Attached files
| file | filename |
|---|---|
| EX-21.1 - EX-21.1 - VIASYSTEMS GROUP INC | d839554dex211.htm |
| EX-31.2 - EX-31.2 - VIASYSTEMS GROUP INC | d839554dex312.htm |
| EX-32.1 - EX-32.1 - VIASYSTEMS GROUP INC | d839554dex321.htm |
| EX-31.1 - EX-31.1 - VIASYSTEMS GROUP INC | d839554dex311.htm |
| EX-23.1 - EX-23.1 - VIASYSTEMS GROUP INC | d839554dex231.htm |
| EXCEL - IDEA: XBRL DOCUMENT - VIASYSTEMS GROUP INC | Financial_Report.xls |
Table of Contents
UNITED STATES
SECURITIES AND EXCHANGE COMMISSION
WASHINGTON, DC 20549
FORM 10-K
(Mark One)
| x | ANNUAL REPORT PURSUANT TO SECTION 13 OR 15(d) OF THE SECURITIES EXCHANGE ACT OF 1934 |
For the fiscal year ended December 31, 2014
or
| ¨ | TRANSITION REPORT PURSUANT TO SECTION 13 OR 15(d) OF THE SECURITIES EXCHANGE ACT OF 1934 |
For the transition period from to
Commission File Number 001-15755

Viasystems Group, Inc.
(Exact name of Registrant as Specified in Its Charter)
| Delaware | 75-2668620 | |
| (State or Other Jurisdiction of Incorporation or Organization) |
(I.R.S. Employer Identification No.) | |
| 101 South Hanley Road, St. Louis, Missouri | 63105 | |
| (Address of Principal Executive Offices) | (Zip Code) | |
Registrant’s telephone number, including area code (314) 727-2087
Securities registered pursuant to Section 12(b) of the Act:
| Title of each class |
Name of each exchange on which registered | |
| Common Stock, $0.01 par value | NASDAQ Global Market |
Securities registered pursuant to Section 12(g) of the Act: None
Indicate by check mark if the registrant is a well-known seasoned issuer, as defined in Rule 405 of the Securities Act. ¨ Yes x No
Indicate by check mark if the registrant is not required to file reports pursuant to Section 13 or Section 15(d) of the Act. ¨ Yes x No
Indicate by check mark whether the registrant (1) has filed all reports required to be filed by Section 13 or 15(d) of the Securities Exchange Act of 1934 during the preceding 12 months (or for such shorter period that the registrant was required to file such reports), and (2) has been subject to such filing requirements for the past 90 days. x Yes ¨ No
Indicate by check mark whether the registrant has submitted electronically and posted on its corporate web site, if any, every Interactive Data File required to be submitted and posted pursuant to Rule 405 of Regulation S-T (§232.405 of this chapter) during the preceding 12 months (or for such shorter period that the registrant was required to submit and post such files. x Yes ¨ No
Indicate by check mark if disclosure of delinquent filers pursuant to Item 405 of Regulation S-K (§229.405 of this chapter) is not contained herein, and will not be contained, to the best of registrant’s knowledge, in definitive proxy or information statements incorporated by reference in Part III of this Form 10-K or any amendment to this Form 10-K. ¨
Indicate by check mark whether the registrant is a large accelerated filer, an accelerated filer, a non-accelerated filer or a smaller reporting company. See the definitions of “large accelerated filer,” “accelerated filer” and “smaller reporting company” in Rule 12b-2 of the Exchange Act. (Check one):
| Large Accelerated Filer | ¨ | Accelerated Filer | x | |||
| Non-Accelerated Filer | ¨ (Do not check if a smaller reporting company) | Smaller Reporting Company | ¨ | |||
Indicate by check mark whether the registrant is a shell company (as defined in Rule 12b-2 of the Act). ¨ Yes x No
The aggregate market value of the voting stock (consisting of common stock, $0.01 par value) of Viasystems Group, Inc. held by non-affiliates of the registrant was approximately $67,805,921 based upon the last sale price for the common stock on June 30, 2014, the last trading day of the registrant’s most recently completed second quarter, as reported on the NASDAQ Global Market system.
As of March 2, 2015, there were 20,897,809 shares of our common stock outstanding.
DOCUMENTS INCORPORATED BY REFERENCE: None
Table of Contents
Introductory Note
On September 21, 2014, Viasystems Group, Inc. announced that it had entered into a merger agreement with TTM Technologies, Inc. (“TTM”) and a wholly owned subsidiary of TTM. Unless stated otherwise, all forward-looking information contained in this report does not take into account or give any effect to the impact of the proposed merger. For additional details regarding the proposed merger, see i) Note 2 to our consolidated financial statements, “Merger Agreement with TTM Technologies, Inc.,” contained in Part II, Item 8, of this report, ii) “Recent Developments” contained in Part I, Item 1, of this report and iii) “Risk Factors” contained in Part I, Item 1A, of this report.
2
Table of Contents
VIASYSTEMS GROUP, INC. AND SUBSIDIARIES
FORM 10-K FOR THE YEAR ENDED DECEMBER 31, 2014
| Page | ||||||||
| Item 1. |
5 | |||||||
| Item 1A. |
15 | |||||||
| Item 1B. |
30 | |||||||
| Item 2. |
31 | |||||||
| Item 3. |
32 | |||||||
| Item 4. |
33 | |||||||
| Item 5. |
34 | |||||||
| Item 6. |
36 | |||||||
| Item 7. |
Management’s Discussion and Analysis of Financial Condition and Results of Operations |
37 | ||||||
| Item 7A. |
58 | |||||||
| Item 8. |
59 | |||||||
| 60 | ||||||||
| 61 | ||||||||
| Consolidated Statements of Operations and Comprehensive (Loss) Income |
62 | |||||||
| 63 | ||||||||
| 64 | ||||||||
| 65 | ||||||||
| Item 9. |
Changes in and Disagreements with Accountants on Accounting and Financial Disclosure |
94 | ||||||
| Item 9A. |
94 | |||||||
| Item 9B. |
97 | |||||||
| Item 10. |
97 | |||||||
| Item 11. |
104 | |||||||
| Item 12. |
Security Ownership of Certain Beneficial Owners and Management and Related Stockholder Matters |
119 | ||||||
| Item 13. |
Certain Relationships and Related Transactions, and Director Independence |
122 | ||||||
| Item 14. |
123 | |||||||
| Item 15. |
124 | |||||||
| 125 | ||||||||
| 126 | ||||||||
| SUBSIDIARIES OF VIASYSTEMS GROUP, INC. |
131 | |||||||
| CERTIFICATIONS |
133 | |||||||
3
Table of Contents
CAUTIONARY STATEMENTS CONCERNING FORWARD-LOOKING STATEMENTS
Statements made in this Annual Report on Form 10-K (the “Report”) include the use of the terms “we,” “us” and “our” which unless specified otherwise refer collectively to Viasystems Group, Inc. (“Viasystems”) and its subsidiaries.
We have made certain “forward-looking” statements in this Report under the protection of the safe harbor of forward-looking statements within the meaning of Section 27A of the Securities Act of 1933, as amended, and Section 21E of the Securities Exchange Act of 1934, as amended. Such forward-looking statements include those statements made in the sections titled “Risk Factors” and “Management’s Discussion and Analysis of Financial Condition and Results of Operations,” that are based on our management’s beliefs and assumptions and on information currently available to our management. Forward-looking statements include information concerning our possible or assumed future results of operations, business strategies, financing plans, competitive position, potential growth opportunities and effects of competition. Forward-looking statements include all statements that are not historical facts and can be identified by the use of forward-looking terminology such as the words “believes,” “expects,” “may,” “anticipates,” “intends,” “plans,” “estimates” or the negative thereof or other similar expressions or comparable terminology.
Forward-looking statements involve risks, uncertainties and assumptions and are not guarantees of future events and results. Actual results may differ materially from anticipated results expressed or implied in these forward-looking statements. You should not put undue reliance on any forward-looking statements. We do not have any intention or obligation to update forward-looking statements after we file this Report.
You should understand that many important factors could cause our results to differ materially from those expressed in forward-looking statements. These factors include, but are not limited to the ability of Viasystems to successfully complete the proposed merger with TTM Technologies, Inc. and the timing of the proposed merger; any actions taken by the company, including but not limited to, restructuring or strategic initiatives (including capital investments or asset acquisitions or dispositions); fluctuations in our operating results and customer orders; global economic conditions; declines in gross margin as a result of excess capacity; our significant reliance on net sales to our largest customers; fluctuations in our operating results; our history of losses; our reliance on the automotive and telecommunications industries; risks associated with the credit risk of our customers and suppliers; influence of significant stockholders; our significant foreign operations and risks relating to currency fluctuations; relations with and regulations imposed by the Chinese government, including power rationing; our dependence on the electronics industry, which is highly cyclical and subject to significant downturns in demand; shortages of, or price fluctuations with respect to, raw materials and increases in oil prices; our ability to compete in a highly competitive industry and to respond to rapid technological changes; reduction in, or cancellation of, customer orders; risks associated with manufacturing defective products and failure to meet quality control standards; uncertainty and adverse changes in the economy and financial markets; risks relating to success of printed circuit board manufacturers in Asia; failure to maintain good relations with our noncontrolling interest holder in China; failure to align manufacturing capacity with customer demand; damage to our manufacturing facilities or information systems; loss of key personnel and high employee turnover; risks associated with governmental and environmental regulation, including regulation associated with climate change and greenhouse gas emissions; our exposure to income tax fluctuations; failure to comply with, or expenses related to compliance with, export laws or other laws applicable to our foreign operations, including the Foreign Corrupt Practices Act; our ability to renew leases of our manufacturing facilities; risks associated with future merger-related and restructuring charges and risks relating to our substantial indebtedness. Please refer to the “Risk Factors” section of this Report for additional factors that could materially affect our financial performance.
4
Table of Contents
| Item 1. | Business |
Recent Developments
Merger Agreement with TTM Technologies, Inc.
On September 21, 2014, our company, Viasystems Group, Inc. (the “Company”), TTM Technologies, Inc., a Delaware corporation (“TTM”), and Vector Acquisition Corp., a Delaware corporation and a wholly owned subsidiary of TTM (“Merger Sub”), entered into an Agreement and Plan of Merger (the “Merger Agreement”) pursuant to which Merger Sub will, subject to the satisfaction or waiver of the conditions therein, merge with and into the Company, with the Company surviving the merger as a wholly owned subsidiary of TTM (the “Merger”). The Merger agreement was adopted by the Company’s stockholders on December 16, 2014.
Pursuant to the terms of the Merger Agreement and subject to the conditions therein, at the effective time of the Merger (the “Effective Time”), each share of the Company’s common stock issued and outstanding immediately prior to the Effective Time (other than shares (1) held in treasury of the Company, (2) owned by TTM or Merger Sub or (3) owned by stockholders who have perfected and not withdrawn a demand for appraisal rights under Delaware law) will be converted into the right to receive a combination of (a) 0.706 of validly issued, fully paid and nonassessable shares of TTM’s common stock (the “Stock Consideration”) and (b) $11.33 per share in cash (together with the Stock Consideration, the “Merger Consideration”). No fractional shares of TTM’s common stock will be issued in the Merger and the Company’s stockholders will receive cash in lieu of any fractional shares.
Pursuant to the terms of the Merger Agreement and subject to the conditions therein, at the Effective Time, the Company’s outstanding stock options will be cancelled and converted into the right to receive a combination of cash and stock with a combined value equal to the excess value, if any, of the Merger Consideration that would be delivered in respect of the number of shares of the Company’s common stock underlying such option over the exercise price for such option. The Company’s outstanding restricted stock awards will be converted into the Merger Consideration. The Company’s outstanding performance share units will vest based on the greater of 100% of the target payout and the payout that would have resulted based on the Company’s performance criteria, with each such vested performance share unit being exchanged for the Merger Consideration.
The completion of the Merger is subject to various closing conditions, including, among other things, i) the expiration or termination of the applicable waiting period under the Hart-Scott-Rodino Antitrust Improvements Act of 1976, as amended (“HSR”), ii) the absence of any legal restraints or prohibitions on the consummation of the Merger and iii) receipt of approval of the Merger by the Committee on Foreign Investment in the United States (“CFIUS”). The obligation of each party to consummate the Merger is also conditioned upon the other party’s representations and warranties being true and correct (subject to certain materiality exceptions), the other party having performed in all material respects its obligations under the Merger Agreement and the other party not having suffered a material adverse effect.
The Merger Agreement contains customary representations, warranties and covenants made by each of the Company and TTM, including, among other things, covenants and agreements to conduct their respective businesses in the ordinary course in all material respects during the period between the execution of the Merger Agreement and completion of the Merger and not to engage in certain kinds of transactions during this period.
The Merger Agreement contains certain termination rights for each of the Company and TTM, including the right of each party to terminate the Merger Agreement if the Merger has not been consummated by June 21, 2015, subject to a three-month extension to September 21, 2015 at the election of either party if, on such date (such date as the same may be extended, the “Outside Date”), the Merger has not yet received antitrust approval, CFIUS approval or certain specified legal restraints are in place but all other closing conditions have been satisfied.
The Merger Agreement also provides that the Company will be entitled to receive from TTM a termination fee of $40.0 million in the event that the Merger Agreement is terminated due to a failure to obtain regulatory approval.
5
Table of Contents
The foregoing description of the Merger and the Merger Agreement is qualified in its entirety by reference to the Merger Agreement, a copy of which is attached as Exhibit 2.1 to the Company’s Current Report on Form 8-K filed with the SEC on September 22, 2014, and which is incorporated by reference herein.
The Company cannot give any assurance that the Merger and the other related transactions will be completed or that, if completed, they will be exactly on the terms as set forth in the Merger Agreement and the other related transaction agreements.
Juarez Restructuring
During the third quarter of 2014, we rationalized the scope of operations and reduced the size of the workforce at our Juarez, Mexico metal fabrication and assembly facility by approximately 22%. As a result, we recorded restructuring charges of $0.6 million related to severance costs. In connection with the reduction of the workforce, we reviewed the facility’s property, plant and equipment for impairment and recorded a $6.2 million impairment charge.
Senior Secured Notes due 2019
On April 15, 2014, our subsidiary, Viasystems, Inc., completed an offering of $50.0 million aggregate principal amount of 7.875% Senior Secured Notes due 2019 (the “New Notes”). The New Notes were issued at a premium of 7.000%, or $3.5 million, which is being amortized as a reduction of interest expense over the term of the New Notes. We incurred $3.4 million of financing fees related to the New Notes that have been capitalized and are being amortized over the term of the New Notes. The net proceeds of the New Notes are being used for general corporate purposes and to pay fees and expenses related to the offering of the New Notes.
Previously, we had issued $550.0 million aggregate principal amount of 7.875% Senior Secured Notes due 2019 (the “Existing Notes” and, together with the New Notes, the “2019 Notes”) pursuant to an indenture dated as of April 30, 2012. The New Notes constitute an additional issuance of, and are fungible with, the Existing Notes and form a single class of debt securities with the Existing Notes for all purposes and have the same terms as the Existing Notes, except for the issue price and issue date.
Guangzhou Fire
On September 5, 2012, we experienced a fire on the campus of our PCB manufacturing facility in Guangzhou, China which damaged property, destroyed inventory and temporarily reduced the facility’s manufacturing capacity (the “Guangzhou Fire”). In 2013, we received partial reimbursements of $1.6 million from our insurance carrier related to our property damage claim. During 2014, we settled all outstanding claims related to the Guangzhou Fire for an additional $31.4 million. The total claim settlement related to the Guangzhou Fire was approximately $33.0 million which included $6.5 million related to our property damage claim and $26.5 million related to our business interruption claim.
General
We are a technology leader and worldwide provider of complex multi-layer rigid, flexible and rigid-flex printed circuit boards (“PCBs”) and electro-mechanical solutions (“E-M Solutions”). PCBs serve as the “electronic backbone” of almost all electronic equipment, and our E-M Solutions products and services integrate PCBs and other components into finished or semi-finished electronic equipment, for which we also provide custom and standard metal enclosures, metal cabinets, metal racks and sub-racks, backplanes, cable assemblies and busbars.
6
Table of Contents
The products we manufacture include, or can be found in, a wide variety of commercial products, including automotive engine controls, hybrid converters, automotive electronics for navigation, safety and entertainment, telecommunications switching equipment, data networking equipment, computer storage equipment, semiconductor test equipment, wind and solar energy applications, off-shore drilling equipment, communications applications, flight control systems and complex industrial, medical and other technical instruments. Our broad offering of E-M Solutions products and services includes component fabrication, component integration, and final system assembly and testing. These services can be bundled with our PCBs to provide an integrated solution to our customers. Our net sales for the year ended December 31, 2014, were derived from the following end markets:
| • | Automotive (32.6%); |
| • | Industrial & instrumentation (23.6%); |
| • | Telecommunications (17.4%); |
| • | Computer and datacommunications (15.2%); and |
| • | Military and aerospace (11.2%). |
We are a supplier to more than 1,000 original equipment manufacturers (“OEMs”) and contract electronic manufacturers (“CEMs”) in numerous end markets. Our OEM customers include industry leaders such as:
In addition, we have good working relationships with industry-leading CEMs and we supply PCBs and E-M Solutions products to them as well. These customers include:
We have fifteen manufacturing facilities, including eight in the United States and seven located outside of the United States, which allows us to take advantage of low cost, high quality manufacturing environments, while serving a broad base of customers around the globe. Our PCB products are produced in our eight domestic facilities, three of our five facilities in China and our one facility in Canada. Our E-M Solutions products and services are provided from our other two facilities in China and our one facility in Mexico. In addition to our manufacturing facilities, we maintain engineering and customer service centers in Hong Kong, China, the Netherlands, England, Canada, Mexico and the United States to support our customers’ local needs. The locations of our engineering and customer service centers correspond directly to the primary areas where we ship our products. For the year ended December 31, 2014, approximately 50.2%, 31.3% and 18.5% of our net sales were generated by shipments to destinations in the Americas, Asia and Europe, respectively.
7
Table of Contents
Our History
We were incorporated in 1996 under the name Circo Craft Holding Company. Circo Craft Holding Company had no operations prior to our first acquisition in October 1996, when we changed our name to Circo Technologies, Inc. In January 1997, we changed our name to Viasystems Group, Inc.
From 1997 through 2001, we expanded rapidly through the acquisition of several businesses throughout Europe, North America and China. During that time, we expanded our business model to include full systems assemblies, wire harnesses and cable assemblies to complement our original PCB and backpanel offerings.
From 1999 to 2001, the majority of our customers were telecommunications and networking OEMs and our business relied heavily on those markets. In early 2001, the telecommunications and networking industries began a significant business downturn caused by a decline in capital spending in those industries. This decline in capital spending was exacerbated by excess inventories within those industries’ contract manufacturing supply chain.
From 2001 through 2005, we substantially restructured our operations and closed or sold 24 under-performing or non-strategic facilities. During that time, we streamlined our business to focus on PCBs, E-M Solutions and wire harnesses, and significantly diversified our end markets and customer base.
During 2006, we sold our wire harness business. As a result of the disposal of the wire harness operations and the restructuring activities early in that decade, we positioned ourselves as a PCB and E-M Solutions manufacturer, with manufacturing facilities located in low cost areas of the world, able to serve our global customer base.
During 2009, in light of global economic conditions we closed our E-M Solutions manufacturing facility in Milwaukee, Wisconsin, along with its satellite final-assembly and distribution facility in Newberry, South Carolina.
On February 11, 2010, Viasystems was recapitalized pursuant to a recapitalization agreement (the “Recapitalization Agreement”) such that i) each outstanding share of newly issued common stock was exchanged for 0.083647 shares of common stock, ii) each outstanding share of our Mandatory Redeemable Class A Junior Preferred Stock was reclassified as, and converted into, 8.478683 shares of newly issued common stock and iii) each outstanding share of our Redeemable Class B Senior Convertible Preferred Stock was reclassified as, and converted into, 1.416566 shares of newly issued common stock.
During 2010, we acquired Merix Corporation (“Merix”) in a transaction pursuant to which Merix became a wholly owned subsidiary of our company (the “Merix Acquisition”). Merix was a leading manufacturer of technologically advanced, multi-layer PCBs with operations in the United States and China. The Merix Acquisition increased our PCB manufacturing capacity by adding four additional PCB production facilities, added North American PCB quick-turn services capability and added military and aerospace to our already diverse end-user markets.
During 2012, we acquired DDi Corp. (“DDi”) which increased our PCB manufacturing capacity by adding seven additional PCB production facilities, added flexible circuit manufacturing capabilities and enhanced our North American quick-turn services capability. Also during 2012, we closed our PCB manufacturing facility in Huizhou, China and our E-M Solutions manufacturing facility in Qingdao, China.
We are headquartered in St. Louis, Missouri, where our mailing address is 101 South Hanley Road, St. Louis, Missouri 63105, and our telephone number at that location is (314) 727-2087. We can also be reached through our website, www.viasystems.com.
Our Products
Printed Circuit Boards - PCBs serve as the foundation of almost all electronic equipment, providing both the circuitry and mounting surfaces necessary to interconnect discrete electronic components, such as integrated circuits, capacitors and resistors. PCBs consist of a pattern of electrical circuitry fabricated on insulating material through electroplating and etching processes that allow for connections between components mounted onto them.
8
Table of Contents
Electro-Mechanical Solutions - E-M Solutions include a wide variety of products and services, primarily including i) backplane assembly, ii) PCB assembly, which involves attaching electronic components to PCBs and backplanes, iii) fabrication of custom and standard metal enclosures, cabinets, racks, sub-racks and bus bars, iv) systems integration, v) final assembly, vi) product testing and vii) fulfillment.
Our PCB products are supplied from our Printed Circuit Boards segment and our E-M Solutions products and services are supplied from our Assembly segment.
Our Business Strategy
Our objective is to be the leader in providing complex multi-layer PCBs and E-M Solutions globally. Key elements of our strategy to achieve this objective include:
Maintenance of diverse end markets and end customer mix. In order to reduce exposure to, and reliance on, any single unpredictable end market and to provide alternative growth paths, we focus on a diverse range of markets, including automotive, industrial & instrumentation, computer and data communications, telecommunications and military and aerospace. For reporting purposes, we consider our industrial & instrumentation end market to also include medical, consumer and other. We pursue customers in each market, and intend to continue to maintain our focus on a diverse mix of customers and end markets.
Enhancement of our strong customer relationships. We benefit from established, long-term relationships with a diverse group of OEM customers. We are focused on expanding our business with these customers by leveraging our history of producing quality products with a high level of customer service and operational excellence, which provides us with the opportunity to bid for additional programs from the strong position of a preferred supplier. In addition, we have good working relationships with industry leading CEMs. These relationships provide us access to additional PCB and E-M Solutions opportunities and enable our CEM partners to offer a fully integrated product solution to their customers. Our management team has created a culture that is focused on providing our customers with high quality products, service and technical support.
Expansion of our relationships with existing customers through cross-selling. We intend to continue to pursue cross-selling opportunities with our existing base of customers. We leverage our full life cycle capabilities to provide our customers with an integrated manufacturing solution that can range from fabrication of bare PCBs to final system assembly and testing. We intend to continue to leverage our customer relationships to expand sales to our existing customers.
Expansion of our manufacturing capabilities in low-cost locations. To meet our customers’ demands for high quality, low-cost products and services, we have invested and, as market conditions allow, will continue to invest in facilities and equipment in low-cost regions. For the year ended December 31, 2014, approximately 70.6% of our net sales were generated from products produced in our operations in China and Mexico. We intend to continue to develop our best-in-class technology and manufacturing processes in low-cost manufacturing locations. We believe our ability to leverage our advanced technology and manufacturing capabilities in low-cost locations will enable us to grow our net sales, improve our profitability and effectively meet our customers’ requirements for high quality, low-cost products and services.
Enhancement of our quick-turn manufacturing capabilities. We intend to continue to develop our quick-turn PCB manufacturing capabilities in North America and Asia. Quick-turn manufacturing enables us to provide our customers with an expedited turnaround for prototype PCBs. With our quick-turn offering, we are able to offer our customers a seamless manufacturing transition from quick-turn prototyping by the engineering/design team to volume manufacturing. We focus on quick-turn capabilities because the significant value of these services to our customers allows us to charge a premium and generate higher margins. We also believe that the market dynamics for such time-critical services and products are more resistant to pricing pressure and commoditization.
9
Table of Contents
Concentration on high value-added assembly products and services. We intend to continue to focus on providing E-M Solutions products and services to leading designers and sellers of advanced electronics products that generally require custom designed, complex products and short lead-time manufacturing services. We differentiate ourselves from many of our global competitors by focusing on low-volume, high margin programs, and not programs for high volume, low margin products such as mobile devices, personal computers and low-end consumer electronics. In addition, we intend to maintain our focus on offering leading-edge, high technology engineering services that we believe provide us a competitive advantage.
Build on our leading position in renewable energy and hybrid technology. We have developed expertise and significant customer relationships in the fabrication and assembly of wind power related technologies, as well as an expertise in our PCB manufacturing process for “heavy copper” applications, which are used in hybrid automotive technologies. Our goal is to substantially grow our sales related to these and other “green” technologies.
Continued emphasis on our operational excellence. We continuously pursue strategic initiatives designed to improve product quality while reducing manufacturing costs. We expect to continue to focus on opportunities to improve operating income, including continued implementation of advanced manufacturing techniques, and our management team is focused on maximizing our current asset base to improve our operational efficiency while also adapting to the needs of our customers and the market.
Markets and Customers
During 2014, we provided products and services to more than 1,000 OEMs. We believe our position as a strategic supplier of PCBs and E-M Solutions fosters close relationships with our customers. These relationships have resulted in additional growth opportunities as we have expanded our capabilities and capacity to meet our customers’ wide range of needs.
The following table shows our net sales as a percentage of total net sales by the principal end markets we serve:
| Year Ended December 31, | ||||||||||||
| Markets |
2014 | 2013 | 2012 | |||||||||
| Automotive |
32.6 | % | 30.2 | % | 32.5 | % | ||||||
| Industrial & instrumentation |
23.6 | 25.4 | 26.8 | |||||||||
| Telecommunications |
17.4 | 17.2 | 15.5 | |||||||||
| Computer and datacommunications |
15.2 | 16.7 | 17.2 | |||||||||
| Military and aerospace |
11.2 | 10.5 | 8.0 | |||||||||
|
|
|
|
|
|
|
|||||||
| Total net sales |
100.0 | % | 100.0 | % | 100.0 | % | ||||||
|
|
|
|
|
|
|
|||||||
Although we seek to diversify our customer base, a small number of customers are responsible for a significant portion of our net sales. For the years ended December 31, 2014, 2013 and 2012, sales to our ten largest customers accounted for approximately 40.6%, 40.6% and 49.0% of our net sales, respectively. During the years ended December 31, 2014, 2013 and 2012, one customer, Robert Bosch GmbH, individually accounted for more than 10% of our net sales, with sales representing 13.6%, 12.6% and 13.9% of our net sales in those years, respectively. Sales to Robert Bosch GmbH occurred in the Printed Circuit Boards segment.
Manufacturing Services
Our offering of manufacturing services includes the following:
Engineering and Prototyping Services - We provide comprehensive front-end engineering services, including custom enclosure design and circuit board manufacturability design services in order to provide efficient manufacturing and delivery for our customers. We offer quick-turn prototyping in Asia and North America, which is the rapid production of a new product sample. Our quick-turn service allows us to provide small test quantities of PCBs to our customers’ product development groups. Our participation in product design and prototyping allows us to reduce our customers’ manufacturing costs and their time-to-market and time-to-volume. These services enable us to strengthen our relationships with customers that require advanced engineering services. In addition, by working closely with customers throughout the development and design process, we often gain insight into their future product requirements, and receive a preference for commercial quantity orders once the design is perfected.
10
Table of Contents
PCB and Backpanel Fabrication - PCBs are platforms that provide electrical interconnection for semiconductors and other electronic components. Backpanels provide electrical interconnection between PCBs. We manufacture complex multi-layer rigid, flexible and rigid-flex PCBs and backpanels on a low-volume, quick-turn basis, as well as on a high-volume production basis. Historically, the trend in the electronics industry has been to increase the speed and performance of electronic devices while reducing their size. This trend has led to increasingly complex PCBs with higher layer counts, higher interconnect density and higher heat dissipation requirements.
Printed Circuit Board Assembly - As part of our E-M Solutions offerings, we have the capability to manufacture printed circuit board assemblies (“PCBAs”). Generally, we do not produce PCBAs on a standalone basis, but rather integrate them with other components as part of a full electro-mechanical system. In addition, we offer testing of PCBAs and the functions of the completed product, and we work with our customers to develop product-specific test strategies. Our test capabilities include in-circuit tests, functional tests, environmental stress tests and manufacturing defect analysis.
Backpanel Assembly - We provide backpanel assemblies, which are manufactured by mounting interconnect devices, including PCBs, integrated circuits and other electronic components on a bare backpanel. This process differs from that used to manufacture PCBAs primarily because of the larger size of the backpanel and the more complex placement techniques that must be used with higher layer count PCBs. We also perform functional and in-circuit testing on assembled backpanels.
Custom Metal Enclosure Fabrication - We specialize in the manufacture of custom-designed chassis and enclosures primarily used in the telecommunications, industrial, medical and computer/datacommunications industries. As a fully integrated supply chain partner with expertise in design, rapid prototyping, manufacturing, packaging and logistics, we provide our customers with shortened time-to-market and reduced manufacturing costs throughout a product’s life cycle.
Full System Assembly and Test - We provide full system assembly services to customers from our facilities in China and Mexico. These services require sophisticated logistics capabilities and supply chain management capabilities to procure components rapidly, assemble products, perform complex testing and deliver products to end-users around the world. Our full system assembly services involve combining custom metal enclosures and a wide range of subassemblies, including backpanel assemblies and PCBAs. We also apply advanced test techniques to various subassemblies and final end products. Increasingly, customers require custom, build-to-order system solutions with very short lead times. We are focused on supporting this trend by providing supply chain solutions designed to meet our customers’ individual needs.
Packaging and Global Distribution - We offer our customers flexible, just-in-time and build-to-order delivery programs, allowing product shipments to be closely coordinated with our customers’ inventory requirements. We are able to ship products directly into customers’ distribution channels or directly to the end-user.
Supply Chain Management - Effective management of the supply chain is critical to the success of our customers as it directly impacts the time required to deliver product to market and the capital requirements associated with carrying inventory. Our global supply chain organization works with customers and suppliers to meet production requirements and to procure materials. We utilize our enterprise resource planning (“ERP”) systems to optimize inventory management.
After-Sales Support - We offer a wide range of after-sales support tailored to meet customer requirements, including product upgrades, engineering change management, field failure analysis and repair.
11
Table of Contents
Sales and Marketing
We focus on developing close relationships with our customers at the earliest development and design phases of products, and we continue to develop our relationship with our customers throughout all stages of production. We identify, develop and market new technologies that benefit our customers and position ourselves as a preferred product or service provider.
We market our products through our own sales and marketing organization and through relationships with independent sales agents around the world. This global sales organization is structured to ensure global account coverage by industry-specific teams of account managers. As of December 31, 2014, we employed approximately 314 sales and marketing employees strategically located throughout North America, Europe and Asia. Each industry marketing team shares support staff of sales engineers, program managers, technical service personnel and customer service organizations to ensure high-quality, customer-focused service. The global marketing organization further supports the sales organization through market research, market development and communications.
Manufacturing and Engineering
We produce highly complex, technologically advanced multi-layer and standard technology rigid, flexible and rigid-flex PCBs and backpanels that meet increasingly narrow tolerances and specifications demanded by our customers. Multi-layering, which involves placing multiple layers of electronic circuitry within a single PCB or backpanel, expands the number of circuits, allows for integration of increasingly complex components and increases the operating speed of systems by reducing the distance that electrical signals must travel. We are capable of producing commercial quantities of PCBs with up to 60 layers. PCBs and backpanels having narrow, closely spaced circuit tracks are known as fine line products. Today, we are capable of producing commercial quantities of PCBs with circuit track widths as narrow as three one-thousandths of an inch. We also have the capability to produce large format backpanels of up to 49 inches in length and as thick as four tenths of an inch. We have developed heavy copper capabilities, using foils of up to 12 ounces per square foot, which are required in high-power applications. In addition, we have developed microwave technologies to support radio frequency (“RF”) applications, and thermal management solutions, including solder-coin-attach, adhesive-bonded-heatsink and our proprietary embedded-heatsink technology.
The manufacturing of complex multi-layer PCBs and backpanels often requires the use of sophisticated high density interconnections (“HDI”) including blind or buried vias, sequential buildup (“SBU”) technology and via-in-pad (“VIP”) technology. The ability to precisely control the electrical properties (e.g., electrical impedance) of our products is crucial to transmission of high speed signals. These technologies require high performance materials and very tight laminating and etching tolerances. Our Printed Circuit Boards operation is an industry leader in performing extensive testing of various PCB designs, materials and surface finishes for manufacturability, including restrictions on hazardous substances compliance and compatibility.
The manufacture of PCBs and backpanels involves several basic steps, including i) etching, electrodeposition or laser direct imaging (“LDI”) to produce the circuit image on copper-clad epoxy laminates, ii) pressing the laminates together to form a panel, iii) drilling holes, iv) electrodepositing copper or other conductive material in the holes to form interlayer electrical, thermal and physical connections, and v) cutting the panels to shape. In addition, complex PCBs and backpanels require advanced process steps, such as dry film imaging, optical aligned registration, photoimageable soldermask, computer controlled drilling and routing, automated plating, via fill and various surface finish techniques. Tight process controls are required throughout the manufacturing process to achieve critical electrical and physical properties. The manufacturing of PCBs used in backpanel assemblies requires specialized equipment and expertise because of the larger size and thickness of the backpanel and the increased number of holes for component mounting.
The manufacturing of PCBAs involves the attachment of various electronic components, such as semiconductors, integrated circuits, capacitors, microprocessors and resistors onto PCBs in order to make a complete circuit. The manufacturing of backpanel assemblies involves attachment of electronic components, including PCBs, integrated circuits and other components to the backpanel, which essentially is a large PCB. We use surface mount, pin-through-hole and press-fit technologies in backpanel assembly. We also assemble higher-level sub-systems and full systems incorporating PCBs and complex electro-mechanical components.
12
Table of Contents
We provide computer-aided testing of PCBs, sub-systems and full systems, which contributes significantly to our ability to consistently deliver high quality products. We test PCBs and system level assemblies to verify that all components have been properly inserted and that electrical circuits are complete. Further functional tests determine whether the board or system assembly is performing to customer specifications.
Quality Standards
Our quality management systems are defect prevention based, customer focused and comply with international standards. All of our facilities are ISO 9001 certified, a globally accepted quality management standard. We also have facilities that are certified to additional industry specific standards, including automotive quality standards ISO/TS 16949, telecommunications quality management standard TL 9000 and aerospace quality management standard AS9100C. All of our U.S. Facilities maintain key military quality certifications including MIL-PRF-55110, MIL-PRF-31032 or MIL-PRF-50884. Our facilities in Guangzhou and Zhongshan, China maintain ISO 17025 certification for testing and calibration laboratories. Our facilities in Forest Grove, Oregon; Milpitas, California; Denver, Colorado; Cleveland, Ohio; North Jackson, Ohio; Sterling, Virginia, Toronto, Canada and Huiyang, China maintain NADCAP (National Aerospace and Defense Contractors Accreditation Program) accreditation.
Our manufacturing facilities and products also comply with industry specific requirements, including Telcordia (formerly Bellcore) and Underwriters Laboratories. These requirements include quality, manufacturing process controls, manufacturing documentation and supplier certification of raw materials. All of our U.S. facilities are registered to produce products subject to U.S. international traffic in arms regulations (ITAR) and our Toronto, Canada facility is registered to produce products subject to the Canadian Controlled Goods Program (“CGP”).
Supplier Relationships
We order raw materials and components based on purchase orders, forecasts and demand patterns of our customers and seek to minimize our inventory of materials or components that are not identified for immediate use in filling specific orders or specific customer contracts. We work with our suppliers to develop just-in-time supply systems that reduce inventory carrying costs and contract globally, where appropriate, to leverage our purchasing volumes. We select our suppliers on the basis of quality, on-time delivery, cost, technical capability and potential for technical advancement. While some of our customer agreements may require certain components to be sourced from specific vendors, the raw materials and component parts we use to manufacture our products, including copper and laminate, are generally available from multiple suppliers.
Competition
Our industry is highly competitive, and we believe our markets are highly fragmented. We face competition from numerous local, regional and large international providers of PCBs and E-M Solutions. Our primary competitors are Compeq Manufacturing Co. Ltd., Flextronics Corporation, Gold Circuit Electronics Ltd., Kingboard Chemical Holdings Ltd., Nanya Technology Corp., Sanmina-SCI Corp. and TTM Technologies, Inc. We believe we compete favorably in the markets we serve based on product quality, responsive customer service and support and price. The cost of many of the products we manufacture are generally low relative to the total cost of our customers’ end-products. As a result, product reliability and prompt delivery are sometimes of greater importance to our customers than price.
13
Table of Contents
International Operations
As of December 31, 2014, we had seven manufacturing facilities located outside the United States, and sales offices in Canada, Mexico, Asia and Europe. Our international operations produce products in China, Canada and Mexico that accounted for approximately 66.7%, 6.5% and 3.9% of our net sales, respectively, for the year ended December 31, 2014, and 64.8%, 6.4% and 4.7% of our 2013 net sales, respectively. The remaining 22.9% and 24.1% of net sales for the years ended December 31, 2014 and 2013, respectively, are from products produced in the United States. Approximately 56.7% and 10.0% of our net sales for the year ended December 31, 2014, and 54.6% and 10.2% of our 2013 net sales were from products produced in China by our Printed Circuit Boards and Assembly business segments, respectively. We believe that our global presence is important as it allows us to provide consistent, quality products on a cost effective and timely basis to our multinational customers worldwide. We rely heavily on our international operations and are subject to risks generally associated with operating in foreign countries, including price and exchange controls, fluctuations in currency exchange rates and other restrictive actions that could have a material effect on our results of operations, financial condition and cash flows.
Environmental
Our operations are subject to various federal, state, local and foreign environmental laws and regulations, which govern, among other things, the discharge of pollutants into the air, ground and water, as well as the handling, storage, manufacturing and disposal of, or exposure to, solid and hazardous wastes, and occupational safety and health. We believe that we are in material compliance with applicable environmental laws, and that the costs of compliance with such current or proposed environmental laws and regulations will not have a material adverse effect on us. All of our manufacturing sites are certified to ISO 14001 standards for environmental quality compliance or are working to achieve this certification. Further, we are not a party to any current claim or proceeding, and are not aware of any threatened claim or proceeding under environmental laws that could, if adversely decided, reasonably be expected to have a material adverse effect on us. However, there can be no assurance that any material environmental liability will not arise in the future, such as due to a change in the law or the discovery of currently unknown conditions.
Employees
As of December 31, 2014, we had 14,854 employees. Of these employees, 12,823 were involved in manufacturing, 1,128 in engineering, 314 in sales and marketing and 589 in administrative capacities. No employees were represented by a union pursuant to a collective bargaining agreement.
Intellectual Property
We have developed expertise and techniques that we use in the manufacturing of our products. Research, development and engineering expenditures for the creation and application of new products and processes were approximately $4.6 million, $4.3 million and $3.6 million for the years ended December 31, 2014, 2013 and 2012, respectively. We believe many of our processes related to the manufacturing of PCBs are proprietary, including our ability to manufacture large perimeter, thick, high-layer-count backpanels. Generally, we rely on common law trade secret protection and on confidentiality agreements with our employees and customers to protect our trade secrets and techniques. We own 90 patents (including pending patents); however, we believe patents do not constitute a significant form of intellectual property rights in our industry. Our current portfolio of patents has expiration dates ranging from 2016 to 2031.
Backlog
We estimate that our backlog of unfilled orders as of December 31, 2014, was approximately $231.7 million, compared with $215.0 million at December 31, 2013. Because unfilled orders may be cancelled prior to delivery, the backlog outstanding at any point in time is not necessarily indicative of the level of business to be expected in the ensuing periods.
Segments
We operate our business in two segments: Printed Circuit Boards, which includes our PCB products; and Assembly, which includes our E-M Solutions products and services. For the year ended December 31, 2014, our Printed Circuit Boards segment accounted for approximately 86.2% of our net sales, and our Assembly segment accounted for approximately 13.8% of our net sales. See Note 16 in the accompanying notes to the consolidated financial statements for further information regarding our segments for fiscal years 2014, 2013 and 2012.
14
Table of Contents
Seasonality of Business
As a manufacturer of electronic components, orders for our products generally correspond to the production schedules of our customers. We have historically experienced reduced sales orders in both of our segments during the first quarter of each year for our products we ship to customers in China. We attribute this decline to shutdowns of our customers’ manufacturing facilities surrounding the Chinese New Year public holidays which normally occur in January or February of each year. In addition, we have historically experienced lower sales orders in both of our segments during the fourth quarter of each year for the products that we ship to customers in North America and Europe. We attribute this decline to shutdowns of our customers’ manufacturing facilities which are often scheduled during the winter holidays.
Financial Information and Geographical Areas
See Note 16 in the accompanying notes to the consolidated financial statements for financial information about geographical areas for fiscal years 2014, 2013 and 2012.
Available Information
Our website address is www.viasystems.com. Our annual, quarterly and current reports on Forms 10-K, 10-Q and 8-K, respectively, and all amendments thereto filed or furnished pursuant to Section 13(a) or 15(d) of the Exchange Act, can be accessed, free of charge, at our website as soon as practicable after such reports are electronically filed with, or furnished to, the SEC. Information contained on our website does not constitute, and shall not be deemed to constitute, part of this report and shall not be deemed to be incorporated by reference into this report. You may read and copy any materials we file with the SEC at the SEC’s Public Reference Room at 100 F Street, NE, Washington, DC 20549. You may obtain information regarding the Public Reference Room by calling the SEC at 1-800-SEC-0330. In addition, the SEC maintains a website at www.sec.gov that contains reports, proxy and information statements, and other information regarding issuers that file electronically with the SEC.
| Item 1A. | Risk Factors |
In evaluating our company, the factors described below should be considered carefully. The occurrence of one or more of these events could significantly and adversely affect our business, financial condition, results of operations or cash flows.
Risks Related to Our Pending Merger with TTM Technologies, Inc.
The Company, TTM and Merger Sub may be unable to satisfy the conditions to the Merger and the Merger may not be consummated.
Consummation of the Merger is subject to various closing conditions, including, among other things, i) the review and approval of the United States Federal Trade Commission (the “FTC”) pursuant to the HSR Act, ii) the absence of any legal restraints or prohibitions on the consummation of the Merger and iii) receipt of the CFIUS approval. The obligation of each party to consummate the Merger is also conditioned upon the other party’s representations and warranties being true and correct (subject to certain materiality exceptions), the other party having performed in all material respects its obligations under the Merger Agreement, and the other party not having suffered a material adverse effect (as defined in the Merger Agreement).
These and other conditions to the consummation of the Merger may fail to be satisfied. In addition, satisfying the conditions to the Merger may take longer, and could cost more, than the Company and TTM expect. The satisfaction of all of the required conditions could delay the completion of the Merger for a significant period of time or prevent it from occurring. Further, there can be no assurance that the conditions to the Merger will be satisfied or waived or that the Merger will be consummated.
15
Table of Contents
Regulatory approvals that are required to consummate the Merger may not be received, may take longer than expected, or may impose conditions that are not presently anticipated.
Consummation of the Merger is subject to various closing conditions, including, among other things, the review and approval of the FTC pursuant to the expiration or termination of the applicable waiting period under the HSR Act. On December 4, 2014, we and TTM announced that we each received a second request from the FTC for additional information associated with the Merger. The second request has the effect of extending the waiting period imposed by the HSR Act. We and TTM are continuing to cooperate fully with the FTC’s review. In addition to obtaining FTC clearance, the proposed transaction remains subject to CFIUS approval.
In addition, private parties who may be adversely affected by the Merger and individual states may bring legal actions under the antitrust laws in certain circumstances. Although the parties believe the consummation of the Merger will not likely be prevented by antitrust law, there can be no assurance that a challenge to the Merger on antitrust grounds will not be made or, if a challenge is made, what the result will be. Under the Merger Agreement, the Company and TTM have agreed to use their reasonable best efforts to obtain all regulatory clearances necessary to consummate the Merger as promptly as reasonably practicable. In addition, in order to consummate the Merger, TTM and the Company may be required to comply with conditions, terms, obligations, or restrictions imposed by regulatory entities and such conditions, terms, obligations, or restrictions may have the effect of delaying completion of the Merger, imposing additional material costs on or materially limiting the revenues of TTM after the completion of the Merger, or otherwise reducing the anticipated benefits to TTM of the Merger. In addition, such conditions, terms, obligations, or restrictions may result in the delay or abandonment of the Merger.
The announcement and pendency of the Merger could have an adverse effect on Viasystems’ stock price, business, financial condition, results of operations, or business prospects.
The announcement and pendency of the Merger could disrupt our business in the following ways, among others:
| • | our employees may experience uncertainty regarding their future roles with TTM, which might adversely affect our ability to retain, recruit and motivate key personnel; |
| • | the attention of our management may be directed towards the consummation of the Merger and transaction-related considerations and may be diverted from the day-to-day business operations of Viasystems, and matters related to the Merger may require commitments of time and resources that could otherwise have been devoted to other opportunities that might have been beneficial to us; and |
| • | customers, suppliers and other third parties with business relationships with us may decide not to renew or seek to terminate, change, and/or renegotiate their relationships with us as a result of the Merger, whether pursuant to the terms of their existing agreements with us or otherwise. |
Any of these matters could adversely affect our stock price, business, financial condition, results of operations, or business prospects.
Failure to consummate the Merger could negatively impact our stock price and future business and financial results.
If the Merger is not consummated for any reason, our ongoing businesses may be adversely affected and, without realizing any of the benefits of having consummated the Merger, we would be subject to a number of risks, including the following:
| • | we may experience negative reactions from the financial markets, including negative impacts on our stock price; |
| • | we may experience negative reactions from our customers, suppliers, and regulators; |
| • | uncertainty regarding the completion of the Merger may foster uncertainty among our employees about their future roles, which could adversely affect our ability to attract and retain key personnel; |
| • | we will be required to pay certain costs relating to the Merger, whether or not the Merger is consummated; |
16
Table of Contents
| • | the Merger Agreement places certain restrictions on the conduct of our business prior to completion of the Merger, which may affect our ability to execute certain business strategies or pursue otherwise attractive business opportunities. Such restrictions, the waiver of which is subject to TTM’s consent (in certain cases, not to be unreasonably withheld, conditioned or delayed), may prevent us from making certain acquisitions or taking certain other specified actions during the pendency of the Merger; and |
| • | matters relating to the Merger (including integration planning) will require substantial commitments of time and resources by our management, which would otherwise have been devoted to day-to-day operations and other opportunities that may have been beneficial to us as an independent company. |
Our business relationships may be subject to disruption due to uncertainty associated with the Merger.
Parties with which we do business may experience uncertainty associated with the proposed Merger, including with respect to current or future business relationships with us or the combined company. Our business relationships may be subject to disruption, as customers, distributors, suppliers, vendors, and others may attempt to negotiate changes in existing business relationships or consider entering into business relationships with parties other than us or the combined company. These disruptions could have an adverse effect on our business, financial condition, or results of operations. The risk, and adverse effect, of such disruptions could be exacerbated by a delay in consummating the Merger or termination of the Merger Agreement.
The Merger Agreement contains provisions that limit our ability to pursue alternatives to the Merger.
The Merger Agreement contains “no shop” provisions that, subject to limited exceptions, provide that we may not (1) solicit, initiate, cause, knowingly facilitate or encourage the submission of any inquiries, proposals or offers or any other efforts or attempts that constitute or may reasonably be expected to lead to any acquisition proposal, or engage in any discussions or negotiations with respect thereto or otherwise cooperate with or assist or participate in, or knowingly facilitate or encourage, any such inquiries, proposals, discussions or negotiations, or resolve to or publicly propose to take any of the foregoing actions, (2) approve or recommend, or resolve to or publicly propose to approve or recommend, any acquisition proposal or enter into any Merger Agreement, agreement-in-principle, letter of intent, share purchase agreement, asset purchase agreement, share exchange agreement, option agreement or other similar agreement relating to an acquisition proposal or enter into any letter of intent, agreement or agreement-in-principle requiring us to abandon, terminate or fail to consummate the Merger or (3) (a) withdraw, modify or qualify in a manner adverse to TTM or Merger Sub the recommendation of the our board of directors or the approval or declaration of advisability by our board of directors of the Merger Agreement and the transactions contemplated thereby (including the Merger) or (b) approve or recommend, or resolve to or publicly propose to approve or recommend, any acquisition proposal.
Risks Related to Our Business and Industry
We have a history of losses and may not be profitable in the future.
We have a history of losses and cannot assure you that we will achieve sustained profitability in the future. We incurred losses from continuing operations of $15.2 million, $27.6 million and $62.2 million for the years ended December 31, 2014, 2013 and 2012, respectively. For the years ended December 31, 2011 and 2010, we had net income of $30.3 million and $15.6 million, respectively. If we cannot regain our profitability, the value of our enterprise may decline.
We may experience fluctuations in operating results, and because many of our operating costs are fixed, even small revenue shortfalls or increased expenses can have a disproportionate effect on operating results.
Our operating results may vary significantly for a variety of reasons, including:
| • | overall economic conditions in the electronics industry and global economy; |
| • | pricing pressures; |
| • | timing of orders from and shipments to major customers; |
| • | our capacity relative to the volume of orders; |
| • | expenditures in anticipation of future sales; |
17
Table of Contents
| • | expenditures or write-offs related to acquisitions; |
| • | expenditures or write-offs related to restructuring activities; |
| • | start-up expenses relating to new manufacturing facilities; or |
| • | variations in product mix. |
We are dependent upon the electronics industry, which is highly cyclical, suffers significant downturns in demand and faces pricing and profitability pressures, which may result in excess manufacturing capacity and increased price competition.
The electronics industry, on which a substantial portion of our business depends, is cyclical and subject to significant downturns characterized by diminished product demand, rapid declines in average selling prices and over-capacity. This industry has experienced periods characterized by relatively low demand and price depression and is likely to experience recessionary periods in the future. Economic conditions affecting the electronics industry in general or specific customers in particular, have adversely affected our results of operations in the past and may do so in the future. The global economy has in the past been, and may in the future be, impacted by global recessionary conditions, volatile fuel prices, and changing political and economic landscapes. These factors and others may lead to low consumer confidence levels, resulting in a downturn in demand for products incorporating PCBs and E-M Solutions.
In addition, the electronics industry is characterized by intense competition, rapid technological change, relatively short product life cycles and pricing and profitability pressures. These factors adversely affect our customers and we suffer similar effects. Our customers are primarily high-technology equipment manufacturers in the automotive, communications and networking, computing and peripherals, test, industrial and medical markets of the electronics industry. Due to the uncertainty in the markets served by most of our customers, we cannot accurately predict our future financial results or accurately anticipate future orders. At any time, our customers can discontinue or modify products containing components we manufacture, exert pricing pressure on us, renegotiate the terms of our arrangements with them, adjust the timing of orders and shipments or affect our mix of consolidated net sales, any of which could have a material adverse effect on our business, financial condition, results of operations or cash flows.
During periods of excess global PCB manufacturing capacity, our gross margins may fall and/or we may have to incur restructuring charges if we choose to reduce the capacity of or close any of our facilities.
When we experience excess capacity, our sales revenues may not fully cover our fixed overhead expenses, and our gross margins will fall. If we conclude we have significant, long-term excess capacity, we may decide to permanently close or scale down our facilities and lay off some of our employees. Closures or lay-offs could result in our recording restructuring charges such as severance, other exit costs and asset impairments.
The PCB and electronic manufacturing services (“EMS”) industries are highly competitive, and we may not be able to compete effectively in one or both of them.
The PCB industry is highly competitive, with multiple global competitors and hundreds of regional and local manufacturers. The EMS industry is also highly competitive, with competitors on the global, regional and local levels and relatively low barriers to entry. In both of these industries, we could experience increased future competition resulting in price reductions, reduced margins or loss of market share. Any of these could have an adverse effect on our business, financial condition, results of operations or cash flows. In addition, some of our principal competitors may be less leveraged, may have greater access to financial or other resources, may have lower cost operations and may be better able to withstand adverse market conditions.
The PCB and EMS industries are subject to rapid technological change; our failure to respond timely or adequately to such changes may render our existing technology less competitive or obsolete, and our operating results may suffer.
The market for our products and services is characterized by rapidly changing product platforms based on technology and continuing process development. The success of our business will depend, in large part, upon our ability to maintain and enhance our technological capabilities, develop and market products and services that meet changing customer needs and successfully anticipate or respond to technological product platform changes on a cost-effective and timely basis. There can be no assurance that we will effectively respond to the technological product requirements of the changing market, including having sufficient cash flow to make additional capital expenditures that may be required as a result of those changes. To the extent we are unable to respond to such technological product requirements, our business, financial condition, results of operations or cash flows may be adversely affected.
18
Table of Contents
If we do not align manufacturing capacity with customer demand, we could experience difficulties meeting our customers’ expectations or, conversely, incur excess costs to maintain unneeded capacity.
If we fail to build or maintain sufficient manufacturing infrastructure, or if we fail to recruit, train and retain sufficient staff to meet customer demand, we may experience extended lead times, leading to the loss of customer orders. Conversely, if we increase manufacturing capacity and order levels do not remain stable or increase, our business, financial condition, results of operations or cash flows could be adversely affected.
Our products and related manufacturing processes are often highly complex and therefore our products may at times contain manufacturing defects, which may subject us to product liability and warranty claims.
We face an inherent business risk of exposure to warranty and product liability claims in the event that our products, particularly those supplied to the automotive and aerospace industries, fail to perform as expected or such failure results, or is alleged to result, in bodily injury and/or property damage. If we were to manufacture and deliver products to our customers that contain defects, whether caused by a design, manufacturing or component failure, or by deficiencies in the manufacturing processes, it may result in delayed shipments to customers and reduced or cancelled customer orders. In addition, if any of our products are or are alleged to be defective, we may be required to participate in a recall of such products. As suppliers become more integral to the vehicle design process and assume more of the vehicle assembly functions, vehicle manufacturers are increasingly looking to their suppliers for contributions when faced with product liability claims or recalls. In addition, vehicle manufacturers, which have traditionally borne the costs associated with warranty programs offered on their vehicles, are increasingly requiring suppliers to guarantee or warrant their products and may seek to hold us responsible for some or all of the costs related to the repair and replacement of parts supplied by us to the vehicle manufacturer. A successful warranty or product liability claim against us in excess of our established warranty and legal reserves or available insurance coverage, or a requirement that we participate in a product recall may have a material adverse effect on our business, financial condition, results of operations or cash flows and may harm our business reputation, which could lead to customer cancellations or non-renewals.
We may be required to recognize additional impairment charges.
Pursuant to U.S. generally accepted accounting principles (“U.S. GAAP”), we are required to make periodic assessments of goodwill, intangible assets and other long-lived assets to determine if they are impaired. We incurred impairment charges to write down the value of property, plant and equipment of $6.2 million and $1.7 million in 2014 and 2012, respectively, as a result of various restructuring activities and other events. Disruptions to our business, end-market conditions, protracted economic weakness, unexpected significant declines in operating results of reporting units, divestitures and enterprise value declines may result in impairment charges to goodwill and other asset impairments. Future impairment charges could substantially affect our reported earnings in the periods of such charges.
If we are not able to renew leases of our manufacturing facilities, our operations could be interrupted and our assets could become impaired.
We lease several of our principal manufacturing facilities from third parties under operating leases with remaining lease terms, as of December 31, 2014, ranging from one to five years. In addition, for the facilities we own in China, we lease the underlying land pursuant to land use rights agreements with the Chinese government, which expire from 2043 to 2052. During 2012, we closed our manufacturing facility in Huizhou, China because the area where this facility was located was redeveloped away from industrial use, and we were unable to renew our lease. If we are not able to renew facility leases under commercially acceptable terms, our operations at those facilities could be interrupted, our assets could become impaired and we may incur significant expense to relocate those operations. Any of these factors could have a material adverse effect on our business, financial condition, results of operations or cash flows.
19
Table of Contents
We may have exposure to income tax rate fluctuations as well as to additional tax liabilities, which could impact our financial position.
As a corporation with a presence both abroad and in the United States, we are subject to taxes in various jurisdictions. Our effective tax rate is subject to fluctuation as the income tax rates for each year are a function of the following factors, among others:
| • | the effects of a mix of profits or losses earned in numerous tax jurisdictions with a broad range of income tax rates; |
| • | our ability to utilize net operating losses; |
| • | our ability to allocate expenses of our U.S. corporate headquarters to overseas subsidiaries; |
| • | changes in contingencies related to taxes, |
| • | interest or penalties resulting from tax audits; and |
| • | changes in tax laws or the interpretation of such laws. |
Changes in the mix of these items and other items may cause our effective tax rate to fluctuate between periods, which could have a material adverse effect on our business, financial condition, results of operations or cash flows.
Certain of our Chinese subsidiaries have operated or continue to operate under tax incentive programs. Any tax incentives we receive could be challenged, modified or even eliminated by taxing authorities or changes in law. These tax incentive programs must be periodically renewed, and we cannot be assured that we would continue to qualify. In addition, the tax laws and rates in certain jurisdictions in which we operate can change with little or no notice, and any such change may apply retroactively. The effect of changes in Chinese tax laws on our overall tax rate will be affected by, among other things, our income, the manner in which China interprets, implements and applies the new tax provisions and our ability to qualify for any exceptions or new incentives. The expiration of tax incentive programs or new tax legislation could increase our effective tax rate, thereby having a material adverse effect on our business, financial condition, results of operations or cash flows.
We are also subject to non-income taxes, such as payroll, sales, use, value-added, net worth, property and goods and services taxes, in various jurisdictions.
Significant judgment is required in determining our provision for income taxes and other tax liabilities. Although we believe that our tax estimates are reasonable, we cannot provide assurance that the final determination of tax audits or tax disputes will not be different from what is reflected in our income tax provisions and accruals.
Uncertainty and adverse changes in the economy and financial markets could have an adverse impact on our business and operating results.
Uncertainty or adverse changes in the economy could lead to a decline in demand for the end products manufactured by our customers, which, in turn, could result in a decline in the demand for our products and pressure to reduce our prices. As a result of the global economic downturns that began in 2008 and 2001, many businesses experienced weaker demand for their products and services and, therefore, took a more conservative stance in ordering component inventory. These downturns led to lower sales levels and caused us to close plants and reduce the size of our work force. Any future decrease in demand for our products could have an adverse impact on our business, financial condition, results of operations or cash flows. Uncertainty and adverse changes in the economy could also increase the cost and decrease the availability of potential sources of financing which could have a material adverse effect on our business, financial condition, results of operations or cash flows.
In addition, instability in the financial markets during economic downturns could lead to the consolidation, restructuring and closure of financial institutions. Should any of the financial institutions who maintain our cash deposits or who are a party to our credit facilities become unable to repay our deposits or honor their commitments under our credit facilities, it could have a material adverse effect on our business, financial condition, results of operations or cash flows.
20
Table of Contents
We are subject to environmental laws and regulations that expose us to potential financial liability.
Our operations are regulated under a number of federal, state, local and foreign environmental laws and regulations that govern, among other things, the discharge of hazardous materials into the air, soil and water, the handling, use, generation, storage and disposal of, or exposure to, hazardous materials and wastes, the investigation and remediation of contamination and occupational health and safety. Violations of these laws and regulations can lead to material liabilities, fines, costs or penalties. Compliance with these laws and regulations is a major consideration in the fabrication of PCBs because metals and other hazardous materials are used in the manufacturing process. In addition, it is possible that in the future, new or more stringent requirements could be imposed. Various federal, state, local and foreign environmental laws and regulations impose liability, regardless of fault, on current or previous real property owners or operators for the costs of investigating, cleaning up or removing contamination caused by hazardous or toxic substances at or from the property. In addition, because we are a generator of hazardous wastes, we, along with any other person who arranges for the disposal of those wastes, may be subject to potential financial exposure for costs associated with the investigation and remediation of sites at which such hazardous waste has been disposed, if those sites become contaminated. Liability may be imposed without regard to legality of the original actions and without regard to whether we knew of, or were responsible for, the presence of such hazardous or toxic substances, and we could be responsible for payment of the full amount of the liability, whether or not any other responsible party is also liable.
Increased regulation associated with climate change and greenhouse gas emissions could impose significant additional costs on operations.
U.S. federal and state governments and various governmental agencies have adopted or are contemplating statutory and regulatory changes in response to the potential impacts of climate change and emissions of greenhouse gases. International treaties or agreements may also result in increasing regulation of climate change and greenhouse gas emissions, including the introduction of greenhouse gas emissions trading mechanisms. Any such law or regulation regarding climate change and greenhouse gas emissions could impose significant costs on our operations and on the operations of our customers and suppliers, including increased energy, capital equipment, environmental monitoring, reporting and other compliance costs. The potential costs of “allowances,” “offsets” or “credits” that may be part of potential cap-and-trade programs or similar proposed regulatory measures are still uncertain. Any adopted future climate change and greenhouse gas laws or regulations could negatively impact our ability, and that of our customers and suppliers, to compete with companies situated in areas not subject to such laws or regulations. These statutory and regulatory initiatives, if enacted, may impact our operations directly or indirectly through our suppliers or customers. Until the timing, scope and extent of any future law or regulation becomes known, we cannot predict the effect on our business, financial condition, results of operations or cash flows.
Provisions of the Dodd-Frank Act relating to “Conflict Minerals” may increase our costs and lead to reputational challenges.
The Dodd-Frank Wall Street Reform and Consumer Protection Act contains provisions to improve transparency and accountability concerning the supply of certain minerals (the “Subject Minerals”) originating from the Democratic Republic of Congo (the “DRC”) and adjoining countries that are believed to be benefiting armed groups. As a result, the SEC adopted due diligence, disclosure and reporting requirements for companies which manufacture products that include components containing Subject Minerals, regardless of whether the Subject Minerals are actually mined in the DRC or adjoining countries. In our first report under these rules, filed on Form SD on June 2, 2014, we reported that for calendar year 2013, we did not have sufficient information to determine the country of origin of all of the Subject Minerals we use to manufacture our products and thus were unable to determine whether any of the subject minerals originated in the DRC or adjoining countries.
The requirements for due diligence, disclosure and reporting related to Subject Materials could decrease the availability and increase the prices of components used in our customers’ products, particularly if we choose (or are required by our customers) to source such components from different suppliers than we use now. While we have taken certain steps during 2014 to improve our information gathering and due diligence procedures related to Subject Minerals our supply chain is complex, and we may face reputational challenges with our customers and other stakeholders if we are unable to timely verify the origins of Subject Minerals contained in our products, or if our due diligence process reveals that materials we source originate in the DRC or adjoining countries and benefit armed groups.
21
Table of Contents
There may be shortages of, or price fluctuations with respect to, raw materials or components, which would cause us to curtail our manufacturing or incur higher than expected costs.
We purchase the raw materials and components we use in producing our products and providing our services, and bear the risk of potential raw material or component price fluctuations. In addition, shortages of raw materials such as gold and copper clad laminates, the principal raw materials used in our PCB operations, have occurred in the past and may occur in the future. Raw material or component shortages or price fluctuations could have a material adverse effect on our business, financial condition, results of operations or cash flows. In addition, if we experience a shortage of materials or components, we may not be able to produce products for our customers in a timely fashion.
Energy and fuel oil prices may fluctuate, which would increase our cost to manufacture goods.
Our manufacturing operations consume a significant amount of energy to power our factories. We purchase electricity from local utilities and we generate a portion of our own electricity in certain of our manufacturing facilities using diesel generators. Prices for electricity and diesel fuel have historically experienced periods of volatility. Future price increases for electricity and diesel fuel would increase our cost and could have a material adverse effect on our business, financial condition, results of operations or cash flows.
We may not have sufficient insurance coverage for certain of the risks and liabilities we assume in connection with the products and services we provide to customers, which could leave us responsible for certain costs and damages incurred by customers.
We carry various forms of business and liability insurance, including commercial general liability insurance, which we believe are reasonable and customary for similarly situated companies in our industry. However, we do not have insurance coverage for all of the risks and liabilities we assume in connection with the products and services we provide to customers, such as potential warranty, product liability and product recall claims. As a result, such liability claims may not be covered or only be partially covered under our insurance policies. We continue to monitor the insurance marketplace to evaluate the availability of and need to obtain additional insurance coverage in the future. However, should we sustain a significant uncovered loss, it could have a material adverse effect on our business, financial condition, results of operations or cash flows.
Damage to our manufacturing facilities or information systems due to fire, natural disaster or other events could harm our financial results and our losses from such events may not be fully covered by insurance.
We have manufacturing, engineering and customer service centers in various countries around the world. The destruction or closure of any of our facilities for a significant period of time as a result of fire, explosion, act of war or terrorism, blizzard, flood, tornado, earthquake, lightning or other natural disaster could harm us financially, increasing our cost of doing business and limiting our ability to deliver our products and services on a timely basis. For example, in September 2012, our manufacturing facility in Guangzhou, China suffered a fire which resulted in the loss of inventory and property, plant and equipment and temporarily reduced a portion of our manufacturing capacity which created manufacturing inefficiencies and caused some customers to cancel orders. In June 2010, our manufacturing facility in Zhongshan, China suffered a fire in an electrical distribution hub, causing a cessation of production activities for a period of approximately one week.
While we maintain insurance coverage to protect us from property damage and business interruption losses, certain coverage is subject to deductibles and other exclusions and may not cover all of the losses incurred. We have historically had difficulties collecting on our claims under certain insurance policies and have experienced delays of more than one year to receive payment of certain claims. In addition, our history of insurance claims may make it difficult to obtain insurance coverage in the future at commercially reasonable rates if at all. If we were to suffer uninsured losses, were not able to collect on insured losses or were not able to obtain adequate insurance coverage in the future, it could have a material adverse effect on our business, financial condition, results of operations or cash flows.
In addition, we rely heavily upon information technology systems and high-technology equipment in our manufacturing processes and the management of our business. We have developed disaster recovery plans; however, disruption of these technologies as a result of natural disaster or other events could harm our business and have a material adverse effect on our business, financial condition, results of operations or cash flows.
22
Table of Contents
We could be subject to litigation in the course of our operations that could adversely affect our operating results.
We are subject to various claims with respect to such matters as product liability, product development and other actions arising in the normal course of business. Item 3 of Part I of this Report discusses any material pending legal proceedings to which we are a party. Through any of these matters, or if we became the subject of future material legal proceedings, our operating results may be affected by the outcome of such proceedings and other contingencies that cannot be predicted with certainty. When appropriate, and as required by U.S. GAAP, we estimate material loss contingencies and establish reserves based on our assessment of contingencies where liability is deemed probable and reasonably estimable in light of the facts and circumstances known to us at a particular point in time. Subsequent developments in legal proceedings may affect our assessment and estimates of the loss contingency recorded as a liability or as a reserve against assets in our consolidated financial statements and could have a material adverse effect on business, financial condition, results of operations or cash flows in the period in which a liability would be recognized and the period in which damages would be paid, respectively. Although claims have been infrequent in the past, we may become subject to claims by our customers or end-users of our products alleging that we were negligent in our production or have infringed on intellectual property of another.
Several of our competitors hold patents covering a variety of technologies, applications and methods of use similar to some of those used in our products. From time to time, we and our customers have received correspondence from our competitors claiming that some of our products, as used by our customers, may be infringing one or more of these patents. Competitors or others have in the past, and may in the future, assert infringement claims against us or our customers with respect to current or future products or uses, and these assertions may result in costly litigation or require us to obtain a license to use intellectual property of others. If claims of infringement are asserted against our customers, those customers may seek indemnification from us for damages or expenses they incur.
If we became subject to infringement claims, we would evaluate our position and consider the available alternatives, which may include seeking licenses to use the technology in question or defending our position. These licenses, however, may not be available on satisfactory terms or at all. If we are not able to negotiate the necessary licenses on commercially reasonable terms or successfully defend our position, it could have a material adverse effect on our business, financial condition, results of operations or cash flows.
If we lose key management, operations, engineering or sales and marketing personnel, or if we experience high employee turnover, we could experience reduced sales, delayed product development and diversion of management resources.
Our success depends largely on the continued contributions of our key management, administration, operations, engineering and sales and marketing personnel, many of whom would be difficult to replace. With the exception of certain of our executive officers, we generally do not have employment or non-compete agreements with our key personnel. If one or more members of our senior management or key professionals were to resign, the loss of personnel could result in loss of sales, delays in new product development and diversion of management resources, which would have a negative effect on our business. We do not maintain “key man” insurance policies on any of our personnel.
In addition, we rely on the collective experience of our employees, particularly in the manufacturing process, to ensure we continuously evaluate and adopt new technologies and remain competitive. Although we are not generally dependent on any one employee or a small number of employees involved in our manufacturing process, we have in the past experienced periods of high employee turnover and may in the future experience significantly high employee turnover at our facilities in China. If we are not able to replace departing employees with new employees who have comparable skills and capabilities, our operations could suffer as we may be unable to keep up with innovations in the industry or the demands of our customers, and may not be able to compete effectively.
Security breaches and other disruptions could compromise our information and expose us to liability, which could cause our business and reputation to suffer.
In the ordinary course of our business, we collect and store sensitive data in our data centers and on our networks, including intellectual property, our proprietary business information and that of our customers, suppliers and business partners, and personally identifiable information of our employees. The secure processing, maintenance and transmission of this information is critical to our operations. Despite our security measures, our information technology and infrastructure may be vulnerable to attacks by hackers or breached due to employee error, malfeasance or other disruptions. Any such breach could compromise our networks and the information stored there could be accessed, publicly disclosed, lost or stolen. Any such access, disclosure or other loss of information could result in legal claims or proceedings, disrupt our operations, damage our reputation, and cause a loss of confidence in our products and services, which could have a material adverse effect on our business, financial condition, results of operations or cash flows.
23
Table of Contents
Risks Related to Our Customers and Suppliers
A significant portion of our net sales is based on transactions with our largest customers; if we lose any of these customers, our sales could decline significantly.
For the years ended December 31, 2014, 2013 and 2012, sales to our ten largest customers accounted for approximately 40.6%, 40.6% and 49.0% of our consolidated net sales, respectively. For the years ended December 31, 2014, 2013 and 2012, one customer, Robert Bosch GmbH, accounted for over 10.0% of our consolidated net sales, with sales representing 13.6%, 12.6% and 13.9% of our net sales for those years, respectively.
Although we cannot assure you that our principal customers will continue to purchase our products at past levels, we expect a significant portion of our net sales will continue to be concentrated within a small number of customers. The loss of, or significant curtailment of purchases by, any of our principal customers could have a material adverse effect on our business, financial condition, results of operations or cash flows.
We generally do not obtain long-term volume purchase commitments from customers and therefore, cancellations, reductions in production quantities and delays in production by our customers could adversely affect our business.
For many of our customers we do not have firm long-term purchase commitments, but rather conduct business on a purchase order basis. Customers may cancel their orders, reduce production quantities or delay production at any time for a number of reasons. Many of our customers have in the past experienced, and may in the future experience, significant decreases in demand for their products and services. Uncertain economic conditions in the global economy and the markets in which our customers operate have in the past prompted some of our customers to cancel orders, delay the delivery of our products and place purchase orders for fewer products than they had forecasted to us. Even when our customers are contractually obligated to purchase products, we may be unable or, for other business reasons, choose not to enforce our contractual rights. Cancellations, reductions or delays of orders by customers could:
| • | adversely affect our operating results by reducing the volume of products that we manufacture for our customers; |
| • | delay or eliminate recoupment of our expenditures for inventory purchased to fulfill customer orders; or |
| • | lower our asset utilization, which would result in lower gross margins. |
Increasingly, our larger customers are requesting that we enter into supply agreements with them that have restrictive terms and conditions. These agreements typically include provisions that increase our financial exposure, which could result in significant costs to us.
Increasingly, our larger customers are requesting that we enter into supply agreements with them. These agreements typically include provisions that generally serve to fix our selling price over some period of time or to increase our exposure for product liability and warranty claims - as compared to our standard terms and conditions - which could result in higher costs to us as a result of such claims. In addition, these agreements typically contain provisions that seek to limit our operational and pricing flexibility and extend payment terms, which may have a material adverse effect on our business, financial condition, results of operations or cash flows.
24
Table of Contents
If we are unable to provide our customers with high-end technology, high quality products, and responsive service, or if we are unable to deliver our products to our customers in a timely manner, our results of operations and financial condition may suffer.
In order to maintain our existing customer base and obtain business from new customers, we must constantly demonstrate our ability to produce our products at the level of technology, quality, responsiveness of service, timeliness of delivery, and at prices that our customers require. If our products are of substandard quality, if they are not delivered on time, if we are not responsive to our customers’ demands, or if we cannot meet our customers’ technological requirements, our reputation as a reliable supplier could be damaged. If we are unable to meet these product and service standards, we may be unable to obtain new contracts or keep our existing customers, and this could have a material adverse effect on our business, financial condition, results of operations or cash flows.
Our exposure to the credit risk of our customers and suppliers may adversely affect our business.
We sell our products to customers that have in the past experienced, and may in the future experience, financial difficulties. If our customers experience financial difficulties, we could have difficulty recovering amounts owed from these customers. While we perform credit evaluations and adjust credit limits based upon each customer’s payment history and credit worthiness, such programs may not be effective in reducing our exposure to credit risk. We evaluate the collectability of accounts receivable, and based on this evaluation make adjustments to the allowance for doubtful accounts for expected losses. Actual bad debt write-offs may differ from our estimates, which may have a material adverse effect on our business, financial condition, results of operations or cash flows.
Our suppliers may also experience financial difficulties, which could result in our having difficulty sourcing the materials and components we use in producing our products and providing our services. If we encounter such difficulties, we may not be able to produce our products for customers in a timely fashion, which could have an adverse effect on our business, financial condition, results of operations or cash flows.
We rely on the automotive industry for a significant portion of sales.
A significant portion of our sales are to customers within the automotive industry. For the years ended December 31, 2014, 2013 and 2012, sales to customers in the automotive industry represented approximately 32.6%, 30.2% and 32.5% of our net sales, respectively. If there was a destabilization of the automotive industry or a market shift away from our automotive customers, it may have a materially adverse effect on our business, financial condition, results of operations or cash flows.
Failure to meet the quality control standards of our automotive customers may cause us to lose existing, or prevent us from gaining new, automotive customers.
For safety reasons, our automotive customers have strict quality standards that generally exceed the quality requirements of our other customers. Because a significant portion of our PCB products are sold to customers in the automotive industry, if those products do not meet these quality standards, our results of operations may be materially and adversely affected. These automotive customers may require long periods of time to evaluate whether our manufacturing processes and facilities meet their quality standards. If we were to lose automotive customers due to quality control issues, we might not be able to regain those customers or gain new automotive customers for long periods of time, which could have a material adverse effect on our business, financial condition, results of operations or cash flows.
We rely on the telecommunications industry for a significant portion of sales. Accordingly, the economic volatility in this industry has had, and may continue to have, a material adverse effect on our ability to forecast demand and production and to meet desired sales levels.
A large percentage of our business is conducted with customers who are in the telecommunications industry. For the years ended December 31, 2014, 2013 and 2012, sales to customers in the telecommunications industry represented approximately 17.4%, 17.2% and 15.5% of our net sales, respectively. This industry is characterized by intense competition, relatively short product life cycles and significant fluctuations in product demand. This industry is heavily dependent on the end markets it serves and therefore can be affected by the demand patterns of those markets. If the volatility in this industry continues, it would likely have a material adverse effect on our business, financial condition, results of operations or cash flows.
A significant portion of our business is derived from products and services ultimately sold to the U.S. government by our customers. Changes affecting the government’s capacity to do business with us or our customers or the effects of competition in the defense industry could have a material adverse effect on our business.
25
Table of Contents
A significant portion of our revenues is derived from products and services ultimately sold to the U.S. government and is therefore affected by, among other things, the federal budget process. We are a supplier, primarily as a subcontractor, to the U.S. government and its agencies as well as to foreign governments and agencies. Government contracts and subcontracts are subject to political and budgetary constraints and processes, changes in short-range and long-range strategic plans, the timing of contract awards, and in the case of contracts with the U.S. government, the congressional budget authorization and appropriation processes. Changes affecting the federal government could also increase competition among suppliers, which could have a material adverse effect on our business. In addition, the government is able to terminate contracts for convenience and may suspend or debar contractors in the event of certain violations of legal and regulatory requirements. Further, defense expedite (DX) orders from the U.S. government, which by law receive priority, can interrupt scheduled shipments to our other customers. The termination or failure to fund one or more significant contracts by the U.S. government could have a material adverse effect on our business, financial condition, results of operations or cash flows.
A significant portion of our business is derived from products and services sold to customers in the defense industry. Changes in export control or other federal regulations could result in increased competition from offshore competitors which could have a material adverse effect on our business.
A significant portion of our net sales are derived from products and services ultimately sold to customers in the defense industry. Many of these products are currently subject to export controls and other regulatory requirements such as United States Munitions List, that limit the ability of overseas competitors to manufacture such products. If these regulations or others are changed in a manner that reduces restrictions on certain products being manufactured overseas, we would face increased competition from overseas manufacturers. Such increased competition could have a material adverse effect on our business, financial condition, results of operations or cash flows.
Risks Related to Doing Business in China and Other International Locations
A significant portion of our manufacturing activities are conducted in foreign countries, exposing us to additional risks that may not exist in the United States.
International manufacturing operations represent a majority of our business. Sales outside the United States represent a majority of our net sales, and we expect net sales outside the United States to continue to represent a significant portion of our total net sales. Outside of the United States, we operate manufacturing facilities in China, Mexico and Canada.
Our international manufacturing operations are subject to a variety of potential risks, including:
| • | inflation or changes in political and economic conditions; |
| • | unstable regulatory environments; |
| • | changes in import and export duties; |
| • | domestic and foreign customs and tariffs; |
| • | potentially adverse tax consequences; |
| • | trade restrictions; |
| • | restrictions on the transfer of funds into or out of a country; |
| • | changes in labor laws, including minimum wage; |
| • | labor unrest; |
| • | logistical and communications challenges; |
| • | difficulties associated with managing a large organization spread throughout various countries; |
| • | differing protection of intellectual property and trade secrets; or |
| • | burdensome taxes and other restraints. |
Any of these factors may have an adverse effect on our international operations or on the ability of our international operations to repatriate earnings, which could have a material adverse effect on our business, financial condition, results of operations or cash flows.
26
Table of Contents
If manufacturing technical capability and quality continue to improve in Asia and other foreign countries where production costs are lower, our U.S. operations may become less competitive, lose market share, incur lower cost absorption, and experience lower gross margins and impairment of assets.
To the extent PCB manufacturers in Asia are able to more effectively compete with products manufactured in the United States, our facilities in the United States may not be able to compete as effectively and parts of our U.S. operations may not remain viable.
PCB manufacturers in Asia and other geographies often have significantly lower production costs than our U.S. operations and may even have cost advantages over our own operations in Asia. Production capability improvements by foreign competitors and domestic competitors with foreign operations may play an increasing role in the PCB markets in which we compete, which may adversely affect our revenues and profitability. While PCB manufacturers in these locations have historically competed primarily in markets for less technologically advanced products, some, including ourselves, have expanded their manufacturing capabilities to produce higher layer count, higher technology PCBs and could compete more directly with our North American and Asia operations.
Electrical power shortages in certain areas of China have, in the past, caused the government to impose power rationing programs, and additional power rationings in the future could adversely affect our operations in China.
In recent years, the Chinese government has periodically rationed electrical power in certain areas of the country which has led to unscheduled production interruptions in some of our manufacturing facilities. We may encounter difficulties in the future with obtaining power or other key services due to infrastructure weaknesses and constraints in China that may impair our ability to compete effectively as well as materially adversely affect our business, financial condition, results of operations or cash flows.
We are subject to currency fluctuations, which may affect our cost of goods sold and operating margins.
A significant portion of our costs, including payroll and rent, are denominated in foreign currencies, particularly the Chinese Renminbi (“RMB”). Changes in exchange rates between foreign currencies and the U.S. dollar will affect our cost of goods sold and operating margins and could have a material adverse effect on our business, financial condition, results of operations or cash flows.
Material increases in labor costs in China could have an adverse impact on our business and operating results.
We operate a number of manufacturing facilities in China. In past years, we have experienced increases in labor costs in our Chinese facilities. We expect increases in the cost of labor in our manufacturing facilities in China will continue to occur in the future. To the extent we are unable to pass on increases in labor costs to our customers by increasing the prices for our products and services, minimum wage increases or increases in other labor costs could have a material adverse effect on our business, financial condition, results of operations or cash flows.
We lease land for all of our owned and leased Chinese manufacturing facilities from the Chinese government under land use rights agreements that may be terminated by the Chinese government.
We lease the land where our Chinese manufacturing facilities are located from the Chinese government through land use rights agreements. Although we believe our relationship with the Chinese government is sound, if the Chinese government decided to terminate our land use rights agreements, our assets could become impaired, and our ability to meet our customers’ orders could be impacted. This could have a material adverse effect on our business, financial condition, results of operations or cash flows.
We export products from the United States to other countries. If we fail to comply with export laws, we could be subject to additional taxes, duties, fines and other punitive actions.
Exports from the United States are regulated by various government agencies, including the U.S. Department of Commerce and the U.S. Department of State. Failure to comply with these regulations can result in significant fines and penalties. Additionally, violations of these laws can result in punitive penalties, which could restrict or prohibit us from exporting certain products, and could have a material adverse effect on our business, financial condition, results of operations or cash flows.
27
Table of Contents
As a U.S. corporation with international operations, we are subject to the Foreign Corrupt Practices Act (“FCPA”). A determination that we violated this act may adversely affect our business.
As a U.S. corporation, we are subject to the regulations imposed by the FCPA, which generally prohibits U.S. companies and their intermediaries from making improper payments to foreign officials for the purpose of obtaining or keeping business. Any determination that we have violated the FCPA could have a material adverse effect on our business, financial condition, results of operations or cash flows.
Risks Related to Our Capital Structure
Our wholly owned subsidiary, Viasystems, Inc., is a holding company with no operations of its own and depends on its subsidiaries for cash.
Our operations are conducted through our wholly owned subsidiary, Viasystems, Inc., which is a holding company with no operations of its own, and none of its subsidiaries are obligated to make funds available to Viasystems, Inc. Accordingly, Viasystems, Inc.’s ability to service its indebtedness is dependent on the distribution of funds from its subsidiaries. If Viasystems, Inc. is unable to transfer cash generated by its subsidiaries, its ability to make payments on its indebtedness may be impaired. Viasystems, Inc.’s failure to service its debt may have a material adverse effect on our business, financial condition, results of operations or cash flows.
We are influenced by our significant stockholders, whose interests may be different than our other stockholders.
As of December 31, 2014, affiliates of HM Capital Partners and affiliates of Black Diamond Capital Management, L.L.C. owned approximately 47.7% and 19.0% of our outstanding common stock, respectively. Accordingly, these entities, together or with other partners, may effectively control the election of a majority of our board of directors and the approval or disapproval of certain other matters requiring stockholder approval and, as a result, have significant influence over the direction of our management and policies. The interests of any large stockholder or controlling group may not be the same as the interests of our other stockholders. In addition, owners of these entities are in the business of making investments in companies and may from time to time acquire and hold interests in businesses that compete directly or indirectly with us or otherwise have business objectives that are not aligned with our business objectives.
Some provisions of Delaware law and our certificate of incorporation and bylaws may deter third parties from acquiring us and diminish the value of our common stock.
Our certificate of incorporation and bylaws provide for, among other things:
| • | restrictions on the ability of our stockholders to call a special meeting and the business that can be conducted at such a meeting; |
| • | our ability to issue preferred stock with terms that the board of directors may determine, without stockholder approval; |
| • | a prohibition of action by written consent unless such action is approved by all stockholders; |
| • | the absence of cumulative voting in the election of directors; and |
| • | advance notice requirements for stockholder proposals and nominations. |
These provisions in our certificate of incorporation and bylaws may discourage, delay or prevent a transaction involving a change of control of our company that is in the best interest of our minority stockholders. Even in the absence of a takeover attempt, the existence of these provisions may adversely affect the prevailing market price of our common stock if they are viewed as discouraging future takeover attempts.
28
Table of Contents
Investors may experience dilution of their ownership interests due to the future issuance of additional shares of our capital stock, which could have an adverse effect on the price of our common stock.
We may in the future issue additional shares of our common stock which could result in the dilution of the ownership interests of our stockholders. As of December 31, 2014, we have outstanding approximately 20.9 million shares of common stock, and no shares of preferred stock. We are authorized to issue 100.0 million shares of common stock and 25.0 million shares of preferred stock with such designations, preferences and rights as determined by our board of directors. The potential issuance of such additional shares of common stock may create downward pressure on the trading price of our common stock. We may also issue additional shares of our common stock in connection with the hiring of personnel, future acquisitions, future issuances of our securities for capital raising purposes or for other business purposes. Future sales of substantial amounts of our common stock, or the perception that sales could occur, could have a material adverse effect on the price of our common stock.
In addition, pursuant to our 2010 Equity Incentive Plan, as of December 31, 2014, we are authorized to grant options and other stock awards representing up to 440,276 shares to our officers, employees, directors and consultants. Our stockholders will incur dilution upon exercise or issuance of any options or other stock awards. In addition, if we raise additional funds by issuing additional common stock, or securities convertible into, exchangeable or exercisable for common stock, or if we use our securities as consideration for future acquisitions or investments, further dilution to our existing stockholders will result, and new investors could have rights superior to existing stockholders.
We have a substantial amount of debt and may be unable to service or refinance this debt, which could have a material adverse effect on our business in the future, and may place us at a competitive disadvantage in our industry.
As of December 31, 2014, our total outstanding indebtedness was approximately $614.0 million. Our net interest expense for the years ended December 31, 2014, 2013 and 2012, was approximately $47.3 million, $44.8 million and $42.2 million, respectively. As of December 31, 2014, our total consolidated stockholders’ equity was approximately $202.7 million.
This high level of debt could have negative consequences. For example, it could:
| • | result in our inability to comply with the financial and other restrictive covenants in our credit facilities; |
| • | increase our vulnerability to adverse industry and general economic conditions; |
| • | require us to dedicate a substantial portion of our cash flow from operations to make scheduled principal payments on our debt, thereby reducing the availability of our cash flow for working capital, capital investments and other business activities; |
| • | limit our ability to obtain additional financing to fund future working capital, capital investments, acquisitions and other business activities; |
| • | limit our ability to refinance our indebtedness on terms that are commercially reasonable, or at all; |
| • | expose us to the risk of interest rate fluctuations to the extent we pay interest at variable rates on the debt; |
| • | limit our flexibility to plan for, and react to, changes in our business and industry; or |
| • | place us at a competitive disadvantage relative to our less leveraged competitors. |
Servicing our debt requires a significant amount of cash and our ability to generate cash may be affected by factors beyond our control.
Our business may not generate cash flow in an amount sufficient to enable us to pay the principal of, or interest on, our indebtedness or to fund our other liquidity needs, including working capital, capital expenditures, product development efforts, strategic acquisitions, investments and alliances and other general corporate requirements.
Our ability to generate cash is subject to general economic, financial, competitive, legislative, regulatory and other factors that are beyond our control. We cannot assure you that:
| • | our business will generate sufficient cash flow from operations; |
| • | we will realize the cost savings, revenue growth and operating improvements related to the execution of our long-term strategic plan; or |
| • | future sources of funding will be available to us in amounts sufficient to enable us to fund our liquidity needs. |
If we cannot fund our liquidity needs, we will have to take actions such as: reducing or delaying capital expenditures, product development efforts, strategic acquisitions, investments and alliances; selling assets; restructuring or refinancing our debt; or seeking additional equity capital. We cannot assure that any of these remedies could, if necessary, be affected on commercially reasonable terms, or at all, or that they would permit us to meet our scheduled debt service obligations. Our $75.0 million senior secured revolving credit facility (the “Senior Secured 2010 Credit Facility”) and the indenture governing the principal amount of our 7.875% Senior Secured Notes due 2019 (the “2019 Notes”) limit the use of the proceeds from any disposition of assets and, as a result, we may not be allowed to use the proceeds from such dispositions to satisfy all current debt service obligations. In addition, if we incur additional debt, the risks associated with our substantial leverage, including the risk that we would be unable to service our debt or generate enough cash flow to fund our liquidity needs, could intensify.
29
Table of Contents
Restrictive covenants in the indenture governing the 2019 Notes and the agreements governing our other indebtedness will restrict our ability to operate our business.
The indentures or other agreements governing the 2019 Notes, the Senior Secured 2010 Credit Facility and certain mortgage loans contain, and agreements governing indebtedness we may incur in the future may contain, covenants that restrict our ability to, among other things, incur additional debt, pay dividends, make investments, enter into transactions with affiliates, merge or consolidate with other entities or sell all or substantially all of our assets. Additionally, the agreement governing the Senior Secured 2010 Credit Facility requires us to maintain certain financial ratios. A breach of any of these covenants could result in a default thereunder, which could allow the lenders or the noteholders to declare all amounts outstanding thereunder immediately due and payable. If we are unable to repay outstanding borrowings when due, the lenders under the Senior Secured 2010 Credit Facility, the collateral trustee under the indenture governing the 2019 Notes and related agreements and our mortgage lenders have the right to proceed against the collateral granted to them, including certain equity interests. We may also be prevented from taking advantage of business opportunities that arise because of the limitations imposed on us by the restrictive covenants under our indebtedness.
Downgrading of our debt ratings would adversely affect us.
Our debt securities and corporate credit profile are monitored and rated by Moody’s Investors Service, Inc. (“Moodys”) and Standard & Poor’s Ratings Services, a division of the McGraw-Hill Companies, Inc., (“S&P”). On March 31, 2014, S&P downgraded our corporate rating from BB- to B+ and the rating on the 2019 Notes from BB- to B+. On April 10, 2014, Moodys reaffirmed our corporate rating to B2 and the rating on the 2019 Notes to B1. Any future downgrade by Moodys or S&P could make it more difficult for us to obtain new financing if we had an immediate need to increase our liquidity or increase the cost at which any new financing may be negotiated.
Failure to maintain good relations with the noncontrolling interest holder of a majority-owned subsidiary in China could materially adversely affect our ability to manage that operation.
A noncontrolling interest holder owns a 5% interest in our subsidiary that operates our Huiyang, China facility. The noncontrolling interest holder is affiliated with the Chinese government and has close ties to local economic development and other Chinese government agencies. The noncontrolling interest holder has certain rights to be consulted and to consent to certain operating and investment matters concerning the Huiyang facility and the board of directors of our subsidiary that operates the Huiyang facility. Failure to maintain good relations with the noncontrolling interest holder could materially adversely affect our ability to manage the operations of the plant.
| Item 1B. | Unresolved Staff Comments |
Not Applicable.
30
Table of Contents
| Item 2. | Properties |
In addition to our executive offices in St. Louis, Missouri, we operate fifteen principal manufacturing and one principal distribution facility, located in four different countries with a total area of approximately 5.7 million square feet. Our Anaheim, California; Cleveland, Ohio; Denver, Colorado and Toronto, Canada facilities are pledged to secure mortgage loans associated with each of those respective facilities. Remaining lease terms for our principal leased properties range from one to five years.
The principal properties owned or leased by us are described below.
| Location |
Size (Appx. Sq. Ft.) |
Type of Interest |
Description of Primary Products | |||||
| United States |
||||||||
| Forest Grove, Oregon |
310,500 | Owned | PCB fabrication and warehousing | |||||
| Sterling, Virginia |
101,000 | Leased | PCB fabrication | |||||
| Anaheim, California |
97,000 | Owned | PCB fabrication | |||||
| North Jackson, Ohio |
75,000 | Owned | PCB fabrication | |||||
| 9,000 | Leased | |||||||
| Milpitas, California |
62,000 | Leased | PCB fabrication | |||||
| San Jose, California |
40,000 | Leased | PCB fabrication and warehousing | |||||
| Cleveland, Ohio |
40,000 | Owned | PCB fabrication | |||||
| El Paso, Texas |
29,000 | Leased | E-M Solutions warehousing and distribution | |||||
| Littleton, Colorado |
26,000 | Owned | PCB fabrication | |||||
| 2,000 | Leased | |||||||
| Mexico |
||||||||
| Juarez, Chihuahua |
205,000 | Leased | Backpanel assembly, PCB assembly, custom metal enclosure fabrication, and full system assembly and test | |||||
| Canada |
||||||||
| Toronto |
93,000 | Owned | PCB fabrication | |||||
| 15,000 | Leased | |||||||
| China |
||||||||
| Guangzhou |
2,250,000 | Owned (a) | PCB and backpanel fabrication | |||||
| 106,000 | Leased | |||||||
| Zhongshan |
1,140,000 | Owned (a) | PCB fabrication | |||||
| Huiyang |
400,000 | Owned (a) | PCB fabrication and warehousing | |||||
| Shanghai |
430,000 | Owned (a) | Custom metal enclosure fabrication, backpanel assembly, PCB assembly and full system assembly and test | |||||
| Shenzhen |
286,000 | Leased | Custom metal enclosure fabrication, PCB assembly and full system assembly and test | |||||
| (a) | Although these facilities are owned, we lease the underlying land pursuant to land use rights agreements with the Chinese government, which expire from 2043 to 2052. |
In addition to the facilities listed above, we maintain several engineering, customer service, sales and marketing and other offices throughout North America, Europe and Asia, all of which are leased.
31
Table of Contents
| Item 3. | Legal Proceedings |
We are presently involved in various legal proceedings arising in the ordinary course of our business operations, including employment matters and contract claims. We believe that any liability with respect to these proceedings will not be material in the aggregate to our consolidated financial position, results of operations or cash flows.
Litigation Relating to the TTM Merger
Since the public announcement on September 22, 2014, of the proposed Merger with TTM, we, the Company’s board of directors, TTM and Merger Sub, have been named as defendants in two putative class action complaints challenging the Merger. The first lawsuit, filed on September 30, 2014, in the Circuit Court of St. Louis County, Missouri (the “Missouri Lawsuit”), and the second lawsuit, filed on October 13, 2014, in the Court of Chancery of the State of Delaware (the “Delaware Lawsuit” and, together with the Missouri Lawsuit, the “Lawsuits”), generally allege, among other things, that the Merger fails to properly value our company, and that the individual defendants breached their fiduciary duties in approving the merger agreement and that those breaches were aided and abetted by TTM, Merger Sub and the Company.
The Delaware Lawsuit specifically alleges, among other allegations, that (1) the Company’s board of directors breached its fiduciary duties by: (a) agreeing to the Merger for grossly inadequate consideration, (b) agreeing to lock up the Merger with deal protection devices that prevent other bidders from making a successful competing offer for Viasystems, and (c) participating in a transaction where the loyalties of the Company’s board of directors and management are divided; (2) the Voting Agreements prevent the Company’s stockholders from providing a meaningful vote on the proposal to adopt the Merger; and (3) that those breaches of fiduciary duties were aided and abetted by TTM, Merger Sub, and the Company.
Further, the Missouri Lawsuit specifically alleges, among other allegations, that (1) the Merger is the result of an unfair and flawed process because TTM’s financial advisor conspired with the Company’s two largest stockholders and their affiliates to sell the Company to TTM without the knowledge of the Company’s board of directors; (2) the Merger is unfair because it undervalues Viasystems; (3) the Company’s board of directors and the Company’s management have a conflict of interest due to the cash pool bonus and change in control payments to be made to certain executive officers and key employees if the Merger is consummated; (4) the Merger is unfair because the Merger Agreement contains preclusive deal protection devices that prevent other bidders from making a successful competing offer for Viasystems and prevent the Company’s stockholders from providing a meaningful vote on the proposal to adopt the Merger Agreement; and (5) the definitive Proxy Statement/Prospectus mailed on or about November 10, 2014 to the Company’s stockholders of record as of November 6, 2014 (the “Proxy Statement”) failed to provide the Company’s stockholders with material information regarding the Merger. The Lawsuits seek, among other things, injunctive relief to enjoin the defendants from completing the Merger on the agreed-upon terms, rescinding, to the extent already implemented, the Merger Agreement or any of the terms therein, costs and disbursements and attorneys’ and experts’ fees and costs, as well as other equitable relief as the court deems proper. Viasystems believes the Lawsuits are without merit.
On December 8, 2014, the parties to the Missouri Lawsuit agreed in principle to resolve all claims against the Company, the members of the Company’s board of directors, TTM, and Merger Sub. The agreement contemplated a release and settlement by the Company’s stockholders of all claims against the Company, the members of the Company’s board of directors, TTM, and Merger Sub, and in exchange Viasystems would promptly make certain agreed-upon supplemental disclosures regarding the Merger that the plaintiff in the Missouri Lawsuit alleged were material to the Company’s stockholders considering whether to vote to adopt the Merger Agreement. On December 9, 2014, in accordance with the parties’ agreement, Viasystems filed with the SEC on Form 8-K the agreed-upon supplemental disclosures regarding the Merger (the “Supplemental Disclosures”).
32
Table of Contents
On January 6, 2015, the parties entered into a Memorandum of Understanding, documenting the agreement-in-principle for the settlement of the Missouri Lawsuit. The settlement will not affect the merger consideration to be received by the Company’s stockholders pursuant to the Merger Agreement. There can be no assurance that the parties will ultimately enter into a definitive settlement agreement, or that the court will approve the settlement even if the parties were to enter into such definitive settlement agreement. In the event that the parties enter into a definitive settlement agreement, a hearing will be scheduled, following notice to the Company’s stockholders, at which the court will consider the fairness, reasonableness, and adequacy of the settlement. If the settlement is finally approved by the court, it will resolve and release all claims in all actions (including the Delaware Lawsuit) that were or could have been brought challenging or otherwise relating to any aspect of the Merger, the Merger Agreement, and any disclosure made in connection therewith. The defendants to the Lawsuits deny all fault or liability, and deny that they have committed any of the unlawful or wrongful acts alleged in the Lawsuits or otherwise in relation to the Merger, the Merger Agreement, or any of the events/actions related thereto, and specifically deny that any further disclosure was required to supplement the Proxy Statement under any applicable rule, statute, regulation or law. The Company agreed to provide the Supplemental Disclosures solely to minimize the cost of defending the Lawsuits and to permit the stockholder vote on the Merger Agreement to proceed without delay.
| Item 4. | Mine Safety Disclosures |
Not applicable.
33
Table of Contents
Item 5. Market for Registrant’s Common Equity, Related Stockholder Matters and Issuer Purchases of Equity Securities
Market Information and Stock Performance Graph
The following performance graph compares the cumulative total return on our common stock with the cumulative total return of i) the NASDAQ Composite Index and ii) a peer group index comprised of TTM Technologies, Inc., Flextronics International Ltd. and Sanmina-SCI Corporation. The graph assumes a $100 investment in each of Viasystems Group, Inc., the NASDAQ Composite Index and the peer group index at the close of trading on February 17, 2010, the date our common stock began trading on the NASDAQ Global Market, and assumes the reinvestment of all dividends. These indices are included for comparison purposes only and are not intended to forecast or be indicative of possible future performance of our common stock.
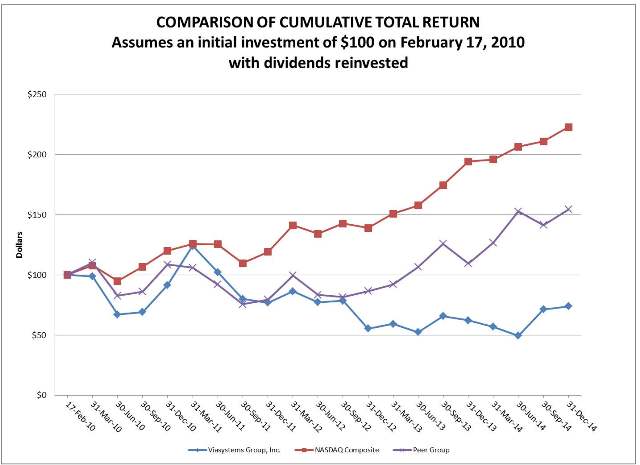
The performance graph above is being furnished solely to accompany this Annual Report on Form 10-K pursuant to Item 201(e) of Regulation S-K, is not being filed for purposes of Section 18 of the Securities Exchange Act of 1934, as amended, and is not to be incorporated into any filing of Viasystems, whether made before or after the date hereof, regardless of any general incorporation language in such filing.
34
Table of Contents
Our common stock is listed on the NASDAQ Global Market under the symbol VIAS, and began trading on February 17, 2010. As of February 6, 2015, the approximate number of holders of our common stock was 2,166. Previously, all of our outstanding common stock was held privately, and accordingly, there was no public trading market for our common stock.
The table below sets forth the range of quarterly high and low sales prices (including intraday prices) for our common stock on the NASDAQ Global Market during the periods indicated.
| Share Price | ||||||||
| 2013 |
High | Low | ||||||
| First Quarter |
$ | 16.00 | $ | 11.01 | ||||
| Second Quarter |
13.97 | 10.40 | ||||||
| Third Quarter |
20.06 | 11.00 | ||||||
| Fourth Quarter |
16.45 | 12.00 | ||||||
| 2014 |
||||||||
| First Quarter |
$ | 13.98 | $ | 11.55 | ||||
| Second Quarter |
13.30 | 9.52 | ||||||
| Third Quarter |
16.79 | 9.75 | ||||||
| Fourth Quarter |
16.48 | 14.81 | ||||||
Dividend Policy
We have paid no dividends since our inception, and our ability to pay dividends is limited by the terms of certain agreements related to our indebtedness. We do not anticipate paying any cash dividends on our common stock in the foreseeable future. We currently intend to retain all available funds and any available future earnings to fund the development and growth of our business. However, our subsidiary in China with a noncontrolling interest has the ability to make distributions to the noncontrolling interest holder.
35
Table of Contents
| Item 6. | Selected Financial Data |
The selected financial data and other data below for the years ended December 31, 2014, 2013, 2012, 2011, and 2010, present consolidated financial information of Viasystems and its subsidiaries and have been derived from our audited consolidated financial statements. The selected historical consolidated financial data set forth below should be read in conjunction with “Management’s Discussion and Analysis of Financial Condition and Results of Operations” and our consolidated financial statements and the notes thereto included elsewhere in this Report.
| Year Ended December 31, | ||||||||||||||||||||
| 2014 | 2013 | 2012(1) | 2011 | 2010(1) | ||||||||||||||||
| (dollars in thousands, except per share amounts) | ||||||||||||||||||||
| Statements of Operations Data: |
||||||||||||||||||||
| Net sales |
$ | 1,204,102 | $ | 1,171,046 | $ | 1,159,906 | $ | 1,057,317 | $ | 929,250 | ||||||||||
| Operating expenses (income): |
||||||||||||||||||||
| Cost of goods sold, exclusive of items shown separately below (2) |
968,586 | 949,496 | 927,154 | 837,686 | 718,710 | |||||||||||||||
| Guangzhou Fire business interruption insurance proceeds |
(26,459 | ) | — | — | — | — | ||||||||||||||
| Selling, general and administrative (2) |
111,893 | 100,505 | 109,460 | 80,300 | 77,458 | |||||||||||||||
| Depreciation |
87,904 | 88,060 | 80,019 | 65,938 | 56,372 | |||||||||||||||
| Amortization |
6,167 | 6,715 | 4,547 | 1,710 | 1,710 | |||||||||||||||
| Restructuring and impairment (3) |
7,351 | 1,073 | 19,457 | 812 | 8,518 | |||||||||||||||
|
|
|
|
|
|
|
|
|
|
|
|||||||||||
| Operating income |
48,660 | 25,197 | 19,269 | 70,871 | 66,482 | |||||||||||||||
| Other expense (income): |
||||||||||||||||||||
| Interest expense, net |
47,334 | 44,797 | 42,156 | 28,906 | 30,871 | |||||||||||||||
| Amortization of deferred financing costs |
2,901 | 2,898 | 2,723 | 2,015 | 1,994 | |||||||||||||||
| Loss on early extinguishment of debt (4) |
— | — | 24,234 | — | 706 | |||||||||||||||
| Other, net |
(3,435 | ) | (5,983 | ) | (419 | ) | 1,202 | 1,233 | ||||||||||||
|
|
|
|
|
|
|
|
|
|
|
|||||||||||
| Income (loss) before income taxes |
1,860 | (16,515 | ) | (49,425 | ) | 38,748 | 31,678 | |||||||||||||
| Income taxes |
17,036 | 11,095 | 12,793 | 8,464 | 16,082 | |||||||||||||||
|
|
|
|
|
|
|
|
|
|
|
|||||||||||
| Net (loss) income |
$ | (15,176 | ) | $ | (27,610 | ) | $ | (62,218 | ) | $ | 30,284 | $ | 15,596 | |||||||
|
|
|
|
|
|
|
|
|
|
|
|||||||||||
| Net income attributable to noncontrolling interest |
814 | 610 | 89 | 1,791 | 2,044 | |||||||||||||||
| Accretion of Redeemable Class B Senior Convertible preferred stock |
— | — | — | — | 1,053 | |||||||||||||||
| Conversion of Mandatory Redeemable Class A Junior preferred stock (5) |
— | — | — | — | 29,717 | |||||||||||||||
| Conversion of Redeemable Class B Senior Convertible preferred stock (5) |
— | — | — | — | 105,021 | |||||||||||||||
|
|
|
|
|
|
|
|
|
|
|
|||||||||||
| Net (loss) income available to common stockholders |
$ | (15,990 | ) | $ | (28,220 | ) | $ | (62,307 | ) | $ | 28,493 | $ | (122,239 | ) | ||||||
|
|
|
|
|
|
|
|
|
|
|
|||||||||||
| Basic (loss) earnings per share |
$ | (0.79 | ) | $ | (1.40 | ) | $ | (3.12 | ) | $ | 1.43 | $ | (6.81 | ) | ||||||
|
|
|
|
|
|
|
|
|
|
|
|||||||||||
| Diluted (loss) earnings per share |
$ | (0.79 | ) | $ | (1.40 | ) | $ | (3.12 | ) | $ | 1.42 | $ | (6.81 | ) | ||||||
|
|
|
|
|
|
|
|
|
|
|
|||||||||||
| Basic weighted average shares outstanding |
20,280,284 | 20,089,507 | 19,991,190 | 19,981,022 | 17,953,233 | |||||||||||||||
|
|
|
|
|
|
|
|
|
|
|
|||||||||||
| Diluted weighted average shares outstanding |
20,280,284 | 20,089,507 | 19,991,190 | 20,129,787 | 17,953,233 | |||||||||||||||
|
|
|
|
|
|
|
|
|
|
|
|||||||||||
| Balance Sheet Data (at period end): |
||||||||||||||||||||
| Cash and cash equivalents |
$ | 71,964 | $ | 54,738 | $ | 74,816 | $ | 71,281 | $ | 103,599 | ||||||||||
| Working capital |
188,441 | 108,448 | 142,879 | 136,733 | 134,285 | |||||||||||||||
| Total assets |
1,135,505 | 1,118,417 | 1,106,181 | 839,249 | 780,573 | |||||||||||||||
| Total debt, including current maturities |
614,008 | 572,895 | 575,696 | 226,770 | 225,397 | |||||||||||||||
| Stockholders’ equity |
202,664 | 212,588 | 231,857 | 293,072 | 257,105 | |||||||||||||||
| (1) | The financial data starting as of and for the year ended December 31, 2012, reflects the acquisition of DDi on May 31, 2012, and the financial data starting as of and for the year ended December 31, 2010, reflects the Recapitalization Agreement and the acquisition of Merix on February 16, 2010. |
| (2) | Stock compensation expense included in cost of goods sold and selling, general and administrative expenses for the years ended December 31, 2014, 2013, 2012, 2011 and 2010 was $7,752, $9,414, $10,563, $7,697, and $2,870, respectively. |
36
Table of Contents
| (3) | Represents restructuring charges taken to downsize and close facilities, and impairment losses related to the write-off of long-lived assets. |
| (4) | In connection with the repurchase of our $220 million 12.0% Senior Secured Notes due 2015 in 2012 and the repurchase of $105.9 million principal amount of our $200 million 10.5% Senior Subordinated Notes due 2011 (the “2011 Notes”) in 2010, we incurred losses on early extinguishment of debt of $24,234 and $706, respectively. |
| (5) | In connection with the Merix Acquisition, the Mandatory Redeemable Class A Junior preferred stock and the Redeemable Class B Senior Convertible preferred stock were reclassified as, and converted into, common stock in February 2010. |
| Item 7. | Management’s Discussion and Analysis of Financial Condition and Results of Operations |
The following discussion should be read in conjunction with “Selected Financial Data” and our consolidated financial statements and related notes included elsewhere in this Report. The following discussion contains forward-looking statements based upon current expectations and related to future events, and our future financial performance involves risks and uncertainties. We based these statements on assumptions we consider reasonable. Actual results and the timing of events could differ materially from those discussed in the forward-looking statements; see “Cautionary Statements Concerning Forward-Looking Statements.” Factors that could cause or contribute to these differences include, but are not limited to, those discussed below and elsewhere in this document, particularly in “Risk Factors.”
Recent Developments
Merger Agreement with TTM Technologies, Inc.
On September 21, 2014, our company, Viasystems Group, Inc. (the “Company”), TTM Technologies, Inc., a Delaware corporation (“TTM”), and Vector Acquisition Corp., a Delaware corporation and a wholly owned subsidiary of TTM (“Merger Sub”), entered into an Agreement and Plan of Merger (the “Merger Agreement”) pursuant to which Merger Sub will, subject to the satisfaction or waiver of the conditions therein, merge with and into the Company, with the Company surviving the merger as a wholly owned subsidiary of TTM (the “Merger”). The Merger Agreement was adopted by the Company’s stockholders on December 16, 2014.
Pursuant to the terms of the Merger Agreement and subject to the conditions therein, at the effective time of the Merger (the “Effective Time”), each share of the Company’s common stock issued and outstanding immediately prior to the Effective Time (other than shares (1) held in treasury of the Company, (2) owned by TTM or Merger Sub or (3) owned by stockholders who have perfected and not withdrawn a demand for appraisal rights under Delaware law) will be converted into the right to receive a combination of (a) 0.706 of validly issued, fully paid and nonassessable shares of TTM’s common stock (the “Stock Consideration”) and (b) $11.33 per share in cash (together with the Stock Consideration, the “Merger Consideration”). No fractional shares of TTM’s common stock will be issued in the Merger and the Company’s stockholders will receive cash in lieu of any fractional shares.
Pursuant to the terms of the Merger Agreement and subject to the conditions therein, at the Effective Time, the Company’s outstanding stock options will be cancelled and converted into the right to receive a combination of cash and stock with a combined value equal to the excess value, if any, of the Merger Consideration that would be delivered in respect of the number of shares of the Company’s common stock underlying such option over the exercise price for such option. The Company’s outstanding restricted stock awards will be converted into the Merger Consideration. The Company’s outstanding performance share units will vest based on the greater of 100% of the target payout and the payout that would have resulted based on the Company’s performance criteria, with each such vested performance share unit being exchanged for the Merger Consideration.
37
Table of Contents
The completion of the Merger is subject to various closing conditions, including, among other things, i) the expiration or termination of the applicable waiting period under the Hart-Scott-Rodino Antitrust Improvements Act of 1976, as amended (“HSR”), ii) the absence of any legal restraints or prohibitions on the consummation of the Merger and iii) receipt of approval of the Merger by the Committee on Foreign Investment in the United States (“CFIUS”). The obligation of each party to consummate the Merger is also conditioned upon the other party’s representations and warranties being true and correct (subject to certain materiality exceptions), the other party having performed in all material respects its obligations under the Merger Agreement and the other party not having suffered a material adverse effect.
The Merger Agreement contains customary representations, warranties and covenants made by each of the Company and TTM, including, among other things, covenants and agreements to conduct their respective businesses in the ordinary course in all material respects during the period between the execution of the Merger Agreement and completion of the Merger and not to engage in certain kinds of transactions during this period.
The Merger Agreement contains certain termination rights for each of the Company and TTM, including the right of each party to terminate the Merger Agreement if the Merger has not been consummated by June 21, 2015, subject to a three-month extension to September 21, 2015 at the election of either party if, on such date (such date as the same may be extended, the “Outside Date”), the Merger has not yet received antitrust approval, CFIUS approval or certain specified legal restraints are in place but all other closing conditions have been satisfied.
The Merger Agreement also provides that the Company will be entitled to receive from TTM a termination fee of $40.0 million in the event that the Merger Agreement is terminated due to a failure to obtain regulatory approval.
The foregoing description of the Merger and the Merger Agreement is qualified in its entirety by reference to the Merger Agreement, a copy of which is attached as Exhibit 2.1 to the Company’s Current Report on Form 8-K filed with the SEC on September 22, 2014, and which is incorporated by reference herein.
The Company cannot give any assurance that the Merger and the other related transactions will be completed or that, if completed, they will be exactly on the terms as set forth in the Merger Agreement and the other related transaction agreements.
Juarez Restructuring
During the third quarter of 2014, we rationalized the scope of operations and reduced the size of the workforce at our Juarez, Mexico metal fabrication and assembly facility by approximately 22%. As a result, we recorded restructuring charges of $0.6 million related to severance costs. In connection with the reduction of the workforce, we reviewed the facility’s property, plant and equipment for impairment and recorded a $6.2 million impairment charge.
Senior Secured Notes due 2019
On April 15, 2014, our subsidiary, Viasystems, Inc., completed an offering of $50.0 million aggregate principal amount of 7.875% Senior Secured Notes due 2019 (the “New Notes”). The New Notes were issued at a premium of 7.000%, or $3.5 million, which is being amortized as a reduction of interest expense over the term of the New Notes. We incurred $3.4 million of financing fees related to the New Notes that have been capitalized and are being amortized over the term of the New Notes. The net proceeds of the New Notes are being used for general corporate purposes and to pay fees and expenses related to the offering of the New Notes.
Previously, we had issued $550.0 million aggregate principal amount of 7.875% Senior Secured Notes due 2019 (the “Existing Notes” and, together with the New Notes, the “2019 Notes”) pursuant to an indenture dated as of April 30, 2012. The New Notes constitute an additional issuance of, and are fungible with, the Existing Notes and form a single class of debt securities with the Existing Notes for all purposes and have the same terms as the Existing Notes, except for the issue price and issue date.
38
Table of Contents
Guangzhou Fire
On September 5, 2012, we experienced a fire on the campus of our PCB manufacturing facility in Guangzhou, China which damaged property, destroyed inventory and temporarily reduced the facility’s manufacturing capacity (the “Guangzhou Fire”). In 2013, we received partial reimbursements of $1.6 million from our insurance carrier related to our property damage claim. During 2014, we settled all outstanding claims related to Guangzhou Fire for an additional $31.4 million. The total claim settlement related to the Guangzhou Fire was approximately $33.0 million which included $6.5 million related to our property damage claim and $26.5 million related to our business interruption claim.
Company Overview
We are a technology leader and worldwide provider of complex multi-layer printed circuit boards (“PCBs”) and electro-mechanical solutions (“E-M Solutions”). PCBs serve as the “electronic backbone” of almost all electronic equipment, and our E-M Solutions products and services integrate PCBs and other components into finished or semi-finished electronic equipment, which include custom and standard metal enclosures, metal cabinets, metal racks and sub-racks, backplanes, cable assemblies and busbars. We operate our business in two segments: Printed Circuit Boards, which includes our PCB products, and Assembly, which includes our E-M Solutions products and services.
The components we manufacture include, or can be found in, a wide variety of commercial products, including automotive engine controls, hybrid converters, automotive electronics for navigation, safety and entertainment, telecommunications switching equipment, data networking equipment, computer storage equipment, semiconductor test equipment, wind and solar energy applications, off-shore drilling equipment, communications applications, flight control systems and complex industrial, medical and other technical instruments.
We are a supplier to more than 1,000 original equipment manufacturers (“OEMs”) and contract electronic manufacturers (“CEMs”) in numerous end markets. Our OEM customers include industry leaders such as:
In addition, we have good working relationships with industry-leading CEMs and we supply PCBs and E-M Solutions products to them as well. These customers include:
We have fifteen manufacturing facilities, including eight in the United States and seven located outside of the United States, which allows us to take advantage of low cost, high quality manufacturing environments, while serving a broad base of customers around the globe. Our PCB products are produced in our eight domestic facilities, three of our five facilities in China and our one facility in Canada. Our E-M Solutions products and services are provided from our other two facilities in China and our one facility in Mexico. In addition to our manufacturing facilities, to support our customers’ local needs, we maintain engineering and customer service centers in Hong Kong, China, the Netherlands, England, Canada, Mexico and the United States. The locations of our engineering and customer service centers correspond directly to the primary areas where we ship our products. For the year ended December 31, 2014, approximately 50.2%, 31.3% and 18.5% of our net sales were generated by shipments to destinations in North America, Asia and Europe, respectively.
39
Table of Contents
Business Overview
As a component manufacturer, our sales trends generally reflect the market conditions in the industries we serve. While we believe the long-term growth prospects for our PCB and E-M Solutions products are positive, economic uncertainty and pricing pressures continue to exist, and our visibility to future demand trends remains limited.
We expect sales in the automotive end market to improve sequentially as we continue working to optimize our available capacity. In addition, long-term industry demand trends in the automotive electronics market are positive. According to Prismark Partners LLC, a leading PCB industry research firm, the global automotive electronics market is expected to grow at a compound annual growth rate of 5.1% from 2014 to 2018. Market growth in automotive electronics is expected to be driven primarily by growth in worldwide vehicle sales, particularly to customers in emerging markets such as China, increased electronic content per vehicle and increased sales of hybrid and electric vehicles.
Sales trends to our customers in the diverse industrial & instrumentation end market typically follow global economic trends. While we have experienced lower demand during 2014, we see opportunities in this end market as a result of growing demand for alternative energy, market share opportunities in the automated test equipment market and cross selling opportunities between our Printed Circuit Boards and Assembly segments.
The telecommunications end market remains dynamic as the customers we supply produce a mix of products which include both new cutting-edge applications as well as more mature products with varying levels of demand. We have benefitted from opportunities related to the 4G LTE build out in China, and we continue to try to position ourselves to take advantage of growth opportunities related to the introduction of next generation wireless technology standards.
In the computer and datacommunications end market, we have experienced softening demand in 2014, consistent with demand drops many of our customers are experiencing in their businesses. We continue to pursue new customers and programs for both our Printed Circuit Boards and Assembly segments, especially in the high-end server and storage sectors which are being driven, in part, by the “Cloud” infrastructure build-out.
In the military and aerospace end market, we experienced a recent improvement in sales as a result of customer qualification activity in 2014. However, overall demand and pricing trends continue to be negatively impacted by the U.S. government budget sequester, which we expect will have an impact on our sales going into 2015. With facilities in China that maintain aerospace quality management certifications, we see growth opportunities in this end market from the growing aerospace production in China.
40
Table of Contents
Results of Operations
Year Ended December 31, 2014, Compared with Year Ended December 31, 2013
Net Sales. Net sales for the year ended December 31, 2014, were $1,204.1 million, representing a $33.1 million, or 2.8%, increase from net sales for the year ended December 31, 2013.
Net sales by end market for the years ended December 31, 2014 and 2013 were as follows:
| End Market (dollars in millions) |
2014 | 2013 | ||||||
| Automotive |
$ | 393.0 | $ | 353.4 | ||||
| Industrial & Instrumentation |
284.0 | 297.2 | ||||||
| Telecommunications |
209.6 | 201.6 | ||||||
| Computer and Datacommunications |
182.5 | 196.0 | ||||||
| Military and Aerospace |
135.0 | 122.8 | ||||||
|
|
|
|
|
|||||
| Total Net Sales |
$ | 1,204.1 | $ | 1,171.0 | ||||
|
|
|
|
|
|||||
Our net sales of products for end use in the automotive market increased by approximately $39.6 million, or 11.2%, during the year ended December 31, 2014, compared with 2013. The increase was primarily a result of increased sales volume of approximately 9.8% in our Printed Circuit Boards segment driven by i) the restoration of manufacturing capacity and continued customer requalification activities following the Guangzhou Fire, ii) additional capacity we added to our principal automotive manufacturing facility in China, iii) new automotive customers in our Assembly segment and iv) program wins with existing automotive customers in our Printed Circuit Boards segment.
Net sales of products ultimately used in the industrial & instrumentation market decreased by approximately $13.2 million, or 4.4%, during the year ended December 31, 2014, compared with 2013. The decrease in net sales was driven primarily by i) decreased demand of elevator controls and wind power related programs as certain customers are manufacturing in-house a portion of the components we supply, ii) the loss of sales from a medical equipment related program due to price competitiveness and iii) lost market share with a customer seeking to diversify their supply chain, partially offset by iv) new program sales for industrial manufacturing equipment to an existing customer in our Assembly segment.
Net sales of products ultimately used in the telecommunications market increased by approximately $8.0 million, or 4.0%, during the year ended December 31, 2014, as compared with 2013. The sales increase was primarily a result of increased demand from i) a customer whose products support the 4G LTE build-out in China and ii) a ramp up in demand for a new program we won in 2013, partially offset by iii) a decline in demand from certain programs which went end-of-life in 2013, iv) reduced demand from an Assembly segment customer due to changes in order patterns the customer experienced for its end product and v) an inventory correction by one of our largest customers in this end market.
Net sales of our products for use in the computer and datacommunications markets decreased by approximately $13.5 million, or 6.9%, during the year ended December 31, 2014, as compared with 2013. The decrease was primarily a result of reduced sales volume of approximately 8.9% in our Printed Circuit Boards segment driven by a decline in demand from certain programs which went end-of-life and an inventory correction by one of the largest customers in this end market, partially offset by new customer wins in our Printed Circuit Boards segment and new program wins with existing customers in our Assembly segment.
Net sales to customers in the military and aerospace market increased by approximately $12.2 million, or 9.9%, during the year ended December 31, 2014, compared with 2013. The increase is primarily due to ramping demand for certain customer programs and market share growth with existing customers, including one customer who ceased internal production of PCBs and outsourced their requirements to us.
41
Table of Contents
Net sales by segment for the years ended December 31, 2014 and 2013 were as follows:
| Segment (dollars in millions) |
2014 | 2013 | ||||||
| Printed Circuit Boards |
$ | 1,049.0 | $ | 1,008.1 | ||||
| Assembly |
166.3 | 174.5 | ||||||
| Eliminations |
(11.2 | ) | (11.6 | ) | ||||
|
|
|
|
|
|||||
| Total Net Sales |
$ | 1,204.1 | $ | 1,171.0 | ||||
|
|
|
|
|
|||||
Printed Circuit Boards segment net sales, including intersegment sales, for the year ended December 31, 2014, increased by $40.9 million, or 4.1%. The increase was a result of increased sales in our automotive, telecommunications and military and aerospace end markets, partially offset by decreased sales in our computer and datacommunications and industrial & instrumentation end markets.
Assembly segment net sales decreased by $8.2 million, or 4.7%, for the year ended December 31, 2014, compared with 2013. The decrease was primarily the result of decreased sales in our industrial & instrumentation and telecommunications end markets, partially offset by increased net sales in our other end markets.
Cost of Goods Sold. Cost of goods sold, exclusive of items shown separately in the consolidated statement of operations and comprehensive (loss) income for year ended December 31, 2014, was $968.6 million, or 80.4% of consolidated net sales. This represents a 0.7 percentage point improvement from the 81.1% of consolidated net sales for the year ended December 31, 2013. As described below, a number of net positive cost factors in our Printed Circuit Boards segment were partially offset by a number of net negative factors in our Assembly segment.
On September 5, 2012, we experienced a fire on the campus of our PCB manufacturing facility in Guangzhou, China. The fire disrupted operations at this facility in both 2012 and 2013, which negatively impacted the ratio of cost of goods sold to consolidated net sales during these periods. During 2014, we settled our business interruption insurance claim related to the Guangzhou Fire for $26.5 million (the “Fire Insurance Payment”), which was recorded as a gain in operating income during this period.
The costs of materials, labor and overhead in our Printed Circuit Boards segment can be impacted by trends in global commodities prices and currency exchange rates, as well as other cost trends which can impact minimum wage rates and energy costs in China. Economies of scale can help to offset any adverse trends in these costs. As compared with 2013, cost of goods sold as a percentage of net sales in our Printed Circuit Boards segment was positively impacted during 2014 by i) higher sales levels, and ii) certain costs associated with the Guangzhou Fire in 2013 which did not recur in 2014, partially offset by iii) increased incentive compensation expense, including approximately $1.5 million related to the Fire Insurance Payment, iv) higher labor costs due to minimum wage increases that were implemented in China during the second quarter of 2013, v) a temporary work stoppage by employees in our largest factory in China and vi) manufacturing inefficiencies as we responded to a quality issue with certain raw materials we received from a supplier.
Cost of goods sold in our Assembly segment relates primarily to component materials costs. As a result, trends in sales volume for the segment drive similar trends in cost of goods sold. As compared with 2013, cost of goods sold as a percentage of net sales in our Assembly segment was negatively impacted during 2014 by i) lower sales levels ii) higher labor costs due to minimum wage increases that were implemented in China during the second quarter of 2013, and iii) lower absorption of overhead costs at our Juarez, Mexico facility due to lower sales levels, partially offset by iv) a gain of $3.6 million as a result of proceeds from a favorable legal judgment to recover costs related to certain defective inventory.
As part of our ongoing efforts to align capacity, overhead costs and operating expense with market demand, during 2014 we continued to implement a staffing reduction plan we had previously announced at certain of our PCB manufacturing facilities in China and made targeted reductions in force at both PCB and E M Solutions facilities in North America.
42
Table of Contents
Selling, General and Administrative Costs. Selling, general and administrative costs for the year ended December 31, 2014, increased by $11.4 million, or 11.3%, to $111.9 million as compared to the year ended December 31, 2013. The increase in selling, general and administrative costs is primarily due to i) $6.1 million of professional fees and other costs associated with the Merger and ii) increased incentive compensation expense, including approximately $2.0 million related to the Fire Insurance Payment, partially offset by iii) decreased non-cash stock compensation expense.
Depreciation. Depreciation expense for the year ended December 31, 2014, was $87.9 million, including $83.4 million related to our Printed Circuit Boards segment and $4.5 million related to our Assembly segment. Depreciation expense in both our Printed Circuit Boards and Assembly segments during 2014 was essentially unchanged compared to 2013.
Restructuring and Impairment. During the year ended December 31, 2014, we incurred approximately $7.4 million of restructuring and impairment charges, including approximately $6.9 million in our Assembly segment, $0.2 million in our Printed Circuit Boards segment and $0.3 million in “Other.” Charges incurred in the Assembly segment related to staff reductions and asset impairments at our Juarez, Mexico metal fabrication and assembly facility; charges incurred in our Printed Circuit Board segment related to the relocation of our Anaheim, California PCB manufacturing facility, partially offset by the reversal of accrued severance costs related to downsizing activities initiated in 2012 ; and charges incurred in “Other” related to an increase in estimated long-term obligations incurred in connection with plant closures that occurred early in the previous decade.
During the year ended December 31, 2013, we recognized net restructuring charges of $1.1 million, including $0.8 million in our Printed Circuit Boards segment, $0.2 million in our Assembly segment and $0.1 million in “Other.” Charges incurred in the Printed Circuit Boards segment were primarily related to $0.7 million for the relocation of our Anaheim, California facility; charges incurred in our Assembly segment related to staffing reductions during the fourth quarter of 2013; and charges incurred in “Other” related to an increase in estimated long-term obligations incurred in connection with plant closures that occurred early in the previous decade.
The primary components of restructuring and impairment expense for the years ended December 31, 2014 and 2013, are as follows:
| Restructuring Activity (dollars in millions) |
2014 | 2013 | ||||||
| Asset impairment |
$ | 6.2 | $ | — | ||||
| Lease and other contractual commitment expenses |
0.7 | 1.2 | ||||||
| Personnel and severance |
0.5 | (0.1 | ) | |||||
|
|
|
|
|
|||||
| Total expense, net |
$ | 7.4 | $ | 1.1 | ||||
|
|
|
|
|
|||||
Juarez Restructuring
During the third quarter of 2014, we rationalized the scope of operations and reduced the size of the workforce at our Juarez, Mexico metal fabrication and assembly facility by approximately 22%. As a result, we recorded restructuring charges of $0.6 million related to severance costs. In connection with the reduction of the workforce, we reviewed the facility’s property, plant and equipment for impairment and recorded a $6.2 million impairment charge.
Anaheim Move
During the second half of 2013, we relocated a PCB manufacturing facility we were leasing in Anaheim, California to a facility we had purchased and renovated in the same city (the “Anaheim Move”). During the years ended December 31, 2014 and 2013, we incurred lease and moving cost expense of approximately $0.5 million and $0.7 million, respectively, related to the Anaheim Move and we do not expect to incur any significant additional charges.
43
Table of Contents
Operating Income. Operating income of $48.7 million for the year ended December 31, 2014, represents an increase of $23.5 million compared with operating income of $25.2 million during the year ended December 31, 2013. The primary sources of operating income (loss) for the years ended December 31, 2014 and 2013, are as follows:
| Source (dollars in millions) |
2014 | 2013 | ||||||
| Printed Circuit Boards segment |
$ | 66.5 | $ | 25.3 | ||||
| Assembly segment |
(11.4 | ) | 0.5 | |||||
| Other |
(6.4 | ) | (0.6 | ) | ||||
|
|
|
|
|
|||||
| Operating income |
$ | 48.7 | $ | 25.2 | ||||
|
|
|
|
|
|||||
The increase in operating income in our Printed Circuit Boards segment was primarily the result of the net favorable impact of the Fire Insurance Payment, lower levels of cost of goods sold relative to sales, and reduced restructuring costs, partially offset by increased selling, general and administrative expense.
The decrease in operating income in our Assembly segment is primarily the result of restructuring and impairment charges at our Juarez, Mexico assembly facility and higher cost of goods sold as a percentage of net sales, partially offset by a $3.6 million gain as a result of a favorable legal judgment to recover costs related to certain defective inventory.
The $6.4 million operating loss in the “Other” segment for the year ended December 31, 2014 relates to $6.1 million of professional fees and other expenses related to the Merger and $0.3 million of restructuring charges related to an increase in estimated long-term obligations incurred in connection with manufacturing facilities which were closed in previous years. The $0.6 million operating loss in the “Other” segment for the year ended December 31, 2013, relates to acquisition and equity registration costs and restructuring charges related to an increase in estimated long-term obligations incurred in connection with manufacturing facilities which were closed in previous years.
Adjusted EBITDA. We measure our performance primarily through our operating income. In addition to our consolidated financial statements presented in accordance with U.S. GAAP, management uses certain non-GAAP financial measures, including “Adjusted EBITDA.” Adjusted EBITDA is not a recognized financial measure under U.S. GAAP, and does not purport to be an alternative to operating income or an indicator of operating performance. Adjusted EBITDA is presented to enhance an understanding of our operating results and is not intended to represent cash flows or results of operations. Our board of directors, lenders and management use Adjusted EBITDA primarily as an additional measure of performance for matters including executive compensation and competitor comparisons. In addition, the use of this non-U.S. GAAP measure provides an indication of our ability to service debt, and we consider it an appropriate measure to use because of our leveraged position.
Adjusted EBITDA has certain material limitations, primarily due to the exclusion of certain amounts that are material to our consolidated results of operations, such as interest expense, income tax expense and depreciation and amortization. In addition, Adjusted EBITDA may differ from the Adjusted EBITDA calculations of other companies in our industry, limiting its usefulness as a comparative measure.
We use Adjusted EBITDA to provide meaningful supplemental information regarding our operating performance and profitability by excluding from EBITDA certain items that we believe are not indicative of our ongoing operating results or will not impact our future operating cash flows as follows:
| • | Stock Compensation - non-cash charges associated with recognizing the fair value of stock options, restricted stock awards and performance share units granted to employees and directors. We exclude these charges to more clearly reflect comparable year-over-year cash operating performance. |
| • | Restructuring and Impairment Charges - which consist primarily of facility closures and other headcount reductions. We exclude restructuring and impairment charges to more clearly reflect our ongoing operating performance. |
| • | Costs Relating to Acquisitions and Equity Registrations – professional fees and other non-recurring costs and expenses associated with mergers and acquisition activity as well as costs associated with capital transactions, such as equity registrations. We exclude these costs and expenses because they are not representative of our customary operating expenses. |
44
Table of Contents
Reconciliations of operating income to Adjusted EBITDA for the years ended December 31, 2014 and 2013, were as follows:
| Source (dollars in millions) |
2014 | 2013 | ||||||
| Operating income |
$ | 48.7 | $ | 25.2 | ||||
| Add-back: |
||||||||
| Depreciation and amortization |
94.1 | 94.8 | ||||||
| Non-cash stock compensation expense |
7.8 | 9.4 | ||||||
| Restructuring and impairment charges |
7.4 | 1.1 | ||||||
| Costs relating to acquisitions and equity registrations |
6.1 | 0.6 | ||||||
|
|
|
|
|
|||||
| Adjusted EBITDA |
$ | 164.1 | $ | 131.1 | ||||
|
|
|
|
|
|||||
Adjusted EBITDA increased by $33.0 million, or 25.2%, primarily as a result of i) higher sales levels, ii) lower cost of goods sold relative to net sales, iii) the $23.0 million net favorable impact of the Fire Insurance Payment and iv) a $3.6 million gain as a result of a favorable legal judgment to recover costs related to certain defective inventory. Adjusted EBITDA for the year ended December 31, 2013 has not been adjusted to exclude costs related to manufacturing inefficiencies stemming from the Guangzhou Fire.
Interest Expense, net. Interest expense, net of interest income, was $47.3 million for the year ended December 31, 2014, compared with $44.8 million for the year ended December 31, 2013. The increase in interest expense is primarily attributable to i) interest incurred on the New Notes since they were issued on April 15, 2014, and ii) interest incurred on higher average outstanding credit facility borrowings during 2014, partially offset by iii) reduced interest expense on mortgage loans as a result of lower average outstanding principle balances during 2014 as compared with 2013.
Other Income and Expense. Other income, net for the year ended December 31, 2014 was $3.4 million and consisted primarily of foreign currency translation gains and the gain on the sale of a non-operating asset. For the year ended December 31, 2013, other income, net was $6.0 million and consisted primarily of the reversal of a $9.0 million liability as a result of the lapse of a contingency, partially offset by net foreign currency translation losses.
Income Taxes. Our income tax provision relates to i) taxes provided on our pre-tax earnings based on the effective tax rates in the jurisdictions where the income is earned and ii) other tax matters, including changes in tax-related contingencies and changes in the valuation allowance established for deferred tax assets. For the year ended December 31, 2014, our tax provision includes net expense of $12.9 million related to pre-tax earnings, and an expense of $4.1 million related to other tax matters, including a reversal of $0.6 million of uncertain tax positions due to lapsing of the applicable statute of limitations. For the year ended December 31, 2013, our tax provision includes net expense of $9.0 million related to pre-tax earnings, and an expense of $2.1 million related to other tax matters, including a reversal of $0.6 million of uncertain tax positions due to lapsing of the applicable statute of limitations.
As of December 31, 2014, we had established a full valuation allowance in both the U.S. and Canada for the deferred tax asset for net operating loss carryforwards. During the year ended December 31, 2014, we decreased the valuation allowance by $1.3 million, and during the year ended December 31, 2013, we increased the valuation allowance by $1.1 million. We continually evaluate our ability to realize our deferred tax assets and may, in the future, reverse the valuation allowance if sufficient supporting evidence exists.
45
Table of Contents
Year Ended December 31, 2013, Compared with Year Ended December 31, 2012
Net Sales. Net sales for the year ended December 31, 2013, were $1,171.0 million, representing a $11.1 million, or 1.0%, increase from net sales for the year ended December 31, 2012. Assuming the DDi Acquisition had occurred on January 1, 2012, on a pro forma basis, net sales decreased by approximately $101.9 million, or 8.0%, for the year ended December 31, 2013, as compared with the same period in 2012.
Net sales by end market on a historical basis for the years ended December 31, 2013 and 2012, and on a pro forma basis for the year ended December 31, 2012, were as follows:
| Historical | Pro Forma | |||||||||||
| End Market (dollars in millions) |
2013 | 2012 | 2012 | |||||||||
| Automotive |
$ | 353.4 | $ | 376.7 | $ | 378.6 | ||||||
| Industrial & Instrumentation |
297.2 | 311.6 | 352.3 | |||||||||
| Telecommunications |
201.6 | 180.0 | 191.9 | |||||||||
| Computer and Datacommunications |
196.0 | 199.1 | 224.3 | |||||||||
| Military and Aerospace |
122.8 | 92.5 | 125.8 | |||||||||
|
|
|
|
|
|
|
|||||||
| Total Net Sales |
$ | 1,171.0 | $ | 1,159.9 | $ | 1,272.9 | ||||||
|
|
|
|
|
|
|
|||||||
Our net sales of products for end use in the automotive market decreased by approximately $23.3 million, or 6.2%, during the year ended December 31, 2013, compared with 2012. Assuming the DDi Acquisition had occurred on January 1, 2012, on a pro forma basis, net sales of products for end use in this market decreased by approximately $25.2 million, or 6.7%, for the year ended December 31, 2013, as compared to 2012. The decrease was primarily a result of i) reduced sales volume of approximately 8.1% in our Printed Circuit Boards segment driven by manufacturing capacity constraints due to the Guangzhou Fire and closure of our Huizhou, China facility in late 2012 and ii) price reductions on certain programs implemented at the beginning of 2013, partially offset by iii) sales growth to customers in our Assembly segment and iv) favorable product mix. Despite lowering selling prices in light of reductions in some material costs, we experienced reduced market share on some programs due to price competitiveness.
Net sales of products ultimately used in the industrial & instrumentation market decreased by approximately $14.4 million, or 4.6%, during the year ended December 31, 2013, compared with 2012. Assuming the DDi Acquisition had occurred on January 1, 2012, on a pro forma basis, net sales of products for end use in this market decreased by approximately $55.1 million, or 15.6%, for the year ended December 31, 2013, as compared with 2012. The decrease in net sales was driven primarily by a decline in sales of wind power and elevator control related programs as certain customers began manufacturing in-house a portion of the components we supply and a decline in demand from customers that support the semiconductor industry.
Net sales of products ultimately used in the telecommunications market increased by approximately $21.6 million, or 12.0%, during the year ended December 31, 2013, as compared with 2012. Assuming the DDi Acquisition had occurred on January 1, 2012, on a pro forma basis, net sales of products for use in this end market increased by approximately $9.7 million, or 5.0%, for the year ended December 31, 2013, as compared with 2012. The increase was primarily a result of demand from a new customer in our Assembly segment and increased sales volume of approximately 2.7% in our Printed Circuit Boards segment.
Net sales of our products for use in the computer and datacommunications markets decreased by approximately $3.1 million, or 1.5%, during the year ended December 31, 2013, as compared with 2012. Assuming the DDi Acquisition had occurred on January 1, 2012, on a pro forma basis, net sales of products for use in this end market decreased by approximately $28.3 million, or 12.6%, for the year ended December 31, 2013, as compared with 2012. The decrease in net sales was primarily a result of reduced demand for certain programs we supply through our Printed Circuit Boards segment and the loss of sales from a program supplied through our Assembly segment that went end-of-life, partially offset by a new customer and program wins in our Assembly segment.
46
Table of Contents
Net sales to customers in the military and aerospace market increased by approximately $30.3 million, or 32.8%, during the year ended December 31, 2013, compared with 2012. Assuming the DDi Acquisition had occurred on January 1, 2012, on a pro forma basis, net sales of products for use in this end market decreased by approximately $3.0 million, or 2.3%, for the year ended December 31, 2013, as compared with 2012. While we have increased our market share with certain customers during the year, the decline in sales reflects weakened demand from our customers as a result of uncertainty caused by the U.S. government’s budget processes.
Net sales by segment on a historical basis for the years ended December 31, 2013 and 2012, and on a pro forma basis for the year ended December 31, 2012, were as follows:
| Historical | Pro Forma | |||||||||||
| Segment (dollars in millions) |
2013 | 2012 | 2012 | |||||||||
| Printed Circuit Boards |
$ | 1,008.1 | $ | 967.2 | $ | 1,080.2 | ||||||
| Assembly |
174.5 | 200.1 | 200.1 | |||||||||
| Eliminations |
(11.6 | ) | (7.4 | ) | (7.4 | ) | ||||||
|
|
|
|
|
|
|
|||||||
| Total Net Sales |
$ | 1,171.0 | $ | 1,159.9 | $ | 1,272.9 | ||||||
|
|
|
|
|
|
|
|||||||
Printed Circuit Boards segment net sales, including intersegment sales, for the year ended December 31, 2013, increased by $40.9 million, or 4.2%, compared with 2012. Assuming the DDi Acquisition had occurred on January 1, 2012, on a pro forma basis, Printed Circuit Boards net sales, including intersegment sales, for the year ended December 31, 2013, decreased by $72.1 million, or 6.7%, compared with 2012. This decrease is a result of decreases in net sales in all end markets except the telecommunications end market.
Assembly segment net sales decreased by $25.6 million, or 12.8%, for the year ended December 31, 2013, compared with 2012. The decrease was primarily the result of reduced demand in wind power programs in our industrial & instrumentation end market, partially offset by increased sales to other customers in all our other end markets.
Cost of Goods Sold. Cost of goods sold, exclusive of items shown separately in the consolidated statement of operations and comprehensive (loss) income for year ended December 31, 2013, was $949.5 million, or 81.1%, of consolidated net sales. This represents a 1.2 percentage point increase from the 79.9% of consolidated net sales for the year ended December 31, 2012.
The costs of materials, labor and overhead in our Printed Circuit Boards segment can be impacted by trends in global commodities prices and currency exchange rates, as well as other cost trends which can impact minimum wage rates and energy costs in China. Economies of scale can help to offset any adverse trends in these costs. Cost of goods sold as a percentage of sales was impacted during 2013 by costs related to manufacturing inefficiencies at our Guangzhou, China PCB facility as a result of a fire in September 2012 and production inefficiencies in our Anaheim, California PCB operation as we relocated those operations to a new facility. Our results for the year ended December 31, 2013, also reflect a stabilization of material costs which had increased in 2012. With anticipated changes in minimum wage laws in China, we expect our labor costs will increase during 2014, similar to 2013 and prior years. As part of our ongoing efforts to better align overhead costs and operating expenses with market demand, during the third quarter of 2012, we began to reduce staffing at certain of our PCB manufacturing facilities in China.
Cost of goods sold in our Assembly segment relates primarily to component materials costs. As a result, trends in sales volume for the segment drive similar trends in cost of goods sold. Costs as a percentage of sales during the year ended December 31, 2013, were negatively impacted by inefficiencies and increased overhead costs at our Juarez, Mexico facility as it launched new products and by reduced sales volume and unfavorable product mix at our Shanghai, China facility.
Selling, General and Administrative Costs. Selling, general and administrative costs for the year ended December 31, 2013, decreased by $9.0 million, or 8.2%, to $100.5 million as compared to the year ended December 31, 2012. The decrease was primarily due to i) a $9.2 million decrease in merger and acquisition related costs, ii) a $3.1 million decrease in cash-based incentive compensation expense and iii) a $1.2 million decrease in non-cash stock compensation expense, partially offset by a full-year of costs associated with manufacturing, sales and administrative sites acquired in the DDi Acquisition as compared to seven months of these costs during 2012. Excluding merger and acquisition related costs, selling, general and administrative costs for the year ended December 31, 2013, decreased by 0.1% to 8.5% as a percentage of sales, as compared with 2012.
47
Table of Contents
Depreciation. Depreciation expense for the year ended December 31, 2013, was $88.1 million, including $83.6 million related to our Printed Circuit Boards segment and $4.5 million related to our Assembly segment. Depreciation expense in our Printed Circuit Boards segment increased by approximately $8.1 million, or 10.7%, compared to the same period last year primarily as a result of increased investments in new equipment during the past twelve months and the effect of a full-year of depreciation on fixed assets acquired through the DDi Acquisition as compared with only seven months during 2012. Depreciation expense in our Assembly segment during 2013 was essentially unchanged compared to 2012.
Restructuring and Impairment. During the year ended December 31, 2013, we recognized net restructuring charges of $1.1 million, including $0.8 million in our Printed Circuit Boards, $0.2 million in our Assembly segment and $0.1 million in “Other.” Charges incurred in the Printed Circuit Boards segment were primarily related to $0.7 million for the relocation of our Anaheim, California facility. Charges incurred in the Assembly segment related to staffing reductions during the fourth quarter of 2013, and charges incurred in “Other” related to an increase in estimated long-term obligations incurred in connection with plant closures that occurred early in the previous decade.
The primary components of restructuring and impairment expense for the years ended December 31, 2013 and 2012, are as follows:
| Restructuring Activity (dollars in millions) |
2013 | 2012 | ||||||
| Lease and other contractual commitment expenses |
$ | 1.2 | $ | 1.7 | ||||
| Personnel and severance |
(0.1 | ) | 16.1 | |||||
| Asset impairment |
— | 1.7 | ||||||
|
|
|
|
|
|||||
| Total expense, net |
$ | 1.1 | $ | 19.5 | ||||
|
|
|
|
|
|||||
Operating Income. Operating income of $25.2 million for the year ended December 31, 2013, represents an increase of $5.9 million compared with operating income of $19.3 million during the year ended December 31, 2012. The primary sources of operating income for the years ended December 31, 2013 and 2012, are as follows:
| Source (dollars in millions) |
2013 | 2012 | ||||||
| Printed Circuit Boards segment |
$ | 25.3 | $ | 27.4 | ||||
| Assembly segment |
0.5 | 1.6 | ||||||
| Other |
(0.6 | ) | (9.7 | ) | ||||
|
|
|
|
|
|||||
| Operating income |
$ | 25.2 | $ | 19.3 | ||||
|
|
|
|
|
|||||
The decrease in operating income in our Printed Circuit Boards segment was primarily the result of higher levels of cost of goods sold relative to sales and increased depreciation and amortization expense, partially offset by decreased selling, general and administrative expense and restructuring costs. Operating income during the second quarter of 2012 reflected a one-time inventory fair value adjustment of approximately $3.9 million related to the DDi Acquisition, which negatively impacted cost of goods sold.
The decrease in operating income in our Assembly segment is primarily the result of lower net sales, partially offset by decreased restructuring costs.
The $0.6 million operating loss in the “Other” segment for the year ended December 31, 2013, relates to acquisition and equity registration costs and restructuring charges related to an increase in estimated long-term obligations incurred in connection with manufacturing facilities which were closed in previous years. The $9.7 million operating loss in the “Other” segment for the year ended December 31, 2012, relates primarily to professional fees associated with the DDi Acquisition.
48
Table of Contents
Adjusted EBITDA. Reconciliations of operating income to Adjusted EBITDA for the years ended December 31, 2013 and 2012, were as follows:
| Source (dollars in millions) |
2013 | 2012 | ||||||
| Operating income |
$ | 25.2 | $ | 19.3 | ||||
| Add-back: |
||||||||
| Depreciation and amortization |
94.8 | 84.6 | ||||||
| Non-cash stock compensation expense |
9.4 | 10.6 | ||||||
| Restructuring and impairment charges |
1.1 | 19.9 | ||||||
| Costs relating to acquisitions and equity registrations |
0.6 | 13.6 | ||||||
|
|
|
|
|
|||||
| Adjusted EBITDA |
$ | 131.1 | $ | 148.0 | ||||
|
|
|
|
|
|||||
Adjusted EBITDA decreased by $16.9 million, or 11.4%, primarily due to higher cost of goods sold relative to sales in 2013, as compared to 2012. Adjusted EBITDA for the years ended December 31, 2013 and 2012, has not been adjusted to exclude net costs related to manufacturing inefficiencies stemming from the 2012 fire at our Guangzhou, China facility.
Interest Expense, net. Interest expense, net of interest income, was $44.8 million for the year ended December 31, 2013, compared to $42.2 million, for the year ended December 31, 2012. On April 30, 2012, we issued $550.0 million in aggregate principal amount of 7.875% Senior Secured Notes due 2019 and in May 2012, we redeemed our $220.0 million in the aggregate principal amount of 12.0% senior secured notes due 2015 and assumed $14.7 million of mortgage debt in the DDi Acquisition. The increase in interest expense is primarily due to the incremental interest expense associated with the 2019 Notes and mortgage debt which was outstanding for all of 2013 over the interest expense associated with i) the 2015 Notes, which were outstanding for five months during 2012, and ii) the 2019 Notes and mortgage debt, which were outstanding for only a portion of 2012.
Other Income and Expense. Other income, net for the years ended December 31, 2013 and 2012, was $6.0 million and $0.4 million, respectively. For the year ended December 31, 2013, other income, net reflects the reversal of a $9.0 million liability as a result of the lapse of a contingency, partially offset by net foreign currency translation losses.
Income Taxes. Our income tax provision relates to i) taxes provided on our pre-tax earnings based on the effective tax rates in the jurisdictions where the income is earned and ii) other tax matters, including changes in tax-related contingencies and changes in the valuation allowance established for deferred tax assets. For the year ended December 31, 2013, our tax provision includes net expense of $9.0 million related to pre-tax earnings, and an expense of $2.1 million related to other tax matters, including a reversal of $0.6 million of uncertain tax positions due to lapsing of the applicable statute of limitations. For the year ended December 31, 2012, our tax provision included net expense of $9.3 million related to our pre-tax earnings, and an expense of $3.5 million related to other tax matters, including a reversal of $2.7 million of uncertain tax positions due to lapsing of the applicable statute of limitations.
As of December 31, 2013, we had established a full valuation allowance in both the U.S. and Canada for the deferred tax asset for net operating loss carryforwards. During the years ended December 31, 2013 and 2012, we increased the valuation allowance by $1.1 million and $57.0 million, respectively. We continually evaluate our ability to realize our deferred tax assets and may, in the future, reverse the valuation allowance if sufficient supporting evidence exists.
Noncontrolling Interest. Net income attributable to noncontrolling interest of $0.6 million for the year ended December 31, 2013, compares to net income attributable to noncontrolling interest of $0.1 million in 2012, and reflects a noncontrolling interest holder’s (the “Noncontrolling Interest Holder”) 5.0% interest in the profits from our PCB manufacturing facility in Huiyang, China in 2013 and 2012 and the Noncontrolling Interest Holder’s 15.0% interest in the profits from the Huizhou Facility for the period prior to our buyout of that interest in May 2012. The increase in net income attributable to noncontrolling interest during 2013 as compared to 2012 is primarily a result of losses attributable to noncontrolling interest from our Huizhou Facility in 2012.
49
Table of Contents
Liquidity and Capital Resources
Cash Flow
Net cash provided by operating activities was $38.4 million, $89.9 million and $78.1 million for the years ended December 31, 2014, 2013 and 2012, respectively. The reduction in net cash provided by operating activities in 2014 as compared with 2013, is primarily due to changes in working capital and higher income tax payments, partially offset by a lower net loss. The changes in working capital items reflect i) a reduction in our days payables outstanding from approximately 75 days at December 31, 2013, to approximately 64 days at December 31, 2014, ii) increased accounts receivable resulting from higher sales levels and iii) increased inventory levels to support customer demand. Net cash provided by operating activities increased in 2013 as compared with 2012, as a result of a lower net loss in 2013, partially offset by an increase in receivables, inventories and payables during 2013 as we recovered from the impact of the Guangzhou Fire and replaced the capacity we lost with the closure of our Huizhou Facility at the end of 2012.
Net cash used in investing activities was $59.1 million, $106.6 million and $371.0 million for the years ended December 31, 2014, 2013 and 2012, respectively. Cash used by investing activities during 2014 related to capital expenditures of $64.7 million, partially offset by $3.6 million of proceeds from the disposal of property, plant and equipment and $2.0 million of insurance proceeds for property, plant and equipment damaged in the Guangzhou Fire. Cash used by investing activities during 2013 related entirely to capital expenditures net of proceeds from the disposal of fixed assets.
Our Printed Circuit Boards segment is a capital-intensive business that requires annual spending to keep pace with customer demands for new technologies, cost reductions and product quality standards. The spending needed to meet our customers’ requirements is incremental to recurring repair and replacement capital expenditures required to maintain our existing production capacities and capabilities. While we are prepared to make appropriate investments in facilities to meet growing demand, given the ongoing uncertainty about global economic conditions, we have and will continue to focus on managing capital expenditures to respond to changes in demand or other economic conditions.
Net cash used in investing activities by our Printed Circuit Boards segment include capital expenditures of $60.5 million, $100.9 million and $102.1 million for the years ended December 31, 2014, 2013 and 2012, respectively. The decline in capital expenditures during 2014 as compared with 2013 reflects increased levels of spending in 2013 to increase manufacturing capacity and replace equipment destroyed in the Guangzhou Fire. Capital expenditures in our Printed Circuit Boards segment in 2013 were relatively flat as compared with 2012, and reflect continued spending to increase manufacturing capacity and replace equipment destroyed in the Guangzhou Fire.
Capital expenditures related to our Assembly segment for the years ended December 31, 2014, 2013 and 2012 were $3.9 million, $6.6 million and $6.0 million, respectively. Capital expenditures in our Assembly segment declined in 2014 as compared with 2013 as we adjusted the level of capital spending to reflect lower sales levels. The increase in capital expenditures in our Assembly segment in 2013, as compared with 2012, primarily relates to investments at our E-M Solutions facilities to support sales growth.
Net cash provided by financing activities was $38.0 million for the year ended December 31, 2014, which related to i) the $50.1 million net proceeds from the issuance of the New Notes, ii) $0.1 million of proceeds from the exercise of stock options, partially offset by iii) $10.0 million of net repayments of credit facilities in China, iv) $1.2 million of scheduled principal payments of our North America mortgage loans, v) $0.4 million of optional mortgage loan prepayments and vi) $0.6 million of payments related to net share settlement of stock awards.
Net cash used in financing activities was $3.4 million for the year ended December 31, 2013, which related primarily to i) $2.2 million of scheduled debt repayments, including the redemption of our $0.9 million in the aggregate principal amount of 4.0% Senior Subordinated Notes due 2013, ii) $0.7 million of tax withholding payments related to net share settlements of stock awards, iii) a $0.3 million optional mortgage debt prepayment and iv) $0.2 million of financing fees related to the extension of the Senior Secured 2010 Credit Facility.
50
Table of Contents
Net cash provided by financing activities was $296.5 million for the year ended December 31, 2012, which related to the issuance of $550.0 million aggregate principal amount of our 2019 Notes, partially offset by i) $16.2 million of related debt issuance costs, ii) the payment of $236.3 million to redeem our 2015 Notes, iii) net repayments of $0.7 million on credit facilities and mortgage debt and iv) a $0.3 million distribution to the Noncontrolling Interest Holder.
Financing Arrangements
As of December 31, 2014, our financing arrangements included the following:
Senior Secured Notes due 2019
On April 15, 2014, our subsidiary, Viasystems, Inc., completed an offering of $50.0 million aggregate principal amount of 7.875% Senior Secured Notes due 2019 (the “New Notes”). The New Notes were issued at a premium of 7.000%, or $3.5 million, which is being amortized as a reduction of interest expense over the term of the New Notes. We incurred $3.4 million of financing fees related to the New Notes that have been capitalized and are being amortized over the term of the New Notes. The net proceeds of the New Notes are being used for general corporate purposes and to pay fees and expenses related to the offering of the New Notes.
Previously, we had issued $550.0 million aggregate principal amount of 7.875% Senior Secured Notes due 2019 (the “Existing Notes” and, together with the New Notes, the “2019 Notes”) pursuant to an indenture dated as of April 30, 2012. The New Notes constitute an additional issuance of, and are fungible with, the Existing Notes and form a single class of debt securities with the Existing Notes for all purposes and have the same terms as the Existing Notes, except for the issue price and issue date. We incurred $16.2 million of deferred financing fees related to the Existing Notes that were capitalized and are being amortized over the life of the notes. Interest on the 2019 Notes is due semiannually on May 1 and November 1 of each year. At any time prior to May 1, 2015, we may use the cash proceeds from one or more equity offerings to redeem up to $192.5 million of the aggregate principal amount of the notes at a redemption price of 107.875% plus accrued and unpaid interest. In addition, at any time prior to May 1, 2015, but not more than once in any twelve-month period, we may redeem up to $55.0 million of the aggregate principal amount of the notes at a redemption price of 103% plus accrued and unpaid interest. Furthermore, at any time prior to May 1, 2015, we may redeem all or part of the notes, at a redemption price of 100% plus a “make-whole” premium equal to the greater of a) 1% of the principal amount or b) the excess of i) the present value at the redemption rate of 105.906% of the principal amount redeemed calculated using a discount rate equal to the treasury rate (as defined) plus 50 basis points, over ii) the principal amount of the notes. On or after May 1, 2015, we may redeem all or a portion of the notes during the twelve month periods ended April 30, 2016, 2017 and 2018 at redemption prices of 105.906%, 103.938% and 101.969%, respectively, plus accrued and unpaid interest. After May 1, 2018, we may redeem the 2019 Notes at the redemption price of 100% plus accrued and unpaid interest. In the event of a Change in Control (as defined), we are required to make an offer to purchase the 2019 Notes at a redemption price of 101%, plus accrued and unpaid interest.
The 2019 Notes are guaranteed, jointly and severally, by all of Viasystems, Inc.’s current and future material domestic subsidiaries (the “Subsidiary Guarantors”) and by Viasystems Group, Inc. through a parent guarantee. The 2019 Notes are collateralized by all of the equity interests of each of the Subsidiary Guarantors and by liens on substantially all of Viasystems, Inc.’s and the Subsidiary Guarantors’ assets.
The indenture governing the 2019 Notes contains restrictive covenants which, among other things, limit our ability and certain of our subsidiaries, including Viasystems, Inc. and the Subsidiary Guarantors, to: a) incur additional indebtedness or issue disqualified stock or preferred stock; b) create liens; c) pay dividends, make investments or make other restricted payments; d) sell assets; e) consolidate, merge, sell or otherwise dispose of all or substantially all of the assets of Viasystems, Inc. and its subsidiaries; and f) enter into certain transactions with affiliates.
51
Table of Contents
Senior Secured 2010 Credit Facility
Effective as of December 31, 2013, we amended our senior secured revolving credit agreement (the “Senior Secured 2010 Credit Facility) with Wells Fargo Capital Finance, LLC primarily for the purpose of extending the maturity date, increasing the maximum potential credit limit, and reducing the applicable margins for loans under the agreement. The Senior Secured 2010 Credit Facility, as amended, provides a secured revolving credit facility in an aggregate principal amount of up to $75.0 million which, upon mutual agreement, may be increased to a maximum of $100.0 million. The facility matures on December 29, 2018. The annual interest rates applicable to loans under the Senior Secured 2010 Credit Facility are, at our option, either the Prime Rate or Eurodollar Rate (each as defined in the Senior Secured 2010 Credit Facility) plus, in each case, an applicable margin. The applicable margin is tied to our Monthly Average Excess Availability (as defined in the Senior Secured 2010 Credit Facility) and ranges from 0.25% to 0.75% for Prime Rate loans and 1.75% to 2.25% for Eurodollar Rate loans. In addition, Viasystems is required to pay an unused line fee and other fees as defined in the Senior Secured 2010 Credit Facility.
The Senior Secured 2010 Credit Facility is guaranteed by and secured by substantially all of the assets of our current and future material domestic subsidiaries, subject to certain exceptions as set forth in the Senior Secured 2010 Credit Facility. The Senior Secured 2010 Credit Facility contains negative covenants restricting and limiting our ability to, among other things:
| • | incur debt, incur contingent obligations and issue certain types of preferred stock; |
| • | create liens; |
| • | pay dividends, distributions or make other specified restricted payments; |
| • | make certain investments and acquisitions; |
| • | enter into certain transactions with affiliates; and |
| • | merge or consolidate with any other entity or sell, assign, transfer, lease, convey or otherwise dispose of assets. |
Under the Senior Secured 2010 Credit Facility, if the Excess Availability (as defined in the Senior Secured 2010 Credit Facility) is less than $9.4 million, then we must maintain, on a monthly basis, a minimum fixed charge coverage ratio of 1.0 to 1.0.
We incurred $2.5 million of deferred financing fees, including the 2013 amendment, related to the Senior Secured 2010 Credit Facility which have been capitalized and are being amortized over the life of the facility. As of December 31, 2014, the Senior Secured 2010 Credit Facility supported letters of credit totaling $1.9 million, and approximately $66.4 million was unused and available based on eligible collateral.
Zhongshan 2010 Credit Facility
Our unsecured revolving credit facility between our Kalex Multi-layer Circuit Board (Zhongshan) Limited (“KMLCB”) subsidiary and China Construction Bank, Zhongshan Branch (the “Zhongshan 2010 Credit Facility”), provides for borrowing denominated in Renminbi (“RMB”) and foreign currency including the U.S. dollar. Borrowings are guaranteed by KMLCB’s sole Hong Kong parent company, Kalex Circuit Board (China) Limited. This revolving credit facility is renewable annually upon mutual agreement. Loans under the credit facility bear interest at the rate of i) LIBOR plus a margin negotiated prior to each U.S. dollar denominated loan or ii) the interest rate quoted by the Peoples Bank of China for Chinese RMB denominated loans. The Zhongshan 2010 Credit Facility has certain restrictions and other covenants that are customary for similar credit arrangements; however, there are no financial covenants contained in this facility. As of December 31, 2014, the Zhongshan 2010 Credit Facility was undrawn, and approximately $40.9 million of the revolving credit facility was unused and available.
Senior Subordinated Convertible Notes due 2013
On May 15, 2013, we redeemed all $0.9 million principal amount of our outstanding senior subordinated convertible notes due 2013 upon their scheduled maturity.
52
Table of Contents
North America Mortgage Loans
Toronto Mortgages
Our mortgage loans with Business Development Bank of Canada (“BDC”) consists of two loan agreements, one denominated in U.S. dollars and the second denominated in Canadian dollars, which are secured by the land, building and certain equipment at our manufacturing facility in Toronto, Canada. The loan agreements contain a covenant requiring us to maintain an available funds coverage ratio of 1.5 to 1.0. As of December 31, 2014, the balance of the U.S. dollar loan was $0.4 million. The loan bears interest at a variable rate equal to the applicable BDC floating base rate less 0.4% (3.25% as of December 31, 2014) and will mature in October 2015. As of December 31, 2014, the U.S. dollar equivalent balance of the Canadian dollar loan was $3.1 million. The loan bears interest at a variable rate equal to the applicable BDC floating base rate less 0.75% (4.25% as of December 31, 2014) and will mature in September 2028.
Anaheim Mortgage
Our mortgage loan with Wells Fargo Bank is secured by the land and building at our PCB manufacturing facility in Anaheim, California. The loan agreement contains a covenant requiring us to maintain a minimum fixed charge coverage ratio of 1.25 to 1.0. As of December 31, 2014, the balance of the loan was $4.9 million. The loan bears interest at a fixed rate of 4.326%, and will mature in March 2019, when a balloon principal payment of $3.4 million will be due.
Cleveland Mortgage
Our mortgage loan with Zions Bank is secured by the land and building of our PCB manufacturing facility in the Cuyahoga Falls suburb of Cleveland, Ohio. As of December 31, 2014, the balance of the loan was $1.3 million. The loan bears interest at a variable rate equal to the Federal Home Loan Bank of Seattle prime rate plus 2% (3.25% as of December 31, 2014), and will mature in November 2032.
Denver Mortgage
Our mortgage loan with GE Real Estate is secured by the land and building at our manufacturing facility in Littleton, Colorado. As of December 31, 2014, the balance of the loan was $0.7 million. The loan bears interest at a fixed rate of 7.55%, and will mature in July 2032.
North Jackson Mortgage
During 2014, we completed the repayment of the mortgage loan on our North Jackson, Ohio PCB facility.
Liquidity
We had cash and cash equivalents at December 31, 2014 and 2013, of $72.0 million and $54.7 million, respectively, of which $42.9 million and $34.5 million, respectively, were held outside the United States. Liquidity is affected by many factors, some of which are based on normal ongoing operations of our business and some of which arise from fluctuations related to global economics and markets. Cash balances are generated and held in many locations throughout the world. We permanently reinvest the earnings of our foreign subsidiaries outside the United States, and our current plans do not demonstrate a need to repatriate them to fund our United States operations. If these funds were to be needed for our operations in the United States, we would be required to record and pay significant taxes to repatriate these funds (see Note 13 in the accompanying notes to the consolidated financial statements). At December 31, 2014, we had no outstanding borrowings and letters of credit of $1.9 million under various credit facilities; and approximately $107.2 million of the credit facilities were unused and available. The agreements underlying our credit facilities include restrictive and financial covenants and, as of December 31, 2014, we were in compliance with these covenants.
We believe that cash flow from operations, availability on credit facilities and available cash on hand will be sufficient to fund our recurring capital expenditure requirements and other currently anticipated cash needs for the next 12 months. However, our ability to meet our cash needs through cash generated by our operating activities will depend on the demand for our products, as well as general economic, financial, competitive and other factors, many of which are beyond our control. Therefore, we cannot be assured that our business will generate sufficient cash flow from operations, that currently anticipated cost savings and operating improvements will be realized on schedule, that future borrowings will be available to us under our credit facilities or that we will be able to raise third party financing in an amount sufficient to enable us to pay our indebtedness or to fund our other liquidity needs. We may need to refinance all or a portion of our indebtedness.
53
Table of Contents
Our principal liquidity requirements over the next twelve months will be for i) $23.6 million semi-annual interest payments required in connection with the 2019 Notes, payable in May and November each year, ii) capital expenditure needs of our continuing operations, iii) working capital needs, iv) debt service requirements in connection with our credit facilities and other debt and v) costs associated with the Merger.
Off Balance Sheet Arrangements
We do not have any off balance sheet arrangements as defined under Securities and Exchange Commission rules.
Backlog
We estimate that our backlog of unfilled orders as of December 31, 2014, was approximately $231.7 million, which includes $188.4 million and $43.3 million from our Printed Circuit Boards and Assembly segments, respectively. This compares with our backlog of unfilled orders of $215.0 million at December 31, 2013, which included $165.5 million and $49.5 million from our Printed Circuit Boards and Assembly Segments, respectively. Because unfilled orders may be cancelled prior to delivery, the backlog outstanding at any point in time is not necessarily indicative of the level of business to be expected in the ensuing period.
Related Party Transactions
Noncontrolling Interest Holder
We purchase consulting and other services from the Noncontrolling Interest Holder which owns 5% of the subsidiary that operates our PCB manufacturing facility in Huiyang, China. During each of the years ended December 31, 2014, 2013 and 2012, we paid the Noncontrolling Interest Holder $0.1 million related to these services. Prior to the 2012 closure of the Huizhou Facility, we made rental payments and purchased consulting and other services from the Noncontrolling Interest Holder related to the Huizhou Facility. During each of the years ended December 31, 2012 and 2011, we paid the Noncontrolling Interest Holder $0.7 million related to these rental payments and service fees.
Critical Accounting Policies and Estimates
The preparation of financial statements in conformity with U.S. GAAP requires that management make certain estimates and assumptions that affect amounts reported in the financial statements and accompanying notes. Actual results may differ from those estimates and assumptions and the differences may be material. Significant accounting policies, estimates and judgments that management believes are the most critical to aid in fully understanding and evaluating the reported financial results are discussed below.
Revenue Recognition
We recognize revenue when all of the following criteria are satisfied: persuasive evidence of an arrangement exists; risk of loss and title transfer to the customer; the price is fixed and determinable; and collectability is reasonably assured. Sales and related costs of goods sold are included in income when goods are shipped to the customer in accordance with the delivery terms and the above criteria are satisfied. All services are performed prior to invoicing customers for any products manufactured by us. We monitor and track product returns, which have historically been within our expectations and the provisions established. Reserves for product returns are recorded based on historical trend rates at the time of sale. Despite our efforts to improve our quality and service to customers, we cannot guarantee that we will continue to experience the same or better return rates than we have in the past. Any significant increase in returns could have a material negative impact on our operating results.
54
Table of Contents
Accounts Receivable and Allowance for Doubtful Accounts
Accounts receivable balances represent customer trade receivables generated from our operations. We evaluate collectability of accounts receivable based on a specific case-by-case analysis of larger accounts; and based on an overall analysis of historical experience, past due status of the entire accounts receivable balance and the current economic environment. Based on this evaluation, we make adjustments to the allowance for doubtful accounts for expected losses. We also perform credit evaluations and adjust credit limits based upon each customer’s payment history and creditworthiness. While credit losses have historically been within our expectations and the provisions established, actual bad debt write-offs may differ from our estimates, resulting in higher or lower charges in the future for our allowance for doubtful accounts.
Inventories
Inventories are stated at the lower of cost (valued using the first-in, first-out (FIFO) and average cost methods) or market value. Cost includes raw materials, labor and manufacturing overhead.
We apply judgment in valuing our inventories by assessing the net realizable value of our inventories based on current expected selling prices, as well as factors such as obsolescence and excess stock. We provide valuation allowances as necessary. Should we not achieve our expectations of the net realizable value of our inventory, future losses may occur.
Long-Lived Assets, Excluding Goodwill
We review the carrying amounts of property, plant and equipment, definite-lived intangible assets and other long-lived assets for potential impairment if an event occurs or circumstances change that indicates the carrying amount may not be recoverable. In evaluating the recoverability of a long-lived asset, we compare the carrying values of the assets with corresponding estimated undiscounted future operating cash flows. In the event the carrying values of long-lived assets are not recoverable by future undiscounted operating cash flows, impairments may exist. In the event of impairment, an impairment charge would be measured as the amount by which the carrying value of the relevant long-lived assets exceeds their fair value. During 2014 we recognized an impairment loss to fixed assets of $6.1 million as a result of restructuring activities at our Juarez, Mexico metal fabrication and assembly facility. No impairments were recorded in 2013. During 2012 we recognized an impairment loss to fixed assets of $0.7 million as a result of the closure of our Huizhou, China PCB manufacturing facility.
Goodwill
At December 31, 2014, our goodwill balance relates entirely to our Printed Circuit Boards segment. We conduct an assessment of the carrying value of goodwill annually, as of the first day of our fourth fiscal quarter, or more frequently if circumstance arise which would indicate the fair value of a reporting unit is below its carrying amount. During 2014, we performed a qualitative assessment to screen for potential impairment of goodwill. A qualitative assessment requires us to consider a number of relevant factors and conclude whether it is more likely than not that the fair value of a reporting unit is more than its carrying amount. In performing our qualitative assessment to screen for potential impairment of goodwill, we considered a number of factors, including i) macroeconomic conditions, ii) factors impacting our industry and the end markets we serve, iii) factors impacting our costs to manufacture products and operate our business, iv) the financial performance of reporting units compared with projections and prior periods, v) reporting unit specific events which could impact future operating results, vi) the market value of our debt and equity securities, and vii) other relevant events and circumstances identified at the time of the assessment. No adjustments were recorded to the balance of goodwill as a result of this assessment.
In any given year we may elect to perform a quantitative impairment test for impairment, or if, as a result of the qualitative assessment, we are not able to conclude it is more likely than not that the fair value of a reporting unit is more than its carrying amount, then we would be required to perform a quantitative test for impairment. The performance of a quantitative test would require us to make certain assumptions and estimates in determining fair value of our reporting units. When performing such a test, we use multiple methods to estimate the fair value of our reporting units, including discounted cash flow analyses and an EBITDA-multiple approach, which derives an implied fair value of a business unit based on the market value of comparable companies expressed as a multiple of those companies’ earnings before interest, taxes, depreciation and amortization (“EBITDA”). Discounted cash flow analyses require us to make significant assumptions about discount rates, sales growth, profitability and other factors. The EBITDA-multiple approach requires us to judgmentally select comparable companies based on factors such as their nature, scope and size. Significant judgment is required in making assumptions and estimates to perform a quantitative impairment test, and should our assumptions change in the future, our fair value models could result in lower fair values, which could materially affect the value of goodwill and our operating results.
55
Table of Contents
Income Taxes
We record a valuation allowance to reduce our deferred tax assets to the amount that we believe will more likely than not be realized. We have considered future taxable income and ongoing prudent, feasible tax planning strategies in assessing the need for the valuation allowance, but in the event we were to determine that we would not be able to realize all or part of our net deferred tax assets in the future, an adjustment to the net deferred tax assets would be charged to income in the period such determination was made. Similarly, should we determine that we would be able to realize our deferred tax assets in the future in excess of the net deferred tax assets recorded, an adjustment to the net deferred tax asset would increase net income in the period such determination was made.
Derivative Financial Instruments and Fair Value Measurements
We conduct our business in various regions of the world, and export and import products to and from several countries. Our operations may, therefore, be subject to volatility because of currency fluctuations. Sales are primarily denominated in U.S. dollars, while expenses are frequently denominated in local currencies, and results of operations may be adversely affected as currency fluctuations affect our product prices and operating costs or those of our competitors. From time to time, we enter into foreign exchange forward contracts and cross-currency swaps to minimize the short-term impact of foreign currency fluctuations. We do not engage in hedging transactions for speculative investment reasons. Gains or losses from our hedging activities have not historically been material to our cash flows, financial position or results from operations. There can be no assurance that our hedging operations will eliminate or substantially reduce risks associated with fluctuating currencies.
The foreign exchange forward contracts and cross-currency swaps designated as cash flow hedges are accounted for at fair value. We record deferred gains and losses related to cash flow hedges based on their fair value using a market approach and Level 2 inputs. The effective portion of the change in each cash flow hedge’s gain or loss is reported as a component of other comprehensive income, net of taxes. The ineffective portion of the change in the cash flow hedge’s gain or loss is recorded in earnings at each measurement date. Gains and losses on derivative contracts are reclassified from accumulated other comprehensive (loss) income to current period earnings in the line item in which the hedged item is recorded in the same period the hedged foreign currency cash flow affects earnings.
Accounting for Acquisitions
The acquisition method of accounting requires an acquirer to recognize the assets acquired and the liabilities assumed at the acquisition date measured at their estimated fair value as of that date. Extensive use of estimates and judgments are required to allocate the consideration paid in a business combination to the assets acquired and liabilities assumed. If necessary, these estimates can be revised during an allocation period when information becomes available to further define and quantify the value of assets acquired and liabilities assumed. The allocation period does not exceed a period of one year from the date of acquisition. To the extent additional information to refine the original allocation becomes available during the allocation period, the purchase price allocation would be adjusted accordingly. Should information become available after the allocation period, the effects would be reflected in operating results.
Recently Adopted Accounting Pronouncements
As of January 1, 2014, we adopted a new accounting standard which provides guidance for the financial statement presentation of unrecognized tax benefits when a net operating loss carryforward exists. The new standard provides that a liability related to an unrecognized tax benefit be presented as a reduction of a deferred tax asset for a net operating loss carryforward if the settlement of such liability is required or expected in the event the uncertain tax position is disallowed. This standard did not have a material impact on Viasystems’ consolidated financial statements upon adoption.
56
Table of Contents
Recently Issued Accounting Pronouncements
Revenue Recognition. In June 2014, the Financial Accounting Standards Board (the “FASB”) issued a new accounting standard that changes the criteria companies must use for the recognition of revenue and will affect our measurement, recognition and disclosures concerning revenue once the new standard is adopted. We will adopt the new standard as of January 1, 2017. As of the date of this Report, we are still evaluating the potential impact this standard will have on our consolidated financial statements upon adoption.
Going Concern. In August 2014, the FASB issued disclosure guidance that requires management to evaluate, at each annual and interim reporting period, whether substantial doubt exists about an entity’s ability to continue as a going concern and, if applicable, to provide related disclosures. As outlined by that guidance, substantial doubt about an entity’s ability to continue as a going concern exists when relevant conditions and events, considered in the aggregate, indicate that it is probable that an entity will be unable to meet its obligations as they become due within one year after the date that the financial statements are issued (or are available to be issued). The new guidance will be effective for annual reporting periods ending after December 15, 2016 and interim periods thereafter, with early adoption permitted.
Discontinued Operations. In April 2014, the FASB issued accounting guidance that raised the threshold for disposals to qualify as discontinued operations to disposals which represent a strategic shift that has (or will have) a major effect on an entity’s operations and financial results. Such a strategic shift may include the disposal of (1) a major geographical area of operations, (2) a major line of business, (3) a major equity method investment or (4) other major parts of an entity. Provided that the major strategic shift criterion is met, the new guidance does allow entities to have significant continuing involvement and continuing cash flows with the discontinued operation, unlike current U.S. GAAP. The new standard also requires additional disclosures for discontinued operations and new disclosures for individually material disposal transactions that do not meet the definition of a discontinued operation. The new guidance will apply prospectively to disposals that occur in interim and annual periods beginning on or after December 31, 2014.
Contractual Obligations
The following table provides a summary of future payments due under contractual obligations and commitments as of December 31, 2014:
| Payments due by period | ||||||||||||||||||||
| Contractual Obligations (dollars in millions) |
Less than 1 year |
1-3 years |
3-5 years |
More than 5 years |
Total | |||||||||||||||
| 2019 Notes |
$ | — | $ | — | $ | 600.0 | $ | — | $ | 600.0 | ||||||||||
| Interest on 2019 Notes |
47.3 | 94.5 | 63.0 | — | 204.8 | |||||||||||||||
| North America Mortgage Loans, including interest |
1.3 | 2.2 | 5.2 | 4.0 | 12.7 | |||||||||||||||
| Capital lease payments |
0.1 | 0.3 | 0.3 | 0.1 | 0.8 | |||||||||||||||
| Operating leases |
7.4 | 10.2 | 4.5 | 10.2 | 32.3 | |||||||||||||||
| Restructuring payments |
0.3 | 0.2 | 0.2 | 2.0 | 2.7 | |||||||||||||||
| Management fees |
0.4 | 0.7 | 0.7 | 11.0 | 12.8 | |||||||||||||||
| Deferred compensation |
1.9 | 0.1 | 0.2 | 8.2 | 10.4 | |||||||||||||||
| Purchase orders |
60.8 | — | — | — | 60.8 | |||||||||||||||
|
|
|
|
|
|
|
|
|
|
|
|||||||||||
| Total (a) |
$ | 119.5 | $ | 108.2 | $ | 674.1 | $ | 35.5 | $ | 937.3 | ||||||||||
|
|
|
|
|
|
|
|
|
|
|
|||||||||||
| (a) | The liability for unrecognized tax benefits of $32.1 million included in other non-current liabilities at December 31, 2014, has been excluded from the above table as we cannot make a reasonably reliable estimate of the timing of future payments. |
57
Table of Contents
| Item 7A. | Quantitative and Qualitative Disclosures About Market Risk |
Interest Rate Risk
As of December 31, 2014, we had $4.8 million of outstanding borrowings with variable interest rates, and we may have additional variable rate debt in the future. Accordingly, our earnings and cash flows could be affected by changes in interest rates in the future. Based on the December 31, 2014 reference rates, we do not believe a 10% movement in the reference rates would have a material effect on our financial condition, operating results or cash flows.
Foreign Currency Exchange Rate Risk
We conduct our business in various regions of the world, and export and import products to and from several countries. Our operations may, therefore, be subject to volatility because of currency fluctuations. Sales are primarily denominated in U.S. dollars, while expenses are frequently denominated in local currencies, and results of operations may be affected adversely as currency fluctuations affect our product prices and operating costs or those of our competitors. From time to time, we enter into foreign exchange forward contracts and cross-currency swaps to minimize the short-term impact of foreign currency fluctuations. We do not engage in hedging transactions for speculative investment reasons. Gains or losses from our hedging activities have not historically been material to our cash flows, financial position or results from operations. There can be no assurance that our hedging operations will eliminate or substantially reduce risks associated with fluctuating currencies. At December 31, 2014, we have foreign currency hedge instruments outstanding that hedge a notional amount of approximately 1.8 billion Chinese RMB at an average exchange rate of 6.28 RMB per one U.S. dollar with a weighted average remaining maturity of 6.1 months.
Based on December 31, 2014 exchange rates and our RMB denominated operating expenses for the year ended December 31, 2014, an increase or decrease in the RMB exchange rate of 10% (ignoring the effects of hedging) would result in an increase or decrease in our annual operating expenses of approximately $57.7 million.
Commodity Price Risk
We purchase diesel fuel to generate portions of our energy in certain of our manufacturing facilities using generators, and we will be required to bear the increased cost of generating energy if the cost of oil increases. In addition, the materials we purchase to manufacture PCBs contain copper, gold, silver and tin. To the extent prices for such metals increase, our cost to manufacture PCBs will increase. Prices for copper, gold, silver, tin and oil have a history of substantial fluctuation in recent years. Future price increases for such commodities would increase our cost and could have an adverse effect on our results of operations.
58
Table of Contents
| Item 8. | Financial Statements and Supplementary Data |
Index To Financial Statements
59
Table of Contents
Report of Independent Registered Public Accounting Firm
The Board of Directors and Stockholders
Viasystems Group, Inc.
We have audited the accompanying consolidated balance sheets of Viasystems Group, Inc. and subsidiaries as of December 31, 2014 and 2013, and the related consolidated statements of operations and comprehensive (loss) income, stockholders’ equity and cash flows for each of the three years in the period ended December 31, 2014. These financial statements are the responsibility of the Company’s management. Our responsibility is to express an opinion on these financial statements based on our audits.
We conducted our audits in accordance with the standards of the Public Company Accounting Oversight Board (United States). Those standards require that we plan and perform the audit to obtain reasonable assurance about whether the financial statements are free of material misstatement. An audit includes examining, on a test basis, evidence supporting the amounts and disclosures in the financial statements. An audit also includes assessing the accounting principles used and significant estimates made by management, as well as evaluating the overall financial statement presentation. We believe that our audits provide a reasonable basis for our opinion.
In our opinion, the financial statements referred to above present fairly, in all material respects, the consolidated financial position of Viasystems Group, Inc. and subsidiaries at December 31, 2014 and 2013, and the consolidated results of their operations and their cash flows for each of the three years in the period ended December 31, 2014, in conformity with U.S. generally accepted accounting principles.
We also have audited, in accordance with the standards of the Public Company Accounting Oversight Board (United States), Viasystems Group, Inc. and subsidiaries’ internal control over financial reporting as of December 31, 2014, based on criteria established in the Internal Control - Integrated Framework issued by the Committee of Sponsoring Organizations of the Treadway Commission (2013 framework), and our report dated March 12, 2015, expressed an unqualified opinion thereon.
/s/ Ernst & Young LLP
St. Louis, Missouri
March 12, 2015
60
Table of Contents
VIASYSTEMS GROUP, INC. AND SUBSIDIARIES
CONSOLIDATED BALANCE SHEETS
(dollars in thousands, except per share amounts)
| December 31, | ||||||||
| 2014 | 2013 | |||||||
| ASSETS |
||||||||
| Current assets: |
||||||||
| Cash and cash equivalents |
$ | 71,964 | $ | 54,738 | ||||
| Accounts receivable, net |
215,784 | 196,126 | ||||||
| Inventories |
138,195 | 122,182 | ||||||
| Deferred taxes |
10,010 | 9,361 | ||||||
| Prepaid expenses and other |
28,684 | 28,770 | ||||||
|
|
|
|
|
|||||
| Total current assets |
464,637 | 411,177 | ||||||
| Property, plant and equipment, net |
415,607 | 446,488 | ||||||
| Goodwill |
151,283 | 151,283 | ||||||
| Intangible assets, net |
90,158 | 96,183 | ||||||
| Deferred financing costs, net |
13,115 | 12,593 | ||||||
| Other assets |
705 | 693 | ||||||
|
|
|
|
|
|||||
| Total assets |
$ | 1,135,505 | $ | 1,118,417 | ||||
|
|
|
|
|
|||||
| LIABILITIES AND STOCKHOLDERS’ EQUITY |
||||||||
| Current liabilities: |
||||||||
| Current maturities of long-term debt |
$ | 1,093 | $ | 11,387 | ||||
| Accounts payable |
175,346 | 203,122 | ||||||
| Accrued and other liabilities |
93,861 | 85,009 | ||||||
| Income taxes payable |
5,896 | 3,211 | ||||||
|
|
|
|
|
|||||
| Total current liabilities |
276,196 | 302,729 | ||||||
| Long-term debt, less current maturities |
612,915 | 561,508 | ||||||
| Other non-current liabilities |
43,730 | 41,592 | ||||||
|
|
|
|
|
|||||
| Total liabilities |
932,841 | 905,829 | ||||||
| Commitments and contingencies |
||||||||
| Stockholders’ equity: |
||||||||
| Common stock, $0.01 par value, 100,000,000 shares authorized; 20,921,111 and 20,759,014 shares issued and outstanding |
209 | 208 | ||||||
| Paid-in capital |
2,401,505 | 2,394,268 | ||||||
| Accumulated deficit |
(2,209,279 | ) | (2,193,289 | ) | ||||
| Accumulated other comprehensive income |
6,475 | 8,461 | ||||||
|
|
|
|
|
|||||
| Total Viasystems stockholders’ equity |
198,910 | 209,648 | ||||||
| Noncontrolling interest |
3,754 | 2,940 | ||||||
|
|
|
|
|
|||||
| Total stockholders’ equity |
202,664 | 212,588 | ||||||
|
|
|
|
|
|||||
| Total liabilities and stockholders’ equity |
$ | 1,135,505 | $ | 1,118,417 | ||||
|
|
|
|
|
|||||
See accompanying notes to consolidated financial statements.
61
Table of Contents
VIASYSTEMS GROUP, INC. AND SUBSIDIARIES
CONSOLIDATED STATEMENTS OF OPERATIONS
AND COMPREHENSIVE (LOSS) INCOME
(dollars in thousands, except per share amounts)
| Year Ended December 31, | ||||||||||||
| 2014 | 2013 | 2012 | ||||||||||
| Net sales |
$ | 1,204,102 | $ | 1,171,046 | $ | 1,159,906 | ||||||
| Operating expenses (income): |
||||||||||||
| Cost of goods sold, exclusive of items shown separately below |
968,586 | 949,496 | 927,154 | |||||||||
| Guangzhou Fire business interruption insurance proceeds |
(26,459 | ) | — | — | ||||||||
| Selling, general and administrative |
111,893 | 100,505 | 109,460 | |||||||||
| Depreciation |
87,904 | 88,060 | 80,019 | |||||||||
| Amortization |
6,167 | 6,715 | 4,547 | |||||||||
| Restructuring and impairment |
7,351 | 1,073 | 19,457 | |||||||||
|
|
|
|
|
|
|
|||||||
| Operating income |
48,660 | 25,197 | 19,269 | |||||||||
| Other expense (income): |
||||||||||||
| Interest expense, net |
47,334 | 44,797 | 42,156 | |||||||||
| Amortization of deferred financing costs |
2,901 | 2,898 | 2,723 | |||||||||
| Loss on early extinguishment of debt |
— | — | 24,234 | |||||||||
| Other, net |
(3,435 | ) | (5,983 | ) | (419 | ) | ||||||
|
|
|
|
|
|
|
|||||||
| Income (loss) before income taxes |
1,860 | (16,515 | ) | (49,425 | ) | |||||||
| Income taxes |
17,036 | 11,095 | 12,793 | |||||||||
|
|
|
|
|
|
|
|||||||
| Net loss |
$ | (15,176 | ) | $ | (27,610 | ) | $ | (62,218 | ) | |||
|
|
|
|
|
|
|
|||||||
| Less: |
||||||||||||
| Net income attributable to noncontrolling interest |
$ | 814 | $ | 610 | $ | 89 | ||||||
|
|
|
|
|
|
|
|||||||
| Net loss attributable to common stockholders |
$ | (15,990 | ) | $ | (28,220 | ) | $ | (62,307 | ) | |||
|
|
|
|
|
|
|
|||||||
| Basic loss per share |
$ | (0.79 | ) | $ | (1.40 | ) | $ | (3.12 | ) | |||
|
|
|
|
|
|
|
|||||||
| Diluted loss per share |
$ | (0.79 | ) | $ | (1.40 | ) | $ | (3.12 | ) | |||
|
|
|
|
|
|
|
|||||||
| Basic weighted average shares outstanding |
20,280,284 | 20,089,507 | 19,991,190 | |||||||||
|
|
|
|
|
|
|
|||||||
| Diluted weighted average shares outstanding |
20,280,284 | 20,089,507 | 19,991,190 | |||||||||
|
|
|
|
|
|
|
|||||||
| Comprehensive (loss) income: |
||||||||||||
| Net loss |
$ | (15,176 | ) | $ | (27,610 | ) | $ | (62,218 | ) | |||
| Change in fair value of derivatives, net of tax |
(1,986 | ) | (407 | ) | 813 | |||||||
|
|
|
|
|
|
|
|||||||
| Comprehensive loss |
(17,162 | ) | (28,017 | ) | (61,405 | ) | ||||||
| Less: |
||||||||||||
| Comprehensive income attributable to noncontrolling interests |
814 | 610 | 89 | |||||||||
|
|
|
|
|
|
|
|||||||
| Comprehensive loss attributable to common stockholders |
$ | (17,976 | ) | $ | (28,627 | ) | $ | (61,494 | ) | |||
|
|
|
|
|
|
|
|||||||
See accompanying notes to consolidated financial statements.
62
Table of Contents
VIASYSTEMS GROUP, INC. AND SUBSIDIARIES
CONSOLIDATED STATEMENTS OF STOCKHOLDERS’ EQUITY
(dollars in thousands)
| Common Stock Shares |
Common Stock at Par |
Paid-in Capital |
Accumulated Deficit |
Accumulated Other Comprehensive Income |
Non- Controlling Interest |
Total | ||||||||||||||||||||||
| Balance at December 31, 2011 |
20,390,009 | $ | 204 | $ | 2,383,910 | $ | (2,102,762 | ) | $ | 8,055 | $ | 3,665 | $ | 293,072 | ||||||||||||||
| Net (loss) income |
— | — | — | (62,307 | ) | — | 89 | (62,218 | ) | |||||||||||||||||||
| Change in fair value of derivatives, net of taxes of $0 |
— | — | — | — | 813 | — | 813 | |||||||||||||||||||||
| Issuance of restricted stock awards |
240,825 | 2 | (2 | ) | — | — | — | — | ||||||||||||||||||||
| Forfeiture of restricted stock awards |
(6,579 | ) | — | — | — | — | — | — | ||||||||||||||||||||
| Distribution to noncontrolling interest holder |
— | — | — | — | — | (267 | ) | (267 | ) | |||||||||||||||||||
| Purchase of remaining interest in Huizhou subsidiary |
— | — | (8,949 | ) | — | — | (1,157 | ) | (10,106 | ) | ||||||||||||||||||
| Stock compensation expense |
— | — | 10,563 | — | — | — | 10,563 | |||||||||||||||||||||
|
|
|
|
|
|
|
|
|
|
|
|
|
|
|
|||||||||||||||
| Balance at December 31, 2012 |
20,624,255 | 206 | 2,385,522 | (2,165,069 | ) | 8,868 | 2,330 | 231,857 | ||||||||||||||||||||
| Net (loss) income |
— | — | — | (28,220 | ) | — | 610 | (27,610 | ) | |||||||||||||||||||
| Change in fair value of derivatives, net of taxes of $256 |
— | — | — | — | (407 | ) | — | (407 | ) | |||||||||||||||||||
| Issuance of restricted stock awards |
203,089 | 2 | (2 | ) | — | — | — | — | ||||||||||||||||||||
| Forfeiture of restricted stock awards |
(11,509 | ) | — | — | — | — | — | — | ||||||||||||||||||||
| Shares withheld for payment of taxes upon vesting of restricted stock awards |
(56,821 | ) | — | (666 | ) | — | — | — | (666 | ) | ||||||||||||||||||
| Stock compensation expense |
— | — | 9,414 | — | — | — | 9,414 | |||||||||||||||||||||
|
|
|
|
|
|
|
|
|
|
|
|
|
|
|
|||||||||||||||
| Balance at December 31, 2013 |
20,759,014 | 208 | 2,394,268 | (2,193,289 | ) | 8,461 | 2,940 | 212,588 | ||||||||||||||||||||
| Net (loss) income |
— | — | — | (15,990 | ) | — | 814 | (15,176 | ) | |||||||||||||||||||
| Change in fair value of derivatives, net of taxes of $0 |
— | — | — | — | (1,986 | ) | — | (1,986 | ) | |||||||||||||||||||
| Exercise of stock options |
4,999 | — | 76 | — | — | — | 76 | |||||||||||||||||||||
| Issuance of restricted stock awards |
213,900 | 1 | (1 | ) | — | — | — | — | ||||||||||||||||||||
| Forfeiture of restricted stock awards |
(11,366 | ) | — | — | — | — | — | — | ||||||||||||||||||||
| Shares withheld for payment of taxes upon vesting of restricted stock awards |
(45,436 | ) | — | (590 | ) | — | — | — | (590 | ) | ||||||||||||||||||
| Stock compensation expense |
— | — | 7,752 | — | — | — | 7,752 | |||||||||||||||||||||
|
|
|
|
|
|
|
|
|
|
|
|
|
|
|
|||||||||||||||
| Balance at December 31, 2014 |
20,921,111 | $ | 209 | $ | 2,401,505 | $ | (2,209,279 | ) | $ | 6,475 | $ | 3,754 | $ | 202,664 | ||||||||||||||
|
|
|
|
|
|
|
|
|
|
|
|
|
|
|
|||||||||||||||
See accompanying notes to consolidated financial statements.
63
Table of Contents
VIASYSTEMS GROUP, INC. AND SUBSIDIARIES
CONSOLIDATED STATEMENTS OF CASH FLOWS
(dollars in thousands)
| Year Ended December 31, | ||||||||||||
| 2014 | 2013 | 2012 | ||||||||||
| Cash flows from operating activities: |
||||||||||||
| Net loss |
$ | (15,176 | ) | $ | (27,610 | ) | $ | (62,218 | ) | |||
| Adjustments to reconcile net loss to net cash provided by operating activities: |
||||||||||||
| Depreciation and amortization |
94,071 | 94,775 | 84,566 | |||||||||
| Non-cash stock compensation expense |
7,752 | 9,414 | 10,563 | |||||||||
| Impairment of property, plant and equipment |
6,152 | — | 747 | |||||||||
| Amortization of deferred financing costs |
2,901 | 2,898 | 2,723 | |||||||||
| (Gain) loss on disposition of assets, net |
(2,269 | ) | (161 | ) | 551 | |||||||
| Deferred income taxes |
(1,841 | ) | (652 | ) | 306 | |||||||
| Amortization of original issue (premium) discount on long term debt |
(492 | ) | — | 665 | ||||||||
| Non-cash impact of exchange rates |
(380 | ) | (95 | ) | 155 | |||||||
| Loss on early extinguishment of debt |
— | — | 24,234 | |||||||||
| Change in restricted cash |
— | — | 6,830 | |||||||||
| Change in assets and liabilities: |
||||||||||||
| Accounts receivable |
(19,658 | ) | (12,978 | ) | 51,090 | |||||||
| Inventories |
(16,013 | ) | (11,153 | ) | 29,868 | |||||||
| Prepaid expenses and other |
(3,013 | ) | 2,204 | 4,633 | ||||||||
| Accounts payable |
(27,776 | ) | 41,232 | (58,444 | ) | |||||||
| Accrued and other liabilities |
11,435 | (8,879 | ) | (15,207 | ) | |||||||
| Income taxes payable |
2,685 | 876 | (2,973 | ) | ||||||||
|
|
|
|
|
|
|
|||||||
| Net cash provided by operating activities |
38,378 | 89,871 | 78,089 | |||||||||
| Cash flows from investing activities: |
||||||||||||
| Capital expenditures |
(64,742 | ) | (108,521 | ) | (108,721 | ) | ||||||
| Proceeds from disposals of property, plant and equipment |
3,628 | 1,956 | 1,272 | |||||||||
| Property insurance proceeds from the Guangzhou Fire |
1,988 | — | — | |||||||||
| Acquisition of DDi, net of cash acquired |
— | — | (253,464 | ) | ||||||||
| Acquisition of remaining interest in Huizhou, China facility |
— | — | (10,106 | ) | ||||||||
|
|
|
|
|
|
|
|||||||
| Net cash used in investing activities |
(59,126 | ) | (106,565 | ) | (371,019 | ) | ||||||
| Cash flows from financing activities: |
||||||||||||
| Proceeds from issuance of 2019 notes |
53,500 | — | — | |||||||||
| Financing and other fees |
(3,404 | ) | (187 | ) | (16,186 | ) | ||||||
| Proceeds from borrowings under credit facilities |
20,000 | 10,000 | 10,000 | |||||||||
| Repayments of borrowings under mortgages, capital leases and credit facilities |
(31,608 | ) | (11,636 | ) | (10,787 | ) | ||||||
| Proceeds from exercise of stock options |
76 | — | — | |||||||||
| Withholding taxes related to stock awards net share settlements |
(590 | ) | (666 | ) | — | |||||||
| Repayment of Senior Subordinated Convertible Notes due 2013 |
— | (895 | ) | — | ||||||||
| Proceeds from issuance of 7.875% Senior Secured Notes due 2019 |
— | — | 550,000 | |||||||||
| Repayment of 12.0% Senior Secured Notes |
— | — | (236,295 | ) | ||||||||
| Distributions to noncontrolling interest holder |
— | — | (267 | ) | ||||||||
|
|
|
|
|
|
|
|||||||
| Net cash provided by (used in) financing activities |
37,974 | (3,384 | ) | 296,465 | ||||||||
| Net change in cash and cash equivalents |
17,226 | (20,078 | ) | 3,535 | ||||||||
| Cash and cash equivalents, beginning of year |
54,738 | 74,816 | 71,281 | |||||||||
|
|
|
|
|
|
|
|||||||
| Cash and cash equivalents, end of year |
$ | 71,964 | $ | 54,738 | $ | 74,816 | ||||||
|
|
|
|
|
|
|
|||||||
| Supplemental cash flow information: |
||||||||||||
| Interest paid |
$ | 48,854 | $ | 44,598 | $ | 46,294 | ||||||
|
|
|
|
|
|
|
|||||||
| Income taxes paid, net |
$ | 12,278 | $ | 9,051 | $ | 14,827 | ||||||
|
|
|
|
|
|
|
|||||||
See accompanying notes to consolidated financial statements.
64
Table of Contents
VIASYSTEMS GROUP, INC. AND SUBSIDIARIES
NOTES TO CONSOLIDATED FINANCIAL STATEMENTS
(dollars in thousands, except per share data)
| 1. | Summary of Significant Accounting Policies |
Viasystems Group, Inc., a Delaware corporation (“Group”), was formed on August 28, 1996. Group is a holding company and its only significant asset is stock of its wholly owned subsidiary, Viasystems, Inc. On April 10, 1997, Group contributed to Viasystems, Inc. all of the capital of its then existing subsidiaries. Prior to the contribution of capital by Group, Viasystems, Inc. had no operations of its own. Group relies on distributions from Viasystems, Inc. for cash. Moreover, the Senior Secured 2010 Credit Facility (see Note 10) and the indentures governing Viasystems, Inc.’s 2019 Notes each contain restrictions on Viasystems, Inc.’s ability to pay dividends to Group. Group, together with Viasystems, Inc. and its subsidiaries, is herein referred to as “the Company.”
Nature of Business
The Company is a leading worldwide provider of complex multi-layer printed circuit boards (“PCBs”) and electro-mechanical solutions (“E-M Solutions”). The Company’s products are used in a wide range of applications including, for example, automotive engine controls, data networking equipment, telecommunications switching equipment, complex medical, technical and industrial instruments, and flight control systems.
Principles of Consolidation
The accompanying consolidated financial statements include the accounts of Viasystems Group, Inc. and its wholly-owned and majority-owned subsidiaries. All intercompany accounts and transactions have been eliminated in consolidation.
Use of Estimates
The preparation of financial statements in conformity with generally accepted accounting principles (“GAAP”) in the United States (“U.S.”) requires management to make estimates and assumptions that affect i) the reported amounts of assets and liabilities, ii) the disclosure of contingent assets and liabilities at the date of the financial statements and iii) the reported amounts of revenues and expenses during the reporting period.
Estimates and assumptions are used in accounting for the following significant matters, among others:
| • | allowances for doubtful accounts; |
| • | inventory valuation; |
| • | fair value of derivative instruments and related hedged items; |
| • | fair value of assets acquired and liabilities assumed in acquisitions; |
| • | useful lives of property, plant, equipment and intangible assets; |
| • | long-lived and intangible asset impairments; |
| • | restructuring charges; |
| • | warranty and product returns allowances; |
| • | deferred compensation agreements; |
| • | tax related items; |
| • | contingencies; and |
| • | fair value of awards granted under the Company’s stock-based compensation plans. |
Actual results may differ from previously estimated amounts, and such differences may be material to our consolidated financial statements. Estimates and assumptions are reviewed periodically, and the effects of revisions are reflected in the period in which the revision is made. The Company does not consider as material any revisions made to estimates or assumptions during the periods presented in the accompanying consolidated financial statements.
65
Table of Contents
Cash and Cash Equivalents and Restricted Cash
The Company considers short-term highly liquid investments purchased with an original maturity of three months or less to be cash equivalents.
Accounts Receivable and Concentration of Credit Risk
Accounts receivable balances represent customer trade receivables generated from the Company’s operations. To reduce the potential for credit risk, the Company evaluates the collectability of customer balances based on a combination of factors but does not generally require significant collateral. The Company regularly analyzes significant customer balances, and when it becomes evident a specific customer will be unable to meet its financial obligations to the Company for reasons including, but not limited to, bankruptcy filings or deterioration in the customer’s operating results or financial position, a specific allowance for doubtful accounts is recorded to reduce the related receivable to the amount that is believed reasonably collectible. The Company also records an allowance for doubtful accounts for all other customers based on a variety of factors, including the length of time the receivables are past due, historical experience and current economic conditions. If circumstances related to specific customers change, estimates of the recoverability of receivables could be further adjusted.
The provision for bad debts is included in selling, general and administrative expense. Account balances are charged off against the allowance when the Company believes it is probable the receivable will not be recovered.
Inventories
Inventories are stated at the lower of cost or market. Cost is determined using the first-in, first-out (FIFO) and average cost methods. Cost includes raw materials, labor and manufacturing overhead.
Property, Plant and Equipment
Property, plant and equipment are stated at cost. Repairs and maintenance that do not extend the useful life of an asset are charged to expense as incurred. The useful lives of leasehold improvements are the lesser of the remaining lease term or the useful life of the improvement. When assets are retired or otherwise disposed of, their costs and related accumulated depreciation are removed from the accounts, and any resulting gains or losses are included in the operations for the period. Depreciation is computed using the straight-line method over the estimated useful lives of the related assets as follows:
| Buildings |
20-50 years | |||
| Leasehold improvements |
3-15 years | |||
| Machinery, equipment, systems and other |
3-10 years |
Impairment of Long-Lived Assets
The Company reviews intangible assets with a finite life and other long-lived assets for impairment if facts and circumstances exist that indicate the asset’s useful life is shorter than previously estimated or the carrying amount may not be recoverable from future operations based on undiscounted expected future cash flows. Impairment losses are recognized in operating results for the amount by which the carrying value of the asset exceeds its fair value. In addition, the remaining useful life of an impaired asset group would be reassessed and revised, if necessary.
Goodwill
Goodwill is recorded when the consideration paid for an acquisition exceeds the fair value of identifiable net tangible and intangible assets acquired. Goodwill and other indefinite-lived intangible assets are not amortized but are reviewed for impairment annually or more frequently if a triggering event were to occur in an interim period.
66
Table of Contents
Intangible Assets
Intangible assets consist primarily of identifiable intangibles acquired. Amortization of identifiable intangible assets acquired is computed using systematic methods over the estimated useful lives of the related assets as follows:
| Life | Method | |||||
| Patents, trademarks and trade names |
2-5 years | Straight-line | ||||
| Customer lists |
12-20 years | Straight-line | ||||
| Manufacturer sales representative network |
12-20 years | Straight-line | ||||
| Developed technologies |
15 years | Double-declining balance | ||||
Impairment testing of these assets would occur if and when an indicator of impairment is identified.
Deferred Financing Costs
Deferred financing costs, consisting of fees and other expenses associated with debt financing, are amortized over the term of the related debt using the straight-line method, which approximates the effective interest method.
Product Warranties
Provisions for estimated expenses related to product warranties are generally made at the time products are sold. These estimates are established using historical information on the nature, frequency and average cost of warranty claims.
Amounts accrued for warranty reserves are included in accrued and other liabilities (see Note 9). The following table summarizes changes in the reserve for the years ended December 31, 2014 and 2013:
| December 31, | ||||||||
| 2014 | 2013 | |||||||
| Balance, beginning of year |
$ | 8,539 | $ | 9,211 | ||||
| Provision |
7,548 | 8,501 | ||||||
| Claims and adjustments |
(7,511 | ) | (9,173 | ) | ||||
|
|
|
|
|
|||||
| Balance, end of year |
$ | 8,576 | $ | 8,539 | ||||
|
|
|
|
|
|||||
Environmental Costs
Accruals for environmental matters are recorded in operating expenses when it is probable that a liability has been incurred and the amount of the liability can be reasonably estimated. Accrued liabilities do not include claims against third parties and are not discounted. Costs related to environmental remediation are charged to expense. Other environmental costs are also charged to expense unless they increase the value of the property and/or mitigate or prevent contamination from future operations, in which event they are capitalized.
Derivative Financial Instruments
From time to time, the Company enters into cash flow hedges in the form of foreign exchange forward contracts and cross-currency swaps to minimize the short-term impact of foreign currency fluctuations. However, there can be no assurance that these activities will eliminate or reduce foreign currency risk. To reduce the potential for credit risk associated with cash flow hedges, the Company monitors the credit ratings of the counter parties to its hedging transactions. The foreign exchange forward contracts and cross-currency swaps are designated as cash flow hedges and are accounted for at fair value. The effective portion of the change in each cash flow hedge’s gain or loss is reported as a component of other comprehensive (loss) income, net of taxes. The ineffective portion of the change in the cash flow hedge’s gain or loss is recorded in earnings at each measurement date. Gains and losses on derivative contracts are reclassified from accumulated other comprehensive (loss) income to current period earnings in the line item in which the hedged item is recorded in the same period the hedged foreign currency cash flow affects earnings (see Note 14).
67
Table of Contents
Foreign Currency Translation and Remeasurement
All the Company’s foreign subsidiaries use the U.S. dollar as their functional currency. Net (loss) income includes gains and losses arising from transactions denominated in currencies other than the U.S. dollar, the impact of remeasuring local currency denominated assets and liabilities of foreign subsidiaries to the U.S. dollar and the realized gains and losses resulting from the Company’s foreign currency hedging activities.
Revenue Recognition
Revenue is recognized when all of the following criteria are satisfied: persuasive evidence of an arrangement exists; risk of loss and title transfer to the customer; the price is fixed and determinable; and collectability is reasonably assured. Sales and related costs of goods sold are included in income when goods are shipped to the customer in accordance with the delivery terms, except in the case of vendor managed inventory arrangements, whereby sales and the related costs of goods sold are included in income when possession of goods is taken by the customer. Generally, there are no formal customer acceptance requirements or further obligations related to manufacturing services. If such requirements or obligations exist, then revenue is recognized at the time when such requirements are completed and the obligations are fulfilled. Reserves for product returns are recorded based on historical trend rates at the time of sale.
Shipping Costs
Costs incurred by the Company to ship finished goods to its customers are included in cost of goods sold on the consolidated statements of operations and comprehensive (loss) income.
Income Taxes
The Company accounts for certain items of income and expense in different periods for financial reporting and income tax purposes. Provisions for deferred income taxes are made in recognition of such temporary differences, where applicable. A valuation allowance is established against deferred tax assets unless the Company believes it is more likely than not that the benefit will be realized.
The Company provides for uncertain tax positions and the related interest and penalties based upon its assessment of whether it is more likely than not that the tax position will be sustained on examination by the taxing authorities, given the technical merits of the position. The tax benefits recognized in the financial statements from such a position are measured based on the largest benefit that has a greater than fifty percent likelihood of being realized upon ultimate resolution.
The Company recognizes accrued interest and penalties related to unrecognized tax benefits as a component of income tax expense.
Earnings or Loss Per Share
The Company computes basic (loss) earnings per share by dividing its net (loss) income attributable to common stockholders for the period by the weighted average number of common shares outstanding during the period. The computation of diluted (loss) earnings per share is based on the weighted average number of common shares outstanding during the period plus dilutive common equivalent shares (consisting primarily of employee stock options and unvested stock awards). The potentially dilutive impact of the Company’s share-based compensation awards is determined using the treasury stock method.
68
Table of Contents
The components used in the computation of our basic and diluted (loss) earnings per share attributable to common stockholders were as follows:
| Year Ended December 31, | ||||||||||||
| 2014 | 2013 | 2012 | ||||||||||
| Net loss attributable to common stockholders |
$ | (15,990 | ) | $ | (28,220 | ) | $ | (62,307 | ) | |||
|
|
|
|
|
|
|
|||||||
| Basic weighted average shares outstanding |
20,280,284 | 20,089,507 | 19,991,190 | |||||||||
| Dilutive effect of stock options |
— | — | — | |||||||||
| Dilutive effect of restrictive stock awards |
— | — | — | |||||||||
| Dilutive effect of performance share units |
— | — | — | |||||||||
|
|
|
|
|
|
|
|||||||
| Dilutive weighted average shares outstanding |
20,280,284 | 20,089,507 | 19,991,190 | |||||||||
|
|
|
|
|
|
|
|||||||
| Basic loss per share |
$ | (0.79 | ) | $ | (1.40 | ) | $ | (3.12 | ) | |||
|
|
|
|
|
|
|
|||||||
| Diluted loss per share |
$ | (0.79 | ) | $ | (1.40 | ) | $ | (3.12 | ) | |||
|
|
|
|
|
|
|
|||||||
For the year ended December 31, 2014, the calculation of diluted weighted average shares outstanding excludes i) the effect of options to purchase 1,770,720 shares of common stock, ii) unvested restricted stock awards of 623,302 because their inclusion would be antidilutive, and iii) the effect of performance share units representing a maximum of 1,384,555 shares of common stock because the related performance measures were not attainable during the period. For the year ended December 31, 2013, the calculation of diluted weighted average shares outstanding excludes i) the effect of options to purchase 1,869,124 shares of common stock, ii) unvested restricted stock awards of 576,042 because their inclusion would be antidilutive, and iii) the effect of performance share units representing a maximum of 971,518 shares of common stock because the related performance measures were not attainable during the period. For the year ended December 31, 2012, the calculation of diluted weighted average shares outstanding excludes i) the effect of options to purchase 2,029,010 shares of common stock, ii) unvested restricted stock awards of 629,435, iii) long-term debt convertible into 6,593 shares of common stock because their inclusion would be antidilutive and iv) the effect of performance share units representing a maximum of 278,686 shares of common stock because the related performance measures were not attainable during the period.
Employee Stock-Based Compensation
The Company maintains two stock option plans, the “2010 Equity Incentive Plan” and the “2003 Stock Option Plan,” and recognizes compensation expense for share-based awards, including stock options and restricted stock awards, ratably over the awards’ vesting periods based on the grant date fair values of the awards (see Note 15).
Noncontrolling Interest
The Company owns a majority interest in its subsidiary that operates a manufacturing facility in Huiyang, China, and a noncontrolling interest holder (the “Noncontrolling Interest Holder”) owns 5% of this subsidiary. During the first five months of 2012, the Company also owned a majority interest in its subsidiary that operated a manufacturing facility in Huizhou, China (the “Huizhou Facility”), and the Noncontrolling Interest Holder owned 15% of that subsidiary. In connection with the closure of the Huizhou Facility in 2012, the Company purchased the 15% noncontrolling interest which increased the Company’s ownership to 100%. Noncontrolling interest is reported as a component of equity, and net income attributable to the noncontrolling interest is reported as a reduction from net income to arrive at net income attributable to the Company’s common stockholders.
69
Table of Contents
Research and Development
Research, development and engineering expenditures for the creation and application of new products and processes were approximately $4,579, $4,304 and $3,615 for the years ended December 31, 2014, 2013 and 2012, respectively. Research and development is included in the selling, general and administrative line item on the consolidated statements of operations and comprehensive (loss) income.
Reclassifications
The accompanying consolidated financial statements for prior years contain certain reclassifications to conform to the presentation used in the current period.
Recently Adopted Accounting Pronouncements
As of January 1, 2014, the Company adopted a new accounting standard which provides guidance for the financial statement presentation of unrecognized tax benefits when a net operating loss carryforward exists. The new standard provides that a liability related to an unrecognized tax benefit be presented as a reduction of a deferred tax asset for a net operating loss carryforward if the settlement of such liability is required or expected in the event the uncertain tax position is disallowed. This standard did not have a material impact on the Company’s consolidated financial statements upon adoption.
Recently Issued Accounting Pronouncements
Revenue Recognition. In June 2014, the Financial Accounting Standards Board issued a new accounting standard that changes the criteria companies must use for the recognition of revenue and will affect the Company’s measurement, recognition and disclosures concerning revenue once the new standard is adopted. The Company will adopt the new standard as of January 1, 2017. As of the date of this Report, the Company is still evaluating the potential impact this standard will have on its consolidated financial statements upon adoption.
Going Concern. In August 2014, the FASB issued disclosure guidance that requires management to evaluate, at each annual and interim reporting period, whether substantial doubt exists about an entity’s ability to continue as a going concern and, if applicable, to provide related disclosures. As outlined by that guidance, substantial doubt about an entity’s ability to continue as a going concern exists when relevant conditions and events, considered in the aggregate, indicate that it is probable that an entity will be unable to meet its obligations as they become due within one year after the date that the financial statements are issued (or are available to be issued). The new guidance will be effective for annual reporting periods ending after December 15, 2016 and interim periods thereafter, with early adoption permitted.
Discontinued Operations. In April 2014, the FASB issued accounting guidance that raised the threshold for disposals to qualify as discontinued operations to disposals which represent a strategic shift that has (or will have) a major effect on an entity’s operations and financial results. Such a strategic shift may include the disposal of (1) a major geographical area of operations, (2) a major line of business, (3) a major equity method investment or (4) other major parts of an entity. Provided that the major strategic shift criterion is met, the new guidance does allow entities to have significant continuing involvement and continuing cash flows with the discontinued operation, unlike current U.S. GAAP. The new standard also requires additional disclosures for discontinued operations and new disclosures for individually material disposal transactions that do not meet the definition of a discontinued operation. The new guidance will apply prospectively to disposals that occur in interim and annual periods beginning on or after December 31, 2014.
70
Table of Contents
| 2. | Merger Agreement with TTM Technologies, Inc. |
On September 21, 2014, the Company, TTM Technologies, Inc., a Delaware corporation (“TTM”), and Vector Acquisition Corp., a Delaware corporation and a wholly owned subsidiary of TTM (“Merger Sub”), entered into an Agreement and Plan of Merger (the “Merger Agreement”) pursuant to which Merger Sub will, subject to the satisfaction or waiver of the conditions therein, merge with and into the Company, with the Company surviving the merger as a wholly owned subsidiary of TTM (the “Merger”). The Merger Agreement was adopted by the Company’s stockholders on December 16, 2014. Selling, general and administrative costs for the year ended December 31, 2014, include $6,060 of professional fees and other expenses related to the Merger.
Pursuant to the terms of the Merger Agreement and subject to the conditions therein, at the effective time of the Merger (the “Effective Time”), each share of the Company’s common stock issued and outstanding immediately prior to the Effective Time (other than shares (1) held in treasury of the Company, (2) owned by TTM or Merger Sub or (3) owned by stockholders who have perfected and not withdrawn a demand for appraisal rights under Delaware law) will be converted into the right to receive a combination of (a) 0.706 of validly issued, fully paid and nonassessable shares of TTM’s common stock (the “Stock Consideration”) and (b) $11.33 per share in cash (together with the Stock Consideration, the “Merger Consideration”). No fractional shares of TTM’s common stock will be issued in the Merger and the Company’s stockholders will receive cash in lieu of any fractional shares.
Pursuant to the terms of the Merger Agreement and subject to the conditions therein, at the Effective Time, the Company’s outstanding stock options will be cancelled and converted into the right to receive a combination of cash and stock with a combined value equal to the excess value, if any, of the Merger Consideration that would be delivered in respect of the number of shares of the Company’s common stock underlying such option over the exercise price for such option. The Company’s outstanding restricted stock awards will be converted into the Merger Consideration. The Company’s outstanding performance share units will vest based on the greater of 100% of the target payout and the payout that would have resulted based on the Company’s performance criteria, with each such vested performance share unit being exchanged for the Merger Consideration.
The completion of the Merger is subject to various closing conditions, including, among other things, i) the expiration or termination of the applicable waiting period under the Hart-Scott-Rodino Antitrust Improvements Act of 1976, as amended (“HSR”), ii) the absence of any legal restraints or prohibitions on the consummation of the Merger and iii) receipt of approval of the Merger by the Committee on Foreign Investment in the United States (“CFIUS”). The obligation of each party to consummate the Merger is also conditioned upon the other party’s representations and warranties being true and correct (subject to certain materiality exceptions), the other party having performed in all material respects its obligations under the Merger Agreement and the other party not having suffered a material adverse effect.
The Merger Agreement contains customary representations, warranties and covenants made by each of the Company and TTM, including, among other things, covenants and agreements to conduct their respective businesses in the ordinary course in all material respects during the period between the execution of the Merger Agreement and completion of the Merger and not to engage in certain kinds of transactions during this period.
The Merger Agreement contains certain termination rights for each of the Company and TTM, including the right of each party to terminate the Merger Agreement if the Merger has not been consummated by June 21, 2015, subject to a three-month extension to September 21, 2015 at the election of either party if, on such date (such date as the same may be extended, the “Outside Date”), the Merger has not yet received antitrust approval, CFIUS approval or certain specified legal restraints are in place but all other closing conditions have been satisfied.
The Merger Agreement also provides that the Company will be entitled to receive from TTM a termination fee of $40.0 million in the event that the Merger Agreement is terminated due to a failure to obtain regulatory approval.
The Company cannot give any assurance that the Merger and the other related transactions will be completed or that, if completed, they will be exactly on the terms as set forth in the Merger Agreement and the other related transaction agreements.
71
Table of Contents
| 3. | The DDi Acquisition |
On May 31, 2012, the Company acquired DDi Corp. (“DDi”) in an all cash purchase transaction pursuant to which DDi became a wholly owned subsidiary of the Company (the “DDi Acquisition”).
Pro Forma Information (unaudited)
The following unaudited pro forma information presents the combined results of operations of Viasystems and DDi for the year ended December 31, 2012, as if the DDi Acquisition had been completed on January 1, 2012, with adjustments to give effect to pro forma events that are directly attributable to the DDi Acquisition. The unaudited pro forma results do not reflect any operating efficiencies or potential cost savings which may result from the consolidation of the operations of the companies. Accordingly, these unaudited pro forma results are presented for illustrative purposes and are not intended to represent or be indicative of the actual results of operations of the combined company that would have been achieved had the acquisition occurred at the beginning of the period presented, nor are they intended to represent or be indicative of future results of operations.
The following table summarizes the unaudited pro forma results of operations:
| Year Ended December 31, 2012 |
||||
| Net sales |
$ | 1,272,908 | ||
|
|
|
|||
| Net (loss) income |
$ | (22,909 | ) | |
|
|
|
|||
The pro forma net income was adjusted to give effect to pro forma events which are directly attributable to the DDi Acquisition. Adjustments to the pro forma net income for the year ended December 31, 2012 included: i) the exclusion of $17,789 of acquisition-related costs, ii) the inclusion of $454 of net expense related to fair value adjustments to acquisition-date net assets acquired and iii) the exclusion of $21,288 of net expense related to merger financing transactions, including debt extinguishment costs, interest expense and amortization of deferred financing costs.
| 4. | Accounts Receivable and Concentration of Credit Risk |
The allowance for doubtful accounts is included in accounts receivable, net in the accompanying consolidated balance sheets.
The activity in the allowance for doubtful accounts is summarized as follows:
| 2014 | 2013 | 2012 | ||||||||||
| Balance, beginning of year |
$ | 3,647 | $ | 2,680 | $ | 2,770 | ||||||
| Provision |
902 | 1,660 | 2,066 | |||||||||
| Write-offs, credits and adjustments |
(1,971 | ) | (693 | ) | (2,156 | ) | ||||||
|
|
|
|
|
|
|
|||||||
| Balance, end of year |
$ | 2,578 | $ | 3,647 | $ | 2,680 | ||||||
|
|
|
|
|
|
|
|||||||
For the years ended December 31, 2014, 2013 and 2012, sales to the Company’s ten largest customers accounted for approximately 40.6%, 40.6% and 49.0% of the Company’s net sales, respectively. During the years ended December 31, 2014, 2013 and 2012, one customer, Robert Bosch GmbH, individually accounted for more than 10% of our net sales, with sales representing 13.6%, 12.6% and 13.9% of our net sales in those years, respectively. Sales to Robert Bosch GmbH occurred in the Printed Circuit Boards segment.
72
Table of Contents
| 5. | Inventories |
The composition of inventories at December 31, is as follows:
| 2014 | 2013 | |||||||
| Raw materials |
$ | 44,582 | $ | 42,538 | ||||
| Work in process |
41,517 | 35,504 | ||||||
| Finished goods |
52,096 | 44,140 | ||||||
|
|
|
|
|
|||||
| Total |
$ | 138,195 | $ | 122,182 | ||||
|
|
|
|
|
|||||
| 6. | Property, Plant and Equipment |
The composition of property, plant and equipment at December 31, is as follows:
| 2014 | 2013 | |||||||
| Land and buildings |
$ | 162,230 | $ | 157,245 | ||||
| Machinery, equipment and systems |
632,527 | 638,348 | ||||||
| Leasehold improvements |
98,721 | 91,662 | ||||||
| Construction in progress |
9,496 | 26,874 | ||||||
|
|
|
|
|
|||||
| 902,974 | 914,129 | |||||||
| Less: Accumulated depreciation |
(487,367 | ) | (467,641 | ) | ||||
|
|
|
|
|
|||||
| Total |
$ | 415,607 | $ | 446,488 | ||||
|
|
|
|
|
|||||
| 7. | Goodwill and Other Intangible Assets |
As of December 31, 2014, the Company had recorded goodwill of $151,283 from prior acquisitions which related entirely to its Printed Circuit Boards segment. The Company conducts an assessment of the carrying value of goodwill annually, as of the first day of its fourth fiscal quarter, or more frequently if circumstances arise which would indicate the fair value of a reporting unit with goodwill is below its carrying amount. No adjustments were recorded to goodwill as a result of these assessments.
The components of intangible assets subject to amortization were as follows:
| December 31, 2014 | December 31, 2013 | |||||||||||||||||||||||
| Gross Carrying Amount |
Accumulated Amortization |
Net Book Value |
Gross Carrying Amount |
Accumulated Amortization |
Net Book Value |
|||||||||||||||||||
| Developed technologies |
$ | 20,371 | $ | (20,371 | ) | $ | — | $ | 20,371 | $ | (19,830 | ) | $ | 541 | ||||||||||
| Customer list |
88,015 | (12,503 | ) | 75,512 | 88,015 | (7,967 | ) | 80,048 | ||||||||||||||||
| Manufacturer sales representative network |
17,115 | (2,682 | ) | 14,433 | 17,115 | (1,769 | ) | 15,346 | ||||||||||||||||
| Patents, trademarks and trade name |
2,757 | (2,544 | ) | 213 | 2,615 | (2,367 | ) | 248 | ||||||||||||||||
|
|
|
|
|
|
|
|
|
|
|
|
|
|||||||||||||
| Total |
$ | 128,258 | $ | (38,100 | ) | $ | 90,158 | $ | 128,116 | $ | (31,933 | ) | $ | 96,183 | ||||||||||
|
|
|
|
|
|
|
|
|
|
|
|
|
|||||||||||||
The expected future annual amortization expense of definite-lived intangible assets for the next five fiscal years is as follows:
| Year Ended December 31, |
||||
| 2015 |
$ | 5,511 | ||
| 2016 |
5,504 | |||
| 2017 |
5,499 | |||
| 2018 |
5,488 | |||
| 2019 |
5,466 | |||
| Thereafter |
62,690 | |||
|
|
|
|||
| Total |
$ | 90,158 | ||
|
|
|
|||
73
Table of Contents
| 8. | Restructuring and Impairment |
As of December 31, 2014, the reserve for restructuring charges included $220 and $1,610 related to i) the closure of its Huizhou Facility and ii) plant shutdowns and downsizings which occurred in 2001 through 2005 as a result of the economic downturn that began in 2000 (the “2001 Restructuring”), respectively.
The following tables summarize changes in the reserve for the years ended December 31, 2014, 2013 and 2012:
| Year Ended December 31, 2014 | ||||||||||||||||||||||||||||
| Reserve 12/31/13 |
Charges | Reversals | Net Charges |
Cash Payments |
Adjustments | Reserve 12/31/14 |
||||||||||||||||||||||
| Restructuring activities: |
||||||||||||||||||||||||||||
| Personnel and severance |
$ | 1,587 | $ | 642 | $ | (131 | ) | $ | 511 | $ | (1,781 | ) | $ | — | $ | 317 | ||||||||||||
| Lease and other contractual commitments |
1,240 | 688 | — | 688 | (462 | ) | 47 | (a) | 1,513 | |||||||||||||||||||
| Asset impairments |
— | 6,152 | — | 6,152 | — | (6,152 | ) | — | ||||||||||||||||||||
|
|
|
|
|
|
|
|
|
|
|
|
|
|
|
|||||||||||||||
| $ | 2,827 | $ | 7,482 | $ | (131 | ) | $ | 7,351 | $ | (2,243 | ) | $ | (6,105 | ) | $ | 1,830 | ||||||||||||
|
|
|
|
|
|
|
|
|
|
|
|
|
|
|
|||||||||||||||
| Year Ended December 31, 2013 | ||||||||||||||||||||||||||||
| Reserve 12/31/12 |
Charges | Reversals | Net Charges |
Cash Payments |
Adjustments | Reserve 12/31/13 |
||||||||||||||||||||||
| Restructuring activities: |
||||||||||||||||||||||||||||
| Personnel and severance |
$ | 3,758 | $ | 276 | $ | (436 | ) | $ | (160 | ) | $ | (2,011 | ) | $ | — | $ | 1,587 | |||||||||||
| Lease and other contractual commitments |
1,610 | 1,250 | (17 | ) | 1,233 | (1,650 | ) | 47 | (a) | 1,240 | ||||||||||||||||||
|
|
|
|
|
|
|
|
|
|
|
|
|
|
|
|||||||||||||||
| $ | 5,368 | $ | 1,526 | $ | (453 | ) | $ | 1,073 | $ | (3,661 | ) | $ | 47 | $ | 2,827 | |||||||||||||
|
|
|
|
|
|
|
|
|
|
|
|
|
|
|
|||||||||||||||
| Year Ended December 31, 2012 | ||||||||||||||||||||||||||||
| Reserve 12/31/11 |
Charges | Reversals | Net Charges |
Cash Payments |
Adjustments | Reserve 12/31/12 |
||||||||||||||||||||||
| Restructuring activities: |
||||||||||||||||||||||||||||
| Personnel and severance |
$ | 190 | $ | 16,151 | $ | — | $ | 16,151 | $ | (12,583 | ) | $ | — | $ | 3,758 | |||||||||||||
| Lease and other contractual commitments |
952 | 1,622 | — | 1,622 | (1,050 | ) | 86 | (a) | 1,610 | |||||||||||||||||||
| Asset impairments |
— | 1,684 | — | 1,684 | — | (1,684 | ) | — | ||||||||||||||||||||
|
|
|
|
|
|
|
|
|
|
|
|
|
|
|
|||||||||||||||
| $ | 1,142 | $ | 19,457 | $ | — | $ | 19,457 | $ | (13,633 | ) | $ | (1,598 | ) | $ | 5,368 | |||||||||||||
|
|
|
|
|
|
|
|
|
|
|
|
|
|
|
|||||||||||||||
| (a) | Represents accretion of interest on discounted restructuring liabilities. |
The restructuring and impairment charges were determined based on formal plans approved by the Company’s management using the best information available at the time. The amounts the Company ultimately incurs may change as the balance of the plans are executed. Expected cash payout of the accrued expenses is as follows:
| Year Ended December 31, |
||||
| 2015 |
$ | 324 | ||
| 2016 |
109 | |||
| 2017 |
114 | |||
| 2018 |
116 | |||
| 2019 |
121 | |||
| Thereafter |
1,920 | |||
|
|
|
|||
| Total |
$ | 2,704 | ||
| Less: Amounts representing interest |
(874 | ) | ||
|
|
|
|||
| Restructuring liability |
$ | 1,830 | ||
|
|
|
|||
2014 Restructuring and Impairment Charges
During the year ended December 31, 2014, the Company incurred net restructuring charges of $7,351, including $6,794 in its Assembly segment, $210 in its Printed Circuit Boards segment and $347 in its “Other” segment (see Note 16). The Company incurred $642 of severance expense and $6,152 of asset impairment charges in its Assembly segment as a result of a reduction in workforce at its Juarez, Mexico facility and a related impairment analysis of the property, plant and equipment at that facility. The Company incurred $341 of restructuring charges in its Printed Circuit Boards segment related to lease and moving costs for the relocation of its Anaheim, California facility, net of a reversal of $131 of accrued severance charges related to cost savings activities announced in 2012. Through December 31, 2014, the Company incurred $1,109 of restructuring charges related to the relocation of the Anaheim facility, and the Company does not expect it will incur significant additional related charges. Charges incurred in the “Other” segment related to an increase in estimated long-term obligations incurred in connection with the 2001 Restructuring.
74
Table of Contents
Juarez Restructuring
During the third quarter of 2014, the Company rationalized the scope of operations and reduced the size of the workforce at its Juarez, Mexico metal fabrication and assembly facility by approximately 22%. In connection with the reduction of the workforce at the Juarez facility, the Company reviewed its property, plant and equipment at the facility for impairment and recorded a $6,152 impairment charge in its Assembly segment during the year ended December 31, 2014. The fair value of the property, plant and equipment was measured using a market approach utilizing Level 3 inputs (see Note 14). The Company does not expect it will incur significant additional related charges.
2013 Restructuring and Impairment Charges
During the year ended December 31, 2013, the Company recognized net restructuring charges of $1,073, including $818 in its Printed Circuit Boards segment, $183 in its Assembly segment and $72 in its “Other” segment (see Note 16). Charges incurred in the Printed Circuit Boards segment included i) $741 related to the relocation of the Company’s Anaheim, California facility, ii) $334 related to the closure of the Huizhou Facility, iii) $102 related to the 2012 fire at the Company’s Guangzhou, China PCB factory and iv) $77 related to staffing reductions at certain North America manufacturing facilities, partially offset by the reversal of $436 of accrued severance costs associated with the closure of the Huizhou Facility. Charges incurred in the Assembly segment related to staffing reductions during the fourth quarter of 2013, and charges incurred in the “Other” segment related to an increase in estimated long-term obligations incurred in connection with the 2001 Restructuring.
Anaheim Move
During the second half of 2013, the Company relocated a PCB manufacturing facility it was leasing in Anaheim, California to a facility it had purchased and renovated in the same city (the “Anaheim Move”). The charges related to the Anaheim Move during 2013 related to lease and moving costs.
Huizhou PCB Facility Closure
The Huizhou Facility ceased operations during the third quarter of 2012, and was decommissioned and returned to its landlord in January 2013. During the year ended December 31, 2013, the Company incurred $334 of moving costs related to relocating the operations of the Huizhou Facility to its other PCB facilities in China, and reversed $436 of accrued severance costs as a result of favorable resolutions of related contingencies.
2012 Restructuring and Impairment Charges
During the year ended December 31, 2012, the Company recognized $19,457 of restructuring and impairment charges, including $18,405 in its Printed Circuit Boards segment, $801 in its Assembly segment and $251 in “Other.” Restructuring and impairment charges incurred in the Printed Circuit Boards segment included i) $10,662 related to the closure of its Huizhou Facility, ii) $826 associated with integrating the newly acquired DDi business, iii) $5,923 related to general cost savings and iv) $994 of impairment charges and other costs related to fire damage at its Guangzhou, China PCB facility. Restructuring and impairment charges incurred in the Assembly segment related to general cost savings which primarily included the closure of the Company’s Qingdao facility. Restructuring charges incurred in “Other” related to a revaluation of certain employee benefit obligations related to the 2001 Restructuring.
75
Table of Contents
Guangzhou Fire
On September 5, 2012, the Company experienced a fire on the campus of its PCB manufacturing facility in Guangzhou, China which resulted in the loss of inventory with a carrying value of $4,692 and property, plant and equipment with a net book value of $1,988. The Company maintains insurance coverage for property losses and business interruptions caused by fire which is subject to certain deductibles. During the year ended December 31, 2012, the Company recorded an impairment charge of $937 for the amount of the inventory loss subject to an insurance deductible. In 2013, the Company received partial reimbursements of $1,631 million from its insurance carrier related to its property damage claim. During 2014, the Company settled all outstanding claims related to Guangzhou Fire for an additional $31,346. The total claim settlement related to the Guangzhou Fire was $32,977 and included $6,518 related to the Company’s property damage claim and $26,459 related to the Company’s business interruption claim, which was recorded as a gain in operating income.
General Cost Savings Activities
During 2012, the Company initiated staffing reductions at certain of its manufacturing facilities in China in order to better align overhead costs and operating expenses with market demand for its products and recorded related restructuring charges of $5,923 and $142 in its Printed Circuit Boards and Assembly segments, respectively. The Company does not expect to incur significant additional costs related to the activities announced during 2012.
| 9. | Accrued and Other Liabilities |
The composition of accrued and other liabilities at December 31, is as follows:
| 2014 | 2013 | |||||||
| Accrued payroll and related costs |
$ | 49,371 | $ | 36,547 | ||||
| Accrued warranty |
8,576 | 8,539 | ||||||
| Accrued interest |
7,914 | 7,302 | ||||||
| Accrued other |
28,000 | 32,621 | ||||||
|
|
|
|
|
|||||
| Total |
$ | 93,861 | $ | 85,009 | ||||
|
|
|
|
|
|||||
| 10. | Long-Term Debt |
The composition of long-term debt at December 31, is as follows:
| 2014 | 2013 | |||||||
| Senior Secured Notes due 2019 |
$ | 603,008 | $ | 550,000 | ||||
| Senior Secured 2010 Credit Facility |
— | — | ||||||
| North America Mortgage loans |
10,435 | 12,259 | ||||||
| Zhongshan 2010 Credit Facility |
— | 10,000 | ||||||
| Capital leases |
565 | 636 | ||||||
|
|
|
|
|
|||||
| 614,008 | 572,895 | |||||||
| Less: Current maturities |
(1,093 | ) | (11,387 | ) | ||||
|
|
|
|
|
|||||
| $ | 612,915 | $ | 561,508 | |||||
|
|
|
|
|
|||||
As of December 31, 2014, the Company had no borrowings under the Company’s various credit facilities, the Company had issued letters of credit totaling $1,875, and approximately $107,244 of the credit facilities was unused and available.
The schedule of principal payments for long-term debt at December 31, 2014, is as follows:
| Year Ended December 31, |
||||
| 2015 |
$ | 1,093 | ||
| 2016 |
762 | |||
| 2017 |
794 | |||
| 2018 |
826 | |||
| 2019 |
604,060 | |||
| Thereafter |
3,465 | |||
|
|
|
|||
| Total |
$ | 611,000 | ||
|
|
|
|||
76
Table of Contents
Senior Secured Notes due 2019
On April 15, 2014, the Company’s subsidiary, Viasystems, Inc., completed an offering of $50,000 aggregate principal amount of 7.875% Senior Secured Notes due 2019 (the “New Notes”). The New Notes were issued at a premium of 7.000%, or $3,500, which is being amortized as a reduction of interest expense over the term of the New Notes. As of December 31, 2014, the unamortized premium was $3,008. The Company incurred $3,404 of financing fees related to the New Notes that have been capitalized and are being amortized over the term of the New Notes. The net proceeds of the New Notes are being used for general corporate purposes and to pay fees and expenses related to the offering of the New Notes.
Previously, the Company had issued $550,000 aggregate principal amount of 7.875% Senior Secured Notes due 2019 (the “Existing Notes” and, together with the New Notes, the “2019 Notes”) pursuant to an indenture dated as of April 30, 2012. The New Notes constitute an additional issuance of, and are fungible with, the Existing Notes and form a single class of debt securities with the Existing Notes for all purposes and have the same terms as the Existing Notes, except for the issue price and issue date. The Company incurred $16,186 of deferred financing fees related to the Existing Notes that have been capitalized and are being amortized over the life of the 2019 Notes. The net proceeds of the 2019 Notes were used to fund the redemption of the 2015 Notes and the DDi Acquisition.
Interest on the 2019 Notes is due semiannually on May 1 and November 1 of each year, beginning on November 1, 2012. At any time prior to May 1, 2015, the Company may use the cash proceeds from one or more equity offerings to redeem up to $192,500 of the aggregate principal amount of the 2019 Notes at a redemption price of 107.875% plus accrued and unpaid interest. In addition, at any time from March 1, 2013 to May 1, 2015, but not more than once in any twelve-month period, the Company may redeem up to $55,000 of the aggregate principal amount of the notes at a redemption price of 103% plus accrued and unpaid interest. Furthermore, at any time prior to May 1, 2015, the Company may redeem all or part of the notes, at a redemption price of 100% plus a “make-whole” premium equal to the greater of a) 1% of the principal amount or b) the excess of i) the present value at the redemption rate of 105.906% of the principal amount redeemed calculated using a discount rate equal to the treasury rate (as defined) plus 50 basis points, over ii) the principal amount of the notes. On or after May 1, 2015, the Company may redeem all or a portion of the notes during the twelve month periods ended April 30, 2016, 2017 and 2018 at redemption prices of 105.906%, 103.938% and 101.969%, respectively, plus accrued and unpaid interest. After May 1, 2018, the Company may redeem the 2019 Notes at the redemption price of 100% plus accrued and unpaid interest. In the event of a Change in Control (as defined), the Company is required to make an offer to purchase the 2019 Notes at a redemption price of 101%, plus accrued and unpaid interest.
The 2019 Notes are guaranteed, jointly and severally, by all of Viasystems, Inc.’s current and future material domestic subsidiaries (the “Subsidiary Guarantors”) and by Viasystems Group, Inc. through a parent guarantee. The 2019 Notes are collateralized by all of the equity interests of each of the Subsidiary Guarantors, and by liens on substantially all of Viasystems, Inc.’s and the Subsidiary Guarantors’ assets.
The indenture governing the 2019 Notes contains restrictive covenants which, among other things, limit the ability of Viasystems, Inc. and the Subsidiary Guarantors to: a) incur additional indebtedness or issue disqualified stock or preferred stock; b) create liens; c) pay dividends, make investments or make other restricted payments; d) sell assets; e) consolidate, merge, sell or otherwise dispose of all or substantially all of the assets of Viasystems, Inc. and its subsidiaries; and f) enter into certain transactions with affiliates.
Senior Secured 2010 Credit Facility
Effective as of December 31, 2013, the Company amended its senior secured revolving credit agreement (the “Senior Secured 2010 Credit Facility”) with Wells Fargo Capital Finance, LLC primarily for the purpose of extending the maturity date, increasing the maximum potential credit limit, and reducing the applicable margins for loans. The Senior Secured 2010 Credit Facility, as amended, provides a secured revolving credit facility in an aggregate principal amount of up to $75,000 which, upon mutual agreement, may be increased to a maximum of $100,000. The Facility matures on December 29, 2018. The annual interest rates applicable to loans under the Senior Secured 2010 Credit Facility are, at the Company’s option, either the Prime Rate or Eurodollar Rate (each as defined in the Senior Secured 2010 Credit Facility) plus, in each case, an applicable margin. The applicable margin is tied to the Company’s Monthly Average Excess Availability (as defined in the Senior Secured 2010 Credit Facility) and ranges from 0.25% to 0.75% for Prime Rate loans and 1.75% to 2.25% for Eurodollar Rate loans. In addition, the Company is required to pay an unused line fee and other fees as defined in the Senior Secured 2010 Credit Facility.
77
Table of Contents
The Senior Secured 2010 Credit Facility is guaranteed by and secured by substantially all of the assets of the Company’s current and future material domestic subsidiaries, subject to certain exceptions as set forth in the Senior Secured 2010 Credit Facility. The Senior Secured 2010 Credit Facility contains negative covenants restricting and limiting the Company’s ability to, among other things:
| • | incur debt, incur contingent obligations and issue certain types of preferred stock; |
| • | create liens; |
| • | pay dividends, distributions or make other specified restricted payments; |
| • | make certain investments and acquisitions; |
| • | enter into certain transactions with affiliates; and |
| • | merge or consolidate with any other entity or sell, assign, transfer, lease, convey or otherwise dispose of assets. |
Under the Senior Secured 2010 Credit Facility, if the Excess Availability (as defined in the Senior Secured 2010 Credit Facility) is less than $9,375, the Company must maintain, on a monthly basis, a minimum fixed charge coverage ratio of 1.0 to 1.0.
The Company incurred $2,529 of deferred financing fees related to the Senior Secured 2010 Credit Facility, including the 2013 amendment, which have been capitalized and are being amortized over the life of the facility. As of December 31, 2014, the Senior Secured 2010 Credit Facility supported letters of credit totaling $1,875, and approximately $66,386 was unused and available based on eligible collateral.
Zhongshan 2010 Credit Facility
The Company’s unsecured revolving credit facility between its Kalex Multi-layer Circuit Board (Zhongshan) Limited (“KMLCB”) subsidiary and China Construction Bank, Zhongshan Branch (the “Zhongshan 2010 Credit Facility”), provides for borrowing denominated in Renminbi (“RMB”) and foreign currency including the U.S. dollar. Borrowings are guaranteed by KMLCB’s sole Hong Kong parent company, Kalex Circuit Board (China) Limited. This revolving credit facility is renewable annually upon mutual agreement. Loans under the credit facility bear interest at the rate of i) LIBOR plus a margin negotiated prior to each U.S. dollar denominated loan or ii) the interest rate quoted by the Peoples Bank of China for Chinese RMB denominated loans. The Zhongshan 2010 Credit Facility has certain restrictions and other covenants that are customary for similar credit arrangements; however, there are no financial covenants contained in this facility. As of December 31, 2014, the Zhongshan 2010 Credit Facility was undrawn, and approximately $40,858 of the facility was unused and available.
North America Mortgage Loans
Toronto Mortgages
The Company’s mortgage loans with Business Development Bank of Canada (“BDC”) consists of two loan agreements, one denominated in U.S. dollars and the second denominated in Canadian dollars, which are secured by the land, building and certain equipment at the Company’s manufacturing facility in Toronto, Canada. The loan agreements contain a covenant requiring maintenance of an available funds coverage ratio of 1.5 to 1.0. As of December 31, 2014, the balance of the U.S. dollar loan was $358. The loan bears interest at a variable rate equal to the applicable BDC floating base rate less 0.4% (3.25% as of December 31, 2014), requires monthly principal and interest payments of approximately $37, and will mature in October 2015. As of December 31, 2014, the U.S. dollar equivalent balance of the Canadian dollar loan was $3,139. The loan bears interest at a variable rate equal to the applicable BDC floating base rate less 0.75% (4.25% as of December 31, 2014), requires monthly principal and interest payments of approximately $35, and will mature in September 2028.
78
Table of Contents
Anaheim Mortgage
The Company’s mortgage loan with Wells Fargo Bank is secured by the land and building at the Company’s manufacturing facility in Anaheim, California. The loan agreement contains a covenant requiring maintenance of a minimum fixed charge coverage ratio of 1.25 to 1.0. As of December 31, 2014, the balance of the loan was $4,858. The loan bears interest at a fixed rate of 4.326%, requires monthly principal and interest payments of approximately $43, and will mature in March 2019, when a balloon principal payment of $3,446 will be due.
Cleveland Mortgage
The Company’s mortgage loan with Zions Bank is secured by the land and building of the Company’s PCB manufacturing facility in the Cuyahoga Falls suburb of Cleveland, Ohio. As of December 31, 2014, the balance of the loan was $1,347. The loan bears interest at a variable rate equal to the Federal Home Loan Bank of Seattle prime rate plus 2% (3.25% as of December 31, 2014), requires monthly principal and interest payments of approximately $8, and will mature in November 2032.
Denver Mortgage
The Company’s mortgage loan with GE Real Estate is secured by the land and building at the Company’s manufacturing facility in Littleton, Colorado. As of December 31, 2014, the balance of the loan was $733. The loan bears interest at a fixed rate of 7.55%, requires monthly principal and interest payments of approximately $11, and will mature in July 2032.
North Jackson Mortgage
During 2014, the Company completed the repayment of the mortgage loan on its North Jackson, Ohio PCB facility.
| 11. | Commitments |
The Company leases certain buildings, transportation and other equipment under capital and operating leases. As of December 31, 2014 and 2013, there was equipment held under capital leases with a cost basis of $12,007 included in property, plant and equipment. The Company has recorded accumulated depreciation related to this equipment of $9,606 and $8,405 as of December 31, 2014 and 2013, respectively. Total rental expense under operating leases was $8,143, $10,320 and $7,571 for the years ended December 31, 2014, 2013 and 2012, respectively.
Future minimum lease payments under capital leases and operating leases that have initial or remaining non-cancelable lease terms in excess of one year at December 31, 2014, are as follows:
| Year Ended December 31, |
Capital | Operating | ||||||
| 2015 |
$ | 131 | $ | 7,433 | ||||
| 2016 |
131 | 5,720 | ||||||
| 2017 |
131 | 4,438 | ||||||
| 2018 |
131 | 2,260 | ||||||
| 2019 |
131 | 2,274 | ||||||
| Thereafter |
131 | 7,071 | ||||||
|
|
|
|
|
|||||
| Total |
786 | $ | 29,196 | |||||
|
|
|
|||||||
| Less: Amounts representing interest |
(221 | ) | ||||||
|
|
|
|||||||
| Capital lease obligations |
$ | 565 | ||||||
|
|
|
|||||||
| 12. | Contingencies |
The Company is a party to contracts with third party consultants, independent contractors and other service providers in which the Company has agreed to indemnify such parties against certain liabilities in connection with their performance. Based on historical experience and the likelihood that such parties will ever make a claim against the Company, in the opinion of our management, the ultimate liabilities resulting from such indemnification obligations will not have a material adverse effect on its financial condition and results of operations and cash flows.
The Company is a party to contracts and agreements with other third parties in which the Company has agreed to indemnify such parties against certain liabilities in connection with claims by unrelated parties. At December 31, 2014 and 2013, other non-current liabilities include $1,500 and $1,927, respectively, of accruals for potential claims in connection with such indemnities.
79
Table of Contents
The Company’s certificate of incorporation provides that none of the Directors and officers of the Company bear the risk of personal liability for monetary damages for breach of fiduciary duty as a Director or officer except in cases where the action involves a breach of the duty of loyalty, acts in bad faith or intentional misconduct, the unlawful paying of dividends or repurchasing of capital stock, or transactions from which the Director or officer derived improper personal benefits.
The Company is subject to various lawsuits and claims with respect to such matters as product liability, product development and other actions arising in the normal course of business. In the opinion of our management, the ultimate liabilities resulting from such lawsuits and claims have been adequately provided for and will not have a material adverse effect on the Company’s financial condition and results of operations and cash flows.
| 13. | Income Taxes |
The Company’s income tax provision for the years ended December 31, 2014, 2013 and 2012, consists of the following:
| 2014 | 2013 | 2012 | ||||||||||
| Current: |
||||||||||||
| Federal |
$ | — | $ | — | $ | — | ||||||
| State |
(98 | ) | (196 | ) | (408 | ) | ||||||
| Foreign |
18,719 | 12,180 | 12,491 | |||||||||
|
|
|
|
|
|
|
|||||||
| 18,621 | 11,984 | 12,083 | ||||||||||
| Deferred: |
||||||||||||
| Federal |
— | — | 3,407 | |||||||||
| State |
— | — | 292 | |||||||||
| Foreign |
(1,585 | ) | (889 | ) | (2,989 | ) | ||||||
|
|
|
|
|
|
|
|||||||
| (1,585 | ) | (889 | ) | 710 | ||||||||
|
|
|
|
|
|
|
|||||||
| Total |
$ | 17,036 | $ | 11,095 | $ | 12,793 | ||||||
|
|
|
|
|
|
|
|||||||
A reconciliation between the income tax provision at the federal statutory income tax rate and at the effective tax rate, for the years ended December 31, 2014, 2013 and 2012, is summarized below:
| 2014 | 2013 | 2012 | ||||||||||
| U.S. Federal Statutory Rate |
$ | 651 | $ | (5,780 | ) | $ | (17,299 | ) | ||||
| State taxes, net of federal benefit |
105 | 1 | (106 | ) | ||||||||
| Permanent items |
8,422 | 3,709 | 3,726 | |||||||||
| Foreign tax (under) U.S. Statutory rate |
(6,190 | ) | (4,574 | ) | (1,993 | ) | ||||||
| Current year valuation allowance for deferred tax assets |
10,118 | 16,117 | 26,416 | |||||||||
| Uncertain tax positions |
4,054 | 2,099 | (87 | ) | ||||||||
| Foreign tax rate changes and withholdings |
502 | 611 | 440 | |||||||||
| Other |
(626 | ) | (1,088 | ) | 1,696 | |||||||
|
|
|
|
|
|
|
|||||||
| $ | 17,036 | $ | 11,095 | $ | 12,793 | |||||||
|
|
|
|
|
|
|
|||||||
80
Table of Contents
The tax effects of significant temporary differences representing deferred tax assets and liabilities at December 31, 2014 and 2013, are as follows:
| 2014 | 2013 | |||||||
| Deferred tax assets: |
||||||||
| Net operating loss carryforwards |
$ | 372,038 | $ | 378,143 | ||||
| Capital loss carryforwards |
95,282 | 103,583 | ||||||
| Federal and State credit carryforwards |
23,295 | 25,633 | ||||||
| Accrued liabilities not yet deductible |
15,988 | 9,989 | ||||||
| Equity compensation |
13,247 | 11,824 | ||||||
| Property, plant and equipment |
7,775 | — | ||||||
| Other |
713 | 1,119 | ||||||
|
|
|
|
|
|||||
| 528,338 | 530,291 | |||||||
| Valuation allowance |
(479,743 | ) | (481,019 | ) | ||||
|
|
|
|
|
|||||
| 48,595 | 49,272 | |||||||
|
|
|
|
|
|||||
| Deferred tax liabilities: |
||||||||
| Property, plant and equipment |
— | (1,530 | ) | |||||
| Inventory |
(6,134 | ) | (4,348 | ) | ||||
| Intangibles |
(33,417 | ) | (35,641 | ) | ||||
| Other |
— | (515 | ) | |||||
|
|
|
|
|
|||||
| (39,551 | ) | (42,034 | ) | |||||
|
|
|
|
|
|||||
| Net deferred tax assets |
$ | 9,044 | $ | 7,238 | ||||
|
|
|
|
|
|||||
The domestic and foreign income (loss) before income tax provision are as follows:
| Year Ended December 31, | ||||||||||||
| 2014 | 2013 | 2012 | ||||||||||
| Domestic |
$ | (66,893 | ) | $ | (69,938 | ) | $ | (50,723 | ) | |||
| Foreign |
68,753 | 53,423 | 1,298 | |||||||||
|
|
|
|
|
|
|
|||||||
| $ | 1,860 | $ | (16,515 | ) | $ | (49,425 | ) | |||||
|
|
|
|
|
|
|
|||||||
As of December 31, 2014, the Company had the following net operating loss (“NOL”) carryforwards: $755,065 in the U.S., $8,263 in China, $48,881 in Canada, $26,652 in Hong Kong and $419 in the Netherlands. The U.S. NOLs expire in 2019 through 2034, the Canada NOLs expire in 2029 through 2034, and the Netherlands NOLs expire in 2017. All other NOLs carry forward indefinitely. Canada has a capital loss of $354,209 that will carry forward indefinitely. For the year ended December 31, 2014, the Company recognized a benefit from the utilization of NOL carryforwards of $2,985, of which all was recognized in China, Hong Kong, Canada and the Netherlands.
As of December 31, 2014 and 2013, the Company has established a full valuation allowance in both the U.S. and Canada for the deferred tax assets for NOL carryforwards. During the years ended December 31, 2014 and 2013, the valuation allowance decreased by $1,276 and increased by $1,098, respectively.
In connection with the Company’s reorganization under Chapter 11 completed on January 31, 2003, Viasystems Group believes more than a 50% change in ownership occurred under Section 382 of the Internal Revenue Code of 1986, as amended, and regulations issued thereunder. As a consequence, the utilization of the U.S. NOLs is limited to approximately $21,687 per year (except to the extent the Company recognizes certain gains built in at the time of the ownership change), with any unused portion carried over to succeeding years. Any NOLs not utilized in a year can be carried over to succeeding years.
Certain of the Company’s subsidiaries have tax rate reductions in China that, as of December 31, 2014, allow for an annually-reviewed 10% rate reduction. If not for such tax rate reductions, the Company would have had $59 ($0.00 per basic and diluted shares outstanding), $217 ($0.01 per basic and diluted share outstanding) and $594 ($0.03 per basic and diluted share outstanding) of additional income tax expense for the years ended December 31, 2014, 2013 and 2012, respectively, based on the applicable reduced tax rate of 15%.
81
Table of Contents
As of December 31, 2014, the Company has not recognized deferred income taxes on $189,712 of undistributed earnings of its foreign subsidiaries as such earnings are considered to be permanently reinvested in the Company’s foreign operations. If the earnings were distributed in the form of dividends, the Company estimates it would be subject to foreign distribution taxes of approximately $10,120 as of December 31, 2014. The Company estimates the impact of any U.S. federal income tax would be offset by NOL carryforwards.
Uncertain Tax Positions
At December 31, 2014 and 2013, other non-current liabilities include $32,165 and $28,164 of long-term accrued taxes, respectively, related to the liability for unrecognized tax benefits. The Company classifies income tax-related interest and penalties as a component of income tax expense. At December 31, 2014 and 2013, the total unrecognized tax benefit in the consolidated balance sheet included a liability of $15,675 and $13,394, respectively, related to accrued interest and penalties on unrecognized tax benefits. The income tax provision included in the Company’s consolidated statements of operations for the years ended December 31, 2014, 2013 and 2012, included expense of $2,281, $2,607 and $1,638, respectively, related to interest and penalties on unrecognized tax benefits.
The liability for unrecognized tax benefits increased by $1,720 from December 31, 2013, to December 31, 2014, including the reversal of $391 of uncertain tax positions due to lapsing of the applicable statute of limitations, primarily due to provisions related to tax positions taken in the current period, and interest and penalties related to positions taken in prior periods. At December 31, 2014 and 2013, the liability for unrecognized tax benefits included $32,165 and $28,164, respectively, that, if recognized, would affect the effective tax rate. The Company is in discussions with various taxing authorities on several open tax positions, and it is possible that the amount of the liability for unrecognized tax benefits could change during the next year. The Company currently estimates approximately $4,000 of the liability for uncertain tax positions could be settled in the next twelve months.
As of December 31, 2014, the Company is subject to U.S. federal income tax examination for all tax years from 1998 forward, and to non-U.S. income tax examinations generally for the tax years 2002 through 2012. In addition, the Company is subject to state and local income tax examinations generally for the tax years 2002 through 2012.
A reconciliation of the Company’s total gross unrecognized tax benefits, exclusive of related interest and penalties, for the years ended December 31, 2014, 2013 and 2012, is summarized below:
| 2014 | 2013 | 2012 | ||||||||||
| Balance, beginning of year |
$ | 14,770 | $ | 14,865 | $ | 15,664 | ||||||
| Tax positions related to current year: |
||||||||||||
| Additions |
2,111 | 321 | 181 | |||||||||
| Reductions |
— | — | — | |||||||||
| Tax positions related to prior years: |
||||||||||||
| Additions |
— | — | — | |||||||||
| Reductions |
— | — | — | |||||||||
| Tax positions acquired from DDi |
— | — | 787 | |||||||||
| Settlements |
— | (19 | ) | (16 | ) | |||||||
| Lapses in statutes of limitations |
(391 | ) | (397 | ) | (1,751 | ) | ||||||
|
|
|
|
|
|
|
|||||||
| Balance, end of year |
$ | 16,490 | $ | 14,770 | $ | 14,865 | ||||||
|
|
|
|
|
|
|
|||||||
| 14. | Derivative Financial Instruments and Fair Value Measurements |
Cash Flow Hedging Strategy
The Company uses foreign exchange forward contracts and cross-currency swaps that are designated and qualify as cash flow hedges to manage certain of its foreign exchange rate risks. The Company’s objective is to limit potential losses in earnings or cash flows from adverse foreign currency exchange rate movements. The Company’s foreign currency exposure arises from the transacting of business in a currency other than the U.S. dollar, primarily the Chinese Renminbi (“RMB”).
The Company enters into foreign exchange forward contracts and cross-currency swaps after considering future use of foreign currencies, desired foreign exchange rate sensitivities and the foreign exchange rate environment. Prior to entering into a hedge transaction, the Company formally documents the relationship between hedging instruments to be used and the hedged items, as well as the risk management objective for undertaking the hedge transactions. The Company generally does not hedge its exposure to the exchange rate variability of future cash flows beyond the end of its next ensuing fiscal year.
82
Table of Contents
The Company recognizes all such derivative contracts as either assets or liabilities in the balance sheet and measures those instruments at fair value (see Note 1) through adjustments to other comprehensive income, current earnings, or both, as appropriate. Accumulated other comprehensive (loss) income as of December 31, 2014, included net deferred loss on derivatives of $1,053 (net of taxes $0) and as of December 31, 2013 and 2012, included net deferred gains on derivatives of $933 (net of taxes $256) and $1,340 (net of taxes of $0), respectively, related to cash flow hedges.
The Company records deferred gains and losses related to cash flow hedges based on the fair value of open derivative contracts on the reporting date, as determined using a market approach and Level 2 inputs. As of December 31, 2014, all of the Company’s derivative contracts were in the form of the RMB cross-currency swaps and as of December 31, 2013, all of the Company’s derivative contracts were in the form of the RMB foreign exchange forward contracts and cross currency swaps, which were designated and qualified as cash flow hedging instruments. Realized gains or losses from the settlement of foreign exchange forward contracts and cross-currency swaps are recognized in earnings in the same period the hedged foreign currency cash flow affects earnings. For the years ended December 31, 2014, 2013 and 2012, a loss of $1,856 and gains of $5,784 and $2,347, respectively, were recorded in cost of goods sold related to foreign currency cash flow hedges.
The following table summarizes the Company’s outstanding derivative contracts:
| December 31, 2014 | December 31, 2013 | |||||||
| Notional amount in thousands of Chinese RMB |
1,800,000 | 479,096 | ||||||
| Weighted average remaining maturity in months |
6.1 | 6.4 | ||||||
| Weighted average exchange rate per one U.S. Dollar |
6.28 | 6.18 | ||||||
Fair Value of Measurements
The Company measures the fair value of assets and liabilities using a three-tier fair value hierarchy which prioritizes the inputs used in measuring fair value as follows: Level 1 - observable inputs such as quoted prices in active markets; Level 2 - inputs, other than quoted market prices in active markets, which are observable, either directly or indirectly; and Level 3 - valuations derived from valuation techniques in which one or more significant inputs are unobservable. In addition, the Company may use various valuation techniques, including the market approach, using comparable market prices; the income approach, using present value of future income or cash flow; and the cost approach, using the replacement cost of assets.
83
Table of Contents
Financial Instruments Measured on a Recurring Basis
The following table sets forth, as of December 31, 2014, 2013 and 2012, the hierarchy of the Company’s financial asset (liability) positions for which fair value is measured on a recurring basis:
| December 31, 2014 | ||||||||||||||
| Level 1 | Level 2 | Level 3 | Balance Sheet Classification | |||||||||||
| Available – for – sale investments in Savings Restoration Plan |
$ | 1,429 | $ | — | $ | — | Prepaid expense and other | |||||||
| Cash flow hedges – deferred loss contracts |
— | (1,053 | ) | — | Accrued and other liabilities | |||||||||
|
|
|
|
|
|
|
|||||||||
| $ | 1,429 | $ | (1,053 | ) | $ | — | ||||||||
|
|
|
|
|
|
|
|||||||||
| December 31, 2013 | ||||||||||||||
| Level 1 | Level 2 | Level 3 | Balance Sheet Classification | |||||||||||
| Available – for – sale investments in Savings Restoration Plan |
$ | 1,077 | $ | — | $ | — | Prepaid expense and other | |||||||
| Cash flow hedges – deferred gains contracts |
— | 1,189 | — | Prepaid expense and other | ||||||||||
|
|
|
|
|
|
|
|||||||||
| $ | 1,077 | $ | 1,189 | $ | — | |||||||||
|
|
|
|
|
|
|
|||||||||
| December 31, 2012 | ||||||||||||||
| Level 1 | Level 2 | Level 3 | Balance Sheet Classification | |||||||||||
| Available – for – sale investments in Savings Restoration Plan |
$ | 411 | $ | — | $ | — | Prepaid expense and other | |||||||
| Cash flow hedges – deferred gains contracts |
— | 1,340 | — | Prepaid expense and other | ||||||||||
|
|
|
|
|
|
|
|||||||||
| $ | 411 | $ | 1,340 | $ | — | |||||||||
|
|
|
|
|
|
|
|||||||||
Available-for-sale investments in the Savings Restoration Plan (see Note 18) consist of investments in money market accounts and mutual funds invested in a rabbi trust, and are valued based on quoted prices in active markets (Level 1). The liability to participants in the Savings Restoration Plan is equal to the fair value of the plan’s investments, with any difference attributable to the timing of deposits into the trust.
The Company records deferred gains and losses related to cash flow hedges based on the fair value of active derivative contracts on the reporting date, as determined using a market approach. As quoted prices in active markets are not available for identical contracts, Level 2 inputs are used to determine fair value. These inputs include quotes for similar but not identical derivative contracts, market interest rates that are corroborated with publicly available market information and third party credit ratings for the counter parties to our derivative contracts. When applicable, all such contracts covered by master netting agreements are reported net, with gross positive fair values netted with gross negative fair values by counterparty.
The Company did not have any transfers between levels during the years ended December 31, 2014, 2013 or 2012.
Other Financial Instruments
In addition to cash flow hedges, the Company’s financial instruments consist of cash equivalents, accounts receivable, long-term debt and other long-term obligations. For cash equivalents, accounts receivable and other long-term obligations, the carrying amounts approximate fair market value. The estimated fair values of the Company’s debt instruments as of December 31, 2014 and 2013, are as follows:
| December 31, 2014 | ||||||||||
| Fair Value | Carrying Amount |
Balance Sheet Classification | ||||||||
| Senior Secured Notes due 2019 |
$ | 634,878 | $ | 603,800 | Long-term debt, less current maturities | |||||
| Senior Secured 2010 Credit Facility |
— | — | ||||||||
| North America Mortgage Loans |
10,288 | 10,435 | Long-term debt, including current maturities | |||||||
| Zhongshan 2010 Credit Facility |
— | — | Current maturities of long-term debt | |||||||
| December 31, 2013 | ||||||||||
| Fair Value | Carrying Amount |
Balance Sheet Classification | ||||||||
| Senior Secured Notes due 2019 |
$ | 595,034 | $ | 550,000 | Long-term debt, less current maturities | |||||
| Senior Secured 2010 Credit Facility |
— | — | ||||||||
| North America Mortgage Loans |
11,710 | 12,259 | Long-term debt, including current maturities | |||||||
| Zhongshan 2010 Credit Facility |
10,000 | 10,000 | Current maturities of long-term debt | |||||||
84
Table of Contents
The Company determined the fair value of the Senior Secured Notes due 2019 using Level 1 inputs - quoted market prices for the notes. The Company determined the fair value of the North America Mortgage Loans, and Zhongshan 2010 Credit Facility using Level 2 inputs, and estimated the fair value based on discounted future cash flows using a discount rate that approximates the current effective borrowing rate for comparable loans.
| 15. | Equity Incentive Plans |
2010 Equity Incentive Plan
The Company’s 2010 Equity incentive Plan, (the “2010 Plan”) was adopted in April 2010, and provides for grants of stock options, restricted stock awards, performance share units and other stock-based awards to the Company’s employees and directors. Subject to additions and adjustments, 4,600,000 shares are authorized for granting under the 2010 Plan. At December 31, 2014, 440,276 shares were available for future grants.
The 2010 Plan provides the compensation committee of the Company’s board of directors the discretion to grant awards in any form and with any terms permitted by the 2010 Plan. All stock option grants awarded since the inception of the 2010 Plan expire 7 years after the grant date, with one-third of the options vesting on the first anniversary of the grant date, and one-twelfth of the options vesting on each of the next eight ensuing calendar quarter-ends. Subject to certain accelerated vesting provisions of the 2010 Plan, restricted stock awards granted since the inception of the 2010 Plan vest on the third anniversary of the grant date. Performance share units vest only if the performance objectives of the awards are met as measured over the performance period established for each grant. Based upon the extent to which performance objectives are achieved, shares issued upon the vesting of share units may range from zero to 200% of the original grant.
2003 Stock Option Plan
In January 2013, the Company’s 2003 Stock Option Plan (the “2003 Plan”) expired such that no new awards may be granted under that plan. The 2003 Plan allowed for the granting of options to purchase shares of the Company’s common stock. Options granted expire 10 years after the grant date. At December 31, 2014, 40,775 options were issued and outstanding under this plan.
Stock Compensation Expense
Stock compensation expense recognized in the consolidated statements of operations was as follows:
| December 31, | ||||||||||||
| 2014 | 2013 | 2012 | ||||||||||
| Cost of goods sold |
$ | 658 | $ | 684 | $ | 640 | ||||||
| Selling, general and administrative |
7,094 | 8,730 | 9,923 | |||||||||
|
|
|
|
|
|
|
|||||||
| $ | 7,752 | $ | 9,414 | $ | 10,563 | |||||||
|
|
|
|
|
|
|
|||||||
As of December 31, 2014, unrecognized compensation expense related to grants of stock options, restricted stock awards and performance share units totaled $8,423 and will be recognized over a period of approximately two years.
85
Table of Contents
Stock Option Activity
The following table summarizes the stock option activity under both the 2003 Plan and the 2010 Plan for the year ended December 31:
| 2014 | 2013 | 2012 | ||||||||||||||||||||||
| Options | Exercise Price(1) |
Options | Exercise Price(1) |
Options | Exercise Price(1) |
|||||||||||||||||||
| Beginning balance |
1,869,124 | $ | 24.73 | 2,029,010 | $ | 31.84 | 1,676,812 | $ | 36.00 | |||||||||||||||
| Granted |
— | — | 22,500 | 13.47 | 406,962 | 17.70 | ||||||||||||||||||
| Exercised |
(4,999 | ) | 15.30 | — | — | — | — | |||||||||||||||||
| Forfeited |
(93,405 | ) | 50.86 | (182,386 | ) | 102.43 | (54,764 | ) | 54.16 | |||||||||||||||
|
|
|
|
|
|
|
|||||||||||||||||||
| Ending balance |
1,770,720 | $ | 23.40 | 1,869,124 | $ | 24.73 | 2,029,010 | $ | 31.84 | |||||||||||||||
|
|
|
|
|
|
|
|||||||||||||||||||
| Exercisable at year end |
1,752,079 | $ | 23.49 | 1,697,339 | $ | 25.50 | 1,377,982 | $ | 37.97 | |||||||||||||||
|
|
|
|
|
|
|
|||||||||||||||||||
| (1) | weighted average |
As of December 31, 2014, the intrinsic value of outstanding stock options was $193.
No stock options were granted during the year ended December 31, 2014. The fair value of each option grant during the years ended December 31, 2013 and 2012 was estimated on the date of the grant using the Black-Scholes option-pricing model with the following assumptions:
| 2013 | 2012 | |||
| Expected life of options |
4.3 years | 4.3 years | ||
| Risk free interest rate |
0.75% to 0.88% | 0.63% to 0.85% | ||
| Expected volatility of stock |
54.66% to 54.94% | 62.12% to 67.05% | ||
| Expected dividend yield |
None | None | ||
| Weighted average fair value |
$5.95 | $8.86 |
The Company’s common stock was listed and began trading on the NASDAQ on February 17, 2010. For stock options granted during the year ended December 31, 2013, the Company estimated the expected volatility of the underlying shares using its historical stock performance. For stock options granted in 2012, as there was insufficient historical data about the Company’s common stock performance, the Company estimated the expected volatility of the underlying shares based on the blended historical stock volatility of peer companies. The Company estimated the expected life of new option grants in both 2013 and 2012 using the simplified method.
As of December 31, 2014, outstanding stock options under the 2003 Plan had an exercise price of $150.99; and outstanding stock options under the 2010 Plan had exercise prices ranging from $12.66 to $24.00. The following table summarizes information regarding outstanding stock options under these plans as of December 31, 2014:
| Outstanding | Exercisable | |||||||||||||||||||
| Exercise Price |
Number of Options |
Weighted Average Remaining Contractual Life |
Weighted Average Exercise Price |
Number of Options |
Weighted Average Remaining Contractual Life |
Weighted Average Exercise Price |
||||||||||||||
| $ 12.66 to $15.30 |
126,581 | 3.69 years | $ | 14.76 | 108,651 | 3.49 years | $ | 14.82 | ||||||||||||
| $ 18.42 to $21.04 |
762,270 | 3.47 years | 19.66 | 762,270 | 3.47 years | 19.66 | ||||||||||||||
| $ 21.88 to $24.00 |
841,094 | 2.34 years | 21.89 | 840,383 | 2.34 years | 21.89 | ||||||||||||||
| $ 150.99 |
40,775 | 1.86 years | 150.99 | 40,775 | 1.86 years | 150.99 | ||||||||||||||
|
|
|
|
|
|||||||||||||||||
| 1,770,720 | 2.91 years | $ | 23.40 | 1,752,079 | 2.89 years | $ | 23.49 | |||||||||||||
|
|
|
|
|
|||||||||||||||||
86
Table of Contents
Restricted Stock Award Activity
The following table summarizes restricted stock award activity for the years ended December 31:
| 2014 | 2013 | 2012 | ||||||||||||||||||||||
| Shares | Weighted Average Grant Date Per Share Fair Value |
Shares | Weighted Average Grant Date Per Share Fair Value |
Shares | Weighted Average Grant Date Per Share Fair Value |
|||||||||||||||||||
| Nonvested, beginning of year |
576,042 | $ | 17.47 | 629,435 | $ | 18.40 | 405,595 | $ | 18.05 | |||||||||||||||
| Granted |
213,900 | 12.31 | 203,089 | 13.50 | 240,825 | 19.02 | ||||||||||||||||||
| Vested |
(155,274 | ) | 20.13 | (244,973 | ) | 16.61 | (10,406 | ) | 18.13 | |||||||||||||||
| Forfeited |
(11,366 | ) | 14.27 | (11,509 | ) | 16.96 | (6,579 | ) | 19.85 | |||||||||||||||
|
|
|
|
|
|
|
|||||||||||||||||||
| Nonvested, end of year |
623,302 | $ | 15.09 | 576,042 | $ | 17.47 | 629,435 | $ | 18.40 | |||||||||||||||
|
|
|
|
|
|
|
|||||||||||||||||||
Restricted stock awards outstanding as of December 31, 2014, had an aggregate intrinsic value of $10,147. As of the vesting date, the total fair value of restricted stock awards which vested during 2014 was $2,017.
Performance Share Units
For performance share units with market conditions, such as those that include performance conditions related to attaining a specific stock price, the grant date fair value of awards are estimated using the Monte Carlo simulation method and expensed ratably over the requisite service period. For performance share units without market conditions, the grant date fair value of awards is based on the share price of the Company’s common stock on the date of grant and expensed ratably over the requisite service period based on the probability of achieving the performance objectives, with changes in expectations recognized as an adjustment to earnings in the period of the change. For performance share units granted in 2014 and 2013, the performance objectives were based on the achievement of targeted future stock prices of the Company’s common stock over a period of three years. For performance share units granted in 2012, the performance objectives were based on the achievement of targeted levels of Adjusted EBITDA and return on invested capital (both as defined in the grant agreements) over a period of three to five years.
The following table summarizes performance share unit activity for the years ended December 31:
| 2014 | 2013 | 2012 | ||||||||||||||||||||||
| Shares | Weighted Average Grant Date Per Share Fair Value |
Shares | Weighted Average Grant Date Per Share Fair Value |
Shares | Weighted Average Grant Date Per Share Fair Value |
|||||||||||||||||||
| Nonvested, beginning of year |
558,113 | $ | 16.26 | 139,343 | $ | 15.35 | — | $ | — | |||||||||||||||
| Granted |
241,138 | 14.88 | 427,736 | 16.57 | 139,343 | 15.35 | ||||||||||||||||||
| Vested |
— | — | — | — | — | — | ||||||||||||||||||
| Forfeited |
— | — | (8,966 | ) | 17.04 | — | — | |||||||||||||||||
|
|
|
|
|
|
|
|||||||||||||||||||
| Nonvested, end of year |
799,251 | $ | 15.84 | 558,113 | $ | 16.26 | 139,343 | $ | 15.35 | |||||||||||||||
|
|
|
|
|
|
|
|||||||||||||||||||
87
Table of Contents
In February 2015, with respect to performance share units granted in 2012, the Company issued 37,697 shares which had been earned.
| 16. | Business Segment Information |
Operating segments are defined as components of an enterprise for which separate financial information is available that is evaluated regularly by the chief operating decision maker or decision making group in deciding how to allocate resources and in assessing performance. During the year ended December 31, 2014, the Company operated its business in two segments: i) Printed Circuit Boards and ii) Assembly.
The Printed Circuit Boards segment consists of the Company’s printed circuit board manufacturing facilities located in the United States, Canada and China. These facilities manufacture double-sided and multi-layer printed circuit boards and backpanels. The Assembly segment consists of assembly operations including backpanel assembly, printed circuit board assembly, cable assembly, custom enclosures, and full system assembly and testing. The assembly operations are conducted in manufacturing facilities in China and Mexico. Intersegment sales are eliminated in consolidation. The accounting policies of segments are the same as those described in Note 1.
Assets and liabilities of the Company’s corporate headquarters, along with those of its closed printed circuit boards and assembly operations, are reported in “Other.” Operating expenses of our corporate headquarters are allocated to the Printed Circuit Boards and Assembly segments based on a number of factors, including sales.
Total assets by segment are as follows:
| December 31, | ||||||||
| 2014 | 2013 | |||||||
| Total assets: |
||||||||
| Printed Circuit Boards |
$ | 984,949 | $ | 975,570 | ||||
| Assembly |
95,478 | 99,857 | ||||||
| Other |
55,078 | 42,990 | ||||||
|
|
|
|
|
|||||
| Total assets |
$ | 1,135,505 | $ | 1,118,417 | ||||
|
|
|
|
|
|||||
88
Table of Contents
Net sales and operating income (loss) by segment, together with reconciliation to (loss) income before income taxes, are as follows:
| Year ended December 31, | ||||||||||||
| 2014 | 2013 | 2012 | ||||||||||
| Net sales to external customers: |
||||||||||||
| Printed Circuit Boards |
$ | 1,037,768 | $ | 996,528 | $ | 959,793 | ||||||
| Assembly |
166,334 | 174,518 | 200,113 | |||||||||
|
|
|
|
|
|
|
|||||||
| Total |
$ | 1,204,102 | $ | 1,171,046 | $ | 1,159,906 | ||||||
|
|
|
|
|
|
|
|||||||
| Intersegment sales: |
||||||||||||
| Printed Circuit Boards |
$ | 11,237 | $ | 11,581 | $ | 7,379 | ||||||
| Assembly |
— | — | — | |||||||||
|
|
|
|
|
|
|
|||||||
| Total |
$ | 11,237 | $ | 11,581 | $ | 7,379 | ||||||
|
|
|
|
|
|
|
|||||||
| Operating income (loss): |
||||||||||||
| Printed Circuit Boards |
$ | 66,533 | $ | 25,255 | $ | 27,357 | ||||||
| Assembly |
(11,466 | ) | 565 | 1,639 | ||||||||
| Other |
(6,407 | ) | (623 | ) | (9,727 | ) | ||||||
|
|
|
|
|
|
|
|||||||
| Total |
48,660 | 25,197 | 19,269 | |||||||||
| Interest expense, net |
47,334 | 44,797 | 42,156 | |||||||||
| Amortization of deferred financing costs |
2,901 | 2,898 | 2,723 | |||||||||
| Loss on early extinguishment of debt |
— | — | 24,234 | |||||||||
| Other, net |
(3,435 | ) | (5,983 | ) | (419 | ) | ||||||
|
|
|
|
|
|
|
|||||||
| (Loss) income before income taxes |
$ | 1,860 | $ | (16,515 | ) | $ | (49,425 | ) | ||||
|
|
|
|
|
|
|
|||||||
Capital expenditures and depreciation expense by segment are as follows:
| Year ended December 31, | ||||||||||||
| 2014 | 2013 | 2012 | ||||||||||
| Capital expenditures: |
||||||||||||
| Printed Circuit Boards |
$ | 60,510 | $ | 100,881 | $ | 102,058 | ||||||
| Assembly |
3,930 | 6,653 | 5,952 | |||||||||
| Other |
302 | 987 | 711 | |||||||||
|
|
|
|
|
|
|
|||||||
| Total capital expenditures |
$ | 64,742 | $ | 108,521 | $ | 108,721 | ||||||
|
|
|
|
|
|
|
|||||||
| Depreciation expense: |
||||||||||||
| Printed Circuit Boards |
$ | 83,368 | $ | 83,554 | $ | 75,506 | ||||||
| Assembly |
4,536 | 4,506 | 4,513 | |||||||||
|
|
|
|
|
|
|
|||||||
| Total depreciation expense |
$ | 87,904 | $ | 88,060 | $ | 80,019 | ||||||
|
|
|
|
|
|
|
|||||||
89
Table of Contents
Net sales by country of destination are as follows:
| Year Ended December 31, | ||||||||||||
| 2014 | 2013 | 2012 | ||||||||||
| United States |
$ | 497,895 | $ | 526,744 | $ | 465,798 | ||||||
| People’s Republic of China, including Hong Kong |
253,745 | 234,072 | 244,290 | |||||||||
| Canada |
51,138 | 43,874 | 40,070 | |||||||||
| Malaysia |
51,070 | 43,651 | 44,474 | |||||||||
| Germany |
46,933 | 46,237 | 55,305 | |||||||||
| Hungary |
43,703 | 42,374 | 43,141 | |||||||||
| France |
25,453 | 22,316 | 27,733 | |||||||||
| Mexico |
24,555 | 14,026 | 8,248 | |||||||||
| Singapore |
20,563 | 19,915 | 16,366 | |||||||||
| India |
19,858 | 21,662 | 28,905 | |||||||||
| Sweden |
17,104 | 13,969 | 7,877 | |||||||||
| Brazil |
16,008 | 13,508 | 14,632 | |||||||||
| Israel |
14,979 | 12,326 | 15,651 | |||||||||
| United Kingdom |
11,395 | 12,052 | 19,542 | |||||||||
| Netherlands |
10,516 | 27,169 | 27,084 | |||||||||
| Thailand |
10,351 | 12,959 | 12,873 | |||||||||
| Other |
88,836 | 64,192 | 87,917 | |||||||||
|
|
|
|
|
|
|
|||||||
| Total |
$ | 1,204,102 | $ | 1,171,046 | $ | 1,159,906 | ||||||
|
|
|
|
|
|
|
|||||||
Net sales by country of manufacture are as follows:
| Year Ended December 31, | ||||||||||||
| 2014 | 2013 | 2012 | ||||||||||
| People’s Republic of China |
$ | 803,433 | $ | 758,425 | $ | 829,593 | ||||||
| United States |
276,128 | 282,036 | 246,959 | |||||||||
| Canada |
78,032 | 75,106 | 41,881 | |||||||||
| Mexico |
46,509 | 55,479 | 41,473 | |||||||||
|
|
|
|
|
|
|
|||||||
| $ | 1,204,102 | $ | 1,171,046 | $ | 1,159,906 | |||||||
|
|
|
|
|
|
|
|||||||
Property, plant and equipment, net by country are as follows:
| December 31, | ||||||||
| 2014 | 2013 | |||||||
| People’s Republic of China, including Hong Kong |
$ | 290,258 | $ | 302,563 | ||||
| United States |
95,302 | 104,647 | ||||||
| Canada |
28,858 | 30,448 | ||||||
| Mexico |
1,189 | 8,830 | ||||||
|
|
|
|
|
|||||
| $ | 415,607 | $ | 446,488 | |||||
|
|
|
|
|
|||||
90
Table of Contents
| 17. | Accumulated Other Comprehensive Income |
Changes in accumulated other comprehensive (loss) income, by component, for the years ended December 31, 2014, 2013, and 2012, were as follows:
| Cash Flow Hedges (see Note14) |
Foreign Currency Translation |
Total | ||||||||||
| Accumulated other comprehensive income at December 31, 2011 |
$ | 527 | $ | 7,528 | $ | 8,055 | ||||||
|
|
|
|
|
|
|
|||||||
| Other comprehensive income, net of tax and before reclassifications |
3,160 | — | 3,160 | |||||||||
| Amounts reclassified from accumulated other comprehensive income, net of tax |
(2,347 | ) | — | (2,347 | ) | |||||||
|
|
|
|
|
|
|
|||||||
| Other comprehensive income, net of tax |
813 | — | 813 | |||||||||
|
|
|
|
|
|
|
|||||||
| Accumulated other comprehensive income at December 31, 2012 |
1,340 | 7,528 | 8,868 | |||||||||
| Other comprehensive income, net of tax and before reclassifications |
5,377 | — | 5,377 | |||||||||
| Amounts reclassified from accumulated other comprehensive income, net of tax |
(5,784 | ) | — | (5,784 | ) | |||||||
|
|
|
|
|
|
|
|||||||
| Other comprehensive loss, net of tax |
(407 | ) | — | (407 | ) | |||||||
|
|
|
|
|
|
|
|||||||
| Accumulated other comprehensive income at December 31, 2013 |
933 | 7,528 | 8,461 | |||||||||
| Other comprehensive loss, net of tax and before reclassifications |
(3,842 | ) | — | (3,842 | ) | |||||||
| Amounts reclassified from accumulated other comprehensive income, net of tax |
1,856 | — | 1,856 | |||||||||
|
|
|
|
|
|
|
|||||||
| Other comprehensive loss, net of tax |
(1,986 | ) | — | (1,986 | ) | |||||||
|
|
|
|
|
|
|
|||||||
| Accumulated other comprehensive (loss) income at December 31, 2014 |
$ | (1,053 | ) | $ | 7,528 | $ | 6,475 | |||||
|
|
|
|
|
|
|
|||||||
Other comprehensive (loss) income for the years ended December 31, 2014, 2013 and 2012, was net of tax of $0, $256 and $0, respectively.
| 18. | Retirement Plans |
The Company has a defined contribution retirement savings plan (the “Retirement Plan”) covering substantially all domestic employees who meet certain eligibility requirements as to age and length of service. The Retirement Plan incorporates the salary deferral provision of Section 401(k) of the Internal Revenue Code and employees may defer up to 30% of their compensation or the annual maximum limit prescribed by the Internal Revenue Code. The Company matches a percentage of the employees’ deferrals (the “Matching Contribution”) and may contribute an additional 1% of employees’ salaries to the Retirement Plan regardless of employee deferrals. The Company may also elect to contribute an additional profit-sharing contribution at the end of each year. At the beginning of 2013, the employees of the U.S. based manufacturing facilities acquired from DDi became eligible to receive Matching Contributions under the Retirement Plan. The Company’s contributions to the Retirement Plan were $2,371, $1,871 and $1,310 for the years ended December 31, 2014, 2013 and 2012, respectively.
The Company has a savings restoration plan (the “Savings Restoration Plan”) to provide additional benefits to certain domestic employees who are not eligible to receive the full Matching Contribution due to limitations imposed by the Internal Revenue Code. The Savings Restoration Plan also allows for the voluntary deferral of certain compensation by eligible employees. The Company’s expense related to the Savings Restoration Plan were $153, $114 and $120 for the years ended December 31, 2014, 2013 and 2012 respectively.
91
Table of Contents
| 19. | Related Party Transactions |
Noncontrolling Interest Holder
The Company purchases consulting and other services from the Noncontrolling Interest Holder related to its Huiyang, China PCB manufacturing facility. During the years ended December 31, 2014, 2013 and 2012, the Company paid the Noncontrolling Interest Holder $115, $107 and $108, respectively, related to these services and as of December 31, 2014, $36 was payable to the Noncontrolling Interest Holder.
Prior to the 2012 closure of the Huizhou Facility, the Company made rental payments and purchased consulting and other services from the Noncontrolling Interest Holder related to the Huizhou Facility. During the year ended December 31, 2012, the Company paid the Noncontrolling Interest Holder $721 related to these rental payments service fees.
Compensation of Directors
For each of the years ended December 31, 2014, 2013 and 2012, the Company paid director fees based on the following rates: the Chairman of the Board receives an annual fee of $120; directors (other than the Chairman) who are not executive officers receive an annual fee of $60; members of the Audit Committee, Compensation Committee and Nominating and Governance Committee receives an additional annual fee of $15, $13 and $10, respectively; and the chairman of the Audit Committee, Compensation Committee and Nominating and Governance Committee receive an additional fee of $15, $13 and $10, respectively. In addition, Directors are reimbursed for out-of-pocket expenses incurred in connection with attending meetings of the Board and its committees.
In 2014, the Company awarded each director who was not an executive officer 12,690 shares of restricted stock as of the date of the Company’s annual shareholders meeting. In 2013, the Company awarded each director who was not an executive officer 11,848 shares of restricted stock as of the date of the Company’s annual shareholders meeting. In 2012, the Company awarded each director who was not an executive officer 6,852 shares of restricted stock as of the Company’s annual shareholders meeting and granted two directors who joined the board subsequently 7,333 shares of restricted stock each.
92
Table of Contents
| 20. | Summary of Interim Financial Information (unaudited) |
Quarterly financial data for the years ended December 31, 2014 and 2013 is presented below:
| Quarter | ||||||||||||||||||||
| 1st | 2nd | 3rd | 4th | Year | ||||||||||||||||
| 2014: |
||||||||||||||||||||
| Net sales |
$ | 295,912 | $ | 300,929 | $ | 299,252 | $ | 308,009 | 1,204,102 | |||||||||||
| Cost of goods sold |
239,803 | 242,245 | 239,883 | 246,655 | 968,586 | |||||||||||||||
| Guangzhou Fire business interruption insurance proceeds |
— | — | — | (26,459 | ) | (26,459 | ) | |||||||||||||
| Selling, general and administrative |
26,849 | 25,442 | 30,051 | 29,551 | 111,893 | |||||||||||||||
| Depreciation and amortization |
23,492 | 23,524 | 23,590 | 23,465 | 94,071 | |||||||||||||||
| Restructuring and impairment |
273 | 68 | 6,794 | 216 | 7,351 | |||||||||||||||
|
|
|
|
|
|
|
|
|
|
|
|||||||||||
| Operating income (loss) |
5,495 | 9,650 | (1,066 | ) | 34,581 | 48,660 | ||||||||||||||
|
|
|
|
|
|
|
|
|
|
|
|||||||||||
| Net (loss) income |
$ | (9,357 | ) | $ | (3,620 | ) | $ | (16,359 | ) | $ | 14,160 | $ | (15,176 | ) | ||||||
| Noncontrolling interest |
$ | 190 | $ | 239 | $ | 205 | $ | 180 | $ | 814 | ||||||||||
|
|
|
|
|
|
|
|
|
|
|
|||||||||||
| Net (loss) income attributable to common stockholders |
(9,547 | ) | (3,859 | ) | (16,564 | ) | 13,980 | (15,990 | ) | |||||||||||
|
|
|
|
|
|
|
|
|
|
|
|||||||||||
| Basic (loss) earnings per share |
$ | (0.47 | ) | $ | (0.19 | ) | $ | (0.82 | ) | $ | 0.69 | $ | (0.79 | ) | ||||||
|
|
|
|
|
|
|
|
|
|
|
|||||||||||
| Diluted (loss) earnings per share |
$ | (0.47 | ) | $ | (0.19 | ) | $ | (0.82 | ) | $ | 0.67 | $ | (0.79 | ) | ||||||
|
|
|
|
|
|
|
|
|
|
|
|||||||||||
| Basic weighted average shares outstanding |
20,268,717 | 20,289,645 | 20,290,384 | 20,297,657 | 20,280,284 | |||||||||||||||
|
|
|
|
|
|
|
|
|
|
|
|||||||||||
| Diluted weighted average shares outstanding |
20,268,717 | 20,289,645 | 20,290,384 | 20,820,186 | 20,280,284 | |||||||||||||||
|
|
|
|
|
|
|
|
|
|
|
|||||||||||
| 2013: |
||||||||||||||||||||
| Net sales |
$ | 272,940 | $ | 285,553 | $ | 309,172 | $ | 303,381 | $ | 1,171,046 | ||||||||||
| Cost of goods sold |
219,058 | 232,448 | 253,737 | 244,253 | 949,496 | |||||||||||||||
| Selling, general and administrative |
27,693 | 25,001 | 25,192 | 22,619 | 100,505 | |||||||||||||||
| Depreciation and amortization |
23,636 | 23,556 | 23,537 | 24,046 | 94,775 | |||||||||||||||
| Restructuring and impairment |
— | — | 347 | 726 | 1,073 | |||||||||||||||
|
|
|
|
|
|
|
|
|
|
|
|||||||||||
| Operating income |
2,553 | 4,548 | 6,359 | 11,737 | 25,197 | |||||||||||||||
|
|
|
|
|
|
|
|
|
|
|
|||||||||||
| Net (loss) income |
$ | (13,282 | ) | $ | (10,268 | ) | $ | (9,032 | ) | $ | 4,972 | $ | (27,610 | ) | ||||||
| Noncontrolling interest |
$ | 173 | $ | 101 | $ | 121 | $ | 215 | $ | 610 | ||||||||||
|
|
|
|
|
|
|
|
|
|
|
|||||||||||
| Net (loss) income attributable to common stockholders |
$ | (13,455 | ) | $ | (10,369 | ) | $ | (9,153 | ) | $ | 4,757 | $ | (28,220 | ) | ||||||
|
|
|
|
|
|
|
|
|
|
|
|||||||||||
| Basic earnings per share |
$ | (0.67 | ) | $ | (0.52 | ) | $ | (0.45 | ) | $ | 0.24 | $ | (1.40 | ) | ||||||
|
|
|
|
|
|
|
|
|
|
|
|||||||||||
| Diluted earnings per share |
$ | (0.67 | ) | $ | (0.52 | ) | $ | (0.45 | ) | $ | 0.23 | $ | (1.40 | ) | ||||||
|
|
|
|
|
|
|
|
|
|
|
|||||||||||
| Basic weighted average shares outstanding |
19,994,820 | 20,010,029 | 20,171,083 | 20,179,174 | 20,089,507 | |||||||||||||||
|
|
|
|
|
|
|
|
|
|
|
|||||||||||
| Diluted weighted average shares outstanding |
19,994,820 | 20,010,029 | 20,171,083 | 20,464,264 | 20,089,507 | |||||||||||||||
|
|
|
|
|
|
|
|
|
|
|
|||||||||||
93
Table of Contents
| Item 9. | Changes in and Disagreements with Accountants on Accounting and Financial Disclosure |
None.
| Item 9A. | Controls and Procedures |
(a) Evaluation of Disclosure Controls and Procedures
Under the supervision and with the participation of Viasystems’ management, including Viasystems’ Chief Executive Officer and Chief Financial Officer, Viasystems has evaluated the effectiveness of Viasystems’ disclosure controls and procedures (as defined in Rule 13a-15(e) under the Securities Exchange Act of 1934, as amended) as of December 31, 2014. Based on that evaluation, Viasystems’ Chief Executive Officer and Chief Financial Officer concluded that, as of December 31, 2014, such disclosure controls and procedures were effective in ensuring information required to be disclosed by Viasystems in reports that it files or submits under the Securities Exchange Act of 1934, as amended, is i) recorded, processed, summarized and reported within the time periods specified in the Securities and Exchange Commission’s rules and forms and ii) accumulated and communicated to our management, including our principal executive officer and principal financial officer, as appropriate to allow timely decisions regarding required disclosure.
(b) Inherent Limitations on Effectiveness of Controls
Our management, including our Chief Executive Officer and Chief Financial Officer, does not expect that our disclosure controls or our internal control over financial reporting will prevent or detect all errors and all fraud. A control system, no matter how well conceived or operated, can provide only reasonable, not absolute, assurance the objectives of the control system are met. Further, the design of a control system must reflect the fact there are resource constraints, and the benefits of controls must be considered relative to their costs. Because of the inherent limitations in all control systems, no evaluation of controls can provide absolute assurance that all control issues and instances of fraud, if any, have been detected. These inherent limitations include the realities that judgments in decision-making can be faulty, and breakdowns can occur because of simple error or mistake. Additionally, controls can be circumvented by the individual acts of some persons, by collusion of two or more people, or by management override of the controls. The design of any system of controls is based in part upon certain assumptions about the likelihood of future events, and there can be no assurance any design will succeed in achieving its stated goals under all potential future conditions; over time, controls may become inadequate because of changes in conditions, or the degree of compliance with the policies or procedures may deteriorate. Because of the inherent limitations in a cost-effective control system, misstatements due to errors or fraud may occur and not be detected. Our disclosure controls and procedures are designed to provide a reasonable level of assurance that their objectives are achieved.
(c) Management’s Annual Report on Internal Control over Financial Reporting
Management is responsible for establishing and maintaining adequate internal control over financial reporting, as such term is defined in Rule 13a-15(f) under the Securities Exchange Act of 1934, as amended. As of December 31, 2014, under the supervision and with the participation of management, including Viasystems’ Chief Executive Officer and Chief Financial Officer, an evaluation was conducted of the effectiveness of Viasystems’ internal control over financial reporting based on the framework contained in the report titled “Internal Control - Integrated Framework” issued by the Committee of Sponsoring Organizations of the Treadway Commission (“COSO”) in 2013. This evaluation included review of the documentation of controls, evaluation of the design effectiveness of controls, testing of the operating effectiveness of controls and a conclusion on this evaluation. Based on that evaluation, management concluded that Viasystems’ internal control over financial reporting was effective to provide reasonable assurance that the desired control objectives were achieved as of December 31, 2014.
Viasystems’ independent registered public accounting firm, Ernst & Young LLP, has audited the effectiveness of Viasystems’ internal control over financial reporting as of December 31, 2014, as stated in their report, which is included herein.
94
Table of Contents
(d) Changes in Internal Control Over Financial Reporting
There were no changes in Viasystems’ internal control over financial reporting that occurred during the quarter ended December 31, 2014, that have materially affected, or are reasonably likely to materially affect, its internal control over financial reporting.
| Date: March 12, 2015 | /s/ David M. Sindelar | |||||
| David M. Sindelar | ||||||
| Chief Executive Officer | ||||||
| Date: March 12, 2015 | /s/ Gerald G. Sax | |||||
| Gerald G. Sax | ||||||
| Chief Financial Officer | ||||||
95
Table of Contents
Report of Independent Registered Public Accounting Firm
The Board of Directors and Stockholders
Viasystems Group, Inc.
We have audited Viasystems Group, Inc. and subsidiaries’ (the Company’s) internal control over financial reporting as of December 31, 2014, based on criteria established in Internal Control - Integrated Framework issued by the Committee of Sponsoring Organizations of the Treadway Commission (2013 framework) (the COSO criteria). The Company’s management is responsible for maintaining effective internal control over financial reporting, and for its assessment of the effectiveness of internal control over financial reporting included in the accompanying Management’s Annual Report on Internal Control over Financial Reporting. Our responsibility is to express an opinion on the Company’s internal control over financial reporting based on our audit.
We conducted our audit in accordance with the standards of the Public Company Accounting Oversight Board (United States). Those standards require that we plan and perform the audit to obtain reasonable assurance about whether effective internal control over financial reporting was maintained in all material respects. Our audit included obtaining an understanding of internal control over financial reporting, assessing the risk that a material weakness exists, testing and evaluating the design and operating effectiveness of internal control based on the assessed risk, and performing such other procedures as we considered necessary in the circumstances. We believe that our audit provides a reasonable basis for our opinion.
A company’s internal control over financial reporting is a process designed to provide reasonable assurance regarding the reliability of financial reporting and the preparation of financial statements for external purposes in accordance with generally accepted accounting principles. A company’s internal control over financial reporting includes those policies and procedures that (1) pertain to the maintenance of records that, in reasonable detail, accurately and fairly reflect the transactions and dispositions of the assets of the company; (2) provide reasonable assurance that transactions are recorded as necessary to permit the preparation of financial statements in accordance with generally accepted accounting principles, and that receipts and expenditures of the company are being made only in accordance with authorizations of management and directors of the company; and (3) provide reasonable assurance regarding prevention or timely detection of unauthorized acquisition, use, or disposition of the company’s assets that could have a material effect on the financial statements.
Because of its inherent limitations, internal control over financial reporting may not prevent or detect misstatements. Also, projections of any evaluation of effectiveness to future periods are subject to the risk that controls may become inadequate because of changes in conditions, or that the degree of compliance with the policies or procedures may deteriorate.
In our opinion, the Company maintained, in all material respects, effective internal control over financial reporting as of December 31, 2014, based on the COSO criteria.
We also have audited, in accordance with the standards of the Public Company Accounting Oversight Board (United States), the consolidated balance sheets of Viasystems Group, Inc. and subsidiaries’ as of December 31, 2014 and 2013, and the related consolidated statements of operations and comprehensive (loss) income, stockholders’ equity, and cash flows for each of the three years in the period ended December 31, 2014, and our report dated March 12, 2015, expressed an unqualified opinion thereon.
/s/ Ernst & Young LLP
St. Louis, Missouri
March 12, 2015
96
Table of Contents
| Item 9B. | Other Information |
None
| Item 10. | Directors, Executive Officers and Corporate Governance |
The following table sets forth the names and ages of each of the directors and executive officers of the Company, followed by a description of their business experience during at least the past 5 years. The positions held by the directors and executive officers are with the Company unless indicated otherwise. All executive officers are appointed by the board of directors of the Company (“the Board”) and serve at their pleasure. There are no family relationships among any of the executive officers or directors. Unless indicated otherwise, each of our directors and executive officers is a U.S. citizen and the business address of each individual is 101 South Hanley Road, Suite 1800, St. Louis, Missouri 63105.
| Name |
Age | Position | ||
| Non-Employee Directors | ||||
| Michael D. Burger(1)(3) | 56 | Director | ||
| Robert F. Cummings(2)(3) | 65 | Director | ||
| Kirby A. Dyess(2)(3) | 68 | Director | ||
| Peter Frank | 67 | Director | ||
| Jack D. Furst | 56 | Director | ||
| Edward Herring | 44 | Director | ||
| William A. Owens(1)(3) | 74 | Director | ||
| Dominic J. Pileggi(1)(2) | 63 | Director | ||
| Christopher Steffen(1)(2)(3) | 73 | Chairman of the Board | ||
| David D. Stevens(1)(2) | 61 | Director | ||
| Employee Directors | ||||
| David M. Sindelar | 57 | Chief Executive Officer and Director | ||
| Timothy L. Conlon | 63 | President, Chief Operating Officer and Director | ||
| Non-Director Executives | ||||
| Gerald G. Sax | 54 | Senior Vice President and Chief Financial Officer | ||
| Brian W. Barber | 59 | Senior Vice President Operations-Printed Circuit Board & Supply Chain Management | ||
| Richard B. Kampf | 59 | Senior Vice President Sales and Marketing | ||
| (1) | Member of the Company’s Audit Committee |
| (2) | Member of the Company’s Compensation Committee |
| (3) | Member of the Company’s Nominating and Corporate Governance Committee |
Directors
Michael D. Burger, 56, was appointed as a director in February 2010. Mr. Burger is currently President, Chief Executive Officer and a member of the board of directors of Cascade Microtech, Inc., which provides electrical measurement and semiconductor testing technology. He served as a director, President and Chief Executive Officer of Merix Corporation from April 2007 until February 2010. From November 2004 until joining Merix Corporation, Mr. Burger served as President of the Components Business of Flextronics Corporation, a leading provider of advanced design and electronics manufacturing services to original equipment manufacturers. Prior to Flextronics, from 1999 to November 2004, Mr. Burger was employed by ZiLOG, Inc., a supplier of devices for embedded control and communications applications. From May 2002 until November 2004, Mr. Burger served as ZiLOG’s President and a member of its board of directors.
Mr. Burger’s experience as former Chief Executive Officer of a global printed circuit board manufacturer and his experience with other electronic manufacturers makes him a valued member of the Board.
97
Table of Contents
Timothy L. Conlon, 63, has been a director, President and Chief Operating Officer of the Company since October 1998. Prior to joining the Company, Mr. Conlon was President and Chief Operating Officer of Berg Electronics Corp. from January 1997 through October 1998. Mr. Conlon also served as Executive Vice President and Chief Operating Officer of Berg Electronics Group, Inc., a wholly-owned subsidiary of Berg Electronics Corp., from October 1993 through January 1997. Mr. Conlon is a member of the board of trustees of Maryville University.
Mr. Conlon’s knowledge of the electronics and information-technology hardware industries and his experience as a leader of global operations qualify him to be a director.
Robert F. Cummings, Jr., 65, has been a director since January 2003. In 2010, Mr. Cummings became a Vice Chairman of Investment Banking at JP Morgan Chase & Co. He currently serves as a director of Corning Incorporated. Mr. Cummings joined GSC Group, Inc. (“GSC Group”), a privately held money management firm, in 2002 where he served as Senior Managing Director until he retired in July 2009. In 2010, GSC Group and six affiliates filed petitions seeking relief under Chapter 11 of the United States Bankruptcy Code. Before joining GSC Group, Mr. Cummings was with Goldman, Sachs & Co. for 28 years, where he was a Partner and a member of the Corporate Finance Department.
Mr. Cummings’ extensive corporate finance experience, both as an investment banker and an investor, provides Mr. Cummings with a wealth of knowledge relevant to the Company and service on the Board.
Kirby A. Dyess, 68, was appointed as a director in February 2010. Ms. Dyess served as a director of Merix Corporation from 2002 until February 2010. She is a principal in her own early stage investment firm, Austin Capital Management LLC. She served as Vice President of Intel Corporation and Director of Operations for Intel Capital from April 2001 until her retirement in December 2002. She served as Vice President and Director of New Business Development of Intel Corporation from January 1997 to April 2001 and was Corporate Vice President and Director of Human Resources worldwide from 1993 to 1996. Ms. Dyess also serves on the boards of directors of Portland General Electric and Itron, Inc., as well as privately held companies Prolifiq Software, Inc. and Compli, Inc.
Ms. Dyess’ experience directing Intel’s private equity investments in technology companies and her experience as a global human resources executive are strong qualifications for membership on the Board.
Peter Frank, 67, was appointed as a director in April 2010. In 2011, Mr. Frank joined Black Diamond Capital Management, L.L.C. where he is currently a Senior Managing Director. From 2010 to 2011, he served as President and Senior Managing Director of GSC Group, which he joined in 2001. In addition, Mr. Frank was a member of the investment committees for GSC Group’s Recovery Funds, European Corporate Debt and European Mezzanine Funds. From 2008 to 2010, he served as Senior Managing Director and Co-Head of Corporate Credit and Distressed Investment Group for GSC Group. From 2005 until 2008, he served as the Senior Operating Executive for GSC Group’s Recovery Funds and from 2001 to 2004, he served as a consultant for GSC Group. GSC Group filed for Chapter 11 bankruptcy protection in 2010. Prior to 2001, Mr. Frank was the Chief Executive Officer of Ten Hoeve Bros., Inc. and was an investment banker at Goldman, Sachs & Co. He serves on the boards of directors of several privately held companies.
Mr. Frank’s private equity, investment banking and capital markets experience coupled with his active oversight experience with other companies as a chairman and member of the board of directors qualify him to serve on the Board.
Jack D. Furst, 56, was a director of the Company from 1996 to February 2003 and resumed his position as a director of the Company in February 2005. Mr. Furst is the founder of his own private investment firm, Oak Stream Investors, which he started in 2009. He had been affiliated with HM Capital Partners LLC (“HM Capital”), a private equity firm, since 1989, the year in which it was formed (as Hicks, Muse, Tate & Furst, Incorporated). Until 2008, he was a Partner in HM Capital and was involved in all aspects of the firm’s business, including originating, structuring and monitoring HM Capital’s investments. From 2008 to 2013, Mr. Furst maintained an affiliation with HM Capital. Mr. Furst has over 25 years of experience in leveraged acquisitions and private investments. Prior to joining HM Capital, Mr. Furst served as a Vice President and subsequently a Partner of Hicks & Haas from 1987 to 1989. From 1984 to 1986, Mr. Furst was a merger and acquisitions/corporate finance specialist for The First Boston Corporation in New York. Before joining First Boston, Mr. Furst was a Financial Consultant at PricewaterhouseCoopers.
98
Table of Contents
Mr. Furst has been engaged with the Company since its inception in 1996 and has extensive experience with several manufacturers of electronic components which allow him to provide us a unique breadth of knowledge in the industry and of the Company. In addition, Mr. Furst has extensive capital markets experience, including mergers and acquisitions and private-to-public transitions, which is a valuable qualification for service on the Board.
Edward Herring, 44, has been a director since August 2006. Mr. Herring is the founder of a private investment firm, Tailwater Capital LLC, which was started in 2013. Prior to founding Tailwater Capital, he had been affiliated with HM Capital since 1998, where he was a Partner until 2012. Mr. Herring currently serves as a director of several privately held companies, including Align Midstream Partners LP, Pivotal Petroleum Partners LP, TW SWD & Solids Holdco LP, TSL Holdings I LP, and Southcross Holdings LP. Mr. Herring previously served as a director of Regency Energy Partners LC and Swift & Company. From 1996 to 1998, Mr. Herring attended Harvard Business School and earned a Masters in Business Administration degree. From 1993 to 1996 Mr. Herring was an investment banker with Goldman, Sachs & Co.
Mr. Herring has a long history of involvement with the Company and has a great understanding of the electronics industry. In addition, Mr. Herring’s private equity, investment banking and capital markets experience qualify him to serve as a director of the Company.
William A. Owens, 74, has been a director since August 2012. He has served as the Chairman of AEA Investors (Asia) since April 2006 and has served as Managing Director, Chairman and Chief Executive Officer of AEA Holdings Asia, a New York private equity company at various times since then. Mr. Owens previously served as Vice Chairman, Chief Executive Officer and President of Nortel Networks Corporation, a global supplier of communications equipment, from May 2004 to November 2005. Prior to that, Mr. Owens served as Chairman and Chief Executive Officer of Teledesic LLC, a satellite communications company, from February 1999 to May 2004. During that same period, Mr. Owens also served as Chairman and Chief Executive Officer of Teledesic’s affiliated company, Teledesic Holdings Ltd. From 1996 to 1998, Mr. Owens was President, Chief Operating Officer and Vice Chairman of Science Applications International Corporation (SAIC). Mr. Owens served in the U.S. military from 1962 to 1996, holding various key leadership positions, including Vice Chairman of the Joint Chiefs of Staff. Mr. Owens has also served as Chairman of CenturyLink, Inc. from 2009 to present, as a director of Polycom, Inc. from 2005 to present and as a director of Wipro Limited from 2006 to present, all public companies. He also served as a member of the boards of directors of Daimler Chrysler AG from 2003 until 2009 and of Embarq Corporation from 2006 to 2009.
Mr. Owens’ extensive experience as Chief Executive Officer for communications companies, his board experience with other public companies and his understanding of the military and related industries make him a valued member of the Board.
Dominic J. Pileggi, 63, was appointed as a director in February 2012. He served as Chairman of the board of directors of Thomas & Betts Corporation from 2006 to 2013. From 2004 to 2012, he was Chief Executive Officer of Thomas & Betts Corporation. From 2000 to 2004, Mr. Pileggi held various other senior executive positions with Thomas & Betts Corporation. From 1998 to 2000, he was President of the Electro-Mechanical Solutions Division of the Company. From 1995 to 1998, he held senior executive positions with Casco Plastic, Inc. and Jordan Telecommunications. Mr. Pileggi held various executive positions with Thomas & Betts Corporation from 1979 through 1994. He also served as a director of Exide Corporation and is currently a director of Acuity Brands, Inc. and served as a director of the Lubrizol Corporation from 2005 to 2011.
Mr. Pileggi’s experience as Chief Executive Officer of Thomas & Betts Corporation and his knowledge of the electronics industry are valuable qualifications for his membership on the Board.
David M. Sindelar, 57, has been a director since August 2001 and Chief Executive Officer of the Company since July 2001. He also served as our Senior Vice President and Chief Financial Officer from January 1997 through June 2001. Previously, Mr. Sindelar served as Chief Executive Officer and director of International Wire Group, Inc. Mr. Sindelar also served as Senior Vice President and Chief Financial Officer of Berg Electronics Corp. International Wire Group, Inc. and certain of its subsidiaries filed a bankruptcy petition in May 2004.
Mr. Sindelar’s experience as Chief Executive Officer and Chief Financial Officer of our Company and other companies in the electronics industry are valuable qualifications for his role on the Board.
99
Table of Contents
Christopher J. Steffen, 73, has been Chairman of the Board since December 2003 and a director since October 2003. Mr. Steffen also currently serves as a director of W. R. Grace & Co. and Platinum Underwriters Holdings, Ltd. From 2004 to 2012, he served as a director of Accelrys, Inc. From 2002 to 2010, he served as an advisor to Wall Street Management and Capital, Inc., a boutique business financial advisory firm. From 1993 to 1996, Mr. Steffen served as the Vice Chairman and director of Citicorp and its principal subsidiary, Citibank, N.A. In 1993, he served as Senior Vice President and Chief Financial Officer of Eastman Kodak. From 1989 to 1993, Mr. Steffen served as Executive Vice President and Chief Financial and Administrative Officer and director of Honeywell, Inc.
Mr. Steffen is well qualified to serve as Chairman of the Board because of his depth of management experience with global manufacturing companies, his experience as a Chief Financial Officer of Honeywell, Inc., and his board experience with large-cap and small-cap companies. As an independent director and non-executive Chairman of the Board, Mr. Steffen promotes discussion, provides effective leadership and maintains a sense of urgency about achieving our goals.
David D. Stevens, 61, has been a director since August 2012. He has been an advisor in private equity since 2006. Mr. Stevens was the Chief Executive Officer of Accredo Health Group, Inc., a subsidiary of Medco Health Solutions, Inc., from 2005 to 2006. He was the Chairman of the Board and Chief Executive Officer of Accredo Health, Inc. from 1996 to 2005. Mr. Stevens was the President and Chief Operating Officer of the predecessor companies of Accredo Health from their inception in 1983 until 1996. Mr. Stevens has been a director of the board of Wright Medical Group, Inc. since 2004 and of Allscripts Healthcare Solutions, Inc. since 2012, both of which are public companies. He served as a member of the boards of directors of Thomas & Betts Corporation from 2004 to May 2012 and of Medco Health Solutions, Inc. from 2006 to April 2012.
Mr. Stevens’ experience as Chief Executive Officer of Accredo Health Group, Inc. and his board experience are strong qualifications for membership on the Board.
Non-Director Executive Officers
Gerald G. Sax, 54, has been the Senior Vice President and Chief Financial Officer of the Company since August 2005. Mr. Sax served as Senior Vice President-Supply Chain from February 2003 to August 2005. He also served as our Senior Vice President-Europe from July 1999 to January 2003. Mr. Sax joined us in November 1998 as Vice President-Corporate Controller. Prior to joining us, Mr. Sax was Vice President-Corporate Controller for Berg Electronics Corp. from September 1995 to October 1998.
Brian W. Barber, 59, has been the Senior Vice President Operations Printed Circuit Board & Supply Chain Management of Viasystems since December 2007. From November 2000 to December 2007, Mr. Barber was Vice President Operations Printed Circuit Boards/Electro-Mechanical Solutions, Americas, and from January 2000 to October 2000, Mr. Barber was Vice President Printed Circuit Board Operations. Prior to joining Viasystems in 2000, Mr. Barber had been employed by Hadco Corporation since 1982 serving as Vice President and Business Unit Manager of its high technology operation.
Richard B. Kampf, 59, has been the Senior Vice President of Sales & Marketing since December 2007. From November 2002 to December 2007, Mr. Kampf was Vice President of Sales & Marketing, and from March 2000 to October 2002, Mr. Kampf was Vice President of Sales & Marketing for Viasystems Printed Circuit Board, Americas. Mr. Kampf joined us in April 1999, as Director of Sales for the Americas. Prior to joining our Company, Mr. Kampf had over 18 years of experience in the electronics industry with companies such as Marshall Industries, where he was Vice President of Sales, and Thomas & Betts Corporation, where he was Vice President of Sales & Marketing.
CORPORATE GOVERNANCE
Viasystems is committed to maintaining the highest standards of business conduct and corporate governance, which we believe are essential to running our business efficiently, serving our stockholders well and maintaining the Company’s integrity in the marketplace.
100
Table of Contents
Board Leadership Structure and Role in Risk Oversight
We believe that the composition of the Board results in a strong leadership structure for the Company. The Chairman of the Board provides leadership to the Board and works with the Board to define its structure and activities in the fulfillment of its responsibilities. Pursuant to the Company’s Corporate Governance Guidelines and Principles (the “Guidelines”), the Board has independent leadership in the form of an independent Chairman. The Board adopted this structure to promote decision-making and governance independent of that of our management and to better perform the Board’s monitoring and evaluation functions. Mr. Steffen has served as the Chairman of the Board since 2003.
The Board has established a policy that its non-employee directors meet regularly in executive session, without members of management present. If any of the non-employee directors do not qualify as an independent director, as set forth in the Guidelines, one or more additional executive sessions will be held annually, attended only by independent directors. The independent Chairman presides over the executive sessions.
We believe that the foregoing structure, policies and practices, when combined with the Company’s other governance policies and procedures, provide the best opportunities for oversight, discussion and evaluation of decisions and direction from the Board.
The Board maintains oversight responsibility for the management of the Company’s risks, and oversees an enterprise-wide approach to risk management, designed to provide a holistic view of organizational objectives, including strategic objectives, to improve long-term organizational performance, to prioritize and manage identified risks, and to enhance stockholder value. A fundamental part of risk management is not only understanding the risks the Company faces and what steps management is taking to manage those risks, but also understanding what level of risk is appropriate for the Company. The Board regularly invites key members of the Company’s management to its meetings in order to inform the Board of any operational and/or financial risks that the Company is facing, and the Board reviews and directs management to address and mitigate such risks. In addition, the Board has designated the Audit Committee as the committee primarily responsible for supervising the establishment and implementation of risk management systems and reviewing the effectiveness of those systems. The Company has also adopted a Risk Management Policy that seeks to provide a framework to guide and assist management, under the supervision of the Audit Committee, in mitigating various risks. Our Risk Management Policy requires that the Audit Committee actively monitor the Company’s risk profile and confirm that management has implemented an effective system of internal control. Our Risk Management Policy addresses various types of risk, including enterprise risk, financial risk, operational risk, information technology risk, occupational health and safety risk and sustainability risk. Our Risk Management Policy is available on the Company’s website at www.viasystems.com.
In addition, as part of its oversight of the Company’s executive compensation program, the Compensation Committee considers the impact of the Company’s executive compensation program, and the incentives created by the compensation awards that it administers, on the Company’s risk profile. The Compensation Committee reviews all of its compensation policies and procedures, including the incentives that they create and factors that may reduce the likelihood of excessive risk taking, to determine whether they present a significant risk to the Company. Based on this review, the Compensation Committee has determined that the Company does not utilize compensation policies or practices that create risks that are reasonably likely to have a material adverse effect on the Company.
Corporate Governance Policies
In addition to our Third Amended and Restated Certificate of Incorporation and Second Amended and Restated Bylaws, we have adopted the Guidelines, which are posted on our website at www.viasystems.com, to address significant corporate governance matters. The Guidelines provide a framework for the Company’s corporate governance and cover topics including director responsibilities, executive sessions and independent Board leadership, formal evaluation of the Chief Executive Officer, director qualification standards, director orientation and continuing education and committees of the Board. The Nominating and Corporate Governance Committee is responsible for overseeing and reviewing the Guidelines and reporting and recommending to the Board any changes to the Guidelines.
The Company has a Code of Business Conduct and Ethics (the “Code of Conduct”) applicable to all employees, officers and directors, including the principal executive officer, principal financial officer and principal accounting officer, that addresses legal and ethical issues employees may encounter in carrying out their duties and responsibilities. Subject to applicable law, employees are required to report any conduct they believe to be a violation of the Code of Conduct. The Code of Conduct is posted on the Company’s website at www.viasystems.com. The Company has also adopted a Supplemental Code of Ethics (the “Supplemental Code”) applicable to its Chief Executive Officer, Chief Financial Officer and other senior officers of Viasystems. The Supplemental Code is posted on the Company’s website at www.viasystems.com. The Company intends to post on its website amendments to, and waivers from, the Supplemental Code that require disclosure under applicable SEC rules.
101
Table of Contents
Director Independence
In accordance with the rules of the NASDAQ, the Board makes an annual determination as to the independence of the directors and nominees for election as a director. No director will be deemed to be independent unless the Board affirmatively determines that such director has no relationship that, in the opinion of the Board, would interfere with the exercise of his or her independent judgment in carrying out the responsibilities of a director. The Board observes all criteria for independence established by the NASDAQ listing standards and other governing laws and regulations. In addition, the Board consults with the Company’s counsel to ensure that the Board’s determinations are consistent with all relevant securities and other laws and regulations regarding the definition of “independent director,” including to those set forth in pertinent listing standards of the NASDAQ in effect from time to time. The Company’s policy on director independence is included in the Guidelines and is available on our website at www.viasystems.com.
As a result of its annual review of director independence, the Board has determined that Messrs. Burger, Cummings, Owens, Pileggi, Steffen and Stevens and Ms. Dyess are independent directors. Messrs. Sindelar and Conlon are not independent because they are employees of the Company. Messrs. Herring and Furst are not independent because each previously, within the past 3 years, held a direct or indirect interest in one of the institutional investors that beneficially owns a significant number of shares of common stock in the Company (hereinafter referred to as “Shares”), and may have been deemed to have voting and dispositive power over such Shares. Mr. Frank is not independent because he holds a direct interest in one of the institutional investors that beneficially owns a significant number of Shares.
Board Meetings and Committees
The Board held eight meetings during 2014. In addition to meetings of the full Board, directors attended meetings of individual Board committees. Each director who served during 2014 attended at least 75% of the total number of meetings of the Board and committees on which he or she serves. The Company does not have a policy with regard to directors’ attendance at the annual meeting of stockholders. All of the then-current directors attended Viasystems’ 2014 annual meeting of stockholders, except Mr. Furst.
The Board has established four standing committees: the Audit Committee, the Compensation Committee, the Nominating and Corporate Governance Committee and the Executive Committee. The Audit, Compensation, Nominating and Corporate Governance and Executive Committees operate under written charters adopted by the Board. All of the committee charters are available on the Company’s website at www.viasystems.com.
Audit Committee. The Audit Committee assists the Board in overseeing (i) the integrity of our financial statements, (ii) our compliance with legal, ethical and regulatory requirements, (iii) the independence, qualifications, engagement, compensation and performance of our independent registered public accounting firm, (iv) the performance of our internal audit function, (v) our systems of internal control over financial reporting, (vi) risk management and (vii) application of our related person transaction policy. The Audit Committee currently consists of Messrs. Burger, Owens, Pileggi, Steffen and Stevens. Mr. Steffen currently serves as the Interim Chairman of the Audit Committee. The Board has determined that each of the members of our Audit Committee is independent under the applicable provisions of the Securities Exchange Act of 1934, as amended (the “Exchange Act”), and the NASDAQ rules. The Board has also determined that Mr. Stevens meets the requirements of an audit committee financial expert. The Audit Committee held five meetings during 2014.
Compensation Committee. The Compensation Committee (i) reviews and approves the compensation of our executive officers and other key employees, (ii) evaluates the performance of our Chief Executive Officer and oversees the performance evaluation of senior management and (iii) administers and makes recommendations to the Board with respect to incentive-compensation plans, equity-based plans and other compensation benefit plans. The Compensation Committee currently consists of Messrs. Cummings, Pileggi, Steffen and Stevens and Ms. Dyess. Ms. Dyess is the Chairman of the Compensation Committee. The Compensation Committee held five meetings during 2014. The Board has determined that each of the members of our Compensation Committee is independent under the applicable provisions of the Exchange Act and the NASDAQ rules.
102
Table of Contents
Nominating and Corporate Governance Committee. The Nominating and Corporate Governance Committee assists the Board in (i) identifying and recommending candidates to fill vacancies on the Board and for election by the stockholders, (ii) recommending committee assignments for directors to the Board, (iii) monitoring and assessing the performance of the Board and individual non-employee directors, reviewing compensation received by directors for service on the Board and its committees and (iv) developing and recommending to the Board appropriate corporate governance policies, practices and procedures. The Nominating and Corporate Governance Committee currently consists of Messrs. Burger, Cummings, Owens and Steffen and Ms. Dyess. Mr. Steffen is the Chairman of the Nominating and Corporate Governance Committee. The Nominating and Corporate Governance Committee held one meeting during 2014.
Executive Committee. The Executive Committee acts on routine matters of the Board when the Board is not in session. The Executive Committee currently consists of Messrs. Cummings, Furst, Sindelar and Steffen. The Executive Committee held no meetings during 2014.
Compensation Committee Interlocks and Insider Participation
During 2014, no member of the Compensation Committee was an officer or employee of our Company or any of our subsidiaries. In addition, none of our executive officers served on the board of directors or on the Compensation Committee of any other entity, for which any executive officers of such other entity served either on our Board or on our Compensation Committee.
Director Nomination Process
There have been no material changes to the procedures by which the Company’s security holders may recommend nominees to the Board during 2014.
SECTION 16(a) BENEFICIAL OWNERSHIP REPORTING COMPLIANCE
Section 16(a) of the Exchange Act requires that the Company’s directors and executive officers and persons who own more than ten percent of the outstanding Shares file with the SEC (and provide a copy to the Company) certain reports relating to their ownership of Shares.
To the Company’s knowledge, all Section 16(a) filing requirements were met on a timely basis during 2014.
103
Table of Contents
| Item 11. | Executive Compensation |
Compensation Discussion and Analysis
This section of the disclosure describes our current and past compensation philosophies, policies and programs with respect to the compensation of our named executive officers: our Chief Executive Officer, Chief Financial Officer and our three other most highly compensated executive officers for 2014.
Compensation Philosophy and Objectives
The compensation programs are designed to remunerate executives in accordance with a pay-for-performance philosophy. As such, the compensation programs are intended to provide incentives to our executives and other employees to maximize stockholder value, which in turn affects the overall compensation earned by our management.
The Compensation Committee has adopted compensation programs designed to achieve the following key objectives:
| • | attract, motivate and retain superior talent; |
| • | encourage high performance and promote accountability; |
| • | ensure that compensation is commensurate with our annual performance; and |
| • | provide performance awards for the achievement of financial and operational targets and strategic objectives that are critical to our long-term growth. |
Compensation Committee’s Role in Establishing Compensation
The Compensation Committee administers our executive compensation program. The role of the Compensation Committee is to oversee our compensation and benefit plans and policies, administer our equity-based plans, and review and approve annually all compensation decisions relating to our senior executive officers. The Compensation Committee regularly reviews all of our compensation policies, including policies and strategy relating to executive recruitment, retention and compensation, as well as the appropriate mix of base salary, short-term cash-based incentive compensation and long-term incentive compensation for our senior executives. The Compensation Committee also reviews and approves all elements of compensation for each of our named executive officers, including the Chief Executive Officer, taking into consideration our performance, the performance of each respective internal organization for which the executive is responsible, as well as information regarding compensation levels for senior executives in our comparator group described below.
Management’s Role in Establishing Compensation
Our Chief Executive Officer makes compensation recommendations to the Compensation Committee on all named executive officers (other than himself) based on information he gathers including industry resources, benchmark data and other peer compensation information gathered in response to requests from the Compensation Committee. Notwithstanding the input from the Chief Executive Officer, the Compensation Committee ultimately determines the compensation of our named executive officers during their meetings in executive session, without any members of management present. In addition, based on the policies and strategies set by the Compensation Committee, our Chief Executive Officer, President and Chief Operating Officer, and Chief Financial Officer set salaries and incentive compensation opportunities for the respective employees who report to them. The Chief Executive Officer submits recommendations to the Compensation Committee with respect to equity incentive compensation for all of our employees.
Advisor to the Compensation Committee
The Compensation Committee has the ability to engage the services of an outside consultant if it believes it would be effective to do so. For 2014, the Compensation Committee selected Meridian Compensation Partners, LLC (“Meridian”) as its executive compensation advisor. In 2014, Meridian advised the Compensation Committee with respect to its compensation decisions for all of our executive officers and directors, including the Chief Executive Officer. Meridian reported directly to the Compensation Committee and only provided services that were requested and authorized by the Compensation Committee. Based on a review of its engagement of Meridian and consideration of factors set forth in SEC rules, the Compensation Committee determined that Meridian’s work did not raise any conflicts of interest.
104
Table of Contents
Review of Compensation Program
In developing an annual compensation program for our executive officers, including the grants of incentive based compensation, the Compensation Committee considers each executive’s historical performance, our overall performance, the level of responsibility managed by each executive, the skills and experience of each executive, and other performance-based measures. The Compensation Committee also considers market data to evaluate whether changes to the compensation program and pay levels of our executive officers may be appropriate.
The Compensation Committee does not have any formal policies or guidelines for allocating compensation between long-term and short-term compensation or among the different forms of compensation. This is due to the Compensation Committee’s desire to maintain flexibility to tailor executive compensation to attract and retain top-flight executives.
Benchmarking and Comparator Group
In February 2014, the Compensation Committee reviewed a compensation study for senior executives of similarly situated companies prepared by Meridian, which included an analysis of a peer group of companies’ senior executive compensation. With the impending merger with TTM awaiting approval from various regulatory agencies, the Company determined not to refresh this exercise in February, 2015. The following companies comprised the 2014 comparator group of publicly-traded companies specific to our industry with varying annual revenues:
2014 Compensation Program
The Compensation Committee established individual executive compensation for 2014 at levels the Compensation Committee believed were comparable with executives of other companies of similar size and stage of development, operating in similar markets, taking into account our performance and strategic goals. To evaluate proposed base salary changes and incentive award compensation for 2014, the Compensation Committee reviewed the Meridian survey, which summarized compensation data from the comparator group. Based on this review, the Compensation Committee determined that the cash compensation (base salary and short-term incentives) paid to each of our named executive officers was in line with the market median range of the senior executives of companies in the comparator group. The Compensation Committee approved a 3% salary raise and a 5% potential bonus raise for each of Messrs. Sax, Barber and Kampf on February 4, 2014.
In 2011, the Compensation Committee established a non-qualified deferred compensation plan for all senior executives of the Company that allows senior executives, including the named executive officers, to earn an additional 3% of the cash compensation they receive over $260,000 as deferred compensation to be held by the Company in trust. The plan allows senior executives to defer other cash compensation to be held by the Company in trust until such senior executive’s retirement or termination of employment with the Company.
In establishing 2014 compensation for our Chief Executive Officer, the Compensation Committee determined that the incentives provided to him should include both non-equity, cash-based incentive opportunities and long-term equity-based incentive opportunities. The cash-based incentive opportunities were conditioned upon i) the achievement of quantifiable metrics of our financial performance as measured by Adjusted EBITDA and ii) certain other defined “management by objective” goals. The equity-based incentive opportunities were in the form of performance share units conditioned upon the future performance of the Company’s stock price. These incentives are intended to align the Chief Executive Officer’s interests with those of the stockholders of the Company.
105
Table of Contents
Elements of Our 2014 Executive Compensation Program
In 2014, the total compensation of our executive officers was comprised of all of the following:
| • | base salary; |
| • | annual incentive compensation; |
| • | long-term equity-based incentive awards; |
| • | employee benefits and perquisites; and |
| • | severance benefits. |
Base Salary. Base salaries provide executives with a predictable level of income. The Compensation Committee generally establishes base salaries for executives after consideration of the following criteria: (i) the scope of their responsibilities, (ii) level of experience and individual performance, (iii) external competitiveness, and (iv) internal fairness considerations. The goal for the base salary component of our executive compensation is to compensate them at a level that approximates the median salaries of individuals in comparable positions at companies in the comparator group. Base salaries of the named executive officers are reviewed annually by the Compensation Committee and may be adjusted from time to time at the Compensation Committee’s discretion.
Annual Incentive Compensation Plan. Our Annual Incentive Compensation Plan (“AICP”) is designed to motivate executives to achieve individual and business unit performance objectives. In February 2014, the Compensation Committee established annual target awards under our AICP for each of our executive officers. Target incentive compensation opportunities for each executive were established as a percentage of each individual’s base salary. Payments to our executive officers under the AICP were subject to achievement of the Company’s financial objectives and individual nonquantitative management by objective (“MBO”) goals. The Compensation Committee has reserved the right to use its discretion outside of the parameters set forth by the Committee when issuing such awards.
For 2014, the Compensation Committee selected “Adjusted EBITDA” as the quantitative measurement of the Company’s financial performance for the AICP. The Compensation Committee selected this measure because it facilitates performance comparisons from period to period and company to company by excluding from the calculation of earnings before interest, taxes, depreciation and amortization (“EBITDA”) expenses that the Compensation Committee believes are not indicative of the Company’s ongoing operating results or which do not impact future operating cash flows. The adjustments to EBITDA to arrive at Adjusted EBITDA include (i) restructuring and impairment charges, (ii) loss on early extinguishment of debt, (iii) stock compensation (iv) costs associated with acquisitions and equity registrations and (v) other net. Adjusted EBITDA is not a recognized financial measure under U.S. generally accepted accounting principles and does not purport to be an alternative to operating income or an indicator of operating performance. In prior years, Adjusted EBITDA was measured based on Viasystems’ consolidated financial results for all AICP participants. For 2014, the Compensation Committee elected to more closely align the financial performance goals for each AICP participant with their individual responsibilities, and the Compensation Committee set financial and other targets for certain sub-sections of our business and each participant was provided such target goals based on one or a combination of these measurements. However, most of our senior executives were provided a target based on the Adjusted EBITDA performance of the Company as a whole.
For the Company’s named executive officers, the Compensation Committee determined that the AICP performance measures should be weighted 85% for the Company’s financial performance measured against the Adjusted EBITDA target set by the Compensation Committee (“Financial Performance Bonus”) and 15% for the achievement of individual MBO goals. For 2014, Mr. Sindelar, Mr. Conlon, Mr. Sax and Mr. Kampf’s Financial Performance Bonus was based on the whole-company consolidated Adjusted EBITDA results which was deemed by the Compensation Committee to be the most consistent with their responsibilities. For 2014, Mr. Barber’s Financial Performance Bonus was based i) three-quarters on the whole-company consolidated Adjusted EBITDA results and ii) one-quarter on the Printed Circuit Boards segment Adjusted EBITDA results which was deemed by the Compensation Committee to be the most consistent with Mr. Barber’s responsibilities.
106
Table of Contents
The Compensation Committee created a formula for a graduated scale of projected incentive payments that would be made to the AICP participants based on the actual Adjusted EBITDA achieved as compared to the target. The graduated scales, as set out below, allow the Compensation Committee to calculate the incentive compensation that is to be paid pursuant to our AICP as a function of Adjusted EBITDA. The Adjusted EBITDA target for 2014 was set by the Compensation Committee at $152.0 million.
The following table demonstrates the potential percentage of the incentive compensation opportunity that each named executive officer whose Financial Performance Bonus was based solely on whole-company consolidated Adjusted EBITDA results would have been paid based on achievement of certain levels of Adjusted EBITDA targets for 2014:
| Whole Company Consolidated Adjusted EBITDA Performance ($ in millions) |
% of Adjusted EBITDA Target Achieved |
Named Executive Officer Bonus Based on Adjusted EBITDA |
Named Executive Officer Bonus Based on Individual Goals |
Named Executive Officer Potential Bonus |
||||||||||
| Below $128.0 | Below 84.2% | 0.00 | % | 15.0 | % | 15.00 | % | |||||||
| 128.0 | 84.2 | 42.50 | 15.0 | 57.50 | ||||||||||
| 130.0 | 85.5 | 53.12 | 15.0 | 68.12 | ||||||||||
| 136.8 | 90.0 | 63.75 | 15.0 | 78.75 | ||||||||||
| 144.4 | 95.0 | 74.38 | 15.0 | 89.38 | ||||||||||
| 152.0 | 100.0 | 85.00 | 15.0 | 100.00 | ||||||||||
| 159.6 | 105.0 | 110.00 | 15.0 | 125.00 | ||||||||||
| 167.2 | 110.0 | 135.00 | 15.0 | 150.00 | ||||||||||
| 174.8 | 115.0 | 160.00 | 15.0 | 175.00 | ||||||||||
| 182.4 | 120.0 | 185.00 | 15.0 | 200.00 | ||||||||||
The Compensation Committee determined that each of the Named Executive Officers had achieved his MBO goals. In addition the Compensation Committee reviewed the financial results of the Company and determined that the whole-company consolidated had achieved Adjusted EBITDA of approximately $163.9 million resulting in a bonus of approximately 139.1% of the potential bonus award for each of Messrs. Sindelar, Conlon, Sax, Barber and Kampf. In addition, all employees participating in the AICP received a bonus based on the Company’s performance combined with the respective performance of each individual business unit that such individuals’ bonuses were measured against.
Equity Incentive Awards. The Compensation Committee oversees the administration of our 2003 Stock Option Plan (the “2003 Plan”) and our 2010 Equity Incentive Plan (the “2010 Plan”). The Compensation Committee awards equity incentive grants to qualifying employees at its discretion, but typically the grants are made at the commencement of employment and then annually thereafter. The Compensation Committee uses equity incentive as our primary long-term incentives vehicle because:
| • | equity incentives and the related vesting period help attract and retain executives; |
| • | the value received by the recipient of equity incentives is based on the growth of our enterprise value; and |
| • | equity incentives help to provide a balance to the overall executive compensation program as base salary and the AICP focus on short-term compensation, while equity incentives reward executives for increases in our overall enterprise value. |
In determining the number and type of equity incentives granted to executives in 2014 including our named executive officers, the Compensation Committee takes into account the individual’s position, scope of responsibility, ability to affect profits and stockholder value, and the value of the equity incentives in relation to other elements of the individual executives’ total compensation. In addition, the Compensation Committee has historically considered the recommendations of our Chief Executive Officer.
107
Table of Contents
In February 2014, the Compensation Committee determined the overall senior executive compensation packages were adequate as compared with our peers. The Committee considered the appropriate manner and amount of long term incentive based compensation to provide to the Company’s executive officers under the 2010 Plan and made awards of equity based compensation so that the senior executives compensation packages remain competitive with our peers. Because of the impending merger with TTM the Company did not undertake this review in 2015. For 2014 the Compensation Committee determined the number of Leverage Performance Shares awarded to each of our senior executives such that the intrinsic value of such awards on the grant date was equal to the amount of value the Compensation Committee had determined was appropriate for the long term incentive compensation component of each respective senior executives total compensation package. The Compensation Committee believes that the issuance of equity based compensation serves to further align the interests of our executive officers and stockholders.
In February 2014, in a continuing attempt to further link the interests of the shareholders and the members of management, the Compensation Committee continued its practice of issuing equity-based incentive opportunities to the top 14 executives of the Company in the form of performance share units conditioned upon the future performance of the Company’s stock price (“Leveraged Performance Shares”). The use of Leveraged Performance Shares in 2014 was adopted based on the recommendation of Meridian.
For the 2014 granting, Leveraged Performance Shares provide for payment of the Company’s common stock after the conclusion of a three year graduated vesting period in an amount ranging from 0% to approximately 171% of the number of underlying performance share units awarded to the participant. The amount of common stock earned by each recipient at the end of the vesting period is strictly a function of the market price of the Company’s common stock, as reported by the NASDAQ market, during a measurement period which consists of the calendar year 2017 or if a change of control occurs before January 1, 2018, the higher of (i) the target price of the stock as of the date of the grant, and (ii) the prices of the Company’s stock at the time of the change of control. The performance measure for Leveraged Performance Shares issued in 2014 provides that should the market price of the Company’s common stock price decline by more than 62% (the “Floor”) from the grant date, no shares of common stock will be earned. Should the market price of the Company’s common stock increase by 169% or more (the “Ceiling”) from the grant date, 1.71 shares of the Company’s common stock will be earned for each Leveraged Performance Share granted. The number of shares of common stock earned for performance between the Floor and Ceiling will be determined by straight-line interpolation in accordance with terms of the grant agreements.
One-third of the award vests on each of the first three anniversary dates of the grant date. If a change of control of the Company occurs prior to the end of the vesting period, all of the Leveraged Performance Shares will vest and the stock price used to determine the number of shares to be paid will be the higher of the target price or closing stock price on the date of the change of control. If a recipient’s employment is terminated by the Company, other than for cause, prior to the third anniversary of the grant date, the recipient will be eligible to receive an amount of common stock based on the Leveraged Performance Shares that vested prior to the termination of the recipient’s employment, with such shares paid at the conclusion of the measurement period. If a recipient is terminated for cause before the end of the final vesting period, all Leveraged Performance Shares shall be forfeited.
To better attract and retain key talent, the Compensation Committee determined it would continue the practice that participants in the 2010 Plan below our most senior executives may receive grants of restricted stock and/or stock options. This practice is consistent with Meridian’s advice and broader market practices.
108
Table of Contents
The following table sets forth the number of Leveraged Performance Shares awarded to each named executive officer in 2014:
| Name |
Leveraged Performance Shares (1) |
|||
| David M. Sindelar |
83,150 | |||
| Timothy L. Conlon |
39,307 | |||
| Gerald G. Sax |
24,189 | |||
| Brian W. Barber |
19,654 | |||
| Richard B. Kampf |
19,654 | |||
| (1) | The awards of Leveraged Performance Shares granted in 2014 will fully vest on February 5, 2017. Depending on the achievement of established performance measures, shares of common stock ranging from 0% to 171% of the underlying number of performance share units awarded will be issued. |
For additional information regarding these awards see “—Grants of Plan Based Awards” and “—Outstanding Equity Awards” below.
Employee Benefits. All of our executives are eligible to participate in various benefit plans available generally to our U.S.-based employees, such as medical, dental, vision, long-term and short-term disability, and life insurance. We also offer to executive officers additional perquisites and benefits, such as club dues, paid transportation and parking costs reflected in the All Other Compensation column of the Summary Compensation Table for the named executive officers. Each of the employment agreements with Messrs. Sindelar, Conlon and Sax contains provisions that require us to pay all medical expenses for them and their respective spouses for the remainder of their lifetime and the lifetime of their spouse, subject to certain conditions contained in their respective agreements. See “—Employment Agreements” below for more information. The Compensation Committee believes these benefits and perquisites are reasonable and consistent with our overall compensation program to attract and retain executive talent to key positions.
The Company has defined contribution retirement savings plans (the “Retirement Plans”) covering substantially all of our domestic employees who meet certain eligibility requirements as to age and length of service. The Retirement Plans incorporate the salary deferral provision of Section 401(k) of the Internal Revenue Code. Employees may defer up to 50% of their compensation or the annual maximum limit prescribed by the Internal Revenue Code. The Company matches qualifying employees’ deferrals (the “Matching Contribution”) up to 3% of such employee’s annual eligible compensations up to a maximum of, $7,800 for 2014. The Company may contribute an additional 1% of employees’ salaries to the Retirement Plans regardless of employee deferrals. The Company may also elect to contribute an additional profit-sharing contribution at the end of each year.
Employment and Severance Benefits. We have entered into an employment agreement with each of our named executive officers. These agreements provide for a minimum annual base salary and an annual cash-based incentive compensation opportunity of up to a specified percentage of the executive’s annual base salary, as well as other perquisites and benefits. Entering into such agreements serves to attract and retain talent at the executive level. For additional information about the terms of these employment agreements, see “—Employment Agreements” below. For additional information about the severance benefits provided under these employment agreements, see “—Employment Agreements” and “—Potential Payments Upon Termination or Change in Control” below.
Additionally, the award agreements related to outstanding stock options, restricted stock and performance share units granted to our named executive officers include accelerated vesting provisions that are triggered in the event of a change in control. For additional information about these provisions, see “—2010 Equity Incentive Plan” and “—Potential Payments Upon Termination or Change in Control” below.
Consideration of “Say on Pay” and “Say on Frequency” Voting Results. The Compensation Committee considered the results of the stockholders “say on pay vote” at our 2014 annual meeting of stockholders in making compensation decisions for 2014. Because over 87% of the votes cast approved our compensation program as described in our 2014 proxy statement, the Compensation Committee believes that stockholders generally support our pay for performance philosophy. Therefore, the Compensation Committee continued to apply the same principles in determining the amounts and types of executive compensation through and into 2014.
109
Table of Contents
The Compensation Committee and the Board considered the results of the stockholder “say on frequency” vote at our 2014 annual meeting of stockholders in adopting a frequency policy for future say on pay votes. Because over 62% of votes cast expressed a preference for having a say on pay vote every three years, the Board adopted a policy pursuant to which the Company will conduct a say on pay vote every three years. Therefore, we held a say on pay vote at the 2014 annual meeting. We expect to hold our next say on pay vote and say on frequency vote in 2017. We welcome the input of our stockholders on our compensation policies and compensation program at any time, and not just in the years we conduct a say on pay vote.
COMPENSATION COMMITTEE REPORT
We have reviewed and discussed the Compensation Discussion and Analysis required by Item 402(b) of Regulation S-K with management and, based on that review and those discussions, we recommend to the Board of Directors that the Compensation Discussion and Analysis be included in the Viasystems Group, Inc. Annual Report on Form 10-K for the year ended December 31, 2014.
| Respectfully submitted, |
| THE COMPENSATION COMMITTEE OF THE BOARD OF VIASYSTEMS GROUP, INC. |
| /s/ Kirby A. Dyess |
| Kirby A. Dyess |
| Chairman of the Compensation Committee |
| /s/ Robert F. Cummings, Jr. |
| Robert F. Cummings, Jr. |
| Member of the Compensation Committee |
| /s/ Dominic J. Pileggi |
| Dominic J. Pileggi |
| Member of the Compensation Committee |
| /s/ Christopher J. Steffen |
| Christopher J. Steffen |
| Member of the Compensation Committee |
| /s/ David D. Stevens |
| David D. Stevens |
| Member of the Compensation Committee |
110
Table of Contents
Summary Compensation Table
The following table shows information regarding the compensation earned during the fiscal years ended December 31, 2014, 2013 and 2012, by our Chief Executive Officer, Chief Financial Officer and our three other highest compensated executive officers.
SUMMARY COMPENSATION TABLE
| Name and Principal Position |
Fiscal Year |
Salary | Bonus | Stock Awards (1) |
Option Awards (1) |
Nonequity Incentive Plan Compensation (2) |
Change in Pension Value and Nonqualified Deferred Compensation Earnings |
All Other Compensation (3) |
Total | |||||||||||||||||||||||||||
| David M. Sindelar, |
2014 | $ | 920,000 | $ | — | $ | 1,237,272 | $ | — | $ | 1,280,010 | $ | 3,835 | $ | 193,122 | $ | 3,634,239 | |||||||||||||||||||
| 2013 | 920,000 | — | 2,443,922 | — | — | 19,108 | 273,351 | 3,656,381 | ||||||||||||||||||||||||||||
| 2012 | 920,000 | — | 1,833,343 | 872,295 | 626,704 | 8,491 | 259,322 | 4,520,155 | ||||||||||||||||||||||||||||
| Timothy L. Conlon, |
2014 | $ | 550,000 | $ | — | $ | 584,888 | $ | — | $ | 765,233 | $ | (4,444 | ) | $ | 731,143 | $ | 2,626,820 | ||||||||||||||||||
| 2013 | 550,000 | — | 1,155,343 | — | — | 15,641 | 927,294 | 2,648,278 | ||||||||||||||||||||||||||||
| 2012 | 550,000 | — | 866,662 | 412,363 | 374,660 | 6,920 | 714,725 | 2,925,330 | ||||||||||||||||||||||||||||
| Gerald G. Sax, |
2014 | $ | 412,116 | $ | — | $ | 359,932 | $ | — | $ | 398,728 | $ | 5,526 | $ | 61,759 | $ | 1,238,061 | |||||||||||||||||||
| 2013 | 399,791 | — | 710,986 | — | — | 5,117 | 67,352 | 1,183,246 | ||||||||||||||||||||||||||||
| 2012 | 384,758 | — | 533,332 | 253,756 | 170,363 | 2,798 | 68,676 | 1,413,683 | ||||||||||||||||||||||||||||
| Brian W. Barber, |
2014 | $ | 352,169 | $ | — | $ | 292,452 | $ | — | $ | 340,729 | $ | 3,136 | $ | 500,466 | $ | 1,488,952 | |||||||||||||||||||
| 2013 | 341,600 | — | 577,680 | — | — | 8,048 | 698,843 | 1,626,171 | ||||||||||||||||||||||||||||
| 2012 | 328,800 | — | 433,348 | 206,177 | 145,586 | 1,814 | 498,405 | 1,614,130 | ||||||||||||||||||||||||||||
| Richard B. Kampf, |
2014 | $ | 352,169 | $ | — | $ | 292,452 | $ | — | $ | 340,729 | $ | 3,552 | $ | 41,105 | $ | 1,030,007 | |||||||||||||||||||
| 2013 | 341,600 | — | 577,680 | — | — | 4,144 | 39,446 | 962,870 | ||||||||||||||||||||||||||||
| 2012 | 328,800 | — | 433,348 | 206,177 | 145,586 | 2,192 | 37,716 | 1,153,819 | ||||||||||||||||||||||||||||
| (1) | Represents the aggregate grant date fair value of the restricted stock and stock option awards granted to our named executive officers. The dollar amounts were computed in accordance with Financial Accounting Standards Board Accounting Standards Codification Topic 718, Compensation-Stock Compensation (“ASC Topic 718”), as required by SEC regulations, and exclude the impact of estimated forfeitures related to service-based vesting conditions. See note 15 in Part II to the consolidated financial statements in this annual report on Form 10-K for a description of the assumptions used in determining the accounting expense associated with these awards. |
| (2) | Represents cash awards under the Company’s annual incentive compensation plan, for the year in which the award was earned, not the year in which the award was paid. |
| (3) | Includes compensation as described under “All Other Compensation” below. |
111
Table of Contents
All Other Compensation
The table below sets forth the components of compensation for 2014 included in the All Other Compensation column in the Summary Compensation Table above.
| Name |
Car Allowance (1) |
401(k) Match |
Nonqualified Deferred Compensation Employer Contribution |
Life Insurance Premiums |
Foreign Tax Payments (2) |
Financial Consulting (3) |
Club Dues (4) |
Medical Premiums |
Other | Total | ||||||||||||||||||||||||||||||
| David M. Sindelar |
$ | 33,994 | $ | 7,800 | $ | 47,400 | $ | 7,984 | $ | — | $ | 31,184 | $ | 34,189 | $ | 1,317 | $ | 29,252 | (6) | $ | 193,122 | |||||||||||||||||||
| Timothy L. Conlon (5) |
22,663 | 7,800 | 25,200 | 10,372 | 229,738 | 31,400 | 12,001 | 1,317 | 390,652 | (7) | 731,143 | |||||||||||||||||||||||||||||
| Gerald G. Sax |
12,834 | 7,800 | 13,159 | 5,386 | — | 5,833 | 15,285 | 911 | 550 | (8) | 61,759 | |||||||||||||||||||||||||||||
| Brian W. Barber (5) |
11,858 | 7,040 | 10,110 | 1,894 | 175,063 | 24,123 | 3,572 | 1,431 | 265,375 | (9) | 500,466 | |||||||||||||||||||||||||||||
| Richard B. Kampf |
10,840 | 7,679 | 10,110 | 1,894 | — | — | 9,150 | 1,431 | — | 41,105 | ||||||||||||||||||||||||||||||
| (1) | Includes tax payments on car allowance as follows: Mr. Sindelar ($13,598), Mr. Conlon ($9,065), Mr. Sax ($5,134), Mr. Barber ($4,743) and Mr. Kampf ($4,336). |
| (2) | Includes tax payments related to foreign assignments as follows: Mr. Conlon ($223,307) and Mr. Barber ($123,535). |
| (3) | Includes tax payments for certain financial consulting services as follows: Mr. Sindelar ($11,458), Mr. Conlon ($12,560), Mr. Sax ($2,333) and Mr. Barber ($9,649). |
| (4) | Includes tax payments for certain club dues as follows: Mr. Sindelar ($9,945), Mr. Sax ($5,954) and Mr. Kampf ($3,500). |
| (5) | All or a substantial portion of the perquisites were paid in Hong Kong dollars at an exchange rate of approximately US$1 to HK$7.80. |
| (6) | Includes $12,794 for entertainment, $8,358 for out of pocket medical costs and $8,100 for charitable contributions. |
| (7) | Includes $307,252 for housing and other expenses related to living in Hong Kong, $32,170 for spousal-related travel expenses, $43,594 for transportation in Hong Kong and $7,636 for out of pocket medical costs. |
| (8) | Includes $350 for out of pocket medical costs and $200 for charitable contributions. |
| (9) | Includes $205,025 for housing and other expenses related to living in Hong Kong, $18,674 for spousal-related travel expenses and $41,677 for transportation in Hong Kong. |
Grants of Plan-Based Awards
The following table sets forth certain information with respect to grants of plan-based awards for the year ended December 31, 2014, to our Chief Executive Officer, Chief Financial Officer and our three other highest compensated executive officers.
2014 GRANTS OF PLAN-BASED AWARDS
| Board Action/ |
Estimated Future Payouts Under Non-Equity Incentive Plan Awards (1) |
Estimated Future Payouts Under Equity Incentive Plan Awards (2) |
All Other Stock Awards: Number of Shares of Stock |
All Other Option Awards: Number of Securities |
Exercise or Base Price of Option |
Grant Date Fair Value of Stock and Option |
||||||||||||||||||||||||||||||||||||||
| Name |
Grant Date |
Threshold ($) |
Target ($) |
Maximum ($) |
Threshold (#) |
Target (#) |
Maximum (#) |
or Units |
Underlying Options |
Awards ($/Share) |
Awards (3) ($) |
|||||||||||||||||||||||||||||||||
| David M. Sindelar |
02/04/2014 | — | 920,000 | 1,840,000 | — | 83,150 | 142,187 | — | — | — | 1,237,272 | |||||||||||||||||||||||||||||||||
| Timothy L. Conlon |
02/04/2014 | — | 550,000 | 1,100,000 | — | 39,307 | 67,215 | — | — | — | 584,888 | |||||||||||||||||||||||||||||||||
| Gerald G. Sax |
02/04/2014 | — | 289,240 | 578,480 | — | 24,189 | 41,364 | — | — | — | 359,932 | |||||||||||||||||||||||||||||||||
| Brian W. Barber |
02/04/2014 | — | 247,170 | 494,340 | — | 19,654 | 33,609 | — | — | — | 292,452 | |||||||||||||||||||||||||||||||||
| Richard B. Kampf |
02/04/2014 | — | 247,170 | 494,340 | — | 19,654 | 33,609 | — | — | — | 292,452 | |||||||||||||||||||||||||||||||||
| (1) | Represents the potential payout for awards granted under the AICP. These awards were subject to attainment of certain performance targets. The performance targets and target award multiples for determining the payout are described under “—Compensation Discussion and Analysis—2014 Compensation Program—Annual Incentive Compensation Plan.” Actual amounts paid under the plan to the named executive officers are reported in the Summary Compensation Table under the “—Non-Equity Incentive Plan Compensation.” |
| (2) | Represents Leveraged Performance Shares awarded under the 2010 Plan. |
| (3) | Represents the aggregate grant date fair value of the performance stock units granted to our named executive officers in 2014. The dollar amounts were computed in accordance with ASC Topic 718. See note 15 to the consolidated financial statements in Part II in this Form 10-K for a description of the assumptions used in determining the accounting expense associated with these awards. |
112
Table of Contents
Employment Agreements
Chief Executive Officer and President and Chief Operating Officer and Chief Financial Officer
Concurrently with the execution of the Merger Agreement with TTM, Viasystems and its applicable subsidiaries entered into Amended and Restated Executive Employment Agreements with each of Messrs. David M. Sindelar, Viasystems’ Chief Executive Officer, Timothy L. Conlon, Viasystems’ President and Chief Operating Officer, and Gerald G. Sax, Viasystems’ Senior Vice President and Chief Financial Officer. Messrs. Sindelar, Conlon and Sax are considered and referred to as the “Executive Employees.”
The employment agreements expire upon termination of the executive’s employment either by us or the Executive Employee. The agreements provide for annual base salary of not less than $920,000 for Mr. Sindelar and $550,000 for Mr. Conlon, and $413,200 for Mr. Sax as well as an annual cash-based incentive compensation opportunity of an amount determined by the Compensation Committee in accordance with our AICP. Each Executive Employee is also eligible to receive an automobile allowance, lifetime medical benefits for the Executive Employee and his spouse, subject to certain exceptions, and other benefits customarily accorded to our executives.
The Amended and Restated Executive Employment Agreements provide for certain additional benefits to the Executive Employees in the event of a termination of such Executive Employee’s position following a change in control of Viasystems (as defined in each Amended and Restated Executive Employment Agreement), as well as the addition of non-competition and non-solicitation provisions for Messrs. Sindelar and Sax. The Executive Employees are entitled to these additional benefits if their employment is terminated during the period beginning on the closing date of the change in control and ending on the earlier of (1) the last day of the month that is two years after the closing date of the Merger, or (2) the death of the Executive Employee, which such period is referred to as the “Protection Period.”
Mr. Sindelar’s Change in Control Severance. Pursuant to the Amended and Restated Executive Employment Agreement between Viasystems and Mr. Sindelar, in the event Mr. Sindelar’s employment with Viasystems is terminated during the Protection Period by (1) Viasystems without cause, (2) Mr. Sindelar with good reason (as defined in his Amended and Restated Executive Employment Agreement) or (3) reason of Mr. Sindelar’s total disability (as defined in his Amended and Restated Executive Employment Agreement) or death, then Mr. Sindelar would be entitled to receive the following: (a) Mr. Sindelar’s then-current base salary for a period of 18 months following the termination of Mr. Sindelar’s employment (such total amount being referred to as “Mr. Sindelar’s Change of Control Salary Severance”), (b) an amount equal to 100% of Mr. Sindelar’s Change in Control Salary Severance, such amount to be paid over an 18-month period following Mr. Sindelar’s termination (such total amount, “Mr. Sindelar’s Bonus Change in Control Severance”), (c) an amount equal to the sum of (A) Mr. Sindelar’s Change in Control Salary Severance and (B) Mr. Sindelar’s Bonus Change in Control Severance, less (C) $1,189,150, such amount to be paid in a lump sum cash payment within five business days following the date of the termination of Mr. Sindelar’s employment, (d) the continuation of certain benefits provided under his Amended and Restated Executive Employment Agreement for 18 months following termination of Mr. Sindelar’s employment, and (e) the reimbursement of certain expenses for 18 months following termination of Mr. Sindelar’s employment.
Mr. Conlon’s Change in Control Severance. Pursuant to the Amended and Restated Executive Employment Agreement between Viasystems and Mr. Conlon, in the event Mr. Conlon’s employment with Viasystems is terminated during the Protection Period by (1) Viasystems without cause, (2) Mr. Conlon with good reason (as defined in his Amended and Restated Executive Employment Agreement) or (3) reason of Mr. Conlon’s total disability (as defined in his Amended and Restated Executive Employment Agreement) or death, then Mr. Conlon would be entitled to receive the following: (a) Mr. Conlon’s then-current base salary (as calculated in his Amended and Restated Executive Employment Agreement) for a period of 24 months following termination of Mr. Conlon’s employment, (b) the continuation of certain benefits provided under his Amended and Restated Executive Employment agreement for 18 months following termination of Mr. Conlon’s employment, and (c) the reimbursement of certain expenses for 18 months following termination of Mr. Conlon’s employment.
Mr. Sax’s Change in Control Severance. Pursuant to the Amended and Restated Executive Employment Agreement between Viasystems and Mr. Sax, in the event Mr. Sax’s employment with Viasystems is terminated during the Protection Period by (1) Viasystems without cause, (2) Mr. Sax with good reason (as defined in his Amended and Restated Executive Employment Agreement) or (3) reason of Mr. Sax’s total disability (as defined in his Amended and Restated Executive Employment Agreement) or death, then Mr. Sax would be entitled to receive the following: (a) Mr. Sax’s then-current base salary (as calculated in his Amended and Restated Executive Employment Agreement) for a period of 24 months following termination of Mr. Sax’s employment, such amount to be paid over an 18-month period following the termination of Mr. Sax’s employment (such total amount, “Mr. Sax’s Change of Control Salary Severance”), (b) an amount equal to 70% of Mr. Sax’s Change in Control Salary Severance, such amount to be paid over an 18-month period following termination of Mr. Sax’s employment, (c) the continuation of certain benefits provided under his Amended and Restated Executive Employment Agreement for 18 months following termination of Mr. Sax’s employment, and (d) the reimbursement of certain expenses for 18 months following termination of Mr. Sax’s employment.
113
Table of Contents
Under their employment agreements Messrs. Sindelar and Sax will be deemed to be terminated without cause if he is terminated for any reason other than fraud, dishonesty or unauthorized use of any of our trade secrets or confidential information. Under his employment agreement, Mr. Conlon will be deemed to be terminated without cause if he is terminated for any reason other than fraud, conviction to or plea of nolo centendere (or other similar plea) to a felony or crime involving moral turpitude, dishonesty, incompetence, willful misconduct, willful violation of any law, rule or regulation or breach of fiduciary duty involving personal profit, illegal use of drugs, unauthorized use of any of our trade secrets or confidential information, or willful failure to properly perform the duties assigned to him or execute or comply with Company policies. Under the employment agreements, the Executive Employees will be deemed to be disabled if he has been unable to perform his duties to the Company due to mental or physical incapacity for a period of six months or for any 100 working days out of a consecutive twelve month period. Each Executive Employee and his spouse will receive lifetime medical benefits, whether terminated with or without cause or due to the executive’s death or disability, subject to certain exemptions.
Potential Section 280G Cutback. Each of Messrs. Sindelar, Conlon and Sax’s respective Amended and Restated Executive Employment Agreements contains a “best-net” provision, which provides that if Section 280G of the Code would apply to payments the Executive Employee has received or will receive in conjunction with the change in control (including, without limitation, those made under the Amended and Restated Executive Employment Agreement), and such payments would trigger an excise tax on “excess parachute payments,” then those payments are subject to a reduction in order to avoid application of that excise tax, but only if the reduction would result in a greater net after-tax amount paid to the Executive Employee.
Non-Competition Clause. As a condition of receiving the benefits described above, the respective Amended and Restated Executive Employment Agreements of Messrs. Sindelar and Sax provide that, during the Executive Employee’s employment and for a period of 36 months following termination of the Executive Employee’s employment for any reason, the Executive Employee may not compete with Viasystems, divert business from Viasystems or solicit customers or employees of Viasystems. Mr. Conlon’s employment agreement preserves the non-competition and non-solicitation obligations contained in his previously existing employment agreement, which provide that (1) if terminated (a) by Viasystems for cause or (b) through voluntary termination (except a voluntary termination for good reason during the Protection Period), Mr. Conlon shall not compete with Viasystems for one year and (2) if terminated (a) by Viasystems without cause or as a result of total disability or (b) by Mr. Conlon for good reason during the Protection Period, Mr. Conlon shall not compete with Viasystems for 18 months.
Other Agreements
We entered into employment agreements with Mr. Barber (in 2000) and Mr. Kampf (in 2002). Under the agreements, if the executive is terminated without cause, and for Mr. Barber, if the executive terminates his employment due to death or disability, the executive (or his estate, heirs or beneficiary, as applicable) will be entitled to continuation of (i) his base salary and health insurances for a period of twelve months, (ii) a pro rata portion of any AICP award he is eligible to receive for the final calendar year of his employment, and (iii) for Mr. Barber only, continuation of his automobile allowance for a period of twelve months.
Under their agreements, each of Mr. Barber and Mr. Kampf will be deemed to be terminated without cause if he is terminated for any reason other than fraud, dishonesty, competition with us, unauthorized use of any of our trade secrets or confidential information, insubordination or failure to properly perform the duties assigned to him, in our reasonable judgment.
The employment arrangements of each of Mr. Barber and Mr. Kampf include a non-compete covenant of one year and a non-disclosure covenant. The potential payments under the agreements to each of Mr. Barber and Mr. Kampf are conditioned upon the executive executing a separation agreement acceptable to us that includes a release of claims against us and a covenant not to compete.
114
Table of Contents
Transaction Bonus Pool
On September 21, 2014, in order to properly incent certain key employees to work toward the goal of consummating the Merger, the Board approved a transaction bonus pool (the “Transaction Bonus Pool”) from which cash bonus payments will be made to designated officers and key employees of Viasystems and its subsidiaries upon consummation of the Merger. In order to be entitled to receive a cash bonus payment, the participant must remain an employee of Viasystems or one of its subsidiaries through the date of the consummation of the Merger. This cash bonus pool has not yet been allocated to specific employees but represents additional payments expected to be made in connection with the Merger. The Transaction Bonus Pool payments are “single trigger”. Any portion of the $1,189,150 available in the Transaction Bonus Pool may be allocated to any officer or key employee of Viasystems.
2010 Equity Incentive Plan
Our 2010 Plan was approved by our stockholders in June 2010 and is administered by our Compensation Committee. The 2010 Plan permits awards of stock options, stock appreciation rights, restricted stock, other stock-based awards and performance-based compensation. The maximum number of Shares that may be issued pursuant to equity awards under the 2010 Plan is 4,600,000 and no participant may receive awards for more than 1,000,000 Shares each year. Options granted under the 2010 Plan are required to have an exercise price of not less than the fair market value of our Shares on the grant date. In the event of a change in control, the Compensation Committee has the discretion to accelerate the exercisability or vesting of the awards under the 2010 Plan.
Under the 2010 Plan, change in control is defined as:
| • | any person becoming the beneficial owner of a majority of our Shares; |
| • | when a majority of our directors were not directors when the 2010 Plan was enacted, or were not approved by a vote of at least two-thirds of the directors who were serving on the Board at the time the plan was enacted; |
| • | a reorganization, merger, or consolidation or sale or other disposition of substantially all of the assets of the Company, unless holders of our voting stock immediately prior to the transaction beneficially own more than 50% of the combined voting power of the surviving entity; or |
| • | our stockholders approve a complete liquidation or dissolution of the Company, the sale or disposition of all or substantially all of the assets of the Company (and such transaction is consummated) or a going private transaction which will result in the Shares no longer being publicly traded (and such transaction is consummated). |
Under our outstanding stock option, restricted stock and performance share unit award agreements, the unvested portion of the stock option, restricted stock and performance share unit awards vest and become fully exercisable immediately prior to a change in control. Under the stock option award agreement, any such stock options will remain exercisable for 90 days after the change in control and will terminate and be forfeited thereafter. In addition, under the stock option award agreement, the stock options will vest on a pro rata basis of the ratio of the number of complete months of service divided by 36, if the option holder’s service to the Company terminates due to death or disability prior to the first anniversary of the date of grant. Under our outstanding restricted stock and 2012 performance share unit agreements, if the employee is involuntarily terminated, the restricted stock or performance share units that have not yet vested as of the employee’s termination will vest by calculating the product of (a) 0.083, (b) the total number of calendar quarter-ends that have passed starting from the date the award was made and ending on the date the employee was terminated and (c) the number of shares of restricted stock or performance share units granted under the agreement.
115
Table of Contents
Outstanding Equity Awards
The following table sets forth certain information with respect to outstanding equity awards at December 31, 2014, with respect to our Chief Executive Officer, Chief Financial Officer and our three other most highly compensated executive officers.
OUTSTANDING EQUITY AWARDS AT FISCAL YEAR-END
| Option Awards | Stock Awards | |||||||||||||||||||||||||||||||
| Number of Securities Underlying Unexercised Options (#) |
Option Exercise |
Option Expiration |
Shares That Have Not |
Market Value of Shares that Have Not |
Equity Incentive Plan Awards: Number of Unearned Shares, Units or Other Rights That Have Not |
Equity Have Not |
||||||||||||||||||||||||||
| Name |
Exercisable | Un-exercisable | Price ($) | Date | Vested (#)(1) | Vested ($)(2) | Vested ($)(3) | Vested ($)(2) | ||||||||||||||||||||||||
| David M. Sindelar |
239,945 | — | 21.88 | 5/11/2017 | — | — | — | — | ||||||||||||||||||||||||
| 131,153 | — | 20.38 | 2/08/2018 | — | — | — | — | |||||||||||||||||||||||||
| 95,701 | — | 18.42 | 2/07/2019 | — | — | — | — | |||||||||||||||||||||||||
| — | — | — | — | 49,765 | 810,174 | — | — | |||||||||||||||||||||||||
| — | — | — | — | — | — | 49,765 | 810,174 | |||||||||||||||||||||||||
| — | — | — | — | — | — | 147,495 | 2,401,219 | |||||||||||||||||||||||||
| — | — | — | — | — | — | 83,150 | 1,353,682 | |||||||||||||||||||||||||
| Timothy L. Conlon |
114,280 | — | 21.88 | 5/11/2017 | — | — | — | — | ||||||||||||||||||||||||
| 65,577 | — | 20.38 | 2/08/2018 | — | — | — | — | |||||||||||||||||||||||||
| 45,241 | — | 18.42 | 2/07/2019 | — | — | — | — | |||||||||||||||||||||||||
| — | — | — | — | 23,525 | 382,987 | — | — | |||||||||||||||||||||||||
| — | — | — | — | — | — | 23,525 | 382,987 | |||||||||||||||||||||||||
| — | — | — | — | — | — | 69,725 | 1,135,123 | |||||||||||||||||||||||||
| — | — | — | — | — | — | 39,307 | 639,918 | |||||||||||||||||||||||||
| Gerald G. Sax |
10,455 | — | 150.99 | 8/08/2015 | — | — | — | — | ||||||||||||||||||||||||
| 85,695 | — | 21.88 | 5/11/2017 | — | — | — | — | |||||||||||||||||||||||||
| 39,346 | — | 20.38 | 2/08/2018 | — | — | — | — | |||||||||||||||||||||||||
| 27,840 | — | 18.42 | 2/07/2019 | — | — | — | — | |||||||||||||||||||||||||
| — | — | — | — | 14,477 | 235,686 | — | — | |||||||||||||||||||||||||
| — | — | — | — | — | — | 14,477 | 235,686 | |||||||||||||||||||||||||
| — | — | — | — | — | — | 42,908 | 698,542 | |||||||||||||||||||||||||
| — | — | — | — | — | — | 24,189 | 393,797 | |||||||||||||||||||||||||
| Brian W. Barber |
4,182 | — | 150.99 | 2/06/2017 | — | — | — | — | ||||||||||||||||||||||||
| 3,345 | — | 150.99 | 11/1/2017 | — | — | — | — | |||||||||||||||||||||||||
| 42,847 | — | 21.88 | 5/11/2017 | — | — | — | — | |||||||||||||||||||||||||
| 28,854 | — | 20.38 | 2/08/2018 | — | — | — | — | |||||||||||||||||||||||||
| 22,620 | — | 18.42 | 2/07/2019 | — | — | — | — | |||||||||||||||||||||||||
| — | — | — | — | 11,763 | 191,502 | — | — | |||||||||||||||||||||||||
| — | — | — | — | — | — | 11,763 | 191,502 | |||||||||||||||||||||||||
| — | — | — | — | — | — | 34,863 | 507,570 | |||||||||||||||||||||||||
| — | — | — | — | — | — | 19,654 | 319,967 | |||||||||||||||||||||||||
| Richard B. Kampf |
4,182 | — | 150.99 | 2/06/2017 | — | — | — | — | ||||||||||||||||||||||||
| 3,345 | — | 150.99 | 11/1/2017 | — | — | — | — | |||||||||||||||||||||||||
| 42,847 | — | 21.88 | 5/11/2017 | — | — | — | — | |||||||||||||||||||||||||
| 28,854 | — | 20.38 | 2/08/2018 | — | — | — | — | |||||||||||||||||||||||||
| 22,620 | — | 18.42 | 2/07/2019 | — | — | — | — | |||||||||||||||||||||||||
| — | — | — | — | 11,763 | 191,502 | — | — | |||||||||||||||||||||||||
| — | — | — | — | — | — | 11,763 | 191,502 | |||||||||||||||||||||||||
| — | — | — | — | — | — | 34,863 | 567,570 | |||||||||||||||||||||||||
| — | — | — | — | — | — | 19,654 | 319,967 | |||||||||||||||||||||||||
| (1) | All outstanding shares of restricted stock vest on the third anniversary of the grant date. |
| (2) | Market value of restricted stock and performance share units reflects a per share price of $16.28 which was the fair market value on December 31, 2014. The value of performance share units assumes vesting at target. All restricted stock awards outstanding at December 31, 2014, vested on February 7, 2015 in accordance with their original vesting schedule. |
| (3) | Performance share units granted in 2014, 2013 and 2012 may be vested from 0% to 171%, 166% and 200%, respectively, based on the achievement of the underlying performance measures. Performance share units vest following the completion of the requisite service period, which, for all outstanding performance share units as of December 31, 2014, is three years from the underlying grant date. |
116
Table of Contents
Options Exercised and Stock Vested
None of our named executive officers exercised any stock options in 2014. Shares of restricted stock previously awarded to our named executive officers vested during 2014 as set forth in the table below.
OPTION EXERCISES AND STOCK VESTED
| Option Awards | Stock Awards (1) | |||||||||||||||
| Name |
Number of Shares Acquired on Exercise (#) |
Value Realized on Exercise ($) |
Number of Shares Acquired on Vesting (#) |
Value Realized on Vesting ($) |
||||||||||||
| David M. Sindelar |
— | — | 61,335 | 797,355 | ||||||||||||
| Timothy L. Conlon |
— | — | 30,667 | 398,671 | ||||||||||||
| Gerald G. Sax |
— | — | 18,400 | 239,200 | ||||||||||||
| Brian W. Barber |
— | — | 13,494 | 175,422 | ||||||||||||
| Richard B. Kampf |
— | — | 13,494 | 175,422 | ||||||||||||
| (1) | Represents shares of restricted stock that were granted during 2011 and vested during 2014. |
Pension Benefits
None of our named executive officers are covered by a pension plan or other similar benefit plan that provides for payments or other benefits.
Nonqualified Deferred Compensation
In 2011, we established our Savings Restoration Plan which provides for the deferral of compensation to certain domestic employees who are not eligible to receive the full Matching Contribution due to limitations imposed by the Internal Revenue Code. The Savings Restoration Plan also allows for the voluntary deferral of certain compensation by eligible employees to be held in trust by the Company. The following table sets forth certain information with respect to nonqualified deferred compensation plans for our Chief Executive Officer, Chief Financial Officer and our three other highest compensated executive officers.
NONQUALIFIED DEFERRED COMPENSATION
| Name |
Executive Contributions in 2014 ($) |
Company Contributions in 2014 ($) |
Aggregate Earnings in 2014 ($) |
Aggregate Withdrawals/ Distributions ($) |
Aggregate Balance at December 31, 2014 ($) |
|||||||||||||||
| David M. Sindelar |
— | 47,400 | 3,835 | — | 216,716 | |||||||||||||||
| Timothy L. Conlon |
110,000 | 25,200 | (4,444 | ) | — | 574,113 | ||||||||||||||
| Gerald G. Sax |
20,606 | 13,159 | 5,526 | — | 158,758 | |||||||||||||||
| Brian W. Barber |
70,434 | 10,110 | 3,136 | — | 165,769 | |||||||||||||||
| Richard B. Kampf |
10,565 | 10,110 | 3,552 | — | 73,392 | |||||||||||||||
117
Table of Contents
Potential Payments Upon Termination or Change in Control
The following table quantifies potential compensation that would become payable to each of our named executive officers under employment and equity award agreements and Company plans and policies (as in effect on December 31, 2014) if their employment had terminated or a change in control event had occurred on December 31, 2014, using the executive officer’s base salary and the closing price of our common stock on December 31, 2014, and assuming a 100% payout under our AICP for 2014. For additional information regarding (i) the circumstances in which our executive officers would be entitled to severance compensation, see “—Employment Agreements” above and (ii) the acceleration of vesting of equity awards, see “—2010 Equity Incentive Plans” above. Due to the factors that may affect the amount of any benefits provided upon the events described below, any actual amounts paid or payable may be different than those shown in this table. Factors that could affect these amounts include the date the termination or change in control event occurs, the base salary of an executive on the date of termination of employment or change in control and the price of our common stock when the termination or change in control event occurs.
| Cash Severance |
Acceleration of Equity Awards |
Benefits and Perquisites |
Total | |||||||||||||
| David M. Sindelar |
||||||||||||||||
| Voluntary Termination |
$ | — | $ | 2,672,110 | (2) | $ | — | $ | 2,672,110 | (1) | ||||||
| Termination For Cause |
— | 2,672,110 | (2) | — | 2,672,110 | (1) | ||||||||||
| Termination Without Cause |
2,760,000 | 2,672,110 | (2) | 250,152 | 5,682,262 | (1) | ||||||||||
| Death or Disability |
2,760,000 | 4,383,179 | (2) | 250,152 | 7,393,331 | (1) | ||||||||||
| Termination Without Cause or For Good Reason Following Change in Control |
4,330,850 | 4,565,075 | (2) | 297,278 | 9,193,203 | (1) | ||||||||||
| Timothy L. Conlon |
||||||||||||||||
| Voluntary Termination |
$ | — | $ | 1,261,788 | (2) | $ | — | $ | 1,261,788 | (1) | ||||||
| Termination For Cause |
— | 1,261,788 | (2) | — | 1,261,788 | (1) | ||||||||||
| Termination Without Cause |
825,000 | 1,261,788 | (2) | 145,730 | 2,232,518 | (1) | ||||||||||
| Death or Disability |
825,000 | 2,070,654 | (2) | 145,730 | 3,041,384 | (1) | ||||||||||
| Termination Without Cause or For Good Reason Following Change in Control |
1,100,000 | 2,158,028 | (2) | 153,080 | 3,411,108 | (1) | ||||||||||
| Gerald G. Sax |
||||||||||||||||
| Voluntary Termination |
$ | — | $ | 776,487 | (2) | $ | — | $ | 776,487 | (1) | ||||||
| Termination For Cause |
— | 776,487 | (2) | — | 776,487 | (1) | ||||||||||
| Termination Without Cause |
1,053,660 | 776,487 | (2) | 96,333 | 1,926,480 | (1) | ||||||||||
| Death or Disability |
1,053,660 | 1,092,339 | (2) | 96,333 | 2,424,247 | (1) | ||||||||||
| Termination Without Cause or For Good Reason Following Change in Control |
1,404,880 | 1,263,214 | (2) | 82,576 | 2,815,481 | (1) | ||||||||||
| Brian W. Barber |
||||||||||||||||
| Voluntary Termination |
$ | — | $ | 630,910 | (2) | $ | — | $ | 630,910 | |||||||
| Termination With Cause |
— | 630,910 | (2) | — | 630,910 | |||||||||||
| Termination Without Cause |
600,270 | 630,910 | (2) | 24,630 | 1,255,810 | |||||||||||
| Death or Disability |
600,270 | 1,035,352 | (2) | 24,630 | 1,660,252 | |||||||||||
| Termination Without Cause or For Good Reason Following Change in Control |
600,270 | 1,079,038 | (2) | 24,630 | 1,703,938 | |||||||||||
| Richard B. Kampf |
||||||||||||||||
| Voluntary Termination |
$ | — | $ | 630,910 | (2) | $ | — | $ | 630,910 | |||||||
| Termination With Cause |
— | 630,910 | (2) | — | 630,910 | |||||||||||
| Termination Without Cause |
600,270 | 630,910 | (2) | 20,056 | 1,251,236 | |||||||||||
| Death or Disability |
— | 1,035,352 | (2) | — | 1,035,352 | |||||||||||
| Termination Without Cause or For Good Reason Following Change in Control |
600,270 | 1,079,038 | (2) | 20,056 | 1,699,364 | |||||||||||
| (1) | Plus lifetime medical benefits. |
| (2) | Includes the value of performance share units assuming they vest at target, unless the actual performance achieved is known. |
DIRECTOR COMPENSATION
The Company pays the following director fees: the Chairman of the Board receives an annual fee of $120,000; directors (other than the Chairman) who are not executive officers receive an annual fee of $60,000 (“Board Cash Retainer”); each Audit Committee, Compensation Committee and Nominating and Governance Committee member receives an additional annual fee of $15,000, $12,500 and $10,000, respectively; and the chairman of each of the Audit Committee, Compensation Committee and Nominating and Governance Committee receives an additional fee of $15,000, $12,500 and $10,000, respectively. In addition, directors are reimbursed for out-of-pocket expenses incurred in connection with attending meetings of the Board and its committees.
118
Table of Contents
Upon reelection to the Board at each annual stockholder’s meeting, directors will receive an annual grant of restricted stock under the 2010 Plan in the amount of the number of shares equal to the quotient of $150,000 divided by the price that the Company’s stock closes on the day of that annual meeting. These shares of restricted stock will vest three years from the date of the grant subject to certain acceleration provisions. Directors will also be required to achieve and maintain share ownership guidelines equal to five times the Board Cash Retainer (i.e., $300,000). These guidelines must be achieved within five years of election to the Board.
The following table provides compensation information for our non-employee directors in 2014.
DIRECTOR COMPENSATION FOR FISCAL YEAR ENDED DECEMBER 31, 2014
| Name |
Fees Earned or Paid in Cash |
Stock Awards (1) |
Total | |||||||||
| Michael D. Burger |
$ | 85,000 | $ | 150,000 | $ | 233,125 | ||||||
| Robert F. Cummings, Jr. |
82,500 | 150,000 | 232,500 | |||||||||
| Kirby A. Dyess |
95,000 | 150,000 | 245,000 | |||||||||
| Peter Frank |
60,000 | 150,000 | 210,000 | |||||||||
| Jack D. Furst |
60,000 | 150,000 | 210,000 | |||||||||
| Edward Herring |
60,000 | 150,000 | 210,000 | |||||||||
| William A. Owens |
85,000 | 150,000 | 235,000 | |||||||||
| Dominic J. Pileggi |
87,500 | 150,000 | 237,500 | |||||||||
| Christopher J. Steffen |
182,500 | 150,000 | 332,500 | |||||||||
| David D. Stevens |
87,500 | 150,000 | 237,500 | |||||||||
| (1) | At the close of market on May 6, 2014, each director then serving was granted 12,690 shares of restricted stock. The dollar amounts represent the aggregate grant date fair value of restricted stock awards in accordance with ASC Topic 718. See note 15 to the consolidated financial statements in Part 2 of this Annual Report on Form 10-K for the year ended December 31, 2014 for a description of the assumptions used in determining the accounting expense associated with these awards. |
Item 12. Security Ownership of Certain Beneficial Owners and Management and Related Stockholder Matters
The following table sets forth certain information with respect to the beneficial ownership of the Company’s Shares as of December 31, 2014 by:
| • | each beneficial owner of more than five percent of the Company’s Shares; |
| • | each member of the Board and each of our named executive officers; and |
| • | all members of the Board and executive officers as a group. |
Beneficial ownership is determined under rules of the SEC and generally includes any Shares over which a person exercises sole or shared voting or investment power. The table also includes the number of Shares underlying options that will be exercisable within 60 days of the date of this proxy statement. Unless otherwise indicated and subject to community property laws where applicable, the Company believes that each of the stockholders named in the following table has sole voting and investment power with respect to the Shares beneficially owned.
119
Table of Contents
The information in the following table regarding beneficial ownership of Shares held by entities known by the Company to beneficially own 5% or more of the Company’s Shares is included in reliance on a report filed by each entity with the SEC, except that the percentage is based on the Company’s calculations made in reliance on the number of Shares reported to be beneficially owned by the entity in such report and the number of Shares outstanding on December 31, 2014.
| Shares of Viasystems Common Stock |
||||||||
| Name of Beneficial Owner |
Number | Percentage | ||||||
| 5% Stockholders: |
||||||||
| Hicks Muse Entities (1) |
9,982,135 | 47.7 | % | |||||
| Black Diamond Entities (2) |
3,984,941 | 19.0 | ||||||
| Dimensional Fund Advisors LP (3) |
1,512,967 | 7.3 | ||||||
| Executive Officers and Directors: |
||||||||
| Brian W. Barber (4)(5) |
133,803 | * | ||||||
| Michael D. Burger (4) |
54,411 | * | ||||||
| Timothy L. Conlon (4)(5)(6) |
294,967 | 1.4 | ||||||
| Robert F. Cummings, Jr. (4) |
38,246 | * | ||||||
| Kirby A. Dyess (4)(7) |
39,828 | * | ||||||
| Peter Frank (4) |
38,246 | * | ||||||
| Jack D. Furst (4) |
38,246 | * | ||||||
| Edward Herring (4) |
38,246 | * | ||||||
| Richard B. Kampf (4)(5) |
139,444 | * | ||||||
| William A. Owens (4) |
31,871 | * | ||||||
| Dominic J. Pileggi (4) |
33,390 | * | ||||||
| Gerald G. Sax (4)(5) |
230,491 | 1.1 | ||||||
| David M. Sindelar (4)(5)(8) |
619,932 | 2.9 | ||||||
| Christopher J. Steffen (4)(5) |
56,429 | * | ||||||
| David D. Stevens (4) |
31,871 | * | ||||||
| All executive officers and directors as a group (15 persons) |
1,819,421 | 8.3 | ||||||
| * | Represents beneficial ownership of less than 1.0% of the outstanding shares of Viasystems common stock. |
| (1) | These figures include: |
| • | 8,189,803 shares of Viasystems common stock held of record by Hicks, Muse, Tate & Furst Equity Fund III, L.P., a limited partnership, of which the ultimate general partner is Hicks, Muse Fund III Incorporated, an affiliate of Hicks, Muse & Co. Partners, L.P. |
| • | 222,120 shares of Viasystems common stock held of record by HM3 Coinvestors, L.P., a limited partnership of which the ultimate general partner is Hicks, Muse Fund III Incorporated, an affiliate of Hicks, Muse & Co. Partners, L.P. |
| • | 1,425,833 shares of Viasystems common stock held of record by Hicks, Muse & Co. Partners, L.P. Equity Fund IV (1999), L.P., a limited partnership of which the ultimate general partner is Hicks, Muse (1999) Fund IV, LLC, an affiliate of Hicks, Muse & Co. Partners, L.P. |
120
Table of Contents
| • | 75,912 shares of Viasystems common stock held of record by Hicks, Muse PG- IV (1999), C.V., of which the ultimate general partner is HM Fund IV Cayman, LLC, an affiliate of Hicks, Muse & Co. Partners, L.P. |
| • | 35,064 shares of Viasystems common stock held of record by HM 4-P (1999) Coinvestors, L.P., a limited partnership of which the ultimate general partner is Hicks, Muse (1999) Fund IV, LLC, an affiliate of Hicks, Muse & Co. Partners, L.P. |
| • | 23,303 shares of Viasystems common stock held of record by HM 4-EQ (1999) Coinvestors, L.P., a limited partnership of which the ultimate general partner is Hicks, Muse (1999) Fund IV, LLC, an affiliate of Hicks, Muse & Co. Partners, L.P. |
| • | 10,100 shares of Viasystems common stock held of record by Hicks, Muse & Co. Partners, L.P. Private Equity Fund IV (1999), L.P., a limited partnership of which the ultimate general partner is Hicks, Muse (1999) Fund IV, LLC, an affiliate of Hicks, Muse & Co. Partners, L.P. |
Each of the above entities disclaims beneficial ownership of shares of Viasystems common stock except to the extent of each entity’s pecuniary interest in such shares of Viasystems common stock.
| (2) | These figures include: |
| • | 2,632,918 shares of Viasystems common stock held of record by GSC Recovery II, L.P., a limited partnership of which the ultimate general partner is GSC Recovery II GP, L.P., an affiliate of Black Diamond Capital Management, L.L.C. |
| • | 1,352,023 shares of Viasystems common stock held of record by GSC Recovery IIA, L.P., a limited partnership of which the ultimate general partner is GSC Recovery IIA GP, L.P., an affiliate of Black Diamond Capital Management, L.L.C. |
Each of the above entities disclaims beneficial ownership of shares of Viasystems common stock except to the extent of each entity’s pecuniary interest in such shares of Viasystems common stock.
| (3) | According to a Schedule 13G filed by Dimensional Fund Advisors LP (“Dimensional”) with the SEC on February 10, 2014, Dimensional, as an investment advisor, has voting power and dispositive power with respect to 1,499,113 and 1,526,971 shares of Viasystems common stock, respectively. |
| (4) | Includes shares of Viasystems restricted stock for which the executive officer or director has sole voting power, but no dispositive power, as follows: Mr. Barber (11,763 shares), Mr. Burger (31,390 shares), Mr. Conlon (23,525 shares), Mr. Cummings (31,390 shares), Ms. Dyess (31,390 shares), Mr. Frank (31,390 shares), Mr. Furst (31,390 shares), Mr. Herring (31,390 shares), Mr. Kampf (11,763 shares), Mr. Owens (31,871 shares), Mr. Pileggi (31,390 shares), Mr. Sax (14,477 shares), Mr. Sindelar (49,765 shares), Mr. Steffen (31,390 shares) and Mr. Stevens (31,871 shares). |
| (5) | Includes shares of Viasystems common stock that may be acquired pursuant to stock options exercisable within 60 days, as follows: Mr. Barber (101,848 shares), Mr. Conlon (225,078 shares), Mr. Kampf (101,848 shares), Mr. Sax (163,336 shares) and Mr. Sindelar (466,799 shares). |
| (6) | Includes 7,500 shares of Viasystems common stock held by the Conlon Family Limited Partnership, of which Mr. Conlon is a general partner. Mr. Conlon disclaims beneficial ownership of the shares of Viasystems common stock held by the Conlon Family Limited Partnership except to the extent of his pecuniary interest in such shares of Viasystems common stock. |
| (7) | Includes 1,119 shares of Viasystems common stock held in trust for Ms. Dyess and her family. Ms. Dyess is a trustee of the trust and is therefore deemed to have sole voting and dispositive power over the shares of Viasystems common stock held in the trust. |
| (8) | Includes 12,300 shares of Viasystems common stock held in trust for James G. Sindelar and 12,300 shares of Viasystems common stock held in trust for Lauren L. Sindelar. Mr. Sindelar is the trustee of both trusts and is therefore deemed to have sole voting and dispositive power over the shares of Viasystems common stock held in the trust. |
121
Table of Contents
EQUITY COMPENSATION PLAN INFORMATION
We currently maintain two equity compensation plans for the benefit of our employees and directors: the 2003 Plan and the 2010 Plan. Both plans were approved by our stockholders. The 2003 Plan expired in January 2013, and no new awards will be granted under the 2003 Plan; however, options previously granted under the 2003 Plan may still be exercised up until they expire or are forfeited under the terms of the underlying agreements governing such grants. The following table sets forth certain information as of December 31, 2014.
| Plan Category |
Equity Compensation Plan Information | |||||||||||
| Number of Securities to be Issued Upon Exercise |
Weighted- Average Exercise Price |
Number of Securities Available for Future Issuance |
||||||||||
| Equity compensation plans approved by stockholders |
1,770,720 | $ | 23.40 | 440,276 | (1) | |||||||
|
|
|
|
|
|
|
|||||||
| Equity compensation plans not approved by stockholders |
N/A | $ | N/A | N/A | ||||||||
|
|
|
|
|
|
|
|||||||
| (1) | Assumes performance share units will vest at their maximum level. |
| Item 13. | Certain Relationships and Related Transactions, and Director Independence |
Dissolution of VG Holdings
On June 30, 2013, VG Holdings, LLC, an entity that held approximately 75% of our common stock, completed a mandatory distribution of its ownership of the Company to its respective owners, which included affiliates of Hicks, Muse & Co Partners, L.P., affiliates of Black Diamond Capital Management, L.L.C. and others, and dissolved in accordance with its governing documents. As a result of this transaction, the stockholder agreement by and between us and VG Holdings, LLC was effectively terminated.
Related Person Transaction Policy
We have adopted a Related Person Transaction Policy pursuant to which transactions in which we participate and a “related person” has a material direct or indirect interest must be reviewed and approved or ratified by the Audit Committee. A “related person” means: each director and executive officer of Viasystems; any director nominee; any greater than five percent stockholder; any immediate family member of any of the foregoing; and any company or other entity that employs or is controlled by any of the foregoing, or in which any of them have a material ownership or financial interest.
Generally under the Related Person Transaction Policy, any director, executive officer or nominee who intends to enter into a related person transaction, and any employee of Viasystems who intends to cause Viasystems to enter into a related person transaction, is required to disclose all material facts regarding the proposed transaction to the Audit Committee.
The transaction will be reviewed by the Audit Committee and, in its discretion, approved or ratified. The Audit Committee considers, in light of the relevant facts and circumstances, whether the transaction is consistent with the best interests of the Company. It may consider the relationship of the related person with Viasystems, the materiality or significance of the transaction to Viasystems and the related person, the business purpose and reasonableness of the transaction, whether the transaction is comparable to a transaction that could be available to Viasystems on an arm’s-length basis and the impact of the transaction on our business and operations. The Related Person Transaction Policy is available on our website at www.viasystems.com.
122
Table of Contents
| Item 14. | Principal Accountant Fees and Services |
AUDIT COMMITTEE REPORT
The Audit Committee, which is comprised entirely of independent directors, as determined by the Board in accordance with the NASDAQ listing requirements and applicable federal securities laws, serves as an independent and objective party to assist the Board in fulfilling its oversight responsibilities including overseeing (i) the integrity of our financial statements, (ii) our compliance with legal, ethical and regulatory requirements, (iii) the independence, qualifications, engagement, compensation and performance of our independent registered public accounting firm, (iv) the performance of our internal audit function, (v) our systems of internal control over financial reporting, (vi) risk management and (vii) application of our related person transaction policy.
The Company’s independent registered public accounting firm, Ernst & Young, is responsible for performing an independent audit of the consolidated financial statements of the Company and expressing an opinion on the conformity of those financial statements with accounting principles generally accepted in the United States, as well as expressing an opinion (pursuant to Section 404 of the Sarbanes-Oxley Act of 2002) on the effectiveness of internal control over financial reporting.
The members of the Audit Committee are not professional accountants or auditors, and their functions are not intended to duplicate or to certify the activities of management and the independent registered public accounting firm, nor can the Audit Committee certify that the Company’s registered public accounting firm is independent under applicable rules. The Audit Committee serves a board-level oversight role, in which it provides advice, counsel and direction to management and the independent registered public accounting firm on the basis of the information it receives, discussions with management and the independent registered public accounting firm, and the experience of the Audit Committee’s members in business, financial and accounting matters.
In the first quarter of 2015, the Audit Committee reviewed and discussed the audited financial statements for the year ended December 31, 2014 with management and the independent registered public accounting firm, Ernst & Young. As required by the standards of the Public Company Accounting Oversight Board (United States) (“PCAOB”), including PCAOB Interim Auditing Standard AU Section 380, Communication with Audit Committees, the rules of the Securities and Exchange Commission and other applicable regulations, the Audit Committee also discussed with the independent registered public accounting firm matters relating to its independence, including a review of audit and non-audit fees and the written disclosures and letter received by the Audit Committee from Ernst & Young.
Based on the reviews and discussions referred to above, we recommend to the Board of Directors that the audited financial statements be included in Part II of this Annual Report on Form 10-K for the year ended December 31, 2014, for filing with the SEC.
| Respectfully submitted, |
| THE AUDIT COMMITTEE OF THE BOARD OF VIASYSTEMS, INC. |
| /s/ Christopher J. Steffen |
| Christopher J. Steffen |
| Interim Chairman of the Audit Committee |
| /s/ Michael D. Burger |
| Michael D. Burger |
| Member of the Audit Committee |
| /s/ William A. Owens |
| William A. Owens |
| Member of the Audit Committee |
| /s/ Dominic J. Pileggi |
| Dominic J. Pileggi |
| Member of the Audit Committee |
| /s/ David D. Stevens |
| David D. Stevens |
| Member of the Audit Committee |
The Audit Committee has a policy related to the review and approval of services provided by the independent registered public accounting firm. The policy requires advance approval of all audit, audit-related, tax and other services, including specifically defined permitted non-audit services, to be performed by our independent auditor. Unless the specific service has been previously preapproved, the Audit Committee must approve the service before our independent registered public accounting firm is engaged to perform it.
123
Table of Contents
All fees billed by Ernst & Young LLP for all services rendered during the years ended December 31, 2014 and 2013, are summarized in the following table (in thousands):
| Year ended December 31, | ||||||||
| 2014 | 2013 | |||||||
| Audit fees (1) |
$ | 2,289 | $ | 2,036 | ||||
| Audit-related fees (2) |
3 | 3 | ||||||
| Tax fees (3) |
99 | 209 | ||||||
| All other fees |
— | — | ||||||
|
|
|
|
|
|||||
| Total |
$ | 2,391 | $ | 2,248 | ||||
|
|
|
|
|
|||||
| (1) | Audit fees include the fees paid for the annual audit, the review of quarterly financial statements, assistance with regulatory and statutory filings and the audit of Viasystems’ internal control over financial reporting. |
| (2) | In 2014 and 2013, these fees included the annual audit of an employee benefit plan. |
| (3) | Tax fees include fees for tax compliance, tax advice and tax planning. |
During 2014, the Audit Committee reviewed and approved all services provided by the independent registered public accounting firm. Additionally, the Audit Committee considered and concluded that all the services provided by the independent registered public accounting firm were compatible with maintaining the auditor’s independence.
| Item 15. | Exhibits and Financial Statement Schedules |
1. Financial Statements
The information required by this item is included in Item 8 of Part II of this Form 10-K.
2. Financial Statement Schedules
All schedules for which provision is made in the accounting regulation of the Securities and Exchange Commission are not required under the related instructions or are inapplicable and, therefore, have been omitted.
3. Exhibits
The information required by this item is included on the exhibit index that follows the signature page of this Form 10-K.
124
Table of Contents
Pursuant to the requirements of Section 13 or 15(d) of the Securities Exchange Act of 1934, the registrant has duly caused this report to be signed on its behalf by the undersigned, thereunto duly authorized, on the 12th day of March, 2015.
Viasystems Group, Inc.
| /s/ David M. Sindelar |
/s/ Gerald G. Sax | |||
| David M. Sindelar | Gerald G. Sax | |||
| Chief Executive Officer | Senior Vice President and Chief Financial Officer | |||
| (Principal Executive Officer) | (Principal Financial Officer) | |||
| /s/ Christopher R. Isaak | ||||
| Christopher R. Isaak | ||||
| Vice President, Corporate Controller and Chief Accounting Officer (Principal Accounting Officer) | ||||
Pursuant to the requirements of the Securities Exchange Act of 1934, this report has been signed below by the following persons on behalf of the registrant and in the capacities indicated on the 12th day of March, 2015.
| /s/ Christopher J. Steffen Christopher J. Steffen |
Chairman of the Board of Directors | |||
| /s/ Jack D. Furst Jack D. Furst |
Director | |||
| /s/ Edward Herring Edward Herring |
Director | |||
| /s/ Robert F. Cummings, Jr. Robert F. Cummings, Jr. |
Director | |||
| /s/ Peter Frank Peter Frank |
Director | |||
| /s/ Kirby Dyess Kirby Dyess |
Director | |||
| /s/ William A. Owens William A. Owens |
Director | |||
| /s/ Michael Burger Michael Burger |
Director | |||
| /s/ Dominic J. Pileggi Dominic J. Pileggi |
Director | |||
| /s/ David D. Stevens David D. Stevens |
Director | |||
| /s/ David M. Sindelar David M. Sindelar |
Chief Executive Officer and Director (Principal Executive Officer) |
|||
| /s/ Timothy L. Conlon Timothy L. Conlon |
President, Chief Operating Officer and Director | |||
| /s/ Gerald G. Sax Gerald G. Sax |
Senior Vice President and Chief Financial Officer (Principal Financial Officer) |
|||
| /s/ Christopher R. Isaak Christopher R. Isaak |
Vice President, Corporate Controller and Chief Accounting Officer (Principal Accounting Officer) | |||
125
Table of Contents
The following exhibits are filed as part of this Form 10-K or incorporated by reference herein:
| Exhibit |
Exhibit Description | |
| 2.1(4) | Agreement and Plan of Merger, dated as of October 6, 2009, among Viasystems Group, Inc., Maple Acquisition Corp., and Merix Corporation (included as Annex A to the proxy statement/prospectus). | |
| 2.2(17) | Agreement and Plan of Merger by and among DDi, Viasystems and Merger Sub, dated as of April 3, 2012. | |
| 2.3(35) | Agreement and Plan of Merger, dated as of September 21, 2014, among Viasystems Group, Inc., TTM Technology Inc. and Vector Acquisition Corp. | |
| 3.1(7) | Third Amended and Restated Certificate of Incorporation of Viasystems Group, Inc. | |
| 3.2(7) | Second Amended and Restated Bylaws of Viasystems Group, Inc. | |
| 4.1(7) | Specimen Common Stock Certificate. | |
| 4.2(2) | Indenture dated May 16, 2006 between Merix Corporation and U.S. Bank National Association as trustee. | |
| 4.3(2) | Form of 4% Convertible Senior Subordinated Note Due 2013 (included in Section 2.2 of the Indenture filed as Exhibit 4.6 hereto). | |
| 4.4(7) | First Supplemental Indenture dated as of February 16, 2010 among Viasystems Group, Inc., Merix Corporation and U.S. Bank National Association, as trustee. | |
| 4.5(20) | Indenture, dated as of April 30, 2012, among Viasystems, Inc., the guarantors named therein and Wilmington Trust, National Association, as trustee. | |
| 4.6(20) | Supplemental Indenture, dated as of May 2, 2012, among Viasystems Group, Inc., Viasystems, Inc., the guarantors named therein and Wilmington Trust, National Association, as trustee. | |
| 4.7(21) | Second Supplemental Indenture, dated as of June 27, 2012, among Viasystems Group, Inc., Viasystems, Inc., the guarantors named therein and Wilmington Trust, National Association, as trustee. | |
| 4.8(33) | Third Supplemental Indenture, dated as of April 9, 2014, among Viasystems Group, Inc., Viasystems, Inc., the guarantors named therein and Wilmington Trust, National Association, as trustee. | |
| 4.9(34) | Fourth Supplemental Indenture, dated as of April 15, 2014, among Viasystems Group, Inc., Viasystems, Inc., the guarantors named therein and Wilmington Trust, National Association, as trustee. | |
| 10.1(1)* | Viasystems Group, Inc. 2003 Stock Option Plan. | |
| 10.2(10)* | Viasystems Group, Inc. 2010 Equity Incentive Plan (included as Appendix A to Proxy Statement/Prospectus). | |
| 10.3(11)* | Form of Viasystems Group, Inc. 2010 Equity Incentive Plan Nonqualified Stock Option Award Agreement. | |
| 10.4(11)* | Form of Viasystems Group, Inc. 2010 Equity Incentive Plan Restricted Stock Award Agreement. | |
| 10.5(15)* | Viasystems Group, Inc. Non-Qualified Deferred Compensation Plan. | |
| 10.6(16)* | Viasystems Group, Inc. Annual Incentive Compensation Plan. | |
| 10.7(1)* | Amended and Restated Executive Employment Agreement, dated October 13, 2003, among Viasystems Group, Inc., Viasystems, Inc., Viasystems Technologies Corp., L.L.C., the other subsidiaries party thereto, and David M. Sindelar. | |
| 10.8(1)* | Amended and Restated Executive Employment Agreement, dated January 31, 2003, among Viasystems Group, Inc., Viasystems, Inc., Viasystems Technologies Corp., L.L.C., and Timothy L. Conlon. | |
| 10.9(12)* | Amended and Restated Executive Employment Agreement, dated as of August 15, 2005, by and among Viasystems Group, Inc., Viasystems, Inc., the other subsidiaries of Viasystems Group, Inc. set forth on the signature page thereto and Gerald G. Sax. | |
| 10.10(13)* | Agreement, dated as of October 3, 2002, by and between Viasystems Technologies Corp., L.L.C. and Richard B. Kampf. | |
| 10.11(13)* | Agreement, dated as of January 31, 2000, by and between Viasystems Group, Inc. and Brian Barber. | |
| 10.12(4) | Recapitalization Agreement, dated as of October 6, 2009, by and among Viasystems Group, Inc., Hicks, Muse, Tate & Furst Equity Fund III, LP and certain of its affiliates, GSC Recovery II, L.P. and certain of its affiliates, and TCW Shared Opportunities Fund III, L.P. | |
| 10.13(4) | Note Exchange Agreement, dated as of October 6, 2009, by and among Viasystems Group, Inc., Maple Acquisition Corp., and the entities listed on Schedule I attached thereto. | |
| 10.15(5) | Collateral Trust Agreement, dated as of November 24, 2009, among Viasystems, Inc., the guarantors named therein, Wilmington Trust FSB, as trustee and collateral trustee, and the other party lien representatives from time to time party thereto. | |
| 10.16(8) | Loan and Security Agreement, dated as of February 16, 2010, by and among Viasystems Technologies Corp., L.L.C. and Merix Corporation, as borrowers, and Viasystems, Inc., Viasystems International, Inc. and Merix Asia, Inc., as guarantors, the lenders and issuing bank from time to time party thereto, Wachovia Capital Finance Corporation (New England), as administrative agent, and Wells Fargo Capital Finance, LLC, as sole lead arranger, manager and bookrunner. | |
126
Table of Contents
| 10.17(9) | Amendment No. 1 to Loan and Security Agreement, dated as of March 24, 2010, by and among Viasystems Technologies Corp., L.L.C. and Merix Corporation, as Borrowers, Viasystems, Inc., Viasystems International, Inc. and Merix Asia, Inc., as Guarantors, and Wachovia Capital Finance Corporation (New England), as Agent and Lender. | |
| 10.18(15) | Amendment No. 2 to Loan and Security Agreement and Waiver, dated as of August 2, 2011, but effective as of June 30, 2011, by and among Viasystems Technologies, Corp., L.L.C. and Viasystems Corporation, as Borrowers, Viasystems, Inc., Viasystems International, Inc. and Merix Asia, Inc., as Guarantors, and Wells Fargo Capital Finance, LLC, as Agent and Lender. | |
| 10.19(16) | Amendment No. 3 to Loan and Security Agreement and Waiver, dated as of December 8, 2011, by and among Viasystems Technologies, Corp., L.L.C. and Viasystems Corporation, as Borrowers, Viasystems, Inc., Viasystems International, Inc. and Merix Asia, Inc., as Guarantors, and Wells Fargo Capital Finance, LLC, as Agent and Lender. | |
| 10.20(18) | Amendment No. 4 to Loan and Security Agreement, dated as of April 3, 2012, by and among Viasystems Technologies, Corp., L.L.C. and Viasystems Corporation, as Borrowers, Viasystems, Inc., Viasystems International, Inc. and Merix Asia, Inc., as Guarantors, and Wells Fargo Capital Finance, LLC, as Agent and Lender. | |
| 10.21(19) | Amendment No. 5 to Loan and Security Agreement, dated as of April 16, 2012, by and among Viasystems Technologies, Corp., L.L.C. and Viasystems Corporation, as Borrowers, Viasystems, Inc., Viasystems International, Inc. and Merix Asia, Inc., as Guarantors, and Wells Fargo Capital Finance, LLC, as Agent and Lender. | |
| 10.22(22) | Amendment No. 6 to Loan and Security Agreement and Waiver, dated as of April 30, 2012, by and among Viasystems Technologies, Corp., L.L.C. and Viasystems Corporation, as Borrowers, Viasystems, Inc., Viasystems International, Inc. and Merix Asia, Inc., as Guarantors, and Wells Fargo Capital Finance, LLC, as Agent and Lender. | |
| 10.23(23) | Amendment No. 7 to Loan and Security Agreement and Waiver, dated as of December 28, 2012, by and among Viasystems Technologies Corp., L.L.C., Viasystems Corporation, Viasystems North America, Inc., DDi Intermediate Holdings Corp., DDi Capital Corp., DDi Global Corp., DDi Sales Corp., DDi North Jackson Corp., DDi Milpitas Corp., Coretec Holdings Inc., DDi Cleveland Holdings Corp., DDi Denver Corp., Coretec Building Inc., DDi Cleveland Corp., and Trumauga Properties, Ltd., as Borrowers, Viasystems, Inc., Viasystems International, Inc. and Merix Asia, Inc., as Guarantors, and Wells Fargo Capital Finance, LLC, as Agent and Lender. | |
| 10.24(20) | Collateral Trust Agreement, dated as of April 30, 2012, among Viasystems, Inc., the guarantors named therein, Wilmington Trust, National Association as trustee and collateral trustee, and the other parity lien representatives from time to time party thereto. | |
| 10.25(20) | Intercreditor Agreement, dated as of April 30, 2012, among Viasystems, Inc., the grantors named therein, Wells Fargo Capital Finance, LLC, in its capacity as collateral agent for the First Lien Claimholders and Wilmington Trust, National Association, in its capacity as collateral trustee for the Second Lien Claimholders. | |
| 10.26(9) | English translation of the Zhongshan 2010 Credit Facility Contract, dated as of March 26, 2010, by and between Kalex Multi-Layer Circuit Board (Zhongshan) Limited, as Borrower, and China Construction Bank Zhongshan Branch, as Lender. | |
| 10.27(14) | English translation of the renewal of the Zhongshan 2010 Credit Facility Contract, dated as of March 25, 2011, by and between Kalex Multi-Layer Circuit Board (Zhongshan) Limited, as Borrower, and China Construction Bank Zhongshan Branch, as Lender and Amendment No. 1 thereto, dated as of March 28, 2011. | |
| 10.28(22) | English translation of the renewal of the Zhongshan 2010 Credit Facility Contract, dated as of April 26, 2012, by and between Kalex Multi-Layer Circuit Board (Zhongshan) Limited, as Borrower, and China Construction Bank Zhongshan Branch, as Lender and Amendment No. 2 thereto, dated as of April 26, 2012. | |
| 10.29(3) | English translation of the Huiyang 2009 Foreign Exchange Loan, dated June 26, 2009, by and between Merix Printed Circuits Technology Limited and Industrial and Commercial Bank of China, Limited. | |
| 10.30(3) | English translation of the Maximum Amount Mortgage Agreement, dated June 26, 2009, by and between Merix Printed Circuits Technology Limited and Industrial and Commercial Bank of China, Limited. | |
| 10.31(6) | English translation of the Lease Agreement on Tong Fu Kang Plant Building (Building A, Shenzhen), dated as of October 26, 2006, by and between Shenzhen Tong Fu Kang Industry Development Co., Ltd and Viasystems Chang Yuan EMS (Shenzhen) Co., Ltd (now known as Viasystems EMS (Shenzhen) Co., Ltd). | |
127
Table of Contents
| 10.32(16) | English translation of the Lease Agreement on Tong Fu Kang Plant Building (Building A, Shenzhen), dated as of May 25, 2011, by and between Shenzhen Tong Fu Kang Industry Development Co., Ltd and Viasystems EMS (Shenzhen) Co., Ltd. | |
| 10.33(6) | English translation of the Lease Agreement on Tong Fu Kang Plant Building (Building D, Shenzhen), dated as of May 6, 2003, by and between Shenzhen Tong Fu Kang Industry Development Co., Ltd and Viasystems Chang Yuan EMS (Shenzhen) Co., Ltd (now known as Viasystems EMS (Shenzhen) Co., Ltd). | |
| 10.34(6) | Industrial Lease, dated as of April 16, 2008, by and between Verde 9580 Joe Rodriquez LP and Viasystems Technologies Corp., L.L.C. | |
| 10.35(6) | First Amendment to Industrial Lease, dated as of December 8, 2008, by and between Verde 9580 Joe Rodriquez LP and Viasystems Technologies Corp., L.L.C. | |
| 10.36(16) | Temporary Occupancy Agreement, dated as of June 1, 2011, by and between Verde 9580 Joe Rodriquez LP and Viasystems Technologies Corp., L.L.C. | |
| 10.37(15) | Industrial Lease Agreement, dated as of June 20, 2011, by and among Verde Libramiento Aeropuerto, LLC and International Manufacturing Solutions Operaciones, S. de R.L. de C.V. | |
| 10.38(11) | English translation of the Lease Agreement on Gutangao Factory Premises and Dormitories, dated as of January 1, 2008, by and between Desai (Huizhou) Group Company Limited and Merix Printed Circuits (Huizhou) Company Limited. | |
| 10.39(12) | English translation of the Lease Supplement, effective January 1, 2011, to the Lease Agreement on Gutangao Factory Premises and Dormitories, dated as of January 1, 2008, by and between Desai (Huizhou) Group Company Limited and Merix Printed Circuits (Huizhou) Company Limited. | |
| 10.40(11) | Lease Agreement, dated as of July 1, 1987, by and between B.S. Enterprises and Data Circuit Systems, Inc., as amended by the Lease Amendments, dated as of June 23, 2000 and July 1, 2007, concerning 335 Turtle Creek Court. | |
| 10.41(11) | Lease Agreement, dated as of September 20, 2005, by and between KML Fremont Investors LLC and Merix San Jose, Inc., concerning 340 Turtle Creek Court. | |
| 10.42(12) | Lease Amendment, dated as of October 1, 2010, to the Lease Agreement, dated as of September 20, 2005, by and between KML Fremont Investors LLC and Merix San Jose, Inc., concerning 340 Turtle Creek Court. | |
| 10.43(22) | Second Lease Amendment, dated as of July 1, 2012, to the Lease Agreement, dated as of September 20, 2005, by and between James Rando and Viasystems Corporation, concerning 340 Turtle Creek Court. | |
| 10.44(11) | Lease Agreement, dated as of January 1, 2010, by and between Gail H. Ducote, Robert D. Ducote and Merix Corporation, concerning 355 Turtle Creek Court. | |
| 10.45(22) | Lease Agreement, dated as of July 1, 2012, by and between Gail H. Ducote and Robert D. Ducote and Viasystems Corporation, concerning 355 Turtle Creek Court. | |
| 10.46(24) | Credit Agreement dated September 23, 2010, by and between DDi Corp., DDi Global Corp., DDi Sales Corp., DDi North Jackson Corp., DDi Milpitas Corp., DDi Denver Corp., and DDi Cleveland Corp., DDi Toronto Corp., the other Loan Parties thereto, the lenders from time to time party thereto, JPMorgan Chase Bank, N.A., as Administrative Agent and U.S. Lender, and JPMorgan Chase Bank, N.A., Toronto Branch, as Canadian Administrative Agent and Canadian Lender. | |
| 10.47(25) | First Amendment to Credit Agreement by and between DDi Corp., DDi Global Corp., DDi Sales Corp., DDi North Jackson Corp., DDi Milpitas Corp., DDi Denver Corp., and DDi Cleveland Corp., DDi Toronto Corp., the other Loan Parties thereto, the lenders from time to time party thereto, JPMorgan Chase Bank, N.A., as Administrative Agent and U.S. Lender, and JPMorgan Chase Bank, N.A., Toronto Branch, as Canadian Administrative Agent and Canadian Lender. | |
| 10.48(24) | Pledge and Security Agreement dated September 23, 2010 by and between DDi Corp., DDi Intermediate Holdings Corp., DDi Capital Corp., DDi Global Corp., DDi Sales Corp., DDi North Jackson Corp., DDi Milpitas Corp., Coretec Holdings Inc., DDi Cleveland Holdings Corp., DDi Denver Corp., Coretec Building Inc., DDi Cleveland Corp., Trumauga Properties, Ltd. and JPMorgan Chase Bank, N.A. | |
| 10.49(24) | Pledge and Security Agreement dated as of September 23, 2010 by and between DDi Toronto Corp. and JPMorgan Chase Bank, N.A. | |
| 10.50(26) | Real Estate Sales Contract and Joint Escrow Instructions dated December 30, 2011 by and between DDi Global Corp. and Multi-Fineline Electronix, Inc. | |
| 10.51(27) | Credit Agreement, dated March 28, 2012 between DDi Global Corp. and Wells Fargo Bank, N.A. | |
| 10.52(31) | Amendment to Credit Agreement, dated as of November 1, 2012 between DDi Global Corp. and Wells Fargo Bank, N.A. | |
| 10.53(27) | Promissory Note dated March 28, 2012 by DDi Global Corp. in favor of Wells Fargo Bank, N.A. | |
| 10.54(27) | Guaranty dated March 28, 2012 by DDi Corp. in favor of Wells Fargo Bank, N.A. | |
| 10.55(27) | Deed of Trust and Assignment of Rents and Leases dated March 28, 2012 by DDi Global Corp. in favor of Wells Fargo Bank, N.A. | |
128
Table of Contents
| 10.56(29) | Form of Performance Share Units Award Agreement | |
| 10.57(29) | Form of Leveraged Performance Shares Agreement dated February 5, 2013 | |
| 10.58(30) | Amendment No. 8 to Loan and Security Agreement and Waiver, dated as of December 31, 2013, by and among Viasystems Technologies Corp., L.L.C., Viasystems Corporation, Viasystems Sales, Inc., DDi Cleveland Holdings Corp., Coretec Building Inc., and Trumauga Properties, Ltd. as Borrowers, Viasystems, Inc., as Guarantors, and Wells Fargo Capital Finance, LLC, as Agent and Lender. | |
| 10.59(33) | Amendment No. 9 to Loan and Security Agreement and Waiver, dated as of April 9, 2014, by and among Viasystems Technologies Corp., L.L.C., Viasystems Corporation, Viasystems Sales, Inc., DDi Cleveland Holdings Corp., Coretec Building Inc., and Trumauga Properties, Ltd. as Borrowers, Viasystems, Inc., as Guarantors, and Wells Fargo Capital Finance, LLC, as Agent and Lender. | |
| 10.60(33)* | Form of Viasystems Group, Inc. 2010 Equity Incentive Plan Performance Share Units Award Agreement. | |
| 10.61(33)* | Form of Viasystems Group, Inc. 2010 Equity Incentive Plan 2014 Leveraged Share Units Award Agreement. | |
| 10.62(36)* | Amended and Restated Employment Agreement, dated as of April 9, 2014, by and among Viasystems Group, Inc., Viasystems, Inc., Viasystems Technologies Corp. LLC and their subsidiaries party thereto, as employer, and David M. Sindelar, as employee. | |
| 10.63(36)* | Amended and Restated Employment Agreement, dated as of April 9, 2014, by and among Viasystems Group, Inc., Viasystems, Inc., Viasystems Technologies Corp. LLC and their subsidiaries party thereto, as employer, and Gerald G. Sax, as employee. | |
| 10.64(36)* | Amended and Restated Employment Agreement, dated as of April 9, 2014, by and among Viasystems Group, Inc., Viasystems, Inc., Viasystems Technologies Corp. LLC and their subsidiaries party thereto, as employer, and Timothy L. Conlon, as employee. | |
| 14.1(37) | Code of Business Conduct and Ethics (as amended October 24, 2013). | |
| 14.2(33) | Code of Business Conduct and Ethics (as amended April 1, 2014). | |
| 21.1(28) | Subsidiaries of Viasystems Group, Inc. | |
| 23.1(28) | Consent of Ernst & Young LLP. | |
| 31.1(28) | Certification of the Principal Executive Officer pursuant to 17 CFR 240.13a-14(a), as adopted pursuant to § 302 of the Sarbanes-Oxley Act of 2002. | |
| 31.2(28) | Principal Financial Officer pursuant to 17 CFR 240.13a-14(a), as adopted pursuant to § 302 of the Sarbanes-Oxley Act of 2002. | |
| 32.1(28) | Chief Executive Officer and Chief Financial Officer Certification pursuant to 18 U.S.C. § 1350, as adopted pursuant to § 906 of the Sarbanes-Oxley Act of 2002. | |
| 101(28) | The following materials from Viasystems Group, Inc.’s Annual Report on Form 10-K for the year ended December 31, 2014, formatted in XBRL (eXtensible Business Reporting Language): (i) Consolidated Statements of Operations and Comprehensive Income (Loss) for the years ended December 31, 2014, 2013 and 2012 (ii) Consolidated Balance Sheets as of December 31, 2014 and 2013, (iii) Consolidated Statements of Stockholder’s Equity for the years ended December 31, 2014, 2013 and 2012, (iv) Consolidated Statements of Cash Flows for the years ended December 31, 2014, 2013 and 2012, and (v) Notes to Consolidated Financial Statements. | |
| (1) | Incorporated by reference to Registration Statement No. 333-113664 on Form S-1/A of Viasystems Group, Inc. filed on April 28, 2004. |
| (2) | Incorporated by reference to the Form 8-K of Merix Corporation filed on May 16, 2006. |
| (3) | Incorporated by reference to the Form 8-K of Merix Corporation filed on June 30, 2009. |
| (4) | Incorporated by reference to the Registration Statement No. 333-163040 on Form S-4 of Viasystems Group, Inc. filed on November 12, 2009. |
| (5) | Incorporated by reference to the Form 8-K of Viasystems, Inc. filed on December 2, 2009. |
| (6) | Incorporated by reference to Registration Statement No. 333-163040 on Form S-4/A of Viasystems Group, Inc. filed on December 17, 2009. |
| (7) | Incorporated by reference to the Form 8-K of Viasystems Group, Inc. filed on February 17, 2010. |
| (8) | Incorporated by reference to the Form 8-K of Viasystems Group, Inc. filed on February 22, 2010. |
| (9) | Incorporated by reference to the Form 8-K of Viasystems Group, Inc. filed on March 30, 2010. |
| (10) | Incorporated by reference to the Proxy Statement of Viasystems Group, Inc. filed on April 30, 2010. |
129
Table of Contents
| (11) | Incorporated by reference to the Quarterly Report on Form 10-Q of Viasystems Group, Inc. filed on May 17, 2010. |
| (12) | Incorporated by reference to the Annual Report on Form 10-K of Viasystems Group, Inc. filed on February 9, 2011. |
| (13) | Incorporated by reference to Registration Statement No. 333-172657 on Form S-3 of Viasystems Group, Inc. filed on March 7, 2011. |
| (14) | Incorporated by reference to the Quarterly Report on Form 10-Q of Viasystems Group, Inc. filed on May 3, 2011. |
| (15) | Incorporated by reference to the Quarterly Report on Form 10-Q of Viasystems Group, Inc. filed on August 10, 2011. |
| (16) | Incorporated by reference to the Annual Report on Form 10-K of Viasystems Group, Inc. filed on February 15, 2012. |
| (17) | Incorporated by reference to Form 8-K of Viasystems Group, Inc. filed on April 4, 2012. |
| (18) | Incorporated by reference to Form 8-K of Viasystems Group, Inc. filed on April 9, 2012. |
| (19) | Incorporated by reference to Form 8-K of Viasystems Group, Inc. filed on April 17, 2012. |
| (20) | Incorporated by reference to Form 8-K of Viasystems Group, Inc. filed on May 2, 2012. |
| (21) | Incorporated by reference to Form 8-K of Viasystems Group, Inc. filed on June 28, 2012. |
| (22) | Incorporated by reference to the Quarterly Report on Form 10-Q of Viasystems Group, Inc. filed on August 8, 2012. |
| (23) | Incorporated by reference to Form 8-K of Viasystems Group, Inc. filed on January 2, 2013. |
| (24) | Incorporated by reference to Form 8-K of DDi Corp. filed on September 29, 2010. |
| (25) | Incorporated by reference to Form 8-K of DDi Corp. filed on March 15, 2011. |
| (26) | Incorporated by reference to the Annual Report on Form 10-K of DDi Corp. filed on February 17, 2012. |
| (27) | Incorporated by reference to the Quarterly Report on Form 10-Q of DDi Corp. filed on April 25, 2012. |
| (28) | Filed herewith. |
| (29) | Incorporated by reference to Form 10-Q of Viasystems Group, Inc. filed on May 9, 2013. |
| (30) | Incorporated by reference to Form 8-K of Viasystems Group, Inc. filed on January 3, 2014. |
| (31) | Incorporated by reference to Form 10-K of Viasystems Group, Inc. filed on February 15, 2013. |
| (32) | Incorporated by reference to Form 8-K of Viasystems Group, Inc. filed on September 22, 2014. |
| (33) | Incorporated by reference to Form 8-K of Viasystems Group, Inc. filed on April 10, 2014. |
| (34) | Incorporated by reference to Form 8-K of Viasystems Group, Inc. filed on April 15, 2014. |
| (35) | Incorporated by reference to Form 8-K of Viasystems Group, Inc., filed on September 22, 2014. |
| (36) | Incorporated by reference to Form 8-K of Viasystems Group, Inc. filed on September 24, 2014. |
| (37) | Incorporated by reference to Form 10-K of Viasystems Group, Inc. filed on February 14, 2014. |
| * | Indicates management contract or compensatory plan or arrangement. |
130