Attached files
| file | filename |
|---|---|
| 8-K - 8-K - PAR PACIFIC HOLDINGS, INC. | a8-kinvestormaterials.htm |

Piceance Energy Investment Overview March 2015

2 Preliminary Note Par Petroleum Corporation (the “Company”) owns a 33.3% interest in Piceance Energy, LLC and does not operate the Piceance Energy properties. However, the information contained herein has been derived from sources Par believes to be reliable. The information contained in this presentation has been prepared to assist you in making your own evaluation of the Company and does not purport to contain all of the information you may consider important in deciding whether to invest in shares of the Company’s common stock. Any estimates or projections with respect to future performance have been provided to assist you in your evaluation but should not be relied upon as an accurate representation of future results. Certain statements, estimates and financial information contained in this presentation constitute forward-looking statements. Such forward-looking statements involve known and unknown risks and uncertainties that could cause actual events or results to differ materially from the results implied or expressed in such forward-looking statements. While presented with numerical specificity, certain forward-looking statements are based (1) upon assumptions that are inherently subject to significant business, economic, regulatory, environmental, seasonal and competitive uncertainties, contingencies and risks including, without limitation, the ability to maintain adequate liquidity, realize the potential benefit of our net operating loss tax carryforwards, obtain sufficient debt and equity financings, capital costs, well production performance, operating costs, commodity pricing, differentials or crack spreads and other known and unknown risks (all of which are difficult to predict and many of which are beyond the Company's control) some of which are further discussed in the Company’s periodic and other filings with the SEC and (2) upon assumptions with respect to future business decisions that are subject to change. There can be no assurance that the results implied or expressed in such forward-looking statements or the underlying assumptions will be realized and that actual results of operations or future events will not be materially different from the results implied or expressed in such forward-looking statements. Under no circumstances should the inclusion of the forward-looking statements be regarded as a representation, undertaking, warranty or prediction by the Company or any other person with respect to the accuracy thereof or the accuracy of the underlying assumptions, or that the Company will achieve or is likely to achieve any particular results. The forward-looking statements are made as of the date hereof and the Company disclaims any intent or obligation to update publicly or to revise any of the forward-looking statements, whether as a result of new information, future events or otherwise. Recipients are cautioned that forward-looking statements are not guarantees of future performance and, accordingly, recipients are expressly cautioned not to put undue reliance on forward-looking statements due to the inherent uncertainty therein.

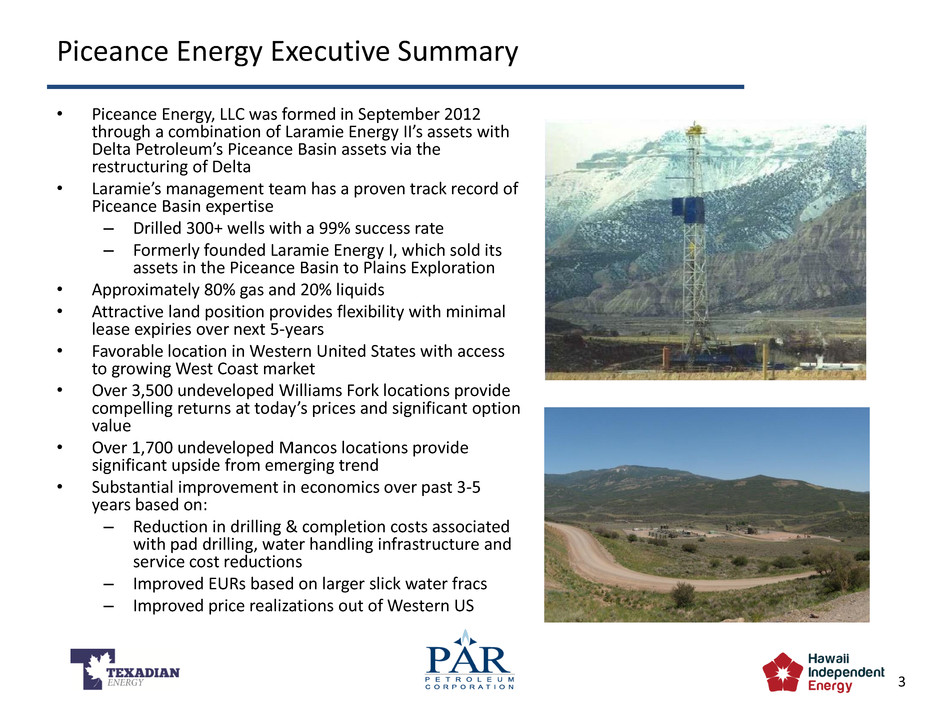
3 Piceance Energy Executive Summary • Piceance Energy, LLC was formed in September 2012 through a combination of Laramie Energy II’s assets with Delta Petroleum’s Piceance Basin assets via the restructuring of Delta • Laramie’s management team has a proven track record of Piceance Basin expertise – Drilled 300+ wells with a 99% success rate – Formerly founded Laramie Energy I, which sold its assets in the Piceance Basin to Plains Exploration • Approximately 80% gas and 20% liquids • Attractive land position provides flexibility with minimal lease expiries over next 5-years • Favorable location in Western United States with access to growing West Coast market • Over 3,500 undeveloped Williams Fork locations provide compelling returns at today’s prices and significant option value • Over 1,700 undeveloped Mancos locations provide significant upside from emerging trend • Substantial improvement in economics over past 3-5 years based on: – Reduction in drilling & completion costs associated with pad drilling, water handling infrastructure and service cost reductions – Improved EURs based on larger slick water fracs – Improved price realizations out of Western US

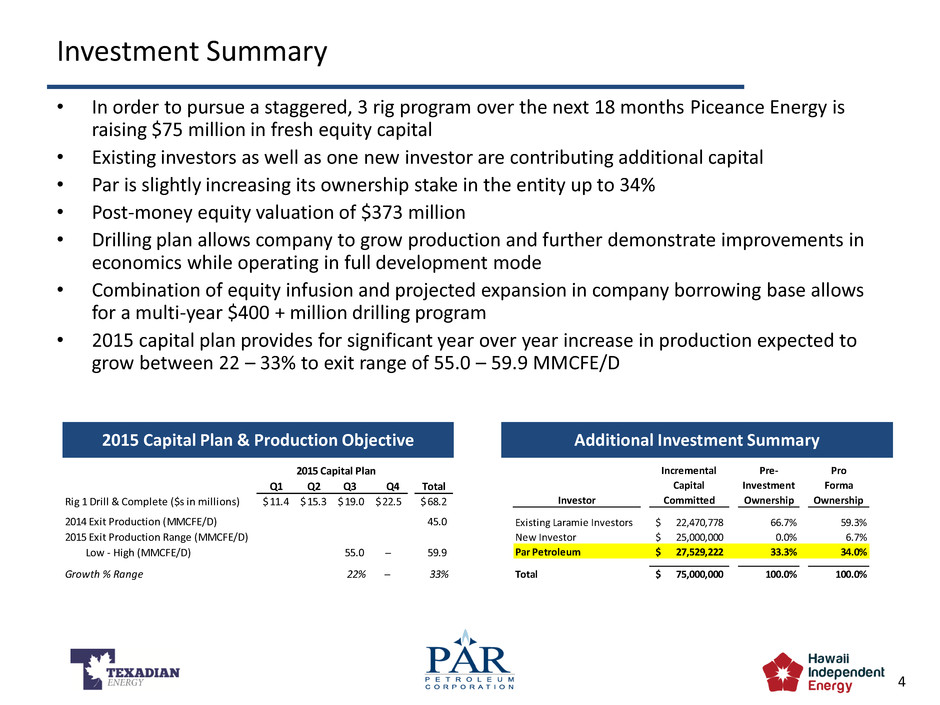
4 Investment Summary • In order to pursue a staggered, 3 rig program over the next 18 months Piceance Energy is raising $75 million in fresh equity capital • Existing investors as well as one new investor are contributing additional capital • Par is slightly increasing its ownership stake in the entity up to 34% • Post-money equity valuation of $373 million • Drilling plan allows company to grow production and further demonstrate improvements in economics while operating in full development mode • Combination of equity infusion and projected expansion in company borrowing base allows for a multi-year $400 + million drilling program • 2015 capital plan provides for significant year over year increase in production expected to grow between 22 – 33% to exit range of 55.0 – 59.9 MMCFE/D Additional Investment Summary 2015 Capital Plan & Production Objective Investor Incremental Capital Committed Pre- Investment Ownership Pro Forma Ownership Existing Laramie Investors 22,470,778$ 66.7% 59.3% New Investor 25,000,000$ 0.0% 6.7% Par Petroleum 27,529,222$ 33.3% 34.0% Total 75,000,000$ 100.0% 100.0% 2015 Capital Plan Q1 Q2 Q3 Q4 Total Rig 1 Drill & Complete ($s in illions) 11.4$ 15.3$ 19.0$ 22.5$ 68.2$ 2014 Exit Production (MMCFE/D) 45.0 2015 Exit Production Ra g (MMCFE/D) Low - High (MMCFE/D) 55.0 ─ 59.9 Growth % Range 22% ─ 33%

5 • The economics of developing natural gas in the Piceance Basin have significantly improved over the past five years: – Basis differentials have decreased significantly due to increased interstate pipeline capacity going west – Multi-stage large volume slick water fracs have increased EURs by over 50% with the opportunity for further improvements • Recent drilling and completion developments offer further improvements: – Improving drilling efficiencies with most recent wells drilled in 5 days vs. history of 10+ days – Further improvements on frac design under evaluation – Multi-well continuous pad drilling of both directional and horizontal wells significantly lowers F&D costs – Water infrastructure for freshwater, flowback and disposal lower overall water costs in a development drilling program Improving Economics in the Piceance Basin Improvements in Drilling & Completion Costs Pro forma D&C costs down nearly 33% from historical costs ($s i millio s) Historical Costs Leading Edge Cost Range - Post Water Facilities Leading Edge Cost Range With Service Cost Reductions Pre-Water Facility Post-Water Facility High-End Low-End High-End Low-End Drill & Case 0.75$ 0.75$ 0.60$ 0.50$ 0.54$ 0.45$ Complete 1.05$ 0.85$ 0.85$ 0.85$ 0.76$ 0.76$ Total 1.80$ 1.60$ 1.45$ 1.35$ 1.30$ 1.21$

6 Advances in Completion Design driving EURs higher Williams Fork Frac History – Water Volume vs. EUR • Additional water infrastructure allows for higher volume completions yielding improved EURs 2006 2008 2011 - 2013 2014 0.00 0.25 0.50 0.75 1.00 1.25 1.50 1.75 2.00 2.25 2.50 - 10,000 20,000 30,000 40,000 50,000 60,000 70,000 80,000 90,000 100,000 EUR/ W el l ( B cf ) Frac Water Volume Pumped (bbls/well) Pad Sand (lbs) Water (gal) Water (bbls) EUR/Well (Bcf) Pad 1 500,150 517,338 12,318 0.7 Pad 2 754,600 1,531,100 36,455 1.1 Pad 3 1,336,113 2,672,267 63,625 1.7 Pad 4 1,914,960 4,082,770 97,209 2.3

7 Single Well Economics & Natural Gas Price Sensitivities • Reducing well costs to $1.4 MM shows capability of creating a repeatable gas inventory with 20%+ IRR profile based on NYMEX strip pricing • Improvements in drilling times suggest further reductions in D&C costs to $1.25 MM further improving economics Case 1 - Current Cost Structure 1.8 Bcf Gross EUR/Well $1.4MM D&C Cost Midpoint Nymex Gas Price ($/MMBtu) Oil Price ($/bbl) NGL Price ($/gal) NPV10 ($M/Well) IROR $2.00 $50.00 $0.36 (408) 2% $2.50 $50.00 $0.36 (97) 8% $3.00 $50.00 $0.36 214 14% $3.50 $50.00 $0.36 525 21% 3/6/2015 NYMEX Strip 669 24% $4.00 $50.00 $0.36 836 29% $4.50 $50.00 $0.36 1,147 37% $5.00 $50.00 $0.36 1,457 45% $5.50 $50.00 $0.36 1,769 55% $6.00 $50.00 $0.36 2,080 69% Case 2 - With Continued Service Cost Reductions 1.8 Bcf Gross EUR/Well $1.25MM D&C Cost Midpoint Nymex Gas Price ($/MMBtu) Oil Price ($/bbl) NGL Price ($/gal) NPV10 ($M/Well) IROR $2.00 $50.00 $0.36 (270) 4% $2.50 $50.00 $0.36 41 11% $3.00 $50.00 $0.36 352 18% $3.50 $50.00 $0.36 663 27% 3/6/2015 NYMEX Strip 807 29% $4.00 $50.00 $0.36 974 35% $4.50 $50.00 $0.36 1,285 44% $5.00 $50.00 $0.36 1,596 55% $5.50 $50.00 $0.36 1,907 70% $6.00 $50.00 $0.36 2,218 81% -20% 0% 20% 40% 60% 80% 100% (500) - 500 1,000 1,500 2,000 2,500 $2 .0 0 $2 .5 0 $3 .0 0 $3 .5 0 $4 .0 0 $4 .5 0 $5 .0 0 $5 .5 0 $6 .0 0 IR O R N PV ($ M ) NYMEX Gas Price ($/MMBtu) 21 Well Pad ($1.4MM/Well D&C) NPV10 ($M/Well) IROR Strip Pricing -20% 0% 20% 40% 60% 80% 100% (500) - 500 1,000 1,500 2,000 2,500 $2 .0 0 $2 .5 0 $3 .0 0 $3 .5 0 $4 .0 0 $4 .5 0 $5 .0 0 $5 .5 0 $6 .0 0 IR O R N PV ($ M ) NYMEX Gas Price ($/MMBtu) 21 Well Pad ($1.25MM/Well D&C) NPV10 ($M/Well) IROR Strip Pricing

8 $(1.46) $(0.18) $(0.29) $0.30 ($0.35) ($1.11) ($2.00) ($1.50) ($1.00) ($0.50) $0.00 $0.50 2007 to 2011 2011 to now 3 Yr. Fwd 2007 to 2011 2011 to now 3 Yr. Fwd $ / MMB TU Rockies Gas Realizations Improving Rockies West Basis Strengthening(1) Appalachian East Basis Weakening(2) Source: Internal Analysis (1) Northwest Rocky Mountain basis. (2) Dominion South basis (3) 3-year average strip price as of 3/09/2015 (3) (3)

9 Piceance Energy Acreage Footprint • All Piceance Energy acreage in Garfield & Mesa Counties, Colorado • Located in prime geologic fairway areas, south of Colorado River and Interstate 70 • Field operations and oil field services based in Grand Junction, CO • Headquarters located in Denver, CO Company’s Acreage

10 Conclusion • Reductions in drilling & completion costs more than offsetting commodity price • Excellent option value embedded in the asset base long-term • Dedicated and experienced operators with superior track record in the basin • Committed group of like minded equity sponsors with track record of value creation across commodity cycles
