Attached files
| file | filename |
|---|---|
| EXCEL - IDEA: XBRL DOCUMENT - Fuel Systems Solutions, Inc. | Financial_Report.xls |
| EX-31.2 - EX-31.2 - Fuel Systems Solutions, Inc. | fsys-ex312_201412316.htm |
| EX-32.2 - EX-32.2 - Fuel Systems Solutions, Inc. | fsys-ex322_201412317.htm |
| EX-23.1 - EX-23.1 - Fuel Systems Solutions, Inc. | fsys-ex231_201412318.htm |
| EX-31.1 - EX-31.1 - Fuel Systems Solutions, Inc. | fsys-ex311_2014123110.htm |
| EX-32.1 - EX-32.1 - Fuel Systems Solutions, Inc. | fsys-ex321_2014123111.htm |
| EX-21.1 - EX-21.1 - Fuel Systems Solutions, Inc. | fsys-ex211_201412319.htm |
UNITED STATES
SECURITIES AND EXCHANGE COMMISSION
Washington, D.C. 20549
FORM 10-K
(Mark One)
|
x |
ANNUAL REPORT PURSUANT TO SECTION 13 OR 15(d) OF THE SECURITIES EXCHANGE ACT OF 1934 |
For the fiscal year ended December 31, 2014
or
|
¨ |
TRANSITION REPORT PURSUANT TO SECTION 13 OR 15(d) OF THE SECURITIES EXCHANGE ACT OF 1934 |
Commission File No.: 001-32999
FUEL SYSTEMS SOLUTIONS, INC.
(Exact Name of Registrant as Specified in Its Charter)
|
Delaware |
|
20-3960974 |
|
(State or Other Jurisdiction Of Incorporation or Organization) |
|
(I.R.S. Employer Identification No.) |
780 Third Avenue, 25th Floor, New York, New York 10017
(Address of Principal Executive Offices, Including Zip Code)
(646) 502-7170
(Registrant’s telephone number, including area code)
Securities registered pursuant to Section 12(b) of the Act:
Common Stock, $0.001 par value per share (including attached Stock Purchase Rights)
Securities registered pursuant to Section 12(g) of the Act:
None
Indicate by check mark if the registrant is a well-known seasoned issuer, as defined in Rule 405 of the Securities Act. Yes ¨ No x
Indicate by check mark if the registrant is not required to file reports pursuant to Section 13 or Section 15(d) of the Act. Yes ¨ No x
Indicate by check mark whether the registrant (1) has filed all reports required to be filed by Section 13 or 15(d) of the Securities Exchange Act of 1934 during the preceding 12 months (or for such shorter period that the registrant was required to file such reports), and (2) has been subject to such filing requirements for the past 90 days. Yes x No ¨
Indicate by check mark whether the registrant has submitted electronically and posted on its corporate Website, if any every Interactive Data File required to be submitted and posted pursuant to Rule 405 of Regulation S-T (§ 232.405 of this chapter) during the preceding 12 months (or for such shorter period that the registrant was required to submit and post such files). Yes x No ¨
Indicate by check mark if disclosure of delinquent filers pursuant to Item 405 of Regulation S-K (§ 229.405 of this chapter) is not contained herein, and will not be contained, to the best of registrant’s knowledge, in definitive proxy or information statements incorporated by reference in Part III of this Form 10-K or any amendment to this Form 10-K. x
Indicate by check mark whether the registrant is a large accelerated filer, an accelerated filer, a non-accelerated filer, or a smaller reporting company. See definitions of “large accelerated filer”, “accelerated filer” and “smaller reporting company” in Rule 12b-2 of the Exchange Act. (Check one):
Large accelerated filer ¨ Accelerated filer x Non-accelerated filer ¨ Smaller reporting company ¨
Indicate by check mark whether the registrant is a shell company (as defined in Rule 12b-2 of the Exchange Act). Yes ¨ No x
The aggregate market value of the common stock held by non-affiliates of the registrant as of June 30, 2014, was approximately $205.5 million based upon the closing sale price of the registrant’s common stock of $11.14 on June 30, 2014, as reported on the Nasdaq Stock Market.
As of February 13, 2015, the registrant had 19,331,413 shares of common stock, $0.001 par value per share, outstanding.
DOCUMENTS INCORPORATED BY REFERENCE
Portions of the registrant’s Proxy Statement which will be filed with the SEC in connection with the 2015 Annual Meeting of Shareholders are incorporated by reference into Part III of this Form 10-K.
FUEL SYSTEMS SOLUTIONS, INC.
TABLE OF CONTENTS
|
|
|
|
Page |
|
|
|
PART I
|
|
|
Item 1. |
|
4 |
|
|
Item 1A. |
|
10 |
|
|
Item 1B. |
|
17 |
|
|
Item 2. |
|
17 |
|
|
Item 3. |
|
17 |
|
|
Item 4. |
|
17 |
|
|
|
|
PART II
|
|
|
Item 5. |
|
18 |
|
|
Item 6. |
|
19 |
|
|
Item 7. |
|
Management’s Discussion and Analysis of Financial Condition and Results of Operations |
21 |
|
Item 7A. |
|
38 |
|
|
Item 8. |
|
38 |
|
|
Item 9. |
|
Changes in and Disagreements with Accountants on Accounting and Financial Disclosure |
38 |
|
Item 9A. |
|
38 |
|
|
Item 9B. |
|
39 |
|
|
|
|
PART III
|
|
|
Item 10. |
|
40 |
|
|
Item 11. |
|
40 |
|
|
Item 12. |
|
Security Ownership of Certain Beneficial Owners and Management and Related Stockholder Matters |
40 |
|
Item 13. |
|
Certain Relationships and Related Transactions and Director Independence |
40 |
|
Item 14. |
|
41 |
|
|
|
|
PART IV
|
|
|
Item 15. |
|
42 |
|
|
|
|
45 |
|
|
|
|
F-1 |
2
FORWARD-LOOKING STATEMENTS
This Form 10-K contains certain forward-looking statements within the meaning of the “safe harbor” provisions of the Private Securities Litigation Reform Act of 1995. These statements may be found throughout this Form 10-K. These statements are not historical facts, but instead involve known and unknown risks, uncertainties and other factors that may cause our or our company’s actual results, levels of activity, performance or achievements to be materially different from the information expressed or implied by these forward looking statements. Statements in this Form 10-K that are not historical facts are hereby identified as “forward-looking statements” for the purpose of the safe harbor provided by Section 21E of the Securities Exchange Act of 1934, as amended, and Section 27A of the Securities Act of 1933, as amended. Words such as: “may,” “will,” “would,” “should,” “could,” “expect,” “anticipate,” “intend,” “plan,” “anticipate,” “believe,” “estimate,” “predict,” “potential,” “continue,” “seeks,” “on-going” or the negative of these terms or other comparable terminology often identify forward-looking statements, although not all forward-looking statements contain these words. You should consider statements that contain these words carefully because they describe our expectations, plans, strategies and goals and beliefs concerning future business conditions, our results of operations, financial position and our business outlook, or state other “forward-looking” information based on currently available information. There are a number of important factors that could cause actual results to differ materially from the results anticipated by these forward-looking statements. These risks and uncertainties and certain other factors which may impact our continuing business financial condition or results of operations, or which may cause actual results to differ from such forward-looking statements, include, but are not limited to, the unpredictable nature of the developing alternative fuel U.S. automotive market, customer dissatisfaction with our products or services, the inability to deliver our products on schedule, a further slowing of economic activity, our ability to maintain customer program relationships, potential changes in tax policies and government incentives and their effect on the economic benefits of our products to consumers, the continued weakness in financial and credit markets, the growth of non-gaseous alternative fuel products and other new technologies, the price differential between alternative gaseous fuels and gasoline, and the repeal or implementation of government regulations relating to reducing vehicle emissions, economic uncertainties caused by political instability in certain of the markets we do business in, the impact of the Argentinean debt crisis on our business, our ability to realign costs with current market conditions, as well as the risks and uncertainties included in Item 1A “Risk Factors” of this Form 10-K. These forward-looking statements are not guarantees of future performance. We cannot assure you that the forward-looking statements in this Form 10-K will prove to be accurate. Furthermore, if our forward-looking statements prove to be inaccurate, the inaccuracy may be material. In light of the significant uncertainties in these forward-looking statements, you should not place undue reliance on these forward looking statements. The forward-looking statements made in this Form 10-K relate to events and state our beliefs, intent and our view of future events only as of the date of the filing of this Form 10-K. We undertake no obligation to update any forward-looking statement to reflect events or circumstances after the date on which the statement is made or to reflect the occurrence of unanticipated events.
3
PART I
PART I
Overview
Fuel Systems Solutions is a leader in providing alternative fuel systems for transportation, industrial, and refueling applications worldwide as well as idle reduction technologies for the heavy duty truck and rail markets. By combining the expertise of industry leading BRC and IMPCO Technologies, Inc. in 2005, as well as further strategic and focused acquisitions, Fuel Systems Solutions represents over 50 years of experience in the industry. We have a global presence and operate in geographies and markets that are underpenetrated and growing, driven by compelling economics, government support, and local demand. Our dedicated and bi-fuel technologies offer our customers a broad range of cost-effective products and applications that we tailor to local specifications. Our technologies enable our customers to:
|
· |
benefit from significantly lower retail fuel prices, capturing the differential between traditional fuels and compressed natural gas (CNG), liquid propane gas (LPG), and other gaseous fuels; |
|
· |
contribute to cleaner air and environment as carbon emissions of natural gas are in general lower than gasoline and diesel; and |
|
· |
help displace oil and exploit natural gas reserves so as to increase energy independence. |
Our components and systems control the pressure and flow of gaseous alternative fuels, such as propane and natural gas used in internal combustion engines. Our products improve efficiency, enhance power output and reduce emissions by electronically sensing and regulating the proper proportion of fuel and air required by the internal combustion engine. We also provide engineering and systems integration services to address our individual customer requirements for product performance, durability and physical configuration. We supply our products and systems to the marketplace through a global distribution network of distributors and dealers in more than 60 countries and through numerous original equipment manufacturers, or OEMs.
We offer an array of components, systems and fully integrated solutions for our customers, including:
|
· |
fuel delivery—pressure regulators, fuel injectors, flow control valves and other components designed to control the pressure, flow and/or metering of gaseous fuels; |
|
· |
electronic controls—solid-state components and proprietary software that monitor and optimize fuel pressure and flow to meet manufacturers’ engine requirements; |
|
· |
gaseous fueled internal combustion engines—engines manufactured by OEMs that are integrated with our fuel delivery and electronic controls; |
|
· |
systems integration—systems integration support to integrate the gaseous fuel storage, fuel delivery and /or electronic control components and sub-systems to meet OEM and aftermarket requirements; |
|
· |
auxiliary power systems—fully integrated auxiliary power systems for truck and diesel locomotives; and |
|
· |
natural gas compressors—natural gas compressors and refueling systems for light and heavy duty refueling applications. |
Automobile manufacturers, taxi companies, transit and shuttle bus companies and delivery fleets are among the most active customers for our transportation products. Our largest markets for transportation products are currently, and have historically been, outside the United States. To capture demand in the now emerging United States market for alternative gaseous fuel-powered vehicles and equipment, we have a full suite of automotive capabilities, including U.S. Environmental Protection Agency (“EPA”) certified product lines, a California Air Resources Board (“CARB”) certified product line and in-house OEM systems engineering platform, enhancing our ability to leverage our existing relationship with fleet customers and other manufacturers as they roll out CNG and LPG versions of key fleet vehicles in North America.
Manufacturers of industrial mobile and power generation equipment, stationary engines, and heavy duty trucks and buses are among the most active customers for our industrial products. Our broad product range allows us to provide turnkey EPA and CARB-certified and non-certified engine systems, customer specified fuel systems modules and/or components, as well as auxiliary power units (APUs). The wide availability of gaseous fuels in world markets combined with their lower emissions and cost compared to gasoline and diesel fuels is driving growth in the global alternative fuel industry.
4
Unless the context otherwise requires, the terms “we,” “us,” “our”, “Fuel Systems” and “the Company” refer to Fuel Systems Solutions, Inc., or Fuel Systems and its subsidiaries. We were incorporated in Delaware in 1985 after having provided automotive and alternative fuel solutions in a variety of organizational structures since 1958. In 2006, we reorganized our business and corporate structure creating Fuel Systems Solutions, Inc. as a holding company. Beginning with the second quarter of 2012, in an effort to more properly align structure and business activities, management reorganized operations into two new operating segments, FSS Industrial and FSS Automotive. Our FSS Industrial operations consist of our industrial mobile and stationary, APU, and the heavy duty commercial transportation operations. Our FSS Automotive operations consist of the company’s passenger and light duty commercial transportation (OEM), automotive aftermarket, and transportation infrastructure operations.
The predecessor to Fuel Systems was IMPCO Technologies, Inc., and all of our filings with the Securities and Exchange Commission (“SEC”) prior to our reorganization are filed under the name of IMPCO Technologies, Inc. Our periodic and current reports, and any amendments to those reports, are available, free of charge, as soon as reasonably practicable after such material is electronically filed with or furnished to the SEC on our website: www.fuelsystemssolutions.com. The information on our website is not incorporated by reference into this report. You may read and copy any materials we file with the SEC at the SEC’s Public Reference Room at 100 F Street NE, Washington, D.C. 20549. You may obtain information on the operation of the Public Reference Room by calling the SEC at 1-800-SEC-0330. The SEC also maintains an Internet site that contains reports, proxy and information statements, and other information regarding us at http://www.sec.gov.
Our Industry
Our business is primarily focused on the alternative fuel industry. We believe three independent market factors—economics, energy independence and environmental concerns—are driving the growth of the market for alternative fuel technology. We believe the historic price differential between propane or natural gas and gasoline and diesel results in an economic benefit to end users of alternative fuel technology. In transportation markets, the price of alternative fuels such as natural gas or propane is typically substantially less than the price of gasoline. By converting a liquid fueled internal combustion engine to run on propane or natural gas, customers can capitalize on this fuel price differential. End-users may recoup the cost of the conversion within six to eighteen months, depending on the fuel cost disparity prevailing at the time and fuel usage. In addition to economic benefits of alternative fuels to end-users, some governments have sought to create a demand for alternative fuels in order to reduce their dependence on imported oil and reduce their unfavorable balance of payments by relying on their natural gas reserves. Alternative fuel vehicles that operate on natural gas or propane can lessen the demand for crude oil.
We are directly involved in two markets: automotive and industrial. These markets have seen growth in the use of clean-burning gaseous fuels due to the less harmful emissions effects of gaseous fuels and the cost advantage available in many markets of gaseous fuels over gasoline and diesel fuels.
Automotive
According to the most recent statistics from the World LP Gas Association and International Association for Natural Gas Vehicles, there are over 23 million propane, or LPG, vehicles and approximately 16.7 million natural gas vehicles in use worldwide, either for personal mobility, fleet conveyance, or public transportation. As the world’s vehicle population increases, it is expected that the passenger vehicle fleet growth will occur in developing countries within Asia, North Africa and areas of the Middle East. These regions currently have the lowest ratio of vehicles per one thousand people and are slated to grow rapidly over the next ten years as economic improvements stimulate personal vehicle ownership. In Europe, Asia and Latin America, alternative fuel vehicles operating on propane and natural gas are widely available through OEM and aftermarket distribution channels and have gained important penetration of total vehicles in circulation in many countries.
In the United States the transportation market for LPG, CNG and other gaseous fuel vehicles has been limited, but recently a market for dedicated and bi-fuel natural gas vehicles has emerged and we believe we are well positioned to take advantage of opportunities as they develop. See Item 7, “Management’s Discussion and Analysis of Financial Condition and Results of Operations—Overview”.
Industrial
Engines in equipment such as forklifts, aerial platforms, sweepers, turf equipment, power generators and other industrial equipment have long been workhorses of developed countries and comprise a significant portion of our global business. With developed countries such as the United States, and the countries in Asia and Europe seeking a broader consensus on regulation of emission sources in an attempt to further reduce air pollution, many countries have legislated, and we believe will continue to legislate, emission standards for this type of equipment.
5
Our industrial brands focus on serving the market with fuel systems, services and emission certified engine packages. With the imposition of new emissions regulations, OEMs will require advanced technologies that permit the use of gaseous fuels in order to satisfy not only new regulations but also their customers’ requirements for durability, performance and reliability. We have developed and are currently supplying a series of advanced technology alternative fuel systems to the industrial OEM market under the brand name Spectrum®.
Competitive Advantages
We believe we have developed a technological leadership position in the alternative fuel industry based on our experience in designing, manufacturing and commercializing alternative fuel delivery products and components; our relationships with leading companies in transportation; our knowledge of the power generation and industrial markets; our financial commitment to research and product development; and our proven ability to develop and commercialize new products. We believe our competitive strengths include:
|
· |
strong technological base; |
|
· |
strong global distribution and OEM customer relationships; |
|
· |
extensive manufacturing experience; |
|
· |
established systems integration expertise; and |
|
· |
participating in end-markets with growth and served by a global footprint. |
Customers and Strategic Relationships
Our customers include some of the world’s largest engine, vehicle and industrial equipment OEMs.
We are working with a number of our customers to address their future product and application requirements as they integrate more advanced, certified gaseous fuel systems into their business strategies. Additionally, we continually survey and evaluate the benefits of joint ventures, acquisitions and strategic alliances with our customers and other participants in the alternative fuel industry to strengthen our global business position.
In 2014, 2013, and 2012, no customers represented more than 10.0% of our consolidated sales. During 2014, 2013, and 2012, sales to our top ten customers accounted for 26.3%, 34.1%, and 28.7% of our consolidated sales, respectively. If our largest customer or several of these key customers were to reduce their orders substantially, we would suffer a decline in sales and profits, and those declines could be substantial.
Products and Services
Our products include gaseous fuel regulators, fuel shut-off valves, fuel metering and delivery systems, complete engine systems, auxiliary power systems and electronic controls for use in internal combustion engines for the transportation, mobile and power generation markets. In addition to these core products, which we manufacture, we also design, assemble and market ancillary components required for complete systems operating on alternative fuels, as well as a complete range of compressors for natural gas refueling applications.
6
All of our products are designed, tested and validated in accordance with our own internal requirements, as well as tested and certified with major regulatory and safety agencies throughout the world, including Underwriters Laboratories in North America, TÜV in Europe, and the Environmental Protection Agency and CARB in the United States. The following table describes the features of our products:
|
Products |
|
|
Features |
|
Fuel Metering |
|
· |
Full range of injectors designed to operate on propane, natural gas or biogas fuels |
|
|
|
|
|
|
|
|
· |
Electronic control overlays allow integration with modern emissions monitoring systems for full emissions compliance capability |
|
|
|
|
|
|
|
|
· |
Designed for high resistance to poor fuel quality |
|
|
|
|
|
|
Fuel Regulation |
|
· |
Reduces pressure of gaseous and liquid fuels |
|
|
|
|
|
|
|
|
· |
Vaporizes liquid fuels |
|
|
|
|
|
|
|
|
· |
Handles a wide range of inlet pressures |
|
|
|
|
|
|
Fuel Shut-Off |
|
· |
Mechanically or electronically shuts off fuel supply to the regulator and engine |
|
|
|
|
|
|
|
|
· |
Available for high-pressure vapor natural gas and low-pressure liquid propane |
|
|
|
|
|
|
|
|
· |
Designs also incorporate standard fuel filtration to ensure system reliability |
|
|
|
|
|
|
Electronics & Controls |
|
· |
Provides closed loop fuel control allowing integration with existing sensors to ensure low emissions |
|
|
|
|
|
|
|
|
· |
Integrates gaseous fuel systems with existing engine management functions |
|
|
|
|
|
|
Engine-Fuel Delivery Systems |
|
· |
Turnkey kits for a variety of engine sizes and applications |
|
|
|
|
|
|
|
|
· |
Customized applications interface based on customer requirements |
|
|
|
|
|
|
Fuel Systems |
|
· |
Complete vehicle and equipment systems for aftermarket and post-production OEM conversion |
|
|
|
|
|
|
|
|
· |
Complete engine and vehicle management systems for heavy on-highway vehicles |
|
|
|
|
|
|
|
|
· |
Complete engine and vehicle management systems for off-highway and industrial engines used for material handling, power generation and industrial applications |
|
|
|
|
|
|
Compressors |
|
· |
Complete range of compressors for natural gas refueling applications and turnkey refueling stations |
|
|
|
|
|
|
Auxiliary Power Systems |
|
· |
Range of auxiliary power systems products for truck and rail applications |
7
We have developed capabilities that we use to develop a broad range of products to satisfy our customers’ needs and applications. These capabilities/applications fall into the following categories:
|
Capabilities |
|
|
Applications |
|
Design and Systems Integration |
|
· |
Strong team of applications engineers for component, system and engine level exercises providing support to customers in the application of our gaseous fuel products |
|
|
|
|
|
|
|
|
· |
Applications engineering services for whole vehicle/machine integration outside of our products |
|
|
|
|
|
|
|
|
· |
Full three dimensional design modeling and component rapid prototyping services |
|
|
|
|
|
|
Certification |
|
· |
Certification of component products and systems in line with the requirements of California Air Resources Board and Environmental Protection Agency for off- highway engines as well as European ECE-ONU certifications |
|
|
|
|
|
|
|
|
· |
Provide customers with the required tools to manage in-field traceability and other requirements beyond initial emission compliance |
|
|
|
|
|
|
Testing and Validation |
|
· |
Component endurance testing |
|
|
|
|
|
|
|
|
· |
Component thermal and flow performance cycling |
|
|
|
|
|
|
|
|
· |
Engine and vehicle testing and evaluation for performance and emissions |
|
|
|
|
|
|
Sub-System Assembly |
|
· |
Pre-assembled modules for direct delivery to customers’ production lines |
|
|
|
|
|
|
|
|
· |
Sourcing and integrating second and third tier supplier components |
|
|
|
|
|
|
Final Assembly & Test |
|
· |
Full vehicle final up-fit assembly and test operating as an extension of the OEM production line/process |
|
|
|
|
|
|
Training and Technical Service |
|
· |
Complete technical service support, including technical literature, web-based information, direct telephone interface (in all major countries) and on-site support |
|
|
|
|
|
|
|
|
· |
Training services through sponsored programs at approved colleges, at our facilities worldwide and on-site at customer facilities |
|
|
|
|
|
|
Service Parts and Warranty Support |
|
· |
Access to service parts network, along with direct support in development of customers’ own internal service parts programs and procedures |
|
|
|
|
|
Sales and Distribution
We sell products through a worldwide network encompassing distributors and dealers in more than 60 countries and through a sales force that develops sales with distributors, OEMs and large end-users. Our operations focus on OEM and aftermarket distributors in the transportation, mobile and power generation markets. Of these markets, we believe that the greatest potential for growth is in the Asia, North and South America and Middle East regions in sales to transportation OEMs and aftermarket distributors and installers and in North America in sales to industrial OEMs and the related aftermarket.
During the years 2014, 2013, and 2012, sales to distributors accounted for 77.5%, 71.6%, and 68.7%, respectively, of our revenue, and sales to OEM customers accounted for 22.5%, 28.4%, and 31.3%, respectively, of our revenue.
Distributors generally service the aftermarket business for the conversion of liquid fueled engines to gaseous fuels. Many distributors have been our customers for more than 20 years.
Information regarding revenue, income and assets of each of our two business segments, FSS Industrial operations and FSS Automotive operations, and our revenue and assets by geographic area is included in Note 19 to the consolidated financial statements included elsewhere in this Annual Report on Form 10-K as well as in Item 7, “Management’s Discussion and Analysis of Financial Condition and Results of Operations”.
8
Manufacturing
We manufacture and assemble a majority of our products at our facilities in Santa Ana, California, Union City, Indiana, Kitchener, Canada, Beccar, Argentina and Cherasco, Italy and to a lesser extent at some of our other international facilities. Current manufacturing operations consist primarily of mechanical component assembly and testing, forging and light machining, electronic PCB assembly and testing and system up-fitting. We rely on outside suppliers for parts and components and obtain components for products from a variety of domestic and foreign automotive and electronics suppliers, die casters, stamping operations, specialized diaphragm manufacturers and machine shops.
Machined die cast aluminum parts and supplier engineered parts represent the major components of our cost of sales. Coordination with suppliers for quality control and timely shipments is a high priority to maximize inventory management. We use a computerized material requirement planning system to schedule material flow and balance the competing demands of timely shipments, productivity and inventory management. Our manufacturing facilities in California, Canada, and Argentina are ISO-9001 certified, while the facilities in Italy are ISO/TS-16949 and ISO-9001 certified.
Research and Development
Our research and development programs provide the technical capabilities that are required for the development of systems and products that support the use of gaseous fuels in internal combustion engines. Our research and development is focused on fuel delivery and electronic control systems and products for motor vehicles, engines, forklifts, stationary engines and small industrial engines. Over the past few years, we expanded our research and development facility in Italy and in the U.S. to continue to serve our customers with new products and capabilities. Our research and development expenditures were approximately $26.2 million, $27.5 million, and $28.3 million, in 2014, 2013, and 2012, respectively.
Competition
Our key competitors in gaseous fuel delivery products, accessory components and engine conversions markets include Westport Innovations Inc. located in Canada; Enovation Controls LLC and Woodward, Inc. located in North America; Landi Group and O.M.T. Tartarini, S.r.L. located in Italy; and Nikki Company Ltd. located in Japan. These companies, together with us, account for a majority of the world market for alternative fuel products and services. In the future, we may face competition from traditional automotive component suppliers, such as the Bosch Group, Delphi Corporation, Siemens VDO Automotive AG, and Visteon Corporation, and from motor vehicle OEMs that develop fuel systems internally. Industry participants compete on price, product performance and customer support.
Product Certification
We must obtain emission compliance certification from the Environmental Protection Agency to sell certain of our products in the United States, receive certification from CARB to sell certain products in California and other states, and meet European standards for emission regulations in Europe. Each car, truck, van or engine sold in each of these markets must be certified before it can be introduced into commerce, and its products must meet component, subsystem and system level durability, emission, refueling and various idle tests. We have also obtained international emissions compliance certification in Europe, Thailand and India. We strive to meet stringent industry standards set by various regulatory bodies. Approvals enhance the acceptability of our products in the worldwide marketplace. Many foreign countries also accept these agency approvals as satisfying the “approval for sale” requirements in their markets.
Employees
As of December 31, 2014, we employed approximately 1,500 persons. Of these employees, approximately 300 were employed in our FSS Industrial operations, of which approximately 170 are non-US employees, and approximately 1,200 were employed in our FSS Automotive operations, of which approximately 1,100 are foreign employees. Employees in Italy, the Netherlands and Argentina are represented by a collective bargaining agreement. Personnel employed by our foreign subsidiaries are often subject to national labor contracts. We consider our relations with our current employees and unions to be good.
Intellectual Property
We currently rely primarily on patent and trade secret laws to protect our intellectual property. We currently have numerous patents registered in countries located in North America, Europe, and Asia. We do not expect the expiration of our patents to have a material effect on our revenue.
9
We also rely on a combination of trademark, trade secret and other intellectual property laws and various contract rights to protect our proprietary rights. We believe that our intellectual property protected by copyright and trademark protection is less significant than our intellectual property protected by patents.
An expansion of OEM offering of gaseous fuel vehicles employing internally developed OEM technology would likely result in a decrease in our revenue and profit margins.
We derive a substantial portion of our revenue from the sale of gaseous fuel systems and components to automobile OEMs. An expansion in the offering of OEM gaseous fuel vehicles employing internally developed OEM technology could reduce demand for our systems and components and would likely have a negative impact on our revenue and profits.
We currently face, and will continue to face, significant competition, which could materially and adversely affect us.
We currently compete with companies that manufacture products to convert liquid-fueled internal combustion engines to gaseous fuels. Our competitors in the future may have greater name recognition, larger customer bases, broader global reach and a wider array of product lines, as well as greater financial resources and access to capital than we have. We are also subject to competition from other alternative fuels and alternative fuel technologies, including ethanol, electric and hybrid electric and fuel cells, and we cannot assure you that such technologies will not be favored over gaseous fuel technologies in the future. We also cannot assure you that our competitors will not create new and improved innovative gaseous fuel technologies. Increases in the market for alternative fuel vehicles may cause automobile or engine manufacturers to develop and produce their own fuel conversion or fuel management equipment rather than purchasing the equipment from suppliers such as us or to employ competing technologies. Further, greater acceptance of alternative fuel engines may result in new competitors. Should any of these events occur, either alone or in combination, the total potential demand for, and pricing of, our products could be negatively affected and cause us to lose business, which could materially and adversely affect us.
We maintain a significant investment in inventory and have made significant investments in the expansion of our operations to meet demand for our product without long-term contracts with customers. A decline in our customers’ purchases would lead to a decline in our revenue and could result in a decrease in our operating results and cash flows.
We do not have long-term contracts with our customers. Generally, our product sales are made on a purchase order basis, which allows our customers to reduce or discontinue their purchases from us. Accordingly, we cannot predict the timing, frequency or size of our future customer orders. Our ability to accurately forecast our sales is further complicated by the continuing global economic and financial uncertainty. Our total inventory at December 31, 2014 was $80.0 million, a decrease of $15.1 million compared to our total inventory at December 31, 2013. If we fail to anticipate the changing needs of our customers and accurately forecast our customer demands, our existing and potential customers may not place orders with us, which would decrease our revenue, and we may accumulate significant inventories of products that we will be unable to sell which may result in a significant decline in the value of our inventory. As a result, our revenue, gross profit and other operating results and cash flows may be materially and adversely affected.
We may continue to make significant investments in our business without any guarantees or long-term commitments from our customers that they will continue to purchase our components and systems with the same timing, frequency and size as we expect. As a result, if there is insufficient demand for our components and systems, we may not recover the costs of any increased investment in our operations, which could have a material, adverse effect on our financial position, liquidity and results of operations.
Reduced consumer or corporate spending due to weakness in the financial markets and uncertainties in the economy, domestically and internationally, may materially and adversely affect our revenue, operating results and cash flows.
We depend on demand from the consumer, OEM, contract manufacturing, industrial, automotive and other markets we serve for the end market applications that use our products and services. All of these markets have been, and may continue to be, affected by the instability in global financial markets. Reductions in consumer or corporate demand for our products and services as a result of uncertain conditions in the macroeconomic environment, such as volatile energy prices, inflation, fluctuations in interest rates, difficulty securing credit, extreme volatility in security prices, diminished liquidity, or other economic factors, may materially and adversely affect our revenue, operating results and cash flows.
Weak economic conditions, such as those being experienced in Europe, may materially impact our customers and suppliers with which we do business. Currently, the demand in Europe for new automobiles remains weak. Economic and financial market conditions that adversely affect our customers may cause them to terminate existing purchase orders, reduce the volume of products
10
they purchase from us in the future or seek price concessions. In connection with the sale of products, we normally do not require collateral as security for customer receivables and do not purchase credit insurance. We may have significant balances owing from customers who operate in cyclical industries or who may not be able to secure sufficient credit in order to honor their obligations to us. Failure to collect a significant portion of amounts due on those receivables could have a material adverse effect on our results of operations, liquidity and financial condition.
Adverse economic and financial market conditions may also cause our suppliers to be unable to provide materials and components to us or may cause suppliers to make changes in the credit terms they extend to us, such as shortening the required payment period for our amounts owing them or reducing the maximum amount of trade credit available to us. While we have not yet experienced changes of this type, they could have a material adverse effect on our results of operations, liquidity and financial condition. If we are unable to successfully anticipate changing economic and financial markets conditions, we may be unable to effectively plan for, and respond to, those changes, and we could be materially and adversely affected.
Currency exchange rate fluctuations may adversely affect our operating results and cash flows and may have a material adverse effect on our revenue and overall financial results.
Because of our significant operations outside of the United States, we engage in business relationships and transactions that involve many different currencies. Exchange rates between the U.S. dollar and the local currencies in these foreign locations where we do business can vary unpredictably. These variations may have an effect on the prices we pay for key materials and services from overseas vendors in our functional currencies under agreements that are priced in local currencies. If the rate of the U.S. dollar depreciates against local currencies, our effective costs for such materials and services would increase, adversely affecting our operating results and cash flows.
For the year ended December 31, 2014, non-U.S. operations accounted for approximately 81.0% of our revenue. Most revenues and expenses of our non-U.S. operations are in local currency. Our financial statements are presented in U.S. dollars, therefore, gains and losses on the conversion of foreign currency denominated expenses into U.S. dollars could cause fluctuations in our operating results, and fluctuating exchange rates could cause significantly reduced revenue and gross margins from non-U.S. dollar-denominated revenue, which could materially and adversely affect our overall financial results.
Also, for the year ended December 31, 2014, Euro denominated revenue accounted for approximately 55.9% of our total revenue; therefore a substantial appreciation in the rate of exchange of the U.S. dollar against the Euro could have a significant adverse effect on our financial results.
We currently do not engage in financial hedging against these risks and may not be able to hedge against these risks in the future.
Fluctuation in oil or natural gas prices (including LPG) may result in a decline in the demand for our products and services, which would materially and adversely affect our revenue, operating results and cash flows.
We believe that our sales are favorably impacted by changes in consumer demand prompted by rising oil prices and concern over potential increases in oil prices. Conversely, when oil prices decrease and remain low or continue to decrease, it may result in a decline of the demand for our products and services. In addition, volatility in the price of natural gas may have an equal though opposite impact on the demand for our products and services. The potential decline in the demand for our products and services caused by these price fluctuations could materially and adversely affect our revenue, operating results and cash flows.
We engage in related party transactions, which result in a conflict of interest involving our management.
We have engaged in the past, and continue to engage, in a significant number of related party transactions, specifically between the Company’s foreign subsidiaries and members of the family of Mariano Costamagna, our Chief Executive Officer, Director and one of our largest stockholders, his brother Pier Antonio Costamagna (one of our former executive officers who retired, effective February 5, 2014, as General Manager of MTM, S.r.L. (“MTM”), a wholly owned subsidiary of the Company), and companies in which our Chief Executive Officer’s family has controlling or other ownership interests. Our Board of Directors (“Board”), its Audit Committee and its Nominating and Corporate Governance Committee seek to review on an ongoing basis related party transactions as well as identify and evaluate new potential related party transactions to properly account for, disclose and maintain control over these transactions. We cannot assure you that the terms of the transactions with these various related parties are on terms as favorable to us as those that could have been obtained in arm’s-length transactions with third parties, or that the existing policies and procedures are sufficient to identify and completely address all related party transactions and conflicts of interest that may arise. Related party transactions could result in related parties receiving more favorable treatment than an unaffiliated third party would receive, although these parties may provide goods or services that are not readily available elsewhere in some situations. In addition, related party
11
transactions present difficult conflicts of interest, could result in significant and minor disadvantages to our company and may impair investor confidence, which could materially and adversely affect us. Related party transactions could also cause us to become materially dependent on related parties in the ongoing conduct of our business, and related parties may be motivated by personal interests to pursue courses of action that are not necessarily in the best interests of our company and our stockholders.
We face risks associated with marketing, distributing, and servicing our products internationally and could be adversely affected if we are unable to grow our business in developing and emerging markets or as a result of political and economic instability or civil unrest in these markets.
In addition to our operations in the United States, we currently operate in Canada, Italy, the Netherlands, Japan, Brazil, Argentina and Venezuela, and market our products and technologies in other international markets, including both industrialized and developing countries. During the years ended December 31, 2014, 2013, and 2012 approximately 27.2%, 29.7%, and 25.0% of our revenue, respectively, was derived from sales to customers located within the United States and Canada. During the years ended December 31, 2014, 2013, and 2012 approximately 72.8%, 70.3%, and 75.0% of our revenue, respectively, was derived from sales to customers located in Asia-Pacific, Europe, and Latin America. Additionally, at December 31, 2014, approximately 84.0% of our employees and 65.2% of our distributors and dealers worldwide were located outside the United States. Political and economic instability or civil unrest in the markets where we operate, including Venezuela, could have a material adverse impact on our sales.
Our combined international operations are subject to various risks common to international activities, such as the following:
|
· |
our ability to maintain good relations with our overseas employees, suppliers, distributors and customers to collect amounts owed from our overseas customers; |
|
· |
the possibility that our distributors and agents will continue to sell products into countries subject to United States sanctions notwithstanding our policies prohibiting such sales; |
|
· |
expenses and administrative difficulties associated with maintaining a significant labor force outside the United States, including, without limitation, the need to comply with employment and tax laws and to adhere to the terms of real property leases and other financing arrangements in foreign nations; |
|
· |
exposure to currency fluctuations; |
|
· |
potential difficulties in enforcing contractual obligations and intellectual property rights; |
|
· |
complying with a wide variety of laws and regulations, including product certification, environmental, and import and export laws; |
|
· |
the challenges of operating in disparate geographies and cultures; |
|
· |
political and economic instability; |
|
· |
adverse tax consequences, including, without limitation, restrictions on our ability to repatriate dividends from our subsidiaries; and |
|
· |
Government authorities in some countries that may from time to time use fuel price as an instrument of fiscal policy and taxation that may vary for different types of fuels, including gaseous fuels. |
From time to time, we restructure our manufacturing capacity, and we may have difficulty managing these changes.
From time to time, we engage in a number of manufacturing expansion and contraction projects, based on the then-current and forecasted needs of our business. In addition, from time to time, we engage in international restructuring efforts in order to better align our business functions with our international operations and transition to other lower cost locations in continuation of our cost reduction efforts. These efforts can require significant investment by us, and have in the past and could continue to result in increased expenses, inefficiencies and reduced gross margins.
Our management team may have difficulty managing our manufacturing capacity and transition projects or otherwise managing any growth or downsizing in our business that we may experience. Risks associated with right-sizing our manufacturing capacity may include those related to:
|
· |
managing multiple, concurrent capacity expansion or reduction projects; |
|
· |
managing the reduction of employee headcount for facilities where we reduce or cease our activities; |
12
|
· |
accurately predicting any increases or decreases in demand for our products and managing our manufacturing capacity appropriately; |
|
· |
under-utilized capacity, particularly during the start-up phase of a new manufacturing facility and the effects on our gross margin of under-utilization; |
|
· |
managing increased employment costs and scrap rates often associated with periods of growth or contraction; |
|
· |
implementing, integrating and improving operational and financial systems, procedures and controls, including our computer systems; |
|
· |
construction delays, equipment delays or shortages, labor shortages and disputes and production start-up problems; and |
|
· |
cost overruns and charges related to our expansion or contraction of activities. |
Our management team may not be effective in restructuring our manufacturing facilities, and our systems, procedures and controls may not be adequate to support such changes in manufacturing capacity. Any inability to manage changes in our manufacturing capacity may harm our profitability and growth.
New technologies may render our existing products obsolete, which could materially and adversely affect us.
New developments in technology may negatively affect the development or sale of some or all of our products or make our products obsolete. Our inability to enhance existing products in a timely manner or to develop and introduce new products that incorporate new technologies, conform to increasingly stringent emission standards and performance requirements, and achieve market acceptance in a timely manner could negatively impact our competitive position and may materially and adversely affect us. New product development or modification is costly, involves significant research, development, time and expense and may not necessarily result in the successful commercialization of any new products.
The development of our business is dependent on the availability of gaseous fueling infrastructure
Many countries, including the United States, currently have limited or no infrastructure to deliver natural gas and propane to vehicle based consumers. Currently in the United States, alternative fuels such as natural gas cannot be readily obtained by consumers for motor vehicle use and only a small percentage of motor vehicles manufactured for the United States are equipped to use alternative fuels. Users of gaseous fuel vehicles may not be able to obtain fuel conveniently and affordably, which may adversely affect the demand for our products and services. We cannot assure you that the United States or global market for gaseous fuel engines will expand broadly or, if it does, that it will result in increased sales of our fuel system products.
The unpredictable nature of the developing alternative fuel U.S. automotive business may materially and adversely affect our revenue, operating results and cash flows.
Although we believe that we are positioned to compete in the dedicated and bi-fuel natural gas vehicle (NGV) OEM market emerging in the U.S. and our vehicle modification and systems integration capabilities for a variety of alternative fuel applications (including CNG and propane) present us with a unique advantage, the unpredictable nature of the developing alternative fuel U.S. automotive business may materially and adversely affect our revenue, operating results and cash flows as well as the recoverability of our initial investments. Our U.S. automotive business, through acquisitions and additional investments, has the capabilities necessary to be a leader in the U.S. market but we cannot assure you that this market will continue to develop, at what rate it will develop or whether our investments in this market will result in increased sales for us or be profitable.
We could be adversely affected by violations of the U.S. Foreign Corrupt Practices Act and similar foreign anti-bribery laws.
The U.S. Foreign Corrupt Practices Act (“FCPA”) and similar anti-bribery laws in other jurisdictions prohibit companies and their intermediaries and agents from making improper payments to foreign officials, including employees of government owned businesses, as well as private organizations, for the purpose of obtaining or retaining business. During the last few years, the United States Department of Justice and the SEC have brought an increasing number of FCPA enforcement cases, many resulting in very large fines and deferred criminal prosecutions. We operate in many countries which are viewed as high risk for FCPA compliance. Our Code of Conduct mandates compliance with the FCPA and other similar anti-bribery laws and we have recently instituted training programs for our employees around the world. Despite our training programs and compliance policies, there can be no assurance that all employees and third-party intermediaries (including our distributors and agents) will comply with anti-corruption laws. Any such violation could have a material adverse effect on our business. As part of our anti-bribery policies, in the event that we have reason to believe that our employees, agents, distributors or other third parties that transact the Company’s business have or may have violated applicable anti-corruption laws, including the FCPA, we may investigate or have outside counsel or agents investigate the relevant
13
facts and circumstances. We have incurred and in the future may incur additional compliance costs associated with the implementation of our FCPA compliance policies and training programs, which could have a material impact on our business.
In any acquisition or joint venture that we engage in, we expose ourselves to the possibility that the employees and agents of such businesses may not have conducted themselves in compliance with the anti-corruption laws of the FCPA. In response to increasing FCPA enforcement actions in the United States, we have sought and continue to seek to impose contractual provisions and undertake cost appropriate due diligence. We cannot provide assurance that we will always be protected from the consequences of acts which may have violated the FCPA.
Violations of the FCPA may result in significant civil and criminal fines, as well as criminal convictions. Violations of the FCPA and other foreign anti-bribery laws, or allegations of such violations, could disrupt our business and cause us to suffer civil and criminal financial penalties and other sanctions, which are likely to have a material adverse impact on our business, financial condition, and results of operations.
We are subject to governmental certification requirements and other regulations, and more stringent regulations in the future may impair our ability to market our products.
We must obtain product certification from governmental agencies, such as the Environmental Protection Agency and the California Air Resources Board, to sell certain of our products in the United States and must obtain other product certification requirements in Europe and other regions. A significant portion of our future revenue will depend upon sales of fuel management products that are certified to meet existing and future air quality and energy standards. We cannot assure you that our products will meet these standards in the future. We incur significant research and developments costs to ensure that our products comply with emissions standards and meet certification requirements in the countries where our products are sold. Our failure to comply with certification requirements could result in the recall of our products as well as civil and/or criminal penalties.
Any new government regulation that affects our alternative fuel technologies, whether at the foreign, federal, state, or local level, including any regulations relating to installation and service of these systems, may increase our costs and the price of our systems and adversely affect the effectiveness of the related technologies. As a result, these regulations could materially and adversely affect us.
Our business is directly and significantly affected by regulations relating to reducing vehicle emissions. If current regulations are repealed or if the implementation of current regulations is suspended or delayed, our revenue, operating results and cash flows may decrease significantly.
If regulations relating to vehicle emissions are amended in a manner that may allow for more lenient standards, or if the implementation of such currently existing standards is delayed or suspended, the demand for our products and services could diminish, and our revenue, operating results and cash flows could decrease significantly. In addition, demand for our products and services may be adversely affected by the perception that emission regulations will be suspended or delayed. Accordingly, we rely on stricter emissions regulations, the adoption of which are out of our control and cannot be assured, to stimulate our growth.
Regulations related to “conflict minerals” may force us to incur additional expenses, may make our supply chain more complex and may result in damage to our reputation with customers.
On August 22, 2012, under the Dodd-Frank Wall Street Reform and Consumer Protection Act of 2010, the SEC adopted requirements for companies that use certain minerals and metals, known as conflict minerals, in their products, whether or not these products are manufactured by third parties. These requirements require companies to perform due diligence, disclose and report whether or not such minerals originate from the Democratic Republic of Congo and adjoining countries. The implementation of these requirements could adversely affect the sourcing, availability and pricing of minerals used in the manufacture of our products. In addition, we may incur additional costs to comply with the disclosure requirements, including costs related to determining the source of any of the relevant minerals and metals used in our products. Since our supply chain is complex, we may not be able to sufficiently verify the origins for these minerals and metals used in our products through the due diligence procedures that we implement, which may harm our reputation. In addition, we may incur additional costs as a result of changes to product, processes or sources of supply as a consequence of these new requirements.
The “conflict mineral” disclosure obligations are complex. Our first report was filed with the SEC on June 2, 2014 and covers our activities during 2013. These reports are dependent upon our implemented systems and processes as well as information provided by our suppliers of products that contain, or potentially contain, conflict minerals. To the extent that the information that we receive from our suppliers is inaccurate or inadequate, or if our implemented systems and processes to obtain that information does not fulfill the SEC’s requirements, we could face both reputational and SEC enforcement risks.
14
Some of our foreign subsidiaries have done business in countries subject to U.S. sanctions and embargoes.
Some of our foreign subsidiaries in the past have sold fuel delivery systems, related parts and accessories to customers in countries currently subject to sanctions and embargoes imposed by the U.S. government, the E.U., the United Nations, and other countries when we did not believe such sales violated these sanctions or embargoes. We may sell products into countries currently subject to sanctions or embargoes if we believe those sales would not violate the sanctions or embargos and the changing embargo regimes with respect to such countries do not present inappropriate business risks. However, the sanctions are complex and are constantly changing. Changing embargo and sanction regimes can make unlawful activities which were previously lawful. We may decide not to sell into countries because of the risk of changing regimes. We believe we have procedures in place to conduct U.S. and foreign operations without violating U.S., EU, or other sanctions. However, if we fail to comply with U.S. sanctions, EU sanctions or other sanctions, we could be subject to material fines and penalties and incur damage to our reputation, which may lead to a reduction in the market price of our common stock.
In addition, our foreign subsidiaries’ sales into such countries, even if they did not violate the sanctions and embargos, could reduce demand for our common stock among certain of our investors.
We have goodwill and intangible assets that may become impaired, which could impact our results of operations.
Approximately $7.0 million, or 2.1%, of our total assets at December 31, 2014 were net intangible assets, including technology, customer relationships and trade name, and approximately $7.4 million, or 2.3%, of our total assets at December 31, 2014 were goodwill that relates to our acquisitions. We amortize the intangible assets, with the exception of goodwill, based on our estimate of their remaining useful lives and their values at the time of acquisition. We are required to test goodwill for impairment at least on an annual basis, or earlier if we determine it may be impaired due to change in circumstances. We are required to test the other intangible assets with definite useful lives for impairment whenever events or changes in circumstances indicate that the carrying amounts of the intangible assets may not be recoverable. If impairment exists in any of these assets, we are required to write-down the related asset to its estimated recoverable value as of the measurement date. Such impairment write-downs may significantly impact our results of operations and financial position. For the year ended December 31, 2014, we recognized an impairment charge of approximately $39.9 million representing the write-off of goodwill associated with three of our reporting units, and an impairment charge of approximately $1.7 million representing write off of intangible assets associated with two of our reporting units. For the year ended December 31, 2012, we recognized an impairment charge of approximately $9.9 million representing the write-off of goodwill and an impairment charge of approximately $9.9 million representing write off of intangible assets associated with two of our reporting units.
We may not be able to successfully integrate our previously acquired businesses or any future acquired businesses into our existing worldwide business without substantial expenses, delays or other operational or financial problems.
As a part of our business strategy, we may seek to acquire additional businesses, technologies or products in the future. We cannot assure you that any prior acquisition or any future transaction we complete will result in long-term benefits to us or our stockholders or that our management will be able to integrate or manage the acquired business effectively, efficiently and in a timely manner. We could also incur unanticipated expenses or losses in connection with any acquisition, including as a result of disputes associated with an earn-out right, or future transaction.
Acquisitions entail numerous risks, including difficulties associated with the integration of operations, technologies, products and personnel that, if realized, could harm our operating results. Risks related to potential acquisitions include, but are not limited to:
|
· |
difficulties in combining previously separate businesses into a single unit; |
|
· |
inability to overcome differences in foreign business practices, accounting practices, customs and importation regulations, language and other barriers in connection with the acquisition of foreign companies; |
|
· |
substantial diversion of management’s time and attention from day-to-day business when evaluating and negotiating such transactions and then integrating an acquired business; |
|
· |
discovery, after completion of the acquisition, of liabilities assumed from the acquired business or of assets acquired; |
|
· |
costs and delays in implementing, and the potential difficulty in maintaining, uniform standards, controls, procedures and policies, including the integration of different information systems; |
|
· |
the presence or absence of adequate internal controls and/or significant fraud in the financial systems of acquired companies; and |
|
· |
failure to achieve anticipated benefits, such as cost savings and revenue enhancements. |
15
The protection of our intellectual property may be costly and ineffective. If we are not able to adequately secure or enforce protection of our intellectual property, then we may not be able to compete effectively and we may not be profitable.
Our future success depends in part on our ability to protect our intellectual property. We rely primarily on patent and trade secret laws to protect our intellectual property. We currently have numerous patents registered in countries located in North America, Europe, and Asia. We also rely on a combination of trademark, trade secret and other intellectual property laws and various contract rights to protect our proprietary rights. However, we cannot be sure that these intellectual property rights provide sufficient protection from competition. Third parties may claim that our products and systems infringe their patents or other intellectual property rights. Third party infringement claims, regardless of their outcome, would not only consume our financial resources, but also would divert the time and effort of our management and could result in our customers or potential customers deferring or limiting their purchase or use of the affected products or services until resolution of the litigation. If a competitor were to challenge our patents, or assert that our products or processes infringe its patent or other intellectual property rights, we could incur substantial litigation costs, be forced to design around their patents, pay substantial damages or even be forced to cease our operations, any of which could be expensive and have an adverse effect on our operating results.
We depend on a limited number of third party suppliers for key materials and components for our products.
We have established relationships with third party suppliers that provide materials and components for our products. A supplier’s failure to supply materials or components in a timely manner or to supply materials and components that meet our quality, quantity or cost requirements, combined with a delay in our ability to obtain substitute sources for these materials and components in a timely manner or on terms acceptable to us, would harm our ability to manufacture our products effectively, or would significantly increase our production costs, either of which could materially and adversely affect us. In addition, we rely on a limited number of suppliers for certain proprietary die cast parts, electronics, software, catalysts and engines for use in our end products. Approximately 23.0%, 26.7%, and 24.4% of our purchases of raw materials and services during the years ended December 31, 2014, 2013, and 2012, respectively, were supplied by ten entities. During 2014, 2013, and 2012, no suppliers represented more than 10.0% of our purchases of raw materials and services.
Class action litigation due to stock price volatility or other factors could cause us to incur substantial costs and divert our management’s time and attention.
From January 1, 2014 through December 31, 2014, our stock price fluctuated from a low of $8.04 to a high of $14.02. From January 1, 2013 through December 31, 2013, our stock price fluctuated from a low of $12.39 to a high of $20.69. From January 1, 2012 through December 31, 2012, our stock price fluctuated from a low of $13.52 to a high of $28.89. In the past, securities class action litigation often has been brought against a company following periods of volatility in the market price of its securities. Any securities litigation could result in substantial costs and could divert the time and attention of our management.
Our actual operating results may differ materially from our guidance.
From time to time, we release guidance in our quarterly earnings releases, quarterly earnings conference calls or otherwise, regarding our future performance that represent our management’s estimates as of the date of release. This guidance, which includes forward-looking statements, is based on projections prepared by our management. These projections are not prepared with a view toward compliance with published guidelines of the American Institute of Certified Public Accountants, and neither our registered public accountants nor any other independent expert or outside party compiles or examines the projections and, accordingly, no such person expresses any opinion or any other form of assurance with respect thereto.
Projections are based upon a number of assumptions and estimates that, while presented with numerical specificity, are inherently subject to significant business, economic and competitive uncertainties and contingencies, many of which are beyond our control and are based upon specific assumptions with respect to future business decisions, some of which will change. The principal reason that we release guidance is to provide a basis for our management to discuss our business outlook with analysts and investors. We do not accept any responsibility for any projections or reports published by any such persons.
Guidance is necessarily speculative in nature, and it can be expected that some or all of the assumptions and estimates inherent in the guidance furnished by us will not materialize or will vary significantly from actual results. Accordingly, our guidance is only an estimate of what management believes is realizable as of the date of release. Actual results will vary from our guidance and the variations may be material. In light of the foregoing, investors are urged not to rely upon, or otherwise consider, our guidance in making an investment decision in respect of our common stock.
16
We may have security breaches of our information technology infrastructure and systems
Our information technology infrastructure and systems may be vulnerable to cyber-terrorism, computer viruses, system failures and other intentional or unintentional interference, negligence, fraud and other unauthorized attempts to access or interfere with these systems and proprietary information. Although we believe we have implemented and maintain reasonable security controls over proprietary information as well as information of our customers, stockholders and employees, a breach of these security controls may have a material adverse effect on our business, financial condition and results of operations and could subject us to significant regulatory actions and fines, litigation, loss, third-party damages and other liabilities.
None.
Facilities
Our executive offices are located in New York, New York. We currently lease additional manufacturing, research and development and general office facilities, under leases expiring through 2020, in the following locations set forth below:
|
Location |
|
Principal Uses |
|
Square Footage |
|
|
|
FSS Industrial Operations: |
|
|
|
|
|
|
|
Ontario, Canada |
|
Sales, marketing application, development and assembly, manufacturing |
|
|
110,000 |
|
|
Santa Ana, California |
|
Sales, manufacturing, design, and development |
|
|
108,000 |
|
|
Delfgauw, Holland |
|
Sales, marketing application, development and assembly |
|
|
20,000 |
|
|
Calgary, Canada |
|
Sales, marketing application, development and assembly |
|
|
11,000 |
|
|
Fukuoka, Japan |
|
Sales, marketing application and assembly |
|
|
8,000 |
|
|
FSS Automotive Operations: |
|
|
|
|
|
|
|
Cherasco, Italy |
|
Sales, marketing application, development and assembly, manufacturing |
|
|
678,000 |
|
|
Beccar, Argentina |
|
Sales, marketing and assembly, manufacturing |
|
|
129,000 |
|
|
Sterling Heights, Michigan |
|
Sales, marketing application, development and assembly |
|
|
83,000 |
|
|
Union City, Indiana |
|
Sales, marketing application and assembly |
|
|
75,000 |
|
|
Changodar (Ahmedabad), India |
|
Sales and assembly |
|
|
91,000 |
|
|
Cesena, Italy |
|
Sales, marketing application, development and assembly |
|
|
11,000 |
|
|
Badia, Italy |
|
Sales and assembly |
|
|
15,000 |
|
|
Valencia, Venezuela |
|
Sales and assembly |
|
|
12,000 |
|
|
San Paulo, Brazil |
|
Sales and marketing |
|
|
5,000 |
|
|
Total |
|
|
|
|
1,356,000 |
|
We also lease nominal amounts of office space in various countries. We believe our facilities are presently adequate for our current core product manufacturing operations and OEM development programs and production.
From time to time, we may be involved in litigation relating to claims arising out of the ordinary course of our business including, but not limited to, product liability, employment matters, patents and trademark, and customer accounts collections. We are not a party to, and to our knowledge there are not threatened, any claims or actions against us, the ultimate disposition of which would have a material adverse effect on us.
Not applicable.
17
PART II
|
Item 5. |
Market for Registrant’s Common Equity, Related Stockholder Matters and Issuer Purchases of Equity Securities. |
Our common stock is traded on the NASDAQ Stock Market under the symbol “FSYS.” As of February 13, 2015, there were approximately 241 holders of record of our common stock. The high and low per share prices of our common stock as reported on the Nasdaq Stock Market were as follows:
|
|
High |
|
|
Low |
|
||
|
Year Ended December 31, 2014 |
|
|
|
|
|
|
|
|
First Quarter |
$ |
14.02 |
|
|
$ |
10.30 |
|
|
Second Quarter |
$ |
11.41 |
|
|
$ |
9.42 |
|
|
Third Quarter |
$ |
11.28 |
|
|
$ |
8.89 |
|
|
Fourth Quarter |
$ |
11.73 |
|
|
$ |
8.04 |
|
|
Year Ended December 31, 2013 |
|
|
|
|
|
|
|
|
First Quarter |
$ |
17.89 |
|
|
$ |
13.40 |
|
|
Second Quarter |
$ |
17.89 |
|
|
$ |
13.67 |
|
|
Third Quarter |
$ |
20.69 |
|
|
$ |
17.48 |
|
|
Fourth Quarter |
$ |
19.78 |
|
|
$ |
12.39 |
|
The chart below provides a comparison of the cumulative total stockholder return on our common stock with that of a broad equity market index and either a published industry index or a peer group index.
The chart below compares the cumulative total stockholder return on our common stock since December 31, 2010 measured at the end of each fiscal year with the cumulative total return of the Nasdaq Composite Index and the Nasdaq Transportation Index over the same period (assuming the investment of $100 and reinvestment of all dividends).
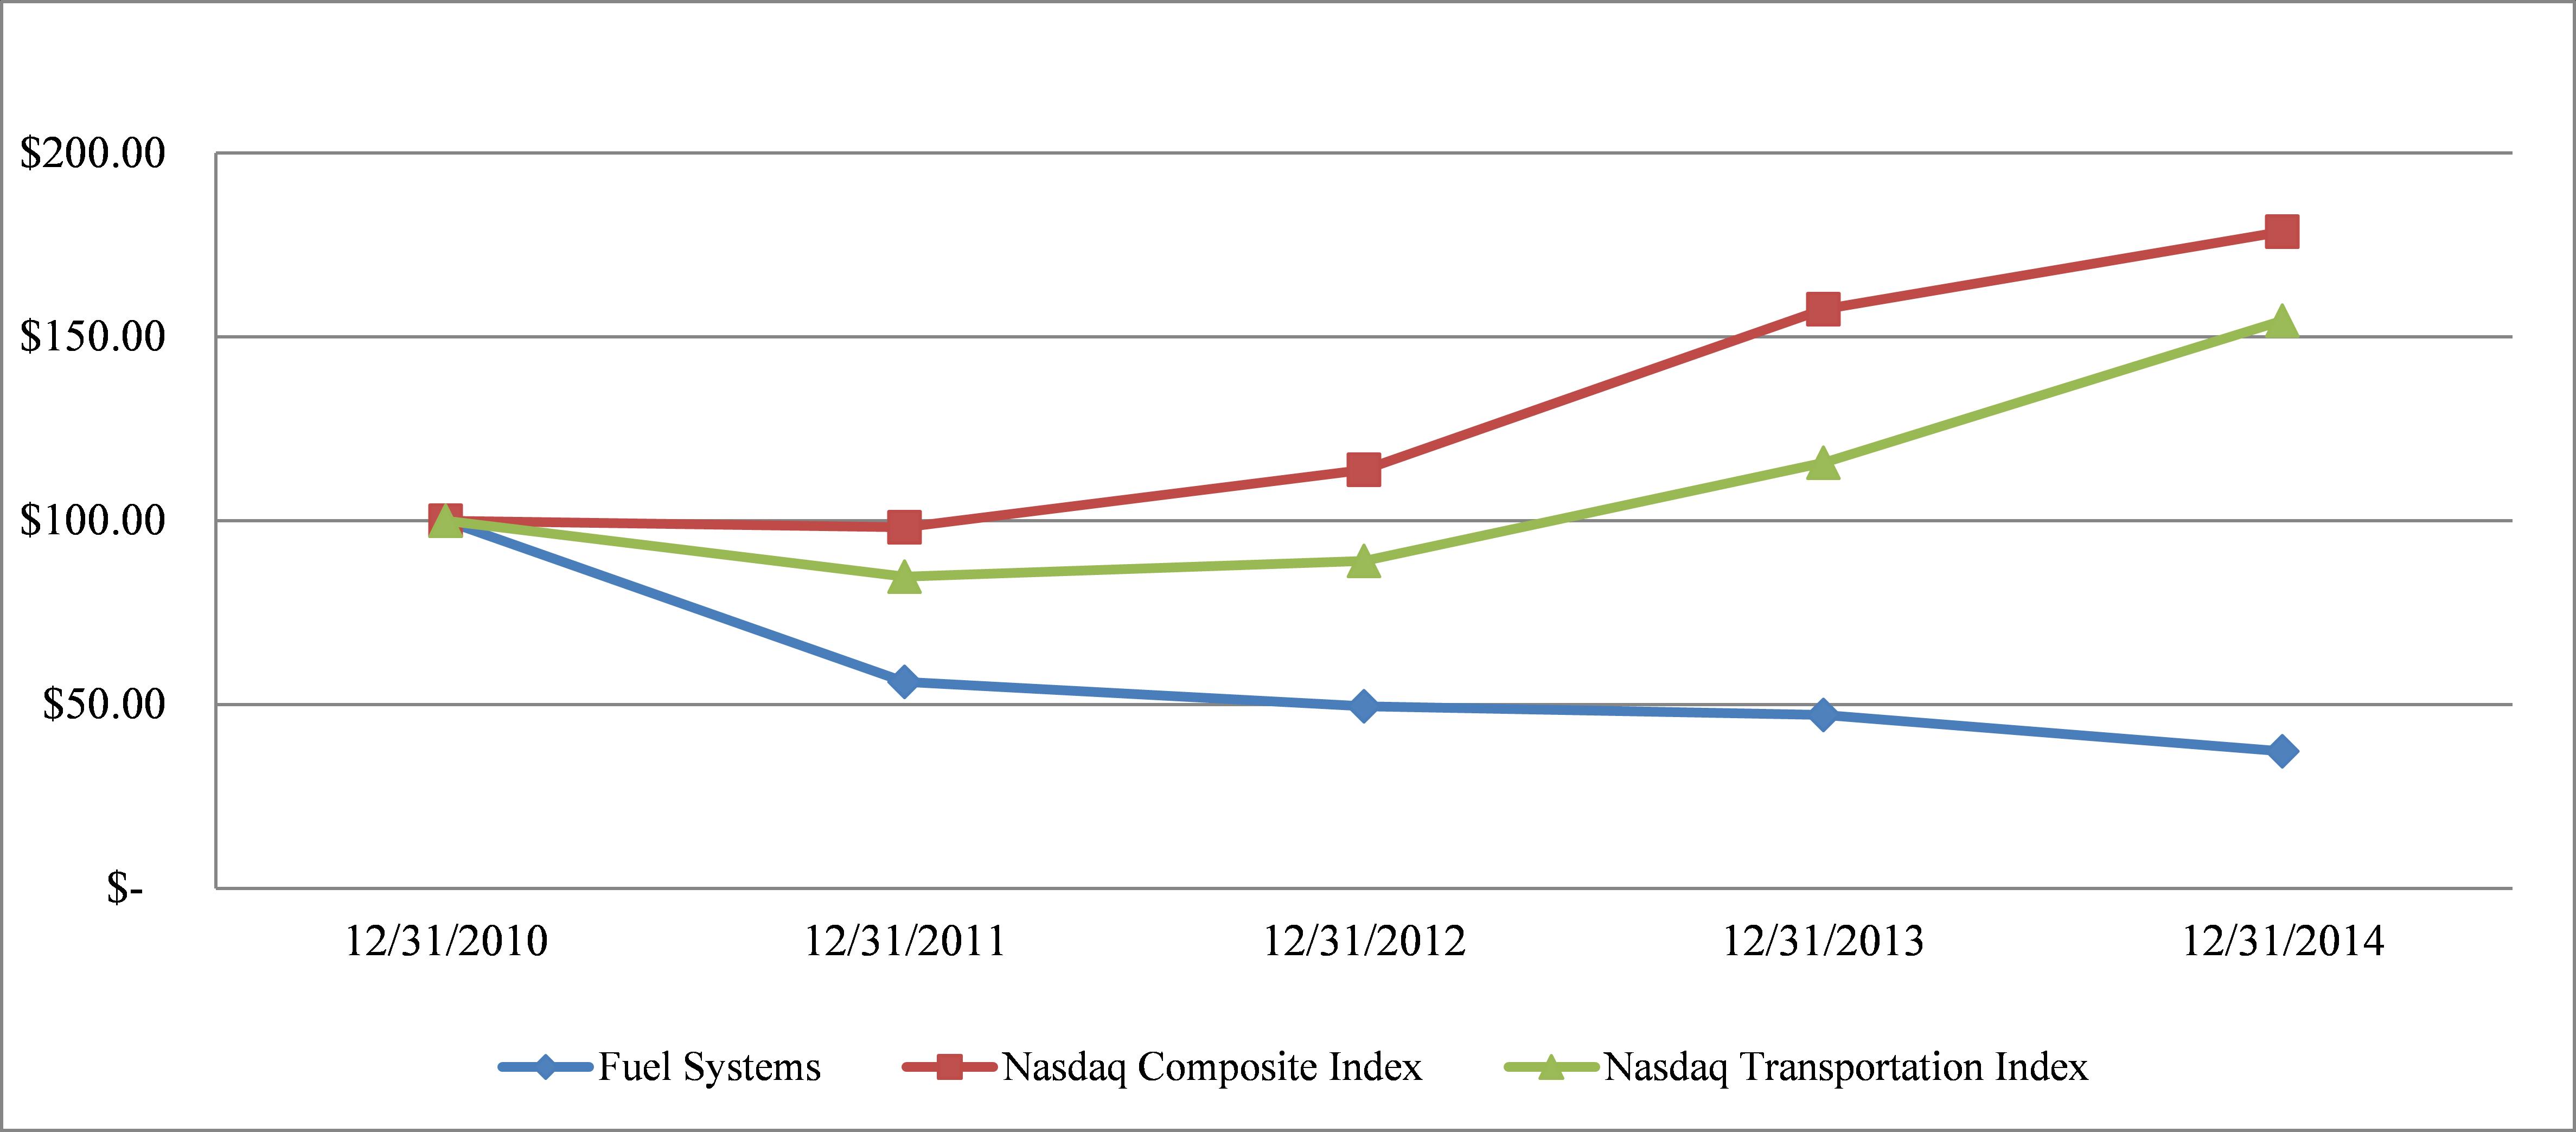
|
|
12/31/2010 |
|
|
12/31/2011 |
|
|
12/31/2012 |
|
|
12/31/2013 |
|
|
12/31/2014 |
|
|||||
|
Fuel Systems |
$ |
100.00 |
|
|
$ |
56.13 |
|
|
$ |
49.49 |
|
|
$ |
47.21 |
|
|
$ |
37.24 |
|
|
Nasdaq Composite Index |
$ |
100.00 |
|
|
$ |
98.20 |
|
|
$ |
113.82 |
|
|
$ |
157.44 |
|
|
$ |
178.53 |
|
|
Nasdaq Transportation Index |
$ |
100.00 |
|
|
$ |
84.82 |
|
|
$ |
89.03 |
|
|
$ |
115.73 |
|
|
$ |
154.37 |
|
The information contained in the performance graph shall not be deemed to be “soliciting material” or to be “filed” with the SEC, nor shall such information be incorporated by reference into any future filing under the Securities Act of 1933 or the Securities Exchange Act of 1934, except to the extent that the Company specifically incorporates it by reference into such filing.
18
Dividend Policy
We have not recently declared or paid dividends on our common stock, including during the past three fiscal years, and we currently expect to retain any earnings for reinvestment in our business. Accordingly, we do not expect to pay dividends in the foreseeable future. The timing and amount of any future dividends is determined by our Board of Directors and will depend on our earnings, cash requirements and the financial condition and other factors deemed relevant by our Board of Directors.
Sales of Unregistered Securities
Except as previously reported in our Quarterly Reports on Form 10-Q and our Current Reports on Form 8-K, we have not sold any equity securities during the three years ended December 31, 2014 which were not registered under the Securities Act of 1933, as amended.
Issuer Purchases of Equity Securities
On November 3, 2014, our Board of Directors approved a share repurchase program for up to $25.0 million of our common stock. The program is expected to continue for up to one year. Purchases under the repurchase program may be made from time to time in open-market transactions, block transactions on or off an exchange, or in privately negotiated transactions. Shares are repurchased at prevailing market prices based on market conditions and other factors.
During the fourth quarter of 2014 we repurchased 336,811 shares of our common stock at an average price paid per share of $10.10. Under the approved share repurchase program referenced above, the approximate value of the shares that may yet be repurchased as of December 31, 2014 equals approximately $21.6 million.
The following represents the above-mentioned share repurchase program tabular disclosure by month as of December 31, 2014 starting from the quarter the repurchase program was approved:
|
Period |
|
Total Number of Shares Purchased
|
Average Price Paid per Share |
Total Number of Shares Purchased as Part of Publicly Announced Program (a) |
Approximate Dollar Value of Shares that May Yet Be Purchased Under the Plan (a) |
|||
|
10/01/2014 - 10/31/2014 |
|
n/a |
|
n/a |
|
n/a |
|
n/a |
|
11/01/2014 - 11/30/2014 |
|
165,396 |
|
$ 9.93 |
|
165,396 |
|
$ 23,358,069 |
|
12/01/2014 - 12/31/2014 |
|
171,415 |
|
$ 10.35 |
|
171,415 |
|
$ 21,598,627 |
|
|
|
|
|
|
|
|
|
|
|
Total as of December 31, 2014 |
|
336,811 |
|
|
|
336,811 |
|
$ 21,598,627 |
Note:
|
(a) |
Refers to repurchases made in open market transactions in connection with the share repurchase program of up to $25.0 million approved by the Board of Directors on November 3, 2014, which is expected to continue for up to one year from the date of approval. |
Total shares repurchased under the above-mentioned approved program through March 10, 2015 equal 1,087,915.
The following selected financial data with respect to our Consolidated Statements of Income data for each of the five years in the period ended December 31, 2014 and the Consolidated Balance Sheet data as of the end of each such fiscal year are derived from our audited consolidated financial statements. The following information should be read in conjunction with our consolidated financial statements and the related notes thereto and “Item 7. Management’s Discussion and Analysis of Financial Condition and Results of Operations” included elsewhere herein.
Amounts in thousands, except per share data.
|
|
|
Years Ended December 31, |
|
||||||||||||||||||
|
Statements of Operations |
|
2014 |
|
|
2013 |
|
|
2012 |
|
|
2011 |
|
|
2010 |
|
||||||
|
Revenue |
|
$ |
339,128 |
|
|
$ |
399,841 |
|
|
$ |
393,947 |
|
|
$ |
418,134 |
|
|
$ |
430,632 |
|
|
|
Cost of revenue |
|
|
264,471 |
|
|
|
312,703 |
|
|
|
302,113 |
|
|
|
321,350 |
|
|
|
298,259 |
|
|
|
Gross profit |
|
|
74,657 |
|
|
|
87,138 |
|
|
|
91,834 |
|
|
|
96,784 |
|
|
|
132,373 |
|
|
19
|
|
|
Years Ended December 31, |
|
||||||||||||||||||
|
Statements of Operations |
|
2014 |
|
|
2013 |
|
|
2012 |
|
|
2011 |
|
|
2010 |
|
||||||
|
Operating expenses |
|
|
|
|
|
|
|
|
|
|
|
|
|
|
|
|
|
|
|
|
|
|
Research and development expense |
|
|
26,194 |
|
|
|
27,540 |
|
|
|
28,327 |
|
|
|
28,149 |
|
|
|
20,775 |
|
|
|
Selling, general and administrative expense |
|
|
58,341 |
|
|
|
55,189 |
|
|
|
54,747 |
|
|
|
56,810 |
|
|
|
53,297 |
|
|
|
Impairments |
|
|
44,341 |
|
|
|
0 |
|
|
|
22,046 |
|
|
|
0 |
|
|
|
0 |
|
|
|
Total operating expenses |
|
|
128,876 |
|
|
|
82,729 |
|
|
|
105,120 |
|
|
|
84,959 |
|
|
|
74,072 |
|
|
|
Operating (loss) income |
|
|
(54,219) |
|
|
|
4,409 |
|
|
|
(13,286 |
) |
|
|
11,825 |
|
|
|
58,301 |
|
|
|
Net (loss) income attributable to Fuel Systems |
|
$ |
(53,416) |
|
|
$ |
(460 |
) |
|
$ |
(15,632 |
) |
|
$ |
5,168 |
|
|
$ |
39,702 |
|
|
|
Net (loss) income attributable to Fuel Systems per common share |
|
$ |
(2.66) |
|
|
$ |
(0.02 |
) |
|
$ |
(0.78 |
) |
|
$ |
0.26 |
|
|
$ |
2.23 |
|
|
|
|
|
As of December 31, |
|
|||||||||||||||||
|
Balance Sheets |
|
2014 |
|
|
2013 |
|
|
2012 |
|
|
2011 |
|
|
2010 |
|
|||||
|
Cash and cash equivalents |
|
$ |
85,180 |
|
|
$ |
80,961 |
|
|
$ |
75,675 |
|
|
$ |
96,740 |
|
|
$ |
124,775 |
|
|
Total current assets |
|
|
254,659 |
|
|
|
290,147 |
|
|
|
282,941 |
|
|
|
299,285 |
|
|
|
306,928 |
|
|
Total assets |
|
|
324,241 |
|
|
|
415,299 |
|
|
|
419,818 |
|
|
|
450,002 |
|
|
|
454,563 |
|
|
Total current liabilities |
|
|
80,331 |
|
|
|
86,085 |
|
|
|
92,156 |
|
|
|
104,692 |
|
|
|
96,079 |
|
|
Long-term debts |
|
|
0 |
|
|
|
215 |
|
|
|
713 |
|
|
|
3,698 |
|
|
|
7,571 |
|
|
Total equity |
|
$ |
236,735 |
|
|
$ |
319,052 |
|
|
$ |
317,047 |
|
|
$ |
329,822 |
|
|
$ |
338,567 |
|
20
The following discussion includes forward-looking statements about our business, financial condition, and results of operations, including discussions about management’s expectations for our business. These statements represent projections, beliefs and expectations based on current circumstances and conditions and in light of recent events and trends, and you should not construe these statements either as assurances of performances or as promises of a given course of action. Instead, various known and unknown factors are likely to cause our actual performance and management’s actions to vary, and the results of these variances may be both material and adverse. A list of the known material factors that may cause our results to vary, or may cause management to deviate from its current plans and expectations, is included in Item 1A “Risk Factors.” The following discussion should also be read in conjunction with the consolidated financial statements and notes included herein.
Overview
We design, manufacture and supply alternative fuel components and systems for use in the transportation and industrial markets on a global basis. Our components and systems control the pressure and flow of gaseous alternative fuels, such as propane and natural gas used in internal combustion engines. Our products improve efficiency, enhance power output and reduce emissions by electronically sensing and regulating the proper proportion of fuel and air required by the internal combustion engine. We also provide engineering and systems integration services to address our individual customer requirements for product performance, durability and physical configuration. For over 50 years, we have developed alternative fuel products. We supply our products and systems to the market place through a global distribution network of distributors and dealers in more than 60 countries and numerous original equipment manufacturers, or OEMs.
We offer an array of components, systems and fully integrated solutions for our customers, including:
fuel delivery—pressure regulators, fuel injectors, flow control valves and other components designed to control the pressure, flow and/or metering of gaseous fuels;
electronic controls—solid-state components and proprietary software that monitor and optimize fuel pressure and flow to meet manufacturers’ engine requirements;
gaseous fueled internal combustion engines—engines manufactured by OEMs that are integrated with our fuel delivery and electronic controls;
systems integration—systems integration support to integrate the gaseous fuel storage, fuel delivery and/or electronic control components and sub-systems to meet OEM and aftermarket requirements;
auxiliary power systems—fully integrated auxiliary power systems for truck and diesel locomotives; and
natural gas compressors—natural gas compressors and refueling systems for light and heavy duty refueling applications.
Manufacturers of industrial mobile and power generation equipment, stationary engines and heavy duty trucks and buses are among the most active customers for our industrial products. Users of small and large industrial engines capitalize on the lower cost and pollutant benefits of using alternative fuels. For example, forklift and other industrial equipment users often use our products to operate equipment indoors resulting in lower toxic emissions. The wide availability of gaseous fuels in world markets combined with their lower emissions and cost compared to gasoline and diesel fuels is driving growth in the global alternative fuel industry. Automobile manufacturers, taxi companies, transit and shuttle bus companies, and delivery fleets are among the most active customers for our transportation products where our largest markets are currently outside the United States.
Our U.S. automotive business has the capabilities necessary to be a leader in this market. We believe Fuel Systems is positioned to compete in the dedicated and bi-fuel natural gas vehicle (NGV) OEM market emerging in the United States. We maintain certain key technology and industry relationships to further our North American OEM and fleet market strategy. Our vehicle modification and systems integration capabilities for a variety of alternative fuel applications, CNG, and propane present us with a unique advantage in the market. While we have limited visibility with respect to the evolving US automotive market, we continue to believe fleet vehicles may offer attractive opportunities for our gaseous fuel solutions in the U.S. We have a full suite of automotive capabilities in this market, including a CARB certified, dedicated systems product line and in-house OEM systems engineering platform, enhancing our ability to leverage our existing relationships with fleet customers and other manufacturers as they roll out CNG and LPG versions of key fleet vehicles.
For the year ended December 31, 2014 revenue decreased approximately $60.7 million or 15.3%, compared to 2013 operating income became an operating loss of $54.2 million, including impairment charges of $44.3 million, and diluted earnings per share (“EPS”) went from a loss of $0.02 in 2013 to a loss of $2.66 in 2014. These results were driven primarily by decreases in automotive
21
OEM, Delayed Original Equipment Manufacturers (“DOEM”) and aftermarket sales across many geographic areas, as well as decreases in sales of most of our industrial products. Lower sales at our FSS Automotive segment were primarily attributable to the conclusion of certain DOEM/OEM programs that were not renewed because of the automakers’ decisions, partly influenced by prevailing economic conditions and partly by increased competitive pressure, to either in-source systems or source from other suppliers. Furthermore, the aftermarket business in key areas such as Europe, and particularly Italy, is experiencing considerable year-over-year contraction, despite some increases in the South American and South Asian markets. Lower sales at our FSS Industrial segment were primarily the result of increased competition, which resulted in the loss of a large customer, as well as political unrest in some key geographic markets. Additionally, the weakening of local currencies compared to the US dollar negatively impacted our revenue at both our FSS Industrial and FSS Automotive segments by approximately $4.1 million and $11.0 million, respectively. These decreases at both our segments were partially offset by increased sales of auxiliary power units and compressors at our FSS Industrial and FSS Automotive segments, respectively, both of which have lower margins.
The aforementioned change in the product/geographic mix and the ensuing lower revenue negatively affected our operating income, which was also further negatively impacted by work force reduction and facility closing expenses of approximately $6.1 million incurred in connection with rationalization of activities at both our segments. Additionally, in the second quarter of 2014, we recognized impairment charges of approximately $44.3 million, associated with goodwill and long-lived assets, for a consolidated EPS impact of approximately $2.15 per share, net of a tax benefit of approximately $1.1 million recognized in connection with these impairment charges. We continue to expect pressure on revenues in the near term as we face increased competition in both our FSS Automotive and FSS Industrial segments, as well as continued economic uncertainty in Europe. As a result, we are initiating a set of restructuring steps to increase operating efficiencies and size our manufacturing footprint to our current revenue base.
In connection with the work force reduction and facility closing expenses initiatives completed in 2014, we are expecting cost savings in 2015 in a range of approximately $5.3 million to $6.3 million. Additionally, we are currently exploring additional rationalizations of activities to take place over the next couple of years. While final determinations of all specific actions have not yet been made, we believe we can realize, over three years, benefits totaling approximately $25.0 million less costs of approximately $10.0 million. Based upon the current timing of these initiatives, we anticipate a net increase in expenses in 2015, with the majority of benefits to be realized beginning in 2016. After the initial three year period , we expect to enjoy annualized benefits of approximately $25.0 million.
The US natural gas automotive market as well as the natural gas compressor market continues to develop at a much slower pace than we anticipated. These markets continue to encounter challenges including political, economic and other competing technical applications. While we continue to invest in these markets, any further weakening of these market developments would likely exacerbate the negative effects in our FSS Automotive operations that we are experiencing. Additionally, downward trends in oil price, as well as adverse foreign currency effects derived from the strengthening of the US dollar compared to local currencies (and especially versus the Euro and the Canadian dollar), may have further negative impact on our business. This could significantly affect our liquidity which may cause us to defer needed capital expenditures, reduce research and development or other spending, and defer costs to achieve productivity programs or sell assets, thereby negatively impacting our business, results of operations and financial condition.
Net cash provided by operations was $18.4 million for the year ended December 31, 2014. We believe that our net cash position of $91.4 million, including marketable securities (excluding Deferred Compensation Plan assets), provides us with adequate capital for working capital and general corporate purposes, which may include expansion of our business, and financing of future acquisitions of companies or assets.
Critical Accounting Policies and Estimates
The discussion and analysis of our financial condition and results of operations are based upon our consolidated financial statements, which have been prepared in accordance with accounting principles generally accepted in the United States. The preparation of these consolidated financial statements requires management to make estimates and judgments that affect the reported amounts of assets, liabilities, and expenses, and related disclosure of contingent assets and liabilities. On an on-going basis, we evaluate our estimates, including those related to bad debts, goodwill, taxes, inventories, warranty obligations, and contingencies and litigation. We base our estimates on historical experience and on various other assumptions that are believed to be reasonable under the circumstances, the results of which form the basis for making judgments about the carrying values of assets and liabilities that are not readily apparent from other sources. Actual results may differ materially from these estimates under different assumptions or conditions. We believe that the accounting policies related to the following accounts or activities are those that are most critical to the portrayal of our financial condition and results of operations and require the more significant judgments and estimates.
22
Allowance for Doubtful Accounts
We maintain allowances for doubtful accounts for estimated losses resulting from the inability of our customers to make required payments. We estimate the allowance for doubtful accounts based on historical experience and any specific customer collection issues that have been identified through management’s review of outstanding accounts receivable. If the financial condition of our customers were to deteriorate, resulting in an impairment of their ability to make payments, additional allowances may be required.
Warranty
We provide for the estimated cost of product warranties at the time revenue is recognized based, in part, on historical experience. While we engage in product quality programs and processes, including actively monitoring and evaluating the quality of our component suppliers, our warranty obligation is affected by product failure rates, material usage and service delivery costs incurred in correcting a product failure. We believe that our warranty experience is within the industry norms. Our standard warranty period is 18 to 36 months from the date of delivery to the customer depending on the product. The warranty obligation on our certified engine products can vary from three to five years depending on the specific part and the actual hours of usage.
Our warranty reserve contains uncertainties because the calculation requires management to make assumptions and to apply judgment regarding product failure rates, material usage and service delivery costs. If actual results are not consistent with the assumptions and estimates used, we may be exposed to additional adjustments that could materially, either positively or negatively, impact our gross profit and operating profit.
Inventory Reserves
We write down our inventory for estimated slow moving and obsolescence or unmarketable inventory equal to the difference between the cost of inventory and the estimated market value. In addition, we examine current and future product sale turnover to determine if there is slow moving inventory.
Our inventory reserve contains uncertainties because the calculation requires management to make assumptions and to apply judgment regarding a number of factors including historical results, future demand and market conditions as well as current inventory loss trends. If actual results are not consistent with the assumptions and estimates used, additional inventory write-downs may be required.
Goodwill and Intangible Assets
We recognize separately from goodwill the assets acquired and the liabilities assumed at their acquisition date fair values. Goodwill as of the acquisition date is measured as the excess of the consideration transferred over the net of the acquisition date fair values of the assets acquired and the liabilities assumed. In those acquisitions that include contingent consideration—i.e. earnout payments to be paid upon the satisfaction of certain milestones—as part of the total consideration paid, we determine the fair value of this liability at the acquisition date using a probability weighted income approach. While we use our best estimates and assumptions as a part of the purchase price allocation process to accurately value assets acquired and liabilities assumed (including any contingent consideration) at the acquisition date, our estimates are inherently uncertain and subject to refinement. As a result, during the measurement period, which may be up to one year from the acquisition date, we record adjustments to the assets acquired and liabilities assumed, with the corresponding offset to goodwill. Upon the conclusion of the measurement period or final determination of the values of assets acquired and liabilities assumed, whichever comes first, any subsequent adjustments are recorded to our consolidated statements of operations.
Accounting for business combinations requires our management to make significant estimates and assumptions, especially at the acquisition date with respect to intangible assets, support obligations assumed, estimated restructuring liabilities and pre-acquisition contingencies. Although we believe the assumptions and estimates we have made in the past have been reasonable and appropriate, they are based in part on historical experience and information obtained from the management of the acquired companies and they are inherently uncertain.
Examples of critical estimates in valuing certain of the intangible assets we have acquired include, but are not limited to:
|
· |
future expected cash flows from acquired developed technologies and patents and other customer contracts; |
|
· |
the life of the acquired developed technologies and patents; |
|
· |
the acquired company’s brand and competitive position, as well as assumptions about the period of time the acquired brand will continue to be used in the combined company’s product portfolio; |
23
|
· |
risk associated with uncertainty, achievement and payment of any milestones; the life of the acquired developed technologies and patents; |
|
· |
the acquired company’s brand and competitive position, as well as assumptions about the period of time the acquired brand will continue to be used in the combined company’s product portfolio; and |
|
· |
discount rates. |
Unanticipated events and circumstances may occur that may affect the accuracy or validity of such assumptions, estimates or actual results.
In addition, uncertain tax positions assumed in connection with a business combination are initially estimated as of the acquisition date and we reevaluate these items quarterly, with any adjustments to our preliminary estimates being recorded to goodwill provided that we are within the measurement period and we continue to collect information in order to determine their estimated values. Subsequent to the measurement period, our final determination of the uncertain tax positions estimated value, or tax related valuation allowances, changes to these uncertain tax positions’ and tax related valuation allowances will affect our provision for income taxes in our consolidated statement of operations and could have a material impact on our results of operations and financial position.
Goodwill—Impairment Assessments
Goodwill is not subject to amortization and is tested for impairment annually and whenever events or changes in circumstances indicate that impairment may have occurred. We perform our annual impairment test during the fourth quarter, after the annual budgeting process is completed. Furthermore, goodwill is reviewed for impairment whenever events or changes in circumstances indicate that the carrying value may not be recoverable. Each interim period, management assesses whether or not an indicator of impairment is present that would necessitate that a goodwill impairment analysis be performed in an interim period other than during the fourth quarter.
The goodwill impairment analysis is a two-step process, with an optional (under certain circumstances) qualitative analysis, known as “step 0”, based on relevant event and circumstances that may be performed ahead of such two steps to determine whether it is more likely than not that the fair value of a reporting unit is less than its carrying amount. If step 0 passes, the two-steps impairment process is not required. If step 0 fails, the two-steps process analysis is required. Step one compares the carrying amount of the reporting unit to its estimated fair value. To the extent that the carrying value of the reporting unit exceeds its estimated fair value, step two is performed, where the reporting unit’s carrying value of goodwill is compared to the implied fair value of goodwill. To the extent that the carrying value of goodwill exceeds the implied fair value of goodwill, impairment exists and must be recognized.
Management reviews goodwill for impairment at the reporting unit level. Our reporting units are identified in accordance with Accounting Standard Codification (“ASC”) Topic 350, “Intangibles—Goodwill and Other”. As of the current annual impairment date we had six reporting units.
We prepare our goodwill impairment analysis by comparing the estimated fair value of each reporting unit, determined using an income approach, with its carrying value. The carrying value of a reporting unit is based on the assets and liabilities associated with the operations of that reporting unit, which often requires allocation of shared or corporate items among reporting units.
The income approach requires several assumptions including future sales growth, EBIT (earnings before interest and taxes) margins, and capital expenditures. These assumptions are the basis for the information used in the discounted cash flow model. The discounted cash flow model also requires the use of a discount rate and a terminal revenue growth rate (the revenue growth rate for the period beyond the five years forecasted by the reporting units), as well as projections of future gross and operating margins (for the period beyond the forecasted five years).
During the second quarter of 2014, we determined that sufficient indicators of potential impairment existed to require an interim goodwill impairment analysis. These indicators included the recent trading values of our stock, and corresponding decline in our market capitalization, coupled with market conditions and business trends within our various reporting units. As a result, we examined the Italian reporting units of our FSS Automotive segment, as well as the Canadian and Netherlands reporting units of our FSS Industrial segment.
24
During the second quarter of 2014, in relation with the above-mentioned reporting units, management used discount rates ranging from 13.75% to 19.25% and terminal growth rates of 3% (the differences in discount rates reflect considerations about differences in the underlying businesses, as well as local economic conditions/environments). The discount rates used for the above-mentioned reporting units increased significantly from the fourth quarter of 2013 analysis due to the decrease in our market capitalization. The inputs utilized in the analyses are classified as Level 3 inputs within the fair value hierarchy as defined in ASC 820 “Fair Value Measurements and Disclosures.” Based on our preliminary analyses, the implied fair value of goodwill was substantially lower than the carrying value of goodwill for the two reporting units within our FSS Automotive segment, as well as for the two reporting units within our FSS Industrial segment. As a result, during the second quarter of 2014, we recognized, based on our best estimate, impairment charges of approximately $33.1 million and $2.6 million, respectively, in relation with our two reporting units located in Italy within our FSS Automotive segment, and impairment charges of $3.1 million and $1.1 million, respectively, in relation with our two reporting units located in Canada and in the Netherlands within our FSS Industrial segment.
During the three months ended September 30, 2014, the impairment analysis for goodwill was finalized and no changes were identified. These impairment charges are included as a separate component of operating income in the consolidated statement of operations for the year ended December 31, 2014 (See Note 15 —Impairments, in the Notes to Consolidated Financial Statements of this Annual Report on Form 10-K).
During the fourth quarter of 2014, management tested the remaining goodwill balance using discount rates ranging from 15.0% to 24.25% and terminal growth rates ranging from 3.0%-7.0% (the differences in discount rates and terminal growth rates reflect considerations about differences in the underlying businesses, as well as local economic conditions/environments). The inputs utilized in the analyses are classified as Level 3 inputs within the fair value hierarchy as defined in ASC 820 “Fair value measurements and disclosures”.
The fair values of our reporting units exceeded the respective carrying values by more than 30%. Consequently, no further impairments were identified during the fourth quarter of 2014.
Variances well in excess of 500 basis points resulting either from increases in the discount rate, or from decreases in the projected cash flows terminal growth rate, would have resulted in one reporting unit failing step one of the goodwill impairment analysis, which would have required the completion of step two of the goodwill impairment analysis to arrive at a potential goodwill impairment loss for this reporting unit. The goodwill at risk associated with this reporting unit is approximately $3.7 million as of December 31, 2014.
As a result, as of December 31, 2014, we had $7.4 million of goodwill on our Consolidated Balance Sheet.
In 2013, our analyses showed no indicator of possible impairment of goodwill.
During the fourth quarter of 2012, management used discount rates ranging from 11.75% to 22% and terminal growth rates ranging from 5%-7%. The inputs utilized in the analyses are classified as Level 3 inputs within the fair value hierarchy as defined in ASC 820 “Fair value measurements and disclosures”.
As a result of the goodwill impairment analysis performed during the fourth quarter of 2012, we recognized an impairment charge of $5.3 million to fully impair the goodwill balance of our US Automotive reporting unit, as well as an impairment charge of $4.6 million against the original amount of our Alternative Fuels Systems (2004) Inc. (“AFS”) reporting unit goodwill of $5.2 million. These impairment charges were included as a separate component of operating income for the year ended December 31, 2012. (See Note 15—Impairments in this Form 10-K for the year ended December 31, 2014 for carrying amount of goodwill by segments).
Long-lived assets—Impairment Assessments
In accordance with ASC Topic 360, “Impairment and Disposal of Long-Lived Asset”, we make judgments about the recoverability of purchased finite lived intangible assets and equipment and leasehold improvements whenever events or changes in circumstances indicate that impairment may exist. We consider several indicators of impairment, among which: a significant decrease in the market price of a long-lived asset (asset group); a significant adverse change in the extent or manner in which a long-lived asset (asset group) is being used or in its physical condition; a significant adverse change in legal factors or in the business climate that could affect the value of a long-lived asset (asset group), including an adverse action or assessment by a regulator; an accumulation of costs significantly in excess of the amount originally expected for the acquisition or construction of a long-lived asset (asset group); a current-period operating or cash flow loss combined with a history of operating or cash flow losses or a projection or forecast that demonstrates continuing losses associated with the use of a long-lived asset (asset group); a current expectation that, more likely than not, a long-lived asset (asset group) will be sold or otherwise disposed of significantly before the end of its previously estimated useful life.
Each period we evaluate the estimated remaining useful lives of purchased intangible assets and whether events or changes in circumstances warrant a revision to the remaining periods of amortization. Recoverability of long-lived assets is measured by comparison
25
of the carrying amount of the asset to the future undiscounted cash flows the asset is expected to generate. Undiscounted cash flows are estimated through several assumptions including future sales growth, EBIT, margins, and capital expenditures.
Assumptions and estimates about future values and remaining useful lives of our intangible and other long-lived assets are complex and subjective. They can be affected by a variety of factors, including external factors such as industry and economic trends, and internal factors such as changes in our business strategy and our internal forecasts.
In the second quarter of 2014, we found an indicator of possible impairment of long-lived assets in the operating results and cash flow trends, both current and forecasted, which were evidenced by the goodwill impairment analysis in four of our reporting units, two in Italy, within the FSS Automotive segment, and one in Canada, and one in the Netherlands within the FSS Industrial segment. In addition to these units, we examined our US Automotive operations due to continuing negative cash flows from the business. In its analysis, management determined that the lowest level asset group, for which identifiable cash flows are largely independent of the cash flows of other groups of assets and liabilities, is represented by the respective reporting unit for one of its Italian reporting units and for its US, Canadian, and Netherlands reporting unit, whereas for the other Italian reporting unit, the lowest level identifiable asset groups are two, in connection with the core business and compressor business, respectively. Our recoverability test included some of the same assumptions used in the goodwill impairment tests, with additional considerations to determine future cash flows that are directly associated with, and that are expected to arise as a direct result of the use and eventual disposition of the asset group. Considerations on terminal value, adjusted to exclude growth beyond the existing service potential of the asset group, were also factored in under both a growth model and a multiple of earnings scenario. The inputs utilized in the analyses are classified as Level 3 inputs within the fair value hierarchy as defined in ASC 820 “Fair Value Measurements and Disclosures”. As a result of the long-lived assets impairment analysis, we recognized impairment charges of approximately $2.7 million and $1.7 million against the carrying values of equipment and leasehold improvements and intangible assets, respectively, at our Italian compressor business asset group and our US Automotive reporting unit within our FSS Automotive segment.
The long-lived assets impairment charges are included as a separate component of operating income in the consolidated statement of operations for the year ended December 31, 2014.
In the fourth quarter of 2014, our analyses showed no indicator of possible impairment of long-lived assets.
In 2013, our analyses showed no indicator of possible impairment of long-lived assets.
In the fourth quarter of 2012, we found an indicator of possible impairment of long-lived assets in the operating results and cash flow trends, both current and forecasted, which were evidenced by the goodwill impairment analysis in two of our reporting units discussed above. In its analysis, management determined that the lowest level asset group, for which identifiable cash flows are largely independent of the cash flows of other groups of assets and liabilities, is represented by each respective reporting unit. Our recoverability test included some of the same assumptions used in the goodwill impairment tests, with additional considerations to determine future cash flows that are directly associated with and that are expected to arise as a direct result of the use and eventual disposition of the asset group. Considerations on terminal value, adjusted to exclude growth beyond the existing service potential of the asset group, were also factored in under both a growth model and a multiple of earnings scenarios. The inputs utilized in the analyses are classified as Level 3 inputs within the fair value hierarchy as defined in ASC 820 “Fair value measurements and disclosures”. As a result of the long-lived assets impairment analysis, we recognized impairment charges of approximately $8.9 million and of $2.2 million against the carrying values of our US Automotive reporting unit intangibles and equipment and leasehold improvements, respectively, as well as an impairment charge of approximately $1.0 million against the carrying value of our AFS reporting unit intangibles. These impairment charges were included as a separate component of operating income for the year ended December 31, 2012. (See Note 15—Impairments in this Form 10-K for the year ended December 31, 2014 for carrying amount of intangibles by segments).
Although we believe the historical assumptions and estimates we have made are reasonable and appropriate, different assumptions and estimates could materially impact our reported financial results.
26
Deferred Taxes
Based upon the substantial net operating loss carryforwards and recent history of losses incurred in certain jurisdictions, we cannot conclude that it is more likely than not that the deferred tax assets in the United States and certain foreign jurisdictions as of December 31, 2014 will be realized within the foreseeable future. The balance of the total United States valuation allowance was approximately $41.8 million as of December 31, 2014. In addition, we have a foreign valuation allowance of approximately $5.5 million as of December 31, 2014. We expect to provide a full valuation allowance on future tax benefits generated in the United States and in certain foreign jurisdictions until we can sustain a level of profitability that demonstrates our ability to utilize the deferred tax assets.
As of December 31, 2014, undistributed earnings, except with respect to a portion of undistributed earnings from our Italian subsidiaries, are considered to be indefinitely reinvested and, accordingly, no provision for United States federal and state income taxes is provided thereon. Residual U.S. taxes have been accrued (applied as a reduction of net operating loss carryforwards) on approximately $0.3 million of earnings of MTM that is not considered indefinitely reinvested. Such amounts could be drawn as a dividend from MTM in the future without U.S. income tax consequences. We repatriated $26.3 and $3.3 million in 2014 and 2013, respectively, and currently intend to repatriate a future portion of these funds; however we do not intend nor foresee the need to repatriate funds in excess of the remaining $0.3 million of earnings not considered to be indefinitely reinvested. Upon distributions of earnings in the form of dividends or otherwise, we would be subject to both U.S. income taxes (subject to an adjustment for foreign tax credits) and withholding taxes payable to various foreign countries. We have accrued such residual income taxes for all undistributed foreign earnings not considered indefinitely reinvested. It is not practical to determine the income tax impact in the event we repatriate undistributed foreign earnings that are considered indefinitely reinvested. As of December 31, 2014, approximately $1.3 million in foreign withholding taxes was accrued related to undistributed earnings not considered to be indefinitely reinvested, as well as to $26.3 million of funds repatriated in 2014.
We believe that we have considered relevant circumstances that we may be currently subject to, and the financial statements accurately reflect our best estimate of the results of our operations, financial condition and cash flows for the years presented. We have discussed the decision process and selection of these critical accounting policies with the Audit Committee of the Board of Directors.
Results of Operations—Years Ended December 31, 2014 and 2013
(Amounts in the tables in thousands, except percentages)
REVENUES
|
|
|
Year Ended |
|
|
Change |
|
|
Percent |
|
|||||||
|
|
|
2014 |
|
|
2013 |
|
|
|
|
|
||||||
|
FSS Industrial |
|
$ |
104,435 |
|
|
$ |
123,351 |
|
|
$ |
(18,916) |
|
|
|
(15.3) |
% |
|
FSS Automotive |
|
|
234,693 |
|
|
|
276,490 |
|
|
|
(41,797) |
|
|
|
(15.1) |
% |
|
Total Revenues |
|
$ |
339,128 |
|
|
$ |
399,841 |
|
|
$ |
(60,713) |
|
|
|
(15.2) |
% |
FSS Industrial. The decrease in revenue is primarily attributable to a net decrease (mainly in North America) of our mobile equipment and stationary products of approximately $15.3 million, as well as lower heavy duty business in Asia of approximately $6.1 million. These decreases were partially offset by increased sales of auxiliary power units in North America of approximately $2.0 million. Our industrial business was significantly impacted by increased competition resulting in the loss of a significant customer, while our heavy duty business was negatively impacted by current political unrest in Thailand. We expect the pressure on revenue attributable to increased competition to continue in the near term. Included in the results discussed above is the weakening of local currencies compared to the US dollar, which negatively impacted our revenue by approximately $4.1 million for the year ended December 31, 2014.
FSS Automotive. The decrease in revenue is primarily attributable to lower DOEM sales of approximately $35.5 million, primarily due to loss of customers in the European markets (primarily Italy) in connection with their change in products strategies and lower volumes in the North American market. Additionally, OEM sales experienced a net decrease of approximately $16.9 million in most geographic areas, despite an increase in India of approximately $5.8 million related to our Rohan BRC acquisition in the third quarter of 2013. Aftermarket sales decreased by approximately $2.3 million in most geographic areas, but primarily in Europe and in the US, despite an increase in aftermarket sales in Argentina and India. The OEM and aftermarket declines were the result of increasing competitive pressure, as well as weak economic environments leading to the end or slow-down of some projects. While the increase in competitive pressure is primarily linked to pricing adjustments, over the last 12 to 18 months we have seen our aftermarket market share increase, primarily in Italy. These decreases were partially offset by an increase in sales of compressors of approximately
27
$12.7 million. In the near term, we continue to expect pressure on revenue attributable to increased competition on the markets we operate, as well as shifting strategies at some of our customers. Included in the results discussed above is the weakening of the local currencies compared to the US dollar, which negatively impacted our revenue by approximately $11.0 million for the year ended December 31, 2014.
The following represents revenues by geographic location for the years ended December 31, 2014 and 2013, which includes the above-mentioned negative impact related to weakening local currencies compared to the US dollar:
|
|
Year Ended |
|
|
Change |
|
|
Percent |
|
|||||||
|
|
2014 |
|
|
|
2013 |
|
|
|
|
|
|||||
|
North America: |
|
|
|
|
|
|
|
|
|
|
|
|
|
|
|
|
United States |
$ |
87,176 |
|
|
$ |
113,674 |
|
|
|
(26,498 |
) |
|
|
(23.3) |
% |
|
Canada |
|
5,144 |
|
|
|
5,044 |
|
|
|
100 |
|
|
|
1.9 |
% |
|
Europe: |
|
|
|
|
|
|
|
|
|
|
|
|
|
|
|
|
Italy |
|
51,342 |
|
|
|
74,987 |
|
|
|
(23,645) |
|
|
|
(31.5) |
% |
|
All other |
|
88,223 |
|
|
|
78,219 |
|
|
|
10,004 |
|
|
|
12.8 |
% |
|
Asia & Pacific Rim |
|
42,829 |
|
|
|
66,577 |
|
|
|
(23,748) |
|
|
|
(35.7) |
% |
|
Latin America |
|
64,414 |
|
|
|
61,340 |
|
|
|
3,074 |
|
|
|
5.0 |
% |
|
Total Revenues |
$ |
339,128 |
|
|
$ |
399,841 |
|
|
$ |
(60,713) |
|
|
|
(15.2) |
% |
The increase in the “All other” locations within Europe primarily relates to higher sales of other products with lower margins, primarily in Russia, while the increase in Latin America is primarily attributable to aftermarket sales in Argentina. Russia is currently experiencing economic sanctions and management is not able to anticipate the future impact of such sanctions. All other geographic locations experienced decreases in revenue when compared to the prior year period, primarily in relation with the items discussed above for both FSS Industrial and FSS Automotive. Included in the results discussed above is the negative impact of the changes of local currencies compared to the US Dollar, which negatively impacted revenue by approximately $15.1 million.
COST OF REVENUE
|
|
Year Ended |
|
|
Change |
|
|
Percent |
|
|||||||
|
|
2014 |
|
|
|
2013 |
|
|
|
|
|
|||||
|
FSS Industrial |
$ |
75,214 |
|
|
$ |
92,392 |
|
|
$ |
(17,178) |
|
|
|
(18.6) |
% |
|
FSS Automotive |
|
189,257 |
|
|
|
220,311 |
|
|
|
(31,054) |
|
|
|
(14.1) |
% |
|
Total Cost of Revenue |
$ |
264,471 |
|
|
$ |
312,703 |
|
|
$ |
(48,232) |
|
|
|
(15.4) |
% |
28
FSS Industrial. The decrease in cost of revenue is primarily attributable to lower material costs of approximately $16.9 million associated with lower volumes. While gross profit decreased in dollar terms due to the effect of lower volumes, the gross margin percentage for the year ended December 31, 2014 increased due to the positive effect associated with the loss of the sales to the above-mentioned customer, which historically had low margins. Included in the results discussed above is effect of the weakening of local currencies compared to the US dollar, which positively impacted cost of revenue by approximately $3.4 million for the year ended December 31, 2014.
FSS Automotive. The decrease in cost of revenue is primarily attributable to lower material cost of approximately $23.0 million, as well as lower compensation expense and outside services expenses of approximately $6.6 million, associated with both headcount reduction initiatives and lower volumes. Additionally, further decreases in cost of revenue are attributable to the impact in the previous year of the loss recorded on the acquisition of an additional 44.89% equity interest in Rohan BRC of approximately $2.0 million, and to lower current year depreciation and amortization expenses of approximately $1.0 million related to the write-off of intangible assets and equipment and leasehold improvements in the second quarter of 2014. The aforementioned decreases were partially offset by an increase in warranty expense of approximately $1.5 million. The above-mentioned shift in product and geographic mix, as well as lower overall revenue, resulted in a lower gross margin percentage compared to the prior year. Included in the results discussed above is the effect of the weakening of local currencies compared to the US dollar, which had a positive impact on cost of revenue of approximately $9.4 million for the year ended December 31, 2014.
RESEARCH & DEVELOPMENT
|
|
Year Ended |
|
|
Change |
|
|
Percent |
|
|||||||
|
|
2014 |
|
|
2013 |
|
|
|
|
|
||||||
|
FSS Industrial |
$ |
7,700 |
|
|
$ |
7,727 |
|
|
$ |
(27) |
|
|
|
(0.3) |
% |
|
FSS Automotive |
|
18,494 |
|
|
|
19,813 |
|
|
|
(1,319) |
|
|
|
(6.7) |
% |
|
Total Research and Development |
$ |
26,194 |
|
|
$ |
27,540 |
|
|
$ |
(1,346) |
|
|
|
(4.9) |
% |
FSS Industrial. Research and development expenses remained relatively flat. While we continue to invest in research and development to enhance our current products and explore new ways to expand our current offerings with new solutions and alternatives, we remain focused on accurately managing costs in order to rationalize expenditures.
FSS Automotive. The decrease primarily relates to higher costs incurred in the prior year in connection with prototyping activities on a project for a customer, as well as cost saving activities in the current year, which resulted in lower outside services and related expense of approximately $1.2 million. We remain focused on rationalizing costs, while continuing to work on advancing our existing product lines and develop various projects for possible new product offerings.
SELLING, GENERAL & ADMINISTRATIVE
|
|
Year Ended |
|
|
Change |
|
|
Percent |
|
|||||||
|
|
2014 |
|
|
2013 |
|
|
|
|
|
||||||
|
FSS Industrial |
$ |
13,146 |
|
|
$ |
13,420 |
|
|
$ |
(274) |
|
|
|
(2.0) |
% |
|
FSS Automotive |
|
36,526 |
|
|
|
35,250 |
|
|
|
1,276 |
|
|
|
3.6 |
% |
|
Corporate |
|
8,669 |
|
|
|
6,519 |
|
|
|
2,150 |
|
|
|
33.0 |
% |
|
Total Selling, General & Administrative |
$ |
58,341 |
|
|
$ |
55,189 |
|
|
$ |
3,152 |
|
|
|
5.7 |
% |
FSS Industrial. The decrease primarily relates to lower compensation and related expense of approximately $0.8 million in connection with decreased headcount, which were partially offset by the cost of a voluntary work force reduction initiative in the current year of approximately $0.6 million.
FSS Automotive. The increase primarily relates to facility closing, work force reduction and lease abandonment expenses in the current year of approximately $5.5 million, incurred in connection with rationalization of activities at our Italian operations, as well as prior year reversal of contingent consideration of approximately $0.4 million. These increases were partially offset primarily by lower outside service expenses of approximately $2.4 million primarily in connection with lower consulting fees, cost savings of approximately $1.2 million achieved through process streamlining and increased efficiencies primarily at our Italian subsidiary, as well as a release of accounts receivable allowance of approximately $0.7 million. Included in the results discussed above is the
29
weakening of local currencies compared to the US dollar, which had a positive impact on selling, general and administrative expenses of approximately $1.5 million for the year ended December 31, 2014.
Corporate Expenses. Corporate expenses consist of general and administrative expenses at the corporate level to support our business segments in areas such as executive management, finance, human resources, management information systems, legal and accounting services and investor relations. Corporate expenses increased primarily as a result of increases in outside services for consultants in connection with restructuring and other activities.
IMPAIRMENTS
|
|
Year Ended |
|
|
Change |
|
|
Percent |
|
|||||||
|
|
2014 |
|
|
2013 |
|
|
|
|
|
||||||
|
FSS Industrial |
$ |
4,158 |
|
|
$ |
0 |
|
|
$ |
4,158 |
|
|
|
NM |
|
|
FSS Automotive |
|
40,183 |
|
|
|
0 |
|
|
|
40,183 |
|
|
|
NM |
|
|
Total |
$ |
44,341 |
|
|
$ |
0 |
|
|
$ |
44,341 |
|
|
|
NM |
|
FSS Industrial. During the second quarter of 2014, we recorded an impairment charge of approximately $4.2 million, representing the write-off of goodwill associated with our reporting units located in Canada and in the Netherlands. Due to the recent trading values of our stock, coupled with market conditions and business trends resulting in lower earnings and cash flow forecasts, we determined that those reporting units could not support the carrying value of their respective goodwill, intangibles and equipment and leasehold improvements. . See Note 15 —Impairments, in the Notes to Consolidated Financial Statements of this Annual Report on Form 10-K for additional discussion.
FSS Automotive. During the second quarter of 2014, we recorded impairment charges of approximately $35.8 million, $1.7 million and $2.7 million representing the write-off of goodwill, intangible assets, and equipment and leasehold improvements, respectively, associated with our Italian and US reporting units. Due to the recent trading values of our stock, coupled with market conditions and business trends resulting in lower earnings and cash flow forecasts, we determined that those reporting units could not support the carrying value of their respective goodwill, intangibles and equipment and leasehold improvements. . See Note 15 —Impairments, in the Notes to Consolidated Financial Statements of this Annual Report on Form 10-K for additional discussion.
For the year ended December 31, 2013 we recorded no impairments.
OPERATING INCOME/(LOSS)
|
|
Year Ended |
|
|
Change |
|
|
Percent |
|
|||||||
|
|
2014 |
|
|
2013 |
|
|
|
|
|
||||||
|
FSS Industrial |
$ |
4,217 |
|
|
$ |
9,811 |
|
|
$ |
(5,594) |
|
|
|
(57.0) |
% |
|
FSS Automotive |
|
(49,767) |
|
|
|
1,117 |
|
|
|
(50,884) |
|
|
|
NM |
|
|
Corporate Expenses |
|
(8,669) |
|
|
|
(6,519) |
|
|
|
(2,150) |
|
|
|
(33.0) |
% |
|
|
$ |
(54,219) |
|
|
$ |
4,409 |
|
|
$ |
(58,628) |
|
|
|
NM |
|
Operating income for the year ended December 31, 2014 decreased for the reasons stated above and resulted in an operating loss for the period.
Other Income (Expense), Net.
Other income (expense) includes foreign exchange gains and losses between various other assets and liabilities to be settled in other currencies. For the year ended December 31, 2014 we recognized approximately $1.1 million in net gains on foreign exchange compared to $2.1 million in net losses on foreign exchange for the year ended December 31, 2013. We routinely conduct transactions in currencies other than our reporting currency, the U.S. dollar. We cannot estimate or forecast the direction or the magnitude of any foreign exchange movements with any currency that we transact in; therefore, we do not measure or predict the future impact of foreign currency exchange rate movements on our consolidated financial statements.
Provision for Income Taxes.
Income tax expense for the year ended December 31, 2014 and 2013 was approximately $0.6 million and $3.6 million, representing an effective tax rate of 1.1% and 115.6%, respectively, and primarily consisted of the provision for our foreign operations
30
(see Note 10—Income Taxes, in the Notes to Consolidated Financial Statements of this Annual Report on Form 10-K for additional discussion).
A full valuation allowance is maintained against the income tax benefits generated in the United States and certain foreign jurisdictions (“loss jurisdictions”) due to cumulative losses incurred in those jurisdictions, as we cannot conclude that such tax benefits meet the more likely than not threshold for realization. For the years ended December 31, 2014 and 2013, we incurred a pre-tax loss of approximately $12.4 million and $8.9 million, respectively, in the loss jurisdictions. Accordingly, for the year ended December 31, 2014, we have not recorded income tax benefits for losses incurred, or significant income tax expense, for income generated for such jurisdictions; as such amounts will be offset by the valuation allowance. We operate in an international environment with significant operations in various locations outside of the United States, which have statutory tax rates that are different from the United States tax rate. Accordingly, the consolidated income tax rate is a composite rate reflecting the earnings in the various locations and the applicable rates. The change in the effective tax rate is primarily a result of the fluctuation of earnings in the various jurisdictions.
Results of Operations—Years Ended December 31, 2013 and 2012
(Amounts in the tables in thousands, except percentages)
REVENUES
|
|
|
Year Ended |
|
|
Change |
|
|
Percent |
|
|||||||
|
|
|
2013 |
|
|
2012 |
|
|
|
|
|
||||||
|
FSS Industrial |
|
$ |
123,351 |
|
|
$ |
122,674 |
|
|
$ |
677 |
|
|
|
0.6 |
% |
|
FSS Automotive |
|
|
276,490 |
|
|
|
271,273 |
|
|
|
5,217 |
|
|
|
1.9 |
% |
|
Total Revenues |
|
$ |
399,841 |
|
|
$ |
393,947 |
|
|
$ |
5,894 |
|
|
|
1.5 |
% |
FSS Industrial. The slight increase in revenue is primarily due to an increase in sales in the North and South American markets for our kits of approximately $6.8 million, as well as for our auxiliary power units of approximately $1.7 million. These increases were partially offset by a decrease in the heavy duty business in Asia of approximately $3.9 million, due to our main customer revising the timing of its orders and its overall purchases in order to adjust to a decreasing local demand, as well as decreases of approximately $1.7 million in sales of our industrial products in Europe. We currently expect lower revenue in the near term as we are facing increased competition which resulted in the loss of a large customer. Included in the results discussed above is the weakening of local currencies compared to the US dollar, which negatively impacted revenue by approximately $3.0 million for the year ended December 31, 2013
FSS Automotive. The increase in revenue was primarily due to increased DOEM sales of approximately $30.8 million, of which approximately $24.7 million relates to the US market with the remainder mostly concentrated in Italy, as well as increased sales of compressors of approximately $4.4 million. These increases were partially offset by lower aftermarket and OEM sales of approximately $30.2 million in nearly all geographic areas, but especially in Italy and the US. This trend in the sale mix has characterized this year so far and is expected to continue in the coming months, particularly as the European market continues to be negatively affected by the overall business climate and struggles with a slower than expected recovery from the recession. In addition, we currently expect lower revenue in the near term as we are facing increased competition, as well as shifting product strategy at some of our customers. Included in the results discussed above is the strengthening of local currencies compared to the US dollar, which had a positive impact on revenue of approximately $1.8 million for the year ended December 31, 2013.
31
The following represents revenues by geographic location for the years ended December 31, 2013 and 2012, which includes the above-mentioned negative impact related to weakening local currencies compared to the US dollar:
|
|
Year Ended |
|
|
Change |
|
|
Percent |
|
|||||||
|
|
2013 |
|
|
|
2012 |
|
|
|
|
|
|||||
|
North America: |
|
|
|
|
|
|
|
|
|
|
|
|
|
|
|
|
United States |
$ |
113,674 |
|
|
$ |
92,652 |
|
|
|
21,022 |
|
|
|
22.7 |
% |
|
Canada |
|
5,044 |
|
|
|
5,938 |
|
|
|
(894 |
) |
|
|
(15.1 |
)% |
|
Europe: |
|
|
|
|
|
|
|
|
|
|
|
|
|
|
|
|
Italy |
|
74,987 |
|
|
|
76,026 |
|
|
|
(1,039) |
|
|
|
(1.4 |
)% |
|
All other |
|
78,219 |
|
|
|
78,623 |
|
|
|
(404) |
|
|
|
(0.5 |
)% |
|
Asia & Pacific Rim |
|
66,577 |
|
|
|
73,425 |
|
|
|
(6,848) |
|
|
|
(9.3 |
)% |
|
Latin America |
|
61,340 |
|
|
|
67,283 |
|
|
|
(5,943) |
|
|
|
(8.8) |
% |
|
Total Revenues |
$ |
399,841 |
|
|
$ |
393,947 |
|
|
$ |
5,894 |
|
|
|
1.5 |
% |
The increase in the North America locations primarily relates to higher sales in the US Automotive market. All other geographic locations experienced decreases in revenue when compared to the prior year, primarily in relation to lower aftermarket and OEM sales. Included in the results discussed above is the net negative impact of the changes of local currencies compared to the US Dollar, which negatively impacted revenue by approximately $1.2 million.
COST OF REVENUE
|
|
Year Ended |
|
|
Change |
|
|
Percent |
|
|||||||
|
|
2013 |
|
|
|
2012 |
|
|
|
|
|
|||||
|
FSS Industrial |
$ |
92,392 |
|
|
$ |
93,019 |
|
|
$ |
(627) |
|
|
|
(0.7 |
)% |
|
FSS Automotive |
|
220,311 |
|
|
|
209,094 |
|
|
|
11,217 |
|
|
|
5.4 |
% |
|
Total Cost of Revenue |
$ |
312,703 |
|
|
$ |
302,113 |
|
|
$ |
10,590 |
|
|
|
3.5 |
% |
FSS Industrial. The decrease in cost of revenue primarily relates to lower warranty costs of $0.6 million, lower inventory write-offs, as well as lower amortization of $0.3 million from the write-off of intangibles in the fourth quarter of 2012, which were offset by an increase in material costs associated with higher volumes of approximately $0.8 million. Gross margin for the year ended December 31, 2013 benefited from the above-mentioned changes in sales mix and reduction in costs compared to the prior year’s period. Included in the results discussed above is the weakening of local currencies compared to the US dollar, which had a positive impact on cost of revenue of approximately $2.7 million for the year ended December 31, 2013.
FSS Automotive. The increase in cost of revenue primarily relates to increases in material costs, including higher inventory write-off, of approximately $8.5 million, as well as increases in compensation and related costs and outside service expenses of approximately $3.5 million, associated with higher DOEM volumes in the US and with higher compressor volumes, which both have lower margins. Cost of revenue also includes the impact of the loss recorded on the acquisition of the additional 44.89% equity interest in Rohan BRC of approximately $2.0 million. These increases were offset by lower depreciation and amortization expenses of approximately $2.5 million related to the write-off of intangible assets and equipment and leasehold improvements in the fourth quarter of 2012. The above-mentioned shift in product and geographic mix resulted in a lower gross margin compared to the prior year’s period. Included in the results discussed above is the strengthening of local currencies compared to the US dollar, which had a negative impact on cost of revenue of approximately $0.9 million for the year ended December 31, 2013.
RESEARCH & DEVELOPMENT
|
|
Year Ended |
|
|
Change |
|
|
Percent |
|
|||||||
|
|
2013 |
|
|
2012 |
|
|
|
|
|
||||||
|
FSS Industrial |
$ |
7,727 |
|
|
$ |
6,775 |
|
|
$ |
952 |
|
|
|
14.1 |
% |
|
FSS Automotive |
|
19,813 |
|
|
|
21,552 |
|
|
|
(1,739) |
|
|
|
(8.1) |
% |
|
Total Research and Development |
$ |
27,540 |
|
|
$ |
28,327 |
|
|
$ |
(787) |
|
|
|
(2.8) |
% |
32
FSS Industrial. The increase primarily relates to higher compensation and related expenses and higher project related costs, mainly due to an increase in headcount as we continue to invest in our existing products, as well as look to expand our current offering with new solutions.
FSS Automotive. The decrease primarily relates to lower compensation and related expenses (in connection with decreased headcount) of approximately $1.0 million, as well as lower supply expenses of approximately $0.6 million, primarily associated with the initial development of an OEM bi-fuel vehicle program in the US, which was completed in late 2012. We are focused on managing costs as we continue to develop various projects for possible new product offerings, while also looking to advance our existing product lines.
SELLING, GENERAL & ADMINISTRATIVE
|
|
Year Ended |
|
|
Change |
|
|
Percent |
|
|||||||
|
|
2013 |
|
|
2012 |
|
|
|
|
|
||||||
|
FSS Industrial |
$ |
13,420 |
|
|
$ |
12,563 |
|
|
$ |
857 |
|
|
|
6.8 |
% |
|
FSS Automotive |
|
35,250 |
|
|
|
36,087 |
|
|
|
(837) |
|
|
|
(2.3 |
)% |
|
Corporate |
|
6,519 |
|
|
|
6,097 |
|
|
|
422 |
|
|
|
6.9 |
% |
|
Total Selling, General & Administrative |
$ |
55,189 |
|
|
$ |
54,747 |
|
|
$ |
442 |
|
|
|
0.8 |
% |
FSS Industrial. The increase relates to higher compensation of approximately $1.1 million, which was partially offset by lower outside service expenses, primarily due to the costs associated in the prior year with the expansion of our production system software in Canada, as well as a prior year severance charge in the US.
FSS Automotive. The decrease primarily relates to lower allowance for doubtful accounts of approximately $1.3 million, an allowance for uncollectible loans to Rohan of approximately $0.8 million in 2012 as well as lower compensation and related expenses resulting from reorganization of activities at the US automotive business. These decreases were partially offset by increases in outside service expenses as well as lower reversals in 2013 of contingent consideration associated with recent acquisitions.
Corporate Expenses. Corporate expenses consist of general and administrative expenses at the corporate level to support our business segments in areas such as executive management, finance, human resources, management information systems, legal and accounting services and investor relations. Corporate expenses increased primarily due to higher outside services.
IMPAIRMENTS
|
|
Year Ended |
|
|
Change |
|
|
Percent |
|
|||||||
|
|
2013 |
|
|
2012 |
|
|
|
|
|
||||||
|
FSS Industrial |
$ |
0 |
|
|
$ |
5,673 |
|
|
$ |
(5,673 |
) |
|
|
NM |
|
|
FSS Automotive |
|
0 |
|
|
|
16,373 |
|
|
|
(16,373 |
) |
|
|
NM |
|
|
Total |
$ |
0 |
|
|
$ |
22,046 |
|
|
$ |
(22,046 |
) |
|
|
NM |
|
For the year ended December 31, 2013 we recorded no impairments.
FSS Industrial. During the fourth quarter of 2012, we recorded impairment charges of approximately $4.6 million and $1.0 million representing the write-off of goodwill and intangible assets, respectively, associated with our AFS reporting unit. Due to lower than expected demand for our products, primarily from the Indian market, management’s forecasts of earnings and cash flow have declined. Management utilizes these forecasts for the income approach as part of the goodwill and intangibles impairment reviews. As a result of the lower earnings and cash flow forecasts, we determined that the reporting unit could not support the carrying value of its respective goodwill and intangibles. See Note 15 —Impairments, in the Notes to Consolidated Financial Statements of this Annual Report on Form 10-K for additional discussion.
FSS Automotive. During the fourth quarter of 2012, we recorded impairment charges of $5.3 million, $8.9 million and $2.2 million representing the write-off of goodwill, intangible assets, and equipment and leasehold improvements, respectively, associated with our US Automotive reporting unit. Due to the slow development of the US natural gas automotive market, management’s forecasts of earnings and cash flow have declined. Management utilizes these forecasts for the income approach as part of the goodwill and intangibles impairment reviews. As a result of the lower earnings and cash flow forecasts, we determined that the reporting unit could not support the carrying value of its goodwill and intangibles. See Note 15 —Impairments, in the Notes to Consolidated Financial Statements of this Annual Report on Form 10-K for additional discussion.
33
OPERATING INCOME/(LOSS)
|
|
Year Ended |
|
|
Change |
|
|
Percent |
|
|||||||
|
|
2013 |
|
|
2012 |
|
|
|
|
|
||||||
|
FSS Industrial |
$ |
9,811 |
|
|
$ |
4,644 |
|
|
$ |
5,167 |
|
|
|
111.3 |
% |
|
FSS Automotive |
|
1,117 |
|
|
|
(11,833 |
) |
|
|
12,950 |
|
|
|
109.4 |
% |
|
Corporate Expenses |
|
(6,519) |
|
|
|
(6,097 |
) |
|
|
(422) |
|
|
|
(6.9) |
% |
|
|
$ |
4,409 |
|
|
$ |
(13,286 |
) |
|
$ |
17,695 |
|
|
|
133.2 |
% |
Operating income for the year ended December 31, 2013 increased for the reasons stated above.
Other Income (Expense), Net.
Other income (expense) includes foreign exchange gains and losses between various other assets and liabilities to be settled in other currencies. For the year ended December 31, 2013 we recognized approximately $2.1 million in losses on foreign exchange compared to $0.7 million in losses on foreign exchange for the year ended December 31, 2012. We routinely conduct transactions in currencies other than our reporting currency, the U.S. dollar. We cannot estimate or forecast the direction or the magnitude of any foreign exchange movements with any currency that we transact in; therefore, we do not measure or predict the future impact of foreign currency exchange rate movements on our consolidated financial statements.
Provision for Income Taxes.
Income tax expense for the year ended December 31, 2013 and 2012 was approximately $3.6 million and $2.2 million, representing an effective tax rate of 115.6% and 16.2%, respectively, and primarily consisted of the provision for our foreign operations (see Note 10—Income Taxes, in the Notes to Consolidated Financial Statements of this Annual Report on Form 10-K for additional discussion). In addition, during the second quarter of 2012, we determined that the recoverability of the net deferred tax assets in our Canadian entities was more likely than not. As a result, we released the related valuation allowance and recognized a tax benefit of approximately $5.0 million. The release of the valuation allowance was based upon the recent history of earnings of our Canadian entities, forecasted future earnings of this group, and the merger of our Canadian operations into a single legal entity that was completed on January 1, 2013, and which will allow the netting, for income tax reporting purposes, of income with losses incurred within this group.
A full valuation allowance is maintained against the income tax benefits generated in the United States and certain foreign jurisdictions (“loss jurisdictions”) due to cumulative losses incurred in those jurisdictions, as we cannot conclude that such tax benefits meet the more likely than not threshold for realization. For the years ended December 31, 2013 and 2012, we incurred a pre-tax loss of approximately $8.9 million and $37.0 million, respectively, in the loss jurisdictions. Accordingly, for the year ended December 31, 2013, we have not recorded income tax benefits for losses incurred, or significant income tax expense, for income generated for such jurisdictions; as such amounts will be offset by the valuation allowance. We operate in an international environment with significant operations in various locations outside of the United States, which have statutory tax rates that are different from the United States tax rate. Accordingly, the consolidated income tax rate is a composite rate reflecting the earnings in the various locations and the applicable rates. The change in the effective tax rate is primarily a result of the fluctuation of earnings in the various jurisdictions.
Liquidity and Capital Resources
(Amounts in the tables in thousands)
Overview— Our primary sources of liquidity are cash provided by operating activities and debt financing. Additionally from time to time we raise funds from the equity capital markets to fund our working capital and general corporate purposes, which may include expansion of our business, additional repayment of debt and financing of future acquisitions of companies or assets. We believe the amounts available to us under our various credit agreements together with cash on hand will continue to allow us to meet our needs for working capital and other cash needs for worldwide operations for at least the next 12 months. For periods beyond 12 months, although we do not have any plans to do so, we may seek additional financing to fund future operations through future offerings of equity or debt securities or through agreements with corporate partners with respect to the development of our technologies and products. We can offer no assurances that we will be able to obtain additional funds on acceptable terms, if at all. However, our ability to satisfy our working capital requirements will substantially depend upon our future operating performance (which may be affected by prevailing economic conditions), and financial, business and other factors, some of which are beyond our control. We continue to evaluate our liquidity needs.
34
On November 3, 2014, our Board of Directors approved a share repurchase program for up to $25.0 million of our common stock. The program is expected to continue for up to one year. Purchases under the repurchase program may be made from time to time in open-market transactions, block transactions on or off an exchange, or in privately negotiated transactions. Shares are repurchased at prevailing market prices based on market conditions and other factors. As of December 31, 2014, 336,811 shares were repurchased under this program. Total shares repurchased under the above-mentioned approved program through March 10, 2015 equal 1,087,915.
We earn a significant amount of our operating results outside the U.S., which is deemed to be permanently reinvested in foreign jurisdictions; however, we had accrued (as a reduction to net operating loss carry-forwards) residual U.S. taxes on approximately $30.0 million of earnings not considered to be indefinitely reinvested. Following repatriation of earnings in 2014 and 2013 of $26.3 million and $3.3 million, respectively, we currently have accrued residual U.S. taxes on approximately $0.3 million of earnings not considered to be indefinitely reinvested. This amount was deemed to be a constructive dividend creating taxable income for US income tax purposes; upon distribution of earnings in the form of dividend, or otherwise, in excess of these amounts, we may be subject to US income taxes. In addition, we would be subject to withholding taxes payable to various foreign countries. In June 2012, our FSS Automotive segment purchased approximately an additional $6.3 million of prime-rated German government bonds with a maturity date of March 14, 2014, which were subsequently sold before maturity on February 8, 2013 for approximately $6.8 million. The related proceeds, as well as additional cash, were reinvested into a new purchase of prime-rated German government bonds for approximately $12.6 million, with a maturity date of October 10, 2014. After maturity of this German bond, the liquidity was temporarily invested in cash and cash equivalents. These investments were placed in the available for sale category. As of December 31, 2014 we had approximately $54.8 million of cash and marketable securities held in accounts outside the U.S., primarily in Europe. We currently intend to repatriate a portion of these funds; however, we do not intend nor foresee the need to repatriate funds in excess of the $0.3 million of earnings not considered to be indefinitely reinvested. We expect existing cash and cash equivalents and cash flows from operations to continue to be sufficient to fund our operating activities and cash commitments for investing and financing activities, such as regular material capital expenditures, for at least the next 12 months.
Should we require more capital in the U.S. than is generated by our operations domestically, for example to fund significant discretionary activities, such as acquisitions of businesses, we could elect to repatriate future earnings from foreign jurisdictions. This could result in higher effective tax rates. We have the ability to borrow funds domestically at reasonable interest rates. See Item 1A “Risk Factors” in this Annual Report on Form 10-K for additional information that could impact our liquidity and capital resources.
Our ratio of current assets to current liabilities was approximately 3:1 at both December 31, 2014 and December 31, 2013, respectively. At December 31, 2014, our total working capital decreased by $29.7 million to $174.3 million from $204.1 million at December 31, 2013. This decrease is primarily due to the following: (1) a decrease of $18.1 million in accounts receivable attributable to both our divisions but primarily to our FSS Automotive operations as a result of lower sales; (2) a decrease of $15.1 million in inventory attributable to both our divisions and primarily to our FSS Automotive operations; and (3) a decrease of $8.0 million in short term investments attributable to the net effect of our investing activities and primarily to the expiration of the investments in German bonds at our FSS Automotive operations, which were all partially offset by: (a) a decrease of $5.1 million in accrued expenses attributable primarily to our FSS Automotive operations in relation with decreased accruals for payroll obligation due to lower post-restructuring headcount and decreased accruals for warranty; (b) an increase of $4.2 million in cash and cash equivalents primarily attributable to the net effect of our investing and operating activities; (c) a net increase of $2.3 million in related party receivables, and (d) a decrease of approximately $0.8 million in accounts payable primarily attributable to higher activity in the previous period. Included in the net decrease commented above were approximately $19.6 million of net decreases attributable to changes in foreign currency exchange rates.
The following table provides a summary of our operating, investing and financing activities as follows:
|
|
Years ended December 31, |
|
|||||||||
|
|
2014 |
|
|
2013 |
|
|
2012 |
|
|||
|
Net cash provided by (used in): |
|
|
|
|
|
|
|
|
|
|
|
|
Operating activities |
$ |
18,424 |
|
|
$ |
21,602 |
|
|
$ |
12,818 |
|
|
Investing activities |
|
(6,060) |
|
|
|
(17,976) |
|
|
|
(22,673) |
|
|
Financing activities |
|
(3,581) |
|
|
|
(255) |
|
|
|
(11,637) |
|
|
Effect on cash of changes in exchange rates |
|
(4,564) |
|
|
|
1,915 |
|
|
|
427 |
|
|
Net increase/(decrease) in cash and cash equivalents |
$ |
4,219 |
|
|
$ |
5,286 |
|
|
$ |
(21,065) |
|
Cash Flow from Operating Activities. We prepare our statement of cash flows using the indirect method. Under this method, we reconcile net income (loss) to cash flows from operating activities by adjusting net income (loss) for those items that impact net income (loss) but may not result in actual cash receipts or payments during the period. These reconciling items include but are not
35
limited to impairments, depreciation and amortization, provisions for inventory reserves and doubtful accounts; gains and losses from various transactions and changes in the consolidated balance sheet for working capital from the beginning to the end of the period.
2014 compared to 2013. In 2014, our net cash flow provided by operating activities decreased $3.2 million from the net cash flow provided by operating activities in the twelve months ended December 31, 2013. This decrease was primarily driven by lower income (as adjusted for non-cash items), and by the net effect of changes in net working capital and other balance sheet accounts. These changes include increases in operating cash flows associated with accounts payable and taxes payable (primarily in relation with higher activity in the prior year), as well as with other current assets (primarily due to activity in the prior year in advances, VAT receivables and tax prepayments), partially offset by decreases in net operating cash flows associated with related parties receivables and inventory (primarily due to decreased level of activity).
2013 compared to 2012. In 2013, our net cash provided by operating activities increased $8.8 million from the net cash provided by operating activities in the twelve months ended December 31, 2012. This increase was primarily driven by changes in net working capital and other balance sheet changes. These changes include an increase in cash associated with lower accounts receivable (primarily due to lower fourth quarter revenue), increases in operating cash flows associated with account payable (mostly in relation with higher activity in the previous period), as well as by a decrease in inventory (primarily in relation with anticipated pressure on revenue), which were partially offset primarily by decreases in operating cash flows associated with accrued expenses (mostly due to lower warranty and other accruals in the previous year for litigation, restructuring and acquisition), decreases in operating cash flows associated with other current assets (primarily due to higher VAT receivables), as well as decreases in operating cash flows associated with tax payables.
Cash Flow from Investing Activities. Our net cash used in investing activities during the considered periods consisted primarily of property, plant and equipment (“PP&E”) expenditures, investment in and reimbursement of available for sale securities, as well as acquisitions.
In 2014, our PP&E additions were approximately $13.7 million, approximately 44% more than the prior year and primarily for acquisitions of machinery and equipment and leasehold improvements in connection with both new business initiatives and our normal business operations, primarily in relation with our FSS Automotive operations. In October 2014, approximately $11.5 million of investments in German Government bonds held by our FSS Automotive operations were reimbursed at their expiration, with the proceeds temporarily invested in cash and cash equivalents. Additionally, in April and December 2014, we invested an additional $3.0 million and $1.0 million, respectively, in time deposits.
In 2013, our PP&E additions were approximately $9.5 million, approximately 31% less than the prior year period and primarily in relation with our FSS Automotive operations. In February 2013, we sold our investment in prime-rated German government bonds acquired in June 2012 for approximately $6.8 million. In February 2013, we also purchased prime-rated German government bonds for which we paid approximately $12.6 million. Additionally, in September 2013 we spent approximately $0.8 million, net of cash acquired, on the acquisition of an additional 44.89% equity interest in Rohan BRC.
In 2012, our PP&E expenditures totaled approximately $13.7 million, of which approximately $10.5 million relates to our FSS Automotive operations, primarily for leasehold improvements and acquisitions of machinery and equipment. In addition, we invested approximately $6.3 million in prime-rated German government bonds, and paid approximately $5.7 million for the acquisition of the net assets of the Cubogas compressor division.
Cash Flow from Financing Activities. Our capitalization and financing strategy is intended to ensure that we are properly capitalized with the appropriate level of debt and available credit.
In 2014, our financing activities refer mostly to the repurchase of treasury shares in connection with the program approved by our Board of Directors on November 3, 2014, as well as payments of term loans and other loans.
In 2013, our financing activities refer mostly to payments of term loans and other loans, as well as proceeds from exercise of stock options (included in “other” on the face of the Condensed Consolidated Statements of Cash Flows).
In 2012, our financing activities included repayments on our revolving lines of credit, term loans and other debt for approximately $8.8 million in connection with our FSS Automotive operations. In January 2012, in accordance with the terms of the agreement, we paid the additional installment of approximately $2.8 million associated with the redemption of the remaining non-controlling interest in MTE.
Credit Agreements
36
Our outstanding debt is summarized as follows (in thousands):
|
|
Available as of |
|
|
December 31, |
|
|
December 31, |
|
|||
|
Revolving lines of credit—Italy and Argentina |
$ |
13,666 |
|
|
$ |
0 |
|
|
$ |
0 |
|
|
Revolving line of credit—USA. |
|
20,000 |
|
|
|
0 |
|
|
|
0 |
|
|
Other indebtedness |
|
0 |
|
|
|
207 |
|
|
|
428 |
|
|
|
$ |
33,666 |
|
|
|
207 |
|
|
|
428 |
|
|
Less: current portion |
|
|
|
|
|
207 |
|
|
|
213 |
|
|
Non-current portion |
|
|
|
|
$ |
0 |
|
|
$ |
215 |
|
Additional information about our credit agreements, borrowings, existing lines of credit, and covenants can be found in Note 11– Debt, in the Notes to Consolidated Financial Statements of this Annual Report on Form 10-K.
Off-Balance Sheet Arrangements
As of December 31, 2014, we had no off-balance sheet arrangements.
Recent Accounting Pronouncements
We discuss new accounting standards which have been issued but not yet adopted, their required date of adoption and/or planned date to adopt, if earlier, and the anticipated impact that adoption of the standards are expected to have on our financial position and results of operations in Note 2– Summary of Significant Accounting Policies, in the Notes to Consolidated Financial Statements of this Annual Report on Form 10-K.
Contractual Obligations
The following table contains supplemental information regarding total contractual obligations as of December 31, 2014:
|
|
|
Payments Due by Period |
|
|||||||||||||||||
|
Contractual Obligations (In thousands) |
|
Total |
|
|
Less Than |
|
|
1-3 |
|
|
3-5 |
|
|
More than |
|
|||||
|
Term and other loans—principal |
|
$ |
190 |
|
|
$ |
190 |
|
|
$ |
0 |
|
|
$ |
0 |
|
|
$ |
0 |
|
|
Term and other loans—interest |
|
|
2 |
|
|
|
2 |
|
|
|
0 |
|
|
|
0 |
|
|
|
0 |
|
|
Capital lease obligations (a) |
|
|
17 |
|
|
|
17 |
|
|
|
0 |
|
|
|
0 |
|
|
|
0 |
|
|
Operating lease obligations (a) |
|
|
29,929 |
|
|
|
6,914 |
|
|
|
12,466 |
|
|
|
8,145 |
|
|
|
2,404 |
|
|
Other long-term liabilities (b) |
|
|
106 |
|
|
|
18 |
|
|
|
38 |
|
|
|
41 |
|
|
|
9 |
|
|
|
|
$ |
30,244 |
|
|
$ |
7,141 |
|
|
$ |
12,504 |
|
|
$ |
8,186 |
|
|
$ |
2,413 |
|
|
|
|
(a) |
The capital lease obligations are undiscounted and represent total minimum lease payments. The operating lease obligations represent total minimum lease payments. Operating lease obligations include amounts under leases with related parties (see Note 17–Related Parties in the Notes to Consolidated Financial Statements of this Annual Report on Form 10-K). |
|
(b) |
We have other long term liabilities on our balance sheet amounting to $5.4 million, of which $5.3 million are not shown on this table. Of the $5.3 million, less than $0.1 million refers to foreign withholding taxes accrued on undistributed earnings not considered to be indefinitely reinvested, and $4.1 million relates to a mandatory termination payment for Italian employees called “Trattamento di Fine Rapporto” that is required by Italian law (see Note 18–Commitment and Contingencies in the Notes to Consolidated Financial Statements of this Annual Report on Form 10-K). Payments under the “Trattamento di Fine Rapporto” contractual obligations are due upon employees’ termination of service. |
37
Foreign Currency Management. We operate on a global basis and are exposed to currency fluctuations related to the manufacture, assemble and sale of our products in currencies other than the U.S. Dollar. The major foreign currencies involve the markets in the European Union, Argentina, and Canada. Movements in currency exchange rates may affect the translated value of our earnings and cash flow associated with our foreign operations as well as the translation of the net asset or liability positions that are denominated in foreign currencies. In countries outside of the United States, we generally generate revenues and incur operating expenses denominated in local currencies. These revenue and expenses are translated using the average rates during the period in which they are recognized and are impacted by changes in currency exchange rates. We monitor this risk and attempt to minimize the exposure to our net results through the management of cash disbursements in local currencies.
We prepared sensitivity analyses to determine the impact of hypothetical changes in foreign currency exchange rates on our results of operations. The foreign currency rate analysis assumed a uniform movement in currencies by 10% relative to the U.S. Dollar on our results. Based upon the results of these analyses, a 10% change in currency rates would have resulted in an increase or decrease in our earnings (including the impacts of impairments) for the year ended December 31, 2014 by approximately $4.8 million. We may seek to hedge our foreign currency economic risk by minimizing our U.S. dollar investment in foreign operations using foreign currency term loans to finance our foreign subsidiaries. Indebtedness denominated in local currency is translated to U.S. dollars at period end exchange rates.
See pages F-1 through F-37 of this Annual Report on Form 10-K.
Not applicable.
Evaluation of Disclosure Controls and Procedures
Our management, with the participation of our chief executive officer and our chief financial officer, has evaluated the effectiveness of our “disclosure controls and procedures” (as defined in Rule 13a-15(e) under the Securities Exchange Act of 1934, as amended) as of December 31, 2014.
Based on such evaluation, our chief executive officer and our chief financial officer have concluded that as of December 31, 2014, our disclosure controls and procedures were effective to ensure that the information we are required to disclose in reports that we file or submit to the SEC is (1) recorded, processed, summarized and reported within the time periods specified under the rules and forms of the SEC and (2) accumulated and communicated to our management, including our chief executive officer and our chief financial officer, as appropriate to allow timely decisions regarding required disclosures.
Management’s Annual Report on Internal Control over Financial Reporting
Our management is responsible for establishing and maintaining adequate internal control over financial reporting and for the assessment of the effectiveness of internal control over financial reporting, as defined in Rule 13a-15(f) of the Exchange Act. Under the rules of the SEC, “internal control over financial reporting” is defined as a process designed to provide reasonable assurance regarding the reliability of our financial reporting and the preparation of financial statements for external purposes in accordance with accounting principles generally accepted in the United States of America.
Internal control over financial reporting includes maintaining records, that in reasonable detail, accurately and fairly reflect our transactions and our dispositions of assets; provide reasonable assurance that transactions are recorded as necessary for preparation of our financial statements in accordance with accounting principles generally accepted in the United States of America; provide reasonable assurance that receipts and expenditures of company assets are made only in accordance with management authorization; and provide reasonable assurance regarding the prevention or the timely detection of the unauthorized acquisition, use or disposition of company assets that could have a material effect on our financial statements. Because of its inherent limitations, internal control over financial reporting may not provide absolute assurance that a misstatement of our financial statements would be prevented or detected.
38
Management conducted an evaluation of the effectiveness of our internal control over financial reporting based on the criteria set forth in Internal Control—Integrated Framework issued by the Committee of Sponsoring Organizations of the Treadway Commission (2013 framework). Based on this evaluation, management concluded that the company’s internal control over financial reporting was effective as of December 31, 2014.
Attestation Report of the Independent Registered Public Accounting Firm
PricewaterhouseCoopers LLP, (“PwC”) the independent registered public accounting firm that audited the financial statements included in this Form 10-K, has attested to, and reported on, the effectiveness of our internal control over financial reporting. The report of PwC is included in the Financial Statements in this Form 10-K.
Changes in Internal Control over Financial Reporting
For the three month period ended December 31, 2014, there has been no change in our internal control over financial reporting that has materially affected, or is reasonably likely to materially affect, our internal control over financial reporting.
None.
39
PART III
The information relating to our executive officers, directors, nominees, Board meetings, committees and Board leadership structure and oversight of risk is set forth under the captions “Board of Directors and Corporate Governance” and “Executive Officers” in the Fuel Systems 2015 Proxy Statement and is incorporated by reference herein. The information under the caption “Section 16(a) Beneficial Ownership Reporting Compliance” that appears in the Fuel Systems 2015 Proxy Statement is also incorporated by reference herein.
We have adopted a Code of Business Conduct and Ethics (the “Code of Ethics”) that applies to our Chief Executive Officer, principal financial officer, principal accounting officer, and to all of our other directors, officers and employees. Our Code of Ethics is available at the Corporate Governance section on our website, www.fuelsystemssolutions.com. As permitted by Item 5.05 of Form 8-K, we will disclose amendments to and waivers from our Code of Ethics required under Item 5.05 on our website.
The information regarding our Audit Committee and designated audit committee financial experts is set forth under the captions “Board of Directors and Corporate Governance - Independent Directors” and “Board of Directors and Corporate Governance - Committees - Audit Committee” in the Fuel Systems 2015 Proxy Statement and such information is incorporated by reference herein.
The information concerning procedures by which shareholders may recommend director nominees is set forth under “Board of Directors and Corporate Governance - Procedure for Stockholder Recommendations for Director Nominees” in the Fuel Systems 2015 Proxy Statement and such information is incorporated by reference herein.
The information relating to executive compensation is set forth under the captions “Executive Compensation” and “Board of Directors and Corporate Governance - Director Compensation” in the Fuel Systems 2015 Proxy Statement and such information is incorporated by reference herein; except that the information under the caption “Compensation Committee Report” shall be deemed “furnished” with this report and shall not be deemed “filed” with this report, nor deemed incorporated by reference into any filing under the Securities Act of 1933 except only as may be expressly set forth in any such filing by specific reference.
|
Item 12. |
Security Ownership of Certain Beneficial Owners and Management and Related Stockholder Matters. |
The information relating to security ownership of management and certain beneficial owners is set forth under the caption “Principal Stockholders” in the Fuel Systems 2015 Proxy Statement and such information is incorporated by reference herein.
Equity Compensation Plan Information
All of our equity compensation plans have been approved by our stockholders. The following table sets forth information about our common stock that may be issued under our equity compensation plans as of December 31, 2014:
|
Plan Category |
|
Number of |
|
|
Weighted- |
|
|
Number of |
|
|||
|
Equity Compensation Plans Approved by Stockholders |
|
|
127,900 |
|
|
$ |
13.86 |
|
|
|
503,374 |
(1) |
|
Total |
|
|
127,900 |
|
|
$ |
13.86 |
|
|
|
503,374 |
|
|
|
|
(1) |
Includes 332,774 shares of restricted stock available for issuance under our 2009 Restricted Stock Plan and 170,600 shares of options available for issuance under the 2011 Stock Option Plan. |
The information regarding certain relationships and related party transactions and director independence is set forth under the captions “Board of Directors and Corporate Governance - Independent Directors” and “Certain Relationships and Related Transactions” in the Fuel Systems 2015 Proxy Statement and such information is incorporated by reference herein.
40
The information regarding fees and services of the independent registered public accounting firm (“independent accountant”) and our pre-approval policies and procedures for audit and non-audit services provided by our independent accountant are set forth under the captions “Principal Accounting Fees and Services” and “Audit Committee Pre-Approval of Audit and Permissible Non-Audit Services of Independent Auditors” in the Fuel Systems 2015 Proxy Statement and such information is incorporated by reference herein.
41
PART IV
PART IV
(a) Documents filed as part of this report:
(1) Consolidated Financial Statements of Fuel Systems Solutions, Inc.
Report of independent registered public accounting firm.
Consolidated balance sheets as of December 31, 2014 and 2013.
Consolidated statements of operations for the years ended December 31, 2014, 2013, and 2012.
Consolidated statements of comprehensive income (loss) for the years ended December 31, 2014, 2013, and 2012.
Consolidated statements of stockholders’ equity for the years ended December 31, 2014, 2013, and 2012.
Consolidated statements of cash flows for the years ended December 31, 2014, 2013, and 2012.
Notes to consolidated financial statements.
(2) Supplemental Financial Statement Schedule:
Schedule II—Valuation Accounts.
(b) Exhibits:
42
EXHIBIT INDEX
Certain of the following exhibits, as indicated by footnote, were previously filed as exhibits to registration statements or reports filed by the Company or its predecessor companies and are hereby incorporated by reference to such statements or reports. The Company’s Exchange Act file number is 1-32999, the Exchange Act file number of IMPCO Technologies, Inc., our predecessor company, is 1-15143, and the Exchange Act file number of AirSensors, Inc., a predecessor company, was 0-16115.
|
Exhibit No. |
|
Description |
|
3.1 |
|
Amended and Restated Certificate of Incorporation of Fuel Systems Solutions, Inc., as currently in effect (incorporated by reference to Exhibit 3.1 of the Company’s Annual Report on Form 10-K for the fiscal year ended December 31, 2011). |
|
3.2 |
|
Bylaws of Fuel Systems Solutions, Inc., as currently in effect (incorporated by reference to Exhibit 3.1 of the Company’s Report on Form 8-K filed on October 2, 2013). |
|
4.1 |
|
Stockholder Protection Rights Agreement dated as of June 27, 2006 between Fuel Systems Solutions, Inc. and ChaseMellon Stockholder Services, L.L.C., as Rights Agent (incorporated by reference to Exhibit 4.2 of the Company’s Registration Statement on Form S-4 filed on June 27, 2006; SEC File No. 333-135378). |
|
4.2 |
|
Amendment No. 1 to Stockholder Protection Rights Agreement, dated as of July 21, 2009, between the Company and Mellon Investor Services LLC, as Rights Agent (incorporated by reference to Exhibit 4.1 of the Company’s Current Report on Form 8-K filed on July 21, 2009; SEC File No. 001-32999). |
|
4.3 |
|
Specimen of common stock certificate of Fuel Systems Solutions, Inc. (incorporated by reference to Exhibit 3.7 of the Company’s Registration Statement on Form S-4 filed on June 27, 2006; SEC File No. 333-135378). |
|
10.1+ |
|
2009 Incentive Bonus Plan (incorporated by reference to Exhibit 10.1 of the Company’s Current Report on Form 8-K filed on July 9, 2009; SEC File No. 001-32999). |
|
10.2+ |
|
2009 Restricted Stock Plan (incorporated by reference to Exhibit 10.2 of the Company’s Current Report on Form 8-K filed on July 9, 2009; SEC File No. 001-32999). |
|
10.3+ |
|
Form of Restricted Stock Agreement under 2009 Restricted Stock Plan (incorporated by reference to Exhibit 99.2 of the Company’s Current Report on Form 8-K filed on July 9, 2009; SEC File No. 001-32999). |
|
10.4+ |
|
Fuel Systems Solutions, Inc. Deferred Compensation Plan and Plan Adoption Agreement, each as amended and restated, effective January 1, 2008 (incorporated by reference to Exhibit 10.11 of the Company’s Annual Report on Form 10-K for the fiscal year ended December 31, 2008; SEC File No. 001-32999). |
|
10.5+ |
|
First Amendment, dated December 31, 2008, to the Fuel Systems Solutions, Inc. Deferred Compensation Plan effective January 1, 2008 (incorporated by reference to Exhibit 10.12 of the Company’s Annual Report on Form 10-K for the fiscal year ended December 31, 2008; SEC File No. 001-32999). |
|
10.6 |
|
Form of Director Indemnification Agreement (incorporated by reference to Exhibit 99.1 of the Company’s Current Report on Form 8-K filed on July 9, 2009; SEC File No. 001-32999). |
|
10.7 |
|
Loan Agreement between MTM, S.r.L. and Unicredit Banca Medio Credito S.p.A., dated December 2, 2004 (incorporated by reference to Ex. 10.3 to IMPCO Technologies, Inc.’s Quarterly Report on Form 10-Q for the period ended March 31, 2005; SEC File No. 001-15143). |
|
10.8 |
|
English summary of Financing Agreement dated December 22, 2008, by and among MTM S.r.L., Banca IMI S.p.A. and Intesa SanPaolo S.p.A. (incorporated by reference to Exhibit 10.1 of the Company’s Current Report on Form 8-K filed on December 29, 2008; SEC File No. 001-32999). |
|
10.9 |
|
Committed Credit Facility dated July 10, 2009 between Fuel Systems, Inc. /IMPCO Technologies, Inc. and Intesa SanPaolo S.p.A. (incorporated by reference to Exhibit 10.1 of the Company’s Current Report on Form 8-K filed on July 17, 2009; SEC File No. 001-32999). |
|
10.10 |
|
First Amendment to Agreement dated April 30, 2014 between Fuel Systems Solutions, Inc., IMPCO Technologies, Inc., IMPCO Technologies B.V. and Intesa SanPaolo S.p.A. (incorporated by reference to Exhibit 10.1 of the Company’s Current Report on Form 8-K filed on May 6, 2014).
|
|
|
|
|
43
|
Exhibit No. |
|
Description |
|
10.11+ |
|
Fuel Systems Solutions, Inc. 2011 Stock Option Plan (incorporated by reference to Exhibit 10.1 of the Company’s Current Report on Form 8-K filed on December 20, 2011). |
|
10.12+ |
|
Fuel Systems Solutions, Inc. 2011 Phantom Stock Option Plan (incorporated by reference to Exhibit 10.2 of the Company’s Current Report on Form 8-K filed on December 20, 2011). |
|
10.13+ |
|
Form of Nonqualified Stock Option Agreement under the Fuel Systems Solutions, Inc. 2011 Stock Option Plan (incorporated by reference to Exhibit 10.3 of the Company’s Current Report on Form 8-K filed on December 20, 2011). |
|
10.14+ |
|
Form of Incentive Stock Option Agreement under the Fuel Systems Solutions, Inc. 2011 Stock Option Plan (incorporated by reference to Exhibit 10.4 of the Company’s Current Report on Form 8-K filed on December 20, 2011). |
|
10.15+ |
|
Form of Phantom Stock Option Agreement under the Fuel Systems Solutions, Inc. 2011 Phantom Stock Option Plan (incorporated by reference to Exhibit 10.5 of the Company’s Current Report on Form 8-K filed on December 20, 2011). |
|
10.16+ |
|
Settlement Agreement, dated May 28, 2014, between Pier Antonio Costamagna and M.T.M. S.r.L. (incorporated by reference to Exhibit 10.1 of the Company’s Current Report on Form 8-K filed on May 30, 2014).
|
|
10.17+ |
|
Agreement dated as of October 29, 2014 by and among Fuel Systems Solutions, Inc., Steven R. Becker, Matthew A. Drapkin, BC Advisors, LLC, Becker Drapkin Management, L.P., Becker Drapkin Partners (QP), L.P., and Becker Drapkin Partners, L.P. (incorporated by reference to Exhibit 10.1 of the Company’s Current Report on Form 8-K filed on October 30, 2014). |
|
|
|
|
|
10.18+ |
|
Separation Agreement and General Release between Roberto Olivo and Fuel Systems Solutions, Inc. (incorporated by reference to Exhibit 10.1 of the Company’s Current Report on Form 8-K filed on December 24, 2014). |
|
|
|
|
|
10.19+ |
|
Minutes of Settlement Agreement between Roberto Olivo and MTM S.r.l. (English translation) (incorporated by reference to Exhibit 10.2 of the Company’s Current Report on Form 8-K filed on December 24, 2014). |
|
21.1* |
|
Significant Subsidiaries of the Company. |
|
23.1* |
|
Consent of PricewaterhouseCoopers LLP, independent registered public accounting firm, with respect to Fuel Systems Solutions, Inc. |
|
24.1* |
|
Powers of Attorney (included on the signature page hereto). |
|
31.1* |
|
Certification of Chief Executive Officer pursuant to Rule 13a-14(a) or 15d-14(a) |
|
31.2* |
|
Certification of Chief Financial Officer pursuant to Rule 13a-14(a) or 15d-14(a) |
|
32.1* |
|
Certification of Chief Executive Officer pursuant to 18 U.S.C. Section 1350 |
|
32.2* |
|
Certification of Chief Financial Officer pursuant to 18 U.S.C. Section 1350 |
|
101.INS* |
|
XBRL Instance Document |
|
101.SCH* |
|
XBRL Taxonomy Extension Schema Document |
|
101.CAL* |
|
XBRL Taxonomy Extension Calculation Linkbase Document |
|
101.LAB* |
|
XBRL Taxonomy Extension Label Linkbase Document |
|
101.PRE* |
|
XBRL Taxonomy Extension Presentation Linkbase Document |
|
101.DEF* |
|
XBRL Taxonomy Extension Definition Linkbase Document |
|
|
|
* |
Filed herewith. |
|
+ |
Management contract or compensatory plan or arrangement. |
44
Pursuant to the requirements of Section 13 or 15(d) of the Securities Exchange Act of 1934, the Registrant has duly caused this report to be signed on its behalf by the undersigned thereunto duly authorized on March 11, 2015.
|
FUEL SYSTEMS SOLUTIONS, INC.
|
||
|
By: |
|
/S/ MARIANO COSTAMAGNA |
|
Name: |
|
Mariano Costamagna |
|
Title: |
|
Chief Executive Officer |
45
SIGNATURES & POWER OF ATTORNEY
KNOW ALL MEN BY THESE PRESENTS, that each person whose signature appears below constitutes and appoints Mariano Costamagna and Pietro Bersani, and each of them, his true and lawful attorneys-in-fact and agents, with full power of substitution and resubstitution, for him and in his name, place and stead, in any and all capacities, to sign any or all amendments to this annual report on Form 10-K under the Securities Exchange Act of 1934, as amended, and to file the same, with all exhibits thereto, and other documents in connection therewith, with the Securities and Exchange Commission, granting unto said attorneys-in-fact and agents, and each of them, full power and authority to do and perform each and every act and thing requisite and necessary to be done in and about the premises, as fully to all intents and purposes as he might or could do in person, hereby ratifying and confirming all that said attorneys-in- fact and agents or any of them, or their or his substitute or substitutes, may lawfully do or cause to be done by virtue hereof.
Pursuant to the requirements of the Securities Exchange Act of 1934, this report has been signed below by the following persons on behalf of the Registrant and in the capacities and on the dates indicated.
|
Signature
|
Title
|
Date
|
|
/S/ MARIANO COSTAMAGNA
Mariano Costamagna |
Chief Executive Officer and Director (Principal Executive Officer) |
March 11, 2015 |
|
|
|
|
|
/S/ PIETRO BERSANI
Pietro Bersani |
Chief Financial Officer |
March 11, 2015 |
|
|
|
|
|
/S/ MICHAEL HELFAND
Michael Helfand |
Senior Vice President Finance and Chief Accounting Officer (Principal Accounting Officer) |
March 11, 2015 |
|
|
|
|
|
/S/ JOSEPH E. POMPEO
Joseph E. Pompeo
|
Director |
March 11, 2015 |
|
/S/ COLIN S. JOHNSTON
Colin S. Johnston |
Director |
March 11, 2015 |
|
|
|
|
|
/S/ MARCO DI TORO
Marco Di Toro |
Director |
March 11, 2015 |
|
|
|
|
|
|
|
|
|
/S/ TROY A. CLARKE
Troy A. Clarke |
Director |
March 11, 2015 |
|
|
|
|
|
/S/ JAMES W. NALL
James W. Nall |
Director |
March 11, 2015 |
|
|
|
|
|
/S/ ANTHONY HARRIS
Anthony Harris |
Director |
March 11, 2015 |
|
/S/ STEVEN R. BECKER
Steven R. Becker |
Director |
March 11, 2015 |
46
FUEL SYSTEMS SOLUTIONS, INC.
INDEX TO CONSOLIDATED FINANCIAL STATEMENTS
|
|
Page |
|
CONSOLIDATED FINANCIAL STATEMENTS—FUEL SYSTEMS SOLUTIONS, INC. |
|
|
F-2 |
|
|
F-3 |
|
|
F-4 |
|
|
F-5 |
|
|
F-6 |
|
|
F-7 |
|
|
F-8 |
|
|
SUPPLEMENTAL FINANCIAL STATEMENT SCHEDULES: |
|
|
F-37 |
F-1
REPORT OF INDEPENDENT REGISTERED PUBLIC ACCOUNTING FIRM
To the Board of Directors and Stockholders of
Fuel Systems Solutions, Inc.:
In our opinion, the consolidated financial statements listed in the accompanying index located on page F-1 present fairly, in all material respects, the financial position of Fuel Systems Solutions, Inc. and its subsidiaries (the Company) at December 31, 2014 and 2013, and the results of their operations and their cash flows for each of the three years in the period ended December 31, 2014 in conformity with accounting principles generally accepted in the United States of America. In addition, in our opinion, the financial statement schedule listed in the accompanying index located on page F-1, presents fairly, in all material respects, the information set forth therein when read in conjunction with the related consolidated financial statements. Also in our opinion, the Company maintained, in all material respects, effective internal control over financial reporting as of December 31, 2014, based on criteria established in Internal Control - Integrated Framework (2013) issued by the Committee of Sponsoring Organizations of the Treadway Commission (COSO). The Company's management is responsible for these financial statements and financial statement schedule, for maintaining effective internal control over financial reporting and for its assessment of the effectiveness of internal control over financial reporting, included in Management’s Annual Report on Internal Control Over Financial Reporting appearing under Item 9A. Our responsibility is to express opinions on these financial statements, on the financial statement schedule, and on the Company's internal control over financial reporting based on our integrated audits. We conducted our audits in accordance with the standards of the Public Company Accounting Oversight Board (United States). Those standards require that we plan and perform the audits to obtain reasonable assurance about whether the financial statements are free of material misstatement and whether effective internal control over financial reporting was maintained in all material respects. Our audits of the financial statements included examining, on a test basis, evidence supporting the amounts and disclosures in the financial statements, assessing the accounting principles used and significant estimates made by management, and evaluating the overall financial statement presentation. Our audit of internal control over financial reporting included obtaining an understanding of internal control over financial reporting, assessing the risk that a material weakness exists, and testing and evaluating the design and operating effectiveness of internal control based on the assessed risk. Our audits also included performing such other procedures as we considered necessary in the circumstances. We believe that our audits provide a reasonable basis for our opinions.
A company’s internal control over financial reporting is a process designed to provide reasonable assurance regarding the reliability of financial reporting and the preparation of financial statements for external purposes in accordance with generally accepted accounting principles. A company’s internal control over financial reporting includes those policies and procedures that (i) pertain to the maintenance of records that, in reasonable detail, accurately and fairly reflect the transactions and dispositions of the assets of the company; (ii) provide reasonable assurance that transactions are recorded as necessary to permit preparation of financial statements in accordance with generally accepted accounting principles, and that receipts and expenditures of the company are being made only in accordance with authorizations of management and directors of the company; and (iii) provide reasonable assurance regarding prevention or timely detection of unauthorized acquisition, use, or disposition of the company’s assets that could have a material effect on the financial statements.
Because of its inherent limitations, internal control over financial reporting may not prevent or detect misstatements. Also, projections of any evaluation of effectiveness to future periods are subject to the risk that controls may become inadequate because of changes in conditions, or that the degree of compliance with the policies or procedures may deteriorate.
|
/s/ PricewaterhouseCoopers LLP |
|
New York, New York |
|
March 11, 2015 |
F-2
FUEL SYSTEMS SOLUTIONS, INC.
(In Thousands, Except Share and Per Share Data)
|
|
December 31, |
|
|
December 31, |
|
||
|
ASSETS |
|
|
|
|
|
|
|
|
Current assets: |
|
|
|
|
|
|
|
|
Cash and cash equivalents |
$ |
85,180 |
|
|
$ |
80,961 |
|
|
Accounts receivable less allowance for doubtful accounts of $3,129 and $3,993 at December 31, 2014 and 2013, respectively |
|
46,952 |
|
|
|
65,008 |
|
|
Inventories |
|
80,001 |
|
|
|
95,052 |
|
|
Deferred tax assets, net |
|
9,547 |
|
|
|
10,234 |
|
|
Other current assets |
|
21,271 |
|
|
|
21,490 |
|
|
Short-term investments |
|
6,614 |
|
|
|
14,615 |
|
|
Related party receivables |
|
5,094 |
|
|
|
2,787 |
|
|
Total current assets |
|
254,659 |
|
|
|
290,147 |
|
|
Equipment and leasehold improvements, net |
|
48,937 |
|
|
|
58,402 |
|
|
Goodwill |
|
7,363 |
|
|
|
48,896 |
|
|
Deferred tax assets, net |
|
5,253 |
|
|
|
4,129 |
|
|
Intangible assets, net |
|
6,964 |
|
|
|
11,790 |
|
|
Other assets |
|
1,065 |
|
|
|
1,260 |
|
|
Long-term investments |
|
0 |
|
|
|
675 |
|
|
Total Assets |
$ |
324,241 |
|
|
$ |
415,299 |
|
|
LIABILITIES AND EQUITY |
|
|
|
|
|
|
|
|
Current liabilities: |
|
|
|
|
|
|
|
|
Accounts payable |
$ |
39,918 |
|
|
$ |
40,702 |
|
|
Accrued expenses |
|
37,017 |
|
|
|
42,094 |
|
|
Income taxes payable |
|
445 |
|
|
|
216 |
|
|
Current portion of term loans and debt |
|
207 |
|
|
|
213 |
|
|
Related party payables |
|
2,744 |
|
|
|
2,860 |
|
|
Total current liabilities |
|
80,331 |
|
|
|
86,085 |
|
|
Term and other loans |
|
0 |
|
|
|
215 |
|
|
Other liabilities |
|
6,174 |
|
|
|
8,364 |
|
|
Deferred tax liabilities, net |
|
1,001 |
|
|
|
1,583 |
|
|
Total Liabilities |
|
87,506 |
|
|
|
96,247 |
|
|
Commitments and contingencies (Note 18) |
|
|
|
|
|
|
|
|
Equity: |
|
|
|
|
|
|
|
|
Preferred stock, $0.001 par value, authorized 1,000,000 shares; none issued and outstanding at December 31, 2014 and 2013 |
|
0 |
|
|
|
0 |
|
|
Common stock, $0.001 par value, authorized 200,000,000 shares; 20,114,427 issued and 19,769,617 outstanding at December 31, 2014; and 20,104,009 issued and 20,096,010 outstanding at December 31, 2013 |
|
20 |
|
|
|
20 |
|
|
Additional paid-in capital |
|
320,820 |
|
|
|
320,345 |
|
|
Shares held in treasury, 344,810 and 7,999 shares at December 31, 2014 and 2013, respectively |
|
(3,692 |
) |
|
|
(295 |
) |
|
Accumulated Deficit |
|
(54,151 |
) |
|
|
(735 |
) |
|
Accumulated other comprehensive loss |
|
(26,403 |
) |
|
|
(439 |
) |
|
Total Fuel Systems Solutions, Inc. Equity |
|
236,594 |
|
|
|
318,896 |
|
|
Non-controlling interest |
|
141 |
|
|
|
156 |
|
|
Total Equity |
|
236,735 |
|
|
|
319,052 |
|
|
Total Liabilities and Equity |
$ |
324,241 |
|
|
$ |
415,299 |
|
See accompanying notes to consolidated financial statements.
F-3
FUEL SYSTEMS SOLUTIONS, INC.
CONSOLIDATED STATEMENTS OF OPERATIONS
(In Thousands Except Share and Per Share Data)
|
|
Years Ended December 31, |
|
|||||||||||
|
|
2014 |
|
|
2013 |
|
|
2012 |
|
|||||
|
Revenue |
$ |
339,128 |
|
|
$ |
399,841 |
|
|
$ |
393,947 |
|
||
|
Cost of revenue |
|
264,471 |
|
|
|
312,703 |
|
|
|
302,113 |
|
||
|
Gross profit |
|
74,657 |
|
|
|
87,138 |
|
|
|
91,834 |
|
||
|
Operating Expenses: |
|
|
|
|
|
|
|
|
|
|
|
||
|
Research and development expense |
|
26,194 |
|
|
|
27,540 |
|
|
|
28,327 |
|
||
|
Selling, general and administrative expense |
|
58,341 |
|
|
|
55,189 |
|
|
|
54,747 |
|
||
|
Impairments |
|
44,341 |
|
|
|
0 |
|
|
|
22,046 |
|
||
|
Total operating expenses |
|
128,876 |
|
|
|
82,729 |
|
|
|
105,120 |
|
||
|
Operating (loss) income |
|
(54,219 |
) |
|
|
4,409 |
|
|
|
(13,286 |
) |
||
|
Other income (expense), net |
|
1,266 |
|
|
|
(1,536 |
) |
|
|
(492 |
) |
||
|
Interest income |
|
980 |
|
|
|
1,062 |
|
|
|
932 |
|
||
|
Interest expense |
|
(829 |
) |
|
|
(847 |
) |
|
|
(603 |
) |
||
|
(Loss) income from operations before income taxes and non-controlling interest |
|
(52,802 |
) |
|
|
3,088 |
|
|
|
(13,449 |
) |
||
|
Income tax provision |
|
(610 |
) |
|
|
(3,566 |
) |
|
|
(2,183 |
) |
||
|
Net loss |
|
(53,412 |
) |
|
|
(478 |
) |
|
|
(15,632 |
) |
||
|
Less: net (income) loss attributed to non-controlling interests |
|
(4 |
) |
|
|
18 |
|
|
|
0 |
|
||
|
Net loss attributable to Fuel Systems Solutions, Inc. |
$ |
(53,416 |
) |
|
$ |
(460 |
) |
|
$ |
(15,632 |
) |
||
|
Net loss per share attributable to Fuel Systems Solutions, Inc.: |
|
|
|
|
|
|
|
|
|
|
|
||
|
Basic |
$ |
(2.66 |
) |
|
$ |
(0.02 |
) |
|
$ |
(0.78 |
) |
||
|
Diluted |
$ |
(2.66 |
) |
|
$ |
(0.02 |
) |
|
$ |
(0.78 |
) |
||
|
Number of shares used in per share calculation |
|
|
|
|
|
|
|
|
|
|
|
||
|
Basic |
|
20,074,773 |
|
|
|
20,073,360 |
|
|
|
20,020,487 |
|
||
|
Diluted |
|
20,074,773 |
|
|
|
20,073,360 |
|
|
|
20,020,487 |
|
||
See accompanying notes to consolidated financial statements.
F-4
CONSOLIDATED STATEMENTS OF COMPREHENSIVE INCOME (LOSS)
(In Thousands)
|
|
Years Ended December 31, |
|
|||||||||||
|
|
2014 |
|
|
2013 |
|
2012 |
|
||||||
|
Net loss |
$ |
(53,412) |
|
|
$ |
(478 |
) |
|
$ |
(15,632 |
) |
||
|
Other comprehensive (loss) income, net of tax except for foreign currency items: |
|
|
|
|
|
|
|
|
|
|
|
||
|
Foreign currency translation adjustments |
|
(26,374) |
|
|
|
1,875 |
|
|
|
1,613 |
|
||
|
Unrealized (loss) gain on investments: |
|
|
|
|
|
|
|
|
|
|
|
||
|
Unrealized holding (loss) gain arising during period |
|
(55) |
|
|
|
55 |
|
|
|
(9 |
) |
||
|
Foreign currency unrealized (loss) gain on investments during period |
|
(245) |
|
|
|
385 |
|
|
|
0 |
|
||
|
Net realized loss (gain) reclassified during period |
|
691 |
|
|
|
(686 |
) |
|
|
0 |
|
||
|
Other comprehensive (loss) income, net of tax except for foreign currency items |
|
(25,983) |
|
|
|
1,629 |
|
|
|
1,604 |
|
||
|
Comprehensive (loss) income |
|
(79,395) |
|
|
|
1,151 |
|
|
|
(14,028 |
) |
||
|
Less: net comprehensive loss attributable to the non-controlling interest |
|
15 |
|
|
|
10 |
|
|
|
0 |
|
||
|
Comprehensive (loss) income attributable to Fuel Systems Solutions, Inc. |
$ |
(79,380) |
|
|
$ |
1,161 |
|
|
$ |
(14,028 |
) |
||
See accompanying notes to consolidated financial statements.
F-5
FUEL SYSTEMS SOLUTIONS, INC.
CONSOLIDATED STATEMENTS OF STOCKHOLDERS’ EQUITY
(In Thousands, Except Share Data)
|
|
Fuel Systems Stockholders’ Equity |
|
|
|
|
|
|
|
|||||||||||||||||||||||
|
|
Common Stock |
|
|
Additional |
|
|
Shares Held |
|
|
Retained |
|
|
Accumulated |
|
|
Non- |
|
|
Total |
|
|||||||||||
|
|
Shares |
|
|
Amount |
|
|
|
|
|
|
|
|
|
|
|
|
|
||||||||||||||
|
Balance, December 31, 2011 |
|
20,014,065 |
|
|
$ |
20 |
|
|
$ |
318,632 |
|
|
$ |
(523 |
) |
|
$ |
15,357 |
|
|
$ |
(3,664 |
) |
|
|
0 |
|
|
$ |
329,822 |
|
|
Net loss |
|
0 |
|
|
|
0 |
|
|
|
0 |
|
|
|
0 |
|
|
|
(15,632 |
) |
|
|
0 |
|
|
|
0 |
|
|
|
(15,632 |
) |
|
Foreign currency translation adjustment |
|
0 |
|
|
|
0 |
|
|
|
0 |
|
|
|
0 |
|
|
|
0 |
|
|
|
1,613 |
|
|
|
0 |
|
|
|
1,613 |
|
|
Unrealized net loss on investments, net of tax |
|
0 |
|
|
|
0 |
|
|
|
0 |
|
|
|
0 |
|
|
|
0 |
|
|
|
(9 |
) |
|
|
0 |
|
|
|
(9 |
) |
|
Evotek acquisition Compensation expense |
|
14,868 |
|
|
|
0 |
|
|
|
750 |
|
|
|
0 |
|
|
|
0 |
|
|
|
0 |
|
|
|
0 |
|
|
|
750 |
|
|
Common stock issued upon exercise of options |
|
1,200 |
|
|
|
0 |
|
|
|
11 |
|
|
|
0 |
|
|
|
0 |
|
|
|
0 |
|
|
|
0 |
|
|
|
11 |
|
|
Issuance and vesting of stock options |
|
0 |
|
|
|
0 |
|
|
|
15 |
|
|
|
0 |
|
|
|
0 |
|
|
|
0 |
|
|
|
0 |
|
|
|
15 |
|
|
Issuance and vesting of restricted stock, net of shares withheld for employee tax |
|
8,887 |
|
|
|
0 |
|
|
|
40 |
|
|
|
208 |
|
|
|
0 |
|
|
|
0 |
|
|
|
0 |
|
|
|
248 |
|
|
Shares held in trust for deferred compensation plan, at cost |
|
0 |
|
|
|
0 |
|
|
|
219 |
|
|
|
10 |
|
|
|
0 |
|
|
|
0 |
|
|
|
0 |
|
|
|
229 |
|
|
Balance, December 31, 2012 |
|
20,039,020 |
|
|
$ |
20 |
|
|
$ |
319,667 |
|
|
$ |
(305 |
) |
|
$ |
(275 |
) |
|
$ |
(2,060 |
) |
|
|
0 |
|
|
$ |
317,047 |
|
|
Net loss |
|
0 |
|
|
|
0 |
|
|
|
0 |
|
|
|
0 |
|
|
|
(460 |
) |
|
|
0 |
|
|
|
(18 |
) |
|
|
(478) |
|
|
Foreign currency translation adjustment |
|
0 |
|
|
|
0 |
|
|
|
0 |
|
|
|
0 |
|
|
|
|
|
|
|
1,867 |
|
|
|
8 |
|
|
|
1,875 |
|
|
Unrealized net loss on investments, net of tax |
|
0 |
|
|
|
0 |
|
|
|
0 |
|
|
|
0 |
|
|
|
0 |
|
|
|
55 |
|
|
|
0 |
|
|
|
55 |
|
|
Unrealized foreign exchange gain on investment, net of tax |
|
0 |
|
|
|
0 |
|
|
|
0 |
|
|
|
0 |
|
|
|
0 |
|
|
|
385 |
|
|
|
0 |
|
|
|
385 |
|
|
Realized foreign exchange gain on investment, net of tax |
|
0 |
|
|
|
0 |
|
|
|
0 |
|
|
|
0 |
|
|
|
0 |
|
|
|
(420 |
) |
|
|
0 |
|
|
|
(420) |
|
|
Realized foreign exchange gain on sale of foreign subsidiary, net of tax |
|
0 |
|
|
|
0 |
|
|
|
0 |
|
|
|
0 |
|
|
|
0 |
|
|
|
(266 |
) |
|
|
0 |
|
|
|
(266) |
|
|
Evotek acquisition Compensation expense |
|
14,868 |
|
|
|
0 |
|
|
|
0 |
|
|
|
0 |
|
|
|
0 |
|
|
|
0 |
|
|
|
0 |
|
|
|
0 |
|
|
Common stock issued upon exercise of options |
|
30,000 |
|
|
|
0 |
|
|
|
316 |
|
|
|
0 |
|
|
|
0 |
|
|
|
0 |
|
|
|
0 |
|
|
|
316 |
|
|
Issuance and vesting of stock options |
|
0 |
|
|
|
0 |
|
|
|
186 |
|
|
|
0 |
|
|
|
0 |
|
|
|
0 |
|
|
|
0 |
|
|
|
186 |
|
|
Issuance and vesting of restricted stock, net of shares withheld for employee tax |
|
12,122 |
|
|
|
0 |
|
|
|
176 |
|
|
|
0 |
|
|
|
0 |
|
|
|
0 |
|
|
|
0 |
|
|
|
176 |
|
|
Shares held in trust for deferred compensation plan, at cost |
|
0 |
|
|
|
0 |
|
|
|
0 |
|
|
|
10 |
|
|
|
0 |
|
|
|
0 |
|
|
|
0 |
|
|
|
10 |
|
|
Change in Control in Rohan BRC |
|
|
|
|
|
|
|
|
|
|
|
|
|
|
|
|
|
|
|
|
|
|
|
|
|
166 |
|
|
|
166 |
|
|
Balance, December 31, 2013 |
|
20,096,010 |
|
|
$ |
20 |
|
|
$ |
320,345 |
|
|
$ |
(295 |
) |
|
$ |
(735 |
) |
|
$ |
(439 |
) |
|
$ |
156 |
|
|
$ |
319,052 |
|
|
Net (loss) income |
|
0 |
|
|
|
0 |
|
|
|
0 |
|
|
|
0 |
|
|
|
(53,416) |
|
|
|
0 |
|
|
|
4 |
|
|
|
(53,412) |
|
|
Foreign currency translation adjustment |
|
0 |
|
|
|
0 |
|
|
|
0 |
|
|
|
0 |
|
|
|
0 |
|
|
|
(26,355) |
|
|
|
(19) |
|
|
|
(26,374) |
|
|
Unrealized net loss on investments, net of tax |
|
0 |
|
|
|
0 |
|
|
|
0 |
|
|
|
0 |
|
|
|
0 |
|
|
|
(55) |
|
|
|
0 |
|
|
|
(55) |
|
|
Unrealized foreign exchange loss on investment, net of tax |
|
0 |
|
|
|
0 |
|
|
|
0 |
|
|
|
0 |
|
|
|
0 |
|
|
|
(245) |
|
|
|
0 |
|
|
|
(245) |
|
|
Realized foreign exchange loss on investment, net of tax |
|
0 |
|
|
|
0 |
|
|
|
0 |
|
|
|
0 |
|
|
|
0 |
|
|
|
691 |
|
|
|
0 |
|
|
|
691 |
|
|
Issuance and vesting of stock options |
|
0 |
|
|
|
0 |
|
|
|
225 |
|
|
|
0 |
|
|
|
0 |
|
|
|
0 |
|
|
|
0 |
|
|
|
225 |
|
|
Repurchase of common stock |
|
(336,811 |
) |
|
|
0 |
|
|
|
0 |
|
|
|
(3,416) |
|
|
|
0 |
|
|
|
0 |
|
|
|
0 |
|
|
|
(3,416) |
|
|
Issuance and vesting of restricted stock, net of shares withheld for employee tax |
|
10,418 |
|
|
|
0 |
|
|
|
250 |
|
|
|
0 |
|
|
|
0 |
|
|
|
0 |
|
|
|
0 |
|
|
|
250 |
|
|
Shares held in trust for deferred compensation plan, at cost |
|
0 |
|
|
|
0 |
|
|
|
0 |
|
|
|
19 |
|
|
|
0 |
|
|
|
0 |
|
|
|
0 |
|
|
|
19 |
|
|
Balance, December 31, 2014 |
|
19,769,617 |
|
|
$ |
20 |
|
|
$ |
320,820 |
|
|
$ |
(3,692 |
) |
|
$ |
(54,151 |
) |
|
$ |
(26,403 |
) |
|
$ |
141 |
|
|
$ |
236,735 |
|
See accompanying notes to consolidated financial statements.
F-6
FUEL SYSTEMS SOLUTIONS, INC.
CONSOLIDATED STATEMENTS OF CASH FLOWS
(In Thousands, except Share and Per Share Data)
|
|
Years Ended December 31, |
|
|||||||||
|
|
2014 |
|
|
2013 |
|
|
2012 |
|
|||
|
Cash flows from operating activities: |
|
|
|
|
|
|
|
|
|
|
|
|
Net loss |
$ |
(53,412) |
|
|
$ |
(478) |
|
|
$ |
(15,632 |
) |
|
Less: net (income) loss attributable to the non-controlling interest |
|
(4) |
|
|
|
18 |
|
|
|
0 |
|
|
Net loss attributable to Fuels Systems Solutions, Inc. |
|
(53,416) |
|
|
$ |
(460) |
|
|
$ |
(15,632 |
) |
|
Adjustments to reconcile net loss to net cash provided by operating activities: |
|
|
|
|
|
|
|
|
|
|
|
|
Depreciation and other amortization |
|
10,724 |
|
|
|
10,917 |
|
|
|
10,424 |
|
|
Amortization of intangibles arising from acquisitions |
|
2,285 |
|
|
|
2,915 |
|
|
|
5,800 |
|
|
Impairments |
|
44,341 |
|
|
|
0 |
|
|
|
22,046 |
|
|
Provision for doubtful accounts |
|
319 |
|
|
|
583 |
|
|
|
2,299 |
|
|
Provision for related party loan receivable |
|
0 |
|
|
|
0 |
|
|
|
828 |
|
|
Write down of inventory |
|
4,239 |
|
|
|
4,310 |
|
|
|
4,246 |
|
|
Loss on acquisition |
|
0 |
|
|
|
2,024 |
|
|
|
0 |
|
|
Other non-cash items |
|
14 |
|
|
|
(222) |
|
|
|
0 |
|
|
Deferred Income Taxes |
|
(2,788) |
|
|
|
(1,939) |
|
|
|
(8,115 |
) |
|
Unrealized (gain) loss on foreign exchange transactions |
|
(685) |
|
|
|
2,961 |
|
|
|
859 |
|
|
Compensation expense related to equity awards |
|
475 |
|
|
|
362 |
|
|
|
1,015 |
|
|
Loss on abandonment of leased property |
|
1,993 |
|
|
|
0 |
|
|
|
0 |
|
|
Loss (gain) on disposal of equipment and other assets |
|
1,573 |
|
|
|
(281) |
|
|
|
1,005 |
|
|
Reduction of contingent consideration |
|
0 |
|
|
|
(406) |
|
|
|
(839 |
) |
|
Changes in assets and liabilities, net of acquisitions |
|
|
|
|
|
|
|
|
|
|
|
|
Decrease (increase) in accounts receivable |
|
11,657 |
|
|
|
10,552 |
|
|
|
(12,878 |
) |
|
Decrease (increase) in inventories |
|
446 |
|
|
|
1,649 |
|
|
|
(2,500 |
) |
|
(Increase) decrease in other current assets |
|
(3,365) |
|
|
|
(6,338) |
|
|
|
827 |
|
|
Decrease (increase) in other assets |
|
751 |
|
|
|
(596) |
|
|
|
715 |
|
|
Increase (decrease) in accounts payable |
|
4,137 |
|
|
|
(2,288) |
|
|
|
(11,271 |
) |
|
Increase (decrease) in income taxes payable |
|
289 |
|
|
|
(2,522) |
|
|
|
308 |
|
|
Increase in accrued expenses |
|
72 |
|
|
|
312 |
|
|
|
9,776 |
|
|
Decrease in long-term liabilities |
|
(1,560) |
|
|
|
(154) |
|
|
|
(762 |
) |
|
Receivables from/payables to related party, net |
|
(3,077) |
|
|
|
223 |
|
|
|
4,667 |
|
|
Net cash provided by operating activities |
|
18,424 |
|
|
|
21,602 |
|
|
|
12,818 |
|
|
Cash flows from investing activities: |
|
|
|
|
|
|
|
|
|
|
|
|
Purchase of equipment and leasehold improvements |
|
(13,726) |
|
|
|
(9,506) |
|
|
|
(13,704 |
) |
|
Purchase of investments |
|
(4,000) |
|
|
|
(14,626) |
|
|
|
(18,277 |
) |
|
Sale of investments |
|
0 |
|
|
|
6,753 |
|
|
|
0 |
|
|
Redemption of investment at maturity |
|
11,456 |
|
|
|
0 |
|
|
|
11,930 |
|
|
Acquisitions, net of cash acquired |
|
0 |
|
|
|
(841) |
|
|
|
(5,700 |
) |
|
Amount in restricted cash for acquisition of non-controlling interest |
|
0 |
|
|
|
0 |
|
|
|
2,820 |
|
|
Other |
|
210 |
|
|
|
244 |
|
|
|
258 |
|
|
Net cash used in investing activities |
|
(6,060) |
|
|
|
(17,976) |
|
|
|
(22,673 |
) |
|
Cash flows from financing activities: |
|
|
|
|
|
|
|
|
|
|
|
|
Decrease in callable revolving lines of credit, net |
|
0 |
|
|
|
0 |
|
|
|
(2,438 |
) |
|
Payments on term loans and other loans |
|
(184) |
|
|
|
(582) |
|
|
|
(6,397 |
) |
|
Increase in treasury shares (share repurchase program) |
|
(3,416) |
|
|
|
0 |
|
|
|
0 |
|
|
Acquisition of non-controlling interest |
|
0 |
|
|
|
0 |
|
|
|
(2,820 |
) |
|
Other |
|
19 |
|
|
|
327 |
|
|
|
18 |
|
|
Net cash used in financing activities |
|
(3,581) |
|
|
|
(255) |
|
|
|
(11,637 |
) |
|
Net increase (decrease) in cash and cash equivalents |
|
8,783 |
|
|
|
3,371 |
|
|
|
(21,492 |
) |
|
Effect of exchange rate changes on cash |
|
(4,564) |
|
|
|
1,915 |
|
|
|
427 |
|
|
Net increase (decrease) in cash and cash equivalents |
|
4,219 |
|
|
|
5,286 |
|
|
|
(21,065 |
) |
|
Cash and cash equivalents at beginning of period |
|
80,961 |
|
|
|
75,675 |
|
|
|
96,740 |
|
|
Cash and cash equivalents at end of period |
|
85,180 |
|
|
|
80,961 |
|
|
|
75,675 |
|
See accompanying notes to consolidated financial statements.
F-7
FUEL SYSTEMS SOLUTIONS, INC.
Notes to Consolidated Financial Statements
Fuel Systems Solutions, Inc. (“Fuel Systems” and the “Company”) designs, manufactures and supplies alternative fuel components and systems for use in the transportation and industrial markets on a global basis. The Company’s components and systems control the pressure and flow of gaseous alternative fuels, such as propane and natural gas used in internal combustion engines.
|
2. |
Summary of Significant Accounting Policies |
(a) Principles of consolidation—The Consolidated Financial Statements include the accounts of the Company and our majority-owned subsidiaries. All intercompany transactions, including intercompany profits and losses and intercompany balances, have been eliminated in consolidation. Investments in unconsolidated joint ventures or affiliates (“joint ventures”) are accounted for under the equity method of accounting, whereby the investment is initially recorded at the cost of acquisition and adjusted to recognize the Company’s share in undistributed earnings or losses since acquisition. The Company’s share in the earnings or losses for its joint ventures would be reflected in equity share in income of unconsolidated affiliates. If the investment in an unconsolidated joint venture is reduced to a zero balance due to prior losses, the Company recognizes any further losses related to its share to the extent that there are any receivables, loans or advances to the joint venture. These additional losses would be reflected in selling, general, and administrative expenses.
(b) Use of estimates—The preparation of consolidated financial statements in conformity with accounting principles generally accepted in the United States requires that management make estimates and assumptions that affect the reported amounts of assets and liabilities and disclosure of contingent assets and liabilities as of the date of the consolidated financial statements and the reported amounts of revenue and expenses during the reporting period. Actual results could materially differ from those estimates.
(c) Cash and cash equivalents—The Company considers all highly liquid investments with maturities of three months or less when purchased to be cash equivalents.
(d) Restricted cash—The Company classifies cash and cash equivalents that are restricted from operating use for the next twelve months as restricted cash. Amounts restricted for longer than twelve months are classified as other assets. When the restrictions are no longer in place, the amounts are reclassified to cash and cash equivalents.
(e) Investments—The Company determines the appropriate classification of its investments at the time of purchase and reevaluates the designations at each balance sheet date. The Company classifies its marketable securities as either short-term or long-term based on each instrument’s underlying contractual maturity date. Marketable securities with maturities of 12 months or less are classified as short-term and marketable debt securities with maturities greater than 12 months are classified as long-term. The Company’s marketable securities are carried at fair value, with the unrealized gains and losses, net of taxes, reported as a component of shareholders’ equity. The Company determines realized gains and losses on the sale of marketable securities on a specific identification method, and reflects such gains and losses as a component of interest and other income, net, in the accompanying Consolidated Statements of Operations.
(f) Inventories—The Company values its inventories at the lower of cost or market value. Cost is determined by the first-in, first-out, or the FIFO method, while market value is determined by replacement cost for raw materials and parts and net realizable value for work-in-process and finished goods.
(g) Equipment and leasehold improvements—Equipment and leasehold improvements are stated on the basis of historical cost. Depreciation of equipment is provided using the straight-line method principally over the following useful lives: dies, molds, and patterns shorter of 3 to 7 years or estimated product life; machinery and equipment 5 to 10 years; office furnishings and equipment 3 to 7 years; automobiles and trucks 5 years. Amortization of leasehold improvements is provided using the straight-line method over the shorter of the assets’ estimated useful lives or the lease terms. Design and development costs incurred in conjunction with the procurement of dies, molds, and patterns are immaterial. Depreciation of equipment acquired under a capital lease is provided using the straight line method over the shorter of the useful life of the equipment or the duration of the lease.
(h) Impairment of Goodwill—Goodwill reflects the cost of an acquisition in excess of the fair values assigned to identifiable net tangible and intangible assets acquired.
F-8
FUEL SYSTEMS SOLUTIONS, INC.
Notes to Consolidated Financial Statements – (Continued)
Goodwill is not subject to amortization and is tested for impairment annually and whenever events or changes in circumstances indicate that impairment may have occurred. Impairment testing is performed for each of the Company’s reporting units. The Company compares the carrying value of a reporting unit, including goodwill, to the fair value of the unit. Carrying value is based on the assets and liabilities associated with the operations of that reporting unit, which often requires allocation of shared or corporate items among reporting units. If the carrying amount of a reporting unit exceeds its fair value, the Company revalues all assets and liabilities of the reporting unit, excluding goodwill, to determine if the fair value of the net assets is greater than the net assets including goodwill. If the fair value of the net assets is less than the net assets including goodwill, impairment has occurred. If the implied fair value of goodwill is less than the carrying value of goodwill, an impairment has occurred. The Company’s estimates of fair value are determined based on a discounted cash flow model. Growth rates for sales and profits are determined using inputs from the Company’s annual long-range planning process. The Company also makes estimates of discount rates, perpetuity growth assumptions, market comparables, and other factors. The inputs and assumptions utilized in the analyses are classified as Level 3 inputs in the fair value hierarchy.
In 2014, an interim impairment test had been performed in the second quarter of 2014 prompted by the trading values of the Company’s stock, and the corresponding decline in market capitalization, coupled with market conditions and business trends within the Company’s various reporting units. The 2014 annual goodwill impairment testing was performed as of October 1, 2014. Consideration was given to the period between the testing date and December 31, 2014, in order to conclude that no facts or circumstances arose that would lead to a different conclusion as of December 31, 2014.
During the fourth quarter of 2012, in connection with the Company’s annual goodwill impairment test, management determined that the carrying values of two of its reporting units exceeded their fair values, due to lower than expected demand, which negatively impacted the respective reporting units’ forecasts of earnings and cash flows. As a result, the Company concluded it had a triggering event, requiring the assessment of impairment of certain of its long-lived assets.
See Note 15 in the notes to the consolidated financial statements for disclosure of the impairment analyses performed by the Company.
Impairment of Long-Lived Assets— The Company evaluates the useful lives of other intangible assets, mainly existing technology, trade name, and customer relationships to determine if they are finite or indefinite-lived. Reaching a determination on useful life requires significant judgments and assumptions regarding the future effects of obsolescence, demand, competition, other economic factors (such as the stability of the industry, known technological advances, legislative action that results in an uncertain or changing regulatory environment, and expected changes in distribution channels), the level of required maintenance expenditures, and the expected lives of other related groups of assets.
Among the intangible assets acquired, existing technology and trade name are amortized using the straight line method, the best estimate of the pattern of the economic benefits, and customer relationships are amortized using the accelerated sum-of-the-years digit method. The sum-of-the-years digit method of amortization reflects the pattern in which the economic benefits of the intangible assets are consumed or otherwise used up. Amortization expense related to existing technology and customer relationships is reported as a component of cost of revenue.
The Company reviews long-lived assets, including equipment and leasehold improvements and other intangible assets with definite lives, for impairment whenever events or changes in circumstances indicate that the asset’s carrying amount may not be recoverable. The Company groups assets and liabilities at the lowest level for which identifiable cash flows are largely independent of the cash flows of other assets and liabilities and evaluate the asset group against the sum of undiscounted future cash flows. If the undiscounted cash flows do not indicate the carrying amount of the asset is recoverable, an impairment charge is measured as the amount by which the carrying amount of the asset group exceeds its fair value based on discounted cash flows analysis or appraisals.
See Note 15 for disclosure of the impairment analyses performed by the Company.
(i) Warranty costs—Estimated future warranty obligations related to certain products are provided by charges to operations in the period in which the related revenue is recognized. Estimates are based, in part, on historical experience.
(j) Research and development costs—Research and development costs are charged to expense as incurred. Equipment used in research and development with alternative future uses is capitalized and amortized over the expected useful life of the equipment.
(k) Advertising Costs—Advertising costs are expensed as incurred. Advertising expense was $1.9 million, $2.2 million, and $1.8 million for the year ended December 31, 2014, 2013, and 2012, respectively.
F-9
FUEL SYSTEMS SOLUTIONS, INC.
Notes to Consolidated Financial Statements – (Continued)
(l) Revenue recognition—The Company recognizes revenue upon transfer of title and risk of loss, generally when products are shipped provided there is (1) persuasive evidence of an arrangement, (2) there are no uncertainties regarding customer acceptance, (3) the sales price is fixed or determinable and (4) management believes collectability is reasonably assured. The Company considers arrangements with extended payment terms not to be fixed or determinable unless they are secured under an irrevocable letter of credit arrangement guaranteed by a reputable financial institution, and accordingly, the Company defers such revenue until payment is received.
The Company recognizes engineering and construction contract revenues using the completed contract method. Under the completed-contract method, income is recognized only when a contract is completed or substantially completed. Accordingly, during the period of performance, billings and costs are accumulated on the balance sheet, but no profit or income is recorded before completion or substantial completion of the work. If at any time during the construction the Company incurs costs overrun, the excess cost is recorded on the books as a loss.
The company standard warranty period ranges from 18 to 36 months from the date of delivery to the customer, depending on the product. The Company through some of its subsidiaries occasionally offers extended warranty programs on some markets and products. The consideration received for extended warranty services is deferred and recognized as revenue on a straight-line basis over the term of the extended warranty.
The Company accounts for taxes collected from customers and remitted to governmental authorities on a net basis in its consolidated statement of operations. The Company classifies shipping and handling charges billed to customers as revenue. Shipping and handling costs paid to others are classified as a component of cost of sales when incurred.
(m) Allowance for doubtful accounts—The Company maintains provisions for uncollectible accounts for estimated losses resulting from the inability of its customers to remit payments. The Company continuously monitors collections and payments from its customers and maintains a provision for estimated credit losses based upon its historical experience and any specific customer collection issues that have been identified. Account balances are charged off against the allowance when the Company determines it is probable the receivable will not be recovered.
(n) Net income (loss) per share attributed to Fuel Systems—Basic income (loss) per share is computed by dividing net income applicable to common stock by the weighted average shares of common stock outstanding during the period. Diluted income (loss) per share is computed based on the weighted average number of shares of common stock outstanding, and if dilutive, all common stock equivalents.
(o) Income taxes—The Company uses the asset and liability method to account for income taxes. Significant management judgment is required in determining the provision for income taxes, deferred tax assets and liabilities and any valuation allowance recorded against net deferred tax assets. In the preparation of its consolidated financial statements, the Company is required to estimate income taxes in each of the jurisdictions in which it operates. This process involves estimating the actual current tax liability together with assessing temporary differences resulting from differing treatment of items, such as deferred revenue, property, plant and equipment and losses for tax and accounting purposes. These differences result in deferred tax assets, which include tax loss carry-forwards and liabilities, and are included within the consolidated balance sheet. The Company then assesses the likelihood of recovery of the deferred tax assets from future taxable income, and to the extent that recovery is not likely or there is insufficient operating history, a valuation allowance is established. To the extent a valuation allowance is established or increased in a period, the Company includes an expense within the tax provision of the consolidated statement of operations.
The Company follows the interpretations of the Financial Accounting Standard Board (“FASB”), which establish a single model to address accounting for uncertain tax positions. The interpretations clarify the accounting for income taxes by prescribing a minimum recognition threshold a tax position is required to meet before being recognized in the financial statements and also provide guidance on derecognition, measurement, classification, interest and penalties, accounting in interim periods, disclosure and transition.
(p) Stock based compensation—The Company’s stock-based compensation programs consist of restricted stock and stock options issued to employees and non-employee directors. The Company recognizes compensation expense for all stock-based payment arrangements, over the requisite service period of the award. For stock options, the Company determines the grant date fair value using the Black-Scholes option-pricing model, which requires the input of certain assumptions, including the expected life of the stock-based payment awards, stock price volatility and risk-free interest rates. For restricted stock the Company determines the fair value based on the fair market values of the underlying stock on the dates of grant.
F-10
FUEL SYSTEMS SOLUTIONS, INC.
Notes to Consolidated Financial Statements – (Continued)
(q) Foreign currency translation—Assets and liabilities of the Company’s consolidated foreign subsidiaries are generally translated at period-end exchange rates, and related revenue and expenses are translated at average exchange rates in effect during the period. Resulting translation adjustments are recorded as foreign currency components of other comprehensive income (loss) in equity. The results and financial condition of the Company’s international operations are affected by changes in exchange rates between certain foreign currencies and the U.S. dollar. The functional currency for each of the Company’s international subsidiaries is the local currency of the subsidiary. The Company seeks to manage its foreign currency economic risk by minimizing its U.S. dollar investment in foreign operations using foreign currency term loans and lines of credit to finance the operations of its foreign subsidiaries. The Company generally recognizes foreign exchange gains and losses on the consolidated statement of operations for intercompany balances that are denominated in currencies other than the reporting currency. In the event that the Company determines that intercompany balances between the Company and its subsidiary will not be settled in the foreseeable future, the foreign exchange gains and losses are deferred as part of the cumulative translation adjustment on the consolidated balance sheet.
Transaction gains and losses arising from exchange rate fluctuations on transactions denominated in a currency other than the functional currency are included in the consolidated statement of operations (in other income/expense, net) as incurred.
(r) Financial instruments—Management determines the appropriate classification of its investments at the time of purchase and reevaluates the designations at each balance sheet date. The Company classifies its marketable securities as either short-term or long-term based on each instrument’s underlying contractual maturity date. Marketable securities with maturities of 12 months or less are classified as short-term and marketable debt securities with maturities greater than 12 months are classified as long-term. The Company’s investments in marketable securities have been classified and accounted for as either available-for-sale or trading (see Note 4). Available-for-sale securities are carried at fair value, with the unrealized gains and losses, net of taxes, reported as a component of shareholders’ equity. Trading securities are reported at fair value, with unrealized gains and losses included in earnings. The Company determines realized gains and losses on the sale of marketable securities on a specific identification method, and reflects such gains and losses as a component of interest and other income, net, in the accompanying Consolidated Statements of Operations.
At December 31, 2014 and 2013, the fair value of the Company’s term loans approximated carrying value. The estimated fair values of the Company’s financial instruments have been determined using available market information. The estimates are not necessarily indicative of the amounts the Company could realize in a current market exchange. The use of different market assumptions and/or estimation methodologies may have an effect on the estimated fair value amounts. The fair value of current financial assets, current liabilities, and other assets are estimated to be equal to their carrying amounts.
(s) Comprehensive income (loss)—The Company presents comprehensive income (loss) in the consolidated statements of comprehensive income (loss). Comprehensive income (loss) includes, in addition to net income (loss), changes in equity that are excluded from the consolidated statements of operations and are recorded directly into a separate section of equity on the consolidated balance sheet. Accumulated other comprehensive income (loss) consists of foreign currency translation adjustments and unrealized gains (losses) on investments.
(t) Treasury stock—Treasury shares are accounted for as a deduction of equity. Any consideration paid or received is recognized directly in equity so that treasury stock is accounted for using the cost method and reported as shares held in treasury on the Company’s consolidated balance sheet. When treasury stock is reissued, the value is computed and recorded using a first-in-first-out basis.
(u) Reclassifications—In connection with the preparation of the consolidated financial statements for the year ended December 31, 2014, the Company identified the followings out-of-period errors: (i) an increase in the income tax provision of approximately $0.2 million; (ii) a balance sheet reclassification from current deferred taxes assets to other current assets for approximately $0.7 million; and (iii) a foot note disclosure, increasing gross deferred taxes assets and valuation allowance by approximately $0.9 million. These errors are presented correctly in the consolidated financial statements for the year ended December 31, 2014. In addition, these errors are not considered material to the previously issued consolidated financial statements or the current consolidated financial statements for the year ended December 31, 2014 as a whole.
Recent Accounting Pronouncements
In April 2014, the FASB issued a new accounting standard update that improves the definition of discontinued operations by limiting discontinued operations reporting to disposals of components of an entity that represent strategic shifts that have, or will have, a major effect on an entity’s operations and financial results. The amendments in this update are effective prospectively for fiscal
F-11
FUEL SYSTEMS SOLUTIONS, INC.
Notes to Consolidated Financial Statements – (Continued)
years, and interim periods within those years, beginning after December 15, 2014. Early adoption is permitted. The adoption of this standard is not expected to have a material impact on the Company’s financial statements.
In May 2014, the FASB issued a new accounting standard update providing additional guidance for revenue recognition in relation to contractual arrangements with customers. The core principle of the guidance is that an entity should recognize revenue to depict the transfer of promised goods or services to customers in an amount that reflects the consideration to which the entity expects to be entitled in exchange for the goods or services. The amendments in this update are effective retrospectively for fiscal years, and interim periods within those years, beginning after December 15, 2016. Early adoption is not permitted. The Company is currently defining the approach and planning the initial review activities necessary for the transition to the new standard.
In June 2014, the FASB issued a new accounting standard update providing additional guidance on how to account for share-based payments where the terms of an award may provide that the performance target could be achieved after an employee completes the requisite service period. The amendments require that a performance target that affects vesting and that could be achieved after the requisite period is treated as a performance condition. The amendments in this update are effective for fiscal years, and interim periods within those years beginning after December 15, 2015, and may be applied (a) prospectively to all awards granted or modified after the effective date or (b) retrospectively to all awards with performance targets that are outstanding as of the beginning of the earliest annual period presented in the financial statements and to all new or modified awards thereafter. Earlier adoption is permitted. The adoption of this standard is not expected to have a material impact on the Company’s financial statements.
In August 2014, the FASB issued a new accounting standard update intended to define management’s responsibility to evaluate whether there is substantial doubt about an organization’s ability to continue as a going concern and to provide related footnote disclosures. Under Generally Accepted Accounting Principles (GAAP), financial statements are prepared under the presumption that the reporting organization will continue to operate as a going concern, except in limited circumstances. Financial reporting under this presumption is commonly referred to as the going concern basis of accounting. The going concern basis of accounting is critical to financial reporting because it establishes the fundamental basis for measuring and classifying assets and liabilities. The amendments in this update apply to all companies and not-for-profit organizations. They become effective in the annual period ending after December 15, 2016, with early application permitted. The adoption of this standard is not expected to have a material impact on the Company’s financial statements.
In February 2015, the FASB issued a new accounting standard update providing amendments to the consolidation guidance. Among other aspects, the amendments in this update affect the consolidation analysis of reporting entities that are involved with Variable Interest Entities (“VIEs”), and the effect of related parties on the primary beneficiary determination. The amendments in this update reduce the application of the related party guidance for VIEs on the basis of the following three changes: (i) for single decision makers related party relationships must be considered indirectly on a proportionate basis, rather than in their entirety, (ii) related party relationships should be considered in their entirety for entities that are under common control only if that common control group has the characteristics of a primary beneficiary, and (iii) if the assessment in (ii) is not applicable, but substantially all of the activities of the VIE are conducted on behalf of a single variable interest holder (excluding the decision maker) in a related party group that has the characteristics of a primary beneficiary, that single variable interest holder must consolidate the VIE as the primary beneficiary. The standard is effective for calendar year-end public business entities in 2016, and early adoption is allowed, including in any interim period. The Company is currently evaluating this standard, which presently is not expected to have a material impact of the Company’s financial statements.
|
3. |
Acquisitions |
Acquisition of additional equity interest in Rohan BRC
On September 13, 2013, the Company acquired an additional 44.89% equity interest in Rohan BRC Gas Equipment Private Limited (“Rohan BRC”), an Indian company that assembles, sells and services Liquefied Petroleum Gas (“LPG”) and Compressed Natural Gas (“CNG”) equipment for automotive or other use, for both Original Equipment Manufacturers (“OEM”) and retrofit markets. This acquisition was justified by business and operations opportunities. The aggregate purchase price for the acquisition of the additional ownership interest in Rohan BRC totaled approximately $1.2 million (€0.9 million), net of cash acquired of $0.1 million (€0.1 million), of which $0.8 million (€0.6 million) was paid at closing, with the remainder to be settled within two years from the acquisition date.
The Company previously owned an equity interest of 50.01% in Rohan BRC and accounted for it under the equity method due to a lack of control on its board of directors and on the majority of its operations. Consequently, the acquisition of the additional
F-12
FUEL SYSTEMS SOLUTIONS, INC.
Notes to Consolidated Financial Statements – (Continued)
44.89% qualified as a step-acquisition. In accordance with the step-acquisition authoritative guidance, the previously held equity interest in Rohan BRC, including inventory on consignment, was re-measured at fair value on the date of acquisition resulting in a fair value of $2.0 million (€1.5 million), and then the total consideration paid for the additional equity interest acquired was compared to its fair value on the date of acquisition. The re-measurement resulted in a loss of $2.0 million (€1.5 million), recorded in cost of revenue for the year ended December 31, 2013.
The results of operations of Rohan BRC have been included in the accompanying consolidated statements of operations from the date of acquisition within the FSS Automotive operating segment.
The Company determined that the acquisition of the additional 44.89% equity interest in Rohan BRC was a non-material business combination. As such, pro forma disclosures are immaterial and are not presented within this filing. Revenue and net loss related to the Rohan BRC acquisition recognized in 2013 were approximately $1.8 million and $0.2 million, respectively.
Acquisition of Cubogas Natural Gas Compressor Systems
On February 10, 2012, the Company purchased from the Wayne business of Dresser Italia S.r.l. (the “seller”), the net assets of its Cubogas compressor division (the “Cubogas” acquisition), specializing in natural gas compressors and packaging solutions, in an all-cash transaction. The acquisition enables the Company to build its infrastructure and natural gas compressor product lines and to serve the growing demand from commercial, fleet and consumer customers. The aggregate purchase price for the Cubogas acquisition totaled approximately $6.7 million (approximately €5.0 million), of which $5.0 million (€3.8 million) was paid at closing, $0.9 million (€0.7 million) was paid in two equal installments 60 and 120 days after closing, with the remaining $0.8 million (€0.6 million) paid in three equal installments one year, two years, and three years from the closing date, respectively.
The results of operations of Cubogas have been included in the accompanying consolidated statements of operations from the date of acquisition within the FSS Automotive operating segment.
The purchase price has been allocated as follows (in thousands):
|
Accounts receivable |
$ |
1,692 |
|
|
Inventory |
|
2,208 |
|
|
Other tangible assets |
|
1,192 |
|
|
Intangible assets subject to amortization |
|
1,613 |
|
|
Goodwill |
|
223 |
|
|
Total assets acquired |
|
6,928 |
|
|
Less: total liabilities |
|
(280 |
) |
|
Total net assets recorded |
$ |
6,648 |
|
The gross contractual amount and the estimated fair value of the receivables acquired were identical and equal to $1.7 million. The Cubogas purchase agreement includes a provision for reimbursement by the seller of uncollected receivable and, consequently, the Company estimated that the entire cash flows will be collected.
The useful lives of the acquired intangible assets are as follows:
|
Acquired intangible assets: |
|
Amount at acquisition |
|
|
Useful life |
|
||
|
Developed technology |
|
$ |
0.8 million |
|
|
|
5 years |
|
|
Trademarks |
|
$ |
0.7 million |
|
|
|
3 to 5 years |
|
|
Customer relationships |
|
$ |
0.1 million |
|
|
|
6 years |
|
|
Total acquired intangible assets |
|
$ |
1.6 million |
|
|
|
|
|
The purchase additions of natural gas compressors from Dresser, which further expands the Company’s compressor product offering, as well as the worldwide association of these brands with innovative fueling technologies, were among the factors that contributed to a purchase price resulting in the recognition of goodwill of $0.2 million (€ 0.2 million). The acquired goodwill is deductible for tax purposes.
F-13
FUEL SYSTEMS SOLUTIONS, INC.
Notes to Consolidated Financial Statements – (Continued)
The Company determined that the acquisition of Cubogas was a non-material business combination. As such, pro forma disclosures are not presented within this filing. Revenue related to the Cubogas acquisition recognized in 2012 was approximately $3.8 million.
Cash, cash equivalents, and investments consist of the following (in thousands):
|
|
As of |
|
|||||
|
|
December 31, 2014 |
|
|
December 31, 2013 |
|
||
|
Cash and cash equivalents: |
|
|
|
|
|
|
|
|
Cash |
$ |
56,038 |
|
|
$ |
72,302 |
|
|
Money market funds |
|
29,142 |
|
|
|
8,659 |
|
|
Total cash and cash equivalents |
$ |
85,180 |
|
|
$ |
80,961 |
|
|
Investments: |
|
|
|
|
|
|
|
|
Available for sale securities: |
|
|
|
|
|
|
|
|
German Government bonds (1) |
|
0 |
|
|
|
12,615 |
|
|
Trading securities: |
|
|
|
|
|
|
|
|
Deferred Compensation Plan assets |
|
614 |
|
|
|
675 |
|
|
Other investments, held to maturity: |
|
|
|
|
|
|
|
|
Time deposits (2) |
|
6,000 |
|
|
|
2,000 |
|
|
Total investments |
$ |
6,614 |
|
|
$ |
15,290 |
|
|
Short term investments |
$ |
6,614 |
|
|
$ |
14,615 |
|
|
Long term investments |
$ |
0 |
|
|
$ |
675 |
|
Note (1): The German Government bonds had a notional amount of €9.0 million and were purchased at 103.96 on February 8, 2013 and reimbursed at par at maturity on October 10, 2014 for approximately $11.5 million (€9.0 million). Amortized cost at maturity was approximately $12.1 million. Upon reimbursement unrealized losses of approximately $0.7 million were reclassified from other comprehensive income to earnings (see Note 14). The proceeds from the reimbursement of the bonds were temporarily invested in high-yield deposits.
Note (2): Represents three Bank of America certificates of deposit (no interest if withdrawn before maturity): a $2 million certificate of deposit with a maturity date of January 16, 2015 and 0.26% interest rate, a $3 million certificate of deposit with a maturity date of January 22, 2015 and 0.26% interest rate, and a $1 million certificate of deposit with a maturity date of September 25, 2015 and 0.34% interest rate.
The Company maintains investments in trading securities in connection with its non-qualified Deferred Compensation Plan, whereby selected key employees and directors elected to defer a portion of their compensation each year. The Company’s investments associated with its Deferred Compensation Plan consist of mutual funds that are publicly traded and for which inputs are directly or indirectly observable in the marketplace. These trading securities are reported at fair value, with unrealized gains and losses included in earnings. In addition, the Deferred Compensation liability includes the value of deferred shares of the Company’s common stock, which is publicly traded and for which current market prices are readily available. The fair market value of the investments in the Deferred Compensation Plan is included in short-term investments starting from the second quarter of 2014 (following termination of the plan, as discussed below), with the corresponding deferred compensation obligation included in accrued expenses on the Condensed Consolidated Balance Sheets. Changes in the fair value of the benefits payable to participants and investments are both recognized as components of compensation expense. The net impact of changes in fair value was not material. The Deferred Compensation Plan was terminated during the second quarter of 2014 and the funds will be distributed within one year.
F-14
FUEL SYSTEMS SOLUTIONS, INC.
Notes to Consolidated Financial Statements – (Continued)
The following tables summarize unrealized gains and losses related to the Company’s investments designated as available-for-sale (in thousands):
|
|
As of December 31, 2013 |
|
|||||||||||||||||
|
|
Amortized |
|
|
Gross |
|
|
Gross |
|
|
Forex |
|
|
Fair |
|
|||||
|
German Government bonds |
$ |
12,315 |
|
|
$ |
55 |
|
|
$ |
0 |
|
|
$ |
245 |
|
|
$ |
12,615 |
|
|
Total |
$ |
12,315 |
|
|
$ |
55 |
|
|
$ |
0 |
|
|
$ |
245 |
|
|
$ |
12,615 |
|
During the twelve months ended December 31, 2013, there were realized gains of approximately $0.4 million pertaining to €5.0 million of notional amount of German Government bonds acquired above par at 100.435 in June of 2012 for $6.3 million, with a maturity date of March 14, 2014, and sold before maturity at 100.09 on February 8, 2013 for approximately $6.8 million.
Unrealized gains on trading securities pertaining to the Company’s Deferred Compensation Plan included in earnings for the year ended December 31, 2014 and 2013 were less than $0.1 million in both periods.
Unrealized losses on trading securities pertaining to the Company’s Deferred Compensation Plan included in earnings for the year ended December 31, 2014 and 2013 were less than $0.1 million in both periods.
As of December 31, 2014 and 2013, the Company did not have any investments in available for sale marketable securities that were in an unrealized loss position for a period of 12 months or greater.
As of December 31, 2014 and 2013, restricted cash balance was approximately $0.4 million and $0.5 million, respectively, included in other assets.
|
5. |
Fair Value Measurements |
The Company applies fair value accounting for all financial assets and liabilities and non-financial assets and liabilities that are recognized or disclosed at fair value in the financial statements on a recurring basis. The Company defines fair value as the price that would be received from selling an asset or paid to transfer a liability in an orderly transaction between market participants at the measurement date. When determining the fair value measurements for assets and liabilities, which are required to be recorded at fair value, the Company considers the principal or most advantageous market in which the Company would transact and the market-based risk measurements or assumptions that market participants would use in pricing the asset or liability, such as risks inherent in valuation techniques, transfer restrictions and credit risk. Fair value is estimated by applying the following hierarchy, which prioritizes the inputs used to measure fair value into three levels and bases the categorization within the hierarchy upon the lowest level of input that is available and significant to the fair value measurement:
|
Level 1 |
|
— |
|
Observable inputs that reflect quoted prices (unadjusted) for identical assets or liabilities in active markets. |
|
Level 2 |
|
— |
|
Include other inputs that are directly or indirectly observable in the marketplace. |
|
Level 3 |
|
— |
|
Unobservable inputs that are supported by little or no market activities. |
The fair value hierarchy also requires an entity to maximize the use of observable inputs and minimize the use of unobservable inputs when measuring fair value.
The Company classifies its cash equivalents and securities within Level 1 or Level 2. This is because the Company values its cash equivalents, available for sale and trading securities using quoted market prices or alternative pricing sources and models utilizing market observable inputs.
F-15
FUEL SYSTEMS SOLUTIONS, INC.
Notes to Consolidated Financial Statements – (Continued)
|
|
|
|
|
Fair value measurement at |
|
||||||||||
|
|
As of December 31, 2014 |
|
|
Level 1 |
|
|
Level 2 |
|
|
Level 3 |
|
||||
|
Assets (in thousands): |
|
|
|
|
|
|
|
|
|
|
|
|
|
|
|
|
Cash equivalents: |
|
|
|
|
|
|
|
|
|
|
|
|
|
|
|
|
Money market funds |
$ |
29,142 |
|
|
$ |
29,142 |
|
|
$ |
0 |
|
|
$ |
0 |
|
|
Trading securities: |
|
|
|
|
|
|
|
|
|
|
|
|
|
|
|
|
Deferred Compensation Plan assets |
|
614 |
|
|
|
0 |
|
|
|
614 |
|
|
|
0 |
|
|
Other investments, held to maturity: |
|
|
|
|
|
|
|
|
|
|
|
|
|
|
|
|
Time deposits |
|
6,000 |
|
|
|
0 |
|
|
|
6,000 |
|
|
|
0 |
|
|
Total |
$ |
35,756 |
|
|
$ |
29,142 |
|
|
$ |
6,614 |
|
|
$ |
0 |
|
|
|
|
|
|
Fair value measurement at |
|
||||||||||
|
|
As of December 31, 2013 |
|
|
Level 1 |
|
|
Level 2 |
|
|
Level 3 |
|
||||
|
Assets (in thousands): |
|
|
|
|
|
|
|
|
|
|
|
|
|
|
|
|
Cash equivalents: |
|
|
|
|
|
|
|
|
|
|
|
|
|
|
|
|
Money market funds |
$ |
8,659 |
|
|
$ |
8,659 |
|
|
$ |
0 |
|
|
$ |
0 |
|
|
Available for sale securities: |
|
|
|
|
|
|
|
|
|
|
|
|
|
|
|
|
German Government bonds |
|
12,615 |
|
|
|
12,615 |
|
|
|
0 |
|
|
|
0 |
|
|
Trading securities: |
|
|
|
|
|
|
|
|
|
|
|
|
|
|
|
|
Deferred Compensation Plan assets |
|
675 |
|
|
|
0 |
|
|
|
675 |
|
|
|
0 |
|
|
Other investments, held to maturity: |
|
|
|
|
|
|
|
|
|
|
|
|
|
|
|
|
Time deposits |
|
2,000 |
|
|
|
0 |
|
|
|
2,000 |
|
|
|
0 |
|
|
Total |
$ |
23,949 |
|
|
$ |
21,274 |
|
|
$ |
2,675 |
|
|
$ |
0 |
|
|
6. |
Inventories |
Inventories are comprised of the following (in thousands):
|
|
As of December 31, |
|
|||||
|
|
2014 |
|
|
2013 |
|
||
|
Raw materials and parts |
$ |
48,221 |
|
|
$ |
56,790 |
|
|
Work-in-process |
|
2,214 |
|
|
|
1,503 |
|
|
Finished goods |
|
28,169 |
|
|
|
36,759 |
|
|
Inventory on consignment |
|
1,397 |
|
|
|
0 |
|
|
Total inventories |
$ |
80,001 |
|
|
$ |
95,052 |
|
|
7. |
Equipment and Leasehold Improvements, Net |
Equipment and leasehold improvements, net, consist of the following (in thousands):
|
|
As of December 31, |
|
|||||
|
|
2014 |
|
|
2013 |
|
||
|
Dies, molds, and patterns |
$ |
5,703 |
|
|
$ |
5,677 |
|
|
Machinery and equipment |
|
62,635 |
|
|
|
67,673 |
|
|
Office furnishings and equipment |
|
21,760 |
|
|
|
21,092 |
|
|
Automobiles and trucks |
|
4,915 |
|
|
|
4,548 |
|
|
Leasehold improvements |
|
19,925 |
|
|
|
25,259 |
|
|
Total equipment and leasehold improvements |
|
114,938 |
|
|
|
124,249 |
|
|
Less: accumulated depreciation |
|
(66,001 |
) |
|
|
(65,847 |
) |
|
Equipment and leasehold improvements, net of accumulated depreciation |
$ |
48,937 |
|
|
$ |
58,402 |
|
F-16
FUEL SYSTEMS SOLUTIONS, INC.
Notes to Consolidated Financial Statements – (Continued)
Depreciation expense related to equipment and leasehold improvements was $10.7 million, $10.9 million, and $10.4 million in 2014, 2013, and 2012, respectively.
Machinery and equipment includes property under capital leases less than $0.1 million and approximately $0.3 million at December 31, 2014 and 2013, respectively, with related accumulated depreciation of less than $0.1 million and $0.2 million at December 31, 2014 and 2013, respectively.
In the fourth quarter of 2014, as part of the ongoing efforts for rationalization of operations and costs, the Company decided to abandon a facility leased in Italy by its FSS Automotive operations, which resulted in write offs of leasehold improvements for approximately $2.0 million (see Note 18).
During 2014, as part of its long-lived assets impairment analysis the Company recorded approximately $2.7 million of impairment on equipment and leasehold improvements (see Note 15).
|
8. |
Goodwill and Intangibles |
The changes in the carrying amount of goodwill by business segment for the years ended December 31, 2014 and 2013 are as follows (in thousands):
|
|
FSS Automotive |
|
|
FSS Industrial |
|
|
Total |
|
|||
|
Net balance as of December 31, 2012 |
$ |
41,167 |
|
|
$ |
8,051 |
|
|
$ |
49,218 |
|
|
Currency translation |
|
(139 |
) |
|
|
(183 |
) |
|
|
(322 |
) |
|
Goodwill, gross |
$ |
50,071 |
|
|
$ |
15,651 |
|
|
$ |
65,722 |
|
|
Accumulated impairment losses |
|
(9,043 |
) |
|
|
(7,783 |
) |
|
|
(16,826 |
) |
|
Net balance as of December 31, 2013 |
$ |
41,028 |
|
|
$ |
7,868 |
|
|
$ |
48,896 |
|
|
Impairment loss (1) |
|
(35,780 |
) |
|
|
(4,158 |
) |
|
|
(39,938 |
) |
|
Currency translation |
|
(1,543 |
) |
|
|
(52) |
|
|
|
(1,595 |
) |
|
Goodwill, gross |
$ |
48,089 |
|
|
$ |
15,911 |
|
|
$ |
64,000 |
|
|
Accumulated impairment losses |
|
(44,384 |
) |
|
|
(12,253 |
) |
|
|
(56,637 |
) |
|
Net balance as of December 31, 2014 |
$ |
3,705 |
|
|
$ |
3,658 |
|
|
$ |
7,363 |
|
|
|
|
|
|
|
|
|
|
|
|
|
|
Note (1): see Note 15.
At December 31, 2014 and 2013, intangible assets consisted of the following (in thousands):
|
|
WT. Average |
|
|
As of December 31, 2014 |
|
|
As of December 31, 2013 |
|
|||||||||||||||||||
|
|
Gross |
|
|
Accumulated |
|
|
Net |
|
|
Gross |
|
|
Accumulated |
|
|
Net |
|
||||||||||
|
Existing technology |
|
4.8 |
|
|
$ |
25,534 |
|
|
$ |
(21,836 |
) |
|
$ |
3,698 |
|
|
$ |
27,774 |
|
|
$ |
(21,150 |
) |
|
$ |
6,624 |
|
|
Customer relationships |
|
10.9 |
|
|
|
19,385 |
|
|
|
(17,330 |
) |
|
|
2,055 |
|
|
|
21,013 |
|
|
|
(17,909 |
) |
|
|
3,104 |
|
|
Trade name |
|
4.3 |
|
|
|
4,432 |
|
|
|
(3,221 |
) |
|
|
1,211 |
|
|
|
5,005 |
|
|
|
(2,944 |
) |
|
|
2,061 |
|
|
Non-compete agreements |
|
0.0 |
|
|
|
0 |
|
|
|
0 |
|
|
|
0 |
|
|
|
158 |
|
|
|
(157 |
) |
|
|
1 |
|
|
Total |
|
|
|
|
$ |
49,351 |
|
|
$ |
(42,387 |
) |
|
$ |
6,964 |
|
|
$ |
53,950 |
|
|
$ |
(42,160 |
) |
|
$ |
11,790 |
|
Amortization expense related to existing technology and customer relationships of approximately $1.8 million, $2.3 million, and $5.1 million for the years ended December 31, 2014, 2013, and 2012, respectively, is reported as a component of cost of revenue. Amortization expense related to trade name and non-compete agreements for the years ended December 31, 2014, 2013, and 2012 was approximately $0.5 million, $0.7 million, and $0.7 million, respectively, and is reported as a component of operating expense.
During 2014, as part of its long-lived assets impairment analysis the Company recorded approximately $1.7 million of impairment on intangible assets (see Note 15).
F-17
FUEL SYSTEMS SOLUTIONS, INC.
Notes to Consolidated Financial Statements – (Continued)
Amortization expense as of December 31, 2014 for the remaining lives of the intangible assets is estimated to be as follows (in thousands):
|
|
Amortization |
|
|
|
2015 |
$ |
1,869 |
|
|
2016 |
|
1,505 |
|
|
2017 |
|
1,074 |
|
|
2018 |
|
902 |
|
|
2019 |
|
605 |
|
|
Thereafter |
|
1,009 |
|
|
|
$ |
6,964 |
|
|
9. |
Accrued Expenses |
The following table details the components of accrued expenses as of December 31, 2014 and 2013 (in thousands):
|
|
As of December 31, |
|
|||||
|
|
2014 |
|
|
2013 |
|
||
|
Accrued warranty |
$ |
6,424 |
|
|
$ |
8,695 |
|
|
Accrued payroll obligations |
|
10,620 |
|
|
|
14,307 |
|
|
Unearned revenue |
|
11,729 |
|
|
|
10,956 |
|
|
Accrued other |
|
8,244 |
|
|
|
8,136 |
|
|
|
$ |
37,017 |
|
|
$ |
42,094 |
|
Changes in the Company’s product warranty liability during the years ended December 31, 2014, 2013, and 2012 are as follows (in thousands):
|
|
|
Years Ended December 31, |
|
|||||||||
|
Warranty reserve for the period ended: |
|
2014 |
|
|
2013 |
|
|
2012 |
|
|||
|
Balance at beginning of period |
|
$ |
8,695 |
|
|
$ |
11,639 |
|
|
$ |
10,425 |
|
|
Additions from acquisitions |
|
|
0 |
|
|
|
0 |
|
|
|
275 |
|
|
Provisions charged to costs and expenses |
|
|
4,763 |
|
|
|
3,517 |
|
|
|
4,640 |
|
|
Settlements |
|
|
(5,288 |
) |
|
|
(4,779) |
|
|
|
(2,503) |
|
|
Adjustments to pre-existing warranties |
|
|
(1,118 |
) |
|
|
(1,520) |
|
|
|
(1,251) |
|
|
Effect of foreign currency translation |
|
|
(628) |
|
|
|
(162) |
|
|
|
53 |
|
|
Balance at end of period |
|
$ |
6,424 |
|
|
$ |
8,695 |
|
|
$ |
11,639 |
|
Unearned revenue as of December 31, 2014 and 2013 relates to amount of approximately $6.8 million and $5.5 million, respectively, deferred under a contract to develop the basic and detailed engineering and outfit the facility for the installation of an integrated production plant for natural gas vehicles for PDVSA in Venezuela (see Note 17). The Company accounts for this project under the completed contract method. The remainder of unearned revenue as of December 31, 2014 and 2013 relates primarily to advance payments by customers, amounting to $2.6 million and $3.6 million, respectively, and to purchased extended warranties by customers, amounting to $2.2 million and $1.8 million, respectively.
|
10. |
Income Taxes |
F-18
FUEL SYSTEMS SOLUTIONS, INC.
Notes to Consolidated Financial Statements – (Continued)
Income (loss) before income taxes, equity share in income of unconsolidated affiliates, and non-controlling interests for U.S. and foreign-based operations is shown below (in thousands):
|
|
Years Ended December 31, |
|
|||||||||
|
|
2014 |
|
|
2013 |
|
|
2012 |
|
|||
|
U.S. |
$ |
(9,888) |
|
|
$ |
(4,037 |
) |
|
$ |
(29,349 |
) |
|
Foreign |
|
(42,914) |
|
|
|
7,125 |
|
|
|
15,900 |
|
|
Income from operations before income taxes and non-controlling interests |
$ |
(52,802) |
|
|
$ |
3,088 |
|
|
$ |
(13,449 |
) |
The provision (benefit) for income taxes consists of the following (in thousands):
|
|
Years Ended December 31, |
|
|||||||||
|
|
2014 |
|
|
2013 |
|
|
2012 |
|
|||
|
Current: |
|
|
|
|
|
|
|
|
|
|
|
|
Federal |
$ |
0 |
|
|
$ |
(138 |
) |
|
$ |
(94 |
) |
|
State |
|
11 |
|
|
|
5 |
|
|
|
84 |
|
|
Foreign |
|
3,387 |
|
|
|
5,638 |
|
|
|
10,308 |
|
|
|
|
3,398 |
|
|
|
5,505 |
|
|
|
10,298 |
|
|
Deferred: |
|
|
|
|
|
|
|
|
|
|
|
|
Federal and state |
|
(2,169) |
|
|
|
2,565 |
|
|
|
(9,302 |
) |
|
Foreign |
|
(2,842) |
|
|
|
(2,945 |
) |
|
|
(4,670 |
) |
|
Change in valuation allowance |
|
2,223 |
|
|
|
(1,559 |
) |
|
|
5,857 |
|
|
|
|
(2,788) |
|
|
|
(1,939 |
) |
|
|
(8,115 |
) |
|
Total provision for income taxes |
$ |
610 |
|
|
$ |
3,566 |
|
|
$ |
2,183 |
|
The components of the Company’s deferred tax assets and liabilities are as follows (in thousands):
|
|
At December 31, |
|
|||||
|
|
2014 |
|
|
2013 |
|
||
|
Deferred Tax Assets: |
|
|
|
|
|
|
|
|
Federal and State NOL Carryovers |
$ |
29,705 |
|
|
$ |
26,049 |
|
|
Federal Tax Credit Carryover |
|
1,665 |
|
|
|
1,718 |
|
|
Foreign NOL and credit Carryovers |
|
9,804 |
|
|
|
8,197 |
|
|
Inventory reserves |
|
5,273 |
|
|
|
2,723 |
|
|
Accrued Expenses |
|
3,269 |
|
|
|
10,511 |
|
|
Intangible Assets |
|
6,355 |
|
|
|
5,530 |
|
|
Other, net |
|
4,449 |
|
|
|
4,086 |
|
|
Valuation allowance |
|
(47,317) |
|
|
|
(44,508 |
) |
|
Total Deferred Tax Asset |
|
13,203 |
|
|
|
14,306 |
|
|
Fixed assets and intangibles |
|
596 |
|
|
|
(1,526 |
) |
|
Net deferred Tax Asset (Liability) |
$ |
13,799 |
|
|
$ |
12,780 |
|
|
Total Deferred assets |
$ |
14,800 |
|
|
$ |
14,363 |
|
|
Less: Deferred tax assets, current |
|
9,547 |
|
|
|
10,234 |
|
|
Net Deferred assets—noncurrent |
$ |
5,253 |
|
|
$ |
4,129 |
|
|
Deferred tax liabilities |
$ |
(1,001) |
|
|
$ |
(1,583 |
) |
|
Less: deferred tax liabilities, current |
|
0 |
|
|
|
0 |
|
|
Net deferred tax liabilities—noncurrent |
$ |
(1,001) |
|
|
$ |
(1,583 |
) |
Based upon the substantial net operating loss carryovers and a recent history of losses incurred in certain jurisdictions, management cannot conclude that it is more likely than not that the deferred tax assets in the U.S. and certain foreign jurisdictions will be realized. Accordingly, a valuation allowance has been recorded to offset these amounts. The balance of the total valuation allowance was $47.3 million and $44.5 million as of December 31, 2014 and 2013, respectively. In addition, the Company expects to provide a full valuation allowance on substantially all of its net deferred tax assets in the U.S. and certain foreign jurisdictions until it can sustain a level of profitability that demonstrates its ability to utilize the assets. During the year ended December 31, 2012, the Company determined that the recoverability of the net deferred tax assets of its Canadian entities was more likely than not. As a result,
F-19
FUEL SYSTEMS SOLUTIONS, INC.
Notes to Consolidated Financial Statements – (Continued)
the Company released the related valuation allowance and recognized a tax benefit of approximately $5.0 million. The release of the valuation allowance was based upon the recent history of earnings of the Canadian entities, forecasted future earnings of the group, and the merger of the Canadian operations into a single legal entity that was completed on January 1, 2013, and which allows the netting, for income tax reporting purposes, of income with losses incurred within this group.
The Company has federal net operating loss carryforwards of approximately $87.7 million that expire between 2020 and 2034. The Company also has state net operating loss carryforwards of approximately $36.6 million that expire between 2015 and 2034. The Company has net operating loss carryforwards in foreign jurisdictions of approximately $23.4 million that begin to expire in 2015. The Company has research tax credit carryforwards for Federal Income Tax purposes of approximately $2.0 million that expire between 2028 and 2034. The Company also has research and development credit carryforwards for state income tax purposes of approximately $2.9 million, which do not expire for tax reporting purposes. The Company also has $1.5 million of U.S. foreign tax credits that begin to expire in 2017. The Company has tax credits in foreign jurisdictions of $2.6 million that begin to expire in 2021.
Not included in the deferred tax assets as of December 31, 2014 is approximately $1.9 million of excess tax benefits related to employee stock compensation. If and when realized, the tax benefit of these assets will be accounted for as a credit to additional paid-in capital, rather than a reduction of the income tax provision.
Utilization of the NOL and R&D credit carryforwards may be subject to a substantial annual limitation due to ownership change limitations that may occur in the future, as required by Section 382 of the Internal Revenue Code of 1986, as amended (the “Code”), as well as similar state and foreign provisions. These ownership changes may limit the amount of NOL and tax credit carryforwards that can be utilized annually to offset future taxable income and tax, respectively. In general, an “ownership change” as defined by Section 382 of the Code results from a transaction or series of transactions over a three-year period resulting in an ownership change of more than 50 percentage points of the outstanding stock of a company by certain stockholders or public groups.
During the year ended December 31, 2014, the Company recognized a tax benefit of approximately $1.1 million in connection with impairment charges on its long-lived assets (see Note 15).
A reconciliation of income taxes computed at the federal statutory income tax rate to income taxes reported in the consolidated statements of operations is based on the consolidated income from operations before income taxes, equity share in income of unconsolidated affiliates, non-controlling interests and extraordinary gain as follows:
|
|
Years Ended December 31, |
|
|||||||||
|
|
2014 |
|
|
2013 |
|
|
2012 |
|
|||
|
Federal statutory income tax rate |
|
(34.0) |
% |
|
|
34.0 |
% |
|
|
(34.0 |
)% |
|
Permanent differences |
|
0.3 |
|
|
|
(0.8 |
) |
|
|
2.8 |
|
|
Valuation Allowance |
|
4.2 |
|
|
|
(50.5 |
) |
|
|
43.5 |
|
|
Goodwill impairment |
|
20.4 |
|
|
|
0.0 |
|
|
|
11.7 |
|
|
Foreign tax rate differential |
|
6.0 |
|
|
|
17.7 |
|
|
|
(7.5 |
) |
|
Expiration of NOL’s |
|
1.6 |
|
|
|
6.8 |
|
|
|
10.4 |
|
|
State tax, net of federal benefit |
|
(0.8) |
|
|
|
(3.1 |
) |
|
|
(7.4 |
) |
|
Tax credits |
|
(1.0) |
|
|
|
(30.9 |
) |
|
|
(1.2 |
) |
|
Uncertain Tax Positions |
|
1.9 |
|
|
|
151.3 |
|
|
|
(0.7 |
) |
|
Return to Accrual Adjustments |
|
2.6 |
|
|
|
(8.7 |
) |
|
|
2.3 |
|
|
Other |
|
0.0 |
|
|
|
(0.2 |
) |
|
|
(3.7 |
) |
|
Effective tax rate |
|
1.2 |
% |
|
|
115.6 |
% |
|
|
16.2 |
% |
As of December 31, 2014, undistributed earnings, except with respect to a portion of undistributed earnings from MTM, are considered to be indefinitely reinvested and, accordingly, no provision for United States federal and state income taxes is provided thereon. Upon distributions of earnings in the form of dividends or otherwise, the Company would be subject to both U.S. income taxes (subject to an adjustment for foreign tax credits) and withholding taxes payable to various foreign countries. The Company has accrued such residual income taxes for all undistributed foreign earnings not considered indefinitely reinvested. It is not practical to calculate the deferred taxes associated with these earnings because of the variability of multiple factors that would need to be assessed at the time of any assumed repatriation; however, foreign tax credits may be available to reduce federal income taxes in the event of distribution.
As of December 31, 2014, approximately $1.3 million in foreign withholding taxes was accrued related to undistributed earnings not considered reinvested, as well as to $26.3 million of funds repatriated in 2014. Residual U.S. taxes have been accrued
F-20
FUEL SYSTEMS SOLUTIONS, INC.
Notes to Consolidated Financial Statements – (Continued)
(applied as a reduction to net operating loss carry-forwards) on approximately $0.3 million of earnings of MTM. This amount was deemed to be a constructive dividend creating taxable income for U.S. income tax purposes; upon distribution of earnings in the form of dividend, or otherwise, in excess of these amounts, the Company may be subject to United States income taxes. In addition, the Company would be subject to withholding taxes payable to various foreign countries.
As of December 31, 2014 and 2013, the Company had approximately $13.8 million and $12.9 million, respectively, of unrecognized tax benefits.
The following table summarizes the activities related to the unrecognized tax benefits:
|
|
At December 31, |
|
|||||||||
|
|
2014 |
|
|
2013 |
|
|
2012 |
|
|||
|
Beginning Balance |
$ |
12,920 |
|
|
$ |
8,061 |
|
|
$ |
7,313 |
|
|
Increases related to current year tax positions |
|
893 |
|
|
|
1,311 |
|
|
|
0 |
|
|
Increases related to prior year tax positions |
|
34 |
|
|
|
3,735 |
|
|
|
828 |
|
|
Expiration of the statute of limitations for the assessment of taxes |
|
0 |
|
|
|
(187 |
) |
|
|
(80 |
) |
|
Ending Balance |
$ |
13,847 |
|
|
$ |
12,920 |
|
|
$ |
8,061 |
|
The Company’s annual effective tax rate will be reduced if $0.8 million of the Company’s unrecognized tax benefits at December 31, 2014 are recognized. To the extent unrecognized tax benefits are recognized at a time such valuation allowance no longer exists, the additional amount that would affect the effective tax rate is approximately $13.0 million. The Company does not expect the unrecognized tax benefits to change significantly over the next 12 months.
The Company files income tax returns in the U.S. federal jurisdiction and in various foreign and state jurisdictions with varying statutes of limitations. The Company is no longer subject to U.S. federal and state income tax examinations for years prior to 2009 and is no longer subject to tax examinations for significant foreign jurisdictions for years prior to 2007. The Company’s policy is to recognize interest expense and penalties related to income tax matters as a component of income tax expenses. During 2014, there were approximately $0.1 million of interest expense and penalties recorded in income tax expense, and at December 31, 2014, there was less than $0.2 million of accrued interest and penalties associated with uncertain tax positions.
The American Taxpayer Relief Act of 2012 (“the Act”) was enacted on January 2, 2013. The Act retroactively restored several expired business tax provisions, including the research and development credit which had previously expired on December 31, 2011. As the legislation was not enacted until after the close of the year ended December 31, 2012, the income tax impact of the retroactive reinstatement and extension was recognized in 2013. The Company does not anticipate any federal income tax benefit due to the existence of deferred tax assets offset by a valuation allowance.
|
11. |
Debt |
The Company’s outstanding debt is summarized as follows (in thousands):
|
|
Available as of |
|
|
December 31, |
|
|
December 31, |
|
|||
|
(a) Revolving lines of credit—Italy and Argentina |
$ |
13,666 |
|
|
$ |
0 |
|
|
$ |
0 |
|
|
(b) Revolving line of credit—USA. |
|
20,000 |
|
|
|
0 |
|
|
|
0 |
|
|
(e) Other indebtedness |
|
0 |
|
|
|
207 |
|
|
|
428 |
|
|
|
$ |
33,666 |
|
|
|
207 |
|
|
|
428 |
|
|
Less: current portion |
|
|
|
|
|
207 |
|
|
|
213 |
|
|
Non-current portion |
|
|
|
|
$ |
0 |
|
|
$ |
215 |
|
F-21
FUEL SYSTEMS SOLUTIONS, INC.
Notes to Consolidated Financial Statements – (Continued)
The debt is scheduled to be repaid as follows (in thousands):
|
5 year debt payout: |
|
|
|
|
2015 |
$ |
207 |
|
|
2016 |
|
0 |
|
|
2017 |
|
0 |
|
|
2018 |
|
0 |
|
|
2019 |
|
0 |
|
|
Thereafter |
|
0 |
|
|
Total |
$ |
207 |
|
At December 31, 2014, the Company’s weighted average interest rate on outstanding debt was 1.0%. The Company is party to numerous significant credit agreements and other borrowings. All foreign denominated revolving lines of credit have been converted using the average interbank currency rate at December 31, 2014.
(a) Revolving Lines of Credit—Italy and Argentina
The Company maintains various revolving lines of credit in Italy and Argentina. The revolving lines of credit in Italy include $6.1 million, which is unsecured, and $4.8 million that is collateralized by accounts receivable. The interest rates on these revolving lines of credit are fixed and variable and range from 1.1% to 4.1% as of December 31, 2014. At December 31, 2014 and 2013 there were no balances outstanding.
The revolving lines of credit in Argentina consist of two lines for a total amount of availability of approximately $2.7 million. These lines are unsecured with no balance outstanding at December 31, 2014 and December 31, 2013. At December 31, 2014, the interest rates for the lines of credit in Argentina ranged from 4.5% to 30.0%.
All lines are callable on demand.
(b) Revolving Line of Credit—USA
As of December 31, 2014, the Company and IMPCO Technologies, Inc. (“IMPCO”) maintain an unsecured, revolving short term credit facility with Intesa SanPaolo S.p.A. (“Intesa”) amounting to $20.0 million. IMPCO intends to use the borrowings for its general corporate purposes and Fuel Systems guarantees IMPCO’s payments. At December 31, 2014 and December 31, 2013, there were no balances outstanding. The maximum aggregate principal amount of loans available at any time was originally $13.0 million with an expiration date of April 30, 2014, which was subsequently extended to April 30, 2015 with a new aggregate principal amount of loans available at any time increased to $20.0 million. At the Company’s option, the loans will bear interest on either the applicable LIBOR rate plus 2.0%, the bank’s prime rate plus 1.0% or the bank’s cost of funds rate plus 2.0%. The bank’s prime rate is a floating interest rate that may change as often as once a day. If any amounts under a loan remain outstanding after the loan’s maturity date, such amounts will bear interest at the bank’s prime rate plus 2.0%. In addition, this revolving credit facility carries a commitment fee of 0.5% of the average daily unused amount. The line of credit contains quarterly covenants which require the Company to maintain (1) a ratio of Net Debt/EBITDA for the then most recently concluded period of four consecutive fiscal quarters of the Company to be less than 2, (2) a consolidated net worth of at least $135.0 million, and (3) the Company shall not, and shall not permit any of its subsidiaries to create, incur, assume or permit to exist any Debt other than (i) debt of any such subsidiary owing to any other subsidiary or to the Company or (ii) debt for borrowed money in a total aggregate principal amount, the U.S. Dollar equivalent of which does not exceed $75.0 million. At December 31, 2014, the Company was in compliance with these covenants.
(c) Other indebtedness
Other indebtedness includes capital leases and various term loans and lines of credits at our foreign subsidiaries. These term loans and lines of credit are used primarily to fund the operations of these subsidiaries and bear interest ranging from 0.5% to 6.95%.
F-22
FUEL SYSTEMS SOLUTIONS, INC.
Notes to Consolidated Financial Statements – (Continued)
|
12. |
Equity |
(a) Shares Held in Treasury
The Company matched employee contributions to its non-qualified deferred compensation plan up to an annual maximum of $12,500 per employee by purchasing shares of the Company’s common stock in the open market, with such match discontinued in 2009 (see Note 18). These shares are carried at cost and classified as a deduction of equity. At December 31, 2014 and 2013, the Company had recorded approximately $0.1 million for the deferred compensation plan. The Deferred Compensation Plan was terminated during the second quarter of 2014 and the funds will be distributed within one year.
As of December 31, 2014 and 2013, the Company also had 344,810 shares and 7,999 shares, respectively, held in treasury with a value of approximately $3.6 million, and $0.2 million, respectively. On November 3, 2014, our Board of Directors approved a share repurchase program for up to $25.0 million of our common stock. As of December 31, 2014, 336,811 shares were repurchased under this program in the open market. The remainder of the treasury shares held by the Company at December 31, 2014 is equal to 7,999 shares, as in the prior year, and it refers to 1,419 shares that came from the surrender of shares tendered for the exercise price in lieu of cash for the exercise of warrants, and 6,580 shares that came from the surrender of shares for U.S. payroll tax withholding obligations associated with vesting of restricted stock.
|
13. |
Stock-Based Compensation |
The Company has two stock option plans that provide for the issuance of options to key employees and directors of the Company at the fair market value at the time of grant. Options previously granted under these plans generally vest in four or five years and are generally exercisable while the individual is an employee or a non-employee director, or ordinarily within one month following termination of employment. In no event may options be exercised more than ten years after date of grant. Under the Company’s 2009 Restricted Stock Bonus Plan, the Company’s Board of Directors may grant restricted stock to officers, employees and non-employee directors. Currently restricted stock are awarded to non-employee directors and normally vest in one year.
In estimating the fair value of stock-based compensation, the Company uses the historical volatility of its shares based on seven year averages.
Stock-based compensation expense for the years ended December 31, 2014, 2013, and 2012 was allocated as follows (in thousands):
|
|
Year Ended December 31, |
|
|||||||||
|
|
2014 |
|
|
2013 |
|
|
2012 |
|
|||
|
Cost of revenue |
$ |
44 |
|
|
$ |
36 |
|
|
$ |
22 |
|
|
Research and development expense |
|
34 |
|
|
|
25 |
|
|
|
762 |
|
|
Selling, general and administrative expense |
|
397 |
|
|
|
301 |
|
|
|
231 |
|
|
|
$ |
475 |
|
|
$ |
362 |
|
|
$ |
1,015 |
|
Excess tax benefits from tax deductions for exercised options in excess of the deferred tax asset attributable to stock compensation costs for such options are recorded as an increase to additional paid-in capital if and when realized. The Company did not record any excess tax benefits in the years ended December 31, 2014, 2013, and 2012 because, due to the net operating loss carry forward position for United States income tax purposes, the Company has not realized excess tax benefits.
F-23
FUEL SYSTEMS SOLUTIONS, INC.
Notes to Consolidated Financial Statements – (Continued)
Stock-Based Compensation Activity—Stock Options
Shares of common stock issued upon exercise of stock options are from previously unissued shares.
The following table displays stock option activity including the weighted average stock option prices for 2014 (in thousands, except share and per share amounts):
|
|
Number of |
|
|
Weighted Average |
|
|
Weighted Average |
|
|
Aggregate |
|
||||
|
Outstanding at December 31, 2013 |
|
113,940 |
|
|
$ |
14.95 |
|
|
|
7.5 yrs |
|
|
$ |
39 |
|
|
Vested and exercisable at December 31, 2013 |
|
35,550 |
|
|
$ |
13.91 |
|
|
|
4.5 yrs |
|
|
$ |
39 |
|
|
Granted |
|
41,450 |
|
|
|
10.37 |
|
|
|
|
|
|
|
|
|
|
Exercised |
|
0 |
|
|
|
0.00 |
|
|
|
|
|
|
|
|
|
|
Forfeited |
|
(27,490 |
) |
|
|
13.13 |
|
|
|
|
|
|
|
|
|
|
Outstanding at December 31, 2014 |
|
127,900 |
|
|
$ |
13.86 |
|
|
|
8.2 yrs |
|
|
$ |
23,627 |
|
|
Vested and exercisable at December 31, 2014 |
|
35,290 |
|
|
$ |
15.76 |
|
|
|
7.3 yrs |
|
|
$ |
0 |
|
The aggregate intrinsic value is calculated as the difference between the exercise price of the underlying awards and the quoted price of the Company’s common stock for the options that were in-the-money at each respective period. During the years ended December 31, 2014, 2013, and 2012, the aggregate intrinsic value of options exercised under the Company’s stock option plans was zero, $0.2 million, and $22 thousand, respectively, determined as of the date of option exercise.
As of December 31, 2014, total unrecognized stock-based compensation cost related to unvested stock options was $0.7 million, expected to be recognized over a weighted-average period of 3.5 years. As of December 31, 2013, total unrecognized stock-based compensation cost related to unvested stock options was $0.8 million, expected to be recognized over a weighted-average period of 3.8 years.
The following table sets forth summarized information with respect to stock options outstanding, vested and exercisable at December 31, 2014:
|
Exercise Price Range: |
|
Outstanding at December 31, 2014 |
|
|
Vested and Exercisable at December 31, 2014 |
|
||||||||||||||
|
|
Number of |
|
|
Average Life |
|
|
Average |
|
|
Number of |
|
|
Average |
|
||||||
|
$10.01 to $15.00 |
|
|
41,450 |
|
|
|
7.7 |
|
|
|
10.37 |
|
|
|
0 |
|
|
|
0.00 |
|
|
$15.01 to $20.00 |
|
|
86,450 |
|
|
|
9.3 |
|
|
|
15.53 |
|
|
|
35,290 |
|
|
|
15.76 |
|
|
|
|
|
127,900 |
|
|
|
8.2 |
|
|
$ |
13.86 |
|
|
|
35,290 |
|
|
$ |
15.76 |
|
Stock-Based Compensation Activity—Restricted Stock
A summary of the unvested restricted stock awards as of December 31, 2014 and the changes during the year then ended are presented below:
|
|
Shares |
|
|
Weighted |
|
||
|
Nonvested at December 31, 2013 |
|
11,380 |
|
|
$ |
15.53 |
|
|
Granted to continuing non-employee directors |
|
28,200 |
|
|
|
10.64 |
|
|
Vested |
|
(10,418 |
) |
|
|
15.69 |
|
|
Forfeited |
|
0 |
|
|
|
0.00 |
|
|
Nonvested at December 31, 2014 |
|
29,162 |
|
|
$ |
10.75 |
|
As of December 31, 2014, total unrecognized share-based compensation cost related to unvested restricted stock was $0.1 million, which is expected to be recognized over a weighted-average period of 0.6 year.
F-24
FUEL SYSTEMS SOLUTIONS, INC.
Notes to Consolidated Financial Statements – (Continued)
|
14. |
Changes and reclassifications in Accumulated Other Comprehensive Income (Loss) by Component |
(a) Changes in Accumulated Other Comprehensive Income (Loss) by Component (all amounts are net of tax, except foreign currency items)
|
|
Year Ended December 31, 2014 |
|
|||||||||||
|
|
Unrealized Gains and |
|
|
Foreign |
|
|
Total |
|
|||||
|
Beginning balance, December 31, 2013 |
|
$ 55 |
|
|
|
$ (494) |
|
|
|
$ (439) |
|
||
|
Current period Other Comprehensive Income activity before reclassifications |
|
(55) |
|
|
|
(26,619) |
|
|
|
(26,674) |
|
||
|
Amounts reclassified from Accumulated Other Comprehensive Loss |
|
0 |
|
|
|
691 |
|
|
|
691 |
|
||
|
Net current-period Other Comprehensive Income |
|
(55) |
|
|
|
(25,928) |
|
|
|
(25,983) |
|
||
|
Net current-period Other Comprehensive Income attributable to non-controlling interest |
|
|
|
|
|
19 |
|
|
|
19 |
|
||
|
Ending balance, December 31, 2014 |
|
$ 0 |
|
|
|
$ (26,403) |
|
|
|
$ (26,403) |
|
||
|
|
Year Ended December 31, 2013 |
|
|||||||||
|
|
Unrealized Gains and |
|
|
Foreign |
|
|
Total |
|
|||
|
Beginning balance, December 31, 2012 |
|
$ (9) |
|
|
|
$ (2,051) |
|
|
|
$ (2,060) |
|
|
Current period Other Comprehensive Income (Loss) activity before reclassifications |
|
55 |
|
|
|
2,252 |
|
|
|
2,307 |
|
|
Amounts reclassified from Accumulated Other Comprehensive Loss |
|
9 |
|
|
|
(695) |
|
|
|
(686) |
|
|
Net current-period Other Comprehensive Income |
|
64 |
|
|
|
1,557 |
|
|
|
1,621 |
|
|
Ending balance, December 31, 2013 |
|
$ 55 |
|
|
|
$ (494) |
|
|
|
$ (439) |
|
|
|
|
Year Ended December 31, 2012 |
|
|||||||||||||||
|
|
Unrealized Gains and |
|
|
Foreign |
|
|
|
Total |
|
|||||||||
|
Beginning balance, December 31, 2011 |
|
$ 0 |
|
|
|
$ (3,664) |
|
|
|
|
$ (3,664) |
|
||||||
|
Current period Other Comprehensive Income (Loss) activity before reclassifications |
|
(9) |
|
|
|
1,613 |
|
|
|
|
1,604 |
|
||||||
|
Amounts reclassified from Accumulated Other Comprehensive Income (Loss) |
|
0 |
|
|
|
0 |
|
|
|
|
0 |
|
||||||
|
Net current-period Other Comprehensive Income |
|
(9) |
|
|
|
1,613 |
|
|
|
|
1,604 |
|
||||||
|
Ending balance, December 31, 2012 |
|
$ (9) |
|
|
|
$ (2,051) |
|
|
|
|
$ (2,060) |
|
||||||
F-25
FUEL SYSTEMS SOLUTIONS, INC.
Notes to Consolidated Financial Statements – (Continued)
(b) Reclassifications out of Accumulated Other Comprehensive Loss
|
|
Amount Reclassified from Accumulated Other |
|||||||||
|
Details about Accumulated Other Comprehensive Income (Loss) Components |
Year Ended |
|
|
Year Ended |
|
|
Year Ended |
Affected Line Item in the |
||
|
Unrealized losses on available-for-sale securities |
|
$ 0 |
|
|
|
$ 9 |
|
|
$ 0 |
Other Expense |
|
Foreign Currency Items: |
|
|
|
|
|
|
|
|
|
|
|
—Foreign currency loss (gain) on available for sale securities |
|
691 |
|
|
|
(429) |
|
|
0 |
Other Expense |
|
—Foreign currency gain on sales of BRC Pakistan |
|
0 |
|
|
|
(266) |
|
|
0 |
Other Expense |
|
Total reclassifications for the period |
|
$ 691 |
|
|
|
$ (686) |
|
|
$ 0 |
|
15.Impairments
During the second quarter of 2014, the Company determined that sufficient indicators of potential impairment existed to require an interim goodwill impairment analysis. These indicators included the recent trading values of the Company’s stock, and corresponding decline in the Company’s market capitalization, coupled with market conditions and business trends within the Company’s various reporting units. As a result, the Company examined the Italian reporting units of its FSS Automotive segment, as well as the Canadian and Netherlands reporting units of its FSS Industrial segment. Due to the complexity and the effort required to estimate the fair value of the reporting units in the step one of the impairment test and to estimate the fair values of all assets and liabilities of the reporting units in the second step of the test, the fair value estimates were derived based on preliminary assumptions and analyses that are subject to change. Based on the Company’s preliminary analyses, the implied fair value of goodwill was substantially lower than the carrying value of goodwill for the two reporting units within the FSS Automotive segment, as well as for the two reporting units within the FSS Industrial segment. As a result, during the second quarter of 2014, the Company recognized, based on its best estimate, impairment charges of $33.1 million and $2.6 million, respectively, in relation with its two reporting units located in Italy within its FSS Automotive segment, and impairment charges of $3.1 million and $1.1 million, respectively, in relation with its two reporting units located in Canada and in the Netherlands within its FSS Industrial segment.
In addition, at the same time and as a result of the interim goodwill impairment analysis performed during the second quarter of 2014, in accordance with ASC Topic 360, “Impairment and Disposal of Long-Lived Asset”, the Company concluded a triggering event occurred, requiring the assessment of impairment for certain of its long-lived assets. Upon completion of the assessment, the Company concluded that long-lived assets were impaired and recorded a $4.4 million impairment charge associated with intangible assets and equipment and leasehold improvements within its FSS Automotive segment. These impairments were measured, depending on the asset, either under an income approach utilizing forecasted discounted cash flows or a market approach utilizing an appraisal to determine fair values of the impairment assets. The inputs and assumptions utilized in the analyses are classified as Level 3 inputs within the fair value hierarchy as defined by ASC 820.
The following table summarizes the impairment charges for each reporting unit by asset category (in thousand):
|
|
Year ended December 31, 2014 |
|
|||||||||||||||||
|
|
Italy |
|
|
US |
|
|
Netherlands |
|
|
Canada |
|
|
Total |
|
|||||
|
Equipment and leasehold improvements |
$ |
2,239 |
|
|
$ |
439 |
|
|
$ |
0 |
|
|
$ |
0 |
|
|
$ |
2,678 |
|
|
Goodwill |
|
35,780 |
|
|
|
0 |
|
|
|
1,094 |
|
|
|
3,064 |
|
|
|
39,938 |
|
|
Intangible assets |
|
1,017 |
|
|
|
708 |
|
|
|
0 |
|
|
|
0 |
|
|
|
1,725 |
|
|
Total Impairments |
$ |
39,036 |
|
|
|
1,147 |
|
|
|
1,094 |
|
|
|
3,064 |
|
|
$ |
44,341 |
|
F-26
FUEL SYSTEMS SOLUTIONS, INC.
Notes to Consolidated Financial Statements – (Continued)
During the three months ended September 30, 2014, the impairment analyses for goodwill and intangible assets were finalized and no changes were identified.
During the fourth quarter of 2014, the Company tested the remaining goodwill balance. The fair values of the Company’s reporting units exceeded the respective carrying values and, consequently, no further impairments were identified during the fourth quarter of 2014.
The 2014 impairment charges are included as a separate component of operating income on the consolidated statement of operations for the year ended December 31, 2014.
For the year ended December 31, 2013, the Company recorded no impairments.
During the fourth quarter of 2012, in connection with the Company’s annual goodwill impairment, management determined two of its reporting units, the US reporting unit included in the FSS Automotive segment and the Canadian reporting unit included in the FSS Industrial segment, did not pass the step 1 test, due to lower than expected demand, which negatively impacted the respective reporting units’ forecasts of earnings and cash flows. As a result, the Company concluded it had a triggering event, requiring the assessment of impairment for certain of its long-lived assets. Upon completion of the assessment, the Company concluded the long-lived assets were impaired and recorded a $12.1 million impairment charge associated with intangible assets and equipment. As a result of the US and Canadian reporting units failing step 1 of the goodwill impairment test, the Company completed the step 2 analysis for both units. Upon completion of the step 2 analysis, the Company determined the goodwill associated with each reporting unit was impaired. As a result, the Company recorded a $9.9 million impairment charge in 2012.
These impairments were measured, depending on the asset, either under an income approach utilizing forecasted discounted cash flows or a market approach utilizing an appraisal to determine fair values of the impairment assets. The inputs and assumptions utilized in the analyses are classified as Level 3 inputs within the fair value hierarchy as defined by ASC 820.
The following table summarizes the impairment charges in 2012 for each reporting unit by asset category (in thousand):
|
|
Year Ended December 31, 2012 |
|
|||||||||
|
|
US |
|
|
Canada |
|
|
Total |
|
|||
|
Equipment and Leasehold improvements |
$ |
2,183 |
|
|
$ |
— |
|
|
$ |
2,183 |
|
|
Goodwill |
|
5,290 |
|
|
|
4,640 |
|
|
|
9,930 |
|
|
Intangible assets |
|
8,900 |
|
|
|
1,033 |
|
|
|
9,933 |
|
|
Total Impairment |
$ |
16,373 |
|
|
$ |
5,673 |
|
|
$ |
22,046 |
|
The 2012 impairment charges are included as a separate component of operating income on the consolidated statement of operations for the year ended December 31, 2012.
F-27
FUEL SYSTEMS SOLUTIONS, INC.
Notes to Consolidated Financial Statements – (Continued)
|
16. |
Loss Per Share |
The following table sets forth the computation of basic and diluted income per share (in thousands, except share and per share data):
|
|
Years Ended December 31, |
|
|||||||||
|
|
2014 |
|
|
2013 |
|
|
2012 |
|
|||
|
Numerator: |
|
|
|
|
|
|
|
|
|
|
|
|
Net loss attributable to Fuel Systems |
$ |
(53,416 |
) |
|
$ |
(460 |
) |
|
$ |
(15,632 |
) |
|
Denominator: |
|
|
|
|
|
|
|
|
|
|
|
|
Denominator for basic earnings per share—weighted average number of shares |
|
20,074,773 |
|
|
|
20,073,360 |
|
|
|
20,020,487 |
|
|
Effect of dilutive securities: |
|
|
|
|
|
|
|
|
|
|
|
|
Employee stock options |
|
0 |
|
|
|
0 |
|
|
|
0 |
|
|
Unvested restricted stock |
|
0 |
|
|
|
0 |
|
|
|
0 |
|
|
Shares held in escrow |
|
0 |
|
|
|
0 |
|
|
|
0 |
|
|
Dilutive potential common shares |
|
20,074,773 |
|
|
|
20,073,360 |
|
|
|
20,020,487 |
|
|
Basic loss per share: |
|
|
|
|
|
|
|
|
|
|
|
|
Net loss per share attributable to Fuel Systems |
$ |
(2.66) |
|
|
$ |
(0.02 |
) |
|
$ |
(0.78 |
) |
|
Diluted loss per share: |
|
|
|
|
|
|
|
|
|
|
|
|
Net loss per share attributable to Fuel Systems |
$ |
(2.66) |
|
|
$ |
(0.02 |
) |
|
$ |
(0.78 |
) |
The following table represents the numbers of anti-dilutive instruments excluded from the computation of diluted EPS:
|
|
Year Ended December 31, |
|
||||||||||
|
|
2014 |
|
|
2013 |
|
|
2012 |
|
||||
|
Anti-dilutive instruments excluded from computation of diluted net loss per share: |
|
|
|
|
|
|
|
|
|
|
|
|
|
Options |
|
87,217 |
|
|
|
10,143 |
|
|
|
30,564 |
|
|
|
Restricted stock |
|
11,418 |
|
|
|
4,213 |
|
|
|
1,607 |
|
|
|
Shares held in escrow |
|
0 |
|
|
|
1,100 |
|
|
|
58,252 |
|
|
F-28
FUEL SYSTEMS SOLUTIONS, INC.
Notes to Consolidated Financial Statements – (Continued)
|
17. |
Related Party Transactions |
The following table sets forth amounts (in thousands) that are included within the captions noted on the consolidated balance sheets at December 31, 2014 and 2013 representing related party transactions with the Company.
|
|
As of |
|
|||||
|
|
December 31, 2014 |
|
|
December 31, 2013 |
|
||
|
Current Receivables with related parties: |
|
|
|
|
|
|
|
|
TCN S.r.L. (a) |
$ |
0 |
|
|
$ |
12 |
|
|
Bianco SPA (b) |
|
266 |
|
|
|
207 |
|
|
Ningbo Topclean Mechanical Technology Co. Ltd. (c) |
|
131 |
|
|
|
37 |
|
|
Current Receivables with JVs and related partners: |
|
|
|
|
|
|
|
|
PDVSA Industrial S.A. (d) |
|
4,697 |
|
|
|
2,531 |
|
|
|
$ |
5,094 |
|
|
$ |
2,787 |
|
|
Current Payables with related parties: |
|
|
|
|
|
|
|
|
Europlast S.r.L. (e) |
|
901 |
|
|
|
962 |
|
|
TCN S.r.L. (a) |
|
724 |
|
|
|
751 |
|
|
TCN Vd S.r.L. (f) |
|
787 |
|
|
|
771 |
|
|
A.R.S. Elettromeccanica (g) |
|
200 |
|
|
|
239 |
|
|
Erretre S.r.L. (h) |
|
14 |
|
|
|
15 |
|
|
IMCOS Due S.r.L. (i) |
|
0 |
|
|
|
53 |
|
|
Grosso, de Rienzo, Riscossa e Associati (j) |
|
101 |
|
|
|
0 |
|
|
Others (l) |
|
9 |
|
|
|
17 |
|
|
Current Payable with JVs and related partners: |
|
|
|
|
|
|
|
|
Ideas & Motion S.r.L. (k) |
|
8 |
|
|
|
52 |
|
|
|
$ |
2,744 |
|
|
$ |
2,860 |
|
|
|
|
(a) |
TCN S.r.L. is 30% owned by Mariano Costamagna, the Company’s Chief Executive Officer, along with his brother, Pier Antonio Costamagna (who retired as an executive officer of the Company and as General Manager of MTM S.r.L., effective February 5, 2014). |
|
(b) |
Bianco S.p.A. is 100% owned by TCN S.r.L. (see note (a) above). |
|
(c) |
Ningbo Topclean Mechanical Technology Co. Ltd. is 100% owned by MTM Hydro S.r.L. (see note (l) below). |
|
(d) |
PDVSA Industrial S.A. (“PDVSA”) is a 70% owner of a joint venture, Sistemas De Conversion Del Alba, S.A. (“SICODA”) with the remaining 30% owned by the Company. |
|
(e) |
Europlast S.r.L. is 90% owned by the Company’s Chief Executive Officer, his brother, Pier Antonio Costamagna and one immediate family member. |
|
(f) |
TCN Vd S.r.L. is 90% owned by TCN S.r.L. (see note (a) above) as well as 3% by the Company’s Chief Executive Officer, along with his brother, Pier Antonio Costamagna. |
|
(g) |
A.R.S. Elettromeccanica is 100% owned by Biemmedue S.r.L. (see note (l) below). |
|
(h) |
Erretre S.r.L. is 85% owned by the Company’s Chief Executive Officer’s immediate family and one employee of the Company. |
|
(i) |
IMCOS Due S.r.L. is 100% owned by the Company’s Chief Executive Officer along with his brother Pier Antonio Costamagna and three immediate family members. |
|
(j) |
One director of the Company is a partner of the law firm Grosso, de Rienzo, Riscossa e Associati. |
|
(k) |
Ideas & Motion S.r.L. is an Italian consulting and services company in which the Company owns an equity ownership interest of 16.67%. |
|
(l) |
Includes Biemmedue S.p.A. (100% owned by the Company’s Chief Executive Officer along with his brother, Pier Antonio Costamagna), MTM Hydro S.r.L. (46% owned by the Company’s Chief Executive Officer along with his brother, Pier Antonio Costamagna), and Immobiliare IV Marzo (60% owned directly and indirectly by the Company’s Chief Executive Officer, his brother, Pier Antonio Costamagna, and three employees of the Company). |
F-29
FUEL SYSTEMS SOLUTIONS, INC.
Notes to Consolidated Financial Statements – (Continued)
|
|
(in thousands) |
|
|||||||||||||||||||||
|
|
2014 |
|
|
2013 |
|
|
2012 |
|
|||||||||||||||
|
|
Purchases |
|
|
Sales |
|
|
Purchases |
|
|
Sales |
|
|
Purchases |
|
|
Sales |
|
||||||
|
Related Party Company: |
|
|
|
|
|
|
|
|
|
|
|
|
|
|
|
|
|
|
|
|
|
|
|
|
Europlast S.r.L. |
$ |
2,281 |
|
|
$ |
1 |
|
|
$ |
3,877 |
|
|
$ |
12 |
|
|
$ |
4,524 |
|
|
$ |
43 |
|
|
TCN S.r.L |
|
1,960 |
|
|
|
0 |
|
|
|
3,159 |
|
|
|
0 |
|
|
|
3,572 |
|
|
|
9 |
|
|
TCN Vd S.r.L |
|
1,627 |
|
|
|
25 |
|
|
|
2,933 |
|
|
|
11 |
|
|
|
3,044 |
|
|
|
0 |
|
|
A.R.S. Elettromeccanica |
|
1,097 |
|
|
|
0 |
|
|
|
1,630 |
|
|
|
0 |
|
|
|
1,584 |
|
|
|
0 |
|
|
Ningbo Topclean Mechanical Technology |
|
687 |
|
|
|
0 |
|
|
|
1,383 |
|
|
|
0 |
|
|
|
1,088 |
|
|
|
0 |
|
|
Bianco Spa |
|
28 |
|
|
|
629 |
|
|
|
15 |
|
|
|
568 |
|
|
|
89 |
|
|
|
951 |
|
|
Erretre S.r.L. |
|
143 |
|
|
|
6 |
|
|
|
210 |
|
|
|
3 |
|
|
|
206 |
|
|
|
0 |
|
|
Grosso, de Rienzo, Riscossa e Associati |
|
206 |
|
|
|
0 |
|
|
|
170 |
|
|
|
0 |
|
|
|
146 |
|
|
|
0 |
|
|
Others |
|
27 |
|
|
|
26 |
|
|
|
30 |
|
|
|
27 |
|
|
|
38 |
|
|
|
68 |
|
|
JVs and related partners: |
|
|
|
|
|
|
|
|
|
|
|
|
|
|
|
|
|
|
|
|
|
|
|
|
Ideas & Motions S.r.L |
|
126 |
|
|
|
8 |
|
|
|
273 |
|
|
|
0 |
|
|
|
0 |
|
|
|
0 |
|
|
Rohan BRC(a) |
|
0 |
|
|
|
0 |
|
|
|
290 |
|
|
|
2,358 |
|
|
|
3 |
|
|
|
2,948 |
|
|
PDVSA Industrial S.A. |
|
0 |
|
|
|
5,131 |
|
|
|
0 |
|
|
|
3,037 |
|
|
|
0 |
|
|
|
8,444 |
|
|
|
$ |
8,182 |
|
|
$ |
5,826 |
|
|
$ |
13,970 |
|
|
$ |
6,016 |
|
|
$ |
14,294 |
|
|
$ |
12,463 |
|
|
|
|
(a) |
Amounts represent purchases and sales prior to the acquisition that closed on September 13, 2013 (see Note 3). |
Other Transactions with Related Parties
The Company leases buildings under separate facility agreements from IMCOS Due S.r.L., a real estate investment company owned 100% by Messrs. Mariano Costamagna, Pier Antonio Costamagna (former executive officer of the Company and General Manager of MTM) and members of their immediate families. The terms of these leases reflect the fair market value of such properties based upon appraisals. These lease agreements begin to expire in 2015, with the last agreement ending in 2020. The Company paid IMCOS Due S.r.L. lease payments of $2.7 million, $2.1 million, and $1.8 million in 2014, 2013, and 2012, respectively. In April 2014, IMCOS Due S.r.L. purchased two properties from a third party, which are currently being leased by the Company. In the fourth quarter of 2014, as part of the ongoing efforts for rationalization of operations and costs, the Company decided to abandon a facility leased in Italy from IMCOS Due S.r.L., which resulted in write offs of leasehold improvements for approximately $2.0 million (see Note 18). The Company leases a building from Immobiliare 4 Marzo S.a.s., a real estate investment company owned 40% by Messrs. Mariano Costamagna, Pier Antonio Costamagna and one employee of the Company. The Company paid Immobiliare 4 Marzo S.a.s. lease payments of $0.3 million, $0.4 million, and $0.3 million in 2014, 2013, and 2012, respectively. The term of this lease reflects the fair market value of such property based upon an appraisal.
The Company entered into an agreement to develop the basic and detailed engineering and outfit the facility for the installation of an integrated production plant for natural gas vehicles for PDVSA in Venezuela. The Company accounts for this project under the completed contract method. As of December 31, 2014 the total amount of cost (included in other current assets) and revenue (included in accrued expenses) deferred under this project totals approximately $6.6 million and $6.8 million, respectively. As of December 31, 2013 the total amount of cost (included in other current assets) and revenue (included in accrued expenses) deferred under this project totaled approximately $5.6 million and $5.5 million, respectively. At December 31, 2014 and 2013, an advance payment from PDVSA of $0.8 million and $1.0 million, respectively, is included in accrued expenses.
F-30
FUEL SYSTEMS SOLUTIONS, INC.
Notes to Consolidated Financial Statements – (Continued)
|
18. |
Commitments and Contingencies |
|
(a) |
Leases |
The Company has certain non-cancelable operating leases for facilities and equipment. Future minimum lease commitments under non-cancelable leases at December 31, 2014 are as follows (in thousands):
|
Years Ending December 31, |
|
Third Party |
|
|
Related Party |
|
|
Total |
|
|||
|
2015 |
|
$ |
3,798 |
|
|
$ |
3,116 |
|
|
$ |
6,914 |
|
|
2016 |
|
|
3,718 |
|
|
|
3,056 |
|
|
|
6,774 |
|
|
2017 |
|
|
3,087 |
|
|
|
2,605 |
|
|
|
5,692 |
|
|
2018 |
|
|
2,525 |
|
|
|
2,341 |
|
|
|
4,866 |
|
|
2019 |
|
|
1,702 |
|
|
|
1,577 |
|
|
|
3,279 |
|
|
Thereafter |
|
|
1,584 |
|
|
|
820 |
|
|
|
2,404 |
|
|
Total |
|
$ |
16,414 |
|
|
$ |
13,515 |
|
|
$ |
29,929 |
|
|
|
|
(1) |
See Note 17 |
Total rental expense under the operating leases for 2014, 2013, and 2012 was approximately $8.2 million, $8.0 million, and $7.7 million, respectively, net of sublease payments of $4 thousand, zero, and less than $0.1 million in 2014, 2013, and 2012, respectively. These leases are non-cancelable and certain leases have renewal options and escalation clauses.
|
(b) |
Contingencies |
From time to time, the Company may be involved in litigation relating to claims arising out of the ordinary course of its business including, but not limited to, product liability, asbestos related liability, employment matters, patent and trademarks, and customer account collections. The Company is not a party to, and, to our knowledge, there are not threats of any claims or actions against us, the ultimate disposition of which would have a material adverse effect on our consolidated results of operations or liquidity.
The Company is currently party to claims for wages brought by former DOEM temporary employees. At December 31, 2011, the Company had accrued $2.4 million in relation to such claims. During 2012, the Company settled claims for an amount equal to approximately $1.5 million, while reversing excess accruals for approximately $0.9 million. During the fourth quarter of 2013, the Company accrued approximately $0.4 million for additional claims. During the year ended December 31, 2014 the Company settled claims for approximately $0.4 million and accrued and settled approximately $0.2 million for additional claims. As of December 31, 2014 the Company had no amounts accrued for additional claims.
Due to changes in the economic environment, and ensuing updated business strategies, during the year ended December 31, 2014, the Company went through a rationalization of its operations. The Company incurred costs associated with work force reduction, as well as the closing of a facility. As of December 31, 2014, the Company has incurred and paid approximately the following amounts in relation with the above-mentioned rationalization of operations, recorded within selling, general, and administrative expenses on the Company’s Consolidated Statement of Operations (amounts in thousands):
|
|
|
|
|
|||||||||
|
|
|
|
|
|
Year Ended |
|
||||||
|
FSS Industrial (1) (2): |
|
|
|
|
|
|
|
|
||||
|
Cost accrued for work force reduction |
|
|
|
|
|
$ |
631 |
|
||||
|
Amounts paid for work force reduction |
|
|
|
|
|
|
550 |
|
||||
|
Unpaid portion of cost accrued for work force reduction as of December 31, 2014 |
|
|
|
|
|
|
81 |
|
||||
|
FSS Automotive (1) (3): |
|
|
|
|
|
|
|
|
||||
|
Cost accrued for work force reduction |
|
|
|
|
|
$ |
2,978 |
|
||||
|
Amounts paid for work force reduction |
|
|
|
|
|
|
2,930 |
|
||||
|
Unpaid portion of cost accrued for work force reduction as of December 31, 2014 |
|
|
|
|
|
|
48 |
|
||||
|
|
|
|
|
|
|
|
|
|
||||
|
Write off in second quarter 2014 in connection with facility closing |
|
|
|
|
|
|
487 |
|
||||
|
Write off in fourth quarter 2014 in connection with lease abandonment (1) |
|
|
|
|
|
|
1,993 |
|
||||
___________
F-31
FUEL SYSTEMS SOLUTIONS, INC.
Notes to Consolidated Financial Statements – (Continued)
|
(1) |
The total expected costs to be incurred in relation with the rationalization of operations were approximately $0.6 million for FSS Industrial and in the range of approximately $3.0 million to $3.5 million for FSS Automotive, respectively. In addition, in the fourth quarter of 2014 management decided to abandon an additional facility leased in Italy by its FSS Automotive operations, which resulted in write offs of leasehold improvements for an additional $2.0 million. |
|
(2) |
The FSS Industrial rationalization of operations started and ended within the three months ended September 30, 2014. |
|
(3) |
The FSS Automotive rationalization of operations started during the three months ended June 30, 2014, when approximately $1.7 million for work force reduction and facility closing expenses were accrued, and ended by September 30, 2014. In addition, in the fourth quarter of 2014 management decided to abandon an additional facility leased in Italy from a related party by its FSS automotive operations, which resulted in write offs of leasehold improvements for an additional $2.0 million (see Note 17). |
During the third quarter of 2012, the Company established a plan to terminate approximately 60 employees in Italy by the end of the year, in an effort to minimize cost structure at certain facilities. The total termination benefit was estimated to be approximately $0.8 million, accrued in operating expenses. In the fourth quarter of 2012, the Company determined the numbers of employee to be terminated to be 22 for a total termination benefit of approximately $0.3 million. Consequently, in the fourth quarter of 2012, the Company reversed excess accruals for approximately $0.5 million. As of December 31, 2012, approximately $0.3 million was still accrued, which was subsequently paid in January 2013.
|
(c) |
Investment and Tax Savings Plan |
The Company has two registered pension plans which provide defined contribution benefits to some of its employees.
In Canada, the Company provides employee and Company funded defined contribution benefits to its employees (the “Canadian Plan”). Full-time employees are eligible to participate on the first day of any month on or after the completion of one year of continuous employment. Part-time employees are eligible to participate on the first day of any month on or after the completion of two years of continuous employment.
Under the Canadian Plan employees are required to contribute an amount equal to 0.5 percent up to 4 percent of their earnings, with the Company contributing an amount equal to the employee required contributions, up to a maximum of $4,000 per year. Incremental voluntary contributions by the employees are permitted as long as the total contributions to the plan do not exceed the limits specified under the Canadian Income Tax Act. Approximately 71% of the Canadian employees of the above-mentioned entities were enrolled in this plan as of December 31, 2014. Employer contributions were approximately $0.2 million, $0.2 million, and $0.1 million, in each of the twelve months periods ending December 31 2014, 2013, and 2012, respectively.
The Company’s Investment and Tax Savings Plan (the “401(k) plan”) is a defined contribution plan, which is qualified under Internal Revenue Service Code Section 401(k). The 401(k) plan is subject to the provisions of the Employee Retirement Income Security Act of 1974. All U.S. employees who are at least age twenty-one or older are eligible to participate in the 401(k) plan immediately and can enter the 401(k) plan on the first day of each month. Eligible employees of the Company who elect to participate in the 401(k) plan may contribute into the plan from 1% to 100% of compensation. The Company’s matching contributions are discretionary and match 100% on the first 3% of the elective salary deferrals. Approximately 66% and 70% of eligible employees were enrolled in the 401(k) plan at December 31, 2014 and December 31, 2013, respectively. The Company match was suspended in 2009 and restored in 2011. Employer contributions were $0.1 million, $0.2 million, and $0.3 million for 2014, 2013, and 2012, respectively.
|
(d) |
Deferred Compensation Plan |
The Company had a non-qualified deferred compensation plan which, was terminated in the second quarter of 2014, whereby selected key employees and directors may elect to defer a portion of their compensation each year. This plan is administered by a third party plan administrator. Employee contributions were invested in mutual funds and consequently considered to be traded instruments. The Company matched 50% of the employee contribution up to an annual maximum of $12,500. Participants in the plan were 25% vested in the amount of the Company matching contributions upon attaining two years of service, with an additional 25% vested for each additional year of service thereafter. The Company match was discontinued in 2009.
The cash contributed by the Company on the participant’s behalf had been invested in Company’s common stock acquired in the open market, which is carried at cost and classified as a deduction of equity in shares held in treasury on the consolidated balance sheet (see Note 12 for further discussion). The value of the Company’s common stock was calculated and recorded as a liability at market value and is classified as a long-term liability on the Company’s consolidated balance sheet for the year ended December 31, 2013, whereas following termination of the plan the value of the Company’s common stock is classified as a current liability in the balance sheet for the year ended December 31, 2014. Any changes in the market value of the Company’s Common Stock were
F-32
FUEL SYSTEMS SOLUTIONS, INC.
Notes to Consolidated Financial Statements – (Continued)
recorded in selling general and administrative expense. The Company includes the common stock of the plan in its computations of basic and diluted net income per share. The Company consolidated the assets of the deferred compensation plan as part of the Company’s assets at the end of each quarter, which were classified as long-term investments on the Company’s consolidated balance sheet as of December 31, 2013, and as short-term investment on the Company’s balance sheet as of December 31, 2014, following termination of the plan. At December 31, 2014 and 2013, the assets under the plan, included in short-term investments and long-term investments, were $0.6 million and $0.7 million, respectively. At December 31, 2014 and 2013 the liabilities under the plan were $0.7 million and $0.8 million, respectively.
|
(e) |
Severance Funds |
Italian law requires companies to make a mandatory termination payment called the Trattamento di Fine Rapporto (“TFR”) to employees. It is paid, as a lump sum, when the employment ends for any reason such as retirement, resignation, or layoff. The severance indemnity liability is calculated in accordance with local civil and labor laws based on each employee’s length of service, employment category and remuneration. There is no vesting period or funding requirement associated with the liability. The liability recorded in the consolidated balance sheet is the amount that the employee would be entitled to if employment ceased immediately. During 2014, 2013, and 2012, the Company had recorded approximately $1.9 million, $2.4 million, and $2.0 million, respectively, in expense for TFR and has a long-term liability accrued in the amount of $4.1 million, and $5.1 million as of December 31, 2014 and 2013, respectively. This liability for severance indemnities relates to the Company’s employees in Italy.
|
(f) |
Liability for Contingent Consideration |
Liability for Contingent Consideration—MTE
In connection with the purchase of the remaining 50% ownership interest in MTE S.r.L. (“MTE”), which took place on June 1, 2011, the Company could have been required to pay up to $1.3 million in earnout payments no later than 5 days after May 31, 2014, upon achievement of 2012 and 2013 gross profit targets.
During the fourth quarter of 2012, the estimated fair value of the MTE contingent consideration liability in connection with the achievement of 2012 and 2013 gross profit targets was reversed, primarily due to a reduction in the probability-weighted estimates based on updated forecast. The reduction in the fair value estimate resulted in a gain of approximately $0.4 million for the twelve months ended December 31, 2012, which was recorded in operating expenses in the Consolidated Statement of Operations. Consequently, the balance of the MTE contingent consideration liability as of December 31, 2014 and 2013 was equal to zero in both periods.
Liability for Contingent Consideration—NaturalDrive
In connection with the NaturalDrive acquisition, which took place on April 18, 2011, the Company could have been required to pay up to $6.75 million in earnout payments upon achievement of business volume and general milestones. The earn-out would have been paid in three equal installments of $1.5 million no later than 90 days after the end of each yearly period ending in March 2012, March 2013, and March 2014 if specified target customer volumes for the year were achieved, and reasonable progress was made on the general milestones.
In April 2013, the Company reached an agreement with the former owners of NaturalDrive that released the Company from any obligation associated with the potential earnout. Consequently, the balance of the NaturalDrive contingent consideration liability as of December 31, 2014 and 2013 was equal to zero.
|
19. |
Business Segment and Geographic Information |
Business Segments. In an effort to more appropriately align the structure and business activities within Fuel Systems, beginning with the second quarter of 2012, management reorganized operations into the following segments: FSS Industrial and FSS Automotive. FSS Industrial consists of the Company’s industrial mobile and stationary equipment and auxiliary power unit (APU), and the Company’s heavy duty commercial transportation operations. FSS Automotive consists of the Company’s passenger and light duty commercial transportation (automotive OEM and aftermarket) and transportation infrastructure operations (compressors).
F-33
FUEL SYSTEMS SOLUTIONS, INC.
Notes to Consolidated Financial Statements – (Continued)
Corporate expenses consist of general and administrative expenses at the Fuel Systems corporate level. Intercompany sales between FSS Industrial and FSS Automotive have been eliminated in the results reported.
The Company evaluates performance based on profit or loss from operations before interest and income taxes. The accounting policies of the reportable segments are the same as those described in the Summary of Significant Accounting Policies.
Financial Information by Business Segment. Financial information by business segment follows (in thousands):
|
|
|
Years Ended December 31, |
|
|||||||||
|
Revenue: |
|
2014 |
|
|
2013 |
|
|
2012 |
|
|||
|
FSS Industrial |
|
$ |
104,435 |
|
|
$ |
123,351 |
|
|
$ |
122,674 |
|
|
FSS Automotive |
|
|
234,693 |
|
|
|
276,490 |
|
|
|
271,273 |
|
|
Total |
|
$ |
339,128 |
|
|
$ |
399,841 |
|
|
$ |
393,947 |
|
|
|
|
Years Ended December 31, |
|
|||||||||
|
Operating Income (Loss): |
|
2014 |
|
|
2013 |
|
|
2012 |
|
|||
|
FSS Industrial |
|
$ |
4,217 |
|
|
$ |
9,811 |
|
|
$ |
4,644 |
|
|
FSS Automotive |
|
|
(49,767) |
|
|
|
1,117 |
|
|
|
(11,833 |
) |
|
Corporate Expenses (1) |
|
|
(8,669) |
|
|
|
(6,519 |
) |
|
|
(6,097 |
) |
|
Total |
|
$ |
(54,219) |
|
|
$ |
4,409 |
|
|
$ |
(13,286 |
|
|
|
|
(1) |
Represents corporate expense not allocated to either of the business segments. |
|
|
|
As of December 31, |
|
|||||
|
Total Assets: |
|
2014 |
|
|
2013 |
|
||
|
FSS Industrial |
|
$ |
126,620 |
|
|
$ |
131,022 |
|
|
FSS Automotive |
|
|
211,788 |
|
|
|
314,018 |
|
|
Corporate (1) |
|
|
175,980 |
|
|
|
187,778 |
|
|
Eliminations |
|
|
(190,147 |
) |
|
|
(217,519 |
) |
|
Total |
|
$ |
324,241 |
|
|
$ |
415,299 |
|
|
|
|
(1) |
Represents corporate balances not allocated to either of the business segments and primarily includes investments in the subsidiaries, which eliminate in consolidation. |
|
|
|
Years Ended December 31, |
|
|||||||||
|
Capital Expenditures: |
|
2014 |
|
|
2013 |
|
|
2012 |
|
|||
|
FSS Industrial |
|
$ |
3,124 |
|
|
$ |
2,679 |
|
|
$ |
3,214 |
|
|
FSS Automotive |
|
|
10,583 |
|
|
|
6,559 |
|
|
|
10,490 |
|
|
Corporate |
|
|
19 |
|
|
|
268 |
|
|
|
0 |
|
|
Total |
|
$ |
13,726 |
|
|
$ |
9,506 |
|
|
$ |
13,704 |
|
F-34
FUEL SYSTEMS SOLUTIONS, INC.
Notes to Consolidated Financial Statements – (Continued)
Geographic Information.
The Company’s geographic information for revenue to unaffiliated customers and long-lived assets is shown below. The basis for determining revenue is the geographic location of the customer. Long-lived assets represent long-term tangible assets that are physically located in the region as indicated (in thousands):
|
|
|
Years Ended December 31, |
|
|||||||||
|
Revenue: |
|
2014 |
|
|
2013 |
|
|
2012 |
|
|||
|
North America: |
|
|
|
|
|
|
|
|
|
|
|
|
|
United States |
|
$ |
87,224 |
|
|
$ |
113,674 |
|
|
$ |
92,652 |
|
|
Canada |
|
|
5,144 |
|
|
|
5,044 |
|
|
|
5,938 |
|
|
Europe: |
|
|
|
|
|
|
|
|
|
|
|
|
|
Italy |
|
|
51,294 |
|
|
|
74,987 |
|
|
|
76,026 |
|
|
All other (1) |
|
|
88,223 |
|
|
|
78,219 |
|
|
|
78,623 |
|
|
Asia & Pacific Rim (1) |
|
|
42,829 |
|
|
|
66,577 |
|
|
|
73,425 |
|
|
Latin America (1) |
|
|
64,414 |
|
|
|
61,340 |
|
|
|
67,283 |
|
|
Total |
|
$ |
339,128 |
|
|
$ |
399,841 |
|
|
$ |
393,947 |
|
|
|
(1) No one country represents more than 10% of total consolidated long-lived assets.
|
|
|
As of December 31, |
|
|||||
|
Long-Lived Assets: |
|
2014 |
|
|
2013 |
|
||
|
North America: |
|
|
|
|
|
|
|
|
|
United States |
|
$ |
4,724 |
|
|
$ |
4,929 |
|
|
Canada |
|
|
5,070 |
|
|
|
4,444 |
|
|
Europe: |
|
|
|
|
|
|
|
|
|
Italy |
|
|
34,896 |
|
|
|
44,695 |
|
|
All other (1) |
|
|
667 |
|
|
|
893 |
|
|
Asia & Pacific Rim (1) |
|
|
588 |
|
|
|
792 |
|
|
Latin America (1) |
|
|
2,992 |
|
|
|
2,649 |
|
|
Total |
|
$ |
48,937 |
|
|
$ |
58,402 |
|
|
|
|
(1) |
No one country represents more than 10% of total consolidated long-lived assets. |
|
20. |
Concentrations |
Revenue
The Company routinely sells products to a broad base of domestic and international customers, which includes distributors and original equipment manufacturers. Based on the nature of these customers, credit is generally granted without collateral being required.
In 2014, 2013, and 2012, no customers represented more than 10.0% of the consolidated sales.
Accounts Receivable
At December 31, 2014, no customers represented more than 10.0% of the consolidated account receivable. At December 31, 2013, no customers represented more than 10.0% of consolidated accounts receivable.
Purchases
During 2014, 2013, and 2012, no suppliers represented more than 10.0% of the consolidated purchases of raw materials and services. In 2014, 2013, and 2012, ten suppliers accounted for approximately 23.0%, 26.7%, and 24.4%, respectively, of consolidated purchases of raw materials and services.
F-35
FUEL SYSTEMS SOLUTIONS, INC.
Notes to Consolidated Financial Statements – (Continued)
Cash
Operating cash balances held at non-U.S. banks, primarily in Europe, represent 57.3% and 77.1% of the Company’s consolidated cash and cash equivalents at December 31, 2014 and 2013, respectively.
|
21. |
Supplementary Cash Flow Information |
Supplementary cash flow information for 2014, 2013, and 2012 is as follows (in thousands):
|
|
|
Years Ended December 31, |
|
|||||||||
|
Supplementary Cash Flow Information: |
|
2014 |
|
|
2013 |
|
|
2012 |
|
|||
|
Interest paid |
|
$ |
445 |
|
|
$ |
18 |
|
|
$ |
357 |
|
|
Taxes paid (including franchise taxes) |
|
$ |
2,879 |
|
|
$ |
10,946 |
|
|
$ |
2,808 |
|
|
Supplemental disclosures of cash flow information |
|
|
|
|
|
|
|
|
|
|
|
|
|
Non-cash investing and financing activities: |
|
|
|
|
|
|
|
|
|
|
|
|
|
Acquisition of equipment in accounts payable |
|
$ |
282 |
|
|
$ |
725 |
|
|
$ |
741 |
|
|
22. |
Quarterly Results of Operations |
A summary of the unaudited quarterly consolidated results of operations follows (in thousands, except per share amounts).
|
|
First Qtr. |
|
|
Second Qtr. |
|
|
Third Qtr. |
|
|
Fourth Qtr. |
|
|||||||||||||||
|
2014 |
(Unaudited) |
|
|
(Unaudited) |
|
|
(Unaudited) |
|
|
(Unaudited) |
|
|||||||||||||||
|
Revenue |
$ |
81,296 |
|
|
$ |
87,391 |
|
|
$ |
85,077 |
|
|
$ |
85,364 |
|
|||||||||||
|
Cost of revenue |
|
63,895 |
|
|
|
69,539 |
|
|
|
65,101 |
|
|
|
65,936 |
|
|||||||||||
|
Gross profit |
|
17,401 |
|
|
|
17,852 |
|
|
|
19,976 |
|
|
|
19,428 |
|
|||||||||||
|
Operating expenses |
|
19,683 |
|
|
|
65,759 |
(a)(b) |
|
|
21,365 |
(c) |
|
|
22,069 |
(d) |
|||||||||||
|
Operating loss |
|
(2,282 |
) |
|
|
(47,907 |
) |
|
|
(1,389 |
) |
|
|
(2,641 |
) |
|||||||||||
|
Interest income (loss), net |
|
13 |
|
|
|
(27 |
) |
|
|
116 |
|
|
|
49 |
|
|||||||||||
|
Net loss attributable to Fuel Systems Solutions, Inc. |
|
(2,006 |
) |
|
|
(44,190) |
|
|
|
(3,207 |
) |
|
|
(4,013 |
) |
|||||||||||
|
Net loss per share attributable to Fuel Systems Solutions, Inc.: |
|
|
|
|
|
|
|
|
|
|
|
|
|
|
|
|||||||||||
|
Basic |
$ |
(0.10 |
) |
|
$ |
(2.20 |
) |
|
$ |
(0.16 |
) |
|
$ |
(0.20 |
) |
|||||||||||
|
Diluted |
$ |
(0.10 |
) |
|
$ |
(2.20 |
) |
|
$ |
(0.16 |
) |
|
$ |
(0.20 |
) |
|||||||||||
|
|
|
|
|
|
|
|
|
|
|
|
|
|
|
|
|
|||||||||||
|
|
First Qtr. |
|
|
Second Qtr. |
|
|
Third Qtr. |
|
|
Fourth Qtr. |
|
|||||||||||||||
|
2013 |
(Unaudited) |
|
|
(Unaudited) |
|
|
(Unaudited) |
|
|
(Unaudited) |
|
|||||||||||||||
|
Revenue |
$ |
98,600 |
|
|
$ |
111,095 |
|
|
$ |
97,573 |
|
|
$ |
92,573 |
|
|||||||||||
|
Cost of revenue |
|
76,982 |
|
|
|
85,276 |
|
|
|
75,506 |
|
|
|
74,939 |
|
|||||||||||
|
Gross profit |
|
21,618 |
|
|
|
25,819 |
|
|
|
22,067 |
|
|
|
17,634 |
|
|||||||||||
|
Operating expenses |
|
20,481 |
|
|
|
20,998 |
|
|
|
20,443 |
|
|
|
20,807 |
|
|||||||||||
|
Operating income (loss) |
|
1,137 |
|
|
|
4,821 |
|
|
|
1,624 |
|
|
|
(3,173 |
) |
|||||||||||
|
Interest income (loss), net |
|
16 |
|
|
|
27 |
|
|
|
(7 |
) |
|
|
179 |
|
|||||||||||
|
Net (loss) income attributable to Fuel Systems Solutions, Inc. |
|
(725 |
) |
|
|
2,580 |
|
|
|
1,032 |
|
|
|
(3,347 |
) |
|||||||||||
|
Net (loss) income per share attributable to Fuel Systems Solutions, Inc.: |
|
|
|
|
|
|
|
|
|
|
|
|
|
|
|
|||||||||||
|
Basic |
$ |
(0.04 |
) |
|
$ |
0.13 |
|
|
$ |
0.05 |
|
|
$ |
(0.16 |
) |
|||||||||||
|
Diluted |
$ |
(0.04 |
) |
|
$ |
0.13 |
|
|
$ |
0.05 |
|
|
$ |
(0.16 |
) |
|||||||||||
|
|
|
(a) |
Includes impairment charges for approximately $44.3 million (see Note 15). |
|
(b) |
Includes cost for work force reduction of approximately $1.2 million and for write off in connection with facility closing for approximately $0.5 million (see Note 18). |
|
(c) |
Includes cost for work force reduction for approximately $2.4 million (see Note 18). |
|
(d) |
Includes cost for lease abandonment of approximately $2.0 million (see Note 18). |
F-36
FUEL SYSTEMS SOLUTIONS, INC.
SCHEDULE II—VALUATION ACCOUNTS
(in thousands)
|
|
Balance at |
|
|
Additions |
|
|
Write-offs |
|
|
Balance at |
|
|||||||||||||
|
Allowance for doubtful accounts for the period ended: |
|
|
|
|
|
|
|
|
|
|
|
|
|
|
|
|||||||||
|
December 31, 2014 |
$ |
3,993 |
|
|
$ |
306 |
|
|
$ |
(1,170 |
) |
|
$ |
3,129 |
|
|||||||||
|
December 31, 2013 |
$ |
4,349 |
|
|
$ |
583 |
|
|
$ |
(939 |
) |
|
$ |
3,993 |
|
|||||||||
|
December 31, 2012 |
$ |
2,665 |
|
|
$ |
2,299 |
|
|
$ |
(615 |
) |
|
$ |
4,349 |
|
|||||||||
|
Deferred tax valuation allowance for the period ended: |
|
|
|
|
|
|
|
|
|
|
|
|
|
|
|
|||||||||
|
December 31, 2014 |
$ |
44,508 |
|
|
$ |
2,224 |
|
|
$ |
585 |
|
|
$ |
47,317 |
|
|||||||||
|
December 31, 2013 |
$ |
46,284 |
|
|
$ |
2,211 |
|
|
$ |
(3,987) |
|
|
$ |
44,508 |
|
|||||||||
|
December 31, 2012 |
$ |
40,427 |
|
|
$ |
5,857 |
|
|
$ |
0 |
|
|
$ |
46,284 |
|
|||||||||
F-37