UNITED STATES
SECURITIES AND EXCHANGE COMMISSION
Washington, D.C. 20549
FORM 8-K
CURRENT REPORT
Pursuant to Section 13 or 15(d) of the Securities Exchange Act of 1934
Date of Report (Date of earliest event reported): March 11, 2015
DIVIDEND CAPITAL DIVERSIFIED PROPERTY FUND INC.
(Exact Name of Registrant as Specified in its Charter)
| Maryland | 000-52596 | 30-0309068 | ||
|
(State or other jurisdiction of incorporation) |
(Commission File No.) |
(I.R.S. Employer Identification No.) |
| 518 Seventeenth Street, 17th Floor, Denver CO | 80202 | |
| (Address of Principal Executive Offices) | (Zip Code) |
Registrant’s telephone number, including area code (303) 228-2200
Check the appropriate box below if the Form 8-K filing is intended to simultaneously satisfy the filing obligation of the registrant under any of the following provisions (see General Instruction A.2. below):
| ☐ | Written communications pursuant to Rule 425 under the Securities Act (17 CFR 230.425) |
| ☐ | Soliciting material pursuant to Rule 14a-12 under the Exchange Act (17 CFR 240.14a-12) |
| ☐ | Pre-commencement communications pursuant to Rule 14d-2(b) under the Exchange Act (17 CFR 240.14d-2(b)) |
| ☐ | Pre-commencement communications pursuant to Rule 13e-4(c) under the Exchange Act (17 CFR 240.13e-4(c)) |
| Item 2.01 | Completion of Acquisition or Disposition of Assets. |
On March 11, 2015, Dividend Capital Diversified Property Fund Inc. (referred to herein as the “Company,” “we,” “our,” or “us”), completed the sale of a portfolio of twelve wholly owned office and industrial properties (including two data centers that we had included within our industrial sector) comprising approximately 2.7 million net rentable square feet (the “Portfolio”) to subsidiaries of Gramercy Property Trust Inc. (“Gramercy”), an unrelated third party, for a gross sales price of approximately $398.6 million. The Portfolio includes (i) six office properties comprising 1.1 million net rentable square feet located in Los Angeles, CA (three properties), Northern New Jersey, Miami, FL, and Dallas, TX, and (ii) six industrial properties comprising 1.6 million net rentable square feet located in Los Angeles, CA, Dallas, TX, Cleveland, OH, Chicago, IL, Houston, TX, and Denver, CO.
We incurred estimated closing costs and fees of approximately $8.5 million upon the closing of this transaction, including approximately $4.0 million in asset management fees related to the disposition of real property paid to our advisor. As of December 31, 2014, our total net investment (i.e. our approximate cost basis) in the Portfolio was approximately $333.4 million. Under the basis of accounting principles generally accepted in the United States ("GAAP"), our accounting basis for all real estate-related assets and liabilities in the Portfolio, net of accumulated depreciation and amortization, was approximately $268.7 million.
Upon the disposition of the Portfolio, Gramercy assumed approximately $128.0 million of a mortgage note borrowing from us, which is scheduled to mature in July 2020 and bears interest at 5.455%. In addition, we were released of our obligations on $44.8 million of mortgage debt that was not assumed by Gramercy through a defeasance process. Accordingly, we incurred defeasance costs of approximately $8.6 million. Upon such defeasance, we derecognized the associated borrowing, which was assumed by a successor borrower.
| Item 7.01 | Regulation FD Disclosure. |
Explanatory Note
The following series of charts, tables and notes included in Item 7.01 reflect certain information about our portfolio and borrowings, as of December 31, 2014, on a pro forma basis adjusted for the following transactions which occurred subsequent to December 31, 2014:
· The repayment of a mortgage note borrowing of approximately $21.1 million on January 2, 2015 (the “Orleans and Whitman Mortgage Note”). Prior to repayment, the mortgage note had a maturity date of July 1, 2015 and bore interest at 6.02%;
· The recast of a previous $620 million senior unsecured term loan and revolving line of credit (our “Old Facility”) into an amended credit agreement providing for a $550 million senior unsecured term loan and revolving line of credit (collectively, the “Facility”) on January 13, 2015, as described in our 2014 Annual Report on Form 10-K, filed with the Securities and Exchange Commission on March 3, 2015 (our “Annual Report on Form 10-K”);
· Our acquisition of an office property in the Austin, TX market (“Rialto”) for approximately $37.3 million on January 15, 2015, as described in our Annual Report on Form 10-K;
· Our disposition of an office property in the Dallas, TX market (“Park Place”) for approximately $46.6 million on January 16, 2015, as described in our Annual Report on Form 10-K;
· The disposition of the Portfolio for approximately $398.6 million on March 11, 2015;
· The assumption of a mortgage note borrowing of $128.0 million by Gramercy on March 11, 2015;
· Our derecognition of the remaining balance of $44.8 million of such borrowing associated with the defeasance that was not assumed by Gramercy on March 11, 2015; and
· The repayment of unsecured borrowings using net proceeds from the activities described above.
Real Properties
The following pro forma table describes our operating properties, adjusted for the transactions described in the explanatory note above, as of December 31, 2014, by market (dollar amounts and square footage amounts in thousands).
| Market | Number of Properties | Gross Investment Amount (1) | Net Rentable Square Feet | Secured Indebtedness (2) | % of Gross Investment Amount | % of Total Net Rentable Square Feet | % Leased (3) | |||||||||||||||||||||
| Office Properties: | ||||||||||||||||||||||||||||
| Washington, DC | 3 | $ | 282,674 | 878 | $ | 45,754 | 13.5 | % | 9.6 | % | 99.3 | % | ||||||||||||||||
| Northern New Jersey | 1 | 212,159 | 594 | 110,934 | 10.1 | % | 6.5 | % | 100.0 | % | ||||||||||||||||||
| East Bay, CA | 1 | 145,242 | 405 | — | 6.9 | % | 4.4 | % | 100.0 | % | ||||||||||||||||||
| San Francisco, CA | 1 | 118,697 | 270 | 57,006 | 5.7 | % | 2.9 | % | 89.6 | % | ||||||||||||||||||
| Denver, CO | 1 | 86,366 | 257 | — | 4.1 | % | 2.8 | % | 95.0 | % | ||||||||||||||||||
| Austin, TX | 2 | 82,278 | 311 | 18,065 | 3.9 | % | 3.4 | % | 97.2 | % | ||||||||||||||||||
| Silicon Valley, CA | 2 | 61,844 | 196 | 30,650 | 2.9 | % | 2.1 | % | 84.4 | % | ||||||||||||||||||
| Princeton, NJ | 1 | 51,239 | 167 | 33,650 | 2.4 | % | 1.8 | % | 100.0 | % | ||||||||||||||||||
| Chicago, IL | 2 | 48,004 | 305 | 29,550 | 2.3 | % | 3.3 | % | 87.9 | % | ||||||||||||||||||
| Philadelphia, PA | 1 | 41,966 | 173 | 24,000 | 2.0 | % | 1.9 | % | 95.5 | % | ||||||||||||||||||
| Dallas, TX | 1 | 34,903 | 149 | 22,469 | 1.7 | % | 1.6 | % | 93.7 | % | ||||||||||||||||||
| Minneapolis/St Paul, MN | 1 | 29,504 | 107 | — | 1.4 | % | 1.2 | % | 100.0 | % | ||||||||||||||||||
| Los Angeles, CA | 1 | 15,031 | 111 | — | 0.7 | % | 1.2 | % | 0.0 | % | ||||||||||||||||||
| Fayetteville, AR | 1 | 11,695 | 63 | — | 0.6 | % | 0.7 | % | 100.0 | % | ||||||||||||||||||
| Total/Weighted Average | 19 | 1,221,602 | 3,986 | 372,078 | 58.2 | % | 43.4 | % | 93.7 | % | ||||||||||||||||||
| Total Office: 19 properties, 14 markets with average annual rent of $29.26 per sq. ft. | ||||||||||||||||||||||||||||
| Industrial Properties: | ||||||||||||||||||||||||||||
| Dallas, TX | 1 | 35,739 | 446 | 22,700 | 1.7 | % | 5.0 | % | 35.1 | % | ||||||||||||||||||
| Central Kentucky | 1 | 27,053 | 727 | — | 1.3 | % | 7.9 | % | 100.0 | % | ||||||||||||||||||
| Louisville, KY | 4 | 26,626 | 736 | 8,162 | 1.3 | % | 8.0 | % | 100.0 | % | ||||||||||||||||||
| Total/Weighted Average | 6 | 89,418 | 1,909 | 30,862 | 4.3 | % | 20.9 | % | 84.9 | % | ||||||||||||||||||
| Total Industrial: 6 properties, three markets with average annual rent of $3.48 per sq. ft. | ||||||||||||||||||||||||||||
| Retail Properties: | ||||||||||||||||||||||||||||
| Boston Metro | 26 | 509,525 | 2,147 | 87,673 | 24.2 | % | 23.4 | % | 94.1 | % | ||||||||||||||||||
| Philadelphia, PA | 1 | 104,955 | 426 | 67,800 | 5.0 | % | 4.6 | % | 100.0 | % | ||||||||||||||||||
| Washington, DC | 1 | 62,516 | 233 | — | 3.0 | % | 2.5 | % | 98.4 | % | ||||||||||||||||||
| Raleigh, NC | 1 | 45,281 | 142 | 26,200 | 2.2 | % | 1.5 | % | 97.9 | % | ||||||||||||||||||
| San Antonio, TX | 1 | 32,065 | 161 | 21,500 | 1.5 | % | 1.8 | % | 89.6 | % | ||||||||||||||||||
| Jacksonville, FL | 1 | 19,494 | 73 | — | 0.9 | % | 0.8 | % | 54.4 | % | ||||||||||||||||||
| Pittsburgh, PA | 1 | 15,068 | 103 | 16,000 | 0.7 | % | 1.1 | % | 94.1 | % | ||||||||||||||||||
| Total/Weighted Average | 32 | 788,904 | 3,285 | 219,173 | 37.5 | % | 35.7 | % | 94.2 | % | ||||||||||||||||||
| Total Retail: 32 properties, seven markets with average annual rent of $16.11 per sq. ft. | ||||||||||||||||||||||||||||
| Grand Total/Weighted Average | 57 | $ | 2,099,924 | 9,180 | $ | 622,113 | 100.0 | % | 100.0 | % | 92.0 | % | ||||||||||||||||
(1)
“Gross Investment Amount” represents the allocated gross basis of real property and debt related investments, after certain adjustments. Gross Investment Amount for real property (i) includes the effect of intangible lease liabilities, (ii) excludes accumulated depreciation and amortization, and (iii) includes the impact of impairments. Amounts reported for debt related investments represent our net accounting basis of the debt investments, which includes (i) unpaid principal balances, (ii) unamortized discounts, premiums, and deferred charges, and (iii) allowances for loan loss.
| (2) | Secured indebtedness represents the principal balance outstanding and does not include our mark-to-market adjustment on debt or GAAP principal amortization on our troubled debt restructuring. |
(3) Based on executed leases as of December 31, 2014.
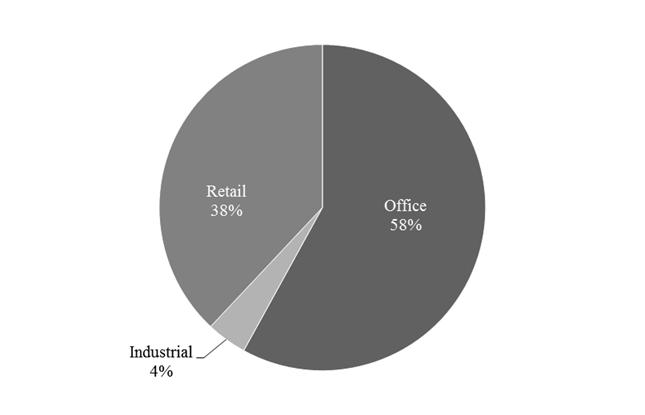
The pro forma chart below describes the diversification of our investment portfolio across real property type, absent the properties in the Portfolio and Park Place, and including Rialto. Percentages in the chart correspond to the fair value as of December 31, 2014.
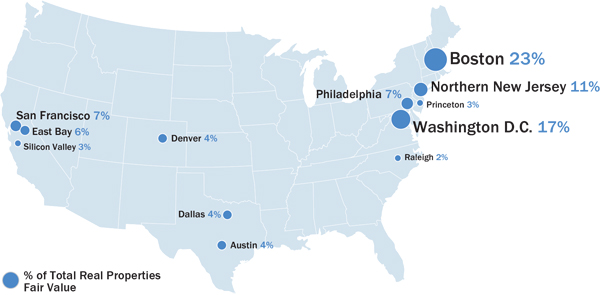
The pro forma chart below shows the allocations of our real property investments across geographic regions within the continental United States, absent the properties in the Portfolio and Park Place, and including Rialto, as of December 31, 2014. Percentages in the chart correspond to our fair value as of December 31, 2014. As of December 31, 2014, our real property investments were geographically diversified across 21 markets. Our debt related investments are located in six additional markets resulting in a combined portfolio allocation across 27 markets (excluding markets accounting for 1% or less of the total fair value of our real property portfolio).
Borrowings
The following pro forma table describes our borrowings, adjusted for the transactions described in the explanatory note above, as of December 31, 2014 (dollar amounts in thousands).
| Weighted Average Stated Interest Rate as of December 31, 2014 |
Outstanding Balance as of December 31, 2014 (1) |
Gross Investment Amount Securing Borrowings as of December 31, 2014 | |||||
| Fixed-rate mortgages | 5.9% | $ | 613,555 | $ | 1,120,989 | ||
| Floating-rate mortgages (2) | 3.2% | 8,250 | 16,118 | ||||
| Total mortgage notes | 5.8% | 621,805 | 1,137,107 | ||||
| Repurchase facilities (3) | 2.8% | 37,023 | 51,156 | ||||
| Total secured borrowings | 5.7% | 658,828 | 1,188,263 | ||||
| Line of credit (4)(6) | 2.2% | 48,594 | N/A | ||||
| Term loan (5)(6) | 1.9% | 100,000 | N/A | ||||
| Total unsecured borrowings | 2.0% | 148,594 | N/A | ||||
| Total borrowings | 5.0% | $ | 807,422 | $ | 1,188,263 | ||
| (1) | Amounts presented are net of (i) unamortized discounts to the face value of our outstanding fixed-rate mortgages of $2.0 million as of December 31, 2014, and (ii) GAAP principal amortization related to troubled debt restructurings of $2.3 million as of December 31, 2014. |
| (2) | As of December 31, 2014, our one floating-rate mortgage note was subject to an interest rate spread of 3.00% over one-month LIBOR. |
| (3) | As of December 31, 2014, borrowings under our repurchase facility were subject to interest at a floating rate of 2.25% over one-month LIBOR. However, we had effectively fixed the interest rate of the borrowings using an interest rate swap, resulting in a fixed interest rate of 2.84% for the term of the borrowings. |
| (4) | Based on the terms of the amended Facility, borrowings under our line of credit would have been subject to interest at a floating rate of 1.40% over one-month LIBOR. However, as of December 31, 2014, we had effectively fixed the interest rate of these borrowings through December 2016 using interest rate swaps at 2.16%. |
| (5) | Based on the terms of the amended Facility borrowings under our term loan would have been subject to interest at a floating rate of 1.35% over one-month LIBOR. However, as of December 31, 2014, we had effectively fixed the interest rate of these borrowings through December 2016 using interest rate swaps at 1.86%. |
| (6) | As of December 31, 2014, we had entered into interest rate swap agreements with total notional of $300.0 million which we entered into to fix the LIBOR component of the interest rate of our unsecured borrowings. Of these swaps, $200.0 million mature in December 2016 and fix the LIBOR rate at 0.64%, and $100.0 million mature in January 2022 and fix the LIBOR rate at 1.96%. We are obligated to pay our counterparties under these swap agreements regardless of the level of our unsecured borrowings. |
The following pro forma table reflects our contractual debt maturities, absent the Orleans and Whitman Mortgage Note, a borrowing associated with defeasance by us for assets that were not part of the Portfolio disposition, and a borrowing assumed by Gramercy in connection with the disposition of the Portfolio, the recast of our Old Facility, and assuming repayment of unsecured borrowings using net proceeds from the disposition of the Portfolio (adjusted for other transactions as described above), as of December 31, 2014, specifically our obligations under mortgage note agreements and other secured and unsecured borrowings (dollar amounts in thousands).
| As of December 31, 2014 | |||||||||||||
| Mortgage Notes and Other Secured Borrowings | Unsecured Borrowings | Total | |||||||||||
| Year Ending December 31, | Number of Borrowings Maturing | Outstanding Balance |
Number of Borrowings Maturing | Outstanding Balance (1) |
Outstanding Balance (2) | ||||||||
| 2015 | 4 | $ | 110,943 | - | $ | - | $ | 110,943 | |||||
| 2016 | 12 | 326,548 | - | - | 326,548 | ||||||||
| 2017 | 6 | 206,333 | - | - | 206,333 | ||||||||
| 2018 | - | 1,419 | 1 | 100,000 | 101,419 | ||||||||
| 2019 | - | 1,509 | 1 | 48,594 | 50,103 | ||||||||
| 2020 | - | 1,605 | - | - | 1,605 | ||||||||
| 2021 | - | 1,707 | - | - | 1,707 | ||||||||
| 2022 | 1 | 1,663 | - | - | 1,663 | ||||||||
| 2023 | - | 978 | - | - | 978 | ||||||||
| 2024 | - | 1,034 | - | - | 1,034 | ||||||||
| Thereafter | 2 | 5,397 | - | - | 5,397 | ||||||||
| Total | 25 | $ | 659,136 | 2 | $ | 148,594 | $ | 807,730 | |||||
| (1) | Unsecured borrowings presented include (i) borrowings under our Revolving Credit Facility of $48.6 million, which mature in 2019, subject to one 12-month extension option, and (ii) Term Loan borrowings of $100.0 million, which mature in 2018, subject to two 12-month extension options. |
| (2) | Outstanding balance represents expected cash outflows for contractual amortization and scheduled balloon payment maturities and does not include the mark-to-market adjustment on assumed debt, partially offset by the GAAP principal amortization of our restructured mortgage note that does not reduce the contractual amount due of the related mortgage note as of December 31, 2014. |
Lease Expirations
The following is a pro forma schedule of expiring leases for our consolidated operating properties, absent leases associated with the properties included in the Portfolio and Park Place, and including leases associated with Rialto, by annualized base rent and square footage as of December 31, 2014 and assuming no exercise of lease renewal options (dollar amounts and square footage in thousands).
| Lease Expirations | ||||||||||||
| Year | Number of Leases Expiring | Annualized Base Rent (1) | % | Square Feet | % | |||||||
| 2015 (2) | 141 | $ 13,291 | 8.1% | 1,044 | 12.3% | |||||||
| 2016 | 73 | 22,015 | 13.4% | 909 | 10.8% | |||||||
| 2017 | 68 | 41,500 | 25.2% | 1,354 | 16.0% | |||||||
| 2018 | 81 | 9,171 | 5.6% | 406 | 4.8% | |||||||
| 2019 | 92 | 21,750 | 13.2% | 1,065 | 12.6% | |||||||
| 2020 | 59 | 14,168 | 8.6% | 699 | 8.3% | |||||||
| 2021 | 23 | 10,776 | 6.5% | 1,291 | 15.3% | |||||||
| 2022 | 19 | 7,486 | 4.5% | 408 | 4.8% | |||||||
| 2023 | 19 | 14,041 | 8.5% | 622 | 7.4% | |||||||
| 2024 | 17 | 3,432 | 2.1% | 239 | 2.8% | |||||||
| Thereafter | 18 | 7,122 | 4.3% | 413 | 4.9% | |||||||
| Total | 610 | $ 164,752 | 100.0% | $ 8,450 | 100.0% | |||||||
| (1) | Annualized base rent represents the annualized monthly base rent of leases in place as of December 31, 2014. |
| (2) | Represents the number of leases expiring and annualized base rent for the remainder of 2015. Includes leases that are on a month-to-month basis at annualized amounts. |
Our properties are generally leased to tenants for the longer term and as of December 31, 2014, the pro forma weighted-average remaining term of our leases was approximately 6.6 years, based on contractual remaining base rent, and 4.7 years, based on leased square footage.
Tenant and Industry Concentration
The following pro forma table describes our top ten tenants and their industry sectors, absent tenants of the properties included in the Portfolio and Park Place, and including tenants of Rialto, as of December 31, 2014 (dollar and square footage amounts in thousands).
| Tenant | Locations | Industry Sector |
Annualized Rental Revenue (1) |
% of Total Annualized Rental Revenue |
Square Feet |
% of Occupied Square Feet | |||||||
| 1 | Charles Schwab & Co, Inc | 1 | Securities, Commodities, Fin. Inv./Rel. Activities | $ 22,992 | 14.0% | 594 | 7.0% | ||||||
| 2 | Sybase | 1 | Publishing Information (except Internet) | 17,971 | 10.9% | 405 | 4.8% | ||||||
| 3 | Northrop Grumman | 1 | Professional, Scientific and Technical Services | 15,585 | 9.5% | 575 | 6.8% | ||||||
| 4 | Stop & Shop | 16 | Food and Beverage Stores | 14,885 | 8.9% | 933 | 11.0% | ||||||
| 5 | Novo Nordisk | 1 | Chemical Manufacturing | 4,444 | 2.7% | 167 | 2.0% | ||||||
| 6 | Seton Health Care | 1 | Hospitals | 4,339 | 2.6% | 156 | 1.8% | ||||||
| 7 | Shaw's Supermarket | 4 | Food and Beverage Stores | 3,872 | 2.4% | 240 | 2.8% | ||||||
| 8 | I.A.M. National Pension Fund | 1 | Funds, Trusts and Other Financial Vehicles | 3,062 | 1.9% | 63 | 0.8% | ||||||
| 9 | Home Depot | 1 | Building Material and Garden Equipment and Supplies Dealers | 2,469 | 1.5% | 102 | 1.2% | ||||||
| 10 | Alliant Techsystems INC. | 1 | Computer and Electronic Product Manufacturing | 2,363 | 1.4% | 107 | 1.3% | ||||||
| Total | 28 | $ 91,982 | 55.8% | 3,342 | 39.5% |
| (1) | Annualized base rent represents the annualized monthly base rent of leases in place as of December 31, 2014. |
The following pro forma table describes our top ten industry sectors, absent the properties included in the Portfolio and Park Place, and including Rialto, as of December 31, 2014 (dollar and square footage amounts in thousands).
| Industry Sector | Number of Leases | Annualized Base Rent (1) | % of Annualized Base Rent | Occupied Square Feet | % of Occupied Square Feet | |||||
| Professional, Scientific and Technical Services | 96 | $ 28,178 | 17.1% | 1,244 | 14.7% | |||||
| Securities, Commodities, Fin. Inv./Rel. Activities | 28 | 25,325 | 15.4% | 676 | 8.0% | |||||
| Food and Beverage Stores | 36 | 22,526 | 13.7% | 1,509 | 17.9% | |||||
| Publishing Information (except Internet) | 3 | 18,173 | 11.0% | 410 | 4.9% | |||||
| Clothing and Clothing Accessories Stores | 26 | 5,405 | 3.3% | 454 | 5.4% | |||||
| Computer and Electronic Product Manufacturing | 7 | 5,354 | 3.2% | 362 | 4.3% | |||||
| Chemical Manufacturing | 3 | 5,296 | 3.2% | 461 | 5.5% | |||||
| Credit Intermediation and Related Activities | 41 | 4,565 | 2.8% | 150 | 1.8% | |||||
| Hospitals | 1 | 4,339 | 2.6% | 156 | 1.8% | |||||
| Food Services and Drinking Places | 52 | 3,976 | 2.4% | 151 | 1.8% | |||||
| All Others | 317 | 41,615 | 25.3% | 2,877 | 34.0% | |||||
| Total | 610 | $ 164,752 | 100.0% | 8,450 | 100.0% |
| (1) | Annualized base rent represents the annualized monthly base rent of leases in place as of December 31, 2014. |
| Item 9.01 | Financial Statements and Exhibits |
| (a) | Pro Forma Financial Information | |||
| Summary of Unaudited Pro Forma Financial Statement | F-1 | |||
| Unaudited Pro Forma Condensed Consolidated Balance Sheet as of December 31, 2014 | F-2 | |||
| Unaudited Pro Forma Condensed Consolidated Statement of Operations for the year ended December 31, 2014 | F-3 | |||
SIGNATURES
Pursuant to the requirements of the Securities Exchange Act of 1934, the Company has duly caused this report to be signed on its behalf by the undersigned thereunto duly authorized.
| Dividend Capital Diversified Property Fund Inc. | ||||
| March 12, 2015 | ||||
| By: |
/S/ M. KIRK SCOTT | |||
| M. Kirk Scott | ||||
| Chief Financial Officer | ||||
DIVIDEND CAPITAL DIVERSIFIED PROPERTY FUND INC.
SUMMARY OF UNAUDITED PRO FORMA FINANCIAL STATEMENTS
As used herein, “the Company,” “we,” “our” and “us” refer to Dividend Capital Diversified Property Fund Inc. and its consolidated subsidiaries except where the context otherwise requires. The following unaudited pro forma information should be read in conjunction with the condensed consolidated balance sheets of Dividend Capital Diversified Property Fund Inc. as of December 31, 2014, the related condensed consolidated statements of operations, condensed consolidated statements of income and loss, condensed consolidated statement of equity, and condensed consolidated statements of cash flows for the year ended December 31, 2014 and the notes thereto. Our consolidated financial statements as of and for the year ended December 31, 2014 have been included in our prior filings with the SEC.
The following unaudited pro forma balance sheet as of December 31, 2014 has been prepared to give effect to the disposition of certain assets and liabilities with respect to a portfolio of twelve wholly owned office and industrial properties comprising approximately 2.7 million net rentable square feet (the “Portfolio”) on March 11, 2015, as if the disposition occurred on December 31, 2014.
The following unaudited pro forma statements of operations for the year ended December 31, 2014 have been prepared to give effect to the disposition of the Portfolio on March 11, 2015, as if the disposition occurred on January 1, 2014, and do not include any related gain or loss on the disposition of the Portfolio.
These unaudited pro forma financial statements are prepared for informational purposes only and are not necessarily indicative of future results or of actual results that would have been achieved had the disposition of the Portfolio been consummated as of the dates indicated.
| F-1 |
DIVIDEND CAPITAL DIVERSIFIED PROPERTY FUND INC.
UNAUDITED PRO FORMA CONDENSED CONSOLIDATED BALANCE SHEET
As of December 31, 2014
(in thousands, except share and per share amounts)
| Pro Forma adjustments | ||||||||||||
| DPF Historical (a) | Portfolio
disposition (b) | Pro Forma Total | ||||||||||
| ASSETS | ||||||||||||
| Investments in real property | $ | 2,442,509 | $ | (379,886 | ) | $ | 2,062,623 | |||||
| Accumulated depreciation and amortization | (513,083 | ) | 78,874 | (434,209 | ) | |||||||
| Total net investments in real property | 1,929,426 | (301,012 | ) | 1,628,414 | ||||||||
| Debt related investments, net | 94,951 | — | 94,951 | |||||||||
| Total net investments | 2,024,377 | (301,012 | ) | 1,723,365 | ||||||||
| Cash and cash equivalents | 14,461 | 208,241 | (c) | 222,702 | ||||||||
| Restricted cash | 27,452 | (6,219 | ) | 21,233 | ||||||||
| Other assets, net | 59,916 | (14,271 | ) | 45,645 | ||||||||
| Assets held for sale | 21,927 | — | 21,927 | |||||||||
| Total Assets | $ | 2,148,133 | $ | (113,261 | ) | $ | 2,034,872 | |||||
| LIABILITIES AND EQUITY | ||||||||||||
| Liabilities: | ||||||||||||
| Accounts payable and accrued expenses | $ | 49,974 | $ | (2,560 | ) | $ | 47,414 | |||||
| Mortgage notes and other secured borrowings | 853,267 | (173,304 | )(d) | 679,963 | ||||||||
| Unsecured borrowings | 345,000 | — | 345,000 | |||||||||
| Intangible lease liabilities, net | 86,243 | (32,337 | ) | 53,906 | ||||||||
| Other liabilities | 47,789 | (3,806 | ) | 43,983 | ||||||||
| Liabilities associated with assets held for sale | 1,880 | — | 1,880 | |||||||||
| Total Liabilities | 1,384,153 | (212,007 | ) | 1,172,146 | ||||||||
| Equity: | ||||||||||||
| Stockholders’ equity: | ||||||||||||
| Common stock, $0.01 par value; 1,000,000,000 shares authorized; 178,399,679 shares issued and outstanding, as of December 31, 2014 | 1,784 | — | 1,784 | |||||||||
| Additional paid-in capital | 1,586,444 | — | 1,586,444 | |||||||||
| Distributions in excess of earnings | (893,791 | ) | 98,746 | (e) | (795,045 | ) | ||||||
| Accumulated other comprehensive loss | (10,120 | ) | — | (10,120 | ) | |||||||
| Total stockholders’ equity | 684,317 | 98,746 | 783,063 | |||||||||
| Noncontrolling interests | 79,663 | — | 79,663 | |||||||||
| Total Equity | 763,980 | 98,746 | 862,726 | |||||||||
| Total Liabilities and Equity | $ | 2,148,133 | $ | (113,261 | ) | $ | 2,034,872 | |||||
| (a) | Historical financial information derived from our Annual Report on Form 10-K as of December 31, 2014. |
| (b) | Represents adjustments to reflect the disposition of the Portfolio. The sale price of the Portfolio was $398.6 million, excluding closing costs. |
| (c) | Represents the amount of proceeds from the Portfolio disposition after the assumption and defeasance of $173.3 million of debt outstanding due under the related mortgage loan (the “Portfolio Loan”), closing costs and fees of approximately $8.5 million, and costs related to our defeasance of the Portfolio Loan of $8.6 million. See note (d) below. |
| (d) | Represents the assumption of the outstanding debt due under the Portfolio Loan and associated partial defeasance. As of December 31, 2014, the outstanding principal balance of the Portfolio Loan was $173.3 million. |
| (e) | Represents the estimated gain on the disposition of the Portfolio. Actual results will differ from this estimate based on final transaction costs. |
| F-2 |
DIVIDEND CAPITAL DIVERSIFIED PROPERTY FUND INC.
UNAUDITED PRO FORMA CONDENSED CONSOLIDATED STATEMENTS OF OPERATIONS
(For the year ended December 31, 2014)
(In thousands, except per share and footnoted information)
| Pro Forma Adjustments | ||||||||||||||||
| DPF Historical (a) | Portfolio (b) | Pro Forma Adjustments (c) | Pro Forma Results | |||||||||||||
| REVENUE: | ||||||||||||||||
| Rental revenue | $ | 224,201 | $ | (33,701 | ) | $ | — | $ | 190,500 | |||||||
| Debt related income | 7,396 | — | — | 7,396 | ||||||||||||
| Total Revenue | 231,597 | (33,701 | ) | — | 197,896 | |||||||||||
| EXPENSES: | ||||||||||||||||
| Rental expense | 50,997 | (588 | ) | — | 50,409 | |||||||||||
| Real estate depreciation and amortization expense | 88,994 | (14,341 | ) | — | 74,653 | |||||||||||
| General and administrative expenses | 11,610 | — | — | 11,610 | ||||||||||||
| Advisory fees, related party | 15,919 | — | — | 15,919 | ||||||||||||
| Acquisition-related expenses | 703 | — | — | 703 | ||||||||||||
| Impairment of real estate property | 9,500 | — | — | 9,500 | ||||||||||||
| Total Operating Expenses | 177,723 | (14,929 | ) | — | 162,794 | |||||||||||
| Other Income (Expenses): | ||||||||||||||||
| Interest and other income (expense) | 1,168 | 97 | — | 1,265 | ||||||||||||
| Interest expense | (61,903 | ) | 8,235 | 1,948 | (51,720 | ) | ||||||||||
| Loss on extinguishment of debt and financing commitments | (63 | ) | — | — | (63 | ) | ||||||||||
| Gain on sale of real property | 10,914 | — | — | 10,914 | ||||||||||||
| Income (loss) from continuing operations | 3,990 | (10,440 | ) | 1,948 | (4,502 | ) | ||||||||||
| Net (income) loss from continuing operations attributable to noncontrolling interests | (340 | ) | 695 | (130 | ) | 225 | ||||||||||
| NET INCOME (LOSS) FROM CONTINUING OPERATIONS ATTRIBUTABLE TO COMMON STOCKHOLDERS | $ | 3,650 | $ | (9,745 | ) | $ | 1,818 | $ | (4,277 | ) | ||||||
| NET INCOME (LOSS) FROM CONTINUING OPERATIONS PER BASIC AND DILUTED COMMON SHARE | $ | 0.02 | $ | (0.02 | ) | |||||||||||
| WEIGHTED AVERAGE NUMBER OF COMMON SHARES OUTSTANDING | ||||||||||||||||
| Basic | 178,273 | 178,273 | ||||||||||||||
| Diluted | 190,991 | 190,991 | ||||||||||||||
| (a) | Historical financial information derived from our Annual Report on Form 10-K as of December 31, 2014. |
| (b) | Amounts represent the historical operations of the Portfolio as reflected in our historical statement of operations for the year ended December 31, 2014. |
| (c) | Amounts represent historical interest payments made related to the portion of the Portfolio Loan that was not assumed by the buyer that was associated with a defeasance in connection with the disposition of the Portfolio. |
| F-3 |