Attached files
| file | filename |
|---|---|
| EX-21.1 - LIST OF SUBSIDIARIES OF THE REGISTRANT - Arista Networks, Inc. | ex211listofsubsidiaries.htm |
| EX-10.5 - 2014 EMPLOYEE STOCK PURCHASE PLAN - Arista Networks, Inc. | ex1052014employeestockpurc.htm |
| EX-31.1 - CERTIFICATION OF CEO PURSUANT TO EXCHANGE ACT RULES 13A-14(A) AND 15D-14(A) - Arista Networks, Inc. | ex311ceocertificationq42014.htm |
| EXCEL - IDEA: XBRL DOCUMENT - Arista Networks, Inc. | Financial_Report.xls |
| EX-31.2 - CERTIFICATION OF CFO PURSUANT TO EXCHANGE ACT RULES 13A-14(A) AND 15D-14(A) - Arista Networks, Inc. | ex312cfocertificationq42014.htm |
| EX-23.1 - CONSENT OF ERNST & YOUNG LLP, INDEPENDENT REGISTERED PUBLIC ACCOUNTING FIRM - Arista Networks, Inc. | ex231independentauditorcon.htm |
| EX-32.1 - CERTIFICATIONS OF CEO AND CFO PURSUANT TO 18 U.S.C. SECTION 1350 - Arista Networks, Inc. | ex321ceoandcfo906certifica.htm |
UNITED STATES
SECURITIES AND EXCHANGE COMMISSION
Washington, D.C. 20549
___________________________________________
FORM 10-K
___________________________________________
(Mark One)
ý | ANNUAL REPORT PURSUANT TO SECTION 13 OR 15(d) OF THE SECURITIES EXCHANGE ACT OF 1934 |
For the fiscal year ended December 31, 2014
Or
o | TRANSITION REPORT PURSUANT TO SECTION 13 OR 15(d) OF THE SECURITIES EXCHANGE ACT OF 1934 |
For the transition period from to
Commission file number: 001-36468
___________________________________________
ARISTA NETWORKS, INC.
(Exact name of registrant as specified in its charter)
___________________________________________
Delaware | 20-1751121 | |
(State or other jurisdiction of incorporation or organization) | (I.R.S. Employer Identification Number) | |
5453 Great America Parkway
Santa Clara, California 95054
(Address of principal executive offices)
(408) 547-5500
(Registrant’s telephone number, including area code)
Securities registered pursuant to Section 12(b) of the Act:
___________________________________________
Title of each class | Name of each exchange on which registered | |
Common Stock, $0.0001 par value | New York Stock Exchange | |
Securities registered pursuant to Section 12(g) of the Act: None
Indicate by check mark if the registrant is a well-known seasoned issuer, as defined in Rule 405 of the Securities Act. Yes o No ý
Indicate by check mark if the registrant is not required to file reports pursuant to Section 13 or Section 15(d) of the Exchange Act. Yes o No ý
Indicate by check mark whether the registrant (1) has filed all reports required to be filed by Section 13 or 15(d) of the Securities Exchange Act of 1934 during the preceding 12 months (or for such shorter period that the registrant was required to file such reports), and (2) has been subject to such filing requirements for the past 90 days. Yes ý No o
Indicate by check mark whether the registrant has submitted electronically and posted on its corporate Web site, if any, every Interactive Data File required to be submitted and posted pursuant to Rule 405 of Regulation S-T (§232.405 of this chapter) during the preceding 12 months (or for such shorter period that the registrant was required to submit and post such files). Yes ý No o
Indicate by check mark if disclosure of delinquent filers pursuant to Item 405 of Regulation S-K is not contained herein, and will not be contained, to the best of registrant’s knowledge, in definitive proxy or information statements incorporated by reference in Part III of this Form 10-K or any amendment to this Form 10-K. ý
Indicate by check mark whether the registrant is a large accelerated filer, an accelerated filer, a non-accelerated filer, or a smaller reporting company. See definitions of “large accelerated filer,” “accelerated filer,” and “smaller reporting company” in Rule 12b-2 of the Exchange Act. (Check one):
Large accelerated filer o | Accelerated filer o | |
Non-accelerated filer x | (Do not check if a smaller reporting company) | Smaller reporting company o |
Indicate by check mark whether the registrant is a shell company (as defined in Rule 12b-2 of the Exchange Act). Yes o No ý
The aggregate market value of the registrant’s common stock held by non-affiliates of the registrant was $1,702,757,925 as of June 30, 2014 based on the closing sale price of the registrant’s common stock on the New York Stock Exchange on such date. Shares held by persons who may be deemed affiliates have been excluded. This determination of affiliate status is not necessarily a conclusive determination for other purposes.
On March 6, 2015, 66,244,550 shares of the registrant’s common stock were outstanding. Portions of the registrant’s definitive Proxy Statement relating to its 2015 Annual Stockholders’ Meeting to be filed pursuant to Regulation 14A within 120 days after the registrant’s fiscal year end of December 31, 2014 are incorporated by reference into Part III of this Annual Report on Form 10-K.
ARISTA NETWORKS, INC.
TABLE OF CONTENTS
Page | ||
Item 1. | ||
Item 1A. | ||
Item 1B. | ||
Item 2. | ||
Item 3. | ||
Item 4. | ||
Item 5. | ||
Item 6. | ||
Item 7. | ||
Item 7A. | ||
Item 8. | ||
Item 9. | ||
Item 9A. | ||
Item 9B. | ||
Item 10. | ||
Item 11. | ||
Item 12. | ||
Item 13. | ||
Item 14. | ||
Item 15. | ||
PART I
FORWARD-LOOKING INFORMATION
SPECIAL NOTE REGARDING FORWARD-LOOKING STATEMENTS
This Annual Report on Form 10-K, including the sections entitled “Business,” “Risk Factors,” “Use of Proceeds,” and “Management’s Discussion and Analysis of Financial Condition and Results of Operations,” contains forward-looking statements within the meaning of Section 27A of the Securities Act of 1933, as amended, as Section 21E of the Securities Exchange Act of 1934, as amended, which statements involve substantial risks and uncertainties. The words “believe,” “may,” “will,” “potentially,” “estimate,” “continue,” “anticipate,” “intend,” “could,” “would,” “project,” “plan,” “predict,” “expect” and similar expressions that convey uncertainty of future events or outcomes are intended to identify forward-looking statements.
These forward-looking statements include, but are not limited to, statements concerning the following:
• | our ability to maintain an adequate rate of revenue growth and our future financial performance, including our expectations regarding our cost of revenue, gross profit or gross margin and operating expenses; |
• | our belief that the cloud networking market is still in the early stages of adoption and has a significant potential opportunity for growth; |
• | our business plan and our ability to effectively manage our growth, including the reporting requirements and compliance obligations of a public company; |
• | costs associated with defending intellectual property infringement and other claims and the potential outcomes of such disputes, such as those claims discussed in “Legal Proceedings;” |
• | our ability to satisfy the requirements for cloud networking solutions and to successfully anticipate technological shifts and market needs, innovate new products and bring them to market in a timely manner; |
• | the budgeting cycles and purchasing practices of end customers, including large end customers who may receive lower pricing terms due to volume discounts; |
• | the deferral or cancellation of orders by end customers, warranty returns or delays in acceptance of our products; |
• | our ability to attract and retain end customers; |
• | our ability to further penetrate our existing customer base and sell more complex and higher-performance configurations of our products; |
• | our ability to displace existing products in established markets; |
• | our belief that increasing channel leverage will extend and improve our engagement with a broad set of customers; |
• | our ability to expand our leadership position in the network switch industry, including the areas of mobility, virtualization, cloud computing and cloud networks; |
• | our ability to timely and effectively scale and adapt our existing technology; |
• | the benefits realized by our customers in their use of our products and services including lower total cost of ownership; |
• | our ability to expand our business domestically and internationally; |
• | the effects of increased competition in our market and our ability to compete effectively; |
• | the effects of seasonal and cyclical trends on our results of operations; |
• | our expectations concerning relationships with third parties; |
• | the attraction and retention of qualified employees and key personnel; |
• | our ability to maintain, protect and enhance our brand and intellectual property; |
• | economic and industry trends; |
• | estimates and estimate methodologies used in preparing our financial statements and determining option exercise prices; |
• | future trading prices of our common stock; |
• | our belief that we have adequately reserved for uncertain tax positions; |
• | our belief that our existing cash and cash equivalents together with cash flow from operations will be sufficient to meet our working capital requirements and our growth strategies for the foreseeable future; and |
• | future acquisitions of or investments in complementary companies, products, services or technologies; |
3
These forward-looking statements are subject to a number of risks, uncertainties and assumptions, including those described in the section titled “Risk Factors” and elsewhere in this Annual Report on Form 10-K. Moreover, we operate in a very competitive and rapidly changing environment, and new risks emerge from time to time. It is not possible for our management to predict all risks, nor can we assess the impact of all factors on our business or the extent to which any factor, or combination of factors, may cause actual results to differ materially from those contained in any forward-looking statements we may make. In light of these risks, uncertainties and assumptions, the forward-looking events and circumstances discussed in this Annual Report on Form 10-K may not occur and actual results could differ materially and adversely from those anticipated or implied in the forward-looking statements. You should not rely upon forward-looking statements as predictions of future events.
The forward-looking statements made in this Annual Report on Form 10-K relate only to events as of the date on which the statements are made. We undertake no obligation to update any forward-looking statements made in this Annual Report on Form 10-K to reflect events or circumstances after the date of this Annual Report on Form 10-K or to reflect new information or the occurrence of unanticipated events, except as required by law. We may not actually achieve the plans, intentions or expectations disclosed in our forward-looking statements and you should not place undue reliance on our forward-looking statements. Our forward-looking statements do not reflect the potential impact of any future acquisitions, mergers, dispositions, joint ventures or investments we may make.
Item 1. Business
We are a leading supplier of cloud networking solutions that use software innovations to address the needs of large-scale Internet companies, cloud service providers and next-generation data centers for enterprises, based on market share. Our cloud networking solutions consist of our Extensible Operating System, or EOS, a set of network applications and our 10/40/100 Gigabit Ethernet switches. Our cloud networking solutions deliver industry-leading performance, scalability, availability, programmability, automation and visibility. Since we began shipping our products, we have grown rapidly, and, according to Crehan Research, we have achieved the second largest market share in data center 10/40/100 Gigabit Ethernet switch ports, excluding blade switching, sold in 2014.
At the core of our cloud networking platform is EOS, which was purpose-built to be fully programmable and highly modular. The programmability of EOS has allowed us to create a set of software applications that address the requirements of cloud networking, including workflow automation, network visibility and analytics, and has also allowed us to rapidly integrate with a wide range of third-party applications for virtualization, management, automation, orchestration and network services.
EOS supports leading cloud and virtualization solutions, including VMware NSX, Microsoft System Center, OpenStack and other cloud management frameworks. We have worked with industry leaders to define new open protocols for the virtualized data center. We co-authored the VXLAN protocol specification with VMware and were the first to demonstrate VXLAN integration. We also co-authored the NVGRE protocol specification with Microsoft and support integration with Microsoft’s System Center.
We use standard Linux as our underlying operating system, providing customers with access to all Linux operating system facilities. This allows customers to extend our EOS software with off-the-shelf Linux applications and a growing number of open source management tools.
EOS has a highly modular architecture, which allows us to prevent network outages in deployments of our cloud networking solutions. This architecture also allows us to rapidly develop new features and protocols without compromising the quality of the existing code base. Because all of our switching products are powered by the same binary image of EOS, we are able to deliver these new innovations to our entire installed base with minimal disruption.
In 2014, we introduced EOS+, a software platform for network programmability and automation, provides an advanced level of programmability, allowing customers to take advantage of pre-built and custom EOS applications as well as integration with a wide range of technology partner solutions.
During the second half of fiscal 2014, the 25 Gigabit Ethernet Consortium was formed by leading cloud networking technology providers for the purpose of supporting an industry-standard and interoperable Ethernet specifications that increase the performance and reduce the interconnect cost per Gbps between the server Network Interface Controller (NIC) and Top-of-Rack (ToR) switch. This new specification will enable the cost-efficient scaling of network bandwidth to 25 or 50 Gbps delivered to server and storage endpoints in next-generation cloud infrastructure, where workloads are expected to surpass the capacity of 10 or 40 Gbps Ethernet links deployed today. The new specification is being made available royalty-free by the Consortium members to any data center ecosystem vendor or consumer who joins the Consortium.
We sell our products through both our direct sales force and our channel partners. Since shipping our first products in 2008, our cumulative end-customer base has grown rapidly. Between December 31, 2010 and December 31, 2014, our cumulative end-customer base grew from approximately 570 to approximately 3,000. Our end customers span a range of industries and include large Internet companies, service providers, financial services organizations, government agencies, media and entertainment companies and others. Our customers include six of the largest cloud services providers based on annual revenue.
We have experienced rapid revenue growth over the last several years, increasing our revenue at a compound annual growth rate of 68.9% from 2010 to 2014. For 2010, 2011, 2012, 2013 and 2014, our revenue was $71.7 million, $139.8 million, $193.4 million,
4
$361.2 million and $584.1 million, respectively. Our 2014 revenue grew 61.7% when compared to 2013. For 2010, 2011, 2012, 2013 and 2014, our net income was $2.4 million, $34.0 million, $21.3 million, $42.5 million and $86.9 million, respectively.
We were incorporated in the State of California as Arastra, Inc. in October 2004. We reincorporated in the State of Nevada in March 2008, and we changed our name to Arista Networks, Inc. in October 2008. We reincorporated in the State of Delaware in March 2014. Our principal executive offices are located at 5453 Great America Parkway, Santa Clara, California 95054. Our main telephone number is (408) 547-5500. Our website address is www.arista.com. Information contained on, or that can be accessed through, our website is not incorporated by reference into this report, and you should not consider information on our website to be part of this report.
Industry Background
Cloud computing is fundamentally changing the way IT infrastructure is built and how applications are delivered. In cloud computing, applications are distributed across thousands of servers. These servers are connected with high-speed network switches that, together, form a pool of resources that allows applications to be rapidly deployed and cost-effectively updated. Cloud computing enables ubiquitous and on-demand network access to these applications from Internet-connected devices including personal computers, tablets and smartphones.
Nearly all consumer applications today are delivered as cloud services. Enterprise applications are rapidly moving to the cloud as well, since cloud services are easier and more cost effective to deploy, scale and operate than traditional applications. Internet leaders like Amazon, eBay, Facebook, Google, Microsoft and Yahoo! pioneered the development of large-scale cloud data centers in order to meet the growing demands of their users, including business customers. Enterprises and service providers around the world are adopting cloud computing technologies in order to achieve similar performance improvements and cost reductions.
The aggregate network bandwidth in the cloud can be orders of magnitude higher than typical legacy data center networks. Therefore, the networks in such cloud environments must be architected and built in a new way. We refer to these next-generation data center networks as cloud networks. Cloud networks must deliver high capacity, high availability and predictable performance and must be programmable to allow integration with third-party applications for network, management, automation, orchestration and network services.
Limitations of Traditional Data Center Networks
In our view, cloud networks and legacy networks are fundamentally different. In a traditional data center, specific applications are installed on a small number of servers, and most network traffic is server-to-client, or “north-south” traffic, which results in perhaps a few terabits/second of aggregate network bandwidth. In the cloud, most network traffic is server-to-server, or “east-west” traffic. The aggregate network bandwidth in the cloud can exceed 1 petabit/second, orders of magnitude higher than that of typical legacy data center networks.
The much larger scale of cloud networks requires much higher network availability since network outages in the cloud are very expensive in terms of customer impact. Traditional network switches have evolved, and the features and capabilities of their operating system have expanded over many years without addressing the structural deficiencies of their underlying software architectures, making it difficult to achieve high network switch reliability.
Some networking vendors have built products that use proprietary protocols to address the scaling needs of next-generation data centers. However, proprietary protocols are generally not acceptable to Internet companies or cloud service providers because they create vendor lock-in.
Legacy networks are not programmable and, as a result, are extremely difficult to integrate with third-party applications for network management, automation, orchestration and network services. This lack of integration forces customers to continue to rely on time consuming, error-prone manual processes that may be cost-prohibitive.
Requirements for Cloud Networking
Cloud networks differ in many aspects from legacy networks, including capacity, performance, scale, availability, programmability, automation, visibility and cost performance. The requirements for cloud networking include the following:
• | Capacity, Performance and Scalability. Cloud networks must have sufficient capacity to interconnect large numbers of servers, up to hundreds of thousands, with predictable network bandwidth. |
• | High Availability. Cloud networks must overcome hardware and software failures for customers in order to avoid network outages that can result in lost revenue, dissatisfied customers and increased operational cost. |
• | Open and Programmable. Cloud networks must be based on open protocols and be programmable to enable integration with leading network applications and management and data analysis tools. |
• | Workflow Automation. Cloud networks must offer automated provisioning and configuration to enable fast service delivery and to minimize operational costs, avoiding time-consuming and error-prone manual processes for configuring, provisioning, monitoring and managing the network. |
• | Network Visibility. Cloud networks must provide IT administrators with real-time in-depth visibility of network status to proactively monitor, detect and notify when issues arise. |
5
• | Cost Performance. Cloud networks must deliver high performance while lowering overall cost of ownership, including capital and operational costs. |
Our Cloud Networking Solutions
We are a leading supplier of cloud networking solutions that use software innovations to address the needs of large-scale Internet companies, cloud service providers and next-generation enterprise data centers. Our cloud networking platform was purpose-built to address the functional and performance requirements for cloud networks. We deliver our solutions via our industry-leading 10/40/100 Gigabit Ethernet switches optimized for next-generation data center networks.
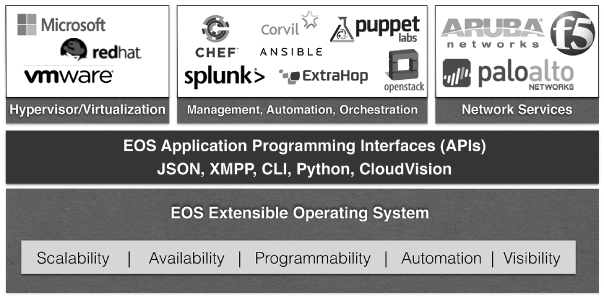
Our cloud networking solutions consist of EOS, our Extensible Operating System, a set of networking applications and our 10/40/100 Gigabit Ethernet switches. At the core of our cloud networking platform is EOS. EOS was architected to be fully programmable and highly modular.
As illustrated below, the programmability of EOS has allowed us to create a set of software applications and application programming interfaces, or APIs, that address the requirements of cloud networking, including workflow automation, network visibility and analytics, and has further allowed us to integrate rapidly with a wide range of third-party applications for virtualization, management, automation, orchestration and network services.
The key benefits of our cloud networking solutions are as follows:
Capacity, Performance and Scalability
Our cloud networking platform enables data center networks to scale to hundreds of thousands of physical servers and millions of virtual machines with the least number of switching tiers. We achieve this by leveraging standard protocols to meet the scale requirements of cloud computing. We have used active-active Layer 2 and Layer 3 network topologies to enable customers to build extremely large and resilient networks.
High Availability
Our highly modular EOS software architecture was designed to be fault-isolating and self-healing in order to deliver higher stability compared to legacy network operating systems. In addition, our customers can non-disruptively upgrade our switches running in the network using our Smart System Upgrade, or SSU, application.
Open and Programmable
Our EOS software was purpose-built to offer programmable interfaces throughout all levels of our software. This has allowed us to integrate our cloud networking platform with a wide range of leading third-party applications. For example, we support VMware NSX, OpenStack and Microsoft System Center for orchestration and fast provisioning, enabling true workload mobility and automatic provisioning of physical switches. We enable customers, through application programming interfaces, to write their own scripts to customize and optimize their networks. In addition, we support a wide range of software-defined network controllers via our OpenFlow and DirectFlow interfaces.
Workflow Automation
Our EOS software enables enterprises to provision networking resources in minutes with no manual intervention through our Zero Touch Provisioning. We also natively support Ansible, CFEngine, Chef, Puppet, virtual network orchestration applications and third-party management tools. Finally, EOS embraces the DevOps model, which is a software development method that combines development and operations, to provision and monitor servers, storage and network resources in a unified fashion.
6
Network Visibility
Our EOS software provides a set of tools and applications that proactively monitor, detect and notify network managers when network issues arise, delivering real-time data to third-party management applications including Corvil, ExtraHop, Riverbed and Splunk to provide detailed application visibility. Our telemetry applications include VM Tracer, which provides visibility down to the virtual machine level, Path Tracer, which detects errors in provisioned network paths, MapReduce Tracer, which monitors and optimizes the performance of Hadoop workloads, and Health Tracer, which monitors infrastructure resiliency. Our network visibility applications provide real-time insight into the status of the network. They include LANZ, which monitors latency, and DANZ, which provides advanced traffic monitoring with flow analysis and timestamps, plus the ability to perform tap aggregation for reporting and analysis.
Lower Total Cost of Ownership
Our cloud networking platform offers architectural and system advantages that provide our customers with cost-effective and highly available cloud networking solutions. Our programmable, scalable leaf-spine architectures, combined with industry-leading applications, significantly reduce networking costs when compared to legacy network designs, enabling faster time to service and improved availability. Our automation tools reduce the operational costs of provisioning, managing and monitoring a data center network and speed up service delivery. Our visibility tools provide high levels of visibility into complex network environments without the need for additional data collection equipment. As a result, fewer network engineers are needed to operate large networks.
Our Market Opportunity
We compete primarily in the data center switching market for 10 Gigabit Ethernet and above, excluding blade switches.
We believe that cloud computing represents a fundamental shift from traditional legacy data centers and that cloud networking is the fastest growing segment within the data center switching market. As organizations of all sizes are adopting cloud architectures, spending on cloud and next-generation data centers has increased rapidly over the last several years, while traditional legacy IT spending has been growing more slowly.
Our Customers
As of December 31, 2014, we had delivered our cloud networking solutions to approximately 3,000 end customers worldwide in over 70 countries. Our end customers span a range of industries and include large Internet companies, service providers, financial services organizations, government agencies, media and entertainment companies and others. Our customers include six of the largest cloud service providers based on annual revenue, including eBay, Facebook, Microsoft and Yahoo!, financial services organizations such as Barclays, Citigroup, and Morgan Stanley, and a number of media and service providers, including AOL, Comcast, Equinix, ESPN, Netflix, and Rackspace. For each of the years ended December 31, 2014, 2013 and 2012, Microsoft purchases, through our channel partner World Wide Technology, Inc., accounted for more than 10% of our total revenue.
Our Competitive Strengths
We believe the following strengths will allow us to maintain and extend our technology leadership position in cloud networking and next-generation data center Ethernet switching:
• | Purpose-Built Cloud Networking Platform. We have developed a highly scalable cloud networking platform that uses software to address the needs of large-scale Internet companies, cloud service providers, financial services organizations, government agencies and media and entertainment companies, including virtualization, big data and low-latency applications. As a result, our cloud networking platform does not have the inherent limitations of legacy network architectures. |
• | Broad and Differentiated Switch Portfolio. Using multiple silicon architectures, we deliver switches with industry-leading capacity, low latency, port density and power efficiency and have innovated in areas such as deep packet buffers, embedded optics and reversible cooling. Our broad switching portfolio has allowed us to offer customers products that best match their specific requirements. |
• | Single Binary Image Software. The single binary image of EOS software allows us to maintain feature consistency across our entire product portfolio and enables us to introduce new software innovations into the market that become available to our entire installed base without a “forklift upgrade” (i.e., a broad upgrade of the data center infrastructure). |
• | Rapid Development of New Features and Applications. Our highly modular EOS software has allowed us to rapidly deliver new features and applications while preserving the structural integrity and quality of our network operating system. We believe our ability to deliver new features and capabilities more quickly than possible with legacy switch operating systems provides us with a strategic advantage given that the requirements in cloud and next-generation data center networking continue to evolve rapidly. |
• | Deep Understanding of Customer Requirements. We have developed close working relationships with many of our largest customers that provide us with insights about their needs and future requirements. This has allowed us develop and deliver products to market that meet customer demands and expectations as well as to rapidly grow sales to existing customers. |
• | Strong Management and Engineering Team with Significant Data Center Networking Expertise. Our management and engineering team consists of networking veterans with extensive data center networking expertise. Our President and Chief Executive Officer, Jayshree Ullal, previously served as SVP and general manager of Cisco’s Data Center Business. Andy Bechtolsheim, our founder and Chief Development Officer, was previously a founder and chief system architect at Sun |
7
Microsystems and from 1996 to 2003 served as VP/GM of the Gigabit Systems Business Unit at Cisco. Kenneth Duda, our founder, Chief Technology Officer and SVP Software Engineering, led the software development effort of the Gigabit Systems Business Unit at Cisco from 1996 to 2000.
• | Significant Technology Lead. We believe that our networking technology represents a fundamental advance in networking software. Our EOS software is the result of more than 1,000 man-years of research and development investment over a ten-year period. |
Our Growth Strategy
We intend to grow our revenue and market share in cloud and next-generation data center Ethernet switching. Key elements of our growth strategy include:
• | Continue to Innovate and Extend our Technology Leadership. We plan to increase our investment in research and development to expand and enhance the features and capabilities of our cloud networking solutions, including our EOS software and our switching products. We believe that continued software and hardware innovation is critical to addressing the complex and changing requirements of cloud networks and that our approach will enable us to continue to innovate rapidly and bring new offerings to market. |
• | Expand our Sales Organization and our Channel Partners. We intend to continue to invest in our sales organization around the globe as we pursue relationships with new large enterprise, service provider and government customers that are deploying data centers. We believe our channel partner network serves a critical role in growing our sales, and we intend to continue to expand our channel partner network and enhance our sales efficiency through sales and support training. We designed our Arista Partner Program, targeted at resellers and systems integrators, to engage partners who provide value-added services and extend our reach into the marketplace. As of December 31, 2014, we had over 800 channel partners worldwide. |
• | Increase Penetration with our Existing Customer Base. Our customers often deploy our products initially for a specific application, which may account for only a portion of their networking needs. As we successfully demonstrate the benefits of our solutions, we see a significant opportunity to sell additional products and services to our existing customers to migrate additional workloads and applications onto our cloud networking platform. For example, the information technology department of a global financial services institution, which is associated with one of our underwriters, initially purchased our products for a trading application, then for an IP storage application and is now using our products in the core of its data center. |
• | Expand Strategic Relationships. We have developed strategic relationships with a number of technology ecosystem participants including A10 Networks, Ansible, Aruba Networks, Cloudera, F5 Networks, Microsoft, Nuage, Palo Alto Networks, Puppet Labs, Pure Storage, RedHat, Riverbed, Splunk, VMTurbo, VMware and Zscaler, to allow integration of our cloud networking solutions with their offerings and enable an integrated experience for our customers. This is a key differentiating point of our solutions as it allows customers to improve performance by integrating with leading solutions. We intend to continue building upon these relationships to provide our customers with the ability to more easily integrate our networking products with their existing and planned IT infrastructures. |
Our Products and Technology
We offer one of the broadest product lines of data center 10/40/100 Gigabit Ethernet switches in the industry, comprising our 7050 Series and 7150 Series top-of-rack switches, our 72XX/7300 X Series SPLINE switches and our 7280 and 7500 E Series spine switches.
We deliver switches with industry-leading capacity, low latency, port density and power efficiency. We have also innovated in areas such as deep packet buffers, embedded optics and reversible cooling. Our products have been recognized with a number of awards, including the Best of Interop Grand Prize that was given to our industry-leading spine switch, the Arista 7500 Series, in 2010 and again, to the Arista 7500E Series, in 2013. An overview of our switching portfolio is shown in the figure below.
8

We use multiple silicon architectures across our products, which allows us to build a broader range of switching products optimized for different functions in the network than competitors that utilize fewer silicon architectures. While we use multiple silicon architectures, all of our switches are powered with the same binary EOS image, which significantly simplifies deployment and ensures the same rich feature set and consistent operation across all our products.
Our Extensible Operating System
The core of our cloud networking platform is our Extensible Operating System, or EOS, which runs on top of standard Linux and offers programmability at all layers of the stack. All of our 10/40/100 Gigabit Ethernet switches run our EOS software.
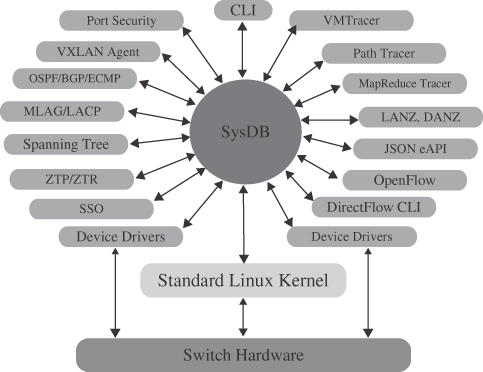
EOS is based on a new and innovative architecture that cleanly separates protocol processing from system state. Our EOS software is highly modular and consists of more than 100 separate processes that we call agents, each one handling specific protocol processing, device driver or system management functions. Each agent runs in user space as a separate Linux process and is completely protected and isolated from all other agents. Communication between agents only occurs through a central in-memory database called SysDB, which provides a central repository for all system state. Any update posted by an agent to SysDB is automatically forwarded to
9
all other processes that need to be notified of such an update to perform the appropriate processing. The exchange of state through a central state repository is far more reliable than the conventional approach of direct inter-process communication between a large number of processes.
As illustrated below, all agents are isolated from each other and interact directly through SysDB, thereby ensuring fault containment and availability.
EOS Attributes
The modular and programmable architecture of EOS enables us to offer a set of attributes, capabilities and features that are essential for cloud networking and next-generation data centers.
High Availability
EOS is self-healing in the sense that individual processes can be restarted without impacting application traffic. The same attribute allows in-service software upgrades of individual EOS processes. The capability to recover from software faults and upgrade processes in a running system is not available in legacy network operating systems.
Programmable at All Layers
EOS is programmable at all layers from the Linux kernel to switch configuration, provisioning, automation and detailed monitoring of the network. We support the following application programming interfaces, or APIs:
• | JSON (JavaScript Object Notation) application programming interfaces to our EOS software enable us, customers and third parties to integrate our cloud networking solutions with existing orchestration and automation systems; |
• | OpenFlow and DirectFlow interfaces enable programming of the forwarding state of the system for traffic engineering in conjunction with external controllers; and |
• | vCenter APIs enable integration with VMware ESX and VMware NSX. |
In addition, we support full access to Linux and support standard Linux tools such as Ping, TCPdump, Ganglia and Nagios, as well as customized Shell, Python and Perl scripts and native C++ programs.
Complete Network Visibility
Through EOS, we have developed a wide range of applications available to our customers for purchase as additional licenses that enable enhanced network monitoring and visibility without requiring additional external monitoring devices, including the following:
• | Latency Analyzer, or LANZ, an application that allows network operators to manage congestion actively in real-time and trigger packet data capture based on queue depth analysis, enabling proactive congestion management; |
• | Data Analyzer, or DANZ, an application that integrates an advanced suite of Tap and SPAN Switch Port aggregation management with our switches; |
• | VMTracer, an application that enables auto-provisioning of the network segmentation model on a per-VM basis and provides complete visibility of the locations of virtual machines on a given physical network port; |
10
• | PathTracer, an application that detects issues with all paths in active-active Layer 2 or Layer 3 networks; |
• | MapReduce Tracer, an application that provides faster rebalancing and recovery in case of node failures in Hadoop networks; and |
• | Health Tracer, an application that monitors the health of the network switch. |
Network Automation
EOS supports Puppet, Chef and Ansible, which enables automatic network configuration in the same manner as servers and storage. In addition, EOS provides two tools that greatly reduce network operational costs:
• | Zero Touch Provisioning, a tool that automates the provisioning of network infrastructure and speeds time to production for new services while eliminating the risk of human error; and |
• | Zero Touch Replacement, a tool that provides automated provisioning of replacement switches, significantly reducing mean-time-to-replacement of a failed switch. |
Leaf-Spine Network Designs
Our customers typically deploy leaf-spine network topologies consisting of leaf switches or top-of-rack switches, located in the server rack connected with uplinks to multiple load-sharing spine switches that provide the backbone. Our leaf-spine network designs scale up to more than 300,000 physical servers and millions of virtual machines using Equal Cost Multiple Pathing, or ECMP, to load balance Layer 3 network traffic across multiple spine switches. With Multi-Chassis Link Aggregation, or MLAG, we can build an active-active Layer 2 network that can connect more than 25,000 physical servers. Examples of our leaf-spine MLAG and ECMP architectures are illustrated below.

Our leaf-spine network designs have been widely deployed and provide predictable network bandwidth and latency. A key advantage of predictable network performance is that it eliminates the need to optimize the network for specific applications, which means a single network design works equally well for all applications.
Customer Support and Services
We have designed our customer support offerings to provide our customers with high levels of support. Our global team of support engineers engages directly with client IT teams and is available at all times over e-mail, by phone or through our website.
We offer multiple service options that allow our customers to select the product replacement service level that best meets their needs. We stock spare parts in over 95 locations around the world through our third-party logistics suppliers. All of our service options include unlimited access to bug-fixes, new feature-releases, online case management and our community forums.
Sales and Marketing
We market and sell our products through our direct sales force and in partnership with our channel partners, including distributors, value-added resellers, systems integrators and OEM partners. We also sell in conjunction with various technology partners. To facilitate channel coordination and increase productivity, we have created a partner program, the Arista Partner Program, to engage partners who provide value-added services and extend our reach into the marketplace. Authorized training partners perform technical training of our channel partners and end customers. Our partners commonly receive an order from an end customer prior to placing an order with us, and we confirm the identification of the end customer prior to accepting such orders. Our partners generally do not stock inventory received from us.
Our sales organization is supported by systems engineers with deep technical expertise and responsibility for pre-sales technical support and solutions engineering for our end customers, systems integrators, original equipment manufacturers, or OEMs, and channel partners. A pool of shared channel sales and marketing representatives also supports these teams. Each sales team is responsible for a
11
geographical territory, has responsibility for a number of major direct end-customer accounts or has assigned accounts in a specific vertical market. We have field sales teams operating in 24 countries. During 2014 and 2013, 79.7% and 82.9% of our revenue was generated from the Americas, substantially all from the U.S., 12.8% and 11.2% from Europe, the Middle East and Africa and 7.5% and 5.9% from the Asia-Pacific region, respectively.
Our marketing activities consist primarily of technology conferences, web marketing, trade shows, product demonstrations, seminars and events, public relations, analyst relations, demand generation and direct marketing to build our brand, increase end-customer awareness, communicate our product advantages and generate qualified leads for our field sales force and channel partners.
Research and Development
We believe our future success depends on our ability to develop new products and features that address the needs of our end customers. Our in-house engineering personnel are responsible for the development, quality, documentation, support and release of our products. We plan to continue to invest significantly in resources to conduct our research and development efforts.
Manufacturing
We subcontract the manufacturing of all of our products to various contract manufacturers. Our primary manufacturing partners are Jabil Circuit and Foxconn. We also work with Flextronics International Ltd. to provide logistics and final configuration services in North America. This approach allows us to reduce our costs, manufacturing overhead and inventory position and allows us to adjust more quickly to changing end-customer demand. We require all of our manufacturing locations to be ISO-9001 certified. Our EOS software is installed on our products at one of three direct fulfillment facilities.
Our contract manufacturing partners procure the majority of the components needed to build our products and assemble our products according to our design specifications. This allows us to leverage the purchasing power of our contract manufacturing partners. We retain complete control over the bill of material, test procedures and quality assurance programs. Our on-site personnel work closely with our partners and review on an ongoing basis forecasts, inventory levels, processes, capacity, yields and overall quality. Our contract manufacturing partners procure components and assemble our products based on our demand forecasts. These forecasts represent our estimates of future demand for our products based upon historical trends and analyses from our sales and product management functions as adjusted for overall market conditions. We update these forecasts monthly.
Our products rely on key components, including merchant silicon, integrated circuit components and power supplies purchased from a limited number of suppliers, including certain sole source providers. Generally, neither our contract manufacturers nor we have a written agreement with any of these component providers to guarantee the supply of the key components used in our products nor do we have exclusive rights to such key components. Our product development efforts also depend upon continued collaboration with our key suppliers, including our merchant silicon vendors such as Broadcom and Intel. As we develop our product roadmap and continue to expand our relationships with these and other merchant silicon vendors, it is critical that we work in tandem with our key merchant silicon vendors to ensure that their silicon includes improved features and that our products take advantage of such improved features. This enables us to focus our research and development resources on software core competencies and to leverage the investments made by merchant silicon vendors to achieve cost-effective solutions.
Once the completed products are manufactured and tested, our contract manufacturing partners ship them to various theatre direct fulfillment facilities in California, the Netherlands and Singapore for final configuration, quality control inspection and shipment to our distribution partners and end customers. After the products are shipped to our end customers, our products are installed by the end customers or by third-party service providers such as system integrators or value added resellers on their behalf.
Backlog
We do not have any long-term purchase commitments from customers. Customers generally order products on an as-needed basis with short lead and delivery times on a per-purchase-order basis. We maintain substantial finished goods inventory to ensure that products can generally be shipped shortly after receipt of an order. A significant portion of our customer shipments in any fiscal year relate to orders received and shipped in that fiscal year, resulting in low product backlog relative to total shipments. Because our customers utilize purchase orders containing non-binding purchase commitments and we allow customers to cancel, change or reschedule orders without penalty at any time prior to shipment, we also do not believe backlog is firm. As a result of the foregoing factors, backlog is not material and not a meaningful indicator in any given period of our ability to achieve any particular level of overall revenue or financial performance.
Competition
The markets in which we compete are highly competitive and characterized by rapidly changing technology, changing end-customer needs, evolving industry standards and frequent introductions of new products and services. We expect competition to intensify in the future as the market for cloud networking expands and existing competitors and new market entrants introduce new products or enhance existing products.
The data center networking market has been historically dominated by Cisco Systems, with competition also coming from other large network equipment and system vendors including Brocade Communications Systems, Dell, Hewlett-Packard and Juniper Networks.
12
We also face competition from other companies and new market entrants, including “whitebox” switch vendors as well as current technology partners and end customers who may develop network switches and cloud service solutions for internal use and/or to broaden their portfolio of products.
The principle competitive factors applicable to our products include:
• | breadth of product offerings and features; |
• | reliability and product quality; |
• | ease of use; |
• | total cost of ownership, including automation, monitoring and integration costs; |
• | performance and scale; |
• | programmability and extensibility; |
• | interoperability with other products; |
• | ability to be bundled with other vendor offerings; and |
• | quality of service, support and fulfillment. |
We believe our products compete favorably with respect to these factors. Our EOS software offers high reliability, integrates with existing network protocols and is open and programmable. We believe the combination of EOS, a set of network applications and our 10/40/100 Gigabit Ethernet Switch makes our offering highly competitive for both cloud and enterprise data centers. However, many of our competitors have greater name recognition, longer operating histories, larger sales and marketing budgets and resources, broader distribution and established relationships with channel partners and end customers, greater access to larger end-customer bases, greater end-customer support resources, greater manufacturing resources, the ability to leverage their sales efforts across a broader portfolio of products, the ability to leverage purchasing power when purchasing subcomponents, the ability to bundle competitive offerings with other products and services, the ability to develop their own silicon chips, the ability to set more aggressive pricing policies, lower labor and development costs, greater resources to make acquisitions, larger intellectual property portfolios and substantially greater financial, technical, research and development or other resources.
Intellectual Property
Our success and ability to compete depend substantially upon our core technology and intellectual property. We rely on patent, trademark and copyright laws, trade secret protection and confidentiality agreements with our employees, end customers, resellers, systems integrators and others to protect our intellectual property rights. As of December 31, 2014, we had 39 patent applications pending in the U.S. and two patents granted in the U.S., which expire in 2025 and 2028.
We cannot assure you that any of our patent applications will result in the issuance of a patent or whether the examination process will result in patents of valuable breadth or applicability. In addition, any patents that may be issued may be contested, circumvented, found unenforceable or invalidated, and we may not be able to prevent third parties from infringing them. We also license software from third parties for integration into our products, including open source software and other software available on commercially reasonable terms. We also own a number of trademarks in the U.S. and other jurisdictions, including Arista (which mark is not registered in the U.S.), EOS, CloudVision, Health Tracer, MapReduce Tracer, Path Tracer, MXP, RAIL and SPLINE.
We control access to and use of our software, technology and other proprietary information through internal and external controls, including contractual protections with employees, contractors, end customers and partners. Our software is protected by U.S. and international copyright, patent and trade secret laws. Despite our efforts to protect our software, technology and other proprietary information, unauthorized parties may still copy or otherwise obtain and use our software, technology and other proprietary information. In addition, we intend to expand our international operations, and effective patent, copyright, trademark and trade secret protection may not be available or may be limited in foreign countries.
Our industry is characterized by the existence of a large number of patents and frequent claims and related litigation regarding patent and other intellectual property rights. If we become more successful, we believe that competitors will be more likely to try to develop products that are similar to ours and that may infringe our proprietary rights. It may also be more likely that competitors or other third parties will claim that our products infringe their proprietary rights. In particular, large and established companies in our industry have extensive patent portfolios and are regularly involved in both offensive and defensive litigation. From time to time, third parties, including certain of these large companies and non-practicing entities, may assert patent, copyright, trademark and other intellectual property rights against us, our channel partners or our end customers, whom our standard license and other agreements obligate us to indemnify against such claims. For example, in December 2014, Cisco Systems filed two lawsuits against us in the Northern District of California for alleged patent and copyright infringement. Additionally, Cisco Systems filed to complaints against us in the International Trade Commission (ITC) for patent infringement, and the ITC has initiated an investigation. Please see "Legal Proceedings" included in Part I, Item 3 of this Annual Report on Form 10-K, for a description of this litigation. Successful claims of infringement by a third party, if any, could prevent us from distributing certain products or performing certain services, require us to expend time and money to develop non-infringing solutions or force us to pay substantial damages, royalties or other fees. We cannot assure you that we do not currently infringe, or that we will not in the future infringe, upon any third-party patents or other proprietary rights.
13
Employees
As of December 31, 2014 we employed over 1,000 full-time employees. None of our employees are represented by unions. We consider our relationship with our employees to be good and have not experienced significant interruptions of operations due to labor disagreements.
Available Information
Our website is located at www.arista.com and our investor relations website is located at www. investors.arista.com. Our Annual Reports on Form 10-K, Quarterly Reports on Form 10-Q, Current Reports on Form 8-K and amendments to reports filed or furnished pursuant to Sections 13(a) and 15(d) of the Securities Exchange Act of 1934, as amended (the “Exchange Act”), are available free of charge on the Investors portion of our web site as soon as reasonably practicable after we electronically file such material with, or furnish it to, the Securities and Exchange Commission (SEC). Further, a copy of this Annual Report on Form 10-K is located at the SEC's Public Reference Room at 100 F Street, NE, Washington, D.C. 20549. Information on the operation of the Public Reference Room can be obtained by calling the SEC at 1-800-SEC-0330.
Webcasts of our earnings calls and certain events we participate in or host with members of the investment community are on our investor relations website. Additionally, we announce investor information, including news and commentary about our business and financial performance, SEC filings, notices of investor events, and our press and earnings releases, on our investor relations website. Investors and others can receive notifications of new information posted on our investor relations website in real time by signing up for email alerts and RSS feeds. Further corporate governance information, including our corporate governance guidelines, board committee charters, and code of conduct, is also available on our investor relations website under the heading “Corporate Governance.” The contents of our websites are not incorporated by reference into this Annual Report on Form 10-K or in any other report or document we file with the SEC, and any references to our websites are intended to be inactive textual references only.
14
Item 1A. Risk Factors
You should consider carefully the risks and uncertainties described below, together with all of the other information in this Annual Report on Form 10-K, which could materially affect our business, financial condition, results of operations and prospects. The risks described below are not the only risks facing us. Risks and uncertainties not currently known to us or that we currently deem to be immaterial also may materially affect our business, financial condition, results of operations and prospects.
Risks Related to Our Business and Our Industry
Our limited operating history makes it difficult to evaluate our current business and future prospects and may increase the risk associated with your investment.
We were founded in 2004 and shipped our first products in 2008. The majority of our revenue growth has occurred since the beginning of 2010. Our limited operating history makes it difficult to evaluate our current business and our future prospects, including our ability to plan for and model future growth. We have encountered and will continue to encounter risks and difficulties frequently experienced by rapidly growing companies in constantly evolving industries, including the risks described elsewhere in this Annual Report on Form 10-K. If we do not address these risks successfully, our business, financial condition, results of operations and prospects will be adversely affected, and the market price of our common stock could decline. Further, we have limited historical financial data, and we operate in a rapidly evolving market. As such, any predictions about our future revenue and expenses may not be as accurate as they would be if we had a longer operating history or operated in a more predictable market.
Our business and operations have experienced rapid growth, and if we do not appropriately manage any future growth or are unable to improve our systems and processes, our business, financial condition, results of operations and prospects will be adversely affected.
We have experienced rapid growth and increased demand for our products over the last several years, which has placed a strain on our management, administrative, operational and financial infrastructure. Our employee headcount and number of end customers have increased significantly. To handle the increase in end customers, we expect to continue to grow our headcount significantly over the next 12 months. For example, as of December 31, 2010 and December 31, 2014, our cumulative number of end customers increased from approximately 570 to over 3,000. As we have grown, we have had to manage an increasingly larger and more complex array of internal systems and processes to scale with all aspects of our business, including our hardware and software development, contract manufacturing and purchasing, logistics and fulfillment and maintenance and support. Our success will depend in part upon our ability to manage our growth effectively. To do so, we must continue to increase the productivity of our existing employees and continue to hire, train and manage new employees as needed. To manage domestic and international growth of our operations and personnel, we will need to continue to improve our operational, financial and management controls and our reporting processes and procedures and implement more extensive and integrated financial and business information systems. We may not be able to successfully implement these or other improvements to our systems and processes in an efficient or timely manner, and we may discover deficiencies in their capabilities or effectiveness. We may experience difficulties in managing improvements to our systems and processes or in connection with third-party technology. In addition, our systems and processes may not prevent or detect all errors, omissions or fraud. Our failure to improve our systems and processes, or their failure to operate effectively and in the intended manner, may result in disruption of our current operations and end-customer relationships, our inability to manage the growth of our business and our inability to accurately forecast our revenue, expenses and earnings and prevent certain losses.
Our results of operations are likely to vary significantly from period to period and be unpredictable and if we fail to meet the expectations of analysts or investors or our previously issued financial guidance, or if any forward-looking financial guidance does not meet the expectation of analysts or investors, the market price of our common stock could decline substantially
Our results of operations have historically varied from period to period, and we expect that this trend will continue. As a result, you should not rely upon our past financial results for any period as indicators of future performance. Our results of operations in any given period can be influenced by a number of factors, many of which are outside of our control and may be difficult to predict, including:
• | our ability to retain and increase sales to existing customer and attract new end customers, including large end customers; |
• | the budgeting cycles and purchasing practices of end customers, including large end customers who may receive lower pricing terms due to volume discounts; |
• | the buying patterns of our large end customers in which large bulk purchases may or may not occur in certain quarters; |
• | the cost and potential outcomes of existing and future litigation; |
• | the rate of expansion and productivity of our sales force; |
• | changes in our pricing policies, whether initiated by us or as a result of competition; |
• | the amount and timing of operating costs and capital expenditures related ot the operation and expansion of our business; |
• | changes in end-customer, distributor or reseller requirements or market needs; |
• | deferral or cancellation of orders from end customers, including in anticipation of new products or product enhancements announced by us or our competitors, or warranty returns; |
• | the inclusion of any acceptance provisions in our customer contracts or any delays in acceptance of those products; |
15
• | changes in the growth rate of the networking market; |
• | the actual or rumored timing and success of new product and service introductions by us or our competitors or any other change in the competitive landscape of our industry, including consolidation among our competitors or end customers; |
• | our ability to successfully expand our business domestically and internationally; |
• | our ability to increase the size of our distribution channel; |
• | decisions by potential end customers to purchase cloud networking solutions from larger, more established vendors, white box vendors or their primary network equipment vendors; |
• | price competition; |
• | insolvency or credit difficulties confronting our end customers, which could adversely affect their ability to purchase or pay for our products and services, or confronting our key suppliers, including our sole source suppliers, which could disrupt our supply chain; |
• | any disruption in our sales channel or termination of our relationship with important channel partners; |
• | our inability to fulfill our end customers’ orders due to supply chain delays, access to key commodities or technologies or events that impact our manufacturers or their suppliers; |
• | seasonality or cyclical fluctuations in our markets; |
• | future accounting pronouncements or changes in our accounting policies; |
• | stock-based compensation expense; |
• | our overall effective tax rate, including impacts caused by any reorganization in our corporate structure, any changes in our valuation allowance for domestic deferred tax assets and any new legislation or regulatory developments; |
• | increases or decreases in our expenses caused by fluctuations in foreign currency exchange rates, as an increasing portion of our expenses are incurred and paid in currencies other than the U.S. dollar; |
• | general economic conditions, both domestically and in foreign markets; and |
• | other risk factors described in this Annual Report on Form 10-K. |
Any one of the factors above or the cumulative effect of several of the factors described above may result in significant fluctuations in our financial and other results of operations. This variability and unpredictability could result in our failure to meet our revenue, gross margins, results of operations or other expectations contained in any forward looking financial guidance we have issued or the expectations of securities analysts or investors for a particular period. If we fail to meet or exceed such guidance or expectations for these or any other reasons, the market price of our common stock could decline substantially, and we could face costly lawsuits, including securities class action suits.
We expect large purchases by a limited number of end customers to continue to represent a substantial portion of our revenue, and any loss or delay of expected purchases could result in material quarter-to-quarter fluctuations of our revenue or otherwise adversely affect our results of operations.
Historically, large purchases by a relatively limited number of end customers have accounted for significant portion of our revenue. Many of these end customers make large purchases to complete or upgrade specific data center installations and are typically made on a purchase-order basis rather than pursuant to long-term contracts. Revenue from sales to Microsoft, through our channel partner, World Wide Technology, Inc., accounted for 14.9% of our revenue for the year ended December 31, 2014, 21.9% of our revenue for the year ended December 31, 2013 and 15.3% of our revenue for the year ended December 31, 2012.
As a consequence of the concentrated nature of our customer base and their purchasing behavior, our quarterly revenue and results of operations may fluctuate from quarter to quarter and are difficult to estimate. For example, any cancellation of orders or any acceleration or delay in anticipated product purchases or the acceptance of shipped products by our larger end customers could materially affect our revenue and results of operations in any quarterly period. We may be unable to sustain or increase our revenue from our large end customers or offset the discontinuation of concentrated purchases by our larger end customers with purchases by new or existing end customers. We expect that such concentrated purchases will continue to contribute materially to our revenue for the foreseeable future and that our results of operations may fluctuate materially as a result of such larger end customers’ buying patterns. In addition, we may see consolidation of our customer base, such as among Internet companies and cloud service providers, which could result in loss of end customers. The loss of such end customers, or a significant delay or reduction in their purchases, could materially harm our business, financial condition, results of operations and prospects.
Our revenue growth rate in recent periods may not be indicative of our future performance.
Our revenue growth rate in recent periods may not be indicative of our future performance. We experienced annual revenue growth rates of 61.7%, 86.8% and 38.3% in 2014, 2013 and 2012, respectively. We may not achieve similar revenue growth rates in future periods, especially as we enter and expand into the cloud services and application services provider markets. You should not rely on our revenue for any prior quarterly or annual period as any indication of our future revenue or revenue growth. If we are unable to maintain consistent revenue or revenue growth, our business, financial condition, results of operations and prospects could be materially adversely affected.
We face intense competition, especially from larger, well-established companies, and we may lack sufficient financial or other resources to maintain or improve our competitive position.
16
The market for data center networking, including the market for cloud networking, is intensely competitive, and we expect competition to increase in the future from established competitors and new market entrants. This competition could result in increased pricing pressure, reduced profit margins, increased sales and marketing expenses and our failure to increase, or the loss of, market share, any of which would likely seriously harm our business, financial condition, results of operations and prospects.
The data center networking market has been historically dominated by Cisco Systems, with competition also coming from other large network equipment and system vendors, including Juniper Networks, Brocade Communications Systems, Hewlett-Packard and Dell. We also face competition from other companies and new market entrants, including “whitebox” switch vendors as well as current technology partners and end customers. Many of our existing and potential competitors enjoy substantial competitive advantages, such as:
• | greater name recognition and longer operating histories; |
• | larger sales and marketing budgets and resources; |
• | broader distribution and established relationships with channel partners and end customers; |
• | greater access to larger end-customer bases; |
• | greater end-customer support resources; |
• | greater manufacturing resources; |
• | the ability to leverage their sales efforts across a broader portfolio of products; |
• | the ability to leverage purchasing power with vendor subcomponents; |
• | the ability to bundle competitive offerings with other products and services; |
• | the ability to develop their own silicon chips; |
• | the ability to set more aggressive pricing policies; |
• | lower labor and development costs; |
• | greater resources to make acquisitions; |
• | larger intellectual property portfolios; and |
• | substantially greater financial, technical, research and development or other resources. |
Our competitors also may be able to provide end customers with capabilities or benefits different from or greater than those we can provide in areas such as technical qualifications or geographic presence or may be able to provide end customers a broader range of products, services and prices. In addition, large competitors may have more extensive relationships with and within existing and potential end customers that provide them with an advantage in competing for business with those end customers. For example, certain large competitors encourage end customers of their other products and services to adopt their data networking solutions through discounted bundled product packages. Our ability to compete will depend upon our ability to provide a better solution than our competitors at a more competitive price. We may be required to make substantial additional investments in research, development, marketing and sales in order to respond to competition, and we cannot assure you that these investments will achieve any returns for us or that we will be able to compete successfully in the future.
We also expect increased competition if our market continues to expand. Conditions in our market could change rapidly and significantly as a result of technological advancements or other factors. Current or potential competitors may be acquired by third parties that have greater resources available than we do. Our current or potential competitors might take advantage of the greater resources of the larger organization resulting from these acquisitions to compete more vigorously or broadly with us. In addition, continued industry consolidation might adversely affect end customers’ perceptions of the viability of smaller and even medium-sized networking companies and, consequently, end customers’ willingness to purchase from those companies. Further, certain large end customers may develop network switches and cloud service solutions for internal use and/or to broaden their portfolio of products, which could allow these end customers to become new competitors in the market.
If we do not successfully anticipate technological shifts, market needs and opportunities, and develop products and product enhancements that meet those technological shifts, needs and opportunities, or if those products are not made available in a timely manner or do not gain market acceptance, we may not be able to compete effectively, and our ability to generate revenue will suffer.
The cloud networking market can be characterized by rapid technological shifts and increasingly complex end-customer requirements to achieve scalable and more programmable networks that facilitate virtualization, big data, public/private cloud and web scale computing. We must continue to develop new technologies and products that address emerging technological trends and changing end-customer needs. The process of developing new technology is complex and uncertain, and new offerings requires significant upfront investment that may not result in material design improvements to existing products or result in marketable new products or costs savings or revenue for an extended period of time, if at all. The success of new products depends on several factors, including appropriate new product definition, component costs, timely completion and introduction of these products, differentiation of new products from those of our competitors and market acceptance of these products.
In addition, new technologies could render our existing products obsolete or less attractive to end customers, and our business, financial condition, results of operations and prospects could be materially adversely affected if such technologies are widely adopted. For example, end customers may prefer to address their network switch requirements by licensing software operating systems separately
17
and placing them on industry-standard servers or develop their own networking products rather than purchasing integrated hardware products as has occurred in the server industry.
We may not be able to successfully anticipate or adapt to changing technology or end-customer requirements on a timely basis, or at all. If we fail to keep up with technology changes or to convince our end customers and potential end customers of the value of our solutions even in light of new technologies, our business, financial condition, results of operations and prospects could be materially adversely affected.
We are currently involved in litigation with Cisco Systems, Inc.
On December 5, 2014, Cisco filed two complaints against us in District Court for the Northern District of California, which are proceeding as Case No. 4-14-cv-0543 (“’043 Case”) and Case No. 4-14-cv-0544 (“’044 Case”). In the ’043 Case, Cisco alleges that we infringe U.S. Patent Nos. 6,377,577; 6,741,592; 7,023,853; 7,061,875; 7,162,537; 7,200,145; 7,224,668; 7,290,164; 7,340,597; 7,460,492; 8,051,211; and 8,356,296 (respectively, “the ’577 patent,” “the ’592 patent,” “the ’853 patent,” “the 875 patent,” “the ’537 patent,” “the ’145 patent,” “the ’668 patent,” “the ’164 patent,” “the ’597 patent,” “the ’492 patent,” “the ’211 patent,” and “the ’296 patent”). Cisco seeks, as relief for our alleged infringement in the ’043 Case, lost profits and/or reasonable royalty damages in an unspecified amount, including treble damages, attorney’s fees, and associated costs. Cisco also seeks injunctive relief in the ’043 Case. On February 10, 2015, the court granted our unopposed motion to stay the ’043 Case until the proceedings before the United States International Trade Commission (“USITC”) pertaining to the same patents (as discussed below) become final. In the ’044 Case, Cisco’s complaint alleges that we infringe U.S. Patent Nos. 7,047,526 and 7,953,886 and further alleges that we infringe numerous copyrights pertaining to Cisco’s “Command Line Interface” or “CLI.” As relief for our alleged patent infringement in the ’044 Case, Cisco seeks lost profits and/or reasonable royalty damages in an unspecified amount including treble damages, attorney’s fees, and associated costs as well as injunctive relief. As relief from our alleged copyright infringement, Cisco seeks damages in an unspecified amount in the form of alleged lost profits, profits from our alleged infringement, statutory damages, attorney’s fees and associated costs. Cisco also seeks injunctive relief against our alleged copyright infringement. On February 13, 2015, we answered the complaint in the ’044 Case, denying the patent and copyright infringement allegations and also raising numerous affirmative defenses. Trial has not been scheduled in either the ’043 or ’044 Cases.
On December 19, 2014, Cisco filed two complaints against us in the USITC, alleging that Arista has violated Section 337 of the Tariff Act of 1930, as amended. The complaints have been instituted as ITC Inv. Nos. 337-TA-944 (“’944 Investigation”) and 337-TA-945 (“’945 Investigation). In the ’944 Investigation, Cisco alleges that certain Arista switching products infringe the ’592, ’537, ’145, ’164, ’597, and ’296 patents. In the ’945 Investigation, Cisco alleges that certain Arista switching products infringe the ’577, ’853, ’875, ’668, ’492, and ’211 patents. In both the ’944 and ’945 Investigations, Cisco seeks, among other things, a limited exclusion order barring entry into the United States of accused switch products (including 7000 Series of switches) and a cease and desist order against us regarding our accused switch products. On January 28, 2015, the Administrative Law Judge assigned to the ’944 Investigation set May 27, 2016 as the target date for completion of the ’944 Investigation. On February 11, 2015, we responded to the notices of investigation and complaints in the ’944 and ’945 Investigations by, among other things, denying the patent infringement allegations and raising numerous affirmative defenses. On February 19, 2015, the Administrative Law Judge assigned to the ’945 Investigation issued a procedural schedule calling for, among other events: issuance of an order construing the claims of the ’577, ’853, ’875, ’668, ’492, and ’211 patents tentatively on July 17, 2015; an evidentiary hearing on November 9-20, 2015; an initial determination regarding our alleged violations due April 26, 2016; and the target date for completion of the ’945 Investigation on August 26, 2016.
We intend to vigorously defend against Cisco’s lawsuits, as summarized in the preceding paragraphs. However, we cannot be certain that, if litigated, any claims by Cisco would be resolved in our favor. For example, an adverse litigation ruling could result in a significant damages award against us, could further result in the above described injunctive relief (including, among other things, an order excluding our products from importation into the United States), could result in a requirement that we make substantial royalty payments to Cisco, and/or could require that we modify our products to the extent that we are found to infringe any valid claims asserted against us Cisco. Any such adverse ruling could materially adversely affect our business, prospects, results of operation and financial condition. To the extent that we reached a negotiated settlement with Cisco, the settlement could require payment of substantial royalties.
Additionally, the existence of this lawsuit could cause concern among our customers and potential customers and could adversely affect our business and results of operations. An adverse litigation ruling could also result in a significant damages award against us and the injunctive relief described above. Many of our customers and channel partners require us to indemnify and defend them against third party infringement claims and pay damages in the case of adverse rulings. These claims could harm our relationships with our customers or channel partners and might deter them from doing business with us. In order to maintain our relationships with existing customers and secure business with new customers, we may be required from time to time to provide additional assurances beyond our standard terms. Whether or not we prevail in the lawsuit, we expect that the litigation will be expensive, time-consuming and a distraction to management in operating our business.
18
We are currently involved in a license dispute with OptumSoft, Inc.
On April 4, 2014, OptumSoft filed a lawsuit against us in the Superior Court of California, Santa Clara County titled OptumSoft, Inc. v. Arista Networks, Inc., in which it asserts (i) ownership of certain components of our EOS network operating system pursuant to the terms of a 2004 agreement between the companies and (ii) breaches of certain confidentiality and use restrictions in that agreement. Under the terms of the 2004 agreement, OptumSoft provided us with a non-exclusive, irrevocable, royalty-free license to software delivered by OptumSoft comprising a software tool used to develop certain components of EOS and a runtime library that is incorporated into EOS. The 2004 agreement places certain restrictions on our use and disclosure of the OptumSoft software and gives OptumSoft ownership of improvements, modifications and corrections to, and derivative works of, the OptumSoft software that we develop. In its lawsuit, OptumSoft has asked the Court to order us to (i) give OptumSoft copies of certain components of our software for evaluation by OptumSoft, (ii) cease all conduct constituting the alleged confidentiality and use restriction breaches, (iii) secure the return or deletion of OptumSoft’s alleged intellectual property provided to third parties, including our customers, (iv) assign ownership to OptumSoft of OptumSoft’s alleged intellectual property currently owned by us, and (v) pay OptumSoft’s alleged damages, attorney’s fees, and costs of the lawsuit. David Cheriton, one of our founders and a former member of our board of directors who resigned from our board of directors on March 1, 2014 and has no continuing role with us, is a founder and, we believe, the largest stockholder and director of OptumSoft. The 2010 David R. Cheriton Irrevocable Trust dtd July 27, 2010, a trust for the benefit of the minor children of Mr. Cheriton, is one of our largest stockholders.
OptumSoft has identified in confidential documents certain software components it claims to own, which are generally applicable tools and utility subroutines and not networking specific code. We cannot assure which software components OptumSoft may ultimately claim to own in the litigation or whether such claimed components are material. The Court set a trial date for Phase I of the proceedings, relating to contract interpretation and application of the contract to certain claimed source code for September 14, 2015. The remaining issues are currently scheduled to be tried in April 2016.
We intend to vigorously defend against OptumSoft’s lawsuit. However, we cannot be certain that, if litigated, any claims by OptumSoft would be resolved in our favor. For example, if it were determined that OptumSoft owned components of our EOS network operating system, we would be required to transfer ownership of those components and any related intellectual property to OptumSoft. If OptumSoft were the owner of those components, it could make them available to our competitors, such as through a sale or license. In addition, OptumSoft could assert additional or different claims against us, including claims that our license from OptumSoft is invalid.
Additionally, the existence of this lawsuit could cause concern among our customers and potential customers and could adversely affect our business and results of operations. An adverse litigation ruling could also result in a significant damages award against us and the injunctive relief described above. In addition, if our license was ruled to have been terminated, and we were not able to negotiate a new license from OptumSoft on reasonable terms, we could be required to pay substantial royalties to OptumSoft or be prohibited from selling products that incorporate OptumSoft intellectual property. Any such adverse ruling could materially adversely affect our business, prospects, results of operation and financial condition. Whether or not we prevail in the lawsuit, we expect that the litigation will be expensive, time-consuming and a distraction to management in operating our business.
Product quality problems, defects, errors or vulnerabilities in our products or services could harm our reputation and adversely affect our business, financial condition, results of operations and prospects.
We produce highly complex products that incorporate advanced technologies, including both hardware and software technologies. Despite testing prior to their release, our products may contain undetected defects or errors, especially when first introduced or when new versions are released. Product defects or errors could affect the performance of our products and could delay the development or release of new products or new versions of products. Allegations of unsatisfactory performance could cause us to lose revenue or market share, increase our service costs, cause us to incur substantial costs in analyzing, correcting or redesigning the products, cause us to lose significant end customers, subject us to liability for damages and divert our resources from other tasks, any one of which could materially adversely affect our business, financial condition, results of operations and prospects.
From time to time, we have had to replace certain components of products that we had shipped and provide remediation in response to the discovery of defects or bugs, including failures in software protocols or defective component batches resulting in reliability issues, in such products, and we may be required to do so in the future. We may also be required to provide full replacements or refunds for such defective products. We cannot assure you that such remediation would not have a material effect on our business, financial condition, results of operations and prospects. Please see “—Our business is subject to the risks of warranty claims, product returns, product liability and product defects.”
The cloud networking market is still in its early stages and is rapidly evolving. If this market does not evolve as we anticipate or our target end customers do not adopt our cloud networking solutions, we may not be able to compete effectively, and our ability to generate revenue will suffer.
The cloud networking market is still in its early stages. The market demand for cloud networking solutions has increased in recent years as end customers have deployed larger networks and have increased the use of virtualization and cloud computing. Our success depends upon our ability to provide cloud networking solutions that address the needs of end customers more effectively and economically than those of other competitors or existing technologies.
19
If the cloud networking solutions market does not develop in the way we anticipate, if our solutions do not offer benefits compared to competing network switching products or if end customers do not recognize the benefits that our solutions provide, then our business, financial condition, results of operations and prospects could be materially adversely affected.
The requirements of being a public company may strain our resources, divert management’s attention and affect our ability to attract and retain qualified board members.
As a public company, we are subject to the reporting and corporate governance requirements of the Securities Exchange Act of 1934, as amended, or the Exchange Act, the listing requirements of the New York Stock Exchange and other applicable securities rules and regulations, including the Sarbanes-Oxley Act and the Dodd-Frank Act. Compliance with these rules and regulations will increase our legal and financial compliance costs, make some activities more difficult, time-consuming or costly and increase demand on our systems and resources, particularly after we are no longer an “emerging growth company” as defined in the JOBS Act. Among other things, the Exchange Act requires that we file annual, quarterly and current reports with respect to our business and results of operations and maintain effective disclosure controls and procedures and internal control over financial reporting. In order to improve our disclosure controls and procedures and internal control over financial reporting to meet this standard, significant resources and management oversight may be required. As a result, management’s attention may be diverted from other business concerns, which could harm our business, financial condition, results of operations and prospects. Although we have already hired additional employees to help comply with these requirements, we may need to further expand our legal and finance departments in the future, which will increase our costs and expenses.
In addition, changing laws, regulations, and standards relating to corporate governance and public disclosure are creating uncertainty for public companies, increasing legal and financial compliance costs and making some activities more time consuming. These laws, regulations and standards are subject to varying interpretations, in many cases due to their lack of specificity, and, as a result, their application in practice may evolve over time as new guidance is provided by regulatory and governing bodies. This could result in continuing uncertainty regarding compliance matters and higher costs necessitated by ongoing revisions to disclosure and governance practices. We intend to invest resources to comply with evolving laws, regulations, and standards, and this investment may result in increased general and administrative expense and a diversion of management’s time and attention from revenue-generating activities to compliance activities. If our efforts to comply with new laws, regulations and standards differ from the activities intended by regulatory or governing bodies, regulatory authorities may initiate legal proceedings against us and our business and prospects may be harmed. As a result of disclosure of information in the filings required of a public company, our business and financial condition will become more visible, which may result in threatened or actual litigation, including by competitors and other third parties. If such claims are successful, our business, financial condition, results of operations and prospects could be harmed, and even if the claims do not result in litigation or are resolved in our favor, these claims, and the time and resources necessary to resolve them, could divert the resources of our management and harm our business, financial condition, results of operations and prospects.
We also expect that being a public company and these new rules and regulations will make it more expensive for us to obtain director and officer liability insurance, and we may be required to accept reduced coverage or incur substantially higher costs to obtain coverage. These factors could also make it more difficult for us to attract and retain qualified executive officers and members of our board of directors, particularly to serve on our Audit Committee and Compensation Committee.
In addition, as a result of our disclosure obligations as a public company, we will have reduced strategic flexibility and will be under pressure to focus on short-term results, which may adversely affect our ability to achieve long-term profitability.
We are an “emerging growth company,” and we cannot be certain if the reduced disclosure requirements applicable to emerging growth companies will make our common stock less attractive to investors.
For so long as we remain an “emerging growth company” as defined in the JOBS Act, we may take advantage of certain exemptions from various requirements that are applicable to public companies that are not “emerging growth companies,” including reduced disclosure obligations regarding executive compensation in our registration statements, periodic reports and proxy statements and exemptions from the auditor attestation requirements of Section 404 of the Sarbanes-Oxley Act, the requirements of holding a nonbinding advisory vote on executive compensation and stockholder approval of any golden parachute payments not previously approved. We may take advantage of these exemptions until we are no longer an emerging growth company. We would cease to be an emerging growth company upon the earliest to occur of: (i) the first fiscal year following the fifth anniversary of our initial public offering; (ii) the first fiscal year after our annual gross revenue is $1 billion or more; (iii) the date on which we have, during the previous three-year period, issued more than $1 billion in non-convertible debt securities; or (iv) as of the end of any fiscal year in which the market value of our common stock held by non-affiliates exceeded $700 million as of the end of the second quarter of that fiscal year and have been subject to the requirements of the Exchange Act for at least 12 months.
In addition, Section 107 of the JOBS Act also provides that an “emerging growth company” may take advantage of an extended transition period for complying with new or revised accounting standards. However, we have chosen to “opt out” of such extended transition period, and as a result, we will comply with new or revised accounting standards on the relevant dates on which adoption of such standards is required for non-emerging growth companies. Our decision to opt out of the extended transition period for complying with new or revised accounting standards is irrevocable.
20
We are obligated to maintain proper and effective internal control over financial reporting. We may not complete our analysis of our internal control over financial reporting in a timely manner, or our internal control over financial reporting may not be determined to be effective, which may adversely affect investor confidence in our company and, as a result, the value of our common stock.
As a public company, we will be required, pursuant to the Exchange Act, to furnish a report by management on, among other things, the effectiveness of our internal control over financial reporting for the fiscal year ending December 31, 2015. This assessment will need to include disclosure of any material weaknesses identified by our management in our internal control over financial reporting. We will be required to disclose changes made in our internal control and procedures on a quarterly basis. Our independent registered public accounting firm will not be required to attest to the effectiveness of our internal control over financial reporting pursuant to Section 404 until the later of the year following our first annual report required to be filed with the SEC or the date we are no longer an “emerging growth company” as defined in the JOBS Act. At such time, our independent registered public accounting firm may issue a report that is adverse in the event that such firm is not satisfied with the level at which our internal control over financial reporting is documented, designed or operating. As a result, we may need to undertake various actions, such as implementing new internal controls and procedures and hiring accounting or internal audit staff. In connection with the audit of our consolidated financial statements for 2010 to 2013, we identified a material weakness in our internal control over financial reporting, which was remediated in 2014. However, we cannot be certain that any control remediation efforts undertaken during 2015 will enable us to avoid a material weakness in the future. Ensuring that we have adequate internal financial and accounting controls and procedures in place to help produce accurate financial statements on a timely basis is a costly and time-consuming effort that needs to be evaluated frequently.
We are currently evaluating our internal control over financial reporting, identifying and remediating deficiencies in internal controls, and documenting the results of our evaluation, testing, and remediation. We may not be able to complete our evaluation, testing, and any required remediation in a timely fashion. During the evaluation and testing process, if we identify one or more material weaknesses in our internal control over financial reporting that we are unable to remediate before the end of the same fiscal year in which the material weakness is identified, we will be unable to assert that our internal controls are effective. If we are unable to assert that our internal control over financial reporting is effective or determine we have a material weakness in our internal controls, we could lose investor confidence in the accuracy and completeness of our financial reports, which would cause the price of our common stock to decline.
In the event that our chief executive officer, chief financial officer, or independent registered public accounting firm determines in the future that our internal control over financial reporting is not effective as defined under Section 404, we could be subject to one or more investigations or enforcement actions by state or federal regulatory agencies, stockholder lawsuits or other adverse actions requiring us to incur defense costs, pay fines, settlements or judgments and causing investor perceptions to be adversely affected and potentially resulting in a decline in the market price of our stock.
If we are unable to attract new large end customers or to sell additional products to our existing end customers, our revenue growth will be adversely affected and our revenue could decrease.
To increase our revenue, we must add new end customers and large end customers and sell additional products to existing end customers. For example, one of our sales strategies is to target specific projects at our current end customers because they are familiar with the operational and economic benefits of our solutions, thereby reducing the sales cycle into these customers. We believe this opportunity with current end customers to be significant given their existing infrastructure and expected future spend. If we fail to attract new large end customers or sell additional products to our existing end customers, our business, financial condition, results of operations and prospects will be harmed.
Some of our large end customers require more favorable terms and conditions from their vendors and may request price concessions. As we seek to sell more products to these end customers, we may be required to agree to terms and conditions that may have an adverse effect on our business or ability to recognize revenue.
Our large end customers have significant purchasing power and, as a result, may receive more favorable terms and conditions than we typically provide to other end customers, including lower prices, bundled upgrades, extended warranties, acceptance terms, indemnification terms and extended return policies and other contractual rights. As we seek to sell more products to these large end customers, an increased mix of our shipments may be subject to such terms and conditions, which may reduce our margins or affect the timing of our revenue recognition and thus may have an adverse effect on our business, financial condition, results of operations and prospects.
Reliance on shipments at the end of the quarter could cause our revenue for the applicable period to fall below expected levels.
As a result of end-customer buying patterns and the efforts of our sales force and channel partners to meet or exceed their sales objectives, we have historically received a substantial portion of sales orders and generated a substantial portion of revenue during the second half of each quarter. This places significant pressure on order review and processing, supply chain management, manufacturing, inventory and quality control management, shipping and trade compliance to ensure that we have properly forecasted supply purchasing, manufacturing capacity, inventory and quality compliance and logistics. If there is any significant interruption in these critical functions, it could result in delayed order fulfillment, adversely affect our business, financial condition, results of operations and prospects and result in a decline in the market price of our common stock.
21
We base our inventory requirements on our forecasts of future sales. If these forecasts are materially inaccurate, we may procure inventory that we may be unable to use in a timely manner or at all.
We and our contract manufacturers procure components and build our products based on our forecasts. These forecasts are based on estimates of future demand for our products, which are in turn based on historical trends and analyses from our sales and marketing organizations, adjusted for overall market conditions. To the extent our forecasts are materially inaccurate or if we otherwise do not need such inventory, we may under- or over-procure inventory, and such inaccuracies in our forecasts could materially adversely affect our business, financial condition and results of operations.
Managing the supply of our products and product components is complex. Insufficient supply and inventory may result in lost sales opportunities or delayed revenue, while excess inventory may harm our gross margins.
Managing the supply of our products and product components is complex, and our inventory management systems and related supply-chain visibility tools may not enable us to forecast accurately and manage effectively the supply of our products and product components. Insufficient supply and inventory may result in lost sales opportunities or delayed revenue, while excess inventory may harm our gross margins. In order to reduce manufacturing lead times and plan for adequate component supply, from time to time we may issue purchase orders for components and products that are non-cancelable and non-returnable. We establish a liability for non-cancelable, non-returnable purchase commitments with our third-party contract manufacturers for quantities in excess of our demand forecasts, or obsolete material charges.
Supply management remains an increased area of focus as we balance the need to maintain sufficient supply levels to ensure competitive lead times against the risk of obsolescence or the end of life of certain products. If we ultimately determine that we have excess supply, we may have to reduce our prices and write down inventory, which in turn could result in lower gross margins. We record a provision when inventory is determined to be in excess of anticipated demand or obsolete to adjust inventory to its estimated realizable value.
Alternatively, insufficient supply levels may lead to shortages that result in delayed revenue or loss of sales opportunities altogether as potential end customers turn to competitors’ products that are readily available. Additionally, any increases in the time required to manufacture our products or ship products could result in supply shortfalls. If we are unable to effectively manage our supply and inventory, our business, financial condition, results of operations and prospects could be adversely affected.
Because some of the key components in our products come from sole limited sources of supply, we are susceptible to supply shortages or supply changes, which could disrupt or delay our scheduled product deliveries to our end customers and may result in the loss of sales and end customers.
Our products rely on key components, including integrated circuit components and power supplies that our contract manufacturers purchase on our behalf from a limited number of suppliers, including certain sole source providers. We do not have guaranteed supply contracts with any of our component suppliers, and our suppliers could delay shipments or cease manufacturing such products or selling them to us at any time. For example, in the past we have experienced shortages in inventory for dynamic random access memory integrated circuits and delayed releases of the next generation of chipset, which delayed our production and/or the release of our new products. The development of alternate sources for those components is time-consuming, difficult and costly. If we are unable to obtain a sufficient quantity of these components on commercially reasonable terms or in a timely manner, sales of our products could be delayed or halted entirely or we may be required to redesign our products. Any of these events could result in lost sales and damage to our end-customer relationships, which would adversely impact our business, financial condition, results of operations and prospects.
Our reliance on component suppliers also yields the potential for their infringement or misappropriation of third party intellectual property rights with respect to components which may be incorporated into our products. We may not be indemnified by such component suppliers for such infringement or misappropriation claims. Any litigation for which we do not receive indemnification could require us to incur significant legal expenses in defending against such claims or require us to pay substantial royalty payments or settlement amounts that would not be reimbursed by our component suppliers.
Our product development efforts are also dependent upon our continued collaboration with our key merchant silicon vendors such as Broadcom and Intel. As we develop our product roadmap and continue to expand our relationships with these and other merchant silicon vendors, it is critical that we work in tandem with our key merchant silicon vendors to ensure that their silicon includes improved features and that our products take advantage of such improved features. This enables us to focus our research and development resources on our software core competencies and to leverage the investments made by merchant silicon vendors to achieve cost-effective solutions.
If our key merchant silicon vendors do not continue to collaborate in such a fashion, if they do not continue to innovate or if there are delays in the release of their products, our own product launches could be delayed, which could have a material effect on revenue and business, financial condition, results of operations and prospects.
In the event of a shortage or supply interruption from our component suppliers, we may not be able to develop alternate or second sources in a timely manner. Further, long-term supply and maintenance obligations to end customers increase the duration for which specific components are required, which may increase the risk of component shortages or the cost of carrying inventory. In addition, our component suppliers change their selling prices frequently in response to market trends, including industry-wide increases in demand,
22
and because we do not have contracts with these suppliers, we are susceptible to price fluctuations related to raw materials and components. If we are unable to pass component price increases along to our end customers or maintain stable pricing, our gross margins could be adversely affected and our business, financial condition, results of operations and prospects could suffer.
Because we depend on third-party manufacturers to build our products, we are susceptible to manufacturing delays and pricing fluctuations that could prevent us from shipping end-customer orders on time, if at all, or on a cost-effective basis, which may result in the loss of sales and end customers.
We depend on third-party contract manufacturers, primarily Jabil Circuit and Foxconn, as our sole source manufacturers for our product lines. A significant portion of our cost of revenue consists of payments to these third-party contract manufacturers. Our reliance on these third-party contract manufacturers reduces our control over the manufacturing process, quality assurance, product costs and product supply and timing, which exposes us to risk. To the extent that our products are manufactured at facilities in foreign countries, we may be subject to additional risks associated with complying with local rules and regulations in those jurisdictions. If we fail to manage our relationships with our third-party manufacturers effectively, or if these third-party manufacturers experience delays, disruptions or quality control problems in their operations, this could severely impair our ability to fulfill orders on time, if at all, or on a cost-effective basis.
Our reliance on contract manufacturers also yields the potential for their infringement of third party intellectual property rights in the manufacturing of our products or misappropriation of our intellectual property rights in the manufacturing of other customers’ products. If we are unable to manage our relationships with our third-party contract manufacturers effectively, or if these third-party manufacturers suffer delays or disruptions for any reason, experience increased manufacturing lead times, capacity constraints or quality control problems in their manufacturing operations or fail to meet our future requirements for timely delivery, our ability to ship products to our end customers would be severely impaired, and our business, financial condition, results of operations and prospects would be seriously harmed.
Our contract manufacturers typically fulfill our supply requirements on the basis of individual orders. We do not have long-term contracts with our third-party manufacturers that guarantee capacity, the continuation of particular pricing terms or the extension of credit limits. Accordingly, they are not obligated to continue to fulfill our supply requirements, which could result in supply shortages, and the prices we are charged for manufacturing services could be increased on short notice. For example, a competitor could place large orders with the third-party manufacturer, thereby utilizing all or substantially all of such third-party manufacturer’s capacity and leaving the manufacturer little or no capacity to fulfill our individual orders without price increases or delays, or at all. Our contract with one of our contract manufacturers permits it to terminate the agreement for convenience, subject to prior notice requirements. We may not be able to develop alternate or second contract manufacturers in a timely manner. If we are required to change contract manufacturers, our ability to meet our scheduled product deliveries to our end customers could be adversely affected, which could cause the loss of sales to existing or potential end customers, delayed revenue or an increase in our costs which could adversely affect our gross margins. The addition of contract manufacturers or manufacturing locations also would increase the complexity of our supply chain management. Any production interruptions or disruptions for any reason, such as a natural disaster, epidemic, capacity shortages, adverse results from intellectual property litigation or quality problems, at one of our manufacturing partners would adversely affect sales of our product lines manufactured by that manufacturing partner and adversely affect our business, financial condition, results of operations and prospects.
If we are unable to increase market awareness of our company and our products, our revenue may not continue to grow or may decline.
We have not yet established broad market awareness of our products and services. Market awareness of our value proposition and products and services will be essential to our continued growth and our success, particularly for the service provider and large enterprise markets. If our marketing efforts are unsuccessful in creating market awareness of our company and our products and services, then our business, financial condition, results of operations and prospects will be adversely affected, and we will not be able to achieve sustained growth.
The sales prices of our products and services may decrease, which may reduce our gross profits and adversely affect our results of operations.
The sales prices for our products and services may decline for a variety of reasons, including competitive pricing pressures, discounts, a change in our mix of products and services, the introduction of new products and services by us or by our competitors, promotional programs, product and related warranty costs or broader macroeconomic factors. In addition, we have provided, and may in the future provide, pricing discounts to large end customers, which may result in lower margins for the period in which such sales occur. Our gross margins may also fluctuate as a result of the timing of such sales to large end customers.
We have experienced declines in sales prices for our products, including our 10 Gigabit Ethernet modular and fixed switches. Competition continues to increase in the market segments in which we participate, and we expect competition to further increase in the future, thereby leading to increased pricing pressures. Larger competitors with more diverse product and service offerings may reduce the price of products and services that compete with ours or may bundle them with other products and services. Additionally, although we price our products worldwide in U.S. dollars, currency fluctuations in certain countries and regions may adversely affect actual prices that partners and end customers are willing to pay in those countries and regions. Furthermore, we anticipate that the sales prices and
23
gross profits for our products will decrease over product life cycles. Decreased sales prices for any reason may reduce our gross profits and adversely affect our result of operations.
Seasonality may cause fluctuations in our revenue and results of operations.
We operate on a December 31 year end and believe that there are significant seasonal factors which may cause sequential product revenue growth to be greater for the second and fourth quarters of our year than our first and third quarters. We believe that this seasonality results from a number of factors, including the procurement, budgeting and deployment cycles of many of our end customers. Our rapid historical growth may have reduced the impact of seasonal or cyclical factors that might have influenced our business to date. As our increasing size causes our growth rate to slow, seasonal or cyclical variations in our operations may become more pronounced over time and may materially affect our business, financial condition, results of operations and prospects.
If we are unable to hire, retain, train and motivate qualified personnel and senior management, our business, financial condition, results of operations and prospects could suffer.
Our future success depends, in part, on our ability to continue to attract and retain highly skilled personnel, particularly software engineering and sales personnel. Competition for highly skilled personnel is often intense, especially in the San Francisco Bay Area where we have a substantial presence and need for highly skilled personnel. Many of the companies with which we compete for experienced personnel have greater resources than we have to provide more attractive compensation packages and other amenities. Research and development personnel are aggressively recruited by startup and emerging growth companies, which are especially active in many of the technical areas and geographic regions in which we conduct product development. In addition, in making employment decisions, particularly in the high-technology industry, job candidates often consider the value of the stock-based compensation they are to receive in connection with their employment. Declines in the market price of our stock could adversely affect our ability to attract, motivate or retain key employees. If we are unable to attract or retain qualified personnel, or if there are delays in hiring required personnel, our business, financial condition, results of operations and prospects may be seriously harmed.
Also, to the extent we hire personnel from competitors, we may be subject to allegations that such personnel has been improperly solicited, that such personnel has divulged proprietary or other confidential information or that former employers own certain inventions or other work product. Such claims could result in litigation. Please see “—We may become involved in litigation that may materially adversely affect us.”
Our future performance also depends on the continued services and continuing contributions of our senior management to execute our business plan and to identify and pursue new opportunities and product innovations. Our employment arrangements with our employees do not require that they continue to work for us for any specified period, and therefore, they could terminate their employment with us at any time. The loss of our key personnel, including Jayshree Ullal, our Chief Executive Officer, Andy Bechtolsheim, our Founder and Chief Development Officer, and Kenneth Duda, our Founder, Chief Technology Officer and SVP Software Engineering or other members of our senior management team, sales and marketing team or engineering team, or any difficulty attracting or retaining other highly qualified personnel in the future, could significantly delay or prevent the achievement of our development and strategic objectives, which could adversely affect our business, financial condition, results of operations and prospects.
We are subject to a number of risks associated with the expansion of our international sales and operations.
Our ability to grow our business and our future success will depend to a significant extent on our ability to expand our operations and customer base worldwide. We have a limited history of marketing, selling and supporting our products and services internationally. Operating in a global marketplace, we are subject to risks associated with having an international reach and requirements such as compliance with applicable anticorruption laws.
One such applicable anticorruption law is the U.S. Foreign Corrupt Practices Act, or FCPA, which generally prohibits U.S. companies and its employees and intermediaries from making corrupt payments to foreign officials for the purpose of obtaining or keeping business, securing an advantage and directing business to another, and requires companies to maintain accurate books and records and a system of internal accounting controls. Under the FCPA, U.S. companies may be held liable for the corrupt actions taken by directors, officers, employees, agents, or other strategic or local partners or representatives. As such, if we or our intermediaries fail to comply with the requirements of the FCPA or similar legislation, governmental authorities in the U.S. and elsewhere could seek to impose civil and/or criminal fines and penalties which could have a material adverse effect on our business, results of operations and financial conditions. We are currently in the early stages of implementing an anticorruption compliance program. Failure to comply with anti-corruption and anti-bribery laws, such as the FCPA and the United Kingdom Bribery Act of 2010, or the United Kingdom Bribery Act, and similar laws associated with our activities outside the U.S., could subject us to penalties and other adverse consequences. We intend to increase our international sales and business and, as such, the risk of violating laws such as the FCPA and United Kingdom Bribery Act increases.
Additionally, as a result of our international reach, we must hire and train experienced personnel to staff and manage our foreign operations. To the extent that we experience difficulties in recruiting, training, managing and retaining an international staff, and specifically staff related to sales management and sales personnel, we may experience difficulties in sales productivity in foreign markets. We also enter into strategic distributor and reseller relationships with companies in certain international markets where we do not have a local presence. If we are not able to maintain successful strategic distributor relationships internationally or to recruit additional companies to enter into strategic distributor relationships, our future success in these international markets could be limited. Business practices in the
24
international markets that we serve may differ from those in the U.S. and may require us in the future to include terms other than our standard terms in end-customer contracts, although to date we generally have not done so. To the extent that we may enter into end-customer contracts in the future that include non-standard terms related to payment, warranties or performance obligations, our results of operations may be adversely affected.
Additionally, our international sales and operations are subject to a number of risks, including the following:
• | greater difficulty in enforcing contracts and accounts receivable collection and longer collection periods; |
• | increased expenses incurred in establishing and maintaining our international operations; |
• | fluctuations in exchange rates between the U.S. dollar and foreign currencies where we do business; |
• | greater difficulty and costs in recruiting local experienced personnel; |
• | wage inflation in certain growing economies; |
• | general economic and political conditions in these foreign markets; |
• | economic uncertainty around the world as a result of sovereign debt issues; |
• | communication and integration problems resulting from cultural and geographic dispersion; |
• | limitations on our ability to access cash resources in our international operations; |
• | ability to establish necessary business relationships and to comply with local business requirements; |
• | risks associated with trade restrictions and foreign legal requirements, including the importation, certification and localization of our products required in foreign countries; |
• | greater risk of unexpected changes in regulatory practices, tariffs and tax laws and treaties; |
• | the uncertainty of protection for intellectual property rights in some countries; |
• | greater risk of a failure of foreign employees to comply with both U.S. and foreign laws, including antitrust regulations, the FCPA and any trade regulations ensuring fair trade practices; and |
• | heightened risk of unfair or corrupt business practices in certain geographies and of improper or fraudulent sales arrangements that may impact financial results and result in restatements of, or irregularities in, financial statements. |
These and other factors could harm our ability to gain future international revenue and, consequently, materially affect our business, financial condition, results of operations and prospects. Expanding our existing international operations and entering into additional international markets will require significant management attention and financial commitments. Our failure to successfully manage our international operations and the associated risks effectively could limit our future growth or materially adversely affect our business, financial condition, results of operations and prospects.
Our ability to sell our products is highly dependent on the quality of our support and services offerings, and our failure to offer high-quality support and services could have a material adverse effect on our business, financial condition, results of operations and prospects.
Once our products are deployed within our end customers’ networks, our end customers depend on our support organization and our channel partners to resolve any issues relating to our products. High-quality support is critical for the successful marketing and sale of our products. If we or our channel partners do not assist our end customers in deploying our products effectively, do not succeed in helping our end customers resolve post-deployment issues quickly or do not provide adequate ongoing support, it could adversely affect our ability to sell our products to existing end customers and could harm our reputation with potential end customers. In addition, as we expand our operations internationally, our support organization will face additional challenges, including those associated with delivering support, training and documentation in languages other than English. Our failure or the failure of our channel partners to maintain high-quality support and services could have a material adverse effect on our business, financial condition, results of operations and prospects.
We may become involved in litigation that may materially adversely affect us.
From time to time, we may become involved in various legal proceedings relating to matters incidental to the ordinary course of our business, including patent, copyright, commercial, product liability, employment, class action, whistleblower and other litigation and claims, and governmental and other regulatory investigations and proceedings. Such matters can be time-consuming, divert management’s attention and resources, cause us to incur significant expenses or liability and/or require us to change our business practices. Because of the potential risks, expenses and uncertainties of litigation, we may, from time to time, settle disputes, even where we have meritorious claims or defenses, by agreeing to settlement agreements. Because litigation is inherently unpredictable, we cannot assure you that the results of any of these actions will not have a material adverse effect on our business, financial condition, results of operations and prospects.
For more information regarding the litigation in which we are currently involved, see Part I, Item 3, of “Legal Proceedings,” in this Annual Report on Form 10-K.
Adverse economic conditions or reduced information technology and network infrastructure spending may adversely affect our business, financial condition, results of operations and prospects.
Our business depends on the overall demand for information technology, network connectivity and access to data and applications. Weak domestic or global economic conditions, fear or anticipation of such conditions or a reduction in information technology and
25
network infrastructure spending even if economic conditions improve, could adversely affect our business, financial condition, results of operations and prospects in a number of ways, including longer sales cycles, lower prices for our products and services, higher default rates among our distributors, reduced unit sales and lower or no growth. For example, the ongoing debt concerns in many countries in Europe have caused, and are likely to continue to cause, uncertainty and instability in local economies and in global financial markets, particularly if any future sovereign debt defaults or significant bank failures or defaults occur. Market uncertainty and instability in Europe could intensify or spread further, particularly if ongoing stabilization efforts prove insufficient. Concerns have been raised as to the financial, political and legal ineffectiveness of measures taken to date. Continuing or worsening economic instability in Europe and elsewhere could adversely affect spending for IT, network infrastructure, systems and tools. Continued turmoil in the geopolitical environment in many parts of the world may also affect the overall demand for our products. Although we do not believe that our business, financial condition, results of operations and prospects have been significantly adversely affected by economic and political uncertainty in Europe and other countries, deterioration of such conditions may harm our business, financial condition, results of operations and prospects in the future. A prolonged period of economic uncertainty or a downturn may also significantly affect financing markets, the availability of capital and the terms and conditions of financing arrangements, including the overall cost of financing as well as the financial health or creditworthiness of our end customers. Circumstances may arise in which we need, or desire, to raise additional capital, and such capital may not be available on commercially reasonable terms, or at all.
Assertions by third parties of infringement or other violations by us of their intellectual property rights, or other lawsuits asserted against us, could result in significant costs and substantially harm our business, financial condition, results of operations and prospects.
Patent and other intellectual property disputes are common in the network infrastructure industry and have resulted in protracted and expensive litigation for many companies. Many companies in the network infrastructure industry, including our competitors and other third parties, as well as non-practicing entities, own large numbers of patents, copyrights, trademarks and trade secrets, which they may use to assert claims of patent infringement, misappropriation or other violations of intellectual property rights against us. From time to time, they have or may in the future also assert such claims against us, our end customers or channel partners whom we typically indemnify against claims that our products infringe, misappropriate or otherwise violate the intellectual property rights of third parties.
As the number of products and competitors in our market increases and overlaps occur, claims of infringement, misappropriation and other violations of intellectual property rights may increase. Any claim of infringement, misappropriation or other violations of intellectual property rights by a third party, even those without merit, could cause us to incur substantial costs defending against the claim, distract our management from our business and require us to cease use of such intellectual property. In addition, some claims for patent infringement may relate to subcomponents that we purchase from third parties. If these third parties are unable or unwilling to indemnify us for these claims, we could be substantially harmed.
The patent portfolios of most of our competitors are larger than ours. This disparity may increase the risk that our competitors may sue us for patent infringement and may limit our ability to counterclaim for patent infringement or settle through patent cross-licenses. In addition, future assertions of patent rights by third parties, and any resulting litigation, may involve patent holding companies or other adverse patent owners who have no relevant product revenue and against whom our own patents may therefore provide little or no deterrence or protection. We cannot assure you that we are not infringing or otherwise violating any third-party intellectual property rights.
The third-party asserters of intellectual property claims may be unreasonable in their demands, or may simply refuse to settle, which could lead to expensive settlement payments, prolonged periods of litigation and related expenses, additional burdens on employees or other resources, distraction from our business, supply stoppages and lost sales.
An adverse outcome of a dispute (including those lawsuits described in Part I, Item 3 of “Legal Proceedings”) may require us to pay substantial damages including treble damages if we are found to have willfully infringed a third party’s patents; cease making, licensing or using solutions that are alleged to infringe or misappropriate the intellectual property of others; expend additional development resources to attempt to redesign our products or services or otherwise to develop non-infringing technology, which may not be successful; enter into potentially unfavorable royalty or license agreements in order to obtain the right to use necessary technologies or intellectual property rights; and indemnify our partners and other third parties. Any damages or royalty obligations we may become subject to as a result of an adverse outcome, and any third-party indemnity we may need to provide, could harm our business, financial condition, results of operations and prospects. Royalty or licensing agreements, if required or desirable, may be unavailable on terms acceptable to us, or at all, and may require significant royalty payments and other expenditures. Further, there is little or no information publicly available concerning market or fair values for license fees, which can lead to overpayment of license or settlement fees. In addition, some licenses may be non-exclusive, and therefore our competitors may have access to the same technology licensed to us. Suppliers subject to third-party intellectual property claims also may choose or be forced to discontinue or alter their arrangements with us, with little or no advance notice to us. Any of these events could seriously harm our business, financial condition, results of operations and prospects.
For more information regarding the intellectual property disputes in which we are currently involved, see Part I, Item 3 of “Legal Proceedings,” in this Annual Report on Form 10-K.
26
Our standard sales contracts contain indemnification provisions requiring us to defend our end customers against third-party claims, including against infringement of certain intellectual property rights, that could expose us to losses which could seriously harm our business, financial conditions, results of operations and prospects.
Under the indemnification provisions of our standard sales contracts, we agree to defend our end customers against third-party claims asserting infringement of certain intellectual property rights, which may include patents, copyrights, trademarks or trade secrets, and to pay judgments entered on such claims. Our exposure under these indemnification provisions is frequently limited to the total amount paid by our end customer under the agreement. However, certain agreements include indemnification provisions that could potentially expose us to losses in excess of the amount received under the agreement. Any of these events, including claims for indemnification, could seriously harm our business, financial condition, results of operations and prospects.
If we are unable to protect our intellectual property rights, our competitive position could be harmed or we could be required to incur significant expenses to enforce our rights.
We depend on our ability to protect our proprietary technology. We rely on trade secret, patent, copyright and trademark laws and confidentiality agreements with employees and third parties, all of which offer only limited protection.
The process of obtaining patent protection is expensive and time-consuming, and we may not be able to prosecute all necessary or desirable patent applications at a reasonable cost or in a timely manner. We may choose not to seek patent protection for certain innovations and may choose not to pursue patent protection in certain jurisdictions. Further, we do not know whether any of our pending patent applications will result in the issuance of patents or whether the examination process will require us to narrow our claims. To the extent that additional patents are issued from our patent applications, which is not certain, they may be contested, circumvented or invalidated in the future. Moreover, the rights granted under any issued patents may not provide us with proprietary protection or competitive advantages, and, as with any technology, competitors may be able to develop similar or superior technologies to our own now or in the future. In addition, we rely on confidentiality or license agreements with third parties in connection with their use of our products and technology. There is no guarantee that such parties will abide by the terms of such agreements or that we will be able to adequately enforce our rights, in part because we rely on “shrink-wrap” licenses in some instances.
We have not registered our trademarks in all geographic markets. Failure to secure those registrations could adversely affect our ability to enforce and defend our trademark rights and result in indemnification claims. Further, any claim of infringement by a third party, even those claims without merit, could cause us to incur substantial costs defending against such claim, could divert management attention from our business and could require us to cease use of such intellectual property in certain geographic markets.
Despite our efforts, the steps we have taken to protect our proprietary rights may not be adequate to preclude misappropriation of our proprietary information or infringement of our intellectual property rights, and our ability to police such misappropriation or infringement is uncertain, particularly in countries outside of the United States.
Detecting and protecting against the unauthorized use of our products, technology and proprietary rights is expensive, difficult and, in some cases, impossible. Litigation may be necessary in the future to enforce or defend our intellectual property rights, to protect our trade secrets or to determine the validity and scope of the proprietary rights of others. Such litigation could result in substantial costs and diversion of management resources, either of which could harm our business, financial condition, results of operations and prospects, and there is no guarantee that we would be successful. Furthermore, many of our current and potential competitors have the ability to dedicate substantially greater resources to protecting their technology or intellectual property rights than we do. Accordingly, despite our efforts, we may not be able to prevent third parties from infringing upon or misappropriating our intellectual property, which could result in a substantial loss of our market share.
We rely on the availability of licenses to third-party software and other intellectual property.
Many of our products and services include software or other intellectual property licensed from third parties, and we otherwise use software and other intellectual property licensed from third parties in our business. This exposes us to risks over which we may have little or no control. For example, a licensor may have difficulties keeping up with technological changes or may stop supporting the software or other intellectual property that it licenses to us. Also, it will be necessary in the future to renew licenses, expand the scope of existing licenses or seek new licenses, relating to various aspects of these products and services or otherwise relating to our business, which may result in increased license fees. These licenses may not be available on acceptable terms, if at all. In addition, a third party may assert that we or our end customers are in breach of the terms of a license, which could, among other things, give such third party the right to terminate a license or seek damages from us, or both. The inability to obtain or maintain certain licenses or other rights or to obtain or maintain such licenses or rights on favorable terms, or the need to engage in litigation regarding these matters, could result in delays in releases of products and services and could otherwise disrupt our business, until equivalent technology can be identified, licensed or developed, if at all, and integrated into our products and services or otherwise in the conduct of our business. Moreover, the inclusion in our products and services of software or other intellectual property licensed from third parties on a nonexclusive basis may limit our ability to differentiate our products from those of our competitors. Any of these events could have a material adverse effect on our business, financial condition, results of operations and prospects.
27
Our products contain third-party open source software components, and failure to comply with the terms of the underlying open source software licenses could restrict our ability to sell our products.
Our products contain software modules licensed to us by third-party authors under “open source” licenses. Use and distribution of open source software may entail greater risks than use of third-party commercial software, as open source licensors generally do not provide warranties or other contractual protections regarding infringement claims or the quality of the code. Some open source licenses contain requirements that we make available source code for modifications or derivative works we create based upon the type of open source software that we use. If we combine our software with open source software in a certain manner, we could, under certain open source licenses, be required to release portions of the source code of our software to the public. This would allow our competitors to create similar products with lower development effort and time and ultimately could result in a loss of product sales for us.
Although we monitor our use of open source software to avoid subjecting our products to conditions we do not intend, the terms of many open source licenses have not been interpreted by U.S. courts, and these licenses could be construed in a way that could impose unanticipated conditions or restrictions on our ability to commercialize our products. Moreover, we cannot assure you that our processes for controlling our use of open source software in our products will be effective. If we are held to have breached the terms of an open source software license, we could be required to seek licenses from third parties to continue offering our products on terms that are not economically feasible, to re-engineer our products, to discontinue the sale of our products if re-engineering could not be accomplished on a timely basis or to make generally available, in source code form, our proprietary code, any of which could adversely affect our business, financial condition, results of operations and prospects.
Sales of our 7000 Series of switches generate most of our product revenue, and if we are unable to continue to grow sales of these products, our business, financial condition, results of operations and prospects will suffer.
Historically, we have derived substantially all of our product revenue from sales of our 7000 Series of switches, and we expect to continue to do so for the foreseeable future. A decline in the price of these products and related services, or our inability to increase sales of these products, would harm our business, financial condition, results of operations and prospects more seriously than if we derived significant revenue from a larger variety of product lines and services. Our future financial performance will also depend upon successfully developing and selling next-generation versions of our 7000 Series of switches. If we fail to deliver new products, new features, or new releases that end customers want and that allow us to maintain leadership in what will continue to be a competitive market environment, our business, financial condition, results of operations and prospects will be harmed.
We expect our gross margins to vary over time and to be adversely affected by numerous factors.
We expect our gross margins to vary over time and to be affected by numerous factors, including:
• | changes in end-customer or product mix, including mix of configurations within each product group; |
• | introduction of new products, including products with price-performance advantages; |
• | our ability to reduce production costs; |
• | entry into new markets or growth in lower margin markets; |
• | entry in markets with different pricing and cost structures; |
• | pricing discounts; |
• | increases in material, labor or other manufacturing-related costs, which could be significant especially during periods of supply constraints; |
• | excess inventory and inventory holding charges; |
• | obsolescence charges; |
• | changes in shipment volume; |
• | the timing of revenue recognition and revenue deferrals; |
• | increased cost, loss of cost savings or dilution of savings due to changes in component pricing or charges incurred due to inventory holding periods if parts ordering does not correctly anticipate product demand or if the financial health of either contract manufacturers or suppliers deteriorates; |
• | lower than expected benefits from value engineering; |
• | increased price competition; |
• | changes in distribution channels; |
• | increased warranty costs; and |
• | how well we execute our strategy and operating plans. |
To remain competitive, we must successfully manage product introductions and transitions.
The success of new product introductions depends on a number of factors including, but not limited to, timely and successful product development, market acceptance, our ability to manage the risks associated with new product production ramp-up issues, the availability of new merchant silicon chips, the effective management of purchase commitments and inventory in line with anticipated product demand, the availability of products in appropriate quantities and costs to meet anticipated demand, and the risk that new products may have quality or other defects or deficiencies in the early stages of introduction. Accordingly, we cannot determine in advance the ultimate effect of new product introductions and transitions on our business and results of operations.
28
Our sales cycles can be long and unpredictable, and our sales efforts require considerable time and expense. As a result, our sales and revenue are difficult to predict and may vary substantially from period to period, which may cause our results of operations to fluctuate significantly.
The timing of our sales and revenue recognition is difficult to predict because of the length and unpredictability of our products’ sales cycles. A sales cycle is the period between initial contact with a prospective end customer and any sale of our products. End-customer orders often involve the purchase of multiple products. These orders are complex and difficult to complete because prospective end customers generally consider a number of factors over an extended period of time before committing to purchase the products and solutions we sell. End customers, especially in the case of our large end customers, often view the purchase of our products as a significant and strategic decision and require considerable time to evaluate, test and qualify our products prior to making a purchase decision and placing an order. The length of time that end customers devote to their evaluation, contract negotiation and budgeting processes varies significantly. Our products’ sales cycles can be lengthy in certain cases, especially with respect to our prospective large end customers. During the sales cycle, we expend significant time and money on sales and marketing activities and make investments in evaluation equipment, all of which lower our operating margins, particularly if no sale occurs. Even if an end customer decides to purchase our products, there are many factors affecting the timing of our recognition of revenue, which makes our revenue difficult to forecast. For example, there may be unexpected delays in an end customer’s internal procurement processes, particularly for some of our larger end customers for which our products represent a very small percentage of their total procurement activity. There are many other factors specific to end customers that contribute to the timing of their purchases and the variability of our revenue recognition, including the strategic importance of a particular project to an end customer, budgetary constraints and changes in their personnel.
Even after an end customer makes a purchase, there may be circumstances or terms relating to the purchase that delay our ability to recognize revenue from that purchase. For example, the sale of our products may be subject to acceptance testing. In addition, the significance and timing of our product enhancements, and the introduction of new products by our competitors, may also affect end customers’ purchases. For all of these reasons, it is difficult to predict whether a sale will be completed, the particular period in which a sale will be completed or the period in which revenue from a sale will be recognized. If our sales cycles lengthen, our revenue could be lower than expected, which would have an adverse effect on our business, financial condition, results of operations and prospects.
Our business depends on end customers renewing their maintenance and support contracts. Any decline in maintenance renewals could harm our future business, financial condition, results of operations and prospects.
We typically sell our products with maintenance and support as part of the initial purchase, and a portion of our annual revenue comes from renewals of maintenance and support contracts. Our end customers have no obligation to renew their maintenance and support contracts after the expiration of the initial period, and they may elect not to renew their maintenance and support contracts, to renew their maintenance and support contracts at lower prices through alternative channel partners or to reduce the product quantity under their maintenance and support contracts, thereby reducing our future revenue from maintenance and support contracts. If our end customers, especially our large end customers, do not renew their maintenance and support contracts or if they renew them on terms that are less favorable to us, our revenue may decline and our business, financial condition, results of operations and prospects will suffer.
Industry consolidation may lead to increased competition and may harm our business, financial condition, results of operations and prospects.
Most of our competitors have made acquisitions and/or have entered into or extended partnerships or other strategic relationships to offer more comprehensive product lines, including cloud networking solutions. For example, in the last few years alone Dell acquired Force10, IBM acquired Blade Network Technology, Hewlett Packard acquired 3Com, Brocade acquired Foundry Networks, Juniper acquired Contrail and VMware acquired Nicira.
Moreover, large system vendors are increasingly seeking to deliver top-to-bottom cloud networking solutions to end customers that combine cloud-focused hardware and software solutions to provide an alternative to our products.
We expect this trend to continue as companies attempt to strengthen their market positions in an evolving industry and as companies are acquired or are unable to continue operations. Companies that are strategic alliance partners in some areas of our business may acquire or form alliances with our competitors, thereby reducing their business with us. Industry consolidation may result in stronger competitors that are better able to compete with us, including any competitors that seek to become sole source vendors for end customers. This could lead to more variability in our results of operations and could have a material adverse effect on our business, financial condition, results of operations and prospects.
Our business is subject to the risks of warranty claims, product returns, product liability and product defects.
Our products are very complex and despite testing prior to their release, they have contained and may contain undetected defects or errors, especially when first introduced or when new versions are released. Product defects or errors could affect the performance of our products and could delay the development or release of new products or new versions of products, adversely affect our reputation and our end customers’ willingness to buy products from us and adversely affect market acceptance or perception of our products. Real or perceived errors, failures or bugs in our products could cause us to lose revenue or market share, increase our service costs, cause us to incur substantial costs in redesigning the products, cause us to lose significant end-customers, subject us to liability for damages and
29
divert our resources from other tasks, any one of which could materially and adversely affect our business, results of operations and financial condition.
Additionally, real or perceived errors, failures or bugs in our products could result in claims by end customers for losses that they sustain. If end customers make these types of claims, we may be required, or may choose, for end-customer relations or other reasons, to expend additional resources in order to address the problem. We may also be required to repair or replace such products or provide a refund for the purchase price for such products. Liability provisions in our standard terms and conditions of sale, and those of our resellers and distributors, may not be enforceable under some circumstances or may not fully or effectively protect us from end-customer claims and related liabilities and costs, including indemnification obligations under our agreements with end customers, resellers and distributors. The sale and support of our products also entail the risk of product liability claims. We maintain insurance to protect against certain types of claims associated with the use of our products, but our insurance coverage may not adequately cover any such claims. In addition, even claims that ultimately are unsuccessful could result in expenditures of funds in connection with litigation and divert management’s time and other resources.
In addition to our own direct sales force, we rely on distributors, systems integrators and value-added resellers to sell our products, and our failure to effectively develop, manage or prevent disruptions to our distribution channels and the processes and procedures that support them could cause a reduction in the number of end customers of our products.
Our future success is highly dependent upon maintaining our relationships with distributors, systems integrators and value-added resellers and establishing additional sales channel relationships. We anticipate that sales of our products to a limited number of channel partners will continue to account for a material portion of our total product revenue for the foreseeable future. We provide our channel partners with specific training and programs to assist them in selling our products, but these steps may not be effective. In addition, our channel partners may be unsuccessful in marketing, selling and supporting our products and services. If we are unable to develop and maintain effective sales incentive programs for our channel partners, we may not be able to incentivize these partners to sell our products to end customers. These partners may have incentives to promote our competitors’ products to the detriment of our own or may cease selling our products altogether. One of our channel partners could elect to consolidate or enter into a strategic partnership with one of our competitors, which could reduce or eliminate our future opportunities with that channel partner. Our agreements with our channel partners may generally be terminated for any reason by either party with advance notice. We may be unable to retain these channel partners or secure additional or replacement channel partners. The loss of one or more of our significant channel partners requires extensive training, and any new or expanded relationship with a channel partner may take several months or more to achieve productivity.
Where we rely on the channel partners for sales of our products, we may have little or no contact with the ultimate users of our products that purchase through such channel partners, thereby making it more difficult for us to establish brand awareness, ensure proper delivery and installation of our products, service ongoing end-customer requirements, estimate end-customer demand and respond to evolving end-customer needs. In addition, our channel partner sales structure could subject us to lawsuits, potential liability and reputational harm if, for example, any of our channel partners misrepresent the functionality of our products or services to end customers, fail to comply with their contractual obligations or violate laws or our corporate policies. If we fail to effectively manage our existing sales channels, or if our channel partners are unsuccessful in fulfilling the orders for our products, if we are unable to enter into arrangements with, and retain a sufficient number of, high-quality channel partners in each of the regions in which we sell products and keep them motivated to sell our products, our ability to sell our products and our business, financial condition, results of operations and prospects will be harmed.
A portion of our revenue is generated by sales to government entities, which are subject to a number of challenges and risks.
We anticipate increasing our sales efforts to U.S. and foreign, federal, state and local governmental end customers in the future. Sales to government entities are subject to a number of risks. Selling to government entities can be highly competitive, expensive and time consuming, often requiring significant upfront time and expense without any assurance that these efforts will generate a sale. The substantial majority of our sales to date to government entities have been made indirectly through our channel partners. Government certification requirements for products like ours may change and, in doing so, restrict our ability to sell into the government sector until we have attained revised certifications. Government demand and payment for our products and services may be affected by public sector budgetary cycles and funding authorizations, with funding reductions or delays adversely affecting public sector demand for our products and services. Government entities may have statutory, contractual or other legal rights to terminate contracts with our distributors and resellers for convenience or due to a default, and any such termination may adversely impact our future business, financial condition, results of operations and prospects. Selling to government entities may also require us to comply with various regulations that are not applicable to sales to non-government entities, including regulations that may relate to pricing, classified material and other matters. Complying with such regulations may also require us to put in place controls and procedures to monitor compliance with the applicable regulations that may be costly or not possible. We are not currently certified to perform work under classified contracts with government entities. Failure to comply with any such regulations could adversely affect our business, prospects, results of operations and financial condition. Governments routinely investigate and audit government contractors’ administrative processes, and any unfavorable audit could result in the government ceasing to buy our products and services, a reduction of revenue, fines or civil or criminal liability if the audit uncovers improper or illegal activities, any of which could materially adversely affect our business, financial condition, results of operations and prospects. The U.S. government may require certain products that it purchases to be manufactured in the U.S. and other relatively high-cost manufacturing locations, and we may not manufacture all products in locations that meet these requirements. Any
30
of these and other circumstances could have a material adverse effect on our business, financial condition, results of operations and prospects.
Our products must interoperate with operating systems, software applications and hardware that is developed by others, and if we are unable to devote the necessary resources to ensure that our products interoperate with such software and hardware, we may lose or fail to increase market share and experience a weakening demand for our products.
Generally, our products comprise only a part of the data center and must interoperate with our end customers’ existing infrastructure, specifically their networks, servers, software and operating systems, which may be manufactured by a wide variety of vendors and original equipment manufacturers, or OEMs. Our products must comply with established industry standards in order to interoperate with the servers, storage, software and other networking equipment in the data center such that all systems function efficiently together. We depend on the vendors of servers and systems in a data center to support prevailing industry standards. Often, these vendors are significantly larger and more influential in driving industry standards than we are. Also, some industry standards may not be widely adopted or implemented uniformly, and competing standards may emerge that may be preferred by our end customers.
In addition, when new or updated versions of these software operating systems or applications are introduced, we must sometimes develop updated versions of our software so that our products will interoperate properly. We may not accomplish these development efforts quickly, cost-effectively or at all. These development efforts require capital investment and the devotion of engineering resources. If we fail to maintain compatibility with these systems and applications, our end customers may not be able to adequately utilize our products, and we may lose or fail to increase market share and experience a weakening in demand for our products, among other consequences, which would adversely affect our business, financial condition, results of operations and prospects.
We are subject to governmental export and import controls that could impair our ability to compete in international markets or subject us to liability if we violate these controls.
Our products may be subject to various export controls and because we incorporate encryption technology into certain of our products, certain of our products may be exported from various countries only with the required export license or through an export license exception. If we were to fail to comply with the applicable export control laws, customs regulations, economic sanctions or other applicable laws, we could be subject to monetary damages or the imposition of restrictions which could be material to our business, operating results and prospects and could also harm our reputation. Further, there could be criminal penalties for knowing or willful violations, including incarceration for culpable employees and managers. Obtaining the necessary export license or other authorization for a particular sale may be time-consuming and may result in the delay or loss of sales opportunities. Furthermore, certain export control and economic sanctions laws prohibit the shipment of certain products, technology, software and services to embargoed countries and sanctioned governments, entities, and persons. Even though we take precautions to ensure that our channel partners comply with all relevant regulations, any failure by our channel partners to comply with such regulations could have negative consequences, including reputational harm, government investigations and penalties.
As our company grows we also continue developing procedures and controls to comply with export control and other applicable laws. Historically, we have had some instances where we inadvertently have not fully complied with certain export control laws, but we have disclosed them to, and implemented corrective actions with, the appropriate government agencies.
In addition, various countries regulate the import of certain encryption technology, including through import permit and license requirements, and have enacted laws that could limit our ability to distribute our products or could limit our end customers’ ability to implement our products in those countries. Any change in export or import regulations, economic sanctions or related legislation, shift in the enforcement or scope of existing regulations or change in the countries, governments, persons or technologies targeted by such regulations could result in decreased use of our products by, or in our decreased ability to export or sell our products to, existing or potential end customers with international operations or create delays in the introduction of our products into international markets. Any decreased use of our products or limitation on our ability to export or sell our products could adversely affect our business, financial condition, results of operations and prospects.
Failure to comply with governmental laws and regulations could harm our business, financial condition, results of operations and prospects.
Our business is subject to regulation by various federal, state, local and foreign governmental agencies, including agencies responsible for monitoring and enforcing employment and labor laws, workplace safety, product safety, environmental laws, consumer protection laws, anti-bribery laws, import/export controls, federal securities laws and tax laws and regulations. In certain jurisdictions, these regulatory requirements may be more stringent than those in the United States. From time to time, we may receive inquiries from such governmental agencies or we may make voluntary disclosures regarding our compliance with applicable governmental regulations or requirements relating to import/export controls, federal securities laws and tax laws and regulations which could lead to formal investigations. Noncompliance with applicable government regulations or requirements could subject us to sanctions, mandatory product recalls, enforcement actions, disgorgement of profits, fines, damages, civil and criminal penalties or injunctions. If any governmental sanctions are imposed, or if we do not prevail in any possible civil or criminal litigation, our business, financial condition, results of operations and prospects could be materially adversely affected. In addition, responding to any action will likely result in a significant
31
diversion of management’s attention and resources and an increase in professional fees. Enforcement actions and sanctions could harm our business, financial condition, results of operations and prospects.
We may invest in or acquire other businesses which could require significant management attention, disrupt our business, dilute stockholder value and adversely affect our business, financial condition, results of operations and prospects.
As part of our business strategy, we have and may continue to make investments in complementary companies, products or technologies which could involve licenses, additional channels of distribution, discount pricing or investments in or acquisitions of other companies. However, we do not have significant experience in making investments in other companies nor have we made any acquisitions to date, and as a result, our ability as an organization to evaluate and/or complete investments or acquire and integrate other companies, products or technologies in a successful manner is unproven. We may not be able to find suitable investment or acquisition candidates, and we may not be able to complete such investments or acquisitions on favorable terms, if at all. If we do complete investments or acquisitions, we may not ultimately strengthen our competitive position or achieve our goals, and any investments or acquisitions we complete could be viewed negatively by our end customers, investors and securities analysts.
In addition, investments and acquisitions may result in unforeseen operating difficulties and expenditures. For example, if we are unsuccessful at integrating any acquisitions or retaining key talent from those acquisitions, or the technologies associated with such acquisitions, into our company, the business, financial condition, results of operations and prospects of the combined company could be adversely affected. Any integration process may require significant time and resources, and we may not be able to manage the process successfully. We may not successfully evaluate or utilize the acquired technology or personnel or accurately forecast the financial effects of an acquisition transaction, including accounting charges. We may have to pay cash, incur debt or issue equity securities to pay for any such investment or acquisition, each of which could adversely affect our financial condition or the market price of our common stock. The sale of equity or issuance of debt to finance any such acquisitions could result in dilution to our stockholders. The incurrence of indebtedness would result in increased fixed obligations and could also include covenants or other restrictions that would impede our ability to manage our operations. Moreover, if the investment or acquisition becomes impaired, we may be required to take an impairment charge, which could adversely affect our financial condition or the market price of our common stock.
If we needed to raise additional capital to expand our operations and invest in new products, our failure to do so on favorable terms could reduce our ability to compete and could harm our business, financial condition, results of operations and prospects.
We expect that our existing cash and cash equivalents, will be sufficient to meet our anticipated cash needs for the foreseeable future. If we did need to raise additional funds to expand our operations and invest in new products, we may not be able to obtain additional debt or equity financing on favorable terms, if at all. If we raise additional equity financing, our stockholders may experience significant dilution of their ownership interests, and the market price of our common stock could decline. Furthermore, if we engage in debt financing, the holders of such debt would have priority over the holders of common stock, and we may be required to accept terms that restrict our ability to incur additional indebtedness or impose other restrictions on our business. We may also be required to take other actions that would otherwise be in the interests of the debt holders, including maintaining specified liquidity or other ratios, any of which could harm our business, financial condition, results of operations and prospects. If we need additional capital and cannot raise it on acceptable terms, if at all, we may not be able to, among other things:
• | evolve or enhance our products and services; |
• | continue to expand our sales and marketing and research and development organizations; |
• | acquire complementary technologies, products or businesses; |
• | expand operations, in the U.S. or internationally; |
• | hire, train and retain employees; or |
• | respond to competitive pressures or unanticipated working capital requirements. |
Our failure to do any of these things could seriously harm our business, financial condition, results of operations and prospects.
If our estimates or judgments relating to our critical accounting policies are based on assumptions that change or prove to be incorrect, our results of operations could fall below expectations of securities analysts and investors, resulting in a decline in the market price of our common stock.
The preparation of financial statements in conformity with accounting principles generally accepted in the United States of America, requires management to make estimates and assumptions that affect the amounts reported in the consolidated financial statements and accompanying notes. We base our estimates on historical experience and on various other assumptions that we believe to be reasonable under the circumstances, as described in Part II Item 7 of “Management’s Discussion and Analysis of Financial Condition and Results of Operations,” the results of which form the basis for making judgments about the carrying values of assets, liabilities, equity, revenue and expenses that are not readily apparent from other sources. Significant assumptions and estimates used in preparing our consolidated financial statements include those related to revenue recognition, stock-based compensation, contract manufacturing liabilities and income taxes. If our assumptions change or if actual circumstances differ from those in our assumptions, our results of operations may be adversely affected and may fall below the expectations of securities analysts and investors, resulting in a decline in the market price of our common stock.
32
We are exposed to the credit risk of our channel partners and some of our end customers, which could result in material losses.
Most of our sales are on an open credit basis, with standard payment terms of 30 days in the United States and, because of local customs or conditions, longer in some markets outside the U.S.. We monitor individual end-customer payment capability in granting such open credit arrangements, seek to limit such open credit to amounts we believe the end customers can pay and maintain reserves we believe are adequate to cover exposure for doubtful accounts. We are unable to recognize revenue from shipments until the collection of those amounts becomes reasonably assured. Any significant delay or default in the collection of significant accounts receivable could result in an increased need for us to obtain working capital from other sources, possibly on worse terms than we could have negotiated if we had established such working capital resources prior to such delays or defaults. Any significant default could adversely affect our results of operations and delay our ability to recognize revenue.
A material portion of our sales is derived through our distributors, systems integrators and value-added resellers. Some of our distributors, systems integrators and value-added resellers may experience financial difficulties, which could adversely affect our collection of accounts receivable. Distributors tend to have more limited financial resources than other systems integrators, value-added resellers and end customers. Distributors represent potential sources of increased credit risk because they may be less likely to have the reserve resources required to meet payment obligations. Our exposure to credit risks of our channel partners may increase if our channel partners and their end customers are adversely affected by global or regional economic conditions. One or more of these channel partners could delay payments or default on credit extended to them, either of which could materially adversely affect our business, financial condition, results of operations and prospects.
If we or our partners fail to comply with environmental requirements, our business, financial condition, results of operations, prospects and reputation could be adversely affected.
We and our partners, including our contract manufacturers, are subject to various local, state, federal and international environmental laws and regulations, including laws governing the hazardous material content of our products and laws relating to the collection, recycling and disposal of electrical and electronic equipment. Examples of these laws and regulations include the European Union, or EU, Restrictions on the use of Hazardous Substances Directive, or RoHS Directive, and the EU Waste Electrical and Electronic Equipment Directive, or WEEE Directive, as well as the implementing legislation of the EU member states. Similar laws and regulations have been passed or are pending in China, South Korea, Norway and Japan and may be enacted in other regions, including in the U.S., and we or our partners, including our contract manufacturers, are, or may in the future be, subject to these laws and regulations.
The EU RoHS Directive and the similar laws of other jurisdictions limit the content of certain hazardous materials such as lead, mercury and cadmium in the manufacture of electrical equipment, including our products. Our products currently comply with the RoHS Directive; however, if there are future changes to this directive, we may be required to re-engineer our products to use components compatible with these regulations. This re-engineering and component substitution could result in additional costs to us or disrupt our operations or logistics.
We are also subject to environmental laws and regulations governing the management and disposal of hazardous materials and wastes. Our failure, or the failure of our partners, including our contract manufacturers, to comply with past, present and future environmental laws could result in fines, penalties, third-party claims, reduced sales of our products, substantial product inventory write-offs and reputational damage, any of which could harm our business, financial condition, results of operations and prospects. We also expect that our business will be affected by new environmental laws and regulations on an ongoing basis applicable to us and our partners, including our contract manufacturers. To date, our expenditures for environmental compliance have not had a material effect on our results of operations or cash flows. Although we cannot predict the future effect of such laws or regulations, they will likely result in additional costs or require us to change the content or manufacturing of our products, which could have a material adverse effect on our business, financial condition, results of operations and prospects.
We are exposed to fluctuations in currency exchange rates, which could adversely affect our business, financial condition, results of operations and prospects.
Our sales contracts are primarily denominated in U.S. dollars, and therefore substantially all of our revenue is not subject to foreign currency risk. However, a strengthening U.S. dollar could increase the real cost of our products to our end customers outside of the U.S., which could adversely affect our business, financial condition, results of operations and prospects. In addition, a decrease in the value of the U.S. dollar relative to foreign currencies could increase our product and operating costs in foreign locations. Further, an increasing portion of our operating expenses is incurred outside the U.S., is denominated in foreign currencies and is subject to fluctuations due to changes in foreign currency exchange rates. If we are not able to successfully hedge against the risks associated with the currency fluctuations, our business, financial condition, results of operations and prospects could be adversely affected.
Our business is subject to the risks of earthquakes, fire, power outages, floods and other catastrophic events and to interruption by manmade problems such as terrorism.
Our corporate headquarters and the operations of our key manufacturing vendors, logistics providers and partners, as well as many of our customers, are located in areas exposed to risks of natural disasters such as earthquakes and tsunamis, including the San Francisco Bay area, Japan and Taiwan. A significant natural disaster, such as an earthquake, tsunami, fire or a flood, or other catastrophic event such as a disease outbreak, could have a material adverse effect on our or their business, which could in turn materially affect our
33
financial condition, results of operations and prospects. For example, in the event our service providers’ information technology systems or manufacturing or logistics abilities are hindered by any of the events discussed above, shipments could be delayed, which could result in missed financial targets, such as revenue and shipment targets, for a particular quarter. Further, if a natural disaster occurs in a region from which we derive a significant portion of our revenue, end customers in that region may delay or forego purchases of our products, which may materially and adversely affect our business, financial condition, results of operations and prospects. In addition, acts of terrorism could cause disruptions in our business or the business of our manufacturer, logistics providers, partners or end customers or the economy as a whole. Given our typical concentration of sales at each quarter end, any disruption in the business of our manufacturer, logistics providers, partners or end customers that affects sales at the end of our quarter could have a particularly significant adverse effect on our quarterly results. All of the aforementioned risks may be augmented if our disaster recovery plans and those of our manufacturers, logistics providers or partners prove to be inadequate. To the extent that any of the above results in delays or cancellations of end-customer orders, or delays in the manufacture, deployment or shipment of our products, our business, financial condition, results of operations and prospects would be adversely affected.
Breaches of our cybersecurity systems could degrade our ability to conduct our business operations and deliver products and services to our customers, delay our ability to recognize revenue, compromise the integrity of our software products, result in significant data losses and the theft of our intellectual property, damage our reputation, expose us to liability to third parties and require us to incur significant additional costs to maintain the security of our networks and data.
We increasingly depend upon our IT systems to conduct virtually all of our business operations, ranging from our internal operations and product development activities to our marketing and sales efforts and communications with our customers and business partners. Computer programmers may attempt to penetrate our network security, or that of our website, and misappropriate our proprietary information or cause interruptions of our service. Because the techniques used by such computer programmers to access or sabotage networks change frequently and may not be recognized until launched against a target, we may be unable to anticipate these techniques. In addition, sophisticated hardware and operating system software and applications that we produce or procure from third parties may contain defects in design or manufacture, including “bugs” and other problems that could unexpectedly interfere with the operation of the system. We have also outsourced a number of our business functions to third-parties, including our manufacturers, logistics providers, and cloud service providers, and our business operations also depend, in part, on the success of these third parties' own cybersecurity measures. Similarly, we rely upon distributors, resellers and system integrators to sell our products and our sales operations depend, in part, on the reliability of their cybersecurity measures. Additionally, we depend upon our employees to appropriately handle confidential data and deploy our IT resources in safe and secure fashion that does not expose our network systems to security breaches and the loss of data. Accordingly, if our cybersecurity systems and those of our contractors fail to protect against unauthorized access, sophisticated cyber attacks and the mishandling of data by our employees and contractors, our ability to conduct our business effectively could be damaged in a number of ways, including:
• | sensitive data regarding our business, including intellectual property and other proprietary data, could be stolen; |
• | our electronic communications systems, including email and other methods, could be disrupted, and our ability to conduct our business operations could be seriously damaged until such systems can be restored; |
• | our ability to process customer orders and electronically deliver products and services could be degraded, and our distribution channels could be disrupted, resulting in delays in revenue recognition; |
• | defects and security vulnerabilities could be introduced into our software, thereby damaging the reputation and perceived reliability and security of our products and potentially making the data systems of our customers vulnerable to further data loss and cyber incidents; and |
• | personally identifiable data of our customers, employees and business partners could be compromised. |
Should any of the above events occur, we could be subject to significant claims for liability from our customers and regulatory actions from governmental agencies. In addition, our ability to protect our intellectual property rights could be compromised and our reputation and competitive position could be significantly harmed. Also, the regulatory and contractual actions, litigations, investigations, fines, penalties and liabilities relating to data breaches that result in losses of personally identifiable or credit card information of users of our services can be significant in terms of fines and reputational impact and necessitate changes to our business operations that may be disruptive to us. Additionally, we could incur significant costs in order to upgrade our cybersecurity systems and remediate damages. Consequently, our financial performance and results of operations could be adversely affected.
We believe our long-term value as a company will be greater if we focus primarily on growth instead of profitability.
Our business strategy is to focus primarily on our long-term growth. As a result, our profitability in any given period may be lower than it would be if our strategy was to maximize short-term profitability. Expenditures on research and development, sales and marketing, infrastructure and other such investments may not ultimately grow our business, prospects or cause long term profitability. For example, in order to support our strong growth, we have accelerated our investment in infrastructure, such as enterprise resource planning software and other technologies to improve the efficiency of our operations. As a result, we expect our levels of operating profit could decline in the short to medium term. If we are ultimately unable to achieve profitability at the level anticipated by analysts and our stockholders, the market price of our common stock may decline.
34
We may not generate positive returns on our research and development investments.
Developing our products is expensive, and the investment in product development may involve a long payback cycle. In 2014, 2013 and 2012, our research and development expenses were $148.9 million, or approximately 25.5% of our revenue, $98.6 million, or approximately 27.3% of our revenue, and $55.2 million, or approximately 28.5% of our revenue, respectively. We expect to continue to invest heavily in software development in order to expand the capabilities of our cloud networking platform, introduce new products and features and build upon our technology leadership. We believe one of our greatest strengths lies in the speed of our product development efforts. By investing in research and development, we believe we will be well positioned to continue our rapid growth and take advantage of our large market opportunity. We expect that our results of operations will be impacted by the timing and size of these investments. These investments may take several years to generate positive returns, if ever.
We provide access to our software and other selected source code to certain partners, which creates additional risk that our competitors could develop products that are similar to or better than ours.
Our success and ability to compete depend substantially upon our internally developed technology, which is incorporated in the source code for our products. We seek to protect the source code, design code, documentation and other information relating to our software, under trade secret, patent and copyright laws. However, we have chosen to provide access to selected source code of our software to several of our partners for co-development, as well as for open application programming interfaces, or APIs, formats and protocols. Though we generally control access to our source code and other intellectual property and enter into confidentiality or license agreements with such partners as well as with our employees and consultants, this combination of procedural and contractual safeguards may be insufficient to protect our trade secrets and other rights to our technology. Our protective measures may be inadequate, especially because we may not be able to prevent our partners, employees or consultants from violating any agreements or licenses we may have in place or abusing their access granted to our source code. Improper disclosure or use of our source code could help competitors develop products similar to or better than ours.
Changes in our provision for income taxes or our effective tax rate, the enactment of new tax laws or changes in the application of existing tax laws of various jurisdictions or adverse outcomes resulting from examination of our income tax returns could adversely affect our results.
Our provision for income taxes is subject to volatility and could be adversely affected by several factors, many of which are outside of our control, including earnings that are lower than anticipated in countries that have lower tax rates and higher than anticipated in countries that have higher tax rates; our ability to generate and use tax attributes; changes in the valuation of our deferred tax assets and liabilities; expiration of or lapses in the R&D tax credit laws; transfer pricing adjustments, including the effect of acquisitions on our inter-company R&D cost sharing arrangement and legal structure; tax effects of nondeductible compensation, including certain stock-based compensation; tax costs related to inter-company realignments; changes in accounting principles; adverse tax consequences, including imposition of withholding or other taxes on payments by subsidiaries or customers; a change in our decision to indefinitely reinvest foreign earnings or changes in tax laws and regulations, including possible U.S. changes to the taxation of earnings of our foreign subsidiaries, the deductibility of expenses attributable to foreign income or the foreign tax credit rules.
Significant judgment is required to evaluate our tax positions and determine our provision for income taxes. The accounting guidance for uncertainty in income taxes applies to all income tax positions, including the potential recovery of previously paid taxes, which if settled unfavorably could adversely affect our provision for income taxes or additional paid-in capital. In addition, tax laws are dynamic and subject to change as new laws are passed and new interpretations of the law are issued or applied. Recent changes to U.S. tax laws, including limitations on the ability of taxpayers to claim and utilize foreign tax credits and the deferral of certain tax deductions until earnings outside of the U.S. are repatriated to the U.S., as well as changes to U.S. tax laws that may be enacted in the future, could impact the tax treatment of our foreign earnings, as well as cash and cash equivalent balances we currently maintain outside of the U.S.
Further, we are subject to the examination of our income tax returns by the Internal Revenue Service and other tax authorities. Audits by the Internal Revenue Service or other tax authorities are subject to inherent uncertainties and could result in unfavorable outcomes, including potential fines or penalties. As we operate in numerous taxing jurisdictions, the application of tax laws can be subject to diverging and sometimes conflicting interpretations by tax authorities of these jurisdictions. The expense of defending and resolving such an audit may be significant. The amount of time to resolve an audit is also unpredictable and may divert management’s attention from our business operations. We regularly assess the likelihood of adverse outcomes resulting from these examinations to determine the adequacy of our provision for income taxes. We cannot assure you that fluctuations in our provision for income taxes or our effective tax rate, the enactment of new tax laws or changes in the application or interpretation of existing tax laws or adverse outcomes resulting from examination of our tax returns by tax authorities will not have an adverse effect on our business, financial condition, results of operations and prospects.
If we do not effectively expand and train our direct sales force, we may be unable to add new end customers or increase sales to our existing end customers, and our business will be adversely affected.
We depend on our direct sales force to obtain new end customers and increase sales with existing end customers. As such, we have invested and will continue to invest substantially in our sales organization. In recent periods, we have been adding personnel and other resources to our sales function as we focus on growing our business, entering new markets and increasing our market share, and we expect to incur significant additional expenses in expanding our sales personnel in order to achieve revenue growth. There is significant
35
competition for sales personnel with the skills and technical knowledge that we require. Our ability to achieve significant revenue growth will depend, in large part, on our success in recruiting, training, retaining and integrating sufficient numbers of sales personnel to support our growth, particularly in international markets. New hires require significant training and may take significant time before they achieve full productivity. Our recent hires and planned hires may not become productive as quickly as we expect, and we may be unable to hire, retain or integrate into our corporate culture sufficient numbers of qualified individuals in the markets where we do business or plan to do business. In addition, because we continue to grow rapidly, a large percentage of our sales force is new to our company. If we are unable to hire, integrate and train a sufficient number of effective sales personnel, or the sales personnel we hire are not successful in obtaining new end customers or increasing sales to our existing end-customer base, our business, financial condition, results of operations and prospects will be adversely affected.
New regulations related to conflict minerals may cause us to incur additional expenses and could limit the supply and increase the costs of certain metals used in the manufacturing of our products.
As a public company, we will be subject to new requirements under the Dodd-Frank Wall Street Reform and Consumer Protection Act of 2010, or the Dodd-Frank Act, that will require us to perform diligence, and disclose and report whether or not our products contain conflict minerals. The implementation of these new requirements could adversely affect the sourcing, availability and pricing of the materials used in the manufacture of components used in our products. In addition, we will incur additional costs to comply with these disclosure requirements, including costs related to conducting diligence procedures and, if applicable, potential changes to products, processes or sources of supply as a consequence of such verification activities. We may also face reputational harm if we determine that certain of our products contain minerals not determined to be conflict-free or if we are unable to alter our products, processes or sources of supply to avoid such materials.
Risks Related to the Securities Markets and Ownership of Our Common Stock
The market price of our common stock has been and may continue to be volatile, and the value of your investment could decline.
Technology stocks have historically experienced high levels of volatility. Since shares of our common stock were sold in our initial public offering in June 2014 at the price of $43.00 per share, our stock price has ranged from $43.00 per share to $94.84 per share through December 31, 2014. The trading price of our common stock has historically been and is likely to be volatile and could be subject to wide fluctuations in response to various factors, some of which are beyond our control. These fluctuations could cause you to lose all or part of your investment in our common stock. Factors that could cause fluctuations in the market price of our common stock include the following:
• | actual or anticipated announcements of new products, services or technologies, commercial relationships, acquisitions or other events by us or our competitors; |
• | forward looking statements related to future revenue, gross margins and earnings per share; |
• | price and volume fluctuations in the overall stock market from time to time; |
• | litigation involving us, our industry, or both including events occurring in our litigation with Cisco Systems and Optumsoft; |
• | significant volatility in the market price and trading volume of technology companies in general and of companies in the IT security industry in particular; |
• | fluctuations in the trading volume of our shares or the size of our public float; |
• | sales by our officers, directors or significant stockholders; |
• | actual or anticipated changes or fluctuations in our results of operations; |
• | adverse changes to our relationships with any of our channel partners; |
• | manufacturing, supply or distribution shortages; |
• | whether our results of operations or our financial outlook for future fiscal periods meet the expectations of securities analysts or investors; |
• | actual or anticipated changes in the expectations of investors or securities analysts; |
• | regulatory developments in the U.S., foreign countries or both; |
• | general economic conditions and trends; |
• | major catastrophic events; |
• | sales of large blocks of our common stock; or |
• | departures of key personnel. |
In addition, if the market for technology stocks or the stock market in general experiences a loss of investor confidence, the market price of our common stock could decline for reasons unrelated to our business, financial condition, results of operations and prospects. The market price of our common stock might also decline in reaction to events that affect other companies in our industry even if these events do not directly affect us. In the past, following periods of volatility in the market price of a company’s securities, securities class action litigation has often been brought against that company. If the market price of our common stock is volatile, we may become the target of securities litigation. Securities litigation could result in substantial costs and divert our management’s attention and resources from our business and prospects. This could have a material adverse effect on our business, financial condition, results of operations and prospects.
36
Sales of substantial amounts of our common stock in the public markets, or the perception that such sales might occur, could reduce the market price that our common stock might otherwise attain and may dilute your voting power and your ownership interest in us.
Sales of a substantial number of shares of our common stock in the public market, or the perception that such sales could occur, could adversely affect the market price of our common stock and may make it more difficult for you to sell your common stock at a time and price that you deem appropriate.
Based on shares outstanding as of December 31, 2014, holders of up to approximately 28,428,975 shares, or 43.4%, of our common stock have rights, subject to some conditions, to require us to file registration statements covering the sale of their shares or to include their shares in registration statements that we may file for ourselves or other stockholders. We have registered the offer and sale of all shares of common stock that we may issue under our equity compensation plans. If holders, by exercising their registration rights, sell large numbers of shares, it could adversely affect our market price.
In addition, we may issue our shares of common stock or securities convertible into our common stock from time to time in connection with a financing, acquisition, investments or otherwise. Any such issuance could result in substantial dilution to our existing stockholders and cause the trading price of our common stock to decline.
Insiders have substantial control over us, which could limit your ability to influence the outcome of key transactions, including a change of control.
Our directors, executive officers and each of our stockholders who own greater than 5% of our outstanding common stock together with their affiliates, in the aggregate, beneficially own approximately 56.6% of the outstanding shares of our common stock, based on shares outstanding as of December 31, 2014. As a result, these stockholders, if acting together, will be able to influence or control matters requiring approval by our stockholders, including the election of directors and the approval of mergers, acquisitions or other extraordinary transactions. They may also have interests that differ from yours and may vote in a way with which you disagree and which may be adverse to your interests. This concentration of ownership may also discourage a potential investor from acquiring our common stock due to the limited voting power of such stock or otherwise may have the effect of delaying, preventing or deterring a change of control of our company, could deprive our stockholders of an opportunity to receive a premium for their common stock as part of a sale of our company and might ultimately affect the market price of our common stock.
We do not intend to pay dividends for the foreseeable future.
We have never declared nor paid any dividends on our common stock. We intend to retain any earnings to finance the operation and expansion of our business and prospects, and we do not anticipate paying any cash dividends in the future. As a result, you may only receive a return on your investment in our common stock if the market price of our common stock increases.
If securities or industry analysts publish inaccurate or unfavorable research reports about our business or prospects, the market price of our common stock and trading volume could decline.
The trading market for our common stock, to some extent, depends on the research and reports that securities or industry analysts publish about us or our business or prospects. We do not have any control over these analysts. If one or more of the analysts who cover us should downgrade our shares or change their opinion of our shares, the market price of our common stock would likely decline. If one or more of these analysts should cease coverage of our company or fail to regularly publish reports on us, we could lose visibility in the financial markets, which could cause the market price of our common stock or trading volume to decline.
Our charter documents and Delaware law could discourage takeover attempts and lead to management entrenchment.
Our amended and restated certificate of incorporation and amended and restated bylaws contain provisions that could delay or prevent a change in control of our company. These provisions could also make it difficult for stockholders to elect directors that are not nominated by the current members of our board of directors or take other corporate actions, including effecting changes in our management. These provisions include:
• | a classified board of directors with three-year staggered terms, which could delay the ability of stockholders to change the membership of a majority of our board of directors; |
• | the ability of our board of directors to issue shares of preferred stock and to determine the price and other terms of those shares, including preferences and voting rights, without stockholder approval, which could be used to significantly dilute the ownership of a hostile acquirer; |
• | the exclusive right of our board of directors to elect a director to fill a vacancy created by the expansion of our board of directors or the resignation, death or removal of a director, which prevents stockholders from being able to fill vacancies on our board of directors; |
• | a prohibition on stockholder action by written consent, which forces stockholder action to be taken at an annual or special meeting of our stockholders; |
• | the requirement that a special meeting of stockholders may be called only by the chairman of our board of directors, our president, our secretary or a majority vote of our board of directors, which could delay the ability of our stockholders to force consideration of a proposal or to take action, including the removal of directors; |
37
• | the requirement for the affirmative vote of holders of at least 66 2/3% of the voting power of all of the then outstanding shares of the voting stock, voting together as a single class, to amend the provisions of our amended and restated certificate of incorporation relating to the issuance of preferred stock and management of our business or our amended and restated bylaws, which may inhibit the ability of an acquirer to effect such amendments to facilitate an unsolicited takeover attempt; |
• | the ability of our board of directors, by majority vote, to amend the bylaws, which may allow our board of directors to take additional actions to prevent an unsolicited takeover and inhibit the ability of an acquirer to amend the bylaws to facilitate an unsolicited takeover attempt; and |
• | advance notice procedures with which stockholders must comply to nominate candidates to our board of directors or to propose matters to be acted upon at a stockholders’ meeting, which may discourage or deter a potential acquirer from conducting a solicitation of proxies to elect the acquirer’s own slate of directors or otherwise attempting to obtain control of us. |
In addition, as a Delaware corporation, we are subject to Section 203 of the Delaware General Corporation Law. These provisions may prohibit large stockholders, in particular those owning 15% or more of our outstanding voting stock, from merging or combining with us for a certain period of time.
The issuance of additional stock in connection with financings, acquisitions, investments, our stock incentive plans or otherwise will dilute all other stockholders.
Our amended and restated certificate of incorporation authorizes us to issue up to 1,000,000,000 shares of common stock and up to 100,000,000 shares of preferred stock with such rights and preferences as may be determined by our board of directors. Subject to compliance with applicable rules and regulations, we may issue our shares of common stock or securities convertible into our common stock from time to time in connection with a financing, acquisition, investment, our stock incentive plans or otherwise. We may from time to time issue additional shares of common stock at a discount from the then market price of our common stock. Any issuance of stock could result in substantial dilution to our existing stockholders and cause the market price of our common stock to decline.
We may have contingent liability arising out of possible violations of the Securities Act of 1933 in connection with communications to potential participants in a previously planned directed share program.
As part of our initial public offering, up to 112,200 shares were reserved for sale at the initial public offering price in connection with a previously planned directed share program which has subsequently been terminated. In March, April and May 2014, certain officers and directors and employees acting at the request of such officers communicated with certain potential participants in the directed share program. The potential directed share program participants consisted of personal friends or family members of officers or directors, customers, suppliers or partners with long-term commercial relationships with us, and three journalists and three industry researchers who had covered us over time. In total, over 150 persons were contacted in person or by telephone, email or text message regarding the planned directed share program. Such communications were intended only to determine their interest in, and ability under their applicable corporate policies to participate in, the planned directed share program and, in some cases, to obtain contact information to provide to the underwriter managing such program. Certain of such communications regarding the directed share program may have constituted a violation of Section 5 of the Securities Act. We could have a contingent liability arising out of the possible violations of the Securities Act in connection with such communications. Any liability would depend upon the number of shares purchased by the recipients of such communications that may have constituted a violation of Section 5 of the Securities Act. If a claim were brought by any such recipients of such communications who purchased shares in the offering and a court were to conclude that these communications constituted a violation of Section 5 of the Securities Act, we could be required to repurchase the shares sold to the potential participants who received such communications at the original purchase price, plus statutory interest from the date of purchase, for claims brought during a period of one year from the date of their purchase of common stock. The SEC could also determine to seek an enforcement action with respect to this matter. We could also incur considerable expense in contesting any such claim.
38
Item 1B. Unresolved Staff Comments
None
Item 2. Properties
Our corporate headquarters is located in Santa Clara, California where we currently lease approximately 210,000 square feet of space under a lease agreement that expires in September 2023.
We also lease space for operations, sales personnel and research and development in locations throughout the U.S. and various international locations, including Ireland, Canada, China, India, Malaysia, Singapore, the United Kingdom, Japan, Korea, and Taiwan. We believe that our current facilities are adequate to meet our current needs. We intend to expand our facilities or add new facilities as we add employees and enter new geographic markets, and we believe that suitable additional or alternative space will be available as needed to accommodate ongoing operations and any such growth. We expect to incur additional expenses in connection with such new or expanded facilities.
Item 3. Legal Proceedings
The information set forth under the “Legal Proceedings” in Note 6 contained in the "Notes to Consolidated Financial Statements" in Item 8 of Part II of this Annual Report on Form 10-K is incorporated herein by reference.
Item 4. Mine Safety Disclosures
Not applicable
PART II
Item 5. Market for Registrant’s Common Equity, Related Stockholder Matters, and Issuer Purchases of Equity Securities
Market Information
Our common stock has been listed on the NYSE under the symbol “ANET” since June 6, 2014, the date of our IPO. The following table sets forth for the periods indicated the high and low sales prices of our common stock as reported on the NYSE.
Fiscal 2014 Quarters | High | Low | ||||||
Second quarter (from June 6, 2014) | $ | 72.63 | $ | 55.00 | ||||
Third quarter | $ | 94.84 | $ | 62.51 | ||||
Fourth quarter | $ | 90.25 | $ | 59.16 | ||||
Holders of Record
As of March 6, 2015, there were 272 holders of record of our common stock. Because many of our shares of common stock are held by brokers and other institutions on behalf of stockholders, we are unable to estimate the total number of stockholders represented by these record holders.
Dividend Policy
We have never declared or paid any cash dividends on our capital stock. We intend to retain any future earnings and do not expect to pay any dividends in the foreseeable future. Any future determination to declare cash dividends will be made at the discretion of our board of directors, subject to applicable laws, and will depend on a number of factors, including our financial condition, results of operations, capital requirements, contractual restrictions, general business conditions and other factors that our board of directors may deem relevant.
Stock Performance Graph
The following shall not be deemed “filed” for purposes of Section 18 of the Exchange Act, or incorporated by reference into any of our other filings under the Exchange Act or the Securities Act, except to the extent we specifically incorporate it by reference into such filing.
The following graph compares the cumulative total return of our common stock with the total return for the NYSE Composite Index and the Standard & Poor’s 500 Index (the “S&P 500”) from June 6, 2014 (the date of our IPO) through December 31, 2014. The graph assumes that $100 was invested on June 6, 2014's closing price in our common stock, the NYSE Composite Index and the S&P 500, and assumes reinvestment of any dividends. The stock price performance on the following graph is not necessarily indicative of future stock price performance.
39
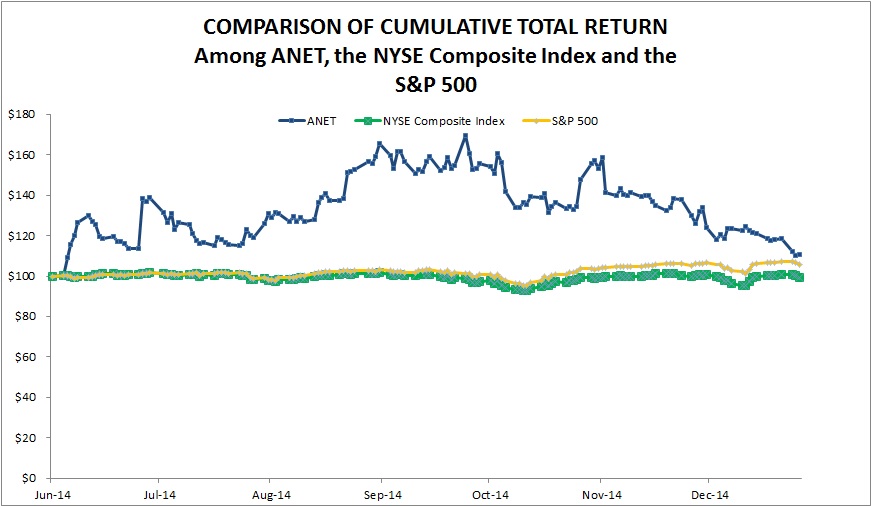
Use of Proceeds
We filed a Registration Statement on Form S-1 (File No. 333-194899) for our initial public offering, which was declared effective by the Securities and Exchange Commission on June 5, 2014. In that offering, aggregate shares of 6,037,500 (inclusive of 787,500 shares of common stock from the full exercise of the over-allotment option granted to the underwriters) common stock were sold on our behalf. The public offering price of the shares sold in the IPO was $43.00 per share. The total gross proceeds from the offering were $259.6 million. After deducting underwriting discounts and commissions totaling $15.6 million and other issuance costs of $5.0 million, the aggregate net proceeds received by us was $239.1 million. No payments were made to our directors or officers or their associates, holders of 10% or more of any class of our equity securities or any affiliates. There has been no material change in the planned use of proceeds from our IPO as described in our final prospectus filed with the SEC on June 5, 2014 pursuant to Rule 424(b).
Unregistered Sales of Equity Securities
During the fiscal year ended December 31, 2014, we sold the following unregistered securities:
Option and Common Stock Issuances
From January 1, 2014 through June 6, 2014 (the date of the filing of our registration statement on Form S-8, File No. 333-196550), pursuant to the terms of our 2011 Equity Incentive Plan, we granted to our officers, directors, employees, consultants and other service providers options to purchase an aggregate of 3,343,000 shares of our common stock at exercise prices ranging from $10.18 to $38.00 per share.
From January 1, 2014 through June 6, 2014 (the date of the filing of our registration statement on Form S-8, File No. 333-196550), pursuant to the terms of our 2004 Equity Incentive Plan and our 2011 Equity Incentive Plan, we issued and sold to our officers, directors, employees, consultants and other service providers an aggregate of 184,105 shares of our common stock upon the exercise of options at exercise prices ranging from $3.33 to $30.67 per share, for an aggregate exercise price of $1.7 million.
None of the foregoing transactions involved any underwriters, underwriting discounts or commissions, or any public offering. We believe the offers, sales, and issuances of the above securities were exempt from registration under the Securities Act by virtue of (i) Section 4(a)(2) of the Securities Act (or Regulation D promulgated thereunder) as transactions not involving a public offering, (ii) Rule 701 promulgated under the Securities Act as transactions pursuant to compensatory benefit plans or contracts relating to compensation as provided under such rule, or (iii) Regulation S promulgated under the Securities Act as transactions made outside of the United States. The recipients of the securities in each of these transactions represented their intentions to acquire the securities for investment only and not with a view to or for sale in connection with any distribution thereof, and appropriate legends were placed upon the stock certificates or book-entry positions representing the shares issued in these transactions. All recipients had adequate access, through their relationships with us, to information about us. The sales of these securities were made without any general solicitation or advertising.
40
On June 6, 2014, in connection with the completion of our initial public offering, all 24,000,000 shares of our then-outstanding shares of preferred stock were automatically converted into 24,000,000 shares of common stock. The issuance of such shares was exempt from the registration requirements of the Securities Act in reliance on Section 3(a)(9) and Section 4(a)(2) of the Securities Act. We received no additional consideration for such automatic conversions.
On June 6, 2014, in connection with the completion of our initial public offering, certain subordinated convertible promissory notes issued to certain noteholders in the aggregate principal amount of $80.0 million and accrued interest were converted into 2,243,975 shares of common stock.
None of the foregoing transactions with respect to the acquisitions involved any underwriters, underwriting discounts or commissions, or any public offering. We believe that such offers, sales and issuances of the above securities in connection with the foregoing acquisitions were exempt from registration under the Securities Act by virtue of Regulation D promulgated thereunder, as transactions by an issuer not involving a public offering.
Securities Authorized for Issuance Under Equity Compensation Plans
See Item 12 of Part III of this report regarding information about securities authorized for issuance under our equity compensation plans.
Item 6. Selected Consolidated Financial Data
The selected consolidated statements of operations data for fiscal 2014, 2013 and 2012 and the consolidated balance sheet data as of December 31, 2014 and 2013 are derived from our audited financial statements appearing in Item 8, “Financial Statements and Supplementary Data,” of this Annual Report on Form 10-K. The selected consolidated statements of operations data for fiscal 2011 and 2010 and the consolidated balance sheet data as of December 31, 2012, 2011 and 2010 are derived from audited financial statements not included in this Annual Report on Form 10-K. Our historical results are not necessarily indicative of the results to be expected in the future.
The following selected consolidated financial data below should be read in conjunction with Item 7, “Management’s Discussion and Analysis of Financial Condition and Results of Operations,” our consolidated financial statements, and the accompanying notes appearing in Item 8, “Financial Statements and Supplementary Data,” of this Annual Report on Form 10-K to fully understand factors that may affect the comparability of the information presented below.
41
Year Ended December 31, | |||||||||||||||||||
2014 | 2013 | 2012 | 2011 | 2010 | |||||||||||||||
(in thousands, except per share data) | |||||||||||||||||||
Selected Consolidated Statements of Operations Data: | |||||||||||||||||||
Revenue | $ | 584,106 | $ | 361,224 | $ | 193,408 | $ | 139,848 | 71,719 | ||||||||||
Cost of revenue 1 | 192,015 | 122,686 | 61,252 | 43,366 | 27,173 | ||||||||||||||
Gross profit | 392,091 | 238,538 | 132,156 | 96,482 | 44,546 | ||||||||||||||
Operating expenses 1: | |||||||||||||||||||
Research and development | 148,909 | 98,587 | 55,155 | 26,408 | 16,285 | ||||||||||||||
Sales and marketing | 85,338 | 55,115 | 28,603 | 19,450 | 9,944 | ||||||||||||||
General and administrative | 32,331 | 18,688 | 8,501 | 6,224 | 2,248 | ||||||||||||||
Total operating expenses | 266,578 | 172,390 | 92,259 | 52,082 | 28,477 | ||||||||||||||
Income from operations | 125,513 | 66,148 | 39,897 | 44,400 | 16,069 | ||||||||||||||
Other income (expense), net: | |||||||||||||||||||
Interest expense | (6,280 | ) | (7,119 | ) | (7,057 | ) | (6,417 | ) | (12,606 | ) | |||||||||
Other income (expense), net | 2,275 | (754 | ) | 135 | (357 | ) | (143 | ) | |||||||||||
Total other income (expense), net | (4,005 | ) | (7,873 | ) | (6,922 | ) | (6,774 | ) | (12,749 | ) | |||||||||
Income before provision for income taxes | 121,508 | 58,275 | 32,975 | 37,626 | 3,320 | ||||||||||||||
Provision for income taxes | 34,658 | 15,815 | 11,626 | 3,591 | 924 | ||||||||||||||
Net income | $ | 86,850 | $ | 42,460 | $ | 21,349 | $ | 34,035 | 2,396 | ||||||||||
Net income attributable to common stockholders: | |||||||||||||||||||
Basic | $ | 68,889 | $ | 20,777 | $ | 9,622 | $ | 13,789 | 715 | ||||||||||
Diluted | $ | 70,524 | $ | 21,780 | $ | 9,662 | $ | 13,854 | 726 | ||||||||||
Net income per share attributable to common stockholders: | |||||||||||||||||||
Basic | $ | 1.42 | $ | 0.76 | $ | 0.39 | $ | 0.65 | $ | 0.04 | |||||||||
Diluted | $ | 1.29 | $ | 0.72 | $ | 0.39 | $ | 0.65 | $ | 0.04 | |||||||||
Weighted-average shares used in computing net income per share attributable to common stockholders: | |||||||||||||||||||
Basic | 48,427 | 27,320 | 24,711 | 21,176 | 15,994 | ||||||||||||||
Diluted | 54,590 | 30,051 | 24,901 | 21,346 | 16,374 | ||||||||||||||
____________________
1Includes stock-based compensation expense as follows:
Year Ended December 31, | |||||||||||||||||||
2014 | 2013 | 2012 | 2011 | 2010 | |||||||||||||||
(in thousands) | |||||||||||||||||||
Cost of revenue | $ | 1,535 | $ | 408 | $ | 270 | $ | 94 | $ | 5 | |||||||||
Research and development | 14,986 | 5,464 | 2,590 | 992 | 62 | ||||||||||||||
Sales and marketing | 7,643 | 2,985 | 1,078 | 554 | 94 | ||||||||||||||
General and administrative | 3,455 | 1,302 | 765 | 334 | 19 | ||||||||||||||
Total stock-based compensation | $ | 27,619 | $ | 10,159 | $ | 4,703 | $ | 1,974 | $ | 180 | |||||||||
Year Ended December 31, | |||||||||||||||||||
2014 | 2013 | 2012 | 2011 | 2010 | |||||||||||||||
(in thousands) | |||||||||||||||||||
Consolidated Balance Sheet Data: | |||||||||||||||||||
Cash and cash equivalents | $ | 240,031 | $ | 113,664 | $ | 88,655 | $ | 70,725 | $ | 14,578 | |||||||||
Working capital | 535,106 | 73,422 | 130,808 | 98,282 | 30,530 | ||||||||||||||
Total assets | 811,023 | 364,520 | 220,168 | 127,642 | 48,216 | ||||||||||||||
Total indebtedness1 | 43,634 | 160,213 | 134,377 | 102,068 | 80,938 | ||||||||||||||
Total deferred revenue | 106,468 | 58,904 | 24,777 | 11,326 | 5,189 | ||||||||||||||
Total stockholders’ equity (deficit) | 555,658 | 77,732 | 18,910 | (8,194 | ) | (48,609 | ) | ||||||||||||
_____________
1Total indebtedness includes our subordinated convertible promissory notes payable to related parties, subordinated convertible promissory notes payable to third parties,
accrued interest payable on the notes and our lease financing obligations.
42
Item 7. Management’s Discussion and Analysis of Financial Condition and Results of Operations
You should read the following discussion and analysis of our financial condition and results of operations together with the consolidated financial statements and related notes that are included elsewhere in this Annual Report on Form 10-K. This discussion contains forward-looking statements based upon current plans, expectations and beliefs that involve risks and uncertainties. Our actual results may differ materially from those anticipated in these forward-looking statements as a result of various factors, including those set forth under “Risk Factors” and elsewhere in this Annual Report on Form 10-K.
Overview
We are a leading supplier of cloud networking solutions that use software innovations to address the needs of large-scale Internet companies, cloud service providers and next-generation data centers for enterprises, based on market share. Our cloud networking solutions consist of our Extensible Operating System, or EOS, a set of network applications and our 10/40/100 Gigabit Ethernet switches. Our cloud networking solutions deliver industry-leading performance, scalability, availability, programmability, automation and visibility. At the core of our cloud networking platform is EOS, which was purpose-built to be fully programmable and highly modular. The programmability of EOS has allowed us to create a set of software applications that address the requirements of cloud networking, including workflow automation, network visibility and analytics, and has also allowed us to rapidly integrate with a wide range of third-party applications for virtualization, management, automation, orchestration and network services.
We were founded in 2004 to address the limitations of legacy networking products and to create a cloud networking platform that is open and programmable. From 2004 to 2008, our activities were focused on the development of our software, which resulted in the commercial release of our first product, the 7100 Series switches based on our EOS software, in 2008. Since then, we have continued to introduce new products utilizing EOS, including our 7500 Series switch and our 7050 Series switch in 2010, the second generation of our 7500 Series switch, called the 7500E modular switch, in May 2013, our 7300 Series switch in November 2013, our 7280E in July 2014 and in December 2014 our EOS+ software platform for networking programmability and automation. As of December 31, 2014, we have shipped more than three million switch ports. We have experienced rapid revenue growth over the last several years, increasing our revenue at a compound annual growth rate of 68.9% from 2010 to 2014. As we have grown the functionality of our EOS software, expanded the range of our switching portfolio and increased the size of our sales force, our revenue has continued to grow rapidly. To support revenue growth, we have increased our international presence to include offices in 11 countries as of December 31, 2014, including Australia, Canada, China, India, Ireland, Japan, Malaysia, Singapore, South Korea, Taiwan and the United Kingdom. Our revenue for the year ended December 31, 2014 was $584.1 million an increase of 61.7% compared to 2013. We have been profitable and cash flow positive for each year since 2010.
We believe that our cloud networking platform addresses the large and growing cloud networking segment of data center switching, which remains in the early stage of adoption. We expect to continue rapidly growing our organization to meet the needs of new and existing customers as they increasingly realize the performance and cost benefits of our cloud networking solutions and as they expand their cloud networks. We intend to continue to invest in our research and development organization to enhance the functionality of our existing cloud networking platform, introduce new products and features and build upon our technology leadership. We believe one of our greatest strengths lies in our rapid development of new features and applications. By investing in research and development, we believe we will be well positioned to continue our rapid growth and take advantage of our large market opportunity. We also intend to continue expanding our sales and marketing teams and programs, with a particular focus on expanding our network of international channel partners and carrying out associated marketing activities in key geographies. In order to support our strong growth, we have accelerated our investment in infrastructure, such as enterprise resource planning software and other technologies to improve the efficiency of our operations. As a result, our levels of operating profit as a percentage of revenue could decline in the short to medium term. For a description of factors that may impact our future performance, see the disclosure in the section titled "Factors Affecting Our Performance" below.
43
Our Business Model
We derive revenue from sales of products and services. We generate revenue primarily from sales of our switching products which incorporate our EOS software. We generate the majority of our services revenue from post contract support, or PCS, which end customers typically purchase in conjunction with our products.
Since shipping our first products in 2008, our cumulative end-customer base has grown rapidly. Between December 31, 2010 and December 31, 2014, our cumulative end-customer base grew from approximately 570 to over 3,000. Our end customers span a range of industries and include large Internet companies, service providers, financial services organizations, government agencies, media and entertainment companies and others.
To continue to grow our revenue, it is important that we both obtain new customers and sell additional products to existing customers. Our development model is focused on the development of new products based on our EOS software and enhancements to EOS. We engineer our products to be agnostic to the underlying merchant silicon architecture. Today, we combine our EOS software with merchant silicon into a family of switching products. This enables us to focus our research and development resources on our software core competencies and to leverage the investments made by merchant silicon vendors to achieve cost-effective solutions. We currently procure certain merchant silicon components from multiple vendors, and we continue to expand our relationships with these and other vendors. We work closely with third parties to manufacture and deliver our products. Our third-party silicon vendors deliver these components to one of three direct fulfillment facilities where our EOS software is installed on our products, and then delivered to us for labeling, quality assurance testing, final configuration and shipment to our customers.
We market and sell our products through our direct sales force and in partnership with channel partners, including distributors, value-added resellers, systems integrators, original equipment manufacturer, or OEM, partners and in conjunction with various technology partners, depending on the application. To facilitate channel coordination and increase productivity, we have created a partner program, the Arista Partner Program, to engage partners who provide value-added services and extend our reach into the marketplace. Authorized training partners provide technical training to our channel partners. Our partners commonly receive an order from an end customer prior to placing an order with us, and we confirm the identification of the end customer prior to accepting such orders. Our partners generally do not stock inventory received from us. Our sales organization is supported by systems engineers with deep technical expertise and responsibility for pre-sales technical support and engineering for our end customers. Each sales team is responsible for a geographic territory, has responsibility for a number of major direct end-customer accounts or has assigned accounts in a specific vertical market. During years ended December 31, 2014, 2013 and 2012, 79.7%, 82.9% and 79.9% of our revenue was generated from the Americas, substantially all from the U.S., 12.8%, 11.2% and 11.9% from Europe, the Middle East and Africa and 7.5%, 5.9% and 8.2% from the Asia-Pacific region, respectively.
Factors Affecting Our Performance
We believe that our future success will depend on many factors, including our ability to expand sales to our existing customers as well as to add new end customers. While these areas present significant opportunity, they also present risks that we must manage to ensure successful results. See the section titled “Risk Factors.” Additionally, we face intense competition especially from larger, well-established companies, and we must continue to expand the capabilities of our cloud networking platform to succeed in our market. If we are unable to address these challenges, our business could be adversely affected.
Increasing Adoption of Cloud Networks. Networks are subject to increasing performance requirements due to growing numbers of connected devices as well as new enterprise and consumer applications. Computing architectures are evolving to meet the need for constant connectivity and access to data and applications. We believe that cloud networks will continue to replace legacy network technologies. Our business and results of operations will be significantly affected by the speed with which organizations implement cloud networks.
Expanding Sales to Existing Customer Base. We expect that a substantial portion of our future sales will be follow-on sales to existing end customers. As noted above, one of our sales strategies is to target specific projects at our current end customers because they are familiar with the operational and economic benefits of our cloud networking solutions, thereby reducing the sales cycle into these customers. We believe this opportunity with current end customers to be significant given their existing and expected infrastructure spend. As of December 31, 2014, our end customers that have been with us for at least 2 years, on average made additional purchases that were approximately 11.9x more than the initial dollar amount of purchases made in the first two quarters of their purchasing history. The first 2 quarters of purchasing are typically the beginning of switch procurement for a given deployment and typically do not include time spent during initial customer testing, as most customer testing is done prior to initial purchase. Although the additional purchases for our Top 10 end customers were significantly more than our overall average, the remainder of the end customer base also showed a propensity to continue purchasing with average additional purchases of 6.7x the initial dollar purchases made in the first two quarters of their purchasing history. This analysis is based on billings, which represent amounts invoiced to customers for products shipped, or for services rendered or to be rendered, and that the vast majority of billings for any given period represent revenue, and to a far lesser extent deferred revenue. Our business and results of operations will depend on our ability to sell additional products to our growing base of customers.
44
Adding New End Customers. We believe that the cloud networking market is still in the early stages of adoption. We intend to target new end customers by continuing to invest in our field sales force and extending our relationships with channel partners. To date, we have primarily targeted end customers with the largest cloud data centers. A typical initial order involves the education of prospective customers about the technical merits and capabilities and potential cost savings of our products as compared to our competitors’ products. Our results of operations will depend on our ability to continue to add new customers. We believe that customer references have been, and will continue to be, an important factor in winning new business.
Selling More Complex and Higher-Performance Configurations. Our results of operations have been, and we believe will continue to be, affected by our ability to sell more complex and higher-performance configurations of our products. Going forward, we aim to grow our revenue by enabling end customers to transition from previously deployed 1 Gigabit Ethernet switches to 10, 40 and eventually 100 Gigabit Ethernet switches. Our ability to sustain our revenue growth will depend, in part, upon our continued sales of more robust configurations of our products, and quarterly results of operations can be significantly impacted by the mix of products and product configurations sold during the period.
Leveraging Channel Partners. We expect to continue to derive a growing portion of our sales through our channel partners as they develop new end customers and expand sales to our existing end customers. We plan to continue to invest in our network of channel partners to empower them to reach new end customers more effectively, increase sales to existing customers and provide services and support effectively. We believe that increasing channel leverage will extend and improve our engagement with a broad set of customers. Our business and results of operations will be materially affected by our success in leveraging our channel partners.
Investing in Research and Development for Growth. We believe that the market for cloud networking is still in the early stages of adoption and we intend to continue investing for long-term growth. We expect to continue to invest heavily in software development in order to expand the capabilities of our cloud networking platform, introduce new products including new releases and upgrades to our EOS software and new applications and build upon our technology leadership. We believe one of our greatest strengths lies in the speed of our product development efforts. By investing in research and development, we believe we will be well positioned to continue our rapid growth and take advantage of our large market opportunity. We expect that our results of operations will be impacted by the timing and size of these product development investments.
Customer Concentration and Timing of Large Orders. Historically, large purchases by a relatively limited number of end customers have accounted for significant portion of our revenue. During the years ended December 31, 2014, 2013 and 2012, our largest end customer accounted for 14.9%, 21.9% and 15.3% of our revenue, respectively. We have also experienced and continue to experience customer concentration on a quarterly basis. In addition, we have experienced increases in the size of our orders, including orders from existing customers, which could result in future increased customer concentration, depending on the timing of the fulfillment of those orders. We have also experienced unpredictability in the timing of large orders, especially with respect to our large end customers, due to the complexity of orders, the time it takes end customers to evaluate, test, qualify and accept our products and factors specific to our end customers. Due to these factors, we expect continued variability in our customer concentration and timing of sales on a quarterly and annual basis. In addition, we have provided, and may in the future provide, pricing discounts to large end customers, which may result in lower margins for the period in which such sales occur. Our gross margins may also fluctuate as a result of the timing of such sales to large end customers.
45
Basis of Presentation
Revenue
We generate revenue primarily from sales of our switching products which incorporate our EOS software. We also derive a small but growing portion of our revenue from sales of PCS. We generate PCS revenue from sales of technical support services contracts that are typically purchased in conjunction with our products and subsequent renewals of those contracts. We offer PCS services under renewable, fee-based contracts, which include 24-hour technical support, hardware repair and replacement parts, bug fixes, patches and unspecified upgrades on a when-and-if available basis. We expect our revenue may vary from period to period based on, among other things, the timing and size of orders, the delivery and acceptance of products, the impact of significant transactions with unique terms and conditions that may require deferral of revenue and cyclicality of orders being placed by our customers. Additionally, we expect our PCS revenue to increase in absolute dollars as we expand our installed base. Our ability to expand our installed base and increase our revenue is subject to numerous risks and uncertainties. See the section titled “Risk Factors.” We report revenue net of sales taxes.
Cost of Revenue
Cost of revenue primarily consists of amounts paid for inventory to our third-party contract manufacturers and merchant silicon vendors, overhead costs in our manufacturing operations department, and other manufacturing-related costs associated with manufacturing our products and managing our inventory. We expect our cost of product revenue to increase as our product revenue increases. Cost of providing PCS services consists of personnel costs for our global customer support organization. We expect our cost of service revenue to increase as our PCS revenue increases.
Gross Margin
Gross margin, or gross profit as a percentage of revenue, has been and will continue to be affected by a variety of factors, including sales to large end customers who generally receive lower pricing, the average sales price of our offerings, manufacturing costs, merchant silicon costs and the mix of products sold. We expect our gross margins to fluctuate over time, depending on the factors described above and others. See Part I Item 1A, of “Risk Factors.”
Operating Expenses
Our operating expenses consist of research and development, sales and marketing and general and administrative expenses. The largest component of our operating expenses is personnel costs. Personnel costs consist of wages, benefits, bonuses and, with respect to sales and marketing expenses, sales commissions. Personnel costs also include stock-based compensation and travel expenses. We expect operating expenses to continue to increase in absolute dollars in the near term as we continue to invest in the growth of our business.
Research and Development Expenses
Research and development expenses consist primarily of personnel costs, with the remainder being prototype expenses, third-party engineering and contractor support costs, and an allocated portion of facility and IT costs and depreciation. Our research and development efforts are focused on maintaining and developing additional functionality for our existing products and on new product development, including new releases and upgrades to our EOS software and applications. We expense research and development costs as incurred. We expect our research and development expenses to increase in absolute dollars as we continue to invest heavily in software development in order to expand the capabilities of our cloud networking platform, introduce new products and features and build upon our technology leadership.
Sales and Marketing Expenses
Sales and marketing expenses consist primarily of personnel costs and also include costs related to marketing and promotional activities, with the remainder being an allocated portion of facility and IT costs and depreciation. We expect our sales and marketing expenses to increase in absolute dollars as we expand our sales and marketing efforts worldwide and expand our relationships with current and future channel partners and end customers.
General and Administrative Expenses
General and administrative expenses consist primarily of personnel costs, professional fees, and an allocated portion of facility and IT costs and depreciation. General and administrative personnel costs include those for our executive, finance, IT, human resources and legal functions. Our professional fees consist primarily of accounting, external legal and IT and other consulting costs. We expect our general and administrative expenses to increase in absolute dollars to support our growing infrastructure needs and as we assume the reporting requirements and compliance obligations of a public company. In addition, we expect an increase in legal expenses to address current and potential litigation claims.
46
Other Income (Expense), Net
Interest Expense
Interest expense consists of interest expense on our subordinated convertible promissory notes, including our related party subordinated convertible promissory notes which were converted during fiscal 2014 and interest expense from our lease financing obligation.
Other Income (Expense)
Other income (expense) consists of gains on investments, write-offs of debt discount on notes payable and foreign currency exchange gains and losses. Our foreign currency exchange gains and losses relate to transactions and asset and liability balances denominated in currencies other than the U.S. dollar. We expect our foreign currency gains and losses to continue to fluctuate in the future due to changes in foreign currency exchange rates.
Provision for Income Taxes
We operate in a number of tax jurisdictions and are subject to taxes in each country or jurisdiction in which we conduct business. Earnings from our non-U.S. activities are subject to local country income tax and may be subject to U.S. income tax. Generally, the U.S. taxes are reduced by a credit for foreign income taxes paid on these earnings which avoids double taxation. Our tax expense to date consists of federal, state and foreign current and deferred income taxes. As we expand internationally, our marginal tax rate may decrease; however, there can be no certainty that our marginal tax rate will decrease, and we may experience changes in tax rates that are not reflective of actual changes in our business or operations.
We account for income taxes under the liability approach for deferred income taxes, which requires recognition of deferred income tax assets and liabilities for the expected future tax consequences of events that have been recognized in our consolidated financial statements but have not been reflected in our taxable income. Estimates and judgments occur in the calculation of certain tax liabilities and in the determination of the recoverability of certain deferred income tax assets, which arise from temporary differences and carryforwards. We measure deferred income tax assets and liabilities using the currently enacted tax rates that apply to taxable income in effect for the years in which those tax assets are expected to be realized or settled. We regularly assess the likelihood that our deferred income tax assets will be realized based on the positive and negative evidence available. We record a valuation allowance to reduce the deferred tax assets to the amount that we are more likely than not to realize.
We believe that we have adequately reserved for our uncertain tax positions, although we can provide no assurance that the final tax outcome of these matters will not be materially different. To the extent that the final tax outcome of these matters is different than the amounts recorded, such differences will affect the provision for income taxes in the period in which such determination is made and could have a material impact on our financial condition and results of operations. The provision for income taxes includes the effects of any reserves that we believe are appropriate, as well as the related net interest and penalties.
47
Results of Operations
The following table summarizes historical results of operations for the periods presented and as a percentage of revenue for those periods. We have derived the data for the years ended December 31, 2014, 2013 and 2012 from our consolidated financial statements (in thousands, except for percentage of revenue).
Year Ended December 31, | |||||||||||
2014 | 2013 | 2012 | |||||||||
Consolidated Statements of Operations Data: | |||||||||||
Revenue | $ | 584,106 | $ | 361,224 | $ | 193,408 | |||||
Cost of revenue (1) | 192,015 | 122,686 | 61,252 | ||||||||
Gross profit | 392,091 | 238,538 | 132,156 | ||||||||
Operating expenses (1): | |||||||||||
Research and development | 148,909 | 98,587 | 55,155 | ||||||||
Sales and marketing | 85,338 | 55,115 | 28,603 | ||||||||
General and administrative | 32,331 | 18,688 | 8,501 | ||||||||
Total operating expenses | 266,578 | 172,390 | 92,259 | ||||||||
Income from operations | 125,513 | 66,148 | 39,897 | ||||||||
Interest expense | (6,280 | ) | (7,119 | ) | (7,057 | ) | |||||
Other income (expense), net | 2,275 | (754 | ) | 135 | |||||||
Total Other income (expense), net | (4,005 | ) | (7,873 | ) | (6,922 | ) | |||||
Income before provision for income taxes | 121,508 | 58,275 | 32,975 | ||||||||
Provision for income taxes | 34,658 | 15,815 | 11,626 | ||||||||
Net income | $ | 86,850 | $ | 42,460 | $ | 21,349 | |||||
Year Ended December 31, | ||||||||
2014 | 2013 | 2012 | ||||||
(as a percentage of revenue) | ||||||||
Revenue | 100.0 | % | 100.0 | % | 100.0 | % | ||
Cost of revenue | 32.9 | 34.0 | 31.7 | |||||
Gross margin | 67.1 | 66.0 | 68.3 | |||||
Operating expenses: | ||||||||
Research and development | 25.5 | 27.3 | 28.5 | |||||
Sales and marketing | 14.6 | 15.3 | 14.8 | |||||
General and administrative | 5.5 | 5.2 | 4.4 | |||||
Total operating expenses | 45.6 | 47.8 | 47.7 | |||||
Income from operations | 21.5 | 18.2 | 20.6 | |||||
Interest expense | (1.1 | ) | (2.0 | ) | (3.6 | ) | ||
Other income (expense), net | 0.4 | (0.2 | ) | 0.1 | ||||
Total other income (expense), net | (0.7 | ) | (2.2 | ) | (3.5 | ) | ||
Income before provision for income taxes | 20.8 | 16.0 | 17.1 | |||||
Provision for income taxes | 5.9 | 4.4 | 6.0 | |||||
Net income | 14.9 | % | 11.6 | % | 11.1 | % | ||
(1) Includes stock-based compensation expense as follows:
48
Year Ended December 31, | |||||||||||
2014 | 2013 | 2012 | |||||||||
Stock-Based Compensation Expense: | |||||||||||
Cost of revenue | $ | 1,535 | $ | 408 | $ | 270 | |||||
Research and development | 14,986 | 5,464 | 2,590 | ||||||||
Sales and marketing | 7,643 | 2,985 | 1,078 | ||||||||
General and administrative | 3,455 | 1,302 | 765 | ||||||||
Total stock-based compensation | $ | 27,619 | $ | 10,159 | $ | 4,703 | |||||
Year Ended December 31, 2014 Compared to Year Ended December 31, 2013
Revenue, Cost of Revenue and Gross Profit (in thousands, except percentages)
Year Ended December 31, | ||||||||||||||||||||
2014 | 2013 | Change in | ||||||||||||||||||
$ | % of revenue | $ | % of revenue | $ | % | |||||||||||||||
Revenue | $ | 584,106 | 100.0 | % | $ | 361,224 | 100.0 | % | $ | 222,882 | 61.7 | % | ||||||||
Cost of revenue | 192,015 | 32.9 | 122,686 | 34.0 | 69,329 | 56.5 | ||||||||||||||
Gross profit | $ | 392,091 | 67.1 | % | $ | 238,538 | 66.0 | % | $ | 153,553 | 64.4 | % | ||||||||
Gross margin | 67.1 | % | 66.0 | % | ||||||||||||||||
Revenue. Revenue increased $222.9 million, or 61.7%, for the year ended December 31, 2014 compared to 2013. The increase in revenue predominantly included an increase in sales of switch products and related accessories of $196.0 million, or 58.9%, primarily to existing customers. The increase in product revenue was largely driven by the number of switch ports shipped, which increased by 82.4% during the year ended December 31, 2014 compared to the same period in 2013, partially offset by a reduction of 15.0% in the average selling price per port shipped. The decrease in average selling price per port was primarily attributable to product mix and lower pricing terms for sales to large end customers. Our cumulative number of customers grew approximately 33% from December 31, 2013 to December 31, 2014 as we continued to broaden our market penetration.
Cost of Revenue. Cost of revenue increased $69.3 million, or 56.5%, for the year ended December 31, 2014 compared to 2013. The increase in cost of revenue was primarily due to the corresponding increase in revenue as our shipment volume significantly increased during the year ended December 31, 2014 resulting in an increase in product costs of $62.1 million during the year ended December 31, 2014 compared to the same period in 2013.
Gross Margin. Gross margin increased from 66.0% for the year ended December 31, 2013 to 67.1% for 2014. The increase in gross margin was primarily the result of a reduction in warranty and excess and obsolete inventory-related charges of $10.3 million due to significant product quality issues and inventory obsolescence charges that did not recur during 2014. These charges were partially offset by an increase in manufacturing overhead charges of $7.4 million to support our revenue growth. To a lesser extent, gross margin was negatively impacted by a decrease in product margins due to product mix and an increase in the size of orders with volume discounts.
Operating Expenses (in thousands, except percentages)
Year Ended December 31, | ||||||||||||||||||||
2014 | 2013 | Change in | ||||||||||||||||||
$ | % of revenue | $ | % of revenue | $ | % | |||||||||||||||
Operating expenses: | ||||||||||||||||||||
Research and development | $ | 148,909 | 25.5 | % | $ | 98,587 | 27.3 | % | $ | 50,322 | 51.0 | % | ||||||||
Sales and marketing | 85,338 | 14.6 | 55,115 | 15.3 | 30,223 | 54.8 | ||||||||||||||
General and administrative | 32,331 | 5.5 | 18,688 | 5.2 | 13,643 | 73.0 | ||||||||||||||
Total operating expenses | $ | 266,578 | 45.6 | % | $ | 172,390 | 47.8 | % | $ | 94,188 | 54.6 | % | ||||||||
Research and development. Research and development expenses increased $50.3 million, or 51.0%, for the year ended December 31, 2014 compared to 2013. The increase was primarily due to an increase in personnel costs of $39.0 million, resulting from an increase of 156 employees (a 34.1% increase) from December 31, 2013 to December 31, 2014, and additional bonus expenses under our corporate bonus plan. The increase was also due to an increase of $6.6 million in research and development related facilities and IT infrastructure costs, and increases in third-party engineering costs of $5.9 million and depreciation expense of $2.0 million, as we continued to expand and support our research and development activities. These expenses were partially offset by a $4.3 million reduction in prototype spending related to project timing.
49
Sales and marketing. Sales and marketing expenses increased $30.2 million, or 54.8%, for the year ended December 31, 2014 compared to 2013. The increase was primarily due to an increase in personnel costs of $23.4 million, resulting from an increase of 45 employees (a 23.0% increase) from December 31, 2013 to December 31, 2014, as well as an increase in sales commissions resulting from higher sales volume. The increase was also due to an increase of $3.7 million in product demonstrations, expenses incurred to expand our sales engineering labs to support our growing customer base, consulting expenses, and other marketing activities, and an increase in IT and infrastructure of $1.6 million.
General and administrative. General and administrative expenses increased $13.6 million, or 73.0%, for the year ended December 31, 2014 compared to 2013. The increase was primarily due to an increase in personnel costs of $5.7 million, resulting from an increase of 17 employees (a 29.8% increase) from December 31, 2013 to December 31, 2014, and additional expenses under our corporate bonus plan. We also incurred higher professional service fees of $3.7 million related to outside legal, accounting and consulting services to support increased business activity, litigation and public-company activities. The increase was also attributable to higher insurance expense and property taxes of $1.5 million associated with being a public company, and a $1.0 million charitable donation through a fund established by the Company in 2014.
Other Income (Expense), Net (in thousands, except percentages)
Year Ended December 31, | Change in | |||||||||||||
2014 | 2013 | $ | % | |||||||||||
Other income (expense), net: | ||||||||||||||
Interest expense | $ | (6,280 | ) | $ | (7,119 | ) | $ | 839 | (11.8 | )% | ||||
Other income (expense), net | 2,275 | (754 | ) | 3,029 | NM | |||||||||
Total other income (expense), net | $ | (4,005 | ) | $ | (7,873 | ) | $ | 3,868 | (49.1 | )% | ||||
Interest expense. Interest expense decreased during the year ended December 31, 2014 compared to the same period in 2013 as a result of repayment and conversion of our notes payable upon our IPO during the second quarter of 2014.
Other income (expense), net. Other income (expense), net increased for the year ended December 31, 2014, compared to 2013 due to the gain on our notes receivable of $4.0 million offset by a $0.7 million write-off related to the debt discount on notes payable upon our IPO, further offset by net transactional exchange rate losses.
Provision for Income Taxes (in thousands, except percentages)
Year Ended December 31, | Change in | |||||||||||||
2014 | 2013 | $ | % | |||||||||||
Provision for income taxes | $ | 34,658 | $ | 15,815 | $ | 18,843 | 119.1 | % | ||||||
Effective tax rate | 28.5 | % | 27.1 | % | ||||||||||
Provision for income taxes. Provision for income taxes was approximately $34.7 million and $15.8 million for the years ended December 31, 2014 and 2013, respectively. Provision for income taxes increased $18.8 million, or 119.1%, for the year ended December 31, 2014 compared to 2013. The change in our provision for income taxes was primarily due to an increase in profit before income tax. The change in the effective tax rate was a result of the geographical distribution of the earnings, the federal research and development ("R&D") tax credit for 2014 including only a current year benefit, as compared to a two-year federal R&D tax credit benefit for 2013, and an increase in state taxes.
The effective tax rate for the year ended December 31, 2014 included the impact of the reinstatement of the 2014 R&D credit. The impact of the 2014 federal R&D tax credit benefit was recorded in the fourth quarter of the year ended December 31, 2014. The effective tax rate for the year ended December 31, 2013 included the impact of the reinstatement of the 2013 and 2012 federal R&D tax credits.
Year Ended December 31, 2013 Compared to Year Ended December 31, 2012
Revenue, Cost of Revenue and Gross Profit (in thousands, except percentages)
Year Ended December 31, | ||||||||||||||||||||
2013 | 2012 | Change in | ||||||||||||||||||
$ | % of revenue | $ | % of revenue | $ | % | |||||||||||||||
Revenue | $ | 361,224 | 100.0 | % | $ | 193,408 | 100.0 | % | $ | 167,816 | 86.8 | % | ||||||||
Cost of revenue | 122,686 | 34.0 | 61,252 | 31.7 | 61,434 | 100.3 | ||||||||||||||
Gross profit | $ | 238,538 | 66.0 | % | $ | 132,156 | 68.3 | % | $ | 106,382 | 80.5 | % | ||||||||
Gross margin | 66.0 | % | 68.3 | % | ||||||||||||||||
50
Revenue. Revenue increased $167.8 million, or 86.8%, for the year ended December 31, 2013 compared to 2012. The increase in revenue predominantly included an increase in sales of switch products and related accessories of $153.2 million, or 85.3%, primarily to existing customers as these customers purchased our newer products to further evolve their data centers. Our revenue also increased to a lesser extent due to sales to new customers. The increase in product revenue was largely driven by number of switch ports shipped which increased by 109.2%, during 2013 compared to the prior year. This increase was partially offset by a reduction of 10% in the average selling price per port shipped. The decrease in the average selling price per port was primarily attributable to lower pricing terms for sales to our large end customers. Our cumulative number of customers grew approximately 43.2% from December 31, 2012 to December 31, 2013 as we continued to broaden our market penetration.
Cost of revenue. Cost of revenue increased $61.4 million, or 100.3%, for the year ended December 31, 2013 compared to 2012. The increase in cost of revenue was primarily due to the corresponding increase in revenue as our shipment volume significantly increased during the year ended December 31, 2013 resulting in an increase in product costs of $46.5 million in 2013 compared to 2012. The increase was also due to an increase of $1.8 million in excess and obsolete material charges for non-cancelable and non-returnable purchase commitments by our third-party contract manufacturers, as well as an increase in write-downs of excess and obsolete inventory of $2.1 million from the introduction of new products and product enhancements We also experienced an increase in manufacturing overhead costs of $4.3 million to support the growth in production during the year ended 2013.
Gross margin. Gross margin decreased approximately two percentage points from 68.3% for the year ended December 31, 2012 to 66.0% for 2013. The decrease in gross margin was primarily due to an increase in excess and obsolete inventory and material charges noted above totaling $3.9 million, and an increase in manufacturing overhead costs of $4.3 million. The decrease was also due, to a lesser extent, to an increase in the size of contracts with large end customers with lower margins, which was partially offset by cost reductions primarily due to more favorable component pricing from our contract manufacturers as we increased volume.
Operating Expenses (in thousands, except percentages)
Year Ended December 31, | ||||||||||||||||||||
2013 | 2012 | Change in | ||||||||||||||||||
$ | % of revenue | $ | % of revenue | $ | % | |||||||||||||||
Operating expenses: | ||||||||||||||||||||
Research and development | $ | 98,587 | 27.3 | % | $ | 55,155 | 28.5 | % | $ | 43,432 | 78.7 | % | ||||||||
Sales and marketing | 55,115 | 15.3 | 28,603 | 14.8 | 26,512 | 92.7 | ||||||||||||||
General and administrative | 18,688 | 5.2 | 8,501 | 4.4 | 10,187 | 119.8 | ||||||||||||||
Total operating expenses | $ | 172,390 | 47.8 | % | $ | 92,259 | 47.7 | % | $ | 80,131 | 86.9 | % | ||||||||
Research and development. Research and development expenses increased $43.4 million, or 78.7%, for the year ended December 31, 2013 compared to 2012. The increase was primarily due to an increase in personnel costs of $21.8 million, which was a result of an increase of 153 employees (a 50.0% increase) in research and development headcount. The increase was also due to a $10.1 million increase in prototype expenses as a result of new product introductions and an increase in facilities expenses of $4.5 million.
Sales and marketing. Sales and marketing expenses increased $26.5 million, or 92.7%, for the year ended December 31, 2013 compared to 2012. The increase was primarily due to an increase in personnel costs of $19.8 million, which was a result of an increase of 57 employees (a 41.3% increase) in sales and marketing headcount. The increase was also due to an increase of $3.0 million in marketing, consulting and promotional expense related to trade shows, product demonstrations and other marketing activities and an increase in sales and marketing-related IT and system engineering expenses of $2.6 million.
General and administrative. General and administrative expenses increased $10.2 million, or 119.8%, for the year ended December 31, 2013 compared to 2012. The increase was primarily due to a $5.5 million increase in professional service fees related to outside legal, accounting, consulting and IT services to support increased business activity and preparations for becoming a public company. The increase was also due to a $3.4 million increase in personnel costs, which was a result of an increase of 23 employees (a 67.6% increase) in general and administrative headcount.
Other Income (Expense), Net (in thousands, except percentages)
Year Ended December 31, | Change in | |||||||||||||
2013 | 2012 | $ | % | |||||||||||
Other income (expense), net: | ||||||||||||||
Interest expense | $ | (7,119 | ) | $ | (7,057 | ) | $ | (62 | ) | 0.9 | % | |||
Other income (expense), net | (754 | ) | 135 | (889 | ) | NM | ||||||||
Total other income (expense), net | $ | (7,873 | ) | $ | (6,922 | ) | $ | (951 | ) | 13.7 | % | |||
51
Interest expense. Interest expense was consistent for the year ended December 31, 2013 compared to 2012.
Other income (expense), net. Other income (expense), net decreased $1.0 million for the year ended December 31, 2013 compared to 2012.
Provision for Income Taxes (in thousands, except percentages)
Year Ended December 31, | Change in | |||||||||||||
2013 | 2012 | $ | % | |||||||||||
Provision for income taxes | $ | 15,815 | $ | 11,626 | $ | 4,189 | 36.0 | % | ||||||
Effective tax rate | 27.1 | % | 35.3 | % | ||||||||||
Provision for income taxes. Provision for income taxes increased $4.2 million, or 36.0%, for the year ended December 31, 2013 compared to 2012. Our effective tax rate decreased 8.2 percentage points from 35.3% for the year ended December 31, 2012 to 27.1% for 2013. The decrease in the effective tax rate was primarily due to the beneficial impact of the passage of the American Tax Relief Act of 2012 signed into law on January 2, 2013, which reinstated the federal research and development credit. The prior year impact of the 2012 federal research and development tax credit benefit was recorded in the three months ended March 31, 2013.
Quarterly Results of Operations
The following tables set forth selected unaudited quarterly consolidated statements of operations data for each of the quarters in the years ended December 31, 2014 and December 31, 2013, as well as the percentage that each line item represents of total revenue. The information for each of these quarters has been prepared on the same basis as the audited annual financial statements included elsewhere in this Annual Report on Form 10-K and, in the opinion of management, includes all adjustments, which includes only normal recurring adjustments, necessary for the fair presentation of the results of operations for these periods in accordance with GAAP. This data should be read in conjunction with our audited consolidated financial statements and related notes included in Item 8 of this Annual Report on Form 10-K.
Three Months Ended | ||||||||||||||||||||||||||||||||
Dec. 31, 2014 | Sep. 30, 2014 | Jun. 30, 2014 | Mar. 31, 2014 | Dec. 31, 2013 | Sep. 30, 2013 | Jun. 30, 2013 | Mar. 31, 2013 | |||||||||||||||||||||||||
(in thousands) | ||||||||||||||||||||||||||||||||
Consolidated Statements of Operations Data: | ||||||||||||||||||||||||||||||||
Revenue | $ | 173,489 | $ | 155,463 | $ | 137,947 | $ | 117,207 | $ | 114,766 | $ | 101,625 | $ | 83,485 | $ | 61,348 | ||||||||||||||||
Cost of revenue | 57,049 | 54,506 | 44,567 | 35,893 | 37,293 | 36,589 | 29,584 | 19,220 | ||||||||||||||||||||||||
Gross profit | 116,440 | 100,957 | 93,380 | 81,314 | 77,473 | 65,036 | 53,901 | 42,128 | ||||||||||||||||||||||||
Operating expenses: | ||||||||||||||||||||||||||||||||
Research and development | 44,344 | 36,231 | 34,888 | 33,446 | 31,352 | 26,635 | 21,086 | 19,514 | ||||||||||||||||||||||||
Sales and marketing | 25,016 | 20,956 | 20,711 | 18,655 | 17,412 | 14,523 | 13,045 | 10,135 | ||||||||||||||||||||||||
General and administrative | 8,078 | 9,896 | 7,126 | 7,231 | 6,204 | 5,242 | 3,506 | 3,736 | ||||||||||||||||||||||||
Total operating expenses | 77,438 | 67,083 | 62,725 | 59,332 | 54,968 | 46,400 | 37,637 | 33,385 | ||||||||||||||||||||||||
Income from operations | 39,002 | 33,874 | 30,655 | 21,982 | 22,505 | 18,636 | 16,264 | 8,743 | ||||||||||||||||||||||||
Other income (expense), net: | ||||||||||||||||||||||||||||||||
Interest expense | (768 | ) | (764 | ) | (1,435 | ) | (1,771 | ) | (1,799 | ) | (1,797 | ) | (1,772 | ) | (1,751 | ) | ||||||||||||||||
Other income (expense), net | (151 | ) | (824 | ) | 2,472 | (764 | ) | (631 | ) | (23 | ) | (1 | ) | (99 | ) | |||||||||||||||||
Total other income (expense), net | (919 | ) | (1,588 | ) | 1,037 | (2,535 | ) | (2,430 | ) | (1,820 | ) | (1,773 | ) | (1,850 | ) | |||||||||||||||||
Income before provision for income taxes | 38,083 | 32,286 | 31,692 | 19,447 | 20,075 | 16,816 | 14,491 | 6,893 | ||||||||||||||||||||||||
Provision for income taxes | 7,046 | 10,420 | 10,074 | 7,118 | 6,333 | 4,960 | 4,240 | 282 | ||||||||||||||||||||||||
Net income | $ | 31,037 | $ | 21,866 | $ | 21,618 | $ | 12,329 | $ | 13,742 | $ | 11,856 | $ | 10,251 | $ | 6,611 | ||||||||||||||||
52
Three Months Ended | ||||||||||||||||||||||||
Dec. 31, 2014 | Sep. 30, 2014 | Jun. 30, 2014 | Mar. 31, 2014 | Dec. 31, 2013 | Sep. 30, 2013 | Jun. 30, 2013 | Mar. 31, 2013 | |||||||||||||||||
(As a percentage of revenue) | ||||||||||||||||||||||||
Consolidated Statements of Operations Data: | ||||||||||||||||||||||||
Revenue | 100.0 | % | 100.0 | % | 100.0 | % | 100.0 | % | 100.0 | % | 100.0 | % | 100.0 | % | 100.0 | % | ||||||||
Cost of revenue | 32.9 | 35.1 | 32.3 | 30.6 | 32.5 | 36.0 | 35.4 | 31.3 | ||||||||||||||||
Gross profit | 67.1 | 64.9 | 67.7 | 69.4 | 67.5 | 64.0 | 64.6 | 68.7 | ||||||||||||||||
Operating expenses: | ||||||||||||||||||||||||
Research and development | 25.6 | 23.3 | 25.3 | 28.5 | 27.3 | 26.2 | 25.3 | 31.8 | ||||||||||||||||
Sales and marketing | 14.4 | 13.5 | 15.0 | 15.9 | 15.2 | 14.3 | 15.6 | 16.5 | ||||||||||||||||
General and administrative | 4.7 | 6.4 | 5.2 | 6.2 | 5.4 | 5.2 | 4.2 | 6.1 | ||||||||||||||||
Total operating expenses | 44.7 | 43.2 | 45.5 | 50.6 | 47.9 | 45.7 | 45.1 | 54.4 | ||||||||||||||||
Income from operations | 22.4 | 21.7 | 22.2 | 18.8 | 19.6 | 18.3 | 19.5 | 14.3 | ||||||||||||||||
Other income (expense), net: | ||||||||||||||||||||||||
Interest expense | (0.4 | ) | (0.5 | ) | (1.0 | ) | (1.5 | ) | (1.6 | ) | (1.8 | ) | (2.1 | ) | (2.9 | ) | ||||||||
Other income (expense), net | (0.1 | ) | (0.5 | ) | 1.8 | (0.7 | ) | (0.5 | ) | — | — | (0.2 | ) | |||||||||||
Total other income (expense), net | (0.5 | ) | (1.0 | ) | 0.8 | (2.2 | ) | (2.1 | ) | (1.8 | ) | (2.1 | ) | (3.1 | ) | |||||||||
Income before provision for income taxes | 21.9 | 20.7 | 23.0 | 16.6 | 17.5 | 16.5 | 17.4 | 11.2 | ||||||||||||||||
Provision for income taxes | 4.1 | 6.7 | 7.3 | 6.1 | 5.5 | 4.8 | 5.1 | 0.4 | ||||||||||||||||
Net income | 17.8 | % | 14.0 | % | 15.7 | % | 10.5 | % | 12.0 | % | 11.7 | % | 12.3 | % | 10.8 | % | ||||||||
Liquidity and Capital Resources
Our principal sources of liquidity are cash and cash equivalents, marketable securities, and cash generated from operations. As of December 31, 2014, cash and cash equivalents and marketable securities were $449.5 million of which approximately $56.6 million was held outside the U.S. in our foreign subsidiaries. We have not repatriated nor do we currently have plans to repatriate these funds, but if we were to repatriate cash held outside of the U.S. for domestic cash operations, we would be required to accrue and pay U.S. income taxes to repatriate these funds less any previously paid foreign income taxes. We consider the undistributed earnings of our foreign subsidiaries as of December 31, 2014 to be indefinitely reinvested, and, accordingly, no U.S. income taxes have been provided thereon.
On June 6, 2014, we completed our IPO in which we sold 6,037,500 shares of our common stock at a public offering price of $43.00 per share, which included 787,500 shares of common stock issued pursuant to the exercise in full of the over-allotment option by the underwriters. The IPO resulted in proceeds of $239.1 million, net of underwriting discounts and commissions of $15.6 million and other issuance costs of $5.0 million. In connection with the closing of the IPO, all of our outstanding convertible preferred stock automatically converted into 24,000,000 shares of common stock on a one-to-one basis.
Upon the closing of our IPO, all noteholders with the exception of one noteholder converted the principal and accrued interest amount outstanding under their subordinated convertible promissory notes into shares of our common stock at the IPO price of $43.00 per share. The noteholder, who did not elect to so convert, was paid a total of $23.6 million which included principal and accrued interest less applicable withholding taxes of $1.1 million. The remainder of the noteholders converted the remaining debt balance of approximately $96.5 million including principal and accrued interest into 2.2 million shares of our common stock.
Our cash and cash equivalents and marketable securities are held for working capital purposes. We plan to continue to invest for long-term growth. One of the principal purposes of our IPO was to obtain additional capital to fund the growth of our business. We believe that our existing cash and cash equivalents together with cash flow from operations will be sufficient to meet our working capital requirements and our growth strategies for the foreseeable future. Our future capital requirements will depend on many factors, including our growth rate, the timing and extent of our spending to support research and development activities, the timing and cost of establishing additional sales and marketing capabilities, the introduction of new and enhanced product and service offerings, our costs and access to outsourcing our manufacturing, our costs related to investing in or acquiring complementary or strategic businesses and technologies as well as the continued market acceptance of our products. If we require or elect to seek additional capital through debt or equity financing in the future, we may not be able to raise capital on terms acceptable to us. If we are required and unable to raise additional capital when desired, our business, operating results, and financial condition may be adversely affected.
53
Cash Flows
December 31, | |||||||
2014 | 2013 | ||||||
(in thousands) | |||||||
Cash and cash equivalents | $ | 240,031 | $ | 113,664 | |||
Year Ended December 31, | ||||||||||||
2014 | 2013 | 2012 | ||||||||||
(in thousands) | ||||||||||||
Cash provided by operating activities | $ | 114,516 | $ | 34,648 | $ | 26,306 | ||||||
Cash used in investing activities | (249,362 | ) | (19,491 | ) | (12,352 | ) | ||||||
Cash provided by financing activities | 261,337 | 9,886 | 3,977 | |||||||||
Effect of exchange rate changes | (124 | ) | (34 | ) | (1 | ) | ||||||
Net increase in cash and cash equivalents | $ | 126,367 | $ | 25,009 | $ | 17,930 | ||||||
Cash Flows from Operating Activities
Our primary source of cash from operating activities has been from cash collections from our customers. We expect cash inflows from operating activities to be affected by increases in sales and timing of collections. Our primary uses of cash from operating activities have been for personnel costs and investment in sales and marketing and research and development. We expect cash outflows from operating activities to increase as a result of further investment in sales and marketing and increases in personnel costs as we grow our business.
During the year ended December 31, 2014, cash provided by operating activities was $114.5 million primarily from net income of $86.9 million, net non-cash charges of $11.8 million, and an increase of $15.8 million due to changes in our operating assets and liabilities. The increase in cash from operating assets and liabilities was primarily due an increase in deferred revenue of $47.6 million resulting from the increase in sales, an increase in accrued liabilities of $18.9 million largely related to our payroll and corporate bonus plan and an increase in accounts payable of $14.0 million due to the timing of our payments, partially offset by a reduction in cash from an increase in accounts receivable of $19.8 million from higher products shipments, an increase in inventories of $13.4 million to meet our customer demand and an increase in prepaid expenses and other current assets of $32.6 million primarily due to higher prepaid taxes, and supplier rebates resulting from our increased inventory purchases.
During the year ended December 31, 2013, cash provided by operating activities was $34.6 million, primarily from net income of $42.5 million and non-cash charges of $6.8 million, partially offset by a decrease of $14.6 million due to changes in our operating assets and liabilities. The decrease in cash from operating assets and liabilities was primarily due to a $49.2 million increase in inventory for anticipated growth in our business, a $28.3 million increase in accounts receivable due to an increase in sales partially offset by an increase in cash from a $3.0 million decrease in prepaid expenses and other current assets, partially offset by an increase in cash from a $3.9 million increase in accounts payable primarily attributable to the timing of payments, a $12.0 million increase in accrued liabilities attributable to higher warranty liabilities and higher accrued personnel costs due to growth in headcount, a $34.1 million increase in deferred revenue due to increased sales and a $6.0 million increase in interest payable attributable to our outstanding convertible promissory notes, including our related party convertible promissory notes.
During the year ended December 31, 2012, cash provided by operating activities was $26.3 million, consisting of net income of $21.3 million adjusted by non-cash charges of $4.0 million and a $0.9 million increase due to changes in our operating assets and liabilities. The increase in cash from operating assets and liabilities was primarily due to a $22.0 million increase in accounts receivable due to an increase in sales, a $7.2 million increase in inventory and a $5.0 million increase in prepaid expenses and other current assets, partially offset by a $13.5 million increase in deferred revenue due to increased sales, a $6.5 million increase in accrued liabilities attributable to higher warranty liabilities and higher accrued personnel costs due to growth in headcount and a $6.0 million increase in interest payable attributable to our outstanding convertible promissory notes, including our related party convertible promissory notes.
Cash Flows from Investing Activities
Our investing activities have consisted primarily of purchases of property and equipment. We expect to continue to make purchases of property and equipment to support continued growth of our business.
During the year ended December 31, 2014, cash used in investing activities was $249.4 million, consisting primarily of purchases of marketable securities of $210.0 million, purchases of property and equipment of $13.1 million and other investing activities of $38.2 million largely due to a $33.6 million equity investments in privately held companies, partially offset by the proceeds of the repayments of our notes receivable of $8.0 million and the release of our restricted cash into cash and cash equivalents of $4.0 million.
54
During the year ended December 31, 2013, cash used in investing activities was $19.5 million, of which $20.3 million relates to the purchase of property and equipment offset by notes receivable repayments of $1.0 million.
During the year ended December 31, 2012, cash used in investing activities was $12.4 million, of which $3.3 million relates to purchases of property and equipment, $5.0 million relates to an investment in a private company and $4.0 million relates to an increase in restricted cash representing a security deposit required for a facility lease.
Cash Flows from Financing Activities
Our cash flows provided by financing activities primarily consisted of proceeds from the IPO and exercises of stock options partially offset by repayment of our subordinated convertible promissory notes.
During the year ended December 31, 2014, cash provided by financing activities was $261.3 million, consisting primarily of net proceeds raised from our IPO of $239.3 million, proceeds from the exercise of stock options, net of repurchases of $25.4 million and excess tax benefits from our incentive plans amounting to $17.4 million. These proceeds were partially offset by the repayment of our notes payable of $20.0 million.
During the year ended December 31, 2013, cash provided by financing activities was $9.9 million, consisting primarily of proceeds from the exercise of stock options, net of repurchases, amounting to $9.0 million and excess tax benefits realized from our equity incentive plans amounting to $0.9 million.
During the year ended December 31, 2012, cash provided by financing activities was $4.0 million, consisting primarily of $3.9 million in proceeds from the exercise of common stock options, net of repurchases.
Debt Obligations
In January 2011, we sold $55.0 million aggregate principal amount of subordinated convertible promissory notes, or Convertible Notes, to outside investors and $25.0 million aggregate principal amount of Convertible Notes to two trusts that are related to two of our co-founders. In June 2011, we sold an additional $20.0 million aggregate principal amount of Convertible Notes to outside investors. The interest rate on the Convertible Notes was 6.0% per annum, computed on the basis of the actual number of days elapsed and a year of 365 days. Upon the closing of our IPO, all noteholders with the exception of one noteholder converted the principal and accrued interest amount outstanding under their subordinated convertible promissory notes into shares of our common stock at the IPO price of $43.00 per share. The noteholder, who did not elect to so convert, was paid a total of $23.6 million which included principal and accrued interest less applicable withholding taxes of $1.1 million. The remainder of the noteholders converted the remaining debt balance of approximately $96.5 million including principal and accrued interest into 2.2 million shares of our common stock.
Off-Balance Sheet Arrangements
As of December 31, 2014, we did not have any relationships with any unconsolidated entities or financial partnerships, such as entities often referred to as structured finance or special purpose entities that would have been established for the purpose of facilitating off-balance sheet arrangements or other contractually narrow or limited purposes.
Contractual Obligations and Commitments
Our contractual commitments will have an impact on our future liquidity. Our contractual obligations represent material expected or contractually committed future obligations with terms in excess of one year. We believe that we will be able to fund these obligations through cash generated from operations and from our existing cash balances.
The following summarizes our contractual obligations and commitments as of December 31, 2014 (in thousands):
Payments Due by Period | ||||||||||||||||||||
Total | Less than 1 Year | 1 to 3 Years | 3 to 5 Years | More than 5 Years | ||||||||||||||||
Financing lease obligation1 | $ | 54,968 | $ | 5,588 | $ | 17,800 | $ | 12,769 | $ | 18,811 | ||||||||||
Operating lease obligations | 45,189 | 2,583 | 14,830 | 10,901 | 16,875 | |||||||||||||||
Total | $ | 100,157 | $ | 8,171 | $ | 32,630 | $ | 23,670 | $ | 35,686 | ||||||||||
_________________
1Includes interest and land lease
The contractual obligation table above excludes tax liabilities of $18.6 million related to uncertain tax positions because we are unable to make a reasonably reliable estimate of the timing of settlement, if any, of these future payments.
55
Critical Accounting Policies and Estimates
We have prepared our consolidated financial statements in accordance with GAAP and include our accounts and the accounts of our wholly owned subsidiaries. The preparation of these consolidated financial statements requires our management to make estimates, assumptions and judgments that affect the reported amounts of assets and liabilities at the date of the financial statements, disclosure of contingent assets and liabilities at the date of the financial statements and the reported amounts of revenue and expenses during the applicable periods. We base our estimates, assumptions and judgments on historical experience and on various other factors that we believe to be reasonable under the circumstances. Different assumptions and judgments would change the estimates used in the preparation of our consolidated financial statements, which, in turn, could change the results from those reported. We evaluate our estimates, assumptions and judgments on an ongoing basis. The critical accounting estimates, assumptions and judgments that we believe have the most significant impact on our consolidated financial statements are described below.
Revenue Recognition
We generate revenue from the sale of network switches which incorporate our EOS software and accessories such as cables and optics to direct customers and channel partners together with PCS. We typically sell products and PCS in a single transaction. We recognize revenue when all of the following criteria are met: persuasive evidence of an arrangement exists, delivery or performance has occurred, the sales price is fixed or determinable and collectability is reasonably assured.
We define each of the four criteria above as follows:
•Persuasive evidence of an arrangement exists. Evidence of an arrangement consists of stand-alone purchase orders or purchase orders issued pursuant to the terms and conditions of a master sales agreement. It is our practice to identify an end customer prior to shipment to a reseller or distributor.
•Delivery or performance has occurred. We use shipping documents or written evidence of customer acceptance, when applicable, to verify delivery or performance. We recognize product revenue upon transfer of title and risk of loss, which primarily is upon shipment to customers. We generally do not have significant obligations for future performance, rights of return, pricing credits or customer acceptance provisions associated with our product sales. In instances where substantive acceptance provisions are specified in the customer arrangement, revenue is deferred until all acceptance criteria have been met.
•The sales price is fixed or determinable. We assess whether the sales price is fixed or determinable based on payment terms and whether the sales price is subject to refund or adjustment.
•Collectability is reasonably assured. We assess probability of collectability on a customer-by-customer basis. Our customers and channel partners are subjected to a credit review process that evaluates their financial condition and ability to pay for products and services.
PCS is offered under renewable, fee-based contracts, which include technical support, hardware repair and replacement parts beyond standard warranty, bug fixes, patches and unspecified upgrades on a when-and-if-available basis. We initially defer PCS revenue and recognize it ratably over the life of the PCS contract, with the related expenses recognized as incurred. PCS contracts usually have a term of one to three years. We include billed but unearned PCS revenue in deferred revenue.
We report revenue net of sales taxes. We include shipping charges billed to customers in revenue and the related shipping costs are included in cost of goods sold.
Multiple-Element Arrangements
Most of our arrangements, other than renewals of PCS, are multiple-element arrangements with a combination of products and PCS. Products and PCS generally qualify as separate units of accounting. Our hardware deliverables and included EOS software together deliver the essential functionality of our products. For multiple-element arrangements, we allocate revenue to each unit of accounting based on the relative selling price. The relative selling price for each element is based upon the following hierarchy: vendor-specific objective evidence, or VSOE, if available; third-party evidence, or TPE, if VSOE is not available; and best estimate of selling price, or BESP, if neither VSOE nor TPE is available. As we have not been able to establish VSOE or TPE for our products and most of our services, we generally utilize BESP for the purposes of allocating revenue to each unit of accounting.
• | VSOE—We determine VSOE based on our historical pricing and discounting practices for the specific products and services when sold separately. In determining VSOE, we require that a substantial majority of the stand-alone selling prices fall within a reasonably narrow pricing range. |
• | TPE—When VSOE cannot be established for deliverables in multiple-element arrangements, we apply judgment with respect to whether we can establish a selling price based on TPE. TPE is determined based on competitor prices for interchangeable products or services when sold separately to similarly situated customers. However, as our products contain a significant element of proprietary technology and offer substantially different features and functionality, the comparable pricing of products with similar functionality typically cannot be obtained. Additionally, as we are unable to reliably determine what competitors products’ selling prices are on a stand-alone basis, we are not able to obtain reliable evidence of TPE of selling price. |
56
• | BESP—When we are unable to establish selling price using VSOE or TPE, we use BESP in our allocation of arrangement consideration. The objective of BESP is to determine the price at which we would transact a sale if the product or service was sold regularly on a stand-alone basis. BESP is based on considering multiple factors including, but not limited to the sales channel (reseller, distributor or end customer), the geographies in which our products and services were sold (domestic or international) and size of the end customer. |
We limit the amount of revenue recognition for delivered elements to the amount that is not contingent on the future delivery of products or services, future performance obligations, or subject to customer-specific return, acceptance or refund privileges.
We account for multiple agreements with a single partner as one arrangement if the contractual terms and/or substance of those agreements indicate that they may be so closely related that they are, in effect, parts of a single arrangement.
We may occasionally accept returns to address customer satisfaction issues even though there is no contractual provision for such returns. We estimate returns for sales to customers based on historical returns rates applied against current-period gross revenues. Specific customer returns and allowances are considered when determining our sales return reserve estimate.
Inventories
Inventories primarily consist of finished goods purchased from third party contract manufacturers and are stated at the lower of cost (computed using the first-in, first-out method) or market value. Manufacturing overhead costs and inbound shipping costs are included in the cost of inventory. In addition, we also purchase certain strategic component inventory, including integrated circuits which are consigned to our contract manufacturers. We record a provision when inventory is determined to be in excess of anticipated demand or obsolete to adjust inventory to its estimated realizable value.
We use significant judgment in establishing our forecasts of future demand and obsolete material exposures. These estimates depend on our assessment of current and expected orders from our customers, product development plans and current sales levels. If actual market conditions are less favorable than those projected by management, which may be caused by factors within and outside of our control, we may be required to increase our inventory write-downs and provisions for non-cancelable, non-returnable purchase commitments, which could have an adverse impact on our gross margins and profitability.
Warranty
We offer a one-year warranty on all of our hardware products and a 90-day warranty against defects in any software embedded in the products. We use judgment and estimates when determining warranty costs based on historical costs primarily to replace or repair product returns within the warranty period at the time we recognize revenue. We accrue specifically identified reserves if and when we determine we have a systemic product failure. Historically, we have identified specific products that failed in the field prematurely at higher than expected rates due to various component issues. Although we engage in extensive product quality programs, if actual product failure rates or use of materials differ from estimates, additional warranty costs may be incurred, which could reduce our gross margin.
Stock-Based Compensation
Compensation expense related to stock-based transactions, including stock options, restricted stock awards, or RSAs, and stock purchase rights, is measured and recognized in the financial statements based on the fair value of the awards granted. The fair value of each stock-based award is estimated on the grant date using the Black-Scholes-Merton option-pricing model. The stock-based compensation expense, net of forfeitures, is recognized on a straight-line basis over the requisite service periods of the awards, which is generally four years.
Our use of the Black-Scholes-Merton option-pricing model requires the input of highly subjective assumptions, including the fair value of the underlying common stock, the expected term of the option, the expected volatility of the price of our common stock, risk-free interest rates and the expected dividend yield of our common stock. The assumptions used in our option-pricing model represent management’s best estimates. These estimates involve inherent uncertainties and the application of management’s judgment. If factors change and different assumptions are used, our stock-based compensation expense could be materially different in the future.
These assumptions and estimates are as follows:
•Fair Value of Common Stock. Prior to our IPO, we estimated the fair value of common stock, based on numerous subjective and objective factors at each grant date.
•Expected Term. The expected term represents the period that our option awards are expected to be outstanding. We consider several factors in estimating the expected term of options granted, including the expected lives used by a peer group of companies within our industry that we consider to be comparable to our business, and the historical option exercise behavior of our employees, which we believe is representative of future behavior.
•Expected Volatility. The volatility is derived from the average historical stock volatilities of a peer group of public companies within our industry that we consider to be comparable to our business over a period equivalent to the expected term of the stock-based grants. We did not rely on implied volatilities of traded options in our industry peers’ common stock because the volume of activity was low. We intend to continue to consistently apply this process using the same or similar public companies
57
until a sufficient amount of historical information regarding the volatility of our own common stock share price becomes available, or unless circumstances change such that the identified companies are no longer similar to us, in which case, more suitable companies whose share prices are publicly available would be utilized in the calculation.
•Risk-Free Interest Rate. The risk-free interest rate is based on the U.S. Treasury yield curve in effect at the time of grant for zero-coupon U.S. Treasury notes with maturities approximately equal to the option’s expected term.
•Dividend Yield. We have never declared or paid any cash dividends and do not presently plan to pay cash dividends in the foreseeable future. Consequently, we used an expected dividend yield of zero.
In addition to the assumptions used in the Black-Scholes-Merton option-pricing model, we must also estimate a forfeiture rate to calculate the stock-based compensation expense for our awards. Our forfeiture rate is based on an analysis of our actual forfeitures. We will continue to evaluate the appropriateness of the forfeiture rate based on actual forfeiture experience, analysis of employee turnover and other factors. Changes in the estimated forfeiture rate can have a significant impact on our stock-based compensation expense as the cumulative effect of adjusting the rate is recognized in the period the forfeiture estimate is changed. We will continue to use judgment in evaluating the assumptions related to our stock-based compensation on a prospective basis. As we continue to accumulate additional data related to our common stock, we may have refinements to our estimates, which could materially impact our future stock-based compensation expense.
Income Taxes
Income tax expense is an estimate of current income taxes payable in the current fiscal year based on reported income before income taxes. Deferred income taxes reflect the effect of temporary differences and carryforwards that we recognize for financial reporting and income tax purposes.
We account for income taxes under the liability approach for deferred income taxes, which requires recognition of deferred income tax assets and liabilities for the expected future tax consequences of events that have been recognized in our consolidated financial statements but have not been reflected in our taxable income. Estimates and judgments occur in the calculation of certain tax liabilities and in the determination of the recoverability of certain deferred income tax assets, which arise from temporary differences and carryforwards. We measure deferred income tax assets and liabilities using the currently enacted tax rates that apply to taxable income in effect for the years in which those tax assets are expected to be realized or settled. We regularly assess the likelihood that our deferred income tax assets will be realized based on the positive and negative evidence available. We record a valuation allowance to reduce the deferred tax assets to the amount that we are more likely than not to realize.
We believe that we have adequately reserved for our uncertain tax positions, although we can provide no assurance that the final tax outcome of these matters will not be materially different. To the extent that the final tax outcome of these matters is different than the amounts recorded, such differences will affect the provision for income taxes in the period in which such determination is made and could have a material impact on our financial condition and results of operations. The provision for income taxes includes the effects of any reserves that we believe are appropriate, as well as the related net interest and penalties.
Loss Contingencies
We use significant judgment and assumptions to estimate the likelihood of loss or the incurrence of a liability in determining loss contingencies. We accrue an estimated loss contingency when it is probable that a liability has been incurred and we can reasonably estimate the amount of loss. We record a charge equal to the minimum estimated liability for litigation costs or a loss contingency only when both of the following conditions are met: (i) information available prior to issuance of our consolidated financial statements indicates that it is probable that a liability had been incurred at the date of the financial statements and (ii) the range of loss can be reasonably estimated. We regularly evaluate current information available to us to determine whether such accruals should be adjusted and whether new accruals are required.
Recent Accounting Pronouncements
Refer to “Recent Accounting Pronouncements” in Note 1 to Consolidated Financial Statements included in Part II, Item 8 of this Annual Report on Form 10-K.
58
Item 7A. Quantitative and Qualitative Disclosures About Market Risk
We are exposed to market risk in the ordinary course of our business. Market risk represents the risk of loss that may impact our financial position due to adverse changes in financial market prices and rates. Our market risk exposure is primarily a result of fluctuations in foreign currency exchange rates, interest rates and investments in privately held companies.
Foreign Currency Risk
Our results of operations and cash flows are subject to fluctuations due to changes in foreign currency exchange rates. Substantially all of our revenue is denominated in U.S. dollars. Our expenses are generally denominated in the currencies in which our operations are located, which is primarily in the U.S. and to a lesser extent in Europe and Asia. Our results of operations and cash flows are, therefore, subject to fluctuations due to changes in foreign currency exchange rates and may be adversely affected in the future due to changes in foreign exchange rates. The effect of a 100 basis point hypothetical change in foreign currency exchanges rates applicable to our business would not have a material impact on our historical consolidated financial statements.
Interest Rate Sensitivity
Our exposure to market risk for changes in interest rates relates primarily to our cash and cash equivalents, available-for-sale marketable securities, notes receivable and our indebtedness. Our cash and cash equivalents are held in cash deposits, money market funds with maturities of less than 90 days from the date of purchase. Our primary exposure to market risk is interest income sensitivity, which is affected by changes in the general level of the interest rates in the U.S. However, because of the short-term nature of the instruments in our portfolio, a sudden change in market interest rates would not be expected to have a material impact on our consolidated financial statements.
As of December 31, 2014, we had approximately $209.4 million invested in available-for-sale marketable securities. An immediate hypothetical change of 100 basis points to the interest rate would not have a material adverse impact on our future operating results and cash flows. As of December 31, 2013, we did not hold or issue financial instruments for trading purposes.
Investments in Privately Held Companies
We have invested in privately held companies in 2014. These investments are recorded in investments, non-current in our consolidated balance sheets and are accounted for using the cost method. As of December 31, 2014, the total carrying amount of our investments in privately held companies was $33.6 million. Some of the privately held companies in which we invested are in the startup or development stages. These investments are inherently risky because the markets for the technologies or products these companies are developing are typically in the early stages and may never materialize. We could lose our entire investment in these companies. Our evaluation of investments in privately held companies is based on the fundamentals of the businesses invested in, including, among other factors, the nature of their technologies and potential for financial return.
59
Item 8. Financial Statements and Supplementary Data
INDEX TO CONSOLIDATED FINANCIAL STATEMENTS
Page | ||
The supplementary financial information required by this Item 8 is included in Item 7 under the caption “Quarterly Results of Operations.”
60
REPORT OF INDEPENDENT REGISTERED PUBLIC ACCOUNTING FIRM
The Board of Directors and Stockholders
Arista Networks, Inc.
We have audited the accompanying consolidated balance sheets of Arista Networks, Inc. as of December 31, 2014 and 2013, and the related consolidated statements of income, comprehensive income, stockholders’ equity (deficit) and cash flows for each of the three years in the period ended December 31, 2014. These financial statements are the responsibility of the Company’s management. Our responsibility is to express an opinion on these financial statements based on our audits.
We conducted our audits in accordance with the standards of the Public Company Accounting Oversight Board (United States). Those standards require that we plan and perform the audit to obtain reasonable assurance about whether the financial statements are free of material misstatement. We were not engaged to perform an audit of the Company’s internal control over financial reporting. Our audits included consideration of internal control over financial reporting as a basis for designing audit procedures that are appropriate in the circumstances, but not for the purpose of expressing an opinion on the effectiveness of the Company’s internal control over financial reporting. Accordingly, we express no such opinion. An audit also includes examining, on a test basis, evidence supporting the amounts and disclosures in the financial statements, assessing the accounting principles used and significant estimates made by management, and evaluating the overall financial statement presentation. We believe that our audits provide a reasonable basis for our opinion.
In our opinion, the financial statements referred to above present fairly, in all material respects, the consolidated financial position of Arista Networks, Inc. at December 31, 2014 and 2013, and the consolidated results of its operations and its cash flows for each of the three years in the period ended December 31, 2014, in conformity with U.S. generally accepted accounting principles.
/s/ Ernst & Young LLP
Redwood City, California
March 11, 2015
61
ARISTA NETWORKS, INC.
Consolidated Balance Sheets
(In thousands, except par value)
December 31, | |||||||
2014 | 2013 | ||||||
ASSETS | |||||||
CURRENT ASSETS: | |||||||
Cash and cash equivalents | $ | 240,031 | $ | 113,664 | |||
Marketable securities | 209,426 | — | |||||
Accounts receivable, net of allowances of $3,094 and $2,339, respectively | 96,982 | 77,999 | |||||
Inventories | 80,519 | 67,094 | |||||
Deferred tax assets | 12,252 | 12,356 | |||||
Prepaid expenses and other current assets | 40,269 | 7,653 | |||||
Investments | — | 4,000 | |||||
Total current assets | 679,479 | 282,766 | |||||
Property and equipment, net | 71,558 | 67,204 | |||||
Deferred tax assets | 11,510 | 4,541 | |||||
Investments, non-current | 36,636 | — | |||||
Other assets | 11,840 | 10,009 | |||||
TOTAL ASSETS | $ | 811,023 | $ | 364,520 | |||
LIABILITIES AND STOCKHOLDERS’ EQUITY | |||||||
CURRENT LIABILITIES: | |||||||
Accounts payable | $ | 32,428 | $ | 20,111 | |||
Accrued liabilities | 40,369 | 21,539 | |||||
Deferred revenue | 60,327 | 41,306 | |||||
Convertible notes payable, related party | — | 24,743 | |||||
Accrued interest payable, related party | — | 4,484 | |||||
Convertible notes payable | — | 74,050 | |||||
Accrued interest payable | — | 12,967 | |||||
Other current liabilities | 11,249 | 10,144 | |||||
Total current liabilities | 144,373 | 209,344 | |||||
Income taxes payable | 17,323 | 14,716 | |||||
Lease financing obligations, non-current | 42,547 | 43,152 | |||||
Deferred revenue, non-current | 46,141 | 17,598 | |||||
Other long-term liabilities | 4,981 | 1,978 | |||||
TOTAL LIABILITIES | 255,365 | 286,788 | |||||
Commitments and contingencies (Note 6) | |||||||
STOCKHOLDERS’ EQUITY: | |||||||
Preferred stock, $0.0001 par value—100,000 shares authorized, no shares issued and outstanding as of December 31, 2014; no shares authorized, issued and outstanding as of December 31, 2013 | — | — | |||||
Convertible preferred stock, $0.0001 par value— no shares and 24,000 shares authorized, issued and outstanding at December 31, 2014 and December 31, 2013; aggregate liquidation preference of $6,000 as of December 31, 2013 (none as of December 31, 2014) | — | 5,992 | |||||
Common stock, $0.0001 par value—1,000,000 and 176,000 shares authorized as of December 31, 2014 and December 31, 2013; 65,528 and 31,927 shares issued and outstanding as of December 31, 2014 and December 31, 2013 | 7 | 3 | |||||
Additional paid-in capital | 426,171 | 28,737 | |||||
Retained earnings | 129,814 | 42,964 | |||||
Accumulated other comprehensive income (loss) | (334) | 36 | |||||
TOTAL STOCKHOLDERS’ EQUITY | 555,658 | 77,732 | |||||
TOTAL LIABILITIES AND STOCKHOLDERS’ EQUITY | $ | 811,023 | $ | 364,520 | |||
The accompanying notes are an integral part of these consolidated financial statements.
62
ARISTA NETWORKS, INC.
Consolidated Statements of Income
(In thousands, except per share amounts)
Year Ended December 31, | |||||||||||
2014 | 2013 | 2012 | |||||||||
Revenue | $ | 584,106 | $ | 361,224 | $ | 193,408 | |||||
Cost of revenue | 192,015 | 122,686 | 61,252 | ||||||||
Gross profit | 392,091 | 238,538 | 132,156 | ||||||||
Operating expenses: | |||||||||||
Research and development | 148,909 | 98,587 | 55,155 | ||||||||
Sales and marketing | 85,338 | 55,115 | 28,603 | ||||||||
General and administrative | 32,331 | 18,688 | 8,501 | ||||||||
Total operating expenses | 266,578 | 172,390 | 92,259 | ||||||||
Income from operations | 125,513 | 66,148 | 39,897 | ||||||||
Other income (expense), net: | |||||||||||
Interest expense—related party | (782 | ) | (1,739 | ) | (1,735 | ) | |||||
Interest expense | (5,498 | ) | (5,380 | ) | (5,322 | ) | |||||
Other income (expense), net | 2,275 | (754 | ) | 135 | |||||||
Total other income (expense), net | (4,005 | ) | (7,873 | ) | (6,922 | ) | |||||
Income before provision for income taxes | 121,508 | 58,275 | 32,975 | ||||||||
Provision for income taxes | 34,658 | 15,815 | 11,626 | ||||||||
Net income | $ | 86,850 | $ | 42,460 | $ | 21,349 | |||||
Net income attributable to common stockholders: | |||||||||||
Basic | $ | 68,889 | $ | 20,777 | $ | 9,622 | |||||
Diluted | $ | 70,524 | $ | 21,780 | $ | 9,662 | |||||
Net income per share attributable to common stockholders: | |||||||||||
Basic | $ | 1.42 | $ | 0.76 | $ | 0.39 | |||||
Diluted | $ | 1.29 | $ | 0.72 | $ | 0.39 | |||||
Weighted-average shares used in computing net income per share attributable to common stockholders: | |||||||||||
Basic | 48,427 | 27,320 | 24,711 | ||||||||
Diluted | 54,590 | 30,051 | 24,901 | ||||||||
The accompanying notes are an integral part of these consolidated financial statements.
63
ARISTA NETWORKS, INC.
Consolidated Statements of Comprehensive Income
(In thousands)
Year Ended December 31, | |||||||||||
2014 | 2013 | 2012 | |||||||||
Net income | $ | 86,850 | $ | 42,460 | $ | 21,349 | |||||
Other comprehensive income (loss), net of tax: | |||||||||||
Foreign currency translation adjustments | (217) | (2) | 4 | ||||||||
Change in net unrealized loss on available-for-sale securities | (153) | — | — | ||||||||
Other comprehensive income (loss) | (370) | (2) | 4 | ||||||||
Comprehensive income | $ | 86,480 | $ | 42,458 | $ | 21,353 | |||||
The accompanying notes are an integral part of these consolidated financial statements.
64
ARISTA NETWORKS, INC.
Consolidated Statements of Stockholders’ Equity (Deficit)
(In thousands)
Convertible Preferred Stock | Common Stock | Additional Paid-In Capital | Retained Earnings (Accumulated Deficit) | Accumulated Other Comprehensive Income | Total Stockholders’ Equity (Deficit) | ||||||||||||||||||||||||
Shares | Amount | Shares | Amount | ||||||||||||||||||||||||||
Balance—December 31, 2011 | 24,000 | $ | 5,992 | 29,788 | $ | 3 | $ | 6,622 | $ | (20,845 | ) | $ | 34 | $ | (8,194 | ) | |||||||||||||
Net income | — | — | — | — | — | 21,349 | — | 21,349 | |||||||||||||||||||||
Other comprehensive income, net of tax | — | — | — | — | — | — | 4 | 4 | |||||||||||||||||||||
Tax benefit for equity incentive plans | — | — | — | — | 39 | — | — | 39 | |||||||||||||||||||||
Stock-based compensation | — | — | — | — | 4,703 | — | — | 4,703 | |||||||||||||||||||||
Vesting of stock options and restricted stock | — | — | — | — | 861 | — | — | 861 | |||||||||||||||||||||
Exercise of stock options, net of repurchases | — | — | 498 | — | 104 | — | — | 104 | |||||||||||||||||||||
Exercise of stock purchase rights | — | — | 20 | — | 44 | — | — | 44 | |||||||||||||||||||||
Balance—December 31, 2012 | 24,000 | 5,992 | 30,306 | 3 | 12,373 | 504 | 38 | 18,910 | |||||||||||||||||||||
Net income | — | — | — | — | — | 42,460 | — | 42,460 | |||||||||||||||||||||
Other comprehensive income, net of tax | — | — | — | — | — | — | (2 | ) | (2 | ) | |||||||||||||||||||
Tax benefit for equity incentive plans | — | — | — | — | 552 | — | — | 552 | |||||||||||||||||||||
Stock-based compensation | — | — | — | — | 10,159 | — | — | 10,159 | |||||||||||||||||||||
Vesting of stock options and restricted stock | — | — | — | — | 4,041 | — | — | 4,041 | |||||||||||||||||||||
Exercise of stock options, net of repurchases | — | — | 1,600 | — | 1,453 | — | — | 1,453 | |||||||||||||||||||||
Exercise of stock purchase rights | — | — | 21 | — | 159 | — | — | 159 | |||||||||||||||||||||
Balance—December 31, 2013 | 24,000 | $ | 5,992 | 31,927 | $ | 3 | $ | 28,737 | $ | 42,964 | $ | 36 | $ | 77,732 | |||||||||||||||
Net income | — | — | — | — | — | 86,850 | — | 86,850 | |||||||||||||||||||||
Other comprehensive loss, net of tax | — | — | — | — | — | — | (370 | ) | (370 | ) | |||||||||||||||||||
Issuance of common stock from initial public offering, net of offering costs | — | — | 6,038 | 1 | 239,054 | — | — | 239,055 | |||||||||||||||||||||
Conversion of convertible preferred stock into common stock upon initial public offering | (24,000 | ) | (5,992 | ) | 24,000 | 3 | 5,989 | — | — | — | |||||||||||||||||||
Conversion of notes payable and accrued interest into common stock upon initial public offering | — | — | 1,543 | — | 66,338 | — | — | 66,338 | |||||||||||||||||||||
Conversion of notes payable and accrued interest, related party, into common stock upon initial public offering | — | — | 701 | — | 30,153 | — | — | 30,153 | |||||||||||||||||||||
Tax benefit for equity incentive plans | — | — | — | — | 17,358 | — | — | 17,358 | |||||||||||||||||||||
Stock-based compensation | — | — | — | — | 27,619 | — | — | 27,619 | |||||||||||||||||||||
Vesting of stock options and restricted stock | — | — | — | — | 4,095 | — | — | 4,095 | |||||||||||||||||||||
Exercise of stock options, net of repurchases | — | — | 1,319 | — | 6,828 | — | — | 6,828 | |||||||||||||||||||||
Balance—December 31, 2014 | — | $ | — | 65,528 | $ | 7 | $ | 426,171 | $ | 129,814 | $ | (334 | ) | $ | 555,658 | ||||||||||||||
The accompanying notes are an integral part of these consolidated financial statements.
65
ARISTA NETWORKS, INC.
Consolidated Statements of Cash Flows
(In thousands)
Year Ended December 31, | |||||||||||
2014 | 2013 | 2012 | |||||||||
CASH FLOWS FROM OPERATING ACTIVITIES: | |||||||||||
Net income | $ | 86,850 | $ | 42,460 | $ | 21,349 | |||||
Adjustments to reconcile net income to net cash provided by operating activities: | |||||||||||
Depreciation and amortization | 10,021 | 5,044 | 1,779 | ||||||||
Stock-based compensation | 27,619 | 10,159 | 4,703 | ||||||||
Deferred income taxes | (6,774 | ) | (8,831 | ) | (3,722 | ) | |||||
Provision for bad debts | 860 | 191 | 326 | ||||||||
Realized gain on notes receivable | (4,000 | ) | — | — | |||||||
Amortization of debt discount | 527 | 1,118 | 1,040 | ||||||||
Write-off of debt discount on notes payable | 680 | — | — | ||||||||
Excess tax benefit on stock based-compensation | (17,436 | ) | (882 | ) | (95 | ) | |||||
Other | 348 | — | — | ||||||||
Changes in operating assets and liabilities: | |||||||||||
Accounts receivable | (19,844 | ) | (28,289 | ) | (22,043 | ) | |||||
Inventories | (13,425 | ) | (49,179 | ) | (7,153 | ) | |||||
Prepaid expenses and other current assets | (32,616 | ) | 2,981 | (5,009 | ) | ||||||
Other assets | (4,261 | ) | (305 | ) | (173 | ) | |||||
Accounts payable | 14,007 | 3,865 | 3,842 | ||||||||
Accrued liabilities | 18,874 | 11,967 | 6,544 | ||||||||
Deferred revenue | 47,564 | 34,127 | 13,451 | ||||||||
Interest payable | (1,630 | ) | 4,501 | 4,512 | |||||||
Interest payable—related party | 670 | 1,500 | 1,504 | ||||||||
Income taxes payable | 4,377 | 2,141 | 4,914 | ||||||||
Other liabilities | 2,105 | 2,080 | 537 | ||||||||
Net cash provided by operating activities | 114,516 | 34,648 | 26,306 | ||||||||
CASH FLOWS FROM INVESTING ACTIVITIES: | |||||||||||
Purchases of property and equipment | (13,134 | ) | (20,316 | ) | (3,312 | ) | |||||
Purchases of marketable securities | (210,019 | ) | — | — | |||||||
Proceeds from repayment of notes receivable | 8,000 | 1,000 | — | ||||||||
Change in restricted cash | 4,040 | — | (4,040 | ) | |||||||
Other investing activities | (38,249 | ) | (175 | ) | (5,000 | ) | |||||
Net cash used in investing activities | (249,362 | ) | (19,491 | ) | (12,352 | ) | |||||
CASH FLOWS FROM FINANCING ACTIVITIES: | |||||||||||
Proceeds from initial public offering, net of issuance cost | 239,315 | — | — | ||||||||
Repayment on notes payable | (20,000 | ) | — | — | |||||||
Principal payments of lease financing obligations | (793 | ) | — | — | |||||||
Proceeds from issuance of common stock upon exercising options, net of repurchases | 25,379 | 9,004 | 3,882 | ||||||||
Excess tax benefit on stock-based compensation | 17,436 | 882 | 95 | ||||||||
Net cash provided by financing activities | 261,337 | 9,886 | 3,977 | ||||||||
Effect of exchange rate changes | (124 | ) | (34 | ) | (1 | ) | |||||
NET INCREASE IN CASH AND CASH EQUIVALENTS | 126,367 | 25,009 | 17,930 | ||||||||
CASH AND CASH EQUIVALENTS—Beginning of period | 113,664 | 88,655 | 70,725 | ||||||||
CASH AND CASH EQUIVALENTS—End of period | $ | 240,031 | $ | 113,664 | $ | 88,655 | |||||
66
ARISTA NETWORKS, INC.
Consolidated Statements of Cash Flows
(In thousands)
Year Ended December 31, | |||||||||||
2014 | 2013 | 2012 | |||||||||
SUPPLEMENTAL DISCLOSURES OF CASH FLOW INFORMATION: | |||||||||||
Cash paid for income taxes | $ | 44,770 | $ | 16,806 | $ | 15,114 | |||||
Cash paid for interest— notes payable | $ | 3,639 | $ | — | $ | — | |||||
Cash paid for interest— lease financing obligation | $ | 2,809 | $ | — | $ | — | |||||
SUPPLEMENTAL DISCLOSURES OF NON-CASH INVESTING AND FINANCING INFORMATION: | |||||||||||
Conversion of notes payable and accrued interest to common stock upon initial public offering | $ | 66,338 | $ | — | $ | — | |||||
Conversion of notes payable and accrued interest, related party, to common stock upon initial public offering | $ | 30,153 | $ | — | $ | — | |||||
Conversion of convertible preferred stock to common stock upon initial public offering | $ | 5,992 | $ | — | $ | — | |||||
Increase in accounts payable and accrued liabilities related to property and equipment | $ | 1,240 | $ | 2,668 | $ | 886 | |||||
Acquisition of building with financing obligation | $ | 456 | $ | 18,718 | $ | 25,253 | |||||
Unpaid deferred offering costs | $ | 261 | $ | — | $ | — | |||||
The accompanying notes are an integral part of these consolidated financial statements.
67
ARISTA NETWORKS, INC.
Notes to Consolidated Financial Statements
1. Organization and Summary Significant Accounting Policies
Organization
Arista Networks, Inc. (together with our subsidiaries, “we,” “our” or “us”) is a supplier of cloud networking solutions that use software innovations to address the needs of large-scale Internet companies, cloud service providers and next-generation enterprise. Our cloud networking solutions consist of our Extensible Operating System, a set of network applications and our 10/40/100 Gigabit Ethernet switches. We were incorporated in October 2004 in the State of California under the name Arastra, Inc. In March 2008, we reincorporated in the State of Nevada and in October 2008 changed our name to Arista Networks, Inc. We reincorporated in the state of Delaware in March 2014. Our corporate headquarters are located in Santa Clara, California, and we have wholly-owned subsidiaries throughout the world, including North America, Europe, Asia and Australia.
Initial Public Offering
On June 6, 2014, we completed our initial public offering (the “IPO”) in which we sold 6,037,500 shares of our common stock at a public offering price of $43.00 per share, which included 787,500 shares of common stock issued pursuant to the exercise in full of the over-allotment option granted to the underwriters. The IPO resulted in proceeds of $239.1 million, net of underwriting discounts and commissions of $15.6 million and other issuance costs of $5.0 million. In connection with the closing of the IPO, all of our outstanding convertible preferred stock automatically converted into 24,000,000 shares of common stock on a one-to-one basis.
Upon the closing of our IPO, all noteholders with the exception of one noteholder converted the principal and accrued interest amount outstanding under their subordinated convertible promissory notes into shares of our common stock at the IPO price of $43.00 per share. The noteholder, who did not elect to so convert, was paid a total of $23.6 million which included principal and accrued interest less applicable withholding taxes of $1.1 million. The remainder of the noteholders converted the remaining debt balance of approximately $96.5 million including principal and accrued interest into 2.2 million shares of our common stock.
Basis of Presentation
The accompanying consolidated financial statements include the accounts of Arista Networks, Inc. and our wholly owned subsidiaries. All significant intercompany accounts and transactions have been eliminated. Our consolidated financial statements are prepared in accordance with U.S. generally accepted accounting principles (GAAP).
Use of Estimates
The preparation of the accompanying consolidated financial statements in conformity with GAAP requires us to make estimates and assumptions that affect the amounts reported and disclosed in the consolidated financial statements and accompanying notes. Those estimates and assumptions include, but are not limited to, revenue recognition and deferred revenue; allowance for doubtful accounts and sales return reserve; determination of fair value for stock-based awards; accounting for income taxes, including the valuation allowance on deferred tax assets and reserves for uncertain tax positions; valuation of inventory; valuation of warranty accruals; and the recognition and measurement of contingent liabilities. We evaluate our estimates and assumptions on an ongoing basis using historical experience and other factors and adjust those estimates and assumptions when facts and circumstances dictate. As future events and their effects cannot be determined with precision, actual results could differ from these estimates, and those differences could be material to the consolidated financial statements.
Consolidation of Variable Interest Entities
We use a qualitative approach in assessing the consolidation requirement for variable interest entities (VIEs). This approach focuses on determining whether we have the power to direct the activities of the VIE that most significantly affect the VIE’s economic performance and whether we have the obligation to absorb losses, or the right to receive benefits, that could potentially be significant to the VIE. For all periods presented in the accompanying consolidated financial statements, we have determined that we are not the primary beneficiary of any VIEs. However, in the event that we are the primary beneficiary of a VIE entity, the assets, liabilities, and results of operations of the VIE will be included in our consolidated financial statements.
Business Concentrations
We work closely with third parties to manufacture and deliver our products. As of December 31, 2014 and 2013, two suppliers provided all of our electronic manufacturing services. Our products rely on key components, including certain integrated circuit components and power supplies some of which our contract manufacturers purchase on our behalf from a limited number
68
of suppliers, including certain sole source providers. We do not have guaranteed supply contracts with any of our component suppliers, and our suppliers could delay shipments or cease manufacturing such products or selling them to us at any time. If we are unable to obtain a sufficient quantity of these components on commercially reasonable terms or in a timely manner, sales of our products could be delayed or halted entirely or we may be required to redesign our products. Quality or performance failures of our products or changes in our contractors’ or vendors’ financial or business condition could disrupt our ability to supply quality products to our customers. Any of these events could result in lost sales and damage to our end-customer relationships, which would adversely impact our business, financial condition and results of operations.
Concentrations of Credit Risk
Financial instruments that potentially subject us to concentrations of credit risk consist primarily of cash, cash equivalents, marketable securities, restricted cash, accounts receivable and notes receivable. Our cash, cash equivalents and restricted cash are invested in high quality financial instruments with banks and financial institutions. Such deposits may be in excess of insured limits provided on such deposits.
Our accounts receivable are unsecured and represent amounts due to us based on contractual obligations of our customers. We mitigate credit risk in respect to accounts receivable by performing ongoing credit evaluations of our customers to assess the probability of accounts receivable collection based on a number of factors, including past transaction experience with the customer, evaluation of their credit history, the credit limits extended and review of the invoicing terms of the contract. We generally do not require our customers to provide collateral to support accounts receivable. We have recorded an allowance for doubtful accounts for those receivables that we have determined not to be collectible. Our notes receivable are secured and represent amounts due to us from a private company. We mitigate credit risk in respect to the notes receivable by performing ongoing credit evaluations of the borrower to assess the probability of collecting all amounts due to us under the existing contractual terms.
We market and sell our products through both our direct sales force and our channel partners, including distributors, value-added resellers, system integrators and original equipment manufacturer (“OEM”) partners. Significant customers are those which represent more than 10% of our total net revenue during the period or net accounts receivable balance at each respective balance sheet date. For each significant customer, revenue as a percentage of total revenue and accounts receivable as a percentage of total accounts receivable are as follows:
Revenue | Accounts Receivable | ||||||||||||||
Year Ended December 31, | December 31, | ||||||||||||||
Customers | 2014 | 2013 | 2012 | 2014 | 2013 | ||||||||||
Customer A | 15 | % | 22 | % | 15 | % | 15 | % | 17 | % | |||||
Customer B | * | * | * | * | 11 | % | |||||||||
*less than 10%
Reclassifications
As a result of a change in classification, we have reclassified our spare parts inventory from inventory to other current and non-current assets as of December 31, 2014. Spare parts inventory are used to satisfy our warranty obligations, and are not available for sale or used in the production process. Prior year balances have been adjusted to conform to this new classification for comparability purposes.
Comprehensive Income
Comprehensive income is comprised of net income and other comprehensive income. Unrealized gains and losses on available-for-sale investments and foreign currency translation adjustments are included in our other comprehensive income or loss.
Cash and Cash Equivalents
We consider all highly liquid investments with stated maturity of three months or less at the time of purchase to be cash equivalents. Cash and cash equivalents consist of cash on deposit with various financial institutions and highly liquid investments in money market funds. Interest is accrued as earned.
Marketable Securities
We invest our excess cash primarily in money market and highly liquid debt instruments of the U.S. government. We classify all highly liquid investments with stated maturities of greater than three months as marketable securities. We determine the appropriate classification of our investments in marketable securities at the time of purchase and reevaluate such designation at each balance sheet date. We have classified and accounted for our marketable securities as available-for-sale. We may or may not hold securities with stated maturities greater than 12 months until maturity. After consideration of our risk versus reward
69
objectives, as well as our liquidity requirements, we may sell these securities prior to their stated maturities. As we view these securities as available to support current operations, we classify securities with maturities beyond 12 months as current assets under the caption marketable securities in the accompanying consolidated balance sheets. We carry these securities at fair value, and report the unrealized gains and losses, net of taxes, as a component of stockholders’ equity, except for unrealized losses determined to be other-than-temporary, which we record as other income (expense), net. We determine any realized gains or losses on the sale of marketable securities on a specific identification method, and we record such gains and losses as a component of interest and other income, net.
Fair Value Measurements
Our assets and liabilities which require fair value measurement consist of cash and cash equivalents, restricted cash, marketable securities, accounts receivable, investments, accounts payable, accrued liabilities and convertible notes payable. Cash equivalents, restricted cash, accounts receivable, accounts payable and accrued liabilities are stated at carrying amounts as reported in the consolidated financial statements, which approximates fair value due to their short term nature. For certain investments where we have elected the fair value option, these investments are stated at fair value. The carrying amounts of our convertible notes payable approximate fair value as the stated interest rates approximate market rates currently available to us.
Assets and liabilities recorded at fair value on a recurring basis in the accompanying consolidated balance sheets are categorized based upon the level of judgment associated with the inputs used to measure their fair value. Fair value is defined as the exchange price that would be received for an asset or an exit price that would be paid to transfer a liability in the principal or most advantageous market for the asset or liability in an orderly transaction between market participants on the measurement date. Valuation techniques used to measure fair value must maximize the use of observable inputs and minimize the use of unobservable inputs. The authoritative guidance on fair value measurements establishes a three-tier fair value hierarchy for disclosure of the inputs used to measure fair value instruments as follows:
Level I—Inputs are unadjusted, quoted prices in active markets for identical assets or liabilities at the measurement date;
Level II—Inputs are observable, unadjusted quoted prices in active markets for similar assets or liabilities, unadjusted quoted prices for identical or similar assets or liabilities in markets that are not active, or other inputs that are observable or can be corroborated by observable market data for substantially the full term of the related assets or liabilities; and
Level III—Unobservable inputs that are supported by little or no market data for the related assets or liabilities and typically reflect management’s estimate of assumptions that market participants would use in pricing the asset or liability.
Our financial instruments consist of Level I and Level III assets. Level I assets include highly liquid money market funds that are included in cash and cash equivalents and U.S. government notes classified as marketable securities. Level III assets that were measured on a recurring basis consisted solely of our notes receivable. We classified the notes receivable as Level III, as we used unobservable inputs to the valuation methodology that were significant to the fair value measurement, and the valuation required management judgment due to the absence of quoted market prices. We measured the fair value for certain investments based upon the probability-weighted present value of expected future investment returns, considering each of the possible future outcomes available to us. The significant unobservable inputs used in the fair value measurement of the convertible notes are the scenario probabilities and the discount rate estimated at the valuation date. Generally, increases (decreases) in the discount rate would result in a directionally opposite impact to the fair value measurement of the notes. Also, changes in the probability scenarios would have had varying impacts depending on the weighting of each specific scenario. More weighting towards a change in control or an equity financing by the investee would result in an increase in fair value of the notes receivable.
Restricted Cash
We had restricted cash pledged as collateral representing a security deposit required for a facility lease. As of December 31, 2013, we had classified the restricted cash of $4.0 million as other assets in our accompanying consolidated balance sheet. We did not have any restricted cash as of December 31, 2014.
Foreign Currency
The functional currency of our foreign subsidiaries is either the U.S. dollar or their local currency.
Transaction re-measurement-Assets and liabilities denominated in a currency other than the foreign subsidiaries’ functional currency are re-measured into the functional currency using exchange rates in effect at the end of the reporting period, with gains and losses recorded in other income (expense), net in the consolidated statements of income. We recognized $0.6 million, $0.1 million and $0.2 million in transaction losses for the years ended December 31, 2014, 2013 and 2012, respectively.
Translation-Assets and liabilities of subsidiaries denominated in foreign functional currencies are translated into U.S. dollars at the closing exchange rate on the balance sheet date and equity related balances are translated at historical exchange rates. Revenues, costs and expenses in foreign functional currencies are translated using average exchange rates that
70
approximate those in effect during the period. Translation adjustments are accumulated as a separate component of accumulated other comprehensive income within stockholders’ equity (deficit).
Accounts Receivable, Allowance for Doubtful Accounts, and Sales Return Reserves
Accounts receivable are recorded at the invoiced amount, net of allowances for doubtful accounts, and sales return reserves. We estimate our allowance for doubtful accounts based upon the collectability of the receivables in light of historical trends, adverse situations that may affect our customers’ ability to pay and prevailing economic conditions. This evaluation is done in order to identify issues which may impact the collectability of receivables and related estimated required allowance. Revisions to the allowance are recorded as an adjustment to bad debt expense. After appropriate collection efforts are exhausted, specific accounts receivable deemed to be uncollectible are charged against the allowance in the period they are deemed uncollectible. Recoveries of accounts receivable previously written-off are recorded as credits to bad debt expense. We estimate our sales return reserves based on historical return rates applied against current period gross revenues. Specific customer returns and allowances are considered when determining our sales return reserve estimate. Revisions to the reserve are recorded as adjustments to revenue and the sales return reserves.
We mitigate credit risk in respect to accounts receivable by performing ongoing credit evaluations of our customers and channel partners to assess the probability of accounts receivable collection based on a number of factors, including past transaction experience with the customer or channel partner, evaluation of credit history, the credit limits extended and review of the invoicing terms of the arrangement. In situations where a partner or customer may be thinly capitalized and we have limited payment history with it, we will either establish a small credit limit or require it to prepay their purchases.
Inventories
Inventories primarily consist finished goods purchased from third party contract manufacturers and are stated at the lower of cost (computed using the first-in, first-out method) or market value. Manufacturing overhead costs and inbound shipping costs are included in the cost of inventory. In addition, we also purchase certain strategic component inventory, including integrated circuits which are consigned to our contract manufacturers. We record a provision when inventory is determined to be in excess of anticipated demand, or obsolete, to adjust inventory to its estimated realizable value. For the years ended December 31, 2014, 2013 and 2012, we incurred inventory write-downs of $2.8 million, $5.3 million and $3.2 million, respectively.
We outsource most of our manufacturing and supply chain management operations to two third-party contract manufacturers and as a result, a significant portion of our cost of revenue consists of payments to them. Our third-party contract manufacturers purchase and own a portion of the material used to build our switch products until they are shipped to us, at which time our third-party contract manufacturers invoice us. In addition, we also purchase certain strategic component inventory, including integrated circuits which are consigned to our third-party contract manufacturers. As of December 31, 2014 and 2013, our strategic component inventory consigned to others was $17.1 million and $18.3 million, respectively, and are included in raw materials.
Our finished goods inventory consists of our finished switch products and accessories. This inventory is located principally at third-party direct fulfillment facilities in California, the Netherlands and Singapore.
Property and Equipment
Property and equipment are stated at cost, less accumulated depreciation. Depreciation is calculated using the straight-line method over the shorter of the estimated useful lives of the related assets, generally from one to five years, 30 years for buildings or the lease term for leasehold improvements. The leased building under our build to suit lease is capitalized and included in property and equipment as we were involved in the construction funding and did not meet the “sale-leaseback” criteria.
Investments
Investments in Privately-held Companies
In 2014, we have equity investments in privately-held companies. Our investments are accounted for under the cost method and are included in investments, non-current in the accompanying consolidated balance sheets. Initial measurement of our investments under the cost method were recorded at historical cost which represents our initial investment in the privately-held companies. We will periodically assess and evaluate our cost method investments for impairment and perform an assessment based on evaluation of overall financial performance, industry and market conditions, and other relevant events or factors deemed necessary that may affect carrying value. If we determine that a decrease in the equity investments should be recognized given impairment that is considered “other-than-temporary” in nature, we will write-down the carrying amount to its revised new fair value.
Notes Receivable
In 2014, we also entered into an unsecured promissory note with a privately held company which was recorded at cost.
71
In 2012, we entered into secured note purchase agreements with a private company to provide them with cash advances. We elected the fair value option to account for these investments and recorded unrealized gains and losses in earnings at each subsequent reporting date. Accordingly, these notes receivable were remeasured to fair value at the end of each reporting period. Upfront costs and fees incurred in conjunction with entering into notes receivable were expensed and recognized in earnings as incurred. Gains and losses from the change in fair value, as well as interest income, were recorded in other income (expense), net in the accompanying consolidated statements of income at each reporting period. In 2014, we received payment in full from the borrower equal to two times our outstanding principal balance as well as the unpaid accrued interest through the payment date.
Impairment of Long-Lived Assets and Investments
The carrying amounts of our long-lived assets, including property and equipment and investments in privately-held companies, are periodically reviewed for impairment whenever events or changes in circumstances indicate that the carrying value of these assets may not be recoverable. Recoverability of these assets is measured by comparison of the carrying amount of each asset to the future undiscounted cash flows the asset is expected to generate over their remaining lives. If the asset is considered to be impaired, the amount of any impairment is measured as the difference between the carrying value and the fair value of the impaired asset. No impairment of any long-lived assets was identified for any of the periods presented.
Revenue Recognition
We generate revenue from sales of switching products which incorporate our EOS software and accessories such as cables and optics to direct customers and channel partners together with post contract customer support (“PCS”). We typically sell products and PCS in a single transaction. We recognize revenue when all of the following criteria are met: persuasive evidence of an arrangement exists; delivery or performance has occurred; the sales price is fixed or determinable; and collectability is reasonably assured.
We define each of the four criteria above as follows:
• | Persuasive evidence of an arrangement exists. Evidence of an arrangement consists of stand-alone purchase orders or purchase orders issued pursuant to the terms and conditions of a master sales agreement. It is our practice to identify an end customer prior to shipment to a reseller or distributor. |
• | Delivery or performance has occurred. We use shipping documents or written evidence of customer acceptance, when applicable, to verify delivery or performance. We recognize product revenue upon transfer of title and risk of loss, which primarily is upon shipment to customers. We do not have significant obligations for future performance, such as customer acceptance provisions, rights of return or pricing credits, associated with our product sales. In instances where substantive acceptance provisions are specified in the customer arrangement, revenue is deferred until all acceptance criteria have been met. |
• | The sales price is fixed or determinable. We assess whether the sales price is fixed or determinable based on payment terms and whether the sales price is subject to refund or adjustment. |
• | Collectability is reasonably assured. We assess probability of collectability on a customer-by-customer basis. Our customers and channel partners are subjected to a credit review process that evaluates their financial condition and ability to pay for products and services. |
PCS is offered under renewable, fee-based contracts, which includes technical support, hardware repair and replacement parts beyond standard warranty, bug fixes, patches and unspecified upgrades on a when-and-if-available basis. We initially defer PCS revenue and recognize it ratably over the life of the PCS contract, with the related expenses recognized as incurred. PCS contracts usually have a term of one to three years. We include billed but unearned PCS revenue in deferred revenue.
We report revenue net of sales taxes. We include shipping charges billed to customers in revenue and the related shipping costs are included in cost of goods sold.
Multiple-Element Arrangements
Most of our arrangements, other than renewals of PCS, are multiple element arrangements with a combination of products and PCS. Products and PCS generally qualify as separate units of accounting. Our hardware deliverables include EOS software, which together deliver the essential functionality of our products. For multiple element arrangements, we allocate revenue to each unit of accounting based on the relative selling price. The relative selling price for each element is based upon the following hierarchy: vendor-specific objective evidence (“VSOE”), if available; third-party evidence (“TPE”), if VSOE is not available; and best estimate of selling price (“BESP”), if neither VSOE nor TPE is available. As we have not been able to establish VSOE or TPE for our products and most of our services, we generally utilize BESP for the purposes of allocating revenue to each unit of accounting.
72
• | VSOE—We determine VSOE based on our historical pricing and discounting practices for the specific products and services when sold separately. In determining VSOE, we require that a substantial majority of the stand-alone selling prices fall within a reasonably narrow pricing range. |
• | TPE—When VSOE cannot be established for deliverables in multiple-element arrangements, we apply judgment with respect to whether we can establish a selling price based on TPE. TPE is determined based on competitor prices for interchangeable products or services when sold separately to similarly situated customers. However, as our products contain a significant element of proprietary technology and offer substantially different features and functionality, the comparable pricing of products with similar functionality typically cannot be obtained. Additionally, as we are unable to reliably determine what competitors products’ selling prices are on a stand-alone basis, we are not able to obtain reliable evidence of TPE of selling price. |
• | BESP—When we are unable to establish selling price using VSOE or TPE, we use BESP in our allocation of arrangement consideration. The objective of BESP is to determine the price at which we would transact a sale if the product or service was sold regularly on a stand-alone basis. BESP is based on considering multiple factors including, but not limited to the sales channel (reseller, distributor or end customer), the geographies in which our products and services were sold (domestic or international) and size of the end customer. |
We limit the amount of revenue recognition for delivered elements to the amount that is not contingent on the future delivery of products or services, future performance obligations, or subject to customer-specific return, acceptance or refund privileges.
We account for multiple agreements with a single partner as one arrangement if the contractual terms and/or substance of those agreements indicate that they may be so closely related that they are, in effect, parts of a single arrangement.
We may occasionally accept returns to address customer satisfaction issues even though there is no contractual provision for such returns. We estimate returns for sales to customers based on historical returns rates applied against current-period gross revenues. Specific customer returns and allowances are considered when determining our sales return reserve estimate.
Research and Development Expenses
Costs related to the research, design and development of our products are charged to research and development expenses as incurred. Software development costs are capitalized beginning when a product’s technological feasibility has been established and ending when the product is available for general release to customers. Generally, our products are released soon after technological feasibility has been established. As a result, costs incurred subsequent to achieving technological feasibility have not been significant and accordingly, all software development costs have been expensed as incurred.
Warranty
We offer a one-year warranty on all of our hardware products and a 90-day warranty against defects in the software embedded in the products. We accrue for potential warranty claims at the time of shipment as a component of cost of revenues based on historical experience and other relevant information. We accrue specifically identified reserves if and when we determine we have a systemic product failure. The accrued warranty liability is recorded in accrued liabilities in the accompanying consolidated balance sheets.
Post-Employment Benefits
We have a 401(k) Plan that covers substantially all of our employees in the U.S. For the years ended December 31, 2014, 2013 and 2012, we did not provide a discretionary company match to employee contributions.
Segment Reporting
Our chief operating decision maker is our Chief Executive Officer. Our Chief Executive Officer reviews financial information presented on a consolidated basis for purposes of allocating resources and evaluating financial performance. We have one business activity and there are no segment managers who are held accountable for operations or operating results. Accordingly, we have determined that we operate as one reportable segment.
Stock-Based Compensation
We recognize stock-based compensation for stock-based awards, including stock options, restricted stock units (RSUs), restricted stock awards (“RSAs”), stock purchase rights from our employee stock purchase program based on the estimated fair value of the awards, net of estimated forfeitures. The fair value of each stock-based award and option is estimated on the grant date using the Black-Scholes option-pricing model. This model requires that at the date of grant we determine the fair value of the underlying common stock, the expected term of the award, the expected volatility of the price of our common stock, risk-free interest rates, and expected dividend yield of our common stock. RSUs are measured based on the fair market values of the underlying stock on the dates of grant.
73
The stock-based compensation expense, net of forfeitures, is recognized on a straight-line basis over the requisite service periods of the awards, which is generally two to five years. We estimate a forfeiture rate to calculate the stock-based compensation for our awards. Our forfeiture rate is based on an analysis of our actual historical forfeitures.
Excess tax benefits associated with stock option exercises and other equity awards are recognized in additional paid in capital. The income tax benefits resulting from stock awards that were credited to stockholders' equity were $17.4 million, $0.6 million and $39,000 for the years ended December 31, 2014, 2013 and 2012, respectively.
Income Taxes
We account for income taxes under the liability approach for deferred income taxes, which requires recognition of deferred income tax assets and liabilities for the expected future tax consequences of events that have been recognized in our consolidated financial statements, but have not been reflected in our taxable income. Estimates and judgments occur in the calculation of certain tax liabilities and in the determination of the recoverability of certain deferred income tax assets, which arise from temporary differences and carryforwards. Deferred income tax assets and liabilities are measured using the currently enacted tax rates that apply to taxable income in effect for the years in which those tax assets are expected to be realized or settled. We regularly assess the likelihood that our deferred income tax assets will be realized based on the positive and negative evidence available. We record a valuation allowance to reduce the deferred tax assets to the amount that we are more likely than not to realize.
We regularly review our tax positions and benefits to be realized. We recognize tax liabilities based upon our estimate of whether, and to the extent to which, additional taxes will be due when such estimates are more likely than not to be sustained. An uncertain income tax position will not be recognized if it has less than a 50% likelihood of being sustained. We recognize interest and penalties related to income tax matters as income tax expense.
Net Income per Share of Common Stock
Basic and diluted net income per share attributable to common stockholders is calculated in conformity with the two-class method required for participating securities. We considered our Series A convertible preferred stock to be participating securities. Under the two-class method, net income attributable to common stockholders is determined by allocating undistributed earnings, calculated as net income less current period convertible preferred stock non-cumulative dividends, among our common stock and convertible preferred stock. In computing diluted net income attributable to common stockholders, undistributed earnings are re-allocated to reflect the potential impact of dilutive securities. Basic net income per common share is computed by dividing the net income attributable to common stockholders by the weighted-average number of common shares outstanding during the period. Shares of common stock subject to repurchase resulting from the early exercise of employee stock options are considered participating securities. Diluted net income per share attributable to common stockholders is computed by dividing the net income attributable to common stockholders by the weighted-average number of common shares outstanding, including potential dilutive common shares assuming the dilutive effect of outstanding stock options using the treasury stock method. For purposes of this calculation, convertible preferred stock and options to purchase shares of common stock are considered to be common stock equivalents and are excluded from the calculation of diluted net income per share of common stock if their effect is antidilutive. Convertible notes payable were excluded from the calculation of diluted net income per share since such notes were convertible to common stock at the option of the holder only upon the occurrence of a contingent event, including change in control, initial public offering or prepayment of the convertible notes.
Recent Accounting Pronouncements
In May 2014, the FASB issued ASU No. 2014-09, Revenue From Contracts With Customers, which outlines a single comprehensive model for entities to use in accounting for revenue arising from contracts with customers. The standard is effective for fiscal years (and interim reporting periods within those years) beginning after December 15, 2016. Early application is not permitted. The standard permits the use of either the retrospective or cumulative effect transition method. We are currently reviewing the provisions of the standard and have not yet selected a transition method nor have we determined the effect of the standard on our consolidated financial statements.
74
2. Fair Value Measurements
We measure and report our cash equivalents, restricted cash, available-for-sale marketable securities and notes receivable at fair value. The following table set forth the fair value of our financial assets by level within the fair value hierarchy (in thousands):
December 31, 2014 | |||||||||||||||
Level I | Level II | Level III | Total | ||||||||||||
Financial Assets | |||||||||||||||
Cash and cash equivalents: | |||||||||||||||
Money market funds | $ | 104,216 | $ | — | $ | — | $ | 104,216 | |||||||
Marketable securities: | |||||||||||||||
U.S. government notes | 209,426 | — | — | 209,426 | |||||||||||
Total financial assets | $ | 313,642 | $ | — | $ | — | $ | 313,642 | |||||||
December 31, 2013 | |||||||||||||||
Level I | Level II | Level III | Total | ||||||||||||
Financial Assets | |||||||||||||||
Cash and cash equivalents: | |||||||||||||||
Money market funds | $ | 47,036 | $ | — | $ | — | $ | 47,036 | |||||||
Other assets—Restricted cash: | |||||||||||||||
Money market funds | 4,040 | — | — | 4,040 | |||||||||||
Investments: | |||||||||||||||
Notes receivable(1) | — | — | 4,000 | 4,000 | |||||||||||
Total financial assets | $ | 51,076 | $ | — | $ | 4,000 | $ | 55,076 | |||||||
(1) There were no changes in the fair value of the Level III assets during the year ended December 31, 2013. In 2014, we increased the fair value of our Notes receivable by $4.0 million (See “Note 4 – Investments”). During the year ended December 31, 2014 and 2013, we had no transfers between levels of the fair value hierarchy of its assets measured at fair value. In October 2014, we received payment in full from the borrower equal to two times our outstanding principal balance as well as the unpaid accrued interest through the payment date.
3. Balance Sheet Components
Marketable Securities
The following table summarizes the unrealized gains and losses and fair value of our available-for-sale marketable securities (in thousands):
December 31, 2014 | |||||||||||||||
Amortized Cost | Unrealized Gains | Unrealized Losses | Fair Value | ||||||||||||
U.S. government notes | $ | 209,671 | $ | — | $ | (245 | ) | $ | 209,426 | ||||||
We did not realized any other-than-temporary losses on our marketable securities for the year ended December 31, 2014. None of our marketable securities have been in continuous unrealized loss positions for greater than twelve months as of December 31, 2014.
We did not hold any marketable securities as of December 31, 2013.
We invest in marketable securities that have maximum maturities of up to two years and are generally deemed to be low risk based on their credit ratings from the major rating agencies. The longer the duration of these marketable securities, the more susceptible they are to changes in market interest rates and bond yields. As interest rates increase, those marketable securities purchased at a lower yield show a mark-to-market unrealized loss. The unrealized losses are due primarily to changes in credit spreads and interest rates. We expect to realize the full value of all these investments upon maturity or sale. The weighted average remaining duration of our current marketable securities is approximately 0.8 years as of December 31, 2014.
75
The following table summarizes the amortized cost and fair value of our marketable securities as of December 31, 2014, by contractual years-to-maturity (in thousands):
Amortized Cost | Fair Value | ||||||
Due within one year | $ | 209,671 | $ | 209,426 | |||
Accounts Receivable, net
Accounts receivable, net consists of the following (in thousands):
December 31, | |||||||
2014 | 2013 | ||||||
Accounts receivable | $ | 100,076 | $ | 80,338 | |||
Allowance for doubtful accounts | (1,063 | ) | (810 | ) | |||
Product sales return reserve | (2,031 | ) | (1,529 | ) | |||
Accounts receivable, net | $ | 96,982 | $ | 77,999 | |||
Allowance for Doubtful Accounts
Activity in the allowance for doubtful accounts consists of the following (in thousands):
Year Ended December 31, | |||||||||||
2014 | 2013 | 2012 | |||||||||
Balance at the beginning of year | $ | 810 | $ | 1,284 | $ | 1,169 | |||||
Charged to expenses | 860 | 191 | 326 | ||||||||
Deductions (write-offs) | (607 | ) | (665 | ) | (211 | ) | |||||
Balance at the end of year | $ | 1,063 | $ | 810 | $ | 1,284 | |||||
Sales Return Reserve
Activity in the sales return reserve consists of the following (in thousands):
Year Ended December 31, | |||||||
2014 | 2013 | ||||||
Balance at the beginning of year | $ | 1,529 | $ | — | |||
Charged against revenue | 4,063 | 1,627 | |||||
Sales returns | (3,561 | ) | (98 | ) | |||
Balance at the end of year | $ | 2,031 | $ | 1,529 | |||
Inventories
Inventories consist of the following (in thousands):
December 31, | |||||||
2014 | 2013 | ||||||
Raw materials | $ | 17,094 | $ | 18,286 | |||
Finished goods | 63,425 | 48,808 | |||||
Total inventories | $ | 80,519 | $ | 67,094 | |||
Prepaid Expenses and Other Current Assets
Prepaid expenses and other current assets consists of the following (in thousands):
76
December 31, | |||||||
2014 | 2013 | ||||||
Prepaid income taxes | $ | 25,212 | $ | 134 | |||
Other current assets | 9,820 | 5,137 | |||||
Other prepaid and deposits | 5,237 | 2,382 | |||||
Total prepaid expenses and other current assets | $ | 40,269 | $ | 7,653 | |||
Property and Equipment, net
Property and equipment, net consists of the following (in thousands):
December 31, | |||||||
2014 | 2013 | ||||||
Equipment and machinery | $ | 18,265 | $ | 13,733 | |||
Computer hardware and software | 7,772 | 3,688 | |||||
Furniture and fixtures | 1,373 | 1,352 | |||||
Leasehold improvements | 19,420 | 19,407 | |||||
Building | 35,154 | 35,154 | |||||
Construction-in-process | 6,532 | 1,056 | |||||
Property and equipment, gross | 88,516 | 74,390 | |||||
Less: accumulated depreciation | (16,958 | ) | (7,186 | ) | |||
Property and equipment, net | $ | 71,558 | $ | 67,204 | |||
Building consists of capitalized construction costs of our leased building in Santa Clara, California. Based on the terms of the lease agreement and due to our involvement in certain aspects of the construction, such as our financial involvement in structural elements of asset construction, making decisions related to tenant improvement costs and purchasing insurance not reimbursable by the buyer-lessor (the Landlord), we were deemed the owner of the building (for accounting purposes only) during the construction period. We maintain continued involvement in the property after construction was completed and lack transferability of the risks and rewards of ownership, primarily due to our required maintenance of a $4.0 million letter of credit. Due to our continuing involvement in the property post construction and lack of transferability of related risks and rewards of ownership to the Landlord after construction is complete, we account for the building as a financing obligation. See “Note 6-Commitments and Contingencies”. Accordingly, as of December 31, 2014 and December 31, 2013, we have recorded assets of $53.4 million and $53.3 million, respectively, representing the total costs of the building and improvements incurred, including the costs paid by the Landlord. The building was completed in 2013.
Depreciation expense was $10.0 million, $5.0 million and $1.8 million for the years ended December 31, 2014, 2013 and 2012, respectively.
Accrued Liabilities
Accrued liabilities consist of the following (in thousands):
December 31, | |||||||
2014 | 2013 | ||||||
Accrued payroll related costs | $ | 30,749 | $ | 9,103 | |||
Accrued warranty costs | 3,204 | 5,075 | |||||
Accrued manufacturing costs | 1,089 | 3,835 | |||||
Accrued professional fees | 2,354 | 1,220 | |||||
Accrued taxes | 1,577 | 927 | |||||
Other | 1,396 | 1,379 | |||||
Total accrued liabilities | $ | 40,369 | $ | 21,539 | |||
77
Warranty Accrual
The following table summarizes the activity related to our accrued liability for estimated future warranty costs (in thousands):
Year Ended December 31, | |||||||
2014 | 2013 | ||||||
Warranty accrual, beginning of period | $ | 5,075 | $ | 5,314 | |||
Liabilities accrued for warranties issued during the period | 2,611 | 4,290 | |||||
Warranty costs incurred during the period | (2,163 | ) | (4,529 | ) | |||
Adjustments related to change in estimate | (2,319 | ) | — | ||||
Warranty accrual, end of period | $ | 3,204 | $ | 5,075 | |||
During the year ended December 31, 2013, we identified specific products that were failing in the field prematurely at higher than expected rates due to various component issues. There were no significant specific product warranty reserves recorded in 2014.
Other Current Liabilities
Other current liabilities consist of the following (in thousands):
December 31, | |||||||
2014 | 2013 | ||||||
Liability for early exercised shares subject to repurchase | $ | 4,616 | $ | 7,520 | |||
Sales tax payable | 3,101 | 1,359 | |||||
Lease financing obligations, current portion | 1,087 | 818 | |||||
Other | 2,445 | 447 | |||||
Total other current liabilities | $ | 11,249 | $ | 10,144 | |||
78
4. Investments
Investments in Privately-held Companies
In 2014, we made equity investments of approximately $33.6 million in privately held companies which are accounted for under the cost method. There were no impairments recognized on our investments for the year ended December 31, 2014 as there were no significant identified events or changes in circumstances that would be considered an indicator for impairment.
Notes Receivable
In 2014, we entered into a $3.0 million promissory note with a privately held company which was recorded at cost. The interest rate on the promissory note is 8.0% per annum and is payable quarterly. All unpaid principal and accrued interest on the promissory note is due and payable on the earlier of August 26, 2017, or upon default.
In 2012, we made a loan of $4.0 million to a private company. The interest rate on the notes receivable was 6.0% per annum. The notes were convertible into the private company’s preferred stock or any securities exchangeable for the private company’s preferred stock. All unpaid principal and accrued interest on the notes receivable was due and payable on the earlier of August 31, 2014, or upon default.
On July 30, 2014, the borrower signed a definitive agreement to close a Corporate Transaction through a merger (i.e. a transaction in which 50% of the voting power is transferred) and the transaction was expected to close in the first quarter of 2015. Pursuant to this transaction and per the terms of our agreement, we increased the value of our convertible notes receivable by $4.0 million to $8.0 million in the third quarter of 2014. In October 2014, we received payment in full from the borrower equal to two times our outstanding principal balance as well as the unpaid accrued interest through the payment date.
In conjunction with the notes receivable, we also entered into an Exclusivity and Supply Agreement (“Supply Agreement”) with the borrower. Under the terms of the Supply Agreement, the borrower has agreed to develop and produce certain products for us at mutually agreed on supply terms and with best in class pricing rights to us. In addition, any exclusive features developed between us and the borrower cannot be sold by the borrower to other customers for 24 months following the commercial availability of such production versions. The Supply Agreement does not have a maturity date. We determined that the fair value of the Supply Agreement on its inception was insignificant as the borrower is still in the development stage and there is no certainty that a commercial product will be developed.
We determined that we had a variable interest in the borrower through our notes receivable. However, we determined that we were not the primary beneficiary as we did not have the power to direct the borrower’s activities that most significantly affect the borrower’s economic performance. We also determined that our investment in the borrower was not an equity-method investment as the notes receivable had different risk and reward characteristics than those of the borrower’s common stock. We elected the fair value option method of accounting for our notes receivable.
5. Debt Obligations
Our debt obligations consist of the following (in thousands):
December 31, 2013 | |||
Convertible notes payable—related party | $ | 25,000 | |
Convertible notes payable | 75,000 | ||
Total | 100,000 | ||
Less: Unamortized discount on notes payable | 1,207 | ||
Less: Current portion | 98,793 | ||
Total long-term portion of debt | $ | — | |
In January 2011, we sold $55.0 million aggregate principal amount of subordinated convertible promissory notes (“Convertible Notes”) to outside investors and $25.0 million aggregate principal amount of Convertible Notes to two trusts that are related to two of our co-founders. In June 2011, we sold an additional $20.0 million in Convertible Notes to outside investors. The Convertible Notes were convertible into shares of our common stock upon a change of control, a qualified IPO, or immediately prior to when the notes are to be voluntarily prepaid. The interest rate on the Convertible Notes was 6.0% per annum, computed on the basis of the actual number of days elapsed and a year of 365 days. All unpaid principal and accrued interest on the Convertible Notes were due and payable on the earlier of December 31, 2014 or upon the occurrence of an event of default, defined as: (i) failure to pay principal or interest when due; (ii) breaches of covenants; (iii) breaches of representations and warranties; (iv) failure to make other payment obligations resulting in the acceleration of maturity of indebtedness in excess of $10.0 million; (v) voluntary bankruptcy; (vi) involuntary bankruptcy; or (vii) certain adverse judgments. We could have voluntarily prepaid the Convertible
79
Notes, in whole or in part, before the maturity date by giving each investor 10 days’ prior written notice. We were also required to prepay the Convertible Notes upon a change of control unless the investor elected to convert its Convertible Note immediately prior to the closing of such change of control.
Upon the closing of our IPO all noteholders with the exception of one noteholder converted the principal and accrued interest amount outstanding under their subordinated convertible promissory notes into shares of our common stock at the IPO price of $43.00 per share. The noteholder, who did not elect to so convert, was paid a total of $23.6 million which included principal and accrued interest less applicable withholding taxes of $1.1 million. The remainder of the noteholders converted the remaining debt balance of approximately $96.5 million including principal and accrued interest into 2.2 million shares of our common stock.
6. Commitments and Contingencies
Operating Leases
We lease various operating spaces in North America, Europe, Asia and Australia under non-cancelable operating lease arrangements that expire on various dates through 2023. These arrangements require us to pay certain operating expenses, such as taxes, repairs, and insurance and contain renewal and escalation clauses. We recognize rent expense under these arrangements on a straight-line basis over the term of the lease.
As of December 31, 2014, the aggregate future minimum payments under non-cancelable operating leases consist of the following (in thousands):
Years Ending December 31, | |||
2015 | $ | 2,583 | |
2016 | 4,297 | ||
2017 | 5,155 | ||
2018 | 5,378 | ||
2019 | 5,369 | ||
Thereafter | 22,407 | ||
Total minimum future lease payments | $ | 45,189 | |
Rent expense for all operating leases amounted to $3.3 million, $3.6 million and $2.0 million for the years ended December 31, 2014, 2013 and 2012, respectively.
Financing Obligation—Build-to-Suit Lease
In August 2012, we executed a lease for a building under construction in Santa Clara, California which will serve as our new headquarters. The lease term is 120 months and commenced in August 2013.
Based on the terms of the lease agreement and due to our involvement in certain aspects of the construction such as our financial involvement in structural elements of asset construction, making decisions related to tenant improvement costs and purchasing insurance not reimbursable by the buyer-lessor (the Landlord), we were deemed the owner of the building (for accounting purposes only) during the construction period. We maintained continued involvement in the property after construction was completed and lack transferability of the risks and rewards of ownership, primarily due to our required maintenance of a $4.0 million letter of credit. Due to our continuing involvement in the property post construction and lack of transferability of related risks and rewards of ownership to the Landlord after construction was complete, we account for the building and related improvements as a lease financing obligation. Accordingly, as of December 31, 2014 and December 31, 2013, we have recorded assets of $53.4 million and $53.3 million, representing the total costs of the building and improvements incurred, including the costs paid by the lessor (the legal owner of the building) and additional improvement costs paid by us, and a corresponding financing obligation of $43.6 million and $44.0 million, respectively. As of December 31, 2014, $1.1 million and $42.5 million were recorded as short-term and long-term financing obligations, respectively.
80
As of December 31, 2014, the future minimum payments due under the lease financing obligation were as follows (in thousands):
Years Ending December 31, | |||
2015 | $ | 5,588 | |
2016 | 5,754 | ||
2017 | 5,933 | ||
2018 | 6,113 | ||
2019 | 6,293 | ||
Thereafter | 25,287 | ||
Total payments | 54,968 | ||
Less: interest and land lease expense | (34,770 | ) | |
Total payments under facility financing obligations | 20,198 | ||
Property reverting to landlord | 23,436 | ||
Present value of obligation | 43,634 | ||
Less current portion | (1,087 | ) | |
Long-term portion of obligation | $ | 42,547 | |
Upon completion of construction in the third quarter of 2013, we evaluated the de-recognition of the asset and liability under the sale-leaseback accounting guidance. We concluded that we have forms of continued economic involvement in the facility, and therefore did not meet with the provisions for sale-leaseback accounting. Therefore, the lease is accounted for as a financing obligation and lease payments will be attributed to (1) a reduction of the principal financing obligation; (2) imputed interest expense; and (3) land lease expense (which is considered an operating lease and a component of cost of goods sold and operating expenses) representing an imputed cost to lease the underlying land of the building. In addition, the underlying building asset is depreciated over the building’s estimated useful life of 30 years. At the conclusion of the initial lease term, we will de-recognize both the net book values of the asset and the remaining financing obligation.
Purchase Commitments
Our products are manufactured, assembled and tested by third-party contract manufacturers in Asia who procure components and assemble products on our behalf based on our forecasts. These forecasts are based on estimates of future demand for our products, historical trend analysis provided by our sales and product marketing organizations and adjusted for overall market conditions. In order to reduce manufacturing lead times and plan for adequate component supply, we may issue purchase orders to these third-party contract manufacturers and vendors that may not be cancelable. As of December 31, 2014 and December 31, 2013, our contract manufacturer liability was $0.3 million and $1.8 million for non-cancelable purchase commitments issued to our vendors. We have provided deposits to our third-party contract manufacturers and vendors to secure our obligations to purchase inventory. We had $2.3 million in restricted deposits as of December 31, 2014 and December 31, 2013. Deposits are classified in other assets in our accompanying consolidated balance sheets.
Guarantees
We have entered into agreements with some of our direct customers and channel partners that contain indemnification provisions relating to potential situations where claims could be alleged that our products infringe the intellectual property rights of a third party. We have at our option and expense the ability to repair any infringement, replace product with a non-infringing equivalent-in-function product or refund our customers the unamortized value of the product based on its estimated useful life. Other guarantees or indemnification agreements include guarantees of product and service performance and standby letters of credit for lease facilities and corporate credit cards. We have not recorded a liability related to these indemnification and guarantee provisions and our guarantee and indemnification arrangements have not had any significant impact on our consolidated financial statements to date.
Legal Proceedings
OptumSoft, Inc. Matters
On April 4, 2014, OptumSoft filed a lawsuit against us in the Superior Court of California, Santa Clara County titled OptumSoft, Inc. v. Arista Networks, Inc., in which it asserts (i) ownership of certain components of our EOS network operating system pursuant to the terms of a 2004 agreement between the companies and (ii) breaches of certain confidentiality and use restrictions in that agreement. Under the terms of the 2004 agreement, OptumSoft provided us with a non-exclusive, irrevocable, royalty-free license to software delivered by OptumSoft comprising a software tool used to develop certain components of EOS
81
and a runtime library that is incorporated into EOS. The 2004 agreement places certain restrictions on our use and disclosure of the OptumSoft software and gives OptumSoft ownership of improvements, modifications and corrections to, and derivative works of, the OptumSoft software that we develop.
In its lawsuit, OptumSoft has asked the Court to order us to (i) give OptumSoft copies of certain components of our software for evaluation by OptumSoft, (ii) cease all conduct constituting the alleged confidentiality and use restriction breaches, (iii) secure the return or deletion of OptumSoft’s alleged intellectual property provided to third parties, including our customers, (iv) assign ownership to OptumSoft of OptumSoft’s alleged intellectual property currently owned by us, and (v) pay OptumSoft’s alleged damages, attorney’s fees, and costs of the lawsuit. David Cheriton, one of our founders and a former member of our board of directors who resigned from our board of directors on March 1, 2014 and has no continuing role with us, is a founder and, we believe, the largest stockholder and director of OptumSoft. The 2010 David R. Cheriton Irrevocable Trust dtd July 27, 2010, a trust for the benefit of the minor children of Mr. Cheriton, is one of our largest stockholders. OptumSoft has identified in confidential documents certain software components it claims to own, which are generally applicable tools and utility subroutines and not networking specific code. We cannot assure which software components OptumSoft may ultimately claim to own in the litigation or whether such claimed components are material.
On April 14, 2014, we filed a cross-complaint against OptumSoft, in which we assert our ownership of the software components at issue and our interpretation of the 2004 agreement. Among other things, we assert that the language of the 2004 agreement and the parties’ long course of conduct support our ownership of the disputed software components. We ask the Court to declare our ownership of those software components, all similarly-situated software components developed in the future and all related intellectual property. We also assert that, even if we are found not to own any particular components at issue, such components are licensed to us under the terms of the 2004 agreement. However, there can be no assurance that our assertions will ultimately prevail in litigation. On the same day, we also filed an answer to OptumSoft’s claims, as well as affirmative defenses based in part on OptumSoft’s failure to maintain the confidentiality of its claimed trade secrets, its authorization of the disclosures it asserts and its delay in claiming ownership of the software components at issue. We have also taken additional steps to respond to OptumSoft’s allegations that we improperly used and/or disclosed OptumSoft confidential information. While we believe we have strong defenses to these allegations, we believe we have (i) revised our software to remove the elements we understand to be the subject of the claims relating to improper use and disclosure of OptumSoft confidential information and made the revised software available to our customers and (ii) removed information from our website that OptumSoft asserted disclosed OptumSoft confidential information.
The Court set a trial date for Phase I of the proceedings, relating to contract interpretation and application of the contract to certain claimed source code for September 14, 2015. The remaining issues are currently scheduled to be tried in April 2016.
At this stage of the litigation, we do not believe a loss is probable and we are unable to estimate a possible loss or range of possible loss.
We intend to vigorously defend against any action brought against us by OptumSoft. However, we cannot be certain that, if litigated, any claims by OptumSoft would be resolved in our favor. For example, if it were determined that OptumSoft owned components of our EOS network operating system, we would be required to transfer ownership of those components and any related intellectual property to OptumSoft. If OptumSoft were the owner of those components, it could make them available to our competitors, such as through a sale or license. In addition, if OptumSoft were to bring actual litigation, it could assert additional or different claims against us, including claims that our license from OptumSoft is invalid. An adverse litigation ruling could result in a significant damages award against us and injunctive relief. In addition, if our license was ruled to have been terminated, and we were not able to negotiate a new license from OptumSoft on reasonable terms, we could be prohibited from selling products that incorporate OptumSoft intellectual property. Any such adverse ruling could materially adversely affect our business, prospects, results of operations and financial condition. Whether or not we prevail in a lawsuit, we expect that any litigation would be expensive, time-consuming and a distraction to management in operating our business.
Net Navigation LLC Matters
On April 23, 2014, Net Navigation LLC sued us for alleged infringement of U.S. Patent Nos. 5,901,147; 6,434,145; and 6,625,122 in U.S. District Court for the Eastern District of Texas. On June 30, 2014, we and Net Navigation LLC settled this dispute.
Cisco Systems, Inc. (“Cisco”) Matters
On December 5, 2014, Cisco filed two complaints against us in District Court for the Northern District of California, which are proceeding as Case No. 4-14-cv-0543 (“’043 Case”) and Case No. 4-14-cv-0544 (“’044 Case”). In the ’043 Case, Cisco alleges that we infringe U.S. Patent Nos. 6,377,577; 6,741,592; 7,023,853; 7,061,875; 7,162,537; 7,200,145; 7,224,668; 7,290,164; 7,340,597; 7,460,492; 8,051,211; and 8,356,296 (respectively, “the ’577 patent,” “the ’592 patent,” “the ’853 patent,” “the 875 patent,” “the ’537 patent,” “the ’145 patent,” “the ’668 patent,” “the ’164 patent,” “the ’597 patent,” “the ’492 patent,” “the ’211 patent,” and “the ’296 patent”). Cisco seeks, as relief for our alleged infringement in the ’043 Case, lost profits and/or reasonable
82
royalty damages in an unspecified amount, including treble damages, attorney’s fees, and associated costs. Cisco also seeks injunctive relief in the ’043 Case. On February 10, 2015, the court granted our unopposed motion to stay the ’043 Case until the proceedings before the United States International Trade Commission (“USITC”) pertaining to the same patents (as discussed below) become final. In the ’044 Case, Cisco’s complaint alleges that we infringe U.S. Patent Nos. 7,047,526 and 7,953,886 and further alleges that we infringe numerous copyrights pertaining to Cisco’s “Command Line Interface” or “CLI.” As relief for our alleged patent infringement in the ’044 Case, Cisco seeks lost profits and/or reasonable royalty damages in an unspecified amount including treble damages, attorney’s fees, and associated costs as well as injunctive relief. As relief from our alleged copyright infringement, Cisco seeks damages in an unspecified amount in the form of alleged lost profits, profits from our alleged infringement, statutory damages, attorney’s fees and associated costs. Cisco also seeks injunctive relief against our alleged copyright infringement. On February 13, 2015, we answered the complaint in the ’044 Case, denying the patent and copyright infringement allegations and also raising numerous affirmative defenses. Trial has not been scheduled in either the ’043 or ’044 Cases.
On December 19, 2014, Cisco filed two complaints against us in the USITC alleging that Arista has violated section 337 of the Tariff Act of 1930, as amended. The complaints have been instituted as ITC Inv. Nos. 337-TA-944 (“’944 Investigation”) and 337-TA-945 (“’945 Investigation). In the ’944 Investigation, Cisco alleges that certain Arista switching products infringe the ’592, ’537, ’145, ’164, ’597, and ’296 patents. In the ’945 Investigation, Cisco alleges that certain Arista switching products infringe the ’577, ’853, ’875, ’668, ’492, and ’211 patents. In both the ’944 and ’945 Investigations, Cisco seeks, among other things, a limited exclusion order barring entry into the United States of accused switch products (including 7000 Series of switches) and a cease and desist order against us regarding our accused switch products. On January 28, 2015, the Administrative Law Judge assigned to the ’944 Investigation set May 27, 2016 as the target date for completion of the ’944 Investigation. On February 11, 2015, we responded to the notices of investigation and complaints in the ’944 and ’945 Investigations by, among other things, denying any violation of section 337 of the Tariff Act and the patent infringement allegations, and raising numerous additional defenses. On February 19, 2015, the Administrative Law Judge assigned to the ’945 Investigation issued a procedural schedule calling for, among other events: issuance of an order construing the claims of the ’577, ’853, ’875, ’668, ’492, and ’211 patents tentatively on July 17, 2015; an evidentiary hearing on November 9-20, 2015; issuance of an initial determination regarding our alleged violations on April 26, 2016; and the target date for completion of the ’945 Investigation on August 26, 2016.
At this stage of the litigation, we do not believe a loss is probable, and we are unable to estimate a possible or range of possible loss.
We intend to vigorously defend against Cisco’s lawsuits, as summarized in the preceding paragraphs. However, we cannot be certain that, if litigated, any claims by Cisco would be resolved in our favor. For example, an adverse litigation ruling could result in a significant damages award against us, could further result in the above described injunctive relief (including, among other things, an order excluding our products from importation into the United States), could result in a requirement that we make substantial royalty payments to Cisco, and/or could require that we modify our products to the extent that we are found to infringe any valid claims asserted against us Cisco. Any such adverse ruling could materially adversely affect our business, prospects, results of operation and financial condition. To the extent that we reached a negotiated settlement with Cisco, the settlement could require payment of substantial royalties. Additionally, the existence of this lawsuit could cause concern among our customers and potential customers and could adversely affect our business and results of operations. Whether or not we prevail in the lawsuit, we expect that the litigation will be expensive, time-consuming and a distraction to management in operating our business.
In the ordinary course of business, we are a party to other claims and legal proceedings including matters relating to commercial, employee relations, business practices and intellectual property. We record a provision for contingent losses when it is both probable that a liability has been incurred and the amount of the loss can be reasonably estimated. Based on currently available information, management does not believe that the ultimate outcome of these other unresolved matters is probable or estimable and not likely, individually and in the aggregate, to have a material adverse effect on our financial position, results of operations or cash flows. However, litigation is subject to inherent uncertainties and our view of these matters may change in the future. Were an unfavorable outcome to occur, there exists the possibility of a material adverse impact on our financial position, results of operations or cash flows for the period in which the unfavorable outcome occurs, and potentially in future periods.
83
7. Stock-Based Compensation
Total stock-based compensation expense related to options, restricted stock awards, employee stock purchases, restricted stock units and stock purchase rights granted were charged to the department to which the associated employee reported as follow (in thousands):
Year Ended December 31, | |||||||||||
2014 | 2013 | 2012 | |||||||||
Cost of revenue | $ | 1,535 | $ | 408 | $ | 270 | |||||
Research and development 1 | 14,986 | 5,464 | 2,590 | ||||||||
Sales and marketing 1 | 7,643 | 2,985 | 1,078 | ||||||||
General and administrative | 3,455 | 1,302 | 765 | ||||||||
Total stock-based compensation | $ | 27,619 | $ | 10,159 | $ | 4,703 | |||||
_________________
1Includes modification charge of $0.5 million in 2014 related to acceleration of shares upon termination for two employees.
Equity Award Plans
During the year ended December 31, 2004, we adopted the 2004 Equity Incentive Plan (the “2004 Plan”) for the purpose of granting stock based awards to employees, directors and consultants. Awards granted under the 2004 Plan could be in the form of Incentive Stock Options (“ISOs”), Nonstatutory Stock Options (“NSOs”) or Restricted Stock Awards (“RSAs”). With the establishment of the 2011 Plan (as defined below), the 2004 Plan was terminated with respect to the grant of future awards but the 2004 Plan continues to govern awards previously issued thereunder. During the year ended December 31, 2011, we adopted the 2011 Equity Incentive Plan (the “2011 Plan”) for the purpose of granting stock based awards to employees, directors, and consultants. Awards granted under the 2011 Plan could have been ISOs, NSOs, RSAs, Stock Appreciation Rights (“SARs”) or Restricted Stock Units (“RSUs”). With the establishment of the 2014 Plan (as defined below), the 2011 Plan terminated with respect to the grant of future awards but the 2011 Plan continues to govern awards previously issued thereunder.
2014 Plan
In April 2014, the board of directors and stockholders approved the 2014 Equity Incentive Plan (the “2014 Plan”), effective on the first day that our common stock was publicly traded. A total of 6,510,000 shares of our common stock were initially reserved for issuance under the 2014 Plan. In addition, the shares reserved for issuance under our 2014 Plan will also include (a) those shares reserved but unissued under the 2011 Plan and 2004 Plan as of the effective date and (b) shares returned to our 2011 Plan and 2004 Plan as the result of expiration or termination of options (provided that the maximum number of shares that may be added to the 2014 Plan pursuant to (a) and (b) is 20,025,189 shares). The number of shares available for grant and issuance under the 2014 Plan will be increased automatically on January 1 of each year commencing with 2016 by the number of shares equal to 3% of our shares outstanding on the immediately preceding December 31, but not to exceed 12,500,000 shares, unless the board of directors, in its discretion, determines to make a smaller increase.
2014 Employee Stock Purchase Plan
In April 2014, the board of directors and stockholders approved the 2014 Employee Stock Purchase Plan (the “ESPP”). The ESPP became effective on the first day that our common stock was publicly traded. A total of 651,000 shares of our common stock are initially reserved for future issuance under the ESPP. The number of shares reserved for issuance under the ESPP increases automatically on January 1 of each year commencing with 2015 by the number of shares equal to 1% of our shares outstanding immediately preceding December 31, but not to exceed 2,500,000 shares, unless the board of directors, in its discretion, determines to make a smaller increase. On February 17, 2015, the board authorized the increase to shares available for issuance under the plan of 1% of the total shares outstanding on January1, 2015. The increase amounted to approximately 655,139 shares.
84
Determination of Fair Value
Employee Stock Plans
For the years ended December 31, 2014, 2013 and 2012 the fair value of each stock option granted under our plans was estimated on the date of grant using the Black-Scholes option pricing model with the following assumptions and fair value per share:
Year Ended December 31, | ||||||||
2014 | 2013 | 2012 | ||||||
Expected term (in years) | 7.6 | 6.5 | 5.6 | |||||
Risk-free interest rate | 2.2 | % | 1.7 | % | 0.9 | % | ||
Expected volatility | 47.7 | % | 51.0 | % | 51.0 | % | ||
Dividend rate | — | % | — | % | — | % | ||
ESPP
There were no stock purchases under the ESPP during the year ended December 31, 2014. The following table summarizes the assumptions relating to our ESPP:
Year Ended December 31, | ||||||
2014 | 2013 | 2012 | ||||
Expected term (in years) | 1.4 | N/A | N/A | |||
Risk-free interest rate | 0.3 | % | N/A | N/A | ||
Expected volatility | 36.3 | % | N/A | N/A | ||
Dividend rate | — | % | N/A | N/A | ||
As of December 31, 2014, the total unrecognized stock-based compensation expense for unvested ESPP shares, net of expected forfeitures, was $3.0 million, which is expected to be recognized over a weighted-average period of 1.6 years.
Stock Option Activities
The following table summarizes the option and RSA (Restricted Stock Award) activity under the 2004 Plan, 2011 Plan and 2014 Plan and related information:
Options and RSAs Outstanding | |||||||||||||||
Shares Available for Grant (in thousands) | Number of Shares Underlying Outstanding Options and RSAs (in thousands) | Weighted- Average Exercise Price per Share | Weighted- Average Remaining Contractual Term (Years) of Stock Options | Aggregate Intrinsic Value of Stock Options Outstanding (in thousands) | |||||||||||
Balance—December 31, 2013 | 8,941 | 11,245 | $ | 6.82 | 8.8 | $ | 254,319 | ||||||||
Authorized | 6,510 | ||||||||||||||
Options granted | (4,521 | ) | 4,412 | 40.88 | |||||||||||
Options exercised | — | (1,349 | ) | 6.04 | |||||||||||
Options canceled | 654 | (654 | ) | 12.45 | |||||||||||
Early exercised shares repurchased1 | 28 | — | 4.05 | ||||||||||||
Balance—December 31, 2014 | 11,612 | 13,654 | $ | 17.63 | 8.3 | $ | 598,775 | ||||||||
Vested and exercisable—December 31, 2014 | 3,397 | $ | 5.36 | 7.4 | $ | 188,223 | |||||||||
Vested and expected to vest—December 31, 2014 | 12,034 | $ | 16.12 | 8.2 | $ | 544,919 | |||||||||
_________________
1Early exercised shares repurchased includes 2,000 shares that were originally granted out of our 2004 Plan and were subsequently retired.
The weighted-average grant-date fair value of options granted during the year ended December 31, 2014 was $24.69 per share. The aggregate intrinsic value of options exercised for the year ended December 31, 2014 was $80.5 million.
85
As of December 31, 2014, the total unrecognized stock-based compensation expense for unvested stock options, net of expected forfeitures, was $106.8 million, which is expected to be recognized over a weighted-average period of 4.4 years. The total fair value of options vested for the year ended December 31, 2014 was $16.5 million.
Under the 2004 Plan and 2011 Plan, the options outstanding and vested and exercisable by exercise price at December 31, 2014 are as follows:
Options Outstanding and Exercisable | Options Vested and Exercisable | ||||||||||||||
Range of Exercise Price | Number of Shares Underlying Outstanding Options (in thousands) | Weighted- Average Remaining Contractual Life (Years) | Weighted- Average Exercise Price per Share | Number of Shares Underlying Outstanding Options (in thousands) | Weighted- Average Exercise Price per Share | ||||||||||
$3.33 | 2,116 | 6.8 | $ | 3.33 | 1,457 | $ | 3.33 | ||||||||
$4.16 - $4.18 | 2,272 | 7.6 | 4.17 | 875 | 4.17 | ||||||||||
$4.92 - $7.76 | 1,868 | 8.0 | 6.30 | 618 | 5.81 | ||||||||||
$8.77 - $10.18 | 2,624 | 8.6 | 9.73 | 313 | 9.50 | ||||||||||
$22.49 -$30.67 | 2,652 | 9.1 | 27.58 | 127 | 22.59 | ||||||||||
$34.12 - $68.34 | 1,888 | 9.6 | 50.84 | 7 | 36.38 | ||||||||||
$75.00 - $76.80 | 224 | 9.7 | 75.71 | — | — | ||||||||||
$84.00 | 10 | 9.7 | 84.00 | — | — | ||||||||||
13,654 | 8.3 | $ | 17.63 | 3,397 | $ | 5.36 | |||||||||
Restricted Stock Unit (RSU) Activities
A summary of the activity under our stock plans and changes during the reporting period and a summary of information related to RSUs are presented below (in thousands, except years and per share amounts):
Number of Shares | Weighted- Average Grant Date Fair Value Per Share | Weighted-Average Remaining Contractual Term (in years) | Aggregate Intrinsic Value | |||||||||
Unvested balance—December 31, 2013 | — | — | 0 | — | ||||||||
RSUs granted | 109 | $ | 75.55 | |||||||||
RSUs vested | — | — | ||||||||||
RSUs forfeited/canceled | (1 | ) | 75.00 | |||||||||
Unvested balance—December 31, 2014 | 108 | $ | 75.56 | 2.0 | $ | 6,557 | ||||||
RSUs expected to vest—December 31, 2014 | 94 | $ | 75.56 | 2.0 | $ | 5,722 | ||||||
As of December 31, 2014, there was $6.5 million of unrecognized stock-based compensation expense related to unvested RSUs, net of estimated forfeitures. This amount is expected to be recognized over a weighted-average period of 3.8 years.
Restricted Stock Award Activities
A summary of our RSA activity and related information is as follows (in thousands, except per share amounts):
Number of RSA’s Outstanding | Weighted- Average Grant Date Fair Value Per Share | |||||
Unvested balance—December 31, 2013 | 142 | $ | 2.42 | |||
Vested | (57 | ) | 2.50 | |||
Unvested balance—December 31, 2014 | 85 | $ | 2.50 | |||
There were no RSAs granted during the year ended December 31, 2014. As of December 31, 2014, the total unrecognized stock-based compensation expense for outstanding RSAs, net of expected forfeitures, was $0.2 million, which is expected to be recognized over a weighted-average period of 1.8 years. As of December 31, 2014, the intrinsic value of the outstanding RSAs based on the estimated fair value of $60.76 per share was $5.0 million.
86
Early Exercise of Stock Options
We have historically allowed our employees and directors to exercise options granted under the 2011 Plan and the 2004 Plan prior to vesting. Upon an "early exercise" of these options, the unvested shares acquired through the exercise become options subject to our repurchase right that lapse in accordance with the original option vesting schedule. Upon termination of employment prior to our repurchase rights lapsing in full, we have a right to repurchase the unvested shares at the original purchase price (or the then-current fair market value, if lower). The proceeds initially are recorded in other liabilities from the early exercise of stock options and are reclassified to common stock and paid-in capital as our repurchase right lapse. For the year ended December 31, 2014, we repurchased 29,803 shares of common stock at the original exercise price due to the termination of the holders of the unvested shares. As of December 31, 2014, shares held by employees and directors that were subject to repurchase were 1.4 million with an aggregate price of $4.6 million.
87
8. Net Income Per Share Available to Common Stock
The following table sets forth the computation of our basic and diluted net income per share available to common stock (in thousands, except per share amounts):
Year Ended December 31, | |||||||||||
2014 | 2013 | 2012 | |||||||||
Numerator: | |||||||||||
Basic: | |||||||||||
Net income | $ | 86,850 | $ | 42,460 | $ | 21,349 | |||||
Less: undistributed earnings allocated to participating securities | (17,961 | ) | (21,683 | ) | (11,727 | ) | |||||
Net income available to common stockholders, basic | $ | 68,889 | $ | 20,777 | $ | 9,622 | |||||
Diluted: | |||||||||||
Net income attributable to common stockholders, basic | $ | 68,889 | $ | 20,777 | $ | 9,622 | |||||
Add: undistributed earnings allocated to participating securities | 1,635 | 1,003 | 40 | ||||||||
Net income attributable to common stockholders, diluted | $ | 70,524 | $ | 21,780 | $ | 9,662 | |||||
Denominator: | |||||||||||
Basic: | |||||||||||
Weighted-average shares used in computing net income per share available to common stockholders, basic | 48,427 | 27,320 | 24,711 | ||||||||
Diluted: | |||||||||||
Weighted-average shares used in computing net income per share available to common stockholders, basic | 48,427 | 27,320 | 24,711 | ||||||||
Add weighted-average effect of dilutive securities: | |||||||||||
Stock options, RSUs and RSAs | 6,059 | 2,726 | 187 | ||||||||
Employee stock purchase plan | 104 | — | — | ||||||||
Stock purchase rights | — | 5 | 3 | ||||||||
Weighted-average shares used in computing net income per share available to common stockholders, diluted | 54,590 | 30,051 | 24,901 | ||||||||
Net income per share attributable to common stockholders: | |||||||||||
Basic | $ | 1.42 | $ | 0.76 | $ | 0.39 | |||||
Diluted | $ | 1.29 | $ | 0.72 | $ | 0.39 | |||||
The following outstanding shares of common stock equivalents were excluded from the computation of diluted net income per share available to common stockholders for the periods presented because including them would have been anti-dilutive (in thousands):
Year Ended December 31, | ||||||||
2014 | 2013 | 2012 | ||||||
Stock options and RSUs | 1,263 | 3,599 | 169 | |||||
88
9. Income Taxes
The geographical breakdown of income before provision for income taxes is as follows (in thousands):
Year Ended December 31, | |||||||||||
2014 | 2013 | 2012 | |||||||||
Domestic | $ | 120,838 | $ | 50,455 | $ | 26,837 | |||||
Foreign | 670 | 7,820 | 6,138 | ||||||||
Income before provision for income taxes | $ | 121,508 | $ | 58,275 | $ | 32,975 | |||||
The components of the provision for income taxes are as follows (in thousands):
Year Ended December 31, | |||||||||||
2014 | 2013 | 2012 | |||||||||
Current provision for income taxes: | |||||||||||
Federal | $ | 36,091 | $ | 19,708 | $ | 13,037 | |||||
State | 2,716 | 4,525 | 2,003 | ||||||||
Foreign | 3,306 | 413 | 308 | ||||||||
Total current | 42,113 | 24,646 | 15,348 | ||||||||
Deferred tax benefit: | |||||||||||
Federal | (7,028 | ) | (8,059 | ) | (3,525 | ) | |||||
State | 153 | (938 | ) | (342 | ) | ||||||
Foreign | (580 | ) | 166 | 145 | |||||||
Total deferred | (7,455 | ) | (8,831 | ) | (3,722 | ) | |||||
Total provision for income taxes | $ | 34,658 | $ | 15,815 | $ | 11,626 | |||||
The reconciliation of the statutory federal income tax and our effective income tax is as follows:
Year Ended December 31, | ||||||||
2014 | 2013 | 2012 | ||||||
U.S. federal statutory income tax | 35.00 | % | 35.00 | % | 35.00 | % | ||
State tax, net of federal benefit | 1.19 | 0.89 | 0.26 | |||||
Foreign tax differential | 0.68 | (2.61 | ) | (3.21 | ) | |||
Tax credits | (5.26 | ) | (10.64 | ) | (0.96 | ) | ||
Change in valuation allowance | 1.92 | 3.87 | 3.04 | |||||
Permanent items | (0.86 | ) | (2.54 | ) | (2.55 | ) | ||
Uncertain tax positions and associated interest | 0.37 | 0.58 | 0.44 | |||||
Stock-based compensation | (4.01 | ) | 2.47 | 3.21 | ||||
Other, net | (0.51 | ) | 0.12 | 0.03 | ||||
Total provision for income taxes | 28.52 | % | 27.14 | % | 35.26 | % | ||
We have operations and a taxable presence in numerous jurisdictions outside the U.S. All of these countries except one jurisdiction have a lower tax rate than the U.S. The significant jurisdictions in which we have a presence include Cayman Islands, Ireland, and the United Kingdom.
89
The tax effects of temporary differences that give rise to significant portions of deferred tax assets (liabilities) are as follows (in thousands):
December 31, | |||||||
2014 | 2013 | ||||||
Deferred tax assets: | |||||||
Property and equipment | $ | 504 | $ | 1,020 | |||
Stock-based compensation | 6,365 | 1,738 | |||||
Reserves and accruals not currently deductible | 16,160 | 13,351 | |||||
Net operating losses | 721 | 1,143 | |||||
Tax credits | 9,923 | 5,156 | |||||
State taxes | 342 | 514 | |||||
Other | 1,142 | 375 | |||||
Gross deferred tax assets | 35,157 | 23,297 | |||||
Valuation allowance | (8,954 | ) | (6,288 | ) | |||
Total deferred tax assets | 26,203 | 17,009 | |||||
Deferred tax liabilities: | |||||||
Property and equipment | (2,001 | ) | (47 | ) | |||
Accrued liabilities | (558 | ) | (173 | ) | |||
Other | (2 | ) | — | ||||
Total deferred tax liabilities | (2,561 | ) | (220 | ) | |||
Net deferred tax assets | $ | 23,642 | $ | 16,789 | |||
The following table presents the breakdown between current and non-current deferred tax assets and liabilities (in thousands):
December 31, | |||||||
2014 | 2013 | ||||||
Deferred tax assets | $ | 12,252 | $ | 12,356 | |||
Deferred tax assets, non-current | 11,510 | 4,541 | |||||
Deferred tax liabilities, non-current | (120 | ) | (108 | ) | |||
Total net deferred tax assets | $ | 23,642 | $16,789 | ||||
Recognition of deferred tax assets is appropriate when realization of these assets is more likely than not. We believe that all of the deferred tax assets were realizable with the exception of California and Canada deferred tax assets. Therefore, a valuation allowance of $9.0 million and $6.3 million was recorded as of December 31, 2014 and 2013, respectively, against the California and Canadian deferred tax assets as it was not more likely than not that these assets will be recognized. The net valuation allowance increased by $2.7 million, $2.4 million and $1.0 million as of December 31, 2014, 2013 and 2012, respectively.
As of December 31, 2014 and 2013, we had no net operating loss carryforwards for federal income tax purposes. As of December 31, 2014 and 2013, we had no state net operating loss carryforwards and approximately $13.1 million of carryforward, respectively, which has been fully utilized. As of December 31, 2014 and 2013, we had combined foreign net operating loss carryforwards of $7.5 million and $4.2 million, respectively, that do not expire.
As of December 31, 2014 and 2013, we had $1.9 million and zero, respectively, U.S. federal credit carryforwards which begin to expire in 2025. As of December 31, 2014 and 2013, we had state credit carryforwards of approximately $16.4 million and $9.6 million which can be carried over indefinitely. As of December 31, 2014 and 2013, we had $2.1 million and $1.3 million of Canadian scientific research and experimental development tax credit carry-forwards, respectively, which begin to expire in 2033.
Utilization of the net operating losses and tax credit carryforwards may be subject to limitations due to ownership changes limitations provided in the Internal Revenue code and similar state or foreign provisions. In all years up to December 31, 2014, such limitations had no impact to our deferred tax assets.
Our policy with respect to our undistributed foreign subsidiaries earnings is to consider those earnings to be indefinitely reinvested and, accordingly, no related provision for U.S. federal and state income taxes has been provided. Upon distribution of
90
those earnings’ in the form of dividends or otherwise, we may be subject to both U.S. income taxes (subject to an adjustment for foreign tax credits) and withholding taxes in the various countries. As of December 31, 2014, 2013 and 2012, the undistributed earnings approximated $4.9 million, $4.9 million and $1.0 million, respectively. The determination of the future tax consequences of the remittance of these earnings is not practicable.
Uncertain Tax Positions
We recognize uncertain tax positions only to the extent that management believes that it is more likely than not the position will be sustained. The reconciliation of the beginning and ending amount of gross unrecognized tax benefits as of December 31, 2014, 2013 and 2012 was as follows (in thousands):
Year Ended December 31, | |||||||||||
2014 | 2013 | 2012 | |||||||||
Gross unrecognized tax benefits—beginning balance | $ | 16,973 | $ | 13,960 | $ | 13,326 | |||||
Increases related to tax positions taken in a prior year | 425 | 70 | — | ||||||||
Increases related to tax positions taken during current year | 4,355 | 2,975 | 634 | ||||||||
Decreases related to tax positions taken in a prior year | (431 | ) | (32 | ) | — | ||||||
Decreases related to settlements with taxing authorities | — | — | — | ||||||||
Decreases related to lapse of statute of limitations | — | — | — | ||||||||
Gross unrecognized tax benefits—ending balance | $ | 21,322 | $ | 16,973 | $ | 13,960 | |||||
As of December 31, 2014, 2013 and 2012 the total amount of gross unrecognized tax benefits was $21.3 million, $17.0 million and $14.0 million of which $15.8 million, $13.9 million and $12.2 million would affect our effective tax rate if recognized, respectively.
Our policy is to recognize interest and penalties accrued on any unrecognized tax benefits as a component of income tax expense. We accrued interest and penalties of $0.7 million and $0.5 million in the years ended December 31, 2014 and 2013, respectively. As of December 31, 2014 and 2013, we recognized a liability for interest and penalties of $1.5 million and $0.8 million, respectively.
We do not anticipate that the amount of existing unrecognized tax benefits would significantly increase or decrease within the next 12 months. Because of the net operating loss and tax credit carryforwards, substantially all of our tax years remain open to federal and state tax examination. The majority of our foreign tax returns are open to audit under the statute of limitations of the respective foreign countries, in which the subsidiaries are located.
91
10. Segment Information
We have determined that we operate as one reportable segment. The following table represents revenue based on the customer’s location, as determined by the customer’s shipping address (in thousands):
Year Ended December 31, | |||||||||||
2014 | 2013 | 2012 | |||||||||
United States | $ | 456,691 | $ | 293,579 | $ | 149,537 | |||||
Other Americas | 8,853 | 6,040 | 5,056 | ||||||||
Europe, Middle East and Africa | 74,555 | 40,577 | 23,012 | ||||||||
Asia Pacific | 44,007 | 21,028 | 15,803 | ||||||||
Total revenue | $ | 584,106 | $ | 361,224 | $ | 193,408 | |||||
Long lived assets, excluding intercompany receivables, investments in subsidiaries, privately-held equity investments
and deferred tax assets, net by location are summarized as follows (in thousands):
December 31, | |||||||
2014 | 2013 | ||||||
United States | $ | 67,727 | $ | 63,557 | |||
International | 3,831 | 3,647 | |||||
Total | $ | 71,558 | $ | 67,204 | |||
11. Other Related Party Transactions and Balances
Certain members of our board of directors serve on the boards of our customers. During the years ended December 31, 2014, 2013 and 2012, we recognized revenue of $29.6 million, $11.1 million and $1.1 million, respectively, from sales transactions with these related party customers. Amounts due from these related party customers were $6.4 million and $3.8 million as of December 31, 2014 and 2013, respectively.
92
Item 9. Change in and Disagreements With Accountants on Accounting and Financial Disclosure
None
Item 9A. Controls and Procedures
Evaluation of Disclosure Controls and Procedures
Management, with the participation of our Chief Executive Officer ("CEO") and our Chief Financial Officer ("CFO"), evaluated the effectiveness of our disclosure controls and procedures as of December 31, 2014. The term “disclosure controls and procedures,” as defined in Rules 13a-15(e) and 15d-15(e) under the Exchange Act, means controls and other procedures of a company that are designed to ensure that information required to be disclosed by a company in the reports that it files or submits under the Exchange Act is recorded, processed, summarized and reported, within the time periods specified in the SEC’s rules and forms. Disclosure controls and procedures include, without limitation, controls and procedures designed to ensure that information required to be disclosed by a company in the reports that it files or submits under the Exchange Act is accumulated and communicated to the company’s management, including its principal executive and principal financial officers, as appropriate to allow timely decisions regarding required disclosure.
Based on the evaluation of our disclosure controls and procedures as of December 31, 2014, our CEO and CFO concluded that, as of such date, our disclosure controls and procedures are designed at a reasonable assurance level and are effective to provide reasonable assurance that information we are required to disclose in reports that we file or submit under the Exchange Act is recorded, processed, summarized, and reported within the time periods specified in Securities and Exchange Commission (SEC) rules and forms, and that such information is accumulated and communicated to our management, including our chief executive officer and chief financial officer, as appropriate, to allow timely decisions regarding required disclosure.
A material weakness is a control deficiency, or combination of control deficiencies, in internal control over financial reporting such that there is a reasonable possibility that a material misstatement of the annual or interim financial statements will not be prevented or detected on a timely basis. In connection with the audit of our consolidated financial statements for 2013, we identified a material weakness in our internal control over financial reporting related to our inventory process that were not appropriately designed and implemented during the year. Specifically, in conjunction with changes in our supply chain, we did not appropriately capitalize the cost of freight incurred related to product shipped from our contract manufacturers to the distribution centers and we also did not appropriately capitalize the purchase price variance for inventory.
We have remediated the material weakness in our internal control over financial reporting by implementing a number of measures designed to address the underlying causes of the material weakness. These measures included hiring additional accounting and finance personnel with technical accounting and financial reporting experience, enhancing and segregating duties within our accounting and finance department, and enhancing our internal review procedures during the financial statement close process. We believe that these additional resources and processes and procedures have enabled us to broaden the scope and quality of our controls relating to the oversight and review of financial statements and reconciliations and our application of relevant accounting policies.
Changes in Internal Control over Financial Reporting
Except for the remediation efforts described above, there were no changes in our internal control over financial reporting identified in connection with the evaluation required by Rule 13a-15(d) and 15d-15(d) of the Securities and Exchange Act of 1934, as amended, that occurred during the year ended December 31, 2014 that have materially affected, or are reasonably likely to materially affect, our internal control over financial reporting.
Inherent Limitations of Internal Controls
Our management, including our CEO and CFO, does not expect that our disclosure controls and procedures or our internal controls over financial reporting will prevent or detect all error and all fraud. A control system, no matter how well designed and operated, can provide only reasonable, not absolute, assurance that the objectives of the control system are met. Because of the inherent limitations in all control systems, no evaluation of controls can provide absolute assurance that all control issues and instances of fraud, if any, within the Company have been detected. These inherent limitations include the realities that judgments in decision-making can be faulty, and that breakdowns can occur because of a simple error or mistake. Additionally, controls can be circumvented by the individual acts of some persons, by collusion of two or more people, or by management override of the controls. The design of any system of controls also is based in part upon certain assumptions about the likelihood of future events, and there can be no assurance that any design will succeed in achieving its stated goals under all potential future conditions. Over time, controls may become inadequate because of changes in conditions, or the degree of compliance with the policies or procedures may deteriorate. Because of the inherent limitations in a cost-effective control system, misstatements due to error or fraud may occur and not be detected.
93
Item 9B. Other Information
None
PART III
Item 10. Directors, Executive Officers, and Corporate Governance
Information required by this Item is incorporated herein by reference to the sections entitled “Executive Officers,” “Proposal No. 1—Election of Directors,” “Board of Directors and Corporate Governance,” and “Other Matters” in our Proxy Statement.
Item 11. Executive Compensation
Information required by this Item is incorporated herein by reference to the section entitled ”Executive Compensation” and “Board of Directors and Corporate Governance—Non-Employee Director Compensation” in our Proxy Statement.
Item 12. Security Ownership of Certain Beneficial Owners and Management and Related Stockholder Matters
Information required by this Item is incorporated herein by reference to the sections entitled “Security Ownership of Certain Beneficial Owners and Management” and “Executive Compensation—Equity Compensation Plan Information” in our Proxy Statement.
Item 13. Certain Relationships and Related Transactions and Director Independence
Information required by this Item is incorporated herein by reference to the sections entitled ”Related Party Transactions” and “Board of Directors and Corporate Governance—Director Independence” in our Proxy Statement.
Item 14. Principal Accountant Fees and Services
Information required by this Item is incorporated herein by reference to the section entitled “Proposal No. 2 — Ratification of Appointment of Independent Registered Public Accounting Firm” in our Proxy Statement.
PART IV
Item 15. Exhibits and Financial Statement Schedules
Documents filed as part of this Annual Report on Form 10-K are as follows:
1. | Consolidated Financial Statements |
Our Consolidated Financial Statements are listed in the “Index to Consolidated Financial Statements” under Part II, Item 8 of this Annual Report on Form 10-K.
2. | Financial Statement Schedules |
Financial statement schedules have been omitted because they are not required, not applicable, not present in amounts sufficient to require submission of the schedule, or the required information is shown in the Consolidated Financial Statements or Notes thereto.
3. | Exhibits |
The documents listed in the Exhibit Index of this Annual Report on Form 10-K are incorporated by reference or are filed with this Annual Report on Form 10-K, in each case as indicated therein (numbered in accordance with Item 601 of Regulation S-K).
94
Item 6. Exhibits
See the Exhibit Index following the signature page to this Annual Report on Form 10-K for a list of exhibits filed or furnished with this report, which Exhibit Index is incorporated herein by reference.
95
SIGNATURES
Pursuant to the requirements of the Securities Exchange Act of 1934, the registrant has duly caused this report to be signed on its behalf by the undersigned thereunto duly authorized.
Arista Networks, Inc. | |||
(Registrant) | |||
Dated: | March 11, 2015 | By: | /s/ Jayshree Ullal |
Jayshree Ullal | |||
Chief Executive Officer, President and Director | |||
POWER OF ATTORNEY
KNOW ALL PERSONS BY THESE PRESENTS, that each person whose signature appears below constitutes and appoints Jayshree Ullal and Kelyn Brannon, jointly and severally, his or her attorney-in-fact, with the power of substitution, for him or her in any and all capacities, to sign any amendments to this Annual Report on Form 10-K and to file the same, with exhibits thereto and other documents in connection therewith, with the Securities and Exchange Commission, hereby ratifying and confirming all that each of said attorneys-in-fact, or his or her substitute or substitutes, may do or cause to be done by virtue hereof.
Pursuant to the requirements of the Securities Exchange Act of 1934, this report has been signed below by the following persons on behalf of the Company and in the capacities and on the dates indicated:
Signature | Title | Date | ||
/s/ JAYSHREE ULLAL | Chief Executive Officer, President and Director (Principal Executive Officer) | March 11, 2015 | ||
Jayshree Ullal | ||||
/s/ KELYN BRANNON | Chief Financial Officer (Principal Accounting and Financial Officer) | March 11, 2015 | ||
Kelyn Brannon | ||||
/s/ ANDY BECHTOLSHEIM | Founder, Chief Development Officer, Director | March 11, 2015 | ||
Andy Bechtolsheim | ||||
/s/ CHARLES GIANCARLO | Director | March 11, 2015 | ||
Charles Giancarlo | ||||
/s/ ANN MATHER | Director | March 11, 2015 | ||
Ann Mather | ||||
/s/ DAN SCHEINMAN | Director | March 11, 2015 | ||
Dan Scheinman | ||||
/s/ MARC STOLL | Director | March 11, 2015 | ||
Marc Stoll | ||||
/s/ NIKOS THEODOSOPOULOS | Director | March 11, 2015 | ||
Nikos Theodosopoulos | ||||
96
EXHIBIT INDEX
Incorporated by Reference | ||||||||||||
Exhibit Number | Description | Form | File No. | Exhibit | Filing Date | Filed Herewith | ||||||
3.1 | Amended and Restated Certificate of Incorporation of the Registrant. | 10-Q | 001-36468 | 3.1 | 8/8/2014 | |||||||
3.2 | Bylaws of the Registrant. | 10-Q | 001-36468 | 3.2 | 8/8/2014 | |||||||
4.1 | Form of the Registrant’s common stock certificate. | S-1/A | 333-194899 | 4.1 | 4/21/2014 | |||||||
4.2 | Investors’ Rights Agreement, dated October 16, 2004, between Registrant and certain holders of Registrant’s capital stock named therein. | S-1 | 333-194899 | 4.2 | 3/31/2014 | |||||||
4.3 | Investors’ Rights Agreement, dated January 4, 2011, between Registrant and certain holders of Registrant’s capital stock named therein. | S-1 | 333-194899 | 4.3 | 3/31/2014 | |||||||
10.1 | Form of Indemnification Agreement between the Registrant and each of its directors and executive officers. | S-1/A | 333-194899 | 10.1 | 5/2/2014 | |||||||
10.2 † | 2004 Equity Incentive Plan. | S-1 | 333-194899 | 10.2 | 3/31/2014 | |||||||
10.3 † | 2011 Equity Incentive Plan. | S-1 | 333-194899 | 10.3 | 3/31/2014 | |||||||
10.4 † | 2014 Equity Incentive Plan. | S-1/A | 333-194899 | 10.4 | 5/2/2014 | |||||||
10.5 † | 2014 Employee Stock Purchase Plan. | ü | ||||||||||
10.6 † | Offer Letter, dated October 17, 2004, by and between the Registrant and Kenneth Duda. | S-1 | 333-194899 | 10.6 | 3/31/2014 | |||||||
10.7 † | Offer Letter, dated June 8, 2007, by and between the Registrant and Anshul Sadana. | S-1 | 333-194899 | 10.7 | 3/31/2014 | |||||||
10.8 † | Offer Letter, dated August 1, 2008, by and between the Registrant and Jayshree Ullal. | S-1 | 333-194899 | 10.8 | 3/31/2014 | |||||||
10.9 † | Offer Letter, dated March 27, 2013, by and between the Registrant and Charles Giancarlo. | S-1 | 333-194899 | 10.9 | 3/31/2014 | |||||||
10.10 † | Offer Letter, dated June 3, 2013, by and between the Registrant and Ann Mather. | S-1 | 333-194899 | 10.10 | 3/31/2014 | |||||||
10.11 † | Offer Letter, dated June 21, 2013, by and between the Registrant and Kelyn Brannon. | S-1 | 333-194899 | 10.11 | 3/31/2014 | |||||||
10.12 † | Severance Agreement, dated July 8, 2013, by and between the Registrant and Kelyn Brannon. | S-1 | 333-194899 | 10.12 | 3/31/2014 | |||||||
10.13 † | Offer Letter, dated October 3, 2013, by and between the Registrant and Marc Stoll. | S-1 | 333-194899 | 10.13 | 3/31/2014 | |||||||
10.14 | Lease between Arista Networks, Inc. and The Irvine Company LLC, dated August 10, 2012, as amended on February 28, 2013. | S-1 | 333-194899 | 10.15 | 3/31/2014 | |||||||
10.15 | Second Amendment to Lease, by and between Arista Networks, Inc. and The Irvine Company LLC, dated July 30, 2014. | 10-Q | 001-36468 | 10.1 | 8/8/2014 | |||||||
10.16 | License Agreement, dated November 30, 2004, by and between the Registrant and Optumsoft, Inc. | S-1 | 333-194899 | 10.16 | 3/31/2014 | |||||||
10.17‡ | Manufacturing Services Letter Agreement, dated February 5, 2007, between the Registrant and Jabil Circuit, Inc. | S-1 | 333-194899 | 10.17 | 3/31/2014 | |||||||
10.18 ‡ | Microsoft Master Product Purchase Agreement, dated February 8, 2012, between the Registrant and Microsoft Corporation. | S-1 | 333-194899 | 10.18 | 3/31/2014 | |||||||
10.19 † | Employee Incentive Plan. | S-1/A | 333-194899 | 10.21 | 4/21/2014 | |||||||
21.1 | List of Subsidiaries of the Registrant. | ü | ||||||||||
23.1 | Consent of Ernst & Young LLP, Independent Registered Public Accounting Firm. | ü | ||||||||||
97
31.1 | Certification of the Chief Executive Officer pursuant to Section 302 of the Sarbanes-Oxley Act of 2002. | ü | ||||||||||
31.2 | Certification of the Chief Financial Officer pursuant to Section 302(a) of the Sarbanes-Oxley Act of 2002. | ü | ||||||||||
32.1* | Certifications of Chief Executive Officer and Chief Financial Officer pursuant to 18 U.S.C. Section 1350, as adopted pursuant to section 906 of the Sarbanes-Oxley Act of 2002. | ü | ||||||||||
101.INS | XBRL Instance Document. | |||||||||||
101.SCH | XBRL Taxonomy Extension Schema Document. | |||||||||||
101.CAL | XBRL Taxonomy Extension Calculation Linkbase Document. | |||||||||||
101.DEF | XBRL Taxonomy Extension Definition Linkbase Document. | |||||||||||
101.LAB | XBRL Taxonomy Extension Label Linkbase Document. | |||||||||||
101.PRE | XBRL Taxonomy Extension Presentation Linkbase Document. | |||||||||||
______________________
* The certifications attached as Exhibit 32.1 that accompany this Annual Report on Form 10-K are not deemed filed with the Securities and Exchange Commission and are not to be incorporated by reference into any filing of Arista Networks, Inc. under the Securities Act of 1933, as amended, or the Securities Exchange Act of 1934, as amended, whether made before or after the date of this Annual Report on Form 10-K, irrespective of any general incorporation language contained in such filing.
† Indicates a management contract or compensatory plan or arrangement.
‡ Portions of this exhibit have been granted confidential treatment by the Securities and Exchange Commission.
98