Attached files
| file | filename |
|---|---|
| EXCEL - IDEA: XBRL DOCUMENT - Millennial Media Inc. | Financial_Report.xls |
| EX-32 - EX-32 - Millennial Media Inc. | mm-20141231xex32.htm |
| EX-21.1 - EX-21.1 - Millennial Media Inc. | mm-20141231ex211520f90.htm |
| EX-31.2 - EX-31.2 - Millennial Media Inc. | mm-20141231ex312b46a72.htm |
| EX-10.5 - EX-10.5 - Millennial Media Inc. | mm-20141231ex105925e05.htm |
| EX-31.1 - EX-31.1 - Millennial Media Inc. | mm-20141231ex3113e7a50.htm |
| EX-10.21 - EX-10.21 - Millennial Media Inc. | mm-20141231ex1021e6edb.htm |
| EX-10.20 - EX-10.20 - Millennial Media Inc. | mm-20141231ex10202f0fc.htm |
| EX-23.1 - EX-23.1 - Millennial Media Inc. | mm-20141231ex231736440.htm |
| EX-10.24 - EX-10.24 - Millennial Media Inc. | mm-20141231ex1024224ff.htm |
UNITED STATES
SECURITIES AND EXCHANGE COMMISSION
Washington, D.C. 20549
FORM 10‑K
ANNUAL REPORT PURSUANT TO SECTION 13 OR 15(d) OF
THE SECURITIES EXCHANGE ACT OF 1934
For the fiscal year ended December 31, 2014
Commission file number 001‑35478
MILLENNIAL MEDIA, INC.
|
Incorporated under the Laws of the |
I.R.S. Employer Identification No. |
|
2400 Boston Street, Suite 300, Baltimore, Maryland 21224 |
|
Securities registered pursuant to Section 12(b) of the Exchange Act:
|
Title of each class |
Name of each exchange on which registered |
|
Common Stock, $.001 par value |
New York Stock Exchange |
Securities registered pursuant to Section 12(g) of the Exchange Act: None
Indicate by check mark if the registrant is a well‑known seasoned issuer, as defined in Rule 405 of the Securities Act. Yes ☐ No ☒
Indicate by check mark if the registrant is not required to file reports pursuant to Section 13 or 15(d) of the Exchange Act. Yes ☐ No ☒
Indicate by check mark whether the registrant (1) has filed all reports required to be filed by Section 13 or 15(d) of the Securities Exchange Act of 1934 during the preceding 12 months (or for such shorter period that the registrant was required to file such reports), and (2) has been subject to such filing requirements for the past 90 days. Yes ☒ No ☐
Indicate by check mark whether the registrant has submitted electronically and posted on its corporate Web site, if any, every Interactive Data File required to be submitted and posted pursuant to Rule 405 of Regulation S‑T (§232.405 of this chapter) during the preceding 12 months (or for such shorter period that the registrant was required to submit and post such files). Yes ☒ No ☐
Indicate by check mark if disclosure of delinquent filers pursuant to Item 405 of Regulations S‑K (§229.405 of this chapter) is not contained herein and will not be contained, to the best of registrant’s knowledge, in definitive proxy or information statements incorporated by reference in Part III of this Form 10‑K or any amendment to this Form 10‑K. ☐
Indicate by check mark whether the registrant is a large accelerated filer, an accelerated filer, a non‑accelerated filer, or a smaller reporting company. See the definitions of “large accelerated filer,” “accelerated filer,” and “smaller reporting company” in Rule 12b‑2 of the Exchange Act.
|
Large accelerated filer ☐ |
Accelerated filer ☒ |
Non‑accelerated filer ☐ |
Smaller reporting company ☐ |
Indicate by check mark whether the registrant is a shell company (as defined in Rule 12b‑2 of the Exchange Act). Yes ☐ No ☒
The aggregate market value of Millennial Media, Inc. voting and non‑voting common equity held by non‑affiliates as of June 30, 2014 (the last business day of the registrant’s most recently completed second fiscal quarter) based on the closing sale price of $4.99 as reported on the New York Stock Exchange on that date was $325,749,974.
At March 9, 2015, 139,032,526 shares of Millennial Media, Inc. Common Stock, $.001 par value, were outstanding.
DOCUMENTS INCORPORATED BY REFERENCE
Portions of the Company’s definitive proxy statement, to be filed pursuant to Regulation 14A under the Securities Exchange Act of 1934, for its 2015 Annual Meeting of Stockholders are incorporated by reference in Part III of this Form 10‑K.
SPECIAL NOTE REGARDING FORWARD‑LOOKING STATEMENTS
This Annual Report on Form 10-K, or this Annual Report, contains “forward looking statements” within the meaning of Section 21E of the Securities Exchange Act of 1934, as amended, or the Exchange Act, that involve substantial risks and uncertainties. The forward looking statements are contained principally in Part I, Item 1: “Business,” Part I, Item 1A: “Risk Factors,” and Part II, Item 7: “Management’s Discussion and Analysis of Financial Condition and Results of Operations,” but are also contained elsewhere in this Annual Report. In some cases, you can identify forward looking statements by the words “may,” “might,” “will,” “could,” “would,” “should,” “expect,” “intend,” “plan,” “objective,” “anticipate,” “believe,” “estimate,” “predict,” “project,” “potential,” “continue” and “ongoing,” or the negative of these terms, or other comparable terminology intended to identify statements about the future. These statements involve known and unknown risks, uncertainties and other factors that may cause our actual results, levels of activity, performance or achievements to be materially different from the information expressed or implied by these forward looking statements. Although we believe that we have a reasonable basis for each forward looking statement contained in this Annual Report, we caution you that these statements are based on a combination of facts and factors currently known by us and our expectations of the future, about which we cannot be certain. All statements other than statements of historical fact could be deemed forward looking, including but not limited to statements about:
|
· |
the expansion of the mobile advertising market in general and our belief that digital advertising can be more effective than traditional advertising; |
|
· |
the expected growth of app downloads, mobile ad revenue, number of mobile connected devices and Wi‑Fi enabled devices, wireless network penetration and mobile consumption of content; |
|
· |
market trends, including overall opportunities for mobile advertising and shifting advertising budgets; |
|
· |
the ongoing improvement and refinement of our ad targeting capabilities and the willingness of advertisers to pay more for ads as a result; |
|
· |
our growth strategy; |
|
· |
our expectations to increase our sales and marketing expense, investment in technology and development efforts and general and administrative expense; and |
|
· |
our beliefs about our capital expenditure requirements and that our capital resources will be sufficient to meet our anticipated cash requirements through at least the next 12 months. |
You should refer to “Item 1A. Risk Factors” in this Annual Report for a discussion of important factors that may cause our actual results to differ materially from those expressed or implied by our forward‑looking statements. As a result of these factors, we cannot assure you that the forward‑looking statements in this Annual Report will prove to be accurate. Furthermore, if our forward‑looking statements prove to be inaccurate, the inaccuracy may be material. In light of the significant uncertainties in these forward‑looking statements, you should not regard these statements as a representation or warranty by us or any other person that we will achieve our objectives and plans in any specified time frame, or at all. The forward‑looking statements in this Annual Report represent our views as of the date of this Annual Report. Subsequent events and developments may cause our views to change. However, while we may elect to update these forward‑looking statements at some point in the future, we undertake no obligation to publicly update any forward‑looking statements, whether as a result of new information, future events or otherwise, except as required by law. You should, therefore, not rely on these forward‑looking statements as representing our views as of any date subsequent to the date of this Annual Report.
2
3
Conventions Used in this Report
Mobile connected devices—We refer to mobile devices, such as traditional mobile phones, smartphones and tablets, that are able to connect to the internet through a cellular, wireless or other network as mobile connected devices.
Apps—Software applications specifically designed to operate on mobile connected devices are commonly called apps. Mobile connected devices can access information and content either through apps downloaded onto the device or from web‑based mobile sites accessed using a web browser installed on the device. For convenience, unless the context otherwise requires, we refer to these apps and web‑based mobile sites together as apps.
Developers—For convenience, we refer to the developers of apps and the publishers of web‑based mobile sites together as developers.
Unique users—When we discuss the number of unique users our platform reaches, we measure this as the total number of unique users whose devices made ad requests to our platform during the specified period. This represents the number of users to whom we had an opportunity to deliver ads during that period, not the number of users who actually received ads.
Profiles—When we discuss profiles, we are referring to the number of active unique users in our system that are targetable to receive ads as of the specified date.
Audience categories—When we discuss audience categories, we are referring to a grouping of data into a category based on a variety of user attributes, including location, demographics, affluence, intent, gender, and interests.
Cross‑screen users—When we discuss cross‑screen users, we are referring to users who access digital media through both traditional online means, such as on a laptop or PC, as well as on mobile connected devices.
Number of apps and sites—When we discuss the number of apps and sites enabled by developers to receive ads delivered through our platform, we count an app developed for multiple operating systems as multiple apps.
New and existing clients—When we discuss existing clients, we are referring to advertiser clients who had, as of the beginning of the period being discussed, previously advertised on our or Nexage, Inc.’s platform at any time. An existing client would include a new brand or subsidiary of a parent company that had previously advertised with us or Nexage. When we discuss new clients, we are referring to advertiser clients who had, as of the beginning of the period being discussed, not previously advertised on either platform.
4
Overview
We are an independent mobile advertising marketplace delivering products and services to advertisers and developers. We offer advertisers a suite of solutions that allow them to reach and connect with their target audiences across screens—from smartphones, tablets and other mobile devices to PCs—with the scale to make significant impact to their business. We offer developers the ability to maximize their advertising revenue and acquire new users for their apps. Our advertiser and developer solutions support all major mobile operating systems, including Apple® iOS, Android™, Windows Phone and BlackBerry®. Our proprietary technology and data platform allows advertisers and developers to interact with us in the way that suits them best. For clients who want a higher degree of customer service, we offer our “managed media” services with dedicated account teams. For our clients who want to interact with us on a more automated basis, we offer tools that allow advertisers to buy our ad supply in a programmatic fashion through our ad exchange and developers the opportunity to manage and monetize their ad inventory through our supply side tool.
The goal of our products and services is to help developers and advertisers remove the complexity from mobile advertising. For developers, we provide tools and services that allow their apps to display video, banner ads, interactive rich media and native ad formats. Through this relationship and access to our platform, developers gain access to advertising campaigns from brand marketers and performance‑based advertisers. In return, developers supply us with space on their apps to deliver ads for our advertiser clients and provide us access to anonymous data associated with their apps and users. We use data to build the sophisticated user profiles and audience groups that, in combination with our real‑time decisioning, optimization and targeting capabilities, enable us to deliver targeted advertising campaigns for our advertiser clients. Advertisers pay us to deliver their campaigns to mobile users, and we pay developers a fee for the use of their ad space. As we deliver more campaigns, we are able to collect additional anonymous data about users, audiences and the effectiveness of particular campaigns, which in turn enhances our targeting capabilities and allows us to deliver better performance for advertisers and better opportunities for developers to increase their revenue streams.
Our robust data management platform, or DMP, allows us to access, analyze and utilize the large volumes of data we possess. This data includes location, social, interest, and contextual data, as well as the insights we derive from measuring campaign effectiveness—providing a unique, multidimensional profile of individual consumers. To date, we have developed more than 700 million active server‑side unique user profiles, over 60 million of which link multiple mobile devices and PCs to a single specific user on an anonymous basis. These user profiles, combined with third party data from our data partners, enable us to deliver more relevant, engaging and effective advertising to our advertising clients. Our data asset also allows us to measure the impact of mobile advertising on consumer engagement, intent and action. We have developed a suite of solutions which measures several different areas of mobile advertising impact. As of December 31, 2014, our platform reached more than 650 million monthly unique users worldwide, including over 175 million monthly unique users in the United States alone. Approximately 60,000 apps and mobile sites are enabled by their developers to receive ads delivered through our platform, and we can deliver ads on over 9,000 different mobile device types and models. While averaging more than three billion ad requests daily throughout 2014, in the last two months of 2014, our platform typically handled over nine billion ad requests daily, including requests received through our supply side tool, and requests received through third party platforms and processed by our programmatic buying tool.
We were incorporated under the laws of the State of Delaware on May 30, 2006. Our principal executive office is located at 2400 Boston Street, Suite 300, Baltimore, Maryland. Our telephone number is (410) 522‑8705. Our website address is www.millennialmedia.com. Information contained in, or accessible through, our website does not constitute a part of, and is not incorporated into, this Annual Report. We completed our initial public offering in March 2012 and our common stock is listed on the New York Stock Exchange under the symbol “MM”. Unless the context requires otherwise, the words “Millennial Media,” “Company,” “we,” “us,” and “our” refer to Millennial Media, Inc. and its wholly owned subsidiaries.
5
On December 4, 2014, we completed our acquisition of Nexage, Inc., or Nexage, a privately held mobile advertising exchange and mobile supply side platform under the terms of an Agreement and Plan of Merger, dated September 23, 2014, as amended and restated on October 31, 2014. As a result of this acquisition, Nexage is now a wholly owned subsidiary of Millennial Media.
In connection with the acquisition of Nexage, we issued an aggregate of 30,733,436 shares of our common stock to the former securityholders of Nexage and we also issued options to purchase an additional 7,949,236 shares of common stock in exchange for options to purchase shares of Nexage’s common stock. In the aggregate, the shares issued and shares underlying options represent approximately 26.4% of the total number of shares of our common stock following the closing of the merger, assuming the exercise of all new stock options issued in exchange for the prior Nexage options. Of the total consideration, 4,876,603 of the shares of common stock issued in connection with the acquisition and 1,057,973 of the options exchanged in connection with the acquisition are being held in escrow as partial security for the indemnification obligations of the Nexage securityholders as set forth in the acquisition agreement. We also paid an aggregate of $24.9 million in cash consideration as part of the transaction. All outstanding warrants exercisable for common stock of Nexage were exchanged for a portion of the 30,733,436 shares of our common stock issued at closing.
The Nexage acquisition expands our existing suite of products and comprehensive mobile advertising technology with an end-to-end mobile ad exchange and supply side platform that enables advertisers and developers to interact directly with each other in a programmatic, or automated, fashion. We expect to transition our existing ad exchange solution to Nexage’s technology and business model in 2015. We believe that the integration of Nexage’s supply side platform with our existing supply side tool will improve the solutions we offer to our developers, in particular by increasing access to and optimization of demand sources.
“Millennial Media,” “Millennial Media Exchange,” “MYDAS,” “S.M.A.R.T.,” “Mobile Mix,” “mmDSP,” “mmStudio,” “mMedia,” “MM,” “Jumptap,” “Nexage,” and other trademarks or service marks of Millennial Media, Inc. or its subsidiaries appearing in this Annual Report are the property of Millennial Media, Inc. or its subsidiaries. All other trademarks, service marks and trade names appearing in this Annual Report are the property of their respective owners.
Our Strategy
Our objective is to be the strategic independent mobile advertising partner of choice for developers and advertisers by helping them capitalize on the large and growing mobile advertising opportunity. We simplify the technological complexities of mobile advertising to make it accessible to our partners. The following are the key elements of our growth strategy:
|
· |
Innovate through continued investments in technology and data. |
|
· |
Deepen our relationship with existing developer clients. |
|
· |
Increase our share of advertising budgets from existing advertisers. |
|
· |
Acquire new developers and advertisers. |
|
· |
Increase our global market penetration. |
|
· |
Expand our partnership network with third party providers of tools and services. |
|
· |
Continue to provide trusted insight into the app economy. |
Industry Background and Market Opportunity
Consumers now spend more time on mobile devices than on personal computers. This market shift means that advertisers are moving advertising dollars and focus to mobile advertising platforms. We believe mobile advertising is
6
now a marketing imperative, and provides significant benefits both to developers and to advertisers. For developers, mobile advertising provides the opportunity to monetize their apps, acquire users and gain insight into their usage. For advertisers, the combination of the personal nature of mobile devices, their enhanced functionality and unique data and measurement capabilities, creates a powerful platform for delivering highly targeted and effective advertising. Mobile advertising provides advertisers and developers with a number of benefits not available in traditional advertising media, such as anytime, anywhere access, personalization, location targeting and relevance, more complete user engagement, enhanced audience targeting and monetization opportunities for developers.
The convergence of several factors is fundamentally changing the way mobile users consume content on their mobile connected devices, creating a significant opportunity for mobile advertising. These factors include:
|
· |
Adoption of faster and more functional mobile connected devices. As a result of the widespread adoption of mobile connected devices, driven by increased functionality, faster processing speeds, better graphics processors and advanced display technologies it is now possible to deliver more innovative, interactive and engaging consumer media experiences on a wide variety of mobile connected devices. We anticipate continued improvement and adoption of mobile connected devices. |
|
· |
Widespread access to faster wireless networks facilitates consumer consumption of content. With the growth in the adoption of mobile connected devices, consumers increasingly expect high‑quality online experiences everywhere. High‑speed mobile networks are steadily expanding their footprint and capacity, and the prevalence of Wi‑Fi will further accelerate consumption of content on mobile devices. The combination of widespread network access and faster network technologies enables the proliferation of rich media content, presenting new opportunities in the mobile ecosystem. |
|
· |
Mobile usage disrupts how content is consumed. Consumers are increasingly using their mobile devices as a substitute for their personal computers and other traditional media to access content. Consumers are also increasingly using their mobile devices in all aspects of their daily lives, such as reading the news, playing games, checking sports scores, shopping, checking the weather, banking, obtaining maps and directions and listening to music. |
|
· |
Growth of the mobile app economy. The convergence of better mobile devices and faster connectivity enables new content and new consumer interaction capabilities. Mobile apps are an easy, intuitive and interactive way to instantly deliver content on mobile devices. Mobile apps can be native, running directly on the operating system of the device, while mobile sites run in an internet browser on the device. Developers pursue a variety of approaches to monetize their apps, including charging users a fee for downloading their apps, offering the app for free to users but placing ads within the app, and selling virtual goods within the app. Developers that charge users a fee or sell virtual goods within an app often utilize advertising to supplement their revenue. Developers also use advertising to help consumers discover their apps among the many thousands of apps that are available in the market today. |
|
· |
Mobile advertising disrupts the overall advertising industry. As advertisers seek to maximize the effectiveness of their campaigns, the attractiveness of traditional advertising media, such as outdoor billboards, newspapers, magazines, radio and even television, is declining relative to digital advertising as consumers spend a larger proportion of their time with digital media. At the same time, mobile advertising offers several advantages, such as an increased ability to target specific audiences, measure audience reach and, in some cases, expand geographic range. |
The Millennial Media Solution
Solutions for Advertisers
We offer advertisers the opportunity to reach and engage with their target audiences across mobile devices and screens. Our significant audience reach, access to a large volume of mobile ad space, sophisticated targeting capabilities and broad array of advertising formats allow us to deliver marketing solutions that can help grow our clients’ business. We
7
also enable advertisers to gain insights into the performance of their ad campaigns and to manage their campaigns with a view to maximizing return on their advertising investment. Our solutions are designed to address the needs of large brand advertisers and advertising agencies, as well as performance‑based advertisers. Large brand and performance advertisers typically buy ads on our platform on a full service, or managed, basis, through direct interaction with our sales teams. We also have a smaller tier of clients that prefer to buy ads on our platform through a programmatic, or more automated, approach.
Sophisticated targeting
Our proprietary technology and DMP accesses and analyzes volumes of data about the users on our platform at any point in time. We combine information about a user’s profile and other relevant data in our DMP. Our DMP enables us to offer advertisers the ability to run more targeted and engaging advertising campaigns by incorporating our data, which has been derived from the approximately 60,000 apps and sites enabled to receive ads through our DMP, as well as third-party data or the advertisers’ own customer data.
We have developed more than 700 audience categories to which advertisers can target their ads. Audience categories can be based on a variety of user attributes, including location, demographics, affluence, intent, gender and interests. For example, if a user is browsing the internet and clicks on a news story about a car, that does not necessarily mean the user is interested in purchasing a car. Without additional data points, it is unclear whether the user is interested in purchasing a car or just happened to be interested in the news article. However, if a user has been in a car dealership recently, based on information that can be derived from the location of his or her mobile device, we could place the user into an “in‑market auto” audience category and target car ads to the user. Delivering automotive ads to this user may continue to be very relevant, even after the user has left the car dealership.
Our targeting capabilities also allow us to deliver the type of ad we predict is most likely to engage the user. For example, we may show a video ad for a sports car to a 25‑ to 35‑year‑old affluent male or a rich media ad for a full‑sized SUV or a sedan to a 45‑ to 55‑year‑old father.
We have developed a supplemental approach to data targeting that relies on integrations with several online and offline third party data providers. Our technology addresses the complex problem of merging these providers’ data into the mobile environment.
We also use this third party data to deliver our suite of attribution products. These products use the data derived from the apps and sites on our platform and third party data to show the impact of mobile advertising campaigns, for example, on consumer awareness, product purchase results and in‑store foot traffic. By showing the return on investment of mobile advertising to our large base of advertising clients, we seek to deliver them more consumer insight and thereby increase their confidence in the mobile medium.
We enable advertisers to reach, target and engage audiences directly through our network of approximately 60,000 apps and sites as well as through third party mobile ad exchanges. We also enable third party ad networks, demand side platforms, or DSPs, and advertising agency trading desks to target audiences directly through our ad exchange. We offer managed solutions where we manage algorithmic, real‑time buying on behalf of our clients, as well as direct real‑time bidding.
Cross‑screen capabilities
According to comScore, a market research firm, there are over 100 million cross‑screen users in the United States. We have developed a cross‑screen device map that allows us to associate a single user with his or her multiple online and mobile devices. Using this cross‑screen device map, we offer advertisers the ability both to deliver their message to the same user across screens and then to measure the effectiveness of that message across screens. For example, we are able to deliver an automotive advertisement to the same user on his or her smartphone, tablet and laptop. In addition, we can measure the effectiveness of the mobile advertising even if the user is influenced by an ad on his or her smartphone but interacts with the brand on his or her tablet or laptop, for example by using a website to build a vehicle or schedule an
8
appointment at a dealership. Of our more than 700 million unique user profiles, we are currently able to target more than 60 million profiles across mobile connected devices and PCs.
mmDSP
mmDSP is our mobile‑first DSP. Integrated with most major mobile supply side platforms and exchanges, mmDSP is also able to access inventory directly from our developers and through our ad exchange. mmDSP processes billions of ad requests per day and values each ad request in real‑time based on the needs of our advertisers and its understanding of the likely value of the given ad request to those advertisers.
Millennial Media Exchange
Our ad exchange is a transparent marketplace, enabling advertisers to bid on individual ad impressions. Leveraging our sophisticated targeting capabilities and extensive developer relationships, we bring scale and premium quality to mobile real‑time bidding. Extensive device and user data obtained via our SDK ensures advertisers have the data they need to reach their desired target audiences. A wide range of bidding parameters are available in our ad exchange, enabling advertisers to target their campaign by specific criteria, including location, carrier, device ID, user IP address and developer information.
High level of engagement
We enable advertisers to deliver numerous ad formats:
|
· |
interactive videos, which can also include buttons within the ad that allow a consumer to take an action and engage with the brand, such as visit a website, make a purchase or recommend on social media sites; |
|
· |
native ad formats, which use the native functionality of the device to display ads or to run ads that are customized to the content on the mobile connected device; |
|
· |
rich media, which refers generally to an interactive ad that exhibits dynamic motion over time or in direct response to user interaction, such as a streaming ticker, an interactive animated presentation or ads that expand when users click or touch a specified location on the device screen; |
|
· |
launch pre‑stitials, which are full screen rich media ads, either static image or video, that appear to users before the app loads; |
|
· |
transition interstitials, which are full screen rich media ads, either static image or video, that appear to users at natural transition points in the app, such as between game levels or between the homepage and a unique content page; and |
|
· |
display banners, which are a type of ad format that appears on part of the screen in an app and can be static, animated or expandable, meaning that the ad expands to a full page ad when a user clicks it. |
We believe that these advertising formats, coupled with sophisticated targeting, increase user interaction and engagement with ads, which in turn drives better results for advertisers. Our mmStudio solution enables advertisers and advertising agencies to design rich media and creative ads using a set of templates we have developed. This solution allows the advertiser full control over ad content while ensuring that the ads can be easily integrated and delivered through our platform. We also support the most popular third party rich media creative formats. Our goal is to deliver the most engaging ad possible to a specific user, then to effectively measure the user’s engagement with the ad and, finally, to report the user’s engagement level back to the advertiser.
9
Measurement, actionable insights and campaign management
As a result of the amount and nature of the data we collect in our DMP, our reporting to advertisers goes beyond traditional post‑campaign analysis to provide actionable insights for current ad campaigns and future marketing strategies. We offer real‑time reporting and analytics to help advertisers understand why some campaigns perform better than others. We also use our suite of measurement solutions to report back to advertisers on consumer behavior, mobile advertising impact and overall return‑on‑investment.
Solutions for Developers
Developers work with us in order to maximize ad revenues from their apps by receiving dollars associated with ad campaigns from our advertiser clients. We also offer developers solutions that help promote and distribute their apps, including the ability to run ads for their app on their own apps at no cost to them or to reinvest their ad proceeds by advertising their apps elsewhere on our platform. Our solutions provide developers with insights into their user base along with data to help them enhance their apps and their business.
Tools for App Developers
We provide an easy‑to‑use, turn‑key solution for developers. Through our mMedia portal, developers can download and integrate our software development kits, or SDKs, into their apps at no cost to them. The SDK then becomes an integral part of the app. We have created SDKs for each major mobile operating system. Our SDKs allow the app to receive multiple kinds of ads—including video, interactive rich media, banner display and native ad formats—and also allow developers to take advantage of advanced mobile device features, such as gestures, pinch‑zoom, device orientation and movement. Together, these features enable a compelling interactive user experience with ads. We also offer developers ad serving capabilities, mediation tools and access to our ad exchange, which, together, allow developers to allocate ad requests among various advertising campaign sources, including ads the developers sell themselves, ads generated through us directly, and ads from third party demand side platforms, agency trading desks and third party networks. The ability to access ad demand from a variety of sources enables developers to maximize revenue from their ad space. Our SDKs support all major operating systems and thousands of different mobile device models, so developers can be confident that our ads can be delivered to their apps regardless of the operating system or device on which they will be used. Our goal is to have our SDKs integrated into as many apps as possible so that we can deliver ads to these apps and thereby maximize our platform reach and scale. Therefore, we do not charge developers for our SDKs.
Data and Analytics
We offer developers sophisticated reporting and analytics through an integrated dashboard on our mMedia portal, which includes comprehensive ad revenue generation reports for their apps across all major mobile operating systems. These reports help developers gain insight into user interaction and behavior and the performance of their apps. We share this performance data with developers to help them improve their apps and their deployment of our SDKs in order to maximize their ad revenue. In addition, through the more than three billion ad requests that we typically receive each day through our supply side tool (including the Nexage platform), we are able to gain important insights about users that we are able to share with developers on an aggregated basis.
Services
We offer all developers support through our mMedia portal, as well as various webinars, blogs and, in some cases, support from account managers. We then use the insights we gain from our interactions with developers to enhance the tools we provide to our full developer base.
Our Technology-Based Solution
MYDAS, which is how we refer to our comprehensive mobile advertising technology, along with our data assets, is at the core of the solutions and services that we provide to developers and advertisers. Each time an app makes a request to receive an ad, MYDAS performs several tasks automatically and in real‑time, including identifying unique users;
10
targeting ads based on user interest, behavior and location; delivering those ads to millions of users through tens of thousands of apps, running on thousands of different device types; ensuring that the ads will work over wireless connections of varying quality and speed; and measuring user engagement and ad performance.
MYDAS combines proprietary technology with our data in order to deliver the right mobile ad to the right person at the right time in the right place. MYDAS, including the Nexage supply side platform, typically receives over three billion ad requests daily in the aggregate. MYDAS typically accomplishes ad delivery in under 50 milliseconds from ad request, and includes the following sequences:
|
· |
Ad request management. Mobile apps that have our SDKs embedded send a request for an ad to MYDAS through the SDK. This ad request enters MYDAS, along with associated data from the device, app and mobile carrier. MYDAS analyzes all of the available data to categorize the ad request and to place it in context so that we can deliver the most relevant available ad to the specific user. |
|
· |
Unique user identification. MYDAS then runs a proprietary set of algorithms to analyze multiple data points from the device, carrier and app to statistically determine, on an anonymous basis, the likely unique user of the device and the app requesting the ad. In addition, MYDAS can analyze anonymized identifiers sent to us from third parties to identify unique users across devices more accurately. MYDAS assigns an internal unique user identifier to the user profile developed for that individual, with the goal of delivering more relevant ads to that user across multiple mobile devices and maximizing advertising diversity for that user. We believe that many of our competitors rely only upon a device identification code to identify the device as opposed to the more robust analysis that MYDAS employs to identify the unique user. User identification is accomplished on a completely anonymous basis. |
|
· |
Contextual analysis. After identifying the unique user associated with a specific advertising request, MYDAS then determines the context around the ad request. This context answers one or more of the following questions: |
|
· |
Where is the user? |
|
· |
What site or app is the user currently using? |
|
· |
What is the nature of the content on the site or app from which the request is coming? |
|
· |
What type of device is the request coming from? |
|
· |
What wireless network is the request coming through? |
|
· |
Audience analysis. Once MYDAS identifies the unique user associated with an ad request and its context, it then searches our databases to determine an appropriate audience category or categories based on prior information we have gathered about the user on a completely anonymous basis. For example, a user may belong to an audience of “moms” because she has downloaded or visited several apps focused on content for mothers, or she has identified herself as a “mom” in a registration form for an app. We may also place a user in a “moms” audience because she has opted to share location data with us and she has regularly visited retail establishments typically frequented by mothers. We might place another user in an “in‑market auto buyer” audience because he or she has been in multiple auto dealerships in a short period of time, has opened and engaged with automotive ads and has used numerous apps with automotive‑focused content. The ability to identify a user and then determine the audiences to which that user belongs is critical in order to deliver the most relevant ad possible to that user and deliver the best results for advertisers and developers. Each time that we see a unique user on our platform, we gain data that enables us to better determine the audiences with which that user should be associated. |
11
|
· |
RTB platform. Real-time bidding, or RTB, is an auction‑based system in which digital advertising opportunities are auctioned off in real‑time from developers on an impression‑by‑impression basis. Our RTB platform, within MYDAS, was developed to analyze billions of impressions of mobile inventory, in order to deliver effective programmatic buying for advertisers and to increase returns for developers. The RTB platform interacts directly with developers’ available ad inventory to access scalable audiences in real‑time. After the bid request is received, mmDSP identifies the unique user associated with a specific ad request, the context around the ad request and the audiences to which the user belongs, and delivers the request to our RTB marketplace in which it matches available ads with available ad requests. The real‑time marketplace can be a virtual auction that we run on behalf of our clients or a real‑time bidded auction on our ad exchange or through third party exchanges. mmDSP performs a sophisticated algorithmic analysis to automatically run a near‑instantaneous auction in which each qualified ad campaign bids on each available ad request. We call this process optimization and decisioning. As part of this decisioning process, we use an artificial intelligence concept called “agents,” which are software programs designed to operate the ad marketplace efficiently and fairly, while at the same time optimizing results based on each campaign’s goals. Each ad campaign is represented in the marketplace by one of these agents, programmed with specific goals for the particular campaign. The goals will usually include information such as price, audiences to be targeted and timeframe of the campaign, as well as target engagement metrics. When mmDSP enters an ad request into the marketplace, each agent bids on the ad request, and the platform then matches the best available ad to the specific ad request. |
|
· |
CPC marketplace. This marketplace is based on display ads and is geared towards performance advertising. |
|
· |
Cross‑platform ad delivery. After matching an ad to a request, MYDAS then delivers, or serves, the ad through the SDK integrated into the app on the specific device making the request. MYDAS can deliver a variety of different types of ads, including video ads, rich media ads, native ad formats and a variety of banner ads, to virtually any mobile connected device across all major mobile operating systems, both within mobile apps and through mobile web browsers. MYDAS can also deliver a variety of ad formats to PCs through online exchanges or through partners with online advertising inventory. |
|
· |
Reporting, analysis and machine learning. Once MYDAS has delivered an ad to a specific device, MYDAS analyzes the user’s engagement with the ad, measuring whether the user clicked on the ad or engaged with the ad in some other meaningful way, such as swiping the ad, opening a video, sharing the ad with a friend or downloading an app in response to the ad. These results are then incorporated back into MYDAS, which can use the data to analyze whether the specific ad served to the user was actually the best available ad to deliver to that user. This information about the user’s engagement level with the ad is used to automatically refine various weightings and algorithms within MYDAS to further improve our ability to target and optimize future ad delivery. |
MYDAS also includes a suite of enterprise web services that drive our client‑facing tools and interfaces like mMedia and our internal workflow tools and interfaces. Our web services layer enables us to build new offerings and scale our platform for developers and advertisers quickly and cost‑effectively while also enabling us to integrate our solutions with those of third parties.
MYDAS consists primarily of software incorporating our proprietary algorithms, database software and the data that we store. Our software and data are hosted in data centers in the United States. We primarily lease space at data centers on a managed services basis, although we also co‑locate servers and other equipment that we own at the same data centers. In addition, we use third party web services for some of our data and computing needs.
We use techniques that we believe are standard in our industry to protect MYDAS against unauthorized access. These techniques include password‑controlled user access and authentication, secure hosting with firewalls, encryption, load balancers, switches, anti‑virus software and use of physically secure and redundant facilities.
12
Our Advertisers and Developers
We have built relationships with developers and advertisers of all sizes. Our developer base includes large mobile web publishers, large app developers and other developers. Our advertiser clients include leading advertising agencies and brands, as well as smaller advertisers and often the developers themselves. Throughout our history, we have worked with many of the top 100 advertisers as ranked by Ad Age, and in 2014, based on the Ad Age rankings for 2013, which is the most recent ranking available, we delivered ads for 95 of the top 100 advertisers. These are typically the largest brand advertisers, and many of them have multiple brands for which they run campaigns throughout the year. We have analyzed the total spending by the top 100 Ad Age advertisers based on the most current rankings for each respective period on our platform from 2010 through 2014. The results of this analysis are summarized in the table below.
Use of our Platform by the Top 100 Ad Age Advertisers
|
|
|
|
|
|
|
|
|
|
|
|
|
|
|
|
|
|
|
|
2010 |
|
2011 |
|
2012 |
|
2013 |
|
2014 |
|||||
|
Number of advertisers using our platform |
|
|
61 |
|
|
75 |
|
|
85 |
|
|
90 |
|
|
95 |
|
Total spending by these advertisers on our platform (millions) |
|
$ |
24.6 |
|
$ |
53.4 |
|
$ |
70.8 |
|
$ |
103.0 |
|
$ |
128.1 |
|
Average spending per advertiser |
|
$ |
404,000 |
|
$ |
712,000 |
|
$ |
833,000 |
|
$ |
1,144,000 |
|
$ |
1,348,000 |
We have increased the average annual spending from this group of advertisers by more than 234% during the period from 2010 to 2014. We attribute this growth in average spending among these advertisers to our success in capturing advertising campaigns from more brands per advertiser, running more campaigns for each brand per year and supporting larger campaigns from these advertisers. We believe our increased penetration of these 100 advertisers is attributable to increased sales and marketing efforts and our growing reputation for delivering results for large brand advertisers.
Our largest advertiser and developer clients are typically different from period to period. We believe our business is not substantially dependent on any particular client, and no individual advertising client represented more than 10% of our revenue for the year ended December 31, 2014.
Competition
The mobile advertising market is highly competitive. The competitive dynamics of our market are unpredictable because it is in an early stage of development, rapidly evolving, fragmented and subject to potential disruption by new technological innovations. Several competitors provide mobile advertising solutions. Our primary competitors are the large advertising platforms offered by Google and Apple, both of which focus on advertising solutions built for their proprietary mobile operating systems, Android and iOS, respectively. We also compete with in‑house solutions used by companies who choose to coordinate mobile advertising across their own properties, such as Facebook, Twitter, Yahoo!, and Pandora, as well as some smaller point‑solution offerings in the mobile advertising market. Some of these companies, such as Facebook and Twitter, have growing mobile advertising networks that coordinate advertising across third party properties as well.
We believe the principal competitive factors in our industry include the following:
|
· |
mobile advertising focus; |
|
· |
proven and scalable technology; |
|
· |
platform independence; |
|
· |
size and quality of developer relationships; |
|
· |
relationships with leading advertisers; |
13
|
· |
quality and size of advertising inventory; |
|
· |
brand awareness and reputation; |
|
· |
ability to integrate with third party apps and technologies; |
|
· |
ability to anonymously identify unique users across multiple mobile devices as well as PCs; |
|
· |
ability to gather and use data to deliver more relevant ads and provide insights to our advertisers; |
|
· |
ability to provide yield management tools to our developers; and |
|
· |
ability to offer advertisers and developers the opportunity to buy or sell inventory on our platform in an automated, real‑time bidded manner. |
We believe that we compete favorably with respect to all of these factors and that we are well‑positioned as an independent mobile advertising company that can operate without regard to brand of mobile device or operating system.
Technology and Development
Our technology and development efforts are focused on enhancing the architecture of MYDAS and creating additional functionality for our developer and advertiser customers. We are also continuously working to enhance our database of user profiles, which enables us to help our advertisers reach and engage more precise audiences developed through demographic and behavioral analysis, and then better measure that improved engagement. As part of our cross‑platform SDKs that we provide to developers, we seek to include new capabilities, such as additional analytical tools, notification solutions, payment solutions and mediation tools.
During the years ended December 31, 2014, 2013 and 2012, our technology and development expenses were $29.5 million, $19.0 million and $13.6 million, respectively.
Intellectual Property
Our ability to protect our intellectual property, including our technology, will be an important factor in the success and continued growth of our business. We protect our intellectual property through trade secrets law, patents, copyrights, trademarks and contracts. Some of our technology relies upon third party licensed intellectual property.
We have 97 issued patents, both in the U.S. and internationally, and have more than 99 pending U.S. and international patent applications as of December 31, 2014. Our U.S.-issued patents extend to various dates between 2025 and 2032.
We own U.S. trademark registrations for Millennial Media, Jumptap, tapMatch, MYDAS, Nexage, Mobile Advertising., Demand More. and Bridging the Mobile Advertising Economy. We also own trademark registrations for Millennial Media in Singapore and Japan and for Jumptap in Australia, Canada, the European Union, Israel, Japan, Malaysia, Mexico, Romania, South Korea, Switzerland, Taiwan, and Turkey, and with the World Intellectual Property Organization. In addition, we own a pending trademark application for Millennial Media in the European Union, as well as pending applications for Jumptap in Brazil, China, Russia, India, Indonesia, Saudi Arabia, and Singapore. We continue to review whether pursuing trademark protection in other countries is appropriate.
In addition to the foregoing, we have established business procedures designed to maintain the confidentiality of our proprietary information, including the use of confidentiality agreements and assignment of inventions agreements with employees, independent contractors, consultants and companies with which we conduct business.
14
Government Regulation
We are subject to numerous U.S. and foreign laws and regulations that are applicable to companies engaged in the business of advertising on mobile devices. In addition, many areas of law that apply to our business are still evolving, and could potentially affect our business to the extent they restrict our business practices or impose a greater risk of liability.
Given the nascent stage of mobile advertising, industry practices are rapidly evolving. We participate in the Digital Advertising Alliance and other industry groups that are developing best practices for the mobile advertising industry.
Privacy
Privacy and data protection laws play a significant role in our business. In the United States, at both the state and federal level, there are laws that govern activities such as the collection and use of data by companies like us, and privacy and data protection issues generally have gained wide media and public attention recently. Online advertising activities in the United States have primarily been subject to regulation by the Federal Trade Commission, which has regularly relied upon Section 5 of the Federal Trade Commission Act to enforce against unfair and deceptive trade practices. Section 5 has been the primary regulatory tool used to enforce against alleged violations of online privacy policies, and would apply to privacy practices in the mobile advertising industry. In December 2012, the Federal Trade Commission adopted amendments to rules under the Children’s Online Privacy Protection Act, or COPPA, which went into effect in July 2013. These amendments broadened the potential applicability of COPPA compliance obligations to our activities and those of our clients.
The issue of privacy in the mobile advertising industry is still evolving. Federal legislation and rule‑making has been proposed from time to time that would govern certain advertising practices as they relate to mobile devices, including the use of precise geo‑location data. Although such legislation has not been enacted, it remains a possibility that such federal and state laws may be passed in the future.
There have been numerous civil lawsuits, including class action lawsuits, filed against companies that conduct business in the mobile device industry, including makers of mobile devices, mobile application providers, mobile operating system providers, and mobile third party networks. Plaintiffs in these lawsuits have alleged a range of violations of federal, state and common laws, including computer trespass and violation of privacy laws.
In addition, mobile services are generally not restricted by geographic boundaries, and our services reach mobile devices throughout the world. We currently transact business in Europe and Southeast Asia and, as a result, some of our activities may also be subject to the laws of foreign jurisdictions. In particular, European data protection laws can be more restrictive regarding the collection and use of data than those in U.S. jurisdictions. As we continue to expand into other foreign countries and jurisdictions, we may be subject to additional laws and regulations that may affect how we conduct business.
Advertising
Even though we receive contractual protections from our advertising business partners with respect to their ads, we may nevertheless be subject to regulations concerning the content of ads. Federal and state laws governing intellectual property or other third party rights could apply to the content of ads we place. Laws and regulations regarding unfair and deceptive advertising, sweepstakes, advertising to children, and other consumer protection regulations, may also apply to the ads we place on behalf of clients.
Employees
As of December 31, 2014, we had 636 employees. None of our U.S.‑based employees are represented by a labor union or covered by a collective bargaining agreement. We consider our relationship with our employees to be good.
15
Information about Segment and Geographic Revenue
Information about segment and geographic revenue is set forth in Note 11 to our consolidated financial statements under Item 8 of this Annual Report.
Available Information
Our internet website address is www.millennialmedia.com. In addition to the information about us and our subsidiaries contained in this Annual Report, information about us can be found on our website. Our website and information included in or linked to our website are not part of this Annual Report.
Our annual reports on Form 10‑K, quarterly reports on Form 10‑Q, current reports on Form 8‑K and amendments to those reports filed or furnished pursuant to Section 13(a) or 15(d) of the Securities Exchange Act of 1934, as amended, are available free of charge through our website as soon as reasonably practicable after they are electronically filed with or furnished to the Securities and Exchange Commission, or the SEC. The public may read and copy the materials we file with the SEC at the SEC’s Public Reference Room at 100 F Street, NE, Washington, DC 20549. The public may obtain information on the operation of the Public Reference Room by calling the SEC at 1‑800‑SEC‑0330. Additionally the SEC maintains an internet site that contains reports, proxy and information statements and other information. The address of the SEC’s website is www.sec.gov.
16
Our business is subject to numerous risks. You should carefully consider the following risks and all other information contained in this Annual Report, as well as general economic and business risks, together with any other documents we file with the SEC. If any of the following events actually occur or risks actually materialize, it could have a material adverse effect on our business, operating results and financial condition and cause the trading price of our common stock to decline.
Risks Related to Our Acquisition of Nexage
The consummation of our acquisition of Nexage could have a negative impact on our business or on our stock price.
On December 4, 2014, we completed our acquisition of Nexage, a mobile advertising exchange and mobile supply side platform, in which we acquired all of the outstanding shares of capital stock of Nexage. We refer to this transaction in these Risk Factors as the “Merger”. The closing of the Merger could disrupt our and Nexage’s businesses in the following ways, any of which could negatively affect our stock price or could harm our financial condition, results of operations or business prospects:
|
· |
our and Nexage’s customers and other third-party business partners may seek to terminate or renegotiate their relationships with us or Nexage as a result of the Merger, whether pursuant to the terms of their existing agreements with us or Nexage, or otherwise; |
|
· |
the attention of our management may be directed toward the integration of our businesses and related matters and may be diverted from day-to-day business operations, including from other opportunities that might otherwise be beneficial to us; and |
|
· |
current and prospective employees may experience uncertainty regarding their future roles with our company, which might adversely affect our ability to retain, recruit and motivate key personnel. |
The issuance of our shares in the Merger diluted the voting power and economic interests of our current stockholders.
Upon consummation of the Merger, all of Nexage’s capital stock held by accredited investors and all of its warrants issued and outstanding immediately prior to the effective time of the Merger were converted into shares of our common stock and cash. In connection with the Merger, we have issued a total of 30,733,436 shares of our common stock to the former securityholders of Nexage. We have also issued new options to purchase our common stock in exchange for prior options to purchase common stock of Nexage. These newly issued options are, in the aggregate, exercisable for 7,949,236 shares of our common stock. The aggregate potential equity consideration of 38,682,672 shares, including the shares issuable upon the exercise of options, represents approximately 26.4% of the total number of shares of Millennial common stock following the closing of the Merger, but assuming the exercise of all new stock options issued in exchange for the prior Nexage options. Consequently, our stockholders prior to the Merger now own a significantly smaller percentage of the combined company and they should expect to exercise less influence over the management and policies of the combined company following the Merger than they previously exercised over our management and policies.
We may be unable to realize the benefits anticipated by the Merger, including estimated cost savings and synergies, or it may take longer than we anticipate for us to achieve those benefits.
Our realization of the benefits anticipated as a result of the Merger will depend in part on the integration of Nexage’s business with ours. However, there can be no assurance that we will be able to operate Nexage’s business profitably or integrate it successfully into our operations in a timely fashion, or at all. The size of the combined company’s business is significantly larger than our business was prior to the Merger. Our future success as a combined company depends, in part, upon our ability to manage this expanded business, which will pose substantial challenges for our management, including challenges related to the management and monitoring of new operations and associated increased costs and complexity. The dedication of management resources to this integration could detract attention from our current
17
day-to-day business, and we cannot assure you that there will not be substantial costs associated with the transition process or other negative consequences as a result of these integration efforts. These effects, including, but not limited to, incurring unexpected costs or delays in connection with integration of the two businesses, or the failure of Nexage’s business to perform as expected, could harm our results of operations.
The loss of key personnel could hurt our business and our prospects.
The success of the Merger will depend, in part, on our ability to retain key employees who are continuing employment with the combined company now that the Merger is completed. If any of these key employees terminate their employment, our sales, marketing or development activities might be negatively impacted and management’s attention might be diverted from successfully integrating Nexage’s operations. In addition, we might not be able to locate suitable replacements on reasonable terms for any such key employees who leave the combined company.
Our success will also depend on relationships with third parties and pre-existing customers of both companies, which relationships may be affected by customer preferences or public attitudes about the Merger.
Our success following the Merger will be dependent on the ability to maintain and renew relationships with pre-existing customers and other clients of both our company and Nexage and to establish new advertiser and developer relationships. There can be no assurance that the business of the combined company will be able to maintain pre-existing customer contracts and other business relationships, or that we will be able to enter into or maintain new customer contracts and other business relationships on acceptable terms, if at all. Our failure to maintain important customer relationships could harm our reputation, while also negatively impacting our financial condition and results of operations of the combined company.
Charges to earnings resulting from the Merger may cause our operating results to suffer.
Under accounting principles, we will allocate the total purchase price of the Merger to Nexage’s net tangible assets and intangible assets based on their fair values as of the date of the Merger, and we will record the excess of the purchase price over those fair values as goodwill. Our management’s estimates of fair value will be based upon assumptions that they believe to be reasonable but that are inherently uncertain. The following factors, among others, could result in material charges that would cause our financial results to be negatively impacted:
|
· |
impairment of goodwill; |
|
· |
charges for the amortization of identifiable intangible assets and for stock-based compensation; |
|
· |
accrual of newly identified pre-acquisition contingent liabilities that are identified subsequent to the finalization of the purchase price allocation; and |
|
· |
charges to income to eliminate certain of our pre-acquisition activities that duplicate those of Nexage or to reduce our cost structure. |
Additional costs may include costs of employee redeployment, relocation and retention, including salary increases or bonuses, accelerated amortization of deferred equity compensation and severance payments, reorganization or closure of facilities, taxes and termination of contracts that provide redundant or conflicting services. Some of these costs may have to be accounted for as expenses that would decrease our net income and earnings per share for the periods in which those adjustments are made.
18
Risks Related to Our Business and Our Industry
We have incurred significant net losses since inception, and we expect our operating expenses to increase significantly in the foreseeable future. Accordingly, we may never achieve profitability.
We incurred net losses of $149.1 million and $15.1 million for the years ended December 31, 2014 and 2013, respectively, and we had an accumulated deficit of $214.2 million as of December 31, 2014. We do not know when or if we will ever achieve profitability. Although our revenue has increased substantially in recent periods, it is likely that we will not be able to maintain this rate of revenue growth. Historically, our operating expenses have increased in proportion to our revenue. We anticipate that our operating expenses will continue to increase in the foreseeable future to the extent that our revenue grows, and as we increase headcount primarily driven by the Nexage acquisition. Additionally, our acquisition‑related costs may increase if we pursue additional acquisition opportunities. Although we expect to achieve operating efficiencies and greater leverage of resources as we grow, if we are unable to do so, we may be unable to achieve profitability. If we are not able to achieve and maintain profitability, the value of our company and our common stock could decline significantly.
We operate in an intensely competitive industry, and we may not be able to compete successfully.
The mobile advertising market is highly competitive, with numerous companies providing mobile advertising services. We compete primarily with Google and Apple, both of which are significantly larger than us and have more capital to invest in their mobile advertising businesses, and with social networking companies like Facebook and Twitter, that are expanding their own mobile advertising networks. We also compete with in-house solutions used by companies, such as Yahoo! and Pandora, that choose to coordinate mobile advertising across their own properties. They, or other companies that offer competing mobile advertising solutions, may establish or strengthen cooperative relationships with their mobile operator partners, brand advertisers, app developers or other parties, thereby limiting our ability to promote our services and generate revenue. Competitors could also seek to gain market share from us by reducing the prices they charge to advertisers or by introducing new technology tools for developers. Moreover, increased competition for mobile advertising space from developers could result in an increase in the portion of advertiser revenue that we must pay to developers to acquire that advertising space.
Our business will suffer to the extent that our developers and advertisers purchase and sell mobile advertising directly from each other or through other companies that are able to become intermediaries between developers and advertisers. For example, we are aware of companies that have substantial existing platforms for developers who had previously not heavily used those platforms for mobile advertising campaigns. These companies could compete with us to the extent they expand into mobile advertising. Other companies, such as large app developers with a substantial mobile advertising business, may decide to directly monetize some or all of their advertising space without utilizing our services. Other companies that offer analytics, mediation, exchange or other third-party services may also become intermediaries between mobile advertisers and developers and thereby compete with us. Any of these developments would make it more difficult for us to sell our services and could result in increased pricing pressure, reduced profit margins, increased sales and marketing expenses or the loss of market share.
The mobile advertising market may deteriorate or develop more slowly than expected, which could harm our business.
Advertising on mobile connected devices is an emerging phenomenon. Advertisers have historically spent a smaller portion of their advertising budgets on mobile media as compared to traditional advertising methods, such as television, newspapers, radio and billboards, or online advertising over the internet, such as placing banner ads on websites. Future demand and market acceptance for mobile advertising is uncertain. Many advertisers still have limited experience with mobile advertising and may continue to devote larger portions of their advertising budgets to more traditional offline or online personal computer-based advertising, instead of shifting additional advertising resources to mobile advertising. In addition, our current and potential advertiser clients may ultimately find mobile advertising to be less effective than traditional advertising media or marketing methods or other technologies for promoting their products and services, and they may even reduce their spending on mobile advertising from current levels as a result. If the market for mobile advertising deteriorates, or develops more slowly than we expect, we may not be able to increase our revenue.
19
Our business is dependent on the continued growth in usage of smartphones, tablets and other mobile connected devices.
Our business depends on the continued proliferation of mobile connected devices, such as smartphones and tablets, that can connect to the internet over a cellular, wireless or other network, as well as the increased consumption of content through those devices. Consumer usage of these mobile connected devices may be inhibited for a number of reasons, such as:
|
· |
inadequate network infrastructure to support advanced features beyond just mobile web access; |
|
· |
users’ concerns about the security of these devices; |
|
· |
inconsistent quality of cellular or wireless connection; |
|
· |
unavailability of cost‑effective, high‑speed internet service; and |
|
· |
changes in network carrier pricing plans that charge device users based on the amount of data consumed. |
For any of these reasons, users of mobile connected devices may limit the amount of time they spend on these devices and the number of apps they download on these devices. If user adoption of mobile connected devices and consumer consumption of content on those devices do not continue to grow, our total addressable market size may be significantly limited, which could compromise our ability to increase our revenue and to become profitable.
If mobile connected devices, their operating systems or content distribution channels, including those controlled by our primary competitors, develop in ways that prevent our advertising from being delivered to their users, our ability to grow our business will be impaired.
Our business model depends upon the continued compatibility of our mobile advertising platform with most mobile connected devices, as well as the major operating systems that run on them and the thousands of apps that are downloaded onto them.
The design of mobile devices and operating systems is controlled by third parties with whom we do not have any formal relationships. These parties frequently introduce new devices, and from time to time they may introduce new operating systems or modify existing ones. Network carriers, such as Verizon, AT&T, Sprint or T-Mobile, may also affect the ability to download apps or access specified content on mobile devices.
In some cases, the parties that control the development of mobile connected devices and operating systems include companies that we regard as our most significant competitors. For example, Apple controls two of the most popular mobile devices, the iPhone® and the iPad®, as well as the iOS operating system that runs on them. Apple also controls the App Store for downloading apps that run on Apple® mobile devices. Similarly, Google controls the Android™ platform operating system. If our mobile advertising platform were unable to work on these devices or operating systems, either because of technological constraints or because a maker of these devices or developer of these operating systems wished to impair our ability to provide ads on them or our ability to fulfill advertising space from developers whose apps are distributed through their controlled channels, our ability to generate revenue could be significantly harmed.
We do not control the mobile networks over which we provide our advertising services.
Our mobile advertising platform is dependent on the reliability of network operators and carriers who maintain sophisticated and complex mobile networks, as well as our ability to deliver ads on those networks at prices that enable us to realize a profit. Mobile networks have been subject to rapid growth and technological change, particularly in recent years. We do not control these networks.
Mobile networks could fail for a variety of reasons, including new technology incompatibility, the degradation of network performance under the strain of too many mobile consumers using the network, a general failure from natural
20
disaster or a political or regulatory shut-down. Individuals and groups who develop and deploy viruses, worms and other malicious software programs could also attack mobile networks and the devices that run on those networks. Any actual or perceived security threat to mobile devices or any mobile network could lead existing and potential device users to reduce or refrain from mobile usage or reduce or refrain from responding to the services offered by our advertising clients. If the network of a mobile operator should fail for any reason, we would not be able to effectively provide our services to our clients through that mobile network. This in turn could hurt our reputation and cause us to lose significant revenue.
Mobile carriers may also increase restrictions on the amounts or types of data that can be transmitted over their networks. We currently generate different amounts of revenue from our advertiser clients based on the kinds of ads we deliver, such as display ads, rich media ads or video ads. In some cases, we are paid by advertisers on a cost-per-thousand, or CPM, basis depending on the number of ads shown. In other cases, we are paid on a cost-per-click, or CPC, or cost-per-action, or CPA, basis depending on the actions taken by the mobile device user. Different types of ads consume differing amounts of bandwidth and network capacity. If a network carrier were to restrict the amounts of data that can be delivered on that carrier’s network, or otherwise control the kinds of content that may be downloaded to a device that operates on the network, it could negatively affect our pricing practices and inhibit our ability to deliver targeted advertising to that carrier’s users, both of which could impair our ability to generate revenue.
Mobile connected device users may choose not to allow advertising on their devices.
The success of our business model depends on our ability to deliver targeted, highly relevant ads to consumers on their mobile connected devices. Targeted advertising is done primarily through analysis of data, much of which is collected on the basis of user‑provided permissions. This data might include a device’s location or data collected when device users view an ad or video or when they click on or otherwise engage with an ad. Users may elect not to allow data sharing for targeted advertising for a number of reasons, such as privacy concerns, or pricing mechanisms that may charge the user based upon the amount or types of data consumed on the device. Users may also elect to opt out of receiving targeted advertising from our platform. In addition, the designers of mobile device operating systems are increasingly promoting features that allow device users to disable some of the functionality, which may impair or disable the delivery of ads on their devices, and device manufacturers may include these features as part of their standard device specifications. Although we are not aware of any such products that are widely used in the market today, as has occurred in the online advertising industry, companies may develop products that enable users to prevent ads from appearing on their mobile device screens. If any of these developments were to occur, our ability to deliver effective advertising campaigns on behalf of our advertiser clients would suffer, which could hurt our ability to generate revenue and become profitable.
Our limited operating history makes it difficult to evaluate our business and prospects and may increase your investment risk.
We have only a limited operating history upon which you can evaluate our business and prospects. Although we have experienced revenue growth in recent periods, it is likely that we will not be able to sustain this growth. As part of the nascent mobile advertising industry, we will encounter risks and difficulties frequently encountered by early‑stage companies in rapidly evolving industries, including the need to:
|
· |
maintain our reputation and build trust with our advertisers and developers; |
|
· |
offer competitive pricing to both advertisers and developers; |
|
· |
maintain and expand our network of advertising space through which we deliver mobile advertising campaigns; |
|
· |
deliver advertising results that are superior to those that advertisers or developers could achieve directly or through the use of competing providers or technologies; |
|
· |
continue to develop and upgrade the technologies that enable us to provide mobile advertising services; |
21
|
· |
respond to evolving government regulations relating to the internet, telecommunications, privacy, direct marketing and advertising aspects of our business; |
|
· |
identify, attract, retain and motivate qualified personnel; and |
|
· |
manage our expanding operations. |
If we do not successfully address these risks, our revenue could decline and our ability to pursue our growth strategy and attain profitability could be compromised.
We may not be able to enhance our mobile advertising platform to keep pace with technological and market developments.
The market for mobile advertising services is characterized by rapid technological change, evolving industry standards, new entrants to the market and frequent new service introductions. To keep pace with technological developments, satisfy increasing advertiser and developer requirements, maintain the attractiveness and competitiveness of our mobile advertising solutions and ensure compatibility with evolving industry standards and protocols, we will need to regularly enhance our current services and to develop and introduce new services on a timely basis.
For example, advances in technology that allow developers to generate revenue from their apps without our assistance could harm our relationships with developers and diminish our available advertising space within their apps. Similarly, technological developments that allow third parties to better mediate the delivery of ads between advertisers and developers by introducing an intermediate layer between us and our developers could impair our relationships with those developers. Our inability, for technological, business or other reasons, to enhance, develop, introduce and deliver compelling mobile advertising services in response to changing market conditions and technologies or evolving expectations of advertisers or mobile device users could hurt our ability to grow our business and could result in our mobile advertising platform becoming obsolete.
We depend on developers for mobile advertising space to deliver our advertiser clients’ advertising campaigns, and any decline in advertising supply from these developers could hurt our business.
We depend on developers to provide us with space within their apps, which we refer to as “advertising supply” or “advertising inventory,” on which we deliver ads. The developers that sell their advertising supply to us are not required to provide any minimum amounts of advertising space to us, nor are they contractually bound to provide us with consistent advertising supply. The tools that we provide to developers allow them to make decisions as to how to allocate advertising supply among us and other advertising providers, some of which may be our competitors. A third party acting as a mediator on behalf of developers, or any competing mediation tools embedded within a developer’s apps, could result in pressure on us to increase the prices we pay to developers for that supply or otherwise block our access to developer supply, without which we would be unable to deliver ads on behalf of our advertiser clients.
We generate a significant portion of our revenue from the advertising supply provided by a limited number of developers. In most instances, developers can change the amount of supply they make available to us at any time. Developers may also change the price at which they offer supply to us, or they may elect to make advertising space available to our competitors who offer ads to them on more favorable economic terms. In addition, developers may place significant restrictions on our use of their advertising supply. These restrictions may prohibit ads from specific advertisers or specific industries, or they could restrict the use of specified creative content or format. Developers may also use a fee-based or subscription-based business model to generate revenue from their content, in lieu of or to reduce their reliance on ads.
If developers decide not to make advertising supply available to us for any of these reasons, decide to increase the price of supply, or place significant restrictions on our use of their advertising space, we may not be able to replace this with supply from other developers that satisfy our requirements in a timely and cost-effective manner. If this happens, our revenue could decline or our cost of acquiring supply could increase.
22
Our business depends on our ability to collect and use data to deliver ads, and any limitation on the collection and use of this data could significantly diminish the value of our services and cause us to lose clients and revenue.
When we deliver an ad to a mobile device, we are often able to collect anonymous information about the placement of the ad and the interaction of the mobile device user with the ad, such as whether the user visited a landing page or watched a video. We may also be able to collect information about the user’s mobile location. As we collect and aggregate this data provided by billions of ad impressions, we analyze it in order to optimize the placement and scheduling of ads across the advertising supply provided to us by developers. For example, we may use the collected information to limit the number of times a specific ad is presented to the same mobile device, to provide an ad to only certain types of mobile devices, or to provide a report to an advertiser client on the number of its ads that were clicked. We also compile the data derived from our platform to publish monthly reports of key mobile industry trends in the form of our S.M.A.R.T. and Mobile Mix reports, which we provide to advertisers and developers to enable them to improve their business decisions about mobile advertising or monetization strategies and to promote their use of our services.
Although the data we collect is not personally identifiable information, our clients might decide not to allow us to collect some or all of this data or might limit our use of this data. For example, app developers may not agree to provide us with the data generated by interactions with the content on their apps, or device users may not consent to having information about their device usage provided to the developer. Any limitation on our ability to collect data about user behavior and interaction with mobile device content could make it more difficult for us to deliver effective mobile advertising programs that meet the demands of our advertiser clients.
Although our contracts with advertisers generally permit us to aggregate data from advertising campaigns, these clients might nonetheless request that we discontinue using data obtained from their campaigns that have already been aggregated with other clients’ campaign data. It would be difficult, if not impossible, to comply with these requests, and responding to these kinds of requests could also cause us to spend significant amounts of resources. Interruptions, failures or defects in our data collection, mining, analysis and storage systems, as well as privacy concerns and regulatory restrictions regarding the collection of data, could also limit our ability to aggregate and analyze mobile device user data from our clients’ advertising campaigns. If that happens, we may not be able to optimize the placement of advertising for the benefit of our advertiser clients, which could make our services less valuable, and, as a result, we may lose clients and our revenue may decline.
Our business depends in part on our ability to collect and use location‑based information about mobile connected device users.
Our business model depends in part upon our ability to collect data about the location of mobile connected device users when they are interacting with their devices, and then to use that information to provide effective targeted advertising on behalf of our advertising clients. Our ability to either collect or use location‑based data could be restricted by a number of factors, including new laws or regulations, technology or consumer choice. Limitations on our ability to either collect or use location data could impact the effectiveness of our platform and our ability to target ads.
Our business practices with respect to data could give rise to liabilities or reputational harm as a result of governmental regulation, legal requirements or industry standards relating to consumer privacy and data protection.
In the course of providing our services, we collect, use, transmit and store information related to mobile devices and the ads we place, including a device’s geographic location for the purpose of delivering targeted location‑based ads to the device. Federal, state and international laws and regulations govern the collection, use, retention, sharing and security of data that we collect across our mobile advertising platform. We strive to comply with all applicable laws, regulations, policies and legal obligations relating to privacy and data protection. However, it is possible that these requirements may be interpreted and applied in a manner that is inconsistent from one jurisdiction to another and may conflict with other rules or our practices. Any failure, or perceived failure, by us to comply with U.S. federal or state laws or international laws, including laws and regulations regulating privacy, data security, or consumer protection, could result in proceedings or actions against us by governmental entities or others. We are aware of several ongoing lawsuits filed against companies in our industry alleging various violations of privacy‑related laws. Any such proceedings against us could hurt our reputation, force us to spend significant amounts in defense of these proceedings, distract our management, increase our
23
costs of doing business, adversely affect the demand for our services and ultimately result in the imposition of monetary liability or changes to our business practices. We may also be contractually liable to indemnify and hold harmless our clients from the costs or consequences of inadvertent or unauthorized disclosure of data that we store or handle as part of providing our services.
The regulatory framework for privacy issues worldwide is evolving, and various government and consumer agencies and public advocacy groups have called for new regulation and changes in industry practices, including some directed at the mobile industry in particular. For example, in January 2013, the State of California released a series of recommendations for privacy best practices for the mobile industry. In January 2014, a California law also became effective amending the required disclosures for online privacy policies. In January 2015, another California law went into effect limiting the types of advertised products that may be served on online properties directed to minors under 18. It is possible that new laws and regulations will be adopted in the United States and internationally, or existing laws and regulations may be interpreted in new ways, that would affect our business, particularly with regard to location‑based advertising services, collection or use of data to target ads, and communication with consumers via mobile devices.
The U.S. government, including the Federal Trade Commission, or FTC, and the Department of Commerce, may take steps that result in greater regulation of the collection of consumer information, including regulation aimed at restricting some targeted advertising practices. In December 2012, the FTC adopted revisions to the Children’s Online Privacy Protection Act, or COPPA, that went into effect on July 1, 2013. COPPA imposes a number of obligations on operators of websites and online services including mobile apps, such as obtaining parental consent, if the operator collects specified information from users and either the site or service is directed to children under 13 years old or the site or service knows that a specific user is a child under 13 years old. The changes broadened the applicability of COPPA, including the types of information that are subject to these regulations, and may apply to information that we or our clients collect through mobile devices or apps that, prior to the adoption of these new regulations, was not subject to COPPA. These revisions impose new compliance burdens on us. In February 2013, the FTC issued a staff report containing recommendations for best practices with respect to consumer privacy for the mobile industry. To the extent that we or our clients choose to adopt these recommendations, or other regulatory or industry requirements become applicable to us, we may have greater compliance burdens.
As we expand our operations globally, compliance with regulations that differ from country to country may also impose substantial burdens on our business. In particular, the European Union has traditionally taken a broader view as to what is considered personal information and has imposed greater obligations under data privacy regulations. In addition, individual EU member countries have had discretion with respect to their interpretation and implementation of the regulations, which has resulted in variation of privacy standards from country to country. In January 2012, the European Commission announced significant proposed reforms to its existing data protection legal framework, including changes in obligations of data controllers and processors, the rights of data subjects and data security, restrictions on profiling, and breach notification requirements. These changes are still going through the EU legislative process, with a view to being adopted at the end of 2015 at the earliest, with a two-year period after adoption before they would go into effect. The EU proposals, if finally adopted, may result in a greater compliance burden if we deliver ads to mobile device users in Europe. Complying with any new regulatory requirements could force us to incur substantial costs or require us to change our business practices in a manner that could compromise our ability to effectively pursue our growth strategy.
In addition to compliance with government regulations, we voluntarily participate in several trade associations and industry self‑regulatory groups that promulgate best practices or codes of conduct addressing the provision of location‑based services, delivery of promotional content to mobile devices, and tracking of device users or devices for the purpose of delivering targeted advertising. In 2013, the Digital Advertising Alliance, which administers Self-Regulatory Principles to which we adhere, issued guidance on the application of its Self-Regulatory Principles to the mobile environment. The Digital Advertising Alliance will announce an effective date for this mobile guidance. We could be adversely affected by this mobile guidance or by other changes to these guidelines and codes in ways that are inconsistent with our practices or in conflict with the laws and regulations of U.S. or international regulatory authorities. If we are perceived as not operating in accordance with industry best practices or any such guidelines or codes with regard to privacy, we may be the target of investigations or enforcement actions by government regulators or private lawsuits, our reputation may suffer and we could lose relationships with advertiser or developer partners.
24
Our business involves the use, transmission and storage of confidential information, and the failure to properly safeguard such information could result in significant reputational harm.
We may at times collect, store and transmit information of, or on behalf of, our clients that may include certain types of confidential information that may be considered personal or sensitive, and that are subject to laws that apply to data breaches. We believe that we take reasonable steps to protect the security, integrity and confidentiality of the information we collect and store, but there is no guarantee that inadvertent or unauthorized disclosure will not occur or that third parties will not gain unauthorized access to this information despite our efforts to protect this information, including through a cyber-attack that circumvents existing security measures and compromises the data that we store. If such unauthorized disclosure or access does occur, we may be required to notify persons whose information was disclosed or accessed. Most states have enacted data breach notification laws and, in addition to federal laws that apply to certain types of information, such as financial information, federal legislation has been proposed that would establish broader federal obligations with respect to data breaches. We may also be subject to claims of breach of contract for such unauthorized disclosure or access, investigation and penalties by regulatory authorities and potential claims by persons whose information was disclosed. The unauthorized disclosure of information, or a cyber-security incident involving data that we store, may result in the termination of one or more of our commercial relationships or a reduction in client confidence and usage of our services. We may also be subject to litigation alleging the improper use, transmission or storage of confidential information, which could damage our reputation among our current and potential clients and cause us to lose business and revenue.
Our quarterly operating results have fluctuated in the past and may do so in the future, which could cause our stock price to decline.
Our operating results have historically fluctuated and our future operating results may vary significantly from quarter to quarter due to a variety of factors, many of which are beyond our control. You should not rely on period‑to‑period comparisons of our operating results as an indication of our future performance. Factors that may affect our quarterly operating results include the following:
|
· |
seasonal patterns in the mix of brand and performance advertiser clients and in overall spending by mobile advertisers, which tend to be cyclical; |
|
· |
the addition of new advertisers or developers or the loss of existing advertisers or developers; |
|
· |
changes in demand for our mobile advertising services; |
|
· |
changes in the amount, price and quality of available advertising supply from developers; |
|
· |
the timing and amount of sales and marketing expenses incurred to attract new advertisers and developers; |
|
· |
changes in the economic prospects of advertisers or the economy generally, which could alter current or prospective advertisers’ spending priorities, or could increase the time it takes us to close sales with advertisers; |
|
· |
changes in our pricing policies, the pricing policies of our competitors or the pricing of mobile advertising generally; |
|
· |
changes in governmental regulation of the internet, wireless networks, mobile advertising or the collection of mobile device user data; |
|
· |
costs necessary to improve and maintain our technology platform; |
|
· |
timing differences at the end of each quarter between our payments to developers for advertising space and our collection of advertising revenue related to that space; |
25
|
· |
costs related to acquisitions of other businesses; and |
|
· |
impairments of goodwill or intangible assets. |
Our operating results may fall below the expectations of market analysts and investors in some future periods. If this happens, even just temporarily, the market price of our common stock may fall.
During 2014, we recognized a significant impairment charge related to our goodwill and intangible assets. We may be required to recognize additional such charges in the future, which could negatively affect our results or operations and financial condition.
Goodwill and intangible asset impairment analysis and measurement is a process that requires significant judgment. Our stock price and various other factors affect the assessment of the fair value of our underlying business for purposes of performing any goodwill and intangible asset impairment assessment. For example, our public market capitalization sustained a decline after June 30, 2014 to a value below the net book carrying value of our equity, triggering the need for a goodwill and intangible asset impairment analysis. As a result of our goodwill and intangible asset impairment analyses, we recorded goodwill and intangible asset impairment charges in the quarter ended September 30, 2014.
As of December 31, 2014, we had $172.7 million of remaining goodwill and intangible assets. This balance was net of the $93.5 million impairment we recorded in the quarter ended September 30, 2014 and included the $81.4 million of additional goodwill and intangible assets in the fourth quarter of 2014 we recorded in connection with our acquisition of Nexage. If our enterprise value continues to decline below our net asset value or if our financial condition deteriorates, we may recognize further impairment of our goodwill and intangible assets, which would result in charges that could adversely affect our results of operations and financial position.
Seasonal fluctuations in mobile advertising activity could adversely affect our cash flows.
Our cash flows from operations could vary from quarter to quarter due to the seasonal nature of our advertisers’ spending. For example, many advertisers devote the largest portion of their budgets to the fourth quarter of the calendar year, to coincide with increased holiday purchasing. To date, these seasonal effects have been masked by our rapid revenue growth. However, if and to the extent that seasonal fluctuations become more pronounced, our operating cash flows could fluctuate materially from period to period as a result.
We report revenue on a gross basis, but Nexage reports revenue on a net basis.
Our recognition of revenue is governed by specified criteria that must be met and that determine whether we report revenue on a gross basis, as a principal, or on a net basis, as an agent, depending upon the nature of the sales transaction. We currently recognize revenue on a gross basis, but Nexage recognized revenue on a net basis. We continue to recognize revenue from the portion of our business represented by Nexage through its supply side platform on a net basis. We will continue to evaluate future transactions in which we may engage and/or substantive changes in our business or accounting standards or interpretations as to whether we believe we are acting as the principal or agent in our relationships. This could lead to variations in our revenue and margins that do not necessarily correspond with changes in our underlying activity, may cause comparisons with prior periods to be less meaningful and may make it more difficult for investors to evaluate our performance.
We do not have long‑term agreements with our advertiser clients, and we may be unable to retain key clients, attract new clients or replace departing clients with clients that can provide comparable revenue to us.
Our success requires us to maintain and expand our current advertiser client relationships and to develop new relationships. Our contracts with our advertiser clients generally do not include long‑term obligations requiring them to purchase our services and are cancelable upon short or no notice and without penalty. As a result, we may have limited visibility as to our future advertising revenue streams. We cannot assure you that our advertiser clients will continue to use our services or that we will be able to replace, in a timely or effective manner, departing clients with new clients that
26
generate comparable revenue. If a major advertising client representing a significant portion of our business decides to materially reduce its use of our platform or to cease using our platform altogether, it is possible that we would not have a sufficient supply of ads to fill our developers’ advertising supply, in which case our revenue could be significantly reduced. Revenue derived from performance advertisers in particular is subject to fluctuation and competitive pressures. Such advertisers, which seek to drive app downloads, “clicks,” or specific actions by viewers, are less consistent with respect to their spending volume on our platform, and may decide to substantially increase or decrease their use of our platform based on seasonality or popularity of a particular app. Advertisers in general may shift their business to a competitor’s platform because of new or more compelling offerings, strategic relationships, technological developments, pricing and other financial considerations, or a variety of other reasons. Any non‑renewal, renegotiation, cancellation or deferral of large advertising contracts, or a number of contracts that in the aggregate account for a significant amount of revenue, could cause an immediate and significant decline in our revenue and harm our business.
Loss or reduction of business from our large advertiser clients could have a significant impact on our revenues, results of operations and overall financial condition.
From time to time, a limited number of our advertiser clients have accounted for, and may continue to account for, a significant share of our advertising revenue. This customer concentration increases the risk of quarterly fluctuations in our revenues and operating results. Our advertiser clients may reduce or terminate their business with us at any time for any reason, including changes in their financial condition or other business circumstances. If a large advertising client representing a substantial portion of our business decided to materially reduce or discontinue its use of our platform, it could cause an immediate and significant decline in our revenue and negatively affect our results of operations and financial condition.
Our customer concentration also increases the concentration of our accounts receivable and our exposure to payment defaults by key customers. We generate significant accounts receivable for the services that we provide to our key advertiser clients, which could expose us to substantial and potentially unrecoverable costs if we do not receive payment from them.
Our sales efforts with both advertisers and developers require significant time and expense.
Attracting new advertisers and developers requires substantial time and expense, and we may not be successful in establishing new relationships or in maintaining or advancing our current relationships. For example, it may be difficult to identify, engage and market to potential advertiser clients who do not currently spend on mobile advertising or are unfamiliar with our current services or platform. Furthermore, many of our clients’ purchasing and design decisions typically require input from multiple internal constituencies. As a result, we must identify those involved in the purchasing decision and devote a sufficient amount of time to presenting our services to each of those individuals.
The novelty of our services and our business model often requires us to spend substantial time and effort educating potential advertisers and developers about our offerings, including providing demonstrations and comparisons against other available services. This process can be costly and time‑consuming. If we are not successful in streamlining our sales processes with advertisers and developers, our ability to grow our business may be adversely affected.
If we do not achieve satisfactory results under performance‑based pricing models, we could lose clients and our revenue could decline.
We offer our services to advertisers based on a variety of pricing models, including CPM, CPA and CPC. Under performance‑driven CPA and CPC pricing models, from which we currently derive a significant portion of our revenue, advertisers only pay us if we provide the results they specify. These results‑based pricing models differ from fixed‑rate pricing models, like CPM, under which the fee is based on the number of times the ad is shown, without regard to its effectiveness. As a result, under our contracts with advertisers that provide for us to be paid on a CPC or CPA basis, we must be able to develop effective ad campaigns that result in the desired actions being taken by consumers. If we are not able to perform effectively under these arrangements, or have disagreements with clients over the measurement of deliverables, it could hurt our reputation with advertisers and developers and could cause our revenues to decline.
27
If we cannot increase the capacity of our mobile advertising technology platform to meet advertiser or device user demand, our business will be harmed.
We must be able to continue to increase the capacity of our technology platforms in order to support substantial increases in the number of advertisers and device users, to support an increasing variety of advertising formats and to maintain a stable service infrastructure and reliable service delivery for our mobile advertising campaigns. If we are unable to efficiently and effectively increase the scale of our mobile advertising platforms to support and manage a substantial increase in the number of advertisers and mobile device users, while also maintaining a high level of performance, the quality of our services could decline and our reputation and business could be seriously harmed. In addition, if we are not able to support emerging mobile advertising formats or services preferred by advertisers, we may be unable to obtain new advertising clients or may lose existing advertising clients, and in either case our revenue could decline.
If we fail to detect click fraud or other invalid clicks on ads, we could lose the confidence of our advertiser clients, which would cause our business to suffer.
Our business relies on delivering positive results to our advertiser clients. We are exposed to the risk of fraudulent and other invalid clicks or conversions that advertisers may perceive as undesirable. Because of their smaller sizes as compared to personal computers, mobile device usage could result in a higher rate of accidental or otherwise inadvertent clicks by a user. Invalid clicks could also result from click fraud, where a mobile device user intentionally clicks on ads for reasons other than to access the underlying content of the ads, or a computer program that generates automated clicks or views masquerading as clicks or views by a human. If fraudulent or other malicious activity is perpetrated by others, and we are unable to detect and prevent it, the affected advertisers may experience or perceive a reduced return on their investment. High levels of invalid click activity could lead to dissatisfaction with our advertising services, refusals to pay, refund demands or withdrawal of future business. We may also experience negative publicity or allegations relating to invalid traffic within our industry or on our network, which we may not be able to satisfactorily counter. Any of these occurrences could damage our brand and lead to a loss of advertisers and revenue.
System failures could significantly disrupt our operations and cause us to lose advertiser clients or advertising supply.
Our success depends on the continuing and uninterrupted performance of our own internal systems, which we utilize to place ads, monitor the performance of advertising campaigns and manage our supply of advertising space. Our revenue depends on the technological ability of our platforms to deliver ads and measure them on a CPM, CPC or CPA basis. Sustained or repeated system failures that interrupt our ability to provide services to clients, including technological failures affecting our ability to deliver ads quickly and accurately and to process mobile device users’ responses to ads, could significantly reduce the attractiveness of our services to advertisers and reduce our revenue. Our systems are vulnerable to damage from a variety of sources, including telecommunications failures, power outages, cyber-attacks or other malicious human acts and natural disasters. In addition, any steps we take to increase the reliability and redundancy of our systems may be expensive and may not ultimately be successful in preventing system failures. In many cases the delivery of our services may depend on the systems of third-party partners and vendors, such as the data centers where our servers are co-located, and any outages or disruptions in those systems could also have an adverse impact on our business.
Failure to adequately manage our growth may seriously harm our business.
We have experienced, and may continue to experience, significant growth in our business. If we do not effectively manage our growth, the quality of our services may suffer, which could negatively affect our reputation and demand for our services. Our growth has placed, and is expected to continue to place, a significant strain on our managerial, administrative, operational and financial resources and our infrastructure. Our future success will depend, in part, upon the ability of our senior management to manage growth effectively. This will require us to, among other things:
|
· |
implement additional management information systems; |
|
· |
further develop our operating, administrative, legal, financial and accounting systems and controls; |
|
· |
hire additional personnel; |
28
|
· |
develop additional levels of management within our company; |
|
· |
locate additional office space; |
|
· |
maintain close coordination among our engineering, operations, legal, finance, sales and marketing and client service and support organizations; and |
|
· |
manage our international operations. |
Moreover, as our sales increase, we may be required to concurrently deploy our services infrastructure at multiple additional locations or provide increased levels of customization. As a result, we may lack the resources to deploy our services on a timely and cost‑effective basis. Failure to accomplish any of these requirements could impair our ability to deliver our mobile advertising platform in a timely fashion, fulfill existing client commitments or attract and retain new clients.
Our international operations subject us to increased challenges and risks.
We have expanded our international operations over the last several years. However, we have a limited operating history as a company outside the United States, and our ability to manage our business and conduct our operations internationally requires considerable management attention and resources and is subject to the particular challenges of supporting a rapidly growing business in an environment of multiple cultures, customs, legal systems, alternative dispute systems, regulatory systems and commercial infrastructures. Managing our international operations will require us to invest significant funds and other resources. Operating internationally may subject us to new risks that we have not faced before or increase risks that we currently face, including risks associated with:
|
· |
recruiting and retaining talented and capable employees in foreign countries; |
|
· |
providing mobile advertising services among different cultures, including potentially modifying our platform and features to ensure that we deliver ads that are culturally relevant in different countries; |
|
· |
increased competition from local providers of mobile advertising services; |
|
· |
compliance with applicable foreign laws and regulations; |
|
· |
longer sales or collection cycles in some countries; |
|
· |
credit risk and higher levels of payment fraud; |
|
· |
compliance with anti‑bribery laws, such as the Foreign Corrupt Practices Act and the UK Anti‑Bribery Act; |
|
· |
currency exchange rate fluctuations; |
|
· |
foreign exchange controls that might prevent us from repatriating cash earned outside the United States; |
|
· |
economic instability in some countries, particularly those in Europe given our recent expansion in the United Kingdom; |
|
· |
political instability; |
|
· |
compliance with the laws of numerous taxing jurisdictions, both foreign and domestic, in which we conduct business, potential double taxation of our international earnings and potentially adverse tax consequences due to changes in applicable U.S. and foreign tax laws; |
29
|
· |
the complexity and potential adverse consequences of U.S. tax laws as they relate to our international operations; |
|
· |
increased costs to establish and maintain effective controls at foreign locations; and |
|
· |
overall higher costs of doing business internationally. |
If our revenue from our international operations, and particularly from our operations in the countries and regions on which we have focused our spending, do not exceed the expense of establishing and maintaining these operations, our business and operating results will suffer.
Changes in our executive team may not be successful, and our inability to hire or retain other key personnel would also slow our growth.
In 2014, our chief executive officer, our chief financial officer, and our executive vice president of global sales and operations each resigned from their respective positions. Our current chief executive officer, Michael Barrett, was appointed to that position in January 2014, and our current chief financial officer, Andrew Jeanneret, was appointed to that position in August 2014. Leadership transitions can be inherently difficult to manage and may cause uncertainty or a disruption to our business or may increase the likelihood of turnover in key officers and employees. The uncertainty inherent in our senior management transitions could lead to concerns from current and potential advertisers, developers and other third parties with whom we do business, any of which could hurt our business prospects. In addition, our future success will depend to a significant extent on the continued services of our chief executive officer, chief financial officer and our other executive officers and senior personnel. There can be no assurance that we will be able to retain their services. The loss of the services of one or more of these individuals could adversely affect our business and could divert other senior management time in searching for their replacements.
If we do not attract additional sales and technology talent, we may not be able to sustain our growth or achieve our business objectives.
Our future success depends on our ability to continue to attract, retain and motivate highly skilled employees, particularly employees with technical skills that enable us to deliver effective mobile advertising solutions and sales, and client support representatives with experience in mobile and other digital advertising and strong relationships with brand advertisers and app developers. Competition for these employees in our industry is intense. As a result, we may be unable to attract or retain these management, technical, sales and client support personnel that are critical to our success, resulting in harm to our key client relationships, loss of key information, expertise or know‑how and unanticipated recruitment and training costs. The loss of the services of our senior management or other key employees could make it more difficult to successfully operate our business and pursue our business goals.
Acquisitions or investments may be unsuccessful and may divert our management’s attention and consume significant resources.
A key part of our growth strategy is to pursue additional acquisitions or investments in other businesses or individual technologies. For example, we acquired Metaresolver, Inc., a mobile media buying and targeting platform, in April 2013, and we acquired Jumptap Inc., a competing mobile advertising company, in November 2013. Also, in December 2014, we completed our acquisition of Nexage, an advertising exchange and mobile supply side platform company. For more information about Nexage, see “—Risks Related to Our Acquisition of Nexage.” These and future acquisitions or investments may require us to use significant amounts of cash, issue potentially dilutive equity securities or incur debt. In addition, acquisitions involve numerous risks, any of which could disrupt or harm our business, including:
|
· |
difficulties in integrating the operations, technologies, services and personnel of acquired businesses, especially if those businesses operate outside of our core competency of delivering mobile advertising; |
|
· |
cultural challenges associated with integrating employees from the acquired company into our organization; |
30
|
· |
ineffectiveness or incompatibility of acquired technologies or services; |
|
· |
potential loss of key employees of acquired businesses; |
|
· |
inability to maintain the key business relationships and the reputations of acquired businesses; |
|
· |
diversion of management’s attention from other business concerns; |
|
· |
litigation related to activities of the acquired company, including claims by terminated employees, clients, former stockholders or other third parties; |
|
· |
in the case of foreign acquisitions, the need to integrate operations across different cultures and languages and to address the particular economic, currency, political and regulatory risks associated with specific countries; |
|
· |
costs necessary to establish and maintain effective internal controls for acquired businesses; |
|
· |
loss of key customers; |
|
· |
failure to successfully further develop the acquired technology in order to recoup our investment; and |
|
· |
increased fixed costs. |
The benefits of these and future acquisitions or investments may take considerable time to develop, and we cannot be certain that any particular acquisition or investment will produce its intended benefits, which could harm our business and operating results. Acquisitions may require us to use significant amounts of cash, issue potentially dilutive equity securities or incur debt, and may result in liabilities or expenses related to intangible assets or write-offs of goodwill or intangible assets.
Activities of our advertiser clients could damage our reputation or give rise to legal claims against us.
Our advertiser clients’ promotion of their products and services may not comply with federal, state and local laws, including, but not limited to, laws and regulations relating to mobile communications. Failure of our clients to comply with federal, state or local laws or our policies could damage our reputation and expose us to liability under these laws. We may also be liable to third parties for content in the ads we deliver if the artwork, text or other content involved violates copyrights, trademarks or other intellectual property rights of third parties or if the content is defamatory, unfair and deceptive, or otherwise in violation of applicable laws. Although we generally receive assurance from our advertisers that their ads are lawful and that they have the right to use any copyrights, trademarks or other intellectual property included in an ad, and although we are normally indemnified by the advertisers, a third party or regulatory authority may still file a claim against us. Any such claims could be costly and time‑consuming to defend and could also hurt our reputation. Further, if we are exposed to legal liability as a result of the activities of our advertiser clients, we could be required to pay substantial fines or penalties, redesign our business methods, discontinue some of our services or otherwise expend significant resources.
Our business depends on our ability to maintain the quality of our advertiser and developer content.
We must be able to ensure that our clients’ ads are not placed in developer content that is unlawful, harmful or inappropriate. Likewise, our developers rely upon us not to place ads in their apps that are unlawful, harmful or inappropriate. If we are unable to ensure that the quality of our advertiser and developer content does not decline as the number of advertisers and developers we work with continues to grow, then our reputation and business may suffer.
31
Our growth depends, in part, on the success of our strategic relationships with third parties.
We anticipate that we will continue to depend on various third-party relationships in order to provide our services, such as relationships with technology providers, advertising exchanges, market research companies, and other strategic partners. These third parties may not perform as expected under our agreements with them, and we may have disagreements or disputes with such third parties, which could negatively affect our business and reputation. As we seek additional relationships with third parties, the products and services they offer may not be available to us on reasonable or acceptable terms, or at all, or our competitors may be successful in negotiating exclusive or preferential arrangements with third parties that adversely affect the terms available to us, and our growth may suffer as a result.
Our inability to use software licensed from third parties, or our use of open source software under license terms that interfere with our proprietary rights, could disrupt our business.
Our technology platform incorporates software licensed from third parties, including some software, known as open source software, which we use without charge. Although we monitor our use of open source software, the terms of many open source licenses to which we are subject have not been interpreted by U.S. or foreign courts, and there is a risk that such licenses could be construed in a manner that imposes unanticipated conditions or restrictions on our ability to provide our platform to our clients. In the future, we could be required to seek licenses from third parties in order to continue offering our platform, which licenses may not be available on terms that are acceptable to us, or at all. Alternatively, we may need to re‑engineer our platform or discontinue use of portions of the functionality provided by our platform. In addition, the terms of open source software licenses may require us to provide software that we develop using such software to others on unfavorable license terms. Our inability to use third party software could result in disruptions to our business, or delays in the development of future offerings or enhancements of existing offerings, which could impair our business.
Software and components that we incorporate into our mobile advertising platform may contain errors or defects, which could harm our reputation and hurt our business.
We use a combination of custom and third party software, including open source software, in building our mobile advertising platform. Although we test software before incorporating it into our platform, we cannot guarantee that all of the third party technology that we incorporate will not contain errors, bugs or other defects. We continue to launch enhancements to our mobile advertising platform, and we cannot guarantee any such enhancements will be free from these kinds of defects. If errors or other defects occur in technology that we utilize in our mobile advertising platform, it could result in damage to our reputation and losses in revenue, and we could be required to spend significant amounts of additional resources to fix any problems.
Our failure to protect our intellectual property rights could diminish the value of our services, weaken our competitive position and reduce our revenue.
We regard the protection of our intellectual property, which includes trade secrets, patents, copyrights, trademarks, domain names and patent applications, as critical to our success. We strive to protect our intellectual property rights by relying on federal, state and common law rights, as well as contractual restrictions. We enter into confidentiality and invention assignment agreements with our employees and contractors, and confidentiality agreements with third parties with whom we conduct business in order to limit access to, and disclosure and use of, our intellectual property and proprietary information. However, these contractual arrangements and the other steps we have taken to protect our intellectual property may not prevent the misappropriation of our proprietary information or deter independent development of similar technologies by others.
We seek patent protection for certain of our technologies, but with respect to pending international and domestic patent applications, there can be no assurance that patents will ultimately issue. We are also pursuing the registration of our domain names, trademarks and service marks in the United States and in certain locations outside the United States. Effective trade secret, copyright, trademark, domain name and patent protection is expensive to develop and maintain, both in terms of initial and ongoing registration requirements and the costs of defending our rights. We may be required to protect our intellectual property in an increasing number of jurisdictions, a process that is expensive and may not be
32
successful or which we may not pursue in every location. We may, over time, increase our investment in protecting our intellectual property through additional patent filings that could be expensive and time‑consuming.
We have licensed in the past, and expect to license in the future, some of our proprietary rights, such as trademarks or copyrighted material, to third parties. These licensees may take actions that diminish the value of our proprietary rights or harm our reputation.
Monitoring unauthorized use of our intellectual property is difficult and costly. Our efforts to protect our proprietary rights may not be adequate to prevent misappropriation of our intellectual property. Further, we may not be able to detect unauthorized use of, or take appropriate steps to enforce, our intellectual property rights. Our competitors may also independently develop similar technology. In addition, the laws of many countries, such as China and India, do not protect our proprietary rights to as great an extent as do the laws of European countries and the United States. Further, the laws in the United States and elsewhere change rapidly, and any future changes could adversely affect us and our intellectual property. Our failure to meaningfully protect our intellectual property could result in competitors offering services that incorporate our most technologically advanced features, which could seriously reduce demand for our mobile advertising services. In addition, we may in the future need to initiate infringement claims or litigation. Litigation, whether we are a plaintiff or a defendant, can be expensive, time‑consuming and may divert the efforts of our technical staff and managerial personnel, which could harm our business, whether or not such litigation results in a determination that is unfavorable to us. In addition, litigation is inherently uncertain, and thus we may not be able to stop our competitors from infringing upon our intellectual property rights.
We operate in an industry with extensive intellectual property litigation. Claims of infringement against us may hurt our business.
Our success depends, in part, upon non‑infringement of intellectual property rights owned by others and being able to resolve claims of intellectual property infringement without major financial expenditures or adverse consequences. The mobile telecommunications industry generally is characterized by extensive intellectual property litigation. Although our technology is relatively new and our industry is rapidly evolving, many participants that own, or claim to own, intellectual property historically have aggressively asserted their rights. From time to time, we may be subject to legal proceedings and claims relating to the intellectual property rights of others, including currently pending proceedings related to alleged patent infringement, as described in Part I, Item 3. Legal Proceedings, below, and we expect that third parties will continue to assert intellectual property claims against us, particularly as we expand the complexity and scope of our business.
Future litigation may be necessary to defend ourselves or our clients by determining the scope, enforceability and validity of third party proprietary rights or to establish our proprietary rights. Some of our competitors have substantially greater resources than we do and are able to sustain the costs of complex intellectual property litigation to a greater degree and for longer periods of time than we could. In addition, patent holding companies that focus solely on extracting royalties and settlements by enforcing patent rights may target us. Regardless of whether claims that we are infringing patents or other intellectual property rights have any merit, these claims are time‑consuming and costly to evaluate and defend and could:
|
· |
adversely affect our relationships with our current or future clients; |
|
· |
cause delays or stoppages in providing our mobile advertising services; |
|
· |
divert management’s attention and resources; |
|
· |
require technology changes to our platform that would cause us to incur substantial cost; |
|
· |
subject us to significant liabilities; and |
|
· |
require us to cease some or all of our activities. |
33
In addition to liability for monetary damages against us, which may be tripled and may include attorneys’ fees, or, in some circumstances, damages against our clients, we may be prohibited from developing, commercializing or continuing to provide some or all of our mobile advertising solutions unless we obtain licenses from, and pay royalties to, the holders of the patents or other intellectual property rights, which may not be available on commercially favorable terms, or at all.
If we fail to maintain proper and effective internal controls, our ability to produce accurate financial statements on a timely basis could be impaired.
We are subject to the reporting requirements of the Securities Exchange Act of 1934, the Sarbanes‑Oxley Act of 2002, the Dodd‑Frank Wall Street Reform and Consumer Protection Act of 2010 and the rules and regulations of the New York Stock Exchange. The Sarbanes‑Oxley Act requires, among other things, that we maintain effective disclosure controls and procedures and internal controls over financial reporting and perform system and process evaluation and testing of our internal controls over financial reporting to allow management to report on the effectiveness of our internal controls over financial reporting. This requires that we incur substantial professional fees and internal costs related to our accounting and finance functions and that our management expend significant efforts.
We may in the future discover areas of our internal financial and accounting controls and procedures that need improvement. Our internal control over financial reporting will not prevent or detect all error and fraud. A control system, no matter how well designed and operated, can provide only reasonable, not absolute, assurance that the control system’s objectives will be met. Because of the inherent limitations in all control systems, no evaluation of controls can provide absolute assurance that misstatements due to error or fraud will not occur or that all control issues and instances of fraud will be detected.
If we are unable to maintain proper and effective internal controls in the future, we may not be able to produce timely and accurate financial statements, and we may conclude that our internal controls over financial reporting are not effective. If that were to happen, the market price of our stock could decline and we could be subject to sanctions or investigations by the New York Stock Exchange, the SEC or other regulatory authorities.
We are an “emerging growth company,” and if we decide to comply only with reduced disclosure requirements applicable to emerging growth companies, our common stock could be less attractive to investors.
We are an “emerging growth company,” as defined in the Jumpstart Our Business Startup Act, or JOBS Act, enacted in 2012, and, for as long as we continue to be an “emerging growth company,” we may choose to take advantage of exemptions from various reporting requirements applicable to other public companies including, but not limited to, not being required to comply with the auditor attestation requirements of Section 404 of the Sarbanes-Oxley Act of 2002, reduced disclosure obligations regarding executive compensation in our periodic reports and proxy statements, and exemptions from the requirements of holding a nonbinding advisory vote on executive compensation and shareholder approval of any golden parachute payments not previously approved. We complied with these reduced disclosure requirements in our proxy statement for the 2014 annual meeting of our stockholders and expect to do so for our 2015 proxy statement. We could be an “emerging growth company” through the year ending December 31, 2017, although a variety of circumstances could cause us to lose that status earlier. We cannot predict if investors will find our common stock less attractive if we choose to rely on these exemptions. If some investors find our common stock less attractive as a result of any choices to reduce future disclosure, there may be a less active trading market for our common stock and our stock price may be more volatile.
Under the JOBS Act, emerging growth companies that become public can delay adopting new or revised accounting standards until such time as those standards apply to private companies. We have irrevocably elected not to avail ourselves of this exemption from new or revised accounting standards and, therefore, we will be subject to the same new or revised accounting standards as other public companies that are not emerging growth companies.
34
We may need additional capital in the future to meet our financial obligations and to pursue our business objectives. Additional capital may not be available on favorable terms, or at all, which could compromise our ability to meet our financial obligations and grow our business.
We may need to raise additional capital to fund operations in the future or to finance acquisitions. If we seek to raise additional capital in order to meet various objectives, including developing future technologies and services, increasing working capital, acquiring businesses and responding to competitive pressures, capital may not be available on favorable terms or may not be available at all. In addition, pursuant to the terms of our credit facility, we may be restricted from using the net proceeds of financing transactions for our operating objectives. Lack of sufficient capital resources could significantly limit our ability to take advantage of business and strategic opportunities. Any additional capital raised through the sale of equity or debt securities with an equity component would dilute our stock ownership. If adequate additional funds are not available, we may be required to delay, reduce the scope of, or eliminate material parts of our business strategy, including potential additional acquisitions or development of new technologies.
Our credit facility subjects us to operating restrictions and financial covenants that impose risk of default and may restrict our business and financing activities.
On November 21, 2014, we entered into an amended and restated loan and security agreement with Silicon Valley Bank that provides a senior secured asset-based credit facility with up to $40 million available on a revolving basis until November 2018. At December 31, 2014, we had no amounts outstanding under this loan and security agreement. Borrowings under this agreement are secured by substantially all of our tangible and intangible assets. This credit facility is subject to certain financial covenants, as well as restrictions that limit, among other things, changes in control, indebtedness, investments, distributions on capital stock, mergers and acquisitions, payments of indebtedness, liens, transactions with affiliates, and dispositions of assets. These covenants may restrict our ability to finance our operations and to pursue our business activities and strategies. Our ability to comply with these covenants may be affected by events beyond our control. If a default were to occur and not be waived, such default could cause, among other remedies, all of the outstanding indebtedness under our loan and security agreement to become immediately due and payable, which could materially adversely affect our liquidity and ability to conduct our business.
Our net operating loss carryforwards may expire unutilized or underutilized, which could prevent us from offsetting future taxable income.
We may be limited in the portion of net operating loss carryforwards that we can use in the future to offset taxable income for U.S. federal income tax purposes. At December 31, 2014, we had federal net operating loss carryforwards of $225.0 million, which expire at various dates through 2034. Our gross state net operating loss carryforwards are equal to or less than the federal net operating loss carryforwards and expire over various periods based on individual state tax law.
We periodically assess the likelihood that we will be able to recover our net deferred tax assets. We consider all available evidence, both positive and negative, including historical levels of income, expectations and risks associated with estimates of future taxable income and ongoing prudent and feasible profits. As a result of this analysis of all available evidence, both positive and negative, we concluded that a valuation allowance against our net deferred tax assets should be applied as of December 31, 2014. To the extent we determine that all or a portion of our valuation allowance is no longer necessary, we will recognize an income tax benefit in the period such determination is made for the reversal of the valuation allowance. Once the valuation allowance is eliminated or reduced, its reversal will no longer be available to offset our current tax provision. These events could have a material impact on our reported results of operations.
Risks Related to Ownership of Our Common Stock
An active trading market for our common stock may not continue to develop or be sustained.
Prior to our initial public offering in March 2012, there was no public market for our common stock, and we cannot assure you that an active trading market for our shares will continue to develop or be sustained. If an active market for our common stock does not continue to develop or is not sustained, it may be difficult for investors in our common stock to sell shares without depressing the market price for the shares or to sell such shares at all.
35
The trading price of the shares of our common stock has been and is likely to continue to be volatile.
Since our initial public offering in March 2012, our stock price has exhibited significant volatility, ranging from a high of $27.90 per share to a low of $1.28 per share. The stock market in general and the market for technology companies in particular have experienced extreme volatility that has often been unrelated to the operating performance of particular companies. As a result of this volatility, investors may not be able to sell their common stock at or above the price paid for the shares. The market price for our common stock may be influenced by many factors, including:
|
· |
actual or anticipated variations in quarterly operating results; |
|
· |
changes in financial estimates by us or by any securities analysts who might cover our stock; |
|
· |
conditions or trends in our industry; |
|
· |
stock market price and volume fluctuations of other publicly traded companies and, in particular, those that operate in the advertising, internet or media industries; |
|
· |
announcements by us or our competitors of new product or service offerings, significant acquisitions, strategic partnerships or divestitures; |
|
· |
announcements of investigations or regulatory scrutiny of our operations or lawsuits filed against us; |
|
· |
capital commitments; |
|
· |
additions or departures of key personnel; and |
|
· |
sales of our common stock, including sales by our directors and officers or specific stockholders. |
In addition, in the past, stockholders have initiated class action lawsuits against technology companies following periods of volatility in the market prices of these companies’ stock. Such litigation could cause us to incur substantial costs and divert management’s attention and resources. In September and October 2014, two purported class action complaints were filed alleging violations of the federal securities laws against a group of defendants, including us and certain of our current and former executive officers and directors, among others, as described in Part I, Item 3. Legal Proceedings, below.
If securities or industry analysts do not publish research or publish unfavorable research about our business, our stock price and trading volume could decline.
The trading market for our common stock will rely in part on the research and reports that equity research analysts publish about us and our business. We have only limited research coverage by equity research analysts. Equity research analysts may elect not to initiate or to continue to provide research coverage of our common stock, and such lack of research coverage may adversely affect the market price of our common stock. Even if we do have equity research analyst coverage, we will not have any control over the analysts or the content and opinions included in their reports. The price of our stock could decline if one or more equity research analysts downgrade our stock or issue other unfavorable commentary or research. If one or more equity research analysts ceases coverage of our company or fails to publish reports on us regularly, demand for our stock could decrease, which in turn could cause our stock price or trading volume to decline.
We may fail to meet our publicly announced guidance or other expectations about our business and future operating results, which would cause our stock price to decline.
We have provided and may continue to provide guidance about our business and future operating results. In developing this guidance, our management must make certain assumptions and judgments about our future performance. Our industry is rapidly changing, and as we make acquisitions or adopt new business models to address customer requirements, our historical methods of forecasting may prove inadequate. Our business results may vary significantly
36
from our guidance due to a number of factors, many of which could adversely affect our operations and operating results. If our publicly announced guidance of future operating results fails to meet expectations of securities analysts, investors or other interested parties, the price of our common stock would likely decline, as it has in the past.
The issuance of additional stock in connection with financings, acquisitions, investments, our stock incentive plans or otherwise will dilute all other stockholders.
Our certificate of incorporation authorizes us to issue up to 250,000,000 shares of common stock and up to 5,000,000 shares of preferred stock with such rights and preferences as may be determined by our board of directors. Subject to compliance with applicable rules and regulations, we may issue our shares of common stock or securities convertible into our common stock from time to time in connection with a financing, acquisition, investment, our stock incentive plans or otherwise. For example, in connection with our acquisition of Nexage in December 2014, we issued a total of 30,733,436 shares of our common stock to the former securityholders of Nexage, and we also issued new options to purchase our common stock in exchange for options to purchase common stock of Nexage. These newly issued options are, in the aggregate, exercisable for an additional 7,949,236 shares of our common stock. The aggregate potential equity consideration of 38,682,672 shares, including shares issuable upon the exercise of options, represents approximately 26.4% of the total number of shares of our common stock following the closing of the Merger, but assuming the exercise of all new stock options issued in exchange for the prior Nexage options. Any similar issuances of our equity securities in the future could result in substantial dilution to our existing stockholders and cause the trading price of our common stock to decline.
Provisions in our corporate charter documents and under Delaware law may prevent or frustrate attempts by our stockholders to change our management and hinder efforts to acquire a controlling interest in us, and the market price of our common stock may be lower as a result.
There are provisions in our amended and restated certificate of incorporation and amended and restated bylaws that may make it difficult for a third party to acquire, or attempt to acquire, control of our company, even if a change in control was considered favorable by you and other stockholders. For example, our board of directors has the authority to issue up to 5,000,000 shares of preferred stock. The board of directors can fix the price, rights, preferences, privileges, and restrictions of the preferred stock without any further vote or action by our stockholders. The issuance of shares of preferred stock may delay or prevent a change in control transaction. As a result, the market price of our common stock and the voting and other rights of our stockholders may be adversely affected. An issuance of shares of preferred stock may result in the loss of voting control to other stockholders.
Our charter documents also contain other provisions that could have an anti‑takeover effect, including:
|
· |
only one of our three classes of directors is elected each year; |
|
· |
stockholders are not entitled to remove directors other than by a 66 2/3% vote and only for cause; |
|
· |
stockholders are not permitted to take actions by written consent; |
|
· |
stockholders cannot call a special meeting of stockholders; and |
|
· |
stockholders must give advance notice to nominate directors or submit proposals for consideration at stockholder meetings. |
In addition, we are subject to the anti‑takeover provisions of Section 203 of the Delaware General Corporation Law, which regulates corporate acquisitions by prohibiting Delaware corporations from engaging in specified business combinations with particular stockholders of those companies. These provisions could discourage potential acquisition proposals and could delay or prevent a change in control transaction. They could also have the effect of discouraging others from making tender offers for our common stock, including transactions that may be in your best interests. These provisions may also prevent changes in our management or limit the price that investors are willing to pay for our stock.
37
Our amended and restated certificate of incorporation also provides that the Court of Chancery of the State of Delaware will be the exclusive forum for substantially all disputes between us and our stockholders.
We do not anticipate paying any cash dividends on our common stock in the foreseeable future and our stock may not appreciate in value.
We have not declared or paid cash dividends on our common stock to date. We currently intend to retain our future earnings, if any, to fund the development and growth of our business. In addition, the terms of any existing or future debt agreements may preclude us from paying dividends. There is no guarantee that shares of our common stock will appreciate in value or that the price at which our stockholders have purchased their shares will be able to be maintained.
We will incur costs and demands upon management as a result of complying with the laws and regulations affecting public companies in the United States.
As a public company listed in the United States, changing laws, regulations and standards relating to corporate governance and public disclosure, including regulations implemented by the SEC and stock exchanges, may increase legal and financial compliance costs and make some activities more time consuming. These laws, regulations and standards are subject to varying interpretations and, as a result, their application in practice may evolve over time as new guidance is provided by regulatory and governing bodies. We intend to invest resources to comply with evolving laws, regulations and standards, and this investment may result in increased general and administrative expenses and a diversion of management’s time and attention from revenue‑generating activities to compliance activities. If, notwithstanding our efforts to comply with new laws, regulations and standards, we fail to comply, regulatory authorities may initiate legal proceedings against us and our business may be harmed.
Failure to comply with these rules might also make it more difficult for us to obtain some types of insurance, including director and officer liability insurance, and we might be forced to accept reduced policy limits and coverage or incur substantially higher costs to obtain the same or similar coverage. The impact of these events could also make it more difficult for us to attract and retain qualified persons to serve on our board of directors, on committees of our board of directors or as members of senior management.
Item 1B. Unresolved Staff Comments
None.
Our principal offices occupy approximately 96,000 square feet of leased office space in Baltimore, Maryland pursuant to a lease agreement that expires in September 2024. We also maintain offices in New York, New York; Boston, Massachusetts; Chicago, Illinois; Los Angeles, California; Detroit, Michigan; London, England; San Francisco, California; Atlanta, Georgia; Paris, France; Hamburg, Germany; Singapore and Tokyo, Japan. We believe that our current facilities are suitable and adequate to meet our current needs. We intend to add new facilities or expand existing facilities as we add employees, and we believe that suitable additional or substitute space will be available as needed to accommodate any such expansion of our operations.
Streetspace, Inc. v. Google, Inc. et al. On August 23, 2010, plaintiff Streetspace, Inc. filed a complaint in the U.S. District Court for the Southern District of California, alleging patent infringement against a group of defendants including us. The plaintiff alleged that each of the defendants has infringed, and continues to infringe, plaintiff’s patent. On September 12, 2011, the court granted the defendants’ motion to transfer the case to the U.S. District Court for the Northern District of California. On September 15, 2011, the defendants jointly filed a request to reexamine plaintiff’s claimed patent with the U.S. Patent and Trademark Office (the “PTO”). On November 18, 2011, the PTO granted the request, ordered a reexamination of the plaintiff’s patent, and rejected all of the plaintiff’s patent’s claims. The PTO entered an Action Closing Prosecution on June 4, 2012 rejecting all of the plaintiff’s patent’s claims of the patent‑in‑suit. The PTO
38
entered its final rejection of all claims, also known as Right of Appeal Notice, on May 10, 2013. The plaintiff filed its Notice of Appeal on June 10, 2013 and the defendants filed their Notice of Cross Appeal on June 24, 2013. The plaintiff filed its appeal brief and a petition requesting continued reexamination to enter a concurrently filed amendment on August 12, 2013. The defendants filed their response to the plaintiff’s appeal brief on September 12, 2013. The Patent Office dismissed the plaintiff’s Petition for Continued Reexamination on November 20, 2013. On January 29, 2014, the PTO rejected the plaintiff’s appeal brief as defective, and the plaintiff filed a corrected brief on February 28, 2014. In the cross-appeal, the defendants filed their cross-appeal brief on August 26, 2013, and plaintiff filed its response on September 26, 2013. The parties are awaiting the examiner’s Answer to the appeal briefing. The defendants also filed a motion to stay the case in the Northern District of California, pending the reexamination. The court granted the motion to stay in February 2012 and there has been no discovery in the litigation. The court has issued periodic orders continuing the stay of litigation pending re-examination, including the most recent order on January 28, 2015.
Evolutionary Intelligence, LLC. v. Millennial Media, Inc. On October 17, 2012, Evolutionary Intelligence, LLC filed a complaint against us in the U.S. District Court for the Eastern District of Texas. The plaintiff alleges that we are infringing U.S. Patent No. 7,010,536, entitled “System and Method for Creating and Manipulating Containers with Dynamic Registers” and U.S. Patent No. 7,702,682, entitled “System and Method for Creating and Manipulating Containers with Dynamic Registers.” The complaint seeks declaratory judgment, unspecified damages and injunctive relief. We answered the complaint on December 17, 2012. Among other things, we asserted defenses based non‑infringement and invalidity of the patents in question. We filed a motion to transfer venue to the Northern District of California on December 21, 2012 and the Eastern District of Texas granted the transfer motion on August 27, 2013. The case was opened in the Northern District of California on September 17, 2013. On January 31, 2014, we filed a motion to stay the proceedings, based on several requests for inter partes review (“IPR”) of the patents-in-suit pending before the PTO. On April 25 and 28, 2014, the PTO denied all but one of the IPR requests, and instituted one IPR for one of the patents-in-suit. We were not a party to the IPR requests and are not a party to the pending IPR. On June 11, 2014, the court conditionally granted our motion to stay, contingent on our agreement to be bound by the same estoppel that limits IPR petitioners as set forth in 35 U.S.C. § 315(e). On June 20, 2014, we requested leave of court to seek reconsideration of the court’s order as to the scope of the proposed estoppel. Plaintiff filed an opposition to our request on June 30, 2014, and our request is pending. On July 11, 2014, after briefing and a hearing, the court related the nine co-pending Evolutionary Intelligence cases and assigned them to the same judge. After further briefing on whether the stays should be lifted in light of the denial of all but one of the IPR requests, the court held a hearing on September 19, 2014, and stayed the cases pending the final decision on the IPR. Along with other non-petitioning defendants, we agreed to be bound by a limited estoppel in return for the stay.
Public Employees’ Retirement System of Mississippi v. Millennial Media, Inc. et al. and Travis Ostroviak v. Millennial Media, Inc., et al. On September 30, 2014, plaintiff Public Employees’ Retirement System of Mississippi filed a purported class action complaint in the U.S. District Court for the Southern District of New York, alleging violations of the federal securities laws against a group of defendants including us, certain of our current and former executive officers, directors, and large shareholders, and the underwriters associated with our initial public offering and secondary offering. Plaintiff alleges, among other things, that certain defendants engaged in a fraudulent scheme to artificially inflate the price of our common stock by making false and misleading statements to investors. On October 17, 2014, plaintiff Travis Ostroviak also filed a purported class action complaint in the U.S. District Court for the Southern District of New York, in which Plaintiff makes certain of the same allegations made in the action brought by Public Employees’ Retirement System of Mississippi. The complaint names us and certain of our current and former executive officers and directors as defendants. On February 10, 2015, the Court consolidated these two purported class actions. On February 17, 2015, the Court ordered that a consolidated amended complaint be filed in the actions by March 20, 2015, and that Defendants file any motion to dismiss the complaint by April 17, 2015. We are currently evaluating the claims asserted in these two matters.
Stephen Posko v. Palmieri et al. On January 16, 2015, plaintiff Stephen Posko filed a shareholder derivative complaint in the U.S. District Court for the Southern District of New York. The complaint purports to assert claims derivatively on our behalf against certain of our current and former officers and executives for breach of fiduciary duty, waste, unjust enrichment, and violations of the federal securities laws. The allegations and claims set forth in the complaint are related to the allegations and claims in Public Employees’ Retirement System of Mississippi v. Millennial Media, Inc. et al. and Travis Ostroviak v. Millennial Media, Inc., et al. (the “Securities Class Actions”). The parties in the shareholder
39
derivative action have agreed to seek a stay of the action pending the Court’s ruling on any motion to dismiss filed by Defendants in the Securities Class Actions. We are currently evaluating the claims asserted in this matter.
Item 4. Mine Safety Disclosures
Not applicable.
Item 5. Market for Registrant’s Common Equity, Related Stockholder Matters and Issuer Purchases of Equity Securities
Our common stock has been listed on the New York Stock Exchange, or the NYSE, since March 29, 2012, under the symbol “MM”. Prior to our initial public offering, or IPO, there was no public market for our common stock.
The following tables set forth for the indicated periods the high and low sales prices of our common stock as reported on the NYSE.
|
|
|
|
|
|
|
|
|
|
|
|
|
|
|
|
|
2014 |
||||||||||
|
|
|
First Quarter |
|
Second Quarter |
|
Third Quarter |
|
Fourth Quarter |
||||
|
High |
|
$ |
8.44 |
|
$ |
7.14 |
|
$ |
5.00 |
|
$ |
2.11 |
|
Low |
|
|
5.81 |
|
|
2.90 |
|
|
1.66 |
|
|
1.46 |
|
|
|
|
|
|
|
|
|
|
|
|
|
|
|
|
|
2013 |
||||||||||
|
|
|
First Quarter |
|
Second Quarter |
|
Third Quarter |
|
Fourth Quarter |
||||
|
High |
|
$ |
14.66 |
|
$ |
8.95 |
|
$ |
10.48 |
|
$ |
7.48 |
|
Low |
|
|
6.26 |
|
|
5.87 |
|
|
6.36 |
|
|
5.78 |
As of February 20, 2015, there were 130 registered stockholders of record for our common stock. The actual number of stockholders is greater than this number of record holders and includes stockholders who are beneficial owners but whose shares are held in street name by brokers and other nominees. This number of holders of record also does not include stockholders whose shares may be held in trust by other entities.
We have never declared or paid any dividends on our common stock. We anticipate that we will retain all of our future earnings, if any, for use in the operation and expansion of our business and do not anticipate paying cash dividends in the foreseeable future. Additionally, our ability to pay dividends on our common stock is limited by restrictions under the terms of the agreements governing our credit facility.
Stock Performance Graph
The graph set forth below compares the cumulative total stockholder return on an initial investment of $100 in our common stock between March 29, 2012 (the date of our IPO) and December 31, 2014, with the comparative cumulative total return of such amount on (i) the NYSE Composite Index, (ii) Global X Social Media Index ETF, and (iii) SPDR Morgan Stanley Technology Fund ETF over the same period. We have not paid any cash dividends and, therefore, the cumulative total return calculation for us is based solely upon stock price appreciation (depreciation) and not upon reinvestment of cash dividends. The graph assumes our closing sales price on March 29, 2012 of $25.00 per share as the initial value of our common stock.
40
The comparisons shown in the graph below are based upon historical data. We caution that the stock price performance shown in the graph below is not necessarily indicative of, nor is it intended to forecast, the potential future performance of our common stock.
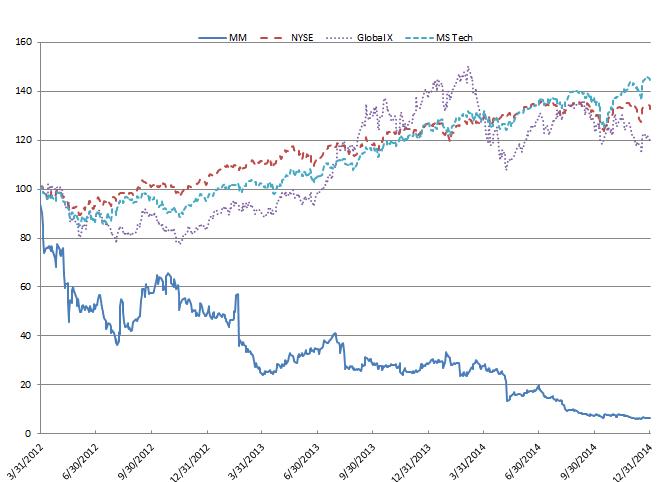
The information presented above in the stock performance graph shall not be deemed to be “soliciting material” or to be “filed” with the SEC or subject to Regulation 14A or 14C, except to the extent that we subsequently specifically request that such information be treated as soliciting material or specifically incorporate it by reference into a filing under the Securities Act of 1933, as amended, or a filing under the Securities Exchange Act of 1934, as amended.
Item 6. Selected Consolidated Financial Data
The following selected consolidated financial data as of and for the years ended December 31, 2014, 2013, 2012, 2011, and 2010 is derived from our audited consolidated financial statements, which have been audited by Ernst & Young LLP, independent registered public accounting firm. Our historical results are not necessarily indicative of the results to be expected in the future. The selected consolidated financial data should be read together with “Item 7.
41
Management’s Discussion and Analysis of Financial Condition and Results of Operations” and in conjunction with the consolidated financial statements, related notes, and other financial information included elsewhere in this Annual Report.
|
|
|
|
|
|
|
|
|
|
|
|
|
|
|
|
|
|
|
|
Year Ended December 31, |
|||||||||||||
|
|
|
2014 |
|
2013 |
|
2012 |
|
2011 |
|
2010 |
|||||
|
|
|
(in thousands, except per share data) |
|||||||||||||
|
Consolidated Statement of Operations Data: |
|
|
|
|
|
|
|
|
|
|
|
|
|
|
|
|
Revenue |
|
$ |
296,164 |
|
$ |
259,171 |
|
$ |
177,667 |
|
$ |
103,678 |
|
$ |
47,828 |
|
Cost of revenue |
|
|
179,758 |
|
|
154,774 |
|
|
105,739 |
|
|
63,595 |
|
|
31,602 |
|
Gross profit |
|
|
116,406 |
|
|
104,397 |
|
|
71,928 |
|
|
40,083 |
|
|
16,226 |
|
Operating expenses: |
|
|
|
|
|
|
|
|
|
|
|
|
|
|
|
|
Sales and marketing |
|
|
53,621 |
|
|
38,682 |
|
|
23,816 |
|
|
14,255 |
|
|
8,508 |
|
Technology and development |
|
|
29,468 |
|
|
18,966 |
|
|
13,620 |
|
|
5,181 |
|
|
2,175 |
|
General and administrative |
|
|
88,588 |
|
|
61,891 |
|
|
38,954 |
|
|
21,321 |
|
|
12,535 |
|
Goodwill and intangible asset impairment |
|
|
93,479 |
|
|
- |
|
|
- |
|
|
- |
|
|
- |
|
Total operating expenses |
|
|
265,156 |
|
|
119,539 |
|
|
76,390 |
|
|
40,757 |
|
|
23,218 |
|
Loss from operations |
|
|
(148,750) |
|
|
(15,142) |
|
|
(4,462) |
|
|
(674) |
|
|
(6,992) |
|
Other expense, net |
|
|
(145) |
|
|
(18) |
|
|
(898) |
|
|
(99) |
|
|
(107) |
|
Loss before income taxes |
|
|
(148,895) |
|
|
(15,160) |
|
|
(5,360) |
|
|
(773) |
|
|
(7,099) |
|
Income tax benefit (expense) |
|
|
(192) |
|
|
47 |
|
|
(70) |
|
|
486 |
|
|
(22) |
|
Net loss |
|
|
(149,087) |
|
|
(15,113) |
|
|
(5,430) |
|
|
(287) |
|
|
(7,121) |
|
Accretion of dividends on redeemable convertible preferred stock |
|
|
- |
|
|
- |
|
|
(1,328) |
|
|
(5,022) |
|
|
(2,933) |
|
Net loss attributable to common stockholders |
|
$ |
(149,087) |
|
$ |
(15,113) |
|
$ |
(6,758) |
|
$ |
(5,309) |
|
$ |
(10,054) |
|
Net loss per share attributable to common stockholders—basic and diluted |
|
$ |
(1.36) |
|
$ |
(0.18) |
|
$ |
(0.11) |
|
$ |
(0.32) |
|
$ |
(0.56) |
|
Weighted average shares of common stock outstanding used in computing net loss per share attributable to common stockholders |
|
|
109,613 |
|
|
84,029 |
|
|
60,951 |
|
|
16,363 |
|
|
17,966 |
|
Other Financial Data: |
|
|
|
|
|
|
|
|
|
|
|
|
|
|
|
|
Adjusted EBITDA(1) |
|
$ |
(19,424) |
|
$ |
8,961 |
|
$ |
4,543 |
|
$ |
1,839 |
|
$ |
(6,436) |
|
(1) |
We define adjusted EBITDA as earnings/(losses) before interest, income taxes, depreciation and amortization, adjusted to eliminate goodwill and intangible asset impairment charges, non‑cash stock‑based compensation expense and expenses related to acquisitions, such as costs for services of lawyers, investment bankers, accountants, and other third parties and acquisition related severance costs, bonuses, retention bonuses and accrual of retention payments that represent contingent compensation to be recognized as expense over a requisite service period. Please see “Management’s Discussion and Analysis of Financial Condition and Results of Operations—Key Operating and Financial Performance Metrics” for more information and for a reconciliation of adjusted EBITDA to net loss, the most directly comparable financial measure calculated and presented in accordance with United States generally accepted accounting principles, or GAAP. |
42
|
|
|
|
|
|
|
|
|
|
|
|
|
|
|
|
|
|
|
|
As of December 31, |
|||||||||||||
|
|
|
2014 |
|
2013 |
|
2012 |
|
2011 |
|
2010 |
|||||
|
|
|
(in thousands) |
|||||||||||||
|
Consolidated Balance Sheet Data: |
|
|
|
|
|
|
|
|
|
|
|
|
|
|
|
|
Cash and cash equivalents |
|
$ |
49,463 |
|
$ |
99,237 |
|
$ |
137,439 |
|
$ |
16,707 |
|
$ |
27,803 |
|
Accounts receivable, net of allowances |
|
|
101,348 |
|
|
109,056 |
|
|
59,179 |
|
|
34,986 |
|
|
19,978 |
|
Total assets |
|
|
357,640 |
|
|
419,604 |
|
|
208,449 |
|
|
61,885 |
|
|
49,115 |
|
Total liabilities |
|
|
99,000 |
|
|
84,134 |
|
|
44,668 |
|
|
29,638 |
|
|
17,807 |
|
Total redeemable convertible preferred stock |
|
|
- |
|
|
- |
|
|
- |
|
|
76,668 |
|
|
71,622 |
|
Total stockholders’ equity (deficit) |
|
|
258,640 |
|
|
335,470 |
|
|
163,781 |
|
|
(44,421) |
|
|
(40,314) |
Adjusted EBITDA
The following table presents a reconciliation of adjusted EBITDA to net loss, the most directly comparable financial measure calculated and presented in accordance with United States generally accepted accounting principles, or GAAP, for each of the periods indicated. Please see “Management’s Discussion and Analysis of Financial Condition and Results of Operations—Key Operating and Financial Performance Metrics” for more information regarding our use of adjusted EBITDA.
|
|
|
|
|
|
|
|
|
|
|
|
|
|
|
|
|
|
|
|
Year Ended December 31, |
|||||||||||||
|
|
|
2014 |
|
2013 |
|
2012 |
|
2011 |
|
2010 |
|||||
|
|
|
(in thousands) |
|||||||||||||
|
Net loss |
|
$ |
(149,087) |
|
$ |
(15,113) |
|
$ |
(5,430) |
|
$ |
(287) |
|
$ |
(7,121) |
|
Adjustments: |
|
|
|
|
|
|
|
|
|
|
|
|
|
|
|
|
Interest expense, net |
|
|
145 |
|
|
95 |
|
|
64 |
|
|
21 |
|
|
28 |
|
Income tax (benefit) expense |
|
|
192 |
|
|
(47) |
|
|
70 |
|
|
(486) |
|
|
22 |
|
Goodwill and intangible asset impairment |
|
|
93,479 |
|
|
- |
|
|
- |
|
|
- |
|
|
- |
|
Depreciation and amortization expense |
|
|
16,733 |
|
|
5,913 |
|
|
2,365 |
|
|
759 |
|
|
223 |
|
Acquisition-related costs |
|
|
5,282 |
|
|
8,410 |
|
|
- |
|
|
- |
|
|
- |
|
Deferred compensation |
|
|
250 |
|
|
750 |
|
|
- |
|
|
- |
|
|
- |
|
Stock-based compensation expense |
|
|
13,582 |
|
|
8,953 |
|
|
7,474 |
|
|
1,832 |
|
|
412 |
|
Total net adjustments |
|
|
129,663 |
|
|
24,074 |
|
|
9,973 |
|
|
2,126 |
|
|
685 |
|
Adjusted EBITDA |
|
$ |
(19,424) |
|
$ |
8,961 |
|
$ |
4,543 |
|
$ |
1,839 |
|
$ |
(6,436) |
43
Item 7. Management’s Discussion and Analysis of Financial Condition and Results of Operations
You should read the following discussion and analysis of our financial condition and results of operations in conjunction with the consolidated financial statements and the related notes to those statements included later in this Annual Report. In addition to historical financial information, the following discussion contains forward‑looking statements that reflect our plans, estimates, beliefs and expectations that involve risks and uncertainties. Our actual results and the timing of events could differ materially from those discussed in these forward‑looking statements. Factors that could cause or contribute to these differences include those discussed below and elsewhere in this Annual Report, particularly in “Item 1A. Risk Factors” and “Special Note Regarding Forward‑Looking Statements.”
Overview
We are an independent mobile advertising company delivering products and services to advertisers and developers. Our technology, tools and services help developers maximize their advertising revenue, acquire users for their apps and gain insight about their users. To advertisers, we offer the ability to reach more than 650 million monthly unique users, including over 175 million monthly unique users in the United States alone. We also offer advertisers sophisticated targeting capabilities and the opportunity to deliver interactive and engaging ad experiences to consumers on their smartphones, tablets, other mobile connected devices and PCs. Approximately 60,000 apps are enabled to receive ads through our platform, and we can deliver ads on over 9,000 different mobile device types and models. We have developed more than 700 million proprietary, anonymous user profiles that we can use to more accurately and efficiently target ads. Our platform is compatible with all major mobile operating systems, including Apple® iOS, Android™, Windows Phone and BlackBerry®.
We help developers and advertisers remove complexity from mobile advertising. By working with us, developers gain access to our tools and services that allow their apps to display video ads, banner ads, interactive rich media ads and native ad formats from our platform. In return, developers supply us with space on their apps to deliver ads for our advertiser clients and also provide us with access to anonymous data associated with their apps and users. We analyze this data to build sophisticated user profiles and audience groups that, in combination with the real‑time decisioning, optimization and targeting capabilities of our technology platform, enable us to deliver highly targeted advertising campaigns for our advertiser clients. Advertisers pay us to deliver ad campaigns to mobile connected device users, and we pay developers a fee for the use of their ad space. As we deliver more ad campaigns, we are able to collect additional anonymous data about users, audiences and the effectiveness of particular ad campaigns, which in turn enhances our targeting capabilities and allows us to deliver better performance for advertisers and better opportunities for developers to increase their revenue streams.
We have built relationships with advertisers and developers of all sizes. Our advertiser clients include leading advertising agencies and brands, including 95 of Ad Age’s top 100 national advertisers, as well as smaller advertisers and often the developers themselves. Our developer base includes large mobile web publishers, large app developers and other developers. Advertisers and developers are able to access our platform through our full‑service offering and through self‑service interfaces. We offer programmatic buying capabilities to advertisers through our ad exchange and through our demand side platform, mmDSP.
We operate in one segment, mobile advertising services. We have increased our revenue from $47.8 million for the year ended December 31, 2010 to $296.2 million for the year ended December 31, 2014. During the year ended December 31, 2014, 16.2% of our revenue was derived from outside of the United States. We have international operations in Europe and Asia. We offer the same services internationally as we do in the United States, and we intend to continue to pursue a strategy of expanding our international operations.
On December 4, 2014, we acquired Nexage, Inc., an advertising exchange and mobile supply side platform and provider of real-time-bidding technology that helps to automate the buying and selling of mobile advertising. While Nexage’s results were not material to our operations in 2014, we believe that Nexage's business is complementary to our existing suite of mobile advertising services and products, and that the combination of our two companies will allow us to offer our customers a “full-stack” mobile-advertising solution and an independent mobile programmatic marketplace with improved buy and sell-side capabilities. In addition to providing managed services for agencies and marketers, we believe
44
the combined company will be able to offer a more complete set of automated mobile programmatic solutions to advertisers and developers, and will be able to more effectively compete in our fast-paced, consolidating industry. We believe the addition of Nexage’s capabilities provides us with a unique opportunity to achieve one of our key strategic objectives to be a market leader in mobile advertising solutions.
The acquisition of Nexage contributed $1.4 million to revenue and $2.1 million to operating expenses in the fourth quarter of 2014.
Key Operating and Financial Performance Metrics
We monitor the key operating and financial performance metrics set forth in the table below to help us evaluate growth trends, establish budgets, measure the effectiveness of our sales and marketing efforts and assess our operational efficiencies.
|
Year Ended December 31, |
||||||||||
|
2014 |
2013 |
2012 |
||||||||
|
(in thousands, except percentages and |
||||||||||
|
per share amounts) |
||||||||||
|
Revenue |
$ |
296,164 |
$ |
259,171 |
$ |
177,667 | ||||
|
Gross margin |
39.3 |
% |
40.3 |
% |
40.5 |
% |
||||
|
Net loss |
$ |
(149,087) |
$ |
(15,113) |
$ |
(5,430) | ||||
|
Adjusted EBITDA |
$ |
(19,424) |
$ |
8,961 |
$ |
4,543 | ||||
|
Basic and diluted net loss per share |
$ |
(1.36) |
$ |
(0.18) |
$ |
(0.11) | ||||
|
Diluted non-GAAP net (loss) income per share |
$ |
(0.18) |
$ |
0.10 |
$ |
0.07 | ||||
Gross margin is our gross profit, or revenue less cost of revenue, expressed as a percentage of our total revenue. Our gross margin has been and will continue to be primarily affected by our pricing terms with new and existing developers, as well as the mix of offerings used by our clients. Some of our offerings, such as our ad exchange, typically generate lower gross margins for us than other portions of our business, such as our network business.
Adjusted EBITDA represents our earnings/(losses) before interest, income taxes, depreciation and amortization, adjusted to eliminate goodwill and intangible asset impairment charges, non‑cash stock‑based compensation expense and expenses related to acquisitions, such as costs for services of lawyers, investment bankers, accountants, and other third parties and acquisition related severance costs, bonuses, retention bonuses and accrual of retention payments that represent contingent compensation to be recognized as expense over a requisite service period. We do not consider the inclusion of these costs to be indicative of our core operating performance. Adjusted EBITDA is a key measure used by our management and board of directors to understand and evaluate our core operating performance and trends, to prepare and approve our annual budget and to develop short‑ and long‑term operational plans. In particular, we believe that the exclusion of the expenses eliminated in calculating adjusted EBITDA can provide a useful measure for period‑to‑period comparisons of our core business. Additionally, adjusted EBITDA is a key financial measure used by the compensation committee of our board of directors in connection with the development of incentive‑based compensation for our executive officers. Accordingly, we believe that adjusted EBITDA provides useful information to investors and others in understanding and evaluating our operating results in the same manner as our management and board of directors.
Diluted non‑GAAP net income per share is calculated as adjusted EBITDA divided by the diluted weighted average number of shares outstanding during the period.
Adjusted EBITDA and diluted non‑GAAP net income per share are not measures calculated in accordance with U.S. generally accepted accounting principles, or GAAP, and should not be considered as an alternative to any measure of financial performance calculated and presented in accordance with GAAP. In addition, these non‑GAAP measures may not be comparable to similarly titled measures of other companies because other companies may not calculate them in the same manner that we do.
45
These non‑GAAP measures have limitations as an analytical tool, and you should not consider them in isolation or as substitutes for analysis of our financial results as reported under GAAP. Some of these limitations are:
|
· |
although depreciation and amortization are non‑cash charges, the assets being depreciated and amortized may have to be replaced in the future, and adjusted EBITDA and diluted non‑GAAP net income (loss) per share do not reflect cash capital expenditure requirements for such replacements or for new capital expenditure requirements; |
|
· |
adjusted EBITDA and diluted non‑GAAP net income per share do not reflect changes in, or cash requirements for, our working capital needs; |
|
· |
adjusted EBITDA does not reflect the potentially dilutive impact of equity‑based compensation; |
|
· |
adjusted EBITDA and diluted non‑GAAP net income per share do not reflect tax payments that may represent a reduction in cash available to us; and |
|
· |
other companies, including companies in our industry, may calculate adjusted EBITDA or similarly titled measures differently, which reduces its usefulness as a comparative measure. |
Because of these and other limitations, you should consider adjusted EBITDA and diluted non‑GAAP net income (loss) per share alongside other GAAP‑based financial performance measures, including various cash flow metrics, net income (loss) and our other GAAP financial results. The following tables present reconciliations of net loss to adjusted EBITDA for each of the periods indicated:
|
|
|
|
|
|
|
|
|
|
|
|
|
|
Year Ended December 31, |
|||||||
|
|
|
2014 |
|
2013 |
|
2012 |
|||
|
|
|
(in thousands) |
|||||||
|
Net loss |
|
$ |
(149,087) |
|
$ |
(15,113) |
|
$ |
(5,430) |
|
Adjustments: |
|
|
|
|
|
|
|
|
|
|
Interest expense, net |
|
|
145 |
|
|
95 |
|
|
64 |
|
Income tax (benefit) expense |
|
|
192 |
|
|
(47) |
|
|
70 |
|
Goodwill and intangible asset impairment |
|
|
93,479 |
|
|
- |
|
|
- |
|
Depreciation and amortization expense |
|
|
16,733 |
|
|
5,913 |
|
|
2,365 |
|
Acquisition-related costs |
|
|
5,282 |
|
|
8,410 |
|
|
- |
|
Deferred compensation |
|
|
250 |
|
|
750 |
|
|
- |
|
Stock-based compensation expense |
|
|
13,582 |
|
|
8,953 |
|
|
7,474 |
|
Total net adjustments |
|
|
129,663 |
|
|
24,074 |
|
|
9,973 |
|
Adjusted EBITDA |
|
$ |
(19,424) |
|
$ |
8,961 |
|
$ |
4,543 |
46
The following tables present reconciliations of GAAP net loss per share to diluted non‑GAAP net income (loss) per share for each of the periods indicated:
|
|
|
|
|
|
|
|
|
|
|
|
|
|
Year Ended December 31, |
|||||||
|
|
|
2014 |
|
2013 |
|
2012 |
|||
|
Net loss per share |
|
$ |
(1.36) |
|
$ |
(0.18) |
|
$ |
(0.11) |
|
Adjustments: |
|
|
|
|
|
|
|
|
|
|
Accretion of dividends on preferred |
|
|
- |
|
|
- |
|
|
0.02 |
|
Interest expense, net |
|
|
0.00 |
|
|
0.00 |
|
|
0.00 |
|
Income tax benefit (expense) |
|
|
0.00 |
|
|
0.00 |
|
|
0.00 |
|
Goodwill and intangible asset impairment |
|
|
0.86 |
|
|
- |
|
|
- |
|
Depreciation and amortization expense |
|
|
0.15 |
|
|
0.07 |
|
|
0.04 |
|
Acquisition-related costs |
|
|
0.05 |
|
|
0.10 |
|
|
- |
|
Deferred compensation |
|
|
0.00 |
|
|
0.01 |
|
|
- |
|
Stock-based compensation expense |
|
|
0.12 |
|
|
0.10 |
|
|
0.12 |
|
Total net adjustments |
|
|
1.18 |
|
|
0.28 |
|
|
0.18 |
|
Diluted non-GAAP net income (loss) per share |
|
$ |
(0.18) |
|
$ |
0.10 |
|
$ |
0.07 |
|
Diluted weighted average common shares outstanding (in thousands) |
|
|
109,613 |
|
|
87,172 |
|
|
67,215 |
Components of Operating Results
Revenue
We generate revenue by charging advertisers to deliver campaigns to users of mobile connected devices. Depending on the specific terms of each advertising contract, we generally recognize revenue based on the activity of mobile users viewing these ads. Our fees from advertisers are commonly based on the number of ads delivered, views, clicks or actions by users on mobile advertisements we deliver, and we recognize revenue at the time the user views, clicks or otherwise acts on the ad. We sell campaigns on several bases: cost per thousand impressions, or CPM, on which we charge advertisers for each ad delivered to a consumer; cost per click, or CPC, on which we charge advertisers for each ad clicked on by a user; and cost per action, or CPA, on which we charge advertisers each time a consumer takes a specified action, such as downloading an app. Our revenue recognition policies are discussed in more detail in the section below entitled “—Critical Accounting Policies and Significant Judgments and Estimates.”
We classify our advertiser clients as “brand” advertisers or “performance” advertisers, depending on the intent of the advertiser. We believe this classification is typical in the advertising and media industries. The goal of a brand advertiser, such as a large automobile manufacturer, is primarily to promote recognition and awareness of its brand among potential consumers and to induce those consumers to purchase a product or service over time. On the other hand, a performance advertiser, such as a social gaming company, typically seeks to cause a specific action by the viewer of the ad, such as clicking on the ad to be taken to a mobile website, downloading an app on the viewer’s mobile device or registering the viewer’s email address in order to receive further communications from the provider of a product or service.
Most of our brand advertiser clients, whether based in the United States or internationally, pay us on a CPM basis, as their primary goal is to maximize the number of ad impressions being viewed, although some brand advertisers may use CPC pricing terms from time to time. On the other hand, U.S. and international performance advertisers generally pay us on a CPC or CPA basis, in which case we are only paid when a viewer takes the specified action, such as clicking on the ad or downloading an app.
Historically, brand advertisers have typically represented about 60% of our annual revenues, with performance advertisers generating the remainder. However, the composition of revenue from brand and performance advertisers on our platform often changes throughout the year. For example, we typically see a larger proportion of our revenue derived from brand advertisers in the second and fourth quarters, reflecting what we believe to be traditional seasonality in the advertising industry due to increased consumer spending going into the summer and winter holiday seasons. We tend to see the lowest percentage of brand advertising and the highest percentage of performance advertising in the first quarter of the year. Following these seasonal trends, brand advertising typically represents between one‑half and two‑thirds of our
47
revenue in any particular quarter. In addition, based on our historical experience, a higher percentage of our international revenue is derived from performance advertisers than is the percentage for domestic revenues, although there is a wide variation from country to country, even within a global region, of the mix between performance and brand advertising in any particular quarter.
Following our acquisition of Jumptap Inc. in November 2013, our split between brand and performance revenue was closer to equal. During the year ended December 31, 2014, we experienced a decline in our U.S. performance advertising business and a corresponding increase in the percentage of our business derived from brand advertisers. This decline was the result of some performance advertisers reducing their overall spending, or looking to drive downloads of their applications by moving their business to competitive platforms, particularly those that enabled them to buy across multiple mobile exchanges.
Cost of revenue
Cost of revenue consists primarily of the payments we make to developers for their advertising space on which we deliver mobile ads. These payments are typically determined in advance as either a percentage of the advertising revenue we earn from mobile ads placed on the developer’s app or as a fixed fee for the ad space or fees paid to win bids for advertising inventory purchased from auction‑based marketplace exchanges. We recognize cost of revenue on a developer‑by‑developer basis at the same time as we recognize the associated revenue. Costs owed to developers but not yet paid are recorded on our consolidated balance sheets as accrued cost of revenue. The use of CPM, CPC, or CPA pricing, whether by U.S. or international advertisers, does not directly affect the gross margin percentage we earn because we pay the same percentage or fixed fee to a developer regardless of what pricing model generated the revenue for us. The cost of revenue for ads delivered through auction‑based exchanges can vary depending on our ability to purchase inventory at competitive rates to win the auction bid. In addition, the geographic location of our developers is not a factor in determining the percentage or fixed fee we pay for ad space. We expect that our exchange business may generate a lower gross margin for us than our network business, as is typical in the industry.
Operating expenses
Operating expenses consist of sales and marketing, technology and development and general and administrative expenses. Salaries and personnel costs are the most significant component of each of these expense categories. We expect to continue to hire new employees in order to support our anticipated revenue growth. We include stock‑based compensation expense in connection with the grant of any equity instrument in the applicable operating expense category based on the respective equity award recipient’s function. With the closing of our acquisition of Nexage in December 2014, operating expenses increased by $2.1 million in the fourth quarter of 2014. Additionally, with the closing of the acquisition of Jumptap and our assumption of the Jumptap sales and marketing, technology and development and general and administrative functions, we saw an immediate increase in our operating expenses beginning in the fourth quarter of 2013.
Sales and marketing expense. Sales and marketing expense consists primarily of salaries and personnel costs for our advertiser‑focused sales and marketing employees, including stock‑based compensation, commissions and bonuses. Historically, salaries and personnel costs have been approximately 70% of total sales and marketing expenses. Additional expenses include marketing programs, consulting, amortization of customer relationship intangible assets, travel and other related overhead. We expect our sales and marketing expense to increase in the foreseeable future as we further increase the number of our sales and marketing professionals and expand our marketing activities.
Technology and development expense. Technology and development expense primarily consists of salaries and personnel costs for development employees, including stock‑based compensation and bonuses. Historically, salaries and personnel costs have been 80% to 90% of total technology and development expenses. Technology and development employees are focused on new product and technology development. Additional expenses include costs related to the development, quality assurance and testing of new technology and enhancement of existing technology, amortization of technology intangible assets and internally developed software related to our technology infrastructure, consulting, travel and other related overhead. Other general IT costs are included in general and administrative expenses. We engage third party consulting firms for various technology and development efforts, such as documentation, quality assurance and
48
support. We intend to continue to invest in our technology and development efforts by hiring additional development personnel and by using outside consulting firms for various technology and development efforts. We believe continuing to invest in technology and development efforts is essential to maintaining our competitive position.
General and administrative expense. General and administrative expense primarily consists of salaries and personnel costs for product, operations, developer support, business development, administration, finance and accounting, legal, information systems and human resources employees, including stock‑based compensation and bonuses. Historically, salaries and personnel costs have been approximately 50% to 60% of total general and administrative expenses. Additional expenses include consulting and professional fees, travel, bad debt expense, insurance and other corporate expenses. We expect our general and administrative expenses to increase in the foreseeable future to support our continued growth.
Goodwill and intangible asset impairment charges.
We review our long-lived assets and identifiable intangible assets for impairment whenever events or changes in circumstances indicate the carrying amount of an asset may not be recoverable. During the year ended December 31, 2014, we determined that our technology and customer relationship assets were not fully recoverable due to lower projected revenue levels from associated products and customers. As a result, we recorded a goodwill impairment charge of $57.1 million and an intangible asset impairment charge of $36.4 million during the year ended December 31, 2014 based on the impairment analysis performed.
Interest and other income (expense)
Interest expense, net consists primarily of interest expense, offset by interest income. Interest expense consists primarily of interest from capital leases, amortization of deferred financing costs and commitment fees on loans. We have not borrowed under our existing credit facility to date.
49
Results of Operations
The following table sets forth our consolidated statement of operations data, both in dollars and as a percentage of revenue, for each of the periods indicated.
Comparison of Years Ended December 31, 2014 and 2013
|
Year Ended December 31, |
||||||||||||||||||
|
2014 |
2013 |
|||||||||||||||||
|
(in thousands) |
Period-to-Period Change |
|||||||||||||||||
|
Consolidated Statement of Operations Data: |
Amount |
Percentage of Revenue |
Amount |
Percentage of Revenue |
Amount |
Percentage |
||||||||||||
|
Revenue |
$ |
296,164 | 100.0 |
% |
$ |
259,171 | 100.0 |
% |
$ |
36,993 | 14.3 |
% |
||||||
|
Cost of revenue |
179,758 | 60.7 | 154,774 | 59.7 | 24,984 | 16.1 | ||||||||||||
|
Gross profit |
116,406 | 39.3 | 104,397 | 40.3 | 12,009 | 11.5 | ||||||||||||
|
Operating expenses: |
||||||||||||||||||
|
Sales and marketing |
53,621 | 18.1 | 38,682 | 14.9 | 14,939 | 38.6 | ||||||||||||
|
Technology and development |
29,468 | 9.9 | 18,966 | 7.3 | 10,502 | 55.4 | ||||||||||||
|
General and administrative |
88,588 | 29.9 | 61,891 | 23.9 | 26,697 | 43.1 | ||||||||||||
|
Goodwill and intangible asset impairment |
93,479 | 31.6 |
- |
- |
93,479 | 100.0 | ||||||||||||
|
Total operating expenses |
265,156 | 89.5 | 119,539 | 46.1 | 145,617 | 121.8 | ||||||||||||
|
Loss from operations |
(148,750) | (50.2) | (15,142) | (5.8) | (133,608) | 882.4 | ||||||||||||
|
Total other expense, net |
(145) | 0.0 | (18) | 0.0 | (127) | 705.6 | ||||||||||||
|
Loss before income taxes |
(148,895) | (50.2) | (15,160) | (5.8) | (133,735) | 882.2 | ||||||||||||
|
Income tax (expense)/benefit |
(192) | (0.1) | 47 | 0.0 | (239) | (508.5) | ||||||||||||
|
Net loss |
$ |
(149,087) | (50.3) |
% |
$ |
(15,113) | (5.8) |
% |
$ |
(133,974) | 886.5 | |||||||
Revenue. Revenue was $296.2 million for the year ended December 31, 2014 compared to $259.2 million for the year ended December 31, 2013, an increase of $37.0 million, or 14.3%. Revenue for 2014 includes revenue from Nexage of $1.4 million for the period from December 5, 2014 to December 31, 2014. The remaining growth was primarily attributable to a full year of Jumptap revenue and the related increase in spending from our existing advertiser clients, as well as an increase in the number of advertiser clients using our platform. The Jumptap acquisition was completed on November 6, 2013. Revenue from our existing advertiser clients increased by 16.6% during the year ended December 31, 2014 as compared to the year ended December 31, 2013 and represented 89.3% of our total revenue for the year ended December 31, 2014. The increase in revenue from existing clients was driven both by our acquisitions and by additional campaigns from brand and performance advertisers that had previously advertised with us, larger campaign sizes and campaigns for new brands owned by existing clients. Revenue from new advertiser clients decreased by 3.1% during the year ended December 31, 2014 as compared to the year ended December 31, 2013 and represented 10.7% of our total revenue for the year ended December 31, 2014.
Our revenue from international operations was $48.1 million, or 16.2% of total revenue, for the year ended December 31, 2014 compared to $62.1 million, or 24.0% of total revenue, for the year ended December 31, 2013. The decrease in revenue in our international operations was primarily driven by certain large, international performance clients, who spent significantly less with us in 2014 versus 2013.
We classify revenue based on the geographic location where the advertising was sold. Performance advertising often is displayed globally. Therefore, we may sell a campaign to a large performance advertiser in one location, such as Europe, and principally deliver ads for that campaign to consumers located in the United States.
50
Cost of revenue. Cost of revenue was $179.8 million, or 60.7% of revenue, for the year ended December 31, 2014, an increase of $25.0 million, or 16.1%, from $154.8 million, or 59.7% of revenue, for the year ended December 31, 2013. The increase in cost of revenue in absolute dollars was the direct result of the increase in revenue, as we pay a percentage of that revenue to developers for use of their ad space in delivering mobile ads for our advertising clients.
Sales and marketing. Sales and marketing expense was $53.6 million, or 18.1% of revenue, for the year ended December 31, 2014, an increase of $14.9 million, or 38.6%, from $38.7 million, or 14.9% of revenue, for the year ended December 31, 2013. The increase in sales and marketing expense, both in absolute dollars and as a percentage of revenue, was primarily attributable to a $7.9 million increase in salaries and personnel‑related costs associated with an increase in headcount, as we increased the number of sales and marketing personnel to support and expand our client base. We also experienced higher commission costs associated with higher revenue. The number of full‑time sales and marketing employees was 224 at December 31, 2014, which is an increase from 187 at December 31, 2013. As a result of the Nexage acquisition we added 17 sales and marketing employees. These employees and corresponding expenses only affected the period from December 5, 2014 to December 31, 2014. As a result of the Jumptap acquisition we added 40 sales and marketing employees in November 2013. These employees and corresponding expenses only affected the period from November 6, 2013 to December 31, 2013 for 2013. 2014 includes the full year impact of these Jumptap employees. In addition, we experienced an additional $4.1 million in depreciation and amortization, $1.6 million in travel and travel related expenses and an $812,000 increase in our marketing programs and travel expenses.
Technology and development. Technology and development expense was $29.5 million, or 9.9% of revenue, for the year ended December 31, 2014, an increase of $10.5 million, or 55.4%, from $19.0 million, or 7.3% of revenue, for the year ended December 31, 2013. The increase in technology and development expense, in absolute dollars and as a percentage of revenue, was primarily attributable to a $5.6 million increase in salaries and personnel‑related costs associated with an increase in the full year headcount, partially offset by a decrease in stock compensation expense of $958,000 primarily associated with a one‑time cost recorded in the prior year related to the departure of certain employees in the technology and development functions and acceleration of unvested stock awards. The number of full‑time technology and development employees was 154 at December 31, 2014, which is an increase from 143 at December 31, 2013. As a result of the Nexage acquisition we added 22 technology and development employees in December 2014. These employees and corresponding expenses only affected the period from December 5, 2014 to December 31, 2014. As a result of the Jumptap acquisition we added 51 technology and development employees in November 2013. These employees and corresponding expenses only affected the period from November 6, 2013 to December 31, 2013 for 2013. 2014 includes the full year impact of these Jumptap employees. In addition, for the year ended December 31, 2014, we incurred $5.0 million in increased depreciation and amortization expense related to our property, equipment, internally developed software and acquired intangible assets and an additional $828,000 in rent expense.
General and administrative. General and administrative expense was $88.6 million, or 29.9% of revenue, for the year ended December 31, 2014, an increase of $26.7 million, or 43.1%, from $61.9 million, or 23.9% of revenue, for the year ended December 31, 2013. The increase in general and administrative expense was primarily attributable to a $11.0 million increase in salaries and personnel‑related costs associated with an increase in headcount and $5.4 million increase in stock compensation expense as a result of the full year impact of the employees related to the Jumptap acquisition and the partial year impact of employees related to the Nexage acquisition. As a result of the Nexage acquisition we added 34 general and administrative employees. These employees and corresponding expenses only affected the period from December 5, 2014 to December 31, 2014. As a result of the Jumptap acquisition we added 64 general and administrative employees in November 2013. These employees and corresponding expenses only affected the period from November 6, 2013 to December 31, 2013 for 2013. 2014 includes the full year impact of these Jumptap employees. The number of full‑time general and administrative employees was 258 at December 31, 2014, a decrease from 270 at December 31, 2013. In addition, for the year ended December 31, 2014, we incurred an additional $6.5 million in IT expenses, $1.9 million in other operating expenses, $1.8 million in depreciation and amortization and $1.5 million in travel and travel related expenses. These increases were offset by lower acquisition related costs of $2.6 million for the year ended December 31, 2014 as compared to the year ended December 31, 2013.
Goodwill and intangible asset impairment. We recorded a goodwill impairment charge of $57.1 million and an intangible asset impairment charge of $36.4 million for the year ended December 31, 2014. No goodwill or intangible asset impairments were recorded for the year ended December 31, 2013.
51
Income tax (expense)/benefit. For the year ended December 31, 2014, we recognized an income tax expense of $192,000 primarily due to foreign tax liabilities as well as minimum state tax liabilities.
Comparison of Years Ended December 31, 2013 and 2012
|
Year Ended December 31, |
||||||||||||||||||
|
2013 |
2012 |
|||||||||||||||||
|
(in thousands) |
Period-to-Period Change |
|||||||||||||||||
|
Consolidated Statement of Operations Data: |
Amount |
Percentage of Revenue |
Amount |
Percentage of Revenue |
Amount |
Percentage |
||||||||||||
|
Revenue |
$ |
259,171 | 100.0 |
% |
$ |
177,667 | 100.0 |
% |
$ |
81,504 | 45.9 |
% |
||||||
|
Cost of revenue |
154,774 | 59.7 | 105,739 | 59.5 | 49,035 | 46.4 | ||||||||||||
|
Gross profit |
104,397 | 40.3 | 71,928 | 40.5 | 32,469 | 45.1 | ||||||||||||
|
Operating expenses: |
||||||||||||||||||
|
Sales and marketing |
38,682 | 14.9 | 23,816 | 13.4 | 14,866 | 62.4 | ||||||||||||
|
Technology and development |
18,966 | 7.3 | 13,620 | 7.7 | 5,346 | 39.3 | ||||||||||||
|
General and administrative |
61,891 | 23.9 | 38,954 | 21.9 | 22,937 | 58.9 | ||||||||||||
|
Total operating expenses |
119,539 | 46.1 | 76,390 | 43.0 | 43,149 | 56.5 | ||||||||||||
|
Loss from operations |
(15,142) | (5.8) | (4,462) | (2.5) | (10,680) | 239.4 | ||||||||||||
|
Other income (expense): |
||||||||||||||||||
|
Interest expense, net |
(18) |
- |
(898) | (0.5) | 880 | (98.0) | ||||||||||||
|
Total other expense |
(18) |
- |
(898) | (0.5) | 880 | (98.0) | ||||||||||||
|
Loss before income taxes |
(15,160) | (5.8) | (5,360) | (3.0) | (9,800) | 182.8 | ||||||||||||
|
Income tax benefit/(expense) |
47 |
- |
(70) |
- |
117 | (167.1) | ||||||||||||
|
Net loss |
$ |
(15,113) | (5.8) |
% |
$ |
(5,430) | (3.0) |
% |
$ |
(9,683) | 178.3 | |||||||
Revenue. Revenue was $259.2 million for the year ended December 31, 2013 compared to $177.7 million for the year ended December 31, 2012, an increase of $81.5 million, or 45.9%. 2013 revenue includes revenue from Jumptap of $25.6 million for the period from November 6, 2013 to December 31, 2013. This growth was primarily attributable to an increase in spending from our existing advertiser clients as well as an increase in the number of advertiser clients using our platform. Revenue from our existing advertiser clients increased by 52.8% during the year ended December 31, 2013 as compared to the year ended December 31, 2012 and represented 87.3% of our total revenue for the year ended December 31, 2013. The increase in revenue from existing clients was driven by additional campaigns from brand and performance advertisers that had previously advertised with us, larger campaign sizes and campaigns for new brands owned by existing clients. Revenue from new advertiser clients increased by 8.9% during the year ended December 31, 2013 as compared to the year ended December 31, 2012 and represented 12.7% of our total revenue for the year ended December 31, 2013.
Our revenue from international operations was $62.1 million, or 24.0% of total revenue, for the year ended December 31, 2013 compared to $26.2 million, or 14.8% of total revenue, for the year ended December 31, 2012. This revenue growth in our international operations was primarily driven by certain large, international performance clients, though revenue increased across a number of clients globally in 2013.
We classify revenue based on the geographic location where the advertising was sold. Performance advertising often is displayed globally. Therefore, we may sell a campaign to a large performance advertiser in one location, such as Europe, and principally deliver ads for that campaign to consumers located in the United States. As a result, our revenue from advertising delivered to U.S. consumers was higher than the revenue derived from advertising sold in the United States in 2013.
52
We also substantially increased our overall sales force during the year ended December 31, 2013 compared to the prior year, allowing us to increase our number of advertising client relationships and the number of developer applications enabled to receive ads delivered through our platform.
Cost of revenue. Cost of revenue was $154.8 million, or 59.7% of revenue, for the year ended December 31, 2013, an increase of $49.1 million, or 46.4%, from $105.7 million, or 59.5% of revenue, for the year ended December 31, 2012. The increase in cost of revenue in absolute dollars was the direct result of the increase in revenue, as we pay a percentage of that revenue to developers for use of their ad space in delivering mobile ads for our advertising clients.
Sales and marketing. Sales and marketing expense was $38.7 million, or 14.9% of revenue, for the year ended December 31, 2013, an increase of $14.9 million, or 62.4%, from $23.8 million, or 13.4% of revenue, for the year ended December 31, 2012. The increase in sales and marketing expense, both in absolute dollars and as a percentage of revenue, was primarily attributable to a $9.8 million increase in salaries and personnel-related costs associated with an increase in headcount and stock-based compensation expense, as we increased the number of sales and marketing personnel to support our expanding client base and experienced higher commission costs associated with higher revenue. The number of full-time sales and marketing employees was 187 at December 31, 2013, which is an increase from 113 at December 31, 2012. As a result of the Jumptap acquisition we added 40 sales and marketing employees. These employees and corresponding expenses only affected the period from November 6, 2013 to December 31, 2013. In addition, we experienced a $2.5 million increase in our marketing programs and travel expenses, an additional $509,000 in depreciation expense related to our property and equipment, an additional $531,000 in amortization expense for acquired intangible assets, an additional $723,000 in rent expense, $801,000 in severance payments which resulted from the acquisition of Jumptap, and an additional $100,000 in other general sales and marketing costs to support our growing sales force.
Technology and development. Technology and development expense was $19.0 million, or 7.3% of revenue, for the year ended December 31, 2013, an increase of $5.4 million, or 39.3%, from $13.6 million, or 7.7% of revenue, for the year ended December 31, 2012. The increase in technology and development expense, in absolute dollars, was primarily attributable to a $5.2 million increase in salaries and personnel-related costs associated with an increase in headcount, partially offset by a decrease in stock compensation expense of $2.1 million primarily associated with a one-time cost recorded in the prior year related to the departure of certain employees in the technology and development functions and acceleration of unvested stock awards. The number of full-time technology and development employees was 143 at December 31, 2013, which is an increase from 79 at December 31, 2012. As a result of the Jumptap acquisition we added 51 technology and development employees. These employees and corresponding expenses only affected the period from November 6, 2013 to December 31, 2013. In addition, for the year ended December 31, 2013, we incurred $780,000 in increased depreciation expense related to our property, equipment, and internally developed software, an additional $765,000 in amortization expense for acquired intangible assets, an additional $107,000 in rent expense, an additional $162,000 in travel related activities, an additional $334,000 in production server hosting expenses, and $95,000 in severance payments as a result of the acquisition of Jumptap. The decrease in technology and development expenses as a percentage of revenue for the year ended December 31, 2013 was primarily attributable to our revenue growing faster than our expenses during 2013, but was also affected by the $2.1 million of higher stock-based compensation expense for our technology and development employees in the prior year.
General and administrative. General and administrative expense was $61.9 million, or 23.9% of revenue, for the year ended December 31, 2013, an increase of $22.9 million, or 58.9%, from $39.0 million, or 21.9% of revenue, for the year ended December 31, 2012. The increase in general and administrative expense was primarily attributable to a $9.4 million increase in salaries and personnel-related costs associated with an increase in headcount and stock compensation expense. In addition, for the year ended December 31, 2013, we incurred $7.6 million of acquisition-related costs and severance related to the Jumptap and Metaresolver acquisitions, increased professional service fees of $1.3 million, $1.0 million in increased depreciation and amortization expense related to our property, equipment, and internally developed software, $750,000 of deferred compensation expense related to our acquisition of Metaresolver, increased rent expense of $475,000, increased information system costs of $272,000, and an increase of $2.1 million in other general corporate costs necessary to support the overall growth in our business. The number of full-time general and administrative employees was 270 at December 31, 2013, an increase from 156 at December 31, 2012. As a result of the Jumptap acquisition we added 64 general and administrative employees. These employees and corresponding expenses only affected the period from November 6, 2013 to December 31, 2013.
53
Income tax benefit. For the year ended December 31, 2013, we recognized an income tax benefit of $47,000 primarily due to investment tax credits in Singapore, partially offset by minimal state and foreign tax liabilities.
Seasonality
Our revenue tends to be seasonal in nature, with the fourth quarter of each calendar year historically representing the largest percentage of our total revenue for the year, and the first quarter representing our smallest percentage of total revenue for the year. Many brand advertisers spend the largest portion of their advertising budgets during the fourth quarter, in preparation for the holiday season.
Inflation
We do not believe that inflation has had a material effect on our business, financial condition or results of operations. We continue to monitor the impact of inflation in order to minimize its effects through pricing strategies, productivity improvements and cost reductions. If our costs were to become subject to significant inflationary pressures, we may not be able to fully offset such higher costs through price increases. Our inability or failure to do so could harm our business, financial condition and results of operations.
Liquidity and Capital Resources
Sources of Liquidity
As of December 31, 2014, we had cash and cash equivalents totaling $49.5 million. In August 2011, we entered into a line of credit with Silicon Valley Bank, or SVB, which allowed for borrowings up to $15.0 million. Amounts borrowed under the line of credit are secured by all of our assets. The loan agreement was amended in October 2013 to extend the maturity date to May 9, 2014, to revise the interest rate payable under the agreement and to make other changes. The loan agreement was amended again in May 2014 increasing allowed borrowings under the agreement to $20.0 million. The loan agreement was amended and restated in November 2014, increasing allowed borrowings to $40.0 million and making other changes. Advances under the line of credit bear interest at a floating rate equal to, at our option, either the prime rate published in the Wall Street Journal plus a margin of 1.6% or the ICE Benchmark Administration LIBOR rate plus a margin of 2.6%, in either case with interest payable monthly. The line of credit agreement requires that we maintain a ratio of cash, cash equivalents and billed accounts receivable to current liabilities less the current portion of deferred revenue of at least 1.25 to 1.00. There are also EBITDA minimum requirements under the credit agreement. Additionally, the line of credit agreement contains an unused line fee of 0.2% per year, calculated based on the average unused portion of the loan, payable monthly.
As of December 31, 2014, we had not yet drawn on this line of credit. As of December 31, 2014, we were in compliance with all covenants under the loan agreement.
54
Working Capital
The following table summarizes our cash and cash equivalents, accounts receivable, working capital and cash flows for the periods indicated:
|
|
|
|
|
|
|
|
|
|
|
|
|
|
As of and For the Year Ended |
|||||||
|
|
|
December 31, |
|||||||
|
|
|
2014 |
|
2013 |
|
2012 |
|||
|
|
|
(in thousands) |
|||||||
|
Cash and cash equivalents |
|
$ |
49,463 |
|
$ |
99,237 |
|
$ |
137,439 |
|
Accounts receivable, net of allowances |
|
|
101,348 |
|
|
109,056 |
|
|
59,179 |
|
Working capital |
|
|
62,108 |
|
|
130,551 |
|
|
154,159 |
|
Cash provided by (used in): |
|
|
|
|
|
|
|
|
|
|
Operating activities |
|
|
(10,239) |
|
|
(21,419) |
|
|
(2,537) |
|
Investing activities |
|
|
(40,492) |
|
|
(3,112) |
|
|
(5,260) |
|
Financing activities |
|
|
1,157 |
|
|
(13,528) |
|
|
128,526 |
Our cash and cash equivalents at December 31, 2014 were held for working capital purposes. We do not enter into investments for trading or speculative purposes. Our policy is to invest any cash in excess of our immediate requirements in investments designed to preserve the principal balance and provide liquidity. Accordingly, our cash and cash equivalents are invested primarily in demand deposit accounts, certificates of deposit and money market funds that are currently providing only a minimal return.
Of our total cash and cash equivalents, less than 3% was held outside of the United States at December 31, 2014 and 2013. Our international operations consist of selling and marketing functions supported by our U.S. operations, and we are dependent on our U.S. operations for our international working capital needs. If our cash and cash equivalents held outside of the United States were ever needed for our operations inside the United States, we would be required to accrue and pay U.S. taxes to repatriate these funds. We currently intend to permanently reinvest these foreign amounts outside the United States, and our current plans do not demonstrate a need to repatriate the foreign amounts to fund our U.S. operations.
Cash Flows
Operating Activities
For the year ended December 31, 2014, our net cash used in operating activities of $10.2 million consisted of a net loss of $149.1 million offset by $125.6 million in adjustments for non‑cash items and by $13.3 million of cash provided by changes in working capital. Adjustments for non‑cash items primarily consisted of the goodwill and intangible asset impairment of $93.5 million, non‑cash stock compensation expense of $13.6 million, depreciation and amortization expense of $16.8 million and bad debt expense of $1.3 million. The increased depreciation and amortization expense primarily related to increased capital expenditure requirements and our intangible assets resulting from the Metaresolver and Jumptap acquisitions that closed in 2013. The increase in cash resulting from changes in working capital primarily consisted of a decrease in accounts receivable of $18.3 million, offset by an increase in other assets of $1.9 million and a $5.4 million decrease in accrued cost of revenue, driven primarily by an increase in developer‑related payments associated with the increase in revenue.
For the year ended December 31, 2013, our net cash used in operating activities of $21.4 million consisted of a net loss of $15.1 million and $23.0 million of cash used to fund changes in working capital, which was primarily driven by the acquisition of Jumptap, domestic and international expansion of our operations, and by our investment in technology and development and personnel to facilitate our growth, offset by $16.7 million in adjustments for non-cash items. Adjustments for non-cash items primarily consisted of non-cash stock compensation expense of $9.0 million, depreciation and amortization expense of $5.9 million, and bad debt expense of $1.8 million. The increased depreciation and amortization expense primarily related to increased capital expenditure requirements and our intangible assets resulting from the Metaresolver and Jumptap acquisitions that closed in 2013. The decrease in cash resulting from changes in
55
working capital primarily consisted of an increase in accounts receivable of $28.1 million, which was primarily driven by increased revenue during the year as we continued to expand our operations both domestically and internationally, an increase in prepaid expenses and other current assets of $1.3 million, which was primarily the result of additional deposit requirements for new office space and future marketing events and memberships, an increase in accounts payable and accrued expenses of $4.7 million, which was primarily the result of our Jumptap acquisition, and increases in accrued payroll and payroll related expenses of $1.1 million, which was primarily the result of increases in headcount to support our growing business. These decreases were partially offset by increases in operating cash flow due to an $11.5 million increase in accrued cost of revenue, driven primarily by an increase in developer-related charges.
For the year ended December 31, 2012, our net cash used in operating activities of $2.5 million consisted of a net loss of $5.4 million and $9.3 million of cash used to fund changes in working capital, which was primarily driven both by the domestic and international expansion of our operations and by our investment in technology and development and personnel to facilitate our growth, offset by $12.3 million in adjustments for non-cash items. Adjustments for non-cash items primarily consisted of non-cash stock compensation expense of $7.5 million, depreciation and amortization expense of $2.4 million and non-cash changes in the fair value of a preferred stock warrant liability of $834,000 from January 1, 2012 until its reclassification to additional paid-in capital on April 3, 2012. The increased depreciation and amortization expense primarily related to increased capital expenditure requirements and our intangible assets resulting from the Condaptive acquisition that closed in 2011. The decrease in cash resulting from changes in working capital primarily consisted of an increase in accounts receivable of $25.7 million, which was primarily driven by increased revenue during the year as we continued to expand our operations both domestically and internationally, and an increase in prepaid expenses and other assets of $542,000, which was primarily the result of additional deposit requirements for new office space and future marketing events and memberships. These decreases were partially offset by increases in operating cash flow due to a $16.4 million increase in accounts payable and accrued expenses and accrued cost of revenue, driven primarily by an increase in developer-related charges, and an $869,000 increase in accrued payroll and payroll-related expenses resulting from an increase in the number of employees.
Investing Activities
For the year ended December 31, 2014, net cash used in investing activities was $40.5 million. This amount consisted of $22.4 million of cash consideration paid, net of cash received, as part of the Nexage acquisition and $18.1 million for the purchase of property and equipment.
For the year ended December 31, 2013, net cash used in investing activities was $3.1 million, consisting of a cash inflow of $2.0 million of cash acquired, net of cash consideration paid, as part of the Metaresolver and Jumptap acquisitions, offset by a cash outflow of $5.1 million for purchases of property and equipment.
For the year ended December 31, 2012, net cash used in investing activities was $5.3 million, consisting of purchases of property and equipment.
Financing Activities
For the year ended December 31, 2014, net cash provided by financing activities was $1.2 million, consisting primarily of $2.1 million of cash received upon the exercise of stock options, offset by cash used for payment of employee withholding taxes related to restricted stock unit vesting of $941,000.
For the year ended December 31, 2013, net cash used in financing activities was $13.5 million, consisting primarily of $14.4 million in cash used to repay a line of credit and long-term debt acquired in the Jumptap acquisition and cash used for payment of employee withholding taxes related to restricted stock unit vesting of $518,000. The cash used in financing activities was partially offset by $1.5 million in cash received upon the exercise of stock options.
For the year ended December 31, 2012, net cash provided by financing activities was $128.5 million, consisting of $127.0 million in proceeds from the issuance of common stock in two offerings, net of offering costs and $1.5 million in cash received upon the exercise of stock options.
56
Operating and Capital Expenditure Requirements
We believe that our existing cash balances and unused capacity under our line of credit will be sufficient to meet our anticipated cash requirements through at least the next 12 months. During this period, we expect our capital expenditure requirements to be approximately $4.0 million to $5.0 million, primarily for computer and network equipment and leasehold improvements for some of our office locations.
Contractual Obligations
We have non‑cancelable contractual obligations for office space and capital leases. The following table discloses aggregate information about material contractual obligations and periods in which payments were due as of December 31, 2014. Future events could cause actual payments to differ from these estimates. We also have a line of credit with SVB, as described above, although we have not borrowed under this facility.
|
|
|
|
|
|
|
|
|
|
|
|
|
|
|
|
|
|
|
|
|
|
|
|
|
|
Payment due by period |
|
|
|
||||||||||||||||
|
Contractual Obligations |
|
2015 |
|
2016 |
|
2017 |
|
2018 |
|
2019 |
|
Thereafter |
|
Total |
|||||||
|
|
|
(in thousands) |
|||||||||||||||||||
|
Operating lease obligations |
|
$ |
7,034 |
|
$ |
6,890 |
|
$ |
6,592 |
|
$ |
6,044 |
|
$ |
4,827 |
|
$ |
14,120 |
|
$ |
45,507 |
|
Capital lease obligations |
|
|
696 |
|
|
348 |
|
|
67 |
|
|
- |
|
|
- |
|
|
- |
|
|
1,111 |
|
Total |
|
$ |
7,730 |
|
$ |
7,238 |
|
$ |
6,659 |
|
$ |
6,044 |
|
$ |
4,827 |
|
$ |
14,120 |
|
$ |
46,618 |
We have sublease agreements for office space that will offset the operating lease obligations set forth in the table above by $290,000, $324,000 and $49,000 in 2015, 2016 and 2017, respectively.
Off‑Balance Sheet Arrangements
As of December 31, 2014, we did not have any off‑balance sheet arrangements, as defined in Item 303(a)(4)(ii) of SEC Regulation S‑K, such as the use of unconsolidated subsidiaries, structured finance, special purpose entities or variable interest entities.
Critical Accounting Policies and Significant Judgments and Estimates
Our management’s discussion and analysis of our financial condition and results of operations is based on our consolidated financial statements, which have been prepared in accordance with U.S. GAAP. The preparation of these consolidated financial statements requires us to make estimates and assumptions that affect the reported amounts of assets and liabilities, disclosure of contingent assets and liabilities at the date of the consolidated financial statements and the reported amounts of revenue and expenses during the reported period. In accordance with U.S. GAAP, we base our estimates on historical experience and on various other assumptions that we believe are reasonable under the circumstances. Actual results may differ from these estimates.
While our significant accounting policies are more fully described in Note 2 to our consolidated financial statements included in Item 8 of this Annual Report, we believe the following accounting policies are critical to the process of making significant judgments and estimates in the preparation of our consolidated financial statements.
Revenue Recognition
We recognize revenue based on the activity of mobile users viewing ads through developer applications and mobile websites. Our revenue is recognized when our advertising services are delivered based on the specific terms of the advertising contract, which are commonly based on the number of ads delivered, or views, clicks or actions by users on mobile advertisements. At the time that our services have been provided, the fees charged are fixed or determinable, persuasive evidence of an arrangement exists, and collectability is reasonably assured.
We evaluate whether it is appropriate to recognize revenue based on the gross amount billed to the customers or the net amount earned as revenue share. Generally, when we are primarily obligated in a transaction, have latitude in
57
establishing prices, are responsible for fulfillment of the transaction, have credit risk, or have several but not all of these indicators, we recognize revenue on a gross basis. While none of the factors individually are considered presumptive or determinative, in reaching our conclusions on gross versus net revenue recognition, we place the most weight on the analysis of whether or not we are the primary obligor in the arrangement. We generally record the net amounts as revenue earned if we are not primarily obligated or do not have latitude in establishing prices or credit risk.
We record deferred revenue when we receive cash payments from our advertiser clients in advance of when we perform the services under our arrangements with them.
Accounts Receivable and Allowances for Doubtful Accounts and Sales Credits
Accounts receivable are stated at realizable value, net of an allowance for doubtful accounts that we maintain for estimated losses expected to result from the inability of some clients to make payments as they become due. Our estimated allowance is based on our analysis of past due amounts and ongoing credit evaluations. Historically, our actual collection experience has not varied significantly from our estimates, due primarily to our credit and collection policies and the financial strength of many of our clients.
We also estimate an allowance for sales credits based on our historical experience of sales credits as a percentage of revenue. Historically, actual sales credits have not significantly differed from our estimates. However, if our revenue and client base continues to grow, higher than expected sales credits may result in future write‑offs that are greater than our estimates.
Business Combinations
In business combinations, we determine the acquisition purchase price as the sum of the consideration we provide. When we issue stock‑based awards to an acquired company’s selling stockholders or employees, we evaluate whether the awards are purchase consideration or compensation for post‑business combination services. Our evaluation includes, among other things, whether the vesting of the stock‑based awards is contingent on the continued employment of the selling stockholder beyond the acquisition date. If continued employment is required for vesting, the awards are treated as compensation for post‑acquisition services and recognized as future compensation expense over the required service period.
We allocate the purchase price in a business combination to the identifiable assets and liabilities of the acquired business at their acquisition date fair values. The excess of the purchase price over the amount allocated to the identifiable assets and liabilities, if any, is recorded as goodwill.
To date, the assets acquired and liabilities assumed in our business combinations have primarily consisted of acquired working capital and definite‑lived intangible assets. Working capital is recorded at its fair value. We estimate the fair value of definite‑lived intangible assets acquired using a discounted cash flow approach, which includes an analysis of the future cash flows expected to be generated by the asset and the risk associated with achieving these cash flows. The key assumptions used in the discounted cash flow model include the discount rate that is applied to the forecasted future cash flows to calculate the present value of those cash flows and the estimate of future cash flows attributable to the acquired intangible asset, which include revenue, operating expenses and taxes.
Stock‑Based Compensation
We include stock‑based compensation as part of operating expenses in connection with the grant or modification of stock options and other equity awards to our directors, employees and non‑employees. We apply the fair value method in accordance with authoritative guidance for determining the cost of stock‑based compensation. The total cost of the grant is measured based on the estimated fair value of the award at the date of grant. Modifications are measured based on the fair value at the date of modification. The fair value is then recognized as stock‑based compensation expense over the requisite service period, which is the vesting period, of the award. Information about the assumptions used in the calculation of stock‑based compensation expense is set forth in the Stock‑Based Compensation footnote to our consolidated financial statements included under Item 8 of this Annual Report.
58
Intangible Asset Impairment
We review long-lived assets and certain identifiable intangible assets for impairment whenever events or changes in circumstances indicate the carrying amount of an asset may not be recoverable. Recoverability of the long-lived asset is measured by a comparison of the carrying amount of the asset or asset group to future undiscounted net cash flows expected to be generated by the asset or asset group. If such assets are not recoverable, the impairment to be recognized, if any, is measured by the amount by which the carrying amount of the assets exceeds the estimated fair value of the assets or asset group. As we operate as one business unit and our long-lived assets do not have identifiable cash flows that are independent of the other assets and liabilities of this business unit, the intangible asset test is performed at the entity level.
During the year ended December 31, 2014, we determined that our technology and customer relationship assets were not fully recoverable due to lower projected revenue levels from associated products and customers. As a result, we recognized an impairment charge of $36.4 million to reduce the carrying values of these intangible assets to their estimated fair values. Fair value was estimated using the income approach based on management’s forecast of future cash flows to be derived from the asset’s use. We continue to evaluate the fair value of our intangible assets based on the results of our operations. Depending on our operations, we may in the future be required to record additional impairment charges.
Goodwill Impairment
Goodwill is tested annually for impairment on October 1 of each year or more frequently if impairment indicators arise. Goodwill is tested for impairment at the reporting unit level using a two‑step approach. The first step is to compare the fair value of the reporting unit to the carrying value of the net assets assigned to the reporting unit. If the fair value of the reporting unit is greater than the carrying value of the net assets assigned to the reporting unit, the assigned goodwill is not considered impaired. If the fair value is less than the reporting unit’s carrying value, step two is performed to measure the amount of the impairment, if any.
During the year ended December 31, 2014, we determined sufficient indication existed to require performance of an interim goodwill impairment analysis as of September 30, 2014 for our reporting unit. This indicator was a decrease in our market capitalization below the carrying value of our net assets. In this interim goodwill impairment test, the reporting unit failed step one.
The combination of the lower reporting unit fair value calculated in step one and the identification of unrecognized fair value changes to the carrying values of other assets and liabilities in the second step of the interim goodwill impairment test, resulted in an implied fair value of goodwill below the carrying value of goodwill. As a result, we recorded a goodwill impairment loss of $57.1 million. We continue to evaluate the fair value of our goodwill based on the results of our operations. Depending on our operations, we may in the future be required to record additional impairment charges.
Recently Issued Accounting Pronouncements
In May 2014, the Financial Accounting Standards Board, or FASB, issued Accounting Standards Update, or ASU, No. 2014-09, “Revenue from Contracts with Customers (Topic 606)”. ASU No. 2014-09 supersedes the revenue recognition requirements in Accounting Standards Codification, or ASC, Topic 605, Revenue Recognition. The adoption of ASU No. 2014-09 is required for public entities for fiscal years beginning after December 15, 2016. The Company is evaluating what the effects, if any, of the adoption of ASU No. 2014-09 will have on its consolidated financial statements.
Item 7A. Quantitative and Qualitative Disclosures about Market Risk
Market risk is the risk of loss to future earnings, to fair values or to future cash flows that may result from changes in the price of a financial instrument. The value of a financial instrument may change as a result of changes in interest rates, exchange rates, commodity prices, equity prices and other market changes. We are exposed to market risk related to changes in foreign currency exchange rates. We do not use derivative financial instruments for speculative, hedging or trading purposes, although in the future we may enter into exchange rate hedging arrangements to manage the risks described below.
59
Interest Rate Sensitivity
We maintain a short‑term investment portfolio consisting mainly of highly liquid short‑term money market funds, which we consider to be cash equivalents. These investments earn interest at variable rates and, as a result, decreases in market interest rates would generally result in decreased interest income. Any borrowings under our line of credit with SVB are at a variable rate and, as a result, increases in market interest rates would generally result in increased interest expense on our outstanding borrowings. During 2014, we did not have any borrowings outstanding under the line of credit.
Foreign Currency Exchange Risk
With international operations, we face exposure to adverse movements in foreign currency exchange rates. These exposures may change over time as business practices evolve and if our exposure increases, adverse movement in foreign currency exchange rates would have a material adverse impact on our financial results. Historically, our primary exposures have been related to non‑U.S. dollar denominated operating expenses in the United Kingdom, other countries in Europe, and Singapore. As a result, our results of operations would generally be adversely affected by a decline in the value of the U.S. dollar relative to these foreign currencies. However, based on the size of our international operations and the amount of our expenses denominated in foreign currencies, we would not expect a 10% decline in the value of the U.S. dollar from rates on December 31, 2014 to have a material effect on our financial position or results of operations. Substantially all of our sales contracts are currently denominated in U.S. dollars. Therefore, we have minimal foreign currency exchange risk with respect to our revenue.
60
Item 8. Financial Statements and Supplementary Data
Millennial Media, Inc.
INDEX TO CONSOLIDATED FINANCIAL STATEMENTS
61
REPORT OF INDEPENDENT REGISTERED PUBLIC ACCOUNTING FIRM
Internal Control Over Financial Reporting
The Board of Directors and Stockholders of Millennial Media, Inc.:
We have audited Millennial Media, Inc.’s internal control over financial reporting as of December 31, 2014, based on criteria established in Internal Control—Integrated Framework issued by the Committee of Sponsoring Organizations of the Treadway Commission (2013 framework) (the COSO criteria). Millennial Media, Inc.’s management is responsible for maintaining effective internal control over financial reporting, and for its assessment of the effectiveness of internal control over financial reporting included in Management’s Report on Internal Control Over Financial Reporting appearing in Item 9A. Our responsibility is to express an opinion on the company’s internal control over financial reporting based on our audit.
We conducted our audit in accordance with the standards of the Public Company Accounting Oversight Board (United States). Those standards require that we plan and perform the audit to obtain reasonable assurance about whether effective internal control over financial reporting was maintained in all material respects. Our audit included obtaining an understanding of internal control over financial reporting, assessing the risk that a material weakness exists, testing and evaluating the design and operating effectiveness of internal control based on the assessed risk, and performing such other procedures as we considered necessary in the circumstances. We believe that our audit provides a reasonable basis for our opinion.
A company’s internal control over financial reporting is a process designed to provide reasonable assurance regarding the reliability of financial reporting and the preparation of financial statements for external purposes in accordance with generally accepted accounting principles. A company’s internal control over financial reporting includes those policies and procedures that (1) pertain to the maintenance of records that, in reasonable detail, accurately and fairly reflect the transactions and dispositions of the assets of the company; (2) provide reasonable assurance that transactions are recorded as necessary to permit preparation of financial statements in accordance with generally accepted accounting principles, and that receipts and expenditures of the company are being made only in accordance with authorizations of management and directors of the company; and (3) provide reasonable assurance regarding prevention or timely detection of unauthorized acquisition, use, or disposition of the company’s assets that could have a material effect on the financial statements.
Because of its inherent limitations, internal control over financial reporting may not prevent or detect misstatements. Also, projections of any evaluation of effectiveness to future periods are subject to the risk that controls may become inadequate because of changes in conditions, or that the degree of compliance with the policies or procedures may deteriorate.
As indicated in Management’s Report on Internal Control Over Financial Reporting appearing in Item 9A, management’s assessment of and conclusion on the effectiveness of internal control over financial reporting did not include the internal controls of Nexage, Inc., which is included in the 2014 consolidated financial statements of Millennial Media, Inc. and constituted $20.8 million and $1.5 million of total and net assets, respectively, as of December 31, 2014 and $1.4 million and $703,000 of revenues and net loss, respectively, for the year then ended. Our audit of internal control over financial reporting of Millennial Media, Inc. also did not include an evaluation of the internal control over financial reporting of Nexage, Inc.
In our opinion, Millennial Media, Inc. maintained, in all material respects, effective internal control over financial reporting as of December 31, 2014, based on the COSO criteria.
We also have audited, in accordance with the standards of the Public Company Accounting Oversight Board (United States), the consolidated balance sheets of Millennial Media, Inc. as of December 31, 2014 and 2013, and the related consolidated statements of operations, comprehensive loss, stockholders’ equity (deficit), and cash flows for each of the three years in the period ended December 31, 2014 of Millennial Media, Inc., and our report dated March 11, 2015 expressed an unqualified opinion thereon.
|
|
/s/ Ernst & Young LLP |
Baltimore, Maryland
March 11, 2015
62
REPORT OF INDEPENDENT REGISTERED PUBLIC ACCOUNTING FIRM
Consolidated Financial Statements
The Board of Directors and Stockholders of Millennial Media, Inc.
We have audited the accompanying consolidated balance sheets of Millennial Media, Inc. as of December 31, 2014 and 2013, and the related consolidated statements of operations, comprehensive loss, changes in stockholders’ equity (deficit), and cash flows for each of the three years in the period ended December 31, 2014. Our audits also included the financial statement schedule listed in the Index at Item 15(b). These financial statements and schedule are the responsibility of the Company’s management. Our responsibility is to express an opinion on these financial statements and schedule based on our audits.
We conducted our audits in accordance with the standards of the Public Company Accounting Oversight Board (United States). Those standards require that we plan and perform the audit to obtain reasonable assurance about whether the financial statements are free of material misstatement. An audit includes examining, on a test basis, evidence supporting the amounts and disclosures in the financial statements. An audit also includes assessing the accounting principles used and significant estimates made by management, as well as evaluating the overall financial statement presentation. We believe that our audits provide a reasonable basis for our opinion.
In our opinion, the financial statements referred to above present fairly, in all material respects, the consolidated financial position of Millennial Media, Inc. at December 31, 2014 and 2013, and the consolidated results of its operations and its cash flows for each of the three years in the period ended December 31, 2014, in conformity with U.S. generally accepted accounting principles. Also, in our opinion, the related financial statement schedule, when considered in relation to the basic financial statements taken as a whole, presents fairly in all material respects the information set forth therein.
We also have audited, in accordance with the standards of the Public Company Accounting Oversight Board (United States), Millennial Media, Inc.’s internal control over financial reporting as of December 31, 2014, based on criteria established in Internal Control‑Integrated Framework issued by the Committee of Sponsoring Organizations of the Treadway Commission (2013 framework) and our report dated March 11, 2015 expressed an unqualified opinion thereon.
/s/ Ernst & Young LLP
Baltimore, Maryland
March 11, 2015
63
Consolidated Balance Sheets
(in thousands, except share and per share data)
|
|
|
|
|
|
|
|
|
|
|
|
|
|
|
December 31, |
|
December 31, |
||
|
|
|
|
|
2014 |
|
2013 |
||
|
Assets |
|
|
|
|
|
|
|
|
|
Current assets: |
|
|
|
|
|
|
|
|
|
Cash and cash equivalents |
|
|
|
$ |
49,463 |
|
$ |
99,237 |
|
Restricted cash |
|
|
|
|
272 |
|
|
320 |
|
Accounts receivable, net of allowances of $3,016 and $4,773 as of December 31, 2014 and December 31, 2013, respectively |
|
|
|
|
101,348 |
|
|
109,056 |
|
Prepaid expenses and other current assets |
|
|
|
|
3,946 |
|
|
4,243 |
|
Total current assets |
|
|
|
|
155,029 |
|
|
212,856 |
|
|
|
|
|
|
|
|
|
|
|
Long-term assets: |
|
|
|
|
|
|
|
|
|
Property and equipment, net |
|
|
|
|
27,164 |
|
|
12,663 |
|
Restricted cash |
|
|
|
|
350 |
|
|
515 |
|
Goodwill |
|
|
|
|
139,004 |
|
|
135,489 |
|
Intangible assets, net |
|
|
|
|
33,724 |
|
|
57,706 |
|
Other assets |
|
|
|
|
2,369 |
|
|
375 |
|
Total long-term assets |
|
|
|
|
202,611 |
|
|
206,748 |
|
Total assets |
|
|
|
$ |
357,640 |
|
$ |
419,604 |
|
|
|
|
|
|
|
|
|
|
|
Liabilities and stockholders’ equity |
|
|
|
|
|
|
|
|
|
Current liabilities: |
|
|
|
|
|
|
|
|
|
Accounts payable and accrued expenses |
|
|
|
$ |
10,520 |
|
$ |
7,617 |
|
Accrued cost of revenue |
|
|
|
|
71,951 |
|
|
65,053 |
|
Accrued payroll and payroll related expenses |
|
|
|
|
9,708 |
|
|
8,767 |
|
Deferred revenue |
|
|
|
|
742 |
|
|
868 |
|
Total current liabilities |
|
|
|
|
92,921 |
|
|
82,305 |
|
|
|
|
|
|
|
|
|
|
|
Other long-term liabilities |
|
|
|
|
6,079 |
|
|
1,829 |
|
Total liabilities |
|
|
|
|
99,000 |
|
|
84,134 |
|
|
|
|
|
|
|
|
|
|
|
Stockholders’ equity: |
|
|
|
|
|
|
|
|
|
Preferred stock, $0.001 par value, 5,000,000 shares authorized, no shares issued and outstanding as of December 31, 2014 and December 31, 2013 |
|
|
|
|
- |
|
|
- |
|
Common stock, $0.001 par value, 250,000,000 shares authorized, 138,818,285 and 106,314,909 shares issued and outstanding as of December 31, 2014 and December 31, 2013, respectively |
|
|
|
|
139 |
|
|
106 |
|
Additional paid-in capital |
|
|
|
|
473,217 |
|
|
400,716 |
|
Accumulated other comprehensive loss |
|
|
|
|
(473) |
|
|
(196) |
|
Accumulated deficit |
|
|
|
|
(214,243) |
|
|
(65,156) |
|
Total stockholders’ equity |
|
|
|
|
258,640 |
|
|
335,470 |
|
Total liabilities and stockholders’ equity |
|
|
|
$ |
357,640 |
|
$ |
419,604 |
The accompanying notes are an integral part of these consolidated financial statements.
64
Consolidated Statements of Operations
(in thousands, except per share data)
|
|
|
|
|
|
|
|
|
|
|
|
|
|
Year Ended December 31, |
|||||||
|
|
|
2014 |
|
2013 |
|
2012 |
|||
|
|
|
|
|
|
|
|
|
|
|
|
Revenue |
|
$ |
296,164 |
|
$ |
259,171 |
|
$ |
177,667 |
|
Cost of revenue |
|
|
179,758 |
|
|
154,774 |
|
|
105,739 |
|
Gross profit |
|
|
116,406 |
|
|
104,397 |
|
|
71,928 |
|
Operating expenses: |
|
|
|
|
|
|
|
|
|
|
Sales and marketing |
|
|
53,621 |
|
|
38,682 |
|
|
23,816 |
|
Technology and development |
|
|
29,468 |
|
|
18,966 |
|
|
13,620 |
|
General and administrative |
|
|
88,588 |
|
|
61,891 |
|
|
38,954 |
|
Goodwill and intangible asset impairment |
|
|
93,479 |
|
|
- |
|
|
- |
|
Total operating expenses |
|
|
265,156 |
|
|
119,539 |
|
|
76,390 |
|
Loss from operations |
|
|
(148,750) |
|
|
(15,142) |
|
|
(4,462) |
|
Other expense |
|
|
|
|
|
|
|
|
|
|
Interest expense, net |
|
|
(145) |
|
|
(95) |
|
|
(64) |
|
Other income/(expense) |
|
|
- |
|
|
77 |
|
|
(834) |
|
Total other expense, net |
|
|
(145) |
|
|
(18) |
|
|
(898) |
|
Loss before income taxes |
|
|
(148,895) |
|
|
(15,160) |
|
|
(5,360) |
|
Income tax benefit (expense) |
|
|
(192) |
|
|
47 |
|
|
(70) |
|
Net loss |
|
|
(149,087) |
|
|
(15,113) |
|
|
(5,430) |
|
Accretion of dividends on redeemable convertible preferred stock |
|
|
- |
|
|
- |
|
|
(1,328) |
|
Net loss attributable to common stockholders |
|
$ |
(149,087) |
|
$ |
(15,113) |
|
$ |
(6,758) |
|
|
|
|
|
|
|
|
|
|
|
|
Net loss per share: |
|
|
|
|
|
|
|
|
|
|
Basic and diluted |
|
$ |
(1.36) |
|
$ |
(0.18) |
|
$ |
(0.11) |
|
|
|
|
|
|
|
|
|
|
|
|
Weighted average common shares outstanding: |
|
|
|
|
|
|
|
|
|
|
Basic and diluted |
|
|
109,613 |
|
|
84,029 |
|
|
60,951 |
|
|
|
|
|
|
|
|
|
|
|
|
Stock-based compensation expense included above: |
|
|
|
|
|
|
|
|
|
|
Sales and marketing |
|
$ |
1,088 |
|
$ |
877 |
|
$ |
1,003 |
|
Technology and development |
|
|
707 |
|
|
1,665 |
|
|
3,768 |
|
General and administrative |
|
|
11,787 |
|
|
6,411 |
|
|
2,703 |
|
Total stock-based compensation expense |
|
$ |
13,582 |
|
$ |
8,953 |
|
$ |
7,474 |
The accompanying notes are an integral part of these consolidated financial statements.
65
Consolidated Statements of Comprehensive Loss
(in thousands)
|
|
|
|
|
|
|
|
|
|
|
|
|
|
Year Ended December 31, |
|||||||
|
|
|
2014 |
|
2013 |
|
2012 |
|||
|
|
|
|
|
|
|
|
|||
|
Net loss |
|
$ |
(149,087) |
|
$ |
(15,113) |
|
$ |
(5,430) |
|
Foreign currency adjustments: |
|
|
|
|
|
|
|
|
|
|
Intra-entity foreign currency transaction adjustments |
|
|
(332) |
|
|
(117) |
|
|
5 |
|
Foreign currency translation adjustments |
|
|
55 |
|
|
(1) |
|
|
(58) |
|
Total comprehensive loss |
|
$ |
(149,364) |
|
$ |
(15,231) |
|
$ |
(5,483) |
The accompanying notes are an integral part of these consolidated financial statements.
66
Consolidated Statements of Changes in Stockholders’ Equity (Deficit)
(in thousands, except share and per share data)
|
|
|
|
|
|
|
|
|
|
|
|
|
|
|
|
|
|
|
|
|
|
|
|
|
|
|
|
Accumulated |
|
|
|
|
|
|
|
|
|
|
|
|
|
|
Additional |
|
Other |
|
|
|
|
Total |
|||
|
|
Common Stock |
|
Paid-In |
|
Comprehensive |
|
Accumulated |
|
Stockholders’ |
|||||||
|
|
Shares |
|
|
Amount |
|
Capital |
|
Loss |
|
Deficit |
|
(Deficit) Equity |
||||
|
Balance, December 31, 2011 |
18,011,035 |
|
$ |
17 |
|
$ |
- |
|
$ |
(25) |
|
$ |
(44,413) |
|
$ |
(44,421) |
|
Conversion of Series B warrant to common stock warrant |
- |
|
|
- |
|
|
1,017 |
|
|
- |
|
|
- |
|
|
1,017 |
|
Cashless exercise of warrant to purchase common stock |
46,760 |
|
|
- |
|
|
- |
|
|
- |
|
|
- |
|
|
- |
|
Conversion of redeemable convertible preferred stock to common stock |
47,679,003 |
|
|
48 |
|
|
77,955 |
|
|
- |
|
|
- |
|
|
78,003 |
|
Issuance of common stock in connection with exercises of stock options and vesting of restricted stock units, net of withholdings |
2,650,893 |
|
|
3 |
|
|
1,493 |
|
|
- |
|
|
- |
|
|
1,496 |
|
Issuance of common stock from initial public offering, net of issuance costs |
10,795,222 |
|
|
11 |
|
|
127,020 |
|
|
- |
|
|
- |
|
|
127,031 |
|
Accretion of dividends on redeemable convertible preferred stock |
- |
|
|
- |
|
|
(1,136) |
|
|
- |
|
|
(192) |
|
|
(1,328) |
|
Accretion of issuance costs on redeemable convertible preferred stock |
- |
|
|
- |
|
|
- |
|
|
- |
|
|
(8) |
|
|
(8) |
|
Stock-based compensation expense |
- |
|
|
- |
|
|
7,474 |
|
|
- |
|
|
- |
|
|
7,474 |
|
Net loss |
- |
|
|
- |
|
|
- |
|
|
- |
|
|
(5,430) |
|
|
(5,430) |
|
Intra-entity foreign currency transaction adjustments |
- |
|
|
- |
|
|
- |
|
|
5 |
|
|
- |
|
|
5 |
|
Foreign currency translation adjustments |
- |
|
|
- |
|
|
- |
|
|
(58) |
|
|
- |
|
|
(58) |
|
Balance, December 31, 2012 |
79,182,913 |
|
$ |
79 |
|
$ |
213,823 |
|
$ |
(78) |
|
$ |
(50,043) |
|
$ |
163,781 |
|
Issuance of common stock in connection with an acquisition, net of issuance costs |
24,745,470 |
|
|
25 |
|
|
175,270 |
|
|
- |
|
|
- |
|
|
175,295 |
|
Issuance of common stock and stock options for acquisition-related activity |
14,134 |
|
|
- |
|
|
112 |
|
|
- |
|
|
- |
|
|
112 |
|
Issuance costs related to public offerings |
- |
|
|
- |
|
|
(58) |
|
|
- |
|
|
- |
|
|
(58) |
|
Options assumed in connection with an acquisition |
- |
|
|
- |
|
|
1,672 |
|
|
- |
|
|
- |
|
|
1,672 |
|
Issuance of common stock in connection with exercises of stock options |
2,087,492 |
|
|
2 |
|
|
1,462 |
|
|
- |
|
|
- |
|
|
1,464 |
|
Issuance of common stock in connection with vesting of restricted stock units, net of withholdings |
284,900 |
|
|
- |
|
|
(518) |
|
|
- |
|
|
- |
|
|
(518) |
|
Stock-based compensation expense |
- |
|
|
- |
|
|
8,953 |
|
|
- |
|
|
- |
|
|
8,953 |
|
Net loss |
- |
|
|
- |
|
|
- |
|
|
- |
|
|
(15,113) |
|
|
(15,113) |
|
Intra-entity foreign currency transaction adjustments |
- |
|
|
- |
|
|
- |
|
|
(117) |
|
|
- |
|
|
(117) |
|
Foreign currency translation adjustments |
- |
|
|
- |
|
|
- |
|
|
(1) |
|
|
- |
|
|
(1) |
|
Balance, December 31, 2013 |
106,314,909 |
|
$ |
106 |
|
$ |
400,716 |
|
$ |
(196) |
|
$ |
(65,156) |
|
$ |
335,470 |
|
Issuance of common stock in connection with an acquisition, net of issuance costs |
30,733,436 |
|
|
31 |
|
|
48,238 |
|
|
- |
|
|
- |
|
|
48,269 |
|
Issuance costs related to public offerings |
- |
|
|
- |
|
|
(33) |
|
|
- |
|
|
- |
|
|
(33) |
|
Options assumed in connection with an acquisition |
- |
|
|
- |
|
|
9,526 |
|
|
- |
|
|
- |
|
|
9,526 |
|
Issuance of common stock in connection with exercises of stock options |
821,301 |
|
|
1 |
|
|
2,130 |
|
|
- |
|
|
- |
|
|
2,131 |
|
Issuance of common stock in connection with vesting of restricted stock units, net of withholdings |
948,639 |
|
|
1 |
|
|
(942) |
|
|
- |
|
|
- |
|
|
(941) |
|
Stock-based compensation expense |
- |
|
|
- |
|
|
13,582 |
|
|
- |
|
|
- |
|
|
13,582 |
|
Net loss |
- |
|
|
- |
|
|
- |
|
|
- |
|
|
(149,087) |
|
|
(149,087) |
|
Intra-entity foreign currency transaction adjustments |
- |
|
|
- |
|
|
- |
|
|
(332) |
|
|
- |
|
|
(332) |
|
Foreign currency translation adjustments |
- |
|
|
- |
|
|
- |
|
|
55 |
|
|
- |
|
|
55 |
|
Balance, December 31, 2014 |
138,818,285 |
|
$ |
139 |
|
$ |
473,217 |
|
$ |
(473) |
|
$ |
(214,243) |
|
$ |
258,640 |
The accompanying notes are an integral part of these consolidated financial statements.
67
Consolidated Statements of Cash Flows
(in thousands)
|
|
|
|
|
|
|
|
|
|
|
|
|
|
Year Ended December 31, |
|||||||
|
|
|
2014 |
|
2013 |
|
2012 |
|||
|
Cash flows from operating activities |
|
|
|
|
|
|
|
|
|
|
Net loss |
|
$ |
(149,087) |
|
$ |
(15,113) |
|
$ |
(5,430) |
|
Adjustments to reconcile net loss to net cash and cash equivalents used in operating activities: |
|
|
|
|
|
|
|
|
|
|
Stock-based compensation expense |
|
|
13,582 |
|
|
8,953 |
|
|
7,474 |
|
Non-cash change in fair value of Series B warrant |
|
|
|
|
|
- |
|
|
834 |
|
Non-cash acquisition related costs |
|
|
- |
|
|
111 |
|
|
- |
|
Bad debt expense |
|
|
1,290 |
|
|
1,766 |
|
|
1,639 |
|
Deferred income taxes |
|
|
- |
|
|
- |
|
|
- |
|
Depreciation and amortization |
|
|
16,733 |
|
|
5,913 |
|
|
2,365 |
|
Amortization of deferred financing fees |
|
|
37 |
|
|
61 |
|
|
28 |
|
Unrealized foreign currency (gain) loss |
|
|
412 |
|
|
(84) |
|
|
(98) |
|
Goodwill and intangible asset impairment |
|
|
93,479 |
|
|
- |
|
|
- |
|
Changes in assets and liabilities: |
|
|
|
|
|
|
|
|
|
|
Release of restricted cash |
|
|
454 |
|
|
- |
|
|
- |
|
Accounts receivable |
|
|
18,271 |
|
|
(28,117) |
|
|
(25,733) |
|
Prepaid expenses and other current assets |
|
|
486 |
|
|
(1,299) |
|
|
(542) |
|
Other assets |
|
|
(1,871) |
|
|
363 |
|
|
(249) |
|
Accounts payable and accrued expenses |
|
|
563 |
|
|
(4,740) |
|
|
2,884 |
|
Accrued cost of revenue |
|
|
(5,383) |
|
|
11,455 |
|
|
13,467 |
|
Accrued payroll and payroll related expenses |
|
|
483 |
|
|
(1,096) |
|
|
869 |
|
Other long-term liabilities |
|
|
375 |
|
|
292 |
|
|
(57) |
|
Deferred revenue |
|
|
(63) |
|
|
116 |
|
|
12 |
|
Net cash and cash equivalents used in operating activities |
|
|
(10,239) |
|
|
(21,419) |
|
|
(2,537) |
|
|
|
|
|
|
|
|
|
|
|
|
Cash flows from investing activities |
|
|
|
|
|
|
|
|
|
|
Net cash (paid) received from acquisitions |
|
|
(22,360) |
|
|
1,968 |
|
|
- |
|
Purchases of property and equipment |
|
|
(18,132) |
|
|
(5,080) |
|
|
(5,260) |
|
Net cash and cash equivalents used in investing activities |
|
|
(40,492) |
|
|
(3,112) |
|
|
(5,260) |
|
|
|
|
|
|
|
|
|
|
|
|
Cash flows from financing activities |
|
|
|
|
|
|
|
|
|
|
Repayment of credit line |
|
|
- |
|
|
(4,003) |
|
|
- |
|
Repayment of long-term debt |
|
|
- |
|
|
(10,353) |
|
|
- |
|
Proceeds from exercises of stock options |
|
|
2,131 |
|
|
1,462 |
|
|
127,030 |
|
Share issuance costs |
|
|
(33) |
|
|
(116) |
|
|
- |
|
Withholding payments for vesting of restricted stock units |
|
|
(941) |
|
|
(518) |
|
|
1,496 |
|
Net cash and cash equivalents provided by (used in) financing activities |
|
|
1,157 |
|
|
(13,528) |
|
|
128,526 |
|
Effect of exchange rates on cash and cash equivalents |
|
|
(200) |
|
|
(143) |
|
|
3 |
|
Net increase (decrease) in cash and cash equivalents |
|
|
(49,774) |
|
|
(38,202) |
|
|
120,732 |
|
|
|
|
|
|
|
|
|
|
|
|
Cash and cash equivalents, beginning of the period |
|
|
99,237 |
|
|
137,439 |
|
|
16,707 |
|
Cash and cash equivalents, end of the period |
|
$ |
49,463 |
|
$ |
99,237 |
|
$ |
137,439 |
|
|
|
|
|
|
|
|
|
|
|
|
Supplemental disclosure of other cash flow information: |
|
|
|
|
|
|
|
|
|
|
Cash paid for interest |
|
$ |
53 |
|
$ |
51 |
|
$ |
31 |
|
Supplemental disclosure of noncash investing activities: |
|
|
|
|
|
|
|
|
|
|
Purchases of property and equipment with tenant improvement allowance |
|
$ |
3,846 |
|
$ |
- |
|
$ |
- |
|
Issuance of common stock and assumptions of options in connection with |
|
|
|
|
|
|
|
|
|
|
acquisitions |
|
|
57,745 |
|
|
176,967 |
|
|
- |
|
Accretion of dividends on redeemable convertible preferred stock |
|
|
- |
|
|
- |
|
|
1,328 |
|
Accretion of issuance costs on redeemable convertible preferred stock |
|
|
- |
|
|
- |
|
|
8 |
The accompanying notes are an integral part of these consolidated financial statements
68
Millennial Media, Inc. (the “Company”) was incorporated in the state of Delaware in May 2006. The Company is engaged in the business of providing mobile advertising solutions to advertisers and developers. Its technology, tools and services help developers to maximize their advertising revenue, acquire users and gain insight about their users. The Company offers advertisers significant audience reach, sophisticated targeting capabilities and the ability to deliver rich and engaging ad experiences to consumers on their mobile connected devices.
2. Summary of Significant Accounting Policies
Principles of Consolidation
The consolidated financial statements include the accounts of Millennial Media, Inc. and its wholly owned subsidiaries. All intercompany balances and transactions have been eliminated in the accompanying consolidated financial statements.
Recently Adopted Accounting Pronouncements
In July 2013, the Financial Accounting Standards Board (“FASB”) issued Accounting Standards Update (“ASU”) No. 2013-11, “Income Taxes (Topic 740)”. ASU No. 2013-11 requires that an unrecognized tax benefit, or a portion of an unrecognized tax benefit, be presented in the financial statements as a reduction to a deferred tax asset for a net operating loss carryforward, a similar tax loss, or a tax credit carryforward, with certain exceptions. This guidance is effective for annual and interim reporting periods beginning after December 15, 2013. The adoption of ASU No. 2013-11 did not have a material impact on the Company's consolidated financial statements.
Recently Issued Accounting Pronouncements
In May 2014, the FASB issued ASU No. 2014-09, “Revenue from Contracts with Customers (Topic 606)”. ASU No. 2014-09 supersedes the revenue recognition requirements in Accounting Standards Codification (“ASC”) Topic 605, Revenue Recognition. The adoption of ASU No. 2014-09 is required for public entities for fiscal years beginning after December 15, 2016. The Company is evaluating what the effects, if any, of the adoption of ASU No. 2014-09 will have on its consolidated financial statements.
Use of Estimates
The preparation of financial statements in conformity with United States generally accepted accounting principles (“U.S. GAAP”) requires management to make estimates and assumptions that affect the amounts reported in the consolidated financial statements and accompanying notes. Actual results could differ from those estimates.
On an ongoing basis, the Company evaluates its estimates, including those related to the accounts receivable allowances, the useful lives of long‑lived assets and other intangible assets, assumptions used for purposes of determining stock‑based compensation, identification of intangibles in purchase accounting, contingent liabilities, fair value of intangibles and goodwill and income taxes, among others. The Company bases its estimates on historical experience and on various other assumptions that it believes to be reasonable, the results of which form the basis for making judgments about the carrying value of assets and liabilities as well as reporting revenue and expenses during the periods presented.
Cash and Cash Equivalents
Cash and cash equivalents consist of checking accounts and a money market account. The Company considers all highly liquid investments with original maturities of three months or less at the time of purchase to be cash equivalents. The Company maintains cash balances in financial institutions in amounts greater than federally insured limits.
69
Restricted Cash
Restricted cash as of December 31, 2014 and 2013 consists of cash required to be deposited with financial institutions supporting letters of credit for certain of the Company’s lease agreements and as collateral for the Company’s credit card accounts.
Revenue Recognition and Deferred Revenue
The Company recognizes revenue based on the activity of mobile users viewing ads through developer applications and mobile websites. Revenues are recognized when the Company’s advertising services are delivered based on the specific terms of the advertising contract, which are commonly based on the number of ads delivered, or views, clicks or actions by users on mobile advertisements. At such time, the Company’s services have been provided, the fees charged are fixed or determinable, persuasive evidence of an arrangement exists, and collectability is reasonably assured.
The Company evaluates whether it is appropriate to recognize revenue based on the gross amount billed to the customers or the net amount earned as revenue. When the Company is primarily obligated in a transaction, has latitude in establishing prices, is responsible for fulfillment of the transaction, has credit risk, or has several but not all of these indicators, revenue is recorded on a gross basis. While none of the factors individually are considered presumptive or determinative, in reaching conclusions on gross versus net revenue recognition, the Company places the most weight on the analysis of whether or not it is the primary obligor in the arrangement. The Company records the net amounts as revenue earned if it is not primarily obligated or does not have latitude in establishing prices or credit risk.
Deferred revenue arises as a result of differences between the timing of revenue recognition and receipt of cash from the Company’s customers.
Cost of Revenue
Cost of revenue consists primarily of amounts due to developers for the advertising inventory utilized in running mobile advertisements. These amounts are typically either a percentage of the advertising revenue earned by the Company based on mobile advertisements that are run on each developer’s application or a fixed fee for the ad space or fees paid to win bids for advertising inventory purchased from auction‑based marketplace exchanges. The Company recognizes the cost of revenue as the associated revenue is recognized, on a developer by developer basis during the period the advertisements run on the developer’s advertising application or mobile website. Costs owed to developers but not yet paid are recorded as accrued cost of revenue. The cost of revenue for ads delivered through auction‑based exchanges can vary depending on the Company’s ability to purchase inventory at competitive rates to win the auction bid.
Fair Value Measurements
The carrying amounts of certain of the Company’s financial instruments, including cash and cash equivalents, accounts receivable, accounts payable and accrued expenses, approximate their respective fair values due to their short‑term nature.
The Company uses a three‑tier fair value hierarchy to classify and disclose all assets and liabilities measured at fair value on a recurring basis, as well as assets and liabilities measured at fair value on a non‑recurring basis, in periods subsequent to their initial measurement. The hierarchy requires the Company to use observable inputs when available, and to minimize the use of unobservable inputs when determining fair value. The three tiers are defined as follows:
|
· |
Level 1. Observable inputs based on unadjusted quoted prices in active markets for identical assets or liabilities; |
70
|
· |
Level 2. Inputs, other than quoted prices in active markets, that are observable either directly or indirectly; and |
|
· |
Level 3. Unobservable inputs for which there is little or no market data, which require the Company to develop its own assumptions. |
Assets and Liabilities Measured at Fair Value on a Recurring Basis
The Company evaluates its financial assets and liabilities subject to fair value measurements on a recurring basis to determine the appropriate level to classify them for each reporting period. This determination requires significant judgments to be made. The following tables summarize the conclusions reached as of December 31, 2014 and 2013 (in thousands):
|
|
|
|
|
|
|
|
|
|
|
|
|
|
|
|
|
Balance at |
|
|
|
|
|
|
|
|
|
|
|
|
|
December 31, 2014 |
|
Level 1 |
|
Level 2 |
|
Level 3 |
||||
|
Assets: |
|
|
|
|
|
|
|
|
|
|
|
|
|
Money market funds (1) |
|
$ |
25,004 |
|
$ |
25,004 |
|
$ |
- |
|
$ |
- |
|
|
|
$ |
25,004 |
|
$ |
25,004 |
|
$ |
- |
|
$ |
- |
|
|
|
|
|
|
|
|
|
|
|
|
|
|
|
|
|
|
|
|
|
|
|
|
|
|
|
|
|
|
|
Balance at |
|
|
|
|
|
|
|
|
|
|
|
|
|
December 31, 2013 |
|
Level 1 |
|
Level 2 |
|
Level 3 |
||||
|
Assets: |
|
|
|
|
|
|
|
|
|
|
|
|
|
Money market funds (1) |
|
$ |
68,437 |
|
$ |
68,437 |
|
$ |
- |
|
$ |
- |
|
|
|
$ |
68,437 |
|
$ |
68,437 |
|
$ |
- |
|
$ |
- |
|
(1) |
Money market funds are classified as cash equivalents in the Company’s consolidated balance sheets. As short‑term, highly liquid investments readily convertible to known amounts of cash, with remaining maturities of three months or less at the time of purchase, the Company’s cash equivalent money market funds have carrying values that approximate fair value. Amounts do not include $24.5 million and $30.8 million of operating cash balances as of December 31, 2014 and 2013, respectively. |
Assets and Liabilities Measured at Fair Value on a Nonrecurring Basis
Some assets are not measured at fair value on an ongoing basis but are subject to fair value adjustments only in certain circumstances. These assets can include goodwill and intangible assets (customer relationships, technology and intellectual property) that have been reduced to fair value when they are impaired (see Note 5). Assets that are written down to fair value when impaired are not subsequently adjusted to fair value unless further impairment occurs. These assets and liabilities also include those related to business acquisitions that are recorded at fair value upon acquisition (see Note 3).
These nonrecurring fair value measurements are based on significant inputs not observable in the market and represent Level 3 measurements within the fair value hierarchy.
The Company uses a combination of income-based and market-based approaches to estimate the fair value of goodwill. These approaches use significant unobservable inputs, including forecasted revenues, gross profit margins, working capital requirements, perpetual growth rates and long-term discount rates.
71
The Company used an income-based approach, specifically the multi-period excess earnings approach to estimate the fair value of our customer relationship asset. This approach used significant unobservable inputs, including forecasted revenues and expense, a long-term discount rate and an estimate for the retention/churn rate of our customers. The Company also used an income-based approach, specifically the relief from royalty method to estimate the fair value of our technology asset. This approach used significant unobservable inputs including projected revenues and market observations regarding royalty rates.
Concentration of Credit Risk
Financial instruments that subject the Company to significant concentrations of credit risk consist primarily of cash and cash equivalents and accounts receivable. All of the Company’s cash and cash equivalents are held at financial institutions that the Company believes to be of high credit quality. The Company’s cash and cash equivalent accounts exceed federally insured limits at times. The Company has not experienced any losses on cash and cash equivalents to date. To manage accounts receivable risk, the Company evaluates the creditworthiness of its customers and maintains an allowance for doubtful accounts.
During the year ended December 31, 2014 no customer accounted for more than 10% of revenue and no customer accounted for greater than 10% of outstanding receivables at year end. During the year ended December 31, 2013 no customer accounted for more than 10% of revenue and one customer accounted for greater than 10% of outstanding receivables at year end.
Accounts Receivable and Allowance for Doubtful Accounts and Sales Credits
The Company extends credit to customers without requiring collateral. Accounts receivable are stated at realizable value, net of an allowance for doubtful accounts. The Company utilizes the allowance method to provide for doubtful accounts based on the Company’s evaluation of the collectability of amounts due. The Company’s estimate is based on historical collection experience and a review of the current status of accounts receivable. Historically, actual write‑offs for uncollectible accounts have not significantly differed from the Company’s estimates. However, higher than expected bad debts may result in future write‑offs that are greater than the Company’s estimates.
The Company also estimates an allowance for sales credits based on the Company’s historical sales credits experience. Historically, actual sales credits have not significantly differed from the Company’s estimates. However, higher than expected sales credits may result in future write‑offs that are greater than the Company’s estimates. The allowances for doubtful accounts and sales credits are included in accounts receivable, net in the consolidated balance sheets.
Property and Equipment
Property and equipment are recorded at cost. Expenditures for major additions and improvements are capitalized. Depreciation and amortization is provided over the estimated useful lives of the related assets using the straight‑line method.
72
The estimated useful lives for significant property and equipment categories are as follows:
|
|
|
|
|
Office furniture and fixtures |
|
5 years |
|
Computer equipment and laptops |
|
2.5 - 3 years |
|
Purchased software |
|
3 years |
|
Internally developed software |
|
3 years |
|
Leasehold improvements |
|
Lesser of remaining lease term or useful life |
Repairs and maintenance costs are charged to expense as incurred.
Internally Developed Software
The Company capitalizes certain internal and external software development costs, consisting primarily of direct labor associated with creating the internally developed software. Software development projects generally include three stages: the preliminary project stage (all costs expensed as incurred), the application development stage (costs are capitalized) and the post‑implementation/operation stage (all costs expensed as incurred). The costs capitalized in the application development stage primarily include the costs of designing the application, coding and testing of the system. Capitalized costs are amortized using the straight‑line method over the estimated useful life of the software, generally 3 years, once it is ready for its intended use. The Company believes the straight‑line recognition method best approximates the manner in which the expected benefit will be derived. Capitalized software development costs of $3.9 million and $3.5 million have been included in property and equipment in the consolidated balance sheets as of December 31, 2014 and 2013, respectively. Amortization expense for the related capitalized internally developed software for the years ended December 31, 2014, 2013, and 2012 totaled $1.2 million, $1.0 million, and $723,000, respectively, and is included in technology and development and general and administrative expenses in the accompanying consolidated statements of operations.
Business Combinations
In business combinations, the Company determines the acquisition purchase price as the sum of the consideration provided. When stock‑based awards are issued to an acquired company’s selling stockholders or employees, the Company evaluates whether the awards are purchase consideration or compensation for post‑business combination services. This evaluation includes, among other things, whether the vesting of the stock‑based awards is contingent on the continued employment of the selling stockholder beyond the acquisition date. If continued employment is required for vesting, the awards are treated as compensation for post‑acquisition services and recognized as future compensation expense over the required service period.
The Company allocates the purchase price in a business combination to the identifiable assets and liabilities of the acquired business at their acquisition date fair values. The excess of the purchase price over the amount allocated to the identifiable assets and liabilities, if any, is recorded as goodwill.
To date, the assets acquired and liabilities assumed in business combinations have primarily consisted of acquired working capital and definite‑lived intangible assets. Working capital is recorded at its fair value. The Company estimates the fair value of definite‑lived intangible assets acquired using a discounted cash flow approach, which includes an analysis of the future cash flows expected to be generated by the asset and the risk associated with achieving these cash flows. The key assumptions used in the discounted cash flow model include the discount rate that is applied to the forecasted future cash flows to calculate the present value of those cash flows and the estimate of future cash flows attributable to the acquired intangible asset, which include revenue, operating expenses and taxes.
73
Goodwill
Goodwill represents the excess of: (a) the aggregate of the fair value of consideration transferred in a business combination, over (b) the fair value of assets acquired, net of liabilities assumed. Goodwill is not amortized, but is subject to an annual impairment test. The Company tests goodwill for impairment annually on October 1st or more frequently if events or changes in business circumstances indicate the asset might be impaired. The Company determined that it had a single, entity‑wide reporting unit. Goodwill is tested for impairment at the reporting unit level using a two‑step approach. The first step is to compare the fair value of the reporting unit to the carrying value of the net assets assigned to the reporting unit. If the fair value of the reporting unit is greater than the carrying value of the net assets assigned to the reporting unit, the assigned goodwill is not considered impaired. If the fair value is less than the reporting unit’s carrying value, step two is performed to measure the amount of the impairment, if any. In the second step, the fair value of goodwill is determined by deducting the fair value of the reporting unit’s identifiable assets and liabilities from the fair value of the reporting unit as a whole, as if the reporting unit had just been acquired and the fair value was being initially allocated. If the carrying value of goodwill exceeds the implied fair value, an impairment charge would be recorded in the period the determination is made.
At September 30, 2014, the Company determined sufficient indication existed to require performance of an interim goodwill impairment analysis as of September 30, 2014 for the Company’s reporting unit. This indicator was a decrease in the Company’s market capitalization during the third quarter of 2014 below the carrying value of its net assets. Accordingly, in this interim goodwill impairment test, the reporting unit failed step one of the analysis.
The combination of the determination of fair value of the reporting unit and the identification of unrecognized fair value changes to the carrying values of other assets and liabilities in the second step of the interim goodwill impairment test, resulted in an implied fair value of goodwill below the carrying value of goodwill at September 30, 2014. As a result, the Company recorded its best estimate of the goodwill impairment loss of $57.1 million. The Company continues to evaluate the fair value of its goodwill based on the results of its operations. Depending on its operations, the Company may in the future be required to record additional impairment charges.
Identifiable Intangible Assets
The Company acquired definite lived intangible assets in connection with its business acquisitions. These assets were recorded at their estimated fair values at the acquisition date and are being amortized over their respective estimated useful lives using the straight‑line method.
The estimated useful lives used in computing amortization are as follows:
|
|
|
|
|
Technology |
|
4 - 5 years |
|
Customer relationships |
|
4 - 5 years |
Impairment of Long‑Lived Assets
The Company reviews long‑lived assets and certain identifiable intangible assets for impairment whenever events or changes in circumstances indicate the carrying amount of an asset may not be recoverable. Recoverability of the long‑lived asset is measured by a comparison of the carrying amount of the asset or asset group to future undiscounted net cash flows expected to be generated by the asset or asset group. If such assets are not recoverable, the impairment to be recognized, if any, is measured by the amount by which the carrying amount of the assets exceeds the estimated fair value of the assets or asset group.
74
During the three months ended September 30, 2014, the Company determined that its technology and customer relationship assets were not fully recoverable due to lower projected revenue levels from associated products and customers. As a result, the Company recognized an impairment charge of $36.4 million to reduce the carrying values of these intangible assets to their estimated fair values. Fair value was estimated using an income-based approach based on management’s forecast of future cash flows to be derived from the asset’s use. There was no impairment recorded during the years ended December 31, 2013 and 2012, or during the period from October 1, 2014 to December 31, 2014. The Company continues to evaluate the fair value of its intangible assets based on the results of its operations. Depending on its operations, the Company may in the future be required to record additional impairment charges.
Income Taxes
Income taxes are accounted for under the asset and liability method of accounting. Deferred tax assets and liabilities are recognized for the future tax consequences attributable to differences between the financial statement carrying amounts of existing assets and liabilities and their respective tax bases, as well as for operating loss and tax credit carryforwards. Deferred tax assets and liabilities are measured using enacted tax rates expected to apply to taxable income in the years in which those temporary differences are expected to be recovered or settled. The effect on deferred tax assets and liabilities of a change in tax rates is recognized in the results of operations in the period that includes the enactment date. The measurement of a deferred tax asset is reduced, if necessary, by a valuation allowance if it is more likely than not that some portion or all of the deferred tax asset will not be realized. Any excess tax benefit above amounts previously recorded for stock‑based compensation expense is recorded in additional paid‑in‑capital in the consolidated balance sheets to the extent that cash taxes payable are reduced. The Company uses the with‑and‑without approach when determining when excess tax benefits have been realized.
The Company accounts for uncertain tax positions by recognizing the financial statement effects of a tax position only when, based on the technical merits of the position, it is more likely than not that the position will be sustained upon examination by the taxing authorities.
The Company has a policy to recognize interest and penalties accrued on any uncertain tax positions as a component of income tax expense.
Advertising Costs
The Company expenses advertising costs as incurred. Advertising costs totaled $124,000, $168,000, and $76,000 for the years ended December 31, 2014, 2013 and 2012, respectively. Advertising costs are included within sales and marketing expenses on the consolidated statements of operations.
Technology and Development
Technology and development expense primarily consists of salaries and payroll‑related costs for employees, including stock‑based compensation and bonuses. Additional expenses include costs related to the development, quality assurance and testing of new technology and enhancement of existing technology, amortization of internally developed software related to the Company’s technology infrastructure, consulting, travel and other related overhead.
Technology and development costs are expensed as incurred, except for certain costs relating to internally developed software, which are capitalized and amortized on a straight‑line basis over their estimated useful life once the asset is placed in service.
75
Foreign Operations and Currency
The consolidated financial statements include the results of the Company’s wholly owned subsidiaries whose books and records are maintained in a functional currency other than the U.S. Dollar. Foreign currency transaction losses totaled $44,000, $194,000 and $7,000 for the years ended December 31, 2014, 2013 and 2012, respectively, and are included in general and administrative expenses in the Company’s consolidated statement of operations.
Stock‑Based Compensation
The Company accounts for stock‑based payment awards for employees by measuring services received in exchange for all equity awards granted based on the fair value of the award as of the grant date. The Company recognizes stock‑based compensation expense on a straight‑line basis over the awards’ vesting period, adjusted for estimated forfeitures. The Company accounts for stock‑based payment awards for non‑employees by measuring services received in exchange for all equity awards granted based on the fair value of the award as of the grant date. Fair value is remeasured each reporting period. The Company recognizes non‑employee stock‑based compensation expense on a straight‑line basis over the awards’ vesting period, adjusted for estimated forfeitures.
The Company uses the Black‑Scholes option pricing model for estimating the fair value of stock options. The use of the option valuation model requires the input of highly subjective assumptions, including the expected life and the expected stock price volatility based on a combination of the Company’s historical price data and peer companies, as there is not enough historical price data for the Company’s common stock. Additionally, the recognition of expense requires the estimation of the number of options that will ultimately vest and the number of options that will ultimately be forfeited.
Basic and Dilutive Loss per Common Share
The Company uses the two‑class method to compute net loss per common share because the Company has issued securities, other than common stock, that contractually entitle the holders to participate in dividends and earnings of the Company. The two‑class method requires earnings for the period to be allocated between common stock and participating securities based upon their respective rights to receive distributed and undistributed earnings. Holders of each series of the Company’s redeemable convertible preferred stock (prior to the conversion to common stock) and the restricted common stock issued in the May 2011 acquisition of Condaptive, Inc. (“Condaptive”) are entitled to participate in distributions, when and if declared by the board of directors, that are made to common stockholders, and as a result are considered participating securities.
Under the two‑class method, for periods with net income, basic net income per common share is computed by dividing the net income attributable to common stockholders by the weighted average number of shares of common stock outstanding during the period. Net income attributable to common stockholders is computed by subtracting from net income the portion of current year earnings that the participating securities would have been entitled to receive pursuant to their dividend rights had all of the year’s earnings been distributed. No such adjustment to earnings is made during periods with a net loss, as the holders of the participating securities have no obligation to fund losses. Diluted net loss per common share is computed under the two‑class method by using the weighted‑average number of shares of common stock outstanding, plus, for periods with net income attributable to common stockholders, the potential dilutive effects of stock options and warrants. In addition, the Company analyzes the potential dilutive effect of the outstanding participating securities under the “if‑converted” method when calculating diluted earnings per share, in which it is assumed that the outstanding participating securities convert into common stock at the beginning of the period. The Company reports the more dilutive of the approaches (two class or “if‑converted”) as its diluted net income per share during the period. Due to net losses for the years ended December 31, 2014, 2013 and 2012, basic and diluted loss per share were the same, as the effect of potentially dilutive securities would have been antidilutive.
76
3. Acquisitions
Nexage
On December 4, 2014, the Company completed the acquisition of all of the outstanding stock of Nexage, Inc. (“Nexage”), a supply-side platform and programmatic technology company.
The acquisition date fair value of the consideration transferred to the former Nexage securityholders was $83.2 million, which consisted of the following:
|
|
|
|
|
|
Fair value of consideration transferred (in thousands, except share data) |
|
|
|
|
Cash |
|
$ |
24,879 |
|
Common stock (30,733,436 shares) |
|
|
48,251 |
|
Fair value of stock options assumed (7,949,236 options) |
|
|
9,526 |
|
Effective settlement of pre-existing relationship |
|
|
564 |
|
Total |
|
$ |
83,220 |
The value of the share consideration for the Company’s common stock was based on the closing price of $1.57 on the closing date of the acquisition. The fair value of the stock options assumed by the Company was determined using the Black‑Scholes option pricing model as of the acquisition date.
The Nexage acquisition was accounted for using the acquisition method of accounting. The consolidated financial statements of the Company as of and for the year ended December 31, 2014 include the financial position and results of operations of Nexage from the acquisition date of December 4, 2014.
The fair value estimates for Nexage’s assets and liabilities are based on, but not limited to, expected future revenue and cash flows, expected future growth rates, and estimated discount rates. The intangible assets acquired will be amortized on a straight‑line basis over the estimated remaining useful lives of 4 years for the technology and customer relationships assets. Goodwill represents the future economic benefits expected to arise from other intangible assets acquired that do not qualify for separate recognition, including acquired workforce, as well as expected future synergies. The estimated fair values of assets acquired and liabilities assumed are considered preliminary and are based on the information that was available as of the date of this report. Thus, the provisional measurements of fair value are subject to change due to settlement of working capital and finalization of the valuation of certain acquired assets. The Company expects to finalize the valuation as soon as practicable, but not later than one year from the acquisition date. The Nexage acquisition was accounted for as a stock acquisition and, as such, none of the goodwill is deductible for tax purposes.
The Company recognized approximately $3.0 million of acquisition-related costs related to the acquisition of Nexage during the year ended December 31, 2014, which amount is included in general and administrative expenses on the accompanying consolidated statements of operations.
Jumptap
On November 6, 2013, the Company completed its acquisition of all of the outstanding stock of Jumptap, Inc. (“Jumptap”). Jumptap is a technology and data company focused on analyzing volumes of data from real‑time bidding exchanges to help brands and agencies optimize and deliver more relevant advertising.
77
The acquisition date fair value of the consideration transferred to the former Jumptap securityholders was approximately $186.7 million, which consisted of the following:
|
|
|
|
|
|
Fair value of consideration transferred (in thousands, except share data) |
|
|
|
|
Cash |
|
$ |
9,484 |
|
Common stock (24,745,470 shares) |
|
|
175,445 |
|
Fair value of stock options assumed (861,311 options) |
|
|
1,672 |
|
Effective settlement of pre-existing relationship |
|
|
84 |
|
Total |
|
$ |
186,685 |
The value of the share consideration for the Company’s common stock was based on the closing price of $7.09 on the closing date of the acquisition. The fair value of the stock options assumed by the Company was determined using the Black‑Scholes option pricing model.
The Jumptap acquisition was accounted for using the acquisition method of accounting. The consolidated financial statements of the Company as of and for the year ended December 31, 2013 include the financial position and results of operations of Jumptap from the acquisition date of November 6, 2013.
The fair values for Jumptap’s assets and liabilities are based on, but not limited to, expected future revenue and cash flows, expected future growth rates, and estimated discount rates. The intangible assets acquired are being amortized on a straight‑line basis over 5 years for both the technology and customer relationships assets. A portion of the intangible assets identified were impaired and written off in September 2014. Goodwill represents the future economic benefits expected to arise from other intangible assets acquired that do not qualify for separate recognition, including acquired workforce, as well as expected future synergies. The Jumptap acquisition was accounted for as a stock acquisition and, as such, none of the goodwill is deductible for tax purposes.
In November 2013, subsequent to the closing of the acquisition of Jumptap, the Company paid the remaining balance of the outstanding long-term debt assumed in the acquisition of $14.4 million.
The Company recognized $7.9 million of acquisition‑related costs related to the acquisition of Jumptap during the year ended December 31, 2013, which amount is included in general and administrative expenses on the accompanying consolidated statements of operations.
Metaresolver
On April 1, 2013, the Company completed the acquisition of all of the outstanding stock of Metaresolver, Inc. (“Metaresolver”), a technology and data company focused on analyzing volumes of data from real‑time bidding exchanges to help brands and agencies optimize their buy and deliver more relevant promotions. The cash consideration for the acquisition of Metaresolver was $13.7 million, of which $2.0 million represented potential deferred cash payments to certain of the Metaresolver founders. The deferred cash payments were subject to varying service requirements over a two‑year period following the closing of the acquisition, were contingent on the Metaresolver founders’ continued service with the Company and was recognized as compensation expense on a straight‑line basis over the requisite service period. For tax purposes, the $2.0 million was included in the purchase price. Only $1.0 million of deferred cash payments were earned and paid out as of December 31, 2014. No further payments of the deferred cash are required.
The Metaresolver acquisition was accounted for using the acquisition method of accounting. The consolidated financial statements of the Company for the year ended December 31, 2013 include the financial position and results of operations of Metaresolver from the acquisition date of April 1, 2013.
78
The developed technology intangible asset acquired was being amortized over its estimated useful life of ten years. All of the developed technology was impaired and written off in September 2014. Goodwill recognized from the transaction results from expected synergies and the acquired workforce. The Metaresolver acquisition was accounted for as a stock acquisition and, as such, none of the goodwill is deductible for tax purposes.
The Company recognized $481,000 of acquisition‑related costs related to the acquisition of Metaresolver during the year ended December 31, 2013, which amount is included in general and administrative expenses on the accompanying consolidated statements of operations.
The following table summarizes the estimated fair values of the assets acquired and liabilities assumed as of the date of acquisition (in thousands) for the Nexage, Jumptap and Metaresolver acquisitions:
|
|
|
|
|
|
|
|
|
|
|
|
|
|
Nexage |
|
Jumptap |
|
Metaresolver |
|||
|
Restricted cash |
|
$ |
- |
|
$ |
320 |
|
$ |
- |
|
Accounts receivable, net of allowance |
|
|
12,111 |
|
|
23,410 |
|
|
118 |
|
Prepaids and other assets |
|
|
254 |
|
|
1,332 |
|
|
22 |
|
Restricted cash—long term |
|
|
242 |
|
|
514 |
|
|
- |
|
Property and equipment |
|
|
374 |
|
|
4,851 |
|
|
47 |
|
Customer relationships |
|
|
11,000 |
|
|
21,290 |
|
|
- |
|
Technology |
|
|
9,400 |
|
|
35,170 |
|
|
2,048 |
|
Other assets |
|
|
- |
|
|
- |
|
|
5 |
|
Goodwill |
|
|
61,029 |
|
|
124,335 |
|
|
9,806 |
|
Total assets acquired |
|
|
94,410 |
|
|
211,222 |
|
|
12,046 |
|
Accounts payable and accrued expenses |
|
|
1,207 |
|
|
11,363 |
|
|
221 |
|
Accrued cost of revenue |
|
|
12,464 |
|
|
19,167 |
|
|
- |
|
Deferred revenue |
|
|
36 |
|
|
530 |
|
|
- |
|
Capital lease—current |
|
|
- |
|
|
566 |
|
|
- |
|
Other current liabilities |
|
|
- |
|
|
- |
|
|
149 |
|
Long-term debt |
|
|
- |
|
|
14,355 |
|
|
- |
|
Capital lease—long-term |
|
|
- |
|
|
1,205 |
|
|
- |
|
Other long-term liabilities |
|
|
- |
|
|
478 |
|
|
- |
|
Total liabilities assumed |
|
|
13,707 |
|
|
47,664 |
|
|
370 |
|
Purchase consideration |
|
$ |
80,703 |
|
$ |
163,558 |
|
$ |
11,676 |
|
Cash acquired |
|
$ |
2,517 |
|
$ |
23,127 |
|
$ |
110 |
In accordance with ASC 805-10-50, the following unaudited pro forma financial information presents the Company’s consolidated financial information assuming the acquisitions of Nexage had taken place on January 1, 2013 and the acquisitions of Jumptap and Metaresolver had taken place on January 1, 2012. These amounts are presented in accordance with U.S. GAAP, consistent with the Company’s accounting policies.
|
Year Ended December 31, |
|||||||||
|
2014 |
2013 |
2012 |
|||||||
|
Revenue(1) |
$ |
302,238 |
$ |
347,770 |
$ |
241,670 | |||
|
Net loss attributable to common stockholders(1)(2)(3) |
(164,596) | (39,371) | (29,593) | ||||||
|
(1) |
Portions of Nexage’s, Metaresolver’s and Jumptap’s operations were fully integrated within the Company’s operations as of the acquisition date; therefore, the Company is unable to determine the revenue and earnings amounts separately
79 |
attributable to Metaresolver and the earnings amount separately attributable to Nexage and Jumptap subsequent to each acquisition date. Revenue subsequent to the acquisition date separately attributable to Nexage was approximately $1.4 million in 2014. Revenue subsequent to the acquisition date separately attributable to Jumptap was approximately $25.6 million in 2013. |
|
(2) |
Pro forma net loss attributable to common stockholders for the year ended December 31, 2012 reflects the impact of certain expenses included in the consolidated statement of operations for the year ended December 31, 2013, but excluded from the calculation of pro forma net loss attributable to common stockholders for that year. These expenses include acquisition‑related costs of $8.4 million for the year ended December 31, 2013. |
|
(3) |
Pro forma net loss attributable to common stockholders for the year ended December 31, 2013 reflects the impact of certain expenses included in the consolidated statement of operations for the year ended December 31, 2014, but excluded from the calculation of pro forma net loss attributable to common stockholders for that year. These expenses include acquisition‑related costs of $3.0 million for the year ended December 31, 2014. |
4. Property and Equipment
Property and equipment consisted of the following as of December 31 (in thousands):
|
|
|
|
|
|
|
|
|
|
|
2014 |
|
2013 |
||
|
Computer equipment and laptops |
|
$ |
21,991 |
|
$ |
10,438 |
|
Leasehold improvements |
|
|
11,261 |
|
|
3,201 |
|
Internally developed software |
|
|
3,879 |
|
|
3,458 |
|
Office furniture and fixtures |
|
|
2,743 |
|
|
1,147 |
|
Computer software |
|
|
2,443 |
|
|
1,575 |
|
|
|
|
42,317 |
|
|
19,819 |
|
Less: accumulated depreciation and amortization |
|
|
(15,153) |
|
|
(7,156) |
|
Property and equipment, net |
|
$ |
27,164 |
|
$ |
12,663 |
Depreciation and amortization expense of property and equipment, excluding amortization expense for internally developed software, for the years ended December 31, 2014, 2013 and 2012 was $7.5 million, $3.2 million and $2.1 million, respectively. Amortization expense of internally developed software for the years ended December 31, 2014, 2013 and 2012 was $1.2 million, $1.0 million and $723,000, respectively. The unamortized balance of internally developed software as of December 31, 2014 and 2013 was $1.0 million and $1.7 million, respectively.
5. Goodwill and Intangible Assets
The changes in the carrying amount of goodwill for the years ended December 31, 2014 and 2013 were as follows (in thousands):
|
|
|
|
|
|
Balance as of January 1, 2013 |
|
$ |
1,348 |
|
Goodwill attributable to acquisitions |
|
|
134,141 |
|
Balance as of December 31, 2013 |
|
|
135,489 |
|
Impairment charges |
|
|
(57,069) |
|
Other |
|
|
(445) |
|
Goodwill attributable to Nexage acquisition |
|
|
61,029 |
|
Balance as of December 31, 2014 |
|
$ |
139,004 |
80
Information regarding the Company’s acquisition‑related intangible assets is as follows (in thousands):
|
|
|
|
|
|
|
|
|
|
|
|
|
|
|
|
As of December 31, 2014 |
|||||||||
|
|
|
|
|
|
|
|
|
|
|
|
Weighted Average |
|
|
|
Gross |
|
|
|
Net |
|
Remaining |
|||
|
|
|
Carrying |
|
Accumulated |
|
Carrying |
|
Useful Life |
|||
|
|
|
Amount |
|
Amortization |
|
Amount |
|
(in years) |
|||
|
Customer relationships |
|
$ |
14,800 |
|
$ |
440 |
|
$ |
14,360 |
|
4.1 |
|
Technology |
|
|
20,101 |
|
|
737 |
|
|
19,364 |
|
4.4 |
|
Total |
|
$ |
34,901 |
|
$ |
1,177 |
|
$ |
33,724 |
|
4.3 |
|
|
|
|
|
|
|
|
|
|
|
|
|
|
|
|
As of December 31, 2013 |
|||||||||
|
|
|
|
|
|
|
|
|
|
|
|
Weighted Average |
|
|
|
Gross |
|
|
|
Net |
|
Remaining |
|||
|
|
|
Carrying |
|
Accumulated |
|
Carrying |
|
Useful Life |
|||
|
|
|
Amount |
|
Amortization |
|
Amount |
|
(in years) |
|||
|
Intellectual property |
|
$ |
72 |
|
$ |
28 |
|
$ |
44 |
|
6.2 |
|
Customer relationships |
|
|
21,290 |
|
|
531 |
|
|
20,759 |
|
5.9 |
|
Technology |
|
|
38,510 |
|
|
1,607 |
|
|
36,903 |
|
6.9 |
|
Total |
|
$ |
59,872 |
|
$ |
2,166 |
|
$ |
57,706 |
|
6.6 |
During year ended December 31, 2014, the Company wrote off $36.4 million of intangible assets determined to be impaired and reduced the remaining useful life of both the customer relationships and technology intangible assets to 5 years. There were no impairment charges for the years ended December 31, 2013 and 2012.
Amortization expense of acquisition‑related intangible assets for the years ended December 31, 2014, 2013 and 2012 was $8.0 million, $1.7 million, and $266,000, respectively. As of December 31, 2014, expected amortization expense for acquisition‑related intangible assets for each of the next five years is as follows (in thousands):
|
|
|
|
|
|
2015 |
|
$ |
7,973 |
|
2016 |
|
|
8,000 |
|
2017 |
|
|
8,000 |
|
2018 |
|
|
7,575 |
|
2019 |
|
|
2,176 |
|
|
|
$ |
33,724 |
81
6. Commitments and Contingencies
Operating Lease Commitments
The Company leases office space under non‑cancelable operating lease agreements which may include renewal options. Future minimum lease payments under these operating leases consisted of the following as of December 31, 2014 (in thousands):
|
|
|
|
|
|
2015 |
|
$ |
7,034 |
|
2016 |
|
|
6,890 |
|
2017 |
|
|
6,592 |
|
2018 |
|
|
6,044 |
|
2019 |
|
|
4,827 |
|
Thereafter |
|
|
14,120 |
|
|
|
$ |
45,507 |
Rent expense for the years ended December 31, 2014, 2013 and 2012 totaled $8.1 million, $3.3 million and $2.0 million, respectively.
Future minimum lease payments due under the non‑cancelable operating lease arrangements contain fixed rent increases over the term of the lease. Rent expense on these operating leases is recognized over the term of the lease on a straight‑line basis. The excess of rent expense recognized over actual cash lease payments due has been reported as a deferred rent liability within other long term liabilities in the accompanying consolidated balance sheets. The balance of the deferred rent liability, which includes both the excess of rent expense recognized over actual cash lease payments and the amounts received as tenant improvement allowance, was $4.9 million and $505,000 as of December 31, 2014 and 2013, respectively.
Legal Contingencies
During the normal course of our business, the Company is occasionally involved with various claims and litigation. Reserves are established in connection with such matters when a loss is probable and the amount of such loss can be reasonably estimated. The determination of probability and the estimation of the actual amount of any such loss are inherently unpredictable, and it is therefore possible that the eventual outcome of such claims and litigation could exceed the estimated reserves. Based upon the Company’s experience, current information and applicable law, it does not believe it is reasonably possible that any proceedings and claims will have a material effect on its financial statements.
7. Debt and Capital Leases
Line of Credit
In August 2011, the Company entered into a line of credit with Silicon Valley Bank, or SVB, which allowed for borrowings up to $15.0 million. Amounts borrowed under the line of credit are secured by substantially all of the Company’s assets. The loan agreement was amended in October 2013 to extend the maturity date to May 9, 2014, to revise the interest rate payable under the agreement and to make other changes. The loan agreement was amended again in May 2014 increasing allowed borrowings to $20.0 million. The loan agreement was amended and restated in November 2014, increasing allowed borrowings to $40.0 million and making other changes. Advances under the line of credit bear interest at a floating rate equal to, at the Company’s option, either the prime rate published in the Wall Street Journal plus a margin of 1.6% or the ICE Benchmark Administration LIBOR rate plus a margin of 2.6%, in either case with interest payable monthly. The line of credit agreement requires that the Company maintain a ratio of cash, cash equivalents and billed
82
accounts receivable to current liabilities less the current portion of deferred revenue of at least 1.25 to 1.00. There are also EBITDA minimum requirements under the credit agreement. Additionally, the line of credit agreement contains an unused line fee of 0.2% per year, calculated based on the average unused portion of the loan, payable monthly. The line of credit is scheduled to mature in November 2018. As of December 31, 2014, the Company had not yet drawn on this line of credit.
As of December 31, 2014, the Company also had $1.5 million in standby letters of credit outstanding with SVB, primarily to secure rent deposits.
Capital Leases
As part of the acquisition of Jumptap in 2013, the Company acquired capital lease agreements with financing companies for computer equipment. The terms of the capital leases are between 3 ‑ 4 years with interest rates ranging between 3.25% and 3.75%. As of December 31, 2014, these leases had a gross asset balance of $1.7 million and accumulated depreciation of $690,000 and are included in property and equipment. As of December 31, 2013, these leases had a gross asset balance of $1.7 million and accumulated depreciation of $102,000 and are included in property and equipment. Depreciation expense for the years ended December 31, 2014, 2013 and 2012 was $558,000, $102,000 and $0, respectively.
The future minimum payments under the capital leases as of December 31, 2014 are as follows:
|
|
|
|
|
|
2015 |
|
$ |
696 |
|
2016 |
|
|
348 |
|
2017 |
|
|
67 |
|
Total |
|
$ |
1,111 |
|
Less: Interest |
|
|
38 |
|
Net |
|
$ |
1,073 |
8. Stock‑Based Compensation
2006 Equity Incentive Plan
The Company’s Board of Directors adopted, and the holders of common stock approved, the 2006 Equity Incentive Plan (the “2006 Plan”) in July 2006. The 2006 Plan was amended by the Company’s Board of Directors and approved by the holders of common stock in December 2010. The Company’s 2006 Plan provides for the grant of incentive stock options to the Company’s employees and affiliates’ employees, and for the grant of non‑statutory stock options, stock bonuses and restricted stock awards to the Company’s employees, directors and consultants.
As of December 31, 2014, options to purchase 1,936,424 shares of the Company’s common stock were outstanding under the 2006 Plan at a weighted average exercise price of $1.74 per share. Effective upon the Company’s initial public offering, no further stock awards could be granted under the Company’s 2006 Plan, but all outstanding stock awards will continue to be governed by their existing terms.
2012 Equity Incentive Plan
In March 2012, the Company’s Board of Directors and the holders of common stock approved the 2012 Equity Incentive Plan (the “2012 Plan”), which became effective on March 28, 2012 upon the pricing of the Company’s initial public offering. The 2012 Plan provides for the grant of incentive stock options within the meaning of Section 422 of the Internal Revenue Code (the “Code”) to the Company’s employees and parent and subsidiary corporations’ employees, and
83
for the grant of non‑statutory stock options, restricted stock awards, restricted stock unit (“RSU”) awards, stock appreciation rights, performance stock awards and other forms of stock compensation to the Company’s employees, including officers, consultants and directors. The 2012 Plan also provides for the grant of performance cash awards to employees, consultants and directors.
Authorized Shares. The maximum number of shares of the Company’s common stock that may be issued under the 2012 Plan was initially 3,250,000 shares. The number of shares of the Company’s common stock reserved for issuance under the 2012 Plan increases on January 1 of each year, for a period of ten years, from January 1, 2013 continuing through January 1, 2022, by the lesser of 3.8% of the total number of shares of the Company’s common stock outstanding on December 31 of the preceding calendar year, or a lesser number of shares determined by the Company’s Board of Directors prior to December 31 of the year immediately preceding the increase. The Company’s common stock reserved for issuance under the 2012 Plan increased by 4,039,967 shares and 6,258,951 shares on January 1, 2014 and 2013, respectively. In May 2014, following the approval of the Company’s stockholders, the 2012 Plan was amended to increase the total number of shares reserved for issuance by 3,000,000 shares, to an aggregate authorized amount of 13,298,917 shares. On January 1, 2015, the Company’s common stock reserved for issuance under the 2012 Plan increased by an additional 5,275,095 shares.
Shares issued under the 2012 Plan may be authorized but unissued or reacquired shares of the Company’s common stock. Shares subject to stock awards granted under the 2012 Plan that expire or terminate without being exercised in full, or that are paid out in cash rather than in shares, will not reduce the number of shares available for issuance under the 2012 Plan. Additionally, shares issued pursuant to stock awards under the 2012 Plan that the Company repurchases or that are forfeited, as well as shares reacquired by the Company as consideration for the exercise or purchase price of a stock award or to satisfy tax withholding obligations related to a stock award, will become available for future grant under the 2012 Plan. As of December 31, 2014, options to purchase 5,105,343 shares of the Company’s common stock were outstanding under the 2012 Plan at a weighted average exercise price of $5.70 and 3,726,345 RSU awards were outstanding.
The Jumptap, Inc. Amended and Restated 2005 Stock Option and Grant Plan
In March 2005, Jumptap’s Board of Directors and the holders of common stock approved the Jumptap, Inc. 2005 Stock Option Plan (the “Jumptap Plan”). As part of the acquisition of Jumptap in 2013, the Company assumed options that were outstanding under the Jumptap Plan and converted them into options to purchase an aggregate of 861,311 shares of the Company’s common stock. Options to purchase 233,017 shares of the Company’s common stock were outstanding under the Jumptap Plan as of December 31, 2014 at a weighted average exercise price of $4.62. No further equity awards can be granted under the Jumptap Plan, but all outstanding equity awards will continue to be governed by their existing terms.
2014 Equity Inducement Plan
On December 4, 2014, the Company’s Board of Directors approved the Millennial Media 2014 Equity Inducement Plan (the “2014 Plan”). The 2014 Plan provides for grants to new employees of the Company or its parent or subsidiary corporations, of (i) incentive stock options within the meaning of Section 422 of the Code, only in connection with the substitution of awards with respect to a merger or other transaction within the meaning of Section 424 of the Code, and (ii) non‑statutory stock options, restricted stock awards, RSU awards, stock appreciation rights, and other forms of stock compensation. The maximum number of shares of the Company’s common stock that may be issued under the 2014 Plan is 9,500,000. As part of the acquisition of Nexage in 2014, the Company exchanged options that were outstanding under the existing Nexage equity award plan for options under the 2014 Plan to purchase an aggregate of 6,640,364 shares of the Company’s common stock. Additionally, shares issued pursuant to stock awards under the 2014 Plan that the Company repurchases or that are forfeited, as well as shares reacquired by the Company as consideration for the exercise or purchase price of a stock award or to satisfy tax withholding obligations related to a stock award, will become available
84
for future grant under the 2014 Plan. As of December 31, 2014, options to purchase 6,599,765 shares of the Company’s common stock at a weighted average exercise price of $0.56 and 823,088 RSU awards were outstanding under the 2014 Plan.
Nexage Individual Assumed Options
On December 8, 2014, as part of the acquisition of Nexage, the Company’s Board of Directors approved the assumption of certain individual option awards that were outstanding under the existing Nexage equity award plan. Upon assumption by the Company, the assumed awards became options to purchase an aggregate of 2,501,046 shares of the Company’s common stock. As of December 31, 2014, none of the assumed options have been forfeited or exercised and options to purchase 2,501,046 shares of the Company’s common stock were outstanding at a weighted average exercise price of $0.17.
Stock compensation expense recognized by the Company was as follows (in thousands):
|
Year Ended December 31, |
||||||||
|
2014 |
2013 |
2012 |
||||||
|
Stock option awards |
$ |
5,242 |
$ |
4,146 |
$ |
2,377 | ||
|
RSUs |
8,111 | 3,518 | 1,442 | |||||
|
Restricted stock awards |
229 | 1,289 | 3,655 | |||||
|
Total recognized stock-based compensation expense |
$ |
13,582 |
$ |
8,953 |
$ |
7,474 | ||
Stock Option Awards
The following summarizes the assumptions used for estimating the fair value of stock options granted to employees and non‑employees for the years ended December 31:
|
|
|
|
|
|
|
|
|
|
|
|
|
|
|
|
|
Year Ended December 31, |
||||||||||
|
|
|
2014 |
|
2013 |
|
2012 |
||||||
|
|
|
|
|
|
|
|
|
|
|
|
|
|
|
Risk-free interest rate |
|
1.1% |
- |
2.0% |
|
0.1% |
- |
2.4% |
|
0.8% |
- |
1.3% |
|
Expected life (in years) |
|
3.0 |
- |
6.3 |
|
0.0 |
- |
8.7 |
|
5.7 |
- |
6.1 |
|
Expected volatility |
|
53% |
- |
65% |
|
37% |
- |
55% |
|
53% |
- |
55% |
|
Dividend yield |
|
0% |
|
0% |
|
0% |
||||||
|
Weighted-average grant date fair value |
|
$1.16 |
|
$3.63 |
|
$6.01 |
||||||
85
The following is a summary of option activity for the three-year period ended December 31, 2014:
|
Weighted- |
||||||||||
|
Average |
||||||||||
|
Remaining |
Aggregate |
|||||||||
|
Weighted- |
Contractual |
Intrinsic |
||||||||
|
Average |
Term |
Value |
||||||||
|
Number |
Exercise Price |
(in years) |
(in thousands) |
|||||||
|
Options outstanding at January 1, 2012 |
7,650,498 |
$ |
1.11 | |||||||
|
Granted |
667,500 | 11.77 | ||||||||
|
Exercised |
(2,624,138) | 0.64 | ||||||||
|
Forfeited |
(79,246) | 4.79 | ||||||||
|
Expired |
(14,593) | 0.27 | ||||||||
|
Options outstanding at January 1, 2013 |
5,600,021 | 2.55 | 6.93 |
$ |
53,401 | |||||
|
Granted and assumed from acquisition |
4,632,311 | 6.81 | ||||||||
|
Exercised |
(2,087,492) | 0.68 | ||||||||
|
Forfeited |
(479,743) | 6.78 | ||||||||
|
Options outstanding at January 1, 2014 |
7,665,097 | 5.28 | 7.85 | 18,395 | ||||||
|
Granted and assumed from acquisition |
13,235,620 | 1.84 | ||||||||
|
Exercised |
(821,301) | 2.56 | ||||||||
|
Forfeited |
(3,703,821) | 6.76 | ||||||||
|
Options outstanding at December 31, 2014 |
16,375,595 |
$ |
2.30 | 8.34 | 11,591 | |||||
|
Options exercisable at December 31, 2014 |
8,851,580 |
$ |
1.30 | 6.82 | 9,431 | |||||
|
Options vested and expected to vest at December 31, 2014 |
16,083,930 |
$ |
2.30 | 7.87 | 11,515 | |||||
As of December 31, 2014, $15.1 million of total unrecognized compensation cost related to stock options is expected to be recognized over a weighted‑average period of approximately 2.7 years.
The aggregate intrinsic value of all options exercised during the years ended December 31, 2014, 2013 and 2012 was $2.8 million, $16.5 million and $36.9 million, respectively. The total fair value of shares which vested during the years ended December 31, 2014, 2013 and 2012 was $4.0 million, $3.1 million and $2.4 million, respectively.
Restricted Common Stock
In connection with the acquisition of Condaptive on May 6, 2011, the Company issued 1,448,080 shares of restricted common stock to the employee shareholders of Condaptive. Under the terms of the stock restriction agreements, a portion of the shares of common stock issued was released from restriction on May 6, 2012, the first anniversary of the issuance. Thereafter, shares of common stock will be released from restriction on a monthly basis over a period that expires between May 2014 and January 2015, depending on the individual award, so long as the shareholder remains an employee of the Company as of the date of each such release, until all of the common stock is released from restriction. If the shareholder’s employment terminates prior to the release of all shares from restriction, the shares not yet vested are subject to repurchase by the Company at a price of $0.001 per share. As of December 31, 2014, 1,448,053 of the shares had been released from restriction.
86
Restricted Stock Units (RSUs)
The following is a summary of RSU activity for the three-year period ended December 31, 2014:
|
Weighted-Average |
|||||
|
Grant Date |
|||||
|
Number |
Fair Value |
||||
|
RSUs outstanding at January 1, 2012 |
- |
$ |
- |
||
|
Granted |
485,465 | 12.69 | |||
|
Vested |
(40,916) | 12.56 | |||
|
Forfeited |
- |
- |
|||
|
RSUs outstanding at January 1, 2013 |
444,549 | 12.71 | |||
|
Granted |
1,105,190 | 6.89 | |||
|
Vested |
(341,251) | 11.15 | |||
|
Forfeited |
(31,200) | 8.96 | |||
|
RSUs outstanding at January 1, 2014 |
1,177,288 | 7.80 | |||
|
Granted |
5,296,670 | 3.16 | |||
|
Vested |
(1,145,969) | 7.24 | |||
|
Forfeited |
(778,556) | 6.39 | |||
|
RSUs outstanding at December 31, 2014 |
4,549,433 | 2.78 | |||
At December 31, 2014, unrecognized compensation expense related to the RSUs was $10.9 million. The unrecognized compensation expense is expected to be recognized over a weighted‑average period of approximately 2.5 years.
9. Income Taxes
The components of (loss) income before income tax for the years ended December 31 are as follows (in thousands):
|
|
|
|
|
|
|
|
|
|
|
|
|
|
2014 |
|
2013 |
|
2012 |
|||
|
Domestic |
|
$ |
(149,044) |
|
$ |
(15,001) |
|
$ |
(5,276) |
|
Foreign |
|
|
149 |
|
|
(159) |
|
|
(84) |
|
Total loss before income tax |
|
$ |
(148,895) |
|
$ |
(15,160) |
|
$ |
(5,360) |
The components of income tax (expense) benefit for the years ended December 31 are as follows (in thousands):
|
|
|
|
|
|
|
|
|
|
|
|
|
|
2014 |
|
2013 |
|
2012 |
|||
|
Federal |
|
$ |
- |
|
$ |
- |
|
$ |
- |
|
State and local |
|
|
(32) |
|
|
(10) |
|
|
(17) |
|
Foreign |
|
|
(160) |
|
|
57 |
|
|
(53) |
|
Total income tax (expense) benefit |
|
$ |
(192) |
|
$ |
47 |
|
$ |
(70) |
87
Total income tax (expense) benefit for the years ended December 31 is allocated as follows (in thousands):
|
|
|
|
|
|
|
|
|
|
|
|
|
|
2014 |
|
2013 |
|
2012 |
|||
|
Current |
|
$ |
(175) |
|
$ |
49 |
|
$ |
(70) |
|
Deferred |
|
|
(17) |
|
|
(2) |
|
|
- |
|
Total income tax (expense) benefit |
|
$ |
(192) |
|
$ |
47 |
|
$ |
(70) |
A reconciliation of the difference between the statutory federal income tax rate and the effective income tax rate for the years ended December 31 is as follows:
|
|
|
|
|
|
|
|
|
|
|
|
2014 |
|
2013 |
|
2012 |
|
|
U.S. statutory Federal rate |
|
35.0 |
% |
34.0 |
% |
34.0 |
% |
|
Increase (decrease) resulting from: |
|
|
|
|
|
|
|
|
Expenses not deductible for tax purposes |
|
(0.5) |
|
(4.3) |
|
(9.8) |
|
|
State income taxes, net of federal benefit |
|
2.1 |
|
3.3 |
|
(2.9) |
|
|
Stock compensation |
|
(1.4) |
|
1.5 |
|
(28.1) |
|
|
Acquisition-related costs |
|
(0.8) |
|
(8.4) |
|
- |
|
|
Goodwill impairment charge |
|
(13.4) |
|
- |
|
- |
|
|
Changes in valuation allowance for deferred income taxes |
|
(21.8) |
|
(25.6) |
|
5.1 |
|
|
Other |
|
0.7 |
|
(0.2) |
|
0.6 |
|
|
Effective tax rate |
|
(0.1) |
% |
0.3 |
% |
(1.1) |
% |
Deferred income taxes reflect the net tax effect of temporary differences that exist between the carrying amounts of assets and liabilities for financial reporting purposes and the amounts used for income tax purposes, using enacted tax rates in effect for the year in which the differences are expected to reverse. As of December 31, 2014, the Company had $260.9 million of federal net operating loss carryforwards, which expire at various dates through 2034. The gross amount of the state net operating loss carryforwards is equal to or less than the federal net operating loss carryforwards and expires over various periods based on individual state tax law. As of December 31, 2014, the Company had gross foreign net operating loss carryforwards of $55,000 that do not expire. In addition, the Company had $5.3 million of R&D credits which expire at various dates through 2034, of which $1.2 million were acquired from the Nexage acquisition.
At December 31, 2014, the Company had $35.9 million in excess tax benefits related to stock‑based compensation deductions, the benefit of which will be recorded to additional paid‑in‑capital once the benefit is realized through a reduction of income taxes payable. The Company uses the with‑and‑without approach when determining when excess tax benefits have been realized.
In general, businesses with U.S. net operating losses (“NOLs”) are considered loss corporations for U.S. federal income tax purposes. Pursuant to Section 382 of the Code, loss corporations that undergo an ownership change, as defined under the Code, may be subject to an annual limitation on the amount of NOLs (and certain other tax attributes) available to offset taxable income earned after such ownership change. The Company has performed an analysis of its ownership changes pursuant to the rules prescribed under U.S. tax law and preliminarily determined that it experienced two ownership changes since its inception. Based on this analysis, the Company’s NOLs and other tax attributes are limited under Section 382 of the Code, although the Company does not believe that such limitations will prevent the Company from utilizing its NOLs and other tax attributes in the future. Instead, the realizability of the Company’s U.S. NOLs and other tax attributes are dependent on the Company earning sufficient taxable income to utilize its NOLs prior to their respective expiration.
88
Components of deferred tax assets and liabilities:
The following summarizes the significant components of the Company’s deferred tax assets and liabilities as of December 31, 2014 and 2013 (in thousands):
|
|
|
|
|
|
|
|
|
|
|
2014 |
|
2013 |
||
|
Deferred tax assets: |
|
|
|
|
|
|
|
U.S. net operating loss carryforwards |
|
$ |
86,958 |
|
$ |
53,516 |
|
Foreign net operating loss carryforwards |
|
|
14 |
|
|
35 |
|
Reserves and accrued expenses |
|
|
1,535 |
|
|
2,264 |
|
Depreciation and amortization |
|
|
446 |
|
|
242 |
|
Stock compensation |
|
|
1,930 |
|
|
1,649 |
|
Tax credits |
|
|
3,985 |
|
|
2,454 |
|
Other deferred tax assets |
|
|
598 |
|
|
163 |
|
Gross deferred tax assets |
|
|
95,466 |
|
|
60,323 |
|
Deferred tax liabilities: |
|
|
|
|
|
|
|
Depreciation and amortization |
|
|
(12,662) |
|
|
(21,086) |
|
Internally developed software |
|
|
(397) |
|
|
(643) |
|
Prepaid expenses |
|
|
(1,059) |
|
|
(636) |
|
Other deferred tax liabilities |
|
|
(0) |
|
|
(51) |
|
Gross deferred tax liabilities |
|
|
(14,118) |
|
|
(22,416) |
|
Valuation allowance |
|
|
(81,374) |
|
|
(37,916) |
|
Net deferred tax liabilities, net of allowance |
|
$ |
(26) |
|
$ |
(9) |
Based upon the Company’s historical operating performance and the reported cumulative net losses to date, the Company presently does not have sufficient objective evidence to support the recovery of its net deferred tax assets. Accordingly, the Company has established a valuation allowance against its net deferred tax assets for financial reporting purposes because it is not more likely than not that these deferred tax assets will be realized.
The Company has subsidiaries in certain international jurisdictions, all of which have accumulated net losses since inception. The Company currently has no plans to repatriate any cash to the U.S. as it intends to permanently reinvest all future earnings internationally.
The following summarizes the significant components of gross unrecognized tax benefits as of December 31, 2014 and 2013 (in thousands):
|
|
|
|
|
|
|
|
|
|
|
2014 |
|
2013 |
||
|
Balance, beginning of year |
|
$ |
794 |
|
$ |
- |
|
Current year uncertain tax positions: |
|
|
|
|
|
|
|
Gross increases |
|
|
208 |
|
|
29 |
|
Gross increases—acquisition |
|
|
654 |
|
|
765 |
|
Prior year uncertain tax positions: |
|
|
|
|
|
|
|
Gross decrease |
|
|
(9) |
|
|
- |
|
Balance, end of year |
|
$ |
1,647 |
|
$ |
794 |
89
The Company’s net unrecognized income tax benefits include interest and penalties of approximately $32,000 and $0, at December 31, 2014 and 2013, respectively. The interest and penalties related to unrecognized income tax benefits are classified as a component of income tax expense. To the extent the Company continues to have a full valuation allowance against its deferred tax assets, any previously unrecognized income tax benefit that would be ultimately recognized would not impact income tax expense.
The Company files tax returns in the U.S. federal jurisdiction, as well as various U.S. state jurisdictions and certain international jurisdictions, where the Company has established subsidiaries. Currently, the Company is not currently under examination by any taxing authority. The tax years 2009 to 2013 remain open to examination by the taxing authorities. Though the statute for years prior to 2009 is closed for assessment of tax, the taxing authority has the ability to make adjustments to such tax years upon examination to determine the appropriate amount of net operating loss carryover to the open statute years.
10. Net Loss Per Common Share
Diluted loss per common share is the same as basic loss per common share for all periods presented as the effects of potentially dilutive items were anti‑dilutive given the Company’s net loss and net loss attributable to common stockholders. The following securities have been excluded from the calculation of weighted average common shares outstanding because the effect is anti‑dilutive:
|
|
|
|
|
|
|
|
|
|
|
Year Ended December 31, |
||||
|
|
|
2014 |
|
2013 |
|
2012 |
|
Stock options |
|
16,375,595 |
|
7,665,097 |
|
5,600,021 |
|
RSUs |
|
4,549,433 |
|
1,177,288 |
|
444,549 |
|
Unvested restricted common stock |
|
27 |
|
84,881 |
|
418,482 |
11. Segment and Geographic Information
Operating segments are defined as components of an enterprise about which separate financial information is available that is evaluated regularly by the chief operating decision maker, in deciding how to allocate resources and assess performance. The Company’s chief operating decision maker is its Chief Executive Officer (“CEO”). The CEO reviews financial information presented on a consolidated basis for purposes of allocating resources and evaluating financial performance. As such, the Company has concluded that its operations constitute one operating and reportable segment.
Substantially all assets were held in the United States for the years ended December 31, 2014, 2013 and 2012. The following table summarizes revenue generated through sales personnel employed by the Company’s U.S. and non‑U.S. subsidiaries (in thousands):
|
|
|
|
|
|
|
|
|
|
|
|
Year Ended December 31, |
|||||||
|
|
2014 |
|
2013 |
|
2012 |
|||
|
Revenues: |
|
|
|
|
|
|||
|
Domestic |
$ |
248,080 |
|
$ |
197,103 |
|
$ |
151,443 |
|
International |
|
48,084 |
|
|
62,068 |
|
|
26,224 |
|
Total |
$ |
296,164 |
|
$ |
259,171 |
|
$ |
177,667 |
12. Employee Benefit Plan
The Company has a defined contribution retirement plan (the “Plan”) available to all full‑time employees in the United States under Section 401(k) of the U.S. Internal Revenue Code. Eligible employees may elect to defer a percentage
90
of their annual compensation up to amounts prescribed by law. The Company made matching contributions of $914,000 and $720,000 to the Plan for the years ended December 31, 2014 and 2013, respectively. The Company did not make matching contributions to the Plan for the year ended December 31, 2012.
13. Quarterly Financial Data (unaudited) (in thousands, except per share data)
The following table sets forth certain unaudited quarterly financial data for 2014 and 2013. This unaudited information has been prepared on the same basis as the audited information included elsewhere in this Annual Report and includes all adjustments necessary to present fairly the information set forth therein. The operating results are not necessarily indicative of results for any future period.
|
|
|
|
|
|
|
|
|
|
|
|
|
|
|
|
|
Three Months Ended |
||||||||||
|
|
|
March 31, |
|
June 30, |
|
September 30, |
|
December 31, |
||||
|
|
|
2014 |
|
2014 |
|
2014 |
|
2014 |
||||
|
Revenue |
|
$ |
72,620 |
|
$ |
67,308 |
|
$ |
69,807 |
|
$ |
86,429 |
|
Gross profit |
|
|
29,895 |
|
|
27,031 |
|
|
26,410 |
|
|
33,070 |
|
Loss from operations |
|
|
(12,902) |
|
|
(15,044) |
|
|
(109,332) |
|
|
(11,472) |
|
Net loss |
|
$ |
(12,947) |
|
$ |
(15,090) |
|
$ |
(109,435) |
|
$ |
(11,616) |
|
Net loss per share: |
|
|
|
|
|
|
|
|
|
|
|
|
|
Basic and diluted |
|
$ |
(0.12) |
|
$ |
(0.14) |
|
$ |
(1.02) |
|
$ |
(0.10) |
|
|
|
|
|
|
|
|
|
|
|
|
|
|
|
|
|
Three Months Ended |
||||||||||
|
|
|
March 31, |
|
June 30, |
|
September 30, |
|
December 31, |
||||
|
|
|
2013 |
|
2013 |
|
2013 |
|
2013 |
||||
|
Revenue |
|
$ |
49,438 |
|
$ |
57,009 |
|
$ |
56,061 |
|
$ |
96,663 |
|
Gross profit |
|
|
20,564 |
|
|
24,185 |
|
|
22,201 |
|
|
37,447 |
|
Loss from operations |
|
|
(3,726) |
|
|
(3,022) |
|
|
(4,596) |
|
|
(3,798) |
|
Net loss |
|
$ |
(3,753) |
|
$ |
(3,053) |
|
$ |
(4,605) |
|
$ |
(3,703) |
|
Net loss per share: |
|
|
|
|
|
|
|
|
|
|
|
|
|
Basic and diluted |
|
$ |
(0.05) |
|
$ |
(0.04) |
|
$ |
(0.06) |
|
$ |
(0.04) |
Quarterly amounts in the tables above have been rounded and therefore may not sum to annual results by an immaterial amount.
14. Related Party Transactions
Wenda Harris Millard, a member of the Company’s Board of Directors, is president of, and an owner of equity interests in, MediaLink LLC. During the years ended December 31, 2014, 2013 and 2012, the Company paid MediaLink $243,000, $170,000 and $130,000, respectively, for strategic advisory and consulting services.
91
Item 9. Changes in and Disagreements with Accountants on Accounting and Financial Disclosure
None.
Item 9A. Controls and Procedures
Evaluation of Disclosure Controls and Procedures
Under the supervision of and with the participation of our management, including our chief executive officer, who is our principal executive officer, and our chief financial officer, who is our principal financial officer, we conducted an evaluation of the effectiveness of our disclosure controls and procedures as of December 31, 2014, the end of the period covered by this Annual Report. The term “disclosure controls and procedures,” as set forth in Rules 13a‑15(e) and 15d‑15(e) under the Securities Exchange Act of 1934, as amended, or the Exchange Act, means controls and other procedures of a company that are designed to provide reasonable assurance that information required to be disclosed by a company in the reports that it files or submits under the Exchange Act is recorded, processed, summarized and reported, within the time periods specified in the SEC’s rules and forms. Disclosure controls and procedures include, without limitation, controls and procedures designed to ensure that information required to be disclosed by a company in the reports that it files or submits under the Exchange Act is accumulated and communicated to the company’s management, including its principal executive and principal financial officers, as appropriate to allow timely decisions regarding required disclosure. Management recognizes that any controls and procedures, no matter how well designed and operated, can provide only reasonable assurance of achieving their objectives, and management necessarily applies its judgment in evaluating the cost‑benefit relationship of possible controls and procedures. Based on the evaluation of our disclosure controls and procedures as of December 31, 2014, our chief executive officer and chief financial officer concluded that, as of such date, our disclosure controls and procedures were effective at the reasonable assurance level.
Changes in Internal Control over Financial Reporting
We completed the acquisition of Nexage, Inc. (“Nexage”) on December 4, 2014. Management considers this transaction to be material to our consolidated financial statements and believes that the internal controls and procedures of Nexage have a material effect on our internal control over financial reporting. We are currently in the process of incorporating the internal controls and procedures of Nexage into our internal controls over financial reporting and extending our compliance program to include Nexage. We have excluded Nexage from the scope of our 2014 assessment of internal control over financial reporting as provided by applicable law and SEC rules and regulations concerning business combinations.
Other than the Nexage acquisition noted above, there have been no changes in our internal control over financial reporting (as defined in Rule 13a‑15(f)) identified in connection with the evaluation required by Rule 13a‑15(d) of the Exchange Act that occurred during the quarter ended December 31, 2014 that have materially affected, or are reasonably likely to materially affect, our internal control over financial reporting.
Management’s Report on Internal Control Over Financial Reporting and Attestation Report of Registered Public Accounting Firm
Our management is responsible for establishing and maintaining adequate internal control over financial reporting. Under the supervision and with the participation of our management, including our Chief Executive Officer and Chief Financial Officer, we assessed the effectiveness of our internal control over financial reporting as of December 31, 2014 based on the criteria set forth in the 2013 Internal Control—Integrated Framework issued by the Committee of Sponsoring Organizations of the Treadway Commission (COSO). Based on our assessment, management has concluded that, as of December 31, 2014, our internal control over financial reporting was effective based on those criteria.
Management has excluded the operations of Nexage from its assessment of internal control over financial reporting as of December 31, 2014. These assets acquired represented $20.8 million and $1.5 million of total and net assets, respectively as of December 31, 2014 and $1.4 million of total revenues for the year ended December 31, 2014.
92
The effectiveness of our internal control over financial reporting as of December 31, 2014 has been audited by Ernst & Young, LLP, an independent registered public accounting firm, as stated in their report, which is included in Part II, Item 8 of this Annual Report.
Not applicable.
93
We will file a definitive Proxy Statement for our 2015 Annual Meeting of Stockholders or our 2015 Proxy Statement with the SEC, pursuant to Regulation 14A, not later than 120 days after the end of our fiscal year. Accordingly, certain information required by Part III has been omitted under General Instruction G(3) to Form 10‑K. Only those sections of the 2015 Proxy Statement that specifically address the items set forth herein are incorporated by reference.
Item 10.Directors, Executive Officers and Corporate Governance
The information required by Item 10 is hereby incorporated by reference to the sections of our 2015 Proxy Statement under the captions “Board of Directors and Committees,” “Election of Directors,” “Management” and “Section 16(a) Beneficial Ownership Reporting Compliance.”
Item 11.Executive Compensation
The information required by Item 11 is hereby incorporated by reference to the sections of our 2015 Proxy Statement under the captions “Executive Compensation” and “Director Compensation.”
Item 12.Security Ownership of Certain Beneficial Owners and Management and Related Stockholder Matters
The information required by Item 12 is hereby incorporated by reference to the sections of our 2015 Proxy Statement under the captions “Security Ownership of Certain Beneficial Owners and Management” and “Securities Authorized for Issuance under Equity Compensation Plans.”
Item 13.Certain Relationships and Related Transactions, and Director Independence
The information required by Item 13 is hereby incorporated by reference to the sections of our 2015 Proxy Statement under the captions “Transactions with Related Parties” and “Director Independence.”
Item 14.Principal Accountant Fees and Services
The information required by Item 14 is hereby incorporated by reference to the section of our 2015 Proxy Statement under the caption “Independent Registered Public Accounting Firm Fees.”
94
Item 15.Exhibits and Financial Statement Schedules
|
(a) |
Exhibits |
|
Exhibit |
|
Description of Document |
| 2.1 |
(1) |
Agreement and Plan of Merger, dated as of February 15, 2013, by and among Millennial Media, Inc., Mojo Merger Sub, Inc., Metaresolver, Inc. and Michael Dearing, as the Stockholders’ Representative. |
| 2.2 |
(2) |
Amendment to Agreement and Plan of Merger and Consent, dated as of March 31, 2013, by and between Millennial Media, Inc. and Metaresolver, Inc. |
| 2.3 |
(3) |
Agreement and Plan of Reorganization, dated as of August 13, 2013, by and among Millennial Media, Inc., Polo Corp, and Jumptap, Inc. |
| 2.4 |
(4) |
First Amendment to Agreement and Plan of Reorganization, dated as of November 1, 2013, by and between Millennial Media, Inc., and Jumptap, Inc. |
| 2.5 |
(5) |
Agreement and Plan of Merger, dated as of September 23, 2014, by and among Millennial Media, Inc., Nexage, Inc., Neptune Merger Sub I, Inc., Neptune Merger Sub II, LLC, and Fortis Advisors LLC. |
| 2.6 |
(6) |
Amended and Restated Agreement and Plan of Merger, dated as of October 31, 2014, by and among Millennial Media, Inc., Nexage, Inc., Neptune Merger Sub I, Inc., Neptune Merger Sub II, LLC, and Fortis Advisors LLC. |
| 3.1 |
(7) |
Amended and Restated Certificate of Incorporation. |
| 3.2 |
(8) |
Amended and Restated Bylaws. |
| 4.1 |
(9) |
Specimen stock certificate evidencing shares of Common Stock. |
| 10.1 |
(10) |
Amended and Restated Loan and Security Agreement, dated as of November 21, 2014, by and between the Registrant and Silicon Valley Bank. |
| 10.2 |
(11) |
Third Amended and Restated Investor Rights Agreement, dated as of December 23, 2010, by and among the Registrant and certain of its stockholders. |
| 10.3 |
(12) |
Commercial Lease, dated as of December 27, 2013, by and between the Registrant and The Can Company LLC. |
| 10.4 |
(13) |
Sublease, dated as of February 4, 2011, by and between the Registrant and TravelClick, Inc., including First Addendum, dated as of March 1, 2011. |
| 10.5 |
|
First Addendum to Lease Agreement, dated as of September 25, 2014, by and between the Registrant and The Can Company LLC. |
| 10.6 |
(14)+ |
2006 Equity Incentive Plan, as amended. |
| 10.7 |
(15)+ |
Form of Stock Option Agreement under 2006 Equity Incentive Plan. |
| 10.8 |
(16)+ |
2012 Equity Incentive Plan. |
|
|
|
|
| 10.9 |
(17)+ |
Form of Stock Option Grant Notice and Stock Option Agreement under 2012 Equity Incentive Plan. |
|
|
|
|
| 10.10 |
(18)+ |
Form of Restricted Stock Unit Grant Notice and Restricted Stock Unit Agreement under 2012 Equity Incentive Plan. |
|
|
|
|
| 10.11 |
(19)+ |
Amended and Restated Jumptap, Inc. 2005 Stock Option and Grant Plan, as amended. |
|
|
|
|
| 10.12 |
(20)+ |
2014 Equity Inducement Plan. |
|
|
|
|
| 10.13 |
(21)+ |
Form of Stock Option Grant Notice and Stock Option Agreement under 2014 Equity Inducement Plan. |
95
|
Exhibit |
|
Description of Document |
| 10.14 |
(22)+ |
Form of Restricted Stock Unit Grant Notice and Restricted Stock Unit Agreement under 2014 Equity Inducement Plan. |
|
|
|
|
| 10.15 |
(23)+ |
Form of Stock Option Grant Notice and Stock Option Agreement for Assumed Awards. |
|
|
|
|
| 10.16 |
(24)+ |
Form of Indemnification Agreement entered into between the Registrant and its directors and executive officers. |
|
|
|
|
| 10.17 |
(25)+ |
Amended and Restated Key Employee Agreement, dated as of March 14, 2012, by and between the Registrant and Paul Palmieri. |
|
|
|
|
| 10.18 |
(26)+ |
Key Employee Agreement, dated as of January 25, 2014, by and between the Registrant and Michael G. Barrett. |
|
|
|
|
| 10.19 |
(27)+ |
Key Employee Agreement, dated as of August 27, 2014, by and between the Registrant and Andrew Jeanneret. |
|
|
|
|
| 10.20 |
+ |
Key Employee Agreement, dated as of September 30, 2014, by and between the Registrant and Jason Kelly. |
|
|
|
|
| 10.21 |
+ |
Offer Letter, dated as of April 24, 2014, by and between the Registrant and Marc Theerman. |
|
|
|
|
| 10.22 |
(28)+ |
Separation Agreement, dated as of January 25, 2014, by and between the Registrant and Paul Palmieri. |
|
|
|
|
| 10.23 |
(29)+ |
Consulting Agreement, dated as of January 25, 2014, by and between the Registrant and Paul Palmieri. |
|
|
|
|
| 10.24 |
+ |
2014 Bonus Plan for executive officers. |
|
|
|
|
| 21.1 |
|
Subsidiaries of the Registrant. |
|
|
|
|
| 23.1 |
|
Consent of Ernst & Young LLP, independent registered public accounting firm. |
|
|
|
|
| 24.1 |
|
Power of Attorney (contained on signature page hereto). |
|
|
|
|
| 31.1 |
|
Certification of Principal Executive Officer pursuant to Rules 13a‑14(a) and 15d‑14(a) promulgated under the Securities Exchange Act of 1934, as adopted pursuant to section 302 of the Sarbanes‑Oxley Act of 2002. |
|
|
|
|
| 31.2 |
|
Certification of Principal Financial Officer pursuant to Rules 13a‑14(a) and 15d‑14(a) promulgated under the Securities Exchange Act of 1934, as adopted pursuant to section 302 of the Sarbanes‑Oxley Act of 2002. |
|
|
|
|
| 32 |
* |
Certification of Principal Executive Officer and Principal Financial Officer pursuant to Rules 13a‑14(b) and 15d‑14(b) promulgated under the Securities Exchange Act of 1934 and 18 U.S.C. Section 1350, as adopted pursuant to section 906 of The Sarbanes‑Oxley Act of 2002. |
|
|
|
|
|
101.INS |
|
XBRL Instance Document |
|
|
|
|
|
101.SC |
H |
XBRL Taxonomy Extension Schema Document |
|
|
|
|
|
101.CA |
L |
XBRL Taxonomy Extension Calculation Linkbase Document |
|
|
|
|
|
101.DE |
F |
XBRL Taxonomy Extension Definition Linkbase Document |
|
|
|
|
|
101.LA |
B |
XBRL Taxonomy Extension Label Linkbase Document |
|
|
|
|
|
101.PR |
E |
XBRL Taxonomy Extension Presentation Linkbase Document |
*These certifications are being furnished solely to accompany this Annual Report pursuant to 18 U.S.C. Section 1350, and are not being filed for purposes of Section 18 of the Securities Exchange Act of 1934, as
96
amended, and are not to be incorporated by reference into any filing of the Registrant, whether made before or after the date hereof, regardless of any general incorporation language in such filing.
+Indicates management contract or compensatory plan.
|
(1) |
Previously filed as Exhibit 2.1 to the Registrant’s Quarterly Report on Form 10‑Q (File No. 001‑35478), filed with the Commission on May 9, 2013, and incorporated by reference herein. |
|
(2) |
Previously filed as Exhibit 2.2 to the Registrant’s Quarterly Report on Form 10‑Q (File No. 001‑35478), filed with the Commission on May 9, 2013, and incorporated by reference herein. |
|
(3) |
Previously filed as Exhibit 2.1 to the Registrant’s Current Report on Form 8‑K (File No. 001‑35478), filed with the Commission on August 19, 2013, and incorporated by reference herein. |
|
(4) |
Previously filed as Exhibit 2.2 to the Registrant’s Current Report on Form 8‑K (File No. 001‑35478), filed with the Commission on November 8, 2013, and incorporated by reference herein. |
|
(5) |
Previously filed as Exhibit 2.1 to the Registrant’s Current Report on Form 8-K (File No. 001-35478), filed with the Commission on September 23, 2014, and incorporated by reference herein. |
|
(6) |
Previously filed as Exhibit 2.4 to the Registrant’s Quarterly Report on Form 10-Q (File No. 001-35478), filed with the Commission on November 10, 2014, and incorporated by reference herein. |
|
(7) |
Previously filed as Exhibit 3.1 to the Registrant’s Current Report on Form 8‑K (File No. 001‑35478), filed with the Commission on April 3, 2012, and incorporated by reference herein. |
|
(8) |
Previously filed as Exhibit 3.2 to the Registrant’s Current Report on Form 8‑K (File No. 001‑35478), filed with the Commission on April 3, 2012, and incorporated by reference herein. |
|
(9) |
Previously filed as Exhibit 4.2 to Amendment No. 4 to the Registrant’s Registration Statement on Form S-1 (File No. 333‑178909), filed with the Commission on March 15, 2012, and incorporated by reference herein. |
|
(10) |
Previously filed as Exhibit 10.1 to the Registrant’s Current Report on Form 8‑K (File No. 001‑35478), filed with the Commission on November 25, 2014, and incorporated by reference herein. |
|
(11) |
Previously filed as Exhibit 10.3 to the Registrant’s Registration Statement on Form S‑1 (File No. 333‑178909), filed with the Commission on January 5, 2012, and incorporated by reference herein. |
|
(12) |
Previously filed as Exhibit 10.3 to the Registrant’s Annual Report on Form 10-K (File No. 001-35478), filed with the Commission on March 3, 2014, and incorporated by reference herein. |
|
(13) |
Previously filed as Exhibit 10.5 to the Registrant’s Registration Statement on Form S‑1 (File No. 333‑178909), filed with the Commission on January 5, 2012, and incorporated by reference herein. |
|
(14) |
Previously filed as Exhibit 10.7 to the Registrant’s Registration Statement on Form S‑1 (File No. 333‑178909), filed with the Commission on January 5, 2012, and incorporated by reference herein. |
|
(15) |
Previously filed as Exhibit 10.8 to the Registrant’s Registration Statement on Form S‑1 (File No. 333‑178909), filed with the Commission on January 5, 2012, and incorporated by reference herein. |
|
(16) |
Previously filed as Exhibit 4.7 to the Registrant’s Registration Statement on Form S‑8 (Registration No. 333‑180540) filed with the Securities and Exchange Commission on April 3, 2012 and incorporated by reference herein. |
97
|
(17) |
Previously filed as Exhibit 10.10 to Amendment No. 3 to the Registrant’s Registration Statement on Form S‑1 (File No. 333‑178909), filed with the Commission on March 8, 2012, and incorporated by reference herein. |
|
(18) |
Previously filed as Exhibit 10.11 to Amendment No. 3 to the Registrant’s Registration Statement on Form S‑1 (File No. 333‑178909), filed with the Commission on March 8, 2012, and incorporated by reference herein. |
|
(19) |
Previously filed as Exhibit 4.4 to the Registrant’s Registration Statement on Form S‑8 (Registration No. 333‑192139) filed with the Securities and Exchange Commission on November 6, 2013 and incorporated by reference herein. |
|
(20) |
Previously filed as Exhibit 4.4 to the Registrant’s Registration Statement on Form S‑8 (Registration No. 333‑200962) filed with the Securities and Exchange Commission on December 15, 2014 and incorporated by reference herein. |
|
(21) |
Previously filed as Exhibit 4.5 to the Registrant’s Registration Statement on Form S‑8 (Registration No. 333‑200962) filed with the Securities and Exchange Commission on December 15, 2014 and incorporated by reference herein. |
|
(22) |
Previously filed as Exhibit 4.6 to the Registrant’s Registration Statement on Form S‑8 (Registration No. 333‑200962) filed with the Securities and Exchange Commission on December 15, 2014 and incorporated by reference herein. |
|
(23) |
Previously filed as Exhibit 4.7 to the Registrant’s Registration Statement on Form S‑8 (Registration No. 333‑200962) filed with the Securities and Exchange Commission on December 15, 2014 and incorporated by reference herein. |
|
(24) |
Previously filed as Exhibit 10.12 to Amendment No. 3 to the Registrant’s Registration Statement on Form S‑1 (File No. 333‑178909), filed with the Commission on March 8, 2012, and incorporated by reference herein. |
|
(25) |
Previously filed as Exhibit 10.1 to the Registrant’s Quarterly Report on Form 10‑Q (File No. 001‑35478), filed with the Commission on May 15, 2012, and incorporated by reference herein. |
|
(26) |
Previously filed as Exhibit 10.16 to the Registrant’s Annual Report on Form 10-K (File No. 001-35478), filed with the Commission on March 3, 2014, and incorporated by reference herein. |
|
(27) |
Previously filed as Exhibit 10.1 to the Registrant’s Quarterly Report on Form 10‑Q (File No. 001‑35478), filed with the Commission on November 10, 2014, and incorporated by reference herein. |
|
(28) |
Previously filed as Exhibit 10.17 to the Registrant’s Annual Report on Form 10-K (File No. 001-35478), filed with the Commission on March 3, 2014, and incorporated by reference herein. |
|
(29) |
Previously filed as Exhibit 10.18 to the Registrant’s Annual Report on Form 10-K (File No. 001-35478), filed with the Commission on March 3, 2014, and incorporated by reference herein. |
98
(b)Financial Statement Schedules
Schedule II—Valuation and Qualifying Accounts (in thousands)
|
|
|
|
|
|
|
|
|
|
|
|
|
|
|
|
|
|
Additions |
|
|
|
|
|
|
|
|
|
|
|
|
Charged To |
|
|
|
|
|
|
|
|
|
|
Balance at |
Expense/ |
Additions |
|
|
Balance at |
||||
|
|
|
Beginning |
Against |
from |
|
|
End of |
||||
|
|
|
of Period |
Revenue |
Acquisitions |
Deductions |
Period |
|||||
|
Allowance for doubtful accounts and sales credits: |
|
|
|
|
|
|
|
|
|
|
|
|
Year ended December 31, 2014 |
|
$ |
4,773 |
$ |
1,290 |
$ |
41 |
$ |
(3,088) |
$ |
3,016 |
|
Year ended December 31, 2013 |
|
|
2,673 |
|
6,219 |
|
1,062 |
|
(5,181) |
|
4,773 |
|
Year ended December 31, 2012 |
|
|
1,215 |
|
1,887 |
|
- |
|
(429) |
|
2,673 |
|
Valuation allowance for deferred tax assets: |
|
|
|
|
|
|
|
|
|
|
|
|
Year ended December 31, 2014 |
|
$ |
37,916 |
$ |
32,001 |
$ |
11,457 |
$ |
- |
$ |
81,374 |
|
Year ended December 31, 2013 |
|
|
9,304 |
|
3,878 |
|
24,734 |
|
- |
|
37,916 |
|
Year ended December 31, 2012 |
|
|
9,577 |
|
(273) |
|
- |
|
- |
|
9,304 |
99
Pursuant to the requirements of Section 13 or 15(d) of the Securities Exchange Act of 1934, as amended, the registrant has duly caused this report to be signed on its behalf by the undersigned, thereunto duly authorized.
|
|
Millennial Media, Inc. |
|
|
|
By: |
/s/ Michael G. Barrett |
|
|
|
Michael G. Barrett |
Date: March 11, 2015
100
KNOW ALL PERSONS BY THESE PRESENTS, that each person whose signature appears below constitutes and appoints Andrew Jeanneret and Ho S. Shin, jointly and severally, as his or her true and lawful attorneys‑in‑fact and agents, with full power of substitution and resubstitution, for him or her and in his or her name, place and stead, in any and all capacities, to sign this Annual Report on Form 10‑K of Millennial Media, Inc., and any or all amendments (including post‑effective amendments) thereto, and to file the same, with all exhibits thereto, and other documents in connection therewith, with the Securities and Exchange Commission, granting unto said attorneys‑in‑fact and agents full power and authority to do and perform each and every act and thing requisite or necessary to be done in and about the premises hereby ratifying and confirming all that said attorneys‑in‑fact and agents, or his or their substitute or substitutes, may lawfully do or cause to be done by virtue hereof.
Pursuant to the requirements of the Securities Exchange Act of 1934, as amended, this report has been signed below by the following persons on behalf of the registrant and in the capacities and on the dates indicated.
|
|
|
|
|
Signature |
Title |
Date |
|
/s/ Michael G. Barrett Michael G. Barrett |
President, Chief Executive Officer and Director (Principal Executive Officer) |
March 11, 2015 |
|
/s/ Andrew Jeanneret Andrew Jeanneret |
Executive Vice President and Chief Financial Officer (Principal Financial Officer) |
March 11, 2015 |
|
/s/ Michael Kocorowski Michael Kocorowski |
Senior Vice President and Chief Accounting Officer (Principal Accounting Officer) |
March 11, 2015 |
|
/s/ Robert P. Goodman Robert P. Goodman |
Director |
March 11, 2015 |
|
/s/ Patrick J. Kerins Patrick J. Kerins |
Director |
March 11, 2015 |
|
/s/ Wenda Harris Millard Wenda Harris Millard |
Director |
March 11, 2015 |
|
/s/ James A. Tholen James A. Tholen |
Director |
March 11, 2015 |
|
/s/ Thomas R. Evans Thomas R. Evans |
Director |
March 11, 2015 |
|
/s/ Ross B. Levinsohn Ross B. Levinsohn |
Director |
March 11, 2015 |
|
/s/ Ernest Cormier Ernest Cormier |
Director |
March 11, 2015 |
101
EXHIBIT INDEX
|
|
|
|
|
Exhibit |
|
Description of Document |
| 2.1 |
(1) |
Agreement and Plan of Merger, dated as of February 15, 2013, by and among Millennial Media, Inc., Mojo Merger Sub, Inc., Metaresolver, Inc. and Michael Dearing, as the Stockholders’ Representative. |
|
|
|
|
| 2.2 |
(2) |
Amendment to Agreement and Plan of Merger and Consent, dated as of March 31, 2013, by and between Millennial Media, Inc. and Metaresolver, Inc. |
|
|
|
|
| 2.3 |
(3) |
Agreement and Plan of Reorganization, dated as of August 13, 2013, by and among Millennial Media, Inc., Polo Corp, and Jumptap, Inc. |
|
|
|
|
| 2.4 |
(4) |
First Amendment to Agreement and Plan of Reorganization, dated as of November 1, 2013, by and between Millennial Media, Inc., and Jumptap, Inc. |
|
|
|
|
| 2.5 |
(5) |
Agreement and Plan of Merger, dated as of September 23, 2014, by and among Millennial Media, Inc., Nexage, Inc., Neptune Merger Sub I, Inc., Neptune Merger Sub II, LLC, and Fortis Advisors LLC. |
|
|
|
|
| 2.6 |
(6) |
Amended and Restated Agreement and Plan of Merger, dated as of October 31, 2014, by and among Millennial Media, Inc., Nexage, Inc., Neptune Merger Sub I, Inc., Neptune Merger Sub II, LLC, and Fortis Advisors LLC. |
|
|
|
|
| 3.1 |
(7) |
Amended and Restated Certificate of Incorporation. |
|
|
|
|
| 3.2 |
(8) |
Amended and Restated Bylaws. |
|
|
|
|
| 4.1 |
(9) |
Specimen stock certificate evidencing shares of Common Stock. |
|
|
|
|
| 10.1 |
(10) |
Amended and Restated Loan and Security Agreement, dated as of November 21, 2014, by and between the Registrant and Silicon Valley Bank. |
|
|
|
|
| 10.2 |
(11) |
Third Amended and Restated Investor Rights Agreement, dated as of December 23, 2010, by and among the Registrant and certain of its stockholders. |
|
|
|
|
| 10.3 |
(12) |
Commercial Lease, dated as of December 27, 2013, by and between the Registrant and The Can Company LLC. |
|
|
|
|
| 10.4 |
(13) |
Sublease, dated as of February 4, 2011, by and between the Registrant and TravelClick, Inc., including First Addendum, dated as of March 1, 2011. |
|
|
|
|
| 10.5 |
|
First Addendum to Lease Agreement, dated as of September 25, 2014, by and between the Registrant and The Can Company LLC. |
|
|
|
|
| 10.6 |
(14)+ |
2006 Equity Incentive Plan, as amended. |
|
|
|
|
| 10.7 |
(15)+ |
Form of Stock Option Agreement under 2006 Equity Incentive Plan. |
|
|
|
|
| 10.8 |
(16)+ |
2012 Equity Incentive Plan. |
|
|
|
|
| 10.9 |
(17)+ |
Form of Stock Option Grant Notice and Stock Option Agreement under 2012 Equity Incentive Plan. |
|
|
|
|
| 10.10 |
(18)+ |
Form of Restricted Stock Unit Grant Notice and Restricted Stock Unit Agreement under 2012 Equity Incentive Plan. |
|
|
|
|
| 10.11 |
(19)+ |
Amended and Restated Jumptap, Inc. 2005 Stock Option and Grant Plan, as amended. |
|
|
|
|
| 10.12 |
(20)+ |
2014 Equity Inducement Plan. |
|
|
|
|
| 10.13 |
(21)+ |
Form of Stock Option Grant Notice and Stock Option Agreement under 2014 Equity Inducement Plan. |
|
|
|
|
| 10.14 |
(22)+ |
Form of Restricted Stock Unit Grant Notice and Restricted Stock Unit Agreement under 2014 Equity Inducement Plan. |
102
|
Exhibit |
|
Description of Document |
| 10.15 |
(23)+ |
Form of Stock Option Grant Notice and Stock Option Agreement for Assumed Awards. |
|
|
|
|
| 10.16 |
(24)+ |
Form of Indemnification Agreement entered into between the Registrant and its directors and executive officers. |
|
|
|
|
| 10.17 |
(25)+ |
Amended and Restated Key Employee Agreement, dated as of March 14, 2012, by and between the Registrant and Paul Palmieri. |
|
|
|
|
| 10.18 |
(26)+ |
Key Employee Agreement, dated as of January 25, 2014, by and between the Registrant and Michael G. Barrett. |
|
|
|
|
| 10.19 |
(27)+ |
Key Employee Agreement, dated as of August 27, 2014, by and between the Registrant and Andrew Jeanneret. |
|
|
|
|
| 10.20 |
+ |
Key Employee Agreement, dated as of September 30, 2014, by and between the Registrant and Jason Kelly. |
|
|
|
|
| 10.21 |
+ |
Key Employment Agreement, dated as of April 24, 2014, by and between the Registrant and Marc Theerman. |
|
|
|
|
| 10.22 |
(28)+ |
Separation Agreement, dated as of January 25, 2014, by and between the Registrant and Paul Palmieri. |
|
|
|
|
| 10.23 |
(29)+ |
Consulting Agreement, dated as of January 25, 2014, by and between the Registrant and Paul Palmieri. |
|
|
|
|
| 10.24 |
+ |
2014 Bonus Plan for executive officers. |
|
|
|
|
| 21.1 |
|
Subsidiaries of the Registrant. |
|
|
|
|
| 23.1 |
|
Consent of Ernst & Young LLP, independent registered public accounting firm. |
|
|
|
|
| 24.1 |
|
Power of Attorney (contained on signature page hereto). |
|
|
|
|
| 31.1 |
|
Certification of Principal Executive Officer pursuant to Rules 13a‑14(a) and 15d‑14(a) promulgated under the Securities Exchange Act of 1934, as adopted pursuant to section 302 of the Sarbanes‑Oxley Act of 2002. |
|
|
|
|
| 31.2 |
|
Certification of Principal Financial Officer pursuant to Rules 13a‑14(a) and 15d‑14(a) promulgated under the Securities Exchange Act of 1934, as adopted pursuant to section 302 of the Sarbanes‑Oxley Act of 2002. |
|
|
|
|
| 32 |
* |
Certification of Principal Executive Officer and Principal Financial Officer pursuant to Rules 13a‑14(b) and 15d‑14(b) promulgated under the Securities Exchange Act of 1934 and 18 U.S.C. Section 1350, as adopted pursuant to section 906 of The Sarbanes‑Oxley Act of 2002. |
|
|
|
|
|
101.INS |
|
XBRL Instance Document |
|
|
|
|
|
101.SC |
H |
XBRL Taxonomy Extension Schema Document |
|
|
|
|
|
101.CA |
L |
XBRL Taxonomy Extension Calculation Linkbase Document |
|
|
|
|
|
101.DE |
F |
XBRL Taxonomy Extension Definition Linkbase Document |
|
|
|
|
|
101.LA |
B |
XBRL Taxonomy Extension Label Linkbase Document |
|
|
|
|
|
101.PRE |
|
XBRL Taxonomy Extension Presentation Linkbase Document |
*These certifications are being furnished solely to accompany this Annual Report pursuant to 18 U.S.C. Section 1350, and are not being filed for purposes of Section 18 of the Securities Exchange Act of 1934, as
103
amended, and are not to be incorporated by reference into any filing of the Registrant, whether made before or after the date hereof, regardless of any general incorporation language in such filing.
+Indicates management contract or compensatory plan.
|
(1) |
Previously filed as Exhibit 2.1 to the Registrant’s Quarterly Report on Form 10‑Q (File No. 001‑35478), filed with the Commission on May 9, 2013, and incorporated by reference herein. |
|
(2) |
Previously filed as Exhibit 2.2 to the Registrant’s Quarterly Report on Form 10‑Q (File No. 001‑35478), filed with the Commission on May 9, 2013, and incorporated by reference herein. |
|
(3) |
Previously filed as Exhibit 2.1 to the Registrant’s Current Report on Form 8‑K (File No. 001‑35478), filed with the Commission on August 19, 2013, and incorporated by reference herein. |
|
(4) |
Previously filed as Exhibit 2.2 to the Registrant’s Current Report on Form 8‑K (File No. 001‑35478), filed with the Commission on November 8, 2013, and incorporated by reference herein. |
|
(5) |
Previously filed as Exhibit 2.1 to the Registrant’s Current Report on Form 8-K (File No. 001-35478), filed with the Commission on September 23, 2014, and incorporated by reference herein. |
|
(6) |
Previously filed as Exhibit 2.4 to the Registrant’s Quarterly Report on Form 10-Q (File No. 001-35478), filed with the Commission on November 10, 2014, and incorporated by reference herein. |
|
(7) |
Previously filed as Exhibit 3.1 to the Registrant’s Current Report on Form 8‑K (File No. 001‑35478), filed with the Commission on April 3, 2012, and incorporated by reference herein. |
|
(8) |
Previously filed as Exhibit 3.2 to the Registrant’s Current Report on Form 8‑K (File No. 001‑35478), filed with the Commission on April 3, 2012, and incorporated by reference herein. |
|
(9) |
Previously filed as Exhibit 4.2 to Amendment No. 4 to the Registrant’s Registration Statement on Form S-1 (File No. 333‑178909), filed with the Commission on March 15, 2012, and incorporated by reference herein. |
|
(10) |
Previously filed as Exhibit 10.1 to the Registrant’s Current Report on Form 8‑K (File No. 001‑35478), filed with the Commission on November 25, 2014, and incorporated by reference herein. |
|
(11) |
Previously filed as Exhibit 10.3 to the Registrant’s Registration Statement on Form S‑1 (File No. 333‑178909), filed with the Commission on January 5, 2012, and incorporated by reference herein. |
|
(12) |
Previously filed as Exhibit 10.3 to the Registrant’s Annual Report on Form 10-K (File No. 001-35478), filed with the Commission on March 3, 2014, and incorporated by reference herein. |
|
(13) |
Previously filed as Exhibit 10.5 to the Registrant’s Registration Statement on Form S‑1 (File No. 333‑178909), filed with the Commission on January 5, 2012, and incorporated by reference herein. |
|
(14) |
Previously filed as Exhibit 10.7 to the Registrant’s Registration Statement on Form S‑1 (File No. 333‑178909), filed with the Commission on January 5, 2012, and incorporated by reference herein. |
|
(15) |
Previously filed as Exhibit 10.8 to the Registrant’s Registration Statement on Form S‑1 (File No. 333‑178909), filed with the Commission on January 5, 2012, and incorporated by reference herein. |
|
(16) |
Previously filed as Exhibit 4.7 to the Registrant’s Registration Statement on Form S‑8 (Registration No. 333‑180540) filed with the Securities and Exchange Commission on April 3, 2012 and incorporated by reference herein. |
104
|
(17) |
Previously filed as Exhibit 10.10 to Amendment No. 3 to the Registrant’s Registration Statement on Form S‑1 (File No. 333‑178909), filed with the Commission on March 8, 2012, and incorporated by reference herein. |
|
(18) |
Previously filed as Exhibit 10.11 to Amendment No. 3 to the Registrant’s Registration Statement on Form S‑1 (File No. 333‑178909), filed with the Commission on March 8, 2012, and incorporated by reference herein. |
|
(19) |
Previously filed as Exhibit 4.4 to the Registrant’s Registration Statement on Form S‑8 (Registration No. 333‑192139) filed with the Securities and Exchange Commission on November 6, 2013 and incorporated by reference herein. |
|
(20) |
Previously filed as Exhibit 4.4 to the Registrant’s Registration Statement on Form S‑8 (Registration No. 333‑200962) filed with the Securities and Exchange Commission on December 15, 2014 and incorporated by reference herein. |
|
(21) |
Previously filed as Exhibit 4.5 to the Registrant’s Registration Statement on Form S‑8 (Registration No. 333‑200962) filed with the Securities and Exchange Commission on December 15, 2014 and incorporated by reference herein. |
|
(22) |
Previously filed as Exhibit 4.6 to the Registrant’s Registration Statement on Form S‑8 (Registration No. 333‑200962) filed with the Securities and Exchange Commission on December 15, 2014 and incorporated by reference herein. |
|
(23) |
Previously filed as Exhibit 4.7 to the Registrant’s Registration Statement on Form S‑8 (Registration No. 333‑200962) filed with the Securities and Exchange Commission on December 15, 2014 and incorporated by reference herein. |
|
(24) |
Previously filed as Exhibit 10.12 to Amendment No. 3 to the Registrant’s Registration Statement on Form S‑1 (File No. 333‑178909), filed with the Commission on March 8, 2012, and incorporated by reference herein. |
|
(25) |
Previously filed as Exhibit 10.1 to the Registrant’s Quarterly Report on Form 10‑Q (File No. 001‑35478), filed with the Commission on May 15, 2012, and incorporated by reference herein. |
|
(26) |
Previously filed as Exhibit 10.16 to the Registrant’s Annual Report on Form 10-K (File No. 001-35478), filed with the Commission on March 3, 2014, and incorporated by reference herein. |
|
(27) |
Previously filed as Exhibit 10.1 to the Registrant’s Quarterly Report on Form 10‑Q (File No. 001‑35478), filed with the Commission on November 10, 2014, and incorporated by reference herein. |
|
(28) |
Previously filed as Exhibit 10.17 to the Registrant’s Annual Report on Form 10-K (File No. 001-35478), filed with the Commission on March 3, 2014, and incorporated by reference herein. |
|
(29) |
Previously filed as Exhibit 10.18 to the Registrant’s Annual Report on Form 10-K (File No. 001-35478), filed with the Commission on March 3, 2014, and incorporated by reference herein. |
105