Attached files
| file | filename |
|---|---|
| EX-23.1 - EX-23.1 - On Deck Capital, Inc. | d851079dex231.htm |
| EX-32.1 - EX-32.1 - On Deck Capital, Inc. | d851079dex321.htm |
| EX-32.2 - EX-32.2 - On Deck Capital, Inc. | d851079dex322.htm |
| EX-31.2 - EX-31.2 - On Deck Capital, Inc. | d851079dex312.htm |
| EX-31.1 - EX-31.1 - On Deck Capital, Inc. | d851079dex311.htm |
| EX-10.16 - EX-10.16 - On Deck Capital, Inc. | d851079dex1016.htm |
| EX-10.21 - EX-10.21 - On Deck Capital, Inc. | d851079dex1021.htm |
Table of Contents
UNITED STATES
SECURITIES AND EXCHANGE COMMISSION
Washington, D.C. 20549
FORM 10-K
(MARK ONE)
| x | ANNUAL REPORT PURSUANT TO SECTION 13 OR 15(d) OF THE SECURITIES EXCHANGE ACT OF 1934 |
FOR THE FISCAL YEAR ENDED DECEMBER 31, 2014
OR
| ¨ | TRANSITION REPORT PURSUANT TO SECTION 13 OR 15(d) OF THE SECURITIES EXCHANGE ACT OF 1934 |
FOR THE TRANSITION PERIOD FROM TO
Commission File Number 001-36779
On Deck Capital, Inc.
(Exact name of registrant as specified in its charter)
| Delaware | 42-1709682 | |
| (State or other jurisdiction of incorporation or organization) |
(I.R.S. Employer Identification No.) |
1400 Broadway, 25th Floor
New York, New York 10018
(Address of principal executive offices)
(888) 269-4246
(Registrant’s telephone number, including area code)
Securities registered pursuant to Section 12(b) of the Act:
| Title of each class |
Name of each exchange on which registered | |
| Common Stock, par value $0.005 per share | New York Stock Exchange |
Securities registered pursuant to Section 12(g) of the Act:
None.
Indicate by check mark if the registrant is a well-known seasoned issuer, as defined in Rule 405 of the Securities Act. YES ¨ NO x
Indicate by check mark whether the registrant is not required to file reports pursuant to Section 13 or Section 15(d) of the Act. YES ¨ NO x
Indicate by check mark whether the registrant (1) has filed all reports required to be filed by Section 13 or 15(d) of the Securities Exchange Act of 1934 during the preceding 12 months (or for such shorter period that the registrant was required to file such reports), and (2) has been subject to such filing requirements for the past 90 days. YES ¨ NO x
Indicate by check mark whether the registrant has submitted electronically and posted on its corporate Web site, if any, every Interactive Data file required to be submitted and posted pursuant to Rule 405 of Regulation S-T (§232.405 of this chapter) during the preceding 12 months (or for such shorter period that the registrant was required to submit and post such files). YES x NO ¨
Indicate by check mark if disclosure of delinquent filers pursuant to Item 405 of Regulation S-K is not contained herein, and will not be contained, to the best of registrant’s knowledge, in definitive proxy or information statements incorporated by reference in Part III of this Form 10-K or any amendment to this Form 10-K. x
Indicate by check mark whether the registrant is a large accelerated filer, an accelerated filer, a non-accelerated filer, or a smaller reporting company. See the definitions of “large accelerated filer,” “accelerated filer,” and “smaller reporting company” in Rule 12b-2 of the Exchange Act. (Check one):
| Large accelerated filer | ¨ | Accelerated filer | ¨ | |||
| Non-accelerated filer | x (Do not check if a smaller reporting company) | Smaller reporting company | ¨ |
Indicate by check mark whether the registrant is a shell company (as defined in Rule 12b-2 of the Exchange Act). YES ¨ NO x
There was no public market for the registrant’s common stock as of June 30, 2014, the last business day of the registrant’s most recently completed second fiscal quarter. The registrant’s common stock began trading on the New York Stock Exchange on December 17, 2014.
The aggregate market value of the common stock by non-affiliates of the registrant, based on the closing price of a share of the registrant’s common stock on December 31, 2014 as reported by the New York Stock Exchange on such date was approximately $1,029,624,858. The registrant has elected to use December 31, 2014, the last day of the fiscal year covered by this report, as the calculation date because on June 30, 2014 (the last business day of the registrant’s mostly recently completed second fiscal quarter), the registrant was a privately-held company. Shares of the registrant’s common stock held by each executive officer, director and holder of 10% or more of the outstanding common stock have been excluded in that such persons may be deemed to be affiliates. This calculation does not reflect a determination that certain persons are affiliates of the registrant for any other purpose.
The number of shares of the registrant’s common stock outstanding as of February 28, 2015 was 69,457,401.
DOCUMENTS INCORPORATED BY REFERENCE
Portions of the registrant’s definitive Proxy Statement for its 2015 Annual Meeting of Stockholders are incorporated by reference in Part III of this Annual Report on Form 10-K. Such Proxy Statement will be filed with the U.S. Securities and Exchange Commission within 120 days after the end of the fiscal year to which this report relates. Except with respect to information specifically incorporated by reference in this Form 10-K, the Proxy Statement is not deemed to be filed as part of this Form 10-K.
Table of Contents
On Deck Capital, Inc.
Table of Contents
CAUTIONARY NOTE REGARDING FORWARD-LOOKING STATEMENTS
This report contains forward-looking statements within the meaning of the Private Securities Litigation Reform Act of 1995 and other legal authority. These forward-looking statements concern our operations, economic performance, financial condition, goals, beliefs, future growth strategies, objectives, plans and current expectations.
Forward-looking statements appear throughout this report including in Item 1. Business, Item 1A. Risk Factors, Item 3. Legal Proceedings and Item 7. Management’s Discussion and Analysis of Financial Condition and Results of Operations. Forward-looking statements can generally be identified by words such as “will,” “enables,” “expects,” “allows,” “continues,” “believes,” “anticipates,” “estimates” or similar expressions.
Forward-looking statements are neither historical facts nor assurances of future performance. They are based only on our current beliefs, expectations and assumptions regarding the future of our business, anticipated events and trends, the economy and other future conditions. As such, they are subject to inherent uncertainties, risks and changes in circumstances that are difficult to predict and in many cases outside our control. Therefore, you should not rely on any of these forward-looking statements. Our expected results may not be achieved, and actual results may differ materially from our expectations.
Important factors that could cause or contribute to such differences include risks relating to: our ability to attract potential customers to our platform; the degree to which potential customers apply for loans, are approved and borrow from us; anticipated trends, growth rates and challenges in our business and in the markets in which we operate; the ability of our customers to repay loans and our ability to accurately assess credit worthiness; our ability to adequately reserve for loan losses; our plans to implement certain additional compliance measures related to our funding advisor channel and their potential impact; changes in our product distribution channel mix or our funding mix; our ability to anticipate market needs and develop new and enhanced offerings to meet those needs; interest rates and origination fees on loans; maintaining and expanding our customer base; the impact of competition in our industry and innovation by our competitors; our anticipated growth and growth strategies, including the possible introduction of new products and possible expansion into new international markets, and our ability to effectively manage that growth; our reputation and possible adverse publicity about us or our industry; the availability and cost of our funding; our failure to anticipate or adapt to future changes in our industry; our ability to hire and retain necessary qualified employees; the lack of customer acceptance or failure of our products; our reliance on our third-party service providers; the evolution of technology affecting our offerings and our markets; our compliance with applicable local, state and federal laws, rules and regulations and their application and interpretation, whether existing, modified or new; our ability to adequately protect our intellectual property; the effect of litigation or other disputes to which we are or may be a party; the increased expenses and administrative workload associated with being a public company; failure to maintain an effective system of internal controls necessary to accurately report our financial results and prevent fraud; our liquidity and working capital requirements; the estimates and estimate methodologies used in preparing our consolidated financial statements; the future trading prices of our common stock, the impact of securities analysts’ reports and shares eligible for future sale on these prices; our ability to prevent or discover security breaks, disruption in service and comparable events that could compromise the personal and confidential information held in our data systems, reduce the attractiveness of our platform or adversely impact our ability to service our loans; and other risks, including those described in this report in Item 1A. Risk Factors and other documents that we file with the Securities and Exchange Commission, or SEC, from time to time which are available on the SEC website at www.sec.gov.
Except as required by law, we undertake no duty to update any forward-looking statements. Readers are also urged to carefully review and consider all of the information in this report, as well as the other documents we make available through the SEC’s website.
When we use the terms “OnDeck,” the “Company,” “we,” “us” or “our” in this report, we are referring to On Deck Capital, Inc. and its consolidated subsidiaries unless the context requires otherwise.
1
Table of Contents
| Item 1. | Business |
Our Company
We are a leading online platform for small business lending. We are seeking to transform small business lending by making it efficient and convenient for small businesses to access capital. Enabled by our proprietary technology and analytics, we aggregate and analyze thousands of data points from dynamic, disparate data sources to assess the creditworthiness of small businesses rapidly and accurately. Small businesses can apply for a term loan or line of credit on our website in minutes and, using our proprietary OnDeck Score®, we can make a funding decision immediately and transfer funds as fast as the same day. We have originated more than $2 billion in loans and collected more than 5.3 million customer payments since we made our first loan in 2007. Our loan originations have increased at a compound annual growth rate of 159% from 2012 to 2014 and achieved a year-over-year growth rate of 152% in 2014.
The 28 million small businesses in the United States are integral to the U.S. economy and the vibrancy of local communities, employing approximately 50% of the private workforce. According to Civic Economics, spending at local retailers and restaurants contributes to the local community on average more than double the amount per dollar spent compared to spending at national chains.
Small business growth benefits from efficient and frictionless access to capital, yet small businesses face numerous challenges that make it difficult to secure such capital. Small business owners are time and resource constrained, but the traditional borrowing process is time consuming and burdensome. Small businesses surveyed by the Federal Reserve Bank of New York indicated that the traditional funding process required them, on average, to dedicate 33 hours, contact 2.7 financial institutions and submit 3 loan applications. These challenges exist in part because it is inherently difficult to assess the creditworthiness of small businesses. Small businesses are a diverse group spanning many different industries, stages in development, geographies, financial profiles and operating histories, historically making it difficult to assess creditworthiness in a uniform manner. Small business data is scattered across dynamic online and offline sources, making it difficult to aggregate, analyze and monitor. There is no widely-accepted credit score for a small business, and frequently a small business owner’s personal credit score is used to assess creditworthiness even though it may not be indicative of the business’s credit profile. Furthermore, small businesses are not well served by traditional loan products. For example, small businesses often seek small, short-term loans to fund short-term projects and investments, but traditional lenders may only offer products that feature large loan sizes, longer durations and rigid collateral requirements that are not well suited to their needs.
The small business lending market is vast and underserved. According to the Federal Deposit Insurance Corporation, or FDIC, there were $180 billion in business loan originations under $250,000 in the United States in the fourth quarter of 2014 across 22.1 million loans. Oliver Wyman, a management consulting firm and business unit of Marsh & McLennan, estimates that there is a potential $80 to $120 billion in unmet demand for small business lines of credit, and we believe that there is also substantial unmet demand for other credit-related products, including term loans. We also believe that the application of our technology to credit assessment can stimulate additional demand for our products expand the total addressable market for small business credit.
To better meet the capital needs of small businesses, we are seeking to use technology to transform the way this capital is accessed. We built our integrated platform specifically to meet their financing needs. Our platform touches every aspect of the customer lifecycle, including customer acquisition, sales, scoring and underwriting, funding, and servicing and collections. A small business can complete an online application 24 hours a day, 7 days a week. Our proprietary data and analytics engine aggregates and analyzes thousands of online and offline data attributes and the relationships among those attributes to assess the creditworthiness of a small business in real time. The data points include customer bank activity shown on their bank statements, government filings, tax and census data. In addition, in certain instances we also analyze reputation and social data. We look at both
2
Table of Contents
individual data points and relationships among the data, with each transaction or action being a separate data point that we take into account. A key differentiator of our solution is the OnDeck Score, the product of our proprietary small business credit scoring system. Both our data and analytics engine and the algorithms powering the OnDeck Score undergo continuous improvement to automate and optimize the credit assessment process, enabling more rapid and predictive credit decisions. Each loan that we make involves our proprietary automated process and approximately two-thirds of our loans are completely underwritten using our proprietary automated underwriting process. Our platform supports same-day funding and automated loan repayment. This technology-enabled approach provides small businesses with efficient, frictionless access to capital.
Our business has grown rapidly. In 2014, we originated $1.2 billion of loans, representing year-over-year growth of 152%, while maintaining consistent credit quality. Our growth in originations has been supported by a diverse and scalable set of funding sources, including committed debt facilities, a securitization facility and our OnDeck Marketplace®, our proprietary whole loan sale platform for institutional investors. In 2014, we recorded gross revenue of $158.1 million, representing year-over-year growth of 142%. In 2014, our Adjusted EBITDA, a non-GAAP financial measure, was a loss of $0.2 million, our loss from operations was $7.1 million, and our net loss was $18.7 million. See the section titled “Management’s Discussion and Analysis of Financial Condition and Results of Operations—Non-GAAP Financial Measures” for a discussion and reconciliation of Adjusted EBITDA to net loss. As of December 31, 2014, our total assets were $729.6 million and the Unpaid Principal Balance on loans outstanding was $490.6 million.
We were incorporated in the state of Delaware on May 4, 2006. We operate from our headquarters in New York, New York and also have offices in Arlington, Virginia, and Denver, Colorado. Additional information about us is available on our website at http://www.ondeck.com. The information on our website is not incorporated herein by reference and is not a part of this report.
OnDeck, the OnDeck logo, OnDeck Score, OnDeck Marketplace and other trademarks or service marks of OnDeck appearing in this report are the property of OnDeck. Trade names, trademarks and service marks of other companies appearing in this report are the property of their respective holders. We have generally omitted the ® and ™ designations, as applicable, for the trademarks used in this report.
Industry Background and Trends
Small Businesses are an Enormous Driver of the U.S. Economy
The growth and prosperity of small businesses are vital to the success of the U.S. economy and essential to the strength of local communities. According to the most recent data available from the U.S. Small Business Administration, there are 28 million small businesses in the United States. These small businesses contribute approximately 45% of U.S. non-agricultural gross domestic product and employ approximately 50% of the private workforce. Small businesses help build vibrant communities with local character and help support the growth of local economies. According to Civic Economics, spending at local retailers and restaurants contributes to the local community on average more than double the amount per dollar spent compared to spending at national chains.
Small Businesses Need Capital to Survive and Thrive
Small businesses need access to capital to purchase supplies and inventory, hire employees, market their businesses and invest in new potential growth opportunities. The need for capital may be seasonal, such as an ice cream vendor hiring for the summer months or a retailer buying inventory in anticipation of the holiday season. It may also be sudden and unexpected, such as a restaurant responding to a last minute catering request or a manufacturer winning a valuable new contract that requires more raw materials. According to a survey by the Federal Reserve Bank of New York, ability to manage uneven cash flow was cited as the most frequent concern of small businesses. The payback period on these investments can be short while the return on investment may benefit the small business for years.
3
Table of Contents
Small Businesses are Unique and Difficult to Assess
Small businesses are a diverse group spanning many different industries, stages in development, geographies, financial profiles and operating histories, historically making it difficult to assess creditworthiness in a uniform manner, and there is no widely-accepted credit score for small businesses. For example, a restaurant has a very different operating and financial profile from a retail store and both are very different from a doctor’s office. Credit assessment is inherently difficult because small business data is constantly changing as the business evolves and is scattered across a myriad of online and offline sources, unlike consumer credit assessment where a lender can generally look to scores provided by consumer credit bureaus. Small business data includes financial data, credit data, government and public records, transactional data, online social data, accounting data and behavioral data. While much of this data is rapidly moving online, certain data remains predominantly offline. In addition, small businesses are not consistently covered by traditional credit bureaus. Once obtained, the data needs to be cleansed, normalized, weighted and analyzed to be useful in the credit scoring decision.
Small Businesses are Not Adequately Served by Traditional Lenders
We believe traditional lenders face a number of challenges and limitations that make it difficult to address the capital needs of small businesses, such as:
| • | Organizational and Structural Challenges. The costly combination of physical branches and manually intensive underwriting procedures makes it difficult for traditional lenders to efficiently serve small businesses. They also serve a broad set of customers, including both consumers and enterprises, and are not solely focused on addressing the needs of small businesses. |
| • | Technology Limitations. Many traditional lenders use legacy or third-party systems that are difficult to integrate or adapt to the shifting needs of small businesses. These technology limitations make it challenging for traditional lenders to aggregate new data sources, leverage advanced analytics and streamline and automate credit decisions and funding. |
| • | Loan Products not Designed for Small Businesses. Small businesses are not well served by traditional loan products. We believe that traditional lenders often offer products characterized by larger loan sizes, longer durations and rigid collateral requirements. By contrast, small businesses often seek small loans for short-term investments. |
As a result, we believe that small businesses feel underserved by traditional lenders. According to the FDIC, the percentage of commercial and industrial loans with a balance less than $250,000 has declined from 20% of total dollars borrowed in 2004 to 12% in the fourth quarter of 2014. According to Oliver Wyman, 75% of small businesses are looking to borrow less than $50,000. In addition, according to the first quarter 2015 Wells Fargo/Gallup Small Business Index, only 34% of small businesses reported that obtaining credit was easy.
Other Credit Products Have Significant Limitations
Certain additional products, including widely available business credit cards, provide small businesses with access to capital but may not be designed for their borrowing needs. For example, business credit cards may not have sufficient credit limits to handle the needs of the small business, particularly in the case of large, one-time projects such as capital improvements or expanding to a new location. In addition, certain business opportunities, such as discounts for paying with cash, and certain business expenses, such as payroll, rent or equipment leases, may not be payable with credit cards. Business credit cards are also typically not designed to fund many small business working capital needs.
4
Table of Contents
Challenges for Small Businesses
Small Business Owners are Time and Resource Constrained
We believe that small business owners lack many of the resources available to larger businesses and have fewer staff on which to rely for critical business issues. According to a survey by eVoice, time is viewed as the most valuable asset to small business owners. Small businesses typically do not employ a financial staff or internal advisors, and small business owners often act as both manager and employee. According to the same survey, 90% of small business owners perform three or more employee roles in any given day. Time spent inefficiently may mean lost sales, extra expenses and personal sacrifices.
Traditional Lending is Not Geared Towards Small Businesses
Traditional lenders do not meet the needs of small businesses for a number of reasons, including the following:
| • | Time Consuming Process. According to a Harvard Business School study, the traditional borrowing process includes application forms which are time consuming to assemble and complete, long in-person meetings during business hours and manual procedures that delay decisions. Small businesses surveyed by the Federal Reserve Bank of New York indicated that the traditional funding process required them, on average, to dedicate 33 hours, contact 2.7 financial institutions and submit 3 loan applications. |
| • | Non-Tailored Credit Assessment. There is no widely-accepted credit score for small businesses. Traditional lenders frequently rely upon the small business owner’s personal credit as a primary indicator of the business’s creditworthiness, even though it is not necessarily indicative of the business’s credit profile. As a result, a creditworthy business may be denied funding or offered a product that fits poorly with its needs. |
| • | Product Mismatch. According to Oliver Wyman, small businesses often seek small loans and evaluate their investment opportunities on a “dollars in, dollars out” basis, since the payback period is short. According to survey data reported by Oliver Wyman, 75% of small businesses are looking to borrow less than $50,000. Small businesses often seek small, short-term loans to fund short-term projects and investments, but are met with traditional loan products that feature large loan sizes, longer durations and rigid collateral requirements that are not well suited to their needs. |
Alternatives to Traditional Bank Loans are Inadequate
Small businesses whose lending needs are not met by traditional bank loans have historically resorted to a fragmented landscape of products, including merchant cash advances, credit cards, receivables factoring, equipment leases and home equity lines, each of which comes with its own challenges and limitations. Merchant cash advances are expensive and limited to certain industries. Credit cards are pervasive but cannot be used for certain types of expenses and face limitations on size. Equipment leasing and receivables factoring both have a cumbersome application process and are only appropriate for specific use cases. Home equity lines have strict collateral requirements, are unappealing to business owners on a personal level and are challenging for businesses with multiple owners.
Modernization of Small Businesses
Small Businesses are Embracing Technology
The proliferation of technology is changing the way small business owners manage their operations. According to a National Small Business Association survey, 70% of small businesses view technology as very important to the success of a business. Small businesses are increasingly using technology to purchase inventory, pay bills, manage accounting and conduct digital marketing. According to the survey, 85% of small businesses purchase supplies online, 83% manage bank accounts online, 82% maintain their own website, 72% pay bills online and 41% use tablets for their business. We believe small business owners expect a user-friendly online borrowing experience.
5
Table of Contents
The Digital Footprint of Small Businesses is Expanding
An increasing amount of information about small businesses is available electronically. Traditional data sources used to assess business creditworthiness, including government data, transactional information, bank accounts, public records and credit bureau data, are all transitioning online. In addition, many small businesses use social media such as Facebook, Twitter and LinkedIn to interact with customers, partners and stakeholders and manage their online business listings on review sites such as Yelp. A National Small Business Association survey reports that 73% of small businesses use a social media platform for their online strategies. This vast amount of real-time digital data about small businesses can be used to generate valuable insights that help better assess the creditworthiness of a small business.
The Opportunity
The small business lending market is vast and underserved. According to the FDIC, there were $180 billion in business loan originations under $250,000 in the United States in the fourth quarter of 2014, across 22.1 million loans. Oliver Wyman estimates that there is a potential $80 to $120 billion in unmet demand for small business lines of credit, and we believe that there is also substantial unmet demand for other credit-related products, including term loans. We also believe that the application of our technology to credit assessment can stimulate additional demand for our products and expand the total addressable market for small business credit.
Our Solution
Our mission is to power the growth of small business through lending technology and innovation. We are combining our passion for small business with technology and analytics to transform the way small businesses access capital. Our solution was built specifically to address small businesses’ capital needs and consists of our loan products, our end-to-end integrated platform and the OnDeck Score. We offer two products to small businesses to enable them to access capital: term loans and lines of credit. Our proprietary, end-to-end integrated platform includes: our website, which allows small businesses to apply for a loan in minutes, 24 hours a day 7 days a week; our proprietary data and analytics engine that analyzes thousands of data attributes from disparate sources to assess the real-time creditworthiness of a small business; the technology that enables seamless funding of our loans; our daily and weekly collections and ongoing servicing system. A key differentiator of our solution is the OnDeck Score, the product of our proprietary small business credit-scoring system. The OnDeck Score aggregates and analyzes thousands of data elements and attributes related to a business and its owners that are reflective of the creditworthiness of the business as well as predictive of its credit performance. Our proprietary data and analytics engine and the algorithms powering the OnDeck Score undergo continuous improvement through machine learning and other statistical techniques to automate and optimize the credit assessment process.
Our customers choose us because we provide the following key benefits:
| • | Access. By combining technology with comprehensive and relevant data that captures the unique aspects of small businesses, we are able to better assess the creditworthiness of small businesses and approve more loans. In addition, we provide customers with access to products that match their capital needs. |
| • | Speed. Small businesses can submit an application on our website in as little as minutes. We are able to provide most loan applicants with an immediate approval decision and, if approved, transfer funds as fast as the same day. Because we require no in-person meetings and have an intuitive online application form, we have been able to significantly increase the convenience and efficiency of the application process without burdensome documentation requirements. |
| • | Customer Experience. Our U.S.-based internal salesforce and customer service representatives provide high tech, high touch, personalized support to our applicants and customers. Our team answers questions and provides assistance throughout the application process and the life of the loan. Our representatives are available Monday through Saturday before, during and after regular business hours |
6
Table of Contents
| to accommodate the busy schedules of small business owners. We also offer our customers credit education and consulting services and other value added services. Our commitment to provide a great customer experience has helped us earn a 73 Net Promoter Score, a widely used system of measuring customer loyalty, and consistently achieve A+ ratings from the Better Business Bureau. Furthermore, the OnDeck Score incorporates data from each customer’s history with us, ensuring that we deliver increasing efficiency to our customers in making repeat loan decisions. We also report back to several business credit bureau agencies, which can help small businesses build their business credit. |
Our Competitive Strengths
We believe the following competitive strengths differentiate us and serve as barriers for others seeking to enter our market:
| • | Significant Scale. Since we made our first loan in 2007, we have funded more than $2 billion in loans across more than 700 industries in all 50 U.S. states and have recently begun lending in Canada. We have collected more than 5.3 million customer payments and maintain a proprietary database of more than 10 million small businesses. In 2014, we originated $1.2 billion of loans, representing year-over-year growth of 152%, all while maintaining consistent credit quality. Our increasing scale offers significant benefits including lower customer acquisition costs, access to a broader dataset, better underwriting decisions and a lower cost of capital. |
| • | Proprietary Data and Analytics Engine. We use data analytics and technology to optimize our business operations and the customer experience including sales and marketing, underwriting, servicing and risk management. Our proprietary data and analytics engine and the OnDeck Score provide us with significant visibility and predictability in assessing the creditworthiness of small businesses and allow us to better serve more customers across more industries. With each loan application, each funded loan and each daily or weekly payment, our data set expands and our OnDeck Score improves. In the latter part of 2014, we introduced the fifth generation, or v5, of the OnDeck Score which has enhanced our credit scoring capabilities, enabling us to improve offers to our customers while preserving the credit quality of our portfolio. Our analysis suggests that v5 has become 85% more accurate at predicting bad credit risk in small businesses across a range of credit risk profiles than personal credit scores alone. We are therefore able to lend to more small businesses than traditional lenders, which need to compensate for their more limited analytical model by being more restrictive in lending decisions. We are also able to use our proprietary data and analytics engine to pre-approve customers and target those customers predisposed to take a loan and that have a high likelihood of approval. |
| • | End-to-End Integrated Technology Platform. We built our integrated platform specifically to meet the financing needs of small businesses. Our platform touches every aspect of the customer lifecycle, including customer acquisition, sales, scoring and underwriting, funding, and servicing and collections. This purpose-built infrastructure is enhanced by robust fraud protection, multiple layers of security and proprietary application programming interfaces. It enables us to deliver a superior customer experience, facilitates agile decision making and allows us to efficiently roll out new products and features. We use our platform to underwrite, process and service all of our small business loans regardless of distribution channel. |
| • | Diversified Distribution Channels. We are building our brand awareness and enhancing distribution capabilities through diversified distribution channels, including direct marketing, strategic partnerships and funding advisors. Our direct marketing includes direct mail, radio, TV, social media and other online marketing channels. Our strategic partners, including banks, payment processors and small business-focused service providers, offer us access to their base of small business customers, and data that can be used to enhance our targeting capabilities. We also have relationships with a large network of funding advisors, including businesses that provide loan brokerage services, which drive distribution and aid brand awareness. Our internal salesforce contacts potential customers, responds to inbound inquiries from potential customers, and is available to assist all customers throughout the application process. |
7
Table of Contents
The following table summarizes the percentage of loans originated by our three distribution channels for the periods indicated:
| Year Ended December 31, | ||||||||||||
| Percentage of Originations (Number of Loans) | 2014 | 2013 | 2012 | |||||||||
| Direct |
55.4 | % | 44.1 | % | 23.4 | % | ||||||
| Strategic Partner |
14.4 | % | 10.3 | % | 8.0 | % | ||||||
| Funding Advisor |
30.2 | % | 45.6 | % | 68.6 | % | ||||||
| Year Ended December 31, | ||||||||||||
| Percentage of Originations (Dollars) | 2014 | 2013 | 2012 | |||||||||
| Direct |
44.7 | % | 34.4 | % | 19.4 | % | ||||||
| Strategic Partner |
13.9 | % | 9.2 | % | 5.5 | % | ||||||
| Funding Advisor |
41.4 | % | 56.4 | % | 75.1 | % | ||||||
| • | High Customer Satisfaction and Repeat Customer Base. Our strong value proposition has been validated by our customers. We had a Net Promoter Score of 73 in December 2014 based on our internal survey of customers. The Net Promoter Score is a widely used index ranging from negative 100 to 100 that measures customer loyalty. Our score places us at the upper end of customer satisfaction ratings and compares favorably to the average Net Promoter Score score of 9 for national banks, 19 for regional banks and 46 for community banks. We have also consistently achieved an A+ rating from the Better Business Bureau. We believe that high customer satisfaction has played an important role in repeat borrowing by our customers. In 2014 and 2013, 50.1% and 43.5%, respectively, of loan originations were by repeat customers, who either replaced their existing loan with a new, usually larger, loan or took out a new loan after paying off their existing OnDeck loan in full. Repeat customers generally comprise our highest quality loans, given many repeat customers require additional financing for growth or expansion. From our 2013 direct and strategic partner customer cohort, customers who took at least three loans grew their revenue and bank balance, respectively, on average by 25% and 42% from their initial loan to their third loan. On average, their OnDeck Score increased by 24 points, enabling us to grow their mean loan amount by 106% while decreasing their annual percentage rate, or APR, by 17.5 percentage points. Twenty-seven percent of our origination volume from repeat customers in 2014 was due to unpaid principal balances rolled from existing loans directly into such repeat originations. Each repeat customer seeking another term loan must pass the following standards: |
| • | the business must be approximately 50% paid down on its existing loan; |
| • | the business must be current on its outstanding OnDeck loan with no material delinquency history; and |
| • | the business must be fully re-underwritten and determined to be of adequate credit quality. |
| • | Durable Business Model. Since we began lending in 2007, we have successfully operated our business through both strong and weak economic environments. Our real-time data, short duration loans, automated daily and weekly collection, risk management capabilities and unit economics enable us to react rapidly to changing market conditions and generate attractive financial results. In addition, we believe the historical consistency and stability of the credit performance of our loan portfolio are appealing to our sources of funding and help validate our proprietary credit scoring model. |
| • | Differentiated Funding Platform. We source capital through multiple channels, including debt facilities, securitization and the OnDeck Marketplace, our proprietary whole loan sale platform for institutional investors. This diversity provides us with multiple, scalable funding sources, long-term capital commitments and access to flexible funding for growth. In addition, because we contribute a portion of the capital for each loan we fund via our debt facilities and securitization, we are able to align interests with our investors. |
8
Table of Contents
| • | 100% Small Business-Focused. We are passionate about small businesses. We have developed significant expertise since we began lending in 2007, remaining exclusively focused on assessing and delivering credit to small businesses. We believe this passion, focus and small business credit expertise provides us with significant competitive advantages. |
Our Strategy for Growth
Our vision is to become the most trusted lender to small businesses, and to accomplish this, we intend to:
| • | Continue to Acquire Customers Through Direct Marketing and Sales. We plan to continue investing in direct marketing and sales to add new customers and increase our brand awareness. As our dataset expands, we will continue to pre-approve and target those customers predisposed to take a loan and that have a high likelihood of approval. We have already seen success from this strategy with an increase in loan transactions attributable to direct marketing of 227% in 2014. |
| • | Broaden Distribution Capabilities Through Partners. We plan to expand our network of strategic partners, including banks, payment processors and small business-focused service providers, and leverage their relationships with small businesses to acquire new customers. |
| • | Enhance Data and Analytics Capabilities. We plan to make substantial investments in our data and analytics capabilities. Our data science team continually uncovers new insights about small businesses and their credit performance and considers new data sources for inclusion in our models, allowing us to evaluate and lend to more customers. As our dataset expands, our self-reinforcing scoring algorithm continues to improve through machine learning, enabling us to make better lending decisions. |
| • | Expand Product Offerings. We will continue developing products that support small businesses from inception through maturity. Following the successful introduction of our line of credit and 24-month term loan products, over time we plan to expand our offerings by introducing new credit-related products for small businesses. We believe this will allow us to provide a more comprehensive offering for our current customers and introduce small business owners to our platform whose needs are not currently met by our term loan and line of credit products. We also recently introduced capability to cross-sell our loan products to existing term loan and line of credit customers, giving small business owners more flexibility to finance their business needs. |
| • | Extend Customer Lifetime Value. We believe we have an opportunity to increase revenue and loyalty from new and existing customers. We have the ability to accommodate our customers’ needs as they grow and as their funding needs increase and change. We plan to introduce new features to continue driving the increased use of our platform, including mobile functionality to increase user engagement. We are focused on providing a positive customer experience and on continuing to drive customer loyalty. |
| • | Targeted International Expansion. We believe small businesses around the world need capital to grow, and there is an opportunity to expand our small business lending in select countries outside of the United States. For example, in the second quarter of 2014, we started providing loans in Canada, and we continue to evaluate additional international market opportunities. |
Our Sales and Marketing
We originate small business loans through three channels: direct marketing, strategic partners and a funding advisor program. While customers can apply for a loan directly on our website, they also have the ability to initiate contact with us through other means, such as by telephone or through a strategic partner or funding advisor. We underwrite, process and service all of our small business loans on our platform regardless of distribution channel.
9
Table of Contents
Direct Marketing
We have originated small business term loans through the direct marketing channel since 2007 and began originating lines of credit in 2013. Through this channel, we make contact with prospective customers utilizing direct mail, social media, television, radio and online marketing. We also engage in outbound calling. Supported by our direct sales team, we funnel customer leads generated through such efforts to our website.
When a customer that has previously taken a loan from us returns for a repeat loan, our direct sales team interacts directly with the customer to help facilitate the process, including for customers initially acquired via a strategic partner or funding advisor. Although our direct sales team facilitates repeat loan transactions, we generally still pay commissions to such strategic partner or funding advisor based on the amount of the net new loan to the customer. Our sales agent assisting the customer also receives a commission, but the commission is generally less than the commission on the initial loan. The amount of commissions, on a percentage basis, paid to a strategic partner will generally be less than the commission earned on the initial loan based on the terms applicable to a particular strategic partner. The amount of commissions, on a percentage basis, paid to a funding advisor on a repeat loan is generally consistent with the commission earned on the initial loan.
Our direct sales team is located in our New York City and Denver offices. This team primarily focuses on generating loan originations and assisting applicants throughout the application process by responding to applicant questions, collecting documentation and providing notification of application outcomes. While our website facilitates the loan application process, customers may elect to mail, fax or email us documentation. In such cases, our direct sales team assists in collecting this documentation. Members of the direct sales team have a commission component to their compensation that is based on loan volume in the case of term loans and number of lines opened in the case of lines of credit.
Strategic Partners
We have originated small business loans through our strategic partner channel since 2011. Through this channel, we are introduced to prospective customers by third parties, who we refer to as strategic partners, that serve or otherwise have access to the small business community in the regular course of their business. Strategic partners conduct their own marketing activities which may include direct mail, online marketing or leveraging existing business relationships. Strategic partners include, among others, banks, small business-focused service providers, other financial institutions, financial and accounting solution providers, payment processors, independent sales organizations, leasing companies and financial and other websites. The material terms of our agreements with strategic partners include the payment by us of commissions, generally based on the amount of the funded loan, in exchange for customers referred to our platform. Such agreements also typically contain other customary terms, including representations and warranties, covenants, termination provisions and expense allocation. Strategic partners differ from funding advisors (described below) in that strategic partners generally provide a referral to our direct sales team and our direct sales team is the main point of contact with the customer. On the other hand, funding advisors serve as the main point of contact with the customer on its initial loan and may help a customer assess multiple funding opportunities. As such, funding advisors’ commissions generally exceed strategic partners’ referral fees. We generally do not recover these amounts upon default of the loan. We have entered into a general marketing agreement with one strategic partner that provides for common stock purchase warrants that vest upon reaching certain performance goals. No other fees are paid to strategic partners.
Funding Advisor Program
We have originated small business loans through the funding advisor program channel since 2007. Through this channel we make contact with prospective customers by entering into relationships with third-party independent advisors, known as Funding Advisor Program partners, which we refer to as funding advisors or FAPs, that typically offer a variety of financial services to small businesses, including commission-based business loan brokerage services. FAPs conduct their own marketing activities which may include direct mail, online marketing, paid leads, television and radio advertising or leveraging existing business relationships. FAPs
10
Table of Contents
include independent sales organizations, commercial loan brokers and equipment leasing firms. FAPs act as intermediaries between potential customers and lenders by brokering business loans on behalf of potential customers. In order to become a FAP, an authorized representative of the FAP must complete an interview with us, clear a personal criminal background check, undergo training and sign an agreement with us. We began implementing background checks, generally on the authorized representative of the FAP, in 2010, but we did not conduct any background checks with respect to any FAPs that began working with us before 2010 or who had annual revenue greater than $15 million when they became a FAP. We generally reject a prospective FAP and terminate our relationship with a current FAP if a background check with respect to such FAP reveals the commission of a crime involving moral turpitude, financial crimes or fraud. In February 2015, we began enhancing our FAP due diligence process as described below. Our relationships with FAPs provide for the payment of a commission at the time the term loan is funded or line of credit account is opened. As of December 31, 2014, we had relationships with more than 600 FAPs and no single FAP was associated with more than 3% of our total originations.
In February 2015, we began to implement enhanced compliance-related measures related to our funding advisor channel in addition to our existing measures. For example, we are expanding the extent to which our funding advisor partners are required to submit to and conduct background checks, including requiring checks on owners, senior management and sales employees of the FAP rather than only the authorized representative of the FAP. We are strengthening the FAP application process and adding an annual re-certification requirement. We will also conduct such diligence on all existing FAPs over a period of months. In addition, we plan to strengthen our contractual provisions with our FAPs to enable us to monitor continuing compliance after these initial checks and to expand our rights to terminate the relationship. We anticipate requiring that FAPs agree to abide by these enhanced compliance obligations as a condition to establishing or maintaining their partnership with us. We have also recently hired a senior compliance officer whose responsibilities include overseeing compliance matters involving our funding advisor channel.
Our Customers
We provide term loans and lines of credit to a diverse set of small businesses. We have funded more than $2 billion in loan volume across more than 700 industries in all 50 U.S. states and have recently begun lending in Canada and have collected more than 5.3 million customer payments since our first loan in 2007. The top five states in which we originated loans in 2014 were California, Florida, Texas, New York and New Jersey, representing approximately 14%, 9%, 8%, 8% and 4% of our total loan originations. Our customers have a median of $569,000 in annual revenue, with 90% of our customers having between $150,000 and $3.2 million in annual revenue, and have been in business for a median of 7.5 years, with 90% in business between 2 and 31 years.
During 2014, the average size of a term loan made on our platform was $45,428 and the average size of a line of credit extended to our customers was $16,397.
Our Products
We offer financing to small businesses through a term loan product and a revolving line of credit product. In the fourth quarter of 2014, we instituted a program that allowed us to offer our term loan and line of credit products to the same customers, subject to customary credit and loan underwriting procedures.
Term Loan Product
Our primary business is to offer fixed term loans to eligible small businesses. The principal amount of each term loan ranges from $5,000 to $250,000. The principal amount of our term loan is a function of the requested borrowing amount and our credit risk assessment, using the OnDeck Score, of the customer’s ability to repay the loan. The original term of each individual term loan ranges from 3 to 24 months. We believe that the highly tailored loan terms are a competitive advantage given the short-term, project-specific nature of many of our
11
Table of Contents
customers’ borrowing needs. Customers repay our term loans through fixed automatic ACH collections from their business bank account on either a daily or weekly basis. Certain term loans are originated by our issuing bank partners and loans that we purchase from the issuing banks have similar performance to loans that we originate.
Line of Credit Product
Our second loan product is a revolving line of credit with fixed six-month level-yield amortization on amounts outstanding and automated weekly payments. The credit lines currently offered to customers are from $10,000 to $25,000. A customer may be offered a line of credit based on our credit risk assessment of the customer’s ability to repay the line of credit. We do not currently purchase lines of credit from issuing bank partners.
Our Loan Pricing
Our loans are priced based on a risk assessment generated by our proprietary data and analytics engine, which includes the OnDeck Score. Customer pricing is determined primarily based on the customer’s OnDeck Score, the loan term and origination channel. Loans originated through direct marketing and strategic partners are generally lower cost than loans originated through FAPs due to the commission structure of the FAP program.
Our customers pay between $0.01 to $0.04 per month in interest for every dollar they borrow under one of our term loans, with the actual amount typically driven by the length of term of the particular loan. Our loans are quoted in “Cents on Dollar,” or COD, or based on an interest rate, depending on the type of loan. In general, term loans are quoted in COD terms, and lines of credit are quoted with an interest rate. Given the use case and payback period associated with shorter term products, many of our customers prefer to understand pricing on a “dollars in, dollars out” basis and are primarily focused on total payback cost.
We believe that our product pricing has historically fallen between traditional bank loans to small businesses and certain non-bank small business financing alternatives such as merchant cash advances. The weighted average pricing on our originations has declined over time as measured by both average “Cents on Dollar” borrowed per month and APR as shown in the table below.
| Q4 2014 |
Q3 2014 |
Q2 2014 |
Q1 2014 |
Q4 2013 |
Q3 2013 |
Q2 2013 |
Q1 2013 |
|||||||||||||||||||||||||
| Weighted Average Term Loan “Cents on Dollar” Borrowed, per Month |
2.23 | ¢ | 2.24 | ¢ | 2.38 | ¢ | 2.53 | ¢ | 2.60 | ¢ | 2.62 | ¢ | 2.71 | ¢ | 2.73 | ¢ | ||||||||||||||||
| Weighted Average APR—Term Loans and Lines of Credit |
51.2 | % | 52.8 | % | 56.7 | % | 59.9 | % | 61.8 | % | 62.9 | % | 65.0 | % | 65.9 | % | ||||||||||||||||
On an annual basis, the weighted average APR for term loans and lines of credit declined from 69.0% in 2012 to 63.4% in 2013, and further declined to 54.4% in 2014. We attribute this pricing shift to increased originations from our direct and strategic partner channels as a percentage of total originations, as well as our declining Cost of Funds Rate. “Cents on Dollar” borrowed reflects the monthly interest paid by a customer to us for a loan, and does not include the loan origination fee and the repayment of the principal of the loan. The APRs of our term loans currently range from 17% to 98% and the APRs of our lines of credit range from 30% to 36%. Because many of our loans are short term in nature and APR is calculated on an annualized basis, we believe that small business customers tend to evaluate term loans primarily on a “Cents on Dollar” borrowed basis rather than APR. Despite these limitations, we are providing historical APRs as supplemental information for comparative purposes. We do not use APR as an internal metric to evaluate performance of our business or as a basis to compensate our employees or to measure their performance. The interest on commercial business loans is also tax deductible as permitted by law, as compared to typical personal loans which do not provide a tax deduction. APR does not give effect to the small business customer’s possible tax deductions and cash savings associated with business related interest expenses. For these and other reasons, we do not believe that APR is a meaningful measurement of the expected returns to us or costs to our customer.
12
Table of Contents
Our Platform and the Underwriting Process
We believe that our technology platform enables a significantly faster process to apply for a loan, a credit assessment that more accurately determines a small business applicant’s creditworthiness and a superior overall experience. Our platform touches each point of our relationship with customers, from the application process through the funding and servicing of loans.
We provide an automated, streamlined application process that potential customers may complete in as little as minutes. Our proprietary scoring model provides applicants with a funding decision rapidly and we can then fund customers as fast as the same day. Once funded, our customers can use our online portal to monitor their loan balance in real time. To the customer, the process appears simple, seamless and efficient because our platform leverages sophisticated, proprietary technology to make it possible.
Since inception, our platform has processed more than 5.3 million customer payments and currently incorporates a proprietary database of more than 10 million small businesses. We believe our technology platform is a significant competitive advantage and is one of the most important reasons that customers take loans from us.
Our Subsidiaries
We currently have five active subsidiaries, each of which is wholly-owned by On Deck Capital, Inc. These subsidiaries perform the following functions:
| • | On Deck Asset Company, LLC. This special purpose vehicle is the borrower under a current asset-backed revolving debt facility. |
| • | OnDeck Asset Pool, LLC. This special purpose vehicle is the borrower under a current asset-backed revolving debt facility. |
| • | Small Business Asset Fund 2009 LLC. This special purpose vehicle is the borrower under a current asset-backed revolving debt facility. |
| • | OnDeck Account Receivables Trust 2013-1 LLC. This special purpose vehicle is the borrower under a current asset-backed revolving debt facility. |
| • | OnDeck Asset Securitization Trust LLC. This special purpose vehicle is the issuer under our current asset-backed securitization facility. |
See “Management’s Discussion and Analysis of Financial Condition and Results of Operations—Liquidity and Capital Resources” and Note 7 of Notes to Consolidated Financial Statements elsewhere in this report for more information regarding these five subsidiaries.
Our Risk Management
Our management team has operated the business through both strong and weak economic environments and has developed significant risk management experience and protocols. Accordingly, we employ a rigorous, comprehensive and programmatic approach to risk management that is ingrained in our business. The objectives of our risk management program are to:
| • | manage the risks of the company, including developing and maintaining systems and internal controls to identify, approve, measure, monitor, report and prevent risks; |
| • | manage reputational and counterparty risk; |
| • | foster a strong risk-centric mindset across the company; and |
| • | control and plan for credit risk-taking consistent with expectations. |
13
Table of Contents
We accomplish these risk management objectives both structurally, through product and platform features, as well as by employing a team of risk management professionals focused on credit and portfolio risks and broader enterprise risks.
The structural protections inherent in our products and technology platform enable us to provide real-time risk monitoring and management. From an underwriting perspective, we make credit decisions based on real-time performance data about our small business customers. We believe that the data and analytics powering the OnDeck Score can predict the creditworthiness of a small business better than models that rely solely on the personal credit score of the small business owner. Our analysis suggests that the current iteration of our proprietary credit-scoring model has become 85% more accurate at predicting bad credit risk in small businesses across a range of credit risk profiles than personal credit scores alone.
In addition, because our products generally require automated payback each business day and allow for ongoing data collection, we obtain early-warning indicators that provide a high degree of visibility not just on individual loans, but also macro portfolio trends. Insights gleaned from such real-time performance data enable us to be agile and adapt quickly to changing conditions. Furthermore, the loans we originate are generally short term in nature. This rapid amortization and recovery of amounts loaned limits our overall loss exposure.
Organizationally, we have a risk management committee, comprised of members of our board of directors, that meets regularly to examine credit risks and enterprise risks of the company. We also have several subcommittees of our risk management committee that are comprised of members of our management team that monitor credit risks, enterprise risks and other risks of the company.
In addition, we have teams of non-management employees within the company that monitor these and other risks. Our credit risk team is responsible for portfolio management, allowance for loan losses, or ALLL, credit model validation and underwriting performance. This team engages in numerous risk management activities, including reporting on performance trends, monitoring of portfolio concentrations and stability, performing economic stress tests on our portfolio, randomly auditing underwriting processes and loan decisions and conducting peer benchmarking and exogenous risk assessments.
Our enterprise risk team focuses on the following additional risks:
| • | ensuring our IT systems, security protocols, and business continuity plans are well established, reviewed and tested; |
| • | establishing and testing internal controls with respect to financial reporting; and |
| • | regularly reviewing the regulatory environment to ensure compliance with existing laws and anticipate future regulatory changes that may impact us. |
Our management team also closely monitors our competitive landscape in order to assess any competitive threats. Finally, from a capital availability perspective, we employ a diverse and scalable funding strategy that allows us to access debt facilities, the securitization markets and institutional capital through our OnDeck Marketplace, reducing our dependence on any one source of capital.
Our Information Technology and Security
Our network is configured with multiple layers of security to isolate our databases from unauthorized access. We use sophisticated security protocols for communication among applications and we encrypt private information, such as an applicant’s social security number. All of our public and private APIs and websites use Secure Sockets Layer.
Our systems infrastructure is deployed on a private cloud hosted in co-located redundant data centers in New Jersey and Colorado. We believe that we have enough physical capacity to support our operations for the
14
Table of Contents
foreseeable future. We have multiple layers of redundancy to ensure reliability of network service and have a 99.99% uptime. We also have a working data redundancy model with comprehensive backups of our databases and software taken nightly.
Our Intellectual Property
We protect our intellectual property through a combination of trademarks, trade dress, domain names, copyrights, trade secrets and patents, as well as contractual provisions and restrictions on access to our proprietary technology.
We have registered trademarks in the United States and Canada for “OnDeck,” “OnDeck Score,” “OnDeck Marketplace,” the OnDeck logo and many other trademarks. We also have filed other trademark applications in the United States and certain other jurisdictions and will pursue additional trademark registrations to the extent we believe it will be beneficial.
Our Employees
As of December 31, 2014, we had 444 full-time employees located throughout our New York, Denver, and Virginia offices as well as several employees in remote locations.
We are proud of our culture, which is anchored by four key values:
| Ingenuity |
We create new solutions to old problems. We imagine what’s possible and seek out innovation and technology to reinvent small business financing and delight our customers. | |
| Passion |
We think big and act boldly. We care intensely about each other, our company, and the small businesses we serve. | |
| Openness |
We are collaborative and accessible. We know that the best outcomes come when we work together. | |
| Impact |
We focus on results. We are committed to making every day count and constantly strive to improve our business. We work to make a difference to small businesses, their customers and our employees. | |
We consider our relationship with our employees to be good and we have not had any work stoppages. Additionally, none of our employees are represented by a labor union or covered by a collective bargaining agreement.
Government Regulation
We are affected by laws and regulations that apply to businesses in general, as well as to commercial lending. This includes a range of laws, regulations and standards that address information security, data protection, privacy, licensing and interest rates, among other things. However, because we are only engaged in commercial lending and do not make any consumer loans or take deposits, we are subject to fewer regulations than businesses involved in those activities.
State Lending Regulations
Interest Rate Regulations
Although the federal government does not regulate the maximum interest rates that may be charged on commercial loan transactions, some states have enacted commercial rate laws specifying the maximum legal interest rate at which loans can be made in the state. We only originate commercial loans and do so under Virginia law. Virginia does not have rate limitations on commercial loans of $5,000 or more or licensing requirements for commercial lenders making such loans. Our underwriting, servicing, operations and collections teams are headquartered in Arlington, Virginia, and that is where the commercial loan contracts are made. All
15
Table of Contents
loans originated directly by us provide that they are to be governed by Virginia law. With respect to loans where we work with a partner or issuing bank, the partner bank may utilize the law of the jurisdiction applicable to the bank in connection with its commercial loans.
Licensing Requirements
In states that do not require a license to make commercial loans, we make term loans directly to customers pursuant to Virginia law, which is the governing law we require in the underlying loan agreements with our customers. However, nine states and jurisdictions, namely Alaska, California, Maryland, Nevada, North Dakota, Rhode Island, South Dakota, Vermont, and Washington, D.C., require a license to make certain commercial loans and may not honor a Virginia choice of law. They assert either that their own licensing laws and requirements should generally apply to commercial loans made by nonbanks or apply to commercial loans made by nonbanks of certain principal amounts or with certain interest rates or other terms. In such states and jurisdictions and in some other circumstances, term loans are made by an issuing bank partner that is not subject to state licensing, primarily BofI Federal Bank (a federally chartered bank), or BofI, and may be sold to us. For the years ended December 31, 2012, 2013 and 2014, loans made by issuing bank partners constituted 21.1%, 16.1% and 15.9%, respectively, of our total loan originations.
BofI establishes its underwriting criteria for the issuing bank partner program in consultation with us. We recommend term loans to BofI that meet BofI’s underwriting criteria, at which point BofI may elect to fund the loan. If BofI decides to fund the loan, BofI retains the economics on the loan for the period that it owns the loan. BofI earns origination fees from the customers who borrow from it and in addition retains the interest paid during the period BofI holds the loan. In exchange for recommending loans to BofI, we earn a marketing referral fee based on the loans recommended to, and funded by, BofI. BofI has the right to hold the loans or sell the loans to us or other purchasers, though it generally sells the loans to us on the business day following its origination of the loan. We are generally the purchaser of the loans that we refer to BofI, and to the extent we choose not to purchase a loan in any individual circumstance, we are obligated to identify an alternative purchaser. During the period when BofI owns the loans, we service the loans in exchange for a nominal fee which is waived if we end up purchasing the loan within 10 days of BofI originating the loan. Our agreement with BofI also provides for a collateral account, which is an account maintained at BofI. The account serves as cash collateral for the performance of our obligations under the agreement, which among other things may include compliance with certain covenants, and also serves to indemnify BofI for breaches by us of representations and warranties where BofI suffers damages as a result of the loans that we refer to it. The initial term of our agreement with BofI was for two years, and the agreement automatically extends for one-year periods unless terminated by either party. The agreement is currently in an extension period. Finally, the agreement may not be assigned without the prior written consent of the non-assigning party.
We are not required to have licenses to make commercial loans based on applicable laws as currently in effect and our operations as presently conducted, including when we service loans made by a federally chartered bank in states that otherwise require licensing of lenders. Some states have licensing requirements in connection with commercial lending. Virginia does not. Because our loans are made in Virginia, we are not required to be licensed in other states where our borrowers are located. Our bank partner is not required to be licensed in any state.
Federal Lending Regulations
We are a commercial lender and as such there are federal laws and regulations that affect our, and other lenders’ lending operations. These laws include, among others, portions of the Wall Street Reform and Consumer Protection Act, or the Dodd-Frank Act, anti-money laundering requirements (such as the Bank Secrecy Act of 1970 and the law commonly referred to as the USA PATRIOT Act), Equal Credit Opportunity Act, Fair Credit Reporting Act, privacy regulations (such as the Right to Financial Privacy Act of 1978), Telephone Consumer Protection Act of 1991, and requirements relating to unfair, deceptive, or abusive acts or practices.
16
Table of Contents
Competition
The small business lending market is competitive and fragmented. We expect competition to continue to increase in the future. We believe the principal factors that generally determine a company’s competitive advantage in our market include the following:
| • | ease of process to apply for a loan; |
| • | brand recognition and trust; |
| • | loan features, including rate, term and pay-back method; |
| • | loan product fit for business purpose; |
| • | transparent description of key terms; |
| • | effectiveness of customer acquisition; and |
| • | customer experience. |
Our principal competitors include traditional banks, legacy merchant cash advance providers, and newer, technology-enabled lenders.
Facilities
As of December 31, 2014, our principal facilities are located as follows. Our corporate headquarters are located in New York, New York, where we lease approximately 38,000 square feet of office space pursuant to a lease expiring in 2023. We also lease approximately 11,000 square feet of office space in Arlington, Virginia for our underwriting, servicing, collections and operations headquarters under a lease that expires in 2018 and an approximately 13,000 square foot sales office in Denver, Colorado under a lease that expires in March 2019. Subsequent to year end, we entered into leases for additional space as further described in Note 17 of Notes to Consolidated Financial Statements elsewhere in this report.
Disclosure of Information
We recognize that in today’s environment, our current and potential investors, the media and others interested in us look to social media and other online sources for information about us. We believe that these sources represent important communications channels for disseminating information about us, including information that could be deemed to constitute material non-public information. As a result, in addition to our investor relations website (http://investors.ondeck.com), filings made with the SEC, press releases we issue from time to time, and public webcasts and conference calls, we have used and intend to continue to use various social media and other online sources to disseminate information about us and, without limitation, our general business developments; financial performance; product and service offerings; research, development and other technical updates; relationships with customers, platform providers and other partners; and market and industry developments. We intend to use the following social media and other websites for the dissemination of information:
Our blog: https://www.ondeck.com/blog
Our Twitter feed: http://twitter.com/ondeckcapital
Our CEO, Noah Breslow’s Twitter feed: http://twitter.com/noahbreslow
Our Facebook page: http://www.facebook.com/OnDeckCapital
Our corporate LinkedIn page: https://www.linkedin.com/company/ondeck
We invite our current and potential investors, the media and others interested in us to visit these sources for information related to us. Please note that this list of social media and other websites may be updated from time to time on our investor relations website and/or filings we make with the SEC.
17
Table of Contents
Industry and Market Data
This report contains estimates, statistical data, and other information concerning our industry, including market size and growth rates, that are based on industry publications, surveys and forecasts, including those by Civic Economics, Oliver Wyman, Gallup, National Small Business Association and other publicly available sources. The industry and market information included in this report involves a number of assumptions and limitations, and you are cautioned not to give undue weight to such information.
The sources of industry and market data contained in this report are listed below:
| • | Civic Economics, Indie Impact Study Series: A National Comparative Survey with the American Booksellers Association, October 2012. |
| • | eVoice, 25 Hour Day Survey, March 2012. |
| • | FDIC, Loans to Small Businesses and Farms, FDIC-Insured Institutions 1995-2014, Q4 2014. |
| • | Federal Reserve Bank of New York, Small Business Credit Survey Spring 2014, August 2014. |
| • | Gallup, Wells Fargo Small Business Survey Topline, Quarter 1, 2015. |
| • | National Small Business Association, 2013 Small Business Technology Survey, September 2013. |
| • | Karen Gordon Mills and Brayden McCarthy, The State of Small Business Lending: Credit Access during the Recovery and How Technology May Change the Game, Harvard Business School, July 22, 2014. |
| • | Oliver Wyman, Financing Small Businesses, 2013. |
| • | Oliver Wyman, Small Business Banking, 2013. |
| • | U.S. Small Business Administration, Small Business GDP: Update 2002-2010, January 2012. |
| • | U.S. Small Business Administration, United States Small Business Profile, 2014. |
The industry in which we operate is subject to a high degree of uncertainty and risk due to a variety of factors, including those described in Item 1A. Risk Factors and elsewhere in this report. These and other factors could cause our actual results to differ materially from those expressed in the estimates made by the independent parties and by us.
18
Table of Contents
| Item 1A. | Risk Factors |
Our current and prospective investors should carefully consider the following risks and all other information contained in this report, including our consolidated financial statements and the related notes, “Management’s Discussion and Analysis of Financial Condition and Results of Operations” and the “Cautionary Note Regarding Forward-Looking Statements,” before making investment decisions regarding our securities. The risks and uncertainties described below are not the only ones we face, but include the most significant factors currently known by us. Additional risks and uncertainties that we are unaware of, or that we currently believe are not material, also may become important factors that affect us. If any of the following risks materialize, our business, financial condition and results of operations could be materially harmed. In that case, the trading price of our securities could decline, and you may lose some or all of your investment.
We have a limited operating history in an evolving industry, which makes it difficult to evaluate our future prospects and may increase the risk that we will not be successful.
We have a limited operating history in an evolving industry that may not develop as expected. Assessing our business and future prospects is challenging in light of the risks and difficulties we may encounter. These risks and difficulties include our ability to:
| • | increase the number and total volume of term loans and lines of credit we extend to our customers; |
| • | improve the terms on which we lend to our customers as our business becomes more efficient; |
| • | increase the effectiveness of our direct marketing, as well as our strategic partner and funding advisor program customer acquisition channels; |
| • | increase repeat borrowing by existing customers; |
| • | successfully develop and deploy new products; |
| • | successfully maintain our diversified funding strategy, including through the OnDeck Marketplace and future securitization transactions; |
| • | favorably compete with other companies that are currently in, or may in the future enter, the business of lending to small businesses; |
| • | successfully navigate economic conditions and fluctuations in the credit market; |
| • | effectively manage the growth of our business; |
| • | successfully expand our business into adjacent markets; and |
| • | successfully expand internationally. |
We may not be able to successfully address these risks and difficulties, which could harm our business and cause our operating results to suffer.
Our recent, rapid growth may not be indicative of our future growth and, if we continue to grow rapidly, we may not be able to manage our growth effectively.
Our gross revenue grew from $25.6 million in 2012 to $65.2 million in 2013 and $158.1 million in 2014. We expect that, in the future, even if our revenue continues to increase, our rate of revenue growth will decline.
In addition, we expect to continue to expend substantial financial and other resources on:
| • | personnel, including expanding our technology and analytics team and significant increases to the total compensation we pay our employees as we grow our employee headcount; |
| • | marketing, including expenses relating to increased direct marketing efforts; |
19
Table of Contents
| • | product development, including the continued development of our platform and OnDeck Score; |
| • | diversification of funding sources, including through OnDeck Marketplace; |
| • | expansion into new markets, including international geographies; |
| • | office space, as we increase the space we need for our growing employee base; and |
| • | general administration, including legal, accounting and other compliance expenses related to being a public company. |
In addition, our historical rapid growth has placed, and may continue to place, significant demands on our management and our operational and financial resources. Finally, our organizational structure is becoming more complex as we add additional staff, and we will need to improve our operational, financial and management controls as well as our reporting systems and procedures. If we cannot manage our growth effectively, our financial results will suffer.
We have a history of losses and may not achieve consistent profitability in the future.
We generated net losses of $16.8 million, $24.4 million and $18.7 million in 2012, 2013 and 2014, respectively. As of December 31, 2014, we had an accumulated deficit of $127.1 million. We will need to generate and sustain increased revenue levels in future periods in order to become profitable, and, even if we do, we may not be able to maintain or increase our level of profitability. We intend to continue to expend significant funds to expand our marketing and sales operations and technology and analytics team, increase our customer service and general loan servicing capabilities, meet the increased compliance requirements associated with our transition to and operation as a public company, lease additional space for our growing employee base, upgrade our data center infrastructure and expand into new markets. In addition, we record our loan loss provision as an expense to account for the possibility that all loans may not be repaid in full. Because we incur a given loan loss expense at the time that we issue the loan, we expect the aggregate amount of this expense to grow as we increase the number and total amount of loans we make to our customers.
Our efforts to grow our business may be more costly than we expect, and we may not be able to increase our revenue enough to offset our higher operating expenses. We may incur significant losses in the future for a number of reasons, including the other risks described in this report, and unforeseen expenses, difficulties, complications and delays, and other unknown events. If we are unable to achieve and sustain profitability, the market price of our common stock may significantly decrease.
Worsening economic conditions may result in decreased demand for our loans, cause our customers’ default rates to increase and harm our operating results.
Uncertainty and negative trends in general economic conditions in the United States and abroad, including significant tightening of credit markets, historically have created a difficult environment for companies in the lending industry. Many factors, including factors that are beyond our control, may have a detrimental impact on our operating performance. These factors include general economic conditions, unemployment levels, energy costs and interest rates, as well as events such as natural disasters, acts of war, terrorism and catastrophes.
Our customers are small businesses. Accordingly, our customers have historically been, and may in the future remain, more likely to be affected or more severely affected than large enterprises by adverse economic conditions. These conditions may result in a decline in the demand for our loans by potential customers or higher default rates by our existing customers. If a customer defaults on a loan payable to us, the loan enters a collections process where our systems and collections teams initiate contact with the customer for payments owed. If a loan is subsequently charged off, we generally sell the loan to a third-party collection agency and receive only a small fraction of the remaining amount payable to us in exchange for this sale.
There can be no assurance that economic conditions will remain favorable for our business or that demand for our loans or default rates by our customers will remain at current levels. Reduced demand for our loans would
20
Table of Contents
negatively impact our growth and revenue, while increased default rates by our customers may inhibit our access to capital, hinder the growth of our OnDeck Marketplace and negatively impact our profitability. Furthermore, we have received a large number of applications from potential customers who do not satisfy the requirements for an OnDeck loan. If an insufficient number of qualified small businesses apply for our loans, our growth and revenue could decline.
Many of our strategic partnerships are nonexclusive and subject to termination options that, if terminated, could harm the growth of our customer base and negatively affect our financial performance. Additionally, these partners are concentrated and the departure of a significant partner could have a negative impact on our operating results.
We rely on strategic partners for referrals of an increasing portion of our customers and our growth depends in part on the growth of these referrals. In 2012, 2013 and 2014, loans issued to customers referred to us by our strategic partners constituted 5.5%, 9.2% and 13.9% of our total loan originations, respectively. Many of our strategic partnerships do not contain exclusivity provisions that would prevent such partners from providing leads to competing companies. In addition, the agreements governing these partnerships contain termination provisions that, if exercised, would terminate our relationship with these partners. These agreements also contain no requirement that a partner refer us any minimum number of leads. There can be no assurance that these partners will not terminate our relationship with them or continue referring business to us in the future, and a termination of the relationship or reduction in leads referred to us would have a negative impact on our revenue and operating results.
In addition, a small number of strategic partners refer to us a significant portion of the loans made within this channel. In 2012, 2013 and 2014, loans issued to customers referred to us by our top four strategic partners constituted 4.7%, 6.8% and 9.8% of our total loan originations, respectively. In the event that one or more of these significant strategic partners terminated our relationship or reduced the number of leads provided to us, our business would be harmed.
To the extent that Funding Advisor Program partners or direct sales agents mislead loan applicants or are engaging or previously engaged in disreputable behavior, our reputation may be harmed and we may face liability.
We rely on third-party independent advisors, including business loan brokers, which we call Funding Advisor Program partners, or FAPs, for referrals of a substantial portion of the customers to whom we issue loans. In 2012, 2013 and 2014, loans issued to customers whose applications were submitted to us via the FAP channel constituted 75.1%, 56.4% and 41.4% of our total loan originations, respectively. Historically, our practice has been to conduct a personal criminal background check on one of the authorized representatives of each prospective FAPs as one element of the FAP application process; however, we have not performed such checks on all employees or agents of a FAP who might be involved in the marketing and sale of our products and we have not conducted any background checks with respect to any FAPs that joined the Funding Adviser Program before 2010 or who had an annual revenue greater than $15 million. Going forward, we will enhance the scope and nature of the due diligence applied to prospective FAPs and retroactively to existing FAPs.
Because FAPs earn fees on a commission basis, FAPs may have an incentive to mislead loan applicants, facilitate the submission by loan applicants of false application data or engage in other disreputable behavior so as to earn additional commissions on those inaccurate loan applications. In addition, while we strictly prohibit, by policy and contract, all FAPs from charging customers any additional unauthorized fees, it is possible that some FAPs may attempt to charge such fees despite our prohibition. We also rely on our direct sales agents for customer acquisition in our direct marketing channel, and these sales agents may also engage in disreputable behavior to increase our customer base. If FAPs or our direct sales agents mislead our customers or engage in any other disreputable behavior, our customers are less likely to be satisfied with their experience and to become repeat customers, and we may be subject to costly and time-consuming litigation, each of which could harm our reputation
21
Table of Contents
and operating performance. We have been subject to negative publicity related to our FAP channel, including regarding the alleged backgrounds of certain of their employees. If we continue to experience such negative publicity, our ability to continue to increase our revenue could be impaired and our business could otherwise be materially and negatively impacted.
We are also implementing certain enhanced contractual provisions and compliance-related measures related to our funding advisor channel, in addition to enhanced due diligence and screening procedures. While these measures are intended to improve certain aspects and reduce the risks of how we work with funding advisors and how they work with our customers, and our plans have progressed, we cannot assure you of the exact timing that all the measures will be implemented, whether they will work as intended, that other compliance-related concerns will not emerge in the future, that the funding advisors will comply with these measures, and that these measures will not negatively impact our business from this channel, including our financial performance, or have other unintended or negative impacts on our business beyond the FAP channel, such as with existing or potential strategic partners, customers or funding sources.
We pay commissions to our strategic partners and FAPs upfront and generally do not recover them in the event the related loan or line of credit is eventually charged-off.
We pay commissions to strategic partners and FAPs on the term loans and lines of credit we originate through these channels. We pay these commissions at the time the term loan is funded or line of credit is opened. However, we generally do not require that this commission be repaid to us in the event of a default on a term loan or line of credit. While we generally discontinue working with strategic partners and FAPs that refer customers to us that ultimately have unacceptably high levels of defaults, to the extent that our strategic partners and FAPs are not at risk of forfeiting their commissions in the event of defaults, they may to an extent be indifferent to the riskiness of the potential customers that they refer to us.
Our business may be adversely affected by disruptions in the credit markets, including reduced access to credit.
We depend on debt facilities and other forms of debt in order to finance most of the loans we make to our customers. However, we cannot guarantee that these financing sources will continue to be available beyond the current maturity date of each debt facility, on reasonable terms or at all. As the volume of loans that we make to customers on our platform increases, we may require the expansion of our borrowing capacity on our existing debt facilities and other debt arrangements or the addition of new sources of capital. The availability of these financing sources depends on many factors, some of which are outside of our control. We may also experience the occurrence of events of default or breaches of financial or performance covenants under our debt agreements, which could reduce or terminate our access to institutional funding. In addition, we began selling loans to third parties via our OnDeck Marketplace in October 2013 and completed our first securitization transaction in May 2014. There can be no assurance that investors will continue to purchase our loans via our OnDeck Marketplace or that we will be able to successfully access the securitization markets again. Furthermore, because we only recently began accessing these sources of capital, there is a greater possibility that these sources of capital may not be available in the future. In the event of a sudden or unexpected shortage of funds in the banking and financial system, we cannot be sure that we will be able to maintain necessary levels of funding without incurring high funding costs, a reduction in the term of funding instruments or the liquidation of certain assets. If we were to be unable to arrange new or alternative methods of financing on favorable terms, we may have to curtail our origination of loans, which could have a material adverse effect on our business, financial condition, operating results and cash flow.
If the information provided by customers to us is incorrect or fraudulent, we may misjudge a customer’s qualification to receive a loan and our operating results may be harmed.
Our lending decisions are based partly on information provided to us by loan applicants. To the extent that these applicants provide information to us in a manner that we are unable to verify, the OnDeck Score may not
22
Table of Contents
accurately reflect the associated risk. In addition, data provided by third-party sources is a significant component of the OnDeck Score and this data may contain inaccuracies. Inaccurate analysis of credit data that could result from false loan application information could harm our reputation, business and operating results.
In addition, we use identity and fraud checks analyzing data provided by external databases to authenticate each customer’s identity. From time to time in the past, these checks have failed and there is a risk that these checks could also fail in the future, and fraud may occur. We may not be able to recoup funds underlying loans made in connection with inaccurate statements, omissions of fact or fraud, in which case our revenue, operating results and profitability will be harmed. Fraudulent activity or significant increases in fraudulent activity could also lead to regulatory intervention, negatively impact our operating results, brand and reputation and require us to take steps to reduce fraud risk, which could increase our costs.
Our current level of interest rate spread and gains of sales of loans in our OnDeck Marketplace program may decline in the future. Any material reduction in our interest rate spread or gains on sales of loans could reduce our profitability.
We earn a substantial majority of our revenues from interest payments on the loans we make to our customers. Financial institutions and other funding sources provide us with the capital to fund these term loans and lines of credit and charge us interest on funds that we draw down. In the event that the spread between the rate at which we lend to our customers and the rate at which we borrow from our lenders decreases, our financial results and operating performance will be harmed. The interest rates we charge to our customers and pay to our lenders could each be affected by a variety of factors, including access to capital based on our business performance, the volume of loans we make to our customers, competition and regulatory requirements. These interest rates may also be affected by a change over time in the mix of the types of products we sell to our customers and investors and a shift among our channels of customer acquisition. Interest rate changes may adversely affect our business forecasts and expectations and are highly sensitive to many macroeconomic factors beyond our control, such as inflation, recession, the state of the credit markets, changes in market interest rates, global economic disruptions, unemployment and the fiscal and monetary policies of the federal government and its agencies. In addition, we generate gains on sales of loans to institutional investors through our OnDeck Marketplace program. The prices we are able to charge for loans we sell are based on a variety of factors, including the terms and credit risk associated with loans, investor demand and other factors. If these variables or others were to change, we might be required to reduce our sales prices on loans, sell fewer loans or both, which could reduce our gains on sales of loans in the OnDeck Marketplace program. Any material reduction in our interest rate spread or gains on sale of loans could have a material adverse effect on our business, results of operations and financial condition.
If the choice of law provisions in our loan agreements are found to be unenforceable, we may be found to be in violation of state interest rate limit laws.
Although the federal government does not currently regulate the maximum interest rates that may be charged on commercial loan transactions, many states have enacted interest rate limit laws specifying the maximum legal interest rate at which loans can be made in the state. We apply Virginia law to the underlying agreement for loans that we originate because our loans are underwritten and entered into in the state of Virginia, where our underwriting, servicing, operations and collections teams are headquartered.
Virginia does not limit interest rates on commercial loans of $5,000 or more. Assuming a court were to recognize this choice of law provision, Virginia law would be applied to a dispute between the customer and us regardless of where the customer is located. We intend for Virginia law to control over state interest rate limit laws that would otherwise be applicable to these loans. We are not aware of any broad-based legal challenges to date to the applicability of Virginia law to these loans or the loans of other companies. However, many laws to which we are subject were adopted prior to the advent of the internet and related technologies and, as a result, do not expressly contemplate or address the unique issues of the internet such as the applicability of laws to online transactions, including in our case, the origination of loans. In addition, many laws that do reference the internet
23
Table of Contents
are being interpreted by the courts, but their applicability and scope remain uncertain. As a result, we cannot predict whether a court may seek to apply a different choice of law to our loans or to otherwise invalidate the applicability of Virginia law to our loans. If the applicability of Virginia law to these loans were challenged, and these loans were found to be governed by the laws of another state, and such other state has an interest rate limit law that prohibits the interest rate in effect with respect to such loans, the obligations of our customers to pay all or a portion of the interest and principal on these loans could be found unenforceable. A judgment that the choice of law provisions in our loan agreements is unenforceable also could result in costly and time-consuming litigation, penalties, damage to our reputation, trigger repurchase obligations, negatively impact the terms of our future loans and harm our operating results. Likewise, a judgment that the choice of law provision in other commercial loan agreements is unenforceable could result in challenges to our choice of law provision and that could result in costly and time-consuming litigation. In addition, it could cause us to incur substantial additional expense to comply with the laws of various states, including either our licensing as a lender in the various states, or requiring us to place more loans through our issuing bank partners.
Issuing bank partners with whom we have agreements lend to customers in certain states. If our relationships with issuing bank partners were to end, then we may have to comply with additional restrictions, and certain states may require us to obtain a lending license.
In states that do not require a license to make commercial loans, we make term loans directly to customers pursuant to Virginia law, which is the governing law we require in the underlying loan agreements with our customers. However, nine states and jurisdictions, namely Alaska, California, Maryland, Nevada, North Dakota, Rhode Island, South Dakota, Vermont, and Washington, D.C., require a license to make certain commercial loans and may not honor a Virginia choice of law. They assert either that their own licensing laws and requirements should generally apply to commercial loans made by nonbanks or apply to commercial loans made by nonbanks of certain principal amounts or with certain interest rates or other terms. In such states and jurisdictions and in some other circumstances, term loans are made by an issuing bank partner that is not subject to state licensing, primarily BofI Federal Bank (a federally chartered bank), and may be sold to us. For the years ended December 31, 2012, 2013 and 2014, loans made by issuing bank partners constituted 21.1%, 16.1% and 15.9%, respectively, of our total loan originations. These loans are not governed by Virginia law, but rather the laws of the issuing bank partner’s home state, California law in the case of BofI Federal Bank. The remainder of our term loans provide that they are to be governed by Virginia law. Our issuing bank partner currently originates all of our loans in California, Nevada, North Dakota, South Dakota and Vermont as well as some loans in other states and jurisdictions in addition to those listed above. Although such states and jurisdictions may have licensing requirements and/or interest rate caps that purport to apply to some or all commercial loans, all such licensing requirements and/or caps that would otherwise be applicable are federally preempted when these loans are originated by our federally chartered issuing bank partner. As a result, loans originated by our issuing bank partner are generally priced the same as loans originated by us under Virginia law. While the other 42 U.S. states where we originate loans currently honor our Virginia choice of law, future legal changes could result in any one or more of those states no longer honoring our Virginia choice of law. In that case, we could address the legal change in a manner similar to how we approach the nine states and jurisdictions that currently require licensing and may not honor a Virginia choice of law, or we could consider other approaches, including licensing.
If we were to seek to make loans directly in those states referenced in the paragraph above or if we were otherwise not able to work with an issuing bank partner, we would have to attempt to comply with the laws of these states in other ways, including through obtaining lending licenses. Compliance with the laws of such states could be costly, and if we are unable to obtain such licenses, our loan volume could substantially decrease and our revenues, growth and profitability would be harmed. In addition, if our activities under the current arrangement with issuing bank partners were deemed to constitute lending within any such jurisdiction, we could be found to have engaged in impermissible lending within such jurisdictions. As a result, we could be subjected to fines and other penalties, all or a portion of the principal and interest charged on the applicable loans could be found to be unenforceable and, to the extent it is determined that such loans were not originated in accordance with all applicable laws, we could be obligated to repurchase any loans from our debt facilities and OnDeck
24
Table of Contents
Marketplace participants that failed to comply with such legal requirements. Any finding that we engaged in lending in states in which we are unlicensed to do so could lead to litigation, harm our reputation and negatively impact our operating expenses and profitability.
An increase in customer default rates may reduce our overall profitability and could also affect our ability to attract institutional funding. Further, historical default rates may not be indicative of future results.
Customer default rates may be significantly affected by economic downturns or general economic conditions beyond our control and beyond the control of individual customers. In particular, loss rates on customer loans may increase due to factors such as prevailing interest rates, the rate of unemployment, the level of consumer and business confidence, commercial real estate values, the value of the U.S. dollar, energy prices, changes in consumer and business spending, the number of personal bankruptcies, disruptions in the credit markets and other factors. In the fourth quarter of 2014, we instituted a program that allowed us to offer both our term loan and line of credit products to the same customers, subject to customary credit and loan underwriting procedures. To the extent that our customers borrow from us under both products and default, our losses could be greater than if we had offered them only one product. In addition, as of December 31, 2014, approximately 28.5% of our total loans outstanding related to customers with fewer than five years of operating history. While our OnDeck Score is designed to establish that, notwithstanding such limited operating and financial history, customers would be a reasonable credit risk, our loans may nevertheless be expected to have a higher default rate than loans made to customers with more established operating and financial histories. In addition, if default rates reach certain levels, the principal of our securitized notes may be required to be paid down, and we may no longer be able to borrow from our debt facilities to fund future loans. In addition, if customer default rates increase beyond forecast levels, returns for investors in our OnDeck Marketplace program will decline and demand by investors to participate in this program will decrease, each of which will harm our reputation, operating results and profitability.
Our risk management efforts may not be effective.
We could incur substantial losses and our business operations could be disrupted if we are unable to effectively identify, manage, monitor and mitigate financial risks, such as credit risk, interest rate risk, liquidity risk, and other market-related risk, as well as operational risks related to our business, assets and liabilities. To the extent our models used to assess the creditworthiness of potential customers do not adequately identify potential risks, the OnDeck Score produced would not adequately represent the risk profile of such customers and could result in higher risk than anticipated. Our risk management policies, procedures, and techniques, including our use of our proprietary OnDeck Score technology, may not be sufficient to identify all of the risks we are exposed to, mitigate the risks that we have identified or identify concentrations of risk or additional risks to which we may become subject in the future.
We rely on our proprietary credit-scoring model in the forecasting of loss rates. If we are unable to effectively forecast loss rates, it may negatively impact our operating results.
In making a decision whether to extend credit to prospective customers, we rely heavily on our OnDeck Score, the credit score generated by our proprietary credit-scoring model and decisioning system, an empirically derived suite of statistical models built using third-party data, data from our customers and our credit experience gained through monitoring the performance of our customers over time. If our proprietary credit-scoring model and decisioning system fails to adequately predict the creditworthiness of our customers, or if our proprietary cash flow analytics system fails to assess prospective customers’ financial ability to repay their loans, or if any portion of the information pertaining to the prospective customer is false, inaccurate or incomplete, and our systems did not detect such falsities, inaccuracies or incompleteness, or any or all of the other components of the credit decision process described herein fails, we may experience higher than forecasted losses. Furthermore, if we are unable to access the third-party data used in our OnDeck Score, or our access to such data is limited, our ability to accurately evaluate potential customers will be compromised, and we may be unable to effectively
25
Table of Contents
predict probable credit losses inherent in our loan portfolio, which would negatively impact our results of operations.
Additionally, if we make errors in the development and validation of any of the models or tools we use to underwrite the loans that we securitize or sell to investors, these investors may experience higher delinquencies and losses and we may be subject to liability. Moreover, if future performance of our customers’ loans differs from past experience (driven by factors, including but not limited to, macroeconomic factors, policy actions by regulators, lending by other institutions and reliability of data used in the underwriting process), which experience has informed the development of the underwriting procedures employed by us, delinquency rates and losses to investors of our securitized debt from our customers’ loans could increase, thereby potentially subjecting us to liability. This inability to effectively forecast loss rates could also inhibit our ability to borrow from our debt facilities, which could further hinder our growth and harm our financial performance.
Our allowance for loan losses is determined based upon both objective and subjective factors and may not be adequate to absorb loan losses.
We face the risk that our customers will fail to repay their loans in full. We reserve for such losses by establishing an allowance for loan losses, the increase of which results in a charge to our earnings as a provision for loan losses. We have established an evaluation process designed to determine the adequacy of our allowance for loan losses. While this evaluation process uses historical and other objective information, the classification of loans and the forecasts and establishment of loan losses are also dependent on our subjective assessment based upon our experience and judgment. Actual losses are difficult to forecast, especially if such losses stem from factors beyond our historical experience, and unlike traditional banks, we are not subject to periodic review by bank regulatory agencies of our allowance for loan losses. As a result, there can be no assurance that our allowance for loan losses will be comparable to that of traditional banks subject to regulatory oversight or sufficient to absorb losses or prevent a material adverse effect on our business, financial condition and results of operations.
We face increasing competition and, if we do not compete effectively, our operating results could be harmed.
We compete with other companies that lend to small businesses. These companies include traditional banks, merchant cash advance providers and newer, technology-enabled lenders. In addition, other technology companies that primarily lend to individual consumers have already begun to focus, or may in the future focus, their efforts on lending to small businesses.
In some cases, our competitors focus their marketing on our industry sectors and seek to increase their lending and other financial relationships with specific industries such as restaurants. In other cases, some competitors may offer a broader range of financial products to our clients, and some competitors may offer a specialized set of specific products or services. Many of these competitors have significantly more resources and greater brand recognition than we do and may be able to attract customers more effectively than we do.
When new competitors seek to enter one of our markets, or when existing market participants seek to increase their market share, they sometimes undercut the pricing and/or credit terms prevalent in that market, which could adversely affect our market share or ability to exploit new market opportunities. Our pricing and credit terms could deteriorate if we act to meet these competitive challenges. Further, to the extent that the commissions we pay to our strategic partners and funding advisors are not competitive with those paid by our competitors, whether on new loans or renewals or both, these partners and advisors may choose to direct their business elsewhere. Those competitive pressures could also result in us reducing the origination fees or interest we charge to our customers. All of the foregoing could adversely affect our business, results of operations, financial condition and future growth.
26
Table of Contents
To date, we have derived our revenue from a limited number of products and markets. Our efforts to expand our market reach and product portfolio may not succeed and may reduce our revenue growth.
We offer term loans and lines of credit to our customers in the United States and term loans to our customers in Canada. Many of our competitors offer a more diverse set of products to small businesses and in additional international markets. While we intend to eventually broaden the scope of products that we offer to our customers, there can be no assurance that we will be successful in such efforts. Failure to broaden the scope of products we offer to potential customers may inhibit the growth of repeat business from our customers and harm our operating results. There also can be no guarantee that we will be successful with respect to our current efforts in Canada, as well as any further expansion beyond the United States and Canada, if we decide to attempt such expansion at all, which may also inhibit the growth of our business.
In connection with our sale of loans to our subsidiaries and through OnDeck Marketplace, we make representations and warranties concerning the loans we sell. If those representations and warranties are not correct, we could be required to repurchase the loans. Any significant required repurchases could have an adverse effect upon our ability to operate and fund our business.
In our asset-backed securitization facility and our other asset-backed revolving debt facilities, we transfer loans to our subsidiaries and make numerous representations and warranties concerning the loans we transfer including representations and warranties that the loans meet the eligibility requirements. We also make representations and warranties in connection with the loans we sell through OnDeck Marketplace. If those representations and warranties are incorrect, we may be required to repurchase the loans. In connection with OnDeck Marketplace and our asset-backed revolving debt facilities, we have been required to repurchase an immaterial amount of loans. Failure to repurchase such loans when required would constitute an event of default under the securitization and other asset-backed facilities and may constitute a termination event under the applicable OnDeck Marketplace agreement. There is no assurance, however, that we would have adequate resources to make such repurchases or, if we did make the repurchases, that such event might not have a material adverse effect on our business.
We may not have adequate funding capacity in the event that an unforeseen number of customers to whom we have extended a line of credit decide to draw their lines at the same time.
Our current capacity to fund our customers’ lines of credit through existing debt facilities is limited. Accordingly, we maintain cash available to fund our customers’ lines of credit based on the amount that we foresee these customers drawing down. For example, if we make available a line of credit for $15,000 to a small business, we may only reserve a portion of this amount at any given time for immediate drawdown. We base the amount that we reserve on our analysis of aggregate portfolio demand and the historical activity of customers using the line of credit product. However, if we inaccurately predict the number of customers that draw down on their lines of credit at a certain time, or if these customers draw down in greater amounts than we forecast, we may not have enough funds available to lend to them. Failure to provide funds drawn down by our customers on their lines of credit may expose us to liability, damage our reputation and inhibit our growth.
As a result of becoming a public company in December 2014, we are obligated to maintain proper and effective internal controls over financial reporting. We may not complete our analysis of our internal controls over financial reporting in a timely manner, or these internal controls may not be determined to be effective, which may adversely affect investor confidence in our company and, as a result, the value of our common stock.
As a public company, we are required to furnish a report by management on, among other things, the effectiveness of our internal control over financial reporting for 2015 and subsequent years. This assessment needs to include disclosure of any material weaknesses identified by our management in our internal control over financial reporting.
27
Table of Contents
We are currently evaluating our internal controls, identifying and remediating deficiencies in those internal controls and documenting the results of our evaluation, testing and remediation.
In connection with our preparation of the financial statements for the year ended December 31, 2013, which were issued on December 4, 2014, we identified four control deficiencies that did not rise to the level of a material weakness, on an individual basis or in the aggregate, but did represent significant deficiencies in our internal control over financial reporting. A control deficiency is considered a significant deficiency if it represents a deficiency, or a combination of deficiencies, in internal control over financial reporting that is less severe than a material weakness, yet important enough to merit attention by those responsible for oversight of a company’s financial reporting. The particular deficiencies related to the effectiveness of our information technology controls, the formalization of key controls in certain operations and finance processes relating to the retention, documentation and evidence of reviews and approvals, the timely reconciliation of certain sub-ledgers and ledgers, and the financial statement close process, specifically the process of recording prepaid assets and expenses accurately. We are continuing our efforts to resolve the significant deficiency relating to the effectiveness of our information technology controls, including designing and implementing policies and procedures to address this deficiency. We have implemented new policies and procedures designed to address the other three significant deficiencies and are in the process of testing the efficacy of those actions. Until our testing processes are complete, we will not have a sufficient basis to conclude whether those actions were effective to remediate one or more of those three significant deficiencies. The actions we have taken and plan to take are subject to ongoing senior management review and audit committee oversight.
In the course of preparing our financial statements for the three months and year ended December 31, 2014, we assessed an additional control deficiency that we identified as a significant deficiency. This significant deficiency relates to the accuracy of certain manual spreadsheets. We are in the process of designing and implementing changes to our policies and procedures to remedy this significant deficiency.
We cannot assure you that the measures we have taken, or will take, to remediate these significant deficiencies will be effective. Moreover, we cannot assure you that we have identified all significant deficiencies or that we will not in the future have additional significant deficiencies or identify material weaknesses. Our independent registered public accounting firm has not evaluated any of the measures we have taken, or that we propose to take, to address these significant deficiencies discussed above.
In addition to the specific actions we have taken or will take to address the foregoing significant deficiencies, because our business has grown and we are a public company, we are seeking to transition to a more developed internal control environment that incorporates increased automation.
We also may not be able to complete our evaluation, testing and any required remediation in a timely fashion. During the evaluation and testing process, if we identify one or more material weaknesses in our internal control over financial reporting that we are unable to remediate before the end of the same fiscal year in which the material weakness is identified or if we are otherwise unable to maintain effective internal controls over financial reporting, we will be unable to assert that our internal controls are effective. If we are unable to assert that our internal control over financial reporting is effective, or if our auditors are unable to attest to management’s report on the effectiveness of our internal controls, we could lose investor confidence in the accuracy and completeness of our financial reports, which would cause the price of our common stock to decline.
We will be required to disclose material changes made in our internal controls and procedures on a quarterly basis. However, our independent registered public accounting firm will not be required to formally attest to the effectiveness of our internal control over financial reporting pursuant to Section 404 of the Sarbanes-Oxley Act of 2002, or the Sarbanes-Oxley Act, until the later of the year following our first annual report required to be filed with the SEC or the date we are no longer an “emerging growth company” as defined in the Jump Our Business Startups Act of 2012, or the JOBS Act. To comply with the requirements of being a public company, we may need to undertake various actions, such as implementing new internal controls and procedures and hiring accounting or internal audit staff.
28
Table of Contents
We will incur increased costs and demands upon management as a result of complying with the laws and regulations affecting public companies, which could harm our results of operations and our ability to attract and retain qualified executives and board members.
As a public company we incur significant legal, accounting, and other expenses that we did not incur as a private company and these expenses will increase after we cease to be an “emerging growth company.” In addition, the Sarbanes-Oxley Act and rules subsequently implemented by the SEC and the New York Stock Exchange, or NYSE, impose various requirements on public companies, including requiring changes in corporate governance practices. Our management and other personnel will need to devote a substantial amount of time to these compliance initiatives. Moreover, these rules and regulations have increased, and will continue to increase, our legal, accounting and financial compliance costs and have made, and will continue to make, some activities more time consuming and costly. For example, we expect these rules and regulations to make it more difficult and more expensive for us to obtain director and officer liability insurance, and we may be required to accept reduced policy limits and coverage or to incur substantial costs to maintain the same or similar coverage. These rules and regulations could also make it more difficult for us to attract and retain qualified persons to serve on our board of directors or our board committees or as executive officers.
In addition, the Sarbanes-Oxley Act requires, among other things, that we assess the effectiveness of our internal control over financial reporting annually and the effectiveness of our disclosure controls and procedures quarterly. In particular, beginning with the year ending December 31, 2015, we will need to perform system and process evaluation and testing of our internal control over financial reporting to allow management to report on, and our independent registered public accounting firm potentially to attest to, the effectiveness of our internal control over financial reporting, as required by Section 404 of the Sarbanes-Oxley Act, or Section 404. As long as we remain an “emerging growth company” we may elect to avail ourselves of the exemption from the requirement that our independent registered public accounting firm attest to the effectiveness of our internal control over financial reporting under Section 404. However, we may no longer avail ourselves of this exemption when we cease to be an “emerging growth company” and, when our independent registered public accounting firm is required to undertake an assessment of our internal control over financial reporting, the cost of our compliance with Section 404 will correspondingly increase. Our compliance with applicable provisions of Section 404 will require that we incur substantial accounting expense and expend significant management time on compliance-related issues as we implement additional corporate governance practices and comply with reporting requirements. Moreover, if we are not able to comply with the requirements of Section 404 applicable to us in a timely manner, or if we or our independent registered public accounting firm identifies deficiencies in our internal control over financial reporting that are deemed to be material weaknesses, the market price of our stock could decline and we could be subject to sanctions or investigations by the SEC or other regulatory authorities, which would require additional financial and management resources.
Furthermore, investor perceptions of our company may suffer if deficiencies are found, and this could cause a decline in the market price of our stock. Irrespective of compliance with Section 404, any failure of our internal control over financial reporting could have a material adverse effect on our stated operating results and harm our reputation. We expect to have in place accounting, internal audit and other management systems and resources that will allow us to maintain compliance with the requirements of the Sarbanes-Oxley Act at the end of any phase-in periods permitted by the NYSE, the SEC, and the JOBS Act. If we are unable to implement these changes effectively or efficiently, it could harm our operations, financial reporting or financial results and could result in an adverse opinion on internal control from our independent registered public accounting firm.
Competition for our employees is intense, and we may not be able to attract and retain the highly skilled employees whom we need to support our business.
Competition for highly skilled engineering and data analytics personnel is extremely intense, and we continue to face difficulty identifying and hiring qualified personnel in many areas of our business. We may not be able to hire and retain such personnel at compensation levels consistent with our existing compensation and
29
Table of Contents
salary structure. Many of the companies with which we compete for experienced employees have greater resources than we have and may be able to offer more attractive terms of employment. In particular, candidates making employment decisions, specifically in high-technology industries, often consider the value of any equity they may receive in connection with their employment. Any significant volatility in the price of our stock may adversely affect our ability to attract or retain highly skilled technical, financial and marketing personnel.
In addition, we invest significant time and expense in training our employees, which increases their value to competitors who may seek to recruit them. If we fail to retain our employees, we could incur significant expenses in hiring and training their replacements and the quality of our services and our ability to serve our customers could diminish, resulting in a material adverse effect on our business.
We rely on our management team and need additional key personnel to grow our business, and the loss of key employees or inability to hire key personnel could harm our business.
We believe our success has depended, and continues to depend, on the efforts and talents of our executives and employees, including Noah Breslow, our Chief Executive Officer. Our future success depends on our continuing ability to attract, develop, motivate and retain highly qualified and skilled employees. Qualified individuals are in high demand, and we may incur significant costs to attract and retain them. In addition, the loss of any of our senior management or key employees could materially adversely affect our ability to execute our business plan and strategy, and we may not be able to find adequate replacements on a timely basis, or at all. Our executive officers and other employees are at-will employees, which means they may terminate their employment relationship with us at any time, and their knowledge of our business and industry would be extremely difficult to replace. We cannot ensure that we will be able to retain the services of any members of our senior management or other key employees. If we do not succeed in attracting well-qualified employees or retaining and motivating existing employees, our business could be materially and adversely affected.
We may require additional capital to pursue our business objectives and respond to business opportunities, challenges or unforeseen circumstances. If capital is not available to us, our business, operating results and financial condition may be harmed.
Since our founding, we have raised substantial equity and debt financing to support the growth of our business. Because we intend to continue to make investments to support the growth of our business, we may require additional capital to pursue our business objectives and respond to business opportunities, challenges or unforeseen circumstances, including increasing our marketing expenditures to improve our brand awareness, developing new products or services or further improving existing products and services, enhancing our operating infrastructure and acquiring complementary businesses and technologies. Accordingly, we may need to engage in equity or debt financings to secure additional funds. However, additional funds may not be available when we need them, on terms that are acceptable to us, or at all. In addition, our agreements with our lenders contain restrictive covenants relating to our capital raising activities and other financial and operational matters, and any debt financing that we secure in the future could involve further restrictive covenants which may make it more difficult for us to obtain additional capital and to pursue business opportunities. Volatility in the credit markets may also have an adverse effect on our ability to obtain debt financing.
If we raise additional funds through further issuances of equity or convertible debt securities, our existing stockholders could suffer significant dilution, and any new equity securities we issue could have rights, preferences and privileges superior to those of holders of our common stock. If we are unable to obtain adequate financing or financing on terms satisfactory to us, when we require it, our ability to continue to pursue our business objectives and to respond to business opportunities, challenges or unforeseen circumstances could be significantly limited, and our business, operating results, financial condition and prospects could be adversely affected.
30
Table of Contents
Our agreements with our lenders contain a number of early payment triggers and covenants. A breach of such triggers or covenants or other terms of such agreements could result in an early amortization, default, and/or acceleration of the related funding facilities which could materially impact our operations.
Primary funding sources available to support the maintenance and growth of our business include, among others, an asset-backed securitization facility, other asset-backed revolving debt facilities and corporate debt. Our liquidity would be materially adversely affected by our inability to comply with various covenants and other specified requirements set forth in our agreements with our lenders which could result in the early amortization, default and/or acceleration of our existing facilities. Such covenants and requirements include financial covenants, portfolio performance covenants and other events. For a description of these covenants, requirements and events, see section titled Management’s Discussion and Analysis of Financial Condition and Results of Operations—Liquidity and Capital Resources.
During an early amortization period or occurrence of an event of default, principal collections from the loans in our asset-backed facilities would be applied to repay principal under such facilities rather than being available on a revolving basis to fund purchases of newly originated loans. During the occurrence of an event of default under any of our facilities, the applicable lenders could accelerate the related debt and such lenders’ commitments to extend further credit under the related facility would terminate. Our asset-backed securitization trust would not be able to issue future series out of such securitization. If we were unable to repay the amounts due and payable under such facilities, the applicable lenders could seek remedies, including against the collateral pledged under such facilities. A default under one facility could also lead to default under other facilities due to cross-acceleration or cross-default provisions.
An early amortization event or event of default would negatively impact our liquidity, including our ability to originate new loans, and require us to rely on alternative funding sources, which might increase our funding costs or which might not be available when needed. If we were unable to arrange new or alternative methods of financing on favorable terms, we might have to curtail the origination of loans, which could have a material adverse effect on our business, financial condition, operating results and cash flow, which in turn could have a material adverse effect on our ability to meet our obligations under our facilities.
We act as servicer with respect to our facilities. If we default in our servicing obligations, an early amortization event of default could occur with respect to the applicable facility and we could be replaced as servicer.
The lending industry is highly regulated. Changes in regulations or in the way regulations are applied to our business could adversely affect our business.
The regulatory environment in which lending institutions operate has become increasingly complex, and following the financial crisis of 2008, supervisory efforts to enact and apply relevant laws, regulations and policies have become more intense. Changes in laws or regulations or the regulatory application or judicial interpretation of the laws and regulations applicable to us could adversely affect our ability to operate in the manner in which we currently conduct business or make it more difficult or costly for us to originate or otherwise make additional loans, or for us to collect payments on loans by subjecting us to additional licensing, registration and other regulatory requirements in the future or otherwise. For example, if our loans were determined for any reason not to be commercial loans, we would be subject to many additional requirements, and our fees and interest arrangements could be challenged by regulators or our customers. A material failure to comply with any such laws or regulations could result in regulatory actions, lawsuits and damage to our reputation, which could have a material adverse effect on our business and financial condition and our ability to originate and service loans and perform our obligations to investors and other constituents.
A proceeding relating to one or more allegations or findings of our violation of such laws could result in modifications in our methods of doing business that could impair our ability to collect payments on our loans or
31
Table of Contents
to acquire additional loans or could result in the requirement that we pay damages and/or cancel the balance or other amounts owing under loans associated with such violation. We cannot assure you that such claims will not be asserted against us in the future. To the extent it is determined that the loans we make to our customers were not originated in accordance with all applicable laws, we would be obligated to repurchase from the entity holding the applicable loan any such loan that fails to comply with legal requirements. We may not have adequate resources to make such repurchases.
Financial regulatory reform relating to asset-backed securities has not been fully implemented and could have a significant impact on our ability to access the asset-backed market.
We rely upon asset-backed financing for a significant portion of our funds with which to carry on our business. Asset-backed securities and the securitization markets were heavily affected by the Dodd-Frank Wall Street Reform and Consumer Protection Act, or the Dodd-Frank Act, which was signed into law in 2010 and have also been a focus of increased regulation by the SEC. However, some of the regulations to be implemented under the Dodd-Frank Act have not yet been finalized and other asset-backed regulations that have been adopted by the SEC have delayed effective dates. For example, the Dodd-Frank Act mandates the implementation of rules requiring securitizers or originators to retain an economic interest in a portion of the credit risk for any asset that they securitize or originate. In October 2014, the SEC adopted final rules in relation to such risk retention, but such rules will not be effective with respect to our transactions until late in 2016. In addition, the SEC previously proposed separate rules which would affect the disclosure requirements for registered as well as unregistered issuances of asset-backed securities. The SEC has recently adopted final rules which affect the disclosure requirements for registered issuances of asset-backed securities backed by residential mortgages, commercial mortgages, auto loans, auto leases and debt securities. However, final rules that would affect the disclosure requirements for registered issuances of asset-backed securities backed by other types of collateral or for unregistered issuances of asset-backed securities have not been adopted. Any of such rules if implemented could adversely affect our ability to access the asset-backed market or our cost of accessing that market.
Our success and future growth depend in part on our successful marketing efforts and increased brand awareness. Failure to effectively use our brand to convert sales may negatively affect our growth and our financial performance.
We believe that an important component of our growth will be continued market penetration through our direct marketing channel. To achieve this growth, we anticipate relying heavily on marketing and advertising to increase the visibility of the OnDeck brand with potential customers. The goal of this marketing and advertising is to increase the strength, recognition and trust in the OnDeck brand, drive more unique visitors to submit loan applications on our website, and ultimately increase the number of loans made to our customers. We incurred expenses of $18.1 million and $33.2 million on sales and marketing in the years ended December 31, 2013 and 2014, respectively.
Our business model relies on our ability to scale rapidly and to decrease incremental customer acquisition costs as we grow. If we are unable to recover our marketing costs through increases in website traffic and in the number of loans made by visitors to our platform, or if we discontinue our broad marketing campaigns, it could have a material adverse effect on our growth, results of operations and financial condition.
Customer complaints or negative publicity could result in a decline in our customer growth and our business could suffer.
Our reputation is very important to attracting new customers to our platform as well as securing repeat lending to existing customers. While we believe that we have a good reputation and that we provide our customers with a superior experience, there can be no assurance that we will continue to maintain a good relationship with our customers or avoid negative publicity. Any damage to our reputation, whether arising from our conduct of business, negative publicity, regulatory, supervisory or enforcement actions, matters affecting our
32
Table of Contents
financial reporting or compliance with SEC and New York Stock Exchange listing requirements, security breaches or otherwise could have a material adverse effect on our business.
Security breaches of customers’ confidential information that we store may harm our reputation and expose us to liability.
We store our customers’ bank information, credit information and other sensitive data. Any accidental or willful security breaches or other unauthorized access could cause the theft and criminal use of this data. Security breaches or unauthorized access to confidential information could also expose us to liability related to the loss of the information, time-consuming and expensive litigation and negative publicity. If security measures are breached because of third-party action, employee error, malfeasance or otherwise, or if design flaws in our software are exposed and exploited, and, as a result, a third party obtains unauthorized access to any of our customers’ data, our relationships with our customers will be severely damaged, and we could incur significant liability.
Because techniques used to obtain unauthorized access or to sabotage systems change frequently and generally are not recognized until they are launched against a target, we and our third-party hosting facilities may be unable to anticipate these techniques or to implement adequate preventative measures. In addition, many states have enacted laws requiring companies to notify individuals of data security breaches involving their personal data. These mandatory disclosures regarding a security breach are costly to implement and often lead to widespread negative publicity, which may cause our customers to lose confidence in the effectiveness of our data security measures. Any security breach, whether actual or perceived, would harm our reputation and we could lose customers.
The collection, processing, storage, use and disclosure of personal data could give rise to liabilities as a result of governmental regulation, conflicting legal requirements or differing views of personal privacy rights.
We receive, collect, process, transmit, store and use a large volume of personally identifiable information and other sensitive data from customers and potential customers. There are federal, state and foreign laws regarding privacy, recording telephone calls and the storing, sharing, use, disclosure and protection of personally identifiable information and sensitive data. Specifically, personally identifiable information is increasingly subject to legislation and regulations to protect the privacy of personal information that is collected, processed and transmitted. Any violations of these laws and regulations may require us to change our business practices or operational structure, address legal claims and sustain monetary penalties and/or other harms to our business.
The regulatory framework for privacy issues in the United States and internationally is constantly evolving and is likely to remain uncertain for the foreseeable future. The interpretation and application of such laws is often uncertain, and such laws may be interpreted and applied in a manner inconsistent with our current policies and practices or require changes to the features of our platform. If either we or our third party service providers are unable to address any privacy concerns, even if unfounded, or to comply with applicable laws and regulations, it could result in additional costs and liability, damage our reputation and harm our business.
Our ability to collect payment on loans and maintain accurate accounts may be adversely affected by computer viruses, physical or electronic break-ins, technical errors and similar disruptions.
The automated nature of our platform may make it an attractive target for hacking and potentially vulnerable to computer viruses, physical or electronic break-ins and similar disruptions. Despite efforts to ensure the integrity of our platform, it is possible that we may not be able to anticipate or to implement effective preventive measures against all security breaches of these types, in which case there would be an increased risk of fraud or identity theft, and we may experience losses on, or delays in the collection of amounts owed on, a fraudulently induced loan. In addition, the software that we have developed to use in our daily operations is highly complex and may contain undetected technical errors that could cause our computer systems to fail. Because each loan
33
Table of Contents
that we make involves our proprietary automated underwriting process, any failure of our computer systems involving our automated underwriting process and any technical or other errors contained in the software pertaining to our automated underwriting process could compromise our ability to accurately evaluate potential customers, which would negatively impact our results of operations. Furthermore, any failure of our computer systems could cause an interruption in operations and result in disruptions in, or reductions in the amount of, collections from the loans we make to our customers.
Additionally, if a hacker were able to access our secure files, he or she might be able to gain access to the personal information of our customers. While we have taken steps to prevent such activity from affecting our platform, if we are unable to prevent such activity, we may be subject to significant liability, negative publicity and a material loss of customers, all of which may negatively affect our business.
Our business depends on our ability to collect payment on and service the loans we make to our customers.
We rely on unaffiliated banks for the Automated Clearing House, or ACH, transaction process used to disburse the proceeds of newly originated loans to our customers and to automatically collect scheduled payments on the loans. As we are not a bank, we do not have the ability to directly access the ACH payment network, and must therefore rely on an FDIC-insured depository institution to process our transactions, including loan payments. Although we have built redundancy between these banks’ services, if we cannot continue to obtain such services from our current institutions or elsewhere, or if we cannot transition to another processor quickly, our ability to process payments will suffer. If we fail to adequately collect amounts owing in respect of the loans, as a result of the loss of direct debiting or otherwise, then payments to us may be delayed or reduced and our revenue and operating results will be harmed.
We rely on data centers to deliver our services. Any disruption of service at these data centers could interrupt or delay our ability to deliver our service to our customers.
We currently serve our customers from two third-party data center hosting facilities in Piscataway, New Jersey and Denver, Colorado. The continuous availability of our service depends on the operations of these facilities, on a variety of network service providers, on third-party vendors and on data center operations staff. In addition, we depend on the ability of our third-party facility providers to protect the facilities against damage or interruption from natural disasters, power or telecommunications failures, criminal acts and similar events. If there are any lapses of service or damage to the facilities, we could experience lengthy interruptions in our service as well as delays and additional expenses in arranging new facilities and services. Even with current and planned disaster recovery arrangements, our business could be harmed.
We designed our system infrastructure and procure and own or lease the computer hardware used for our services. Design and mechanical errors, failure to follow operations protocols and procedures could cause our systems to fail, resulting in interruptions in our platform. Any such interruptions or delays, whether as a result of third-party error, our own error, natural disasters or security breaches, whether accidental or willful, could harm our relationships with customers and cause our revenue to decrease and/or our expenses to increase. Also, in the event of damage or interruption, our insurance policies may not adequately compensate us for any losses that we may incur. These factors in turn could further reduce our revenue and subject us to liability, which could materially adversely affect our business.
Demand for our loans may decline if we do not continue to innovate or respond to evolving technological changes.
We operate in a nascent industry characterized by rapidly evolving technology and frequent product introductions. We rely on our proprietary technology to make our platform available to customers, determine the creditworthiness of loan applicants, and service the loans we make to customers. In addition, we may
34
Table of Contents
increasingly rely on technological innovation as we introduce new products, expand our current products into new markets, and continue to streamline the lending process. The process of developing new technologies and products is complex, and if we are unable to successfully innovate and continue to deliver a superior customer experience, customers’ demand for our loans may decrease and our growth and operations may be harmed.
It may be difficult and costly to protect our intellectual property rights, and we may not be able to ensure their protection.
Our ability to lend to our customers depends, in part, upon our proprietary technology, including our use of the OnDeck Score. We may be unable to protect our proprietary technology effectively which would allow competitors to duplicate our products and adversely affect our ability to compete with them. A third party may attempt to reverse engineer or otherwise obtain and use our proprietary technology without our consent. The pursuit of a claim against a third party for infringement of our intellectual property could be costly, and there can be no guarantee that any such efforts would be successful.
In addition, our platform may infringe upon claims of third-party intellectual property, and we may face intellectual property challenges from such other parties. We may not be successful in defending against any such challenges or in obtaining licenses to avoid or resolve any intellectual property disputes. The costs of defending any such claims or litigation could be significant and, if we are unsuccessful, could result in a requirement that we pay significant damages or licensing fees, which would negatively impact our financial performance. Furthermore, our technology may become obsolete, and there is no guarantee that we will be able to successfully develop, obtain or use new technologies to adapt our platform to compete with other lending platforms as they develop. If we cannot protect our proprietary technology from intellectual property challenges, or if the platform becomes obsolete, our ability to maintain our platform, make loans or perform our servicing obligations on the loans could be adversely affected.
Some aspects of our platform include open source software, and any failure to comply with the terms of one or more of these open source licenses could negatively affect our business.
We incorporate open source software into our proprietary platform and into other processes supporting our business. Such open source software may include software covered by licenses like the GNU General Public License and the Apache License. The terms of various open source licenses have not been interpreted by U.S. courts, and there is a risk that such licenses could be construed in a manner that limits our use of the software, inhibits certain aspects of the platform and negatively affects our business operations.
Some open source licenses contain requirements that we make available source code for modifications or derivative works we create based upon the type of open source software we use. If portions of our proprietary platform are determined to be subject to an open source license, or if the license terms for the open source software that we incorporate change, we could be required to publicly release the affected portions of our source code, re-engineer all or a portion of our platform or change our business activities. In addition to risks related to license requirements, the use of open source software can lead to greater risks than the use of third-party commercial software, as open source licensors generally do not provide warranties or controls on the origin of the software. Many of the risks associated with the use of open source software cannot be eliminated, and could adversely affect our business.
We may evaluate, and potentially consummate, acquisitions, which could require significant management attention, disrupt our business, and adversely affect our financial results.
Our success will depend, in part, on our ability to grow our business. In some circumstances, we may determine to do so through the acquisition of complementary businesses and technologies rather than through internal development. The identification of suitable acquisition candidates can be difficult, time-consuming, and
35
Table of Contents
costly, and we may not be able to successfully complete identified acquisitions. We also have never acquired a business before and therefore lack experience in integrating new technology and personnel. The risks we face in connection with acquisitions include:
| • | diversion of management time and focus from operating our business to addressing acquisition integration challenges; |
| • | coordination of technology, product development and sales and marketing functions; |
| • | transition of the acquired company’s customers to our platform; |
| • | retention of employees from the acquired company; |
| • | cultural challenges associated with integrating employees from the acquired company into our organization; |
| • | integration of the acquired company’s accounting, management information, human resources and other administrative systems; |
| • | the need to implement or improve controls, procedures and policies at a business that prior to the acquisition may have lacked effective controls, procedures and policies; |
| • | potential write-offs of loans or intangibles or other assets acquired in such transactions that may have an adverse effect our operating results in a given period; |
| • | liability for activities of the acquired company before the acquisition, including patent and trademark infringement claims, violations of laws, commercial disputes, tax liabilities and other known and unknown liabilities; and |
| • | litigation or other claims in connection with the acquired company, including claims from terminated employees, customers, former stockholders or other third parties. |
Our failure to address these risks or other problems encountered in connection with our future acquisitions and investments could cause us to fail to realize the anticipated benefits of these acquisitions or investments, cause us to incur unanticipated liabilities and harm our business generally. Future acquisitions could also result in dilutive issuances of our equity securities, the incurrence of debt, contingent liabilities, amortization expenses or the write-off of goodwill, any of which could harm our financial condition. Also, the anticipated benefits of any acquisitions may not materialize.
We may not be able to utilize a significant portion of our net operating loss carryforwards, which could harm our results of operations.
We had U.S. federal net operating loss carryforwards of approximately $32.2 million as of December 31, 2014. These net operating loss carryforwards will begin to expire at various dates beginning in 2027. As of December 31, 2014, we recorded a full valuation allowance of $26.1 million against our net deferred tax asset.
The Internal Revenue Code of 1986, as amended, or the Code, imposes substantial restrictions on the utilization of net operating losses and other tax attributes in the event of an “ownership change” of a corporation. Events which may cause limitation in the amount of the net operating losses and other tax attributes that are able to be utilized in any one year include, but are not limited to, a cumulative ownership change of more than 50% over a three-year period, which has occurred as a result of historical ownership changes. Accordingly, our ability to use pre-change net operating loss and certain other attributes are limited as prescribed under Sections 382 and 383 of the Code. Therefore, if we earn net taxable income in the future, our ability to reduce our federal income tax liability with our existing net operating losses is subject to limitation. Although we believe that our initial public offering did not result in another cumulative ownership change under Sections 382 and 383 of the Code, we do not believe that any resulting limitation will further limit our ability to ultimately utilize our net operating loss carryforwards and other tax attributes in a material way. Future offerings, as well as other future ownership
36
Table of Contents
changes that may be outside our control could potentially result in further limitations on our ability to utilize our net operating loss and tax attributes. Accordingly, achieving profitability may not result in a full release of the valuation allowance.
Our business is subject to the risks of earthquakes, fire, power outages, flood, and other catastrophic events, and to interruption by man-made problems such as terrorism.
Events beyond our control may damage our ability to accept our customers’ applications, underwrite loans, maintain our platform or perform our servicing obligations. In addition, these catastrophic events may negatively affect customers’ demand for our loans. Such events include, but are not limited to, fires, earthquakes, terrorist attacks, natural disasters, computer viruses and telecommunications failures. Despite any precautions we may take, system interruptions and delays could occur if there is a natural disaster, if a third-party provider closes a facility we use without adequate notice for financial or other reasons, or if there are other unanticipated problems at our leased facilities. As we rely heavily on our servers, computer and communications systems and the Internet to conduct our business and provide high-quality customer service, such disruptions could harm our ability to run our business and cause lengthy delays which could harm our business, results of operations and financial condition. We currently are not able to switch instantly to our backup center in the event of failure of the main server site. This means that an outage at one facility could result in our system being unavailable for a significant period of time. Our business interruption insurance may not be sufficient to compensate us for losses that may result from interruptions in our service as a result of system failures. A system outage or data loss could harm our business, financial condition and results of operations.
Risks Related to the Securities Markets and Ownership of Our Common Stock
The price of our common stock may be volatile and the value of your investment could decline.
Technology stocks have historically experienced high levels of volatility. The trading price of our common stock may fluctuate substantially. The market price of our common stock may be higher or lower than the price you pay, depending on many factors, some of which are beyond our control and may not be related to our operating performance. These fluctuations could cause you to lose all or part of your investment in our common stock. Factors that could cause fluctuations in the trading price of our common stock include the following:
| • | announcements of new products, services or technologies, relationships with strategic partners, acquisitions or other events by us or our competitors; |
| • | changes in economic conditions; |
| • | changes in prevailing interest rates; |
| • | price and volume fluctuations in the overall stock market from time to time; |
| • | significant volatility in the market price and trading volume of technology companies in general and of companies in our industry; |
| • | fluctuations in the trading volume of our shares or the size of our public float; |
| • | the impact of securities analysts’ reports or other publicity regarding our business or industry; |
| • | actual or anticipated changes in our operating results or fluctuations in our operating results; |
| • | quarterly fluctuations in demand for our loans; |
| • | whether our operating results meet the expectations of securities analysts or investors; |
| • | actual or anticipated changes in the expectations of investors or securities analysts; |
| • | regulatory developments in the United States, foreign countries or both; |
| • | major catastrophic events; |
| • | sales of large blocks of our stock; or |
| • | departures of key personnel. |
37
Table of Contents
In addition, if the market for technology stocks or the stock market in general experiences loss of investor confidence, the trading price of our common stock could decline for reasons unrelated to our business, operating results or financial condition. The trading price of our common stock might also decline in reaction to events that affect other companies in our industry even if these events do not directly affect us. In the past, following periods of volatility in the market price of a company’s securities, securities class action litigation has often been brought against that company. If our stock price is volatile, we may become the target of securities litigation. Securities litigation could result in substantial costs and divert our management’s attention and resources from our business. This could have a material adverse effect on our business, operating results and financial condition.
Sales of substantial amounts of our common stock in the public markets, or the perception that they might occur, could reduce the price that our common stock might otherwise attain and may dilute your voting power and your ownership interest in us.
Sales of a substantial number of shares of our common stock in the public market, or the perception that these sales could occur, could adversely affect the market price of our common stock and may make it more difficult for you to sell your common stock at a time and price that you deem appropriate. At December 31, 2014, we had 69,120,137 shares of common stock outstanding of which 11,500,000 shares were freely tradable.
In connection with our initial public offering, we and all of our directors and officers and substantially all of our equity holders agreed not to offer, sell or agree to sell, directly or indirectly, any shares of common stock without the permission of Morgan Stanley & Co. LLC and Merrill Lynch, Pierce, Fenner & Smith Incorporated until June 15, 2015. When this lock-up period expires, we and our locked-up security holders will be able to sell our shares in the public market. In addition, the underwriters may, in their sole discretion, release all or some portion of the shares subject to lock-up agreements prior to the expiration of the lock-up period. Sales of a substantial number of such shares upon expiration of the lock-up, or the perception that such sales may occur, or early release of the lock-up, could cause our share price to fall or make it more difficult for us and our stockholders to sell our common stock.
At December 31, 2014, an aggregate of 56,832,941 shares of our common stock (including shares issuable pursuant to the exercise of warrants to purchase common stock), or their permitted transferees, will have rights, subject to some conditions, to require us to file registration statements covering the sale of their shares or to include their shares in registration statements that we may file for ourselves or other stockholders. We have also registered the offer and sale of all shares of common stock that we may issue under our 2014 Equity Incentive Plan and 2014 Employee Stock Purchase Plan.
We may issue our shares of common stock or securities convertible into our common stock from time to time in connection with a financing, acquisition, investments or otherwise. Any such issuance could result in substantial dilution to our existing stockholders and cause the trading price of our common stock to decline.
Insiders and large stockholders have or could have substantial control over us, which could limit your ability to influence the outcome of key transactions, including a change of control.
Our directors, executive officers and each of our stockholders who own greater than 5% of our outstanding common stock and their affiliates, in the aggregate, beneficially own approximately 62.5% of the outstanding shares of our common stock, based on the number of shares outstanding as of December 31, 2014. As a result, these stockholders, if acting together, will be able to influence or control matters requiring approval by our stockholders, including the election of directors and the approval of mergers, acquisitions or other extraordinary transactions. They may also have interests that differ from yours and may vote in a way with which you disagree and which may be adverse to your interests. This concentration of ownership may have the effect of delaying, preventing or deterring a change of control of our company, could deprive our stockholders of an opportunity to receive a premium for their common stock as part of a sale of our company and might ultimately affect the market price of our common stock.
38
Table of Contents
We do not intend to pay dividends for the foreseeable future.
We have never declared or paid any dividends on our common stock. We intend to retain any earnings to finance the operation and expansion of our business, and we do not anticipate paying any cash dividends in the future. As a result, you may only receive a return on your investment in our common stock if the market price of our common stock increases.
The requirements of being a public company may strain our resources, divert management’s attention and affect our ability to attract and retain qualified board members.
As a public company, we are subject to the reporting requirements of the Securities Exchange Act of 1934, as amended, or the Exchange Act, the listing standards of the New York Stock Exchange and other applicable securities rules and regulations. Compliance with these rules and regulations will increase our legal and financial compliance costs, make some activities more difficult, time-consuming or costly, and increase demand on our systems and resources, particularly after we are no longer an “emerging growth company” as defined in the JOBS Act. Among other things, the Exchange Act requires that we file annual, quarterly and current reports with respect to our business and operating results and maintain effective disclosure controls and procedures and internal control over financial reporting. In order to maintain and, if required, improve our disclosure controls and procedures and internal control over financial reporting to meet this standard, significant resources and management oversight may be required. As a result, management’s attention may be diverted from other business concerns, which could harm our business and operating results. Although we have already hired additional employees to comply with these requirements, we may need to hire even more employees in the future, which will increase our costs and expenses.
In addition, changing laws, regulations and standards relating to corporate governance and public disclosure are creating uncertainty for public companies, increasing legal and financial compliance costs and making some activities more time consuming. These laws, regulations and standards are subject to varying interpretations, in many cases due to their lack of specificity, and, as a result, their application in practice may evolve over time as new guidance is provided by regulatory and governing bodies. This could result in continuing uncertainty regarding compliance matters and higher costs necessitated by ongoing revisions to disclosure and governance practices. We intend to invest resources to comply with evolving laws, regulations and standards, and this investment may result in increased general and administrative expense and a diversion of management’s time and attention from revenue-generating activities to compliance activities. If our efforts to comply with new laws, regulations and standards differ from the activities intended by regulatory or governing bodies, regulatory authorities may initiate legal proceedings against us and our business may be harmed.
However, for so long as we remain an “emerging growth company” as defined in the JOBS Act, we may take advantage of certain exemptions from various requirements that are applicable to public companies that are not “emerging growth companies,” including not being required to comply with the independent auditor attestation requirements of Section 404 of the Sarbanes-Oxley Act, reduced disclosure obligations regarding executive compensation in our periodic reports and proxy statements, and exemptions from the requirements of holding a nonbinding advisory vote on executive compensation and stockholder approval of any golden parachute payments not previously approved. We may take advantage of these exemptions until we are no longer an “emerging growth company.”
We would cease to be an “emerging growth company” upon the earliest of: (i) the first fiscal year following the fifth anniversary of our initial public offering, (ii) the first fiscal year after our annual gross revenues are $1 billion or more, (iii) the date on which we have, during the previous three-year period, issued more than $1 billion in non-convertible debt securities, or (iv) as of the end of any fiscal year in which the market value of our common stock held by non-affiliates exceeded $700 million as of the end of the second quarter of that fiscal year.
We also expect that these new rules and regulations will make it more expensive for us as a public company to obtain director and officer liability insurance, and we may be required to accept reduced coverage or incur
39
Table of Contents
substantially higher costs to obtain coverage. These factors could also make it more difficult for us to attract and retain qualified members of our board of directors, particularly to serve on our Audit Committee, Compensation Committee, Risk Management Committee and as qualified executive officers.
We are an “emerging growth company,” and we cannot be certain if the reduced disclosure requirements applicable to emerging growth companies will make our common stock less attractive to investors.
We are an “emerging growth company,” as defined in the JOBS Act, and are taking advantage of certain exemptions from various reporting requirements that are applicable to public companies that are not “emerging growth companies,” including, but not limited to, not being required to comply with the auditor attestation requirements of Section 404 of the Sarbanes-Oxley Act, reduced disclosure obligations regarding executive compensation in our periodic reports and proxy statements and exemptions from the requirements of holding a nonbinding advisory vote on executive compensation and shareholder approval of any golden parachute payments not previously approved. We cannot predict if investors will find our common stock less attractive because we may rely on these exemptions. If some investors find our common stock less attractive as a result, there may be a less active trading market for our common stock, and our stock price may be more volatile and may decline.
If securities or industry analysts do not publish or cease publishing research or reports about our business, or publish inaccurate or unfavorable research reports about our business, our share price and trading volume could decline.
The trading market for our common stock depends, to some extent, on the research and reports that securities or industry analysts publish about us or our business. We do not have any control over these analysts. If one or more of the analysts who cover us should downgrade our shares, change their opinion of our shares or provide more favorable relative recommendations about our competitors, our share price would likely decline. If one or more of these analysts should cease coverage of our company or fail to regularly publish reports on us, we could lose visibility in the financial markets, which could cause our share price or trading volume to decline.
Our charter documents and Delaware law could discourage takeover attempts and lead to management entrenchment.
Our amended and restated certificate of incorporation and amended and restated bylaws contain provisions that could delay or prevent a change in control of our company. These provisions could also make it difficult for stockholders to elect directors that are not nominated by the current members of our board of directors or take other corporate actions, including effecting changes in our management. These provisions include:
| • | a classified board of directors with three-year staggered terms, which could delay the ability of stockholders to change the membership of a majority of our board of directors; |
| • | the ability of our board of directors to issue shares of preferred stock and to determine the price and other terms of those shares, including preferences and voting rights, without stockholder approval, which could be used to significantly dilute the ownership of a hostile acquiror; |
| • | the exclusive right of our board of directors to elect a director to fill a vacancy created by the expansion of our board of directors or the resignation, death or removal of a director, which prevents stockholders from being able to fill vacancies on our board of directors; |
| • | a prohibition on stockholder action by written consent, which forces stockholder action to be taken at an annual or special meeting of our stockholders; |
| • | the requirement that a special meeting of stockholders may be called only by the chairman of our board of directors, our president, our secretary or a majority vote of our board of directors, which could delay the ability of our stockholders to force consideration of a proposal or to take action, including the removal of directors; |
40
Table of Contents
| • | the requirement for the affirmative vote of holders of at least 66 2/3% of the voting power of all of the then outstanding shares of the voting stock, voting together as a single class, to amend the provisions of our amended and restated certificate of incorporation relating to the issuance of preferred stock and management of our business or our amended and restated bylaws, which may inhibit the ability of an acquiror to effect such amendments to facilitate an unsolicited takeover attempt; |
| • | the ability of our board of directors, by majority vote, to amend the bylaws, which may allow our board of directors to take additional actions to prevent an unsolicited takeover and inhibit the ability of an acquiror to amend the bylaws to facilitate an unsolicited takeover attempt; and |
| • | advance notice procedures with which stockholders must comply to nominate candidates to our board of directors or to propose matters to be acted upon at a stockholders’ meeting, which may discourage or deter a potential acquiror from conducting a solicitation of proxies to elect the acquiror’s own slate of directors or otherwise attempting to obtain control of us. |
In addition, as a Delaware corporation, we are subject to Section 203 of the Delaware General Corporation Law. These provisions may prohibit large stockholders, in particular those owning 15% or more of our outstanding voting stock, from merging or combining with us for a certain period of time.
| Item 1B. | Unresolved Staff Comments |
None.
| Item 2. | Properties |
Our principal locations, their purposes and the expiration dates for the leases on facilities at those locations as of December 31, 2014 are shown in the table below.
| Location |
Purpose |
Approximate Square Feet |
Lease Expiration Date | |||
| New York, NY | Corporate Headquarters, technology and direct sales | 38,000 | 2023 | |||
| Denver, CO | Direct sales | 13,000 | 2019 | |||
| Arlington, VA | Direct sales and customer support | 11,000 | 2018 |
To support planned future growth, we are currently in the process of expanding the amount of square footage we occupy in all three office facilities. We lease all of our facilities. We do not own any real property. We believe our facilities are suitable and adequate for our current and near-term needs, and that we will be able to locate additional facilities as needed. Subsequent to year end, we entered into leases for additional space as further described in Note 17 of Notes to Consolidated Financial Statements elsewhere in this report.
| Item 3. | Legal Proceedings |
From time to time we are subject to legal proceedings and claims in the ordinary course of business. The results of such matters cannot be predicted with certainty; however in the opinion of management, no material legal proceedings are pending to which we, our subsidiaries, or any of our properties are subject.
| Item 4. | Mine Safety Disclosures |
None.
41
Table of Contents
| Item 5. | Market for Registrant’s Common Equity, Related Stockholder Matters and Issuer Purchases of Equity Securities |
Market Information
Our common stock began trading on the New York Stock Exchange, or the NYSE, under the symbol “ONDK” on December 17, 2014 in connection with our initial public offering of our common stock. Prior to that date, there was no public market for our common stock. The following table sets forth the high and low intradary sale prices of our common stock on the NYSE from the commencement of trading through the end of 2014:
| Sale Prices | ||||||||
| High | Low | |||||||
| 2014 |
||||||||
| Fourth Quarter (beginning December 17, 2014) |
$ | 28.98 | $ | 21.40 | ||||
Holders of Record
As of February 28, 2015, there were approximately 280 holders of record of our common stock. This record holder figure does not include, and we are not able to estimate, the number of holders whose shares are held of record by banks, brokers and other financial institutions.
Dividends
We have never declared or paid cash dividends on our common stock. We currently intend to retain all available funds and any future earnings for use in the operation of our business and do not anticipate paying any dividends on our common stock in the foreseeable future. Any future determination to declare dividends will be made at the discretion of our board of directors and will depend on our financial condition, operating results, capital requirements, general business conditions, contractual restrictions and other factors that our board of directors may deem relevant.
Issuer Purchases of Equity Securities
During the quarter and year ended December 31, 2014, we did not purchase any of our equity securities that are registered under Section 12(b) of the Exchange Act.
Use of Proceeds from Sales of Registered Securities
The Registration Statement on Form S-1 (Registration No. 333-200043) for the initial public offering of our common stock was declared effective by the SEC on December 16, 2014. The registration statement registered 11,500,000 shares of our common stock, including 1,500,000 shares issuable to the underwriters of our initial public offering pursuant to an over-allotment option. All of the shares were offered and sold for our account. On December 22, 2014, we closed our initial public offering and sold 11,500,000 shares of our common stock at a public offering price of $20.00 per share for an aggregate offering price of $230 million. Upon the closing of the sale on that date, our initial public offering terminated.
The underwriters of our initial public offering were led by Morgan Stanley & Co. LLC, Merrill Lynch, Pierce, Fenner & Smith Incorporated, J.P. Morgan Securities LLC, Deutsche Bank Securities Inc. and Jefferies LLC.
We paid the underwriters of our initial public offering an underwriting discount totaling $16.1 million. In addition, we incurred expenses of $3.9 million which, when added to the underwriting discount, amount to total expenses of approximately $20.0 million. Thus, the net offering proceeds, after deducting underwriting discounts
42
Table of Contents
and offering expenses, were approximately $210.0 million. No payments were made to our directors or officers or their associates, holders of 10% or more of any class of our equity securities or any affiliates in connection with the offering.
There has been no material change in the planned use of proceeds from our initial public offering as described in our final prospectus filed with the SEC on December 17, 2014 under to Rule 424(b)(4). Pending the application of the net proceeds as described in our final prospectus, from December 22, 2014 (the closing date of our initial public offering) through December 31, 2014 (the end of the period covered by this report), the net proceeds were maintained in deposit accounts or short term, investment-grade interest-bearing securities such as money market accounts, certificates of deposit, commercial paper and guaranteed obligations of the U.S. government.
Performance Graph
The following graph compares the cumulative total stockholder return since December 17, 2014, the date our common stock began trading on the NYSE, with the S&P 500 Index and the NASDAQ Internet Index through December 31, 2014. The graph assumes that the value of the investment in our common stock and each index was $100 at market close on December 17, 2014 and that any dividends and other distributions paid during the period covered by the graph were reinvested. The returns shown are historical and are not intended to suggest future performance.
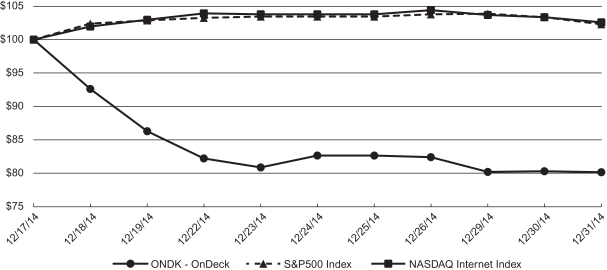
Sales of Unregistered Equity Securities
During the year ended December 31, 2014, we sold the following equity securities that were not registered under the Securities Act of 1933, or the Securities Act.
Preferred Stock Conversion upon IPO
In December 2014, upon the closing of our initial public offering, in each case pursuant to their terms and without payment of additional consideration, 5,234,546 shares of our Series E preferred stock converted to 5,234,546 shares of our common stock, 14,467,756 shares of our Series D preferred stock converted to 14,467,756 shares of our common stock, 2,311,440 shares of our Series C-1 preferred stock converted to 2,311,440 shares of our common stock, 9,735,538 shares of our Series C preferred stock converted to 9,735,538 shares of our common stock, 11,263,702 shares of our Series B preferred stock converted to 11,263,702 shares of
43
Table of Contents
our common stock and 4,438,662 shares of our Series A preferred stock converted to 4,438,662 shares of our common stock.
Preferred Stock Warrant Conversion upon IPO
In December 2014, upon the closing of our initial public offering, in each case pursuant to their terms and without payment of additional consideration, 275,000 of our Series C-1 preferred warrants converted to 275,000 of our common stock warrants and 30,000 of our Series E preferred warrants converted to 30,000 of our common stock warrants.
Warrant Issuances and Exercises
In March 2014 and June 2014, we issued warrants to purchase a total of 30,000 shares of our Series E preferred stock to two accredited investors at an exercise price of $14.71 per share.
In August, September, October and November 2014, we issued a total of 3,804,274 shares of our common stock to 22 accredited investors upon the exercise of outstanding warrants based on a weighted average cash exercise price of $0.38 per share for an aggregate purchase price of $1,432,874.
In August and September 2014, we issued a total of 508,440 shares of our Series B preferred stock to six accredited investors upon the exercise of outstanding warrants based on a weighted average exercise price of $1.48 per share for an aggregate purchase price of $749,999.
In July, August and September 2014, we issued 610,328 shares of our Series C-1 preferred stock to seven accredited investors upon the exercise of outstanding warrants based on an exercise price of $2.76 per share for an aggregate purchase price of $1,686,275.
In December 2014, we issued an aggregate of 254,281 shares of our common stock to two investors upon the cash exercise of one warrant and the net exercise of another warrant based on a weighted average exercise price of $3.23 per share for an aggregate purchase price of $822,023.97.
Preferred Stock Issuances
On February 27, 2014, we sold 5,234,546 shares of our Series E preferred stock to 14 accredited investors at a purchase price of $14.71 per share for aggregate gross proceeds of approximately $77.0 million.
Amended and Restated 2007 Stock Incentive Plan-Related Issuances
In 2014, we granted options to purchase an aggregate of 4,436,566 shares of our common stock under our Amended and Restated 2007 Stock Incentive Plan with exercise prices ranging from $0.68 to $17.00 per share.
In 2014, we issued an aggregate of 1,543,338 shares of our common stock upon the exercise of options granted under our Amended and Restated 2007 Stock Incentive Plan at exercise prices ranging from $0.27 to $3.71 per share, for aggregate consideration of $608,484.34.
The sales of the above securities were exempt from registration under the Securities Act in reliance upon one or more of Sections 4(a)(2) or 3(a)(9) of the Securities Act, and Regulation D, Regulation S or Rule 701 under the Securities Act as transactions by an issuer in a private offering to certain types of investors, in exempt exchange transactions, in an offshore transaction, or pursuant to benefit plans and contracts relating to compensation, in each case as provided in the applicable statutes, rules and regulations.
44
Table of Contents
| Item 6. | Selected Consolidated Financial Data |
The following selected consolidated historical financial data are derived from our audited financial statements. The consolidated balance sheet data as of December 31, 2014 and 2013 and the consolidated statement of operations data for the years ended December 31, 2014, 2013 and 2012 are derived from our audited consolidated financial statements and related notes that are included elsewhere in this Form 10-K. The consolidated balance sheet data as of December 31, 2012 are derived from our audited consolidated financial statements and related notes which are not included in this report. The information set forth below should be read in conjunction with our historical financial statements, including the notes thereto, and “Management’s Discussion and Analysis of Financial Condition and Results of Operations,” included elsewhere in this report.
(in thousands, except share and per share data)
| Year Ended December 31, | ||||||||||||
| 2014 | 2013 | 2012 | ||||||||||
| Consolidated Statements of Operations |
||||||||||||
| Revenue: |
||||||||||||
| Interest income |
$ | 145,275 | $ | 62,941 | $ | 25,273 | ||||||
| Gross revenue |
158,064 | 65,249 | 25,643 | |||||||||
| Total cost of revenue |
84,632 | 39,989 | 20,763 | |||||||||
| Net revenue |
73,432 | 25,260 | 4,880 | |||||||||
|
|
|
|
|
|
|
|||||||
| Net loss |
(18,708 | ) | (24,356 | ) | (16,844 | ) | ||||||
| Net loss attributable to common stockholders |
$ | (31,592 | ) | $ | (37,080 | ) | $ | (20,284 | ) | |||
|
|
|
|
|
|
|
|||||||
| Net loss per common share: |
||||||||||||
| Basic and diluted |
$ | (0.60 | ) | $ | (8.64 | ) | $ | (4.27 | ) | |||
|
|
|
|
|
|
|
|||||||
| Weighted-average common shares outstanding: |
||||||||||||
| Basic and diluted |
52,556,998 | 4,292,026 | 4,750,440 | |||||||||
|
|
|
|
|
|
|
|||||||
| Balance sheet data: |
||||||||||||
| Cash and cash equivalents |
$ | 220,433 | $ | 4,670 | $ | 7,386 | ||||||
| Loans |
504,107 | 222,521 | 90,975 | |||||||||
| Total assets |
729,632 | 235,450 | 106,510 | |||||||||
| Funding debt |
387,928 | 188,297 | 96,297 | |||||||||
| Total liabilities |
419,027 | 216,587 | 110,443 | |||||||||
| Redeemable convertible preferred stock |
— | 118,343 | 53,226 | |||||||||
| Stockholders’ equity (deficit) |
$ | 310,605 | $ | (99,480 | ) | $ | (57,159 | ) | ||||
| Item 7. | Management’s Discussion and Analysis of Financial Condition and Results of Operations |
You should read the following discussion and analysis of our financial condition and results of operations together with our consolidated financial statements and the related notes and other financial information included elsewhere in this report. Some of the information contained in this discussion and analysis, including information with respect to our plans and strategy for our business, includes forward-looking statements that involve risks and uncertainties. You should review the “Cautionary Note Regarding Forward-Looking Statements” and Item 1A. Risk Factors sections of this report for a discussion of important factors that could cause actual results to differ materially from the results described in or implied by the forward-looking statements contained in the following discussion and analysis.
Overview
We are a leading online platform for small business lending. We are seeking to transform small business lending by making it efficient and convenient for small businesses to access capital. Enabled by our proprietary
45
Table of Contents
technology and analytics, we aggregate and analyze thousands of data points from dynamic, disparate data sources to assess the creditworthiness of small businesses rapidly and accurately. Small businesses can apply for a term loan or line of credit on our website in minutes and, using our proprietary OnDeck Score, we can make a funding decision immediately and transfer funds as fast as the same day. We have originated more than $2 billion in loans and collected more than 5.3 million customer payments since we made our first loan in 2007. Our loan originations have increased at a compound annual growth rate of 159% from 2012 to 2014 and had a year-over-year growth rate of 152% for the year ended December 31, 2014.
We generate the majority of our revenue through interest income and fees earned on the term loans we retain. Our term loans are obligations of small businesses with fixed dollar repayments, in principal amounts ranging from $5,000 to $250,000 and with maturities of 3 to 24 months. In September 2013, we expanded our product offerings by launching a line of credit product with line sizes currently ranging from $10,000 to $25,000, repayable within six months of the date of the latest funds draw. We earn interest on the balance outstanding and charge a monthly fee as long as the line of credit is available. In October 2013, we also began generating revenue by selling some of our term loans to third-party institutional investors through our OnDeck Marketplace. The balance of our revenue comes from our servicing and other fee income, which primarily consists of fees we receive for servicing loans we have sold to third-party institutional investors and marketing fees from issuing bank partners. In 2014, 2013 and 2012, loans originated via issuing bank partners constituted 15.9%, 16.1% and 21.1% of our total loan originations, respectively.
We rely on a diversified set of funding sources for the capital we lend to our customers. Our primary source of this capital has historically been debt facilities with various financial institutions. As of December 31, 2014, we had $212.9 million outstanding and $312.6 million total borrowing capacity under such debt facilities. We have sold approximately $156.6 million in loans to OnDeck Marketplace investors from October 2013 through December 31, 2014. In addition, we completed our first securitization transaction in May 2014, pursuant to which we issued debt that is secured by a revolving pool of OnDeck small business loans. We raised approximately $175.0 million from this securitization transaction. We have also used proceeds from our stock financings and operating cash flow to fund loans in the past and continue to finance a portion of our outstanding loans with these funds. Of the total principal outstanding under our term loan and line of credit products that are funded through external sources, sold to OnDeck Marketplace investors or held for sale to OnDeck Marketplace investors as of December 31, 2014, 37% were financed via proceeds raised from our securitization transaction, 48% were funded via our debt facilities and 16% were funded via OnDeck Marketplace investors.
We originate loans through direct marketing, including direct mail, social media, and other online marketing channels. We also originate loans through referrals from our strategic partners, including banks, payment processors and small business-focused service providers, and through funding advisors who advise small businesses on available funding options.
We grew rapidly over the three years ended December 31, 2014. We generated gross revenue of $25.6 million, $65.2 million and $158.1 million for the years ended December 31, 2012, 2013 and 2014, respectively. To date, substantially all of our revenue has been generated in the United States, although we have recently begun offering our products in Canada.
Our Adjusted EBITDA, a non-GAAP measure which is described in further detail in the section below titled “—Key Financial and Operating Metrics,” improved to a loss of $0.2 million for the year ended December 31, 2014 from losses of $16.3 million and $14.8 million for the years ended December 31, 2013 and 2012, respectively. We incurred net losses of $18.7 million, $24.4 million and $16.8 million for the years ended December 31, 2014, 2013 and 2012, respectively.
Initial Public Offering
On December 22, 2014, we completed our initial public offering. We issued and sold 11,500,000 shares of our common stock at a public offering price of $20.00 per share, including 1,500,000 shares sold in connection
46
Table of Contents
with the exercise in full of the over-allotment option we granted to the underwriters. We received net offering proceeds of $210.0 million, after deducting underwriting discounts and commissions and offering expenses.
Key Financial and Operating Metrics
We regularly monitor a number of metrics in order to measure our current performance and project our future performance. These metrics aid us in developing and refining our growth strategies and making strategic decisions.
| As of or for the Year Ended December 31, |
||||||||||||
| 2014 | 2013 | 2012 | ||||||||||
| (dollars in thousands) | ||||||||||||
| Originations |
$ | 1,157,751 | $ | 458,917 | $ | 173,246 | ||||||
| Unpaid Principal Balance |
$ | 490,563 | $ | 215,966 | $ | 90,276 | ||||||
| Average Loans |
$ | 359,652 | $ | 147,398 | $ | 61,352 | ||||||
| Loans Under Management |
$ | 571,759 | $ | 233,324 | $ | 90,276 | ||||||
| Effective Interest Yield |
40.4% | 42.7% | 41.2% | |||||||||
| Average Funding Debt Outstanding |
$ | 279,307 | $ | 124,238 | $ | 62,043 | ||||||
| Cost of Funds Rate |
6.2% | 10.8% | 13.4% | |||||||||
| Provision Rate |
6.6% | 6.0% | 7.2% | |||||||||
| Reserve Ratio |
10.2% | 9.0% | 10.3% | |||||||||
| 15+ Day Delinquency Ratio |
7.3% | 7.6% | 8.9% | |||||||||
| Adjusted EBITDA |
$ | (165 | ) | $ | (16,258 | ) | $ | (14,834 | ) | |||
| Adjusted Net Loss |
$ | (4,634 | ) | $ | (20,179 | ) | $ | (16,467 | ) | |||
Originations
Originations represent the total principal amount of the term loans we made during the period, plus the total amount drawn on lines of credit during the period. Many of our repeat customers renew their loans before their existing loan is fully repaid. In accordance with industry practice, originations of such repeat loans are calculated as the full renewal loan principal, rather than the net funded amount, which is the renewal loan’s principal net of the unpaid principal balance on the existing loan. Loans referred to, and funded by, our issuing bank partners and later purchased by us are included as part of our originations. We have originated approximately 51,500 loans since our inception, and for the years ended December 31, 2014 and 2013, we originated 26,921 and 13,059 loans, respectively. For the years ended December 31, 2014 and 2013, originations from repeat customers as a percentage of total originations during the period was 50.1% and 43.5%, respectively.
The number of weekends and holidays in a period can impact our business. Many small businesses tend to apply for loans on weekdays, and their businesses may be closed at least part of a weekend and on holidays. In addition, our loan fundings and automated customer loan repayments only occur on weekdays (other than bank holidays).
Unpaid Principal Balance
Unpaid Principal Balance represents the total amount of principal outstanding for term loans held for investment and amounts outstanding under lines of credit at the end of the period. It excludes net deferred origination costs, allowance for loan losses and any loans sold or held for sale at the end of the period.
Average Loans
Average Loans for the period is the simple average of Total Loans outstanding as of the beginning of the period and as of the end of each quarter in the period. Total Loans represents the Unpaid Principal Balance, plus net deferred origination fees and costs.
47
Table of Contents
Loans Under Management
Loans Under Management represents the Unpaid Principal Balance plus the amount of principal outstanding for loans held for sale, excluding net deferred origination costs, and the amount of principal outstanding of term loans we serviced for others at the end of the period.
Effective Interest Yield
Effective Interest Yield is the rate of return we achieve on loans outstanding during a period, which is our annualized interest income divided by Average Loans.
Net deferred origination costs in Total Loans consist of deferred origination fees and costs. Deferred origination fees include fees paid up front to us by customers when loans are funded and decrease the carrying value of loans, thereby increasing the Effective Interest Yield earned. Deferred origination costs are limited to costs directly attributable to originating loans such as commissions, vendor costs and personnel costs directly related to the time spent by the personnel performing activities related to loan origination and increase the carrying value of loans, thereby decreasing the Effective Interest Yield earned.
Average Funding Debt Outstanding
Funding debt outstanding is the debt that we incur to support our lending activities and does not include our corporate operating debt. Average Funding Debt Outstanding for the period is the simple average of the funding debt outstanding as of the beginning of the period and as of the end of each quarter in the period.
Cost of Funds Rate
Cost of Funds Rate is our funding cost, which is the interest expense, fees, and amortization of deferred issuance costs we incur in connection with our lending activities across all of our debt facilities, divided by the Average Funding Debt Outstanding, then annualized.
Provision Rate
Provision Rate equals the provision for loan losses divided by the new originations volume of loans held for investment in a period. Because we reserve for probable credit losses inherent in the portfolio upon origination, this rate is significantly impacted by the period’s originations volume. This rate may also be impacted by changes in loss expectations for loans originated prior to the commencement of the period.
Reserve Ratio
Reserve Ratio is our allowance for loan losses as of the end of the period divided by the Unpaid Principal Balance as of the end of the period.
15+ Day Delinquency Ratio
15+ Day Delinquency Ratio equals the aggregate Unpaid Principal Balance for our loans that are 15 or more calendar days past due as of the end of the period as a percentage of the Unpaid Principal Balance for such period. The Unpaid Principal Balance for our loans that are 15 or more calendar days past due includes loans that are paying and non-paying. The majority of our loans require daily repayments, excluding weekends and holidays, and therefore may be deemed delinquent more quickly than loans from traditional lenders that require only monthly payments.
15+ Day Delinquency Ratio is not annualized, but reflects balances as of the end of the period.
48
Table of Contents
Non-GAAP Financial Measures
We believe that the provision of non-GAAP metrics in this report can provide a useful measure for period-to-period comparisons of our core business and useful information to investors and others in understanding and evaluating our operating results. However, non-GAAP metrics are not a measure calculated in accordance with United States generally accepted accounting principles, or GAAP, and should not be considered an alternative to any measures of financial performance calculated and presented in accordance with GAAP. Other companies may calculate these non-GAAP metrics differently than we do.
Adjusted EBITDA
Adjusted EBITDA represents our net (loss) income, adjusted to exclude interest expense associated with debt used for corporate purposes (rather than funding costs associated with lending activities), income tax expense, depreciation and amortization, stock-based compensation expense and warrant liability fair value adjustment. Stock based compensation includes employee compensation as well as compensation to third party service providers.
EBITDA is impacted by changes from period to period in the liability related to both common and preferred stock warrants which require fair value accounting. Management believes that adjusting EBITDA to eliminate the impact of the changes in fair value of these warrants is useful to analyze the operating performance of the business, unaffected by changes in the fair value of stock warrants which are not relevant to the ongoing operations of the business. All such preferred stock warrants converted to common stock warrants upon our initial public offering in December 2014.
Our use of Adjusted EBITDA has limitations as an analytical tool, and you should not consider it in isolation or as a substitute for analysis of our results as reported under GAAP. Some of these limitations are:
| • | although depreciation and amortization are non-cash charges, the assets being depreciated and amortized may have to be replaced in the future, and Adjusted EBITDA does not reflect cash capital expenditure requirements for such replacements or for new capital expenditure requirements; |
| • | Adjusted EBITDA does not reflect changes in, or cash requirements for, our working capital needs; |
| • | Adjusted EBITDA does not reflect the potentially dilutive impact of equity-based compensation; |
| • | Adjusted EBITDA does not reflect interest associated with debt used for corporate purposes or tax payments that may represent a reduction in cash available to us; |
| • | Adjusted EBITDA does not reflect the potential costs we would incur if certain of our warrants were settled in cash. |
The following table presents a reconciliation of net loss to Adjusted EBITDA for each of the periods indicated:
| Year Ended December 31, | ||||||||||||
| 2014 | 2013 | 2012 | ||||||||||
| (in thousands) | ||||||||||||
| Adjusted EBITDA |
||||||||||||
| Net loss |
$ | (18,708 | ) | $ | (24,356 | ) | $ | (16,844 | ) | |||
| Adjustments: |
||||||||||||
| Corporate interest expense |
398 | 1,276 | 88 | |||||||||
| Income tax expense |
— | — | — | |||||||||
| Depreciation and amortization |
4,071 | 2,645 | 1,545 | |||||||||
| Stock-based compensation expense |
2,842 | 438 | 229 | |||||||||
| Warrant liability fair value adjustment |
11,232 | 3,739 | 148 | |||||||||
|
|
|
|
|
|
|
|||||||
| Adjusted EBITDA |
$ | (165 | ) | $ | (16,258 | ) | $ | (14,834 | ) | |||
|
|
|
|
|
|
|
|||||||
49
Table of Contents
Adjusted Net (Loss) Income
Adjusted Net (Loss) Income represents our net loss adjusted to exclude stock-based compensation expense and warrant liability fair value adjustment, each on the same basis and with the same limitations as described above for Adjusted EBITDA.
The following table presents a reconciliation of net loss to Adjusted Net (Loss) Income for each of the periods indicated:
| Year Ended December 31, | ||||||||||||
| 2014 | 2013 | 2012 | ||||||||||
| (in thousands) | ||||||||||||
| Adjusted Net (Loss) Income |
||||||||||||
| Net loss |
$ | (18,708 | ) | $ | (24,356 | ) | $ | (16,844 | ) | |||
| Adjustments: |
||||||||||||
| Stock-based compensation expense |
2,842 | 438 | 229 | |||||||||
| Warrant liability fair value adjustment |
11,232 | 3,739 | 148 | |||||||||
|
|
|
|
|
|
|
|||||||
| Adjusted Net (Loss) Income |
$ | (4,634 | ) | $ | (20,179 | ) | $ | (16,467 | ) | |||
|
|
|
|
|
|
|
|||||||
Key Factors Affecting Our Performance
Investment in Long-Term Growth
The core elements of our growth strategy include acquiring new customers, broadening our distribution capabilities through strategic partners, enhancing our data and analytics capabilities, expanding our product offerings, extending customer lifetime value and expanding internationally. We plan to continue to invest significant resources to accomplish these goals, and we anticipate that our operating expense will continue to increase for the foreseeable future, particularly our sales and marketing and technology and analytics expenses. These investments are intended to contribute to our long-term growth, but they may affect our near-term profitability.
Originations
Our revenues continued to grow during the year ended December 31, 2014, primarily as a result of growth in originations. Growth in originations has been driven by the addition of new customers, increasing business from existing and previous customers, and increasing average loan size, as annual loan loss rates have remained relatively constant over this time. In addition, during 2014 we grew our line of credit product, and we expect this product to drive a larger percentage of our originations as adoption and use of this product continues to grow. In the latter part of 2014, we also introduced the fifth generation, or v5, of the OnDeck Score which has enhanced our credit scoring capabilities, enabling us to improve offers to our customers while preserving the credit quality of our portfolio.
We anticipate that our future growth will continue to depend in part on attracting new customers. We plan to increase our sales and marketing spending to attract these customers as well as continue to increase our analytics spending to better identify potential customers. We have historically relied on all three of our channels for customer acquisition but have become increasingly focused on growing our direct and strategic partner channels. Originations through our direct and strategic partner channels increased as a percentage of total originations from all customers from 43.6% in 2013 to 58.6% in 2014. We plan to continue investing in direct marketing and sales, increasing our brand awareness and growing our strategic partnerships. During the first six months of 2015, we also plan to implement certain enhanced compliance-related measures related to our funding advisor channel in addition to our existing measures. As a result, while we expect to grow each of our distribution channels, we expect originations in our direct and strategic partner channels to grow at a pace faster than our funding advisor channel.
50
Table of Contents
The following table summarizes the percentage of loans made to all customers originated by our three distribution channels for the periods indicated.
| Year Ended December 31, | ||||||||||||
| Percentage of Originations (Number of Loans) | 2014 | 2013 | 2012 | |||||||||
| Direct |
55.4 | % | 44.1 | % | 23.4 | % | ||||||
| Strategic Partner |
14.4 | % | 10.3 | % | 8.0 | % | ||||||
| Funding Advisor |
30.2 | % | 45.6 | % | 68.6 | % | ||||||
| Year Ended December 31, | ||||||||||||
| Percentage of Originations (Dollars) | 2014 | 2013 | 2012 | |||||||||
| Direct |
44.7 | % | 34.4 | % | 19.4 | % | ||||||
| Strategic Partner |
13.9 | % | 9.2 | % | 5.5 | % | ||||||
| Funding Advisor |
41.4 | % | 56.4 | % | 75.1 | % | ||||||
We originate term loans and lines of credit to customers who are new to OnDeck, as well as to repeat customers. We believe our ability to increase adoption of our products within our existing customer base will be important to our future growth. In 2014 and 2013, total originations from our repeat customers were 50.1% and 43.5%, respectively. We believe our significant number of repeat customers is primarily due to our high levels of customer service and continued improvement in products and services. Repeat customers generally comprise our highest quality loans, given many repeat customers require additional financing for growth or expansion. From our 2013 direct and strategic partner customer cohort, customers who took at least three loans grew their revenue and bank balance, respectively, on average by 25% and 42% from their initial loan to their third loan. On average, their OnDeck Score increased by 24 points, enabling us to grow their mean loan amount by 106% while decreasing their APR by 17.5 percentage points. Twenty-seven percent of our origination volume from repeat customers in 2014 was due to unpaid principal balance rolled from existing loans directly into such repeat originations. In order for a current customer to qualify for a new term loan while a term loan payment obligation remains outstanding, the customer must pass the following standards:
| • | the business must be approximately 50% paid down on its existing loan; |
| • | the business must be current on its outstanding OnDeck loan with no material delinquency history; and |
| • | the business must be fully re-underwritten and determined to be of adequate credit quality. |
The extent to which we generate repeat business from our customers will be an important factor in our continued revenue growth and our visibility into future revenue. In conjunction with repeat borrowing activity, our customers also tend to increase their subsequent loan size compared to their initial loan size. In the fourth quarter of 2014, we introduced the ability for our customers to carry a term loan and line of credit concurrently. We believe that cross-selling these two products will enhance our ability to generate repeat business going forward.
The following table summarizes the percentage of loans originated by new and repeat customers. Loans from cross-selling efforts are classified in the table as repeat loans.
| Year Ended December 31, | ||||||||||||
| Percentage of Originations (Dollars) | 2014 | 2013 | 2012 | |||||||||
| New |
49.9 | % | 56.5 | % | 56.2 | % | ||||||
| Repeat |
50.1 | % | 43.5 | % | 43.8 | % | ||||||
51
Table of Contents
Customer Acquisition Costs
Our customer acquisition costs, or CACs, differ depending upon the acquisition channel. CACs in our direct channel include the commissions paid to our internal salesforce and expenses associated with items such as direct mail, social media and other online marketing activities. CACs in our strategic partner channel include commissions paid to our internal salesforce and strategic partners. CACs in our funding advisor channel include commissions paid to our internal salesforce and funding advisors. Compared to 2013, our CACs in the strategic partner channel and in our funding advisor channel in 2014 have declined slightly as a percentage of originations from the respective channels. Our direct channel CACs have declined as a percentage of originations as a result of the increasing scale of our operations, improvements in customer targeting, our introduction of our line of credit product, the addition of pre-approvals to our marketing outreach and underwriting process and increased repeat purchases from customers.
Customer Lifetime Value
The ongoing lifetime value of our customers will be an important component of our future performance. We analyze customer lifetime value not only by tracking the “contribution” of customers over their lifetime with us, but also by comparing this contribution to the acquisition costs incurred in connection with originating such customers’ initial loans.
For illustration, we consider customers that took their first ever loan from us during the first quarter of 2013, which we refer to as our Q1 2013 cohort, and look at all of their borrowing and transaction history from that date through December 31, 2014. We selected this cohort because it contains sufficient periods to demonstrate contribution after initial acquisition, and we believe that the trends reflected by this cohort are representative of the value of our other customers proximate in time. The borrowing characteristics of the Q1 2013 cohort through December 31, 2014 include:
| • | Average number of loans per customer during the measurement period: 2.3 |
| • | Average initial loan size: $30,818 |
| • | Average repeat loan size: $46,970 |
| • | Total borrowings: $127.9 million |
Below, for customers in the Q1 2013 cohort, we compare the contribution generated through December 31, 2014 with their initial customer acquisition costs.
52
Table of Contents
Q1 2013 Cohort Acquisition Cost and Customer Lifetime Value
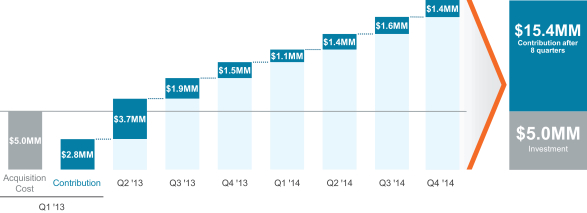
For the Q1 2013 cohort, we estimate the initial customer acquisition cost was $5.0 million.
We define the contribution to include the interest income and fees collected on a cohort of customers’ initial and repeat loans less acquisition costs for their repeat loans, estimated third party processing and servicing expenses for their initial and repeat loans, estimated funding costs (excluding any cost of equity capital) for their initial and repeat loans, and charge-offs of their initial and repeat loans. For the Q1 2013 cohort, the contribution was $2.8 million during the quarter of acquisition and an aggregate of $15.4 million through December 31, 2014. This $15.4 million aggregate contribution represents a return of approximately 3.0 times on the initial $5.0 million acquisition investment.
We expect the customer value of our Q1 2013 cohort and the return on our initial acquisition cost for this cohort to continue to increase as $4.1 million of interest payments remain due in future months, primarily on loans made to repeat customers who are in this cohort, and we believe customers from this cohort will continue to take additional repeat loans from us in the future. Over time, we expect to continue to improve customer lifetime value through our ability to cross-sell additional products to our existing customers, enhance loyalty benefits to our repeat customers, and reduce acquisition, funding and processing and servicing costs.
In the future, we may incur greater marketing expenses to acquire new customers, we may decide to offer term loans with lower interest rates, our charge-offs may increase and our customers’ repeat purchase behavior may change, any of which could adversely impact our customers’ lifetime values to us and our operating results.
Economic Conditions
Changes in the overall economy may impact our business in several ways, including demand for our products, credit performance, and funding costs.
| • | Demand for Our Products. In a strong economic climate, demand for our products may increase as consumer spending increases and small businesses seek to expand. In addition, more potential customers may meet our underwriting requirements to qualify for a loan. At the same time, small businesses may experience improved cash flow and liquidity resulting in fewer customers requiring loans to manage their cash flows. In that climate, traditional lenders may also approve loans for a higher percentage of our potential customers. In a weakening economic climate or recession, the opposite may occur. |
53
Table of Contents
| • | Credit Performance. In a strong economic climate, our customers may experience improved cash flow and liquidity, which may result in lower loan losses. In a weakening economic climate or recession, the opposite may occur. We factor economic conditions into our loan underwriting analysis and reserves for loan losses, but changes in economic conditions, particularly sudden changes, may affect our actual loan losses. These effects may be partially mitigated by the short-term nature and repayment structure of our loans, which should allow us to react more quickly than if the terms of our loans were longer. |
| • | Loan Losses. Our underwriting process is designed to limit our loan losses to levels compatible with our business strategy and financial model. Our aggregate loan loss rates from 2012 through 2014 have been consistent with our financial targets. Our overall loan losses are affected by a variety of factors, including external factors such as prevailing economic conditions, general small business sentiment and unusual events such as natural disasters, as well as internal factors such as the accuracy of the OnDeck Score, the effectiveness of our underwriting process and the introduction of new products, such as our line of credit, with which we have less experience to draw upon when forecasting their loss rates. Our loan loss rates may vary in the future. |
Historical Charge-Offs
We illustrate below our historical loan losses by providing information regarding our net lifetime charge-off ratios by cohort. Net lifetime charge-offs are the unpaid principal balance charged off less recoveries of loans previously charged off, and a given cohort’s net lifetime charge-off ratio equals the cohort’s net lifetime charge-offs through December 31, 2014 divided by the cohort’s total original loan volume. Repeat loans in both the numerator and denominator include the full renewal loan principal, rather than the net funded amount, which is the renewal loan’s principal net of the unpaid principal balance on the existing loan. Loans are typically charged off after 90 days of nonpayment. Loans originated and charged off between January 1, 2012 and December 31, 2014 were on average charged off near the end of their loan term. The chart immediately below includes all term loan originations, regardless of funding source, including loans sold through our OnDeck Marketplace or held for sale on our balance sheet.
Net Charge-off Ratios by Cohort Through December 31, 2014
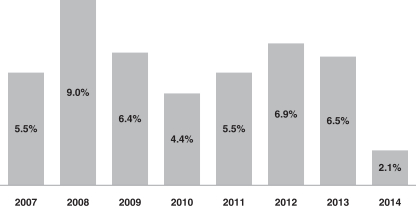
| Principal Outstanding as of December 31, 2014 |
0.0 | % | 0.0 | % | 0.0 | % | 0.0 | % | 0.0 | % | 0.1 | % | 1.6 | % | 49.1 | % |
54
Table of Contents
The following charts display the historical lifetime cumulative net charge-off ratios, by origination year. The charts reflect all term loan originations, regardless of funding source, including loans sold through our OnDeck Marketplace or held for sale on our balance sheet. The data is shown as a static pool for annual cohorts, illustrating how the cohort has performed given equivalent months of seasoning.
Given the most recent originations in the 2014 cohort are relatively unseasoned as of December 31, 2014, the 2014 cohort reflect low lifetime charge-off ratios in each of the new customer, repeat customer and total loans charts below. Further, given our loans are typically charged off after 90 days of nonpayment, all cohorts reflect approximately 0% for the first four months in the below charts.
Net Cumulative Lifetime Charge-off Ratios
New Loans
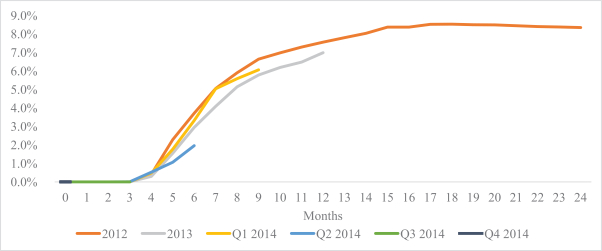
| Originations | 2012 | 2013 | Q1 2014 | Q2 2014 | Q3 2014 | Q4 2014 | ||||||||||||||||||
| New term loans (in thousands) |
$ | 97,367 | $ | 256,344 | 122,227 | 114,858 | 130,721 | 153,548 | ||||||||||||||||
| Weighted average term (months) |
9.1 | 10.0 | 10.7 | 10.6 | 10.9 | 10.9 | ||||||||||||||||||
55
Table of Contents
Net Cumulative Lifetime Charge-off Ratios
Repeat Loans
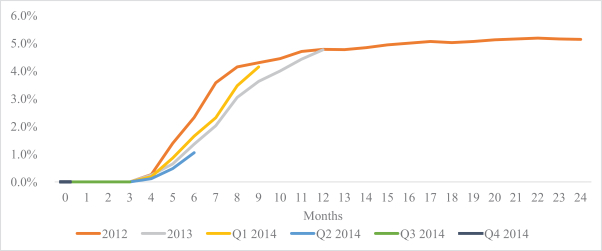
| Originations | 2012 | 2013 | Q1 2014 | Q2 2014 | Q3 2014 | Q4 2014 | ||||||||||||||||||
| Repeat term loans (in thousands) |
75,880 | 199,587 | 98,708 | 122,872 | 166,567 | 191,455 | ||||||||||||||||||
| Weighted average term (months) |
9.3 | 10.0 | 10.9 | 11.1 | 12.1 | 11.9 | ||||||||||||||||||
Net Cumulative Lifetime Charge-off Ratios
All Loans
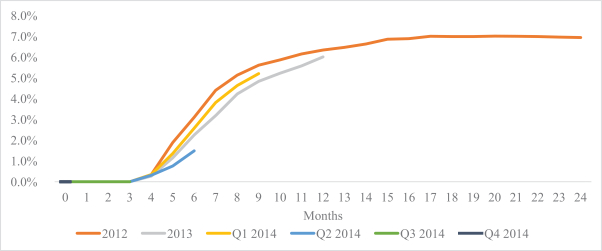
| Originations | 2012 |
2013 |
Q1 2014 |
Q2 2014 |
Q3 2014 |
Q4 2014 |
||||||||||||||||||
| All term loans (in thousands) |
173,246 | 455,931 | 220,935 | 237,730 | 297,288 | 345,004 | ||||||||||||||||||
| Weighted average term (months) |
9.2 | 10.0 | 10.8 | 10.9 | 11.5 | 11.5 | ||||||||||||||||||
56
Table of Contents
Funding Costs
Changes in macroeconomic conditions may affect generally prevailing interest rates, and such effects may be amplified or reduced by other factors such as fiscal and monetary policies, economic conditions in other markets and other factors. Interest rates may also change for reasons unrelated to economic conditions. To the extent that interest rates rise, our funding costs will increase and the spread between our Effective Interest Yield and our Cost of Funds Rate may narrow to the extent we cannot correspondingly increase the payback rates we charge our customers. As we have grown, we have been able to lower our Cost of Funds Rate by negotiating more favorable interest rates on our debt and accessing new sources of funding, such as the OnDeck Marketplace and the securitization markets. While we will continue to seek to lower our Cost of Funds Rate, we do not expect that our Cost of Funds Rate will continue to decline as significantly as it has since 2012.
Components of Our Results of Operations
Revenue
Interest Income. We generate revenue primarily through interest and origination fees earned on the term loans we originate and hold to maturity, and to a lesser extent, interest earned on lines of credit. Our interest and origination fee revenue is amortized over the term of the loan using the effective interest method. Origination fees collected but not yet recognized as revenue are netted with direct origination costs and recorded as a component of loans on our consolidated balance sheets and recognized over the term of the loan. Direct origination costs include costs directly attributable to originating a loan, including commissions, vendor costs and personnel costs directly related to the time spent by those individuals performing activities related to loan origination.
Gain on Sales of Loans. In October 2013, we began selling term loans to third-party institutional investors through our OnDeck Marketplace. We recognize a gain or loss on the sale of such loans as the difference between the proceeds received from the purchaser and the carrying value of the loan.
Other Revenue. Our other revenue consists of servicing income from loans sold to third-party institutional investors, the monthly fees we charge for our line of credit product, and marketing fees earned from our issuing bank partners. We treat loans referred to, and funded by, our issuing bank partners and later purchased by us as part of our originations.
Cost of Revenue
Provision for Loan Losses. Provision for loan losses consists of amounts charged to income during the period to maintain an allowance for loan losses, or ALLL, estimated to be adequate to provide for probable credit losses inherent in our existing loan portfolio. Our ALLL represents our estimate of the expected credit losses inherent in our portfolio of term loans and lines of credit and is based on a variety of factors, including the composition and quality of the portfolio, loan specific information gathered through our collection efforts, delinquency levels, our historical charge-off and loss experience and general economic conditions. We expect our aggregate provision for loan losses to increase in absolute dollars as the amount of term loans and lines of credit we originate increases.
Funding Costs. Funding costs consist of the interest expense we pay on the debt we incur to fund our lending activities, certain fees and the amortization of deferred debt issuance costs incurred in connection with obtaining this debt, such as banker fees, origination fees and legal fees. Such costs are expensed immediately upon early extinguishment of the related debt. We expect funding costs to continue to increase in absolute dollars in the near future as we incur additional debt to support future term loan and line of credit originations. In addition, funding costs as a percentage of gross revenue will fluctuate based on the applicable interest rates payable on the debt we incur to fund our lending activities and our OnDeck Marketplace revenue mix. We do not expect the interest rates at which we borrow to decline as significantly as they have since 2012.
57
Table of Contents
Operating Expense
Operating expense consists of sales and marketing, technology and analytics, processing and servicing, and general and administrative expenses. Salaries and personnel-related costs, including benefits, bonuses and stock-based compensation expense, comprise a significant component of each of these expense categories. We expect our stock-based compensation expense to increase in the future. The number of employees related to these operating expense categories was 155, 251 and 444 at December 31, 2012, 2013 and 2014, respectively. We expect to continue to hire new employees in order to support our growth strategy. All operating expense categories also include an allocation of overhead, such as rent and other overhead, which is based on employee headcount.
Sales and Marketing. Sales and marketing expense consists of salaries and personnel-related costs of our sales and marketing and business development employees, as well as direct marketing and advertising costs, online and offline customer acquisition costs (such as direct mail, paid search and search engine optimization costs), public relations, radio and television advertising, promotional event programs and sponsorships, corporate communications and allocated overhead. We expect our sales and marketing expense to increase in absolute dollars in the foreseeable future as we further increase the number of sales and marketing professionals and increase our marketing activities in order to continue to expand our direct customer acquisition efforts and build our brand. Future sales and marketing expense may include the expense associated with warrants issued to a strategic partner if performance conditions are met as described in Note 8 of Notes to Consolidated Financial Statements elsewhere in this report.
Technology and Analytics. Technology and analytics expense consists primarily of the salaries and personnel-related costs of our engineering and product employees as well as our credit and analytics employees who develop our proprietary credit-scoring models. Additional expenses include third-party data acquisition expenses, professional services, consulting costs, expenses related to the development of new products and technologies and maintenance of existing technology assets, amortization of capitalized internal-use software costs related to our technology platform and allocated overhead. We believe continuing to invest in technology is essential to maintaining our competitive position, and we expect these costs to rise in the near term on an absolute basis and as a percentage of gross revenue.
Processing and Servicing. Processing and servicing expense consists primarily of salaries and personnel related costs of our credit analysis, underwriting, funding, fraud detection, customer service and collections employees. Additional expenses include vendor costs associated with third-party credit checks, lien filing fees and other costs to evaluate, close and fund loans and overhead costs. We anticipate that our processing and servicing expense will rise in absolute dollars as we grow originations.
General and Administrative. General and administrative expense consists primarily of salary and personnel-related costs for our executive, finance and accounting, legal and people operations employees. Additional expenses include a provision for the unfunded portion of our lines of credit, consulting and professional fees, insurance, legal, occupancy, travel and other corporate expenses. Subsequent to our initial public offering, these expenses also include costs associated with compliance with the Sarbanes-Oxley Act and other regulations governing public companies, directors’ and officers’ liability insurance, increased accounting.
Other (Expense) Income
Interest Expense. Interest expense consists of interest expense and amortization of deferred debt issuance costs incurred on debt associated with our corporate activities. It does not include interest expense incurred on debt associated with our lending activities. Interest expense decreased by $0.9 million, from $1.3 million for the year ended December 31, 2013 to $0.4 million for the year ended December 31, 2014. In February 2013, we recognized $1.0 million of non-cash interest expense related to a beneficial conversion feature associated with the conversion of an outstanding convertible note into preferred stock.
58
Table of Contents
Warrant Liability Fair Value Adjustment. We issued warrants to purchase shares of our Series B and C-1 redeemable convertible preferred stock in connection with loan and security agreements entered into with Lighthouse Capital and SF Capital in 2010 and 2012, respectively. Additionally, we issued warrants to purchase shares of our Series E redeemable convertible preferred stock in connection with certain consulting and commercial agreements in 2014. As the warrant holders have the right to demand that their redeemable convertible preferred stock be settled in cash after the passage of time, we recorded the warrants as liabilities on our consolidated balance sheet. The fair values of our redeemable convertible preferred stock warrant liabilities are re-measured at the end of each reporting period and any changes in fair values are recognized in other (expense) income. During 2014, a majority of these warrants were exercised, eliminating the associated warrant liabilities. At the completion of our initial public offering in December 2014, the remaining outstanding warrants were converted into warrants to purchase common stock, which resulted in the reclassification of the warrant liability to additional paid-in-capital, and no further changes in fair value will be recognized in other (expense) income. Future warrant liability fair value adjustment may include adjustments associated with warrants issued to a strategic partner as described in Note 8 of Notes to Consolidated Financial Statements elsewhere in this report.
Provision for Income Taxes
Provision for income taxes consists of U.S. federal, state and foreign income taxes, if any. To date, we have not been required to pay U.S. federal or state income taxes because of our current and accumulated net operating losses. As of December 31, 2014, we had $32.2 million of federal net operating loss carryforwards and $31.4 million of state net operating loss carryforwards available to reduce future taxable income, unless limited due to historical or future ownership changes. The federal net operating loss carryforwards will begin to expire at various dates beginning in 2027.
The Internal Revenue Code of 1986, as amended, or the Code, imposes substantial restrictions on the utilization of net operating losses and other tax attributes in the event of an “ownership change” of a corporation. Events which may cause limitation in the amount of the net operating losses and other tax attributes that are able to be utilized in any one year include, but are not limited to, a cumulative ownership change of more than 50% over a three-year period, which has occurred as a result of historical ownership changes. Accordingly, our ability to use pre-change net operating loss and certain other attributes are limited as prescribed under Sections 382 and 383 of the Code. Therefore, if we earn net taxable income in the future, our ability to reduce our federal income tax liability with our existing net operating losses is subject to limitation. Future offerings, as well as other future ownership changes that may be outside our control could potentially result in further limitations on our ability to utilize our net operating loss and tax attributes. Accordingly, achieving profitability may not result in a full release of the valuation allowance.
As of December 31, 2014, a full valuation allowance of $26.1 million was recorded against our net deferred tax assets.
59
Table of Contents
Results of Operations
The following table sets forth our consolidated statements of operations data for each of the periods indicated.
| Year Ended December 31, | ||||||||||||
| 2014 | 2013 | 2012 | ||||||||||
| (dollars in thousands) | ||||||||||||
| Revenue: |
||||||||||||
| Interest income |
$ | 145,275 | $ | 62,941 | $ | 25,273 | ||||||
| Gain on sales of loans |
8,823 | 788 | — | |||||||||
| Other revenue |
3,966 | 1,520 | 370 | |||||||||
|
|
|
|
|
|
|
|||||||
| Gross revenue |
158,064 | 65,249 | 25,643 | |||||||||
|
|
|
|
|
|
|
|||||||
| Cost of revenue: |
||||||||||||
| Provision for loan losses |
67,432 | 26,570 | 12,469 | |||||||||
| Funding costs |
17,200 | 13,419 | 8,294 | |||||||||
|
|
|
|
|
|
|
|||||||
| Total cost of revenue |
84,632 | 39,989 | 20,763 | |||||||||
|
|
|
|
|
|
|
|||||||
| Net revenue |
73,432 | 25,260 | 4,880 | |||||||||
|
|
|
|
|
|
|
|||||||
| Operating expense: |
||||||||||||
| Sales and marketing |
33,201 | 18,095 | 6,633 | |||||||||
| Technology and analytics |
17,399 | 8,760 | 5,001 | |||||||||
| Processing and servicing |
8,230 | 5,577 | 2,919 | |||||||||
| General and administrative |
21,680 | 12,169 | 6,935 | |||||||||
|
|
|
|
|
|
|
|||||||
| Total operating expense |
80,510 | 44,601 | 21,488 | |||||||||
|
|
|
|
|
|
|
|||||||
| Loss from operations |
(7,078 | ) | (19,341 | ) | (16,608 | ) | ||||||
|
|
|
|
|
|
|
|||||||
| Other (expense) income: |
||||||||||||
| Interest expense |
(398 | ) | (1,276 | ) | (88 | ) | ||||||
| Warrant liability fair value adjustment |
(11,232 | ) | (3,739 | ) | (148 | ) | ||||||
|
|
|
|
|
|
|
|||||||
| Total other (expense) income |
(11,630 | ) | (5,015 | ) | (236 | ) | ||||||
|
|
|
|
|
|
|
|||||||
| Loss before provision for income taxes |
(18,708 | ) | (24,356 | ) | (16,844 | ) | ||||||
| Provision for income taxes |
— | — | — | |||||||||
|
|
|
|
|
|
|
|||||||
| Net loss |
$ | (18,708 | ) | $ | (24,356 | ) | $ | (16,844 | ) | |||
|
|
|
|
|
|
|
|||||||
60
Table of Contents
The following table sets forth our consolidated statements of operations data as a percentage of gross revenue for each of the periods indicated.
| Year ended December 31, |
||||||||||||
| 2014 | 2013 | 2012 | ||||||||||
| Revenue: |
||||||||||||
| Interest income |
91.9 | % | 96.5 | % | 98.6 | % | ||||||
| Gain on sales of loans |
5.6 | 1.2 | — | |||||||||
| Other revenue |
2.5 | 2.3 | 1.4 | |||||||||
|
|
|
|
|
|
|
|||||||
| Gross revenue |
100.0 | 100.0 | 100.0 | |||||||||
|
|
|
|
|
|
|
|||||||
| Cost of revenue: |
||||||||||||
| Provision for loan losses |
42.7 | 40.7 | 48.6 | |||||||||
| Funding costs |
10.9 | 20.6 | 32.3 | |||||||||
|
|
|
|
|
|
|
|||||||
| Total cost of revenue |
53.5 | 61.3 | 81.0 | |||||||||
|
|
|
|
|
|
|
|||||||
| Net revenue |
46.5 | 38.7 | 19.0 | |||||||||
|
|
|
|
|
|
|
|||||||
| Operating expense: |
||||||||||||
| Sales and marketing |
21.0 | 27.7 | 25.9 | |||||||||
| Technology and analytics |
11.0 | 13.4 | 19.5 | |||||||||
| Processing and servicing |
5.2 | 8.5 | 11.4 | |||||||||
| General and administrative |
13.7 | 18.7 | 27.0 | |||||||||
|
|
|
|
|
|
|
|||||||
| Total operating expense |
50.9 | 68.4 | 83.8 | |||||||||
|
|
|
|
|
|
|
|||||||
| Loss from operations |
(4.5 | ) | (29.6 | ) | (64.8 | ) | ||||||
|
|
|
|
|
|
|
|||||||
| Other (expense) income: |
||||||||||||
| Interest expense |
(0.3 | ) | (2.0 | ) | (0.3 | ) | ||||||
| Warrant liability fair value adjustment |
(7.1 | ) | (5.7 | ) | (0.6 | ) | ||||||
|
|
|
|
|
|
|
|||||||
| Total other (expense) income |
(7.4 | ) | (7.7 | ) | (0.9 | ) | ||||||
|
|
|
|
|
|
|
|||||||
| Loss before provision for income taxes |
(11.8 | ) | (37.3 | ) | (65.7 | ) | ||||||
| Provision for income taxes |
— | — | — | |||||||||
| Net loss |
(11.8 | )% | (37.3 | )% | (65.7 | )% | ||||||
|
|
|
|
|
|
|
|||||||
61
Table of Contents
Comparison of Years Ended December 31, 2014 and 2013
| Year Ended December 31, | ||||||||||||||||||||||||
| Period-to-Period | ||||||||||||||||||||||||
| 2014 | 2013 | Change | ||||||||||||||||||||||
| Amount | Percentage of Gross Revenue |
Amount | Percentage of Gross Revenue |
Amount | Percentage | |||||||||||||||||||
| (dollars in thousands) | ||||||||||||||||||||||||
| Revenue: |
||||||||||||||||||||||||
| Interest income |
$ | 145,275 | 91.9 | % | $ | 62,941 | 96.5 | % | $ | 82,334 | 130.8 | % | ||||||||||||
| Gain on sales of loans |
8,823 | 5.6 | 788 | 1.2 | 8,035 | 1,019.7 | ||||||||||||||||||
| Other revenue |
3,966 | 2.5 | 1,520 | 2.3 | 2,446 | 160.9 | ||||||||||||||||||
|
|
|
|
|
|
|
|
|
|
|
|
|
|||||||||||||
| Gross revenue |
158,064 | 100.0 | 65,249 | 100.0 | 92,815 | 142.2 | ||||||||||||||||||
|
|
|
|
|
|
|
|
|
|
|
|
|
|||||||||||||
| Cost of revenue: |
||||||||||||||||||||||||
| Provision for loan losses |
67,432 | 42.7 | 26,570 | 40.7 | 40,862 | 153.8 | ||||||||||||||||||
| Funding costs |
17,200 | 10.9 | 13,419 | 20.6 | 3,781 | 28.2 | ||||||||||||||||||
|
|
|
|
|
|
|
|
|
|
|
|
|
|||||||||||||
| Total cost of revenue |
84,632 | 53.5 | 39,989 | 61.3 | 44,643 | 111.6 | ||||||||||||||||||
|
|
|
|
|
|
|
|
|
|
|
|
|
|||||||||||||
| Net revenue |
73,432 | 46.5 | 25,260 | 38.7 | 48,172 | 190.7 | ||||||||||||||||||
|
|
|
|
|
|
|
|
|
|
|
|
|
|||||||||||||
| Operating expenses: |
||||||||||||||||||||||||
| Sales and marketing |
33,201 | 21.0 | 18,095 | 27.7 | 15,106 | 83.5 | ||||||||||||||||||
| Technology and analytics |
17,399 | 11.0 | 8,760 | 13.4 | 8,639 | 98.6 | ||||||||||||||||||
| Processing and servicing |
8,230 | 5.2 | 5,577 | 8.5 | 2,653 | 47.6 | ||||||||||||||||||
| General and administrative |
21,680 | 13.7 | 12,169 | 18.7 | 9,511 | 78.2 | ||||||||||||||||||
|
|
|
|
|
|
|
|
|
|
|
|
|
|||||||||||||
| Total operating expenses |
80,510 | 50.9 | 44,601 | 68.4 | 35,909 | 80.5 | ||||||||||||||||||
|
|
|
|
|
|
|
|
|
|
|
|
|
|||||||||||||
| Loss from operations |
(7,078 | ) | (4.5 | ) | (19,341 | ) | (29.6 | ) | 12,263 | (63.4 | ) | |||||||||||||
|
|
|
|
|
|
|
|
|
|
|
|
|
|||||||||||||
| Other (expense) income: |
||||||||||||||||||||||||
| Interest expense |
(398 | ) | (0.3 | ) | (1,276 | ) | (2.0 | ) | 878 | (68.8 | ) | |||||||||||||
| Warrant liability fair value adjustment |
(11,232 | ) | (7.1 | ) | (3,739 | ) | (5.7 | ) | (7,493 | ) | 200.4 | |||||||||||||
|
|
|
|
|
|
|
|
|
|
|
|
|
|||||||||||||
| Total other (expense) income: |
(11,630 | ) | (7.4 | ) | (5,015 | ) | (7.7 | ) | (6,615 | ) | 131.9 | |||||||||||||
|
|
|
|
|
|
|
|
|
|
|
|
|
|||||||||||||
| Loss before provision for income taxes |
(18,708 | ) | (11.8 | ) | (24,356 | ) | (37.3 | ) | 5,648 | (23.2 | ) | |||||||||||||
| Provision for income taxes |
— | — | — | — | — | — | ||||||||||||||||||
|
|
|
|
|
|
|
|
|
|
|
|
|
|||||||||||||
| Net loss |
$ | (18,708 | ) | (11.8 | )% | $ | (24,356 | ) | (37.3 | )% | $ | 5,648 | (23.2 | )% | ||||||||||
|
|
|
|
|
|
|
|
|
|
|
|
|
|||||||||||||
Revenue
| Year Ended December 31, | ||||||||||||||||||||||||
| Period-to-Period | ||||||||||||||||||||||||
| 2014 | 2013 | Change | ||||||||||||||||||||||
| Amount | Percentage of Gross Revenue |
Amount | Percentage of Gross Revenue |
Amount | Percentage | |||||||||||||||||||
| (dollars in thousands) | ||||||||||||||||||||||||
| Revenue: |
||||||||||||||||||||||||
| Interest income |
$ | 145,275 | 91.9 | % | $ | 62,941 | 96.5 | % | $ | 82,334 | 130.8 | % | ||||||||||||
| Gain on sales of loans |
8,823 | 5.6 | 788 | 1.2 | 8,035 | 1,019.7 | ||||||||||||||||||
| Other revenue |
3,966 | 2.5 | 1,520 | 2.3 | 2,446 | 160.9 | ||||||||||||||||||
|
|
|
|
|
|
|
|
|
|
|
|
|
|||||||||||||
| Gross revenue |
$ | 158,064 | 100.0 | % | $ | 65,249 | 100.0 | % | $ | 92,815 | 142.2 | % | ||||||||||||
|
|
|
|
|
|
|
|
|
|
|
|
|
|||||||||||||
62
Table of Contents
Gross revenue increased by $92.8 million, or 142.2%, from $65.2 million in 2013 to $158.1 million in 2014. This growth was primarily attributable to a $82.3 million, or 131%, increase in interest income, which was primarily driven by increases in the average total loans outstanding in 2014. During 2014, our average total loans outstanding increased 144.0% to $359.7 million from $147.4 million during 2013. The increase in originations was partially offset by a decline in our Effective Interest Yield on loans outstanding from 42.7% to 40.4% in the later period.
Gain on sales of loans increased by $8.0 million, from $0.8 million in 2013 to $8.8 million in 2014. This increase was primarily attributable to a $121.6 million increase in the sale of term loans through our OnDeck Marketplace in 2014. We launched the OnDeck Marketplace in October 2013.
Other revenue increased $2.4 million, or 161%, in 2014 as compared to 2013, primarily attributable to an increase in marketing fees from our issuing bank partners and an increase in OnDeck Marketplace servicing fees.
Cost of Revenue
| Year Ended December 31, | ||||||||||||||||||||||||
| Period-to-Period | ||||||||||||||||||||||||
| 2014 | 2013 | Change | ||||||||||||||||||||||
| Amount | Percentage of Gross Revenue |
Amount | Percentage of Gross Revenue |
Amount | Percentage | |||||||||||||||||||
| (dollars in thousands) | ||||||||||||||||||||||||
| Cost of revenue: |
||||||||||||||||||||||||
| Provision for loan losses |
$ | 67,432 | 42.7 | % | $ | 26,570 | 40.7 | % | $ | 40,862 | 153.8 | % | ||||||||||||
| Funding costs |
17,200 | 10.9 | 13,419 | 20.6 | 3,781 | 28.2 | ||||||||||||||||||
|
|
|
|
|
|
|
|
|
|
|
|
|
|||||||||||||
| Total cost of revenue |
$ | 84,632 | 53.5 | % | $ | 39,989 | 61.3 | % | $ | 44,643 | 111.6 | % | ||||||||||||
|
|
|
|
|
|
|
|
|
|
|
|
|
|||||||||||||
Provision for Loan Losses. Provision for loan losses increased by $40.9 million, or 153.8%, from $26.6 million in 2013 to $67.4 million in 2014. The increase in provision for loan losses was primarily attributable to the increase in originations of term loans and lines of credit. In accordance with GAAP, we recognize revenue on loans over their term, but provide for probable credit losses on the loans at the time they are originated and then adjust periodically based on actual performance and changes in loss expectations. As a result, we believe that analyzing provision for loan losses as a percentage of originations, rather than as a percentage of gross revenue, provides more useful insight into our operating performance. The Provision Rate increased from 6.0% in 2013 to 6.6% in 2014. The increase was primarily due to the longer average term of loan originations and the increase of originations of our line of credit product.
Funding Costs. Funding costs increased by $3.8 million, or 28.2%, from $13.4 million in 2013 to $17.2 million in 2014. The increase in funding costs was primarily attributable to the increases in our aggregate outstanding borrowings. The average balance of our funding debt facilities during 2014 was $279.3 million as compared to the average balance of $124.2 million during 2013. In addition, we experienced a $0.4 million increase in amortization of debt issuance costs in 2014 as compared to 2013, primarily related to our securitization transaction in May 2014. As a percentage of gross revenue, funding costs decreased from 20.6% in 2013 to 10.9% in 2014. The decrease in funding costs as a percentage of gross revenue was primarily the result of more favorable interest rates on our debt facilities associated with our lending activities and the creation of the OnDeck Marketplace, as loans sold through the OnDeck Marketplace do not incur funding costs from our debt facilities. The decrease in funding costs as a percentage of gross revenue can be seen in the decrease in our Cost of Funds Rate which decreased from 10.8% in 2013 to 6.2% in 2014.
63
Table of Contents
Operating Expense
Sales and Marketing
| Year Ended December 31, | ||||||||||||||||||||||||
| Period-to-Period | ||||||||||||||||||||||||
| 2014 | 2013 | Change | ||||||||||||||||||||||
| Amount | Percentage of Gross Revenue |
Amount | Percentage of Gross Revenue |
Amount | Percentage | |||||||||||||||||||
| (dollars in thousands) | ||||||||||||||||||||||||
| Sales and Marketing |
$ | 33,201 | 21.0 | % | $ | 18,095 | 27.7 | % | $ | 15,106 | 83.5 | % | ||||||||||||
Sales and marketing expense increased by $15.1 million, or 83.5%, from $18.1 million in 2013 to $33.2 million in 2014. The increase was in part attributable to a $5.7 million increase in salaries and personnel-related costs and consultant expenses. In addition, we experienced an $8.7 million increase in direct marketing, general marketing and advertising costs as we expanded our marketing programs to drive increased customer acquisition and brand awareness. As a percentage of gross revenue, sales and marketing expense decreased from 27.7% in 2013 to 21.0% in 2014.
Technology and Analytics
| Year Ended December 31, | ||||||||||||||||||||||||
| 2014 | 2013 | Period-to-Period Change |
||||||||||||||||||||||
| Amount | Percentage of Gross Revenue |
Amount | Percentage of Gross Revenue |
Amount | Percentage | |||||||||||||||||||
| (dollars in thousands) | ||||||||||||||||||||||||
| Technology and analytics |
$ | 17,399 | 11.0 | % | $ | 8,760 | 13.4 | % | $ | 8,638 | 98.6 | % | ||||||||||||
Technology and analytics expense increased by $8.6 million, or 98.6%, from $8.8 million in 2013 to $17.4 million in 2014. The increase was primarily attributable to a $6.4 million increase in salaries and personnel-related costs, as we increased the number of technology personnel developing our platform, as well as analytics personnel to further improve upon algorithms underlying the OnDeck Score. In addition, we experienced a $1.8 million increase in amortization of capitalized internal-use software costs related to our technology platform, expenses related to our new data center facility, technology licenses and other costs to support our larger employee base. As a percentage of gross revenue, technology and analytics expense decreased from 13.4% in 2013 to 11.0% in 2014.
Processing and Servicing
| Year Ended December 31, | ||||||||||||||||||||||||
| 2014 | 2013 | Period-to-Period Change |
||||||||||||||||||||||
| Amount | Percentage of Gross Revenue |
Amount | Percentage of Gross Revenue |
Amount | Percentage | |||||||||||||||||||
| (dollars in thousands) | ||||||||||||||||||||||||
| Processing and Servicing |
$ | 8,230 | 5.2 | % | $ | 5,577 | 8.5 | % | $ | 2,653 | 47.6 | % | ||||||||||||
Processing and servicing expense increased by $2.7 million, or 47.6%, from $5.6 million in 2013 to $8.2 million in 2014. The increase was primarily attributable to a $1.7 million increase in salaries and personnel-related costs, as we increased the number of processing and servicing personnel to support the increased volume of loan applications and approvals and increased loan servicing requirements. In addition, we experienced a $0.8 million increase in third-party processing costs, credit information and filing fees as a result of the increased volume of loan applications and originations. As a percentage of gross revenue, processing and servicing expense decreased from 8.5% in 2013 to 5.2% in 2014.
64
Table of Contents
General and Administrative
| Year Ended December 31, | ||||||||||||||||||||||||
| 2014 | 2013 | Period-to-Period Change |
||||||||||||||||||||||
| Amount | Percentage of Gross Revenue |
Amount | Percentage of Gross Revenue |
Amount | Percentage | |||||||||||||||||||
| (dollars in thousands) | ||||||||||||||||||||||||
| General and Administrative |
$ | 21,680 | 13.7 | % | $ | 12,169 | 18.7 | % | $ | 9,511 | 78.2 | % | ||||||||||||
General and administrative expense increased by $9.5 million, or 78.2%, from $12.2 million in 2013 to $21.7 million in 2014. The increase was primarily attributable to a $2.7 million increase in salaries and personnel-related costs, as we increased the number of general and administrative personnel in 2014 to support the growth of our business and to prepare to operate as a public company. The personnel-related costs in 2013 also reflects a $1.0 million severance expense incurred in connection with the departure of an executive. We incurred a $1.3 million charge in 2014 related to the unfunded portion of our lines of credit, due to the growth of that product. Furthermore, we experienced a $6.7 million increase in consulting, legal, recruiting, accounting and other miscellaneous expenses in 2014 in preparation to operate as a public company. As a percentage of gross revenue, general and administrative expense decreased from 18.7% in 2013 to 13.7% in 2014.
65
Table of Contents
Comparison of Years Ended December 31, 2013 and 2012
| Year Ended December 31, | ||||||||||||||||||||||||
| Period-to-Period | ||||||||||||||||||||||||
| 2013 | 2012 | Change | ||||||||||||||||||||||
| Amount | Percentage of Gross Revenue |
Amount | Percentage of Gross Revenue |
Amount | Percentage | |||||||||||||||||||
| (dollars in thousands) | ||||||||||||||||||||||||
| Revenue: |
||||||||||||||||||||||||
| Interest income |
$ | 62,941 | 96.5 | % | $ | 25,273 | 98.6 | % | $ | 37,668 | 149.0 | % | ||||||||||||
| Gain on sales of loans |
788 | 1.2 | — | — | 788 | * | ||||||||||||||||||
| Other revenue |
1,520 | 2.3 | 370 | 1.4 | 1,150 | 310.8 | ||||||||||||||||||
|
|
|
|
|
|
|
|
|
|
|
|
|
|||||||||||||
| Gross revenue |
65,249 | 100.0 | 25,643 | 100.0 | 39,606 | 154.5 | ||||||||||||||||||
|
|
|
|
|
|
|
|
|
|
|
|
|
|||||||||||||
| Cost of revenue: |
||||||||||||||||||||||||
| Provision for loan losses |
26,570 | 40.7 | 12,469 | 48.6 | 14,101 | 113.1 | ||||||||||||||||||
| Funding costs |
13,419 | 20.6 | 8,294 | 32.3 | 5,125 | 61.8 | ||||||||||||||||||
|
|
|
|
|
|
|
|
|
|
|
|
|
|||||||||||||
| Total cost of revenue |
39,989 | 61.3 | 20,763 | 81.0 | 19,226 | 92.6 | ||||||||||||||||||
|
|
|
|
|
|
|
|
|
|
|
|
|
|||||||||||||
| Net revenue |
25,260 | 38.7 | 4,880 | 19.0 | 20,380 | 417.6 | ||||||||||||||||||
|
|
|
|
|
|
|
|
|
|
|
|
|
|||||||||||||
| Operating expense: |
||||||||||||||||||||||||
| Sales and marketing |
18,095 | 27.7 | 6,633 | 25.9 | 11,462 | 172.8 | ||||||||||||||||||
| Technology and analytics |
8,760 | 13.4 | 5,001 | 19.5 | 3,759 | 75.2 | ||||||||||||||||||
| Processing and servicing |
5,577 | 8.5 | 2,919 | 11.4 | 2,658 | 91.1 | ||||||||||||||||||
| General and administrative |
12,169 | 18.7 | 6,935 | 27.0 | 5,234 | 75.5 | ||||||||||||||||||
|
|
|
|
|
|
|
|
|
|
|
|
|
|||||||||||||
| Total operating expense |
44,601 | 68.4 | 21,488 | 83.8 | 23,113 | 107.6 | ||||||||||||||||||
|
|
|
|
|
|
|
|
|
|
|
|
|
|||||||||||||
| Loss from operations |
(19,341 | ) | (29.6 | ) | (16,608 | ) | (64.8 | ) | (2,733 | ) | (16.5 | ) | ||||||||||||
|
|
|
|
|
|
|
|
|
|
|
|
|
|||||||||||||
| Other (expense) income: |
||||||||||||||||||||||||
| Interest expense |
(1,276 | ) | (2.0 | ) | (88 | ) | (0.3 | ) | (1,188 | ) | * | |||||||||||||
| Warrant liability fair value adjustment |
(3,739 | ) | (5.7 | ) | (148 | ) | (0.6 | ) | (3,591 | ) | * | |||||||||||||
|
|
|
|
|
|
|
|
|
|
|
|
|
|||||||||||||
| Total Other (expense) income |
(5,015 | ) | (7.7 | ) | (236 | ) | (0.9 | ) | (4,779 | ) | * | |||||||||||||
|
|
|
|
|
|
|
|
|
|
|
|
|
|||||||||||||
| Loss before provision for income taxes |
(24,356 | ) | (37.3 | ) | (16,844 | ) | (65.7 | ) | (7,512 | ) | (44.6 | ) | ||||||||||||
| Provision for income taxes |
— | — | — | — | — | — | ||||||||||||||||||
|
|
|
|
|
|
|
|
|
|
|
|
|
|||||||||||||
| Net loss |
$ | (24,356 | ) | (37.3 | )% | $ | (16,844 | ) | (65.7 | )% | $ | (7,512 | ) | (44.6 | )% | |||||||||
|
|
|
|
|
|
|
|
|
|
|
|
|
|||||||||||||
| * | not meaningful |
66
Table of Contents
Revenue
| Year Ended December 31, | ||||||||||||||||||||||||
| Period-to-Period | ||||||||||||||||||||||||
| 2013 | 2012 | Change | ||||||||||||||||||||||
| Amount | Percentage of Gross Revenue |
Amount | Percentage of Gross Revenue |
Amount | Percentage | |||||||||||||||||||
| (dollars in thousands) | ||||||||||||||||||||||||
| Revenue: |
||||||||||||||||||||||||
| Interest income |
$ | 62,941 | 96.5 | % | $ | 25,273 | 98.6 | % | $ | 37,668 | 149.0 | % | ||||||||||||
| Gain on sales of loans |
788 | 1.2 | — | — | 788 | * | ||||||||||||||||||
| Other revenue |
1,520 | 2.3 | 370 | 1.4 | 1,150 | 310.8 | ||||||||||||||||||
|
|
|
|
|
|
|
|
|
|
|
|
|
|||||||||||||
| Gross revenue |
$ | 65,249 | 100.0 | % | $ | 25,643 | 100.0 | % | $ | 39,606 | 154.5 | % | ||||||||||||
|
|
|
|
|
|
|
|
|
|
|
|
|
|||||||||||||
| * | not meaningful |
Revenue. Gross revenue increased by $39.6 million, or 155%, from $25.6 million in 2012 to $65.2 million in 2013. This growth was primarily attributable to a $37.7 million, or 149%, increase in interest income in 2013 as compared to 2012. This increase was driven primarily by increases in the Average Loans outstanding between these years. During 2013, we had Average Loans outstanding of $147.4 million, compared to $61.4 million of Average Loans outstanding during 2012, representing an increase of 140%. There was also a slight increase in our Effective Interest Yield from 41.2% to 42.7% between these periods.
In addition, in 2013 we sold $17.5 million of loans to third-party institutional investors through our OnDeck Marketplace, resulting in gains of $0.8 million during the period. We launched OnDeck Marketplace in October 2013.
We also experienced an increase of $1.2 million, or 311%, in other revenue in 2013 as compared to 2012. This increase was primarily attributable to an increase in marketing fees from our issuing bank partners.
Cost of Revenue
| Year Ended December 31, | ||||||||||||||||||||||||
| Period-to-Period | ||||||||||||||||||||||||
| 2013 | 2012 | Change | ||||||||||||||||||||||
| Amount | Percentage of Gross Revenue |
Amount | Percentage of Gross Revenue |
Amount | Percentage | |||||||||||||||||||
| (dollars in thousands) | ||||||||||||||||||||||||
| Cost of revenue: |
||||||||||||||||||||||||
| Provision for loan losses |
$ | 26,570 | 40.7 | % | $ | 12,469 | 48.6 | % | $ | 14,101 | 113.1 | % | ||||||||||||
| Funding costs |
13,419 | 20.6 | 8,294 | 32.3 | 5,125 | 61.8 | ||||||||||||||||||
|
|
|
|
|
|
|
|
|
|
|
|
|
|||||||||||||
| Total cost of revenue |
$ | 39,989 | 61.3 | % | $ | 20,763 | 81.0 | % | $ | 19,226 | 92.6 | % | ||||||||||||
|
|
|
|
|
|
|
|
|
|
|
|
|
|||||||||||||
Provision for Loan Losses. Provision for loan losses increased by $14.1 million, or 113%, from $12.5 million in 2012 to $26.6 million in 2013. The increase in provision for loan losses was primarily attributable to the increase in origination volume of term loans during 2013 compared to 2012. In accordance with GAAP, we recognize revenue on loans over their term, but provide for probable credit losses on the loans at the time they are originated and then adjust periodically based on actual performance and changes in loss expectations. As a result, we believe that analyzing the provision for loan losses as a percentage of originations, rather than as a percentage of gross revenue, provides more useful insight into our operating performance. The Provision Rate decreased from 7.2% in 2012 to 6.0% in 2013, attributable to an improvement in credit quality of our loan originations and a $0.9 million reduction in the provision resulting from our first sale of charged-off receivables to a third-party purchaser.
67
Table of Contents
Funding Costs. Funding costs increased by $5.1 million, or 61.8%, from $8.3 million in 2012 to $13.4 million in 2013. The increase in funding costs was primarily attributable to an increase in our aggregate outstanding borrowings during 2013 compared to 2012. The average balance of our funding debt facilities in 2013 was $124.2 million as compared to the average balance of $62.0 million in 2012, an increase of 100%. In addition, we experienced a $1.1 million increase in amortization of debt issuance costs in 2013 as compared 2012, primarily as a result of issuance fees incurred in July 2012 related to a debt facility, as well as the addition of two additional debt facilities in August 2013 and October 2013, respectively. As a percentage of gross revenue, funding costs decreased from 32.3% in 2012 to 20.6% in 2013. The decrease in funding costs as a percentage of gross revenue was primarily the result of more favorable interest rates on our new debt facilities.
Operating Expense
Sales and Marketing
| Year Ended December 31, | ||||||||||||||||||||||||
| Period-to-Period | ||||||||||||||||||||||||
| 2013 | 2012 | Change | ||||||||||||||||||||||
| Amount | Percentage of Gross Revenue |
Amount | Percentage of Gross Revenue |
Amount | Percentage | |||||||||||||||||||
| (dollars in thousands) | ||||||||||||||||||||||||
| Sales and marketing |
$ | 18,095 | 27.7 | % | $ | 6,633 | 25.9 | % | $ | 11,462 | 172.8 | % | ||||||||||||
Sales and marketing expense increased by $11.5 million, or 173%, from $6.6 million in 2012 to $18.1 million in 2013. The increase was primarily attributable to a $7.4 million increase in direct marketing and advertising as we expanded our marketing programs to drive increased customer acquisition. In addition, salaries and personnel-related costs increased by $3.9 million, as we increased the number of sales and marketing personnel to support the growth of our business. As a percentage of gross revenue, sales and marketing expense increased from 25.9% for the year ended December 31, 2012 to 27.7% for the year ended December 31, 2013.
Technology and Analytics
| Year Ended December 31, | ||||||||||||||||||||||||
| Period-to-Period | ||||||||||||||||||||||||
| 2013 | 2012 | Change | ||||||||||||||||||||||
| Amount | Percentage of Gross Revenue |
Amount | Percentage of Gross Revenue |
Amount | Percentage | |||||||||||||||||||
| (dollars in thousands) | ||||||||||||||||||||||||
| Technology and analytics |
$ | 8,760 | 13.4 | % | $ | 5,001 | 19.5 | % | $ | 3,759 | 75.2 | % | ||||||||||||
Technology and analytics expense increased by $3.8 million, or 75.2%, from $5.0 in 2012 to $8.8 million in 2013. The increase was primarily attributable to a $1.8 million increase in salaries and personnel-related costs. During 2013, we increased the number of technology and analytics personnel to continue developing our technology platform and improve upon the algorithms underlying the OnDeck Score. In addition, we experienced a $0.9 million increase in amortization of capitalized internal-use software costs related to our technology platform, and a $0.7 million increase in hardware, software, technology licenses and other costs to support our growth in loan originations and employees. As a percentage of gross revenue, technology and analytics expense decreased from 19.5% in 2012 to 13.4% in 2013.
68
Table of Contents
Processing and Servicing
| Year Ended December 31, | ||||||||||||||||||||||||
| Period-to-Period | ||||||||||||||||||||||||
| 2013 | 2012 | Change | ||||||||||||||||||||||
| Amount | Percentage of Gross Revenue |
Amount | Percentage of Gross Revenue |
Amount | Percentage | |||||||||||||||||||
| (dollars in thousands) | ||||||||||||||||||||||||
| Processing and servicing |
$ | 5,577 | 8.5 | % | $ | 2,919 | 11.4 | % | $ | 2,658 | 91.1 | % | ||||||||||||
Processing and servicing expense increased by $2.7 million, or 91.1%, from $2.9 million in 2012 to $5.6 million in 2013. The increase was primarily attributable to a $1.3 million increase in salaries and personnel-related costs, as we increased the number of processing and servicing personnel to support the increased volume of loan applications and loan servicing requirements. In addition, we experienced a $1.5 million increase in third-party processing costs, credit information and filing fees in 2013 related to the higher volume of term loan and line of credit applications and originations processed. As a percentage of gross revenue, processing and servicing expense decreased from 11.4% in 2012 to 8.5% in 2013.
General and Administrative
| Year Ended December 31, | ||||||||||||||||||||||||
| Period-to-Period | ||||||||||||||||||||||||
| 2013 | 2012 | Change | ||||||||||||||||||||||
| Amount | Percentage of Gross Revenue |
Amount | Percentage of Gross Revenue |
Amount | Percentage | |||||||||||||||||||
| (dollars in thousands) |
||||||||||||||||||||||||
| General and administrative |
$ | 12,169 | 18.7 | % | $ | 6,935 | 27.0 | % | $ | 5,234 | 75.5 | % | ||||||||||||
General and administrative expense increased by $5.2 million, or 75.5%, from $6.9 million in 2012 to $12.2 million in 2013. The increase in general and administrative expense was primarily attributable to a $2.8 million increase in salaries and personnel-related costs, as we increased the number of general and administrative personnel to support our growing business. These 2013 personnel-related costs also included a $1.0 million severance expense incurred in connection with the departure of an executive. Furthermore, we experienced a $2.2 million increase in consulting, legal and other general and administrative expenses in 2013. As a percentage of gross revenue, general and administrative expense decreased from 27.0% in 2012 to 18.7% in 2013.
Liquidity and Capital Resources
Sources of Liquidity
Prior to our initial public offering, we funded our lending activities and operations primarily through private placements of redeemable convertible preferred stock, issuances of debt facilities, cash from operating activities and, beginning in October 2013, the sale of term loans to third-party institutional investors through our OnDeck Marketplace.
Initial Public Offering
On December 22, 2014, we completed our initial public offering, or IPO, in which we sold 11.5 million shares of our common stock to the public at $20 per share. We received net proceeds of $210.0 million from the IPO, net of underwriting discounts, commissions and offering expenses. Upon the closing of the IPO, all shares of outstanding redeemable convertible preferred stock automatically converted into shares of common stock and all warrants for redeemable convertible preferred stock converted to warrants for common stock. At December 31, 2014, substantially all IPO proceeds remained on hand to fund our future operations as more fully described in Item 5 of this report under the subheading “-Use of Proceeds from Sales of Registered Securities.”
69
Table of Contents
Preferred Equity Financings
Since inception, we raised $182.9 million from the sale of redeemable convertible preferred stock to third parties, including $77 million in our Series E financing in February 2014. The funds received from the issuance of our Series E redeemable convertible preferred stock were our primary source of capital for operating expenditures in 2014. We also used a portion of this capital to finance a small percentage of the loan volume we originate.
Current Debt Facilities
The following table summarizes our current debt facilities available for funding our lending activities and our operating expenditures as of December 31, 2014:
| Description |
Maturity Date |
Weighted Average Interest Rate |
Borrowing Capacity |
Principal Outstanding |
||||||||||
| (in millions) | ||||||||||||||
| Funding debt: |
||||||||||||||
| OnDeck Asset Securitization Trust LLC |
May 2018 | 3.4 | % | $ | 175.0 | $ | 175.0 | |||||||
| OnDeck Account Receivables Trust 2013-1 LLC |
September 2016 | 3.4 | % | 167.6 | 105.6 | |||||||||
| On Deck Asset Company, LLC |
October 2016 | 8.4 | % | 50.0 | 32.7 | |||||||||
| On Deck Asset Pool, LLC |
August 2015 | 5.0 | % | 75.0 | 56.7 | |||||||||
| Small Business Asset Fund 2009 LLC |
Various(1) | 7.8 | % | 20.0 | 16.7 | |||||||||
| Partner Synthetic Participation |
Various(2) | Various | 1.2 | 1.2 | ||||||||||
|
|
|
|
|
|||||||||||
| Total funding debt |
$ | 487.6 | $ | 387.9 | ||||||||||
|
|
|
|
|
|||||||||||
| Corporate debt: |
||||||||||||||
| On Deck Capital, Inc. |
October 2015 | 4.5 | % | $ | 20.0 | $ | 12.0 | |||||||
|
|
|
|
|
|||||||||||
| (1) | Maturity dates range from February 2015 through October 2016 |
| (2) | Maturity dates range from January 2015 through December 2016 |
While the lenders under our corporate debt facility and Partner Synthetic Participation have direct recourse to us as the borrower thereunder, lenders to our subsidiaries do not have direct recourse to us.
Funding Debt
Asset-Backed Securitization Facility. A significant portion of our loans at December 31, 2014 were funded through the securitization of small business loans we generated. In May 2014, we, through a wholly-owned subsidiary, accessed the asset-backed securitization market when such wholly-owned subsidiary issued our inaugural series of fixed-rate asset backed notes, or our Series 2014-1 Notes, in a $175 million rated transaction. The Series 2014-1 Notes were issued in two classes: Class A, rated BBB(sf) by DBRS, Inc., in the initial principal amount of $156.7 million and Class B, rated BB(sf) by DBRS, Inc., in the initial principal amount of $18.3 million. The Series 2014-1 Notes and any other series issued under the same indenture are secured by and payable from a revolving pool of small business loans transferred from us to such wholly-owned subsidiary. Loans transferred to such wholly-owned subsidiary are accounted for and included in our consolidated financial statements as if owned by us. At the time of issuance of the Series 2014-1 Notes, the portfolio of loans held by such wholly-owned subsidiary and pledged to secure the Series 2014-1 Notes was approximately $183.2 million. The Class A notes and Class B notes bear interest at 3.15% and 5.68%, respectively, and provide us with a blended interest rate fixed at 3.41%. The Series 2014-1 Notes contain a two-year revolving period, after which principal on the asset-backed securities will be paid sequentially to the Class A and Class B Notes monthly from collections on the loans. The final maturity date of the Series 2014-1 is in May 2018. Monthly payments of interest on the Series 2014-1 Notes began June 17, 2014. As of December 31, 2014, the outstanding principal
70
Table of Contents
balance of the Series 2014-1 Notes was $175.0 million and the principal amount of loans pledged to secure the Series 2014-1 Notes was $187.7 million. Additional series of asset-backed securities are expected to be issued through such wholly-owned subsidiary in the future. Lenders under our asset backed securitization facility do not have direct recourse to us.
Asset-Backed Revolving Debt Facilities. We also fund loans through asset-backed revolving debt facilities. With respect to each such facility, the lenders commit to make loans to one of our wholly-owned subsidiaries, the proceeds of which are used to finance the subsidiary’s purchase of small business loans from us. The revolving pool of small business loans transferred to each such wholly-owned subsidiary serves as collateral for the loans made to the subsidiary borrower under the debt facility. Such transferred loans are accounted for and included in our consolidated financial statements as if owned by us. The subsidiaries repay the borrowings from collections received on the loans. We currently utilize four such asset-backed revolving debt facility structures through four separate subsidiaries. As of December 31, 2014, the aggregate outstanding principal balance under these revolving debt facilities was $211.8 million and the principal amount of loans pledged to secure these revolving debt facilities was $243.2 million. We expect to use additional asset-backed debt facilities, including possible new facilities and increases to existing facilities, as part of our financing strategy to support and expand our business in the future. Lenders under our asset-backed revolving debt facilities do not have direct recourse to us.
Our ability to utilize our asset-backed revolving debt facilities as well as our securitization facility, as described herein, is subject to compliance with various requirements. Such requirements include:
| • | Eligibility Criteria. In order for our loans to be eligible for purchase by the applicable subsidiary, they must meet all applicable eligibility criteria. |
| • | Concentration Limits. The subsidiary collateral pools are subject to certain concentration limits that, if exceeded, would require the applicable subsidiary borrower to add additional collateral. |
| • | Covenants and Other Requirements. The subsidiary facilities contain several financial covenants, portfolio performance covenants and other covenants or requirements that, if not complied with, may result in events of default, the accelerated repayment of amounts owed, often referred to as an early amortization event, and/or the termination of the facility. |
As of December 31, 2014, we were in compliance with all financial and portfolio covenants required per the debt agreements.
Corporate Debt
During 2013, we entered into a revolving debt facility with Square 1 Bank to finance our corporate investments in technology, sales and marketing, processing and servicing and other general corporate expenditures. We amended and restated this revolving debt facility in November 2014 to (i) extend its maturity date to October 30, 2015; (ii) decrease the interest rate to prime plus 1.25%, with a floor of 4.5% per annum; and (iii) increase our borrowing capacity to $20 million. This borrowing arrangement is collateralized by substantially all of our assets. As of December 31, 2014, the outstanding principal balance under this revolving debt facility was $12.0 million.
Our ability to utilize our corporate debt facility as described herein is subject to compliance with various requirements. The corporate debt facility contains financial covenants, portfolio performance covenants and other covenants or requirements that, if not complied with, may result in events of default, the accelerated repayment of amounts owed, and/or the termination of the facility.
OnDeck Marketplace
Our OnDeck Marketplace is a proprietary whole loan sale platform that allows participating third-party institutional investors to directly purchase small business loans from us. Pursuant to a whole loan purchase
71
Table of Contents
agreement, each OnDeck Marketplace participant commits to purchase, on what is known as a forward flow basis, a pre-determined dollar amount of loans that satisfy certain eligibility criteria. The loans are sold to the participant at a pre-determined purchase price above par. We recognize a gain or loss from OnDeck Marketplace loans when sold. The loan sales typically occur within five days after loan origination and are usually conducted daily. We currently act as servicer in exchange for a servicing fee with respect to the loans purchased by the applicable OnDeck Marketplace participant. We expect to continue to add third-party institutional investors who purchase loans through our OnDeck Marketplace as well as increase the amount of loans made available for purchase to our existing investors, growing the OnDeck Marketplace business.
Cash and Cash Equivalents, Loans (Net of Allowance for Loan Losses), and Cash Flows
The following table summarizes our cash and cash equivalents, loans (net of ALLL) and cash flows:
| As of and for the Year Ended December 31, |
||||||||
| 2014 | 2013 | |||||||
| (in thousands) | ||||||||
| Cash and cash equivalents |
$ | 220,433 | $ | 4,670 | ||||
| Loans, net of allowance for loan losses |
$ | 454,303 | $ | 203,078 | ||||
| Cash provided by (used in): |
||||||||
| Operating activities |
$ | 103,196 | $ | 31,385 | ||||
| Investing activities |
$ | (371,570 | ) | $ | (176,729 | ) | ||
| Financing activities |
$ | 484,137 | $ | 142,628 | ||||
Our cash and cash equivalents at December 31, 2014 were held primarily for working capital purposes. We may, from time to time, use excess cash and cash equivalents to fund our lending activities. We do not enter into investments for trading or speculative purposes. Our policy is to invest any cash in excess of our immediate working capital requirements in investments designed to preserve the principal balance and provide liquidity. Accordingly, our excess cash is invested primarily in demand deposit accounts that are currently providing only a minimal return.
Cash Flows
Operating Activities
Cash flows provided by operating activities in 2014 were $103.2 million, which were primarily the result of our cash received from our customers including interest payments as well as the gain on sale of our loans totaling approximately $185.3 million, less the amount of cash we utilized to pay our operating expenses of approximately $67.8 million and $15.0 million we used to pay the interest on our debt (both funding and corporate). During that same period, accounts payable and accrued expenses and other liabilities increased by approximately $7.6 million.
Cash flows provided by operating activities in 2013 were $31.4 million, which were primarily the result of our cash received from our customers including interest payments as well as the gain on sale of our loans totaling approximately $82.6 million, less the amount of cash we utilized to pay our operating expenses of approximately $39.7 million and $10.6 million we used to pay the interest on our debt (both funding and corporate). During that same period, accounts payable and accrued expenses and other liabilities increased by approximately $3.5 million.
Cash flows provided by operating activities in 2012 were $10.3 million, which were primarily the result of our cash received from our customers including interest payments as well as the gain on sale of our loans totaling approximately $34.2 million, less the amount of cash we utilized to pay our operating expenses of approximately
72
Table of Contents
$17.0 million and $6.9 million we used to pay the interest on our debt (both funding and corporate). During that same period, accounts payable and accrued expenses and other liabilities increased by approximately $3.7 million.
Investing Activities
Our investing activities have consisted primarily of funding our term loan and line of credit originations, including payment of associated direct costs and receipt of associated fees, offset by customer repayments of term loans and lines of credit, purchases of property, equipment and software, capitalized internal-use software development costs, proceeds from the sale of term loans which were not specifically identified at origination through our OnDeck Marketplace and changes in restricted cash. Purchases of property, equipment and software and capitalized internal-use software development costs may vary from period to period due to the timing of the expansion of our operations, the addition of employee headcount and the development cycles of our internal-use technology.
For the year ended December 31, 2014, net cash used to fund our investing activities was $371.6 million, and consisted primarily of $311.7 million of loan originations in excess of loan repayments received, $34.3 million of origination costs paid in excess of fees collected and $11.0 million for the purchase of property, equipment and software and capitalized internal-use software development costs. The growth in our loan originations was consistent with the overall increase in revenue during the year. We also restricted more cash as collateral for financing arrangements, resulting in a $14.6 million decrease in unrestricted cash during the year.
For the year ended December 31, 2013, net cash used to fund our investing activities was $176.7 million, and consisted primarily of $142.1 million of loan originations in excess of loan repayments received, $23.2 million of origination costs paid in excess of fees collected and $5.8 million for the purchase of property, equipment and software and capitalized internal-use software development costs. The growth in our loan originations was consistent with the overall increase in revenue during the year. We also restricted more cash as collateral for financing arrangements, resulting in a $5.6 million decrease in unrestricted cash during the year.
For the year ended December 31, 2012, net cash used to fund our investing activities was $67.7 million, and consisted primarily of $53.7 million of loan originations in excess of loan repayments received, $8.4 million of origination costs paid in excess of fees collected and $3.2 million for the purchase of property, equipment and software and capitalized internal-use software development costs. The growth in our loan originations was consistent with the overall increase in revenue during the year. We also restricted more cash as collateral for financing arrangements, resulting in a $2.5 million decrease in unrestricted cash during the year.
Financing Activities
Our financing activities have consisted primarily of the issuance of common stock and redeemable convertible preferred stock and net borrowings from our securitization facility and our revolving debt facilities.
For the year ended December 31, 2014, net cash provided by financing activities was $484.1 million and consisted primarily of $213.8 million in proceeds from our initial public offering, net of underwriting discount and commissions before expenses, $196.6 million in net borrowings from our securitization and debt facilities, primarily associated with the increase in loan originations during the year, and $77.0 million in net proceeds from the issuance of redeemable convertible preferred stock. These amounts were partially offset by $2.2 million of initial public offering costs and payments of debt issuances costs of $5.7 million.
For the year ended December 31, 2013, net cash provided by financing activities was $142.6 million and consisted primarily of $107.0 million in net borrowings from our revolving debt facilities, primarily associated with the increase in loan originations during the year, and $49.7 million in net proceeds from the issuance of
73
Table of Contents
redeemable convertible preferred stock. These amounts were partially offset by $6.3 million used to repurchase redeemable convertible preferred stock from investors and $6.1 million used to repurchase common stock warrants and retire stock options from current and former employees.
For the year ended December 31, 2012, net cash provided by financing activities was $62.0 million and consisted primarily of $60.0 million in net borrowings from our revolving debt facilities, primarily associated with the increase in loan originations during the year, and $4.7 million in net proceeds from the issuance of redeemable convertible preferred stock.
Operating and Capital Expenditure Requirements
We believe that our existing cash balances, together with the available borrowing capacity under our revolving lines of credit, will be sufficient to meet our anticipated cash operating expense and capital expenditure requirements through at least the next 12 months. If we should require additional liquidity, we will seek additional equity or debt financing. The sale of equity may result in dilution to our stockholders and those securities may have rights senior to those of our common shares. If we raise additional funds through the issuance of additional debt, the agreements governing such debt could contain covenants that would restrict our operations and such debt would rank senior to shares of our common stock. We may require additional capital beyond our currently anticipated amounts and additional capital may not be available on reasonable terms, or at all.
Contractual Obligations
Our principal commitments consist of obligations under our outstanding debt facilities and securitization facility and non-cancelable leases for our office space and computer equipment. The following table summarizes these contractual obligations at December 31, 2014. Future events could cause actual payments to differ from these estimates.
| Payment Due by Period | ||||||||||||||||||||
| Total | Less than 1 Year |
1-3 Years | 3-5 Years | More than 5 Years |
||||||||||||||||
| (in thousands) | ||||||||||||||||||||
| Contractual Obligations: |
||||||||||||||||||||
| Long-term debt: |
||||||||||||||||||||
| Funding debt |
$ | 387,956 | $ | 11,560 | $ | 339,938 | $ | 36,458 | $ | — | ||||||||||
| Corporate debt |
12,000 | 12,000 | — | — | — | |||||||||||||||
| Interest payments(1) |
33,173 | 16,833 | 16,340 | — | — | |||||||||||||||
| Capital leases, including interest |
414 | 217 | 197 | — | — | |||||||||||||||
| Operating leases |
21,590 | 3,201 | 8,897 | 4,517 | 4,975 | |||||||||||||||
| Purchase obligations |
2,159 | 909 | 1,250 | — | — | |||||||||||||||
|
|
|
|
|
|
|
|
|
|
|
|||||||||||
| Total contractual obligations |
$ | 457,292 | $ | 44,720 | $ | 366,622 | $ | 40,975 | $ | 4,975 | ||||||||||
|
|
|
|
|
|
|
|
|
|
|
|||||||||||
| (1) | Interest payments on our debt facilities with variable interest rates are calculated using the interest rate as of December 31, 2014. |
The obligations of our subsidiaries for the funding debt described above and related interest payment obligations are structured to be non-recourse to On Deck Capital, Inc.
Off-Balance Sheet Arrangements
As of December 31, 2014, we did not have any off-balance sheet arrangements, as defined in Item 303(a)(4)(ii) of Regulation S-K, such as the use of unconsolidated subsidiaries, structured finance, special purpose entities or variable interest entities.
74
Table of Contents
Critical Accounting Policies and Significant Judgments and Estimates
Our management’s discussion and analysis of our financial condition and results of operations is based on our consolidated financial statements, which have been prepared in accordance with GAAP. The preparation of these consolidated financial statements requires us to make estimates and assumptions that affect the reported amounts of assets and liabilities, disclosure of contingent assets and liabilities at the date of the consolidated financial statements and the reported amounts of revenue and expenses during the reported period. In accordance with GAAP, we base our estimates on historical experience and on various other assumptions that we believe are reasonable under the circumstances. Actual results may differ from these estimates under different assumptions or conditions.
While our significant accounting policies are more fully described in Note 2 of Notes to Consolidated Financial Statements appearing elsewhere in this report, we believe the following accounting policies require the most significant judgment and estimates in the preparation of our consolidated financial statements.
Allowance for Loan Losses
The allowance for loan losses, or ALLL, is established through periodic charges to the provision for loan losses. Loan losses are charged against the ALLL when we believe that the future collection of principal is unlikely. Subsequent recoveries, if any, are credited to the ALLL.
We evaluate the creditworthiness of our portfolio on a pooled basis, due to its composition of small, homogenous loans with similar general credit risk characteristics and diversified among variables including industry and geography. We use a proprietary forecast loss rate at origination for new loans that have not had the opportunity to make payments when they are first funded. The allowance is subjective as it requires material estimates, including such factors as historical trends, known and inherent risks in the loan portfolio, adverse situations that may affect borrowers’ ability to repay and current economic conditions. Other qualitative factors considered may include items such as uncertainties in forecasting and modeling techniques, changes in portfolio composition, seasonality, business conditions and emerging trends. Recovery of the carrying value of loans is dependent to a great extent on conditions that may be beyond our control. Any combination of the aforementioned factors may adversely affect our loan portfolio resulting in increased delinquencies and loan losses and could require additional provisions for credit losses, which could impact future periods. In our opinion, we have provided adequate allowances to absorb probable credit losses inherent in our loan portfolio based on available and relevant information affecting the loan portfolio at each balance sheet date.
Nonaccrual Loans and Charged Off Loans
We consider a loan to be delinquent when the daily or weekly payments are one day past due. We do not recognize interest income on loans that are delinquent and non-paying. Loans are returned to accrual status if they are brought to non-delinquent status or have performed in accordance with the contractual terms for a reasonable period of time and, in our judgment, will continue to make periodic principal and interest payments as scheduled. When we determine it is probable that we will be unable to collect additional principal amounts on the loan the remaining Unpaid Principal Balance is charged off. Generally, charge offs occur after the 90th day of delinquency.
Accrual for Unfunded Loan Commitments
In September 2013, we introduced a line of credit product. Customers may draw on their lines of credit up to defined maximum amounts. As of December 31, 2014 and 2013, our off balance sheet credit exposure related to the undrawn line of credit balances was $28.7 million and $2.2 million, respectively. Similar to our ALLL, we are required to accrue for potential losses related to these unfunded loan commitments at the time the line of credit is originated despite the fact that the customer has not yet drawn these funds. Significant judgment is required to estimate both the amount that may ultimately be drawn on the lines of credit as well as the amount
75
Table of Contents
which would ultimately require a reserve. If additional amounts drawn or the rate of default differ from our estimates, actual expenses could differ significantly from our original estimates. The accrual for unfunded loan commitments was $1.3 million and $13,000 as of December 31, 2014 and 2013, respectively, and is included in general and administrative expense.
Internal-Use Software Development Costs
We capitalize certain costs related to software developed for internal-use, primarily associated with the ongoing development and enhancement of our technology platform and other internal uses. We begin to capitalize our costs to develop software when preliminary development efforts are successfully completed, management has authorized and committed project funding, and it is probable that the project will be completed and the software will be used to perform the function as intended. These costs are amortized on a straight-line basis over the estimated useful life of the related asset, generally three years. Costs incurred prior to meeting these criteria together with costs incurred for training and maintenance are expensed as incurred and recorded in technology and analytics expense on our consolidated statements of operations.
Stock-Based Compensation
We recognize stock-based compensation expense net of an estimated forfeiture rate and therefore only recognize compensation expense for those options expected to vest over the service period of the award. Calculating stock-based compensation expense requires the input of subjective assumptions, including the expected term of the options, stock price volatility, and the pre-vesting forfeiture rate. We estimate the expected life of options granted based on historical exercise patterns, which we utilize as the means of estimating future behavior. Because our stock only became publicly traded in December 2014, we do not have enough data upon which to estimate volatility based on historical performance. We estimate the volatility of our common stock on the date of grant using historical data of public companies we judge to be reasonably comparable, e.g., companies in similar industries that recently completed initial public offerings of comparable size. In the near future, upon achieving a reasonable base of historical performance data, we will utilize historical and/or implied volatility as part of our assumptions.
The assumptions used in calculating the fair value of stock-based awards represent our best estimates, but these estimates involve inherent uncertainties and the application of management judgment. As a result, if factors change and we use different assumptions, our stock-based compensation expense could be materially different in the future. In addition, we are required to estimate the expected pre-vesting award forfeiture rate, and recognize expense only for those options expected to vest. We estimate this forfeiture rate based on historical experience of our stock-based awards that are granted and cancelled before vesting. If our actual forfeiture rate is materially different from our original estimates, the stock-based compensation expense could be significantly different from what we have recorded in the current period. Changes in the estimated forfeiture rate can have a significant effect on reported stock-based compensation expense, as the effect of adjusting the forfeiture rate for all current and previously recognized expense for unvested awards is recognized in the period the forfeiture estimate is changed. If the actual forfeiture rate is higher than the estimated forfeiture rate, then an adjustment will be made to increase the estimated forfeiture rate, which will result in a decrease to the expense recognized in our consolidated financial statements. If the actual forfeiture rate is lower than the estimated forfeiture rate, then an adjustment will be made to lower the estimated forfeiture rate, which will result in an increase to the expense recognized in our consolidated financial statements.
Income Taxes
We recognize deferred tax assets and liabilities for the future tax consequences attributable to differences between the financial statement carrying amounts of existing assets and liabilities and their respective tax bases, as well as for operating loss and tax credit carryforwards. We measure deferred tax assets and liabilities using enacted tax rates expected to apply to taxable income in the years in which we expect to recover or settle those
76
Table of Contents
temporary differences. We recognize the effect of a change in tax rates on deferred tax assets and liabilities in the results of operations in the period that includes the enactment date. We reduce the measurement of a deferred tax asset, if necessary, by a valuation allowance if it is more likely than not that we will not realize some or all of the deferred tax asset.
Uncertain tax positions are recognized only when we believe it is more likely than not that the tax position will be upheld upon examination by the taxing authorities based on the merits of the position. We recognize interest and penalties, if any, related to unrecognized income tax uncertainties in income tax expense. We did not have any accrued interest or penalties associated with uncertain tax positions in any of the reporting periods included in this report.
Recently Issued Accounting Pronouncements and JOBS Act Election
In July 2013, the Financial Accounting Standards Board, or the FASB, issued ASU 2013-11, “Presentation of an Unrecognized Tax Benefit When a Net Operating Loss Carryforward, a Similar Tax Loss, or a Tax Credit Carryforward Exists,” which amends ASC 740, “Income Taxes.” ASU 2013-11 requires entities to present unrecognized tax benefits as a liability and not combine it with deferred tax assets to the extent a net operating loss carryforward, a similar tax loss, or a tax credit carryforward is not available at the reporting date. We adopted this pronouncement effective January 1, 2014 but, due to the nature and amounts of our unrecognized tax benefits and net operating loss carryforward, it has not had a significant impact on our consolidated financial statements.
In May 2014, the FASB issued ASU 2014-09, “Revenue Recognition” which creates ASC 606, “Revenue from Contracts with Customers,” and supersedes ASC 605, “Revenue Recognition.” ASU 2014-09 requires revenue to be recognized at an amount that reflects the consideration the entity expects to be entitled to receive in exchange for those goods or services. This accounting standard is effective for us beginning January 1, 2017. We are currently assessing the impact this accounting standard will have on our consolidated financial statements.
Under the JOBS Act, we meet the definition of an “emerging growth company.” We have irrevocably elected to opt out of the extended transition period for complying with new or revised accounting standards pursuant to Section 107(b) of the JOBS Act.
| Item 7A. | Quantitative and Qualitative Disclosures About Market Risk |
Market risk is the risk of loss to future earnings, values or future cash flows that may result from changes in the price of a financial instrument. The value of a financial instrument may change as a result of changes in interest rates, exchange rates, commodity prices, equity prices and other market changes. We are exposed to market risk related to changes in interest rates and foreign currency exchange rates. We do not use derivative financial instruments for speculative, hedging or trading purposes, although in the future we may enter into interest rate or exchange rate hedging arrangements to manage the risks described below.
Interest Rate Sensitivity
Our cash and cash equivalents as of December 31, 2014 consisted of cash maintained in several FDIC insured operating accounts, which may exceed FDIC insured amounts. Our primary exposure to market risk for our cash and cash equivalents is interest income sensitivity, which is affected by changes in the general level of U.S. interest rates. Given the currently low U.S. interest rates, we generate only a de minimis amount of interest income from these deposits.
We are subject to interest rate risk in connection with borrowings under our debt agreements which are subject to variable interest rates. As of December 31, 2014, we had $207.0 million of outstanding borrowings under debt agreements with variable interest rates. An increase of one percentage point in interest rates would
77
Table of Contents
result in an approximately $1.6 million increase in our annual interest expense on our outstanding borrowings at December 31, 2014. The amount of the increase is less than 1% of our outstanding variable rate debt at that date as a result of interest rate floors. Each additional one percentage point increase in interest rates thereafter would increase our annual interest expense by approximately $2.1 million on our outstanding borrowings as of that date as the floors would no longer apply. Any debt we incur in the future may also bear interest at variable rates. Any increase in interest rates in the future will likely affect our borrowing costs under all of our sources of capital for our lending activities.
Foreign Currency Exchange Risk
Substantially all of our revenue and operating expenses are denominated in U.S. dollars. Therefore, we do not believe that our exposure to foreign currency exchange risk is material to our financial condition, results of operations or cash flows. If a significant portion of our revenue and operating expenses were to become denominated in currencies other than U.S. dollars, we may not be able to effectively manage this risk, and our business, financial condition and results of operations could be adversely affected by translation and by transactional foreign currency.
78
Table of Contents
| Item 8. | Consolidated Financial Statements and Supplementary Data |
| Page | ||||
| Index to Consolidated Financial Statements: |
||||
| 80 | ||||
| 81 | ||||
| 82 | ||||
| Consolidated Statements of Changes in Stockholders’ Equity (Deficit) |
83 | |||
| 84 | ||||
| 86 | ||||
| Financial Statement Schedules: |
||||
| 109 | ||||
79
Table of Contents
Report of Independent Registered Public Accounting Firm
To the Board of Directors and Stockholders of
On Deck Capital, Inc. and subsidiaries
We have audited the accompanying consolidated balance sheets of On Deck Capital, Inc. and subsidiaries (the “Company”) as of December 31, 2014 and 2013, and the related consolidated statements of operations, changes in stockholders’ equity (deficit), and cash flows for each of the three years in the period ended December 31, 2014. These financial statements are the responsibility of the Company’s management. Our responsibility is to express an opinion on these financial statements based on our audits.
We conducted our audits in accordance with the standards of the Public Company Accounting Oversight Board (United States). Those standards require that we plan and perform the audit to obtain reasonable assurance about whether the financial statements are free of material misstatement. We were not engaged to perform an audit of the Company’s internal control over financial reporting. Our audits included consideration of internal control over financial reporting as a basis for designing audit procedures that are appropriate in the circumstances, but not for the purpose of expressing an opinion on the effectiveness of the Company’s internal control over financial reporting. Accordingly, we express no such opinion. An audit also includes examining, on a test basis, evidence supporting the amounts and disclosures in the financial statements, assessing the accounting principles used and significant estimates made by management, and evaluating the overall financial statement presentation. We believe that our audits provide a reasonable basis for our opinion.
In our opinion, the financial statements referred to above present fairly, in all material respects, the consolidated financial position of On Deck Capital, Inc. and subsidiaries at December 31, 2014 and 2013, and the consolidated results of their operations and their cash flows for each of the three years in the period ended December 31, 2014, in conformity with U.S. generally accepted accounting principles.
/s/ Ernst & Young LLP
New York, NY
March 10, 2015
80
Table of Contents
ON DECK CAPITAL, INC. AND SUBSIDIARIES
(in thousands, except share and per share data)
| December 31, | ||||||||
| 2014 | 2013 | |||||||
| Assets |
||||||||
| Cash and cash equivalents |
$ | 220,433 | $ | 4,670 | ||||
| Restricted cash |
29,448 | 14,842 | ||||||
| Loans |
504,107 | 222,521 | ||||||
| Less: Allowance for loan losses |
(49,804 | ) | (19,443 | ) | ||||
|
|
|
|
|
|||||
| Loans, net of allowance for loan losses |
454,303 | 203,078 | ||||||
| Loans held for sale |
1,523 | 1,423 | ||||||
| Deferred debt issuance costs |
5,374 | 2,327 | ||||||
| Property, equipment and software, net |
13,929 | 7,169 | ||||||
| Other assets |
4,622 | 1,941 | ||||||
|
|
|
|
|
|||||
| Total assets |
$ | 729,632 | $ | 235,450 | ||||
|
|
|
|
|
|||||
| Liabilities, redeemable convertible preferred stock and stockholders’ equity (deficit) |
||||||||
| Liabilities: |
||||||||
| Accounts payable |
$ | 4,360 | $ | 1,161 | ||||
| Interest payable |
819 | 1,120 | ||||||
| Funding debt |
387,928 | 188,297 | ||||||
| Corporate debt |
12,000 | 15,000 | ||||||
| Warrant liability |
— | 4,446 | ||||||
| Accrued expenses and other liabilities |
13,920 | 6,563 | ||||||
|
|
|
|
|
|||||
| Total liabilities |
419,027 | 216,587 | ||||||
|
|
|
|
|
|||||
| Commitments and contingencies (Note 15) |
||||||||
| Redeemable convertible preferred stock: |
||||||||
| Series A preferred stock, par value $0.005, 0 and 5,953,360 shares authorized; 0 and 4,438,662 shares issued and outstanding at December 31, 2014 and 2013, respectively |
— | 2,559 | ||||||
| Series B preferred stock, par value $0.005, 0 and 11,355,162 shares authorized; 0 and 10,755,262 shares issued and outstanding at December 31, 2014 and 2013, respectively |
— | 22,918 | ||||||
| Series C preferred stock, par value $0.005, 0 and 9,735,538 shares authorized, 0 and 9,735,538 shares issued and outstanding at December 31, 2014 and 2013 |
— | 24,749 | ||||||
| Series C-1 preferred stock, par value $0.005, 0 and 3,000,000 shares authorized; 0 and 1,701,112 shares issued and outstanding at December 31, 2014 and 2013 |
— | 5,401 | ||||||
| Series D preferred stock, par value $0.005, 0 and 14,467,756 shares authorized; 0 and 14,467,756 shares issued and outstanding at December 31, 2014 and 2013 |
— | 62,716 | ||||||
|
|
|
|
|
|||||
| Total redeemable convertible preferred stock |
— | 118,343 | ||||||
|
|
|
|
|
|||||
| Stockholders’ equity (deficit): |
||||||||
| Common stock—$0.005 par value, 1,000,000,000 and 63,929,322 shares authorized and 69,031,719 and 4,467,614 shares issued and outstanding at December 31, 2014 and 2013, respectively |
360 | 38 | ||||||
| Treasury stock—at cost |
(5,656 | ) | (5,656 | ) | ||||
| Additional paid-in capital |
442,969 | 1,614 | ||||||
| Accumulated deficit |
(127,068 | ) | (95,476 | ) | ||||
|
|
|
|
|
|||||
| Total stockholders’ equity (deficit) |
310,605 | (99,480 | ) | |||||
|
|
|
|
|
|||||
| Total liabilities, redeemable convertible preferred stock and stockholders’ equity (deficit) |
$ | 729,632 | $ | 235,450 | ||||
|
|
|
|
|
|||||
The accompanying notes are an integral part of these consolidated financial statements.
81
Table of Contents
ON DECK CAPITAL, INC. AND SUBSIDIARIES
Consolidated Statements of Operations
(in thousands, except share and per share data)
| Year Ended December 31, | ||||||||||||
| 2014 | 2013 | 2012 | ||||||||||
| Revenue: |
||||||||||||
| Interest income |
$ | 145,275 | $ | 62,941 | $ | 25,273 | ||||||
| Gain on sales of loans |
8,823 | 788 | — | |||||||||
| Other revenue |
3,966 | 1,520 | 370 | |||||||||
|
|
|
|
|
|
|
|||||||
| Gross revenue |
158,064 | 65,249 | 25,643 | |||||||||
|
|
|
|
|
|
|
|||||||
| Cost of revenue: |
||||||||||||
| Provision for loan losses |
67,432 | 26,570 | 12,469 | |||||||||
| Funding costs |
17,200 | 13,419 | 8,294 | |||||||||
|
|
|
|
|
|
|
|||||||
| Total cost of revenue |
84,632 | 39,989 | 20,763 | |||||||||
|
|
|
|
|
|
|
|||||||
| Net revenue |
73,432 | 25,260 | 4,880 | |||||||||
|
|
|
|
|
|
|
|||||||
| Operating expense: |
||||||||||||
| Sales and marketing |
33,201 | 18,095 | 6,633 | |||||||||
| Technology and analytics |
17,399 | 8,760 | 5,001 | |||||||||
| Processing and servicing |
8,230 | 5,577 | 2,919 | |||||||||
| General and administrative |
21,680 | 12,169 | 6,935 | |||||||||
|
|
|
|
|
|
|
|||||||
| Total operating expense |
80,510 | 44,601 | 21,488 | |||||||||
|
|
|
|
|
|
|
|||||||
| Loss from operations |
(7,078 | ) | (19,341 | ) | (16,608 | ) | ||||||
|
|
|
|
|
|
|
|||||||
| Other expense: |
||||||||||||
| Interest expense |
(398 | ) | (1,276 | ) | (88 | ) | ||||||
| Warrant liability fair value adjustment |
(11,232 | ) | (3,739 | ) | (148 | ) | ||||||
|
|
|
|
|
|
|
|||||||
| Total other expense |
(11,630 | ) | (5,015 | ) | (236 | ) | ||||||
|
|
|
|
|
|
|
|||||||
| Loss before provision for income taxes |
(18,708 | ) | (24,356 | ) | (16,844 | ) | ||||||
| Provision for income taxes |
— | — | — | |||||||||
|
|
|
|
|
|
|
|||||||
| Net loss |
(18,708 | ) | (24,356 | ) | (16,844 | ) | ||||||
| Series A and Series B preferred stock redemptions |
— | (5,254 | ) | — | ||||||||
| Accretion of dividends on redeemable convertible preferred stock |
(12,884 | ) | (7,470 | ) | (3,440 | ) | ||||||
|
|
|
|
|
|
|
|||||||
| Net loss attributable to common stockholders |
$ | (31,592 | ) | $ | (37,080 | ) | $ | (20,284 | ) | |||
|
|
|
|
|
|
|
|||||||
| Net loss per common share: |
||||||||||||
| Basic and diluted |
$ | (0.60 | ) | $ | (8.64 | ) | $ | (4.27 | ) | |||
|
|
|
|
|
|
|
|||||||
| Weighted-average common shares outstanding: |
||||||||||||
| Basic and diluted |
52,556,998 | 4,292,026 | 4,750,440 | |||||||||
|
|
|
|
|
|
|
|||||||
The accompanying notes are an integral part of these consolidated financial statements.
82
Table of Contents
ON DECK CAPITAL, INC. AND SUBSIDIARIES
Consolidated Statements of Changes in Stockholders’ Equity (Deficit)
(in thousands, except share data)
| Common Stock | Additional Paid-in Capital |
Accumulated Deficit |
Treasury Stock |
Total Stockholders’ Equity (Deficit) |
||||||||||||||||||||
| Shares | Amount | |||||||||||||||||||||||
| Balance—January 1, 2012 |
6,184,140 | $ | 31 | $ | 467 | $ | (37,162 | ) | $ | (479 | ) | $ | (37,143 | ) | ||||||||||
| Stock-based compensation |
— | — | 244 | — | — | 244 | ||||||||||||||||||
| Exercise of warrants |
20,776 | — | 6 | — | — | 6 | ||||||||||||||||||
| Exercise of stock options |
72,442 | — | 22 | — | (4 | ) | 18 | |||||||||||||||||
| Accretion of dividends on redeemable convertible preferred stock |
— | — | — | (3,440 | ) | — | (3,440 | ) | ||||||||||||||||
| Net loss |
— | — | — | (16,844 | ) | — | (16,844 | ) | ||||||||||||||||
|
|
|
|
|
|
|
|
|
|
|
|
|
|||||||||||||
| Balance—December 31, 2012 |
6,277,358 | $ | 31 | $ | 739 | $ | (57,446 | ) | $ | (483 | ) | $ | (57,159 | ) | ||||||||||
| Stock-based compensation |
— | — | 448 | — | — | 448 | ||||||||||||||||||
| Redemption of preferred stock—Series A and B |
— | — | — | (5,254 | ) | — | (5,254 | ) | ||||||||||||||||
| Issuance of common stock warrant |
— | — | 45 | — | — | 45 | ||||||||||||||||||
| Redemption of warrants |
— | — | — | (950 | ) | — | (950 | ) | ||||||||||||||||
| Exercise of stock options |
1,227,206 | 7 | 382 | — | — | 389 | ||||||||||||||||||
| Redemption of common stock |
— | — | — | — | (5,173 | ) | (5,173 | ) | ||||||||||||||||
| Accretion of dividends on redeemable convertible preferred stock |
— | — | — | (7,470 | ) | — | (7,470 | ) | ||||||||||||||||
| Net loss |
— | — | — | (24,356 | ) | — | (24,356 | ) | ||||||||||||||||
|
|
|
|
|
|
|
|
|
|
|
|
|
|||||||||||||
| Balance—December 31, 2013 |
7,504,564 | $ | 38 | $ | 1,614 | $ | (95,476 | ) | $ | (5,656 | ) | $ | (99,480 | ) | ||||||||||
| Issuance of common stock in connection with initial public offering, net of underwriting discounts |
11,500,000 | 57 | 209,933 | — | — | 209,990 | ||||||||||||||||||
| Stock-based compensation |
— | — | 3,095 | — | — | 3,095 | ||||||||||||||||||
| Conversion of preferred stock warrants to common stock warrants upon IPO |
— | — | 4,912 | — | — | 4,912 | ||||||||||||||||||
| Conversion of preferred stock to common stock |
47,457,356 | 237 | 221,267 | — | — | 221,504 | ||||||||||||||||||
| Vesting of restricted stock units |
11,667 | — | 6 | — | — | 6 | ||||||||||||||||||
| Issuance of common stock warrant |
— | — | 64 | — | — | 64 | ||||||||||||||||||
| Exercise of stock options and warrants |
5,596,181 | 28 | 2,078 | — | — | 2,106 | ||||||||||||||||||
| Accretion of dividends on redeemable convertible preferred stock |
— | — | — | (12,884 | ) | — | (12,884 | ) | ||||||||||||||||
| Net loss |
— | — | — | (18,708 | ) | — | (18,708 | ) | ||||||||||||||||
|
|
|
|
|
|
|
|
|
|
|
|
|
|||||||||||||
| Balance—December 31, 2014 |
72,069,768 | $ | 360 | $ | 442,969 | $ | (127,068 | ) | $ | (5,656 | ) | $ | 310,605 | |||||||||||
|
|
|
|
|
|
|
|
|
|
|
|
|
|||||||||||||
The accompanying notes are an integral part of these consolidated financial statements.
83
Table of Contents
ON DECK CAPITAL, INC. AND SUBSIDIARIES
Consolidated Statements of Cash Flows
(in thousands)
| Year Ended December 31, | ||||||||||||
| 2014 | 2013 | 2012 | ||||||||||
| Cash flows from operating activities |
||||||||||||
| Net loss |
$ | (18,708 | ) | $ | (24,356 | ) | $ | (16,844 | ) | |||
| Adjustments to reconcile net loss to net cash provided by operating activities: |
||||||||||||
| Provision for loan losses |
67,432 | 26,570 | 12,469 | |||||||||
| Depreciation and amortization |
4,071 | 2,645 | 1,545 | |||||||||
| Amortization of debt issuance costs |
2,676 | 2,184 | 1,068 | |||||||||
| Stock-based compensation |
2,842 | 438 | 229 | |||||||||
| Loss on disposal of fixed assets |
516 | — | — | |||||||||
| Debt discount |
— | 959 | — | |||||||||
| Preferred stock warrant issuance and warrant liability fair value adjustment |
11,232 | 3,739 | 524 | |||||||||
| Amortization of net deferred origination costs |
27,267 | 17,322 | 8,574 | |||||||||
| Unfunded loan commitment reserve |
1,253 | — | — | |||||||||
| Common stock warrant issuance |
64 | 45 | — | |||||||||
| Changes in operating assets and liabilities: |
||||||||||||
| Other assets |
(2,681 | ) | (143 | ) | (1,253 | ) | ||||||
| Accounts payable |
1,599 | (570 | ) | 1,430 | ||||||||
| Interest payable |
(301 | ) | (53 | ) | 286 | |||||||
| Accrued expenses and other liabilities |
6,034 | 4,028 | 2,228 | |||||||||
| Originations of loans held for sale |
(140,578 | ) | (18,937 | ) | — | |||||||
| Sales of loans held for sale |
139,131 | 17,514 | — | |||||||||
| Repayments of term loans held for sale |
1,347 | — | — | |||||||||
|
|
|
|
|
|
|
|||||||
| Net cash provided by operating activities |
103,196 | 31,385 | 10,256 | |||||||||
|
|
|
|
|
|
|
|||||||
| Cash flows from investing activities |
||||||||||||
| Change in restricted cash |
(14,606 | ) | (5,647 | ) | (2,459 | ) | ||||||
| Purchases of property, equipment and software |
(7,576 | ) | (3,705 | ) | (1,843 | ) | ||||||
| Capitalized internal-use software |
(3,467 | ) | (2,093 | ) | (1,336 | ) | ||||||
| Originations of term loans and lines of credit, excluding rollovers into new originations |
(858,297 | ) | (380,357 | ) | (152,498 | ) | ||||||
| Capitalized net deferred origination costs |
(34,253 | ) | (23,180 | ) | (8,377 | ) | ||||||
| Principal repayments of term loans and lines of credit |
546,629 | 238,253 | 98,806 | |||||||||
|
|
|
|
|
|
|
|||||||
| Net cash used in investing activities |
(371,570 | ) | (176,729 | ) | (67,707 | ) | ||||||
|
|
|
|
|
|
|
|||||||
| Cash flows from financing activities |
||||||||||||
| Proceeds from exercise of stock options and warrants |
4,625 | 389 | 24 | |||||||||
| Proceeds from public offering, net of underwriting discount |
213,843 | — | — | |||||||||
| Payments of initial public offering costs |
(2,239 | ) | — | — | ||||||||
| Redemption of common stock and warrants |
— | (6,123 | ) | — | ||||||||
| Proceeds from the issuance of redeemable convertible preferred stock |
77,000 | 49,717 | 4,675 | |||||||||
| Redemption of preferred stock |
— | (6,282 | ) | — | ||||||||
| Proceeds from the issuance of funding debt |
472,242 | 201,860 | 158,677 | |||||||||
| Proceeds from the issuance of corporate debt |
9,000 | 15,000 | 8,000 | |||||||||
84
Table of Contents
| Year Ended December 31, | ||||||||||||
| 2014 | 2013 | 2012 | ||||||||||
| Payments of debt issuance costs |
(5,723 | ) | (2,071 | ) | (2,720 | ) | ||||||
| Repayment of funding debt |
(272,611 | ) | (109,862 | ) | (106,644 | ) | ||||||
| Repayment of corporate debt |
(12,000 | ) | — | — | ||||||||
|
|
|
|
|
|
|
|||||||
| Net cash provided by financing activities |
484,137 | 142,628 | 62,012 | |||||||||
|
|
|
|
|
|
|
|||||||
| Net increase (decrease) in cash and cash equivalents |
215,763 | (2,716 | ) | 4,561 | ||||||||
| Cash and cash equivalents at beginning of year |
4,670 | 7,386 | 2,825 | |||||||||
|
|
|
|
|
|
|
|||||||
| Cash and cash equivalents at end of year |
$ | 220,433 | $ | 4,670 | $ | 7,386 | ||||||
|
|
|
|
|
|
|
|||||||
| Supplemental disclosure of other cash flow information |
||||||||||||
| Cash paid for interest |
$ | 14,968 | $ | 10,616 | $ | 6,954 | ||||||
|
|
|
|
|
|
|
|||||||
| Supplemental disclosures of non-cash investing and financing activities |
||||||||||||
| Conversion of redeemable convertible preferred stock to common stock |
$ | 221,504 | $ | — | $ | — | ||||||
|
|
|
|
|
|
|
|||||||
| Unpaid offering expenses charged to equity |
$ | 1,670 | $ | — | $ | — | ||||||
|
|
|
|
|
|
|
|||||||
| Stock-based compensation included in capitalized internal-use software |
$ | 253 | $ | 10 | $ | 15 | ||||||
|
|
|
|
|
|
|
|||||||
| Unpaid principal balance of term loans rolled into new originations |
$ | 158,876 | $ | 59,623 | $ | 20,748 | ||||||
|
|
|
|
|
|
|
|||||||
| Conversion of debt to redeemable convertible preferred stock |
$ | — | $ | 8,959 | $ | — | ||||||
|
|
|
|
|
|
|
|||||||
| Accretion of dividends on redeemable convertible preferred stock |
$ | 12,884 | $ | 7,470 | $ | 3,440 | ||||||
|
|
|
|
|
|
|
|||||||
The accompanying notes are an integral part of these consolidated financial statements.
85
Table of Contents
ON DECK CAPITAL, INC. AND SUBSIDIARIES
Notes to Consolidated Financial Statements
1. Organization
On Deck Capital, Inc.’s principal activity is providing financing products to small businesses located throughout the United States, including term loans (typically three to twenty-four months in duration for $5,000 to $250,000) and lines of credit. We use technology and analytics to aggregate data about a business and then quickly and efficiently analyze the creditworthiness of the business using our proprietary credit-scoring model.
We originate most of the loans in our portfolio and also purchase loans from BofI Federal Bank (“BofI”). We subsequently transfer most loans into one of our wholly-owned subsidiaries or sell them through OnDeck Marketplace. As of December 31, 2014, we have five active wholly owned subsidiaries related to asset-backed revolving debt and securitization facilities: Small Business Asset Fund 2009 LLC (“SBAF”), OnDeck Account Receivables Trust 2013-1 LLC (“ODART”), On Deck Asset Company LLC (“ODAC”), OnDeck Asset Securitization Trust LLC (“ODAST”) and OnDeck Asset Pool, LLC (“ODAP”) (collectively, the “Subsidiaries”). Subsidiaries acquire loans we originate or purchase and hold them for the sole benefit of the lenders of each subsidiary. On June 18, 2014, the subsidiaries that were dormant, SBLP II LLC (“SBLP II”) and Fund for ODC Receivables (“FOR”), were dissolved. Each subsidiary has specific criteria for the loans that can be transferred into the entity, such as term, size and industry concentrations.
2. Summary of Significant Accounting Policies
Basis of Presentation and Principles of Consolidation
We prepare our consolidated financial statements in accordance with accounting principles generally accepted in the United States of America (“U.S. GAAP”). The accompanying consolidated financial statements include all of our accounts as well as the accounts of our wholly owned subsidiaries: SBAF, SBLP II, ODART, ODAC, ODAST, FOR and ODAP. All intercompany transactions and accounts have been eliminated in consolidation.
Segment Reporting
Operating segments are defined as components of an enterprise for which discrete financial information is available that is evaluated regularly by the chief operating decision maker (“CODM”) for purposes of allocating resources and evaluating financial performance. Our CODM reviews financial information presented on a consolidated basis for purposes of allocating resources and evaluating financial performance. As such, our operations constitute a single operating segment and one reportable segment. Substantially all revenue was generated and all assets were held in the United States during the years ended December 31, 2014, 2013 and 2012.
Reclassifications
Certain reclassifications have been made to the prior year amounts to conform to the current year presentation. We corrected the classification of amortization of net deferred origination costs to be included as operating activities in the consolidated statement of cash flows. Previously, such amounts were presented as an investing activity.
Use of Estimates
The preparation of financial statements in conformity with U.S. GAAP requires us to make estimates and assumptions that affect the reported amounts in the consolidated financial statements and accompanying notes.
86
Table of Contents
Significant estimates include allowance for loan losses, valuation of warrants, stock-based compensation expense, servicing assets/liabilities, capitalized software development costs, the useful lives of long-lived assets and valuation allowance for deferred tax assets. We base our estimates on historical experience, current events and other factors we believe to be reasonable under the circumstances. These estimates and assumptions are inherently subjective in nature; actual results may differ from these estimates and assumptions.
Comprehensive Loss
There are no significant items of comprehensive loss other than net loss for all periods presented.
Cash and Cash Equivalents
Cash and cash equivalents include checking, savings and money market accounts. We consider all highly liquid investments with original maturities of three months or less at the time of purchase to be cash equivalents.
Restricted Cash
Restricted cash represents funds held in demand deposit accounts as reserves on certain debt facilities and as collateral for BofI transactions. We have no ability to draw on the restricted accounts.
Loans and Loans Held for Sale
Loans
We originate term loans and lines of credit (collectively, “loans”) that are generally short term in nature, and require daily or weekly repayments. Through origination of term loans, we have the right to place a lien on the general assets of the customer by filing a UCC claim, which may not be perfected. Loans are carried at amortized cost, reduced by a valuation allowance for loan losses estimated as of the balance sheet dates. In accordance with Accounting Standards Codification (“ASC”) Subtopic 310-20, Nonrefundable Fees and Other Costs, the amortized cost of a loan is equal to the unpaid principal balance, plus net deferred origination costs. Net deferred origination costs are comprised of certain direct origination costs, net of all loan origination fees received. Loan origination fees include fees charged to the borrowers that increase the loan’s effective interest yield and other fees charged related to origination. Direct origination costs in excess of loan origination fees received are included in the loan balance and amortized over the term of the loan using the effective interest method. Loan origination costs are limited to direct costs attributable to originating a loan, including commissions and personnel costs directly related to the time spent by those individuals performing activities related to loan origination. Additionally, when a term loan is originated in conjunction with the extinguishment of a previously issued term loan, we determine whether this is a new loan or a modification to an existing loan in accordance with ASC 310-20. If accounted for as a new loan, rather than a modification, any remaining unamortized net deferred costs are recognized when the new loan is originated. We have both the ability and intent to hold these loans to maturity.
Loans Held for Sale
In October 2013 we started OnDeck Marketplace, a program whereby we originate and sell certain loans to third-party institutional investors and retain servicing rights. We sell whole loans to purchasers in exchange for a cash payment. Determination to hold or sell a loan is made typically within five business days of initial funding. Loans held for sale are recorded at the lower of cost or market until the loans are sold. Cost of loans held for sale is inclusive of unpaid principal plus net deferred origination costs.
Since we continue to service the loans we sell, we evaluate whether a servicing asset or liability has been incurred. We estimate the fair value of the loan servicing asset or liability considering the contractual servicing
87
Table of Contents
fee revenue, adequate compensation for our servicing obligation, the non-delinquent principal balances of loans and projected servicing revenues over the remaining lives of the loans. As of December 31, 2014 and 2013, we serviced an unpaid principal amount of $79.7 million and $16.0 million of term loans for others, respectively, and determined that no servicing asset or liability is necessary.
Allowance for Loan Losses
The allowance for loan losses (“ALLL”) is established through periodic charges to the provision for loan losses. Loan losses are charged against the ALLL when we believe that the future collection of principal is unlikely. Subsequent recoveries, if any, are credited to the ALLL.
We evaluate the creditworthiness of our portfolio on a pooled basis due to its composition of small, homogenous loans with similar general credit risk characteristics and diversification among variables including industry and geography. We use a proprietary forecast loss rate at origination for new loans that have not had the opportunity to make payments when they are first funded. The forecasted loss rate is updated daily to reflect actual loan performance and the underlying ALLL model is updated monthly to reflect our assumptions. The allowance is subjective as it requires material estimates, including such factors as historical trends, known and inherent risks in the loan portfolio, adverse situations that may affect borrowers’ ability to repay and current economic conditions. Other qualitative factors considered may include items such as uncertainties in forecasting and modeling techniques, changes in portfolio composition, seasonality, business conditions and emerging trends. Recovery of the carrying value of loans is dependent to a great extent on conditions that may be beyond our control. Any combination of the aforementioned factors may adversely affect our loan portfolio resulting in increased delinquencies and loan losses and could require additional provisions for credit losses, which could impact future periods. In our opinion, we have provided adequate allowances to absorb probable credit losses inherent in our loan portfolio based on available and relevant information affecting the loan portfolio at each balance sheet date.
Accrual for Unfunded Loan Commitments and Off-Balance Sheet Credit Exposures
In September 2013, we introduced a line of credit product. We estimate probable losses on unfunded loan commitments similarly to the ALLL process and include the calculated amount in accrued expenses and other liabilities. We believe the accrual for unfunded loan commitments is sufficient to absorb estimated probable losses related to these unfunded credit commitments. The determination of the adequacy of the accrual is based on evaluations of the unfunded credit commitments, including an assessment of the probability of commitment usage, credit risk factors for lines of credit outstanding to these customers and the terms and expiration dates of the unfunded credit commitments. As of December 31, 2014 and 2013, our off-balance sheet credit exposure related to the undrawn line of credit balances was $28.7 million and $2.2 million, respectively. The related accrual for unfunded loan commitments was $1.3 million and $13,000 as of December 31, 2014 and 2013, respectively. Net adjustments to the accrual for unfunded loan commitments are included in general and administrative expenses.
Accrual for Third-Party Representations
As a component of the loan sale agreements, we have made certain representations to third parties that purchase loans. Any significant estimated post-sale obligations or contingent obligations to the purchaser of the loans, such as fraudulent loan repurchase obligations or excess loss indemnification obligations, would be accrued if probable and estimable in accordance with ASC 450, Contingencies. There are no restricted assets related to these agreements. As of December 31, 2014 and 2013, we have not incurred any significant losses and or material liability for probable obligations requiring accrual.
88
Table of Contents
Nonaccrual Loans, Restructured Loans and Charged Off Loans
We consider a loan to be delinquent when the daily or weekly payments are one day past due. We stop accruing interest income on loans that are delinquent and non-paying. Loans are returned to accrual status if they are brought to non-delinquent status or have performed in accordance with the contractual terms for a reasonable period of time and, in our judgment, will continue to make periodic principal and interest payments as scheduled.
Certain borrowers who have experienced or are expected to experience financial difficulty may not be able to maintain their regularly scheduled and contractually required payments. Following discussions with OnDeck, such borrowers may temporarily make reduced payments and/or make payments on a less frequent basis than contractually required. As part of our effort to maximize loan recoverability and as a temporary accommodation to the borrower, we may voluntarily forebear from pursuing our legal rights and remedies under the applicable loan agreement, which we do not modify and which remains in full force and effect.
Generally, after the 90th day of delinquency, we will make an initial assessment of whether an individual loan should be charged off based on payment status and information gathered through collection efforts. A loan is charged off when we determine it is probable that we will be unable to collect all of the remaining principal payments.
Deferred Debt Issuance Costs and Debt
We borrow from various lenders to finance our lending activities and general corporate operations. Costs incurred in connection with financings, such as banker fees, origination fees and legal fees, are classified as deferred debt issuance costs. We capitalize these costs and amortize them over the expected life of the related financing agreements. The related fees are expensed immediately upon early extinguishment of the debt. In a debt modification, the initial issuance costs and any additional fees incurred as a result of the modification are deferred over the term of the modified agreement.
Interest expense is calculated using the effective interest method. Deferred debt issuance costs are amortized using the effective interest method for term debt and the straight-line method for revolving lines of credit. Interest expense and the amortization of deferred debt issuance costs incurred on debt used to fund loan originations are presented as funding costs in our consolidated statements of operations. Interest expense and the amortization of deferred debt issuance costs incurred on debt used to fund general corporate operations are recorded as interest expense, a component of other expense, in our consolidated statements of operations.
Property, Equipment and Software
Property, equipment and software consists of computer and office equipment, purchased software, capitalized internal-use software costs and leasehold improvements. Property, equipment and software are stated at cost less accumulated depreciation and amortization. Depreciation and amortization expense are recognized over the estimated useful lives of the assets using the straight-line method. Leasehold improvements are amortized over the shorter of the terms of the respective leases or the estimated lives of the improvements.
In accordance with ASC subtopic 350-40, Internal-Use Software, the costs to develop software for our website and other internal uses are capitalized beginning when the preliminary project stage is completed, we have authorized funding and it is probable that the project will be completed and the software will be used to perform the function intended. Capitalized internal-use software costs primarily include salaries and payroll-related costs for employees directly involved in the development efforts, software licenses acquired and fees paid to outside consultants.
Software development costs incurred prior to meeting the criteria for capitalization and costs incurred for training and maintenance are expensed as incurred. Certain upgrades and enhancements to existing software that result in additional functionality are capitalized. Capitalized software development costs are amortized using the straight-line method over their expected useful lives, generally three years.
89
Table of Contents
We review long-lived assets for impairment whenever events or changes in circumstances indicate that the carrying values of those assets may not be recoverable. An impairment loss will be recognized only if the carrying value of a long-lived asset is not recoverable and exceeds its fair market value. If there is an indication of impairment, we will estimate the future cash flows (undiscounted and without interest charges) expected from the use of the asset and its eventual disposition. If an impairment is determined to exist, the impairment loss will be measured as the amount by which the carrying value of the asset exceeds its fair value and recorded in the period the determination is made. Assets held for sale are reported at the lower of the carrying amount or fair value, less costs to sell. During 2014 and 2013, no impairments of long-lived assets were deemed necessary.
Redeemable Convertible Preferred Stock
Our redeemable convertible preferred stock was redeemable at the option of the holder after the passage of time and, therefore, had been classified outside of permanent equity in accordance with the SEC Staff Accounting Bulletin (“SAB”) Topic 3C, Redeemable Preferred Stock. We made periodic accretions to the carrying amount of the redeemable convertible preferred stock so that the carrying amount would equal the redemption amount at the earliest redemption date, February 25, 2019. When stock warrants are exercised for shares of redeemable convertible preferred stock and the fair value of the redeemable preferred stock on the date of exercise of the warrants is more than the redemption amount of the preferred stock, the carrying amount of the preferred stock is recorded at its fair value on the date of issuance on the balance sheet. All redeemable convertible preferred stock automatically converted into shares of common stock upon closing of our initial public offering (“IPO”) in December 2014. As of December 31, 2014 we had no redeemable convertible preferred stock outstanding.
Stock Warrants for Shares of Preferred Stock
We issued warrants for certain series of our redeemable convertible preferred stock to third parties in connection with certain agreements. As the warrant holders had the right to demand their preferred shares to be settled in cash after the passage of time, we recorded the warrants as liabilities and at each balance sheet date. We valued the warrants using the Black-Scholes-Merton Option Pricing Model. Any change in warrant value was recorded through a warrant liability fair value adjustment in our consolidated statements of operations. All warrants for shares of preferred stock automatically converted into warrants for shares of common stock upon closing of our IPO in December 2014. Upon conversion, the warrant liability was converted to permanent equity as a component of additional paid-in capital.
The fair value of warrants issued in connection with new debt agreements is treated as a debt discount and reduces the initial carrying value of the related debt. The discount is amortized as interest expense and is accreted to the debt’s carrying value using the effective interest method over the term of the debt. The fair value of warrants issued in association with consulting agreements and banking arrangements is treated as consulting expense and bank fees, respectively, and are recorded as operating expenses in the statements of operations. Agreements and arrangements with periods of performance are amortized over the contractual period of the services. In connection with our IPO in December 2014, all preferred stock warrants converted to warrants for shares of common stock which are not subject to fair value adjustments.
Revenue Recognition
Interest Income
We generate revenue primarily through interest and origination fees earned on loans originated and held to maturity.
We recognize interest and origination fee revenue over the terms of the underlying loans using the effective interest method. Origination fees collected but not yet recognized as revenue are netted with direct origination costs and presented as a component of loans in our consolidated balance sheets.
90
Table of Contents
Historically, borrowers who elected to prepay term loans were required to pay future interest and fees that would have been assessed had the term loan been repaid in accordance with its original agreement. Beginning in December 2014, certain term loans may be eligible for a discount of future interest and fees that would have been assessed had the loan been repaid in accordance with its original agreement.
Gain on Sales of Loans
In October 2013, we started a program whereby we originate and sell certain loans to third-party purchasers and retain servicing rights. We account for the loan sales in accordance with ASC Topic 860, Transfers and Servicing, which states that a transfer of a financial asset, a group of financial assets, or a participating interest in a financial asset is accounted for as a sale if all of the following conditions are met:
| 1. | The financial assets are isolated from the transferor and its consolidated affiliates as well as its creditors. |
| 2. | The transferee or beneficial interest holders have the right to pledge or exchange the transferred financial assets. |
| 3. | The transferor does not maintain effective control of the transferred assets. |
For the year ended December 31, 2014 and 2013, all sales met the requirements for sale treatment under the guidance for ASC Topic 860, Transfers and Servicing. We record the gain or loss on the sale of a loan at the sale date in an amount equal to the proceeds received less outstanding principal and net deferred origination costs.
Other Revenue
We retain servicing rights on sold loans and recognize servicing revenue for servicing sold loans as a component of other revenue. For the years ended December 31, 2014 and 2013 we earned $0.9 million and $1,000 servicing revenue, respectively. In accordance with ASC Topic 860, Transfers and Servicing, we have not recognized a servicing asset or liability as the benefits of servicing are just adequate to compensate us for our servicing responsibilities. Other revenue also includes marketing fees earned from our issuing bank partners, which are recognized as the related services are provided, and monthly fees charged to customers for our line of credit products.
Stock-Based Compensation
In accordance with ASC Topic 718, Compensation—Stock Compensation, all stock-based compensation made to employees is measured based on the grant-date fair value of the awards and recognized as compensation expense on a straight-line basis over the period during which the option holder is required to perform services in exchange for the award (the vesting period). We use the Black-Scholes-Merton Option Pricing Model to estimate the fair value of stock options. The use of the option valuation model requires subjective assumptions, including the fair value of our common stock, the expected term of the option and the expected stock price volatility based on peer companies. Additionally, the recognition of stock-based compensation expense requires an estimation of the number of options that will ultimately vest and the number of options that will ultimately be forfeited.
Advertising Costs
Advertising costs are expensed as incurred and are included in the sales and marketing line item in our consolidated statements of operations. For the years ended December 31, 2014 and 2013, advertising costs totaled $14.4 million and $7.2 million, respectively.
Income Taxes
In accordance with ASC 470, Income Taxes, we recognize deferred tax assets and liabilities for the expected future tax consequences of temporary differences between the financial reporting and tax basis of assets and
91
Table of Contents
liabilities, as well as for operating loss and tax credit carryforwards. Deferred tax assets and liabilities are measured using the tax rates that are expected to apply to taxable income for the years in which those tax assets and liabilities are expected to be realized or settled. Valuation allowances are recorded to reduce deferred tax assets to the amount we believe is more likely than not to be realized.
Uncertain tax positions are recognized only when we believe it is more likely than not that the tax position will be upheld on examination by the taxing authorities based on the merits of the position. We recognize interest and penalties, if any, related to uncertain tax positions in income tax expense. We did not have any accrued interest or penalties associated with uncertain tax positions as of December 31, 2014 and 2013.
We file income tax returns in the United States for federal, state and local jurisdictions. We are no longer subject to U.S. federal, certain states, and local income tax examinations for years prior to 2011, with certain states no longer subject for years prior to 2010, although carryforward attributes that were generated prior to 2011 may still be adjusted upon examination by the Internal Revenue Service if used in a future period. No income tax returns are currently under examination by taxing authorities.
Fair Value Measurement
In accordance with ASC 820, Fair Value Measurement, we use a three-tier fair value hierarchy to classify and disclose all assets and liabilities measured at fair value on a recurring basis, as well as assets and liabilities measured at fair value on a non-recurring basis, in periods subsequent to their initial measurement. The hierarchy requires us to use observable inputs when available, and to minimize the use of unobservable inputs when determining fair value. The three tiers are defined as follows:
Level 1: Quoted prices in active markets or liabilities in active markets for identical assets or liabilities, accessible by us at the measurement date.
Level 2: Quoted prices for similar assets or liabilities in active markets, or quoted prices for identical or similar assets or liabilities in markets that are not active, or other observable inputs other than quoted prices.
Level 3: Unobservable inputs for assets or liabilities for which there is little or no market data, which require us to develop our own assumptions. These unobservable assumptions reflect estimates of inputs that market participants would use in pricing the asset or liability. Valuation techniques include the use of option pricing models, discounted cash flows, or similar techniques, which incorporate our own estimates of assumptions that market participants would use in pricing the instrument or valuations that require significant management judgment or estimation.
A financial instrument’s categorization within the valuation hierarchy is based on the lowest level of input that is significant to the fair value measurement.
Basic and Diluted Net Loss per Common Share
Basic net loss per common share is computed by dividing net loss per share available to common stockholders by the weighted average number of common shares outstanding for the period and excludes the effects of any potentially dilutive securities. We compute net loss per common share using the two-class method required for participating securities. We consider all series of redeemable convertible preferred stock to be participating securities due to their cumulative dividend rights. In accordance with the two-class method, earnings allocated to these participating securities, which include participation rights in undistributed earnings, are subtracted from net income or loss to determine total undistributed earnings or losses to be allocated to common stockholders. All participating securities are excluded from basic weighted-average common shares outstanding. Upon closing of our IPO, all redeemable convertible preferred stock was converted to common stock and became included in our weighted average common shares outstanding.
92
Table of Contents
Diluted net loss per common share includes the dilution that would occur upon the exercise or conversion of all potentially dilutive securities into common stock using the “treasury stock” or “if converted” methods, as applicable. Diluted net loss per common share is computed under the two-class method by using the weighted-average number of common shares outstanding, plus, for periods with net income attributable to common stockholders, the potential dilutive effects of stock options, warrants and convertible preferred stock. In addition, we analyze the potential dilutive effect of the outstanding participating securities under the “if converted” method when calculating diluted earnings per share in which it is assumed that the outstanding participating securities convert into common stock at the beginning of the period. We report the more dilutive of the approaches (two-class or “if converted”) as our diluted net income per share during the period. Due to net losses for the years ended December 31, 2014, 2013 and 2012, basic and diluted net loss per common share were the same, as the effect of potentially dilutive securities was anti-dilutive.
Recently Adopted Accounting Pronouncements
In July 2013, the FASB issued ASU 2013-11, Presentation of an Unrecognized Tax Benefit When a Net Operating Loss Carryforward, a Similar Tax Loss, or a Tax Credit Carryforward Exists, which amends ASC Topic 740, Income Taxes. ASU 2013-11 requires entities to present unrecognized tax benefits as a liability and not combine it with deferred tax assets to the extent a net operating loss carryforward, a similar tax loss, or a tax credit carryforward is not available at the reporting date. We adopted this accounting standard effective January 1, 2014, but it did not have a significant impact on our consolidated financial statements.
Recent Accounting Pronouncements Not Yet Adopted
In May 2014, the FASB issued ASU 2014-09, Revenue Recognition, which creates ASC 606, Revenue from Contracts with Customers, and supersedes ASC 605, Revenue Recognition. ASU 2014-09 requires revenue to be recognized at an amount that reflects the consideration to which the entity expects to be entitled in exchange for those goods or services. This accounting standard is effective for interim and annual periods beginning after December 15, 2016. We are currently assessing the impact this accounting standard will have on our consolidated financial statements.
3. Net Loss Per Common Share
Basic and diluted net loss per common share is calculated as follows (in thousands, except share and per share data):
| Year Ended December 31, | ||||||||||||
| 2014 | 2013 | 2012 | ||||||||||
| Numerator: |
||||||||||||
| Net loss |
$ | (18,708 | ) | $ | (24,356 | ) | $ | (16,844 | ) | |||
| Less: Series A and B preferred stock redemptions |
— | (5,254 | ) | — | ||||||||
| Less: Accretion of dividends on the redeemable convertible preferred stock |
(12,884 | ) | (7,470 | ) | (3,440 | ) | ||||||
|
|
|
|
|
|
|
|||||||
| Net loss attributable to common stockholders |
$ | (31,592 | ) | $ | (37,080 | ) | $ | (20,284 | ) | |||
|
|
|
|
|
|
|
|||||||
| Denominator: |
||||||||||||
| Weighted-average common shares outstanding, basic and diluted |
52,556,998 | 4,292,026 | 4,750,440 | |||||||||
|
|
|
|
|
|
|
|||||||
| Net loss per common share, basic and diluted |
$ | (0.60 | ) | $ | (8.64 | ) | $ | (4.27 | ) | |||
|
|
|
|
|
|
|
|||||||
93
Table of Contents
Diluted loss per common share is the same as basic loss per common share for all periods presented because the effects of potentially dilutive items were anti-dilutive given our net losses. The following common share equivalent securities have been excluded from the calculation of weighted-average common shares outstanding because the effect is anti-dilutive for the periods presented:
| Year Ended December 31, | ||||||||||||
| 2014 | 2013 | 2012 | ||||||||||
| Anti-Dilutive Common Share Equivalents |
||||||||||||
| Redeemable convertible preferred stock: |
||||||||||||
| Series A |
— | 4,438,662 | 5,953,360 | |||||||||
| Series B |
— | 10,755,262 | 10,846,722 | |||||||||
| Series C |
— | 9,735,538 | 9,735,538 | |||||||||
| Series C-1 |
— | 1,701,112 | 1,701,112 | |||||||||
| Series D |
— | 14,467,756 | — | |||||||||
| Series E |
— | — | — | |||||||||
| Warrants to purchase redeemable convertible preferred stock |
— | 1,393,768 | 1,393,768 | |||||||||
| Warrants to purchase common stock |
2,516,288 | 4,057,066 | 4,443,634 | |||||||||
| Restricted stock units |
88,418 | — | — | |||||||||
| Stock options |
10,371,469 | 7,814,970 | 6,342,792 | |||||||||
|
|
|
|
|
|
|
|||||||
| Total anti-dilutive common share equivalents |
12,976,175 | 54,364,134 | 40,416,926 | |||||||||
|
|
|
|
|
|
|
|||||||
4. Interest Income
Interest income was comprised of the following components for the year ended December 31 (in thousands):
| 2014 | 2013 | 2012 | ||||||||||
| Interest on unpaid principal balance |
$ | 172,542 | $ | 51,706 | 15,082 | |||||||
| Amortization of net deferred origination costs |
(27,267 | ) | 11,235 | 10,191 | ||||||||
|
|
|
|
|
|
|
|||||||
| Total interest income |
$ | 145,275 | $ | 62,941 | 25,273 | |||||||
|
|
|
|
|
|
|
|||||||
5. Loans, Allowance for Loan Losses and Loans Held for Sale
Loans consisted of the following as of December 31 (in thousands):
| 2014 | 2013 | |||||||
| Term loans |
$ | 466,386 | $ | 213,570 | ||||
| Lines of credit |
24,177 | 2,396 | ||||||
|
|
|
|
|
|||||
| Total unpaid principal balance |
490,563 | 215,966 | ||||||
| Net deferred origination costs |
13,544 | 6,555 | ||||||
|
|
|
|
|
|||||
| Total loans |
$ | 504,107 | $ | 222,521 | ||||
|
|
|
|
|
|||||
94
Table of Contents
The activity in the allowance for loan losses for the years ended December 31, 2014, 2013 and 2012 consisted of the following (in thousands):
| 2014 | 2013 | 2012 | ||||||||||
| Balance at January 1 |
$ | 19,443 | $ | 9,288 | $ | 3,662 | ||||||
| Provision for loan losses |
67,432 | 26,570 | 12,469 | |||||||||
| Loans charged off |
(39,638 | ) | (17,651 | ) | (6,881 | ) | ||||||
| Recoveries of loans previously charged off |
2,567 | 1,236 | 38 | |||||||||
|
|
|
|
|
|
|
|||||||
| Allowance for loan losses at December 31 |
$ | 49,804 | $ | 19,443 | $ | 9,288 | ||||||
|
|
|
|
|
|
|
|||||||
We originate most of the loans in our portfolio and also purchase loans from issuing bank partners. During the years ended December 31, 2014, 2013 and 2012 we purchased loans in the amount of $180.8 million, $73.5 million and $36.6 million, respectively.
In the third quarter of 2013, we began selling previously charged-off loans to a third-party debt collector. The proceeds from these sales are recorded as a component of the recoveries of loans previously charged off. For the years ended December 31, 2014 and 2013, previously charged-off loans sold accounted for $1.7 million and $1.0 million of recoveries of loans previously charged off, respectively.
Below is a table that illustrates the loan balance related to non-delinquent, paying and non-paying delinquent loans and the corresponding allowance for loan losses as of December 31, 2014 and 2013 (in thousands):
| 2014 | 2013 | |||||||
| Unpaid Principal Balance |
Unpaid Principal Balance |
|||||||
| Non-delinquent loans |
$ | 430,689 | $ | 191,849 | ||||
| Delinquent: paying (accrual status) |
40,049 | 17,473 | ||||||
| Delinquent: non-paying (non-accrual status) |
19,825 | 6,644 | ||||||
|
|
|
|
|
|||||
| Total |
$ | 490,563 | $ | 215,966 | ||||
|
|
|
|
|
|||||
The balance of the allowance for loan losses for non-delinquent loans was $20.5 million and $9.8 million as of December 31, 2014 and December 31, 2013, respectively, while the balance of the allowance for loan losses for delinquent loans was $29.3 million and $9.6 million as of December 31, 2014 and December 31, 2013, respectively.
The following table shows an aging analysis of term loans by delinquency status as of December 31, 2014 and 2013 (in thousands):
| 2014 | 2013 | |||||||
| By delinquency status: |
||||||||
| Non-delinquent loans |
$ | 430,689 | $ | 191,849 | ||||
| 1-14 calendar days past due |
23,954 | 7,658 | ||||||
| 15-29 calendar days past due |
9,462 | 4,237 | ||||||
| 30-59 calendar days past due |
10,707 | 5,206 | ||||||
| 60-89 calendar days past due |
7,724 | 3,648 | ||||||
| 90 + calendar days past due |
8,027 | 3,368 | ||||||
|
|
|
|
|
|||||
| Total unpaid principal balance |
$ | 490,563 | $ | 215,966 | ||||
|
|
|
|
|
|||||
95
Table of Contents
Loans Held for Sale
Loans held for sale consisted of the following as of December 31 (in thousands):
| 2014 | 2013 | |||||||
| Loans held for sale |
$ | 1,483 | $ | 1,320 | ||||
| Net deferred origination costs |
40 | 103 | ||||||
|
|
|
|
|
|||||
| Loans held for sale, net |
$ | 1,523 | $ | 1,423 | ||||
|
|
|
|
|
|||||
6. Property, Equipment and Software, net
Property, equipment and software, net, consisted of the following as of December 31 (in thousands):
| Estimated Useful Life |
2014 | 2013 | ||||||||||
| Computer/office equipment |
12 – 36 months | $ | 7,249 | $ | 2,419 | |||||||
| Capitalized internal-use software |
36 months | 10,599 | 7,628 | |||||||||
| Leasehold improvements |
Life of lease | 6,343 | 3,702 | |||||||||
|
|
|
|
|
|||||||||
| Total property, equipment and software, at cost |
24,191 | 13,749 | ||||||||||
| Less accumulated depreciation and amortization |
(10,262 | ) | (6,580 | ) | ||||||||
|
|
|
|
|
|||||||||
| Property, equipment and software, net |
$ | 13,929 | $ | 7,169 | ||||||||
|
|
|
|
|
|||||||||
Amortization expense on capitalized internal-use software costs was $1.8 million, $1.2 million and $1.0 million for the years ended December 31, 2014, 2013 and 2012, respectively, and is included in accumulated depreciation and amortization in our consolidated statements of operations.
7. Debt
The following table summarizes our outstanding debt as of December 31, 2014 and December 31, 2013:
| Description |
Type | Maturity Date | Interest Rate at December 31, 2014 |
December 31, 2014 |
December 31, 2013 |
|||||||||||
| (in thousands) | ||||||||||||||||
| Funding Debt: |
||||||||||||||||
| ODAST Agreement |
Securitization Facility | May 2018 | 3.4% | $ | 174,972 | $ | — | |||||||||
| ODART Agreement |
Revolving | September 2016 | 3.4% | 105,598 | 52,253 | |||||||||||
| ODAC Agreement |
Revolving | October 2016 | 8.4% | 32,733 | 24,374 | |||||||||||
| ODAP Agreement |
Revolving | August 2016 | 5.0% | 56,686 | — | |||||||||||
| SBAF Agreement |
Revolving | Various(1) | 7.8% | 16,740 | 18,680 | |||||||||||
| SBLP II Agreement |
Revolving | July 2014 (Extinguished April 2014) |
7.8% | — | 84,990 | |||||||||||
| SSL&SA Agreement |
Revolving | July 2014 (Extinguished February 2014) |
16.0% | — | 8,000 | |||||||||||
| Partner Synthetic Participations |
Term | Various(2) | Various | 1,199 | — | |||||||||||
|
|
|
|
|
|||||||||||||
| 387,928 | 188,297 | |||||||||||||||
| Corporate Debt: |
||||||||||||||||
| Square 1 Agreement |
Revolving | October 2015 | 4.5% | 12,000 | 15,000 | |||||||||||
|
|
|
|
|
|||||||||||||
| $ | 399,928 | $ | 203,297 | |||||||||||||
|
|
|
|
|
|||||||||||||
| (1) | Maturity dates range from February 2015 through October 2016 |
| (2) | Maturity dates range from January 2015 through December 2016 |
96
Table of Contents
As of December 31, 2014, future maturities of our borrowings were as follows:
| 2015 |
$ | 23,560 | ||
| 2016 |
252,437 | |||
| 2017 |
87,500 | |||
| 2018 |
36,431 | |||
| 2019 |
— | |||
| Thereafter |
— | |||
|
|
|
|||
| Total |
$ | 399,928 |
In October 2013, ODAC entered into a $25 million revolving credit agreement (the “ODAC Agreement”). On January 2, 2014, ODAC entered into a second amendment of the ODAC Agreement increasing the financing limit of the ODAC Agreement from $25 million to $50 million bearing an interest rate of LIBOR plus 8.25%. On December 19, 2014, ODAC entered into an amendment of the ODAC Agreement thereby extending the facility maturity date from October 17, 2015 to October 17, 2016. No other significant terms were modified under the amendment.
In August 2013, and as subsequently amended, we entered into an $8 million senior subordinated loan and security agreement (“SSL&SA”) with certain entities collectively referred to as SF Capital. On January 22, 2014, we entered into a second amendment with SF Capital, increasing the credit limit available on SSL&SA from $8 million to $18 million with borrowings up to $8 million bearing the original interest rate of 16% and all borrowings in excess of $8 million bearing an interest rate of 12%. No other significant terms were modified under this amendment.
On February 27, 2014, approximately $30 million of the proceeds of the issuance of the Series E redeemable convertible preferred shares was used to repay the SSL&SA in full and portions of certain other debt payable.
On April 7, 2014, the SBLP II Agreement was terminated and the amount outstanding of $63.3 million was paid in full to the lenders. Approximately $54 million of eligible loans were transferred to ODART and were purchased with the existing ODART Agreement. The remaining balance due was paid by OnDeck.
On May 8, 2014, ODAST entered into a $175 million securitization agreement with Deutsche Bank Securities (“Deutsche Bank”) as administrative agent. Of the total commitment, Deutsche Bank allowed for $156.7 million of Class A (primary group of lenders) asset backed notes and $18.3 million of Class B (subordinate group of lenders) asset backed notes. The agreement requires pooled loans to be transferred from us to ODAST with a minimum aggregate principal balance of approximately $183.2 million. Class A and Class B commitments bear interest at 3.15% and 5.68%, respectively. Monthly payments of interest were due beginning June 17, 2014 and principal and interest are due beginning in June 2016, with the final payment occurring in May 2018.
In August 2014, ODAP entered into a $75 million revolving line of credit with Jefferies Mortgage Funding, LLC. The commitment bears interest at 4% plus the greater of 1% or LIBOR, and matures in August 2016.
On September 15, 2014, we entered into an amendment of the ODART agreement increasing the revolving credit agreement from $111.8 million to $167.6 million. Of the total available credit, the Class A commitments increased from $100 million to $150 million and the Class B commitments increased from $11.8 million to $17.6 million. Class A commitments bear interest at cost of funds rate plus 3%. Class B commitments bear interest at 7.25% plus the greater of 1% or LIBOR. The facility maturity date was also extended from August 16, 2015 to September 15, 2016.
97
Table of Contents
The Square 1 Agreement was amended and restated on November 3, 2014 increasing the credit limit from $15 million to $20 million, reducing the applicable interest rate from 5.0% to prime plus 1.25% with a 4.5% floor per annum and extending the commitment termination date to October 30, 2015.
As of December 31, 2014, we were in compliance with all financial and portfolio covenants required per the debt agreements, as amended.
8. Warrant Liability
In conjunction with certain consulting agreements, we issued warrants to purchase shares of Series E redeemable convertible preferred stock (“Series E warrants”). The holders were entitled to purchase 30,000 shares of Series E shares for $14.71 per share. The warrants are exercisable upon vesting through the earlier of ten years after issuance (various dates through June 6, 2024), or two years after closing a qualified initial public offering, which occurred in December 2014. As the Series E warrants vest, they will be recorded as liabilities in the accompanying consolidated balance sheets and subsequently adjusted to fair value each period because they are currently exercisable into redeemable securities. For the years ended December 31, 2014 and 2013, changes in the fair value of these and previously issued warrants were recognized in our consolidated statements of operations as warrant liability fair value adjustment. In connection with our IPO in December 2014 all warrants for shares of preferred stock converted to warrants for shares of common stock which are not subject to fair value adjustments.
In September 2014, in conjunction with a general marketing agreement, we issued a warrant to purchase shares of common stock (“common stock warrant”) to a strategic partner. As of December 31, 2014, the holder was entitled to purchase up to 2,206,496 shares of common stock for $10.66 per share. The number of exercisable shares is dependent upon performance conditions. The warrant is exercisable upon vesting through the earlier of ten years after issuance, September 29, 2024, or one year after the termination of the agreement. As the performance conditions are met, the common stock warrant will be recorded as a liability in our consolidated balance sheets and as sales and marketing expense in our consolidated statements of operations. The warrant liability will be adjusted to fair value each period and recognized in our consolidated statements of operations as warrant liability fair value adjustment. For the year ended December 31, 2014, no performance conditions had been met and therefore no expense or liability has been recorded.
9. Redeemable Convertible Preferred Stock
The following table summarizes the price per share and authorized number of shares of redeemable convertible preferred stock as of December 31, 2014 and 2013:
| Original Issue Price per Share |
Number of Shares Authorized | |||||||||||
| Series Name |
2014 | 2013 | ||||||||||
| Series A |
$ | 0.364500 | — | 5,953,360 | ||||||||
| Series B |
1.475100 | — | 11,355,162 | |||||||||
| Series C |
2.100000 | — | 9,735,538 | |||||||||
| Series C-1 |
2.762900 | — | 3,000,000 | |||||||||
| Series D |
4.158875 | — | 14,467,756 | |||||||||
| Series E |
14.71000 | — | — | |||||||||
Series A, Series B, Series C, Series C-1, Series D and Series E redeemable convertible preferred stock are collectively referred to as the “preferred stock” and individually as the “Series A”, “Series B”, “Series C”, “Series C-1”, “Series D” and “Series E”. Each of the prices per share is referred to as the original issue price and excludes the cost of issuance. Any costs incurred in connection with the issuance of various classes of the preferred stock have been recorded as a reduction of the carrying amount.
98
Table of Contents
The following table summarizes the number of shares of preferred stock outstanding as of December 31, 2014 and 2013 by original issuance dates:
| Issuance Date | Number of Shares Outstanding | |||||||||
| Series Name |
December 31, 2014 | December 31, 2013 | ||||||||
| Series A |
August 11, 2006 | — | 2,780,896 | |||||||
| Series A |
October 27, 2006 | — | 1,147,078 | |||||||
| Series A |
February 14, 2007 | — | 510,688 | |||||||
|
|
|
|
|
|||||||
| Total Series A |
— | 4,438,662 | ||||||||
|
|
|
|
|
|||||||
| Series B |
December 3, 2007 | — | 5,772,550 | |||||||
| Series B |
April 2, 2008 | — | 338,960 | |||||||
| Series B |
May 9, 2008 | — | 576,232 | |||||||
| Series B |
February 4, 2009 | — | 169,480 | |||||||
| Series B |
March 18, 2009 | — | 3,766,946 | |||||||
| Series B |
March 19, 2009 | — | 131,094 | |||||||
|
|
|
|
|
|||||||
| Total Series B |
— | 10,755,262 | ||||||||
|
|
|
|
|
|||||||
| Series C |
December 20, 2010 | — | 7,068,870 | |||||||
| Series C |
April 6, 2011 | — | 2,666,668 | |||||||
|
|
|
|
|
|||||||
| Total Series C |
— | 9,735,538 | ||||||||
|
|
|
|
|
|||||||
| Total Series C-1 |
January 26, 2012 | — | 1,701,112 | |||||||
|
|
|
|
|
|||||||
| Series D |
February 7, 2013 | — | 10,380,116 | |||||||
| Series D |
April 19, 2013 | — | 4,087,640 | |||||||
|
|
|
|
|
|||||||
| Total Series D |
— | 14,467,756 | ||||||||
|
|
|
|
|
|||||||
| Series E |
February 27, 2014 | — | — | |||||||
|
|
|
|
|
|||||||
99
Table of Contents
The following table presents a summary of activity for the preferred stock issued and outstanding for the years ended December 31, 2014, 2013 and 2012 (in thousands):
| Series A | Series B | Series C | Series C-1 | Series D | Series E | Total Amount |
||||||||||||||||||||||
| Balance, January 1, 2012 |
$ | 3,076 | $ | 20,558 | $ | 21,477 | $ | — | $ | — | $ | — | $ | 45,111 | ||||||||||||||
| Issuance of preferred stock |
— | — | — | 4,675 | — | — | 4,675 | |||||||||||||||||||||
| Accretion of dividends on preferred stock |
174 | 1,280 | 1,636 | 350 | — | — | 3,440 | |||||||||||||||||||||
|
|
|
|
|
|
|
|
|
|
|
|
|
|
|
|||||||||||||||
| Balance, December 31, 2012 |
3,250 | 21,838 | 23,113 | 5,025 | — | — | 53,226 | |||||||||||||||||||||
| Redemption of preferred stock(1) |
(835 | ) | (193 | ) | — | — | — | — | (1,028 | ) | ||||||||||||||||||
| Issuance of preferred stock(2) |
— | — | — | — | 58,675 | — | 58,675 | |||||||||||||||||||||
| Accretion of dividends on preferred stock |
144 | 1,273 | 1,636 | 376 | 4,041 | — | 7,470 | |||||||||||||||||||||
|
|
|
|
|
|
|
|
|
|
|
|
|
|
|
|||||||||||||||
| Balance, December 31, 2013 |
$ | 2,559 | $ | 22,918 | $ | 24,749 | $ | 5,401 | $ | 62,716 | $ | — | $ | 118,343 | ||||||||||||||
| Issuance of preferred stock(2) |
— | — | — | — | — | 76,985 | 76,985 | |||||||||||||||||||||
| Exercise of preferred stock warrants |
— | 5,982 | — | 7,225 | — | 85 | 13,292 | |||||||||||||||||||||
| Accretion of dividends on preferred stock |
124 | 1,240 | 1,570 | 413 | 4,619 | 4,918 | 12,884 | |||||||||||||||||||||
| Conversion of preferred stock to common stock in connection with initial public offering |
(2,683 | ) | (30,140 | ) | (26,319 | ) | (13,039 | ) | (67,335 | ) | (81,988 | ) | (221,504 | ) | ||||||||||||||
|
|
|
|
|
|
|
|
|
|
|
|
|
|
|
|||||||||||||||
| Balance, December 31, 2014 |
$ | — | $ | — | $ | — | $ | — | $ | — | $ | — | $ | — | ||||||||||||||
|
|
|
|
|
|
|
|
|
|
|
|
|
|
|
|||||||||||||||
| (1) | During 2013, we redeemed 1,514,698 shares of Series A and 91,460 shares of Series B stock held by investors. The differential between the redemption price and the carrying value of the shares of $5.3 million was charged to accumulated deficit in accordance with accounting for distinguishing liabilities from equity. |
| (2) | Includes the conversion of a convertible note. |
Dividends
Each series of preferred stock contained a cumulative dividend rate of 8% per share. No dividends were declared as of December 31, 2014 and 2013 or through the date of issuing these financial statements. Cumulative dividends were payable in the event of redemption. In addition to the preferential cumulative dividends, holders of preferred stock were entitled to receive, on an if-converted basis, any declared or paid dividends on our common stock.
Conversion
Each series of redeemable convertible preferred stock was mandatorily convertible upon the close of an IPO or upon written consent of the majority of holders, as defined within each preferred stock agreement. All shares of preferred stock were automatically converted to shares of common on a 1:1 basis.
Liquidation
In the event of any liquidation, dissolution, merger or consolidation (resulting in the common and preferred stockholders’ loss of majority), disposition or transfer of assets, or winding up of the company, whether
100
Table of Contents
voluntary or involuntary (a “Liquidation Event”), and after all declared dividends have been paid, holders of certain series of preferred stock were entitled to participate in the distribution of remaining company assets along with common stockholders with variable participation rights per series. These liquidation participation rights were nullified upon the conversion of the preferred shares to common shares which occurred upon the close of our IPO.
Redemption Rights
Each series of preferred stock was redeemable at the election of its holders. The redemption price was equal to any unpaid cumulative dividends and other dividends plus the original issue price. In connection with our IPO in December 2014, all preferred stock was converted to shares of common stock. At December 31, 2014, there were no preferred shares outstanding.
Voting Rights
Certain preferred series holders had rights to elect a variable number of members of the board of directors. At December 31, 2014, there were no preferred shares outstanding.
10. Stockholders’ Equity
Initial Public Offering
On December 22, 2014, we completed our IPO in which we sold 11.5 million shares of our common stock to the public at $20 per share. We received net proceeds of $210.0 million from the IPO, net of underwriting discounts, commissions and offering expenses. Upon the closing of the IPO, all shares of outstanding redeemable convertible preferred stock automatically converted into shares of common stock and all warrants for redeemable convertible preferred stock converted to warrants for common stock.
Retroactive Stock Split
On November 26, 2014, we further amended our amended and restated certificate of incorporation effecting a 2-for-1 forward stock split of our common stock and redeemable convertible preferred stock. The stock split caused an adjustment to the par value of common and preferred stock, from $0.01 per share to $0.005 per share, and a doubling of the number of authorized and outstanding shares of such stock. As a result of the stock split, the share amounts under our employee incentive plan and warrant agreements with third parties were also adjusted accordingly. All numbers of shares and per share data in the accompanying consolidated financial statements and related notes have been retroactively adjusted to reflect this stock split for all periods presented.
11. Income Tax
Our financial statements include a total income tax expense of $0 on net losses of $18.7 million, $24.4 million and $16.9 million for the years ended December 31, 2014, 2013 and 2012, respectively. A reconciliation of the difference between the provision for income taxes and income taxes at the statutory U.S. federal income tax rate is as follows for the years ended December 31:
| 2014 | 2013 | 2012 | ||||||||||
| Federal statutory rate |
34.0 | % | 34.0 | % | 34.0 | % | ||||||
| Effect of: |
||||||||||||
| Change in valuation allowance |
(17.0 | )% | (36.7 | )% | (40.6 | )% | ||||||
| Federal effect of change in state and local tax valuation allowance |
1.7 | % | 6.3 | % | 6.7 | % | ||||||
| Permanent items |
(18.7 | )% | (3.6 | )% | (0.1 | )% | ||||||
|
|
|
|
|
|
|
|||||||
| Income tax provision effective rate |
0.0 | % | 0.0 | % | 0.0 | % | ||||||
|
|
|
|
|
|
|
|||||||
101
Table of Contents
The significant components of our deferred tax asset were as follows as of December 31 (in thousands):
| 2014 | 2013 | |||||||
| Deferred tax assets relating to: |
||||||||
| Net operating loss carryforwards |
$ | 12,271 | $ | 18,686 | ||||
| Loan loss reserve |
18,989 | 7,684 | ||||||
| Property, equipment and software |
(214 | ) | 458 | |||||
| Imputed interest income |
444 | — | ||||||
| Loss on sublease |
145 | — | ||||||
| Deferred rent |
664 | 386 | ||||||
| Miscellaneous items |
4 | 2 | ||||||
|
|
|
|
|
|||||
| Total gross deferred tax assets |
32,303 | 27,216 | ||||||
|
|
|
|
|
|||||
| Deferred tax liabilities: |
||||||||
| Internally developed software |
1,049 | 908 | ||||||
| Deferred issuance costs |
— | 109 | ||||||
| Origination costs |
5,164 | — | ||||||
|
|
|
|
|
|||||
| Total gross deferred tax liabilities |
6,213 | 1,017 | ||||||
|
|
|
|
|
|||||
| Deferred assets less liabilities |
26,090 | 26,199 | ||||||
| Less: valuation allowance |
(26,090 | ) | (26,199 | ) | ||||
|
|
|
|
|
|||||
| Net deferred tax asset |
$ | — | $ | — | ||||
|
|
|
|
|
|||||
In assessing the realizability of deferred tax assets, we consider whether it is more likely than not that some portion or all of the deferred tax assets will not be realized. The ultimate realization of deferred tax assets is dependent upon the generation of future taxable income during the periods in which those temporary differences become deductible. We consider the scheduled reversal of deferred tax liabilities, projected future taxable income, and planned tax strategies in making this assessment. Based upon the level of historical losses and projections for future taxable income over the periods in which the deferred tax assets are deductible, we believe it is more likely than not that we will not realize the benefits of these deductible differences in the future. Therefore, we have recorded a full valuation allowance on our net deferred tax asset.
Our net operating loss carryforwards for federal income tax purposes were approximately $32.2 million, $47.5 million and $37.6 million at December 31, 2014, 2013 and 2012, respectively, and, if not utilized, will expire at various dates beginning in 2027. State net operating loss carryforwards were $31.4 million, $47.2 million and $37.5 million at December 31, 2014, 2013 and 2012, respectively. Net operating loss carryforwards and tax credit carryforwards reflected above may be limited due to historical and future ownership changes.
12. Fair Value of Financial Instruments
Assets and Liabilities Measured at Fair Value on a Recurring Basis
We evaluate our financial assets and liabilities subject to fair value measurements on a recurring basis to determine the appropriate level at which to classify them for each reporting period. This determination requires significant judgments to be made.
102
Table of Contents
The following tables present information about our assets and liabilities that are measured at fair value on a recurring basis using the following categories, as of December 31, 2014 and 2013 (in thousands):
| December 31, 2014 | ||||||||||||||||
| Description |
Level 1 | Level 2 | Level 3 | Total | ||||||||||||
| Liabilities: |
||||||||||||||||
| Warrant liability(1) |
$ | — | $ | — | $ | — | $ | — | ||||||||
|
|
|
|
|
|
|
|
|
|||||||||
| Total liabilities |
$ | — | $ | — | $ | — | $ | — | ||||||||
|
|
|
|
|
|
|
|
|
|||||||||
| December 31, 2013 | ||||||||||||||||
| Description |
Level 1 | Level 2 | Level 3 | Total | ||||||||||||
| Liabilities: |
||||||||||||||||
| Warrant liability(1) |
$ | — | $ | — | $ | 4,446 | $ | 4,446 | ||||||||
|
|
|
|
|
|
|
|
|
|||||||||
| Total liabilities |
$ | — | $ | — | $ | 4,446 | $ | 4,446 | ||||||||
|
|
|
|
|
|
|
|
|
|||||||||
| (1) | Our warrant liability (Note 8) is classified within Level 3 because the liabilities are valued using significant unobservable inputs. We use the Black-Scholes-Merton Option Pricing Model and various inputs and assumptions based on the contractual agreements for the warrants to determine fair value at issuance and subsequent measurements. Estimates of the volatility for the option pricing model were based on the asset volatility of common stock of a group of comparable, publicly-traded companies. Estimates of expected term were based on the remaining contractual period of the warrants. |
There were no transfers between levels for the years ended December 31, 2014 and 2013.
Assets and Liabilities Measured at Fair Value on a Recurring Basis Using Significant Unobservable Inputs (Level 3)
The following table presents the changes in the Level 3 instruments measured at fair value on a recurring basis for the years ended December 31 (in thousands):
| 2014 | 2013 | |||||||
| Warrant liability balance at January 1 |
$ | 4,446 | $ | 707 | ||||
| Exercise of warrants |
(10,766 | ) | — | |||||
| Change in fair value |
11,232 | 3,739 | ||||||
| Conversion of preferred stock warrants to common stock warrants upon IPO |
(4,912 | ) | — | |||||
|
|
|
|
|
|||||
| Warrant liability balance at December 31 |
$ | — | $ | 4,446 | ||||
|
|
|
|
|
|||||
Assets and Liabilities Disclosed at Fair Value
As loans are not measured at fair value, the following discussion relates to estimating the fair value disclosure under ASC Topic 825. The fair value of loans is estimated by discounting scheduled cash flows through the estimated maturity. The estimated market discount rates used for loans are our current offering rates for comparable loans with similar terms.
The carrying amounts of certain of our financial instruments, including loans and loans held for sale, approximate fair value due to their short-term nature and are considered Level 3. The carrying value of our financing obligations, such as fixed-rate debt, approximates fair value, considering the borrowing rates currently available to us for financing obligations with similar terms and credit risks.
103
Table of Contents
13. Related Parties
During April and May 2013, we entered into stock redemption agreements with certain Series A and B preferred stockholders. Per the agreements, we redeemed 1,514,698 shares of Series A for $5.9 million and 91,460 shares of Series B for $0.4 million.
From time to time, we issue warrants in connection with new debt agreements. These features have resulted in certain notes payable being due to related parties holding our common stock and warrants to purchase shares of common or preferred stock.
14. Stock-Based Compensation
2014 Equity Incentive Plan
Our board of directors adopted, and our stockholders approved, a 2014 Equity Incentive Plan (“2014 Plan”). Our 2014 Plan provides for the grant of incentive stock options, within the meaning of Section 422 of the Internal Revenue Code, to our employees, and for the grant of nonstatutory stock options, restricted stock, restricted stock units, stock appreciation rights, performance units and performance shares to our employees, directors and consultants. We have initially authorized up to 7,200,000 shares of our common stock for issuance under the 2014 Plan subject to increase pursuant to the terms of the 2014 Plan. The shares of common stock available for issuance pursuant to the 2014 Plan is increased by shares returned that would otherwise return to our 2007 Plan as the result of the expiration or termination of awards. In addition, the number of shares available for issuance under the 2014 Plan will also include an annual increase on the first day of each fiscal year beginning in fiscal 2016 and ending immediately following fiscal 2020, equal to the least of:
| • | 7,200,000 shares of our common stock; |
| • | 4% of the outstanding shares of our common stock as of the last day of our immediately preceding fiscal year, which is referred to as the threshold percentage; |
| • | a percentage equal to the threshold percentage, plus the difference between the threshold percentage and the percentage added to the 2014 Plan for each prior fiscal year; or |
| • | such other amount as our board of directors may determine. |
As of December 31, 2014 no equity instruments have been granted under the 2014 Plan.
2014 Employee Stock Purchase Plan
Our board of directors adopted, and our stockholders approved, the 2014 Employee Stock Purchase Plan (“ESPP”), which became effective in connection with our IPO in December 2014. The ESPP allows eligible employees to purchase shares of our common stock at a discount through payroll deductions of up to 15% of their eligible compensation, subject to any plan limitations. The offering periods generally start on the first trading day on or after March 15 and September 15 of each year and end on the first trading approximately six months later. The administrator may, in its discretion, modify the terms of future offering periods. Due to the timing of the IPO, the first offering period started December 22, 2014 and will end on September 15, 2015. At the end of each offering period, employees are able to purchase shares at 85% of the lower of the fair market value of our common stock on the first trading day of the offering period or on the last trading day of the offering period. A total of 1,800,000 shares of our common stock are available for sale under our ESPP. In addition, our ESPP provides for annual increases in the number of shares available for issuance under the ESPP on the first day of each fiscal year beginning in fiscal 2016, equal to the lesser of:
| • | 1% of the outstanding shares of our common stock on the first day of such fiscal year; |
| • | 1,800,000 shares of our common stock; or |
| • | such other amount as may be determined by our board of directors. |
104
Table of Contents
At December 31, 2014, total compensation costs related to rights to purchase common shares under the ESPP but not yet vested were approximately $0.9 million, which will be recognized over the offering period.
The assumptions used to calculate our stock-based compensation for each stock purchase right granted under the ESPP were as follows:
| 2014 | ||||
| Risk-free interest rate |
0.17 | % | ||
| Expected term (years) |
0.75 | |||
| Expected volatility |
42.24 | % | ||
| Dividend yield |
0 | % | ||
2007 Stock Option Plan
Our Amended and Restated 2007 Stock Incentive Plan (“2007 Plan”) was terminated in connection with the IPO, and accordingly, no shares are available for issuance under this plan. Our 2007 Plan continues to govern outstanding awards granted thereunder. Our 2007 Plan allowed for the grant of incentive stock options, nonqualified stock options and restricted stock. The terms of the stock option grants under the 2007 Plan, including the exercise price per share and vesting periods, are determined by our Compensation Committee of the Board (“Committee”). Stock options are granted at exercise prices defined by the Committee but, historically, have been equal to the fair market value of our common stock at the date of grant. As of December 31, 2014 and 2013, we had 0 and 1,109,292 shares, respectively, allocated to the 2007 Plan. The options typically vest at a rate of 25% after one year from the vesting commencement date and then monthly over an additional three-year period. The options expire ten years from the grant date or, for terminated employees, 90 days after the employee’s termination date. Compensation expense for the fair value of the options at their grant date is recognized ratably over the vesting period.
Stock-based compensation expense related to stock options is allocated to operating expenses in our consolidated statements of operations and for the years ended December 31, 2014 and 2013 was $2.8 million and $0.4 million, respectively.
We value stock options using the Black-Scholes-Merton Option-Pricing Model, which requires the input of subjective assumptions, including the risk-free interest rate, expected term, expected stock price volatility and dividend yield. The risk-free interest rate assumption is based upon observed interest rates for constant maturity U.S. Treasury securities consistent with the expected term of our employee stock options. The expected term represents the period of time the stock options are expected to be outstanding and is based on the simplified method. Under the simplified method, the expected term of an option is presumed to be the midpoint between the vesting date and the end of the contractual term. We use the simplified method due to the lack of sufficient historical exercise data to provide a reasonable basis upon which to otherwise estimate the expected term of the stock options. Expected volatility is based on historical volatilities for publicly-traded stock of comparable companies over the estimated expected life of the stock options.
We assumed no dividend yield because we do not expect to pay dividends in the near future, which is consistent with our history of not paying dividends.
The following table summarizes the assumptions used for estimating the fair value of stock options granted under the 2007 Plan for the years ended December 31:
| 2014 |
2013 |
2012 | ||||
| Risk-free interest rate |
1.02-2.08% | 0.88-2.29% | 0.83-0.96% | |||
| Expected term (years) |
3.22-6.13 | 5.76-8.52 | 5.86-6.13 | |||
| Expected volatility |
35-59% | 54-60% | 59-60% | |||
| Dividend yield |
0% | 0% | 0% | |||
| Weighted-average grant date fair value per share |
$5.57 | $0.65 | $0.23 |
105
Table of Contents
The following is a summary of option activity for the year ended December 31, 2014:
| Number of Options |
Weighted- Average Exercise Price |
Weighted- Average Remaining Contractual Term |
Aggregate Intrinsic Value |
|||||||||||||
| (in years) | (in thousands) | |||||||||||||||
| Outstanding at January 1, 2014 |
7,814,970 | $ | 0.52 | |||||||||||||
| Granted |
4,436,566 | $ | 10.25 | |||||||||||||
| Exercised |
(1,643,423 | ) | $ | 0.39 | ||||||||||||
| Forfeited |
(216,406 | ) | $ | 3.72 | ||||||||||||
| Expired |
(20,238 | ) | $ | 0.54 | ||||||||||||
|
|
|
|||||||||||||||
| Outstanding at December 31, 2014 |
10,371,469 | $ | 4.59 | 8.49 | $ | 82,259 | ||||||||||
|
|
|
|||||||||||||||
| Exercisable at December 31, 2014 |
3,076,554 | $ | 0.53 | 7.30 | $ | 36,583 | ||||||||||
|
|
|
|||||||||||||||
| Vested or expected to vest as of December 31, 2014 |
8,917,066 | $ | 4.43 | 8.43 | $ | 72,301 | ||||||||||
|
|
|
|||||||||||||||
The following is a summary of option activity for the year ended December 31, 2013:
| Number of Options |
Weighted- Average Exercise Price |
Weighted- Average Remaining Contractual Term (in years) |
Aggregate Intrinsic Value (in thousands) |
|||||||||||||
| Outstanding at January 1, 2013 |
6,342,792 | $ | 0.36 | |||||||||||||
| Granted |
3,713,000 | $ | 0.69 | |||||||||||||
| Exercised |
(1,506,510 | ) | $ | 0.31 | ||||||||||||
| Forfeited |
(724,314 | ) | $ | 0.46 | ||||||||||||
| Expired |
(9,998 | ) | $ | 0.38 | ||||||||||||
|
|
|
|||||||||||||||
| Outstanding at December 31, 2013 |
7,814,970 | $ | 0.52 | 8.41 | $ | 24,972 | ||||||||||
|
|
|
|||||||||||||||
| Exercisable at December 31, 2013 |
2,629,584 | $ | 0.38 | 7.10 | $ | 8,458 | ||||||||||
|
|
|
|||||||||||||||
| Vested or expected to vest as of December 31, 2013 |
6,112,586 | $ | 0.50 | 8.28 | $ | 19,618 | ||||||||||
|
|
|
|||||||||||||||
Stock-based compensation expense related to stock options is included in the following line items in our accompanying consolidated statements of operations for the year ended December 31 (in thousands):
| 2014 | 2013 | |||||||
| Sales and marketing |
$ | 686 | $ | 118 | ||||
| Technology and analytics |
539 | 47 | ||||||
| Processing and servicing |
219 | 30 | ||||||
| General and administrative |
1,398 | 243 | ||||||
|
|
|
|
|
|||||
| Total |
$ | 2,842 | $ | 438 | ||||
|
|
|
|
|
|||||
Total compensation cost related to nonvested awards not yet recognized as of December 31, 2014 and 2013 was $18.9 million and $2.7 million and will be recognized over a weighted-average period of approximately 3.5 years. The aggregate intrinsic value of employee options exercised during the years ended December 31, 2014 and 2013 was $12.1 million and $1.0 million, respectively.
106
Table of Contents
15. Commitments and Contingencies
Lease Commitments
Operating Leases
In May 2013, we entered into an operating agreement in Virginia for a satellite office. The agreement calls for monthly rental payments of $37,000, subject to escalation, through September 2018 and allows for a five month rent holiday during the second year. Deferred rent is included in our balance sheets as a component of accrued expenses and other liabilities. The agreement provided for a $0.5 million leasehold improvement incentive that has been recorded as a liability and is being amortized over the term of the lease.
On January 23, 2014, we signed a lease to rent additional space in the building of our corporate headquarters in New York City. The lease terminates in August 2023 and calls for monthly payments of $61,000, with escalations beginning in its second year. The terms also provide for a tenant allowance of $0.9 million and rent holiday for the first sixteen months. Deferred rent is included in the consolidated balance sheets as a component of accrued expenses and other liabilities.
Certain of our leases have free or escalating rent payment provisions. We recognize rent expense under such leases on a straight-line basis over the term of the lease and record the difference between the rent paid and the straight-line rent expense as deferred rent within other liabilities on our consolidated balance sheets. Improvements funded by tenant allowances are recorded as leasehold improvements and depreciated over the improvements’ estimated useful lives or the remaining lease term, whichever is shorter. The incentive is recorded as deferred rent and amortized over the term of the lease.
Capital Leases
In March 2012, we entered into a capital lease agreement for a data warehouse. The agreement called for monthly principal and interest payments of $5,000 through April 2015. As of December 31, 2014, total future minimum payments is $23,000.
In January 2014, we entered into a capital lease agreement for additional data warehouses. The agreement called for monthly principal and interest payments of $18,000 through January 2017. As of December 31, 2014, total future minimum payments is $424,000.
For the years ended December 31, 2014 and 2013, we recorded depreciation expense of $0.3 million and $54,000, respectively, related to our fixed assets under capital leases. These capital leases are recorded in property, equipment and software, net with a corresponding liability in accrued expenses and other liabilities.
Lease Commitments
At December 31, 2014, future minimum lease commitments under operating and capital leases, net of sublease income, for the remaining terms of the operating leases were as follows (in thousands):
| For the years ending December 31, |
||||
| 2015 |
$ | 3,115 | ||
| 2016 |
3,101 | |||
| 2017 |
2,938 | |||
| 2018 |
2,858 | |||
| 2019 |
2,397 | |||
| Thereafter |
7,181 | |||
|
|
|
|||
| Total |
$ | 21,590 | ||
|
|
|
107
Table of Contents
Concentrations of Credit Risk
Financial instruments that potentially subject us to significant concentrations of credit risk consist principally of cash, cash equivalents, restricted cash and loans. We hold cash, cash equivalents and restricted cash in accounts at regulated domestic financial institutions in amounts that may exceed FDIC insured amounts. We believe these institutions to be of high credit quality, and we have not experienced any related losses to date.
We are exposed to default risk on borrower loans originated. We perform evaluations of borrowers’ financial conditions as needed and have the contractual right to limit a borrower’s ability to take additional working capital loans during the term of the borrower’s OnDeck loan(s). There is no single borrower or group of borrowers that comprise a significant portion of our loan portfolio.
Contingencies
We may be subject to legal proceedings and regulatory actions in the ordinary course of business. The results of such proceedings cannot be predicted with certainty, but we do not anticipate that the final outcome, if any, arising out of any such matter will have a material adverse effect on our consolidated business, financial condition or results of operations taken as a whole.
16. Quarterly Financial Information (unaudited)
The following table contains selected unaudited financial data for each quarter of 2014 and 2013. The unaudited information should be read in conjunction with our financial statements and related notes included elsewhere in this report. We believe that the following unaudited information reflects all normal recurring adjustments necessary for a fair presentation of the information for the periods presented. The operating results for any quarter are not necessarily indicative of results for any future period.
| December 31, 2014 |
September 30, 2014 |
June 30, 2014 |
March 31, 2014 |
December 31, 2013 |
September 30, 2013 |
June 30, 2013 |
March 31, 2013 |
|||||||||||||||||||||||||
| Gross revenues |
50,491 | 43,509 | 35,502 | 28,562 | 23,172 | 17,797 | 13,609 | 10,671 | ||||||||||||||||||||||||
| Net revenue |
25,401 | 22,060 | 18,628 | 7,343 | 8,883 | 8,431 | 5,274 | 2,672 | ||||||||||||||||||||||||
| Net income (loss) |
(4,291 | ) | 354 | (1,054 | ) | (13,717 | ) | (5,607 | ) | (5,063 | ) | (6,397 | ) | (7,289 | ) | |||||||||||||||||
| Net loss attributable to common stockholders |
(7,347 | ) | (3,273 | ) | (4,650 | ) | (16,322 | ) | (7,663 | ) | (7,118 | ) | (13,645 | ) | (8,654 | ) | ||||||||||||||||
| Basic and diluted |
(0.13 | ) | (0.51 | ) | (0.88 | ) | (3.47 | ) | (1.78 | ) | (1.78 | ) | (3.33 | ) | (1.81 | ) | ||||||||||||||||
17. Subsequent Events
In January 2015 we paid off all of our then outstanding corporate debt in the amount of $12 million.
In January 2015, we signed a lease to rent an additional 7,656 square feet in our Virginia office. The lease terminates seven years after the commencement date and calls for monthly payments of $26,000, with escalations beginning in the second year. The terms also provide for a construction allowance of $0.5 million.
In March 2015, we signed an amendment to our corporate headquarters in New York City pursuant to which we have agreed to extend the term of the lease and rent an additional 79,000 square feet, bringing our headquarters to a total of approximately 117,000 square feet. The additional space will be delivered as and when the same becomes available in accordance with the terms of the amendment. The lease will now terminate ten years and ten months after the delivery of the 23rd floor portion of the additional space. Upon delivery of all additional space, the amendment calls for aggregate, initial monthly fixed rent payments of $0.4 million subject to certain rent credits aggregating $3.6 million and a tenant improvement allowance not to exceed $5.8 million.
108
Table of Contents
Schedule II—Valuation and Qualifying Accounts
Years Ended December 31, 2014, 2013 and 2012
| Description |
Balance at Beginning of Period |
Charged to Cost and Expenses |
Charged to Other Accounts |
Deductions— Write offs |
Balance at End of Period |
|||||||||||||||
| (in thousands) | ||||||||||||||||||||
| Allowance for Loan Losses: |
||||||||||||||||||||
| 2014 |
19,443 | 67,432 | 2,567 | (39,638 | ) | 49,804 | ||||||||||||||
| 2013 |
9,288 | 26,570 | 1,236 | (17,651 | ) | 19,443 | ||||||||||||||
| 2012 |
3,662 | 12,469 | 38 | (6,881 | ) | 9,288 | ||||||||||||||
| Deferred tax asset valuation allowance: |
||||||||||||||||||||
| 2014 |
26,199 | (5,825 | ) | 5,717 | — | 26,090 | ||||||||||||||
| 2013 |
17,266 | — | 8,933 | — | 26,199 | |||||||||||||||
| 2012 |
10,424 | — | 6,843 | — | 17,266 | |||||||||||||||
109
Table of Contents
| Item 9. | Changes in and Disagreements with Accountants on Accounting and Financial Disclosure |
None.
| Item 9A. | Controls and Procedures |
Disclosure Controls and Procedures
As required by Rule 13a-15 under the Securities Exchange Act of 1934, “Exchange Act”, management has evaluated, with the participation of our Chief Executive Officer and Chief Financial Officer, the effectiveness of our disclosure controls and procedures as of the end of the period covered by this report. Disclosure controls and procedures refer to controls and other procedures designed to ensure that information required to be disclosed in the reports we file or submit under the Exchange Act are recorded, processed, summarized, and reported within the time periods specified in the rules and forms of the Securities and Exchange Commission. Disclosure controls and procedures include, without limitation, controls and procedures designed to ensure that information required to be disclosed by us in our reports that we file or submit under the Exchange Act are accumulated and communicated to our management, including our Chief Executive Officer and Chief Financial Officer, as appropriate, to allow timely decisions regarding our required disclosure. In designing and evaluating our disclosure controls and procedures, management recognizes that any controls and procedures, no matter how well designed and operated, can provide only reasonable assurance of achieving the desired control objectives, and management was required to apply its judgment in evaluating and implementing possible controls and procedures.
Based on the foregoing evaluation, our Chief Executive Officer and Chief Financial Officer have concluded that, as of December 31, 2014, the end of the period covered by this report, our disclosure controls and procedures were effective at a reasonable assurance level.
Management’s Annual Report on Internal Control over Financial Reporting
This report does not include an annual report of management’s assessment regarding internal control over financial reporting or an attestation report of our registered public accounting firm due to a transition period established by the rules of the SEC for newly public companies.
Changes in Internal Control over Financial Reporting
There has been no change in our internal control over financial reporting during our most recent fiscal quarter that has materially affected, or is reasonably likely to materially affect, our internal control over financial reporting.
| Item 9B. | Other Information |
None.
110
Table of Contents
| Item 10. | Directors, Executive Officers and Corporate Governance |
The information required by this item will be included under the caption “Directors, Executive Officers and Corporate Governance” in our Proxy Statement for the 2015 Annual Meeting of Stockholders to be filed with the SEC within 120 days of the fiscal year ended December 31, 2014, which we refer to as our 2015 Proxy Statement, and is incorporated herein by reference.
The Company has a “Code of Business Conduct and Ethics Policy” that applies to all of our employees, including our Principal Executive Officer, Principal Financial Officer, Principal Accounting Officer and our Board of Directors. A copy of this code is available on our website at http://investors.ondeck.com. We intend to satisfy the disclosure requirement under Item 5.05 of Form 8-K regarding amendment to, or waiver from, a provision of our Code of Business Conduct and Ethics Policy by posting such information on our investor relations website under the heading “Governance—Governance Documents” at http://investors.ondeck.com.
| Item 11. | Executive Compensation |
The information required by this item will be included under the captions “Executive Compensation” and under the subheadings “Board’s Role in Risk Oversight,” “Non-Employee Director Compensation,” “Outside Director Compensation Policy,” and “Compensation Committee Interlocks and Insider Participation” under the heading “Directors, Executive Officers and Corporate Governance” in the 2015 Proxy Statement and is incorporated herein by reference.
| Item 12. | Security Ownership of Certain Beneficial Owners and Management and Related Stockholder Matters |
The information required by this item will be included under the captions “Security Ownership of Certain Beneficial Owners and Management” and under the subheading “Potential Payments upon Termination or Change in Control” and “Equity Benefit and Stock Plans” under the heading “Executive Compensation” in the 2015 Proxy Statement and is incorporated herein by reference.
| Item 13. | Certain Relationships and Related Transactions, and Director Independence |
The information required by this item will be included under the captions “Certain Relationships and Related Transactions” and “Directors, Executive Officers and Corporate Governance—Director Independence” in the 2015 Proxy Statement and is incorporated herein by reference.
| Item 14. | Principal Accounting Fees and Services |
The information required by this item will be included under the caption “Proposal Two: Ratification of Selection of Independent Registered Public Accountants” in the 2015 Proxy Statement and is incorporated herein by reference.
111
Table of Contents
| Item 15. | Exhibits, Financial Statement Schedules |
Item 15(a)(1) and (2) and 15(c) Financial Statements and Schedules
See “Index to Consolidated Financial Statements” in Item 8 of this Annual Report on Form 10-K. Other financial statement schedules have not been included because they are not applicable or the information is included in the financial statements or notes thereto.
Item 15(a)(3)
The exhibits filed or incorporated by reference as part of this Annual Report on Form 10-K are listed in the Exhibit Index immediately preceding the exhibits. We have identified in the Exhibit Index each management contract and compensation plan filed as an exhibit to this Annual Report on Form 10-K in response to Item 15(a)(3) of Form 10-K.
Item 15(b) Exhibits
The documents listed in the Exhibit Index of this report are incorporated by reference or are filed with this Annual Report on Form 10-K, in each case as indicated therein (numbered in accordance with Item 601 of Regulation S-K).
112
Table of Contents
Pursuant to the requirements of Section 13 or 15(d) of the Securities Exchange Act of 1934, the registrant has duly caused this report to be signed on its behalf by the undersigned, thereunto duly authorized.
| On Deck Capital, Inc. | ||||
| /s/ Howard Katzenberg | ||||
| Howard Katzenberg | ||||
| Chief Financial Officer | ||||
| Date: March 10, 2015 |
(Principal Financial Officer) | |||
POWER OF ATTORNEY
KNOW ALL THESE PERSONS BY THESE PRESENTS, that each person whose signature appears below constitutes and appoints Noah Breslow, Howard Katzenberg and Cory Kampfer, and each of them, his attorneys-in-fact, each with full power of substitution, for him in any and all capacities, to sign any and all amendments to this Annual Report on Form 10-K, and to file the same, with exhibits thereto and other documents in connection therewith, with the Securities and Exchange Commission, hereby ratifying and confirming all that each said attorneys-in-fact or his substitute or substitutes, may do or cause to be done by virtue hereof.
Pursuant to the requirements of the Securities Exchange Act of 1934, this report has been signed below by the following persons on behalf of the registrant and in the capacities and on the dates indicated.
| Signature | Title | Date | ||
| /s/ Noah Breslow Noah Breslow |
Chief Executive Officer and Director (Principal Executive Officer) |
March 10, 2015 | ||
| /s/ Howard Katzenberg Howard Katzenberg |
Chief Financial Officer (Principal Financial Officer) |
March 10, 2015 | ||
| /s/ Howard Katzenberg Howard Katzenberg |
Principal Accounting Officer (Principal Accounting Officer) |
March 10, 2015 | ||
| /s/ David Hartwig David Hartwig |
Director |
March 10, 2015 | ||
| /s/ J. Sanford Miller J. Sanford Miller |
Director |
March 10, 2015 | ||
| /s/ James D. Robinson James D. Robinson III |
Director |
March 10, 2015 | ||
| /s/ Jane J. Thompson Jane J. Thompson |
Director |
March 10, 2015 | ||
| /s/ Ronald F. Verni Ronald F. Verni |
Director |
March 10, 2015 | ||
| /s/ Neil E. Wolfson Neil E. Wolfson |
Director |
March 10, 2015 | ||
113
Table of Contents
Exhibit Index
| Exhibit |
Description |
Filed / Furnished / |
Incorporated by Reference from Exhibit Number |
Date Filed | ||||||||
| 3.1 | Amended and Restated Certificate of Incorporation | 8-K | 3.2 | 12/22/2014 | ||||||||
| 3.2 | Amended and Restated Bylaws | 8-K | 3.2 | 12/22/2014 | ||||||||
| 4.1 | Form of common stock certificate. | S-1 | 4.1 | 11/10/2014 | ||||||||
| 4.2 | Ninth Amended and Restated Investors’ Rights Agreement, dated March 13, 2014, by and among the Registrant and certain of its stockholders. | S-1 | 4.2 | 11/10/2014 | ||||||||
| 4.3 | Form of warrant to purchase Series E preferred stock. | S-1 | 4.5 | 11/10/2014 | ||||||||
| 4.4 | Form of warrant to purchase common stock. | S-1 | 4.6 | 11/10/2014 | ||||||||
| 10.1+ | Form of Indemnification Agreement between the Registrant and each of its directors and executive officers. | S-1 | 10.1 | 11/10/2014 | ||||||||
| 10.2+ | Amended and Restated 2007 Stock Incentive Plan and forms of agreements thereunder. | S-1 | 10.2 | 11/10/2014 | ||||||||
| 10.3+ | 2014 Equity Incentive Plan and forms of agreements thereunder. | S-1/A | 10.3 | 12/4/2014 | ||||||||
| 10.4+ | 2014 Employee Stock Purchase Plan and form of agreement thereunder. | S-1/A | 10.4 | 12/4/2014 | ||||||||
| 10.5+ | Employee Bonus Plan. | S-1 | 10.5 | 11/10/2014 | ||||||||
| 10.6+ | Outside Director Compensation Policy. | S-1 | 10.6 | 11/10/2014 | ||||||||
| 10.7+ | Confirmatory Employment Offer Letter between the Registrant and Noah Breslow dated October 30, 2014. | S-1 | 10.7 | 11/10/2014 | ||||||||
| 10.8+ | Confirmatory Employment Offer Letter between the Registrant and James Hobson dated November 7, 2014. | S-1 | 10.8 | 11/10/2014 | ||||||||
| 10.9+ | Confirmatory Employment Offer Letter between the Registrant and Howard Katzenberg dated November 3, 2014. | S-1 | 10.9 | 11/10/2014 | ||||||||
| 10.10+ | Form of Change in Control and Severance Agreement between the Registrant and Noah Breslow. | S-1 | 10.10 | 11/10/2014 | ||||||||
| 10.11+ | Form of Change in Control and Severance Agreement between the Registrant and other executive officers. | S-1 | 10.11 | 11/10/2014 | ||||||||
| 10.12 | Lease, dated September 25, 2012, by and between the Registrant and 1400 Broadway Associates L.L.C. | S-1 | 10.12 | 11/10/2014 | ||||||||
| 10.13 | Amended and Restated Loan and Security Agreement, dated November 3, 2014, by and between the Registrant and Square 1 Bank. | S-1 | 10.13 | 11/10/2014 | ||||||||
| 10.14 | Amended and Restated Credit Agreement, dated September 15, 2014, by and among OnDeck Account Receivables Trust 2013-1 LLC, Deutsche Bank AG, New York Branch, Deutsche Bank Trust Company Americas and Deutsche Bank Securities Inc. | S-1 | 10.14 | 11/10/2014 | ||||||||
114
Table of Contents
| 10.15 | Second Amended and Restated Loan and Security Agreement, dated March 21, 2011, by and among Small Business Asset Fund 2009 LLC, each Lender party thereto from time to time and Deutsche Bank Trust Company Americas, as amended January 10, 2014. | S-1 | 10.15 | 11/10/2014 | ||||||||
| 10.16 | Second Amended and Restated Credit Agreement, dated December 19, 2014, by and among On Deck Asset Company, LLC, each Lender party thereto from time to time, WS 2014-1, LLC, and Deutsche Bank Trust Company Americas. | Filed herewith. | ||||||||||
| 10.17 | Base Indenture, dated May 8, 2014, by and between OnDeck Asset Securitization Trust LLC and Deutsche Bank Trust Company Americas. | S-1 | 10.17 | 11/10/2014 | ||||||||
| 10.18 | Series 2014-1 Supplement, dated May 8, 2014, by and between OnDeck Asset Securitization Trust LLC and Deutsche Bank Trust Company Americas. | S-1 | 10.18 | 11/10/2014 | ||||||||
| 10.19 | Credit Agreement, dated August 15, 2014, by and among OnDeck Asset Pool, LLC, Jefferies Mortgage Funding, LLC and Deutsche Bank Trust Company Americas. | S-1 | 10.19 | 11/10/2014 | ||||||||
| 10.20 | Form of Managed Applicant Commission Agreement between the Registrant and its funding advisors. | S-1 | 10.20 | 11/10/2014 | ||||||||
| 10.21 | Lease Modification Agreement, dated March 3, 2015, by and between the Company and ESRT 1400 Broadway, L.P. | Filed herewith. | ||||||||||
| 21.1 | List of subsidiaries of the Registrant. | S-1 |
21.1 | 11/10/2014 | ||||||||
| 23.1 | Consent of Ernst & Young LLP, Independent Registered Public Accounting Firm. | Filed herewith. | ||||||||||
| 31.1 | Certification pursuant to Section 302 of the Sarbanes-Oxley Act of 2002, Rule 13(a)- 14(a)/15d-14(a), by President and Chief Executive Officer. | Filed herewith. | ||||||||||
| 31.2 | Certification pursuant to Section 302 of the Sarbanes-Oxley Act of 2002, Rule 13(a)- 14(a)/15d-14(a), by President and Chief Financial Officer. | Filed herewith. | ||||||||||
| 32.1 | Certification pursuant to 18 U.S.C. Section 1350, as adopted pursuant to Section 906 of the Sarbanes-Oxley Act of 2002, by President and Chief Executive Officer. | Furnished herewith. |
||||||||||
| 32.2 | Certification pursuant to 18 U.S.C. Section 1350, as adopted pursuant to Section 906 of the Sarbanes-Oxley Act of 2002, by President and Chief Financial Officer. | Furnished herewith. |
||||||||||
| + | Indicates a management contract or compensatory plan. |
115