Attached files
| file | filename |
|---|---|
| 8-K - FORM 8-K - GEE Group Inc. | job_8k.htm |
| EX-99.1 - PRESS RELEASE - GEE Group Inc. | job_ex991.htm |
EXHIBIT 99.2
ROTH ANNUAL CONFERENCE INVESTOR PRESENTATION MARCH 10, 2015 NYSE: JOB Employing America since 1893
1
Forward-Looking Statements This presentation contains forward-looking statements within the meaning of Section 27A of the Securities Act of 1933 and Section 21E of the Securities Exchange Act of 1934 as amended, including statements regarding the business of the Company and its industry generally, business strategy, anticipated future financial performance and prospects. All statements in this presentation other than those setting forth strictly historical information are forward-looking statements. These statements are based on the Company’s estimates, projections, beliefs and assumptions and are not guarantees of future performance. The Company makes no assurances that estimates or projections of revenues, gross profit, gross margin, SG&A, EBITDA, adjusted non-GAAP EBITDA, adjusted non-GAAP operating income or loss, adjusted non-GAAP net earnings or loss, operating income or loss, net income or loss, operating cash flow, and other financial metrics will be achieved. These forward-looking statements are subject to various risks and uncertainties, which may cause actual results to differ materially from the forward-looking statements. Factors that could cause or contribute to such differences include actual demand for our services, our ability to attract and retain qualified recruiters, account managers and staffing consultants, our ability to remain competitive in obtaining and retaining staffing clients, the availability of qualified temporary and permanent placement personnel, our ability to manage growth including making and integrating strategic acquisitions, our ability to access capital to fund operations, working capital, capital expenditures and acquisitions, satisfactory performance of our enterprise-wide information systems and such other risk factors detailed in our periodic filings with the SEC including Form 10-K, Form 10-Q and all other filings. The Company disclaims any obligation to update these forward-looking statements except as required by law.
2
Non-GAAP Financial Measures To supplement the Company’s consolidated financial statements presented on a GAAP basis, the Company discloses non-GAAP adjusted EBITDA because management uses these supplemental non-GAAP financial measures to evaluate performance period over period, to analyze the underlying trends in its business, to establish operational goals, to provide additional measures of operating performance, including using the information for internal planning relating to the Company’s ability to meet debt service, make capital expenditures and provide working capital needs. In addition, the Company believes investors already use these non-GAAP measures to monitor the Company’s performance. Non-GAAP Adjusted EBITDA is defined by the Company as net earnings or loss before interest, taxes, depreciation and amortization (EBITDA) adjusted for the non-cash changes in value of derivative liability related to the conversion option on its convertible debt, plus non-cash stock-based compensation. EBITDA and Adjusted EBITDA are not terms defined by GAAP and, as a result, the Company’s measure of EBITDA and Adjusted EBITDA might not be comparable to similarly titled measures used by other companies. Generally, a non-GAAP financial measure is a numerical measure of a company’s performance, financial position or cash flow that either excludes or includes amounts that are not normally included in the most directly comparable measure calculated and presented in accordance with GAAP. The non-GAAP measures discussed above, however, should be considered in addition to, and not as a substitute for, or superior to net income or net loss as reported for GAAP on the Consolidated Statements of Income, cash and cash flows as reported for GAAP on the Consolidated Statement of Cash Flows or other measures of financial performance prepared in accordance with GAAP, and as reflected on the Form 10-Q filed for the respective periods. Reconciliation of non-GAAP net income to non-GAAP adjusted EBITDA is set forth in a supplemental schedule to this presentation.
3
Company Overview NYSE: JOB
4
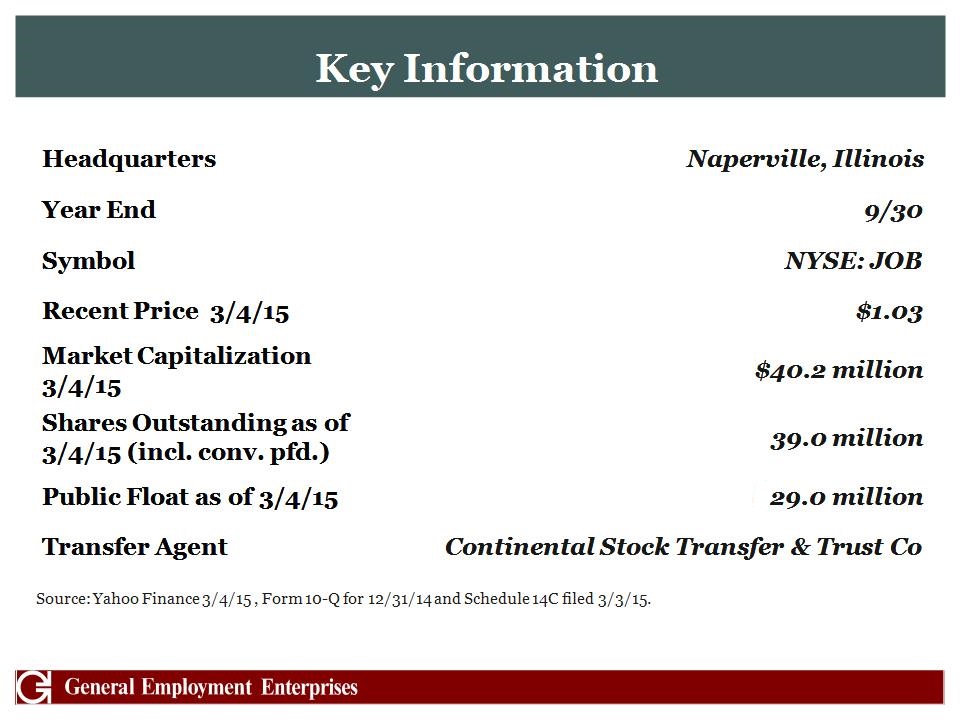
Headquarters Naperville, Illinois Year End 9/30 Symbol NYSE: JOB Recent Price 3/4/15 $1.03 Market Capitalization 3/4/15 $40.2 million Shares Outstanding as of 3/4/15 (incl. conv. pfd.) 39.0 million Public Float as of 3/4/15 $29.0 million Transfer Agent Continental Stock Transfer & Trust Co Source: Yahoo Finance 3/4/15 , Form 10-Q for 12/31/14 and Schedule 14C filed 3/3/15. Key Information
5
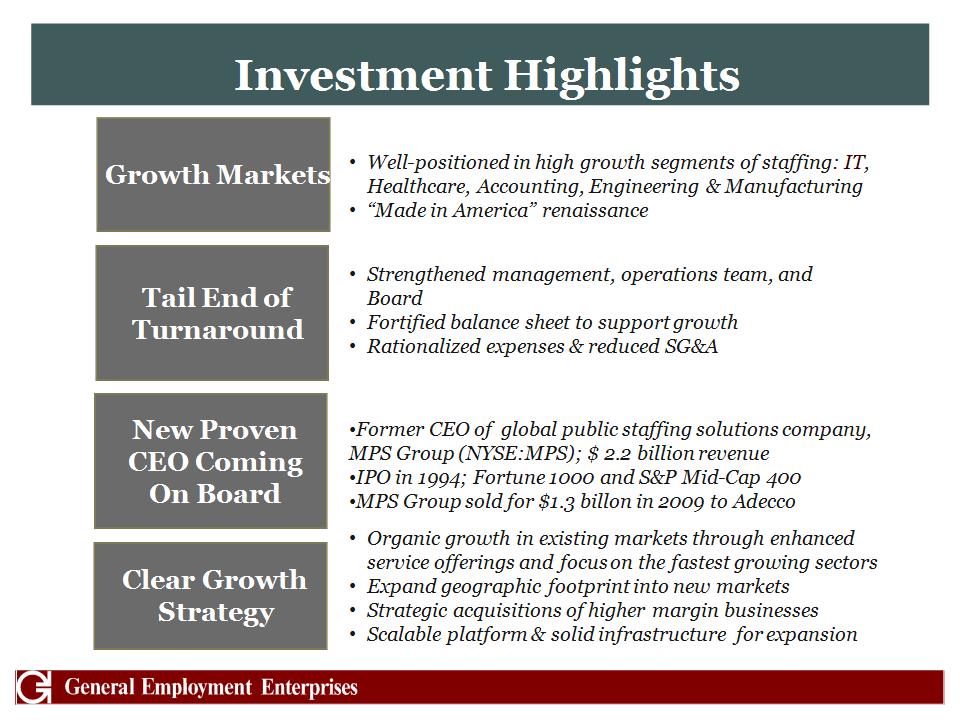
Investment Highlights Growth Markets Tail End of Turnaround Clear Growth Strategy New Proven CEO Coming On Board Former CEO of global public staffing solutions company, MPS Group (NYSE:MPS); $ 2.2 billion revenue IPO in 1994; Fortune 1000 and S&P Mid-Cap 400 MPS Group sold for $1.3 billon in 2009 to Adecco Organic growth in existing markets through enhanced service offerings and focus on the fastest growing sectors Expand geographic footprint into new markets Strategic acquisitions of higher margin businesses Scalable platform & solid infrastructure for expansion Strengthened management, operations team, and Board Fortified balance sheet to support growth Rationalized expenses & reduced SG&A Well-positioned in high growth segments of staffing: IT, Healthcare, Accounting, Engineering & Manufacturing “Made in America” renaissance
6
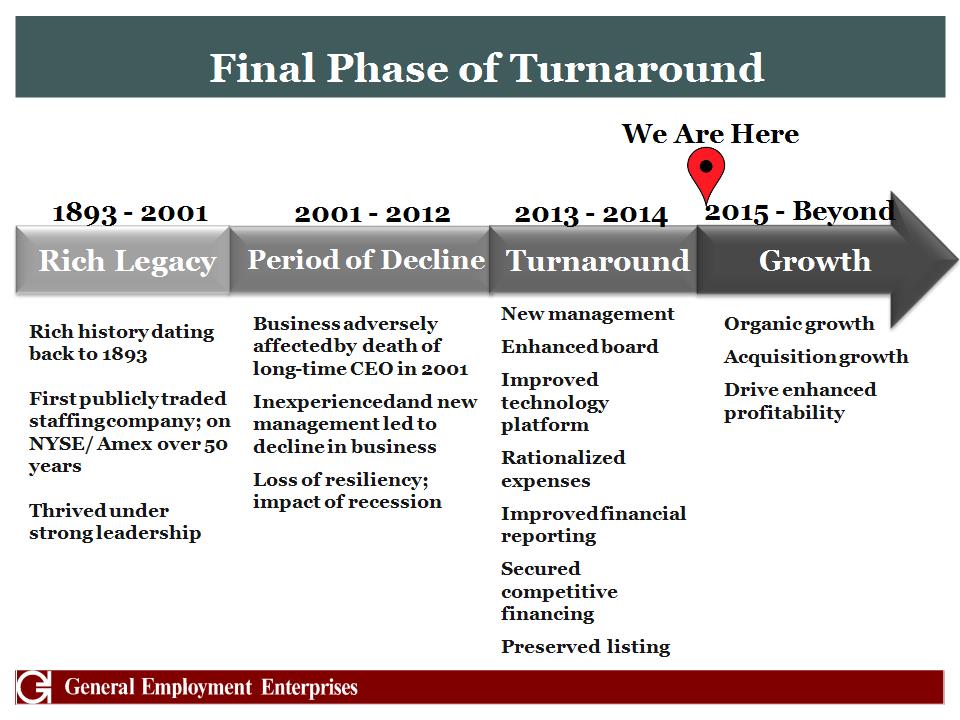
Final Phase of Turnaround Period of Decline Turnaround Growth 2001 - 2012 2013 - 2014 We Are Here 2015 - Beyond Rich history dating back to 1893 First publicly traded staffing company; on NYSE/ Amex over 50 years Thrived under strong leadership Business adversely affected by death of long-time CEO in 2001 Inexperienced and new management led to decline in business Loss of resiliency; impact of recession New management Enhanced board Improved technology platform Rationalized expenses Improved financial reporting Secured competitive financing Preserved listing Organic growth Acquisition growth Drive enhanced profitability Rich Legacy 1893 - 2001
7
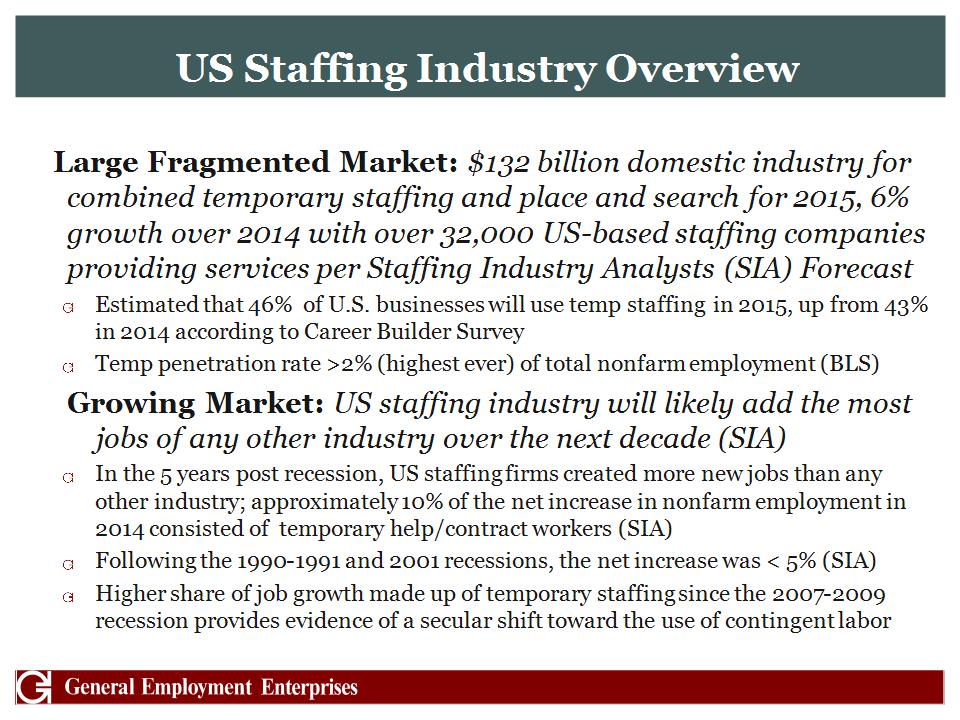
US Staffing Industry Overview Large Fragmented Market: $132 billion domestic industry for combined temporary staffing and place and search for 2015, 6% growth over 2014 with over 32,000 US-based staffing companies providing services per Staffing Industry Analysts (SIA) Forecast Estimated that 46% of U.S. businesses will use temp staffing in 2015, up from 43% in 2014 according to Career Builder Survey Temp penetration rate >2% (highest ever) of total nonfarm employment (BLS) Growing Market: US staffing industry will likely add the most jobs of any other industry over the next decade (SIA) In the 5 years post recession, US staffing firms created more new jobs than any other industry; approximately 10% of the net increase in nonfarm employment in 2014 consisted of temporary help/contract workers (SIA) Following the 1990-1991 and 2001 recessions, the net increase was < 5% (SIA) Higher share of job growth made up of temporary staffing since the 2007-2009 recession provides evidence of a secular shift toward the use of contingent labor
8
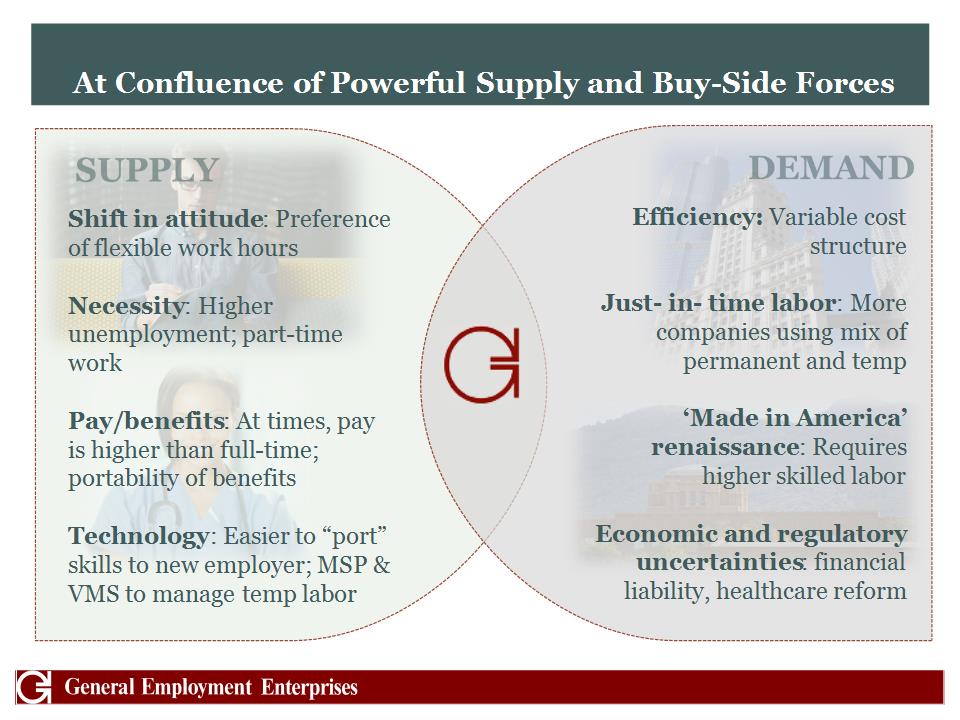
At Confluence of Powerful Supply and Buy-Side Forces Shift in attitude: Preference of flexible work hours Necessity: Higher unemployment; part-time work Pay/benefits: At times, pay is higher than full-time; portability of benefits Technology: Easier to “port” skills to new employer; MSP & VMS to manage temp labor Efficiency: Variable cost structure Just- in- time labor: More companies using mix of permanent and temp ‘Made in America’ renaissance: Requires higher skilled labor Economic and regulatory uncertainties: financial liability, healthcare reform
9
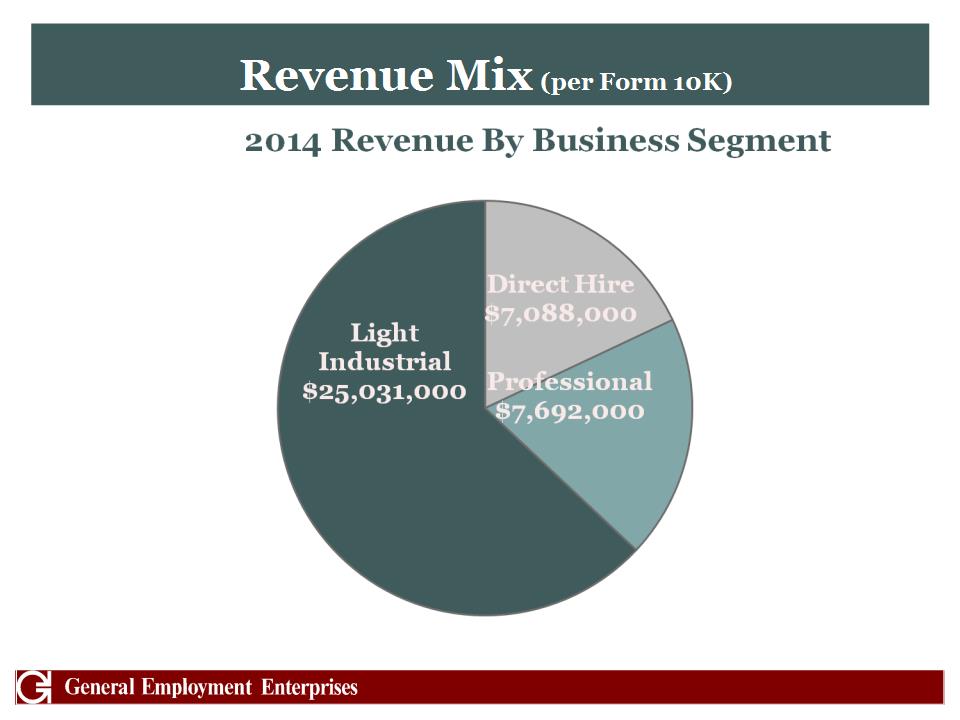
Revenue Mix (per Form 10K)
10
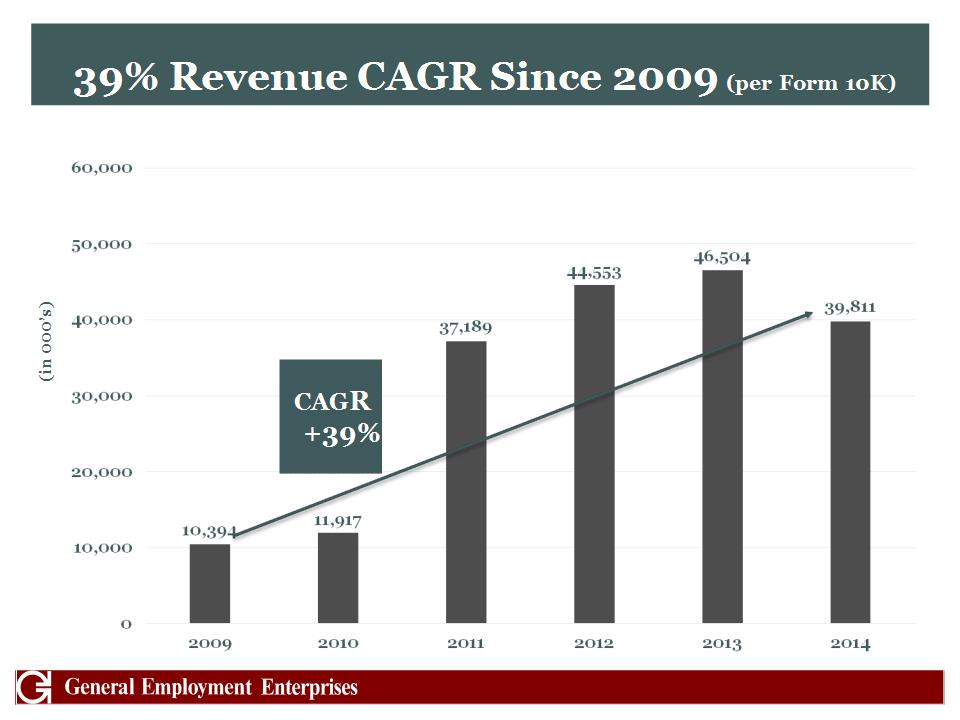
39% Revenue CAGR Since 2009 (per Form 10K) (in 000’s) CAGR+39%
11
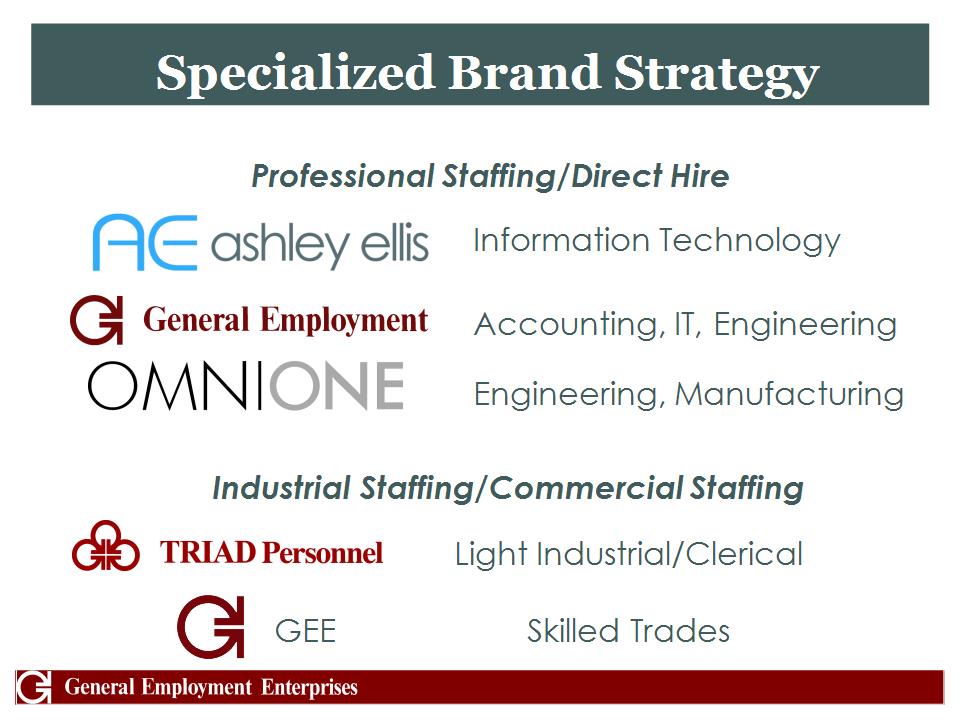
Specialized Brand Strategy Information Technology Accounting, IT, Engineering Engineering, Manufacturing Professional Staffing/Direct Hire Industrial Staffing/Commercial Staffing Light Industrial/Clerical GEE Skilled Trades
12
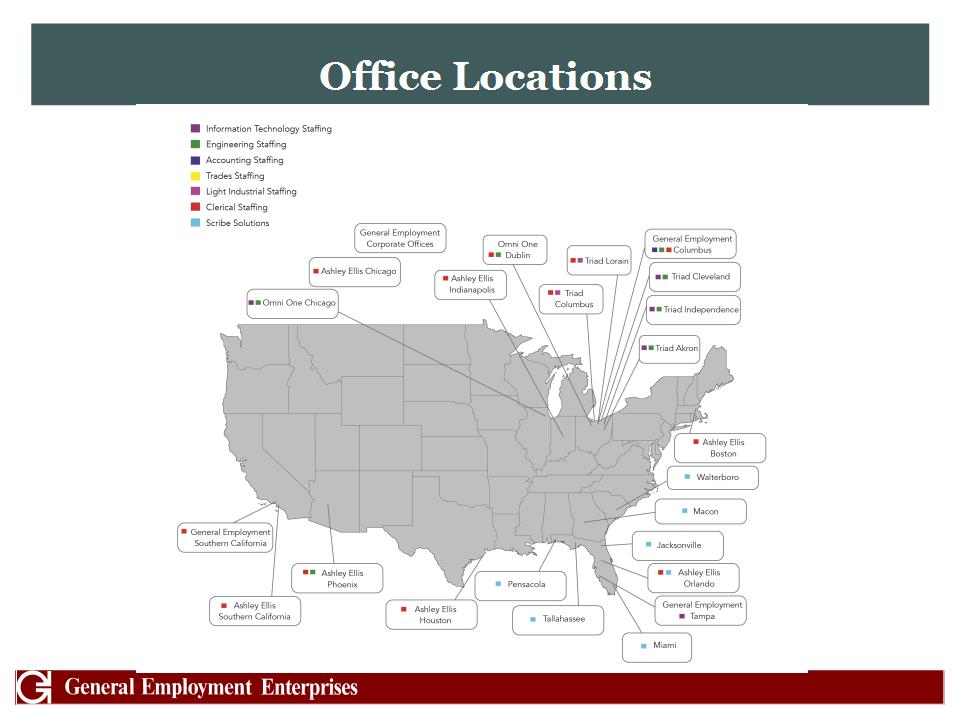
Office Locations
13
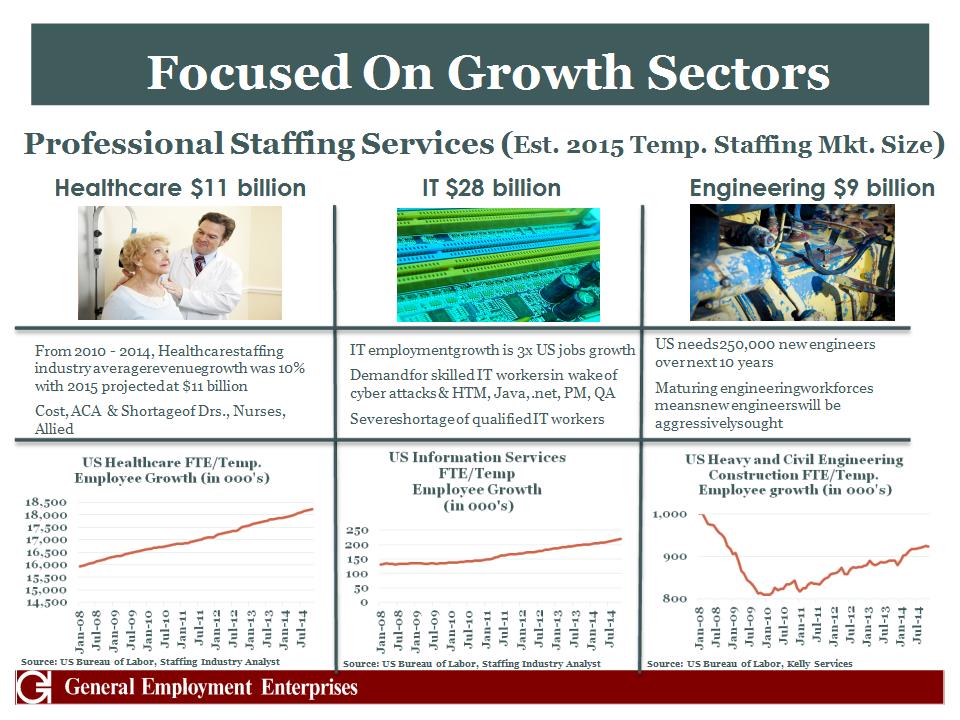
Focused On Growth Sectors Professional Staffing Services (Est. 2015 Temp. Staffing Mkt. Size) Healthcare $11 billion Engineering $9 billion Source: US Bureau of Labor, Staffing Industry Analyst Source: US Bureau of Labor, Kelly Services US needs 250,000 new engineers over next 10 years Maturing engineering workforces means new engineers will be aggressively sought IT employment growth is 3x US jobs growth Demand for skilled IT workers in wake of cyber attacks & HTM, Java, .net, PM, QA Severe shortage of qualified IT workers From 2010 – 2014, Healthcare staffing industry average revenue growth was 10% with 2015 projected at $11 billion Cost, ACA & Shortage of Drs., Nurses , Allied Source: US Bureau of Labor, Staffing Industry Analyst IT $28 billion
14
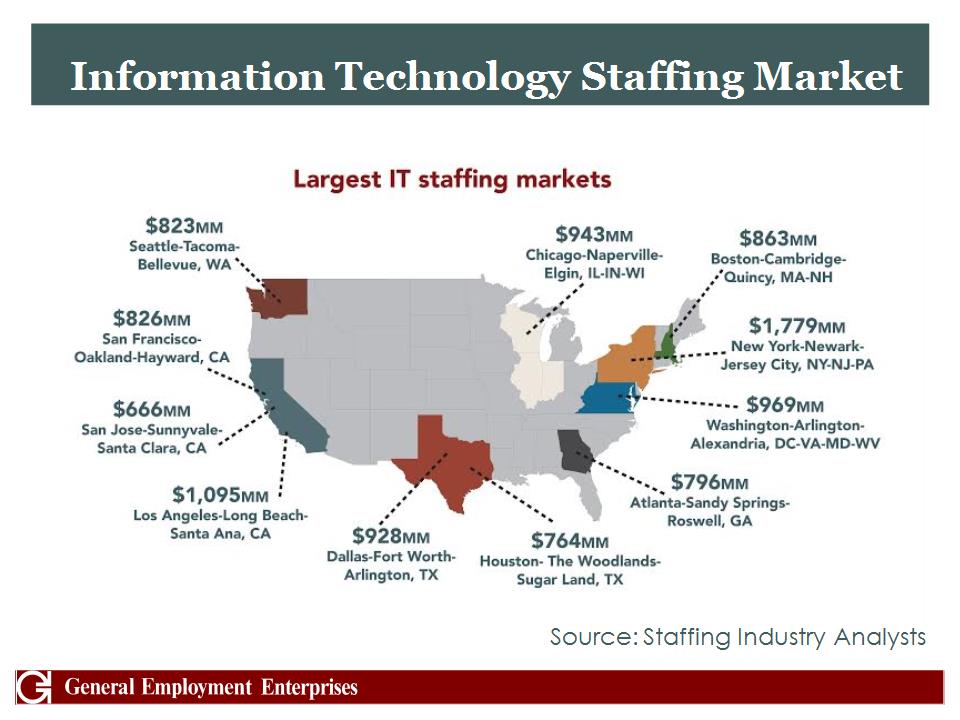
Information Technology Staffing Market Source: Staffing Industry Analysts
15
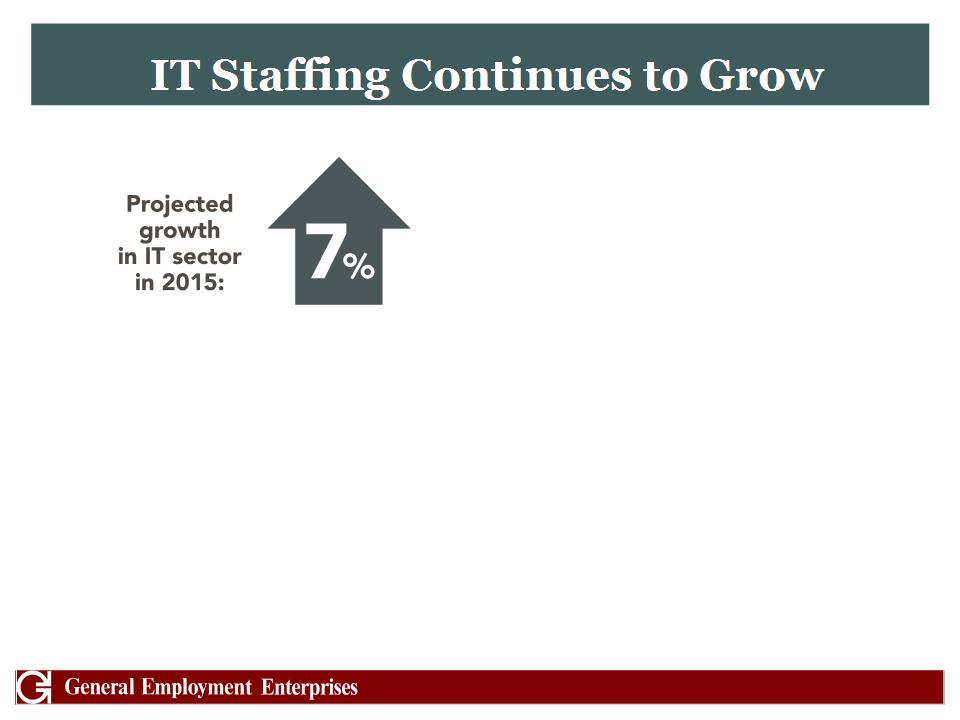
IT Staffing Continues to Grow
16
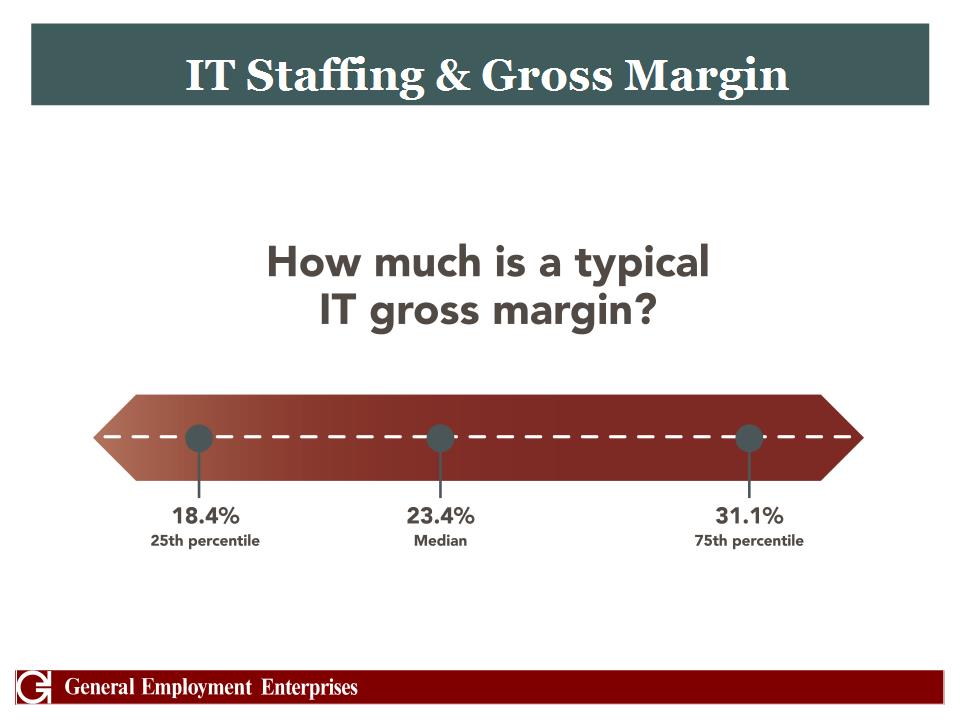
IT Staffing & Gross Margin
17
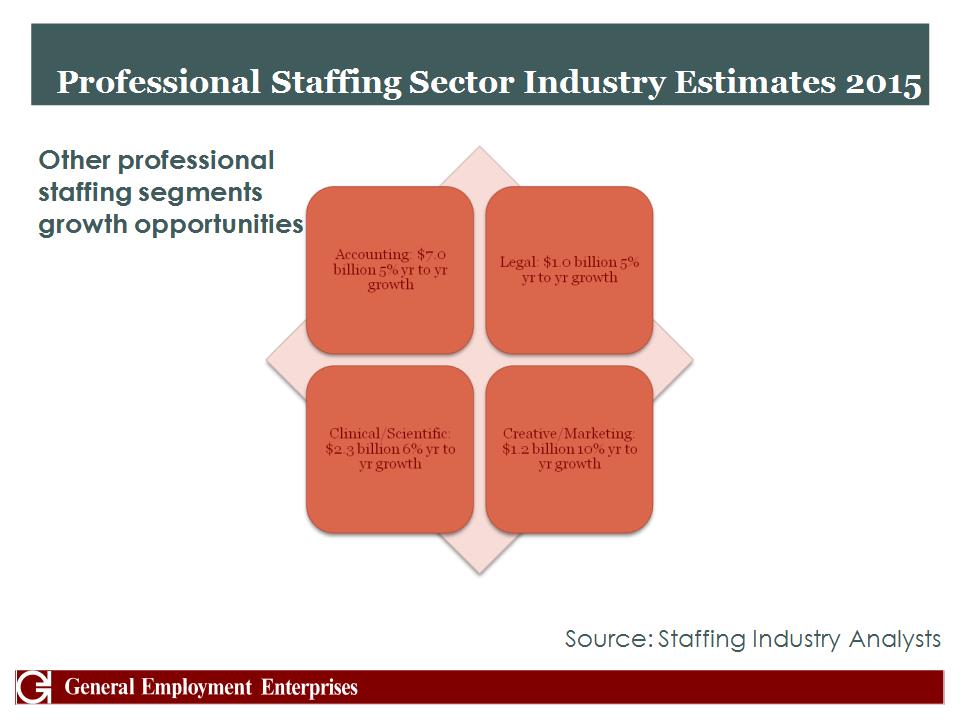
Professional Staffing Sector Industry Estimates 2015 Source: Staffing Industry Analysts Other professional staffing segments growth opportunities
18
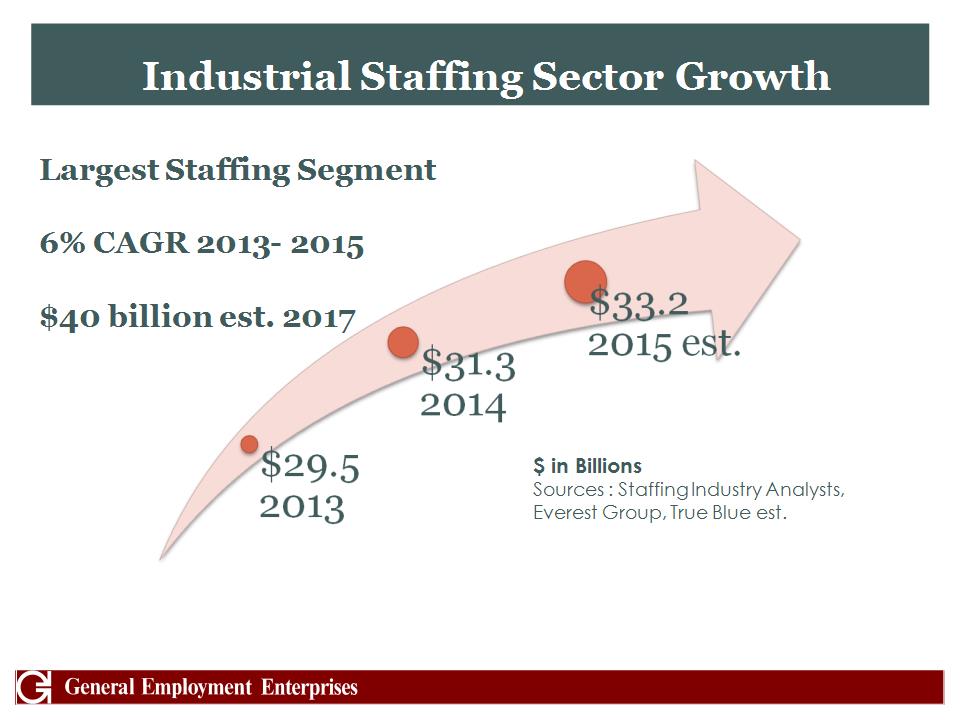
Industrial Staffing Sector Growth $ in Billions Sources : Staffing Industry Analysts, Everest Group, True Blue est. Largest Staffing Segment 6% CAGR 2013- 2015 $40 billion est. 2017
19
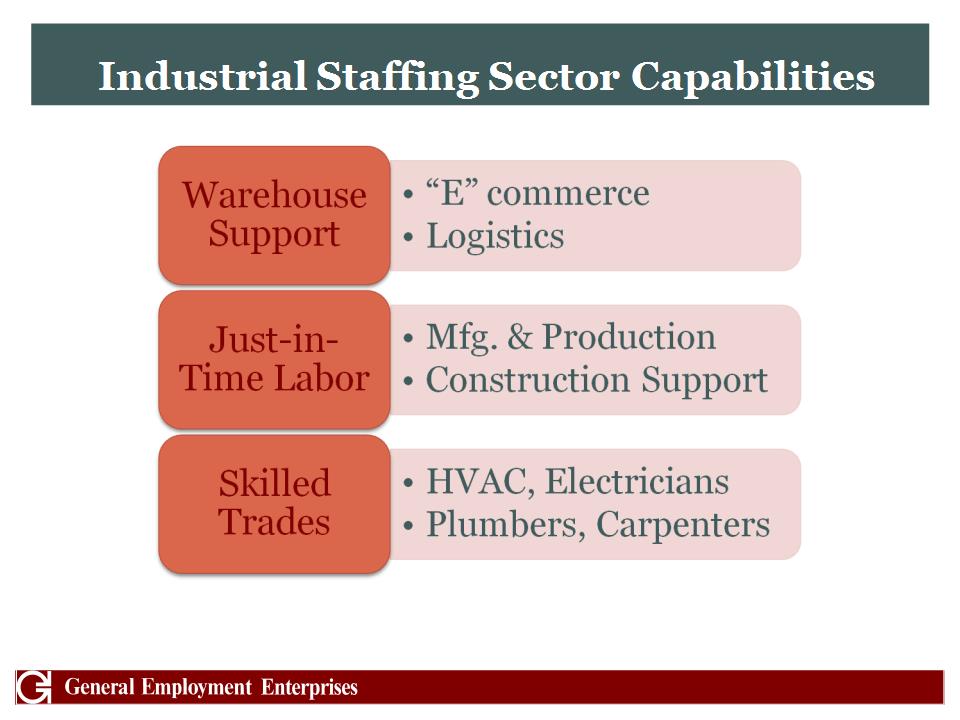
Industrial Staffing Sector Capabilities
20
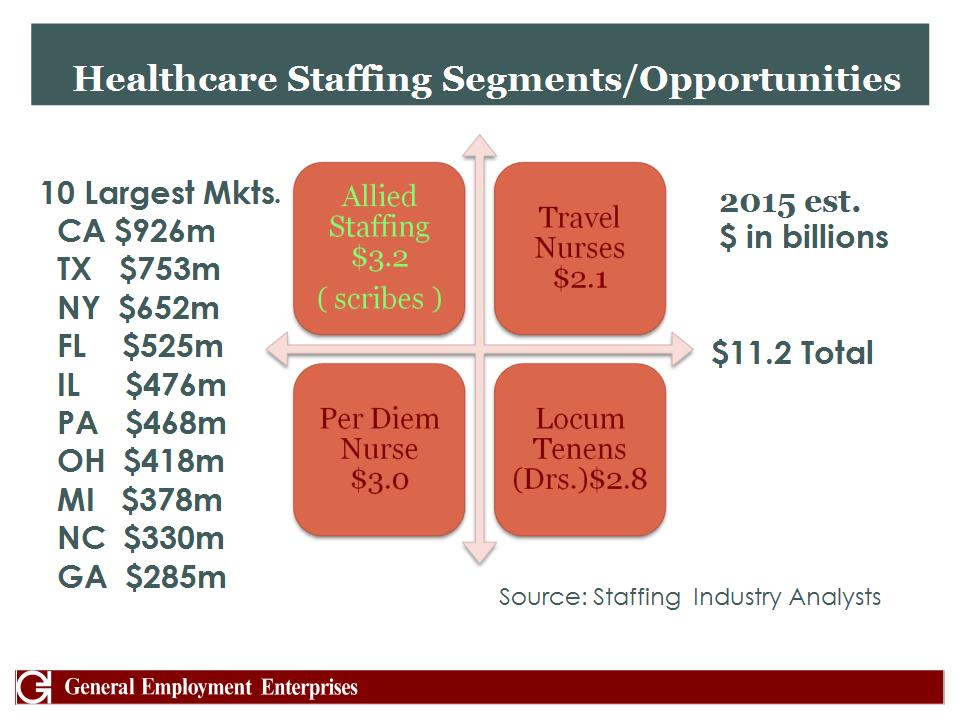
Healthcare Staffing Segments/Opportunities Source: Staffing Industry Analysts 2015 est. $ in billions 10 Largest Mkts. CA $926m TX $753m NY $652m FL $525m IL $476m PA $468m OH $418m MI $378m NC $330m GA $285m $11.2 Total
21
Acquisition of Scribe Solutions Definitive agreement signed in December 2014; anticipated to close by 3/31/15 Scribe provides Emergency Rooms (ER) & Physician Practices with highly trained medical scribes for personal assistant work in connection with electronic medical records (EMR) Scribe recruits, qualifies, hires and trains all resources Demand driven by: Over crowded ER & Dr. waiting rooms, EMR issues Rising cost of patient care, ICD 9 & 10, ACA, RCM Increased burden of documentation and clerical work
22
Proven New CEO Derek Dewan will join General Employment as the Company’s CEO upon completion of Scribe acquisition Mr. Dewan was previously Chairman and CEO of MPS Group, Inc. (NYSE:MPS) and predecessor AccuStaff Incorporated, a multi-billion global Fortune 1000 staffing provider MPS Group grew organically and through acquisition into an international professional human capital solutions and staffing provider with a vast network of offices in the United States, Canada, the United Kingdom, Continental Europe, Asia and Australia Successful IPO in 1994, $10.50 price surged to $240; follow-on stock offerings of $110 million and $370 million; $500 million bank revolver In 2009, Mr. Dewan was instrumental in the sale of MPS Group to the largest staffing company in the world, Adecco Group, for $1.3 billion
23
Experienced Core Management Andrew J. Norstrud, CFO – Mr. Norstrud will transition back into the position of Chief Financial Officer upon completion of Scribe acquisition. He started with General Employment in March 2013 as CFO and brings significant experience with public companies in the areas of financial reporting, restructuring for profitability and growth, acquisitions, and technology. He is a CPA and was formerly with PricewaterhouseCoopers (PwC) and Grant Thornton. Deborah Santora-Tuohy, President of Staffing –Mrs. Santora-Tuohy has been with the Light Industrial Division for over 23 years, and was recently promoted to President of the Staffing Division to focus on internal expansion outside of Ohio and increasing profitability. Branch Level Managers – Our offices are operated by long tenured managers that have spent more than 10 years with General Employment, with our longest tenured manager at 45 years and continues to operate a profitable location in Columbus, Ohio.
24

Financial Overview
25
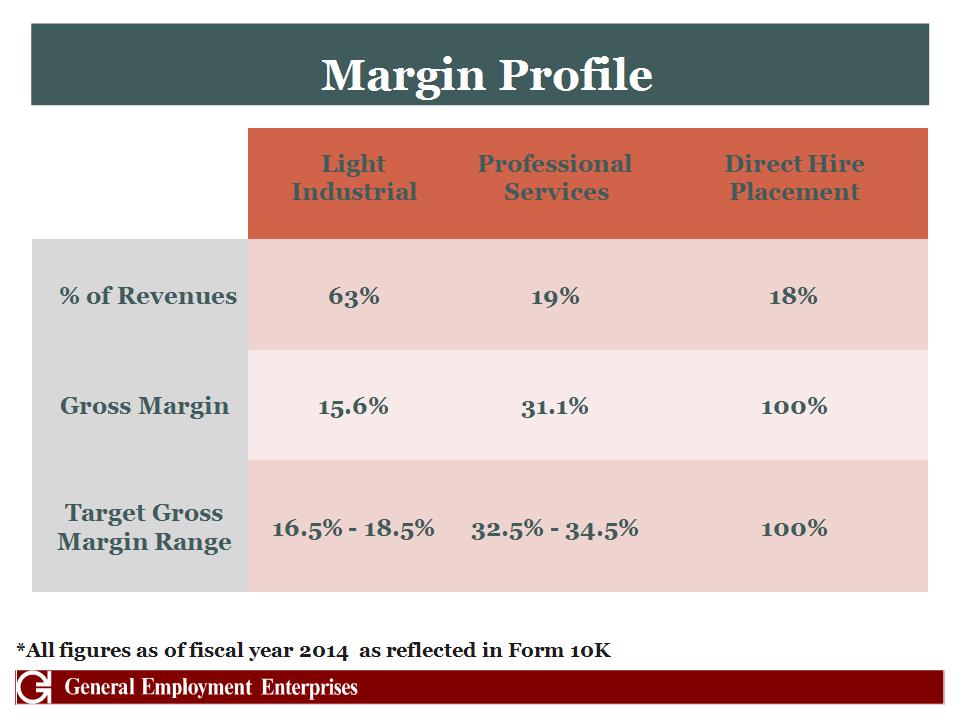
Margin Profile *All figures as of fiscal year 2014 as reflected in Form 10K Light Industrial Professional Services Direct Hire Placement % of Revenues 63% 19% 18% Gross Margin 15.6% 31.1% 100% Target Gross Margin Range 16.5% – 18.5% 32.5% – 34.5% 100%
26
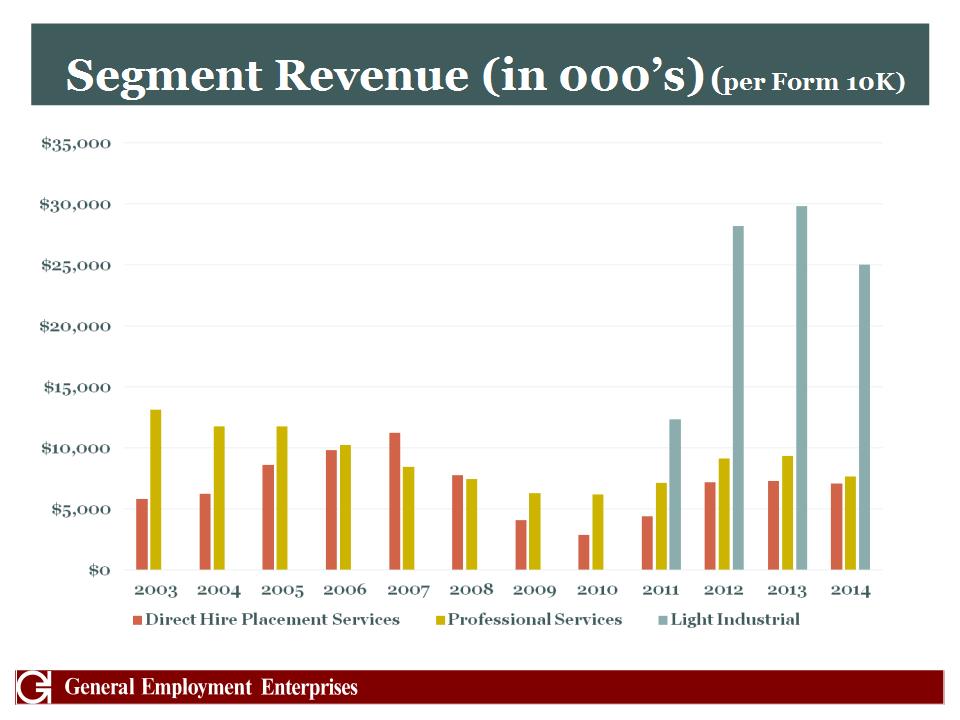
Segment Revenue (in 000’s) (per Form 10K)
27
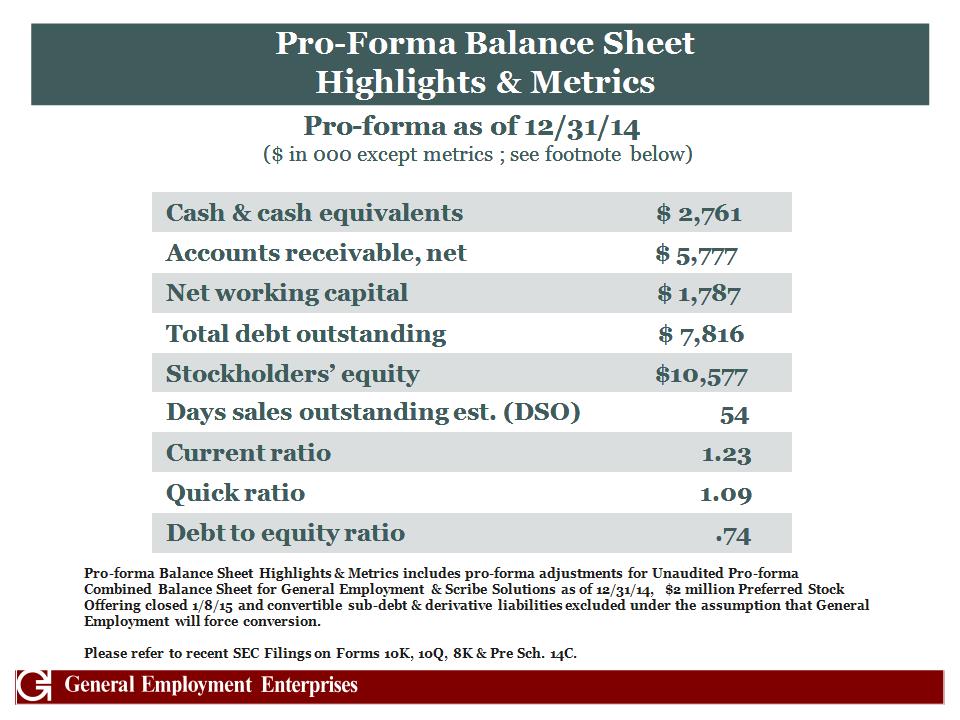
Pro-Forma Balance Sheet Highlights & Metrics Pro-forma as of 12/31/14 ($ in 000 except metrics ; see footnote below) Cash & cash equivalents $ 2,761 Accounts receivable, net $ 5,777 Net working capital $ 1,787 Total debt outstanding $ 7,816 Stockholders’ equity $10,577 Days sales outstanding est. (DSO) 54 Current ratio 1.23 Quick ratio 1.09 Debt to equity ratio .74 Pro-forma Balance Sheet Highlights & Metrics includes pro-forma adjustments for Unaudited Pro-forma Combined Balance Sheet for General Employment & Scribe Solutions as of 12/31/14, $2 million Preferred Stock Offering closed 1/8/15 and convertible sub-debt & derivative liabilities excluded under the assumption that General Employment will force conversion. Please refer to recent SEC Filings on Forms 10K, 10Q, 8K & Pre Sch. 14C.
28
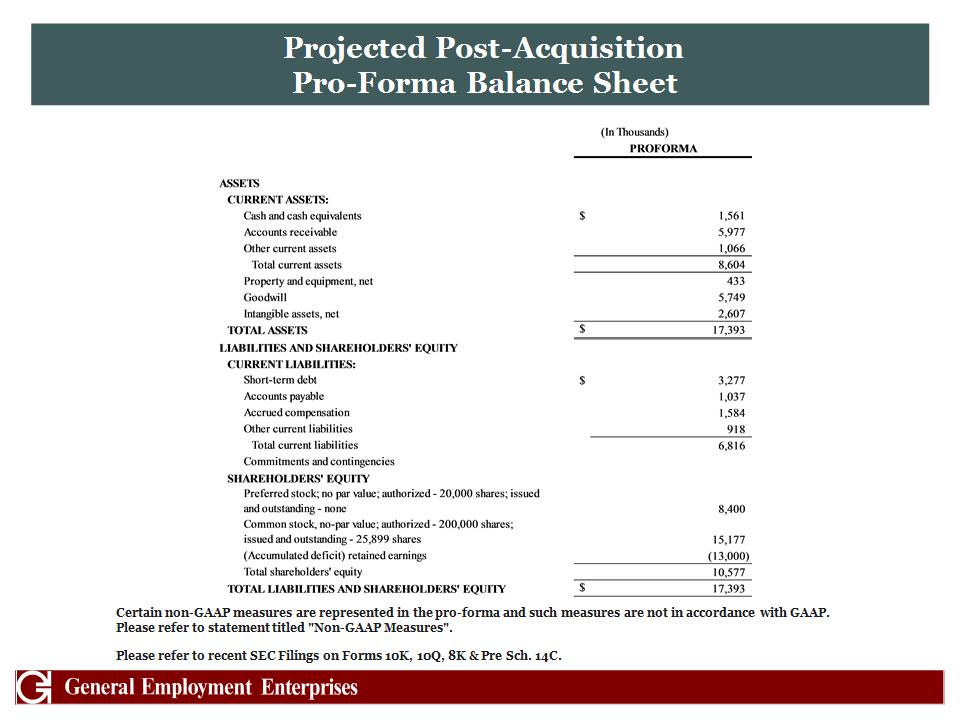
Projected Post-Acquisition Pro-Forma Balance Sheet Certain non-GAAP measures are represented in the pro-forma and such measures are not in accordance with GAAP. Please refer to statement titled "Non-GAAP Measures". Please refer to recent SEC Filings on Forms 10K, 10Q, 8K & Pre Sch. 14C.
29
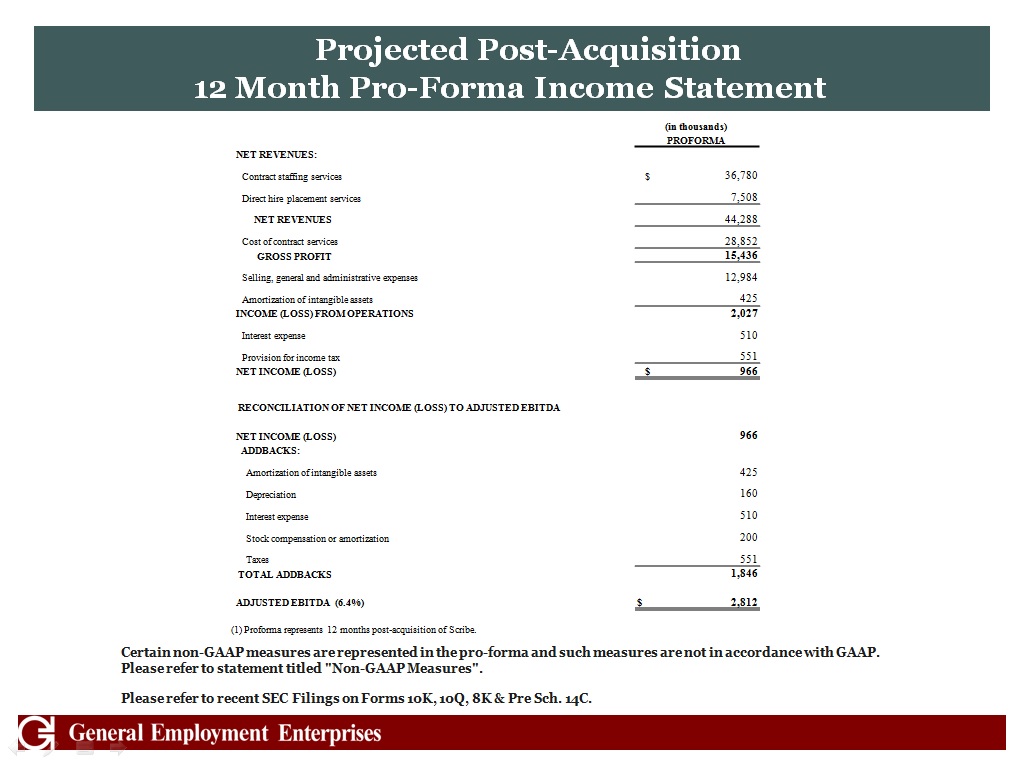
Projected Post-Acquisition 12 Month Pro-Forma Income Statement (in thousands) (in thousands) PROFORMA PROFORMA NET REVENUES: Contract staffing services $ 36,780 Direct hire placement services 7,508 NET REVENUES 44,288 Cost of contract services 28,852 GROSS PROFIT 15,436 Selling, general and administrative expenses 12,984 Amortization of intangible assets 425 INCOME (LOSS) FROM OPERATIONS 2,027 Interest expense 510 Provision for income tax 551 NET INCOME (LOSS) $ 966 RECONCILIATION OF NET INCOME (LOSS) TO ADJUSTED EBITDA RECONCILIATION OF NET INCOME (LOSS) TO ADJUSTED EBITDA RECONCILIATION OF NET INCOME (LOSS) TO ADJUSTED EBITDA RECONCILIATION OF NET INCOME (LOSS) TO ADJUSTED EBITDA NET INCOME (LOSS) 966 ADDBACKS: Amortization of intangible assets 425 Depreciation 160 Interest expense 510 Stock compensation or amortization 200 Taxes 551 TOTAL ADDBACKS 1,846 ADJUSTED EBITDA (6.4%) $ 2,812 (1) Proforma represents 12 months post-acquisition of Scribe. (1) Proforma represents 12 months post-acquisition of Scribe. (1) Proforma represents 12 months post-acquisition of Scribe. (1) Proforma represents 12 months post-acquisition of Scribe. (1) Proforma represents 12 months post-acquisition of Scribe. Certain non-GAAP measures are represented in the pro-forma and such measures are not in accordance with GAAP. Please refer to statement titled "Non-GAAP Measures". Please refer to recent SEC Filings on Forms 10K, 10Q, 8K & Pre Sch. 14C.
30
Growth Strategy
31
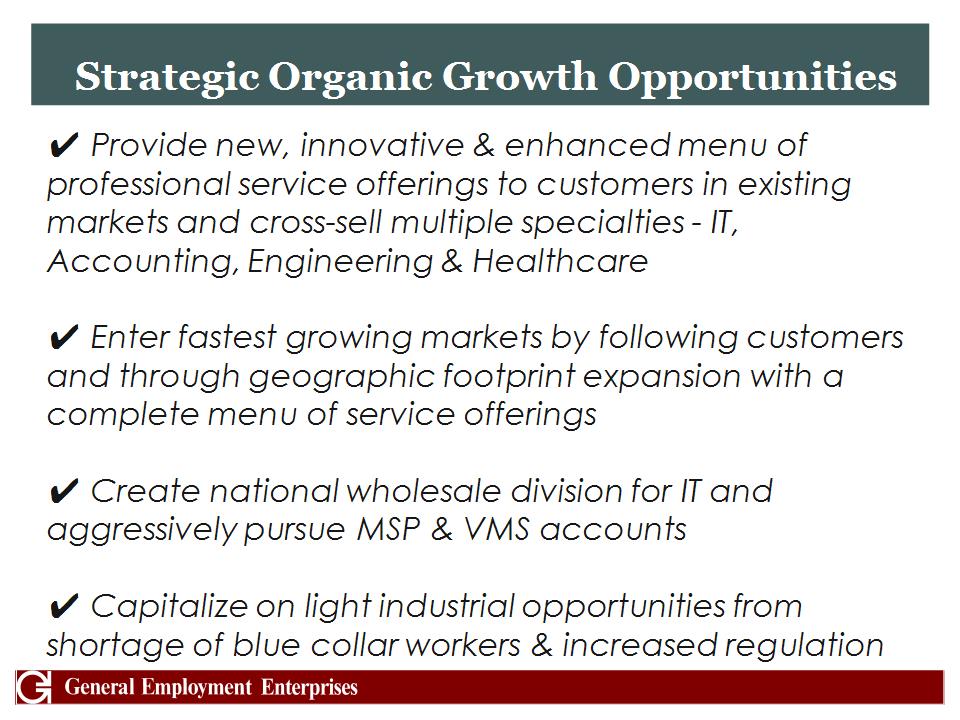
Strategic Organic Growth Opportunities Provide new, innovative & enhanced menu of professional service offerings to customers in existing markets and cross-sell multiple specialties - IT, Accounting, Engineering & Healthcare Enter fastest growing markets by following customers and through geographic footprint expansion with a complete menu of service offerings Create national wholesale division for IT and aggressively pursue MSP & VMS accounts Capitalize on light industrial opportunities from shortage of blue collar workers & increased regulation
32
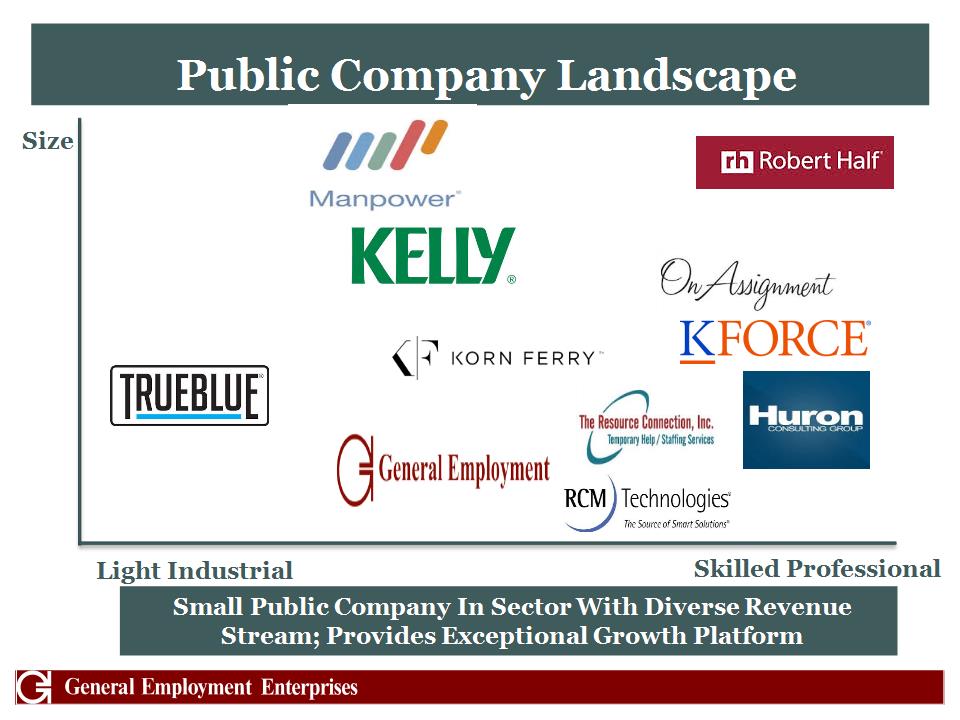
Public Company Landscape Size Light Industrial Skilled Professional Small Public Company In Sector With Diverse Revenue Stream; Provides Exceptional Growth Platform
33
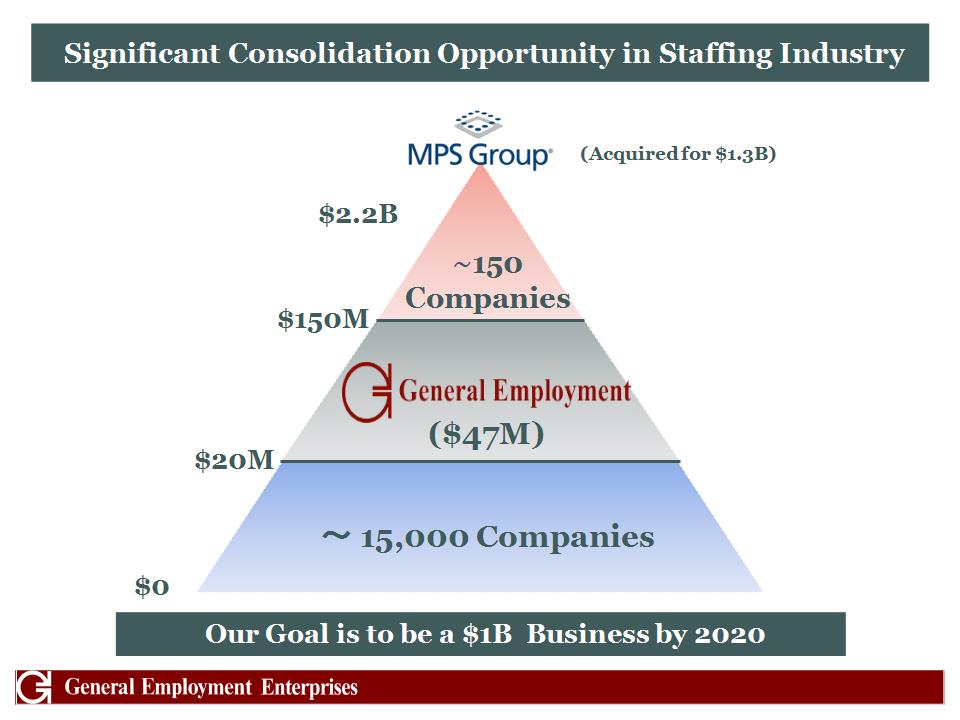
Significant Consolidation Opportunity in Staffing Industry $150M $20M ~ 15,000 Companies Our Goal is to be a $1B Business by 2020 ($47M) $0 ~150 Companies (Acquired for $1.3B) $2.2B
34
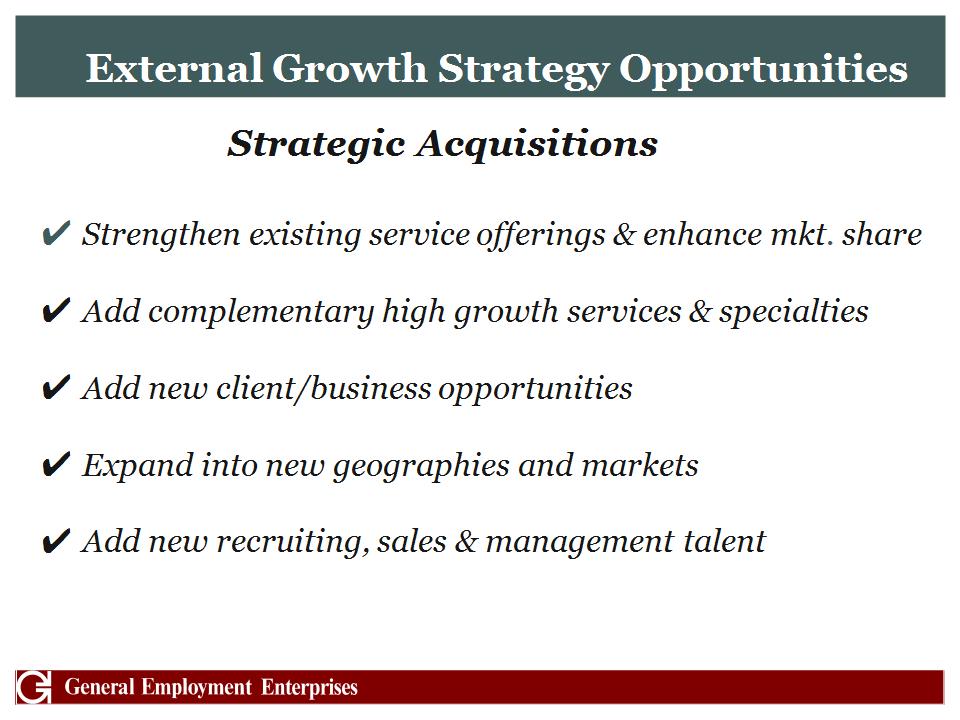
External Growth Strategy Opportunities Strategic Acquisitions Strengthen existing service offerings & enhance mkt. share Add complementary high growth services & specialties Add new client/business opportunities Expand into new geographies and markets Add new recruiting, sales & management talent
35
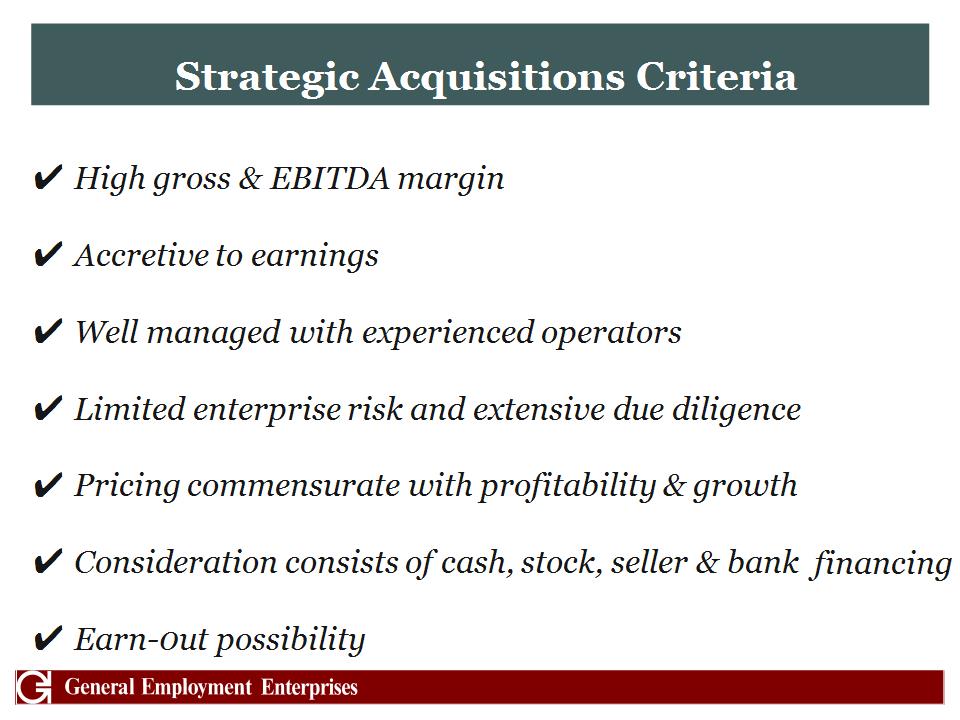
Strategic Acquisitions Criteria High gross & EBITDA margin Accretive to earnings Well managed with experienced operators Limited enterprise risk and extensive due diligence Pricing commensurate with profitability & growth Consideration consists of cash, stock, seller & bank financing Earn-0ut possibility
36
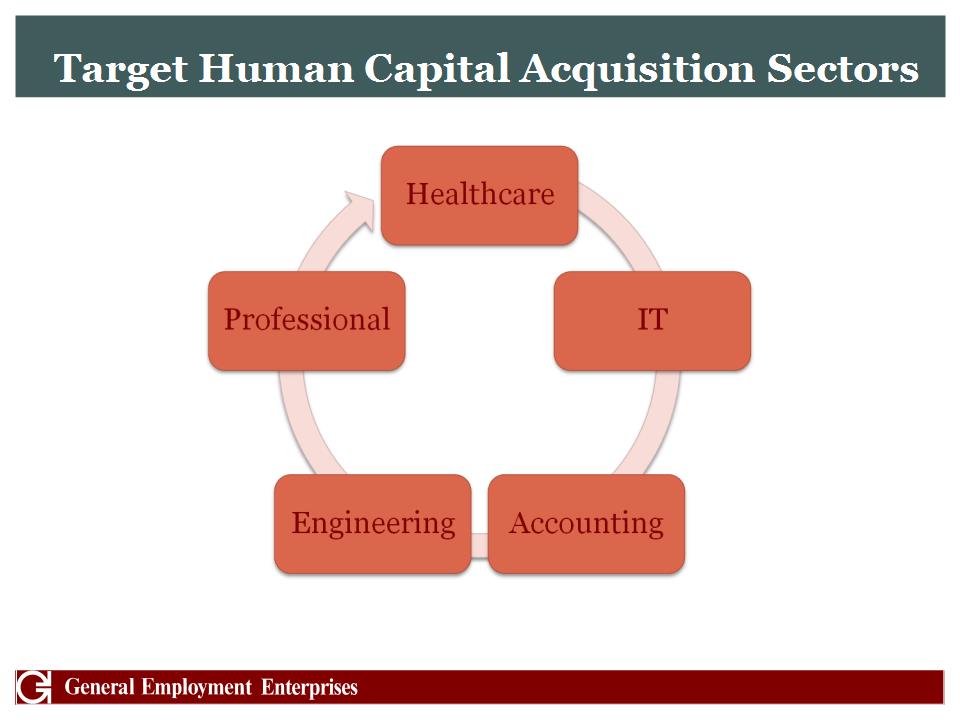
Target Human Capital Acquisition Sectors
37
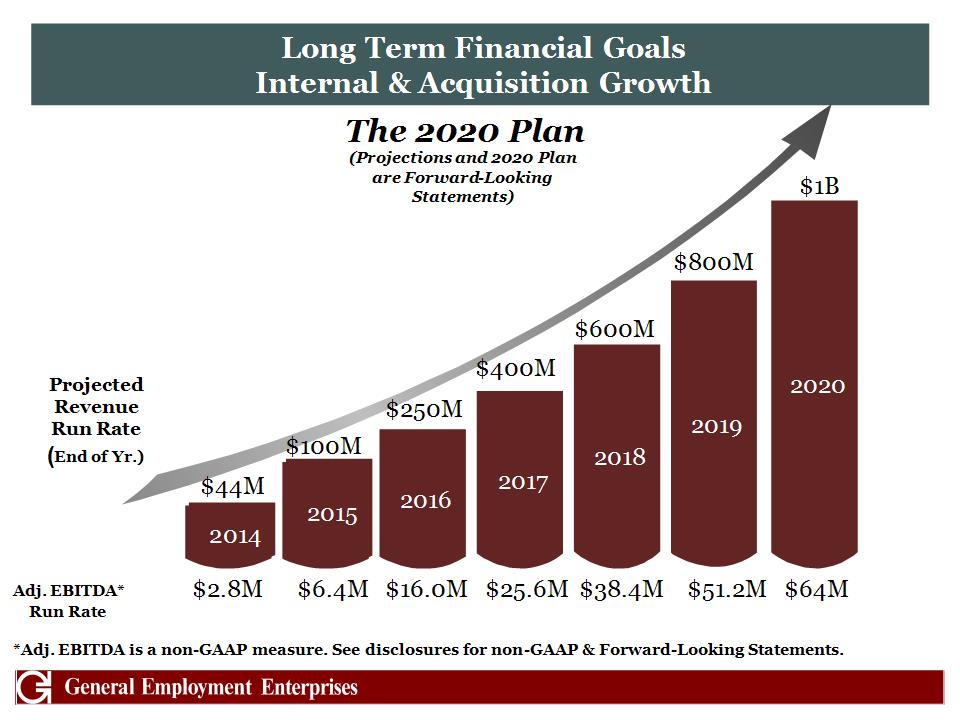
Long Term Financial Goals Internal & Acquisition Growth 2020 2019 2018 2017 2016 2015 2014 Projected Revenue Run Rate (End of Yr.) $44M $100M $250M $400M $600M $800M $1B The 2020 Plan (Projections and 2020 Plan are Forward-Looking Statements) Adj. EBITDA* $2.8M $6.4M $16.0M $25.6M $38.4M $51.2M $64M Run Rate *Adj. EBITDA is a non-GAAP measure. See disclosures for non-GAAP & Forward-Looking Statements. 2015 2014
38
Contacts Corporate Headquarters 184 Shuman Boulevard Suite 420 Naperville, IL 60563 P: 630.954.0400 F: 630.954.0447 Company Contacts Derek E. Dewan, CEO (Incoming) 13500 Sutton Park Drive South Suite 204 Jacksonville, FL 32224 E: derek.dewan@genp.com Andrew J. Norstrud, (Int. CEO), CFO Woodland Corporate Center 8270 Woodland Center Blvd. Tampa, FL 33614 P: 813.769.3580 E: andrew.norstrud@genp.com Legal Counsel Clint Gage - Partner Roetzel & Andress P: 954.759.2760 E: cgage@ralaw.com For more information, please visit http://www.genp.com/ Independent Auditor Ron Frimmer, CPA – Partner Friedman LLP 1700 Broadway Suite 23 New York, NY 10019 E: rfrimmer@friedmanllp.com
39
Questions? Employing America since 1893 NYSE: JOB
40