Attached files
| file | filename |
|---|---|
| 8-K - FORM 8-K - Bridge Capital Holdings | d889197d8k.htm |
| EX-99.1 - EX-99.1 - Bridge Capital Holdings | d889197dex991.htm |
Exhibit 99.2
WESTERN ALLIANCE
BANCORPORATIONTM
BridgeBank
A Compelling Combination
March 9, 2015
Forward-Looking Statements
This release contains forward-looking statements that relate to expectations, beliefs, projections, future plans and strategies, anticipated events or trends and similar expressions concerning matters that are not historical facts. The forward-looking statements contained herein reflect the companies’ current views about future events and financial performance and are subject to risks, uncertainties, assumptions and changes in circumstances that may cause our actual results to differ significantly from historical results and those expressed in any forward-looking statement. In addition to factors previously disclosed in Western Alliance Bancorporation’s (the “Company” or “WAL”) and Bridge Capital Holdings’ (“Bridge”) reports filed with the Securities and Exchange Commission (the “SEC”), some factors that could cause actual results to differ materially from historical or expected results include: failure of the parties to satisfy the closing conditions in the merger agreement in a timely manner or at all; failure of the shareholders of Bridge to approve the merger agreement; failure to obtain governmental approvals for the merger; disruptions to the parties’ businesses as a result of the announcement and pendency of the merger; costs or difficulties related to the integration of the business following the merger; failure to realize cost savings and other benefits of the merger; Bridge customer acceptance of the Company’s products and services; changes in general economic conditions, either nationally or locally in the areas in which each company conducts or will conduct its business; inflation, interest rate, market and monetary fluctuations; increases in competitive pressures among financial institutions and businesses offering similar products and services; and other factors affecting the financial services industry generally or the banking industry in particular.
We do not intend and disclaim any duty or obligation to update or revise any industry information or forward-looking statements set forth in this presentation to reflect new information, future events or otherwise.
Estimated numbers are used for illustrative purposes only and are not forecasts, and actual results may differ materially.
2
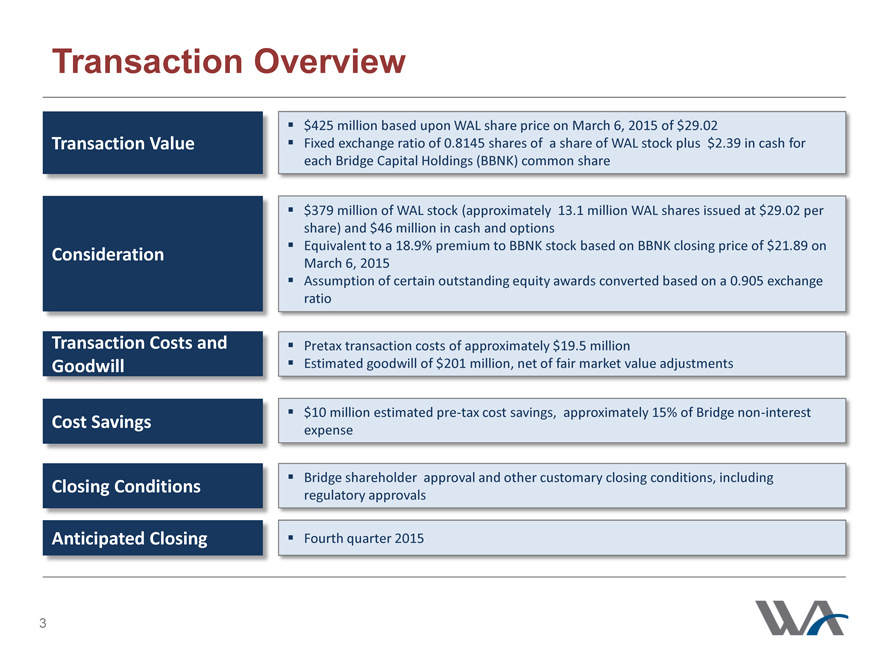
Transaction Overview
$425 million based upon WAL share price on March 6, 2015 of $29.02
Transaction Value Fixed exchange ratio of 0.8145 shares of a share of WAL stock plus $2.39 in cash for
each Bridge Capital Holdings (BBNK) common share
$379 million of WAL stock (approximately 13.1 million WAL shares issued at $29.02 per
share) and $46 million in cash and options
Consideration Equivalent to a 18.9% premium to BBNK stock based on BBNK closing price of $21.89 on
March 6, 2015
Assumption of certain outstanding equity awards converted based on a 0.905 exchange
ratio
Transaction Costs and Pretax transaction costs of approximately $19.5 million
Goodwill Estimated goodwill of $201 million, net of fair market value adjustments
$10 million estimated pre-tax cost savings, approximately 15% of Bridge non-interest
Cost Savings expense
Closing Conditions Bridge shareholder approval and other customary closing conditions, including
regulatory approvals
Anticipated Closing Fourth quarter 2015
3
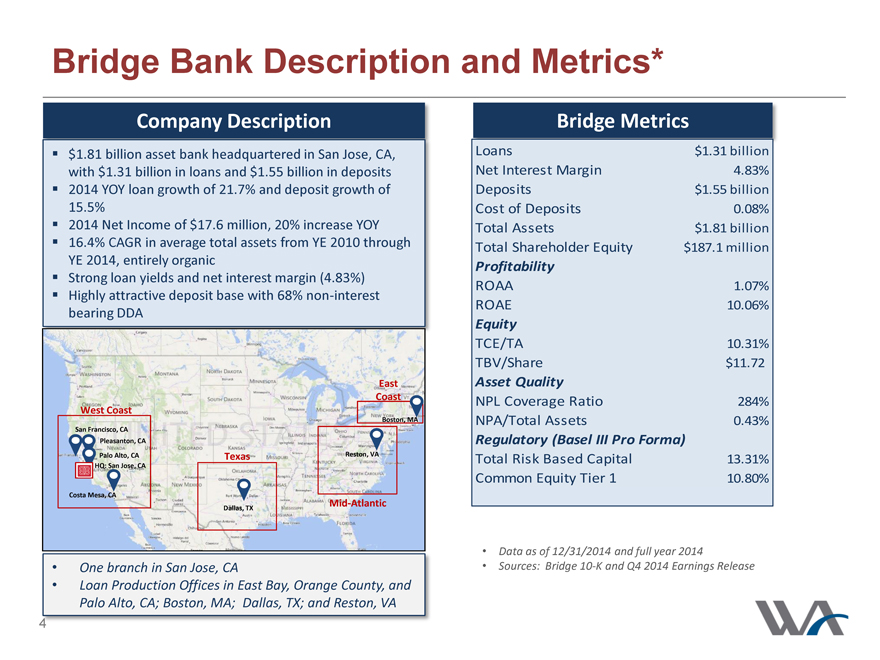
Bridge Bank Description and Metrics*
Company Description
$1.81 billion asset bank headquartered in San Jose, CA,
with $1.31 billion in loans and $1.55 billion in deposits
2014 YOY loan growth of 21.7% and deposit growth of
15.5%
2014 Net Income of $17.6 million, 20% increase YOY
16.4% CAGR in average total assets from YE 2010 through
YE 2014, entirely organic
Strong loan yields and net interest margin (4.83%)
Highly attractive deposit base with 68% non-interest
bearing DDA
East
Coast
West Coast
Boston, MA
San Francisco, CA
Pleasanton, CA
Palo Alto, CA Texas Reston, VA
HQ: San Jose, CA
Costa Mesa, CA
Mid-Atlantic
Dallas, TX
One branch in San Jose, CA
Loan Production Offices in East Bay, Orange County, and
Palo Alto, CA; Boston, MA; Dallas, TX; and Reston, VA
Bridge Metrics
Loans $1.31 billion
Net Interest Margin 4.83%
Deposits $1.55 billion
Cost of Deposits 0.08%
Total Assets $1.81 billion
Total Shareholder Equity $187.1 million
Profitability
ROAA 1.07%
ROAE 10.06%
Equity
TCE/TA 10.31%
TBV/Share $11.72
Asset Quality
NPL Coverage Ratio 284%
NPA/Total Assets 0.43%
Regulatory (Basel III Pro Forma)
Total Risk Based Capital 13.31%
Common Equity Tier 1 10.80%
Data as of 12/31/2014 and full year 2014
Sources: Bridge 10-K and Q4 2014 Earnings Release
4
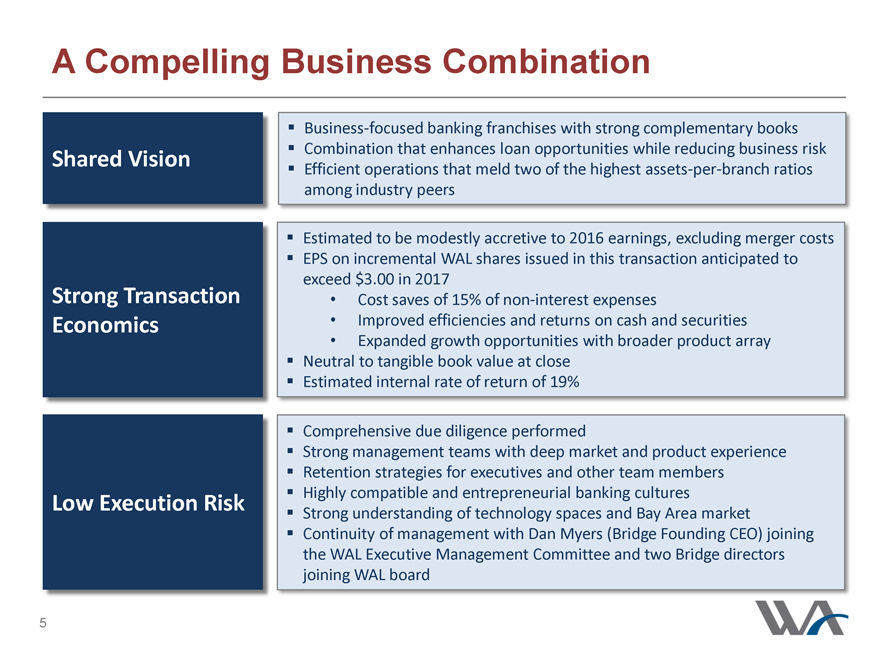
A Compelling Business Combination
Business-focused banking franchises with strong complementary books
Combination that enhances loan opportunities while reducing business risk
Shared Vision
Efficient operations that meld two of the highest assets-per-branch ratios among industry peers
Estimated to be modestly accretive to 2016 earnings, excluding merger costs
EPS on incremental WAL shares issued in this transaction anticipated to exceed $3.00 in 2017
Strong Transaction
Cost saves of 15% of non-interest expenses
Economics
Improved efficiencies and returns on cash and securities
Expanded growth opportunities with broader product array
Neutral to tangible book value at close
Estimated internal rate of return of 19%
Comprehensive due diligence performed
Strong management teams with deep market and product experience
Retention strategies for executives and other team members
Highly compatible and entrepreneurial banking cultures
Low Execution Risk
Strong understanding of technology spaces and Bay Area market
Continuity of management with Dan Myers (Bridge Founding CEO) joining the WAL Executive Management Committee and two Bridge directors joining WAL board
5
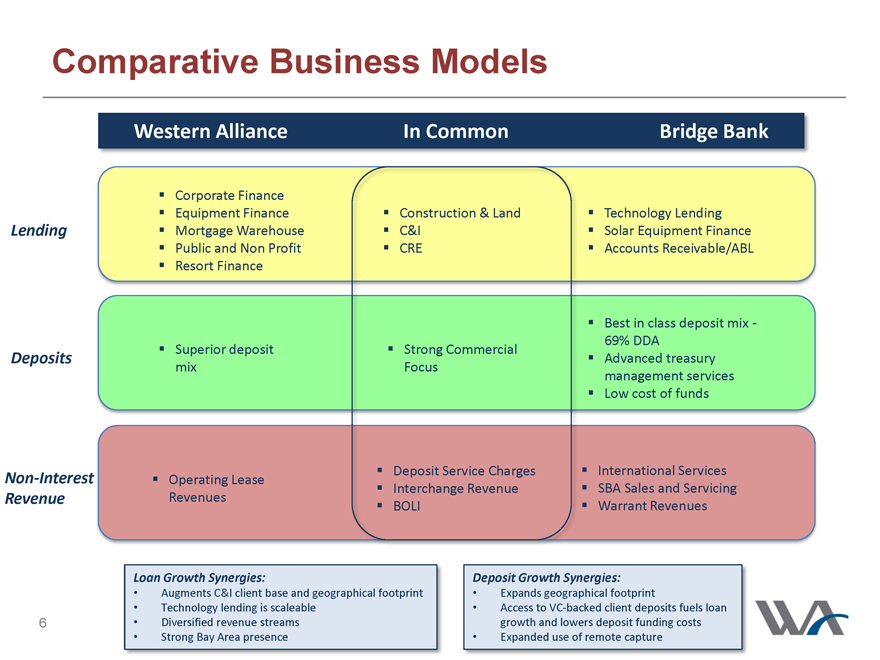
Comparative Business Models
Western Alliance
In Common
Bridge Bank
Corporate Finance
Equipment Finance
Construction & Land
Technology Lending
Lending
Mortgage Warehouse
C&I
Solar Equipment Finance
Public and Non Profit
CRE
Accounts Receivable/ABL
Resort Finance
Best in class deposit mix -
Superior deposit
Strong Commercial
69% DDA
Deposits
Advanced treasury
mix
Focus
management services
Low cost of funds
Non-Interest
Operating Lease
Deposit Service Charges
International Services
Interchange Revenue
SBA Sales and Servicing
Revenue
Revenues
BOLI
Warrant Revenues
Loan Growth Synergies:
Augments C&I client base and geographical footprint
Technology lending is scaleable
Diversified revenue streams
Strong Bay Area presence
Deposit Growth Synergies:
Expands geographical footprint
Access to VC-backed client deposits fuels loan growth and lowers deposit funding costs
Expanded use of remote capture
6
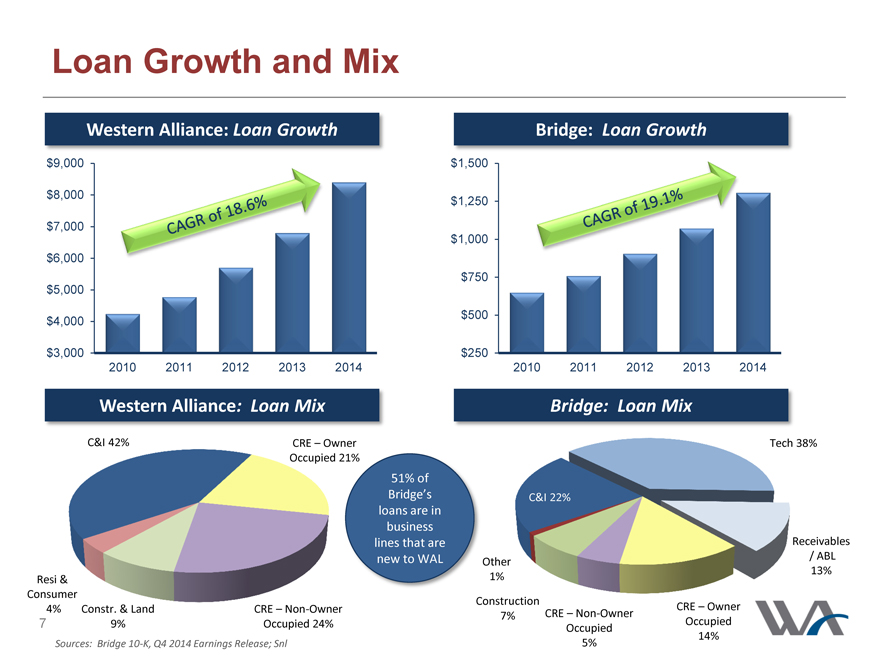
Loan Growth and Mix
Western Alliance: Loan Growth
$ 9,000
$ 8,000
$ 7,000
$ 6,000
$ 5,000
$ 4,000
$ 3,000
2010 2011 2012 2013 2014
Western Alliance: Loan Mix Bridge: Loan Mix
C&I 42% CRE Owner Tech 38%
Occupied 21%
51% of
Bridge’s C&I 22%
loans are in
business
lines that are Receivables
new to WAL Other / ABL
Resi & 1% 13%
Consumer Construction
4% Constr. & Land CRE Non-Owner CRE Owner
7% CRE Non-Owner
7 9% Occupied 24% Occupied Occupied
14%
Sources: Bridge 10-K, Q4 2014 Earnings Release; Snl 5%
Bridge: Loan Growth
$1,500
$1,250
$1,000
$750
$500
$250
2010 2011 2012 2013 2014
7
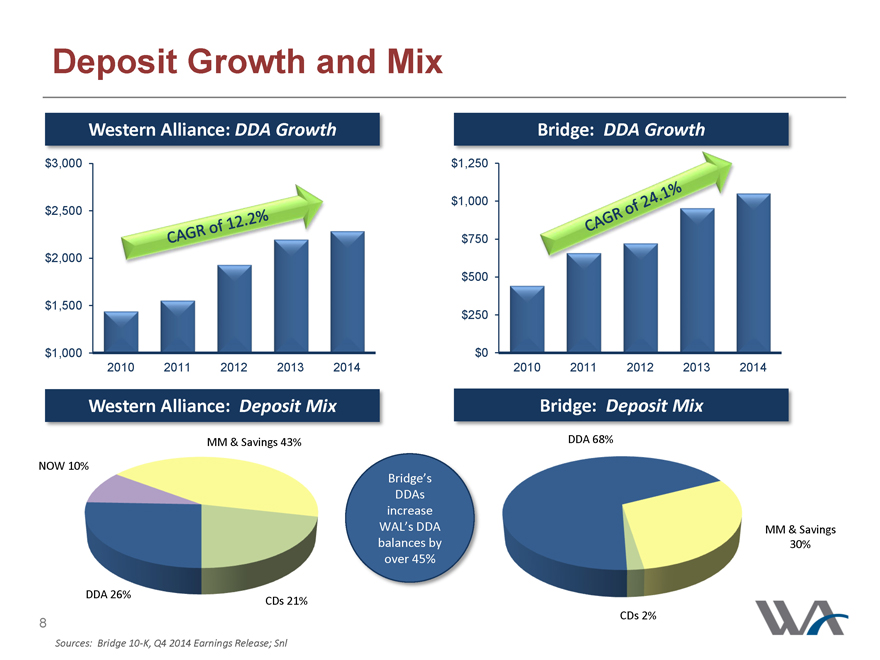
Deposit Growth and Mix
Western Alliance: DDA Growth
$3,000
$2,500
$2,000 CAGR of 12.2%
$1,500
$1,000
2010 2011 2012 2013 2014
Bridge: DDA Growth
$1,250
$1,000
$750 CAGR of 24.1%
$500
$250
$0
2010 2011 2012 2013 2014
Western Alliance: Deposit Mix
MM & Savings 43%
NOW 10%
DDA 26% CDs 21%
Sources: Bridge 10-K, Q4 2014 Earnings Release; Snl
Bridge’s
DDAs increase
WAL’s DDA balances by over 45%
Bridge: Deposit Mix
DDA 68%
MM & Savings
30%
CDs 2%
WA
8
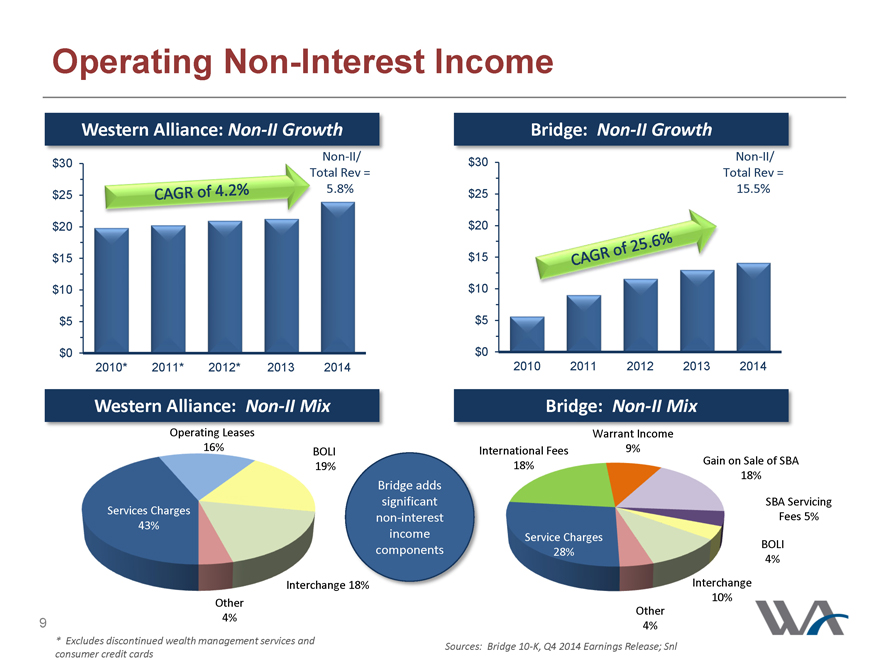
Operating Non-Interest Income
Western Alliance: Non-II Growth
$30 Non-II/
Total Rev =
$25 CAGR of 4.2% 5.8%
$20
$15
$10
$5
$0
2010* 2011* 2012* 2013 2014
Bridge: Non-II Growth
$30 Non-II/
Total Rev =
$25 15.5%
$20
$15
$10 CAGR of 25.6%
$5
$0
2010 2011 2012 2013 2014
Western Alliance: Non-II Mix
Operating Leases
16% BOLI
19%
Services Charges
43%
Interchange 18%
Other
4%
* Excludes discontinued wealth management services and consumer credit cards
Bridge adds significant non-interest income components
Bridge: Non-II Mix
Warrant Income
International Fees 9%
18% Gain on Sale of SBA
18%
SBA Servicing
Fees 5%
Service Charges
BOLI
28%
4%
Interchange
10%
Other
4%
Sources: Bridge 10-K, Q4 2014 Earnings Release; Snl
WA
9
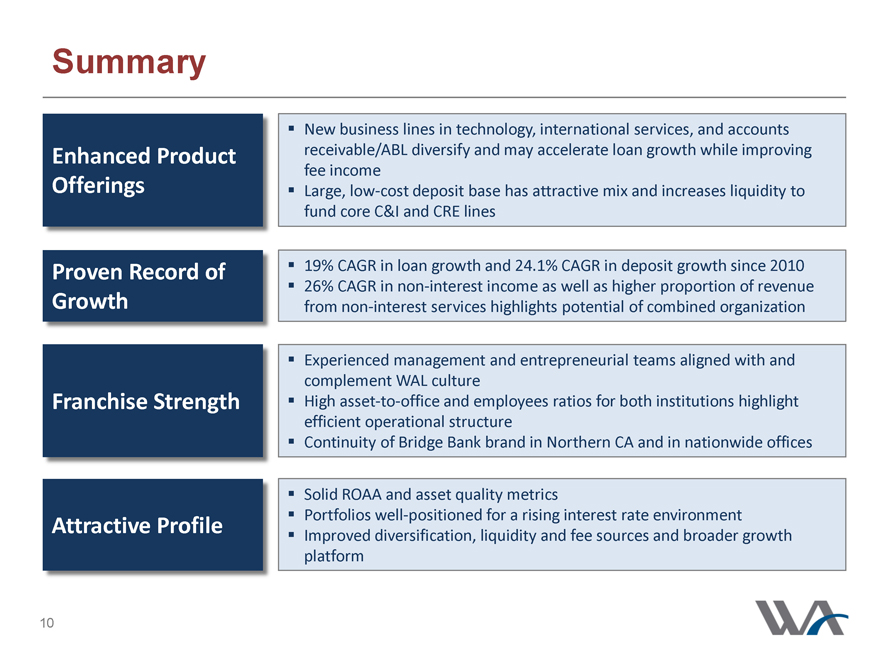
Summary
Enhanced Product Offerings New business lines in technology, international services, and accounts receivable/ABL diversify and may accelerate loan growth while improving fee income
Large, low-cost deposit base has attractive mix and increases liquidity to fund core C&I and CRE lines
Proven Record of Growth 19% CAGR in loan growth and 24.1% CAGR in deposit growth since 2010
26% CAGR in non-interest income as well as higher proportion of revenue from non-interest services highlights potential of combined organization
Experienced management and entrepreneurial teams aligned with and complement WAL culture
Franchise Strength High asset-to-office and employees ratios for both institutions highlight efficient operational structure
Continuity of Bridge Bank brand in Northern CA and in nationwide offices
Solid ROAA and asset quality metrics
Portfolios well-positioned for a rising interest rate environment
Attractive Profile Improved diversification, liquidity and fee sources and broader growth platform
WA
10
Further Disclosures
Non-GAAP Information
This presentation contains financial information and performance measures determined by methods other than in accordance with accounting principles generally accepted in the United States of America. These non-GAAP measures are believed to provide information to investors that is useful in understanding Bridge’s financial condition. These disclosures should not be viewed as a substitute for financial measures determined in accordance with GAAP, nor are they necessarily comparable with non-GAAP performance measures that may be presented by other companies.
Additional Information
This communication is being made in respect of the proposed merger involving the Company and Bridge and does not constitute an offer to sell or the solicitation of an offer to buy any securities or a solicitation of any vote or approval. In connection with the proposed merger with Bridge, the Company will file with the SEC a Registration Statement on Form S-4 that will include a proxy statement of Bridge that also constitutes a prospectus of the Company. Bridge will mail the proxy statement/prospectus to its shareholders. Investors and security holders are urged to read the proxy statement/prospectus regarding the proposed merger when it becomes available because it will contain important information. You may obtain a free copy of the proxy statement/prospectus (when available) and other related documents filed by the Company and Bridge with the SEC at the SEC’s website at www.sec.gov. The proxy statement/prospectus (when it is available) and the other documents may also be obtained for free by accessing the Company’s website at www.westernalliancebancorp.com under the tab “Investor Relations” and then under the heading “Financial Documents” or by accessing Bridge’s website at www.bridgebank.com under the tab “About Us—Investor Relations” and then under the heading “Documents & SEC Filings”.
Participants in the Transactions
The Company, Bridge and their respective directors, executive officers and certain other members of management and employees may be soliciting proxies from Bridge shareholders in favor of the merger with the Company. Information regarding the persons who may, under the rules of the SEC, be considered participants in the solicitation of the Bridge shareholders in connection with the proposed merger will be set forth in the proxy statement/prospectus when it is filed with the SEC. You can find information about the executive officers and directors of the Company in its Annual Report on Form 10-K for the year ended December 31, 2014 and in its definitive proxy statement filed with the SEC on April 2, 2014, as amended. You can find information about Bridge’s executive officers and directors in its Annual Report on Form 10-K for the year ended December 31, 2014 and in its definitive proxy statement filed with the SEC on April 15, 2014. You can obtain free copies of these documents from the Company or Bridge using the information above.
WA
11