Attached files
| file | filename |
|---|---|
| 8-K - 8-K - AECOM | a15-6338_18k.htm |
Exhibit 99.1
|
|
AECOM March 2015 |

|
|
Safe Harbor Except for historical information contained herein, this presentation contains “forward-looking statements.” All statements other than statements of historical fact are “forward-looking statements” for purposes of federal and state securities laws, including any projections of earnings, revenue or other financial items; any statements of the plans, strategies and objectives of management for future operations; any statements concerning proposed new services or developments; any statements regarding future economic conditions or performance; any statements of belief; and any statements of assumptions underlying any of the foregoing. Forward-looking statements may include the words “may,” “will,” “estimate,” “intend,” “continue,” “believe,” “expect” or “anticipate” and other similar words. Although we believe that the expectations reflected in any of our forward-looking statements are reasonable, actual results could differ materially from those projected or assumed in any of our forward-looking statements. Our future financial condition and results of operations, as well as any forward-looking statements, are subject to change and to inherent risks and uncertainties, such as those disclosed in this presentation. Important factors that could cause our actual results, performance and achievements, or industry results to differ materially from estimates or projections contained in forward-looking statements include, among others, the following: uncertainties related to appropriations for funding of, or issuing notices to proceed under, government contracts; our relationships with governmental agencies that may modify, curtail or terminate our contracts; delays in the completion of the budget process of the U.S. government could delay procurement of our services; potential adjustments to government contracts which are subject to audits to determine reimbursable contract costs; adverse results from losses under fixed-price contracts; limited control over operations run through our joint venture entities; misconduct by our employees or consultants or our failure to comply with laws or regulations applicable to our business; current deficits in our defined benefit plans could grow in the future and create additional costs; exposure to legal, political and economic risks in different countries as well as currency exchange rate fluctuations; risks related to security in international locations; failure to successfully execute our merger and acquisition strategy; the need to retain the continued services of our key technical and management personnel and to identify and hire additional qualified personnel; uncertainties about security clearances for our employees; the competitive nature of our business; our liability and insurance policies may not provide adequate coverage; our leveraged position and ability to service our debt; unexpected adjustments and cancellations related to our backlog; dependence on other contractors or subcontractors who could fail to satisfy their obligations; systems and information technology interruption; changing client preferences/demands, fiscal position and payment patterns; and the continuing economic downturn in the U.S. and international markets and tightening of the global credit markets. Additional factors that could cause actual results to differ materially from our forward-looking statements are set forth in our Quarterly Report on Form 10-Q for the period ended December 31, 2014, and our other filings with the Securities and Exchange Commission. We do not intend, and undertake no obligation, to update any forward-looking statement. Non-GAAP Measures Certain measures contained in these slides and related presentation are not measures calculated in accordance with generally accepted accounting principles (GAAP). They should not be considered a replacement for GAAP results. Non-GAAP financial measures appearing in these slides are identified in the footnotes. A reconciliation of these non-GAAP measures to the most directly comparable GAAP financial measures is incorporated in our press release on the Investors section of our Web site at: http://investors.aecom.com. Page 2 Disclosures |
|
|
Vision: Become the world’s leading fully integrated infrastructure firm. Leading provider of infrastructure services with skillsets enhanced through the URS combination. Services span the life-cycle of a project from conception and financing through design, construction, and management services. Global footprint to deliver services to our 25,000 clients and support multinational clients anywhere in the world. Lower risk contract mix and widely diversified end-market exposure lowers earnings volatility and produces consistent cash flow. Proven track record of disciplined capital allocation priorities. Grand Central Terminal East Side Access New York, New York, U.S.A. Page 3 A Leading Global Engineering and Construction Services Company |

|
|
Q1 FY15 Operational Achievements Page 4 Delivered on cash and debt reduction: Generated $253 million of free cash flow and reduced debt by ~$350 million1. Returned to positive organic growth: Delivered 3% constant currency organic revenue growth led by Construction Services (+25%) and improved DCS performance. Americas Design recovery progressing. Organic backlog grew QoQ and YoY. End-market trends remain supportive of a continued recovery. Private sector construction remains strong. Building Construction backlog increased QoQ and YoY. APAC backlog increased by double digits YoY. Markets including Hong Kong remain committed to infrastructure development. Federal diversification continued. $5+ billion of bids being evaluated by customers. Provost Square, Jersey City, New Jersey, U.S.A. 1 Subsequent to the URS acquisition. |

|
|
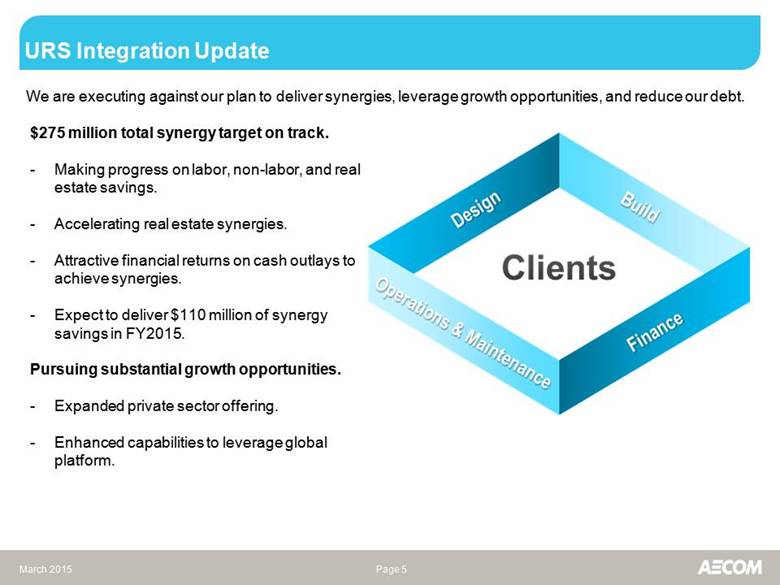
URS Integration Update We are executing against our plan to deliver synergies, leverage growth opportunities, and reduce our debt. Page 5 $275 million total synergy target on track. Making progress on labor, non-labor, and real estate savings. Accelerating real estate synergies. Attractive financial returns on cash outlays to achieve synergies. Expect to deliver $110 million of synergy savings in FY2015. Pursuing substantial growth opportunities. Expanded private sector offering. Enhanced capabilities to leverage global platform. |
|
|
Cash Generation and Capital Allocation Highlights Q1 FY15 Highlights Closed financing of URS transaction. Generated $253 million of FCF1 in Q1 FY15. Repaid approximately $350 million in debt subsequent to closing the URS transaction in October. FY2012-FY2014 Highlights Repurchased $660 million of stock. Cumulative FCF1 of $1 billion; in excess of net income. FY2015+ Priorities Expect to generate $600-$800 million of FCF/year. Target exiting FY17 approaching 2x debt to EBITDA2. Maintain flexibility to respond to changes in financial market conditions. 1 Free cash flow is defined as cash flow from operations less capital expenditures and is a non-GAAP measure. Free cash flow conversion = free cash flow divided by net income; for Q1 FY15, net income excludes acquisition and integration-related expenses, transaction-related financing reported in interest expense, and the amortization of intangible assets. 2 EBITDA is a non-GAAP measure. Page 6 Free Cash Flow1 Conversion |

|
|
Positioned for Domestic Infrastructure Growth AECOM holds the leading position in several market categories. Page 7 An estimated $3.6 trillion1 is needed to maintain domestic infrastructure. Congress working towards a funding solution to support a multi-year highway authorization. Power & chemical opportunities increasing due to lower natural gas prices. Private spending improving; still below prior peak levels. AECOM holds a top ranking2 in key markets: #1 in Facilities #1 in Sports Arena #1 in Transportation #1 in Water #1 in Chemical & Soil Remediation #1 in Site Assessment & Compliance #2 in Power #2 in Hazardous Waste #3 in Autos 1 Per American Society of Civil Engineers. 2 Per Engineering News-Record. One World Trade Center New York, New York, U.S.A. |
|
|
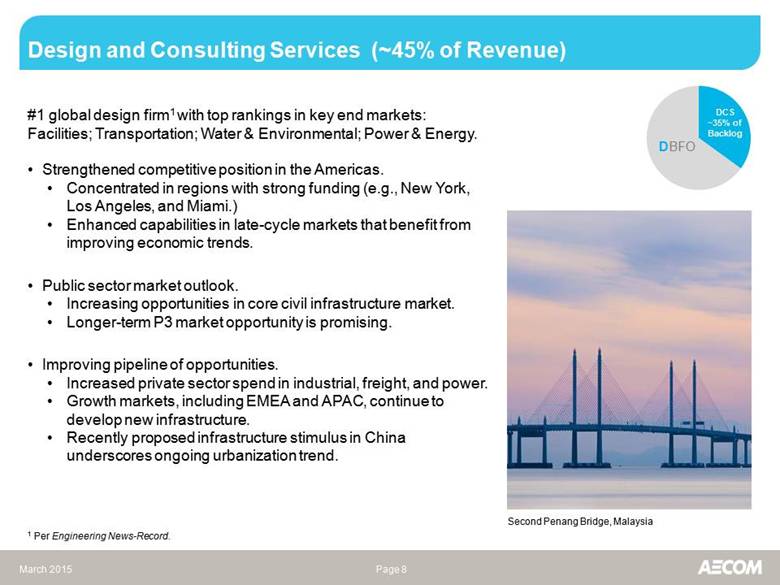
Design and Consulting Services (~45% of Revenue) Page 8 #1 global design firm1 with top rankings in key end markets: Facilities; Transportation; Water & Environmental; Power & Energy. Strengthened competitive position in the Americas. Concentrated in regions with strong funding (e.g., New York, Los Angeles, and Miami.) Enhanced capabilities in late-cycle markets that benefit from improving economic trends. Public sector market outlook. Increasing opportunities in core civil infrastructure market. Longer-term P3 market opportunity is promising. Improving pipeline of opportunities. Increased private sector spend in industrial, freight, and power. Growth markets, including EMEA and APAC, continue to develop new infrastructure. Recently proposed infrastructure stimulus in China underscores ongoing urbanization trend. Second Penang Bridge, Malaysia 1 Per Engineering News-Record. DCS ~35% of Backlog DBFO |
|
|
Construction Services (~35% of Revenue) Page 9 Leading vertical construction platform enhanced with the addition of legacy URS Oil & Gas and Energy & Construction businesses. Built on a heritage of delivering large, complex, and often unique projects. Managing the business to respond to commodity price volatility. Focused on risk management and execution excellence across EIC businesses. Opportunities to leverage our leading design capabilities into larger design-build construction roles. AECOM Capital provides a differentiated path to pursue projects in closer partnerships with customers. CONSTRUCTION SERVICES Energy, Infrastructure and Industrial Construction 40% Revenue Legacy URS E&C and O&G Building Construction 60% Revenue Legacy AECOM CS DBFO CS ~45% of Backlog |

|
|
Management Services (~20% of Revenue) Page 10 Management Services extends AECOM’s integrated model beyond design and construction through life-cycle management and support for government and commercial clients. Expanded federal capabilities. Minimal overlap. AECOM’s diversification strategy accelerated with leading DOE, DOD, and intelligence capabilities. Long-term growth driven by leveraging MS’s site management strength into commercial operations and maintenance opportunities across AECOM’s global platform. Leading nuclear remediation capabilities provide a strong resume for global nuclear decommissioning & decontamination work. Recent wins and $5+ billion of bids under evaluation by our clients provide strong backdrop for the combined enterprise. Kennedy Space Center, Cape Canaveral, Florida, U.S.A. DBFO MS ~20% of Backlog |

|
|
Fiscal 2015 Financial Outlook Adjusted EPS1 of $2.75-$3.35. Assumptions: Effective tax rate2 of approximately 30%. FY15 share count of approximately 151 million. 50 weeks of URS contribution. Approximately $210 million in depreciation expense. Capital expenditures of approximately $170 million. Approximately $220 million in interest expense. Approximately $110 million of gross synergies realized in FY15. FY15 anticipated expenses: Approximately $340 million of acquisition and integration-related expenses. Approximately $220 million of amortization of intangible assets.3 Page 11 1 Adjusted EPS excludes acquisition and integration-related expenses, transaction-related financing reported in interest expense, and the amortization of intangible assets. 2 Inclusive of non-controlling interest deduction; adjusted for acquisition and integration expenses, transaction-related financing reported in interest expense, and the amortization of intangible assets. 3 Amortization of intangible assets expense includes the impact of amortization included in equity in earnings of joint ventures and non-controlling interests. |

|
|
Q1 FY15 Business Highlights & Outlook Construction Services Private construction activity driving growth. Recent Hunt acquisition performing ahead of plan. Larger international opportunities emerging. O&G pressured by reductions to capex within the NA market. Design & Consulting Services Delivered Americas design backlog growth. Encouraged by federal support for infrastructure spending. EMEA market continues to benefit from large-scale infrastructure developments. Double-digit growth in China backlog. Management Services Legacy operations performed well on continued diversification efforts. $5+ billion of bids in evaluation and $3 billion of active pursuits. Recent omnibus bill and budget proposal are supportive of growth. Page 12 |

|
|
Executing Our Strategy – Diversified Platform 1The average represents 8 industry peers, including AECOM. Company Diversification Government 17% Infrastructure 26% Infrastructure 28% Government 20% Page 13 Energy 49% |
|
|
Diversified, Lower Risk Business Model Page 14 Note: End Markets, Geographies and Funding Sources estimates based on Q1 FY15 pro forma revenue where work is performed and including full-quarter results for URS. Contract Type estimate based on Q1 FY15 backlog. Power Environmental Transportation Facilities/ Industrial Federal/ Support Services Private Non-U.S. Government U.S. State/Local U.S. Federal U.S. Asia-Pacific EMEA Oil & Gas 5% Canada 9% GMP Fixed Price Cost Plus Hard Bid 3% |
|
|
Appendix: Free Cash Flow Reconciliation Page 15 Reconciliation of Net Cash Porvided by Operating Activities to Free Cash Flow Three months ended $ millions September 30, 2012 September 30, 2013 September 30, 2014 December 31, 2014 Net cash provided by operating activies $433.4 $408.6 $360.6 $282.6 Capital expenditures (62.9) (52.1) (62.8) (29.7) Free cash flow $370.5 $356.5 $297.8 $252.9 Reconciliation of Free Cash Flow Conversion Three months ended $ millions September 30, 2012 September 30, 2013 September 30, 2014 December 31, 2014 Free cash flow $370.5 $356.5 $297.8 $252.9 Net income (56.9) 243.2 232.8 (80.3) FY12 goodwill impairment, net of tax 317.2 FY12 net income excl. goodwill impairment 260.3 Acquisition and integration expenses 138.5 Amortization of intangible assets 60.3 Acquisition-related financing expenses reported in interest expense 68.0 Tax effect of the above adjustments (56.3) Q1 FY15 adjusted net income 130.2 Free cash flow/net income 1 142% 147% 128% 194% Twelve months ended Twelve months ended 1 For FY12, net income excludes the goodwill impairments for purposes of the conversion. For Q1 FY15, net income is adjusted to exclude acquisition and integration related expenses, transaction costs related to financing reported in interest expense, and the amortization of intangible assets. |
|
|
100K Employees 150+ Countries $19 Billion Serving clients in over 150 countries around the world Nearly 100,000 dedicated professionals globally $19 billion in pro-forma revenue for LTM ended Dec. 31, 2014 Note: Figures include pro-forma estimates for URS and Hunt Construction Group. Thank you! Page 16 |