Attached files
| file | filename |
|---|---|
| EX-32.1 - EX-32.1 - TriVascular Technologies, Inc. | triv-ex321_20141231570.htm |
| EX-23.1 - EX-23.1 - TriVascular Technologies, Inc. | triv-ex231_20141231670.htm |
| EX-21.1 - EX-21.1 - TriVascular Technologies, Inc. | triv-ex211_20141231573.htm |
| EX-31.1 - EX-31.1 - TriVascular Technologies, Inc. | triv-ex311_20141231572.htm |
| EX-31.2 - EX-31.2 - TriVascular Technologies, Inc. | triv-ex312_20141231571.htm |
| EXCEL - IDEA: XBRL DOCUMENT - TriVascular Technologies, Inc. | Financial_Report.xls |
UNITED STATES
SECURITIES AND EXCHANGE COMMISSION
WASHINGTON, DC 20549
FORM 10-K
(Mark One)
|
x |
ANNUAL REPORT PURSUANT TO SECTION 13 OR 15(d) OF THE SECURITIES EXCHANGE ACT OF 1934 |
For the fiscal year ended December 31, 2014
or
|
¨ |
TRANSITION REPORT PURSUANT TO SECTION 13 OR 15(d) OF THE SECURITIES EXCHANGE ACT OF 1934 |
For the transition period from to
Commission File Number: 001-36419
TRIVASCULAR TECHNOLOGIES, INC.
(Exact Name of Registrant as Specified in its Charter)
|
Delaware |
|
87-0807313 |
|
(State or other jurisdiction of incorporation or organization) |
|
(I.R.S. Employer Identification No.) |
3910 Brickway Blvd.
Santa Rosa, CA 95403
(Address of principal executive offices)
(707) 573-8800
(Registrant’s telephone number, including area code)
Securities Registered pursuant to Section 12 (b) of the Act
|
Title of Each Class |
|
Name of Exchange on Which Registered |
|
Common Stock, par value $0.01 per share |
|
The NASDAQ Stock Market LLC |
Securities Registered pursuant to Section 12 (g) of the Act:
None
Indicate by check mark if the registrant is a well-known seasoned issuer, as defined in Rule 405 of the Securities Act. Yes ¨ No x
Indicate by check mark if the registrant is not required to file reports pursuant to Section 13 or 15(d) of the Act. Yes ¨ No x
Indicate by check mark whether the registrant (1) has filed all reports required to be filed by Section 13 or 15(d) of the Securities Exchange Act of 1934 during the preceding 12 months (or for such shorter period that the registrant was required to file such reports), and (2) has been subject to such filing requirements for the past 90 days. Yes x No ¨
Indicate by check mark whether the registrant has submitted electronically and posted on its corporate Web site, if any, every Interactive Data File required to be submitted and posted pursuant to Rule 405 of Regulation S-T (§ 232.405 of this chapter) during the preceding 12 months (or for such shorter period that the registrant was required to submit and post such files). Yes x No ¨
Indicate by check mark if disclosure of delinquent filers pursuant to Item 405 of Regulation S-K is not contained herein and will not be contained, to the best of the registrant’s knowledge, in definitive proxy or information statements incorporated by reference in Part III of this Form 10-K or any amendment to this Form 10-K. ¨
Indicate by check mark whether the registrant is a large accelerated filer, an accelerated filer, a non-accelerated filer, or a smaller reporting company. See the definitions of “large accelerated filer,” “accelerated filer” and “smaller reporting company” in Rule 12b-2 of the Exchange Act.
|
Large accelerated filer |
|
¨ |
|
Accelerated filer |
|
¨ |
|
|
|
|
|
|||
|
Non-accelerated filer |
|
x (do not check if a smaller reporting company) |
|
Smaller reporting company |
|
¨ |
Indicate by check mark whether the registrant is a shell company (as defined in Rule 12b-2 of the Exchange Act). Yes ¨ No x
The aggregate market value of the voting and non-voting common equity held by non-affiliates of the registrant, based on the closing price of the shares of common stock on The NASDAQ Stock Market on June 30, 2014, the last business day of the registrant’s most recently completed second fiscal quarter, was $153,128,334.
As of February 27, 2015, the registrant had 20,384,113 shares of common stock, $0.01 par value per share, outstanding.
Portions of the registrant’s definitive Proxy Statement for the 2015 Annual Meeting of Stockholders, to be filed with the Securities and Exchange Commission pursuant to Regulation 14A not later than 120 days after the end of the fiscal year covered by this Form 10-K, are incorporated by reference in Part III, Items 10-14 of this Form 10-K. Except for the portions of the Proxy Statement specifically incorporated by reference in this Form 10-K, the Proxy Statement shall not be deemed to be filed as part hereof.
Table of Contents
|
|
|
|
|
Page |
|
PART I |
|
|
|
|
|
Item 1. |
|
|
1 |
|
|
Item 1A. |
|
|
18 |
|
|
Item 1B. |
|
|
36 |
|
|
Item 2. |
|
|
36 |
|
|
Item 3. |
|
|
36 |
|
|
Item 4. |
|
|
36 |
|
|
|
|
|
||
|
PART II |
|
|
|
|
|
Item 5. |
|
|
37 |
|
|
Item 6. |
|
|
39 |
|
|
Item 7. |
|
Management’s Discussion and Analysis of Financial Condition and Results of Operations |
|
39 |
|
Item 7A. |
|
|
50 |
|
|
Item 8. |
|
|
51 |
|
|
Item 9. |
|
Changes in and Disagreements With Accountants on Accounting and Financial Disclosure |
|
79 |
|
Item 9A. |
|
|
79 |
|
|
Item 9B. |
|
|
79 |
|
|
|
|
|
||
|
PART III |
|
|
|
|
|
Item 10. |
|
|
80 |
|
|
Item 11. |
|
|
80 |
|
|
Item 12. |
|
Security Ownership of Certain Beneficial Owners and Management and Related Stockholder Matters |
|
80 |
|
Item 13. |
|
Certain Relationships and Related Transactions, and Director Independence |
|
80 |
|
Item 14. |
|
|
80 |
|
|
|
|
|
||
|
PART IV |
|
|
|
|
|
Item 15. |
|
|
81 |
|
PART I
CAUTIONARY NOTE REGARDING FORWARD-LOOKING STATEMENTS
This Annual Report on Form 10-K contains forward-looking statements within the meaning of Section 27A of the Securities Act of 1933, as amended (the “Securities Act”), and Section 21E of the Securities Exchange Act of 1934, as amended (the “Exchange Act”) . All statements included or incorporated by reference in this Annual Report other than statements of historical fact, are forward-looking statements. You can identify these and other forward-looking statements by the use of words such as “may,” “will,” “could,” “anticipate,” “expect,” “intend,” “believe,” “continue” or the negative of such terms, or other comparable terminology. Forward-looking statements also include the assumptions underlying or relating to such statements.
Our actual results could differ materially from those anticipated in these forward-looking statements as a result of various factors, including those set forth below under the caption “Risk Factors” in Part I, Item 1A and “Management’s Discussion and Analysis of Financial Condition and Results of Operations” in Part II, Item 7 of this Annual Report and elsewhere in this Annual Report. Readers are cautioned not to place undue reliance on forward-looking statements. The forward-looking statements speak only as of the date on which they are made and we undertake no obligation to update such statements to reflect events that occur or circumstances that exist after the date on which they are made except as required by law.
TRADEMARKS
As of January 31, 2015, our trademark portfolio contained 35 trademark registrations, 5 of which were U.S. trademark registrations, as well as several pending U.S. and foreign trademark applications. All other trademarks or trade names referred to in this report are the property of their respective owners. Solely for convenience, the trademarks and trade names in this prospectus are referred to without the ® and ™ symbols, but such references should not be construed as any indicator that their respective owners will not assert, to the fullest extent under applicable law, their rights thereto.
PART I
When we refer to “we,” “our,” “us” or ““TriVascular”” in this Annual Report on Form 10-K, we mean TriVascular Technologies, Inc., as well as all of our consolidated subsidiaries, unless otherwise expressly stated or the context otherwise requires. References to the “Ovation System” refer to our “Ovation” and “Ovation Prime” Systems and their related components.
Overview
We are a medical device company developing and commercializing innovative technologies to significantly advance minimally invasive treatment of abdominal aortic aneurysms, or AAA. Our mission is to help physicians improve the lives of patients suffering from aortic disease through excellence in research, product development, manufacturing, sales and service. We developed our technology platform leveraging engineering principles utilized in many industries, including aerospace, aircraft and automotive, and applied these concepts with the goal of designing an optimal solution for AAA therapy to address unmet clinical needs. The Ovation System, our solution for the treatment of AAA through minimally invasive endovascular aortic repair, or EVAR, is a new stent graft platform, providing an innovative and effective alternative to conventional devices. It is designed to specifically address many of the limitations associated with conventional EVAR devices and expand the pool of patients eligible for EVAR.
We estimate the global market for AAA stent grafts was approximately $1.5 billion in 2014 and expect it grow to approximately $1.8 billion in 2017. Improvements in EVAR technology, combined with its demonstrated safety and other advantages relative to open surgical repair, have led to EVAR generally becoming the preferred approach to AAA repair in the United States and many other countries. In the United States, it is reported that EVAR is used to treat approximately 70% of all patients receiving AAA repair. However, given the technical limitations of conventional EVAR devices and the variability in patient anatomy, no currently available commercial EVAR device can address 100% of AAA patients, and a significant number of patients diagnosed with AAA are ineligible for EVAR with conventional devices or are unable or unwilling to undergo an open surgical procedure and receive no AAA treatment at all.
Our differentiated platform, by virtue of its low profile, flexible delivery system and novel sealing mechanism, offers physicians and patients eligible for EVAR a new solution to AAA repair, and has the added benefit of being able to treat a broader population of patients. The Ovation System consists of a main aortic body, injected with a conformable polymer, and typically two iliac limbs. These components, delivered sequentially through the lowest profile FDA-approved delivery system, allow for customization to an
1
individual patient’s unique anatomy. We received CE Mark clearance for the Ovation System from the European Commission in August 2010 and approval from the U.S. Food and Drug Administration, or FDA, in October 2012.
We believe we have an opportunity to rapidly increase the adoption and use of the Ovation System by further investing in our sales infrastructure, generating additional clinical data and expanding our professional education efforts. As of December 31, 2014, our Ovation System has been used to treat more than 5,400 patients in over 30 countries, both in clinical trials and commercially. We market and sell our products through a direct sales organization in the United States, Germany, the United Kingdom, the Netherlands and Canada. In other markets, we market and sell our products through distributors or agents. We began selling the Ovation System commercially in the United States in November 2012. For the year ended December 31, 2014 our total revenue was $31.8 million. For the year ended December 31, 2014, our net loss was $57.4 million. Our accumulated deficit as of December 31, 2014 was $295.9 million.
In our Ovation Pivotal Trial, we validated the safety and efficacy of the Ovation System through both femoral cut-down access and less invasive percutaneous access, or PEVAR, and received FDA approval for both access techniques. We have available three-year clinical data from our Ovation Pivotal Trial, and we intend to continue to invest in clinical studies and registries to further demonstrate the patient, physician and cost benefits of our low profile Ovation System. Based on the available data from our Ovation Pivotal trial, we believe the low profile, flexible delivery system and novel sealing mechanism of the Ovation System offers more patients the opportunity to be treated less invasively, more efficiently and potentially more cost effectively through decreased anesthesia, shorter procedural time and hospital stay, and fewer complications, and will provide advantages to many patients, physicians and payors. Our corporate headquarters and vertically integrated production facilities are located in Santa Rosa, California, and as of December 31, 2014, we had 307 employees. We have an experienced executive leadership team, maintain substantial research and development capabilities and hold an extensive patent portfolio.
Market Overview
AAA Disease
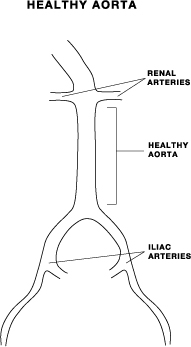
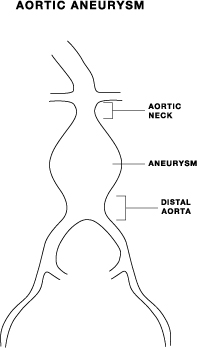
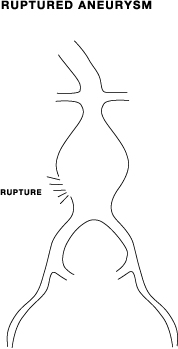
The wall of the aorta, the largest artery in the body, can weaken over time due to loss of a protein called elastin. This often occurs in the presence of atherosclerotic disease, which is a hardening of the arteries due to the build-up of fatty deposits, known as plaque, a leading cause of heart attacks and strokes. Over time, plaque can harden and become calcified. As the wall weakens, a bulging, or an aneurysm, can develop, causing further stress to the dilated vessel wall, and potentially leading to rupture and death. The aorta extends from the heart to the lower abdomen, and aortic aneurysms most frequently occur in the lower abdominal section, and are referred to as abdominal aortic aneurysms. The incidence of AAA increases with age and affects as many as 8% of people over the age of 65 according to the Society of Interventional Radiology, though due to the low rate of diagnosis and challenges of available conventional treatment, only a small percentage of potential patients receive treatment for AAA. Risk factors for aneurysm formation include smoking, high blood pressure, high cholesterol, age, gender and family history. The Centers for Disease Control reports that AAA ruptures carry a risk of death up to 90%, and it is the third leading cause of sudden death in men over the age of 60. The AAA rupture mortality rate may be under-reported since autopsies are not always performed in such cases, and the cause of death is sometimes attributed to heart attacks or other diseases.
2
The illustrations below demonstrate the differences between a healthy abdominal aorta, an abdominal aortic aneurysm and a ruptured abdominal aortic aneurysm.
|
|
|
|
|
|
Market Size
We estimate the U.S. market for abdominal aortic stent grafts to be approximately $600 million in 2014. In addition, we estimate the global market to be approximately $1.5 billion in 2015 and we expect it to grow to approximately $1.8 billion in 2017. There is a substantial patient population with AAA disease. It has been reported that in the United States alone there are currently an estimated 1.2 million people with AAA disease. Of those, it is estimated that only approximately 200,000 are diagnosed annually, and of the diagnosed population, only approximately 70,000 are treated. AAA disease is frequently asymptomatic prior to aneurysm rupture, and is often discovered during procedures for unrelated medical conditions, leading to a fairly low diagnosis rate. Since AAAs generally arise with little warning, screening initiatives have been undertaken. Studies have shown that AAA screening reduces AAA related mortality by up to 50%. The Screening Abdominal Aortic Aneurysms Very Efficiently Act, or SAAAVE, was signed into law in the United States on February 8, 2006, and began providing coverage on January 1, 2007. SAAAVE provides for a one-time, free of charge AAA screening for men or women who have a family history of the disease, or for men who have smoked at some time in their life. We believe that the increase in prevalence of AAA due to the aging population, combined with increased focus on awareness and screening, may lead to increased detection and treatment, further expanding the market.
Treatment
Until recently, open surgery was the standard for AAA repair. Over the last several years, EVAR has generally become the preferred approach to AAA repair in the United States and many other countries, with EVAR being reported to be used for approximately 70% of all patients receiving AAA repair in the United States. Open surgery is still necessary for some patients due to anatomic considerations, life expectancy, other medical conditions and the limitations of conventional EVAR devices.
Open Surgery
Open surgical repair is a highly invasive procedure requiring a large incision in the patient’s torso, displacement of the patient’s intestines to provide access to the aneurysm, clamping of the aorta to temporarily stop blood flow, and implantation of a graft which is sewn to the aorta, bypassing the aneurysm. Open surgical repair typically lasts two to four hours. After open surgical repair, the average hospital stay of a patient is 10.4 days, according to the Journal of the American Medical Association. Post-procedure convalescence may take another four to eight weeks due to the invasiveness of the operation. Procedural mortality and overall morbidity rates associated with open surgical repair prompted physicians to look for alternative options.
3
EVAR
EVAR uses stent grafts to provide a new conduit for blood flow that internally bypasses an aneurysm within the aorta without the significant invasiveness of an open surgical procedure. Conventional EVAR devices are composed of synthetic fabric attached to metal scaffolds. These devices are pre-loaded into catheters for insertion into a patient’s femoral arteries and advancement through the femoral and iliac access vessels. The devices are then deployed at the site of the aneurysm using real-time imaging guidance. The femoral arteries are accessed either through surgical incisions, referred to as cut-downs, or through a less invasive needle stick of the skin, referred to as percutaneous EVAR, or PEVAR.
An EVAR procedure typically lasts one to two hours. In addition, according to the Journal of the American Medical Association, the average hospital stay for EVAR patients was 3.6 days. The near-term safety advantages of EVAR were further demonstrated by two randomized clinical trials conducted with 1,252 patients over 37 centers from 1999 through 2009 in the United Kingdom, collectively known as the UK EVAR Trial. This trial demonstrated a 30-day mortality rate of 1.8% for EVAR, compared to 4.3% for open surgical repair, according to the New England Journal of Medicine. Also, according to the SVS Surgical Control—Lifeline Registry, EVAR procedures demonstrate an 11% major adverse event rate at 30 days, as compared to 56% for open surgical repair. The PEVAR approach can further provide patient and procedural benefits through lower procedure times, reduced hospital stay, fewer complications and the potential use of regional or local anesthesia instead of general anesthesia.
Improvements in EVAR technology, combined with its demonstrated safety advantages, have led EVAR to generally become the preferred approach for AAA repair in the United States and many other countries. In the United States, it is reported that EVAR is used to treat approximately 70% of all patients receiving AAA repair. As EVAR device technology advances to treat a wider range of aneurysms and anatomies and longer term supporting clinical data is collected, we believe more patients will be treated with EVAR. However, conventional EVAR devices have notable limitations.
Limitations of Conventional EVAR Devices
Patient Eligibility
Given the technical limitations of conventional EVAR devices and the variability in patient anatomy, as explained below, a significant number of patients diagnosed with AAA are ineligible for EVAR with conventional devices. As a result, in the United States, it is reported that approximately 30% of AAA patients receiving treatment undergo an open surgical procedure. Because of the highly invasive nature of open surgery, some patients not eligible for EVAR are also unable to tolerate or are unwilling to undergo such a procedure, and receive no AAA treatment at all.
Patient eligibility for treatment with an EVAR device is often determined on the basis of the instructions for use, or IFUs. IFUs are granted by regulatory agencies based on clinical trial and supporting data, and are specific to anatomical and other treatment criteria for which the devices were tested. Physicians may offer to perform and patients may elect to undergo EVAR procedures using devices outside of their IFUs as an alternative to open surgery. In addition, physicians may modify devices outside of the IFU in order to treat challenging anatomies. Some estimate that more than 30% of EVAR procedures are performed outside the implanted device’s IFU. Clinical data has shown that patients undergoing EVAR procedures outside of device IFUs, known as off-label use, experience higher complication rates and less successful outcomes.
Anatomical Access
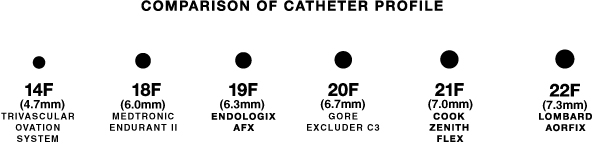
Difficulty Passing through Small Access Vessels. The larger profile delivery systems of conventional EVAR devices relative to the size of many patients’ access vessels limit the patient population that can be treated to those with larger access vessels. Conventional FDA-approved devices have an outer diameter of between 18F and 23F, or 6mm and 7.7mm. Small access vessels may be due to the size of the patient or the existence of blockage within the blood vessels. For example, it is reported that women represent 25% of all patients diagnosed with AAA, but make up only about 10% to 15% of EVAR patients, principally due to their small access vessels. Ancillary devices are sometimes used to dilate, or stretch, a patient’s small access vessels so that large diameter catheters may be utilized to reach the aneurysm. Advancing these larger devices through the access vessels can potentially lead to increased complication rates, resulting in longer recovery time and potentially additional procedural costs.
Difficulty Passing through Diseased and/or Tortuous Access Vessels. AAA patients often have diseased and/or highly contorted, or tortuous, access vessels with extensive calcification, or hardening of the arteries. Conventional EVAR devices are fabric structures with metal support scaffolds extending over most or all of their length, which decrease the flexibility of both the device and its delivery catheter. Advancing stiff catheters through diseased arteries may lead to access vessel trauma or dissection, increasing complication rates and recovery times.
Larger Profile Devices Limit the Practice of Less Invasive Techniques. The larger profile of conventional EVAR devices can inhibit the ability to perform PEVAR, a less invasive technique. In some cases, PEVAR can be performed under regional or local anesthesia, typically reducing procedure and recovery times and avoiding some of the risks associated with the use of general
4
anesthesia. In contrast, the majority of EVAR cases today are performed via surgical cut-down under general anesthesia. With conventional larger profile devices, greater patient selectivity is required, and some physicians may be reluctant to use PEVAR with regional or local anesthesia due to potential complications of using a larger profile device.
Difficulty Treating Aneurysms with Narrowing in the Distal Aorta. Another anatomic characteristic of AAA disease that can limit the use of some conventional EVAR devices is extensive narrowing at the lower end of the aneurysm where the aorta splits into the two iliac arteries, known as the distal aorta. Larger and/or stiffer conventional EVAR devices can be difficult to deploy in these narrow distal aortas because the larger catheter and stent graft components significantly obstruct the already narrow area. Longer term issues can also develop in such instances, as blood flow within the device in the narrow distal aorta can be compromised.
Sealing the Aneurysm
Ineffective Seal of Aortic Blood Flow from the Aneurysm. The aortic wall of a AAA patient is rarely disease-free and can be lined with extensive and irregular calcified plaque and blood clots, or thrombus. Conventional EVAR devices, due to their metal and fabric structures for sealing, may not be able to adequately conform to the irregular surface of the aortic wall, potentially exposing the patient to continued risk of aneurysm rupture. If an incomplete seal occurs and blood clotting does not block the small gaps resulting from irregular aortic wall contact, blood pressure and flow can still reach the aneurysm. This is known as a Type I endoleak and is a severe post-implantation complication that exposes the patient to continued risk of aneurysm rupture.
Inability to Treat Challenging Short Neck Anatomy. Another anatomic characteristic of AAA disease that limits the use of conventional EVAR devices is the proximity of the aneurysm to the renal arteries, which supply blood to the kidneys. If the aortic neck, which is the section of the aorta just below the renal arteries and before the aneurysm begins, is too short, conventional devices that require longer areas of contact with the aortic wall can fail to achieve adequate contact and seal. In addition, these devices have varying degrees of placement accuracy, which can further limit their use in short necks. For these reasons, the FDA-approved IFUs for most conventional EVAR devices require a minimum neck length of 15mm with one requiring 10mm. In a database maintained by an independent third-party clinical data management company and containing approximately 43,000 scans of aneurysm anatomies, approximately 52% of patients had a neck length less than 15mm. In addition, as an aneurysm grows, the neck typically shortens. Due to such limitations of conventional EVAR devices, many patients with advanced AAA disease have few treatment options.
Aortic Neck Dilation over Time. Conventional EVAR devices typically utilize self-expanding metal stents to push graft fabric against the aortic wall to seal the aneurysm. Research has shown that chronic, outward pressure exerted on the aortic neck can lead to long-term enlargement of this section of the aorta, a process referred to as aortic neck dilation. This outward growth of the aorta over time may lead to loss of seal, exposing the patient to continued risk of aneurysm rupture. This risk may be exacerbated when physicians choose an oversized conventional EVAR device in anticipation of neck dilation.
As a result of these challenges, there remains a significant unmet clinical need not addressed by conventional EVAR devices.
Our Solution
Our technology platform was conceived applying principles utilized and proven in other industries. Rather than attempting to improve or adapt an existing EVAR device, we set out to understand the goals of AAA therapy and leverage proven engineering concepts to create an optimal solution. For example, we leveraged our knowledge of fluid mechanics in developing our sealing technology. The result is a new solution designed to specifically address many of the challenges faced in EVAR. While some conventional EVAR devices may claim advantages based on some of their features, no conventional EVAR device contains all of the described advantages of the Ovation System. Our founding purpose was, and remains, to significantly advance minimally invasive treatment of AAA.
Patient Eligibility
Our FDA-approved IFU allows for the on-label treatment of more patients who otherwise may undergo an off-label EVAR procedure or be subject to open surgery, or not receive treatment at all. Our differentiated platform expands the pool of patients eligible for EVAR by virtue of its low profile and flexible delivery system that addresses several key anatomical access challenges, while providing a novel sealing mechanism to address many of the difficulties of diseased patient anatomies. Of the patients treated in the Ovation Pivotal Trial, approximately 40% had anatomies that were outside of the IFUs for other commercially available EVAR devices. In the Ovation Pivotal Trial, 25% of the patients treated had access vessels smaller than the lowest profile of conventional EVAR devices, 7% had neck lengths shorter than the IFUs for those devices and an additional 8% had both of these anatomical characteristics.
5
Anatomical Access
Ability to Pass through Small Access Vessels: Low Profile. The Ovation System’s novel separation and optimization of fixation and seal minimize the overlap between metal and fabric within the catheter, allowing the device to be loaded in a delivery catheter that is smaller than those of conventional EVAR devices. At an outer diameter of 14F, or approximately 4.7mm, the Ovation System is the lowest profile FDA-approved stent graft. Conventional EVAR devices have an outer diameter of between 18F and 23F, or approximately 6mm and 7.7mm. The Ovation System’s low profile enables treatment of more patients with small access vessels and more diseased vessels. This can potentially decrease the incidence of complications by reducing the need for dilation of access vessels for catheter insertion and improving recovery time.
Ability to Pass through Diseased and/or Tortuous Access Vessels: Catheter Flexibility. The Ovation System has the lowest profile FDA-approved delivery system. Its design characteristics significantly increase flexibility, enabling easier passage through diseased and tortuous access vessels. Unlike conventional EVAR devices, the Ovation aortic body design minimizes the overlap between metal and fabric within the catheter, reducing the cross-sectional diameter, or profile, and further enhancing flexibility. This increased flexibility can potentially expand the pool of eligible patients, reduce access vessel trauma and complications and provide enhanced ease of use for physicians.
The Ovation System Enables Minimally Invasive Techniques: Low Profile and Flexibility. The Ovation System’s low profile and proven safety record offer physicians the opportunity to provide PEVAR with regional or local anesthesia to more patients. Studies have shown that the use of smaller profile delivery devices results in fewer access site complications. Therefore, physicians may be more likely to perform PEVAR with the Ovation System and also be more inclined to perform PEVAR under regional or local anesthesia. As a result, PEVAR with the Ovation System may meaningfully reduce procedure and recovery time for certain patients.
Treatment of Aneurysms with Narrowing in the Distal Aorta: Tri-Modular Design and Low Profile. The Ovation System has a tri-modular, low profile architecture, with smaller diameter components that allow it to be deployed in patients with distal aortas that may be too narrow for conventional EVAR devices. In addition, the Ovation System’s highly flexible and smaller iliac limbs potentially allow treatment of more aneurysms with narrow distal aortas.
Sealing the Aneurysm
Ability to Effectively Seal in Highly Diseased Aortas: Polymer-Filled Sealing Rings. The Ovation System’s main aortic body includes a sealing ring that inflates when injected with liquid polymer during implantation. The ring conforms to the aortic wall as the polymer cures, creating a custom seal and preventing blood flow to the aneurysm. The continuous engagement achieved by these rings creates a watertight seal of the aneurysm, which can be particularly important for patients with highly diseased, thrombus-lined and/or calcified aortic necks. In the Ovation Pivotal Trial, our platform demonstrated 100% freedom from Type I endoleaks through the available one- and two-year follow-up data as reported by an independent Core Lab.
Treatment of Challenging Short Neck Anatomy: Separate Anchoring and Sealing. The separation and optimization of the fixation and sealing mechanisms of the Ovation System enable the device to seal with a smaller aortic contact area than conventional EVAR devices. This can be particularly important for patients with irregular or short aortic neck anatomies. An aortic neck is defined as the length of aorta below the renal arteries at which the diameter of the aorta expands 10%. All FDA approved devices, except for the Ovation System have an FDA-approved minimum neck length requirement. Most conventional EVAR devices that require a 15mm neck, with one requiring 10mm, for treatment within approved indications. The Ovation System does not have a conventional neck length requirement and can treat patients of any aortic neck length so long as its sealing ring diameter allows it to maintain contact with the aortic wall at 13mm below the renal arteries. Additionally, the Ovation System utilizes a progressive, staged delivery of its anchor stent, allowing precise placement relative to the renal arteries. This can be particularly important in short neck anatomies in which the aneurysm encroaches closely to the renal arteries.
Avoiding Aortic Neck Dilation: Polymer-Filled Sealing Rings Cast in Place. The Ovation System’s nonexpanding polymer filled sealing rings do not exert significant chronic, outward pressure at the neck of the aorta. In addition, the sealing rings, after being cast in place during implantation, are designed to insulate the aortic neck from the outward force of blood pressure. This is in sharp contrast to conventional EVAR devices, which are self-expanding and exert long-term outward force on the aortic neck in conjunction with the force exerted by local blood pressure. This combined stress on the aortic neck can contribute to aortic neck dilation and potential loss of seal over time. In various published studies, patients treated with conventional EVAR devices demonstrated notable aortic neck dilation over a two-year follow-up period. In contrast, in the Ovation Pivotal Trial, no aortic neck dilation was observed through a similar two-year and even three-year follow-up.
6
Our Strategy
Our mission is to help physicians improve the lives of patients suffering from aortic disease through excellence in research, product development, manufacturing, sales and service. In order to accomplish this mission, we have established and are pursuing several business priorities:
|
· |
Expand Patient Access to the Ovation System through Further Investment in our Sales Infrastructure. We are creating a hybrid sales organization consisting of direct representatives and distributors to provide service excellence to physicians worldwide. Upon receipt of U.S. regulatory approval in October 2012, we began building our direct U.S. sales infrastructure and, as of December 31, 2014, we employed 60 sales representatives. In the United States, we plan to continue to recruit, hire and train experienced sales representatives in order to increase the size and geographic coverage of our sales organization. Outside of the United States, we plan to target additional markets via a self-sufficient distributor and agency model, with the exceptions of Canada, Germany, the Netherlands and the United Kingdom where we already have direct sales capability. We will continue to empower our sales representatives with high impact clinical training, educational and marketing programs. We believe that expanding our U.S. sales infrastructure and establishing additional distributor relationships outside of the United States will drive further adoption of the Ovation System. |
|
· |
Generate Additional Clinical Data to Further Validate the Ovation System Advantage. We believe clinical data demonstrating efficacy, safety and cost effectiveness is critical to the adoption of the Ovation System. As of December 31, 2014, over 5,400 patients have been treated worldwide with the Ovation System and over 800 of these were in ongoing pre-approval and post-market clinical studies. In the Ovation Pivotal Trial, efficacy and safety were validated for both EVAR through surgical cut-down and PEVAR. PEVAR achieved similar clinical outcomes to EVAR, but with less general anesthesia and shorter procedural and hospitalization times. We intend to continue to invest in clinical studies and registries to further demonstrate the patient, physician and cost benefits of our low profile Ovation System. |
|
· |
Increase Awareness of the Ovation System through Professional Education Efforts. We specifically designed our products to address many of the limitations of conventional EVAR devices. We intend to position the Ovation System as the broadest IFU platform with the ability to provide a better solution to treat more patients from the straightforward cases to the more complex. We believe that our technology can benefit patients with a wide range of anatomic characteristics, but only if physicians are aware of, have access to and are properly trained in the use of the Ovation System. We plan to utilize and expand our training centers and broaden our network of physician educators. We believe our investment in these professional education activities will facilitate peer-to-peer education and knowledge dissemination among physicians and healthcare providers, and provide more patients with access to less invasive and improved EVAR treatment. |
|
· |
Leverage our Technology Platform and Culture of Innovation to Advance and Expand our Product Pipeline. We are extending our novel and proprietary technologies into a series of products with the goals of improving outcomes while reducing the invasiveness of therapy, further expanding the pool of patients eligible for EVAR and enhancing the physician experience. Products in development include our next-generation Ovation iliac limbs and our next-generation aortic body, named the Ovation Alto stent graft. We believe these innovative products will continue to drive adoption of our Ovation platform and further validate the advantages and benefits of our technology. |
|
· |
Optimize Manufacturing and Operations to Achieve Cost and Production Efficiencies While Maintaining Quality as our Top Priority. We employ a vertically integrated operating model, designing, developing and manufacturing many of our products in-house at our headquarters in Santa Rosa, California. With our current infrastructure, we have the capacity to significantly increase our manufacturing volume. We intend to use our design, engineering and manufacturing capabilities to further advance and improve the efficiency of our manufacturing processes, which we believe will result in significant margin expansion. |
7
Our Products
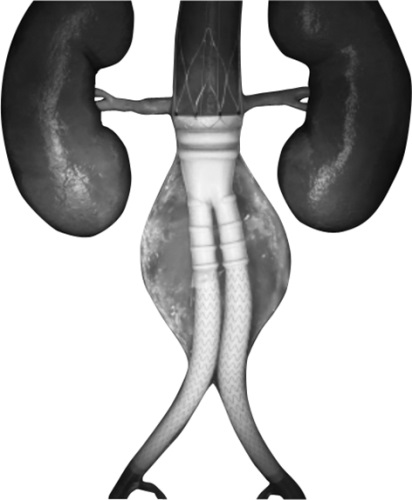
Our Ovation System is an FDA-approved, new AAA stent graft solution designed to specifically address many of the challenges faced in EVAR and to significantly advance minimally invasive treatment of AAA. Our tri-modular design employs a main aortic body, injected with conformable polymer, and typically two iliac limbs. In some cases, extra iliac limbs or iliac extensions may be required. These components, delivered sequentially through the lowest profile FDA-approved delivery system, allow for customization to an individual patient’s unique anatomy. The following illustration shows the Ovation System and its implantable components.
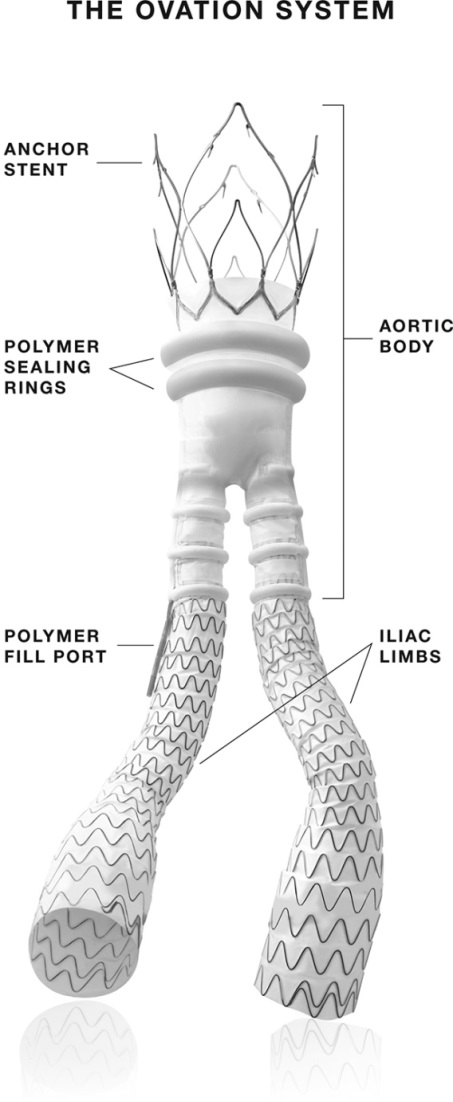
Aortic Body
The aortic body consists of a nitinol metal proximal anchor stent and a polytetrafluoroethylene, or PTFE, graft containing a network of sealing rings that inflate when injected with a liquid fill polymer that solidifies during the deployment procedure. These rings conform to the aortic wall as the polymer cures, creating a custom seal and preventing blood flow to the aneurysm. The stent contains integral angled barbs that anchor the device to the aortic wall and are designed to prevent device migration. The graft has a polymer fill port that connects the network of inflatable rings in the graft to the delivery catheter. The radiopaque nitinol stent is connected to the PTFE graft by radiopaque marker coils, permitting visualization through real-time imaging during delivery for accurate placement. We offer five different aortic body sizes allowing for the use of the Ovation System in a wide variety of anatomies.
Iliac Limbs
The iliac limbs are composed of a nitinol metal stent encapsulated in PTFE material. The iliac limbs are deployed into the leg sections of the aortic body. Radiopaque markers enable the physician to visualize placement of the iliac limb within the aortic body. When the iliac limb is deployed and expands, it is held in place by resistance against the aortic body legs. We offer a wide range of iliac limbs and limb extensions of different lengths and diameters to allow customization to each patient’s anatomy.
8
Fill Polymer
The fill polymer is composed of three elements that are mixed in our pre-loaded kit prior to injection. Upon mixing and injection into the graft using our fill polymer autoinjector, these elements form a radiopaque polymer that fills the sealing rings of the channels in the wall of the aortic body graft. As the polymer cures, a customized seal conforms to the patient’s anatomy allowing for the treatment of many shorter and more diseased necks. We recently introduced the CustomSeal technology, our next generation fill polymer, designed with the same biocompatible components as the Ovation Prime polymer, but with a 30% reduction in cure time, enabling faster procedure times. We received CE mark approval in March 2014 and FDA approval in October 2014 for the CustomSeal short-cure fill polymer.
Delivery System
To facilitate introduction of the Ovation System into patients’ access vessels, the aortic body, iliac limbs and iliac extensions are preloaded into delivery catheters with outer diameters that range in size from 13F to 15F, or approximately 4.3mm to 5.0mm. The aortic body delivery catheters have the lowest profile of any FDA approved EVAR system. The small size of our delivery system compared to conventional EVAR devices, and the resulting ability to navigate small access vessels, allow for the treatment of a broader patient population.
The following figure illustrates the difference in the profile of delivery catheters, shown in relative scale to one another, used in the Ovation System and conventional EVAR devices.
9
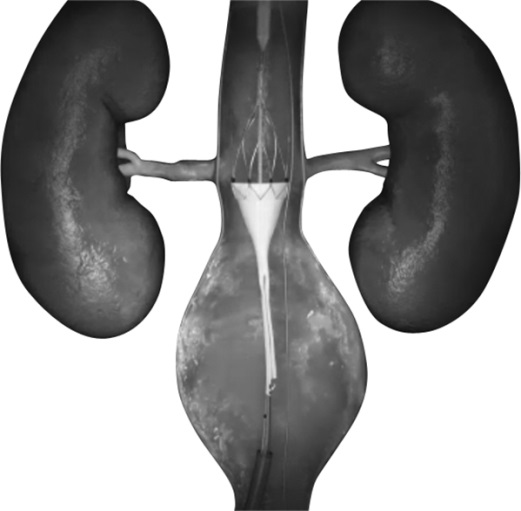
The Typical EVAR Procedure with the Ovation System
The following figure and discussion summarize the primary steps of a typical EVAR procedure performed with the Ovation System.
|
|
|
|
|
|
|
(1) |
|
(2) |
|
(3) |
|
|
|
|
|
(4) |
|
(5) |

Once a patient is prepped for the AAA repair procedure, a physician typically begins by accessing the femoral arteries at the top of each leg, through either a surgical cut-down or percutaneous approach, creating two separate access points.
Over a guide wire, the main aortic body is inserted into the first access vessel and advanced to the site of the aneurysm using real-time imaging. The catheter’s outer sheath is retracted to uncover the stent graft. The anchor stent at the top of our device is positioned just above the renal arteries.
(1) The first stage of the anchor stent is released by turning and pulling the largest, outermost of three nested knobs of the catheter handle. This nested knob design is intended to ensure the device is deployed in the proper sequence.
(2) The device is precisely positioned below the renal arteries. By pulling the second knob of the catheter handle, the barbed portion of the anchor stent is then released fixing the graft in place.
(3) After mixing the fill polymer in its pre-loaded kit, a syringe containing the mixed polymer is then connected to the catheter for injection. Our autoinjector is inserted over the syringe to facilitate hands-free and controlled delivery of the polymer into the graft.
10
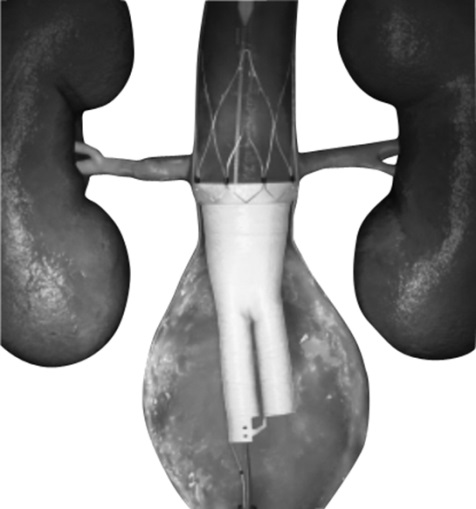
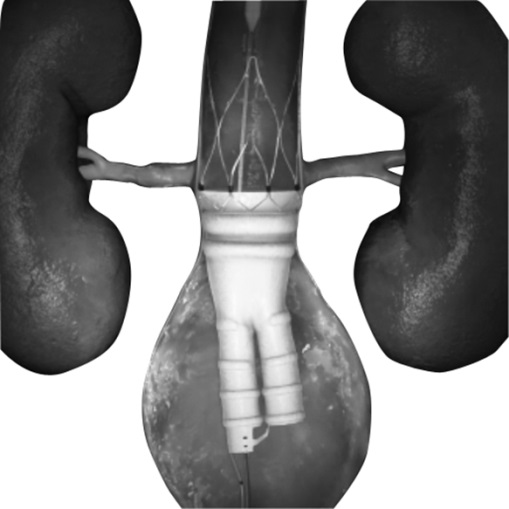
The delivery of the fill polymer is visible under real-time imaging so the filling process can be monitored. Depending on the size of the graft, it takes approximately 30 to 60 seconds for the sealing ring and channels of the graft to fill. The polymer-filled sealing rings conform to the aortic wall and provide a custom seal that is unique for each patient. The CustomSeal polymer cures in approximately 14 minutes.
(4) While the polymer is curing, a guide wire is advanced through the second access vessel into the open leg of the aortic body. Over this wire a catheter containing an iliac limb is inserted into the aortic body leg using real-time imaging to position it within the aortic body leg. By retracting the outer sheath of the catheter, the iliac limb is deployed.
(5) The iliac limb delivery catheter is retracted and then withdrawn from the patient. The main body catheter is then disengaged by pulling the third knob on the catheter handle and withdrawn. Following the removal of the main aortic body catheter, the second iliac limb is then deployed through the first access vessel.
To conclude the procedure, imaging is performed to confirm blood flow is contained entirely within the device. Typically, the entire procedure takes one to two hours.
Products in Development
Our objective is to continue to improve patient outcomes and reduce procedural times through ease of use enhancements to our existing products and the development of new products to further expand patient access to EVAR. Research and development expenses were $13.3 million and $15.5 million, for the years ended December 31, 2013 and December 31, 2014, respectively. We have several product development projects underway, including the following:
Ovation iX Iliac Limbs
We are developing next generation Ovation iX iliac limbs for use with both our current Ovation Prime and our next generation Ovation iX and Alto aortic bodies, which are currently in development. These limbs are designed to have integrated sheaths, reducing the number of catheter exchanges during the procedure. These devices are expected to have size ranges to include larger diameters and longer lengths. We expect the expanded size matrix and ease of use improvements will further increase the number of patients eligible to be treated with EVAR. We have received initial FDA and CE Mark approvals for the Ovation iX Iliac limbs and have submitted supplemental filings for manufacturing changes. Upon approval of the supplemental applications we plan to launch the Ovation iX iliac limbs in the U.S. and Europe.
Ovation iX Aortic Bodies
We are developing Ovation iX aortic bodies for use with both our Ovation Prime and our Ovation iX iliac limbs. These aortic bodies are designed to have integrated sheaths, reducing the number of catheter exchanges during the procedure. The Ovation iX aortic bodies also incorporate an integrated cannulation assist conduit to enable quicker placement of the contralateral iliac limb in certain complex anatomies. We expect these features to further enhance the physician implant experience.
Ovation Alto System
We are developing a next generation aortic body that together with the next generation iliac limbs make up the Ovation Alto stent graft. The Ovation Alto aortic body is expected to contain several design changes to enhance physician experience and allow access to EVAR for more patients, including:
|
· |
sealing rings moved closer to the top of the aortic body, enabling the treatment of shorter necks; |
|
· |
differentiated aortic body leg lengths to better distinguish the aortic body legs under real-time imaging; |
|
· |
wider diameter aortic body legs to facilitate placement of the iliac limbs; |
|
· |
anchor stents sized specifically for each individual aortic body size, potentially allowing treatment of more patients with highly diseased aortas; and |
|
· |
integrated delivery sheaths. |
Other Potential Platform Applications
We have other platform applications in various stages of development. For example, we conducted first-in-man studies, with positive clinical results, for an early generation device to treat thoracic aneurysms and received investigational device exemption approval from the FDA in 2010 to conduct further studies in the United States.
11
While we are currently focusing our resources on the treatment of AAA, we believe these results are encouraging for other potential applications of our technology. Since our technology platform was conceived and developed internally, we believe our organization is well equipped to leverage and extend our highly differentiated and innovative technology going forward.
Clinical Trials
The Ovation Pivotal Trial
We conducted a global, multi-center, 161 patient pivotal trial to obtain regulatory approvals for the Ovation System, referred to here as the Ovation Pivotal Trial. The Ovation Pivotal Trial took place in three countries, with 36 centers enrolling subjects. The first patient was enrolled in November 2009 and the last patient was treated in May 2011. Of the 161 patients enrolled, 111 were treated in the United States. We received CE Mark clearance for the Ovation System in August 2010 on the basis of 30-day data on the initial 21 patients enrolled in this trial. We received FDA premarket approval, or PMA, for the Ovation System in October 2012, based on one-year data from the full 161 patient cohort. The Ovation Pivotal Trial included the first-in-man experience with the Ovation System, as well as all initial cases at participating centers. We believe the inclusion of first-in-man data demonstrates the inherent ease-of-use of the Ovation System, which is further supported by the inclusion of all of the first patients treated at participating centers. Following enrollment of the 161st patient in the Ovation Pivotal Trial, we enrolled an additional 77 patients across the 28 U.S. sites that participated in the Ovation Pivotal Trial, utilizing the same protocol.
The follow-up data from the Ovation Pivotal Trial demonstrates the efficacy of EVAR with the Ovation System with 100% freedom from device-related Type I and III endoleaks, migration, aneurysm rupture and conversion to open surgical repair at one and two years. When blood flows into the aneurysm due to inadequate or ineffective sealing of overlapping graft joints or rupture of the graft fabric, this is referred to as a Type III endoleak. This data also shows a low rate of aneurysm growth, which is generally considered a surrogate for successful treatment.
Notably, the Ovation Pivotal Trial included a large number of patients with complex anatomies. Of the patients treated in our Ovation Pivotal Trial, approximately 40% had anatomies outside of the IFUs for other commercially available EVAR devices. In the Ovation Pivotal Trial, 25% of the patients treated had access vessels smaller than the lowest profile of conventional EVAR devices, 7% had neck lengths shorter than the IFUs for those devices and an additional 8% had both of these anatomical characteristics. In this subgroup of complex patients, the performance of the Ovation System was consistent with the performance in the overall patient cohort. EVAR with the Ovation System also required an average post-procedure hospital stay of 2.3 days, compared to 3.6 days average for EVAR patients in general.
In the Ovation Pivotal Trial, the decision whether to use a surgical cut-down or PEVAR was left to the discretion of the implanting physician. In 77 of the 161 patients (48%), the procedure was performed utilizing PEVAR. Accordingly, the FDA approval for our Ovation System includes indications for both PEVAR and surgical cut-down methods of vessel access. When comparing patient data on the basis of vessel access, as summarized in the table below, the PEVAR arm demonstrated strong safety and effectiveness and a reduction in mean anesthesia time, mean procedure time and median hospital stay, versus the cut-down cohort.
|
|
|
Cut-Down |
|
PEVAR |
|
|
Patients enrolled |
|
84 (52%) |
|
77 (48%) |
|
|
Major adverse event rate at 30 days |
|
3.6% (3/84) |
|
1.3% (1/77) |
|
|
Treatment success at one-year |
|
98.8% (83/84) |
|
98.7% (76/77) |
|
|
Anesthesia time (mean) |
|
191 minutes |
|
155 minutes |
|
|
Procedure time (mean) |
|
120 minutes |
|
98 minutes |
|
|
Hospitalization (median) |
|
2 days |
|
1 day |
|
Ovation Post Approval Study
As a condition of our PMA approval, we are required to enroll 82 patients in a post approval study in the United States, referred to as the Ovation Post Approval Study. The primary endpoint of the Ovation Post Approval Study is freedom from aneurysm mortality. Patients will be followed for five years. As of December 31, 2014, we had enrolled 43 patients in this study.
Ovation PMR
In 2011, we initiated a 500 patient, 30 center, European post-market registry, referred to as Ovation PMR. The primary endpoint of the Ovation PMR is treatment effectiveness. The intention of the Ovation PMR is to determine how real world use of the Ovation System compares to the results garnered in the Ovation Pivotal Trial. We completed the enrollment in the Ovation PMR in December 2013.
12
LIFE Study
In October 2014, we initiated our Least Invasive Fast track EVAR, or LIFE, Study, which we expect will illustrate the potential advantages of PEVAR with the Ovation Prime System, including reduced invasiveness, procedure time, need for anesthesia, costs, complications, and length of hospital stay. We plan to enroll 250 patients across 25 centers in the United States. We plan to conduct a similar study in Europe commencing in 2015. As of December 31, 2014, 12 patients had been enrolled in our U.S. LIFE study.
LUCY Study
In early 2015, we initiated our TriVascular Evaluation of Females who are Underrepresented Candidates for Abdominal Aortic Aneurysm Repair, or LUCY study, which will evaluate the clinical benefits associated with EVAR using the Ovation System in female patients. We expect the study will show:
|
· |
High eligibility rate even in female patients with complex anatomies, including small access vessel diameter, short neck length and increased neck angulation; |
|
· |
Low access-related vascular complications rate; |
|
· |
Low mortality rate. |
Manufacturing and Quality Assurance
Our manufacturing facilities are located within our corporate headquarters in Santa Rosa, California. Our manufacturing capabilities are vertically integrated, in large part due to the considerable amount of proprietary manufacturing technology we have developed over the course of the company’s history. All of our stent grafts and catheters are manufactured and packaged in our rigorously monitored and maintained production environments. We engage third party contractors and suppliers to perform sterilization and accessory component assembly. We perform regular quality system audits of all of our key suppliers, and we maintain strategic inventory levels or qualifying second sources for all significant materials and components.
We have received International Standards Organization, or ISO, 13485 certification, which includes design control requirements. The manufacturing process has been validated as required by FDA and other regulatory bodies. As a medical device manufacturer, our manufacturing facility and the facilities of our sterilization and other critical suppliers are subject to periodic inspection by FDA and other regulatory agencies.
We have significantly increased manufacturing output in each of the last two years. We believe we are well positioned to continue advancing our manufacturing technology and efficiency going forward.
Sales and Marketing
The decision makers for EVAR device selection are primarily vascular surgeons, and to a lesser extent, interventional cardiologists and radiologists. Hospital administrators and group purchasing organizations may also influence device purchasing decisions and limit device selection.
As of December 31, 2014, our U.S. sales organization consisted of a team of nine experienced sales managers employed by us who recruit, train and lead our direct sales force consisting of 60 sales representatives and 9 clinical specialists. Through our direct sales force, we provide product support and service to our hospital and physician customers in the United States. Approximately 68% of our revenues for the year ended December 31, 2014 were generated from sales of our Ovation System in the United States. For the year ended December 31, 2014, no single customer represented more than 10% of our revenues.
Internationally, we sell our Ovation System in Canada, Germany, the Netherlands, and the United Kingdom through a direct sales force, and through independent distributors and agents in other countries. As of December 31, 2014, we marketed our Ovation System in 23 countries outside of the United States through 25 independent distributors. We had 18 sales managers, representatives and clinical specialists in international markets as of December 31, 2014. In addition, from time to time we may engage a limited number of agents to facilitate sales in certain international geographies.
13
Competition
The medical device industry is highly competitive. Any product we develop that achieves regulatory clearance or approval will compete for market acceptance and market share. We believe that the primary competitive factors in the AAA stent graft market segment are:
|
· |
clinical effectiveness; |
|
· |
product safety, reliability, and durability; |
|
· |
ease of use; |
|
· |
scope of instructions for use and eligible patient populations; |
|
· |
physician experience and comfort with use of a particular EVAR device; |
|
· |
product support and service; |
|
· |
sales force experience and relationships; and |
|
· |
price. |
We experience significant competition and we expect that the intensity of competition will increase over time. For example, our major competitors, Medtronic, Inc., W.L. Gore Inc., Cook Medical Products, Inc. and Endologix, Inc., have each obtained full regulatory approval for their EVAR systems in the United States and Europe. In addition to these major competitors, we also have smaller competitors and emerging competitors, including Lombard Medical, Inc. and Cordis Corporation with recent introductions into the EVAR market in the U.S. and Europe.
Many of our competitors have substantially greater capital resources, longer commercial history and established relationships with physicians. Many also have greater resources and expertise in the areas of research and development, obtaining regulatory approvals, manufacturing, marketing, and sales. In addition, some of these competitors have multiple product offerings, in addition to EVAR products, allowing them more opportunities to interact with physicians and purchasing decision makers. We also face fierce competition in recruiting and retaining qualified sales and other personnel.
Intellectual Property
As of January 31, 2015, we owned 134 issued patents globally, of which 46 were issued U.S. patents. As of January 31, 2015, we owned 60 patent applications pending globally, of which 32 were patent applications pending in the United States. Subject to payment of required maintenance fees, annuities and other charges, 11 of our issued U.S. patents expire between 2018 and 2020, 25 expire between 2021 and 2025, and the remaining 10 expire between 2026 and 2030.
As of January 31, 2015, our trademark portfolio contained 33 trademark registrations, 5 of which were U.S. trademark registrations, as well as several pending U.S. and foreign trademark applications.
In March 2008, in connection with the spin-off from Boston Scientific Corporation, we entered into several intellectual property agreements with the subsidiaries of Boston Scientific Corporation, Boston Scientific Scimed, Inc., referred to here as Scimed, and Endovascular Technologies, Inc., referred to here as EndoT. Under an exclusive license agreement with Scimed, we granted Scimed various exclusive and non-exclusive licenses to use certain patents and know-how outside of our retained field of EVAR, dissections or trauma for aortic, thoracic and iliac blood vessels. Scimed’s rights include the first right to enforce the licensed patents against third parties for infringement outside of our retained field and the right to consult with us and our counsel in the preparation and prosecution of the licensed patents and patent applications. Under a non-exclusive license agreement, Scimed and EndoT granted to us a non-exclusive, worldwide, royalty-free license to use certain other patents and know-how in the field of EVAR and dissections or trauma for aortic, thoracic and related repair of iliac blood vessels. Pursuant to the know-how agreement, Scimed irrevocably assigned to us the rights to technology and regulatory filings and granted us a further non-exclusive worldwide, royalty-free license to use certain additional patents and know-how related to the field of EVAR, dissections or trauma for aortic, thoracic or iliac blood vessels. Each of the exclusive license and the non-exclusive license agreement remains in effect, unless earlier terminated by either party for common contractual reasons such as a material breach by the other party, declaration of bankruptcy by a party or dissolution or liquidation of one party’s business, through the expiration of the last-to-expire patent underlying each respective agreement. The know-how agreement includes use of patents licensed to Scimed by a third party, and the know-how agreement remains in effect for as long as Scimed continues to have rights to those patents, which Scimed must use commercially reasonable efforts to maintain.
We also rely upon trade secrets, know-how, continuing technological innovation, and may rely upon licensing opportunities in the future, to develop and maintain our competitive position. We protect our proprietary rights through a variety of methods, including confidentiality agreements and proprietary information agreements with suppliers, employees, consultants and others who may have access to proprietary information.
14
Third-Party Coverage and Reimbursement
In the United States, hospitals are the primary purchasers of our Ovation System. Hospitals in turn bill various third-party payors, such as Medicare, Medicaid and private health insurance plans, for the total healthcare services required to treat the patient’s AAA procedure. Government agencies, private insurers and other payors determine whether to provide coverage for a particular procedure and to reimburse hospitals for inpatient treatment at a fixed rate based on the diagnosis-related group, or DRG, as determined by the U.S. Centers for Medicare and Medicaid Services, or CMS. The fixed rate of reimbursement is based on the procedure performed, and is unrelated to the specific medical device used in that procedure. Medicare rates for the same or similar procedures vary due to geographic location, nature of facility in which the procedure is performed (i.e., teaching or community hospital) and other factors. While private payors vary in their coverage and payment policies, most look to coverage and payment by Medicare as a benchmark by which to make their own decisions.
Reimbursement of procedures utilizing our Ovation Systems currently is covered under specific DRG codes. For hospital reimbursement, patients treated with our Ovation Systems are classified under DRG codes 237 or 238, “Major Cardiovascular Procedures with Major Complications” and “Major Cardiovascular Procedures without Major Complications,” respectively, using the ICD-9 procedure code 39.71, “Endovascular implantation of other graft in abdominal aorta.” In the latest data published by CMS, the national average reimbursement under DRG codes 237 and 238 was approximately $29,500 and $19,500, respectively.
Some payors may deny reimbursement if they determine that the device used in a treatment was unnecessary, not cost-effective, or used for a non-approved indication. We cannot assure you that government or private third-party payors will cover and reimburse the procedures using our products in whole or in part in the future or that payment rates will be adequate.
Outside the United States, market acceptance of medical devices, including EVAR systems, depends partly upon the availability of reimbursement within the prevailing healthcare payment system. Reimbursement levels vary significantly by country, and by region within some countries. Reimbursement is obtained from a variety of sources, including government-sponsored and private health insurance plans, and combinations of both. A small number of countries may require us to gather additional clinical data before recognizing coverage and reimbursement for our products. It is our intent to complete the requisite clinical studies and obtain coverage and reimbursement approval in countries where it makes economic sense to do so.
Further, the increased emphasis on managed healthcare in the U.S. and on country and regional pricing and reimbursement controls in international markets will put additional pressure on product pricing, reimbursement and usage, which may adversely affect our product sales and results of operations. These pressures can arise from rules and practices of insurers and managed care organizations, judicial decisions and governmental laws and regulations related to Medicare, Medicaid and healthcare reform, medical device reimbursement policies and pricing in general. Our ability to achieve market acceptance or significant sales volume will be dependent in large part on the availability of coverage and the level of reimbursement for procedures performed using our products under healthcare payment systems in such markets.
Government Regulation
Government Regulation—Medical Devices
United States
Our products are regulated in the United States as Class III medical devices by the FDA under the Federal Food, Drug and Cosmetic Act. The FDA classifies medical devices into one of three classes based upon controls the FDA considers necessary to reasonably ensure their safety and effectiveness. Class I devices are subject to general controls such as labeling, adherence to good manufacturing practices and maintenance of product complaint records, but are usually exempt from premarket notification requirements. Class II devices are subject to the same general controls and also are subject to special controls such as performance standards, and FDA guidelines, and may also require clinical testing prior to approval. Class III devices are subject to the highest level of controls because they are life-sustaining or life-supporting devices. Class III devices require rigorous clinical testing prior to their approval and generally require a pre-market approval, or PMA, or a PMA supplement approval prior to their sale.
Manufacturers must file an Investigational Device Exemption, or IDE, application if human clinical studies of a device are required and if the FDA considers investigational use of the device to represent significant risk to the patient. The IDE application must be supported by data, typically including the results of animal and engineering testing of the device. The animal and laboratory testing must meet the FDA’s good laboratory practice requirements. If the IDE application is approved by the FDA, human clinical studies may begin at a specific number of investigational sites with a maximum number of patients, as approved by the FDA. The clinical studies must be conducted under the review of an independent institutional review board to ensure the protection of patients’ rights.
15
Generally, upon completion of these human clinical studies, a manufacturer seeks approval of a Class III medical device from the FDA by submitting a PMA application. A PMA application must be supported by extensive data, including the results of the clinical studies, as well as testing and literature to establish the safety and effectiveness of the device. PMA approval may be conditioned upon the conduct of certain post-approval studies, such as long term follow-up studies.
FDA regulations require us to register as a medical device manufacturer with the FDA. Additionally, the California Department of Health Services, or CDHS, requires us to register as a medical device manufacturer within the state. Because of this, the FDA and the CDHS inspect us on a routine basis for compliance with the Quality System Regulation, or QSR. These regulations require that we manufacture our products and maintain related documentation in a prescribed manner with respect to manufacturing, testing and control activities. We have undergone and expect to continue to undergo regular QSR inspections in connection with the manufacture of our products at our facility. Further, the FDA requires us to comply with various FDA regulations regarding labeling. Failure by us or by our suppliers to comply with applicable regulatory requirements can result in enforcement action by the FDA or state authorities, which may include any of the following sanctions:
|
· |
warning letters, fines, injunctions, consent decrees and civil penalties; |
|
· |
customer notifications, recall or seizure of our products; |
|
· |
operating restrictions, partial suspension or total shutdown of production; |
|
· |
delay in processing applications for new products or modifications to existing products; |
|
· |
mandatory product recalls; |
|
· |
withdrawing approvals that have already been granted; and |
|
· |
criminal prosecution. |
The Medical Device Reporting laws and regulations require us to provide information to the FDA on deaths or serious injuries alleged to have been associated with the use of our devices, as well as product malfunctions that likely would cause or contribute to death or serious injury if the malfunction were to recur. In addition, the FDA prohibits an approved device from being marketed for off-label use. The FDA and other agencies actively enforce the laws and regulations prohibiting the promotion of off-label uses, and a company that is found to have improperly promoted off-label uses may be subject to significant liability, including substantial monetary penalties and criminal prosecution.
We are also subject to other federal, state and local laws, regulations, and recommendations relating to safe working conditions, laboratory, and manufacturing practices.
International
Our international sales are subject to regulatory requirements in the countries in which our products are sold. The regulatory review process varies from country to country and may in some cases require the submission of clinical data. In addition, the FDA must be notified of, or approve the export to certain countries of devices that require a PMA, and not yet approved in the United States.
In Europe, we need to comply with the requirements of the Medical Devices Directive, or MDD, and appropriately affix the CE Mark on our products to attest to such compliance. To achieve compliance, our products must meet the “Essential Requirements” of the MDD relating to safety and performance and we must successfully undergo verification of our regulatory compliance, or conformity assessment, by a Notified Body selected by us. The level of scrutiny of such assessment depends on the regulatory class of the product. We are subject to continued surveillance by our Notified Body and will be required to report any serious adverse incidents to the appropriate authorities. We also must comply with additional requirements of individual countries in which our products are marketed.
Government Regulation—Fraud and Abuse and Other Healthcare Regulation
Anti-Kickback Statute
We are subject to various federal and state healthcare laws, including, but not limited to, anti-kickback laws. In particular, the federal Anti-Kickback Statute prohibits persons or entities from knowingly and willfully soliciting, offering, receiving or paying any remuneration, directly or indirectly, overtly or covertly, in cash or in kind, in exchange for or to induce either the referral of an individual, or the furnishing, arranging for or recommending a good or service, or for the purchasing, leasing, ordering, or arranging for or recommending, any good, facility, service or item for which payment may be made in whole or in part under federal healthcare programs, such as the Medicare and Medicaid programs. The federal Anti-Kickback Statute is broad and prohibits many arrangements and practices that are lawful in businesses outside of the healthcare industry. The term “remuneration” expressly includes kickbacks, bribes, or rebates and also has been broadly interpreted to include anything of value, including for example, gifts, discounts, the
16
furnishing of supplies or equipment, credit arrangements, payments of cash, waivers of payments, ownership interests and providing anything at less than its fair market value.
There are a number of statutory exceptions and regulatory safe harbors protecting certain business arrangements from prosecution under the federal Anti-Kickback Statute. These statutory exceptions and safe harbors set forth provisions that, if all their applicable requirements are met, will assure healthcare providers and other parties that they may not be prosecuted under the federal Anti-Kickback Statute. The failure of a transaction or arrangement to fit precisely within one or more applicable statutory exceptions or safe harbors does not necessarily mean that it is illegal or that prosecution will be pursued. However, conduct and business arrangements that do not fully satisfy all requirements of an applicable safe harbor may result in increased scrutiny by government enforcement authorities and will be evaluated on a case-by-case basis based on a cumulative review of all of its facts and circumstances. Additionally, the intent standard under the federal Anti-Kickback Statute was amended under the Affordable Care Act, to a stricter standard such that a person or entity no longer needs to have actual knowledge of the statute or specific intent to violate it in order to have committed a violation. The Affordable Care Act provides that the government may assert that a claim including items or services resulting from a violation of the federal Anti-Kickback Statute constitutes a false or fraudulent claim for purposes of the federal civil False Claims Act which is discussed below. Penalties for violations of the anti-kickback statute include, but are not limited to, criminal, civil and/or administrative penalties, damages, fines, disgorgement, individual imprisonment, possible exclusion from Medicare, Medicaid and other federal healthcare programs, and the curtailment or restructuring of operations. Various states have adopted laws similar to the federal Anti-Kickback Statute, and some of these state laws may be broader in scope in that some of these state laws extend to all payors and may not contain safe harbors.
Federal Civil False Claims Act
The federal civil False Claims Act prohibits, among other things, persons or entities from knowingly presenting or causing to be presented a false or fraudulent claim to, or the knowing use of false statements to obtain payment from or approval by, the federal government. Suits filed under the federal civil False Claims Act, known as “qui tam” actions, can be brought by any individual on behalf of the government. These individuals, sometimes known as “relators” or, more commonly, as “whistleblowers”, may share in any amounts paid by the entity to the government in fines or settlement. The number of filings of qui tam actions has increased significantly in recent years, causing more healthcare companies to have to defend a case brought under the federal civil False Claim Act. If an entity is determined to have violated the federal civil False Claims Act, it may be required to pay up to three times the actual damages sustained by the government, plus civil penalties for each separate false claim. Many of these state laws are broader in scope and apply to all payors, and therefore, are not limited to only those claims submitted to the federal government.
Federal Civil Monetary Penalties Statute
The federal Civil Monetary Penalties Statute, among other things, imposes fines against any person who is determined to have presented, or caused to be presented, claims to a federal healthcare program that the person knows, or should know, is for an item or service that was not provided as claimed or is false or fraudulent.
Health Insurance Portability and Accountability Act of 1996
The federal Health Insurance Portability and Accountability Act, or HIPAA, created several new federal crimes, including healthcare fraud and false statements relating to healthcare matters. The healthcare fraud statute prohibits knowingly and willfully executing a scheme to defraud any healthcare benefit program, including private third-party payors. The false statements statute prohibits knowingly and willfully falsifying, concealing or covering up a material fact or making any materially false, fictitious or fraudulent statement in connection with the delivery of or payment for healthcare benefits, items or services. In addition, HIPAA and its implementing regulations established uniform standards for certain covered entities, which are healthcare providers, health plans and healthcare clearinghouses, as well as their business associates, governing the conduct of specified electronic healthcare transactions and protecting the security and privacy of protected health information. The American Recovery and Reinvestment Act of 2009, commonly referred to as the economic stimulus package, included an expansion of HIPAA’s privacy and security standards called the Health Information Technology for Economic and Clinical Health Act, or HITECH. Among other things, HITECH created four new tiers of civil monetary penalties and gave state attorneys general new authority to file civil actions for damages or injunctions in federal courts to enforce the federal HIPAA laws and seek attorneys’ fees and costs associated with pursuing federal civil actions.
The Federal Physician Payments Sunshine Act
The federal Physician Payment Sunshine Act requires manufacturers of drugs, devices, biologics and medical supplies for which payment is available under Medicare, Medicaid or the Children’s Health Insurance Program, with certain exceptions, to report annually to the Centers for Medicare & Medicaid Services, or CMS, information related to “payments or other transfers of value” made to physicians (defined to include doctors, dentists, optometrists, podiatrists and chiropractors) and teaching hospitals, and to report annually to CMS ownership and investment interests held by physicians, as defined above, and their immediate family members in our company so long as it is privately held.
17
Healthcare Reform
In March 2010, President Obama enacted the Affordable Care Act, or ACA, which has the potential to substantially change healthcare financing and delivery by both governmental and private insurers, and significantly impact the medical device industry. The Affordable Care Act will impact existing government healthcare programs and will result in the development of new programs. The Affordable Care Act’s provisions of importance include, but are not limited to, a deductible 2.3% excise tax on any entity that manufactures or imports medical devices offered for sale in the U.S., with limited exceptions, effective January 1, 2013.
The full impact of the ACA, as well as other laws and reform measures that may be proposed and adopted in the future, remains uncertain, but may continue the downward pressure on medical device pricing, especially under the Medicare program, and may also increase our regulatory burdens and operating costs, which could have a material adverse effect on our business operations.
The Foreign Corrupt Practices Act
The Foreign Corrupt Practices Act, or FCPA, prohibits any U.S. individual or business from paying, offering, or authorizing payment or offering of anything of value, directly or indirectly, to any foreign official, political party or candidate for the purpose of influencing any act or decision of the foreign entity in order to assist the individual or business in obtaining or retaining business. The FCPA also obligates companies whose securities are listed in the United States to comply with accounting provisions requiring the company to maintain books and records that accurately and fairly reflect all transactions of the corporation, including international subsidiaries, and to devise and maintain an adequate system of internal accounting controls for international operations.
Product Liability
The manufacture and marketing of medical devices carries the significant risk of financial exposure to product liability claims. Our products are used in situations in which there is a high risk of serious injury or death. Such risks will exist even with respect to those products that have received, or in the future may receive, regulatory approval for commercial sale. We are currently covered under a product liability insurance policy with coverage limits of $10 million per occurrence and $10 million per year in the aggregate, subject to typical self-insured retention amounts.
Employees
As of December 31, 2014, we had 307 employees, including 76 in manufacturing, 34 in operations, 20 in research and development, 14 in regulatory and clinical affairs, 21 in quality support, 121 in sales and marketing, and 21 in administration. We believe the success of our business will depend, in part, on our ability to attract and retain qualified personnel. Our employees are not subject to a collective bargaining agreement, and we believe that we have good relations with our employees.
Available Information
Our website address is www.trivascular.com. We post links to our website to the following filings as soon as reasonably practicable after they are electronically filed with or furnished to the Securities and Exchange Commission, or the SEC: Annual Reports on Form 10-K, quarterly reports on Form 10-Q, current reports on Form 8-K, proxy statements, and any amendments to those reports filed or furnished pursuant to Section 13 or 15(d) of the Exchange Act. All such filings are available through our website free of charge. Our filings may also be read and copied at the SEC’s Public Reference Room at 100 F Street, NE, Washington, DC 20549. Information on the operation of the Public Reference Room may be obtained by calling the SEC at 1-800-SEC-0330. The SEC also maintains an internet site at www.sec.gov that contains reports, proxy and information statements, and other information regarding issuers that file electronically with the SEC.
Investing in our common stock involves a high degree of risk. You should consider carefully the following risk factors, as well as the other information in this Annual Report on Form 10-K, including the financial statements and related notes, before you decide to purchase our common stock. If any of the following risks actually occur, our business, financial condition and results of operations could be materially adversely affected, the value of our common stock could decline and you may lose all or part of your investment. The risks described below are not the only ones we face. Additional risks that we currently do not know about or that we currently believe to be immaterial may also impair our business, financial condition, operating results and prospects. Certain statements below are forward-looking statements.
18
Risks Related to our Business
We have a history of significant losses. If we do not achieve and sustain profitability, our financial condition and stock price could suffer.
We have experienced significant net losses, and we expect to continue to incur losses for the foreseeable future while we establish and grow the sales ramp for our products. Our net loss was $57.4 million for the year ended December 31, 2014. As of December 31, 2014, our accumulated deficit was $295.9 million. Our prior losses, combined with expected future losses, have had and will continue to have, for the foreseeable future, an adverse effect on our stockholders’ deficit and working capital. We have never achieved profitability, and do not anticipate being profitable in the near future. If our revenue grows more slowly than we anticipate, or if our operating expenses are higher than we expect, we may not be able to achieve profitability, our financial condition will suffer and our stock price could decline. Even if we achieve profitability in the future, we may not be able to sustain profitability in subsequent periods.
All of our revenue is generated from a limited number of products, and any decline in the sales of these products or failure to gain market acceptance of these products will negatively impact our business.
We have focused heavily on the development and commercialization of a limited number of products for the treatment of AAA. From inception through December 31, 2014, our total revenue was derived entirely from sales of our Ovation System, and we expect our revenue to be derived entirely from sales of our Ovation System for the foreseeable future. If we are unable to achieve and maintain significantly greater market acceptance of these products and do not achieve sustained positive cash flow, we will be severely constrained in our ability to fund our operations and the development and commercialization of improvements and other product lines. In addition, if we are unable to market our products as a result of a quality problem, failure to maintain or obtain regulatory approvals, unexpected or serious complications or other unforeseen negative effects related to our products or the other factors discussed in these risk factors, we would lose our only source of revenue, and our business will be adversely affected.
We only recently began selling our products commercially and our products may never achieve market acceptance.
We received regulatory approval in the United States in October 2012 and at that time began hiring and training our sales force and selling our products commercially. We have limited experience engaging in commercial activities and limited established relationships with physicians and hospitals, and we may be unable to successfully expand the commercialization of our products for a number of reasons, including:
|
· |
established competitors’ relationships with customers; |
|
· |
limitations in our ability to demonstrate differentiation and advantages of our products compared to competing products and the relative safety, efficacy and ease of use of our products; |
|
· |
the limited size of our sales force and the learning curve required to gain experience selling our products; |
|
· |
insufficient financial or other resources to support our commercialization efforts necessary to reach profitability; and |
|
· |
the introduction and market acceptance of competing products and technologies. |
Moreover, physicians and hospitals may not perceive the benefits of our products and may be unwilling to change from the devices they are currently using. Educating these physicians and hospitals on the benefits of our products requires a significant commitment by our marketing team and sales organization. Physicians and hospitals may be slow to change their practices because of perceived risks arising from the use of new products. Physicians may not recommend or prescribe our products until there is more long-term clinical evidence to convince them to alter their existing treatment methods, or until they receive additional recommendations from prominent physicians that our products are effective. In addition, physicians and hospitals may initially be unwilling to use our products except in the most challenging anatomies untreatable by other devices. If our products are only used in the most challenging AAA cases, this could lead to increased rates of complications and a skewed perception of the effectiveness of our products, even if our products perform better in those challenging cases than any competing products would be able to perform. We cannot predict when, if ever, physicians and hospitals may adopt more widespread use of our products. If we are unable to educate physicians and hospitals about the advantages of our Ovation System, do not achieve significantly greater market acceptance of our products, do not gain momentum in our sales activities, or fail to significantly grow our market share, we will not be able to grow our revenue and our business and financial condition will be adversely affected.
If we are unable to educate physicians on the safe and effective use of our products, we may be unable to achieve our expected growth.
An important part of our sales process includes the education of physicians on the safe and effective use of our products. There is a learning process for physicians to become proficient in the use of our products and it typically takes several procedures for a physician to become comfortable using the Ovation System. If a physician experiences difficulties during an initial procedure or otherwise, that physician may be less likely to continue to use our product, or to recommend it to other physicians. It is critical to the success of our
19
commercialization efforts to educate physicians on the proper use of the Ovation System, and to provide them with adequate product support during clinical procedures. It is important for our growth that these physicians advocate for the benefits of our products in the broader marketplace. If physicians are not properly trained, they may misuse or ineffectively use our products. This may also result in unsatisfactory patient outcomes, patient injuries, negative publicity or lawsuits against us, any of which could have an adverse effect on our business.
If we fail to develop and retain our direct sales force, our business could suffer.
We have a direct sales force in the United States, Canada and in certain European countries. We also utilize a network of independent distributors and agents for sales outside of the United States. As we launch new products and increase our current marketing efforts with respect to existing products and expand into new geographies, we will need to retain, grow and develop our direct sales personnel, distributors and agents. We have made, and intend to continue to make, a significant investment in recruiting and training sales representatives. There is significant competition for sales personnel experienced in relevant medical device sales. Once hired, the training process is lengthy because it requires significant education for new sales representatives to achieve the level of clinical competency with our products expected by implanting physicians. Upon completion of the training, our sales representatives typically require lead time in the field to grow their network of accounts and achieve the productivity levels we expect them to reach in any individual territory. If we are unable to attract, motivate, develop and retain a sufficient number of qualified sales personnel, and if our sales representatives do not achieve the productivity levels we expect them to reach, our revenue will not grow at the rate we expect and our financial performance will suffer. Also, to the extent we hire personnel from our competitors, we may have to wait until applicable non-competition provisions have expired before deploying such personnel in restricted territories or incur costs to relocate personnel outside of such territories, and we may be subject to allegations that these new hires have been improperly solicited, or that they have divulged to us proprietary or other confidential information of their former employers.
We are in a highly competitive market segment, which is subject to technological change. If our competitors are better able to develop and market products that are safer, more effective, less costly, easier to use or otherwise more attractive than any products that we may develop, our business will be adversely impacted.
The medical device industry is highly competitive and subject to technological change. Our success depends, in part, upon our ability to maintain a competitive position in the development of technologies and products for use in the treatment of AAA. Any product we develop that achieves regulatory clearance or approval will have to compete for market acceptance and market share. We believe that the primary competitive factors in the AAA stent graft market segment are clinical effectiveness, product safety, reliability and durability, scope of IFU and eligible patient populations, physician experience and comfort with use of a particular EVAR device, ease of use, product support and service, sales force experience and relationships and price. We face significant competition in the United States and internationally, and we expect the intensity of competition will increase over time. For example, our major competitors, Medtronic, Inc., W.L. Gore Inc., Cook Medical Products, Inc. and Endologix, Inc., each have approved EVAR systems in the United States and Europe. In addition to these major competitors, we also have other emerging competitors and smaller companies, such as Lombard Medical, Inc. and Cordis Corporation with recent introductions into the EVAR market in the U.S. and Europe and other competitors may emerge in the future. Many of the companies developing or marketing competing products enjoy several advantages to us, including:
|
· |
greater financial and human resources for product development, sales and marketing; |
|
· |
greater name recognition; |
|
· |
long established relationships with physicians and hospitals; |
|
· |
longer-term clinical trial data due to earlier regulatory approval; |
|
· |
the ability to offer rebates or bundle multiple product offerings to offer greater discounts or incentives; |
|
· |
more established sales and marketing programs and distribution networks; and |
|
· |
greater experience in and resources for conducting research and development, clinical studies, manufacturing, preparing regulatory submissions, obtaining regulatory clearance or approval for products and marketing approved products. |
Our competitors may develop and patent processes or products earlier than us, obtain regulatory clearance or approvals for competing products more rapidly than us or develop more effective or less expensive products or technologies that render our technology or products obsolete or less competitive. We also face fierce competition in recruiting and retaining qualified sales, scientific, and management personnel, establishing clinical trial sites and enrolling patients in clinical studies. If our competitors are more successful than us in these matters, our business may be harmed.
20
Our success depends on physicians’ increased use of our products in endovascular AAA procedures.
Our low profile AAA products utilize a different sealing technology within the patient’s anatomy and have the ability to address a wider range of difficult anatomies than some of our competitors’ products. We face challenges convincing physicians, many of whom have extensive experience with competitors’ products and established relationships with other companies, to appreciate the benefits of the Ovation System and adopt it for treatment of their patients. If our products are unable to gain wider acceptance by physicians or if physicians’ use of our products declines, our revenue will be impacted, and our business would be adversely affected.
Our success depends in part on the growth in the number of AAA patients treated with endovascular devices.
AAA disease is frequently asymptomatic prior to aneurysm rupture, and is often discovered during procedures for unrelated medical conditions, leading to a fairly low diagnosis rate. While there are currently an estimated 1.2 million people in the United States with AAA disease, it is estimated that only 200,000 people are diagnosed annually, and of the diagnosed population, only 70,000 are treated. Our growth will depend in part upon an increasing percentage of patients with AAA being diagnosed, and an increasing percentage of those diagnosed receiving EVAR, as opposed to an open surgical procedure. Studies have shown that AAA screening reduces AAA-related mortality by up to 50%. Initiatives to increase screening for AAA include the Screening Abdominal Aortic Aneurysms Very Efficiently Act, or SAAAVE Act, which was signed into law on February 8, 2006 in the U.S. SAAAVE provides one-time AAA screening for Medicare beneficiaries who have a family history of the disease or other risk factors recommended for screening as specified by the U.S. Department of Health and Human Services, or HHS. Screening is provided as part of the “Welcome to Medicare” physical and such coverage began on January 1, 2007. The failure to diagnose more patients with AAA could negatively impact our revenue growth.
We have limited long-term clinical data to support the safety, efficacy and durability of our products, which could be a barrier to further physician adoption of our products, and unforeseen complications could harm our business and reputation.
Our longest-term available clinical data from our Ovation Pivotal Trial is five years, and we have comprehensive three-year follow-up data for this patient population. Because we currently lack comprehensive clinical data older than three years supporting the safety, efficacy and durability of our products and the benefits they offer, physicians may be slower to adopt or recommend our products, we may not have comparative data that our competitors have. Further, future studies or clinical experience may indicate that treatment with our products is not superior to treatment with competitive products or that our products cause unexpected or serious complications or other unforeseen negative effects. Such results could slow the adoption of our products and significantly reduce our sales, which could prevent us from achieving our forecasted sales targets or profitability, and our business and reputation may be harmed.
If clinical studies of our current or future products do not produce results necessary to support regulatory clearance or approval in the United States or elsewhere, we will be unable to commercialize these products.
We are currently conducting clinical trials, including our Ovation Post Approval Study, Ovation PMR Study, the LIFE Study and initiating the LUCY Study. We will likely need to conduct additional clinical studies in the future to support new product approvals, or for the approval for new indications for the use of our products. Clinical testing takes many years, is expensive and carries uncertain outcomes. The initiation and completion of any of these studies may be prevented, delayed, or halted for numerous reasons, including, but not limited to, the following:
|
· |
the FDA, institutional review boards or other regulatory authorities do not approve a clinical study protocol, force us to modify a previously approved protocol, or place a clinical study on hold; |
|
· |
patients do not enroll in, or enroll at a lower rate than we expect, or do not complete a clinical study; |
|
· |
patients or investigators do not comply with study protocols; |
|
· |
patients do not return for post-treatment follow-up at the expected rate; |
|
· |
patients experience serious or unexpected adverse side effects for a variety of reasons that may or may not be related to our products such as the advanced stage of co-morbidities that may exist at the time of treatment, causing a clinical study to be put on hold; |
|
· |
sites participating in an ongoing clinical study withdraw, requiring us to engage new sites; |
|
· |
difficulties or delays associated with establishing additional clinical sites; |
|
· |
third-party clinical investigators decline to participate in our clinical studies, do not perform the clinical studies on the anticipated schedule, or are inconsistent with the investigator agreement, clinical study protocol, good clinical practices, and other FDA and institutional review board requirements; |
|
· |
third-party organizations do not perform data collection and analysis in a timely or accurate manner; |
21
|
· |
regulatory inspections of our clinical studies or manufacturing facilities require us to undertake corrective action or suspend or terminate our clinical studies; |
|
· |
changes in federal, state, or foreign governmental statutes, regulations or policies; |
|
· |
interim results are inconclusive or unfavorable as to immediate and long-term safety or efficacy; |
|
· |
the study design is inadequate to demonstrate safety and efficacy; or |
|
· |
not meeting the statistical endpoints. |
Clinical failure can occur at any stage of the testing. Our clinical studies may produce negative or inconclusive results, and we may decide, or regulators may require us, to conduct additional clinical and/or non-clinical testing in addition to those we have planned. Our failure to adequately demonstrate the safety and efficacy of any of our devices would prevent receipt of regulatory clearance or approval and, ultimately, the commercialization of that device or indication for use. Even if our products are approved in the United States and Europe, comparable regulatory authorities of foreign countries must also approve the manufacturing and marketing of our products in those countries. Approval procedures vary among jurisdictions and can involve requirements and administrative review periods different from, and greater than, those in the United States or Europe, including additional preclinical studies or clinical trials. Any of these occurrences may harm our business, financial condition and prospects significantly.
Our international operations subject us to certain operating risks, which could adversely impact our net sales, results of operations, and financial condition.
Sales of our products outside the United States represented approximately 32.3% of our revenue for the year ended December 31, 2014. In September 2010, we began selling our products in Europe through our own sales force and through distributors. As of December 31, 2014, we sell our products directly in Canada, Germany, the Netherlands and the United Kingdom and through distributors elsewhere. The sale and shipment of our products across international borders, as well as the purchase of components from international sources, subjects us to U.S. and foreign governmental trade, import and export, and customs regulations and laws.
Compliance with these regulations and laws is costly and exposes us to penalties for non-compliance. Other laws and regulations that can significantly impact us include various anti-bribery laws, including the U.S. Foreign Corrupt Practices Act and anti-boycott laws, as well as export controls laws. Any failure to comply with applicable legal and regulatory obligations could impact us in a variety of ways that include, but are not limited to, significant criminal, civil and administrative penalties, including imprisonment of individuals, fines and penalties, denial of export privileges, seizure of shipments, restrictions on certain business activities and exclusion or debarment from government contracting. Also, the failure to comply with applicable legal and regulatory obligations could result in the disruption of our shipping and sales activities.
In addition, several of the countries in which we sell our products are, to some degree, subject to political, economic or social instability. Our international operations expose us and our distributors to risks inherent in operating in foreign jurisdictions. These risks include:
|
· |
difficulties in enforcing or defending intellectual property rights; |
|
· |
pricing pressure that we may experience internationally; |
|
· |
a shortage of high-quality sales people and distributors; |
|
· |
third-party reimbursement policies that may require some of the patients who receive our products to directly absorb medical costs or that may necessitate the reduction of the selling prices of our products; |
|
· |
competitive disadvantage to competition with established business and customer relationships; |
|
· |
the imposition of additional U.S. and foreign governmental controls or regulations; |
|
· |
economic instability; |
|
· |
changes in duties and tariffs, license obligations and other non-tariff barriers to trade; |
|
· |
the imposition of restrictions on the activities of foreign agents, representatives and distributors; |
|
· |
scrutiny of foreign tax authorities which could result in significant fines, penalties and additional taxes being imposed on us; |
|
· |
laws and business practices favoring local companies; |
|
· |
longer payment cycles; |
|
· |
foreign currency exchange rate fluctuations; |
22
|
· |
difficulties in maintaining consistency with our internal guidelines; |
|
· |
difficulties in enforcing agreements and collecting receivables through certain foreign legal systems; |
|
· |
the imposition of costly and lengthy new export licensing requirements; |
|
· |
the imposition of U.S. or international sanctions against a country, company, person or entity with whom we do business that would restrict or prohibit continued business with the sanctioned country, company, person or entity; and |
|
· |
the imposition of new trade restrictions. |
If we experience any of these risks, our sales in international countries may be harmed and our results of operations would suffer.
We rely on a small group of third-party distributors to effectively distribute our products outside the United States.
We depend, in part, on medical device distributors for the marketing and selling of our products in most geographies outside of the United States. We depend on these distributors’ efforts to market our products, yet we are unable to control their efforts completely. These distributors typically sell a variety of other, non-competing products that may limit the resources they dedicate to selling our products. In addition, we are unable to ensure that our distributors comply with all applicable laws regarding the sale of our products. If our distributors fail to effectively market and sell our products, in full compliance with applicable laws, our operating results and business may suffer. Recruiting and retaining qualified third-party distributors and training them in our technology and product offerings require significant time and resources. To develop and expand our distribution, we must continue to scale and improve our processes and procedures that support our distributors. Further, if our relationship with a successful distributor terminates, we may be unable to replace that distributor without disruption to our business. If we fail to maintain relationships with our distributors, fail to develop new relationships with other distributors, including in new markets, fail to manage, train or incentivize existing distributors effectively, or fail to provide distributors with competitive products on attractive terms, or if these distributors are not successful in their sales efforts, our revenue may decrease and our operating results, reputation and business may be harmed.
If third-party payors do not provide adequate coverage and reimbursement for the use of our products, our revenues will be negatively impacted.
Our success in marketing our products depends in large part on whether U.S. and international government health administrative authorities, private health insurers and other organizations will adequately cover and reimburse customers for the cost of our products. In the United States, a third-party payor’s decision to provide coverage for our products does not imply that an adequate reimbursement rate will be obtained. Further, one third-party payor’s decision to cover our products does not assure that other payors will also provide coverage for the products or provide coverage at an adequate reimbursement rate. Reimbursement systems in international markets vary significantly by country and by region within some countries, and reimbursement approvals must be obtained on a country-by-country basis. In many international markets, a product must be approved for reimbursement before it can be approved for sale in that country. Further, many international markets have government-managed healthcare systems that control reimbursement for new devices and procedures. In most markets there are private insurance systems as well as government-managed systems. If sufficient coverage and reimbursement is not available for our current or future products, in either the United States or internationally, the demand for our products and our revenues will be adversely affected.
Our independent registered public accounting firm expressed in its report on our 2013 audited financial statements a substantial doubt about our ability to continue as a going concern.
We only recently began selling our products commercially and our products may never achieve market acceptance and we have experienced significant losses from operations since our inception. There is a risk that we will be unable to obtain necessary financing to continue our operations on terms acceptable to us or at all. As a result, our independent registered public accounting firm expressed in its auditors’ report on our consolidated financial statements for the year ended December 31, 2013 a substantial doubt regarding our ability to continue as a going concern. Our financial statements do not include any adjustments that might result from the outcome of the uncertainty regarding our ability to continue as a going concern. While the auditors’ report on our consolidated financial statements for the year ended December 31, 2014 did not express such a concern, future reports from our independent registered public accounting firm may contain statements expressing doubt about our ability to continue as a going concern. If we cannot continue as a going concern, our stockholders may lose their entire investment in our common stock.
We may be required to obtain additional funds in the future, and these funds may not be available on acceptable terms or at all.
Our operations have consumed substantial amounts of cash since inception, and we anticipate our expenses will increase as we seek to continue to grow our business and operate as a public company. We may need to seek additional capital in the future. We believe that our growth will depend, in part, on our ability to fund our commercialization efforts and our efforts to develop new technologies for the treatment of AAA and other aortic disorders, and technology complementary to our current products. Our existing resources
23
may not allow us to conduct all of these activities that we believe would be beneficial for our future growth. As a result, we may need to seek funds in the future. If we are unable to raise funds on favorable terms, or at all, we may not be able to support our commercialization efforts or increase our research and development activities and the growth of our business may be negatively impacted. As a result, we may be unable to compete effectively. Our cash requirements in the future may be significantly different from our current estimates and depend on many factors, including:
|
· |
the results of our commercialization efforts for our existing and future products; |
|
· |
the need for additional capital to fund future development programs; |
|
· |
the costs involved in obtaining and enforcing patents or any litigation by third parties regarding intellectual property; |
|
· |
the establishment of high volume manufacturing and increased sales and marketing capabilities; and |
|
· |
our success in entering into collaborative relationships with other parties. |
To finance these activities, we may seek funds through borrowings or through additional rounds of financing, including private or public equity or debt offerings and collaborative arrangements with corporate partners. We may be unable to raise funds on favorable terms, or at all.
During the recent economic instability, it has been difficult for many companies to obtain financing in the public markets or to obtain debt financing on commercially reasonable terms, if at all. In addition, the sale of additional equity or convertible debt securities could result in additional dilution to our stockholders. If we borrow additional funds or issue debt securities, these securities could have rights superior to holders of our common stock, and could contain covenants that will restrict our operations. We might have to obtain funds through arrangements with collaborative partners or others that may require us to relinquish rights to our technologies, product candidates, or products that we otherwise would not relinquish. If we do not obtain additional resources, our ability to capitalize on business opportunities will be limited, we may be unable to compete effectively and the growth of our business will be harmed.
We may not be able to generate sufficient cash to service our indebtedness, which currently consists of our term loans with Capital Royalty Partners and Century Medical.
As of December 31, 2014, we owed an aggregate principal and accrued interest amount of $52.4 million to Capital Royalty Partners, pursuant to a term loan agreement. We also owed $6.0 million of principal to Century Medical, Inc., pursuant to a term loan. Our ability to make scheduled payments or to refinance our debt obligations depends on numerous factors, including the amount of our cash balances and our actual and projected financial and operating performance. These amounts and our performance are subject to certain financial and business factors, as well as prevailing economic and competitive conditions, some of which may be beyond our control. We may be unable to maintain a level of cash balances or cash flows from operating activities sufficient to permit us to pay the principal, premium, if any, and interest on our existing or future indebtedness. If our cash flows and capital resources are insufficient to fund our debt service obligations, we may be forced to reduce or delay capital expenditures, sell assets or operations, seek additional capital or restructure or refinance our indebtedness. We may not be able to take any of these actions, and even if we are, these actions may be insufficient to permit us to meet our scheduled debt service obligations. In addition, in the event of our breach of the term loan agreements with either Capital Royalty Partners or Century Medical, we may be required to repay any outstanding amounts earlier than anticipated.
Our existing term loan agreement contains restrictive and financial covenants that may limit our operating flexibility.
Our existing term loan agreements with Capital Royalty Partners and Century Medical contain certain restrictive covenants that either limit our ability to, or require a mandatory prepayment in the event we, incur additional indebtedness and liens, merge with other companies or consummate certain changes of control, acquire other companies, engage in new lines of business, make certain investments, pay dividends, transfer or dispose of assets, amend certain material agreements and enter into various specified transactions. We therefore may not be able to engage in any of the foregoing transactions unless we obtain the consent of our lenders or prepay the outstanding amounts under the term loan agreements, which could require us to pay additional prepayment penalties. The Capital Royalty Partners agreement also contains certain financial covenants, including minimum revenue and cash balance requirements, and our obligations under the term loans are secured by all of our property, with certain exceptions. We may not be able to generate sufficient cash flow or sales to meet the financial covenants or pay the principal and interest under the agreements. Furthermore, our future working capital, borrowings or equity financing could be unavailable to repay or refinance the amounts outstanding under the agreements. In the event of a liquidation, Capital Royalty Partners and Century Medical would be repaid all outstanding principal and interest prior to distribution of assets to unsecured creditors and the holders of our common stock would receive a portion of any liquidation proceeds only if all of our creditors, including Capital Royalty Partners and Century Medical, were first repaid in full.
24
Challenges in the credit environment may adversely affect our business and financial condition.
The global financial markets continue to experience unprecedented levels of volatility. Our ability to enter into or maintain existing financing arrangements on acceptable terms could be adversely affected if there is a material decline in the demand for our products, or our customers become insolvent. Any deterioration in our key financial ratios, or non-compliance with financial covenants in our existing term loan agreement with Capital Royalty Partners could also adversely affect our business and financial condition. While these conditions and the current economic instability have not meaningfully impaired our ability to access credit markets or our operations to date, continuing volatility in the global financial markets could increase borrowing costs or affect our ability to access the capital markets. Current or worsening economic conditions may also adversely affect the business of our customers, including their ability to pay for our products. This could result in a decrease in the demand for our products, longer sales cycles, slower adoption of new technologies and increased price competition.
If we fail to properly manage our anticipated growth, our business could suffer.
We have been growing rapidly in recent periods and have a relatively short history of operating as a commercial company. For example, we recently significantly expanded our U.S. sales force from 16 sales representatives at December 31, 2012 to 60 sales representatives at December 31, 2014, following the receipt of regulatory approval in the United States. We intend to continue to grow and may experience periods of rapid growth and expansion, which could place a significant additional strain on our limited personnel, information technology systems and other resources. In particular, the hiring of our direct sales force in the United States requires significant management, financial and other supporting resources. Any failure by us to manage our growth effectively could have an adverse effect on our ability to achieve our development and commercialization goals.
To achieve our revenue goals, we must successfully increase production output to meet expected customer demand. In the future, we may experience difficulties with production yields and quality control, component supply, and shortages of qualified personnel, among other problems. These problems could result in delays in product availability and increases in expenses. Any such delay or increased expense could adversely affect our ability to generate revenues.
Future growth will also impose significant added responsibilities on management, including the need to identify, recruit, train and integrate additional employees. In addition, rapid and significant growth will place a strain on our administrative and operational infrastructure.
In order to manage our operations and growth we will need to continue to improve our operational and management controls, reporting and information technology systems and financial internal control procedures. If we are unable to manage our growth effectively, it may be difficult for us to execute our business strategy and our operating results and business could suffer.
If we are unable to protect our intellectual property, our business will be negatively affected.
The market for medical devices is subject to frequent litigation regarding patent and other intellectual property rights. It is possible that our patents or licenses may not withstand challenges made by others or protect our rights adequately.
Our success depends in large part on our ability to secure effective patent protection for our products and processes in the United States and internationally. We have filed and intend to continue to file patent applications for various aspects of our technology. However, we face the risks that:
|
· |
we may fail to secure necessary patents prior to or after obtaining regulatory clearances, thereby permitting competitors to market competing products; and |
|
· |
our already-granted patents may be re-examined, invalidated or not extended. |
We also own trade secrets and confidential information that we try to protect by entering into confidentiality agreements with our employees and other parties. However, the confidentiality agreements may not be honored or, if breached, we may not have sufficient remedies to protect our confidential information. Further, our competitors may independently learn our trade secrets or develop similar or superior technologies. To the extent that our consultants, key employees or others apply technological information to our projects that they develop independently or others develop, disputes may arise regarding the ownership of proprietary rights to such information, and such disputes may not be resolved in our favor. If we are unable to protect our intellectual property adequately, our business and commercial prospects will suffer.
25
The medical device industry, including the EVAR space, is characterized by extensive patent litigation, and we could become subject to litigation that could be costly, result in the diversion of management’s attention, require us to pay significant damages or royalty payments or prevent us from marketing and selling our existing or future products.
Our success depends in part on not infringing the patents or violating the other proprietary rights of others. Significant litigation regarding patent rights occurs in the medical industry, including among companies focused on EVAR. It is possible that U.S. and foreign patents and pending patent applications controlled by third parties may be alleged to cover our Ovation System. Our competitors in both the United States and abroad, many of which have substantially greater resources and have made substantial investments in patent portfolios and competing technologies, may have applied for or obtained or may in the future apply for and obtain, patents that will prevent, limit or otherwise interfere with our ability to make, use and sell our products. We have received in the past, and may receive in the future, particularly as a public company, communications from patent holders, including non-practicing entities, alleging infringement of patents or other intellectual property rights or misappropriation of trade secrets, or offering licenses to such intellectual property. At any given time, we may be involved as either a plaintiff or a defendant in a number of patent infringement actions, the outcomes of which may not be known for prolonged periods of time. For example, we are currently involved in a patent dispute with an individual alleging that our products infringe a patent he owns. We are defending this case vigorously and believe the allegations to be without merit.
The large number of patents, the rapid rate of new patent applications and issuances, the complexities of the technologies involved and the uncertainty of litigation significantly increase the risks related to any patent litigation. Any potential intellectual property litigation also could force us to do one or more of the following:
|
· |
stop selling, making, or using products that use the disputed intellectual property; |
|
· |
obtain a license from the intellectual property owner to continue selling, making, licensing, or using products, which license may require substantial royalty payments and may not be available on reasonable terms, or at all; |
|
· |
incur significant legal expenses; |
|
· |
pay substantial damages or royalties to the party whose intellectual property rights we may be found to be infringing; |
|
· |
pay the attorney fees and costs of litigation to the party whose intellectual property rights we may be found to be infringing; or |
|
· |
redesign those products that contain the allegedly infringing intellectual property, which could be costly, disruptive and/or infeasible. |
If any of the foregoing occurs, we may have to withdraw existing products from the market or may be unable to commercialize one or more of our products, all of which could have a material adverse effect on our business, results of operations and financial condition. Any litigation or claim against us, even those without merit, may cause us to incur substantial costs, and could place a significant strain on our financial resources, divert the attention of management from our core business and harm our reputation. Further, as the number of participants in the EVAR industry grows, the possibility of intellectual property infringement claims against us increases.
In addition, we may indemnify our customers and international distributors with respect to infringement by our products of the proprietary rights of third parties. Third parties may assert infringement claims against our customers or distributors. These claims may require us to initiate or defend protracted and costly litigation on behalf of our customers or distributors, regardless of the merits of these claims. If any of these claims succeed, we may be forced to pay damages on behalf of our customers or distributors or may be required to obtain licenses for the products they use. If we cannot obtain all necessary licenses on commercially reasonable terms, our customers may be forced to stop using our products.
We may face product liability claims that could result in costly litigation and significant liabilities.
Manufacturing and marketing of our commercial products, and clinical testing of our products under development, may expose us to product liability and other tort claims. Although we have, and intend to maintain, liability insurance, the coverage limits of our insurance policies may not be adequate and one or more successful claims brought against us may have a material adverse effect on our business and results of operations. Additionally, product liability claims could negatively affect our reputation, continued product sales, and our ability to obtain and maintain regulatory approval for our products.
Our ability to maintain our competitive position depends on our ability to attract and retain highly qualified personnel.
We believe that our continued success depends to a significant extent upon the efforts and abilities of our key executives. All of our executive officers and other employees are at-will employees, and therefore may terminate employment with us at any time with no advance notice.
26
The replacement of any of our key personnel likely would involve significant time and costs and may significantly delay or prevent the achievement of our business objectives and would harm our business.
Our future success also depends on our ability to continue to attract and retain our executive officers and other key employees. Many of our employees have become or will soon become vested in a substantial amount of stock or number of stock options. Our employees may be more likely to leave us if the shares they own or the shares underlying their vested options have significantly appreciated in value relative to the original purchase prices of the shares or the exercise prices of the options, or if the exercise prices of the options that they hold are significantly below the market price of our common stock. Further, our employees’ ability to exercise those options and sell their stock in a public market after our IPO may result in a higher than normal turnover rate. We do not carry any “key person” insurance policies.
Our manufacturing operations, research and development activities, and corporate headquarters, are currently based at a single location that may subject us to a variety of risks.
We currently conduct all of our manufacturing, development and management activities at a single location in Santa Rosa, California, near known earthquake fault zones. Our finished goods inventory is split between our Santa Rosa location and our third-party European distribution center in Belgium. We have taken precautions to safeguard our facilities, including insurance, health and safety protocols, and off-site storage of computer data. However, vandalism, terrorism or a natural or other disaster such as an earthquake or fire could cause substantial delays in our operations, damage or destroy our equipment or inventory, and cause us to incur additional expenses. An earthquake in particular could seriously harm our business and results of operations. The insurance coverage we maintain may not be adequate to cover our losses in any particular case.
Our manufacturing operations are dependent upon third-party suppliers, making us vulnerable to supply problems and price fluctuations, which could harm our business.
We rely on a number of suppliers who manufacture certain components of our products. We do not have long-term supply agreements with most of our suppliers, and, in many cases, we make our purchases on a purchase order basis. Our suppliers may encounter problems during manufacturing for a variety of reasons, including failure to follow specific protocols and procedures, failure to comply with applicable regulations, equipment malfunction and environmental factors, any of which could delay or impede their ability to meet our demand. Our reliance on these third-party suppliers also subjects us to other risks that could harm our business, including:
|
· |
we are not a major customer of many of our suppliers, and these suppliers may therefore give other customers’ needs higher priority than ours; |
|
· |
we may not be able to obtain an adequate supply in a timely manner or on commercially reasonable terms; |
|
· |
our suppliers, especially new suppliers, may make errors in manufacturing that could negatively affect the efficacy or safety of our Ovation System or cause delays in shipment; |
|
· |
we may have difficulty locating and qualifying alternative suppliers; |
|
· |
switching components or suppliers may require product redesign and possibly submission to FDA; |
|
· |
the occurrence of a fire, natural disaster or other catastrophe, impacting one or more of our suppliers, may affect their ability to deliver products to us in a timely manner; and |
|
· |
our suppliers may encounter financial hardships unrelated to our demand, which could inhibit their ability to fulfill our orders and meet our requirements. |
We may not be able to quickly establish additional or alternative suppliers in part because of the FDA approval process. Any interruption or delay in obtaining products from our third-party suppliers, or our inability to obtain products from qualified alternate sources at acceptable prices in a timely manner, could impair our ability to meet the demand of our customers and cause them to switch to competing products.
Our ability to achieve profitability will depend, in part, on our ability to reduce the per unit manufacturing cost of the Ovation System.
Currently, the gross profit generated from the sale of our Ovation System is not sufficient to cover our operating expenses. To achieve profitability, we need to, among other things, reduce the per unit manufacturing cost of our Ovation System. This cannot be achieved without improving manufacturing efficiency and increasing our manufacturing volume to leverage manufacturing overhead costs. If we are unable to improve manufacturing efficiency and reduce manufacturing overhead costs per unit, our ability to achieve profitability will be severely constrained. Any increase in manufacturing volumes is dependent upon a corresponding increase in sales. The occurrence of one or more factors that negatively impact the manufacturing or sales of our Ovation System or delay the
27
introduction of our next generation product or reduce our manufacturing efficiency may prevent us from achieving our desired decrease in manufacturing costs, which would prevent us from attaining profitability.
We are subject to credit risk from our accounts receivable related to our product sales, which include sales within European countries that have recently experienced economic turmoil.
We have receivable balances from customers in Europe of approximately $1.8 million as of December 31, 2014. Our accounts receivable in the United States are primarily due from for-profit and not-for-profit private hospitals. Our accounts receivable outside of the United States are primarily due from third-party distributors, and to a lesser extent, public government-owned and private hospitals. Our historical write-offs of accounts receivable have not been significant.
We monitor the financial performance and credit worthiness of our customers so that we can properly assess and respond to changes in their credit profile. Our third-party distributors operate in certain countries such as Greece, Italy, Spain and Turkey where economic conditions continue to present challenges to their businesses, and thus, could place in risk the amounts due to us from them. These distributors are owed certain amounts from public hospitals that are funded by their governments. Adverse financial conditions in these countries may continue, thus negatively affecting the length of time that it will take us to collect associated accounts receivable, or impact the likelihood of ultimate collection.
Our operating results may vary significantly from quarter to quarter, which may negatively impact our stock price in the future.
Our quarterly revenues and results of operations may fluctuate due to, among others, the following reasons:
|
· |
physician and hospital acceptance of our products; |
|
· |
the timing, expense and results of research and development activities, preclinical studies and clinical trials, and obtaining future regulatory approvals; |
|
· |
fluctuations in our expenses associated with expanding our operations and operating as a public company; |
|
· |
the introduction of new products and technologies by our competitors; |
|
· |
sales representatives productivity; |
|
· |
supplier, manufacturing or quality problems with our products; |
|
· |
the timing of stocking orders from our distributors; |
|
· |
changes in our pricing policies or in the pricing policies of our competitors or suppliers; and |
|
· |
changes in third-party payors’ reimbursement policies. |
Because of these and possibly other factors, it is likely that in some future period our operating results will not meet investor expectations or those of public market analysts.
Any unanticipated change in revenues or operating results is likely to cause our stock price to fluctuate since such changes reflect new information available to investors and analysts. New information may cause investors and analysts to revalue our business, which could cause a decline in the trading price of our stock.
The seasonality of our business creates variance in our quarterly revenue, which makes it difficult to compare or forecast our financial results.
Our revenue fluctuates on a seasonal basis, which affects the comparability of our results between periods. For example, we have historically experienced lower sales in the summer months and around the holidays, primarily due to the buying patterns and implant volumes of our distributors and hospitals. These seasonal variations are difficult to predict accurately and at times may be entirely unpredictable, which introduce additional risk into our business as we rely upon forecasts of customer demand to build inventory in advance of anticipated sales. In addition, we believe our limited history commercializing our products has, in part, made our seasonal patterns more difficult to discern, making it more difficult to predict future seasonal patterns.
We are subject to risks associated with currency fluctuations, and changes in foreign currency exchange rates could impact our results of operations.
A significant portion of our business is located outside the United States and, as a result, we generate revenue and incur expenses denominated in currencies other than the U.S. dollar, a majority of which is denominated in Euros. For example, in 2014, approximately 21% of our total revenue was denominated in foreign currencies. As a result, changes in the exchange rates between
28
such foreign currencies and the U.S. dollar could materially impact our reported results of operations and distort period to period comparisons. Fluctuations in foreign currency exchange rates also impact the reporting of our receivables and payables in non-U.S. currencies. As a result of such foreign currency fluctuations, it could be more difficult to detect underlying trends in our business and results of operations. In addition, to the extent that fluctuations in currency exchange rates cause our results of operations to differ from our expectations or the expectations of our investors, the trading price of our common stock could be adversely affected.
In the future, we may engage in exchange rate hedging activities in an effort to mitigate the impact of exchange rate fluctuations. If our hedging activities are not effective, changes in currency exchange rates may have a more significant impact on our results of operations.
Failure to protect our information technology infrastructure against cyber-based attacks, network security breaches, service interruptions, or data corruption could significantly disrupt our operations and adversely affect our business and operating results.
We rely on information technology and telephone networks and systems, including the Internet, to process and transmit sensitive electronic information and to manage or support a variety of business processes and activities, including sales, billing, customer service, procurement and supply chain, manufacturing, and distribution. We use enterprise information technology systems to record, process, and summarize financial information and results of operations for internal reporting purposes and to comply with regulatory financial reporting, legal, and tax requirements. Our information technology systems, some of which are managed by third-parties, may be susceptible to damage, disruptions or shutdowns due to computer viruses, attacks by computer hackers, failures during the process of upgrading or replacing software, databases or components thereof, power outages, hardware failures, telecommunication failures, user errors or catastrophic events. We are not aware of any breaches of our information technology infrastructure. Despite the precautionary measures we have taken to prevent breakdowns in our information technology and telephone systems, if our systems suffer severe damage, disruption or shutdown and we are unable to effectively resolve the issues in a timely manner, our business and operating results may suffer.
Our ability to use our net operating losses to offset future taxable income may be subject to certain limitations; in addition, we may be unable to use a substantial part of our net operating losses if we don’t attain profitability in an amount necessary to offset such losses.
As of December 31, 2014, we had federal net operating loss, or NOL, carryforwards of approximately $263.4 million. In general, under Section 382 of the Internal Revenue Code of 1986, as amended, the Internal Revenue Code, a corporation that undergoes an “ownership change” is subject to limitations on its ability to utilize its pre-change NOLs to offset future taxable income. Our existing NOLs may be subject to limitations arising from previous ownership changes, and if we undergo an ownership change in connection with or after our IPO, our ability to utilize NOLs could be further limited by Section 382. Future changes in our stock ownership, some of which are outside of our control, could result in an ownership change under Section 382. Furthermore, we may be unable to use a substantial part of our NOLs if we do not attain profitability in an amount sufficient to offset such losses.
The industry- and market-related estimates included in our public filings are based on various assumptions and may prove to be inaccurate.
Industry- and market-related estimates included in our SEC filings, including, without limitation, estimates related to our market size and industry data, are subject to uncertainty and are based on assumptions which may not prove to be accurate. This may have negative consequences, such as us overestimating our potential market opportunity.
Risks Related to Regulation of our Industry
Our future success depends on our ability to develop, receive regulatory clearance or approval for, and introduce new products or product enhancements that will be accepted by the market in a timely manner.
It is important to our business that we continue to build a pipeline of product offerings for treatment of AAA in order to remain competitive. As such, our success will depend, in part, on our ability to develop and introduce new products. However, we may not be able to successfully develop and obtain regulatory clearance or approval for product enhancements, or new products, or these products may not be accepted by physicians or the payors who financially support many of the procedures performed with our products.
The success of any new product offering or enhancement to an existing product will depend on several factors, including our ability to:
|
· |
identify and anticipate physician and patient needs properly; |
|
· |
develop and introduce new products or product enhancements in a timely manner; |
|
· |
avoid infringing upon the intellectual property rights of third parties; |
29
|
· |
demonstrate, if required, the safety and efficacy of new products with data from preclinical studies and clinical studies; |
|
· |
obtain the necessary regulatory clearances or approvals for new products or product enhancements; |
|
· |
comply fully with FDA regulations on marketing of new devices or modified products; |
|
· |
provide adequate training to potential users of our products; and |
|
· |
receive adequate coverage and reimbursement for procedures performed with our products. |
If we do not develop new products or product enhancements in time to meet market demand or if there is insufficient demand for these products or enhancements, or if our competitors introduce new products with enhanced functionalities that are superior to ours, our results of operations will suffer.
Our business is subject to extensive governmental regulation that could make it more expensive and time consuming for us to introduce new or improved products.
Our products must comply with regulatory requirements imposed by the FDA in the United States, and similar agencies in foreign jurisdictions. These requirements involve lengthy and detailed laboratory and clinical testing procedures, sampling activities, an extensive agency review process, and other costly and time-consuming procedures. It often takes several years to satisfy these requirements, depending on the complexity and novelty of the product. We also are subject to numerous additional licensing and regulatory requirements relating to safe working conditions, manufacturing practices, environmental protection, fire hazard control, and disposal of hazardous or potentially hazardous substances. Some of the most important requirements we face include:
|
· |
FDA Regulations (Title 21 CFR); |
|
· |
European Union CE mark requirements; |
|
· |
Medical Device Quality Management System Requirements (ISO 13485:2003); |
|
· |
Occupational Safety and Health Administration requirements; and |
|
· |
California Department of Health Services requirements. |
Government regulation may impede our ability to conduct clinical studies and to manufacture our existing and future products. Government regulation also could delay our marketing of new products for a considerable period of time and impose costly procedures on our activities. The FDA and other regulatory agencies may not approve any of our future products on a timely basis, if at all. Any delay in obtaining, or failure to obtain, such approvals could negatively impact our marketing of any future products and reduce our product revenues.
Our products remain subject to strict regulatory controls on manufacturing, marketing and use. We may be forced to modify or recall a product after release in response to regulatory action or unanticipated difficulties encountered in general use. Any such action could have a material effect on the reputation of our products and on our business and financial position.
Further, regulations may change, and any additional regulation could limit or restrict our ability to use any of our technologies, which could harm our business. We could also be subject to new international, federal, state or local regulations that could affect our research and development programs and harm our business in unforeseen ways. If this happens, we may have to incur significant costs to comply with such laws and regulations, which will harm our results of operations.
The misuse or off-label use of our products may harm our image in the marketplace; result in injuries that lead to product liability suits, which could be costly to our business; or result in costly investigations and FDA sanctions if we are deemed to have engaged in such promotion.
The products we currently market have been approved by the FDA for specific treatments and anatomies. We train our marketing and sales force to not promote our products for uses outside of the FDA-approved indications for use, known as “off-label uses”. A physician, however, may use our products off-label, when in the physician’s independent professional medical judgment he or she deems appropriate. There could be increased risk of injury to patients if physicians use our products off-label. Furthermore, the use of our products for indications other than those approved by the FDA may not effectively treat such conditions, which could harm our reputation in the marketplace among physicians and patients.
Physicians may also misuse our products or use improper techniques if they are not adequately trained, potentially leading to injury and an increased risk of product liability. If our products are misused or used with improper technique, we may become subject to costly litigation by our customers or their patients. Product liability claims could divert management’s attention from our core business, be expensive to defend, and result in sizable damage awards against us that may not be covered by insurance. In addition, if
30
the FDA determines that our promotional materials or training constitute promotion of an off-label use, it could request that we modify our training or promotional materials or subject us to regulatory or enforcement actions, including the issuance of an untitled letter, a warning letter, injunction, seizure, civil fine or criminal penalties. It is also possible that other federal, state or foreign enforcement authorities might take action if they consider our business activities to constitute promotion of an off-label use, which could result in significant penalties, including, but not limited to, criminal, civil and/or administrative penalties, damages, fines, disgorgement, exclusion from participation in government healthcare programs, and the curtailment of our operations. Any of these events could significantly harm our business and results of operations and cause our stock price to decline.
Further, the advertising and promotion of our products is subject to EEA Member States laws implementing Directive 93/42/EEC concerning Medical Devices, or the EU Medical Devices Directive, Directive 2006/114/EC concerning misleading and comparative advertising, and Directive 2005/29/EC on unfair commercial practices, as well as other EEA Member State legislation governing the advertising and promotion of medical devices. In addition, voluntary EU and national Codes of Conduct provide guidelines on the advertising and promotion of our products to the general public and may impose limitations on our promotional activities with healthcare professionals.
Our products may in the future be subject to product notifications, recalls, or voluntary market withdrawals that could harm our reputation, business and financial results.
The FDA and similar foreign governmental authorities have the authority to require the recall of commercialized products in the event of material deficiencies or defects in design or manufacture that could affect patient safety. In the case of the FDA, the authority to require a recall must be based on an FDA finding that there is a reasonable probability that the device would cause serious adverse health consequences or death. Manufacturers may, under their own initiative, conduct a product notification or recall to inform physicians of changes to instructions for use, or IFU, or if a deficiency in a device is found or suspected. For example, in September 2014 we initiated a voluntary field safety corrective action for a small subset of aortic bodies of a specific size, which affected less than 30 devices sold to international distributors, all of which have been returned to us. During the first quarter 2014, pending the European availability of our updated Ovation IFU, we notified European physicians with scheduled cases of an update concerning an optional procedural step. This update was previously approved by FDA and incorporated in the U.S. IFU during the fourth quarter 2013. We informed FDA of the above-described European physician communication, which FDA formally classified as a recall. Further, in 2012, we conducted a voluntary recall relating to certain lots of our non-implantable fill polymer kit. A government-mandated recall or voluntary recall by us or one of our distributors could occur as a result of component failures, manufacturing errors, design or labeling defects or other issues. Recalls, which include certain notifications and corrections as well as removals, of any of our products could divert managerial and financial resources and could have an adverse effect on our financial condition, harm our reputation with customers, and reduce our ability to achieve expected revenues.
We are required to comply with medical device reporting, or MDR, requirements and must report certain malfunctions, deaths, and serious injuries associated with our products, which can result in voluntary corrective actions or agency enforcement actions.
Under the FDA MDR regulations, medical device manufacturers are required to submit information to the FDA when they receive a report or become aware that a device has or may have caused or contributed to a death or serious injury or has or may have a malfunction that would likely cause or contribute to death or serious injury if the malfunction were to recur. All manufacturers placing medical devices on the market in the European Economic Area are legally bound to report any serious or potentially serious incidents involving devices they produce or sell to the regulatory agency, or Competent Authority, in whose jurisdiction the incident occurred.
Malfunction of our products could result in future voluntary corrective actions, such as recalls, including corrections, or customer notifications, or agency action, such as inspection or enforcement actions. If malfunctions do occur, we may be unable to correct the malfunctions adequately or prevent further malfunctions, in which case we may need to cease manufacture and distribution of the affected products, initiate voluntary recalls, and redesign the products. Regulatory authorities may also take actions against us, such as ordering recalls, imposing fines, or seizing the affected products. Any corrective action, whether voluntary or involuntary, will require the dedication of our time and capital, distract management from operating our business, and may harm our reputation and financial results.
We may be subject to federal, state and foreign healthcare laws and regulations, and a finding of failure to comply with such laws and regulations could have a material adverse effect on our business.
Our operations are, and will continue to be, directly and indirectly affected by various federal, state or foreign healthcare laws, including, but not limited to, those described below. In particular, we are subject to the federal Anti-Kickback Statute, which prohibits any person or entity from knowingly and willfully offering, paying, soliciting or receiving any remuneration, directly or indirectly, in cash or in kind, in return for or to induce the referring, ordering, leasing, purchasing or arranging for or recommending the referring, ordering, purchasing or leasing of any good, facility, item or service, for which payment may be made, in whole or in part, under federal healthcare programs, such as the Medicare and Medicaid programs.
31
We are also subject to the federal HIPAA statute, which, among other things, created federal criminal laws that prohibit knowingly and willfully executing, or attempting to execute, a scheme or artifice to defraud any health care benefit program or making any materially false, fictitious or fraudulent statements relating to health care matters.
We are also subject to the federal “sunshine” law, which requires us to track and report annually to the Centers for Medicare & Medicaid Services, or CMS, information related to “payments or other transfers of value” made to physicians (defined to include doctors, dentists, optometrists, podiatrists and chiropractors) and teaching hospitals and to report annually to CMS ownership and investment interests held by physicians, as defined above, and their immediate family members in our company so long as it is privately held.
In addition, we are subject to the federal civil and criminal false claims laws and civil monetary penalty laws, which prohibit, among other things, persons or entities from knowingly presenting, or causing to be presented, a false or fraudulent claim to, or the knowing use of false records or statements to obtain payment from, or approval by, the federal government. Suits filed under the False Claims Act, known as “qui tam” actions, can be brought by any individual on behalf of the government and such individuals, commonly known as “whistleblowers”, may share in any amounts paid by the entity to the government in fines or settlement. When an entity is determined to have violated the False Claims Act, it may be required to pay up to three times the actual damages sustained by the government, plus civil penalties for each separate false claim.
Many states have also adopted laws similar to each of the above federal laws, such as anti-kickback and false claims laws which may be broader in scope and apply to items or services reimbursed by any third-party payor, including commercial insurers, as well as laws that restrict our marketing activities with physicians, and require us to report consulting and other payments to physicians. Some states mandate implementation of compliance programs to ensure compliance with these laws. We also are subject to foreign fraud and abuse laws, which vary by country.
If our operations are found to be in violation of any of the laws described above or any other governmental regulations that apply to us now or in the future, we may be subject to penalties, including civil and criminal penalties, damages, fines, disgorgement, exclusion from governmental health care programs, and the curtailment or restructuring of our operations, any of which could adversely affect our ability to operate our business and our financial results.
Healthcare policy changes, including recent federal legislation to reform the U.S. healthcare system, may have a material adverse effect on us.
In March 2010, President Obama signed the Patient Protection and Affordable Care Act, as amended by the Health Care and Education Affordability Reconciliation Act, or PPACA. The PPACA includes, among other things, a deductible 2.3% excise tax on any entity that manufactures or imports medical devices offered for sale in the United States, with limited exceptions, effective January 1, 2013. This excise tax will result in a significant increase in the tax burden on our industry, and if any efforts we undertake to offset the excise tax are unsuccessful, the increased tax burden could have an adverse affect on our results of operations and cash flows. Other elements of the PPACA, including comparative effectiveness research, an independent payment advisory board, payment system reforms including shared savings pilots and other provisions, may significantly affect the payment for, and the availability of, healthcare services and result in fundamental changes to federal healthcare reimbursement programs, any of which may materially affect numerous aspects of our business.
Risks Related to our Common Stock
Our stock price is likely to be volatile, which may result in losses to our stockholders.
The trading price of our common stock is likely to be volatile and could fluctuate widely, regardless of our operating performance, in response to, among other things, the risk factors described in this report and other factors, many of which are beyond our control, including:
|
· |
actual or anticipated fluctuations in our results of operations; |
|
· |
variance in our financial performance from the estimates we provide to the public or the expectations of market analysts; |
|
· |
conditions and trends in our industry and the markets we serve; |
|
· |
announcements of significant new products by us or our competitors; |
|
· |
changes in our pricing policies or the pricing policies of our competitors; |
|
· |
changes in recommendations by securities analysts that elect to follow our common stock; |
|
· |
legislation or regulatory policies, practices, or actions; |
|
· |
the commencement or outcome of litigation; |
32
|
· |
the sale of our common stock or other securities in the future by us or our stockholders, including upon expiration of market standoff or contractual lock-up agreements; |
|
· |
developments or disputes concerning our intellectual property or other proprietary rights; |
|
· |
recruitment or departure of key personnel; |
|
· |
changes in market valuation or earnings of our competitors; |
|
· |
the trading volume of our common stock; |
|
· |
changes in the estimation of the future size and growth rate of our markets; and |
|
· |
general economic conditions. |
In addition, the market prices of the stock of new issuers and of companies with smaller market capitalizations like us have been volatile and from time to time have experienced significant share price and trading volume changes unrelated or disproportionate to the operating performance of those companies. In the past, stockholders have filed securities class action litigation following periods of market volatility. If we were to become involved in securities litigation, it could subject us to substantial costs, divert resources and the attention of management from our business, and adversely affect our business.
A large number of additional shares may be sold into the public market in the near future, which may cause the market price of our common stock to decline significantly, even if our business is doing well.
Sales of a substantial amount of common stock in the public market, or the perception that these sales may occur, could adversely affect the market price of our common stock. The holders of approximately 11.9 million shares of common stock and holders of certain of our warrants have the right to require us to register under the Securities Act any shares in our company pursuant to a stockholders agreement between such holders and us. If such holders, by exercising their registration rights, sell a large number of shares, they could adversely affect the market price for our common stock. If we file a registration statement for the purpose of selling additional shares to raise capital and are required to include shares held by these holders pursuant to the exercise of their registration rights, our ability to raise capital may be impaired.
Insiders have substantial control over us and are able to influence corporate matters.
As of December 31, 2014, our directors and executive officers and stockholders holding more than 5% of our capital stock and their affiliates beneficially own, in the aggregate, more than 50% of our outstanding common stock. As a result, if these stockholders were to choose to act together, they would be able to exercise significant influence over all matters requiring stockholder approval, including the election of directors and approval of significant corporate transactions, such as a merger or other sale of our company or its assets. This concentration of ownership could limit your ability to influence corporate matters and may have the effect of delaying or preventing a third party from acquiring control over us.
An active trading market for our common stock may not be sustained.
Prior to the IPO, there was no public market for our common stock. Although we completed our IPO in April 2014 and shares of our common stock are listed and trading on The NASDAQ Global Select Market, an active trading market for our shares may not be sustained. If an active market for our common stock does not continue, it may be difficult for our stockholders to sell their shares without depressing the market price for the shares or sell their shares at or above the prices at which they acquired their shares or sell their shares at the time they would like to sell. The lack of active trading market for our common stock may also impair our ability to raise capital to continue to fund our operations by selling shares and may impair our ability to acquire other companies, products or technologies by using our shares as consideration.
Anti-takeover provisions in our organizational documents and Delaware law may discourage or prevent a change of control, even if an acquisition would be beneficial to our stockholders, which could reduce our stock price and prevent our stockholders from replacing or removing our current management.
Our amended and restated certificate of incorporation and amended and restated bylaws contain provisions that could delay or prevent a change of control of our company or changes in our board of directors that our stockholders might consider favorable. Some of these provisions:
|
· |
authorize the issuance of preferred stock with powers, preferences and rights that may be senior to our common stock, which can be created and issued by the board of directors without prior stockholder approval; |
|
· |
provide for the adoption of a staggered board of directors whereby the board is divided into three classes each of which has a different three-year term; |
33
|
· |
provide that the number of directors shall be fixed by the board; |
|
· |
prohibit our stockholders from filling board vacancies; |
|
· |
provide for the removal of a director only for cause and then by the affirmative vote of the holders of a majority of the shares then entitled to vote at an election of directors, except as required by law; |
|
· |
prohibit stockholders from calling special stockholder meetings, except as required by law; |
|
· |
prohibit stockholders from acting by written consent without holding a meeting of stockholders; |
|
· |
require certain stockholder litigation proceeding to be brought in Delaware; |
|
· |
require the vote of at least 66 2/3% of the outstanding shares to approve amendments to the anti-takeover provisions of our certificate of incorporation or bylaws; |
|
· |
prohibit cumulative voting, except as required by law, in the election of directors, which limits the ability of minority stockholders to elect director candidates; and |
|
· |
require advance written notice and additional disclosure for stockholder proposals and director nominations. |
We are subject to the provisions of Section 203 of the Delaware General Corporation Law, which may prohibit certain business combinations with stockholders owning 15% or more of our outstanding voting stock. These and other provisions in our amended and restated certificate of incorporation, amended and restated bylaws and Delaware law could make it more difficult for stockholders or potential acquirers to obtain control of our board of directors or initiate actions that are opposed by our then-current board of directors, including a merger, tender offer or proxy contest involving our company. Any delay or prevention of a change of control transaction or changes in our board of directors could cause the market price of our common stock to decline.
Our issuance of preferred stock could adversely affect holders of our common stock.
Our board is authorized to issue up to 5,000,000 shares of preferred stock without any action on the part of our stockholders. Our board also has the power, without stockholder approval, to set the terms of any series of preferred stock that may be issued, including voting rights, except that shares of preferred stock may not have more than one vote per share, dividend rights, preferences over our common stock with respect to dividends or in the event of a dissolution, liquidation or winding up and other terms. In the event that we issue preferred stock in the future that has preference over our common stock with respect to payment of dividends or upon our liquidation, dissolution or winding up, or if we issue preferred stock that is convertible into our common stock at greater than a one-to-one ratio, the voting and other rights of the holders of our common stock or the market price of our common stock could be adversely affected.
If securities or industry analysts do not publish research or publish inaccurate or unfavorable research about our business, our share price and trading volume could decline.
The trading market for our common stock will depend on the research and reports that securities or industry analysts publish about us or our business. We do not have any control over these analysts. We cannot assure you that analysts will cover us or provide favorable coverage. If one or more of the analysts who cover us downgrade our stock or change their opinion of our stock, our share price would likely decline. If one or more of these analysts cease coverage of our company or fail to regularly publish reports on us, we could lose visibility in the financial markets, which could cause our share price or trading volume to decline.
We are an “emerging growth company,” and we cannot be certain if the reduced reporting requirements applicable to emerging growth companies will make our common stock less attractive to investors.
We are an “emerging growth company,” as defined in the JOBS Act. For as long as we continue to be an emerging growth company, we may take advantage of exemptions from various reporting requirements that are applicable to other public companies that are not emerging growth companies, including not being required to comply with the auditor attestation requirements of Section 404 of the Sarbanes-Oxley Act, reduced disclosure obligations regarding executive compensation in our periodic reports and proxy statements and exemptions from the requirements of holding a nonbinding advisory vote on executive compensation and stockholder approval of any golden parachute payments not previously approved. We could be an emerging growth company for up to five years following our IPO, although circumstances could cause us to lose that status earlier, including if the market value of our common stock held by non-affiliates exceeds $700 million as of any June 30 before that time, in which case, we would no longer be an emerging growth company as of the following December 31. We cannot predict if investors will find our common stock less attractive because we may rely on these exemptions. If some investors find our common stock less attractive as a result, there may be a less active trading market for our common stock and our stock price may be more volatile.
34
We had previously identified a material weakness in our internal control over financial reporting and may identify additional material weaknesses in the future or otherwise fail to maintain an effective system of internal controls, which may result in material misstatements of our financial statements or cause us to fail to meet our reporting obligations or fail to prevent fraud; and in that case, our stockholders could lose confidence in our financial reporting, which would harm our business and could negatively impact the price of our stock.
Effective internal controls are necessary for us to provide reliable financial reports and prevent fraud. If we fail to maintain an effective system of internal controls, we might not be able to report our financial results accurately or prevent fraud; and in that case, our stockholders could lose confidence in our financial reporting, which would harm our business and could negatively impact the price of our stock. Prior to our IPO, we were a private company with limited accounting personnel and other resources with which to address our internal controls and procedures. During the course of preparing for our IPO, we determined that material adjustments to the earnings per share amounts were necessary, which required us to restate the financial statements for the year ended December 31, 2012. This led us to conclude that we had a material weakness in our internal control over financial reporting. A material weakness is a deficiency, or combination of deficiencies, in internal control over financial reporting, such that there is a reasonable possibility that a material misstatement of our annual or interim financial statements will not be prevented or detected on a timely basis. We have remediated this material weakness primarily by implementing additional review procedures within the finance department and, engaging external accounting experts with the appropriate knowledge to supplement our internal resources in our computation and review processes when appropriate. We cannot assure you that the measures we have taken to date will be sufficient to avoid future material weaknesses. Even when we conclude that our internal control over financial reporting provides reasonable assurance regarding the reliability of financial reporting and the preparation of financial statements for external purposes in accordance with generally accepted accounting principles, because of its inherent limitations, internal control over financial reporting may not prevent or detect fraud or misstatements.
Our reporting obligations as a public company will place a significant strain on our management, operational and financial resources and systems for the foreseeable future. If we fail to maintain the adequacy of our internal control over financial reporting, we may not be able to produce reliable financial reports or help prevent fraud. Our failure to maintain effective internal control over financial reporting could prevent us from filing our periodic reports on a timely basis which could result in the loss of investor confidence in the reliability of our financial statements, harm our business and negatively impact the trading price of our common stock.
The requirements of being a public company may strain our resources and divert management’s attention.
As a public company, we are subject to the reporting requirements of the Exchange Act, the Sarbanes-Oxley Act, the Dodd-Frank Act, the listing requirements of the NASDAQ Global Select Market and other applicable securities rules and regulations. Despite recent reforms made possible by the JOBS Act, compliance with these rules and regulations nonetheless increases our legal and financial compliance costs, makes some activities more difficult, time-consuming or costly and increases demand on our systems and resources, particularly after we will no longer be an “emerging growth company.” The Exchange Act requires, among other things, that we file annual, quarterly, and current reports with respect to our business and operating results.
As a result of disclosure of information in this report and in other filings required of a public company, our business and financial condition are more visible, which we believe may result in threatened or actual litigation, including by competitors and other third parties. If such claims are successful, our business and operating results could be harmed, and even if the claims do not result in litigation or are resolved in our favor, these claims, and the time and resources necessary to resolve them, could divert the resources of our management and adversely affect our business, brand and reputation and results of operations.
We also expect that being a public company and these new rules and regulations will make it more expensive for us to obtain director and officer liability insurance, and we may be required to accept reduced coverage or incur substantially higher costs to obtain coverage. These factors could also make it more difficult for us to attract and retain qualified members of our board of directors, particularly to serve on our audit committee and compensation committee, and qualified executive officers.
We do not intend to pay dividends on our common stock.
We have never paid dividends on our common stock and we currently intend to retain any future earnings and do not expect to pay any cash dividends on our common stock in the foreseeable future. We are not legally or contractually required to pay dividends and our current term loan agreements with Capital Royalty Partners and Century Medical contain restrictions on our ability to pay dividends. The declaration and payment of all future dividends, if any, will be at the sole discretion our board of directors, which retains the right to change our dividend policy at any time, and may be limited by our debt arrangements in place from time to time. Consequently, stockholders must rely on sales of their common stock after price appreciation, which may never occur, as the only way to realize any future gains on their investment.
35
Item 1B. UNRESOLVED STAFF COMMENTS
Not applicable.
As of December 31, 2014, we leased our headquarters, research and development, and manufacturing facilities, an aggregate of approximately 110,000 square feet, in Santa Rosa, California under an operating lease scheduled to expire in February 2018, which may be renewed for an additional five years, at our option. We also lease several small administrative offices in Dallas, Texas, Dresden, Germany, Milan, Italy and Nyon, Switzerland. We believe our current facilities will be adequate and suitable for our operations for the foreseeable future.
We may from time to time be involved in various claims and legal proceedings of a nature we believe are normal and incidental to a medical device business. These matters may include product liability, intellectual property, employment, and other general claims. We accrue for contingent liabilities when it is probable that a liability has been incurred and the amount can be reasonably estimated. We are not presently a party to any legal proceedings that, in the opinion of our management, are likely to have a material adverse effect on our business. Regardless of outcome, litigation can have an adverse impact on us because defense and settlement costs, diversion of management resources and other factors.
Item 4. MINE SAFETY DISCLOSURES
Not applicable.
36
PART II
Item 5. Market for Registrant’s Common Equity, Related Stockholder Matters and Issuer Purchases of Equity Securities.
Market Information
Our common stock has been listed on The NASDAQ Global Select Market since April 16, 2014 under the symbol “TRIV.” Prior to such time, there was no public market for our common stock. The following table sets forth the high and low sales prices per share of our common stock as reported on The NASDAQ Global Select Market for the periods indicated.
|
|
|
Price Range |
|
|||||
|
|
|
High |
|
|
Low |
|
||
|
Year Ended December 31, 2014 |
|
|
|
|
|
|
|
|
|
Second Quarter (commencing April 16, 2014) |
|
$ |
17.99 |
|
|
$ |
11.15 |
|
|
Third Quarter |
|
|
17.25 |
|
|
|
12.00 |
|
|
Fourth Quarter |
|
|
16.62 |
|
|
|
11.42 |
|
The last sale price for our common stock as reported by The NASDAQ Global Select Market on February 27, 2015 was $10.26 per share.
Holders of Record
As of February 27, 2015, there were approximately 134 holders of record of our common stock. The actual number of common stockholders is greater than the number of record holders, and includes stockholders who are beneficial owners, but whose shares are held in street name by brokers and other nominees. This number of holders of record also does not include stockholders whose shares may be held in trust by other entities.
Dividend Policy
We have never declared or paid any cash dividends on our common stock. At the present time, we have no plans to declare or pay any dividends and intend to retain all of our future earnings, if any, generated by our operations for the development and growth of our business. Any future decision to pay dividends will be made by our board of directors in its sole discretion and will depend upon our results of operations, financial condition, capital requirements and other factors that our board of directors deems relevant in its informed business judgment. In addition, the terms of our term loan agreements with Capital Royalty Partners and Century Medical, Inc. restrict our ability to pay cash dividends.
Securities Authorized for Issuance under Equity Compensation Plans
Information about our equity compensation plans is incorporated herein by reference to Part III, Item 12 of this Annual Report.
Repurchases of Equity Securities
There were no repurchases of equity securities during the fourth quarter of 2014.
37
Performance Measurement Comparison
The following graph shows a comparison from April 16, 2014 (the date our common stock commenced trading on The NASDAQ Global Select Market) through December 31, 2014 of the cumulative total return for our common stock, the NASDAQ Composite Index and NASDAQ Medical Equipment Index. The graph assumes an initial investment of $100 on April 16, 2014. The comparisons in the graph are not intended to forecast or be indicative of possible future performance of our common stock.
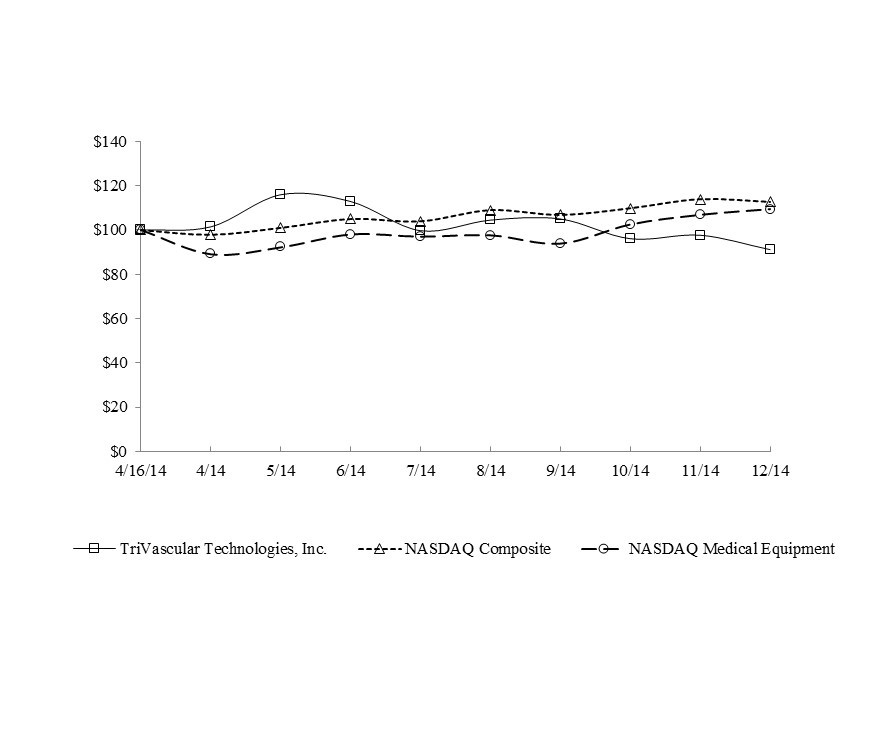
The preceding graph and related information shall not be deemed “soliciting material”, shall not be deemed “filed” with the SEC, shall not be subject to the liabilities of Section 18 of the Exchange Act, and shall not be incorporated by reference in any of our filings under the Securities Act or the Exchange Act whether made before or after the date hereof and irrespective of any general incorporation language in any such filing.
Use of Proceeds from the Sale of Registered Securities
On April 22, 2014, we closed our IPO of 7,475,000 shares of common stock, including 975,000 shares of common stock from the full exercise of the overallotment option of shares granted to the underwriters, at a price to the public of $12.00 per share. The offer and sale of all of the shares in the IPO were registered under the Securities Act pursuant to a registration statement on Form S-1 (File No. 333-194466), which was declared effective by the SEC on April 15, 2014. The offering commenced on April 16, 2014, closed on April 22, 2014, and did not terminate before all of the shares in the IPO that were registered in the registration statement were sold. J.P. Morgan Securities LLC and Credit Suisse Securities (USA) LLC acted as managing underwriters. We raised approximately $81.1 million in net proceeds from the offering, after deducting underwriter discounts and commissions of approximately $6.3 million and other offering expenses of approximately $2.3 million.
No offering expenses were paid directly or indirectly to any of our directors or officers (or their associates) or persons owning ten percent or more of any class of our equity securities or to any other affiliates. There has been no material change in the planned use of proceeds from our IPO as described in our final prospectus filed with the SEC pursuant to Rule 424(b) under the Securities Act on April 17, 2014. We estimate that, as of December 31, 2014, we have used approximately $64.1 million of the net proceeds from the offering to repay our promissory note to Boston Scientific Corporation, to expand our sales and marketing infrastructure, to fund additional research and development, and for working capital and other general corporate purposes. The remainder of the net proceeds from the offering has been invested in cash and cash equivalents.
38
Item 6. SELECTED FINANCIAL DATA
The selected financial data presented below under the heading “Statements of Comprehensive Loss Data” for the years ended December 31, 2014, 2013 and 2012 and the selected financial data presented below under the heading “Balance Sheet Data” as of December 31, 2014,and 2013 have been derived from our audited financial statements included elsewhere in this Annual Report. The consolidated balance sheet data as of December 31, 2012 has been derived from our audited consolidated financial statements which are not included herein. The selected financial data presented below should be read in conjunction with the information included under the heading “Management’s Discussion and Analysis of Financial Condition and Results of Operations” in Part II, Item 7 and the financial statements and the related notes in Part II, Item 8. Our historical results for any prior period are not necessarily indicative of results to be expected in any future period.
|
Statements of Comprehensive Loss Data: |
|
|
|
|
|
|
|
|
|
|
|
|
|
|
|
|
|
|
|
|
|
|
|
|
|
|
|
|
|
Year Ended December 31, |
|
|||||||||
|
(in thousands, except share and per share data) |
|
2014 |
|
|
2013 |
|
|
2012 |
|
|||
|
|
|
|
|
|
|
|
|
|
|
|
|
|
|
Revenue |
|
$ |
31,798 |
|
|
$ |
19,508 |
|
|
$ |
5,398 |
|
|
Cost of goods sold |
|
|
13,820 |
|
|
|
11,708 |
|
|
|
8,948 |
|
|
Gross profit |
|
|
17,978 |
|
|
|
7,800 |
|
|
|
(3,550 |
) |
|
Operating expenses: |
|
|
|
|
|
|
|
|
|
|
|
|
|
Sales, general and administrative |
|
|
52,435 |
|
|
|
38,401 |
|
|
|
18,720 |
|
|
Research and development |
|
|
15,544 |
|
|
|
13,294 |
|
|
|
12,156 |
|
|
Total operating expenses |
|
|
67,979 |
|
|
|
51,695 |
|
|
|
30,876 |
|
|
Loss from operations |
|
|
(50,001 |
) |
|
|
(43,895 |
) |
|
|
(34,426 |
) |
|
Loss on extinguishment of senior notes |
|
|
— |
|
|
|
— |
|
|
|
(3,081 |
) |
|
Total other income (expense), net |
|
|
(7,372 |
) |
|
|
(6,413 |
) |
|
|
(5,805 |
) |
|
Net loss |
|
$ |
(57,373 |
) |
|
$ |
(50,308 |
) |
|
$ |
(43,312 |
) |
|
Other comprehensive (loss) income |
|
|
(346 |
) |
|
|
103 |
|
|
|
129 |
|
|
Comprehensive loss |
|
$ |
(57,719 |
) |
|
$ |
(50,205 |
) |
|
$ |
(43,183 |
) |
|
Net loss per share, basic and diluted |
|
$ |
(3.95 |
) |
|
$ |
(87.42 |
) |
|
$ |
(101.97 |
) |
|
Weighted average shares used to compute net loss per share, basic and diluted |
|
|
14,519,396 |
|
|
|
575,482 |
|
|
|
424,743 |
|
|
|
|
|
|
|
|
|
|
|
|
|
|
|
|
Balance Sheet Data: |
|
|
|
|
|
|
|
|
|
|
|
|
|
|
|
As of December 31, |
|
|||||||||
|
(in thousands) |
|
2014 |
|
|
2013 |
|
|
2012 |
|
|||
|
|
|
|
|
|
|
|
|
|
|
|
|
|
|
Cash and Cash equivalents |
|
$ |
32,896 |
|
|
$ |
38,108 |
|
|
$ |
45,393 |
|
|
Short-term investments |
|
$ |
46,084 |
|
|
$ |
— |
|
|
$ |
— |
|
|
Working capital |
|
$ |
86,720 |
|
|
$ |
44,519 |
|
|
$ |
51,978 |
|
|
Property and equipment, net |
|
$ |
1,248 |
|
|
$ |
1,505 |
|
|
$ |
2,286 |
|
|
Total assets |
|
$ |
108,533 |
|
|
$ |
64,700 |
|
|
$ |
68,994 |
|
|
Notes payable |
|
$ |
55,004 |
|
|
$ |
44,288 |
|
|
$ |
42,765 |
|
|
Total liabilities |
|
$ |
68,960 |
|
|
$ |
53,508 |
|
|
$ |
48,718 |
|
|
Convertible preferred stock |
|
$ |
— |
|
|
$ |
239,990 |
|
|
$ |
200,100 |
|
|
Total stockholders' equity (deficit) |
|
$ |
39,573 |
|
|
$ |
(228,798 |
) |
|
$ |
(179,824 |
) |
Item 7. MANAGEMENT’S DISCUSSION AND ANALYSIS OF FINANCIAL CONDITION AND RESULTS OF OPERATIONS
You should read the following discussion and analysis together with “Item 6. Selected Financial Data” and our financial statements and related notes included elsewhere in this Annual Report.
The following discussion of our financial condition and results of operations contains forward-looking statements within the meaning of Section 27A of the Securities Act of 1933, as amended (the “Securities Act”), and Section 21E of the Securities Exchange Act of 1934, as amended (the “Exchange Act”). Forward-looking statements include statements that may relate to our plans, objectives, goals, strategies, future events, future revenues or performance, capital expenditures, financing needs and other information that is
39
not historical information. Forward-looking statements can often be identified by the use of terminology such as “subject to,” “believe,” “anticipate,” “plan,” “expect,” “intend,” “estimate,” “project,” “may,” “will,” “should,” “would,” “could,” “can,” the negatives thereof, variations thereon and similar expressions, or by discussions of strategy. All forward-looking statements, including, without limitation, our examination of historical operating trends, are based upon our current expectations and various assumptions. These forward-looking statements involve risks and uncertainties that could cause our actual results to differ materially from those expressed or implied in our forward-looking statements. Such risks and uncertainties include, among others, those discussed under the caption “Item 1A. Risk Factors” and elsewhere in this Annual Report. We do not intend, and undertake no obligation, to update any of our forward-looking statements after the date of this report to reflect actual results or future events or circumstances. Given these risks and uncertainties, readers are cautioned not to place undue reliance on such forward-looking statements.
When we refer to “we,” “our,” “us” or ““TriVascular”” in this Annual Report on Form 10-K, we mean TriVascular Technologies, Inc., as well as all of our consolidated subsidiaries, unless otherwise expressly stated or the context otherwise requires. References to the “Ovation System” refer to our “Ovation” and “Ovation Prime” Systems and their related components.
Overview
We are a medical device company developing and commercializing innovative technologies to significantly advance minimally invasive treatment of abdominal aortic aneurysms, or AAA. Our mission is to help physicians improve the lives of patients suffering from aortic disease through excellence in research, product development, manufacturing, sales and service. We developed our technology platform leveraging engineering principles utilized in many other industries and applied these concepts with the goal of designing an optimal solution for AAA therapy to address unmet clinical needs. The Ovation System, our solution for the treatment of AAA through minimally invasive endovascular aortic repair, or EVAR, is a new stent graft platform. It is designed to specifically address many of the limitations associated with conventional EVAR devices and expand the pool of patients eligible for EVAR by virtue of its low profile, flexible delivery system and novel sealing mechanism. The Ovation System consists of a main aortic body, injected with a conformable polymer, and typically two iliac limbs. These components allow the devices to be customized to a patient’s unique anatomy to effectively seal the aneurysm.
We received CE Mark clearance in August 2010 and began commercial sales of our Ovation System in Europe in September 2010. In October 2012, we received approval from the U.S. Food and Drug Administration for the Ovation System for the treatment of AAA and began commercial sales in the United States in November 2012. We sell our products through our direct U.S. and European sales forces and through third-party distributors in Europe and in other parts of the world.
We manufacture and package all of the components of our implantable products at our headquarters in Santa Rosa, California. We also engage third-party contractors and suppliers to perform sterilization and accessory component assembly.
In April 2014, we completed the IPO of our common stock, which resulted in the sale of 7,475,000 shares at a price of $12.00 per share. We received net proceeds from the IPO of approximately $81.1 million, after deducting underwriting discounts and commissions and offering expenses.
In May 2014, we initiated the launch of our CustomSeal short cure fill polymer in Europe, further enhancing the implant experience for physicians. Subsequently, in October 2014, we received FDA approval of CustomSeal polymer for use in the U.S.
In September 2014, we announced our three-year follow-up data on primary safety and performance metrics from the Ovation Pivotal Trial. The data showed 100% freedom from aneurysm rupture, 100% freedom from conversion to open surgical repair, 100% freedom from Type I & III endoleaks, and 100% freedom from device migration. Subset analysis of the results of patients with aortic neck lengths less than 10mm, as well as patients who presented with tourtuous aortic neck anatomy, showed 100% freedom from: Type I and III endoleaks; rupture; migration; and conversion to surgical repair.
In October 2014, we initiated our LIFE Study, which we expect will illustrate the potential advantages of PEVAR with the Ovation Prime System. As of December 31, 2014, 12 patients had been enrolled in our U.S. LIFE study. In early 2015, we initiated the LUCY Study which will evaluate the clinical benefits associated with EVAR using the Ovation System in female patients.
Important Factors Affecting our Results of Operations
We believe there are several important factors that have impacted and that we expect to continue to impact our results of operations.
Our Ability to Recruit and Train our Sales Representatives and their Productivity
We only recently began building our sales organization in the United States and have made, and intend to continue to make, a significant investment in recruiting and training our sales representatives. This process is lengthy because it requires significant
40
education and training for our sales representatives to achieve the level of clinical competency with our products that is expected by implanting physicians. Upon completion of the training, our sales representatives typically require lead time in the field to grow their network of accounts and achieve the productivity levels we expect them to reach. Successfully recruiting and training a sufficient number of productive sales representatives is required to achieve growth at the rate we expect.
Physician Awareness and Acceptance of our Ovation System
We continue to invest in programs to educate physicians who treat AAA disease about the advantages of our Ovation System. This requires significant commitment by our marketing team and sales organization, and can vary depending upon the physician’s practice specialization, personal preferences and geographic location. We are competing with well-established companies in our industry that have strong existing relationships with many of these physicians. Educating physicians about the advantages of our Ovation System, and influencing these physicians to use our Ovation System to treat AAA disease, is required to grow our revenue.
Access to Hospital Facilities
In order for physicians to use our Ovation System, most hospital facilities where these physicians treat patients typically require us to enter into purchasing contracts with them. This process can be lengthy and time-consuming and require extensive negotiations and management time. In some cases, contract bidding processes are only open at certain periods of time and we may not be successful in bidding. In many hospitals, we are not able to sell our products unless and until a purchasing contract has been executed.
Leveraging our Manufacturing Capacity
With our current operating model and infrastructure, we have the capacity to significantly increase our manufacturing production. We intend to use our design, engineering and manufacturing capabilities to increase manufacturing efficiency and to continue to develop new products with lower manufacturing costs. In addition, if we grow our revenue and sell more units, our fixed manufacturing costs will be spread over more units, which we believe will further reduce our manufacturing costs on a per-unit basis. Improving our gross margin, which is dependent upon further increasing our manufacturing efficiency and growing our U.S. revenue, among other factors, is critical to our ability to reach profitability.
Investment in Research and Clinical Trials
We are continuously investing in research and development of new products and product enhancements to improve outcomes and enhance the physician experience with our products, while reducing the invasiveness of AAA therapy and expanding the pool of patients eligible for EVAR. We believe that these efforts will continue to drive adoption of our Ovation platform and further validate the advantages of our innovative technology. While research and development and clinical testing are time consuming and costly, we believe that clinical data demonstrating efficacy, safety and cost effectiveness is critical to increasing the adoption of our Ovation System.
For additional information about the risks and uncertainties associated with our business, see the section entitled “Risk Factors” of this Form 10-K.
Components of Results of Operations
Revenue
Our Ovation System consists of an aortic body preloaded into a catheter, at least two iliac limbs preloaded into catheters, a fill polymer kit and an autoinjector. In some cases, extra iliac limbs or iliac extensions may be required. Most of our sales are on a per-component basis; however, a small minority of our direct customers have total system pricing.
We derive revenue from sales of our Ovation System and related components and accessories to two types of customers: hospitals and distributors. We recognize revenue from sales to hospitals when we are notified that the product has been used or implanted and we have received a valid purchase order. Product sales to hospitals are billed to and paid by the hospitals as part of their normal payment processes, with payment received by us in the form of an electronic transfer, check or credit card. We recognize revenue from our distributors at the time the product is shipped to the distributor. Product sales to distributors are billed to and paid by the distributors as part of their normal payment processes, with payment received by us in the form of an electronic transfer. Our average sales prices are significantly higher in the United States than they are internationally. Our revenue from international sales can also be significantly impacted by fluctuations in foreign currency exchange rates.
41
We expect our revenue to increase as we expand our sales and marketing infrastructure and increase awareness of our products. We also expect our revenue to fluctuate from quarter to quarter due to a variety of factors, including seasonality and the impact of the buying patterns and implant volumes of our distributors and hospitals. We have historically experienced lower sales in the summer months and around the holidays.
Cost of Goods Sold, Gross Profit and Gross Margin
We manufacture the Ovation System at our manufacturing facility in Santa Rosa, California. Cost of goods sold includes the cost of raw materials, labor costs, manufacturing overhead expenses, reserves for expected scrap and inventory obsolescence as well as distribution-related expenses. Due to our relatively low production volumes compared to our current potential manufacturing capacity, a significant portion of our cost of goods sold consists of manufacturing overhead expenses. These expenses include the cost of quality assurance, material procurement, inventory control, facilities, equipment and operations supervision and management. Cost of goods sold also includes depreciation expense for production equipment, changes to our excess and obsolete inventory reserves, and certain direct costs such as shipping costs, net of costs charged to customers.
We calculate gross margin as revenue less cost of goods sold divided by revenue. Our gross margin has been and will continue to be affected by a variety of factors, primarily by our manufacturing costs and, to a lesser extent, the percentage of products we sell in the United States versus internationally and the percentage of products we sell to distributors versus directly to hospitals. Our gross margin is significantly higher on products we sell in the United States, as compared to products we sell internationally, due to significantly higher average selling prices in the United States. Our gross margin is typically higher on products we sell directly to hospitals as compared to products we sell through distributors.
We expect our gross margin to increase over the long term because we expect to increase our manufacturing efficiency and, as our production volume increases, we will spread our fixed manufacturing costs over a larger number of units, thereby significantly reducing our per-unit manufacturing costs. However, our gross margin may fluctuate from period to period depending on the interplay of all of these factors.
Sales, General and Administrative
Sales, general and administrative, or SG&A, expenses primarily consist of compensation, including salary, employee benefits and stock-based compensation expenses for our sales and marketing personnel, and for administrative personnel that support our general operations such as information technology, executive management, financial accounting, customer service, and human resources personnel. SG&A expenses also includes costs attributable to marketing our products to our customers and prospective customers, patent and legal fees, financial audit fees, insurance costs, recruiting fees, fees for other consulting services, and allocated facilities-related expenses. We expect to incur additional SG&A expenses in connection with our becoming a public company, which may increase further when we are no longer able to rely on the “emerging growth company” exemption we are afforded under the JOBS Act of 2012.
We expect our SG&A expenses to continue to increase in absolute dollars for the foreseeable future as our business grows and we continue to invest in our sales, marketing, clinical education, training and general administration resources to build our direct sales, distribution and administrative infrastructure in the United States. However, we expect our SG&A expenses to decrease as a percentage of our revenue over the long term, although our SG&A expenses may fluctuate from period to period due to the seasonality of our revenue and the timing and extent of our SG&A expenses.
Research and Development
Our research and development, or R&D, activities primarily consist of engineering and research programs associated with our products under development, as well as R&D activities associated with our core technologies. Our R&D expenses primarily consist of compensation, including salary, employee benefits and stock-based compensation expenses for our R&D and clinical personnel. We also incur significant expenses for supplies, development prototypes, design and testing, clinical study costs and product regulatory expenses. We expect our R&D expenses to increase as we initiate and advance our development projects and conduct additional clinical studies.
We expect our R&D expenses to continue to increase in absolute dollars for the foreseeable future as we continue to advance our products under development, as well as initiate and prepare for additional clinical studies. However, we expect our R&D expenses to decrease as a percentage of our revenue over the long term, although our R&D expenses may fluctuate from period to period due to the seasonality of our revenue and the timing and extent of our R&D expenses.
42
Loss on Extinguishment of Senior Notes
Loss on extinguishment of senior notes consists of the loss recognized in connection with the final payment of our notes with Pinnacle Ventures in 2012, which included all unamortized debt discounts and the previously unrecognized portion of the final payment.
Interest Expense
Our interest expense primarily consists of interest expense and amortization of debt discount associated with our term loan agreement with Capital Royalty, as amended. At December 31, 2014, there was $50.0 million outstanding principal under the term loan, which accrued interest at a rate of 12.5% per annum. There was also $6.0 million outstanding principal under our subordinated loan with Century Medical which we drew in the first quarter of 2014, which accrued interest at a rate of 5.0% per annum.
Interest Income and Other Income (Expense), Net and Income Tax Expense
Interest income and other income (expense), net primarily consists of changes in the fair value of then outstanding convertible preferred stock warrants. Prior to our IPO, the convertible preferred stock warrants were subject to re-measurement at each balance sheet date, and any change in fair value was recognized as a component of interest income and other income (expense), net. We continued to adjust the liability for changes in fair value until the completion of the IPO in April 2014, at which time all convertible preferred stock warrants were converted into warrants to purchase common stock and a final valuation was performed. We recognize interest and, if applicable, penalties related to income tax matters in income tax expense. We recognize our income tax expense using the effective tax method (“ETR”) as discussed in Note 14, “Income Tax Expense,” of our consolidated financial statements included in this Form 10-K.
Results of Operations
The following table presents our results of continuing operations and the related percentage of the period’s revenue (dollars in thousands):
|
|
|
Year Ended December 31, |
|
|||||||||||||||||||||
|
|
|
2014 |
|
|
2013 |
|
|
2012 |
|
|||||||||||||||
|
|
|
|
|
|
|
|
|
|
|
|
|
|
|
|
|
|
|
|
|
|
|
|
|
|
|
Revenue |
|
$ |
31,798 |
|
|
|
100.0 |
% |
|
$ |
19,508 |
|
|
|
100.0 |
% |
|
$ |
5,398 |
|
|
|
100.0 |
% |
|
Cost of goods sold |
|
|
13,820 |
|
|
|
43.5 |
% |
|
|
11,708 |
|
|
|
60.0 |
% |
|
|
8,948 |
|
|
|
165.8 |
% |
|
Gross profit |
|
|
17,978 |
|
|
|
56.5 |
% |
|
|
7,800 |
|
|
|
40.0 |
% |
|
|
(3,550 |
) |
|
|
-65.8 |
% |
|
Gross margin |
|
|
56.5 |
% |
|
|
|
|
|
|
40.0 |
% |
|
|
|
|
|
|
-65.8 |
% |
|
|
|
|
|
|
|
|
|
|
|
|
|
|
|
|
|
|
|
|
|
|
|
|
|
|
|
|
|
|
|
Operating expenses: |
|
|
|
|
|
|
|
|
|
|
|
|
|
|
|
|
|
|
|
|
|
|
|
|
|
Sales, general and administrative |
|
|
52,435 |
|
|
|
164.9 |
% |
|
|
38,401 |
|
|
|
196.8 |
% |
|
|
18,720 |
|
|
|
346.8 |
% |
|
Research and development |
|
|
15,544 |
|
|
|
48.9 |
% |
|
|
13,294 |
|
|
|
68.1 |
% |
|
|
12,156 |
|
|
|
225.2 |
% |
|
Total operating expenses |
|
|
67,979 |
|
|
|
213.8 |
% |
|
|
51,695 |
|
|
|
265.0 |
% |
|
|
30,876 |
|
|
|
572.0 |
% |
|
Loss from operations |
|
|
(50,001 |
) |
|
|
(157.2 |
%) |
|
|
(43,895 |
) |
|
|
(225.0 |
%) |
|
|
(34,426 |
) |
|
|
(637.8 |
%) |
|
Other income (expense): |
|
|
|
|
|
|
|
|
|
|
|
|
|
|
|
|
|
|
|
|
|
|
|
|
|
Loss on extinguishment of senior notes |
|
|
— |
|
|
N/A |
|
|
|
— |
|
|
N/A |
|
|
|
(3,081 |
) |
|
|
-57.1 |
% |
||
|
Interest expense |
|
|
(7,652 |
) |
|
|
(24.1 |
%) |
|
|
(6,386 |
) |
|
|
(32.7 |
%) |
|
|
(4,306 |
) |
|
|
(79.8 |
%) |
|
Interest income and other income (expense), net and income tax expense |
|
|
280 |
|
|
|
0.9 |
% |
|
|
(27 |
) |
|
|
(0.1 |
%) |
|
|
(1,499 |
) |
|
|
(27.8 |
%) |
|
Net loss |
|
$ |
(57,373 |
) |
|
|
(180.4 |
%) |
|
$ |
(50,308 |
) |
|
|
(257.9 |
%) |
|
$ |
(43,312 |
) |
|
|
(802.4 |
%) |
Comparison of Years Ended December 31, 2014 and 2013
Revenue. Revenue for the years ended December 31, 2014 and December 31, 2013 was $31.8 million and $19.5 million, respectively, an increase of 63%. The increase in revenue was primarily related to the growth of our U.S. business. For the years ended December 31, 2014 and 2013, our U.S. revenue was $21.5 million and $10.6 million, respectively, and represented 68% and 54% of our revenue in the respective periods. Since we initiated sales of our Ovation System in the U.S. in November 2012, revenue has grown significantly as we increased the size of our U.S. sales force resulting in increased adoption of our products. For the years ended December 31, 2014 and 2013, international revenue was $10.3 million and $8.9 million, respectively. For the year ended December 31, 2014, our distributor revenue represented 23% of our revenue, compared to 32% for the year ended December 31, 2013.
43
Cost of Goods Sold, Gross Profit and Gross Margin. Our cost of goods sold for the year ended December 31, 2014 was $13.8 million, resulting in a gross profit of $18.0 million, compared to $11.7 million in cost of goods sold in the year ended December 31, 2013, resulting in a gross profit of $7.8 million. Our gross margin for the year ended December 31, 2014 was 56.5%, compared to 40% for the year ended December 31, 2013. The increase in gross margin was primarily due to a significant reduction in our per-unit manufacturing costs resulting from the absorption of fixed manufacturing costs over substantially more units.
Sales, General and Administrative Expenses. Our SG&A expenses for the year ended December 31, 2014 were $52.4 million, compared to $38.4 million for the year ended December 31, 2013, an increase of 37%. At December 31, 2014, our SG&A headcount totaled 142 employees, compared to 125 employees at December 31, 2013. The increase in SG&A expenses was primarily associated with our continued expansion of our U.S. commercial operations. Employee-related expenses for our SG&A functions increased by $9.6 million for the year ended December 31, 2014 compared to the same period in 2013. The increase in employee related spending is associated with the annualization of compensation for 2013 new employees in addition to new employees hired in 2014. SG&A expenses also increased by $1.6 million associated with employee related expenses such as travel, $1.4 million associated with marketing and professional education expenses and $1.1 million associated with public company related costs.
Research and Development Expenses. Our R&D expenses for the year ended December 31, 2014 were $15.5 million, compared to $13.3 million for the year ended December 31, 2013, an increase of 17%. The increase in R&D expenses in the year ended December 31, 2014 consisted primarily of salary expenses and product development costs associated with our CustomSeal fill polymer, our Ovation iX iliac limbs and aortic bodies and our Ovation Alto System.
Interest Expense. Our interest expense for the year ended December 31, 2014 was $7.7 million, compared to $6.4 million for the year ended December 31, 2013. The increase in interest expense was primarily attributable repayment of the BSC note upon completion of our IPO in April 2014, which included recognition of the previously unamortized debt discount of $0.7 million, as well as the addition of the subordinated loan agreement with Century Medical in January 2014.
Interest Income and Other Income (Expense), Net. Interest income and other income (expense), net for the year ended December 31, 2014 was $0.3 million, compared to less than $0.1 million in the year ended December 31, 2013.
Comparison of Years Ended December 31, 2013 and 2012
Revenue. We commenced selling our products in Europe in September 2010 and in the U.S. in November 2012. Revenue for the years ended December 31, 2013 and 2012 was $19.5 million and $5.4 million, respectively, an increase of 261%. For the years ended December 31, 2013 and December 31, 2012, international revenue was $8.9 million and $5.2 million, respectively, and represented 46% and 96%, respectively, of revenue in the respective periods. Our international revenue growth of $3.7 million for the year ended December 31, 2013 was driven primarily by deeper penetration in geographies in which we were already selling our products, which accounted for approximately 85% of the increase. Of that 85%, more than two-thirds of the increase resulted from deeper penetration of our top three geographies. For the year ended December 31, 2013, distributor revenue represented 32% of our revenue, compared to 54% during the year ended December 31, 2012. Our U.S. revenue has grown significantly throughout 2013 as we increased the size of our U.S. sales force from 16 sales representatives at December 31, 2012 to 56 sales representatives at December 31, 2013.
Cost of Goods Sold, Gross Profit and Gross Margin. Our cost of goods sold for the year ended December 31, 2013 was $11.7 million, resulting in a gross profit of $7.8 million, compared to $8.9 million in cost of goods sold in the year ended December 31, 2012, resulting in a negative gross profit of $3.6 million. Our gross margin for the year ended December 31, 2013 was 40%, compared to a negative 66% for the year ended December 31, 2012. The increase in gross margin was primarily due to a significant reduction in our per-unit manufacturing costs resulting from the absorption of fixed manufacturing costs over substantially more units.
Sales, General and Administrative Expenses. Our SG&A expenses for the year ended December 31, 2013 were $38.4 million, compared to $18.7 million for the year ended December 31, 2012, an increase of 105%. At December 31, 2013, our SG&A headcount totaled 125 employees, compared to 72 employees at December 31, 2012. The increase in SG&A expenses was primarily associated with our initiation of Ovation System sales in the U.S. in November 2012 and the continued expansion of our U.S. commercial operations for the year ended December 31, 2013. Employee-related expenses for our SG&A functions increased by $18 million for the year ended December 31, 2013 compared to the same period in 2012. SG&A expenses also increased by $0.3 million associated with marketing and promotional expenses and tradeshows and $0.3 million due to accounting fees.
Research and Development Expenses. Our R&D expenses for the year ended December 31, 2013 were $13.3 million, compared to $12.2 million for the year ended December 31, 2012, an increase of 9%. The increase in R&D expenses in the year ended December 31, 2013 consisted primarily of salary expenses.
Interest Expense. Our interest expense for the year ended December 31, 2013 was $6.4 million, compared to $4.3 million for the year ended December 31, 2012. The increase in interest expense was attributable to the term loan agreement we executed with Capital Royalty in October 2012, under which we can draw up to $50 million, subject to certain conditions, at a rate of 14% per annum,
44
payable on a quarterly basis. In October 2012, we drew $40 million under the term loan agreement. Interest expense for the year ended December 31, 2012 related to notes payable to Pinnacle Ventures at a rate of 11% and our note payable to Boston Scientific Corporation at a rate of 5.25%. We used proceeds from the Capital Royalty term loan to repay all amounts outstanding under the Pinnacle Ventures notes in October 2012.
Interest Income and Other Income (Expense), Net. Interest income and other income (expense), net for the year ended December 31, 2013 was less than $0.1 million, compared to negative $1.5 million in the year ended December 31, 2012. The decrease was attributable to the change in fair value of warrant liabilities.
Liquidity and Capital Resources
Historically, our sources of cash have primarily included our IPO, private placements of equity securities and debt arrangements, and, to a much lesser extent, cash generated from operations, primarily from the collection of accounts receivable resulting from sales. Our historical cash outflows have primarily been associated with cash used for operating activities such as expansion of our sales and marketing infrastructure, investing in inventory, R&D activities and other working capital needs. At December 31, 2014, we had approximately $79.0 million in cash and cash equivalents and short-term investments.
Since our inception, we have generated significant losses and expect to continue to generate losses for the foreseeable future. In January 2014, we entered into a term loan agreement with Century Medical for an aggregate amount of $6.0 million, $4.0 million of which we drew down in January 2014 and the remaining $2.0 million of which we drew down in March 2014. In April 2014, we completed our IPO of 7,475,000 shares of common stock, which included the exercise in full by the underwriters in the offering of their option to purchase 975,000 additional shares of common stock, at an offering price of $12.00 per share. We received net proceeds of approximately $81.1 million, after deducting underwriting discounts and commissions and offering expenses. In November 2014, we entered into the Amended and Restated Term Loan Agreement with Capital Royalty Partners II L.P. and its affiliate funds (collectively, “CRG” or “Capital Royalty”) amending the original term loan agreement under which we previously borrowed $40.0 million in October 2012 (the “Original Term Loan Agreement”) and upon closing of the transaction, increased borrowings under the facility by $10.0 million. Additionally, subject to the achievement of certain revenue milestones, we will have an option to access up to an additional $15.0 million on or before December 31, 2015.
We believe that our cash, cash equivalents, short-term investments and available sources of debt financing will be sufficient to satisfy our liquidity requirements for at least the next 12 months. We have utilized, and may continue to utilize, debt arrangements with debt providers and financial institutions to finance our operations. Factors such as interest rates and available cash will impact our decision to continue to utilize debt arrangements as a source of cash.
The following table shows a summary of our cash flows for the years ended December 31, 2014, 2013, and 2012 (in thousands):
|
|
|
For the Year Ended December 31, |
|
|||||||||
|
|
|
2014 |
|
|
2013 |
|
|
2012 |
|
|||
|
|
|
|
|
|
|
|
|
|
|
|
|
|
|
Cash and cash equivalents at beginning of period |
|
$ |
38,108 |
|
|
$ |
45,393 |
|
|
$ |
3,241 |
|
|
Net cash used in operating activities |
|
|
(53,582 |
) |
|
|
(46,916 |
) |
|
|
(33,957 |
) |
|
Net cash provided by (used in) investing activities |
|
|
(46,401 |
) |
|
|
(208 |
) |
|
|
851 |
|
|
Net cash provided by financing activities |
|
|
94,856 |
|
|
|
39,831 |
|
|
|
75,267 |
|
|
Effect of exchange rate on cash |
|
|
(85 |
) |
|
|
8 |
|
|
|
(9 |
) |
|
Cash and cash equivalents at end of period |
|
$ |
32,896 |
|
|
$ |
38,108 |
|
|
$ |
45,393 |
|
Operating activities. The increase in net cash used in operating activities during 2014 compared to 2013 was primarily related to our increased expenditures, including higher employee headcount, employee-related expenses and working capital needs, as a result of our deeper commercial penetration in the United States.
Investing activities. Net cash used in investing activities in the year ended December 31, 2014 was primarily related to the purchase of investments.
Financing activities. The net cash provided by financing activities in the year ended December 31, 2014 was primarily related to the execution and draw-down of our subordinated loan agreement with Century Medical, proceeds from the issuance of common stock and net proceeds received from our IPO.
45
Indebtedness
Capital Royalty Term Loan
In October 2012, we executed a term loan agreement with Capital Royalty Partners II L.P. and Parallel Investment Opportunities Partners II L.P. (together, “Capital Royalty”) providing us access to up to $50 million under the arrangement, of which $40 million was available in October 2012, and an additional amount up to $10 million was available upon our achievement of a revenue-based milestone, which we elected not to draw down. In October 2012, we drew $40 million under the agreement. Those proceeds were used to repay all amounts outstanding under our $20 million loan from affiliates of Pinnacle Ventures L.L.C.
On November 4, 2014, we entered into the Amended and Restated Term Loan Agreement with Capital Royalty Partners II L.P. and its affiliate funds (collectively, “CRG” or “Capital Royalty”) amending the original term loan. In connection with this amendment, we increased borrowings under the facility by drawing down $10 million upon closing of the transaction on November 21, 2014. Additionally, subject to the achievement of certain revenue milestones, we have an option to access up to an additional $15 million on or before December 31, 2015.
The Amended and Restated Term Loan Agreement primarily amended the terms of the original term loan agreement to increase the borrowing amount, reduce the applicable interest rate from 14.0% to 12.5%, extend the interest only payment period through September 30, 2018 and extend the final maturity date to June 30, 2020. Interest is payable, at our option, (i) in cash at a rate of 12.5% per annum or (ii) 9.0% of the 12.5% per annum in cash and 3.5% of the 12.5% per annum being added to the principal of the loan and subject to accruing interest. Interest-only payments are due quarterly on March 31, June 30, September 30 and December 31 of each year of the interest-only payment period. Thereafter, in addition to interest accrued during the period, the quarterly payments shall include an amount equal to the outstanding principal at September 30, 2018 divided by the remaining number of quarters prior to the end of the term of the loan which is June 30, 2020. The Amended and Restated Term Loan Agreement provides for prepayment fees of 4% of the outstanding balance of the loan if the loan is repaid prior to September 30, 2015. The prepayment fee is reduced by 1% per year for each subsequent year.
Certain affirmative and negative covenants were also amended to provide the Company with additional flexibility. The principal financial covenants require that the Company attain minimum annual revenues of $30.0 million in 2015, $45.0 million in 2016, $60.0 million in 2017, $75.0 million in 2018 and $90.0 million thereafter. At December 31, 2014, we were in compliance with all of the covenants.
The term loan, as amended, continues to be collateralized by a first priority security interest on all of our assets excluding property not assignable without consent by a third party, trademarks that would be invalid by reason of including it in the collateral and 35% of the ownership interest in a foreign subsidiary.
Century Medical, Inc. Subordinated Loan
In January 2014, we executed an exclusive distribution agreement and a related term loan agreement for up to $6 million with Century Medical, a Japanese medical device distributor.
Under the term loan agreement, Century Medical loaned us $4 million in January 2014 and upon achievement of a revenue-based milestone, we drew down the remaining $2 million available under the agreement in March 2014.
The loan has a five-year term, except that it becomes due if the distribution agreement is terminated due to a change of control termination event. The loan accrues interest at an annual rate of 5%. Interest-only payments are due quarterly. If we are in default, the interest rate increases to 9%, and we may elect to pay interest in the form of compounded interest to be added to the aggregate principal amount. We may prepay the loan at any time without penalty.
The loan is collateralized by all of our assets other than intellectual property. The loan is subordinated to the Capital Royalty term loan pursuant to a subordination agreement among Capital Royalty, Century Medical and us.
On November 4, 2014, we entered into an amendment to loan agreement with Century Medical primarily to conform certain terms of the existing agreement to those of the Amended and Restated Term Loan Agreement with Capital Royalty.
Boston Scientific Corporation Note Payable
In March 2008, we issued a promissory note in the amount of $3.5 million to Boston Scientific Corporation as part of the purchase price consideration related to our spin-off transaction from Boston Scientific Corporation. The note carried an interest rate of 5.25% per annum and matured on March 28, 2018. The note, together with unpaid accrued interest, was repayable upon our initial public offering or a sale or liquidation event. We repaid the note in full, including all accrued interest and the previously unrecognized unamortized debt discount, subsequent to the closing of the IPO in April 2014.
46
Future Capital Requirements
Our liquidity position and capital requirements are subject to a number of factors. For example, our cash inflow and outflow may be impacted by the following:
|
· |
our ability to generate revenues; |
|
· |
fluctuations in gross margins and net losses; and |
|
· |
fluctuations in working capital. |
Our primary short-term capital needs, which are subject to change, include expenditures related to:
|
· |
support of our commercialization efforts related to our current and future products; |
|
· |
improvements in our manufacturing capacity and efficiency; |
|
· |
new research and product development efforts; and |
|
· |
payment of interest due under our loan agreements with Capital Royalty and Century Medical. |
Although we believe the foregoing items reflect our most likely uses of cash in the short term, we cannot predict with certainty all of our particular short-term cash uses or the timing or amount of cash used. If cash generated from operations is insufficient to satisfy our working capital and capital expenditure requirements, we may be required to sell additional equity or debt securities or obtain additional credit facilities. This capital may not be available on satisfactory terms, if at all. Furthermore, any additional equity financing may be dilutive to our stockholders, and debt financing, if available, may include restrictive covenants. For a discussion of other factors that may impact our future liquidity and capital funding requirements, see “Risk Factors.”
Credit Risk
We had receivable balances from customers in Europe of approximately $2.8 million as of December 31, 2014 and $2.4 million as of December 31, 2013. Our accounts receivable outside of the United States are primarily due from third-party distributors, and to a lesser extent, public government-owned and private hospitals. Our accounts receivable in the United States are primarily due from for-profit and not-for-profit private hospitals. Our historical write-offs of accounts receivable have not been significant.
We monitor the financial performance and credit worthiness of our customers, so that we can properly assess and respond to changes in their credit profile. Our third-party distributors operate in certain countries, such as Greece, Italy, Spain and Turkey, where economic conditions continue to present challenges to their businesses, and thus, could place at risk the amounts due to us from them. These distributors are owed certain amounts from public hospitals that are funded by their governments. Adverse financial conditions in these countries may continue, thus negatively affecting the length of time that it will take us to collect associated accounts receivable, or impact the likelihood of ultimate collection.
Contractual Obligations
The following table shows a summary of our contractual obligations as of December 31, 2014 (in thousands):
|
|
|
Payments due by Period |
|
|||||||||||||||||
|
|
|
|
|
|
|
|
|
|
|
|
|
|
|
|
|
|
|
Total |
|
|
|
|
|
Less than |
|
|
|
|
|
|
|
|
|
|
More than |
|
|
Amounts |
|
|||
|
|
|
1 Year |
|
|
1 to 3 Years |
|
|
3 to 5 Years |
|
|
5 Years |
|
|
Committed |
|
|||||
|
|
|
|
|
|
|
|
|
|
|
|
|
|
|
|
|
|
|
|
|
|
|
Debt Obligations |
|
$ |
5,142 |
|
|
$ |
10,812 |
|
|
$ |
75,734 |
|
|
$ |
— |
|
|
$ |
91,688 |
|
|
Operating Leases (1) |
|
|
1,187 |
|
|
|
2,399 |
|
|
|
199 |
|
|
|
— |
|
|
|
3,785 |
|
|
Total contractual obligations |
|
$ |
6,329 |
|
|
$ |
13,211 |
|
|
$ |
75,933 |
|
|
$ |
— |
|
|
$ |
95,473 |
|
|
(1) |
We currently lease approximately 110,000 square feet for our headquarters and manufacturing facilities in Santa Rosa, California that expires in March 2018 as well as various administrative offices in various locations. |
Critical Accounting Policies and Estimates
Our consolidated financial statements included in this Form 10-K have been prepared in accordance with generally accepted accounting principles in the United States, or U.S. GAAP. To prepare our financial statements, we must make estimates and assumptions that affect the reported amounts of assets and liabilities, sales, costs and expenses. We base our estimates on historical expenses and on various other assumptions that we believe to be reasonable under the circumstances. Changes in the accounting
47
estimates are likely to occur from period to period. Actual results could be significantly different from these estimates. We believe that the accounting policies discussed below are critical to understanding our historical and future performance, as these policies relate to the more significant areas involving management’s judgment and estimates.
In May 2014, the Financial Accounting Standards Board, or FASB, issued Accounting Standards Update (“ASU”) No. 2014-09. ASU 2014-09 provided guidance related to revenue from contracts with customers. Under this guidance, revenue is recognized when promised goods or services are transferred to customers in an amount that reflects the consideration that is expected to be received for those goods or services. The updated standard will replace most existing revenue recognition guidance under GAAP when it becomes effective and permits the use of either the retrospective or cumulative effect transition method. Early adoption is not permitted. The updated standard will be effective for us in the first quarter of 2017. We have not yet selected a transition method and are currently evaluating the effect that the updated standard will have on our consolidated financial statements and related disclosures.
In August 2014, the FASB issued new guidance related to the disclosures around going concern. The new standard provides guidance around management’s responsibility to evaluate whether there is substantial doubt about an entity’s ability to continue as a going concern and to provide related footnote disclosures. The new standard is effective for fiscal years, and interim periods within those fiscal years, beginning after December 15, 2016. Early adoption is permitted. The adoption of this standard is not expected to have a material impact on our financial statements.
Our critical accounting policies and estimates are more fully described in Note 2, “Summary of Significant Accounting Policies”, of our consolidated financial statements in this Form 10-K.
Revenue Recognition
Our revenue is generated from sales to two types of customers: hospitals and third-party distributors. Sales to hospitals represent the majority of our revenue. We utilize a network of direct sales representatives for sales in the United States and a combination of direct sales representatives, independent sales agencies and distributors for sales outside the United States. We recognize revenue when persuasive evidence of an arrangement exists, product delivery has occurred, pricing is fixed or determinable and collection is reasonably assured. In direct markets, we provide products for a specific implant procedure and recognize revenue at the time that we are notified that the product has been used or implanted and a valid purchase order has been received. For all other transactions, we recognize revenue when title to the goods and risk of loss transfer to customers, provided that there are no remaining performance obligations that will affect the customer’s final acceptance of the sale. We recognize revenue from sales to distributors at the time the product is shipped to the distributor. Distributors, who sell the products to their customers, take title to the products and assume all risks of ownership at time of shipment. Our distributors are obligated to pay within specified terms regardless of when or if they ever they sell the products. Our policy is to classify shipping and handling costs, net of costs charged to customers, as cost of goods sold. In general, we do not offer rights of return or price protection to our customers and have no post-delivery obligations. We offer rights of exchange in limited circumstances for products that have a short shelf life at the time of shipment. One of our distributor customers represented 16.9% of our net accounts receivable and approximately 4% of our sales for the year ended December 31, 2014.
Excess and Obsolete Inventory
We state inventories at the lower of cost or market. We determine cost on a standard cost method, which approximates the first-in, first-out method. We evaluate the carrying value of our inventories in relation to our estimated forecast of product demand, which takes into consideration the estimated life cycle of our products. A significant decrease in demand could result in an increase in the amount of excess inventory quantities on hand. When quantities on hand exceed estimated sales forecasts, we record a write-down for excess inventories, which results in a corresponding charge to cost of goods sold. Charges incurred for excess and obsolete inventory were $0.8 million and $0.1 million for the years ended December 31, 2014 and 2013, respectively.
Our industry is characterized by ongoing product innovation that could result in an increase in the amount of obsolete inventory quantities on hand. For example, as we introduce new products or next generation products, we may be required to take charges for excess and obsolete inventory that could have a significant impact on the value of our inventory or our operating results.
Investments
We may have investments, with maturities of longer than 90 days but less than a year, based on expected maturity dates. They are classified as available-for-sale as we can liquidate our securities as needed, and changes in fair value between accounting periods are included in accumulated other comprehensive (loss) income on the consolidated balance sheet until the securities are sold. Discounts or premiums are amortized to interest income and other income (expense) net using the interest method.
48
Goodwill and Indefinite Lived Intangible Assets
As a result of our spin off from Boston Scientific Corporation, we recorded goodwill and intangible assets. We classify intangible assets into three categories: (1) goodwill; (2) intangible assets with indefinite lives not subject to amortization; and (3) intangible assets with definite lives subject to amortization. Goodwill and intangible assets with indefinite lives are not amortized. We assess goodwill and other intangible assets with indefinite lives for impairment on an annual basis in the fourth quarter of each year or more frequently if indicators of impairment exist.
The performance of the goodwill impairment test involves a two-step process. We first assess our book value and market value, by reporting unit, to determine if an impairment of goodwill exists. We have determined that we have one reporting unit. A potential impairment exists if the fair value of the reporting unit is lower than its net book value. The second step of the process is only performed if a potential impairment exists, and it involves comparing the aggregate fair value of the reporting unit’s net assets, other than goodwill and other intangibles, to the fair value of the reporting unit as a whole. Goodwill is considered impaired, and an impairment charge is recorded, if the excess of the fair value of the reporting unit over the fair value of the net assets is less than the carrying value of goodwill and intangible assets with indefinite lives. This evaluation requires use of internal business plans that are based on our judgments regarding future economic conditions, product demand and pricing, costs, inflation rates and discount rates, among other factors. These judgments and estimates involve inherent uncertainties, and the measurement of the fair value is dependent on the accuracy of the assumptions used in making the estimates and how those estimates compare to our future operating performance.
The fair value measurement of purchased intangible assets with indefinite lives involves the estimation of the fair value which is based on our management’s assumptions about expected future cash flows, discount rates, growth rates, estimated costs and other factors which utilize historical data, internal estimates, and, in some cases, outside data. If the carrying value of the indefinite life intangible asset exceeds management’s estimate of fair value, the asset is impaired, and we would be required to record an impairment charge which would negatively impact our operating results. There was no impairment of goodwill, or intangible assets with indefinite lives, identified through December 31, 2014.
Stock-Based Compensation
We determine the fair value of stock options on the date of grant and shares to be issued to employees under the Employee Stock Purchase Plan (“ESPP”) utilizing the Black-Scholes option-pricing model, and is impacted by our common stock price as well as changes in assumptions regarding a number of highly complex and subjective variables. These variables include, but are not limited to, expected common stock price volatility, expected term, risk-free interest rates and expected dividends. For restricted stock unit (“RSU”) awards, the fair value is determined based on the closing price on the NASDAQ Global Select Market on date of the award.
The fair value is recognized over the period during which services are rendered, known as the requisite service period on a straight-line basis for awards that vest based on service conditions. Stock-based compensation expense recognized at fair value includes the impact of estimated forfeitures. We estimate future forfeitures at the date of grant and revises the estimates, if necessary, in subsequent periods if actual forfeitures differ from those estimates.
Equity instruments issued to non-employees are recorded at their fair value on the measurement date and are subject to periodic adjustments as the underlying equity instruments vest. The fair value of options granted to consultants is expensed when vested. The non-employee stock-based compensation expense was not material for all periods presented.
Cash flows resulting from the tax benefits for tax deductions resulting from the exercise of stock options in excess of the compensation expense recorded for those options (excess tax benefits) are classified as cash flows from financing activities in the consolidated statements of cash flows; however, there were no cash flow impacts from excess tax benefits during the years ending December 31, 2014, 2013, or 2012.
Estimating the fair value of equity-settled awards as of the grant date using valuation models, such as the Black-Scholes option pricing model, is affected by assumptions regarding a number of complex variables. Changes in the assumptions can materially affect the fair value and ultimately how much stock-based compensation expense is recognized. These inputs are subjective and generally require significant analysis and judgment to develop. For valuations of all equity awards utilizing the Black-Scholes option-pricing model to date, we estimated the expected term and the volatility data based on a study of publicly traded industry peer companies and the our actual experience since the IPO. For purposes of identifying these peer companies, we considered the industry, stage of development, size and financial leverage of potential comparable companies. The risk-free interest rate is based on the yield available on U.S. Treasury zero-coupon issues similar in duration to the expected term of the equity-settled award.
49
Warrant Liabilities
We previously issued freestanding warrants to purchase shares of our convertible preferred stock. The warrants were recorded at fair value using either the Black-Scholes option pricing model, other binomial valuation model or lattice model, depending on the characteristics of the warrants at the time of the valuation. We remeasured the fair value of the convertible preferred stock warrants at each financial reporting period with any changes in fair value being recognized as a component of other income (expense) in the accompanying statements of comprehensive loss. Upon the closing of our IPO, the warrants converted into warrants exercisable for common stock. At that time, the liability was reclassified to additional paid-in capital.
Off Balance Sheet Arrangements
We do not maintain any off balance sheet partnerships, arrangements, or other relationships with unconsolidated entities or others, often referred to as structured finance or special-purpose entities, which are established for the purpose of facilitating off balance sheet arrangements or other contractually narrow or limited purposes.
JumpStart Our Business Startups Act of 2012 (JOBS Act)
In April 2012, the Jumpstart Our Business Startups Act of 2012, or the JOBS Act, was enacted. Section 107 of the JOBS Act provides that an “emerging growth company” can take advantage of the extended transition period provided in Section 7(a)(2)(B) of the Securities Act for complying with new or revised accounting standards. Thus, an emerging growth company can delay the adoption of certain accounting standards until those standards would otherwise apply to private companies. We have irrevocably elected not to avail ourselves of this extended transition period and, as a result, we will adopt new or revised accounting standards on the relevant dates on which adoption of such standards is required for other public companies.
Item 7A. QUANTITATIVE AND QUALITATIVE DISCLOSURES ABOUT MARKET RISK.
We do not believe that we currently have material exposure to interest rate, foreign currency exchange rate or other relevant market risks.
Interest Rate Risk
We are exposed to market risks in the ordinary course of our business. Our cash and cash equivalents include cash in readily available checking and money market accounts. These securities are not dependent on interest rate fluctuations that may cause the principal amount of these assets to fluctuate. Additionally, the interest rate on our Capital Royalty and Century term loans are fixed and not subject to changes in market interest rates.
Foreign Currency Exchange Risk
A significant portion of our business is located outside the United States and, as a result, we generate revenue and incur expenses denominated in currencies other than the U.S. dollar, a majority of which is denominated in Euros. For the years ended December 31, 2014 and 2013, approximately 21% and 31%, respectively, of our sales were denominated in foreign currencies. As a result, our revenue can be significantly impacted by fluctuations in foreign currency exchange rates. Our international selling, marketing and administrative costs related to these sales are largely denominated in the same foreign currencies, which mitigated our foreign currency exchange risk exposure. A hypothetical 10% favorable or unfavorable change in the weighted average foreign currency rates for the year ended December 31, 2014 would have affected the annualized foreign currency denominated revenue by $0.7 million for the year.
50
Item 8. FINANCIAL STATEMENTS AND SUPPLEMENTAL DATA
INDEX TO CONSOLIDATED FINANCIAL STATEMENTS
51
Report of Independent Registered Public Accounting Firm
To the Board of Directors and Stockholders of
TriVascular Technologies, Inc.
In our opinion, the accompanying consolidated balance sheets and the related consolidated statements of comprehensive loss, of convertible preferred stock and stockholders’ equity (deficit) and cash flows present fairly, in all material respects, the financial position of TriVascular Technologies, Inc. and its subsidiaries (“the Company”) at December 31, 2014 and 2013, and the results of their operations and their cash flows for each of the three years in the period ended December 31, 2014 in conformity with accounting principles generally accepted in the United States of America. These consolidated financial statements are the responsibility of the Company’s management. Our responsibility is to express an opinion on these consolidated financial statements based on our audits. We conducted our audits of these statements in accordance with the standards of the Public Company Accounting Oversight Board (United States). Those standards require that we plan and perform the audit to obtain reasonable assurance about whether the financial statements are free of material misstatement. An audit includes examining, on a test basis, evidence supporting the amounts and disclosures in the consolidated financial statements, assessing the accounting principles used and significant estimates made by management, and evaluating the overall financial statement presentation. We believe that our audits provide a reasonable basis for our opinion.
/s/ PricewaterhouseCoopers LLP
San Jose, California
March 9, 2015
52
TriVascular Technologies, Inc.
(in thousands, except par value and share data)
|
|
|
As of December 31, |
|
|||||
|
|
|
2014 |
|
|
2013 |
|
||
|
|
|
|
|
|
|
|
|
|
|
Assets |
|
|
|
|||||
|
Current assets |
|
|
|
|
|
|
|
|
|
Cash and cash equivalents |
|
$ |
32,896 |
|
|
$ |
38,108 |
|
|
Short-term investments |
|
|
46,084 |
|
|
|
— |
|
|
Accounts receivable, net |
|
|
6,565 |
|
|
|
4,741 |
|
|
Inventories, net |
|
|
8,570 |
|
|
|
7,042 |
|
|
Prepaid expenses and other current assets |
|
|
2,932 |
|
|
|
2,435 |
|
|
Total current assets |
|
|
97,047 |
|
|
|
52,326 |
|
|
Property and equipment, net |
|
|
1,248 |
|
|
|
1,505 |
|
|
Goodwill |
|
|
8,259 |
|
|
|
8,259 |
|
|
Other intangible assets |
|
|
1,182 |
|
|
|
1,182 |
|
|
Other assets |
|
|
797 |
|
|
|
1,428 |
|
|
Total assets |
|
$ |
108,533 |
|
|
$ |
64,700 |
|
|
|
|
|
|
|
|
|
|
|
|
Liabilities, Convertible Preferred Stock and Stockholders’ Equity (Deficit) |
|
|
|
|
|
|
|
|
|
Current liabilities |
|
|
|
|
|
|
|
|
|
Accounts payable |
|
$ |
1,862 |
|
|
$ |
1,678 |
|
|
Accrued liabilities and other |
|
|
8,465 |
|
|
|
6,129 |
|
|
Total current liabilities |
|
|
10,327 |
|
|
|
7,807 |
|
|
Notes payable |
|
|
55,004 |
|
|
|
44,288 |
|
|
Other long term liabilities |
|
|
3,629 |
|
|
|
1,413 |
|
|
Total liabilities |
|
|
68,960 |
|
|
|
53,508 |
|
|
Commitments and contingencies (Note 9) |
|
|
|
|
|
|
|
|
|
Convertible preferred stock |
|
|
— |
|
|
|
239,990 |
|
|
Stockholders’ equity (deficit) |
|
|
|
|
|
|
|
|
|
Preferred stock, $0.01 par value - 5,000,000 shares authorized, 0 shares issued and outstanding at December 31, 2014 |
|
|
— |
|
|
|
— |
|
|
Common stock, $0.01 par value -100,000,000 shares authorized, 20,168,069 and 580,458 shares issued and outstanding at December 31, 2014 and 2013, respectively |
|
|
202 |
|
|
|
6 |
|
|
Additional paid-in capital |
|
|
335,445 |
|
|
|
9,551 |
|
|
Accumulated other comprehensive (loss) income |
|
|
(180 |
) |
|
|
166 |
|
|
Accumulated deficit |
|
|
(295,894 |
) |
|
|
(238,521 |
) |
|
Total stockholders’ equity (deficit) |
|
|
39,573 |
|
|
|
(228,798 |
) |
|
Total liabilities, convertible preferred stock and stockholders' equity (deficit) |
|
$ |
108,533 |
|
|
$ |
64,700 |
|
The accompanying notes are an integral part of these consolidated financial statements.
53
TriVascular Technologies, Inc.
Consolidated Statements of Comprehensive Loss
(in thousands, except share and per share data)
|
|
|
Year Ended December 31, |
|
|||||||||
|
|
|
2014 |
|
|
2013 |
|
|
2012 |
|
|||
|
|
|
(in thousands, except share and per share data) |
|
|||||||||
|
|
|
|
|
|
|
|
|
|
|
|
|
|
|
Revenue |
|
$ |
31,798 |
|
|
$ |
19,508 |
|
|
$ |
5,398 |
|
|
Cost of goods sold |
|
|
13,820 |
|
|
|
11,708 |
|
|
|
8,948 |
|
|
Gross profit |
|
|
17,978 |
|
|
|
7,800 |
|
|
|
(3,550 |
) |
|
|
|
|
|
|
|
|
|
|
|
|
|
|
|
Operating expenses: |
|
|
|
|
|
|
|
|
|
|
|
|
|
Sales, general and administrative |
|
|
52,435 |
|
|
|
38,401 |
|
|
|
18,720 |
|
|
Research and development |
|
|
15,544 |
|
|
|
13,294 |
|
|
|
12,156 |
|
|
Total operating expenses |
|
|
67,979 |
|
|
|
51,695 |
|
|
|
30,876 |
|
|
Loss from operations |
|
|
(50,001 |
) |
|
|
(43,895 |
) |
|
|
(34,426 |
) |
|
Other income (expense): |
|
|
|
|
|
|
|
|
|
|
|
|
|
Loss on extinguishment of senior notes |
|
|
— |
|
|
|
— |
|
|
|
(3,081 |
) |
|
Interest expense |
|
|
(7,652 |
) |
|
|
(6,386 |
) |
|
|
(4,306 |
) |
|
Interest income and other income (expense), net |
|
|
592 |
|
|
|
172 |
|
|
|
(1,324 |
) |
|
Loss before income tax expense |
|
|
(57,061 |
) |
|
|
(50,109 |
) |
|
|
(43,137 |
) |
|
Provision for income tax |
|
|
312 |
|
|
|
199 |
|
|
|
175 |
|
|
Net loss |
|
$ |
(57,373 |
) |
|
$ |
(50,308 |
) |
|
$ |
(43,312 |
) |
|
|
|
|
|
|
|
|
|
|
|
|
|
|
|
Other comprehensive (loss) income: |
|
|
|
|
|
|
|
|
|
|
|
|
|
Change in foreign currency translation adjustment |
|
|
(336 |
) |
|
|
103 |
|
|
|
128 |
|
|
Change in unrealized (loss) gain on short-term investments |
|
|
(10 |
) |
|
|
— |
|
|
|
1 |
|
|
Other comprehensive (loss) income |
|
|
(346 |
) |
|
|
103 |
|
|
|
129 |
|
|
Comprehensive loss |
|
$ |
(57,719 |
) |
|
$ |
(50,205 |
) |
|
$ |
(43,183 |
) |
|
|
|
|
|
|
|
|
|
|
|
|
|
|
|
Net loss per share, basic and diluted |
|
$ |
(3.95 |
) |
|
$ |
(87.42 |
) |
|
$ |
(101.97 |
) |
|
|
|
|
|
|
|
|
|
|
|
|
|
|
|
Weighted average shares used to compute net loss per share, basic and diluted |
|
|
14,519,396 |
|
|
|
575,482 |
|
|
|
424,743 |
|
The accompanying notes are an integral part of these consolidated financial statements.
54
TriVascular Technologies, Inc.
Consolidated Statements of Convertible Preferred Stock and Stockholders’ Equity (Deficit)
(in thousands, except share and per share data)
|
|
|
|
|
|
|
|
|
|
|
|
|
|
|
|
|
|
|
|
|
|
|
|
Accumulated |
|
|
|
|
|
|
|
|
|
|
|
|
|
Convertible |
|
|
|
|
|
|
|
|
|
|
|
Additional |
|
|
Other |
|
|
|
|
|
|
|
|
|
|||||||
|
|
|
Preferred Stock |
|
|
|
Common Stock |
|
|
Paid-In |
|
|
Comprehensive |
|
|
Accumulated |
|
|
Stockholders’ |
|
||||||||||||||
|
|
|
Shares |
|
|
Amount |
|
|
|
Shares |
|
|
Amount |
|
|
Capital |
|
|
Income (Loss) |
|
|
Deficit |
|
|
Equity (Deficit) |
|
||||||||
|
|
|
(in thousands, expect share and per share data) |
|
||||||||||||||||||||||||||||||
|
Balances at January 1, 2012 |
|
|
136,298,168 |
|
|
$ |
140,122 |
|
|
|
|
359,225 |
|
|
$ |
4 |
|
|
$ |
6,236 |
|
|
$ |
(66 |
) |
|
$ |
(144,901 |
) |
|
$ |
(138,727 |
) |
|
Issuance of Series D convertible preferred stock at $0.3896 per share for cash in June and October 2012, net of issuance costs of $201 |
|
|
154,465,052 |
|
|
|
59,978 |
|
|
|
|
— |
|
|
|
— |
|
|
|
— |
|
|
|
— |
|
|
|
— |
|
|
|
— |
|
|
Issuance of common stock upon exercise of stock options |
|
|
— |
|
|
|
— |
|
|
|
|
213,659 |
|
|
|
2 |
|
|
|
562 |
|
|
|
— |
|
|
|
— |
|
|
|
564 |
|
|
Issuance of common stock warrants in connection with term loan |
|
|
— |
|
|
|
— |
|
|
|
|
— |
|
|
|
— |
|
|
|
499 |
|
|
|
— |
|
|
|
— |
|
|
|
499 |
|
|
Vesting of early exercised common stock |
|
|
— |
|
|
|
— |
|
|
|
|
— |
|
|
|
— |
|
|
|
18 |
|
|
|
— |
|
|
|
— |
|
|
|
18 |
|
|
Stock-based compensation expense |
|
|
— |
|
|
|
— |
|
|
|
|
— |
|
|
|
— |
|
|
|
1,005 |
|
|
|
— |
|
|
|
— |
|
|
|
1,005 |
|
|
Net loss |
|
|
— |
|
|
|
— |
|
|
|
|
— |
|
|
|
— |
|
|
|
— |
|
|
|
— |
|
|
|
(43,312 |
) |
|
|
(43,312 |
) |
|
Change in foreign currency translation adjustment |
|
|
— |
|
|
|
— |
|
|
|
|
— |
|
|
|
— |
|
|
|
— |
|
|
|
128 |
|
|
|
— |
|
|
|
128 |
|
|
Change in unrealized gain on investments |
|
|
— |
|
|
|
— |
|
|
|
|
— |
|
|
|
— |
|
|
|
— |
|
|
|
1 |
|
|
|
— |
|
|
|
1 |
|
|
Balances at December 31, 2012 |
|
|
290,763,220 |
|
|
$ |
200,100 |
|
|
|
|
572,884 |
|
|
$ |
6 |
|
|
$ |
8,320 |
|
|
$ |
63 |
|
|
$ |
(188,213 |
) |
|
$ |
(179,824 |
) |
|
Issuance of Series E convertible preferred stock at $0.3896 per share for cash in November 2013, net of issuance costs of $110 |
|
|
102,669,404 |
|
|
|
39,890 |
|
|
|
|
— |
|
|
|
— |
|
|
|
— |
|
|
|
— |
|
|
|
— |
|
|
|
— |
|
|
Issuance of common stock upon exercise of stock options |
|
|
|
|
|
|
|
|
|
|
|
7,574 |
|
|
|
— |
|
|
|
56 |
|
|
|
— |
|
|
|
— |
|
|
|
56 |
|
|
Vesting of early exercised common stock |
|
|
— |
|
|
|
— |
|
|
|
|
— |
|
|
|
— |
|
|
|
5 |
|
|
|
— |
|
|
|
— |
|
|
|
5 |
|
|
Stock-based compensation expense |
|
|
— |
|
|
|
— |
|
|
|
|
— |
|
|
|
— |
|
|
|
1,170 |
|
|
|
— |
|
|
|
— |
|
|
|
1,170 |
|
|
Net loss |
|
|
— |
|
|
|
— |
|
|
|
|
— |
|
|
|
— |
|
|
|
— |
|
|
|
— |
|
|
|
(50,308 |
) |
|
|
(50,308 |
) |
|
Change in foreign currency translation adjustment |
|
|
— |
|
|
|
— |
|
|
|
|
— |
|
|
|
— |
|
|
|
— |
|
|
|
103 |
|
|
|
— |
|
|
|
103 |
|
|
Balances at December 31, 2013 |
|
|
393,432,624 |
|
|
$ |
239,990 |
|
|
|
|
580,458 |
|
|
$ |
6 |
|
|
$ |
9,551 |
|
|
$ |
166 |
|
|
$ |
(238,521 |
) |
|
$ |
(228,798 |
) |
|
|
|
|
|
|
|
|
|
|
|
|
|
|
|
|
|
|
|
|
|
|
|
|
|
|
|
|
|
|
|
|
|
|
|
|
Issuance of common stock upon exercise of stock options |
|
|
— |
|
|
|
— |
|
|
|
|
643,130 |
|
|
|
6 |
|
|
|
1,582 |
|
|
|
— |
|
|
|
— |
|
|
|
1,588 |
|
|
Issuance of common stock in IPO, net of underwriter's discount and offering costs |
|
|
— |
|
|
|
— |
|
|
|
|
7,475,000 |
|
|
|
75 |
|
|
|
81,112 |
|
|
|
— |
|
|
|
— |
|
|
|
81,187 |
|
|
Conversion of preferred stock in connection with IPO |
|
|
(393,432,624 |
) |
|
|
(239,990 |
) |
|
|
|
11,601,860 |
|
|
|
116 |
|
|
|
239,874 |
|
|
|
|
|
|
|
|
|
|
|
239,990 |
|
|
Conversion of preferred stock warrants into common stock warrants in connection with IPO |
|
|
— |
|
|
|
— |
|
|
|
|
— |
|
|
|
— |
|
|
|
647 |
|
|
|
— |
|
|
|
— |
|
|
|
647 |
|
|
Unvested portion of early exercised stock options |
|
|
— |
|
|
|
— |
|
|
|
|
(354,458 |
) |
|
|
(3 |
) |
|
|
(859 |
) |
|
|
|
|
|
|
|
|
|
|
(862 |
) |
|
Vesting of early exercised common stock |
|
|
— |
|
|
|
— |
|
|
|
|
139,853 |
|
|
|
1 |
|
|
|
340 |
|
|
|
— |
|
|
|
— |
|
|
|
341 |
|
|
Employee stock purchase plan |
|
|
— |
|
|
|
— |
|
|
|
|
82,226 |
|
|
|
1 |
|
|
|
838 |
|
|
|
|
|
|
|
|
|
|
|
839 |
|
|
Stock-based compensation expense |
|
|
— |
|
|
|
— |
|
|
|
|
— |
|
|
|
— |
|
|
|
2,360 |
|
|
|
— |
|
|
|
— |
|
|
|
2,360 |
|
|
Net loss |
|
|
— |
|
|
|
— |
|
|
|
|
— |
|
|
|
— |
|
|
|
— |
|
|
|
— |
|
|
|
(57,373 |
) |
|
|
(57,373 |
) |
|
Change in foreign currency translation adjustment |
|
|
|
|
|
|
|
|
|
|
|
|
|
|
|
|
|
|
|
|
|
|
|
(336 |
) |
|
|
|
|
|
|
(336 |
) |
|
Change in unrealized loss on investments |
|
|
— |
|
|
|
— |
|
|
|
|
— |
|
|
|
— |
|
|
|
— |
|
|
|
(10 |
) |
|
|
— |
|
|
|
(10 |
) |
|
Balances at December 31, 2014 |
|
|
— |
|
|
$ |
— |
|
|
|
|
20,168,069 |
|
|
$ |
202 |
|
|
$ |
335,445 |
|
|
$ |
(180 |
) |
|
$ |
(295,894 |
) |
|
$ |
39,573 |
|
The accompanying notes are an integral part of these consolidated financial statements.
55
TRIVASCULAR TECHNOLOGIES, INC.
Consolidated Statements of Cash Flows
(in thousands)
|
|
|
Years ended December 31, |
|
|||||||||
|
|
|
2014 |
|
|
2013 |
|
|
2012 |
|
|||
|
|
|
|
|
|
|
|
|
|
|
|
|
|
|
Cash flows from operating activities |
|
|
|
|
|
|
||||||
|
Net loss |
|
$ |
(57,373 |
) |
|
$ |
(50,308 |
) |
|
$ |
(43,312 |
) |
|
Adjustments to reconcile net loss to net cash used in operating activities |
|
|
|
|
|
|
|
|
|
|
|
|
|
Depreciation and amortization of property and equipment |
|
|
526 |
|
|
|
1,000 |
|
|
|
1,487 |
|
|
Amortization of premium on short-term investments, net |
|
|
34 |
|
|
|
— |
|
|
|
4 |
|
|
Amortization of debt issuance costs and debt discount |
|
|
675 |
|
|
|
444 |
|
|
|
1,163 |
|
|
Provision for excess and obsolete inventory |
|
|
882 |
|
|
|
128 |
|
|
|
1,797 |
|
|
Provision for bad debts |
|
|
72 |
|
|
|
— |
|
|
|
— |
|
|
Changes in fair value of warrants |
|
|
(633 |
) |
|
|
(144 |
) |
|
|
1,151 |
|
|
Loss on extinguishment of senior notes |
|
|
— |
|
|
|
— |
|
|
|
3,081 |
|
|
Amortization of intangibles acquired in business combination |
|
|
— |
|
|
|
35 |
|
|
|
142 |
|
|
Stock-based compensation expense |
|
|
2,620 |
|
|
|
1,291 |
|
|
|
1,056 |
|
|
Non-cash interest expense on notes payable |
|
|
1,932 |
|
|
|
1,211 |
|
|
|
525 |
|
|
Changes in assets and liabilities |
|
|
|
|
|
|
|
|
|
|
|
|
|
Accounts receivable |
|
|
(2,143 |
) |
|
|
(3,033 |
) |
|
|
113 |
|
|
Inventories |
|
|
(2,410 |
) |
|
|
892 |
|
|
|
(717 |
) |
|
Prepaid expenses and other current assets |
|
|
(65 |
) |
|
|
(1,248 |
) |
|
|
(471 |
) |
|
Accounts payable |
|
|
184 |
|
|
|
462 |
|
|
|
216 |
|
|
Accrued liabilities and other |
|
|
2,117 |
|
|
|
2,354 |
|
|
|
(192 |
) |
|
Net cash used in operating activities |
|
|
(53,582 |
) |
|
|
(46,916 |
) |
|
|
(33,957 |
) |
|
Cash flows from investing activities |
|
|
|
|
|
|
|
|
|
|
|
|
|
Purchase of short-term investments |
|
|
(46,128 |
) |
|
|
— |
|
|
|
— |
|
|
Proceeds from sales of short-term investments |
|
|
— |
|
|
|
— |
|
|
|
869 |
|
|
Proceeds from maturity of short-term investments |
|
|
— |
|
|
|
— |
|
|
|
136 |
|
|
Purchase of property and equipment |
|
|
(273 |
) |
|
|
(221 |
) |
|
|
(175 |
) |
|
Proceeds from notes receivable from related parties |
|
|
— |
|
|
|
13 |
|
|
|
21 |
|
|
Net cash provided by (used in) investing activities |
|
|
(46,401 |
) |
|
|
(208 |
) |
|
|
851 |
|
|
Cash flows from financing activities |
|
|
|
|
|
|
|
|
|
|
|
|
|
Proceeds from initial public offering, net |
|
|
81,305 |
|
|
|
— |
|
|
|
— |
|
|
Proceeds from issuance of convertible preferred stock, net of issuance costs |
|
|
— |
|
|
|
39,890 |
|
|
|
48,650 |
|
|
Proceeds from bridge notes |
|
|
— |
|
|
|
— |
|
|
|
11,161 |
|
|
Extinguishment of notes payable |
|
|
(4,599 |
) |
|
|
— |
|
|
|
(24,055 |
) |
|
Proceeds from notes payable, net of issuance costs |
|
|
15,723 |
|
|
|
— |
|
|
|
38,947 |
|
|
Payments for deferred offering costs |
|
|
— |
|
|
|
(118 |
) |
|
|
— |
|
|
Proceeds from issuance of common stock |
|
|
2,427 |
|
|
|
59 |
|
|
|
564 |
|
|
Net cash provided by financing activities |
|
|
94,856 |
|
|
|
39,831 |
|
|
|
75,267 |
|
|
Effects of exchange rate changes on cash and cash equivalents |
|
|
(85 |
) |
|
|
8 |
|
|
|
(9 |
) |
|
Net increase (decrease) in cash and cash equivalents |
|
|
(5,212 |
) |
|
|
(7,285 |
) |
|
|
42,152 |
|
|
Cash and cash equivalents |
|
|
|
|
|
|
|
|
|
|
|
|
|
Beginning of year |
|
|
38,108 |
|
|
|
45,393 |
|
|
|
3,241 |
|
|
End of year |
|
$ |
32,896 |
|
|
$ |
38,108 |
|
|
$ |
45,393 |
|
|
Supplemental cash flow information |
|
|
|
|
|
|
|
|
|
|
|
|
|
Interest paid on notes payable |
|
$ |
5,045 |
|
|
$ |
4,720 |
|
|
$ |
1,466 |
|
|
Cash paid for income taxes |
|
|
226 |
|
|
|
168 |
|
|
|
332 |
|
|
Significant non cash transactions |
|
|
|
|
|
|
|
|
|
|
|
|
|
Conversion of convertible preferred stock into common stock |
|
|
239,990 |
|
|
|
— |
|
|
|
— |
|
|
Unpaid deferred offering costs |
|
|
— |
|
|
|
602 |
|
|
|
— |
|
|
Conversion of convertible preferred stock warrants into common stock warrants |
|
|
647 |
|
|
|
— |
|
|
|
— |
|
|
Increase in deferred revenue related to distributor agreement |
|
|
3,017 |
|
|
|
— |
|
|
|
— |
|
|
Unvested portion of early exercised stock options |
|
|
862 |
|
|
|
— |
|
|
|
— |
|
|
Vesting of early exercised stock options |
|
|
341 |
|
|
|
5 |
|
|
|
18 |
|
|
Issuance of common and preferred stock warrants |
|
|
— |
|
|
|
— |
|
|
|
478 |
|
|
Change in unrealized (loss) gain on short-term investments |
|
|
(10 |
) |
|
|
— |
|
|
|
1 |
|
|
Conversion of bridge notes and accrued interest into Series D preferred stock |
|
|
— |
|
|
|
— |
|
|
|
11,328 |
|
The accompanying notes are an integral part of these consolidated financial statements.
56
TRIVASCULAR TECHNOLOGIES, INC.
NOTES TO CONSOLIDATED FINANCIAL STATEMENTS
1. The Company
TriVascular Technologies, Inc. (the “Company”) was incorporated in the state of Delaware in July 2007 and began operations on March 28, 2008. The Company is a medical device company developing and commercializing innovative technologies to significantly advance minimally invasive treatment of abdominal aortic aneurysms (“AAA”). The Ovation System, the Company’s solution for the treatment of AAA through minimally invasive endovascular aortic repair (“EVAR”) is a new stent graft platform, providing an innovative and effective alternative to conventional devices. It is designed specifically to address many of the limitations associated with conventional EVAR devices and expand the pool of patients eligible for EVAR. The Company received CE Mark clearance in August 2010 and began commercial sales of its Ovation System in Europe in September 2010. In October 2012, the Company received approval from the U.S. Food and Drug Administration (the “FDA”) for the Ovation System for the treatment of AAA and began commercial sales in the United States in November 2012.
As a medical device company with little commercial operating history, the Company is subject to all of the risks and expenses associated with a growing company. The Company must, among other things, respond to competitive developments, attract, retain and motivate qualified personnel, and support the expense of developing and marketing new products based on innovative technology.
In the course of its development activities, the Company has sustained significant operating losses. Even if development and marketing efforts are successful, substantial time may pass before significant revenues will be realized, and during this period, the Company will require additional funds, the availability of which cannot be reasonably assured. From inception through December 31, 2014, the Company had an accumulated deficit of $295.9 million and had been unable to generate positive cash flow from operations. The Company has been able to fund its operations to date through the sale of convertible preferred stock, its initial public offering (“IPO”) and debt financing. The Company’s management plans to expand commercial activities to grow revenues, manage expenses and obtain additional funds through the issuance of stock and additional debt. There can be no assurances that, in the event the Company requires additional financing, such financing will be available on terms which are favorable or at all. Failure to generate sufficient cash flows from operations, raise additional capital and reduce discretionary spending could have a material adverse effect on the Company’s ability to achieve its intended business objectives.
2. Summary of Significant Accounting Policies
Basis of Presentation
These consolidated financial statements have been prepared in accordance with accounting principles generally accepted in the U.S. (U.S. GAAP) and with the rules and regulations of the U.S. Securities and Exchange Commission (“SEC”). The consolidated financial statements include the Company’s accounts and those of its wholly owned subsidiaries. All intercompany accounts and transactions have been eliminated in consolidation.
On April 22, 2014, the Company completed its IPO of 7,475,000 shares of common stock, which included the exercise in full by the underwriters in the offering of their option to purchase 975,000 additional shares of common stock, at an offering price of $12.00 per share. The Company received net proceeds of approximately $81.1 million, after deducting underwriting discounts and commissions and offering expenses. In connection with the IPO, the Company’s outstanding shares of convertible preferred stock were automatically converted into 11,601,860 shares of common stock and warrants exercisable for convertible preferred stock were automatically converted into warrants exercisable for 192,472 shares of common stock, resulting in the reclassification of the related redeemable convertible preferred stock warrant liability of $0.6 million to additional paid-in capital.
Use of estimates
The preparation of financial statements in conformity with U.S. GAAP requires management to make estimates and assumptions that affect the reported amounts of assets and liabilities and disclosure of contingent assets and liabilities as of the date of the consolidated financial statements and the reported amounts of revenue and expenses during the reporting period. Actual results could differ from those estimates and such differences could be material.
Segment Information
The Company considers operating segments to be components of the Company in which separate financial information is available that is evaluated regularly by the Company’s chief operating decision maker in deciding how to allocate resources and in assessing performance. The chief operating decision maker for the Company is the Chief Executive Officer. The Chief Executive Officer reviews financial information presented on a consolidated basis, accompanied by information about revenue by geographic region, for
57
purposes of allocating resources and evaluating financial performance. The Company has one business activity and there are no segment managers who are held accountable for operations, operating results or plans for levels or components below the consolidated unit level. Accordingly, the Company has determined that it has a single reportable and operating segment structure. The Company and its Chief Executive Officer evaluate performance based primarily on revenue in the geographic locations in which the Company operates.
Revenues by geography are based on the billing address of the customer. The following table sets forth revenue by geographic area (in thousands):
|
|
|
Years ended December 31, |
|
|||||||||
|
|
|
2014 |
|
|
2013 |
|
|
2012 |
|
|||
|
|
|
|
|
|
|
|
|
|
|
|
|
|
|
United States (U.S.) |
|
$ |
21,522 |
|
|
$ |
10,623 |
|
|
$ |
197 |
|
|
International |
|
|
10,276 |
|
|
|
8,885 |
|
|
|
5,201 |
|
|
Total |
|
$ |
31,798 |
|
|
$ |
19,508 |
|
|
$ |
5,398 |
|
The following table summarizes countries with revenues accounting for more than 10% of the total:
|
|
|
Years ended December 31, |
|||||||||||
|
|
|
2014 |
|
|
2013 |
|
|
2012 |
|||||
|
|
|
|
|
|
|
|
|
|
|
|
|
|
|
|
Germany |
|
|
— |
|
* |
|
12 |
% |
|
|
34 |
% |
|
|
Italy |
|
|
— |
|
* |
|
12 |
% |
|
|
28 |
% |
|
|
U.S. |
|
|
68 |
% |
|
|
54 |
% |
|
|
— |
|
* |
* Amounts represent revenues accounting for less than 10%
Long-lived assets and operating income outside the U.S. are not material; therefore disclosures have been limited to revenue.
Cash and Cash Equivalents
Cash and cash equivalents consists of demand deposit accounts and institutional money market funds held in U.S. and foreign banks. Cash equivalents consists of highly liquid investment securities with original maturities at the date of purchase of three months or less and can be exchanged for a known amount of cash to be cash equivalents.
Investments
At December 31, 2014, the Company’s investments consisted of investments, with maturities of longer than 90 days but less than a year based on expected maturity dates. They are classified as available for sale as the Company can liquidate their securities as needed, and changes in fair value between accounting periods are included in accumulated other comprehensive (loss) income on the balance sheet until the securities are sold. Discounts or premiums are amortized to interest income and other income (expense) net using the interest method.
Accounts Receivable
Trade accounts receivable are recorded at the invoice amount and do not include interest. The Company regularly reviews accounts for collectability and establishes an allowance for probable credit losses and writes off uncollectible accounts as necessary. The Company recorded an allowance for doubtful accounts of $72,000 and $0 at December 31, 2014 and 2013.
Inventories
The Company values inventory at the lower of cost to purchase or manufacture the inventory or the market value for such inventory. Cost is determined using the standard cost method which approximates the first-in first-out method. The Company regularly reviews inventory quantities in consideration of actual loss experiences, projected future demand, and remaining shelf life to record a provision for excess and obsolete inventory when appropriate.
58
Concentration of credit risk and Other Risks and Uncertainties
Financial instruments that potentially subject the Company to a concentration of credit risk consist of cash, cash equivalents and investments. The majority of the Company’s cash is held by one financial institution in the United States in excess of federally insured limits. The Company held cash in foreign banks of approximately $0.9 million and $0.8 million at December 31, 2014 and 2013, respectively, which was not federally insured. The Company has not experienced any losses on its deposits of cash and cash equivalents.
Prior to 2013, the majority of the Company’s revenues had been derived from sales of its products in international markets, principally Europe. In most international markets in which the Company participates, the Company uses distributors to sell its products. The Company performs ongoing credit evaluation of its distributors, does not require collateral, and maintains allowances for potential credit losses on customer accounts when deemed necessary.
As of December 31, 2014 and 2013, one customer accounted for 16.9% and 18% of the Company’s accounts receivable, respectively.
The Company’s products require approval from the FDA and certain international regulatory agencies prior to commencing commercial sales. There can be no assurance that the Company’s future products will receive all of these required approvals. If the Company is denied such approvals or such approvals are delayed, it may have a material adverse impact on the Company’s results of operations, financial position and liquidity.
The Company is subject to risks common to early-stage medical device companies including, but not limited to, new technological innovations, dependence on key personnel, protection of proprietary technology, compliance with government regulations, uncertainty of market acceptance of products, product liability and the need to obtain additional financing.
The Company currently conducts all of its manufacturing, development and management activities at a single location in Santa Rosa, California, near known earthquake fault zones. The Company’s finished goods inventory is maintained in its Santa Rosa location and its third-party European distribution center in Belgium.
Property and equipment
Property and equipment are stated at cost, net of accumulated depreciation and amortization. Depreciation is computed using the straight-line method over the estimated useful lives of the assets.
The depreciation and amortization periods for the Company’s property and equipment are as follows:
|
Equipment and software |
|
3 years |
|
Laboratory machinery and equipment |
|
3–5 years |
|
Furniture and fixtures |
|
5 years |
Leasehold improvements are amortized over the lesser of their useful lives or the remaining life of the lease. When assets are retired or otherwise disposed of, the cost and related accumulated depreciation and amortization are removed from the consolidated balance sheet and the resulting gain or loss is reflected in operations in the period realized. Cost of maintenance and repairs are charged to expense as incurred, and improvements and betterments are capitalized.
Goodwill and Indefinite Lived Intangible Assets
On March 28, 2008, the Company acquired Boston Scientific Santa Rosa, or BSSR, (formerly known as TriVascular, Inc.), a business unit of Boston Scientific Corporation, a publically held global manufacturer of medical devices. Pursuant to the terms of the Stock Purchase Agreement, the Company purchased BSSR, for approximately $38.0 million, resulting in goodwill of $8.3 million, which is the excess of the purchase price over the identifiable tangible and intangible assets. The goodwill is not deductible for tax purposes.
The Company classifies goodwill and intangible assets into three categories: (1) goodwill; (2) intangible assets with indefinite lives not subject to amortization; and (3) intangible assets with definite lives subject to amortization.
Goodwill and intangible assets with indefinite lives are not amortized. The Company assesses goodwill and intangible assets with indefinite lives for impairment on an annual basis in the fourth quarter of each year or more frequently if indicators of impairment exist. For the purpose of testing goodwill for impairment, the Company has determined that it has one reporting unit.
59
The goodwill impairment assessment involves a two-step process. We first assess the book value and fair value of the Company to determine if an impairment of goodwill exists by reporting unit. A potential impairment exists if the fair value of the reporting unit is lower than its net book value. The second step of the process is only performed if a potential impairment exists, and it involves comparing the aggregate fair value of the reporting unit’s net assets, other than goodwill, to the fair value of the reporting unit as a whole. Goodwill is considered impaired, and an impairment charge is recorded, if the excess of the fair value of the reporting unit over the fair value of the net assets is less than the carrying value of goodwill. This evaluation requires use of internal business plans that are based on management’s judgments regarding future economic conditions, product demand and pricing, costs, inflation rates and discount rates, among other factors. These judgments and estimates involve inherent uncertainties, and the measurement of the fair value is dependent on the accuracy of the assumptions used in making the estimates and how those estimates compare to our future operating performance. There was no impairment of goodwill identified through December 31, 2014.
The fair value measurement of purchased intangible assets with indefinite lives involves the estimation of the fair value which is based on management assumptions about expected future cash flows, discount rates, growth rates, estimated costs and other factors which utilize historical data, internal estimates, and, in some cases, outside data. If the carrying value of the indefinite live intangible asset exceeds management’s estimate of fair value, the asset is impaired, and the Company is required to record an impairment charge which would negatively impact its operating results. There was no impairment of intangible assets with indefinite lives identified through December 31, 2014.
Impairment of Long-Lived Assets
Purchased intangible assets with finite lives are amortized using the straight-line method over the estimated economic lives of the assets of five years. Long-lived assets, including intangible assets, with definite lives and property and equipment, are reviewed for impairment whenever events or changes in circumstances indicate that the carrying amount of such assets may not be recoverable. Such conditions may include an economic downturn or a change in the assessment of future operations. Determination of recoverability is based on an estimate of undiscounted future cash flows resulting from the use of the asset (or asset group) and its eventual disposition. Measurement of an impairment loss for long-lived assets that management expects to hold and use is based on the amount that the carrying value of the asset (or asset group) exceeds its fair value. If such assets are considered to be impaired, the impairment to be recognized is measured as the amount by which the carrying amount of the assets exceeds the fair value of the assets. Assets to be disposed of are reported as a separate caption at the lower of the carrying amount or fair value less costs to sell. There were no impairment charges, or changes in estimated useful lives recorded through December 31, 2014.
Deferred Offering Costs
Deferred offering costs, consisting of legal, accounting and other fees and costs relating to the IPO, are capitalized. The deferred offering costs were offset against the Company’s IPO proceeds upon the closing of the offering in April 2014. There was $0.7 million of deferred offering costs capitalized as of December 31, 2013 in other assets on the consolidated balance sheets.
Convertible Preferred Stock Warrant Liability
Freestanding warrants related to convertible preferred stock shares that are contingently redeemable are classified as a liability on the Company’s accompanying consolidated balance sheet. The convertible preferred stock warrants are subject to re-measurement at each balance sheet date, and any change in fair value is recognized as a component of interest income and other income (expense), net. The Company continued to adjust the liability for changes in fair value until the completion of its IPO, at which time all redeemable convertible preferred stock warrants converted into warrants to purchase common stock and the liability was reclassified to additional paid-in capital.
Revenue
The Company recognizes revenue when all of the following criteria are met:
|
· |
persuasive evidence of an arrangement exists; |
|
· |
the sales price is fixed or determinable; |
|
· |
collection is reasonably assured; and |
|
· |
delivery has occurred or services have been rendered. |
For sales directly to hospitals or medical facilities, the Company recognizes revenue upon completion of a procedure, which is when the product is implanted in a patient, and a valid purchase order has been received. For distributor sales, the Company recognizes revenue at the time of shipment of product, as this represents the point that the customer has taken ownership and assumed risk of loss. The Company does not offer rights of return or price protection and has no post-delivery obligations.
60
Product Returns
The Company offers rights of exchange to distributors in limited circumstances for products with a short shelf life at the time of shipment. The allowance for sales returns is based on historical returned quantities as compared to Ovation shipments. The return rate is then applied to the sales for the current period to establish a reserve at the end of the period. The return rates used are adjusted for known or expected changes in the marketplace when appropriate. The Company’s allowance for product returns was $0.1 million and $0 million at December 31, 2014 and 2013, respectively. Actual product returns have not differed materially from the amounts reserved.
Medical Device Excise Tax
In accordance with the Patient Protection and Affordable Care Act, effective January 1, 2013, the Company began to incur a 2.3% excise tax on sales of medical devices in the U.S. The medical device excise tax is included in operating expenses in the consolidated statements of comprehensive loss for fiscal year 2014 and 2013.
Research and Development Costs
Research and development, or R&D, costs, including new product development, regulatory compliance and clinical research, are charged to operations as incurred in the consolidated statements of comprehensive loss. Such costs include personnel-related costs, including stock-based compensation, supplies, services, depreciation, allocated facilities and information services, clinical trial and related clinical manufacturing expenses, fees paid to clinical research organizations and investigative sites and other indirect costs.
Advertising
All advertising costs are expensed as incurred and are included in selling, general and administrative expenses in the consolidated statements of comprehensive loss.
Shipping and Handling
Shipping costs incurred are included in cost of goods sold in the consolidated statements of comprehensive loss.
Income Taxes
The Company records income taxes using the asset and liability method, which requires the recognition of deferred tax assets and liabilities for the expected future tax consequences of events that have been recognized in the Company’s consolidated financial statements or income tax returns. In estimating future tax consequences, expected future events other than enactments or changes in the tax law or rates are considered. Valuation allowances are provided when necessary to reduce deferred tax assets to the amount expected to be realized.
The Company operates in various tax jurisdictions and is subject to audit by various tax authorities. The Company provides for tax contingencies whenever it is deemed probable that a tax asset has been impaired or a tax liability has been incurred for events such as tax claims or changes in tax laws. Tax contingencies are based upon their technical merits, relative tax law, and the specific facts and circumstances as of each reporting period. Changes in facts and circumstances could result in material changes to the amounts recorded for such tax contingencies.
The Company records uncertain tax positions on the basis of a two-step process whereby (1) a determination is made as to whether it is more likely than not that the tax positions will be sustained based on the technical merits of the position and (2) for those tax positions that meet the more-likely-than-not recognition threshold the Company recognizes the largest amount of tax benefit that is greater than 50% likely to be realized upon ultimate settlement with the related tax authority.
Other Comprehensive (Loss) Income
Other comprehensive (loss) income represents all changes in stockholders’ equity (deficit) except those resulting from investments or contributions by stockholders. The Company’s other comprehensive (loss) income consists of its net loss and changes in accumulated other comprehensive (loss) income, which represents unrealized (losses) gains on investments and foreign currency translation adjustments.
Currency Translation
The Euro is the functional currency of the Company’s wholly owned subsidiaries in Italy and Germany and the Swiss Franc is the functional currency of the Company’s wholly-owned subsidiary in Switzerland. Accordingly, the assets and liabilities of these
61
subsidiaries are translated into United States dollars using the current exchange rate in effect at the balance sheet date and equity accounts are translated into United States dollars using historical rates. Revenues and expenses are translated using the average exchanges rates in effect when the transactions occur. Foreign currency translation adjustments are recorded within accumulated other comprehensive loss, a separate component of stockholders’ deficit, on the consolidated balance sheets. Foreign exchange transaction gains and losses have not been material to the Company’s consolidated financial statements for all periods presented.
Stock-Based Compensation
The Company’s determination of the fair value of stock options on the date of grant and shares to be issued to employees under the Employee Stock Purchase Plan (“ESPP”) utilizes the Black-Scholes option-pricing model, and is impacted by its common stock price as well as changes in assumptions regarding a number of highly complex and subjective variables. These variables include, but are not limited to, expected common stock price volatility, expected term, risk-free interest rates and expected dividends. For restricted stock unit (“RSU”) awards, the fair value is determined based on the closing price on the NASDAQ Global Select Market on the date of the award.
The fair value is recognized over the period during which services are rendered, known as the requisite service period on a straight-line basis for awards that vest based on service conditions. Stock-based compensation expense recognized at fair value includes the impact of estimated forfeitures. The Company estimates future forfeitures at the date of grant and revises the estimates, if necessary, in subsequent periods if actual forfeitures differ from those estimates.
Equity instruments issued to non-employees are recorded at their fair value on the measurement date and are subject to periodic adjustments as the underlying equity instruments vest. The fair value of options granted to consultants is expensed when vested. The non-employee stock-based compensation expense was not material for all periods presented.
Cash flows resulting from the tax benefits for tax deductions resulting from the exercise of stock options in excess of the compensation expense recorded for those options (excess tax benefits) are classified as cash flows from financing activities in the consolidated statements of cash flows; however there were no cash flow impacts from excess tax benefits during the years ended December 31, 2014, 2013 or 2012.
Estimating the fair value of equity-settled awards as of the grant date using valuation models, such as the Black-Scholes option pricing model, is affected by assumptions regarding a number of complex variables. Changes in the assumptions can materially affect the fair value and ultimately how much stock-based compensation expense is recognized. These inputs are subjective and generally require significant analysis and judgment to develop. For valuations of all equity awards utilizing the Black-Scholes option-pricing model to date, the Company estimated the expected term and the volatility data based on a study of publicly traded industry peer companies and the Company’s actual experience since the IPO. For purposes of identifying these peer companies, the Company considered the industry, stage of development, size and financial leverage of potential comparable companies. The risk-free interest rate is based on the yield available on U.S. Treasury zero-coupon issues similar in duration to the expected term of the equity-settled award.
Net Loss per Share
Basic net loss per share is calculated by dividing the net loss by the weighted average number of common shares that were outstanding for the period, without consideration for potential common shares. Prior to April 22, 2014, the Company had convertible preferred stock, all of which converted into common stock at the closing of the IPO. Because the holders of the Company’s convertible preferred stock and its restricted common shares were entitled to participate in dividends and earnings of the Company when dividends are paid on common stock, the Company applies the two-class method in calculating its earnings per share for periods when the Company generates net income. The two-class method requires net income to be allocated between the common and preferred stockholders based on their respective rights to receive dividends, whether or not declared. Because the convertible preferred stock and restricted common stock were not contractually obligated to share in the Company’s losses, no such allocation was made for any period presented given the Company’s net losses. Diluted net loss per share is calculated by dividing the net loss by the sum of the weighted-average number of dilutive potential common shares outstanding for the period determined using the treasury-stock method or the as-converted method. Potentially dilutive shares are comprised of convertible preferred stock, convertible preferred stock and common stock warrants, shares purchased with nonrecourse loans and options outstanding under the Company’s equity incentive plans. Purchase rights granted pursuant to the Company’s ESPP are excluded from the basic net loss per share calculation because the employee’s participation in the ESPP is revocable, and such rights will not be included until the shares subject to the purchase rights are purchased by the employee. For all periods presented, there is no difference in the number of shares used to calculate basic and diluted shares outstanding due to our net loss and potentially dilutive shares being anti-dilutive.
62
The following equity shares were excluded from the calculation of diluted net loss per share because their effect would have been anti-dilutive for the periods presented (shares for the convertible preferred stock and convertible preferred stock warrants were determined based on the shares outstanding and applicable conversion ratios as of the end of the year):
|
|
|
Years ended December 31, |
|
|||||||||
|
|
|
2014 |
|
|
2013 |
|
|
2012 |
|
|||
|
|
|
|
|
|
|
|
|
|
|
|
|
|
|
Convertible preferred stock |
|
|
— |
|
|
|
11,601,860 |
|
|
|
9,071,203 |
|
|
Employee stock options |
|
|
2,132,937 |
|
|
|
2,113,175 |
|
|
|
1,384,102 |
|
|
RSUs |
|
|
6,500 |
|
|
|
— |
|
|
|
— |
|
|
Convertible preferred stock warrants |
|
|
— |
|
|
|
192,472 |
|
|
|
192,472 |
|
|
Common stock warrants |
|
|
401,892 |
|
|
|
426,878 |
|
|
|
426,878 |
|
|
Total |
|
|
2,541,329 |
|
|
|
14,334,385 |
|
|
|
11,074,655 |
|
3. Recent Accounting Pronouncements
In May 2014, the Financial Accounting Standards Board, or FASB, issued Accounting Standards Update (“ASU”) No. 2014-09. ASU 2014-09 provided guidance related to revenue from contracts with customers. Under this guidance, revenue is recognized when promised goods or services are transferred to customers in an amount that reflects the consideration that is expected to be received for those goods or services. The updated standard will replace most existing revenue recognition guidance under GAAP when it becomes effective and permits the use of either the retrospective or cumulative effect transition method. Early adoption is not permitted. The updated standard will be effective for the Company in the first quarter of 2017. The Company has not yet selected a transition method and is currently evaluating the effect that the updated standard will have on its consolidated financial statements and related disclosures.
In August 2014, the FASB issued new guidance related to the disclosures around going concern. The new standard provides guidance around management's responsibility to evaluate whether there is substantial doubt about an entity's ability to continue as a going concern and to provide related footnote disclosures. The new standard is effective for fiscal years, and interim periods within those fiscal years, beginning after December 15, 2016. Early adoption is permitted. The adoption of this standard is not expected to have a material impact on the Company’s financial statements.
Other amendments to GAAP have been issued by the FASB or other standards-setting bodies that do not require adoption until a future date are not expected to have a material impact on the Company’s consolidated financial statements upon adoption.
4. Fair Value Measurements
The carrying amount of certain financial instruments, including accounts receivable, accounts payable, and accrued liabilities approximate fair value due to their relatively short maturities.
The Company discloses and recognizes the fair value of its assets and liabilities using a hierarchy that prioritizes the inputs to valuation techniques used to measure fair value. The hierarchy gives the highest priority to valuations based upon unadjusted quoted prices in active markets for identical assets or liabilities (Level 1 measurements) and the lowest priority to valuations based upon unobservable inputs that are significant to the valuation (Level 3 measurements). The guidance establishes three levels of the fair value hierarchy as follows:
|
Level 1 |
Inputs that reflect unadjusted quoted prices in active markets for identical assets or liabilities that the Company has the ability to access at the measurement date; |
|
Level 2 |
Inputs other than quoted prices that are observable for the assets or liability either directly or indirectly, including inputs in markets that are not considered to be active; |
|
Level 3 |
Inputs that are unobservable. |
Assets and liabilities measured at fair value are classified in their entirety based on the lowest level of input that is significant to the fair value measurement. The Company’s assessment of the significance of a particular input to the fair value measurement in its entirety requires management to make judgments and consider factors specific to the asset or liability.
63
The following table sets forth the Company’s financial instruments that were measured at fair value on a recurring basis at December 31, 2014 by level within the fair value hierarchy (in thousands):
|
|
|
Assets or Liabilities at Fair Value |
|
|||||||||||||
|
|
|
Level 1 |
|
|
Level 2 |
|
|
Level 3 |
|
|
Total |
|
||||
|
|
|
|
|
|
|
|
|
|
|
|
|
|
|
|
|
|
|
Assets |
|
|
|
|
|
|
|
|
|
|
|
|
|
|
|
|
|
Cash equivalents (1) |
|
$ |
— |
|
|
$ |
16,679 |
|
|
$ |
— |
|
|
$ |
16,679 |
|
|
Corporate debt securities |
|
|
— |
|
|
|
31,330 |
|
|
|
— |
|
|
|
31,330 |
|
|
U.S. Treasury securities |
|
|
— |
|
|
|
4,953 |
|
|
|
— |
|
|
|
4,953 |
|
|
Asset-backed securities |
|
|
— |
|
|
|
9,801 |
|
|
|
— |
|
|
|
9,801 |
|
|
Total |
|
$ |
— |
|
|
$ |
62,763 |
|
|
$ |
— |
|
|
$ |
62,763 |
|
|
(1) |
Cash equivalents included money market funds and corporate debt securities with a maturity of three months or less from the date of purchase. |
The following table sets forth the Company’s financial instruments that were measured at fair value on a recurring basis at December 31, 2013 by level within the fair value hierarchy (in thousands):
|
|
|
Assets or Liabilities at Fair Value |
|
|||||||||||||
|
|
|
Level 1 |
|
|
Level 2 |
|
|
Level 3 |
|
|
Total |
|
||||
|
|
|
|
|
|
|
|
|
|
|
|
|
|
|
|
|
|
|
Liabilities |
|
|
|
|
|
|
|
|
|
|
|
|
|
|
|
|
|
Series C convertible preferred stock warrant liability |
|
$ |
— |
|
|
$ |
— |
|
|
$ |
72 |
|
|
$ |
72 |
|
|
Series D convertible preferred stock warrant liability |
|
|
— |
|
|
|
— |
|
|
|
1,208 |
|
|
|
1,208 |
|
|
Total |
|
$ |
— |
|
|
$ |
— |
|
|
$ |
1,280 |
|
|
$ |
1,280 |
|
Based upon Level 2 inputs and the borrowing rates currently available for loans with similar terms, the Company believes that the fair value of its notes payable approximates its carrying value. The fair value of the Company’s Series C and D convertible preferred stock warrant liabilities (described in Notes 10 and 12 below) were based on Level 3 inputs. The Company valued the Series C convertible preferred stock warrant liabilities and the Series D convertible preferred stock warrant liabilities using the Black-Scholes model as well as the residual value approach as described in Note 12.
The table below presents the activity of Level 3 liabilities during the periods indicated (in thousands):
|
|
|
December 31, |
|
|||||
|
|
|
2014 |
|
|
2013 |
|
||
|
|
|
|
|
|
|
|
|
|
|
Warrant liabilities balance at the beginning of the period |
|
$ |
1,280 |
|
|
$ |
1,424 |
|
|
Change in fair value of warrant liabilities |
|
|
(633 |
) |
|
|
(144 |
) |
|
Transfer of warrant liabilities to additional paid-in capital |
|
|
(647 |
) |
|
|
— |
|
|
Warrant liabilities balance at the end of the period |
|
$ |
— |
|
|
$ |
1,280 |
|
5. Balance Sheet Components
Short-term Investments
Short-term investments consisted of the following at December 31, 2014 (in thousands):
|
|
|
|
|
|
|
Gross |
|
|
Gross |
|
|
|
|
|
||
|
|
|
Amortized |
|
|
Unrealized |
|
|
Unrealized |
|
|
Market |
|
||||
|
|
|
Cost |
|
|
Gains |
|
|
Losses |
|
|
Value |
|
||||
|
|
|
|
|
|
|
|
|
|
|
|
|
|
|
|
|
|
|
Corporate debt securities |
|
$ |
31,333 |
|
|
$ |
— |
|
|
$ |
(3 |
) |
|
$ |
31,330 |
|
|
U.S. Treasury securities |
|
|
4,956 |
|
|
|
— |
|
|
|
(3 |
) |
|
|
4,953 |
|
|
Asset-backed securities |
|
|
9,805 |
|
|
|
— |
|
|
|
(4 |
) |
|
|
9,801 |
|
|
Total |
|
$ |
46,094 |
|
|
$ |
— |
|
|
$ |
(10 |
) |
|
$ |
46,084 |
|
64
All investments have a maturity of less than one year. Management reviewed the short-term investments as of December 31, 2014 and concluded that there are no securities with other than temporary impairments in its investment portfolio. The Company will not likely be required to sell the investments before recovery of their amortized cost basis at the expected maturity.
Inventories
Inventories consisted of the following (in thousands):
|
|
|
December 31, |
|
|||||
|
|
|
2014 |
|
|
2013 |
|
||
|
|
|
|
|
|
|
|
|
|
|
Raw material |
|
$ |
3,731 |
|
|
$ |
2,394 |
|
|
Work-in-process and sub-assemblies |
|
|
2,422 |
|
|
|
1,951 |
|
|
Finished goods |
|
|
2,417 |
|
|
|
2,697 |
|
|
Total |
|
$ |
8,570 |
|
|
$ |
7,042 |
|
Property and equipment
Property and equipment consisted of the following (in thousands):
|
|
|
December 31, |
|
|||||
|
|
|
2014 |
|
|
2013 |
|
||
|
|
|
|
|
|
|
|
|
|
|
Laboratory, machinery and equipment |
|
$ |
7,129 |
|
|
$ |
7,024 |
|
|
Equipment and software |
|
|
2,261 |
|
|
|
2,150 |
|
|
Leasehold improvements |
|
|
5,657 |
|
|
|
5,657 |
|
|
Furniture and fixtures |
|
|
321 |
|
|
|
317 |
|
|
|
|
|
15,368 |
|
|
|
15,148 |
|
|
Less: Accumulated depreciation and amortization |
|
|
(14,120 |
) |
|
|
(13,643 |
) |
|
Total |
|
$ |
1,248 |
|
|
$ |
1,505 |
|
Depreciation and amortization expense related to property and equipment amounted to $0.5 million, $1.0 million and $1.5 million for the years ended December 31, 2014, 2013 and 2012, respectively.
Accrued liabilities and other
Accrued liabilities and other consisted of the following (in thousands):
|
|
|
December 31, |
|
|||||
|
|
|
2014 |
|
|
2013 |
|
||
|
|
|
|
|
|
|
|
|
|
|
Accrued compensation and related expenses |
|
$ |
6,639 |
|
|
$ |
4,263 |
|
|
Other accrued expenses |
|
|
1,826 |
|
|
|
1,866 |
|
|
Total |
|
$ |
8,465 |
|
|
$ |
6,129 |
|
6. Goodwill and Intangible Assets
The goodwill and indefinite-lived intangible assets on the consolidated balance sheets were $8.3million and $1.2 million, respectively, for all periods presented. Amortization expense for the years ended December 31, 2014 and 2013 amounted to $0 and $35,000, respectively.
7. Related Party Transactions
In April 2010, the Company loaned $150,000 with an annual interest rate of 2.7% to an executive officer. The loan required annual principal payments in the amount of $37,500. The outstanding balance on the loan was $0, and $37,500 at December 31, 2014 and, 2013, respectively. The amount was included in other assets on the accompanying consolidated balance sheet at December 31, 2013.
65
In January 2011, the Company entered into a loan agreement with an executive officer in the amount of $705,000 for the exercise of 49,642 stock options. The terms of the note included an annual rate of 1.95% with annual compounding based on a 360 day year, and annual interest only payments beginning in 2012. On January 1, 2013, the interest rate was decreased to 0.87% per annum, with all other terms and provisions the same. The first scheduled interest payment on the note in the amount of $14,000 was converted into principal in February 2012. The note was collateralized by the underlying stock and was 75% nonrecourse. For accounting purposes, the note was accounted for as nonrecourse in its entirety and was considered as a stock option as the substance was similar to the grant of an option. Accordingly, the note and underlying stock were not reflected in the accompanying consolidated financial statements, though it was presented as a stock option in Note 13, Equity Incentive Plan. At December 31, 2014 and 2013, the consolidated balance sheets reflect $0, and $13,000, respectively in accrued interest receivable recorded within other assets. Principal payments in the amount of $10,000 were to be made annually beginning at the end of 2014 with the final principal due in January 2018.
In September 2012, the Company entered into loan agreements with three executive officers in the amount of $150,000, $1,086,000 and $218,000 for the exercise of stock options totaling 597,195. The terms of the notes included an annual rate of 0.88% with annual compounding based on a 360 day year, and annual interest only payments beginning in 2013. The notes were due in full on the fifth anniversary of their issuance. The notes were collateralized by the underlying stock and were 50% nonrecourse. For accounting purposes, the notes were considered fully non-recourse with the stock options treated as outstanding, therefore, the notes and related stock were not reflected in the accompanying consolidated financial statements. At December 31, 2014 and 2013, the consolidated balance sheets reflect $0 and $4,000 in accrued interest receivable within other assets for all three notes.
In February and March 2014, all of the above loans to executive officers were satisfied and extinguished. The April 2010 and September 2012 notes along with accrued interest were repaid in cash resulting in aggregate proceeds of $1,497,435 inclusive of accrued interest of $6,238. The January 2011 note was extinguished with the surrender of the underlying collateral shares to satisfy the loan. The difference between the carrying amount of the loan and the value of the collateral shares was recorded as a loss on extinguishment of the note and the underlying shares were kept in treasury until retired to authorized, unissued by resolution of the board of directors in April 2014.
8. Distribution Agreement
On January 1, 2014, the Company entered into a distribution agreement (the “Distribution Agreement”) with Century Medical, Inc. (“Century”) with respect to the anticipated distribution of the Company’s Ovation medical devices in Japan. Under the terms of a secured note purchase agreement, Century agreed to loan the Company an aggregate of up to $6.0 million, with principal due in January 2019, under the agreement, subject to certain conditions. Under this facility, the Company received $4.0 million on January 10, 2014 and received the remaining $2.0 million on March 18, 2014 as the Company had achieved trailing 12-month revenues of $20 million and no material adverse event had occurred. The notes bear 5% annual interest which is payable quarterly in arrears through January 9, 2019, the maturity date when the entire principal balance becomes due. In return for the loan commitment, the Company granted Century distribution rights to the Company’s planned Ovation product line in Japan, and a right of first negotiation for distribution rights in Japan to future products. Century will be responsible for securing regulatory approval from the Ministry of Health in Japan for the Ovation product lines.
Proceeds from the note and granting the distribution rights were allocated to the note based on its aggregate fair value of $3.0 million at the dates of receipt. This fair value was determined by discounting cash flows using a discount rate of 15%, which the Company estimated as market rate of borrowing that could be obtained by companies with credit risk similar to the Company’s. The remainder of the proceeds of $3.0 million was recognized as debt issuance discount and allocated to the value of the distribution rights granted to Century under the Distribution Agreement. It is included in deferred revenue in other long term liabilities on the consolidated balance sheets. The deferred revenue will be recognized on a straight-line basis over the term of the Distribution Agreement, beginning upon the first sale by Century of the Ovation products in Japan.
9. Commitments and Contingencies
Operating Leases
The Company leased its corporate facility under a non-cancelable operating sublease from Boston Scientific Corporation, which expired in March 2013. In December 2011, the Company amended its facility lease extending the term of the lease through March 2018. Pursuant to the amendment, effective March 1, 2013, Boston Scientific Corporation assigned its lease on the facility directly to the Company. The Company also has small office leases in its subsidiary locations. Facility lease expense was $1,140,000, $1,100,000 and $1,006,000 for the years ended December 31, 2014, 2013 and 2012, respectively. The Company recognizes lease expense on a straight-line basis over the life of the lease. In addition to the lease obligation, the Company pays for common area maintenance and insurance for the facility. The Company also has various office equipment leases for copiers and postage machines.
66
Future minimum lease payments under non-cancelable operating leases as of December 31, 2014 are as follows (in thousands):
|
|
|
|
|
|
|
Other |
|
|
|
|
|
|
|
|
|
Facility |
|
|
Operating |
|
|
|
|
|
||
|
Years Ending |
|
Lease |
|
|
Leases |
|
|
Total |
|
|||
|
|
|
|
|
|
|
|
|
|
|
|
|
|
|
2015 |
|
$ |
1,107 |
|
|
$ |
80 |
|
|
$ |
1,187 |
|
|
2016 |
|
|
1,133 |
|
|
|
66 |
|
|
|
1,199 |
|
|
2017 |
|
|
1,160 |
|
|
|
40 |
|
|
|
1,200 |
|
|
2018 |
|
|
194 |
|
|
|
5 |
|
|
|
199 |
|
|
2019 and beyond |
|
|
— |
|
|
|
— |
|
|
|
— |
|
|
Total minimum lease payments |
|
$ |
3,594 |
|
|
$ |
191 |
|
|
$ |
3,785 |
|
Contingencies
From time to time, the Company may have certain contingent liabilities that arise in the ordinary course of business activities. The Company accrues a liability for such matters when it is probable that future expenditures will be made and such expenditures can be reasonably estimated. There were no contingent liabilities requiring accrual at December 31, 2014 or 2013.
Employment Agreements
The Company enters into employment agreements with its executive officers. The contracts do not have a fixed term and are constructed on an at-will basis. Some of these contracts provide executives with the right to receive certain additional payments and benefits after a change in control, as defined in such agreements.
Indemnification
The Company enters into standard indemnification arrangements in the ordinary course of business. Pursuant to these arrangements, the Company indemnifies, holds harmless, and agrees to reimburse the indemnified parties for losses suffered or incurred by the indemnified party, in connection with any trade secret, copyright, patent or other intellectual property infringement claim by any third party with respect to the Company’s technology. The term of these indemnification agreements is generally perpetual. The maximum potential amount of future payments the Company could be required to make under these agreements is not determinable because it involves claims that may be made against the Company in the future, but have not yet been made.
The Company has entered into indemnification agreements with its directors and officers that may require the Company to indemnify its directors and officers against liabilities that may arise by reason of their status or service as directors or officers, other than liabilities arising from willful misconduct of the individual.
The Company has not incurred costs to defend lawsuits or settle claims related to these indemnification agreements. No liability associated with such indemnifications has been recorded to date.
10. Notes Payable
Century Medical, Inc. Subordinated Loan
In connection with the Distribution Agreement with Century (see Note 8), the Company entered into a secured note purchase agreement and a related security agreement, pursuant to which Century agreed to loan to the Company up to an aggregate of $6.0 million, which was received in the quarter ended March 31, 2014. These notes bear 5% annual interest which is payable quarterly in arrears on the last business day of March, June, September and December of each year through January 9, 2019, the maturity date when the total $6.0 million of principal becomes due. The debt issuance discount of approximately $3.0 million is reflected as a reduction in long-term debt and is being amortized as interest expense over the term of the note using the effective interest method. The loan contains various affirmative and negative covenants and customary events of default, including if a material adverse change occurs with respect to the Company’s business, operations or financial condition, and is subordinated to the Company’s term loan with Capital Royalty.
The Company made interest payments of approximately $274,000 in the year ended December 31, 2014. As of December 31, 2014, the Company was in compliance with all its covenants.
67
On November 4, 2014, the Company entered into a First Amendment to Loan Agreement with Century primarily to conform certain terms of the existing term loan agreement between the Company and Century to those of the Amended and Restated Term Loan Agreement with Capital Royalty.
Capital Royalty Term Loan
In October 2012 the Company executed a Term Loan Agreement with Capital Royalty Partners II L.P. and its affiliate Parallel Investment Opportunities Partners II L.P. (collectively “Capital Royalty”) for up to a $50 million term loan to be used to pay off the Company’s existing Senior Notes (defined below) and to fund operations. The loan could be drawn in two tranches. The first tranche in the amount of $40 million was drawn in October 2012. The second tranche in the amount of $10 million could be drawn prior to April 30, 2014 subject to the Company’s achievement of $20.0 million in annualized U.S. revenue measured on a consecutive three month period before April 30, 2014. The loan bore interest at a rate of 14.0%, based upon a year of 360 days and actual days elapsed. Prior to September 30, 2017, the Company could, at its election, pay the interest as follows: 11.5% per annum paid in cash and 2.5% per annum paid in-kind in the form of additional term loans, or PIK Loans. Payments under the loan were made on a quarterly basis with payment dates fixed at the end of each calendar quarter (“Payment Dates”). Beginning December 31, 2012, the Company elected the paid-in-kind interest option, issuing PIK loans totaling $1,157,000, $1,028,000 and $175,000 in the years ending December 31, 2014, 2013 and 2012, respectively. The notes were interest-only through the 14th Payment Date (March 31, 2016) following funding if the second tranche was not drawn. Following the interest-only period principal payments were to be made in equal installments at the end of the six subsequent calendar quarters if the second tranche was not drawn. The notes matured on the 20th Payment Date (September 30, 2017). In connection with the loan, the Company paid a loan origination fee of 1% and issued warrants to purchase 167,611 shares of Common Stock at $0.41 per share, as described further in Note 12. The initial fair value of the warrant was $496,000 and resulted in a discount to the notes payable, which is being accreted to interest income and other income (expense), net in the statements of comprehensive loss over the life of the loan.
On November 4, 2014, the Company entered into the Amended and Restated Term Loan Agreement with Capital Royalty amending the original term loan. In connection with this amendment, the Company increased borrowings under the facility by drawing down $10 million upon closing of the transaction on November 21, 2014. Additionally, subject to the achievement of certain revenue milestones, the Company has an option to access up to an additional $15 million on or before December 31, 2015.
The Amended and Restated Term Loan Agreement primarily amended the terms of the original term loan agreement to increase the borrowing amount, reduce the applicable interest rate from 14.0% to 12.5%, extend the interest only payment period through September 30, 2018 and extend the final maturity date to June 30, 2020. Interest is payable, at the Company’s option, (i) in cash at a rate of 12.5% per annum or (ii) 9.0% of the 12.5% per annum in cash and 3.5% of the 12.5% per annum being added to the principal of the loan and subject to accruing interest. Interest-only payments are due quarterly on March 31, June 30, September 30 and December 31 of each year of the interest-only payment period. Thereafter, in addition to interest accrued during the period, the quarterly payments shall include an amount equal to the outstanding principal at September 30, 2018 divided by the remaining number of quarters prior to the end of the term of the loan which is June 30, 2020. The Amended and Restated Term Loan Agreement provides for prepayment fees of 4% of the outstanding balance of the loan if the loan is repaid prior to September 30, 2015. The prepayment fee is reduced by 1% per year for each subsequent year.
Certain affirmative and negative covenants were also amended to provide the Company with additional flexibility. The principal financial covenants require that the Company attain minimum annual revenues of $30.0 million in 2015, $45.0 million in 2016, $60.0 million in 2017, $75.0 million in 2018 and $90.0 million thereafter. The loan and security agreement provides that an event of default will occur if, among other triggers, (1) the Company defaults in the payment of any amount payable under the agreement when due, (2) there occurs any circumstance or circumstances that could reasonably be expected to result in a material adverse effect on the Company’s business, operations or condition, or on the Company’s ability to perform its obligations under the agreement, (3) the Company becomes insolvent, (4) the Company undergoes a change in control or (5) the Company breaches any negative covenants or certain affirmative covenants in the agreement or, subject to a cure period, otherwise neglects to perform or observe any material item in the agreement. The repayment of the term loan may be accelerated, at the option of Capital Royalty, following the occurrence of an event of default, which would require the Company to pay to Capital Royalty an amount equal to the sum of: (i) all outstanding principal plus accrued interest, (ii) the final payment, plus (iii) all other sums, that shall have become due and payable but have not been paid, including interest at the default rate with respect to any past due amounts plus the Prepayment Premium.
The term loan, as amended, continues to be collateralized by a first priority security interest on all of the Company’s assets excluding property not assignable without consent by a third party, trademarks that would be invalid by reason of including it in the collateral and 35% of the ownership interest in a foreign subsidiary.
As of December 31, 2014, the Company was in compliance with all of the covenants.
68
Bridge Notes
In February 2012, the Company issued convertible bridge notes to certain of its convertible preferred stock holders providing the Company with net proceeds of $7.2 million. The holders of the bridge notes were entitled to receive convertible preferred stock warrants, initially exercisable for the Company’s Series C convertible preferred stock, equal to 25% of the principal amount of the notes. Upon closing of a Qualified Financing, defined as a financing of not less than $25 million, the notes and accrued interest automatically converted into shares of the equity issued in the Qualified Financing at the purchase price paid by investors for the equity securities of such round. Following a Qualified Financing, the bridge note warrants became exercisable for shares of the equity issued in that financing. On April 24, 2012, the Company amended the February bridge notes to provide additional proceeds of $4.0 million.
In June 2012, the Company entered into a Series D convertible preferred stock Purchase Agreement (“Series D Agreement”) upon closing the Series D financing, the bridge notes and accrued interest, in the amount of $167,000, were converted into shares of Series D convertible preferred stock and the note holders received warrants to purchase 7,161,829 shares of Series D convertible preferred stock at an exercise price of $0.3896 per share (the “Series D Warrants”).
The Company bifurcated the Series D convertible preferred stock warrants from the bridge notes. The Company recorded a $477,000 and $82,200 warrant liability on the dates of issuance and amendment of the bridge notes, respectively, with an offsetting discount on the bridge notes. The warrant liabilities were measured at fair value each reporting period and included in the other long-term liabilities line on the accompanying consolidated balance sheets prior to their conversion into common stock warrants upon the Company’s IPO in April 2014. Changes in fair value were ($598,000), ($129,000), and $777,000 during the years ended December 31, 2014, 2013 and 2012, respectively, and was recorded in interest income and other income (expense), net in the consolidated statement of comprehensive loss, until their conversion into common stock warrants upon the Company’s IPO in April 2014 of $610,000. The valuation of these warrants is discussed in Note 12.
Pinnacle Senior Notes
In May, 2011, the Company amended its Loan and Security Agreement (the “Senior Notes”) with Pinnacle Ventures, L.L.C. (“Pinnacle”), to increase the amount available from $15 million to $20 million to be used in conjunction with its existing cash to fund operations. The loan bore interest at the Prime Rate determined as of the date of the loan (advance) plus seven hundred seventy-five (775) basis points. In connection with this loan the Company issued warrants to purchase up to 409,090 shares of its Series C convertible preferred stock at an exercise price of $1.10 per share, subject to certain exercisability restrictions and warrants to purchase 35,780 shares of common stock exercisable at $12.58 per share.
The Company granted Pinnacle a conversion right to convert $5.0 million of the note into Series C convertible preferred stock at a price of $1.10 per share. On May 19, 2011, the Company drew the entire $20 million available under the credit facility. The Senior Notes were paid in full on October 30, 2012, before the end of the contractual term. In connection with the final payment, the Company recognized a loss on debt extinguishment of $3.1 million in the consolidated statements of comprehensive loss, which included all unamortized discounts and the previously unrecognized portion of the final payment fee.
The Company bifurcated the convertible preferred stock warrants and embedded derivatives related to make-whole provision from the Senior Notes as required by ASC 815 “Derivatives and Hedging.” The Company recorded the fair value of the Series C convertible preferred stock warrants of $258,000 and the fair value of the make-whole provision of $278,000 on the date of issuance of the Senior Notes as liabilities on the consolidated balance sheet with an offsetting discount of $536,000 to the Senior Notes. The derivative/warrant liabilities were measured at fair value each reporting period prior to their conversion into common stock warrants upon the Company’s IPO in April 2014. Changes in fair value were ($35,000), ($15,000) and $374,000 during the years ended December 31, 2014, 2013, and 2012, respectively, and was recorded in interest and was recorded in interest income and other income (expense), net in the consolidated statement of comprehensive loss, until their conversion into common stock warrants upon the Company’s IPO in April 2014 of $37,000. The change in the fair value of the Series C convertible preferred stock warrant liability and the make-whole provision derivative were recorded in interest income and other income (expense), net in the accompanying consolidated statements of comprehensive loss. The valuation of these warrants is discussed in Note 12.
The total discount on the Senior Notes was amortized over the life of the Senior Notes, using the effective interest method. Interest expense attributable to discount amortization totaled $151,000 in 2012. The Senior Notes also included a final payment fee equal to 5% of the amount drawn. The final payment fee was being accrued over the life of the loan using the effective interest method. Interest expense attributable to the accrual of the final payment fee totaled $281,000 in 2012.
Boston Scientific Corporation Note Payable
In conjunction with the acquisition of BSSR, the Company issued a promissory note in the amount of $3,487,000 to the prior owners of BSSR as part of the purchase consideration. The note bore an interest rate of 5.25% per annum and matured on March 28,
69
2018. The note (along with unpaid accrued interest) was repayable upon the earlier of (a) the date upon which initial public offering is consummated, or (b) the sale of the Company, including liquidation, dissolution or winding up. The Company had the right to prepay the unpaid principal at any time without any premium or prepayment penalty. As of December 31, 2013, the Company included $1,055,000 of accrued interest in the notes payable line on the accompanying balance sheet.
The Company repaid the note in full, including all accrued interest and the unamortized debt discount, subsequent to the closing of the IPO in April 2014. Warrants to purchase up to 223,487 shares of common stock expired unexercised upon the IPO in April 2014.
As of December 31, 2014, future minimum payments for the notes are as follows (in thousands):
|
|
|
|
|
|
|
Subordinated |
|
|
|
|
|
|
|
|
|
Term Loan |
|
|
Loan |
|
|
Total |
|
|||
|
|
|
|
|
|
|
|
|
|
|
|
|
|
|
2015 |
|
$ |
4,842 |
|
|
$ |
300 |
|
|
$ |
5,142 |
|
|
2016 |
|
5,016 |
|
|
|
300 |
|
|
|
5,316 |
|
|
|
2017 |
|
5,196 |
|
|
|
300 |
|
|
|
5,496 |
|
|
|
2018 |
|
13,923 |
|
|
|
300 |
|
|
|
14,223 |
|
|
|
2019 and beyond |
|
|
55,503 |
|
|
|
6,008 |
|
|
|
61,511 |
|
|
Total minimum payments |
|
|
84,480 |
|
|
|
7,208 |
|
|
|
91,688 |
|
|
Less: Amount representing interest |
|
|
(32,119 |
) |
|
|
(1,208 |
) |
|
|
(33,327 |
) |
|
Present value of minimum payments |
|
|
52,361 |
|
|
|
6,000 |
|
|
|
58,361 |
|
|
Less: Unamortized debt discount |
|
|
(672 |
) |
|
|
(2,685 |
) |
|
|
(3,357 |
) |
|
Notes payable, net |
|
|
51,689 |
|
|
|
3,315 |
|
|
|
55,004 |
|
|
Less: Notes payable, current portion |
|
|
— |
|
|
|
— |
|
|
|
— |
|
|
Non-current portion of notes payable |
|
$ |
51,689 |
|
|
$ |
3,315 |
|
|
$ |
55,004 |
|
11. Convertible Preferred Stock and Common Stock
In February 2014, the Company’s board of directors and stockholders approved an amendment to the amended and restated certificate of incorporation effecting a reverse stock split within a specified range with the final ratio to be determined by a committee of the board of directors. In March 2014, the committee of the board of directors approved a 1-for-40.57 reverse stock split of the Company’s issued and outstanding shares of common stock and the corresponding adjustments to the conversion ratio of the convertible preferred stock. The reverse split was implemented on April 1, 2014. The par value of the common and convertible preferred stock was not adjusted as a result of the reverse stock split. All issued and outstanding share and per share amounts included in the accompanying consolidated financial statements have been adjusted to reflect this reverse stock split for all periods presented.
Convertible Preferred Stock
The Company had authorized 401,334,139 shares of convertible preferred stock prior to the IPO, of which 393,432,624 shares were issued and outstanding as of December 31, 2013, designated in series, with the rights and preferences of each designated series to be determined by the Company’s Board of Directors.
A summary of the convertible preferred stock at December 31, 2013 is as follows (in thousands except share and per share data):
|
|
|
|
|
|
|
|
|
|
|
|
|
|
|
|
|
|
|
|
|
Proceeds |
|
|
|
|
|
Preferred |
|
|
|
|
Shares |
|
|
Per Share |
|
|
Aggregate |
|
|
Net of |
|
|||||
|
|
|
Shares |
|
|
Issuance |
|
Issued and |
|
|
Liquidation |
|
|
Liquidation |
|
|
Issuance |
|
|||||
|
Series |
|
Authorized |
|
|
Date |
|
Outstanding |
|
|
Preference |
|
|
Preference |
|
|
Costs |
|
|||||
|
|
|
|
|
|
|
|
|
|
|
|
|
|
|
|
|
|
|
|
|
|
|
|
|
A |
|
|
64,883,990 |
|
|
March 2008 |
|
|
64,883,990 |
|
|
$ |
1.00 |
|
|
$ |
64,884 |
|
|
$ |
64,885 |
|
|
B |
|
|
30,505,087 |
|
|
November 2009 |
|
|
30,505,087 |
|
|
|
1.00 |
|
|
|
30,505 |
|
|
|
30,388 |
|
|
C |
|
|
41,318,181 |
|
|
June 2010 |
|
|
40,909,091 |
|
|
|
1.10 |
|
|
|
45,000 |
|
|
|
44,849 |
|
|
|
|
|
|
|
|
June and |
|
|
|
|
|
|
|
|
|
|
|
|
|
|
|
|
|
D |
|
|
161,626,881 |
|
|
October 2012 |
|
|
154,465,052 |
|
|
|
0.39 |
|
|
|
60,180 |
|
|
|
59,978 |
|
|
E |
|
|
103,000,000 |
|
|
November 2013 |
|
|
102,669,404 |
|
|
|
0.39 |
|
|
|
40,000 |
|
|
|
39,890 |
|
|
Total |
|
|
401,334,139 |
|
|
|
|
|
393,432,624 |
|
|
|
|
|
|
$ |
240,569 |
|
|
$ |
239,990 |
|
70
Voting Rights
The holders of preferred stock were entitled to vote on all matters on which the common stockholders were entitled to vote. Holders of preferred and common stock voted together as a single class. Each holder of preferred stock was entitled to the number of votes equal to the number of common stock shares into which the shared held by such holder are convertible. Preferred stock also has certain special protective voting rights.
Dividends
The holders of preferred stock were entitled to receive noncumulative dividends, out of any assets legally available, to the same extent and on the same basis and contemporaneously with, cash dividends as declared by the Board of Directors with respect to the common stock equal to amounts that would have been received by the holders of the same number of shares of common stock into which Series A, Series B, Series C, Series D and Series E preferred stock was convertible. No dividends had been declared prior to the IPO.
Liquidation
In the event of any liquidation, dissolution or winding up of the Company, either voluntarily or involuntarily, the holders of the Series D and Series E convertible preferred stock were entitled to receive, prior and in preference to any distribution of any of the assets of the Company to the holders of shares of Series A, Series B and Series C convertible preferred stock and common stock an amount per share equal to $0.3896 for each share of Series D or Series E convertible preferred stock (as adjusted for stock splits, stock dividends, combinations or other recapitalizations), plus all declared and unpaid dividends, if any. After Series D and Series E convertible preferred stock received its consideration as described in the forgoing, Series A, Series B, and Series C convertible preferred stock was entitled to receive, prior and in preference to any distribution of any of the assets of the Company to the holders of shares of common stock, an amount per share equal to $1.00 for each outstanding share of Series A and Series B convertible preferred stock, and $1.10 for Series C convertible preferred stock (as adjusted for stock splits, stock dividends, combinations or other recapitalizations), plus all declared but unpaid dividends, if any on such share of preferred stock. If upon the liquidation, dissolution or winding up of the Company, the assets of the Company legally available for distribution to the holders of the preferred stock are insufficient to permit the payment to such holders of the full amounts above, then the entire assets of the Company legally available for distribution shall be distributed with equal priority and pro rata among the holders of the convertible preferred stock.
Convertible Preferred Stock Participation Rights
After payment of the full preferential amounts to the convertible preferred stockholders, the remaining assets of the Company available for distribution or the remaining consideration received in a liquidation transaction would have been distributed ratably among the holders of the convertible preferred and common stockholders in proportion to the number of shares held by them with the shares of convertible preferred stock being treated as if they had been converted to shares of common stock at the then applicable conversion rate. Notwithstanding the foregoing, the aggregate distributions made to the convertible preferred stockholders were not to exceed four times in the case of Series A convertible preferred stock and three times in the case of Series B, Series C, Series D and Series E convertible preferred stock their respective liquidation preferences, plus any declared but unpaid dividends.
Conversion
The shares of Series A, Series B, Series C, Series D and Series E preferred stock were convertible into an equal number of shares of common stock, at the option of the holder, subject to certain anti-dilution adjustments, such as in the event of a private placement at an offering price below the price of our Series E convertible preferred stock offering. The Series D convertible preferred stock was issued at a price per share lower than the issuance price per share of the Series A, Series B and Series C convertible preferred stock, triggering the anti-dilution adjustment of the conversion ratios into common stock of Series A, Series B and Series C convertible preferred stock. The issuance price triggering the anti-dilution adjustments was reset to the Series D issuance price at the time of the Series D financing and to the Series E issuance price at the time of the Series E financing.
The conversion ratios as of December 31, 2013 were as follows:
|
|
|
|
|
|
Series A and B convertible preferred stock |
|
1 to 26.00 |
|
|
Series C convertible preferred stock |
|
1 to 25.64 |
|
|
Series D convertible preferred stock |
|
1 to 40.57 |
|
|
Series E convertible preferred stock |
|
1 to 40.57 |
|
71
Balance Sheet Presentation
Prior to the conversion in the IPO in April 2014, the holders of the outstanding shares of convertible preferred stock had liquidation preference rights with respect to distributions of assets in the event of a sale of all or substantially all of the Company’s assets, the merger or consolidation of the Company, or upon the sale of more than 50% of the voting power of the Company. The holders of these preferred shares had voting rights to effect a change in control that would trigger such distribution preferences. Accordingly, all shares of convertible preferred stock were presented outside of permanent equity on the accompanying consolidated balance sheets for all periods presented until their conversion in the IPO in April 2014.
Preferred Stock
The Company’s Certificate of Incorporation, as amended in connection with the IPO, authorizes the Company to issue up to 5,000,000 shares of undesignated preferred stock. The board of directors has the authority to designate the rights, preferences and privileges of any such preferred stock in one or more series. As of December 31, 2014, no shares of preferred stock were issued or outstanding.
Common Stock
On April 22, 2014, the Company completed its IPO of 7,475,000 shares of common stock, which included the exercise in full by the underwriters in the offering of their option to purchase 975,000 additional shares of common stock, at an offering price of $12.00 per share. The Company received net proceeds of approximately $81.1 million, after deducting underwriting discounts and commissions and offering expenses. In connection with the IPO, the Company’s outstanding shares of convertible preferred stock were automatically converted into 11,601,860 shares of common stock and warrants exercisable for convertible preferred stock were automatically converted into warrants exercisable for 192,472 shares of common stock, resulting in the reclassification of the related redeemable convertible preferred stock warrant liability of $0.6 million to additional paid-in capital.
The Company’s Certificate of Incorporation, as amended in connection with the IPO, authorizes the Company to issue up to 100,000,000 shares of $0.01 par value common stock. Prior to this, the Certificate of Incorporation authorized the Company to issue up to 623,000,000 shares of $0.01 par value common stock. The holders of common stock are entitled to dividends when and if declared by the board of directors. There have been no dividends declared to date. The holder of each common share is entitled to one vote.
As of December 31, 2014, the Company has reserved sufficient shares of common stock for exercise of the warrants, stock options and other equity incentive awards, and issuance of shares under the ESPP.
12. Warrants
Common Stock Warrants
In connection with the acquisition of BSSR in March 2008, the Company issued a warrant to Boston Scientific Scimed to purchase up to 223,487 shares of common stock at $20.29 per share which, pursuant to the terms of the warrant, was subsequently adjusted to $12.98 per share. The fair value of $1,411,000 was determined using the Black-Scholes option pricing model with the following assumptions: risk-free interest rate of 2.69%, expected life of 20 years, dividend yield of 0% and expected volatility of 57%. This warrant expired unexercised upon the Company’s IPO in April 2014.
In connection with the Senior Notes, the Company issued warrants to purchase 35,780 shares of common stock at $12.58 per share. The fair value of $325,000 was determined using the Black-Scholes option pricing model with the following assumptions: fair value of underlying securities of $12.58, risk-free interest rate of 2.97%, expected life of 10 years, dividend yield of 0% and expected volatility of 62%. These warrants expire on June 30, 2020. The warrants remain outstanding as of December 31, 2014.
In connection with the Company drawing the first tranche term loan with Capital Royalty, the Company issued warrants to purchase 167,611 shares of common stock at $0.41 per share. The fair value of $496,000 was determined using the Black-Scholes option pricing model with the following assumptions: risk-free interest rate of 2.97%, expected life of 10 years, dividend yield of 0% and expected volatility of 49.7%. The warrants expire on October 29, 2022 and remain outstanding as of December 31, 2014.
Convertible Preferred Stock Warrants
In connection with the Senior Notes, the Company issued warrants to purchase up to 409,090 shares of Series C convertible preferred stock at an exercise price of $1.10 per share. Upon the IPO, these warrants converted into warrants to purchase up to 15,952 shares of common stock at an exercise price of $28.21 per share. The warrants’ fair value of $257,000 was determined using the
72
residual approach model with the following assumptions: fair value of underlying securities of $0.92, risk-free interest rate of 3.17%, expected life of 10 years, dividend yield of 0% and expected volatility of 62%. These warrants expire on June 30, 2020. The fair value of the warrants was remeasured at various dates until their conversion into warrants to purchase common stock upon the Company’s IPO using updated assumptions for the fair value of the underlying securities, the risk-free interest rate, expected life, dividend yield and expected volatility. The warrants to purchase common stock remain outstanding as of December 31, 2014.
In connection with the conversion of the bridge notes, the Company issued warrants to purchase up to 7,161,829 shares of Series D convertible preferred stock at an exercise price of $0.3896 per share. Upon the IPO, these warrants converted into warrants to purchase up to 176,520 shares of common stock at an exercise price of $15.81 per share. These warrants expire on February 2, 2019. The warrants’ initial fair value of $477,000 and $82,000 was determined using the residual approach model. The fair value of the warrants was remeasured at various dates until their conversion into warrants to purchase common stock upon the Company’s IPO using the Black-Scholes option pricing model with updated assumptions for the fair value of underlying securities, the risk-free interest rate, expected life, dividend yield and expected volatility. The warrants to purchase common stock remain outstanding as of December 31, 2014.
The Company determined the fair value of the warrants as of December 31, 2013 using the Black-Scholes option pricing model with the following assumptions:
|
|
|
|
|
|
|
|
|
2013 |
|
|
|
|
|
|
|
|
|
Expected term (years) |
|
5.5 - 6.9 |
|
|
|
Expected volatility |
|
|
42.00 |
% |
|
Risk-free interest rate |
|
|
1.91 |
% |
|
Dividend yield |
|
|
0 |
% |
13. Equity Incentive Plans
In April 2014, the Company adopted the 2014 Employee Stock Purchase Plan (the “ESPP”). A total of 500,000 shares of common stock were initially reserved for issuance under the ESPP, subject to certain annual adjustments. The initial offering under the ESPP commenced on the IPO date and has a duration of approximately 24 months, consisting of four approximately six-month purchase periods. The first purchase period ended on October 31, 2014 when 82,226 shares were purchased at a specified discount. The Company recorded amounts that had been withheld from employees for the second purchase period of $220,000 in accrued liabilities and other at December 31, 2014.
Eligible employee may contribute, normally through payroll deductions, up to 15% of their earnings for the purchase of common stock under the ESPP. The purchase price of common stock under the ESPP will be the lesser of: (a) 85% of the fair market value of a share of the Company’s common stock on the first date of an offering or (b) 85% of the fair market value of a share of the Company’s common stock on the date of purchase.
In April 2014, the Company adopted the 2014 Equity Incentive Plan (the “2014 Plan”). A total of 2,750,000 shares of common stock were initially reserved for issuance under the 2014 Plan, subject to certain annual adjustments. The 2014 Plan provides for the granting of stock options, RSUs and other equity awards to employees, directors and consultants of the Company. Options granted under the 2014 Plan may be either incentive stock options (“ISOs”) or nonqualified stock options (“NSOs”). ISOs may be granted only to Company employees while NSOs may be granted to all eligible recipients. At December 31, 2014, there were 738,810 shares of common stock subject to outstanding options under the 2014 Plan.
In April 2008, the Company adopted the 2008 Equity Incentive Plan (the “2008 Plan”). The 2008 Plan provided for the granting of stock options to employees, directors and consultants of the Company. In connection with the IPO, the 2008 Plan terminated in April 2014, and no further grants may be made from the 2008 Plan, while previously granted options continue in accordance with their respective terms. Any cancelled options from the 2008 Plan are released from the reserves. As of December 31, 2014, there were 1,394,127 shares of common stock subject to remaining outstanding options under the 2008 Plan.
Options under the 2014 and 2008 Plans have terms of up to ten years. The exercise price of an ISO may not be less than 100% of the fair market value of the shares on the date of grant; the exercise price for an NSO may not be less than 100% of the fair market value of the shares on the date of grant and the exercise price of an ISO or an NSO granted to a more than 10% shareholder may not be less than 110% of the fair market value of the shares on the date of grant. Options become exercisable as determined by the compensation committee of the board of directors.
73
In August 2012, the Company’s unvested outstanding options totaling 294,719 shares were repriced to $2.43 per share. The remaining contractual provisions including the term and vesting schedule of the repriced options remained unchanged. The incremental cost of the repriced options was $259,000, with $156,000 and $103,000 being recognized as expense in 2013 and 2012, respectively in the accompanying consolidated statements of comprehensive loss.
Options granted under the 2008 Plan and 2014 Plan include provisions permitting exercise of the option prior to full vesting. Any unvested (but issued) common shares so purchased are subject to repurchase by the Company at the original exercise price of the option upon termination of service. The proceeds initially are recorded as a refundable deposit within accrued liabilities and other and are reclassified into stockholder’s deficit on a ratable basis as the awards vest. The restricted shares issued upon early exercise of stock options are legally issued and outstanding. However, these restricted shares are only deemed outstanding for basic earnings per share computation purposes upon the respective repurchase rights lapsing. During 2012 and 2013, except for the option exercises in connection with stock loans as described in Note 7, no shares were early exercised. As of December 31, 2014, 2013 and 2012, early exercised unvested shares were 214,605, 0 and 497, respectively. As discussed in Note 7, Related Party Transactions, all of the Company’s early exercised stock options totaling 646,837 are included in the following tables.
Activity under the 2008 and 2014 Plans is set forth in the following table:
|
|
|
|
|
|
|
Outstanding Options |
|
|||||
|
|
|
|
|
|
|
|
|
|
|
Weighted |
|
|
|
|
|
Shares |
|
|
|
|
|
|
Average |
|
||
|
|
|
Available |
|
|
Number of |
|
|
Exercise |
|
|||
|
|
|
for Grant |
|
|
Shares |
|
|
Price |
|
|||
|
|
|
|
|
|
|
|
|
|
|
|
|
|
|
Balances at January 1, 2013 |
|
|
234,488 |
|
|
|
1,384,102 |
|
|
$ |
4.28 |
|
|
Additional shares authorized |
|
|
570,372 |
|
|
|
— |
|
|
|
— |
|
|
Options granted |
|
|
(763,907 |
) |
|
|
763,907 |
|
|
|
7.42 |
|
|
Options exercised |
|
|
— |
|
|
|
(7,574 |
) |
|
|
7.77 |
|
|
Options cancelled |
|
|
27,260 |
|
|
|
(27,260 |
) |
|
|
6.59 |
|
|
Balances at December 31, 2013 |
|
|
68,213 |
|
|
|
2,113,175 |
|
|
$ |
5.37 |
|
|
Additional shares authorized |
|
|
2,750,000 |
|
|
|
— |
|
|
|
— |
|
|
2008 Plan shares removed from pool |
|
|
(77,428 |
) |
|
|
— |
|
|
|
— |
|
|
Shares reserved for RSU grants |
|
|
(6,500 |
) |
|
|
— |
|
|
|
— |
|
|
Options granted |
|
|
(839,612 |
) |
|
|
839,612 |
|
|
|
12.20 |
|
|
Options exercised |
|
|
— |
|
|
|
(643,130 |
) |
|
|
2.47 |
|
|
Options cancelled |
|
|
110,017 |
|
|
|
(176,720 |
) |
|
|
10.30 |
|
|
Balances at December 31, 2014 |
|
|
2,004,690 |
|
|
|
2,132,937 |
|
|
$ |
8.52 |
|
The aggregate intrinsic value of options exercised under the 2008 and 2014 Plans was $6,843,000, ($13,000) and ($23,000) for the years ended December 31, 2014, 2013 and 2012, respectively, determined as of the date of option exercise. The 2008 and 2014 Plans provide for early exercise, depending on permissions granted by the board of directors at the time of grant, therefore all the Company’s outstanding stock options are exercisable subject to certain limitations as described in the Plan.
The following table summarizes information about stock options outstanding under the 2008 and 2014 Plans at December 31, 2014:
|
|
|
|
|
Options Outstanding |
|
|
Options Exercisable |
|
||||||||||||||
|
|
|
|
|
|
|
|
|
Weighted |
|
|
|
|
|
|
|
|
|
|
|
|
|
|
|
|
|
|
|
|
|
|
|
Average |
|
|
|
|
|
|
Weighted |
|
|
|
|
|
||
|
|
|
|
|
|
|
|
|
Remaining |
|
|
|
|
|
|
Average |
|
|
Aggregate |
|
|||
|
Exercise |
|
|
Number |
|
|
Contractual |
|
|
Number |
|
|
Exercise |
|
|
Intrinsic |
|
||||||
|
Price |
|
|
Outstanding |
|
|
Life (in Years) |
|
|
Exercisable |
|
|
Price |
|
|
Value |
|
||||||
|
|
|
|
|
|
|
|
|
|
|
|
|
|
|
|
|
|
|
|
|
|
|
|
|
$2.43-$3.25 |
|
|
|
611,137 |
|
|
|
7.39 |
|
|
|
387,283 |
|
|
$ |
2.59 |
|
|
$ |
3,867,000 |
|
|
|
$ |
5.68 |
|
|
|
18,572 |
|
|
|
8.79 |
|
|
|
563 |
|
|
$ |
5.68 |
|
|
|
4,000 |
|
|
$8.52-$12.00 |
|
|
|
1,285,994 |
|
|
|
8.77 |
|
|
|
236,361 |
|
|
$ |
8.78 |
|
|
|
896,000 |
|
|
|
$12.58-$14.52 |
|
|
|
217,234 |
|
|
|
7.45 |
|
|
|
139,872 |
|
|
$ |
13.34 |
|
|
|
— |
|
|
|
Total |
|
|
|
2,132,937 |
|
|
|
8.24 |
|
|
|
764,079 |
|
|
$ |
6.47 |
|
|
$ |
4,767,000 |
|
|
74
The following table summarizes information about stock options outstanding under the 2008 Plan at December 31, 2013:
|
|
|
|
|
Options Outstanding |
|
|
Options Exercisable |
|
||||||||||||||
|
|
|
|
|
|
|
|
|
Weighted |
|
|
|
|
|
|
|
|
|
|
|
|
|
|
|
|
|
|
|
|
|
|
|
Average |
|
|
|
|
|
|
Weighted |
|
|
|
|
|
||
|
|
|
|
|
|
|
|
|
Remaining |
|
|
|
|
|
|
Average |
|
|
Aggregate |
|
|||
|
Exercise |
|
|
Number |
|
|
Contractual |
|
|
Number |
|
|
Exercise |
|
|
Intrinsic |
|
||||||
|
Price |
|
|
Outstanding |
|
|
Life (in Years) |
|
|
Exercisable |
|
|
Price |
|
|
Value |
|
||||||
|
|
|
|
|
|
|
|
|
|
|
|
|
|
|
|
|
|
|
|
|
|
|
|
|
$2.43-$3.25 |
|
|
|
1,283,898 |
|
|
|
8.48 |
|
|
|
458,008 |
|
|
$ |
2.49 |
|
|
$ |
3,875,000 |
|
|
|
$ |
5.68 |
|
|
|
23,234 |
|
|
|
9.80 |
|
|
|
— |
|
|
$ |
5.73 |
|
|
|
— |
|
|
$8.52-$8.93 |
|
|
|
640,152 |
|
|
|
9.20 |
|
|
|
115,697 |
|
|
$ |
8.61 |
|
|
|
241,000 |
|
|
|
$12.58-$14.20 |
|
|
|
165,891 |
|
|
|
7.18 |
|
|
|
155,430 |
|
|
$ |
13.63 |
|
|
|
— |
|
|
|
Total |
|
|
|
2,113,175 |
|
|
|
8.61 |
|
|
|
729,135 |
|
|
$ |
5.84 |
|
|
$ |
4,116,000 |
|
|
There were 6,500 RSU awards granted in 2014 at a grant date fair value of $13.41 per share. None were vested at December 31, 2014.
Stock-Based Compensation
During the year ended December 31, 2014, the Company granted stock options and RSUs to employees to purchase 846,112 shares of common stock under the 2008 and 2014 Plans with a weighted-average grant date fair value of $6.47 per share. As of December 31, 2014, there was total unrecognized compensation costs of $5.5 million. These costs are expected to be recognized over a weighted average period of approximately 3.0 years.
The following table sets forth stock-based compensation expense related to all stock-based arrangements for the periods presented (in thousands):
|
|
|
Years ended December 31, |
|
|||||||||
|
|
|
2014 |
|
|
2013 |
|
|
2012 |
|
|||
|
|
|
|
|
|
|
|
|
|
|
|
|
|
|
Cost of goods sold |
|
$ |
230 |
|
|
$ |
64 |
|
|
$ |
44 |
|
|
Research and development |
|
349 |
|
|
|
215 |
|
|
|
160 |
|
|
|
Sales, general and administrative |
|
|
2,041 |
|
|
|
1,012 |
|
|
|
852 |
|
|
Total |
|
$ |
2,620 |
|
|
$ |
1,291 |
|
|
$ |
1,056 |
|
The Company estimated the fair value of stock options using the Black-Scholes option pricing model. The weighted-average grant-date fair value of options granted in 2014, 2013 and 2012 was $6.42 $3.95 and $1.22, respectively. The fair value of employee stock options is being amortized on a straight-line basis over the requisite service period of the awards. The fair value of RSU awards is determined based on the closing market price on the grant date of the award. The outstanding options generally vest 25% on the first anniversary of the original grant date, with the balance vesting monthly over the remaining three years. The outstanding options granted to the U.S. sales force generally vest 33% on the second anniversary of the original vesting start date, 33% on the third anniversary and the balance on the fourth anniversary.
The assumptions used in the Black–Scholes option pricing model are as follows:
|
|
|
Stock Options |
|
|
ESPP |
|
||||||||||
|
|
|
Years ended December 31, |
|
|
Year Ended December 31, |
|
||||||||||
|
|
|
2014 |
|
|
2013 |
|
|
2012 |
|
|
2014 |
|
||||
|
|
|
|
|
|
|
|
|
|
|
|
|
|
|
|||
|
Expected term (years) |
|
|
5.3 |
|
|
|
5.4 |
|
|
|
5.3 |
|
|
|
1.3 |
|
|
Expected volatility |
|
|
59.71 |
% |
|
|
59.95 |
% |
|
|
61.51 |
% |
|
|
59.54 |
% |
|
Risk-free interest rate |
|
|
1.62 |
% |
|
|
1.24 |
% |
|
|
0.70 |
% |
|
|
0.20 |
% |
|
Dividend yield |
|
|
0 |
% |
|
|
0 |
% |
|
|
0 |
% |
|
|
0 |
% |
Expected Term. The expected term of stock options represents the weighted-average period that the stock options are expected to remain outstanding. The Company estimated the expected term based on the average expected term used by a peer group of publicly traded medical device companies.
75
Expected Volatility. Since there has been no public market for the Company’s common stock prior to its IPO and lack of company-specific historical volatility, the Company has determined the share price volatility for options granted based on an analysis of the volatility used by a peer group of publicly traded medical device companies and, since the IPO, the Company’s actual experience. In evaluating similarity, the Company considers factors such as industry, stage of life cycle and size.
Risk-Free Interest Rate. The risk-free interest rate is based on the U.S. Treasury yield in effect at the time of the grant for zero-coupon U.S. Treasury notes with remaining terms similar to the expected term of the options.
Dividend Rate. The expected dividend was assumed to be zero as the Company has never paid dividends and has no current plans to do so.
Expected Forfeiture Rate. The Company is required to estimate forfeitures at the time of grant, and revise those estimates in subsequent periods if actual forfeitures differ from those estimates. The Company uses historical data to estimate pre-vesting option forfeitures and record stock-based compensation expense only for those awards that are expected to vest. To the extent actual forfeitures differ from the estimates, the difference will be recorded as a cumulative adjustment in the period that the estimates are revised. Based on an analysis of the Company’s historical data, the Company applied average forfeiture rates of 5.8% for the year ended December 31, 2014.
Fair Value of Common Stock. The fair value of the shares of common stock underlying the stock options had historically been determined by the board of directors prior to the Company’s IPO by considering a number of objective and subjective factors including valuation of comparable companies, sales of convertible preferred stock to unrelated third parties, operating and financial performance, the lack of liquidity of capital stock and general and industry specific economic outlook, amongst other factors. Since the IPO in April 2014, the Company determines the fair value of the shares of common stock for any equity incentive plans based on the closing price that the stock is trading at on the public market on the date of grant.
Restricted Stock Units
Following its IPO, the Company plans to begin granting other equity incentive awards, such as RSUs, to its employees and service providers. RSUs are awards that cover a number of shares of our common stock that may be settled upon vesting by the issuance of the underlying shares. These awards are subject to forfeiture prior to settlement because of termination of employment or failure to achieve certain performance conditions, and may contain settlement deferral features. The Company expects that RSUs it will utilize for its executives and employees, generally, will vest as to 25% on a specified date within the calendar quarter nearest to the first anniversary of the vesting commencement date and as to additional 25% on the second, third and fourth such anniversaries. The Company expects that RSUs it will utilize for its U.S. sales force, generally, will vest as to 50% on a specified date within the calendar quarter nearest to the second anniversary of the vesting commencement date, as to 25% on the third such anniversary and as to the remaining 25% on the fourth such anniversary. As of December 31, 2014 the Company had awarded 6,500 RSUs to a member of the U.S. sales force.
14. Income Taxes
Significant components of the Company’s net deferred income tax assets at December 31, 2014 and 2013 are shown below. A valuation allowance has been recorded to offset the net deferred tax asset as of December 31, 2014 and 2013, as the realization of such assets does not meet the more-likely-than-not threshold. The following table shows our net deferred taxes as of December 31, 2014 and 2013 (in thousands):
|
|
|
December 31, |
|
|||||
|
|
|
2014 |
|
|
2013 |
|
||
|
|
|
|
|
|
|
|
|
|
|
Net operating loss carryforwards |
|
$ |
99,627 |
|
|
$ |
79,966 |
|
|
Research and development credits |
|
|
3,585 |
|
|
|
2,933 |
|
|
Depreciation and amortization |
|
|
1,792 |
|
|
|
1,795 |
|
|
Accruals and reserves |
|
|
2,753 |
|
|
|
1,693 |
|
|
Total |
|
|
107,757 |
|
|
|
86,387 |
|
|
Valuation allowance |
|
|
(107,757 |
) |
|
|
(86,387 |
) |
|
Net deferred tax asset |
|
$ |
— |
|
|
$ |
— |
|
76
The components of the provision for income taxes for the years ended December 31, 2014, 2013 and 2012 are as follows (in thousands):
|
|
|
Years ended December 31, |
|
|||||||||
|
|
|
2014 |
|
|
2013 |
|
|
2012 |
|
|||
|
Current: |
|
|
|
|
|
|
|
|
|
|
|
|
|
U.S. |
|
$ |
— |
|
|
$ |
— |
|
|
$ |
— |
|
|
State |
|
|
8 |
|
|
|
14 |
|
|
|
3 |
|
|
Foreign |
|
|
304 |
|
|
|
185 |
|
|
|
172 |
|
|
Subtotal |
|
|
312 |
|
|
|
199 |
|
|
|
175 |
|
|
|
|
|
|
|
|
|
|
|
|
|
|
|
|
Deferred: |
|
|
|
|
|
|
|
|
|
|
|
|
|
U.S. |
|
|
— |
|
|
|
— |
|
|
|
— |
|
|
State |
|
|
— |
|
|
|
— |
|
|
|
— |
|
|
Foreign |
|
|
— |
|
|
|
— |
|
|
|
— |
|
|
Subtotal |
|
|
— |
|
|
|
— |
|
|
|
— |
|
|
Total provision for income taxes |
|
$ |
312 |
|
|
$ |
199 |
|
|
$ |
175 |
|
Due to uncertainties surrounding the realization of deferred tax assets through future taxable income, the Company has provided a full valuation allowance and, therefore, has not recognized any benefits from the net operating losses and other deferred tax assets. The valuation allowance increased $21.4 million during both of the years ended December 31, 2014 and 2013, respectively.
Recognition of deferred tax assets is appropriate when realization of such assets is more likely than not. Based upon the weight of available evidence, the Company believes it is not yet more likely than not that the net deferred tax assets will be realizable. Accordingly, the Company has provided a full valuation allowance against its net deferred tax assets for each of the years presented.
The reconciliation between the statutory federal income tax and the Company’s effective tax rate as a percentage of loss before income taxes is as follows:
|
|
|
Years ended December 31, |
|
|||||||||
|
|
|
2014 |
|
|
2013 |
|
|
2012 |
|
|||
|
|
|
|
|
|
|
|
|
|
|
|
|
|
|
Statutory tax rate |
|
|
34.0 |
% |
|
|
34.0 |
% |
|
|
34.0 |
% |
|
State tax rate, net of federal benefit |
|
|
— |
|
|
|
— |
|
|
|
— |
|
|
Incentive stock option stock compensation |
|
|
(0.8 |
%) |
|
|
(1.0 |
%) |
|
|
0.5 |
% |
|
Adjustments to fair value for the warrants |
|
|
0.4 |
% |
|
|
0.1 |
% |
|
|
(0.9 |
%) |
|
Federal R&D credit |
|
|
0.9 |
% |
|
|
0.9 |
% |
|
|
— |
|
|
Other |
|
|
(0.8 |
%) |
|
|
0.1 |
% |
|
|
(0.4 |
%) |
|
Change in valuation allowance |
|
|
(34.2 |
%) |
|
|
(34.5 |
%) |
|
|
(33.6 |
%) |
|
Effective tax rate |
|
|
(0.5 |
%) |
|
|
(0.4 |
%) |
|
|
(0.4 |
%) |
As of December 31, 2014, the Company had net operating loss carry-forwards of approximately $263.4 million and $179.5 million available to reduce future taxable income, if any, for Federal and state income tax purposes, respectively. The net operating loss carry forwards begin to expire in 2028.
The Company has not provided for deferred U.S. income taxes on undistributed earnings of our foreign subsidiaries that the Company intends to reinvest indefinitely outside the United States. Should the Company distribute or be treated under certain U.S. tax rules as having distributed earnings of foreign subsidiaries in the form of dividends or otherwise, the Company may be subject to U.S. income taxes. Due to complexities in tax laws and various assumptions that would have to be made, it is not practicable at this time to estimate the amount of unrecognized deferred U.S. taxes on these earnings.
At December 31, 2014, the Company also had Federal and California research and development credit carry-forwards of approximately $2.6 million and $2.9 million, respectively. The Federal credit carry-forward will begin to expire in 2028 if not utilized. The California credits have no expiration date.
Utilization of the net operating loss carryforward may be subject to a substantial annual limitation due to ownership percentage change limitations that may have occurred or that could occur in the future, as required by Section 382 of the Internal Revenue Code of 1986, as amended (the “Code”), as well as similar state and foreign provisions. These ownership changes may limit the amount of net operating loss and R&D credit carryforwards that can be utilized annually to offset future taxable income and tax, respectively. In
77
general, an “ownership change” as defined by Section 382 of the Code results from a transaction or series of transactions over a three-year period resulting in an ownership change of more than 50 percentage points of the outstanding stock of a company by certain stockholders. Since the Company’s formation, the Company has raised capital through the issuance of capital stock on several occasions, which, on its own or combined with the purchasing stockholders’ subsequent disposition of those shares, have resulted in such an ownership change, and could result in an ownership change in the future.
As of December 31, 2014 and 2013, the unrecognized tax benefit was $1.9 million and $1.6 million, respectively, all of which would result in corresponding adjustments to valuation allowance. A reconciliation of the beginning and ending amount of unrecognized tax benefit is as follows (in thousands):
|
|
|
Years ended December 31, |
|
|||||
|
|
|
2014 |
|
|
2013 |
|
||
|
|
|
|
|
|
|
|
|
|
|
Balance at the beginning of the year |
|
$ |
1,579 |
|
|
$ |
1,145 |
|
|
Additions related to current year tax positons |
|
|
351 |
|
|
|
434 |
|
|
Balance at the end of the year |
|
$ |
1,930 |
|
|
$ |
1,579 |
|
The Company recognizes interest and/or penalties related to income tax matters as a component of income tax expense. As of December 31, 2014, there were no significant accrued interest and penalties related to uncertain tax positions.
The Company’s primary tax jurisdiction is the United States. The Company’s tax years 2008 through 2013 remain open for examination by the federal and state authorities for three and four years, respectively, from the date of utilization of any operating loss or R&D credits carry-forwards. In addition, federal and state taxing authorities may challenge the carryover of prior year tax attributes when they are used to offset taxable income in future years.
15. Employee Benefits
The Company has a defined contribution 401(k) plan for employees who are at least 21 years of age. Employees are eligible to participate in the plan beginning on the first day of the calendar month following their date of hire. Under the terms of the plan, employees may make voluntary contributions as a percent of compensation. The Company does not provide a matching contribution.
16. Selected Quarterly Financial Data (Unaudited)
Quarterly financial information for fiscal year 2014 and 2013 are presented in the following table (in thousands, except per share data):
|
|
|
For the Quarter Ended |
|
|||||||||||||
|
|
|
March 31 |
|
|
June 30 |
|
|
September 30 |
|
|
December 31 |
|
||||
|
2014: |
|
|
|
|
|
|
|
|
|
|
|
|
|
|
|
|
|
Revenue |
|
$ |
7,034 |
|
|
$ |
7,798 |
|
|
$ |
7,878 |
|
|
$ |
9,088 |
|
|
Gross profit |
|
|
3,369 |
|
|
|
4,335 |
|
|
|
4,506 |
|
|
|
5,768 |
|
|
Operating expenses |
|
|
15,998 |
|
|
|
17,074 |
|
|
|
16,613 |
|
|
|
18,294 |
|
|
Operating loss |
|
|
(12,629 |
) |
|
|
(12,739 |
) |
|
|
(12,107 |
) |
|
|
(12,526 |
) |
|
Net loss |
|
|
(14,423 |
) |
|
|
(14,572 |
) |
|
|
(13,887 |
) |
|
|
(14,491 |
) |
|
Basic and diluted net loss per share |
|
$ |
(21.77 |
) |
|
$ |
(0.87 |
) |
|
$ |
(0.69 |
) |
|
$ |
(0.72 |
) |
|
|
|
|
|
|
|
|
|
|
|
|
|
|
|
|
|
|
|
2013: |
|
|
|
|
|
|
|
|
|
|
|
|
|
|
|
|
|
Revenue |
|
$ |
2,942 |
|
|
$ |
4,826 |
|
|
$ |
5,505 |
|
|
$ |
6,235 |
|
|
Gross profit |
|
|
954 |
|
|
|
1,668 |
|
|
|
1,915 |
|
|
|
3,263 |
|
|
Operating expenses |
|
|
10,674 |
|
|
|
12,840 |
|
|
|
13,136 |
|
|
|
15,045 |
|
|
Operating loss |
|
|
(9,720 |
) |
|
|
(11,172 |
) |
|
|
(11,221 |
) |
|
|
(11,782 |
) |
|
Net loss |
|
|
(11,283 |
) |
|
|
(12,833 |
) |
|
|
(12,703 |
) |
|
|
(13,489 |
) |
|
Basic and diluted net loss per share |
|
$ |
(19.65 |
) |
|
$ |
(22.33 |
) |
|
$ |
(22.07 |
) |
|
$ |
(23.36 |
) |
|
(1) |
Net loss per share is computed independently for each of the quarters presented. Therefore, the sum of the quarterly per-share calculations will not necessarily equal the annual per share calculation. |
78
Item 9. Changes in and Disagreements With Accountants on Accounting and Financial Disclosure.
Not applicable.
Item 9A. Controls and Procedures.
Evaluation of Disclosure Controls and Procedures
We maintain disclosure controls and procedures that are designed to ensure that information required to be disclosed in our periodic and current reports that we file with the SEC is recorded, processed, summarized and reported within the time periods specified in the SEC’s rules and forms, and that such information is accumulated and communicated to our management, including our principal executive officer and principal financial officer, as appropriate, to allow timely decisions regarding required disclosure. In designing and evaluating the disclosure controls and procedures, management recognized that any controls and procedures, no matter how well designed and operated, can provide only reasonable and not absolute assurance of achieving the desired control objectives.
In reaching a reasonable level of assurance, management necessarily was required to apply its judgment in evaluating the cost benefit relationship of possible controls and procedures. In addition, the design of any system of controls also is based in part upon certain assumptions about the likelihood of future events, and there can be no assurance that any design will succeed in achieving its stated goals under all potential future conditions; over time, control may become inadequate because of changes in conditions, or the degree of compliance with policies or procedures may deteriorate. Because of the inherent limitations in a cost-effective control system, misstatements due to error or fraud may occur and not be detected.
During the year ended December 31, 2014, we developed and implemented new control procedures to address a previously identified material weakness in our internal control over financial reporting as of December 31, 2013 related to the process for calculating the weighted common shares used to compute basic and diluted net loss per share. After completing our assessment of the design and operating effectiveness of the new procedures, we concluded that we have remediated the previously identified material weakness as of March 31, 2014.
As of December 31, 2014, we carried out an evaluation, under the supervision and with the participation of our management, including our principal executive officer and principal financial officer, of the effectiveness of the design and operation of our disclosure controls and procedures, as defined in Rules 13a-15(e) and 15d-15(e) under the Exchange Act. Based on this evaluation, our principal executive officer and principal financial officer concluded that our disclosure controls and procedures were effective at the reasonable assurance level as of December 31, 2014.
Management’s Report on Internal Control over Financial Reporting
This Annual Report does not include a report of management’s assessment regarding internal control over financial reporting, or an attestation report of our independent registered public accounting firm, due to a transition period established by the rules of the SEC for newly public companies.
Changes in Internal Control over Financial Reporting
There were no changes in our internal control over financial reporting identified in management’s evaluation pursuant to Rules 13a-15(d) or 15d-15(d) of the Exchange Act during the quarter ended December 31, 2014 that materially affected, or are reasonably likely to materially affect, our internal control over financial reporting.
Not applicable.
79
PART III
Item 10. Directors, Executive Officers and Corporate Governance
The information required by this item and not set forth below will be set forth in the sections entitled “Election of Directors” and “Executive Officers” in our Proxy Statement for our 2015 Annual Meeting of Stockholders, or Proxy Statement, to be filed with the SEC within 120 days after the end of the fiscal year ended December 31, 2014, and is incorporated herein by reference.
We have adopted a Code of Conduct and Ethics that applies to our Chief Executive Officer and other senior financial officers (our Chief Financial Officer and other senior financial officers performing similar functions). The Code of Conduct and Ethics is available on our website at http://www.trivascular.com under the Corporate Governance section of the Investors portion of the website. Our Code of Conduct and Ethics is designed to meet the requirements of Section 406 of Regulation S-K and the rules promulgated thereunder. We will promptly disclose on our website (i) the nature of any amendment to the Code of Conduct and Ethics that applies to any covered person, and (ii) the nature of any waiver, including an implicit waiver, from a provision of the Code of Conduct and Ethics that is granted to one of the covered persons.
Item 11. Executive Compensation
The information required by this item will be set forth in the section entitled “Executive Compensation” in our Proxy Statement and is incorporated herein by reference.
Item 12. Security Ownership of Certain Beneficial Owners and Management and Related Stockholder Matters
The information required by this item will be set forth in the sections entitled “Security Ownership of Certain Beneficial Owners and Management” and “Executive Compensation” in our Proxy Statement and is incorporated herein by reference.
Item 13. Certain Relationships and Related Transactions, and Director Independence
The information required by this item will be set forth in the section entitled “Certain Relationships and Related Party Transactions” in our Proxy Statement and is incorporated herein by reference.
Item 14. Principal Accounting Services and Fees
The information required by this item will be set forth in the section entitled “Ratification of Selection of Independent Registered Public Accounting Firm” in our Proxy Statement and is incorporated herein by reference.
80
PART IV
Item 15. EXHIBITS, FINANCIAL STATEMENT SCHEDULES
(a) The following documents are filed as part of this Annual Report:
1. Financial Statements. The following documents are included in Part II, Item 8 of this Annual Report and are incorporated by reference herein:
|
|
|
Page |
|
|
52 |
|
|
|
53 |
|
|
|
54 |
|
|
Consolidated Statements of Convertible Preferred Stock and Stockholders’ Equity (Deficit) |
|
55 |
|
|
56 |
|
|
|
57 |
2. Financial Statement Schedules. Financial statement schedules are omitted because they are not applicable or the required information is shown in the financial statements or notes thereto.
3. Exhibits.
EXHIBIT INDEX
|
Exhibit |
|
Description |
|
3.1 |
|
Amended and Restated Certificate of Incorporation of TriVascular Technologies, Inc. (incorporated by reference to Exhibit 3.1 to the Current Report on Form 8-K, File No. 001-36419, filed by the Company on April 23, 2014) |
|
|
|
|
|
3.2 |
|
Amended and Restated Bylaws of TriVascular Technologies, Inc. (incorporated by reference to Exhibit 3.2 to the Current Report on Form 8-K, File No. 001-36419, filed by the Company on April 23, 2014) |
|
|
|
|
|
4.1 |
|
Specimen Common Stock Certificate (incorporated by reference to Exhibit 4.1 to the Registration Statement on Form S-1, File No. 333-194466, filed by the Company on April 11, 2014) |
|
|
|
|
|
4.2 |
|
Fourth Amended and Restated Stockholders Agreement by and among the Registrant and the stockholders party thereto (incorporated by reference to Exhibit 4.2 to the Registration Statement on Form S-1, File No. 333-194466, filed by the Company on March 10, 2014) |
|
|
|
|
|
4.3 |
|
Form of Common Stock Warrant held by entities affiliated with Capital Royalty Partners (incorporated by reference to Exhibit 4.3 to the Registration Statement on Form S-1, File No. 333-194466, filed by the Company on March 10, 2014) |
|
|
|
|
|
4.4 |
|
Form of Common Stock Warrant held by entities affiliated with Pinnacle Ventures (incorporated by reference to Exhibit 4.4 to the Registration Statement on Form S-1, File No. 333-194466, filed by the Company on March 10, 2014) |
|
|
|
|
|
4.5 |
|
Form of Series C Convertible Preferred Stock Warrant held by entities affiliated with Pinnacle Ventures (incorporated by reference to Exhibit 4.5 to the Registration Statement on Form S-1, File No. 333-194466, filed by the Company on March 10, 2014) |
|
|
|
|
|
4.6 |
|
Form of Series D Convertible Preferred Stock Warrants (incorporated by reference to Exhibit 4.6 to the Registration Statement on Form S-1, File No. 333-194466, filed by the Company on March 10, 2014) |
|
|
|
|
|
10.1 |
|
Form of Director and Officer Indemnification Agreement (incorporated by reference to Exhibit 10.1 to the Registration Statement on Form S-1, File No. 333-194466, filed by the Company on March 10, 2014) |
|
|
|
|
|
10.2+ |
|
TriVascular Technologies, Inc. 2008 Equity Incentive Plan and Form of Stock Option Grant Agreement (incorporated by reference to Exhibit 10.2 to the Registration Statement on Form S-1, File No. 333-194466, filed by the Company on March 10, 2014) |
|
|
|
|
|
10.3+ |
|
Form of Early Exercise Stock Purchase Agreement pursuant to 2008 Equity Incentive Plan (incorporated by reference to Exhibit 10.3 to the Registration Statement on Form S-1, File No. 333-194466, filed by the Company on March 10, 2014) |
|
|
|
|
|
10.4+ |
|
TriVascular Technologies, Inc. 2014 Employee Stock Purchase Plan (incorporated by reference to Exhibit 10.4 to the Registration Statement on Form S-1, File No. 333-194466, filed by the Company on April 3, 2014) |
|
|
|
|
|
10.5+ |
|
TriVascular Technologies, Inc. 2014 Equity Incentive Plan and Forms of Award Agreements (incorporated by reference to Exhibit 10.5 to the Registration Statement on Form S-1, File No. 333-194466, filed by the Company on April 3, 2014) |
81
|
Exhibit |
|
Description |
|
|
|
|
|
10.6+ |
|
Non-Employee Director Compensation Program (incorporated by reference to Exhibit 10.6 to the Registration Statement on Form S-1, File No. 333-194466, filed by the Company on April 3, 2014) |
|
|
|
|
|
10.7+ |
|
Key Employee Change in Control and Severance Payment Plan (incorporated by reference to Exhibit 10.7 to the Registration Statement on Form S-1, File No. 333-194466, filed by the Company on March 10, 2014) |
|
|
|
|
|
10.8 |
|
Lease Agreement, by and among TriVascular, Inc. and Carmel River, LLC, Carlsen Investments, LLC and Rieger Investments, LLC, dated June 16, 2005 (incorporated by reference to Exhibit 10.8 to the Registration Statement on Form S-1, File No. 333-194466, filed by the Company on March 10, 2014) |
|
|
|
|
|
10.9 |
|
Consent, Assignment First Amendment to Lease and Non-Disturbance Agreement, by and among Carmel River, LLC, Carlsen Investments, LLC and Rieger Investments, LLC, Boston Scientific Santa Rosa Corp. (formerly known as TriVascular, Inc.), dated March 28, 2008 (incorporated by reference to Exhibit 10.9 to the Registration Statement on Form S-1, File No. 333-194466, filed by the Company on March 10, 2014) |
|
|
|
|
|
10.10 |
|
Second Amendment to Lease, by and among Sonoma Airport Properties LLC, TriVascular, Inc. and Boston Scientific Corporation, dated December 2011 (incorporated by reference to Exhibit 10.10 to the Registration Statement on Form S-1, File No. 333-194466, filed by the Company on March 10, 2014) |
|
|
|
|
|
10.11# |
|
Exclusive License Agreement by and between Boston Scientific Santa Rosa Corporation and Boston Scientific Scimed, Inc., dated March 28, 2008 (incorporated by reference to Exhibit 10.11 to the Registration Statement on Form S-1, File No. 333-194466, filed by the Company on March 10, 2014) |
|
|
|
|
|
10.12# |
|
Nonexclusive License Agreement by and between (i) Boston Scientific Scimed, Inc. and Endovascular Technologies, Inc. and (ii) Boston Scientific Santa Rosa Corporation, dated March 28, 2008 (incorporated by reference to Exhibit 10.12 to the Registration Statement on Form S-1, File No. 333-194466, filed by the Company on March 10, 2014) |
|
|
|
|
|
10.13# |
|
Know-How Assignment Agreement by and between Boston Scientific Santa Rosa Corporation and Boston Scientific Scimed, Inc., dated March 28, 2008 (incorporated by reference to Exhibit 10.13 to the Registration Statement on Form S-1, File No. 333-194466, filed by the Company on March 10, 2014) |
|
|
|
|
|
10.14 |
|
Amended and Restated Term Loan Agreement, by and among TriVascular Technologies, Inc., TriVascular, Inc., TriVascular Sales LLC and Capital Royalty Partners II L.P., Parallel Investment Opportunities Partners II L.P., Capital Royalty Partners II—Parallel Fund “A” L.P., Capital Royalty Partners II (Cayman) L.P. and Capital Royalty Partners II—Parallel Fund “B” (Cayman) L.P., dated November 4, 2014 (incorporated by reference to Exhibit 10.1 to the Company’s Current Report on Form 8-K, File No. 001-36419, filed on November 10, 2014) |
|
|
|
|
|
10.15 |
|
Term Loan Agreement by and between TriVascular, Inc. and Century Medical, Inc., dated January 1, 2014 (incorporated by reference to Exhibit 10.15 to the Registration Statement on Form S-1, File No. 333-194466, filed by the Company on March 10, 2014) |
|
|
|
|
|
10.16 |
|
First Amendment to Loan Agreement, by and among TriVascular Technologies, Inc., TriVascular, Inc., TriVascular Sales LLC and Century Medical, Inc., dated November 4, 2014 (incorporated by reference to Exhibit 10.2 to the Company’s Current Report on Form 8-K, File No. 001-36419, filed on November 10, 2014) |
|
|
|
|
|
10.17+ |
|
Amended and Restated Employment Agreement by and between Christopher G. Chavez and the Company, dated February 26, 2014 (incorporated by reference to Exhibit 10.16 to the Registration Statement on Form S-1, File No. 333-194466, filed by the Company on March 10, 2014) |
|
|
|
|
|
10.18+ |
|
Amendment No. 1, dated June 30, 2014, to the Amended and Restated Employment Agreement by and between Christopher G. Chavez and the Company (incorporated by reference to Exhibit 10.1 to the Company’s Current Report on Form 8-K, File No. 001-36419, filed on July 3, 2014) |
|
|
|
|
|
10.19+ |
|
Employment Offer Letter between the Company and Michael V. Chobotov, dated October 27, 2009, as amended on July 3, 2012 (incorporated by reference to Exhibit 10.17 to the Registration Statement on Form S-1, File No. 333-194466, filed by the Company on March 10, 2014) |
|
|
|
|
|
10.20+ |
|
Employment Offer Letter between the Company and Kimberley Elting, dated March 14, 2013 (incorporated by reference to Exhibit 10.18 to the Registration Statement on Form S-1, File No. 333-194466, filed by the Company on March 10, 2014) |
|
|
|
|
|
10.21+ |
|
Employment Offer Letter between the Company and Vivek K. Jayaraman, dated October 4, 2009 (incorporated by reference to Exhibit 10.19 to the Registration Statement on Form S-1, File No. 333-194466, filed by the Company on March 10, 2014) |
|
|
|
82
|
Exhibit |
|
Description |
|
10.22+ |
|
Employment Offer Letter between the Company and Michael R. Kramer, dated August 29, 2010 (incorporated by reference to Exhibit 10.20 to the Registration Statement on Form S-1, File No. 333-194466, filed by the Company on March 10, 2014) |
|
|
|
|
|
10.23+ |
|
Employment Offer Letter between the Company and Lou Molinari, dated April 1, 2008, as amended on December 11, 2009 (incorporated by reference to Exhibit 10.21 to the Registration Statement on Form S-1, File No. 333-194466, filed by the Company on March 10, 2014) |
|
|
|
|
|
10.24+ |
|
Employment Offer Letter between the Company and Shari L. O’Quinn (formerly Allen), dated September 2, 2009 (incorporated by reference to Exhibit 10.22 to the Registration Statement on Form S-1, File No. 333-194466, filed by the Company on March 10, 2014) |
|
|
|
|
|
10.25+ |
|
Employment Offer Letter between the Company and Robert G. Whirley, dated October 27, 2009 (incorporated by reference to Exhibit 10.23 to the Registration Statement on Form S-1, File No. 333-194466, filed by the Company on March 10, 2014) |
|
|
|
|
|
10.26+ |
|
Form of Non-Employee Director vesting acceleration addendum pursuant to the 2008 Equity Incentive Plan (incorporated by reference to Exhibit 10.24 to the Registration Statement on Form S-1, File No. 333-194466, filed by the Company on April 3, 2014) |
|
|
|
|
|
21.1 |
|
Subsidiaries of TriVascular Technologies, Inc. |
|
|
|
|
|
23.1 |
|
Consent of Independent Registered Public Accounting Firm |
|
|
|
|
|
31.1 |
|
Certification of principal executive officer pursuant to Rule 13a 14(a)/15d 14(a) of the Securities Exchange Act of 1934, as amended |
|
|
|
|
|
31.2 |
|
Certification of principal financial officer pursuant to Rule 13a-14(a)/15d-14(a) of the Securities Exchange Act of 1934, as amended. |
|
|
|
|
|
32.1 |
|
Certification of principal executive officer and principal financial officer pursuant to 18 U.S.C. §1350, as adopted pursuant to Section 906 of the Sarbanes-Oxley Act of 2002. |
|
|
|
|
|
101.INS |
|
XBRL Instance Document |
|
|
|
|
|
101.SCH |
|
XBRL Schema Document |
|
|
|
|
|
101.CAL |
|
XBRL Calculation Linkbase Document |
|
|
|
|
|
101.DEF |
|
XBRL Definition Linkbase Document |
|
|
|
|
|
101.LAB |
|
XBRL Labels Linkbase Document |
|
|
|
|
|
101.PRE |
|
XBRL Presentation Linkbase Document |
|
# |
Portions of this exhibit (indicated by asterisks) have been omitted pursuant to a request for confidential treatment granted by the SEC. |
|
+ |
Indicates management contract or compensatory plan. |
83
SIGNATURES
Pursuant to the requirements of Section 13 or 15 (d) of the Securities Exchange Act of 1934, the Registrant has duly caused this report to be signed on its behalf by the undersigned, thereunto duly authorized.
Date: March 9, 2015
|
TRIVASCULAR TECHNOLOGIES, INC. |
||
|
|
|
|
|
By: |
|
/s/ Michael R. Kramer |
|
|
|
Michael R. Kramer |
|
|
|
Chief Financial Officer (Principal Financial Officer and Duly Authorized Officer) |
Power of Attorney
KNOW ALL PERSONS BY THESE PRESENTS, that each person whose signature appears below constitutes and appoints Michael R. Kramer and Kimberley A. Elting, jointly and severally, his or her attorneys-in-fact, each with the power of substitution, for him or her in any and all capacities, to sign any amendments to this Annual Report on Form 10-K, and to file the same, with exhibits thereto and other documents in connection therewith, with the Securities and Exchange Commission, hereby ratifying and confirming all that each of said attorneys-in-fact, or his substitute or substitutes, may do or cause to be done by virtue hereof.
Pursuant to the requirements of the Securities Exchange Act of 1934, this report has been signed below by the following persons on behalf of the registrant and in the capacities on March 9, 2015:
|
Name |
|
Title |
|
|
|
|
|
/s/ Christopher G. Chavez Christopher G. Chavez |
|
President and Chief Executive Officer and Chairman of the Board (Principal Executive Officer) |
|
|
|
|
|
/s/ Michael R. Kramer Michael R. Kramer |
|
Chief Financial Officer (Principal Financial and Accounting Officer) |
|
|
|
|
|
/s/ Ryan D. Drant Ryan D. Drant |
|
Director |
|
|
|
|
|
/s/ Daniel J. Moore Daniel J. Moore |
|
Director |
|
|
|
|
|
/s/ Jake R. Nunn Jake R. Nunn |
|
Director |
|
|
|
|
|
/s/ Douglas A. Roeder Douglas A. Roeder |
|
Director |
|
|
|
|
|
/s/ James P. Scopa James P. Scopa |
|
Director |
|
|
|
|
|
/s/ Robert W. Thomas Robert W. Thomas |
|
Director |
84