Attached files
| file | filename |
|---|---|
| 8-K - 8-K - Great Western Bancorp, Inc. | gwb-20150309x8xkxconf.htm |
| EX-99.2 - EXHIBIT 99.2 - Great Western Bancorp, Inc. | gwb-20150309x8xkxoutlookxe.htm |

Investor Presentation | March 9, 2015

Disclosures Forward-Looking Statements: This presentation contains forward-looking statements within the meaning of the Private Securities Litigation Reform Act of 1995. Statements about our expectations, beliefs, plans, predictions, forecasts, objectives, assumptions or future events or performance are not historical facts and may be forward- looking, including, without limitation, our business outlook and expectations regarding higher total credit-related and OREO charges, our asset quality, our loan and deposit pipeline, loan pricing and yields and our regulatory and compliance readiness. These statements are often, but not always, made through the use of words or phrases such as “anticipates,” “believes,” “can,” “could,” “may,” “predicts,” “potential,” “should,” “will,” “estimate,” “plans,” “projects,” “continuing,” “ongoing,” “expects,” “intends” and similar words or phrases. Accordingly, these statements are only predictions and involve estimates, known and unknown risks, assumptions and uncertainties that could cause actual results to differ materially from those expressed. All forward-looking statements are necessarily only estimates of future results, and there can be no assurance that actual results will not differ materially from expectations, and, therefore, you are cautioned not to place undue reliance on such statements. Any forward-looking statements are qualified in their entirety by reference to the factors discussed in the sections titled “Item 1A. Risk Factors” and “Cautionary Note Regarding Forward-Looking Statements” in our Annual Report on Form 10-K for the fiscal year ended September 30, 2014. Further, any forward-looking statement speaks only as of the date on which it is made, and we undertake no obligation to update any forward-looking statement to reflect events or circumstances after the date on which the statement is made or to reflect the occurrence of unanticipated events. Non-GAAP Financial Measures: This presentation contains non-GAAP measures which our management relies on in making financial and operational decisions about our business and which exclude certain items that we do not consider reflective of our business performance. We believe that the presentation of these measures provides investors with greater transparency and supplemental data relating to our financial condition and results of operations. These non-GAAP measures should be considered in context with our GAAP results. A reconciliation of these non- GAAP measures appears in the appendix to this presentation and in our earnings release dated January 28, 2015. This presentation is available in the Investor Relations section of our website at www.greatwesternbank.com and has been filed as an exhibit to our Current Report on Form 8-K filed with the SEC on March 9, 2015. Explanatory Note: In this presentation, all financial information presented refers to the financial results of Great Western Bancorp, Inc. combined with those of its predecessor, Great Western Bancorporation, Inc.

Presenters Ken Karels President & Chief Executive Officer Peter Chapman Executive VP & Chief Financial Officer David Hinderaker Head of Investor Relations and M&A · Chief Executive Officer of Great Western since 2010 · Previously served as Great Western's COO and Regional President · Prior to joining Great Western in 2002, served as President and CEO at Marquette Bank · 12 years of experience at Great Western and 38 years of industry experience · Chief Financial Officer of Great Western since 2013 · Prior to joining Great Western, held a number of senior finance roles within National Australia Bank and U.S. GAAP experience with E&Y · 11 years of experience at Great Western / National Australia Bank and 20 years of industry experience · Head of Investor Relations and M&A since 2015 · Previously served as Great Western's Head of Business Performance and Strategy · Prior to joining Great Western in 2010, held finance roles in industry and four years in public accounting with Deloitte & Touche · 5 years of experience at Great Western and 10 years of industry experience

About GWB 4 Company Snapshot Stock Performance Demonstrated Earnings Growth Market Presence · Top 20 Midwest bank holding company (1) · Business bank with unique agribusiness expertise · 8th largest farm lender bank in the U.S. as of September 30, 2014 (2) · 163 banking branches across 7 states · Owned by National Australia Bank since 2008 · Current ownership of 68.2% after October 2014 IPO · IPO Price: $18.00 · Price Range: $17.40-23.73 · Avg. Close: $21.20 · Price Increase IPO – Quarter End: 26.6% (1)Source: SNL Financial. Based on bank holding companies with headquarters in the Midwest ranked by total assets as of September 30, 2014. Excludes specialty lenders, insurance companies, trust banks and brokerage and investment banking firms. (2) Source: American Bankers Association. (3) Efficiency ratio is a non-GAAP measure. See appendix for reconciliation. (3)

Executing on Strategy Focused Business Banking Franchise with Agribusiness Expertise · Good growth in CRE and Agribusiness lending during 1QFY15 · Growth being led in Arizona and Colorado but increased lending volumes represent growth in all states across the footprint · New Greeley, Colorado branch opened in December 2014 Strong Profitability and Growth Driven by a Highly Efficient Operating Model · Returns continue to be strong with ROAA of 1.10% and ROTCE(1) of 15.8% for 1QFY15 · Efficiency remains core to profitability with an efficiency ratio(1) of 48.5% · Consolidation of five branches in Omaha, NE and Sioux Falls, SD demonstrates focus on efficiency while a new business banking hub in Omaha, NE is expected to drive revenue growth Risk Management Driving Credit Quality · Asset quality metrics remained strong through 1QFY15, although higher credit-related charges anticipated in 2QFY15 · Nonperforming loans were 0.98% of total loans at December 31, 2014 · OREO balances declined to $43.4 million at December 31, 2014, of which $10.6 million is covered by FDIC loss-sharing arrangements Strong Capital Generation and Attractive Dividend · Tier 1 Capital Ratio of 11.8% and Total Capital Ratio of 12.9% remain strong · Quarterly dividend of $0.12 per share announced January 28, 2015 and paid February 23, 2015 (1) This is a non-GAAP measure. See appendix for reconciliation. 5

Business Outlook Asset Quality · Based on currently available information, expect approximately $15 million of total credit-related charges for 2QFY15 compared to approximately $7 million for 1QFY15, including approximately $1-2 million of OREO charges related to the liquidation of a single significant property · Increase is primarily driven by a small number of C&I lending exposures · Management believes the changes driven by customer-specific developments and that the loans are not concentrated geographically or within a specific industry · Periodic review of grain portfolio completed: higher “Watch” loans but minimal current expected losses Balance Sheet and NIM · Loan and deposit pipelines remain strong across the footprint · Loan pricing and yields remain under pressure primarily driven by continued low benchmark interest rates Efficiency and Costs · Efficiency and expense control continue to be a top priority of management and track positively · Previously announced branch closures remain on schedule for March 31, 2015 Regulatory and Compliance · Internal $10 billion / Dodd-Frank Act Stress Testing (DFAST) readiness is progressing as planned 6

Business Overview

Balance Sheet Overview 8 Balance Sheet Highlights Total Loans (UPB) ($MM) Deposits ($MM) Capital · Loans grew 2.9% during 1QFY15 with growth focused in CRE and agribusiness · Some agribusiness growth expected to be seasonal · Deposits up 2.7% during 1QFY15 led by growth in business and consumer accounts · Continued improvement in cost of deposits · Capital levels remain strong and stable +2.9% FYTD +2.7% FYTD (1) Tangible common equity is a non-GAAP measure. See appendix for reconciliation. (1)
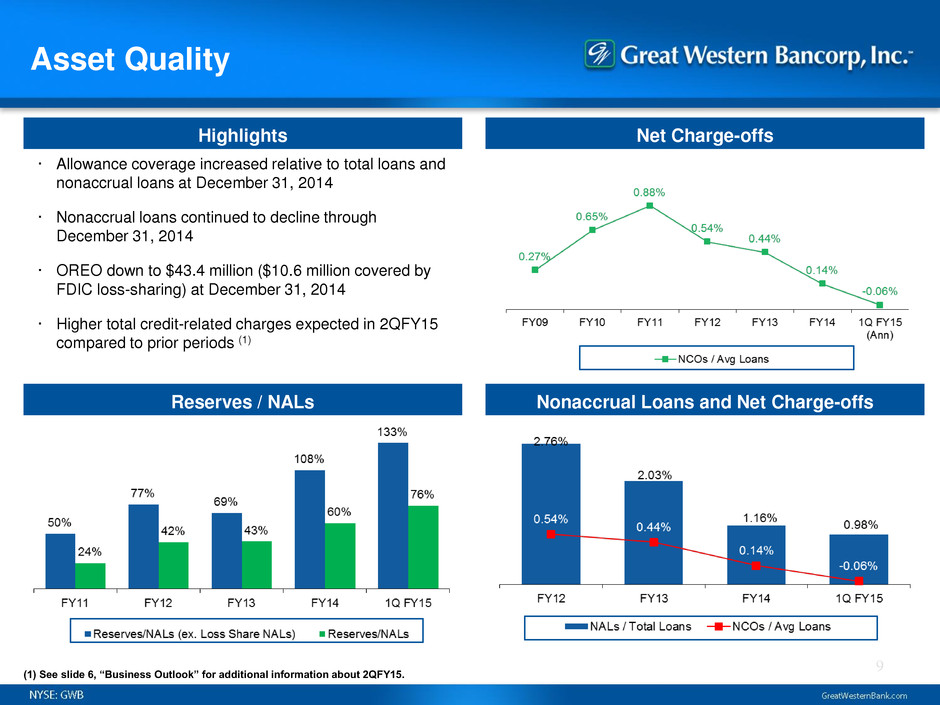
Asset Quality 9 Highlights Net Charge-offs Reserves / NALs Nonaccrual Loans and Net Charge-offs · Allowance coverage increased relative to total loans and nonaccrual loans at December 31, 2014 · Nonaccrual loans continued to decline through December 31, 2014 · OREO down to $43.4 million ($10.6 million covered by FDIC loss-sharing) at December 31, 2014 · Higher total credit-related charges expected in 2QFY15 compared to prior periods (1) (1) See slide 6, “Business Outlook” for additional information about 2QFY15.
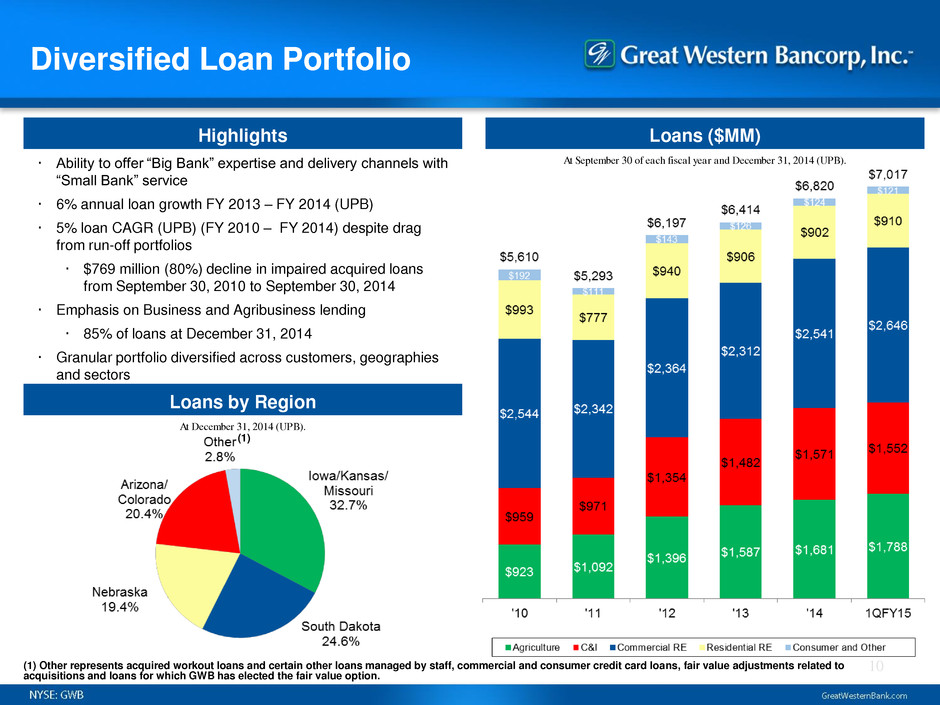
Diversified Loan Portfolio 10 Highlights Loans ($MM) Loans by Region · Ability to offer “Big Bank” expertise and delivery channels with “Small Bank” service · 6% annual loan growth FY 2013 – FY 2014 (UPB) · 5% loan CAGR (UPB) (FY 2010 – FY 2014) despite drag from run-off portfolios · $769 million (80%) decline in impaired acquired loans from September 30, 2010 to September 30, 2014 · Emphasis on Business and Agribusiness lending · 85% of loans at December 31, 2014 · Granular portfolio diversified across customers, geographies and sectors (1) Other represents acquired workout loans and certain other loans managed by staff, commercial and consumer credit card loans, fair value adjustments related to acquisitions and loans for which GWB has elected the fair value option. At December 31, 2014 (UPB). At September 30 of each fiscal year and December 31, 2014 (UPB). (1)
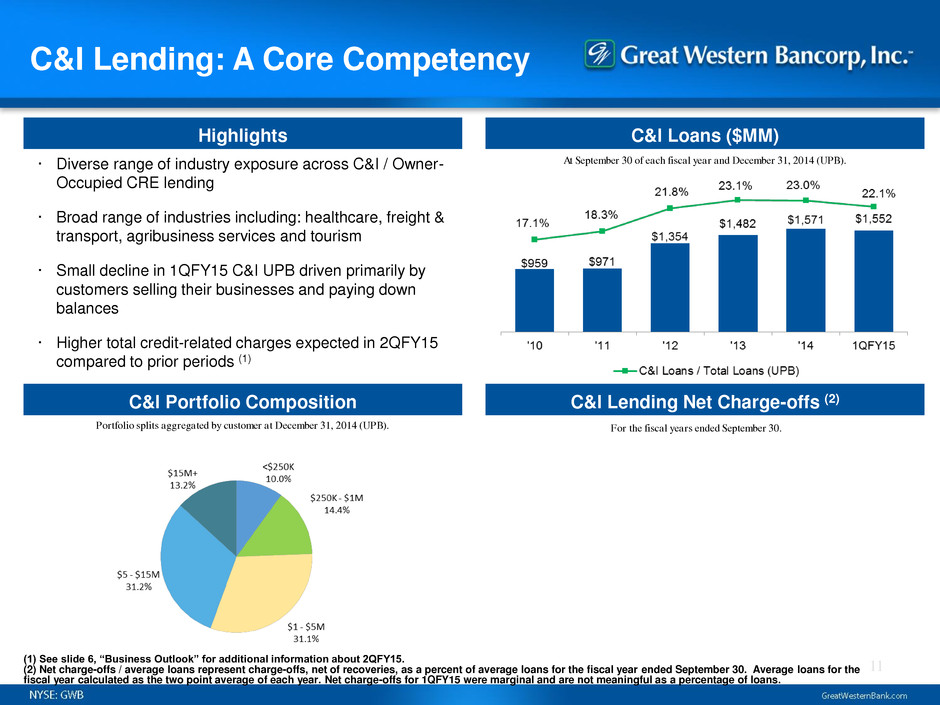
C&I Lending: A Core Competency 11 Highlights C&I Loans ($MM) C&I Portfolio Composition C&I Lending Net Charge-offs (2) · Diverse range of industry exposure across C&I / Owner- Occupied CRE lending · Broad range of industries including: healthcare, freight & transport, agribusiness services and tourism · Small decline in 1QFY15 C&I UPB driven primarily by customers selling their businesses and paying down balances · Higher total credit-related charges expected in 2QFY15 compared to prior periods (1) (1) See slide 6, “Business Outlook” for additional information about 2QFY15. (2) Net charge-offs / average loans represent charge-offs, net of recoveries, as a percent of average loans for the fiscal year ended September 30. Average loans for the fiscal year calculated as the two point average of each year. Net charge-offs for 1QFY15 were marginal and are not meaningful as a percentage of loans. Portfolio splits aggregated by customer at December 31, 2014 (UPB). For the fiscal years ended September 30. At September 30 of each fiscal year and December 31, 2014 (UPB).

Agribusiness Lending Expertise 12 Highlights Agribusiness Loans ($MM) Agribusiness Loan Portfolio by Sector Agribusiness Lending Net Charge-offs (1) · 8th largest farm lender bank in the U.S. as of September 30, 2014 (2) · Balanced exposure across grains and proteins · Limited specialty crop lending · Crop insurance mitigates potential credit losses on grains · Strong 1QFY15 growth driven in part by customers’ tax planning strategies At December 31, 2014 (UPB). For the fiscal years ended September 30. (1) Net charge-offs / average loans represent charge-offs, net of recoveries, as a percent of average loans for the fiscal year ended September 30. Average loans for the fiscal year calculated as the two point average of each year. Net charge-offs for 1QFY15 were marginal and are not meaningful as a percentage of loans. See slide 6, “Business Outlook” for additional information about 2QFY15. (2) Source: American Bankers Association At September 30 of each fiscal year and December 31, 2014 (UPB).
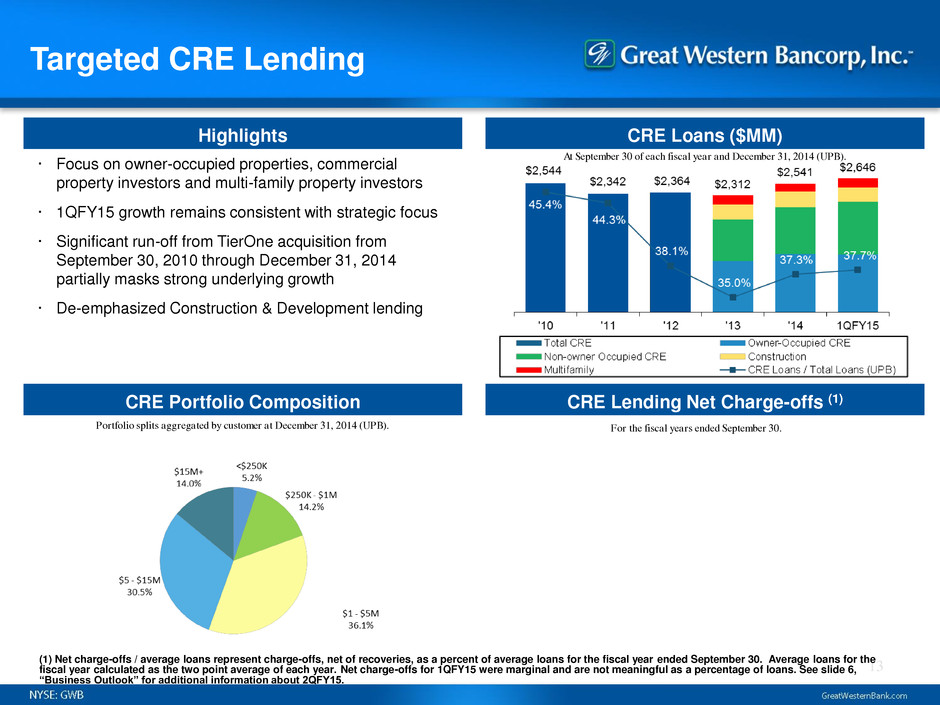
Targeted CRE Lending 13 Highlights CRE Loans ($MM) CRE Portfolio Composition CRE Lending Net Charge-offs (1) · Focus on owner-occupied properties, commercial property investors and multi-family property investors · 1QFY15 growth remains consistent with strategic focus · Significant run-off from TierOne acquisition from September 30, 2010 through December 31, 2014 partially masks strong underlying growth · De-emphasized Construction & Development lending Portfolio splits aggregated by customer at December 31, 2014 (UPB). For the fiscal years ended September 30. (1) Net charge-offs / average loans represent charge-offs, net of recoveries, as a percent of average loans for the fiscal year ended September 30. Average loans for the fiscal year calculated as the two point average of each year. Net charge-offs for 1QFY15 were marginal and are not meaningful as a percentage of loans. See slide 6, “Business Outlook” for additional information about 2QFY15. At September 30 of each fiscal year and December 31, 2014 (UPB).
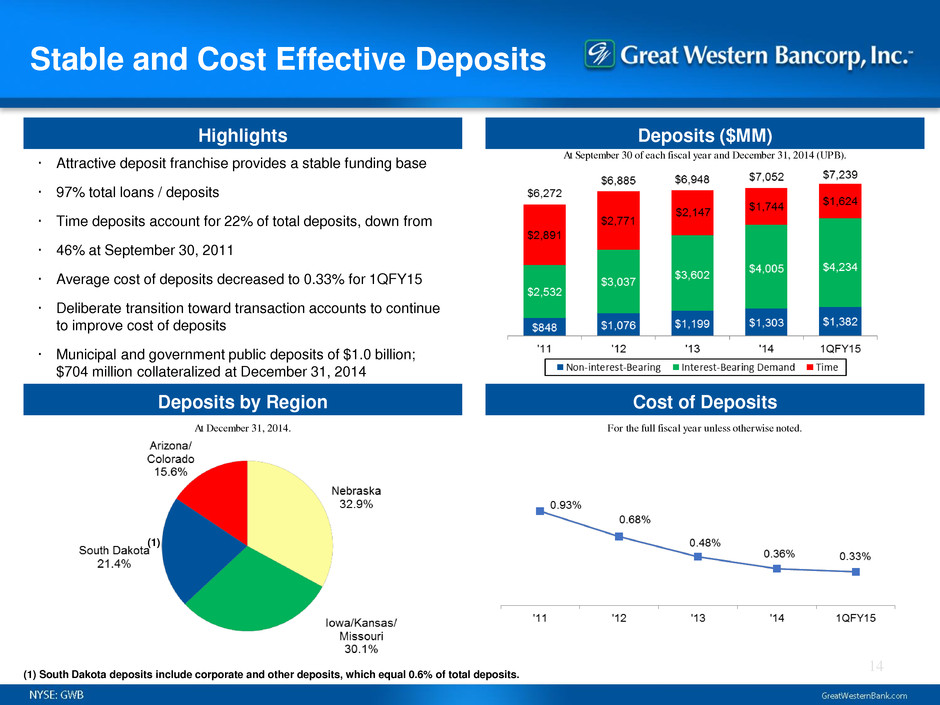
Stable and Cost Effective Deposits 14 Highlights Deposits ($MM) Deposits by Region Cost of Deposits · Attractive deposit franchise provides a stable funding base · 97% total loans / deposits · Time deposits account for 22% of total deposits, down from · 46% at September 30, 2011 · Average cost of deposits decreased to 0.33% for 1QFY15 · Deliberate transition toward transaction accounts to continue to improve cost of deposits · Municipal and government public deposits of $1.0 billion; $704 million collateralized at December 31, 2014 (1) South Dakota deposits include corporate and other deposits, which equal 0.6% of total deposits. At December 31, 2014. For the full fiscal year unless otherwise noted. (1) At September 30 of each fiscal year and December 31, 2014 (UPB).
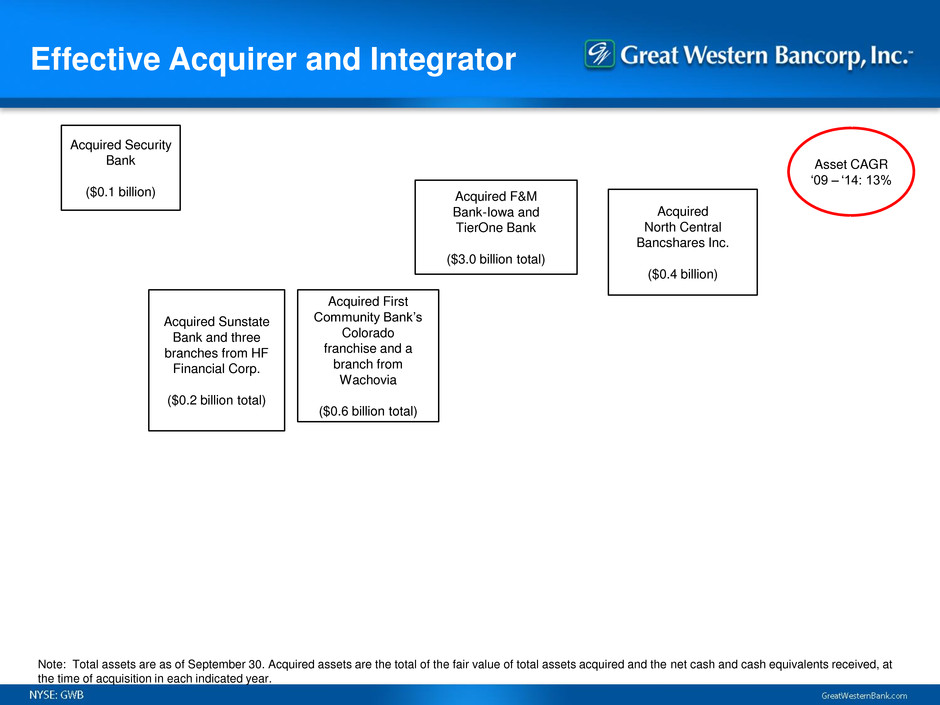
Effective Acquirer and Integrator Acquired Security Bank ($0.1 billion) Acquired Sunstate Bank and three branches from HF Financial Corp. ($0.2 billion total) Acquired First Community Bank’s Colorado franchise and a branch from Wachovia ($0.6 billion total) Acquired F&M Bank-Iowa and TierOne Bank ($3.0 billion total) Acquired North Central Bancshares Inc. ($0.4 billion) Asset CAGR ‘09 – ‘14: 13% Note: Total assets are as of September 30. Acquired assets are the total of the fair value of total assets acquired and the net cash and cash equivalents received, at the time of acquisition in each indicated year.
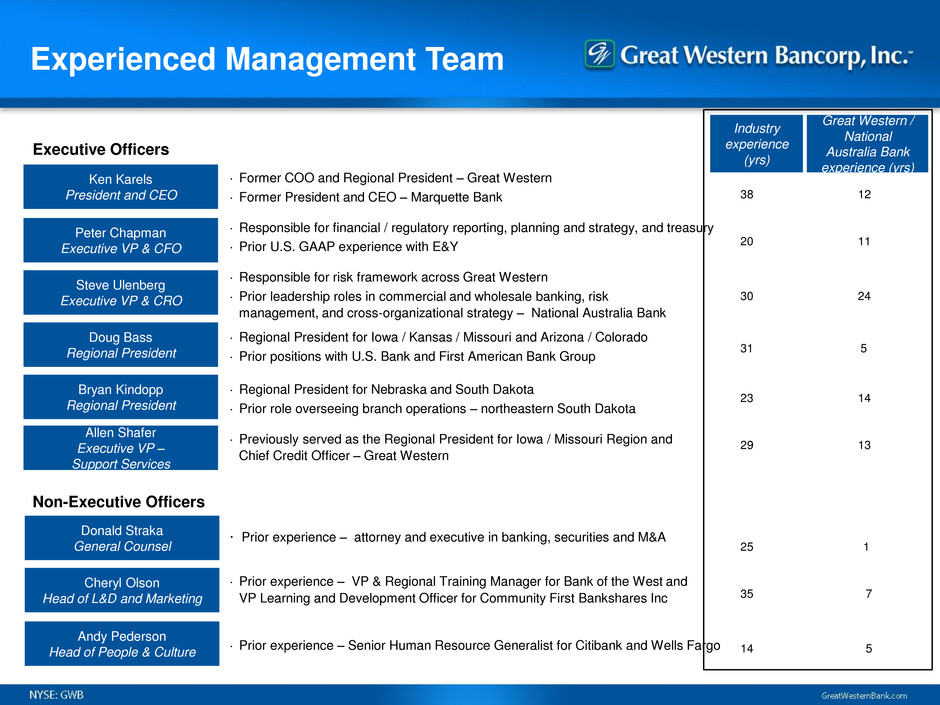
Experienced Management Team Cheryl Olson Head of L&D and Marketing Ken Karels President and CEO Doug Bass Regional President Bryan Kindopp Regional President Peter Chapman Executive VP & CFO Andy Pederson Head of People & Culture Allen Shafer Executive VP – Support Services Steve Ulenberg Executive VP & CRO Donald Straka General Counsel · Former COO and Regional President – Great Western · Former President and CEO – Marquette Bank · Responsible for financial / regulatory reporting, planning and strategy, and treasury · Prior U.S. GAAP experience with E&Y · Responsible for risk framework across Great Western · Prior leadership roles in commercial and wholesale banking, risk management, and cross-organizational strategy – National Australia Bank · Regional President for Iowa / Kansas / Missouri and Arizona / Colorado · Prior positions with U.S. Bank and First American Bank Group · Regional President for Nebraska and South Dakota · Prior role overseeing branch operations – northeastern South Dakota · Previously served as the Regional President for Iowa / Missouri Region and Chief Credit Officer – Great Western · Prior experience – attorney and executive in banking, securities and M&A · Prior experience – VP & Regional Training Manager for Bank of the West and VP Learning and Development Officer for Community First Bankshares Inc · Prior experience – Senior Human Resource Generalist for Citibank and Wells Fargo Executive Officers Non-Executive Officers Industry experience (yrs) Great Western / National Australia Bank experience (yrs) 38 12 20 11 30 24 31 5 23 14 29 13 25 1 35 7 14 5
Financial Highlights

(1)Chart excludes changes related to loans and derivatives at fair value which netted $(7.5) million for the quarter. Dollars in thousands. (2) Adjusted NIM (FTE) is a non-GAAP measure. See appendix for reconciliations. Revenue 18 Revenue Highlights Net Interest Income ($MM) and NIM NIM Analysis Noninterest Income (1) · Net interest income (FTE) increased by $3.2 million compared to 1QFY14 on balance sheet growth, improved cost of deposits and loan mix · NIM (FTE) down but exacerbated by one-offs in current and prior quarter, including 9 bps from IPO proceeds on deposit · Loan pricing competition continues, partially offset by deposit pricing improvement · Core noninterest revenue streams remained consistent (2)

Expenses, Provision & Earnings 19 Highlights Provision for Loan Losses ($MM) (2) Noninterest Expense ($MM) Net Income ($MM) · Provision for loan losses $4.2 million higher in 1QFY15 than comparable period in FY14, which was abnormally low · Total noninterest expenses decreased in 1QFY15, led by lower amortization of intangible assets, partially offset by higher net OREO expenses and professional fees · Expenses remain well managed with quarterly efficiency ratio(1) of 48.5% for 1QFY15 · ROAA above 1.00% for 1QFY15 Stable Expense Base and Efficiency Despite Growth and Complexity OREO Charge Abnormally Low in Comparable Quarter (1) Efficiency ratio is a non-GAAP measure. See appendix for reconciliation. (2) Higher provision for loan losses is expected in 2QFY15. See slide 6, “Business Outlook” for additional information. (1)
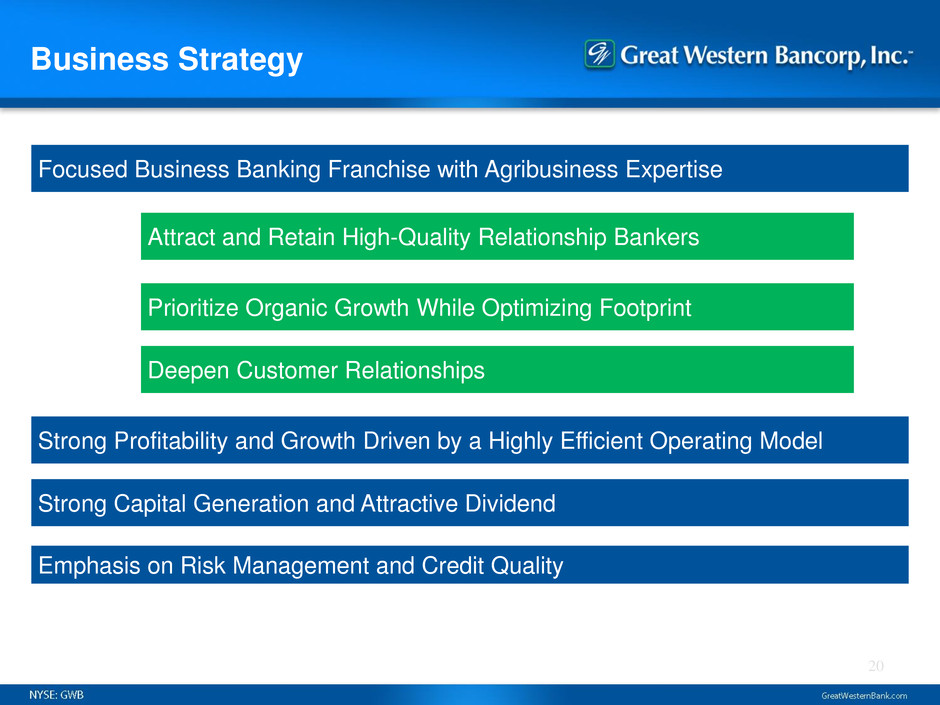
Business Strategy 20 Focused Business Banking Franchise with Agribusiness Expertise Emphasis on Risk Management and Credit Quality Attract and Retain High-Quality Relationship Bankers Prioritize Organic Growth While Optimizing Footprint Deepen Customer Relationships Strong Profitability and Growth Driven by a Highly Efficient Operating Model Strong Capital Generation and Attractive Dividend
Appendix

Non-GAAP Measures 22

Non-GAAP Measures 23
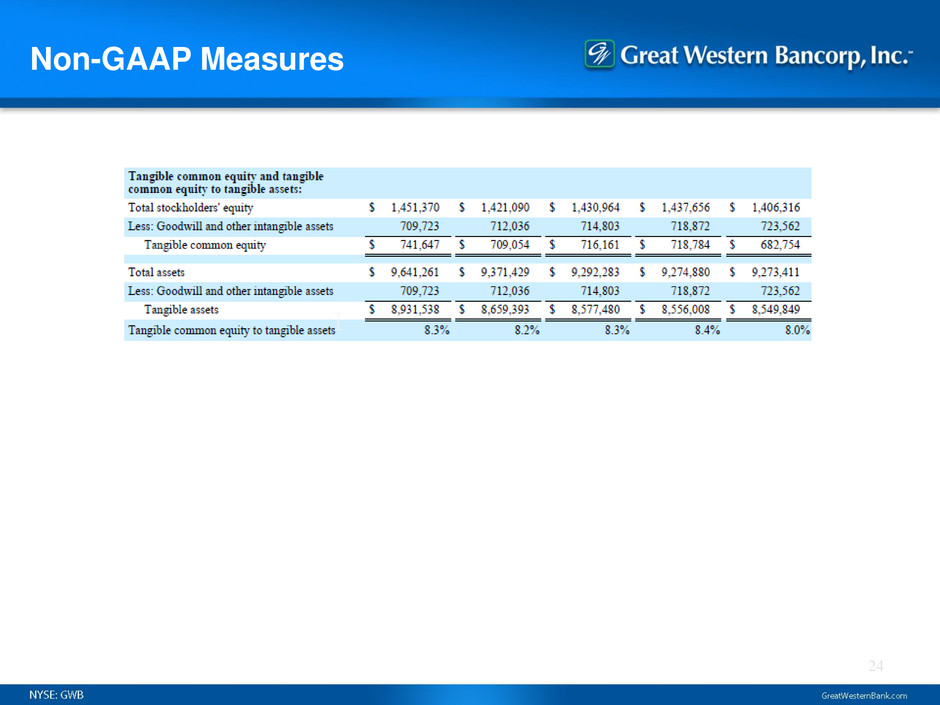
Non-GAAP Measures 24
