Attached files
| file | filename |
|---|---|
| 8-K - 8-K - Wheeler Real Estate Investment Trust, Inc. | q4resultsofoperations8-k.htm |
| EX-99.1 - WHLR Q4 RESULTS - Wheeler Real Estate Investment Trust, Inc. | whlr_q4-2014resultsxfinal.htm |
Exhibit 99.2 Supplemental Operating and Financial Data for the year ended December 31, 2014
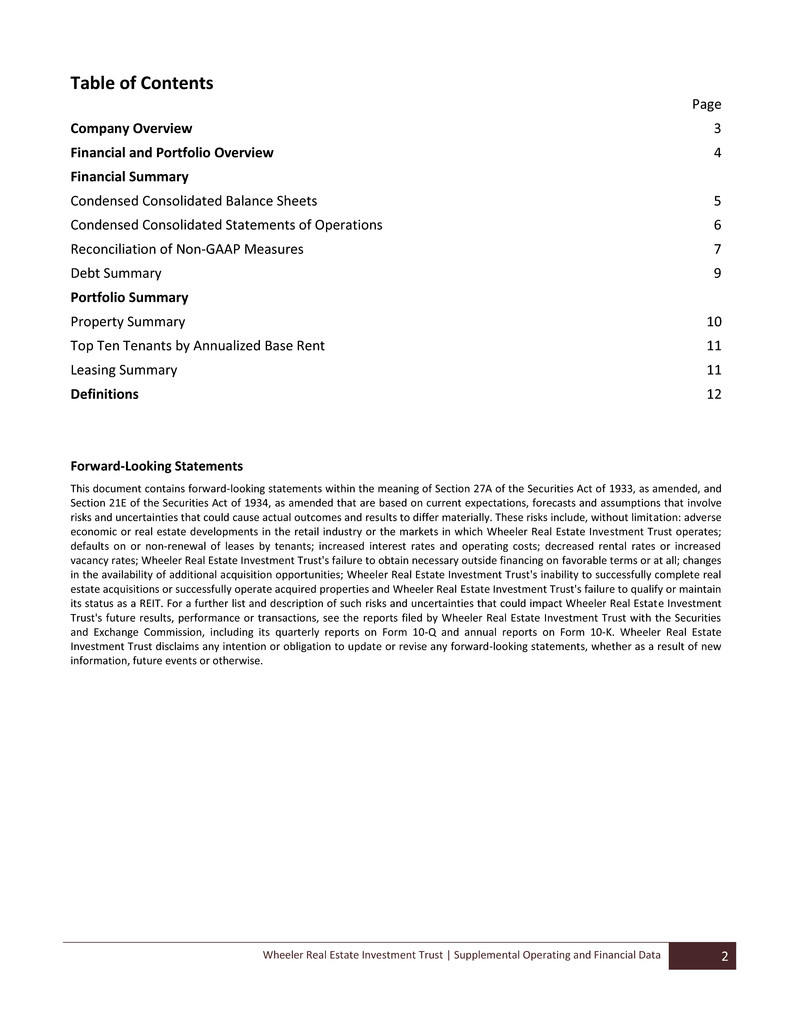
Wheeler Real Estate Investment Trust | Supplemental Operating and Financial Data 2 Table of Contents Page Company Overview 3 Financial and Portfolio Overview 4 Financial Summary Condensed Consolidated Balance Sheets 5 Condensed Consolidated Statements of Operations 6 Reconciliation of Non-GAAP Measures 7 Debt Summary 9 Portfolio Summary Property Summary 10 Top Ten Tenants by Annualized Base Rent 11 Leasing Summary 11 Definitions 12 Forward-Looking Statements This document contains forward-looking statements within the meaning of Section 27A of the Securities Act of 1933, as amended, and Section 21E of the Securities Act of 1934, as amended that are based on current expectations, forecasts and assumptions that involve risks and uncertainties that could cause actual outcomes and results to differ materially. These risks include, without limitation: adverse economic or real estate developments in the retail industry or the markets in which Wheeler Real Estate Investment Trust operates; defaults on or non-renewal of leases by tenants; increased interest rates and operating costs; decreased rental rates or increased vacancy rates; Wheeler Real Estate Investment Trust's failure to obtain necessary outside financing on favorable terms or at all; changes in the availability of additional acquisition opportunities; Wheeler Real Estate Investment Trust's inability to successfully complete real estate acquisitions or successfully operate acquired properties and Wheeler Real Estate Investment Trust's failure to qualify or maintain its status as a REIT. For a further list and description of such risks and uncertainties that could impact Wheeler Real Estate Investment Trust's future results, performance or transactions, see the reports filed by Wheeler Real Estate Investment Trust with the Securities and Exchange Commission, including its quarterly reports on Form 10-Q and annual reports on Form 10-K. Wheeler Real Estate Investment Trust disclaims any intention or obligation to update or revise any forward-looking statements, whether as a result of new information, future events or otherwise.
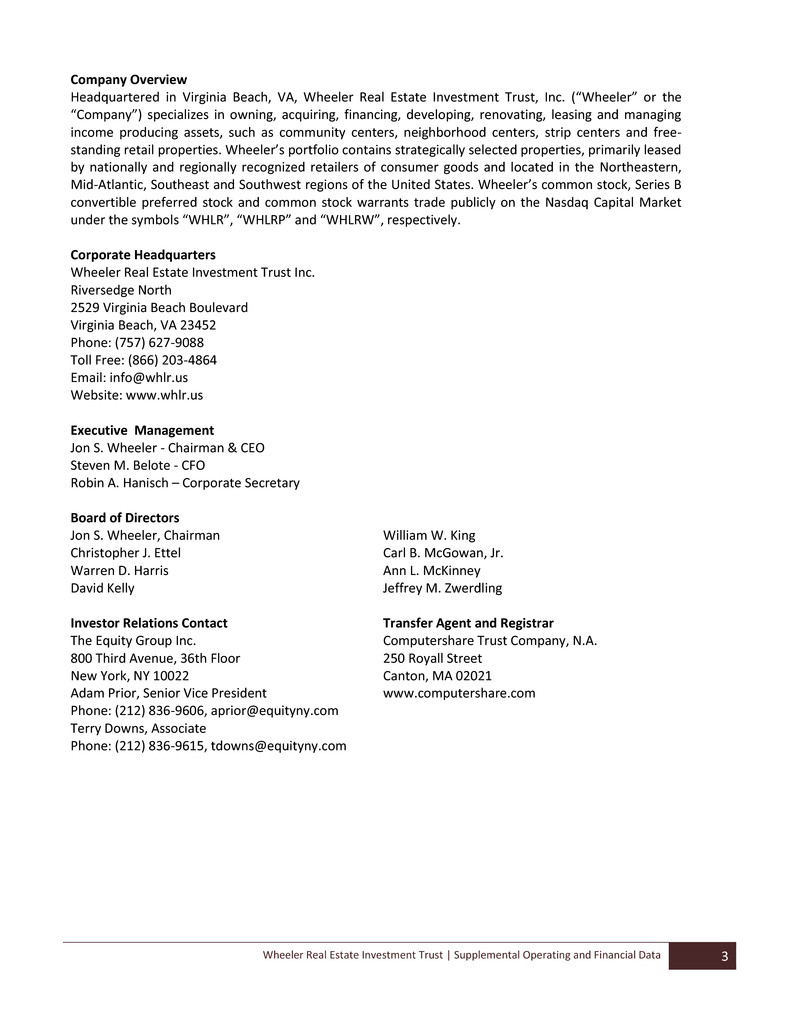
Wheeler Real Estate Investment Trust | Supplemental Operating and Financial Data 3 Company Overview Headquartered in Virginia Beach, VA, Wheeler Real Estate Investment Trust, Inc. (“Wheeler” or the “Company”) specializes in owning, acquiring, financing, developing, renovating, leasing and managing income producing assets, such as community centers, neighborhood centers, strip centers and free- standing retail properties. Wheeler’s portfolio contains strategically selected properties, primarily leased by nationally and regionally recognized retailers of consumer goods and located in the Northeastern, Mid-Atlantic, Southeast and Southwest regions of the United States. Wheeler’s common stock, Series B convertible preferred stock and common stock warrants trade publicly on the Nasdaq Capital Market under the symbols “WHLR”, “WHLRP” and “WHLRW”, respectively. Corporate Headquarters Wheeler Real Estate Investment Trust Inc. Riversedge North 2529 Virginia Beach Boulevard Virginia Beach, VA 23452 Phone: (757) 627-9088 Toll Free: (866) 203-4864 Email: info@whlr.us Website: www.whlr.us Executive Management Jon S. Wheeler - Chairman & CEO Steven M. Belote - CFO Robin A. Hanisch – Corporate Secretary Board of Directors Jon S. Wheeler, Chairman William W. King Christopher J. Ettel Carl B. McGowan, Jr. Warren D. Harris Ann L. McKinney David Kelly Jeffrey M. Zwerdling Investor Relations Contact Transfer Agent and Registrar The Equity Group Inc. 800 Third Avenue, 36th Floor New York, NY 10022 Adam Prior, Senior Vice President Phone: (212) 836-9606, aprior@equityny.com Terry Downs, Associate Phone: (212) 836-9615, tdowns@equityny.com Computershare Trust Company, N.A. 250 Royall Street Canton, MA 02021 www.computershare.com
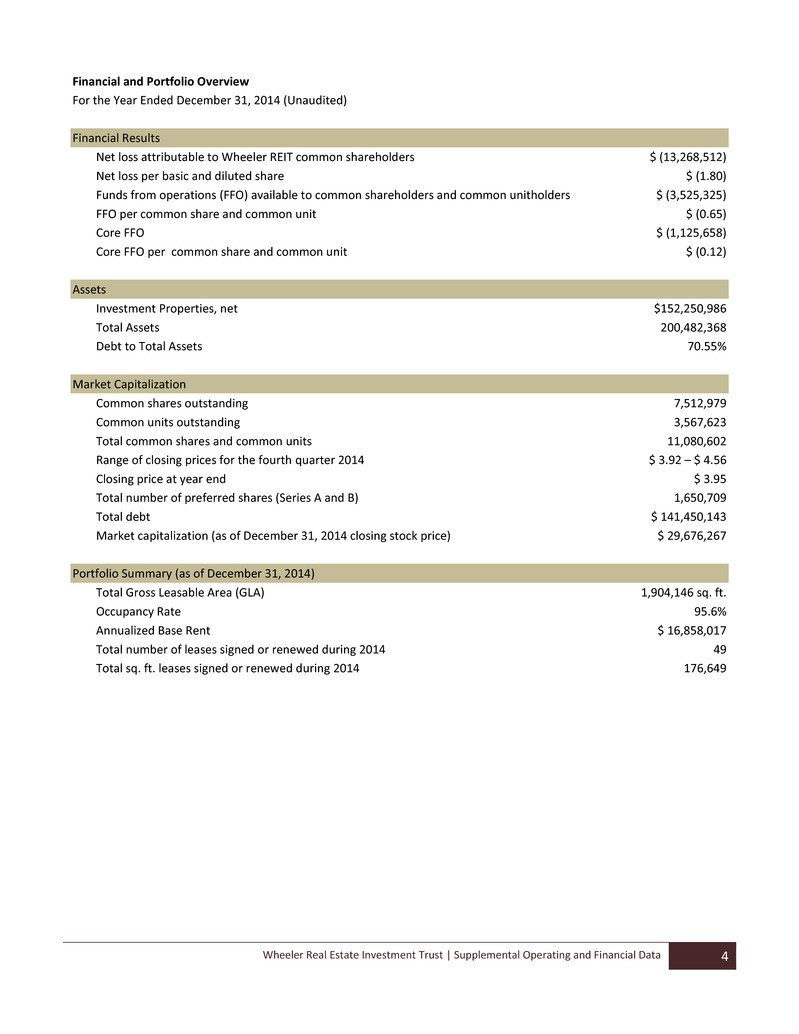
Wheeler Real Estate Investment Trust | Supplemental Operating and Financial Data 4 Financial and Portfolio Overview For the Year Ended December 31, 2014 (Unaudited) Financial Results Net loss attributable to Wheeler REIT common shareholders $ (13,268,512) Net loss per basic and diluted share $ (1.80) Funds from operations (FFO) available to common shareholders and common unitholders $ (3,525,325) FFO per common share and common unit $ (0.65) Core FFO $ (1,125,658) Core FFO per common share and common unit $ (0.12) Assets Investment Properties, net $152,250,986 Total Assets 200,482,368 Debt to Total Assets 70.55% Market Capitalization Common shares outstanding 7,512,979 Common units outstanding 3,567,623 Total common shares and common units 11,080,602 Range of closing prices for the fourth quarter 2014 $ 3.92 – $ 4.56 Closing price at year end $ 3.95 Total number of preferred shares (Series A and B) 1,650,709 Total debt $ 141,450,143 Market capitalization (as of December 31, 2014 closing stock price) $ 29,676,267 Portfolio Summary (as of December 31, 2014) Total Gross Leasable Area (GLA) 1,904,146 sq. ft. Occupancy Rate 95.6% Annualized Base Rent $ 16,858,017 Total number of leases signed or renewed during 2014 49 Total sq. ft. leases signed or renewed during 2014 176,649

Wheeler Real Estate Investment Trust | Supplemental Operating and Financial Data 5 Wheeler Real Estate Investment Trust, Inc. and Subsidiaries Condensed Consolidated Balance Sheets December 31, 2014 December 31, 2013 ASSETS: (Unaudited) Investment properties, net $ 152,250,986 $ 101,772,335 Cash and cash equivalents 9,969,748 1,155,083 Rents and other tenant receivables, net 1,985,466 1,594,864 Goodwill 7,004,072 — Deferred costs and other assets, net 29,272,096 20,847,984 Total Assets $ 200,482,368 $ 125,370,266 LIABILITIES: Loans payable $ 141,450,143 $ 94,562,503 Below market lease intangible, net 778,173 2,674,566 Accounts payable, accrued expenses and other liabilities 5,130,625 2,526,388 Total Liabilities 147,358,941 99,763,457 Commitments and contingencies — — EQUITY: Series A preferred stock (no par value, 4,500 shares authorized, 1,809 issued and outstanding, respectively) 1,458,050 1,458,050 Series B preferred stock (no par value, 3,000,000 shares authorized, 1,648,900 and no shares issued and outstanding, respectively) 37,620,254 — Common stock ($0.01 par value, 75,000,000 shares authorized, 7,512,979 and 7,121,000 shares issued and outstanding, respectively) 75,129 71,210 Additional paid-in capital 31,077,060 28,169,693 Accumulated deficit (27,660,234 ) (11,298,253 ) Total Shareholders’ Equity 42,570,259 18,400,700 Noncontrolling interests 10,553,168 7,206,109 Total Equity 53,123,427 25,606,809 Total Liabilities and Equity $ 200,482,368 $ 125,370,266
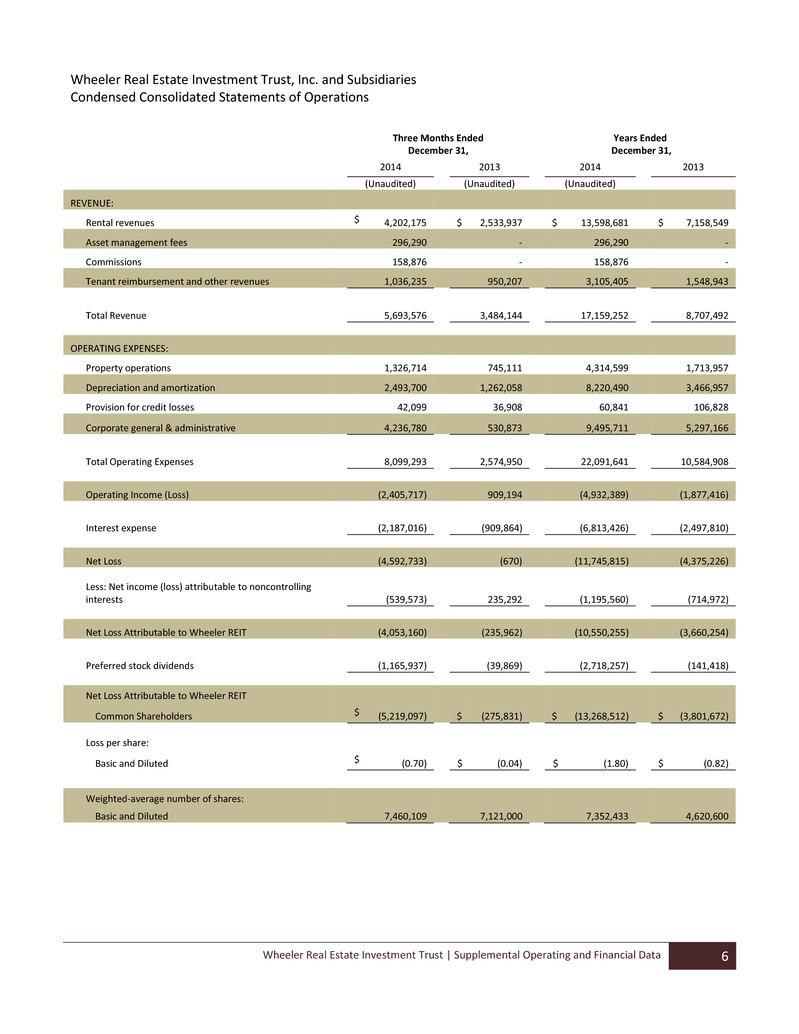
Wheeler Real Estate Investment Trust | Supplemental Operating and Financial Data 6 Wheeler Real Estate Investment Trust, Inc. and Subsidiaries Condensed Consolidated Statements of Operations Three Months Ended December 31, Years Ended December 31, 2014 2013 2014 2013 (Unaudited) (Unaudited) (Unaudited) REVENUE: Rental revenues $ 4,202,175 $ 2,533,937 $ 13,598,681 $ 7,158,549 Asset management fees 296,290 - 296,290 - Commissions 158,876 - 158,876 - Tenant reimbursement and other revenues 1,036,235 950,207 3,105,405 1,548,943 Total Revenue 5,693,576 3,484,144 17,159,252 8,707,492 OPERATING EXPENSES: Property operations 1,326,714 745,111 4,314,599 1,713,957 Depreciation and amortization 2,493,700 1,262,058 8,220,490 3,466,957 Provision for credit losses 42,099 36,908 60,841 106,828 Corporate general & administrative 4,236,780 530,873 9,495,711 5,297,166 Total Operating Expenses 8,099,293 2,574,950 22,091,641 10,584,908 Operating Income (Loss) (2,405,717) 909,194 (4,932,389) (1,877,416) Interest expense (2,187,016) (909,864) (6,813,426) (2,497,810) Net Loss (4,592,733) (670) (11,745,815) (4,375,226) Less: Net income (loss) attributable to noncontrolling interests (539,573) 235,292 (1,195,560) (714,972) Net Loss Attributable to Wheeler REIT (4,053,160) (235,962) (10,550,255) (3,660,254) Preferred stock dividends (1,165,937) (39,869) (2,718,257) (141,418) Net Loss Attributable to Wheeler REIT Common Shareholders $ (5,219,097) $ (275,831) $ (13,268,512) $ (3,801,672) Loss per share: Basic and Diluted $ (0.70) $ (0.04) $ (1.80) $ (0.82) Weighted-average number of shares: Basic and Diluted 7,460,109 7,121,000 7,352,433 4,620,600
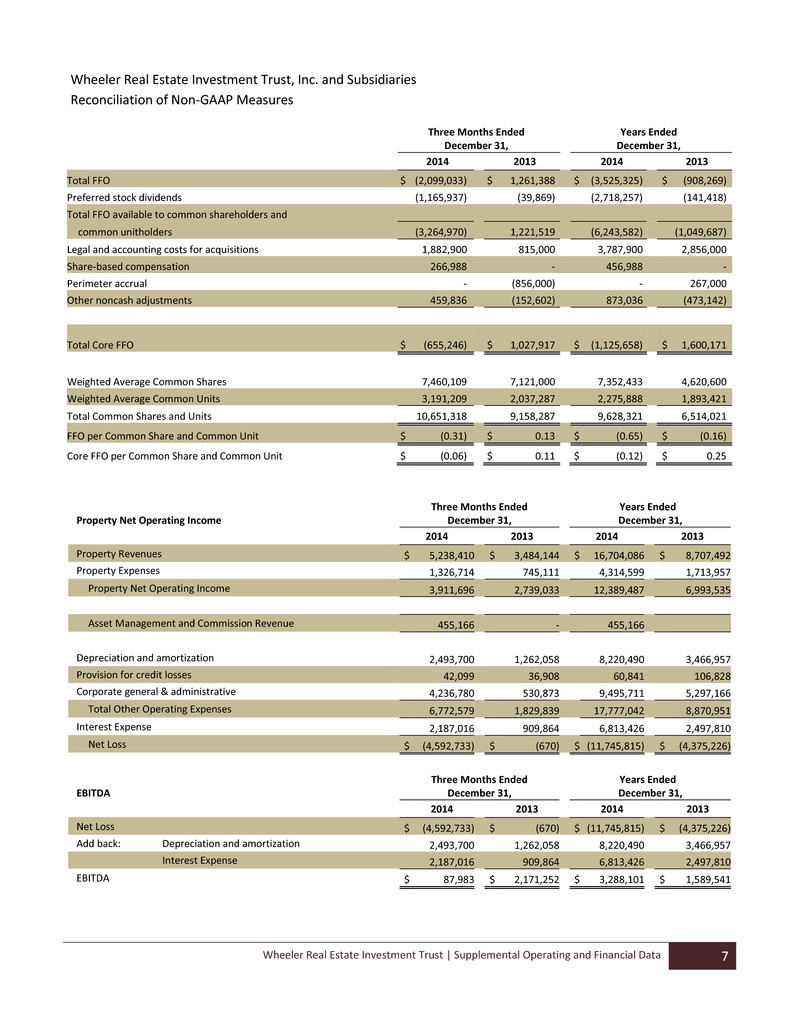
Wheeler Real Estate Investment Trust | Supplemental Operating and Financial Data 7 Wheeler Real Estate Investment Trust, Inc. and Subsidiaries Reconciliation of Non-GAAP Measures Three Months Ended December 31, Years Ended December 31, 2014 2013 2014 2013 Total FFO $ (2,099,033) $ 1,261,388 $ (3,525,325) $ (908,269) Preferred stock dividends (1,165,937) (39,869) (2,718,257) (141,418) Total FFO available to common shareholders and common unitholders (3,264,970) 1,221,519 (6,243,582) (1,049,687) Legal and accounting costs for acquisitions 1,882,900 815,000 3,787,900 2,856,000 Share-based compensation 266,988 - 456,988 - Perimeter accrual - (856,000) - 267,000 Other noncash adjustments 459,836 (152,602) 873,036 (473,142) Total Core FFO $ (655,246) $ 1,027,917 $ (1,125,658) $ 1,600,171 Weighted Average Common Shares 7,460,109 7,121,000 7,352,433 4,620,600 Weighted Average Common Units 3,191,209 2,037,287 2,275,888 1,893,421 Total Common Shares and Units 10,651,318 9,158,287 9,628,321 6,514,021 FFO per Common Share and Common Unit $ (0.31) $ 0.13 $ (0.65) $ (0.16) Core FFO per Common Share and Common Unit $ (0.06) $ 0.11 $ (0.12) $ 0.25 Property Net Operating Income Three Months Ended December 31, Years Ended December 31, 2014 2013 2014 2013 Property Revenues $ 5,238,410 $ 3,484,144 $ 16,704,086 $ 8,707,492 Property Expenses 1,326,714 745,111 4,314,599 1,713,957 Property Net Operating Income 3,911,696 2,739,033 12,389,487 6,993,535 Asset Management and Commission Revenue 455,166 - 455,166 Depreciation and amortization 2,493,700 1,262,058 8,220,490 3,466,957 Provision for credit losses 42,099 36,908 60,841 106,828 Corporate general & administrative 4,236,780 530,873 9,495,711 5,297,166 Total Other Operating Expenses 6,772,579 1,829,839 17,777,042 8,870,951 Interest Expense 2,187,016 909,864 6,813,426 2,497,810 Net Loss $ (4,592,733) $ (670) $ (11,745,815) $ (4,375,226) EBITDA Three Months Ended December 31, Years Ended December 31, 2014 2013 2014 2013 Net Loss $ (4,592,733) $ (670) $ (11,745,815) $ (4,375,226) Add back: Depreciation and amortization 2,493,700 1,262,058 8,220,490 3,466,957 Interest Expense 2,187,016 909,864 6,813,426 2,497,810 EBITDA $ 87,983 $ 2,171,252 $ 3,288,101 $ 1,589,541

Wheeler Real Estate Investment Trust | Supplemental Operating and Financial Data 8 The following unaudited pro forma financial information sets forth the estimated normalized corporate general and administrative expense for the Company as if the property management, leasing and acquisition functions were internalized for all of 2014. Normalized general and administrative expenses exclude costs associated with acquisitions, capital raising activities, amounts previously paid to the operating companies for management services, inter-company transactions and certain non-cash transactions. Additionally, the estimated salaries and compensation expenses associated with the property management and leasing functions for the Company and third party properties that, going forward, will be allocated to these areas have been eliminated. The third party management and leasing function will generate fees and commissions to offset a portion of these costs. The unaudited pro forma financial information is presented for illustrative purposes only and is not necessarily indicative of what the actual general and administrative expenses would have been had the management internalization occurred on or before January 1, 2014, nor does it purport to represent the future general and administrative expenses of the Company. Three Months ended December 31, 2014 Wheeler REIT(1) Internalized Operating Companies (2) Consolidated Total Eliminations / Adjustments Consolidated Subtotal Non-Cash & Acquisition / Capital Related Costs Normalized Consolidation Total Acquisition costs $ 1,882,900 $ - $ 1,882,900 $ (1,152,100) (3) $ 730,800 $ (730,800) (7) $ - Professional fees 441,800 56,800 498,600 - 498,600 (292,600) (8) 206,000 Salaries and compensation 1,292,100 417,400 1,709,500 (914,300) (4) 795,200 (185,600) (9) 609,600 Corporate administration 183,000 7,200 190,200 (47,100) (5) 143,100 - 143,100 REIT administration fees 68,000 - 68,000 (68,000) (6) - - - Travel 273,300 - 273,300 - 273,300 - 273,300 Advertising 74,400 400 74,800 - 74,800 - 74,800 Taxes and Licenses 21,300 2,600 23,900 - 23,900 - 23,900 Total $ 4,236,800 $ 484,400 $ 4,721,200 $ (2,181,500) $ 2,539,700 $ (1,209,000) $ 1,330,700 Year End ended December 31, 2014 Wheeler REIT(1) Internalized Operating Companies (2) Consolidated Total Eliminations / Adjustments Consolidated Subtotal Non-Cash & Acquisition / Capital Related Costs Normalized Consolidation Total Acquisition costs $ 3,787,900 $ - $ 3,787,900 $ (2,733,200) (3) $ 1,054,700 $ (1,054,700) (7) $ - Professional fees 2,259,300 101,200 2,360,500 - 2,360,500 (697,800) (8) 1,662,700 Salaries and compensation 1,326,400 3,117,200 4,443,600 (2,554,800) (4) 1,888,800 (185,600) (9) 1,703,200 Corporate administration 659,100 824,900 1,484,000 (605,100) (5) 878,900 (100,000) (9) 778,900 REIT administration fees 586,200 - 586,200 (586,200) (6) - - - Travel 542,900 72,600 615,500 - 615,500 - 615,500 Advertising 184,200 10,000 194,200 - 194,200 - 194,200 Taxes and Licenses 149,700 18,600 168,300 - 168,300 - 168,300 Total $ 9,495,700 $ 4,144,500 $ 13,640,200 $ (6,479,300) $ 7,160,900 $ (2,038,100) $ 5,122,800 1. Represents the Company's actual general and administrative expense for the period. 2. Represents actual general and administrative expense of the operating companies for the related period prior to the October 2014 internalization. 3. Represents acquisition fees paid to Wheeler Interests. 4. Represents estimated property management and leasing costs allocated to property operations expenses. Going forward, these costs will be allocated to the Company's property operations and its third-party leasing and management function which generates fees and commissions that will offset a portion of these costs. 5. Represents Riversedge office rent paid by Wheeler Interests and non-recurring WHLR Management expenses. 6. Represents administrative services fees paid WHLR Management for managing the Company. 7. Represents other direct acquisition expenses. 8. Represents other indirect acquisition/capital sourcing expenses and non-cash items included in other professional fees. 9. Represents non-cash stock-based compensation.
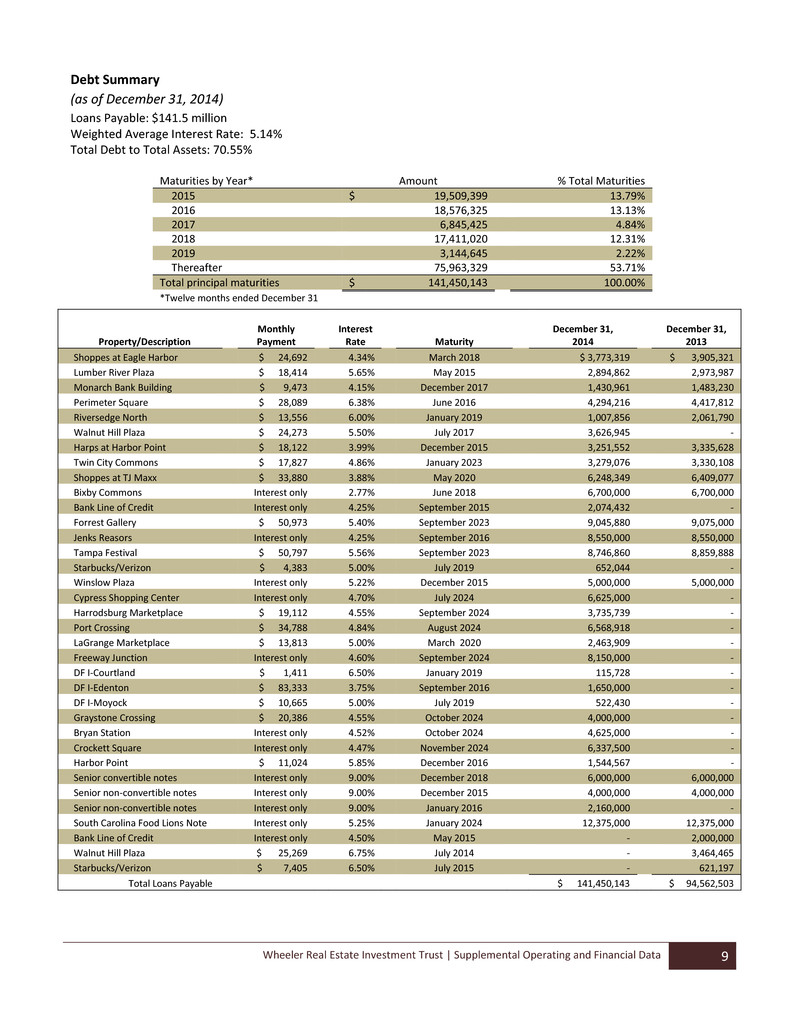
Wheeler Real Estate Investment Trust | Supplemental Operating and Financial Data 9 Debt Summary (as of December 31, 2014) Loans Payable: $141.5 million Weighted Average Interest Rate: 5.14% Total Debt to Total Assets: 70.55% Maturities by Year* Amount % Total Maturities 2015 $ 19,509,399 13.79% 2016 18,576,325 13.13% 2017 6,845,425 4.84% 2018 17,411,020 12.31% 2019 3,144,645 2.22% Thereafter 75,963,329 53.71% Total principal maturities $ 141,450,143 100.00% *Twelve months ended December 31 Monthly Interest December 31, December 31, Property/Description Payment Rate Maturity 2014 2013 Shoppes at Eagle Harbor $ 24,692 4.34% March 2018 $ 3,773,319 $ 3,905,321 Lumber River Plaza $ 18,414 5.65% May 2015 2,894,862 2,973,987 Monarch Bank Building $ 9,473 4.15% December 2017 1,430,961 1,483,230 Perimeter Square $ 28,089 6.38% June 2016 4,294,216 4,417,812 Riversedge North $ 13,556 6.00% January 2019 1,007,856 2,061,790 Walnut Hill Plaza $ 24,273 5.50% July 2017 3,626,945 - Harps at Harbor Point $ 18,122 3.99% December 2015 3,251,552 3,335,628 Twin City Commons $ 17,827 4.86% January 2023 3,279,076 3,330,108 Shoppes at TJ Maxx $ 33,880 3.88% May 2020 6,248,349 6,409,077 Bixby Commons Interest only 2.77% June 2018 6,700,000 6,700,000 Bank Line of Credit Interest only 4.25% September 2015 2,074,432 - Forrest Gallery $ 50,973 5.40% September 2023 9,045,880 9,075,000 Jenks Reasors Interest only 4.25% September 2016 8,550,000 8,550,000 Tampa Festival $ 50,797 5.56% September 2023 8,746,860 8,859,888 Starbucks/Verizon $ 4,383 5.00% July 2019 652,044 - Winslow Plaza Interest only 5.22% December 2015 5,000,000 5,000,000 Cypress Shopping Center Interest only 4.70% July 2024 6,625,000 - Harrodsburg Marketplace $ 19,112 4.55% September 2024 3,735,739 - Port Crossing $ 34,788 4.84% August 2024 6,568,918 - LaGrange Marketplace $ 13,813 5.00% March 2020 2,463,909 - Freeway Junction Interest only 4.60% September 2024 8,150,000 - DF I-Courtland $ 1,411 6.50% January 2019 115,728 - DF I-Edenton $ 83,333 3.75% September 2016 1,650,000 - DF I-Moyock $ 10,665 5.00% July 2019 522,430 - Graystone Crossing $ 20,386 4.55% October 2024 4,000,000 - Bryan Station Interest only 4.52% October 2024 4,625,000 - Crockett Square Interest only 4.47% November 2024 6,337,500 - Harbor Point $ 11,024 5.85% December 2016 1,544,567 - Senior convertible notes Interest only 9.00% December 2018 6,000,000 6,000,000 Senior non-convertible notes Interest only 9.00% December 2015 4,000,000 4,000,000 Senior non-convertible notes Interest only 9.00% January 2016 2,160,000 - South Carolina Food Lions Note Interest only 5.25% January 2024 12,375,000 12,375,000 Bank Line of Credit Interest only 4.50% May 2015 - 2,000,000 Walnut Hill Plaza $ 25,269 6.75% July 2014 - 3,464,465 Starbucks/Verizon $ 7,405 6.50% July 2015 - 621,197 Total Loans Payable $ 141,450,143 $ 94,562,503
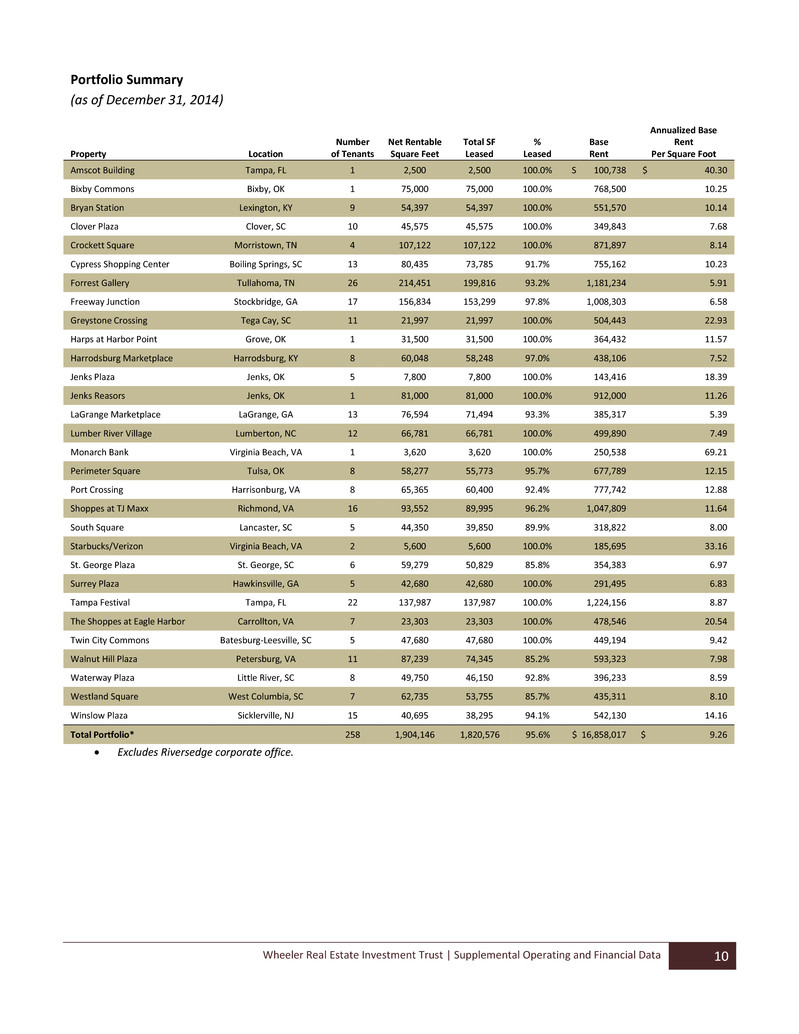
Wheeler Real Estate Investment Trust | Supplemental Operating and Financial Data 10 Portfolio Summary (as of December 31, 2014) Property Location Number of Tenants Net Rentable Square Feet Total SF Leased % Leased Base Rent Annualized Base Rent Per Square Foot Amscot Building Tampa, FL 1 2,500 2,500 100.0% S 100,738 $ 40.30 Bixby Commons Bixby, OK 1 75,000 75,000 100.0% 768,500 10.25 Bryan Station Lexington, KY 9 54,397 54,397 100.0% 551,570 10.14 Clover Plaza Clover, SC 10 45,575 45,575 100.0% 349,843 7.68 Crockett Square Morristown, TN 4 107,122 107,122 100.0% 871,897 8.14 Cypress Shopping Center Boiling Springs, SC 13 80,435 73,785 91.7% 755,162 10.23 Forrest Gallery Tullahoma, TN 26 214,451 199,816 93.2% 1,181,234 5.91 Freeway Junction Stockbridge, GA 17 156,834 153,299 97.8% 1,008,303 6.58 Greystone Crossing Tega Cay, SC 11 21,997 21,997 100.0% 504,443 22.93 Harps at Harbor Point Grove, OK 1 31,500 31,500 100.0% 364,432 11.57 Harrodsburg Marketplace Harrodsburg, KY 8 60,048 58,248 97.0% 438,106 7.52 Jenks Plaza Jenks, OK 5 7,800 7,800 100.0% 143,416 18.39 Jenks Reasors Jenks, OK 1 81,000 81,000 100.0% 912,000 11.26 LaGrange Marketplace LaGrange, GA 13 76,594 71,494 93.3% 385,317 5.39 Lumber River Village Lumberton, NC 12 66,781 66,781 100.0% 499,890 7.49 Monarch Bank Virginia Beach, VA 1 3,620 3,620 100.0% 250,538 69.21 Perimeter Square Tulsa, OK 8 58,277 55,773 95.7% 677,789 12.15 Port Crossing Harrisonburg, VA 8 65,365 60,400 92.4% 777,742 12.88 Shoppes at TJ Maxx Richmond, VA 16 93,552 89,995 96.2% 1,047,809 11.64 South Square Lancaster, SC 5 44,350 39,850 89.9% 318,822 8.00 Starbucks/Verizon Virginia Beach, VA 2 5,600 5,600 100.0% 185,695 33.16 St. George Plaza St. George, SC 6 59,279 50,829 85.8% 354,383 6.97 Surrey Plaza Hawkinsville, GA 5 42,680 42,680 100.0% 291,495 6.83 Tampa Festival Tampa, FL 22 137,987 137,987 100.0% 1,224,156 8.87 The Shoppes at Eagle Harbor Carrollton, VA 7 23,303 23,303 100.0% 478,546 20.54 Twin City Commons Batesburg-Leesville, SC 5 47,680 47,680 100.0% 449,194 9.42 Walnut Hill Plaza Petersburg, VA 11 87,239 74,345 85.2% 593,323 7.98 Waterway Plaza Little River, SC 8 49,750 46,150 92.8% 396,233 8.59 Westland Square West Columbia, SC 7 62,735 53,755 85.7% 435,311 8.10 Winslow Plaza Sicklerville, NJ 15 40,695 38,295 94.1% 542,130 14.16 Total Portfolio* 258 1,904,146 1,820,576 95.6% $ 16,858,017 $ 9.26 Excludes Riversedge corporate office.
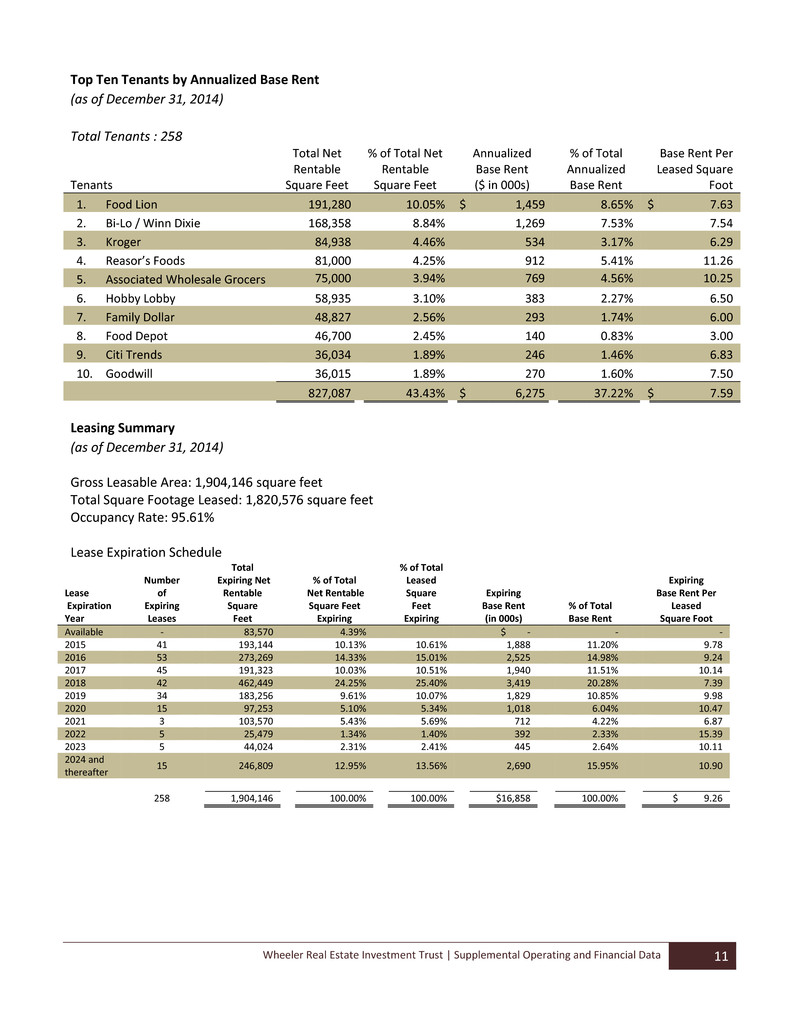
Wheeler Real Estate Investment Trust | Supplemental Operating and Financial Data 11 Top Ten Tenants by Annualized Base Rent (as of December 31, 2014) Total Tenants : 258 Tenants Total Net Rentable Square Feet % of Total Net Rentable Square Feet Annualized Base Rent ($ in 000s) % of Total Annualized Base Rent Base Rent Per Leased Square Foot 1. Food Lion 191,280 10.05% $ 1,459 8.65% $ 7.63 2. Bi-Lo / Winn Dixie 168,358 8.84% 1,269 7.53% 7.54 3. Kroger 84,938 4.46% 534 3.17% 6.29 4. Reasor’s Foods 81,000 4.25% 912 5.41% 11.26 5. Associated Wholesale Grocers 75,000 3.94% 769 4.56% 10.25 6. Hobby Lobby 58,935 3.10% 383 2.27% 6.50 7. Family Dollar 48,827 2.56% 293 1.74% 6.00 8. Food Depot 46,700 2.45% 140 0.83% 3.00 9. Citi Trends 36,034 1.89% 246 1.46% 6.83 10. Goodwill 36,015 1.89% 270 1.60% 7.50 827,087 43.43% $ 6,275 37.22% $ 7.59 Leasing Summary (as of December 31, 2014) Gross Leasable Area: 1,904,146 square feet Total Square Footage Leased: 1,820,576 square feet Occupancy Rate: 95.61% Lease Expiration Schedule Lease Expiration Year Number of Expiring Leases Total Expiring Net Rentable Square Feet % of Total Net Rentable Square Feet Expiring % of Total Leased Square Feet Expiring Expiring Base Rent (in 000s) % of Total Base Rent Expiring Base Rent Per Leased Square Foot Available - 83,570 4.39% $ - - - 2015 41 193,144 10.13% 10.61% 1,888 11.20% 9.78 2016 53 273,269 14.33% 15.01% 2,525 14.98% 9.24 2017 45 191,323 10.03% 10.51% 1,940 11.51% 10.14 2018 42 462,449 24.25% 25.40% 3,419 20.28% 7.39 2019 34 183,256 9.61% 10.07% 1,829 10.85% 9.98 2020 15 97,253 5.10% 5.34% 1,018 6.04% 10.47 2021 3 103,570 5.43% 5.69% 712 4.22% 6.87 2022 5 25,479 1.34% 1.40% 392 2.33% 15.39 2023 5 44,024 2.31% 2.41% 445 2.64% 10.11 2024 and thereafter 15 246,809 12.95% 13.56% 2,690 15.95% 10.90 258 1,904,146 100.00% 100.00% $16,858 100.00% $ 9.26
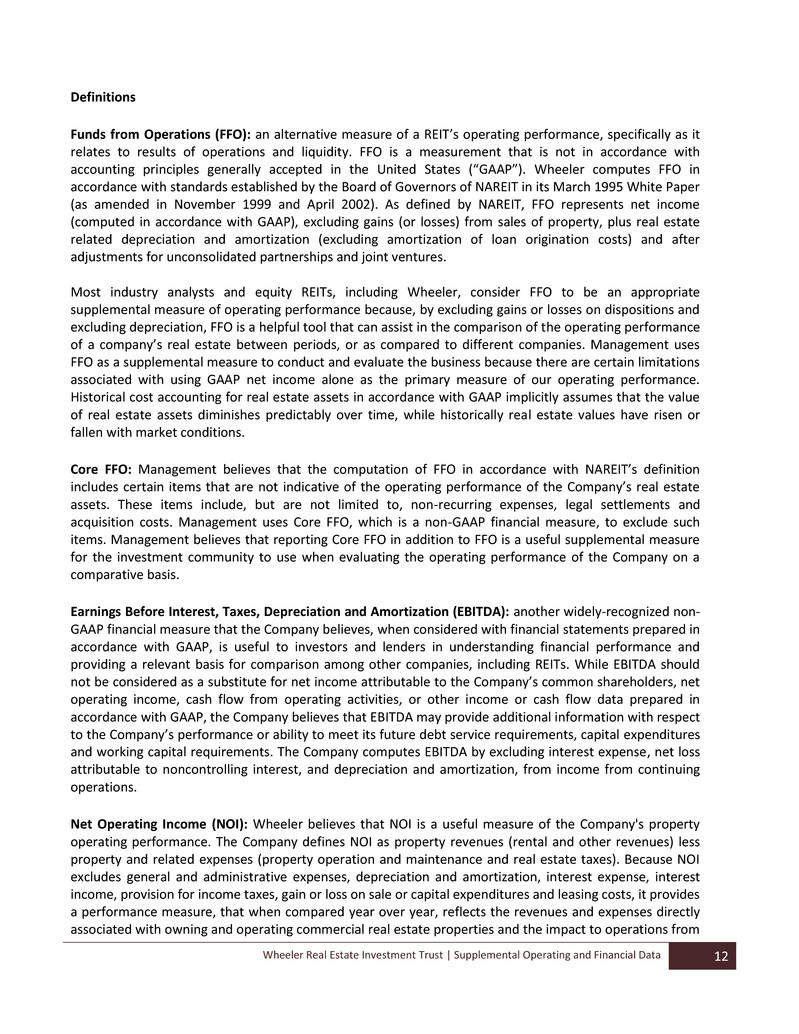
Wheeler Real Estate Investment Trust | Supplemental Operating and Financial Data 12 Definitions Funds from Operations (FFO): an alternative measure of a REIT’s operating performance, specifically as it relates to results of operations and liquidity. FFO is a measurement that is not in accordance with accounting principles generally accepted in the United States (“GAAP”). Wheeler computes FFO in accordance with standards established by the Board of Governors of NAREIT in its March 1995 White Paper (as amended in November 1999 and April 2002). As defined by NAREIT, FFO represents net income (computed in accordance with GAAP), excluding gains (or losses) from sales of property, plus real estate related depreciation and amortization (excluding amortization of loan origination costs) and after adjustments for unconsolidated partnerships and joint ventures. Most industry analysts and equity REITs, including Wheeler, consider FFO to be an appropriate supplemental measure of operating performance because, by excluding gains or losses on dispositions and excluding depreciation, FFO is a helpful tool that can assist in the comparison of the operating performance of a company’s real estate between periods, or as compared to different companies. Management uses FFO as a supplemental measure to conduct and evaluate the business because there are certain limitations associated with using GAAP net income alone as the primary measure of our operating performance. Historical cost accounting for real estate assets in accordance with GAAP implicitly assumes that the value of real estate assets diminishes predictably over time, while historically real estate values have risen or fallen with market conditions. Core FFO: Management believes that the computation of FFO in accordance with NAREIT’s definition includes certain items that are not indicative of the operating performance of the Company’s real estate assets. These items include, but are not limited to, non-recurring expenses, legal settlements and acquisition costs. Management uses Core FFO, which is a non-GAAP financial measure, to exclude such items. Management believes that reporting Core FFO in addition to FFO is a useful supplemental measure for the investment community to use when evaluating the operating performance of the Company on a comparative basis. Earnings Before Interest, Taxes, Depreciation and Amortization (EBITDA): another widely-recognized non- GAAP financial measure that the Company believes, when considered with financial statements prepared in accordance with GAAP, is useful to investors and lenders in understanding financial performance and providing a relevant basis for comparison among other companies, including REITs. While EBITDA should not be considered as a substitute for net income attributable to the Company’s common shareholders, net operating income, cash flow from operating activities, or other income or cash flow data prepared in accordance with GAAP, the Company believes that EBITDA may provide additional information with respect to the Company’s performance or ability to meet its future debt service requirements, capital expenditures and working capital requirements. The Company computes EBITDA by excluding interest expense, net loss attributable to noncontrolling interest, and depreciation and amortization, from income from continuing operations. Net Operating Income (NOI): Wheeler believes that NOI is a useful measure of the Company's property operating performance. The Company defines NOI as property revenues (rental and other revenues) less property and related expenses (property operation and maintenance and real estate taxes). Because NOI excludes general and administrative expenses, depreciation and amortization, interest expense, interest income, provision for income taxes, gain or loss on sale or capital expenditures and leasing costs, it provides a performance measure, that when compared year over year, reflects the revenues and expenses directly associated with owning and operating commercial real estate properties and the impact to operations from
Wheeler Real Estate Investment Trust | Supplemental Operating and Financial Data 13 trends in occupancy rates, rental rates and operating costs, providing perspective not immediately apparent from net income. The Company uses NOI to evaluate its operating performance since NOI allows the Company to evaluate the impact of factors, such as occupancy levels, lease structure, lease rates and tenant base, have on the Company's results, margins and returns. NOI should not be viewed as a measure of the Company's overall financial performance since it does not reflect general and administrative expenses, depreciation and amortization, involuntary conversion, interest expense, interest income, provision for income taxes, gain or loss on sale or disposition of assets, and the level of capital expenditures and leasing costs necessary to maintain the operating performance of the Company's properties. Other REITs may use different methodologies for calculating NOI, and accordingly, the Company's NOI may not be comparable to that of other REITs.
