Attached files
| file | filename |
|---|---|
| 8-K - 8-K - Cambridge Capital Acquisition Corp | d884011d8k.htm |
Exhibit 99.1
PARAKOU TANKERS, INC.
Merger of
Cambridge Capital Acquisition Corporation
(NASDAQ: CAMB)
and
Parakou Tankers, Inc.
Investor Presentation
March 2015
Preliminary Matters
Additional Information and Where to Find It. The proposed mergers described in this presentation (the “Mergers”) will be submitted to the stockholders of Cambridge Capital Acquisition Corporation (“Cambridge”). In connection with the proposed Mergers, Cambridge and Cambridge Holdco, Inc. (“Holdco”), Cambridge’s wholly owned subsidiary, have filed with the Securities and Exchange Commission (the “SEC”) a registration statement on Form S-4 that includes a preliminary proxy statement/prospectus for the stockholders of Cambridge. Cambridge urges investors, stockholders and other interested persons to read the preliminary proxy statement/prospectus and, when available, the definitive proxy statement/prospectus, as well as other documents filed with the SEC, because these documents will contain important information and a more complete description of the transaction summarized briefly in this presentation. Such persons can also read Cambridge’s final prospectus, dated December 17, 2013, and Cambridge’s Annual Report on Form 10-K for the fiscal year ended December 31, 2014, for a description of the security holdings of the Cambridge officers and directors and of EarlyBirdCapital, Inc. (“EBC”) and their respective interests as security holders in the successful consummation of the transactions described herein. Cambridge’s definitive proxy statement/prospectus included in Holdco’s registration statement will be mailed to stockholders of Cambridge as of a record date to be established for voting on the transactions described in this presentation. Stockholders will also be able to obtain a copy of such documents, without charge, by directing a request to: Cambridge Capital Acquisition Corporation, 525 South Flagler Drive, Suite 201, West Palm Beach, Florida 33701. These documents, once available, and Cambridge’s IPO final prospectus and Annual Report on Form 10-K can also be obtained, without charge, at the Securities and Exchange Commission’s web site (http://www.sec.gov).
Participants in Solicitation. EBC, the managing underwriter of Cambridge’s initial public offering consummated in December 2013, is acting as Cambridge’s investment banker in these efforts, for which it will receive a fee. Additionally, Cowen and Company, LLC (“Cowen”) is also assisting Cambridge in connection with the proposed Mergers, for which it will receive a fee. Cambridge and its directors and executive officers, EBC and Cowen may be deemed to be participants in the solicitation of proxies for the special meeting of Cambridge stockholders to be held to approve the Mergers. Information regarding the persons who may, under the rules of the SEC, be deemed participants in the solicitation of the stockholders of Cambridge in connection with the proposed Mergers will be set forth in the proxy statement/prospectus when it is filed with the SEC on Form S-4. You can find information about Cambridge’s executive officers and directors in its Annual Report on Form 10-K, which was filed with the SEC on March 28, 2014. You can obtain free copies of these documents from Cambridge using the contact information above.
Non-Solicitation. This presentation and the oral statements made in connection with this presentation are not proxy statements or solicitations of a proxy, consent or authorization with respect to any securities or in respect of the proposed Mergers and shall not constitute an offer to sell or a solicitation of an offer to buy the securities of Cambridge, Holdco or Parakou Tankers, Inc. (“Parakou”), nor shall there be any sale of any such securities in any state or jurisdiction in which such offer, solicitation, or sale would be unlawful prior to registration or qualification under the securities laws of such state or jurisdiction. No offer of securities shall be made except by means of a prospectus meeting the requirements of Section 10 of the Securities Act of 1933, as amended.
Forward-Looking Statements. This presentation, and oral statements made in connection with this presentation, include “forward-looking statements” within the meaning of U.S. federal securities laws. Words such as “expect,” “estimate,” “project,” “budget,” “forecast,” “anticipate,” “intend,” “plan,” “may,” “will,” “could,” “should,” “believes,” “predicts,” “potential,” “continue” and similar expressions are intended to identify such forward-looking statements. These forward-looking statements involve significant risks and uncertainties that could cause the actual results to differ materially from the expected results and, consequently, you should not rely on these forward-looking statements as predictions of future events. These forward-looking statements and factors that may cause such differences include, without limitation, Cambridge’s and Parakou’s expectations with respect to future performance, growth and anticipated acquisitions; the anticipated financial impact of the Mergers; ability to recognize the anticipated benefits of the Mergers; costs related to the proposed Mergers; the satisfaction of the closing conditions to the Mergers; the timing of the completion of the Mergers; volatility in charter rates and profitability; demand for shipping of refined petroleum products; global economic conditions; changes in fuel prices; geopolitical events and regulatory changes; damages to vessels; acts of piracy, political instability, terrorist or other attacks, war or international hostilities; loss of key personnel; delays in deliveries of any newbuild product tankers; difficulty managing planned growth properly; seasonal and exchange rate fluctuations; access to additional financing; changes in tax laws; weather and natural disasters; changing interpretations of generally accepted accounting principles; inquiries and investigations and related litigation; continued compliance with government regulations; and other risks and uncertainties indicated from time to time in filings with the SEC by Cambridge or Holdco. The foregoing list of factors is not exclusive. Additional information concerning these and other risk factors is contained in Cambridge’s most recent filings with the SEC and will be contained in the proxy statement/prospectus to be filed by Holdco. All subsequent written and oral forward-looking statements concerning Cambridge, Holdco and Parakou, the transactions described herein or other matters and attributable to Cambridge, Holdco and Parakou or any person acting on their behalf are expressly qualified in their entirety by the cautionary statements above. Readers are cautioned not to place undue reliance upon any forward-looking statements, which speak only as of the date made. Neither Cambridge, Holdco nor Parakou undertake or accept any obligation or undertaking to release publicly any updates or revisions to any forward-looking statement to reflect any change in their expectations or any change in events, conditions or circumstances on which any such statement is based.
Market & Industry Data. The market and industry data contained in this presentation are based on the parties own estimates, internal research, surveys and studies conducted by third parties and industry and general publications and, in each case, are believed by management to be reasonable estimates. This data is subject to change and cannot always be verified with complete certainty due to limits on the availability and reliability of raw data, the voluntary nature of the data gathering process and other limitations and uncertainties inherent in any statistical survey of market or industry data.
Parakou Tankers, Inc.
| 2 |
|
The Opportunity
Fully Integrated, High Growth Shipping Company
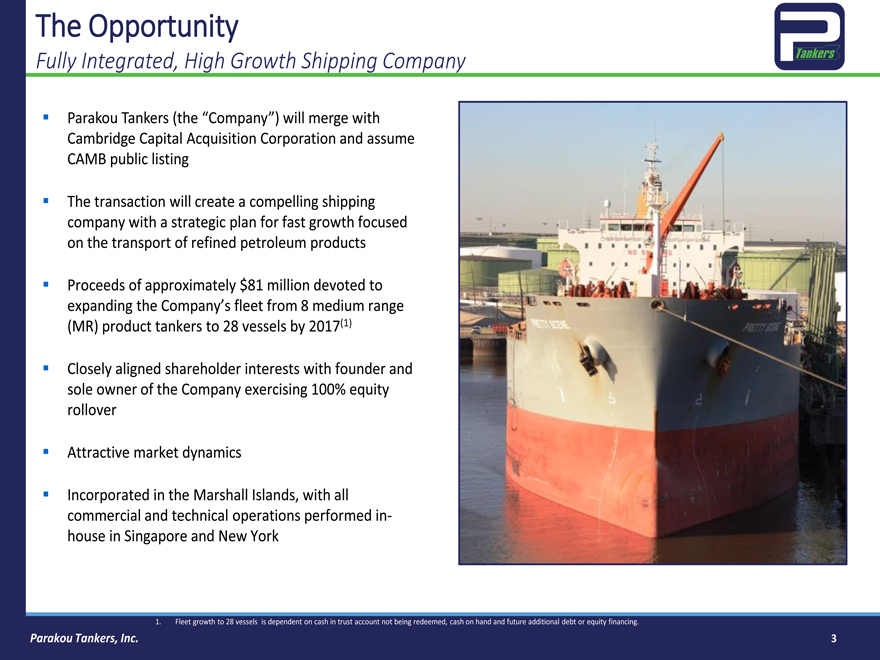
Parakou Tankers (the “Company”) will merge with
Cambridge Capital Acquisition Corporation and assume CAMB public listing
The transaction will create a compelling shipping company with a strategic plan for fast growth focused on the transport of refined petroleum products
Proceeds of approximately $81 million devoted to expanding the Company’s fleet from 8 medium range
(MR) product tankers to 28 vessels by 2017(1)
Closely aligned shareholder interests with founder and sole owner of the Company exercising 100% equity rollover
Attractive market dynamics
Incorporated in the Marshall Islands, with all commercial and technical operations performed in-house in Singapore and New York
1. Fleet growth to 28 vessels is dependent on cash in trust account not being redeemed, cash on hand and future additional debt or equity financing.
Parakou Tankers, Inc.
| 3 |
|
The Transaction
Summary of Terms
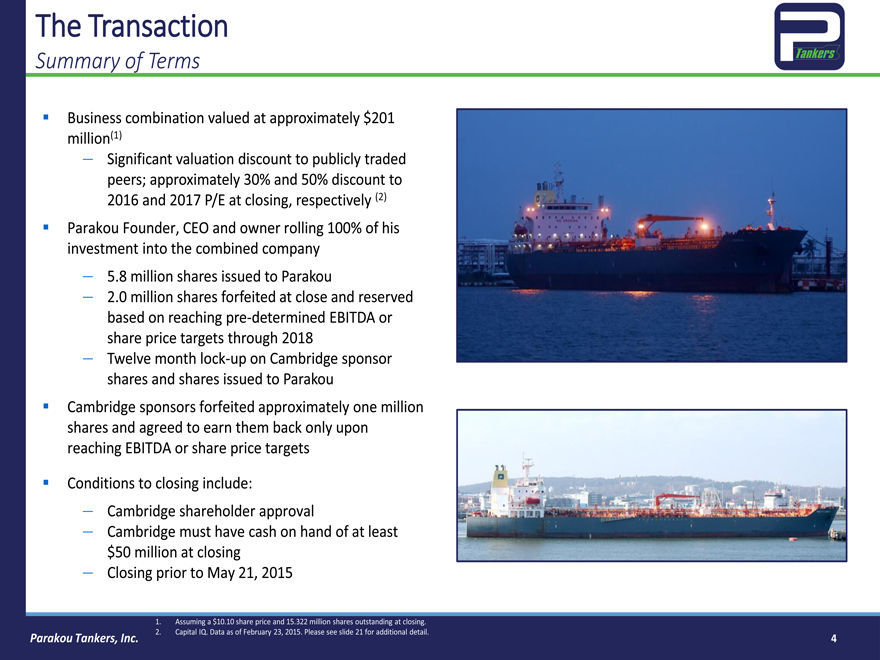
Business combination valued at approximately $201 million(1)
— Significant valuation discount to publicly traded peers; approximately 30% and 50% discount to 2016 and 2017 P/E at closing, respectively (2) Parakou Founder, CEO and owner rolling 100% of his investment into the combined company
— 5.8 million shares issued to Parakou
— 2.0 million shares forfeited at close and reserved based on reaching pre-determined EBITDA or share price targets through 2018
— Twelve month lock-up on Cambridge sponsor shares and shares issued to Parakou Cambridge sponsors forfeited approximately one million shares and agreed to earn them back only upon reaching EBITDA or share price targets
Conditions to closing include:
— Cambridge shareholder approval
— Cambridge must have cash on hand of at least $50 million at closing
— Closing prior to May 21, 2015
1. Assuming a $10.10 share price and 15.322 million shares outstanding at closing.
2. Capital IQ. Data as of February 23, 2015. Please see slide 21 for additional detail.
Parakou Tankers, Inc.
| 4 |
|
The Transaction
Structure and Ownership
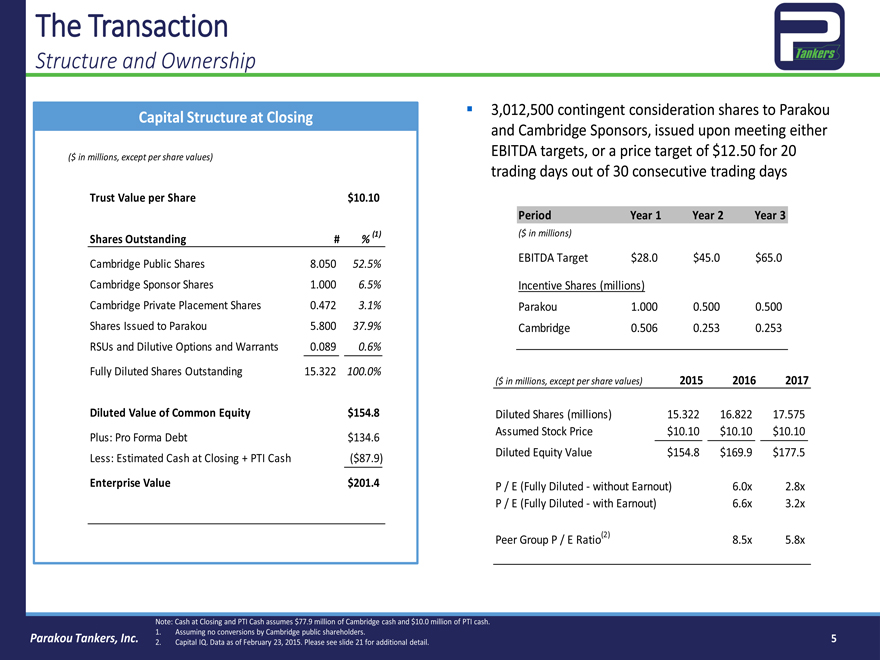
Capital Structure at Closing
($ in millions, except per share values)
Trust Value per Share $10.10
Shares Outstanding #% (1)
Cambridge Public Shares 8.050 52.5%
Cambridge Sponsor Shares 1.000 6.5%
Cambridge Private Placement Shares 0.472 3.1%
Shares Issued to Parakou 5.800 37.9%
RSUs and Dilutive Options and Warrants 0.089 0.6%
Fully Diluted Shares Outstanding 15.322 100.0%
Diluted Value of Common Equity $154.8
Plus: Pro Forma Debt $134.6
Less: Estimated Cash at Closing + PTI Cash($87.9)
Enterprise Value $201.4
3,012,500 contingent consideration shares to Parakou and Cambridge Sponsors, issued upon meeting either EBITDA targets, or a price target of $12.50 for 20 trading days out of 30 consecutive trading days
Period Year 1 Year 2 Year 3
($ in millions)
EBITDA Target $28.0 $45.0 $65.0
Incentive Shares (millions)
Parakou 1.000 0.500 0.500
Cambridge 0.506 0.253 0.253
($ in millions, except per share values) 2015 2016 2017
Diluted Shares (millions) 15.322 16.822 17.575
Assumed Stock Price $10.10 $10.10 $10.10
Diluted Equity Value $154.8 $169.9 $177.5
P / E (Fully Diluted—without Earnout) 6.0x 2.8x
P / E (Fully Diluted—with Earnout) 6.6x 3.2x
Peer Group P / E Ratio(2) 8.5x 5.8x
Note: Cash at Closing and PTI Cash assumes $77.9 million of Cambridge cash and $10.0 million of PTI cash.
1. Assuming no conversions by Cambridge public shareholders.
2. Capital IQ. Data as of February 23, 2015. Please see slide 21 for additional detail.
Parakou Tankers, Inc.
| 5 |
|

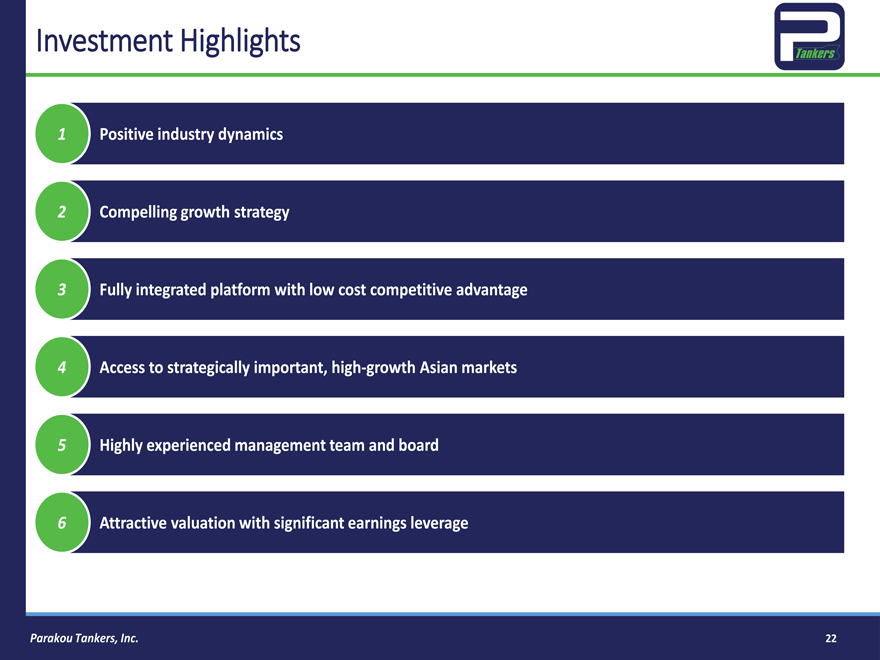
Investment Highlights
| 1 |
|
Positive industry dynamics |
| 2 |
|
Compelling growth strategy |
| 3 |
|
Fully integrated platform with low cost competitive advantage |
| 4 |
|
Access to strategically important, high-growth Asian markets |
| 5 |
|
Highly experienced management team and board |
| 6 |
|
Attractive valuation with significant earnings leverage |
Parakou Tankers, Inc.
| 6 |
|
1. Positive Industry Dynamics
Shifts in Global Refining Capacity Benefit the Product Tanker Trade
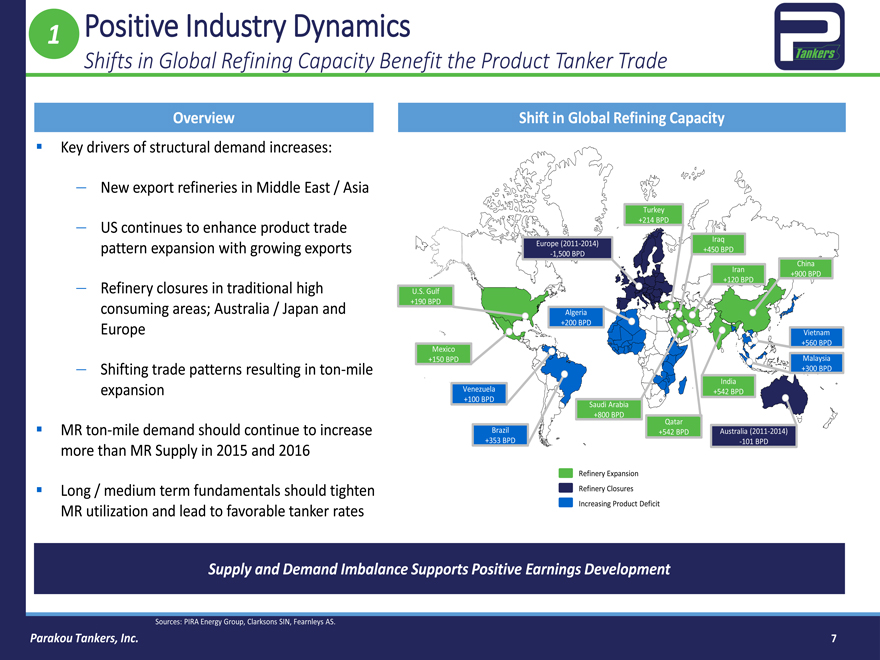
Overview
Key drivers of structural demand increases:
— New export refineries in Middle East / Asia
— US continues to enhance product trade pattern expansion with growing exports
— Refinery closures in traditional high consuming areas; Australia / Japan and Europe
— Shifting trade patterns resulting in ton-mile expansion
MR ton-mile demand should continue to increase more than MR Supply in 2015 and 2016
Long / medium term fundamentals should tighten MR utilization and lead to favorable tanker rates
Shift in Global Refining Capacity
Turkey +214 BPD
Iraq +450 BPD
Europe (2011-2014) -1,500 BPD
Iran +120 BPD
China +900 BPD
U.S. Gulf +190 BPD
Algeria +200 BPD
Vietnam +560 BPD
Mexico +150 BPD
Malaysia +300 BPD
India +542 BPD
Venezuela +100 BPD
Saudi Arabia +800 BPD
Qatar +542 BPD
Brazil +353 BPD
Australia (2011-2014) -101 BPD
Refinery Expansion
Refinery Closures
Increasing Product Deficit
Supply and Demand Imbalance Supports Positive Earnings Development
Sources: PIRA Energy Group, Clarksons SIN, Fearnleys AS.
Parakou Tankers, Inc.
| 7 |
|
| 1 |
|
Positive Industry Dynamics |
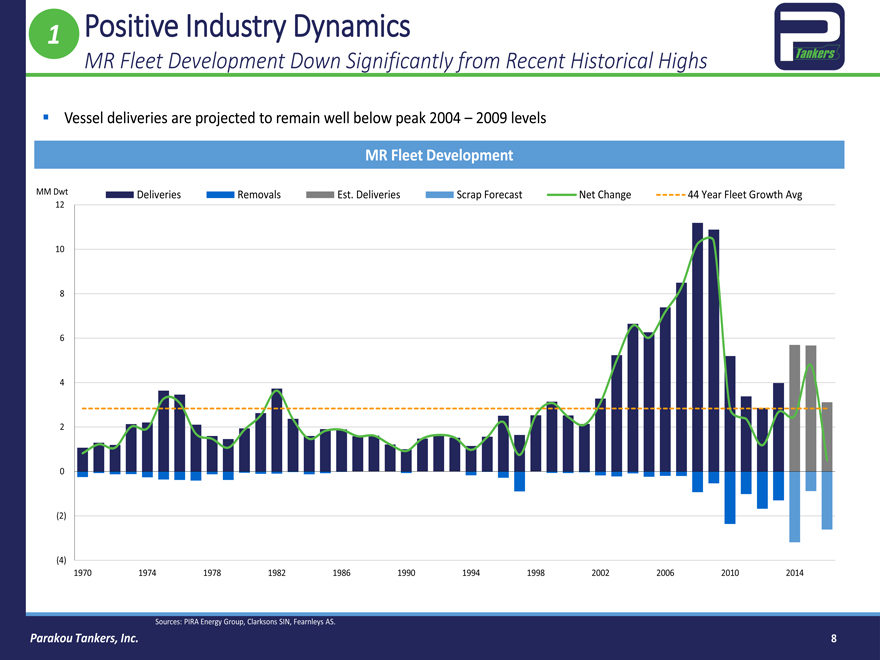
MR Fleet Development Down Significantly from Recent Historical Highs
Vessel deliveries are projected to remain well below peak 2004 – 2009 levels
MM Dwt
Deliveries
Removals
Est. Deliveries
Scrap Forecast
Net Change
44 Year Fleet Growth Avg
12 10 8 6 4 2 0 (2) (4)
1970
1974
1978
1982
1986
1990
1994
1998
2002
2006
2010
2014
Sources: PIRA Energy Group, Clarksons SIN, Fearnleys AS.
Parakou Tankers, Inc.
| 8 |
|
| 1 |
|
Positive Industry Dynamics |
The Benefits of Low Oil Prices
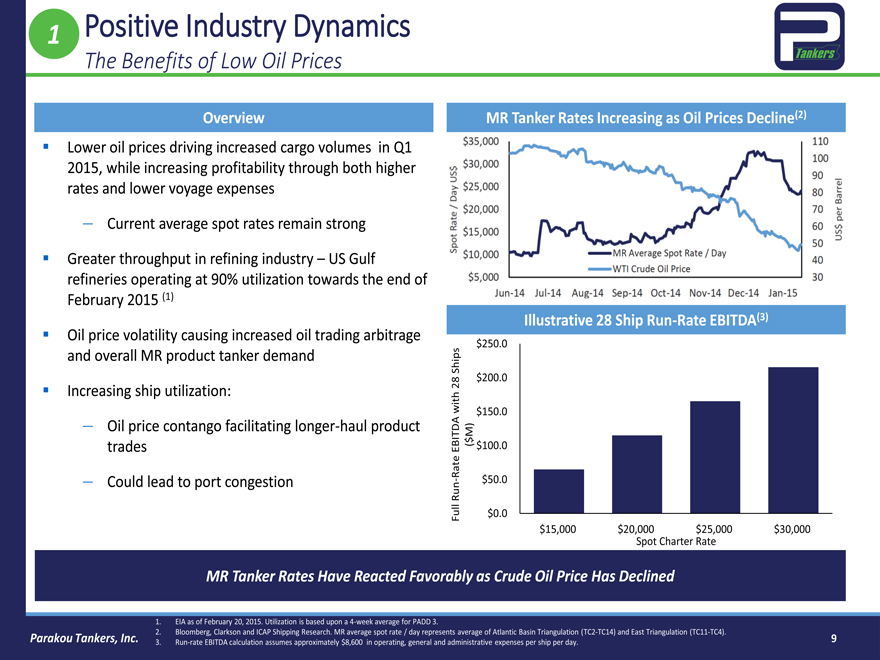
Overview
Lower oil prices driving increased cargo volumes in Q1 2015, while increasing profitability through both higher rates and lower voyage expenses
— Current average spot rates remain strong
Greater throughput in refining industry – US Gulf refineries operating at 90% utilization towards the end of February 2015 (1)
Oil price volatility causing increased oil trading arbitrage and overall MR product tanker demand
Increasing ship utilization:
— Oil price contango facilitating longer-haul product trades
— Could lead to port congestion
MR Tanker Rates Increasing as Oil Prices Decline(2)
Illustrative 28 Ship Run-Rate EBITDA(3)
($ M) ( EBITDA with 28 Ships
Full Run—Rate
$250.0
$200.0
$150.0
$100.0
$50.0
$0.0
$15,000
$20,000
$25,000
$30,000
Spot Charter Rate
MR Tanker Rates Have Reacted Favorably as Crude Oil Price Has Declined
1. EIA as of February 20, 2015. Utilization is based upon a 4-week average for PADD 3.
2. Bloomberg, Clarkson and ICAP Shipping Research. MR average spot rate / day represents average of Atlantic Basin Triangulation (TC2-TC14) and East Triangulation (TC11-TC4).
3. Run-rate EBITDA calculation assumes approximately $8,600 in operating, general and administrative expenses per ship per day.
Parakou Tankers, Inc.
9
| 1 |
|
Positive Industry Dynamics |
Spot Market and Term Charter Rates Continue to Rise
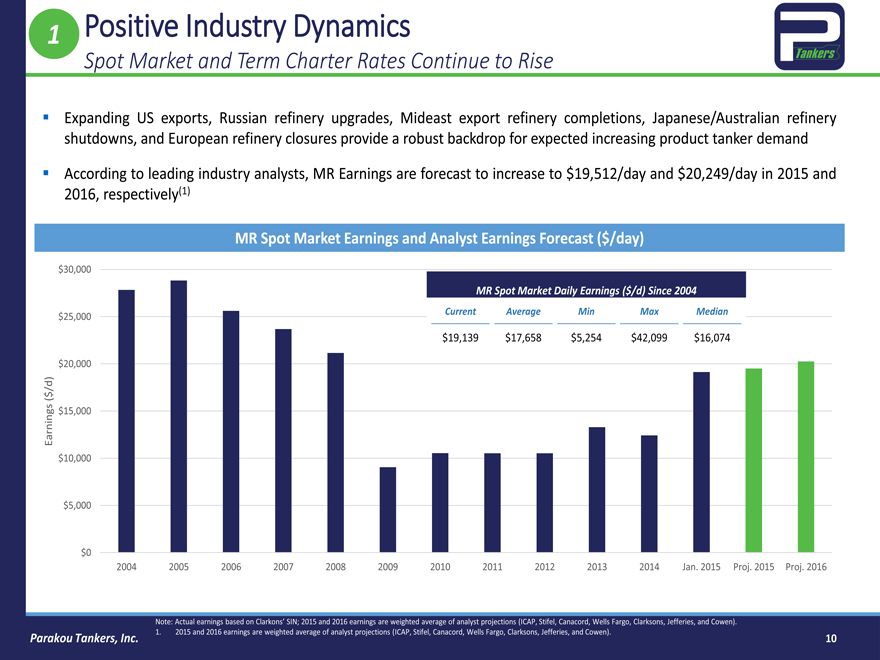
Expanding US exports, Russian refinery upgrades, Mideast export refinery completions, Japanese/Australian refinery shutdowns, and European refinery closures provide a robust backdrop for expected increasing product tanker demand
According to leading industry analysts, MR Earnings are forecast to increase to $19,512/day and $20,249/day in 2015 and 2016, respectively(1)
MR Spot Market Earnings and Analyst Earnings Forecast ($/day)
MR Spot Market Daily Earnings ($/d) Since 2004
Current Average Min Max Median
$19,139 $17,658 $5,254 $42,099 $16,074
Earnings ($/d)
$30,000
$25,000
$20,000
$15,000
$10,000
$5,000 $0
2004 2005 2006 2007 2008 2009 2010 2011 2012 2013 2014 Jan. 2015 Proj. 2015 Proj. 2016
Note: Actual earnings based on Clarkons’ SIN; 2015 and 2016 earnings are weighted average of analyst projections (ICAP, Stifel, Canacord, Wells Fargo, Clarksons, Jefferies, and Cowen).
1. 2015 and 2016 earnings are weighted average of analyst projections (ICAP, Stifel, Canacord, Wells Fargo, Clarksons, Jefferies, and Cowen).
Parakou Tankers, Inc.
10
| 1 |
|
Positive Industry Dynamics |
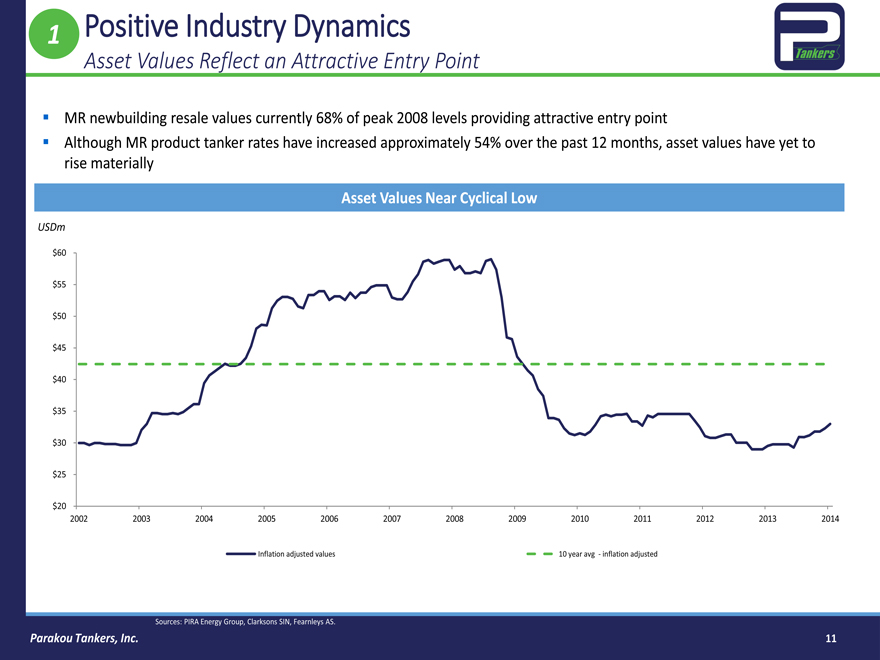
Asset Values Reflect an Attractive Entry Point
MR newbuilding resale values currently 68% of peak 2008 levels providing attractive entry point
Although MR product tanker rates have increased approximately 54% over the past 12 months, asset values have yet to rise materially
Asset Values Near Cyclical Low
USDm
$60 $55 $50 $45 $40 $35 $30 $25 $20
2002 2003 2004 2005 2006 2007 2008 2009 2010 2011 2012 2013 2014
Inflation adjusted values
10 year avg —inflation adjusted values
Sources: PIRA Energy Group, Clarksons SIN, Fearnleys AS.
Parakou Tankers, Inc.
11
| 2 |
|
Compelling Growth Strategy |
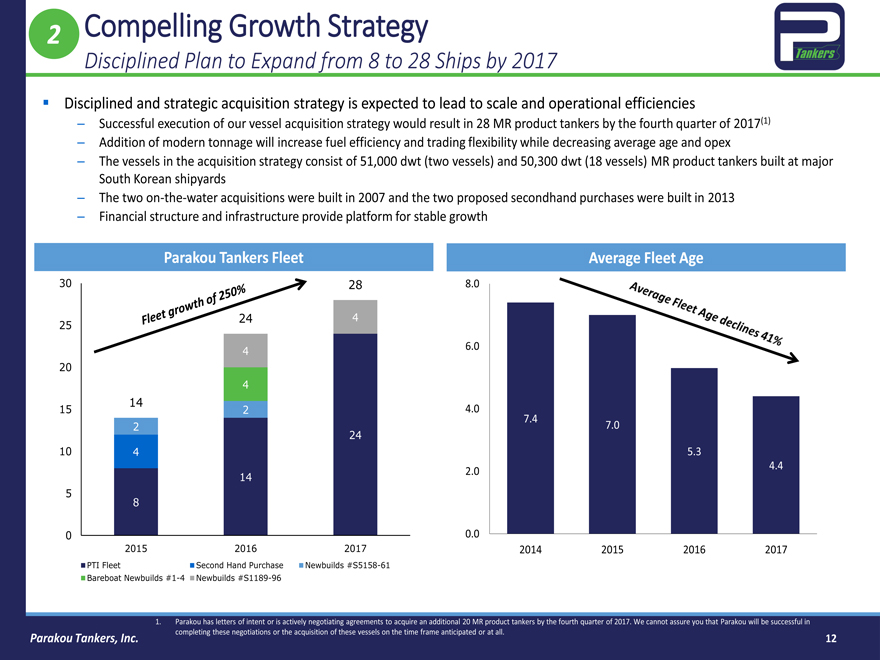
Disciplined Plan to Expand from 8 to 28 Ships by 2017
Disciplined and strategic acquisition strategy is expected to lead to scale and operational efficiencies
– Successful execution of our vessel acquisition strategy would result in 28 MR product tankers by the fourth quarter of 2017(1)
– Addition of modern tonnage will increase fuel efficiency and trading flexibility while decreasing average age and opex
– The vessels in the acquisition strategy consist of 51,000 dwt (two vessels) and 50,300 dwt (18 vessels) MR product tankers built at major South Korean shipyards
– The two on-the-water acquisitions were built in 2007 and the two proposed secondhand purchases were built in 2013
– Financial structure and infrastructure provide platform for stable growth
Parakou Tankers Fleet
30
25
20
15
10
| 5 |
|
0
14
| 2 |
|
| 4 |
|
| 8 |
|
24
| 4 |
|
| 4 |
|
| 2 |
|
14
28
| 4 |
|
24
2015
2016
2017
Average Fleet Age
8.0 6.0 4.0 2.0 0.0
7.4
7.0
5.3
4.4
2014 2015 2016 2017
PTI Fleet
Bareboat Newbuilds #1-4
Second Hand Purchase
Newbuilds #S5158-61
Newbuilds #S1189-96
1. Parakou has letters of intent 24 or is actively negotiating agreements to acquire 4 an additional 20 MR product tankers by the fourth quarter of 2017. We cannot assure you that Parakou will be successful in completing these negotiations or the acquisition of these vessels on the time frame anticipated or at all.
Parakou Tankers, Inc.
12
| 3 |
|
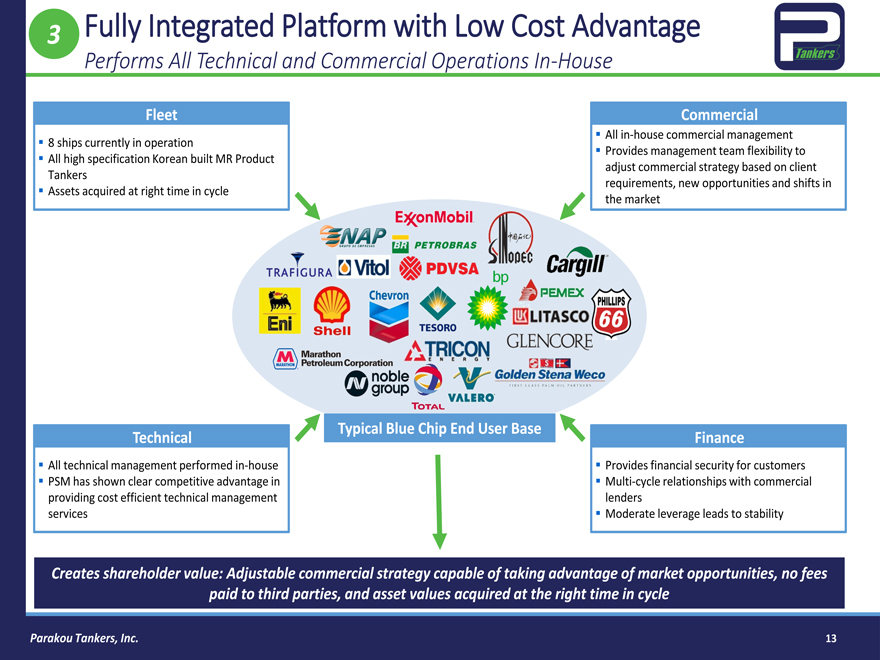
Fully Integrated Platform with Low Cost Advantage |
Performs All Technical and Commercial Operations In-House
Fleet
| 8 |
|
ships currently in operation |
All high specification Korean built MR Product Tankers
Assets acquired at right time in cycle
Commercial
All in-house commercial management
Provides management team flexibility to adjust commercial strategy based on client requirements, new opportunities and shifts in the market
Technical
All technical management performed in-house
PSM has shown clear competitive advantage in providing cost efficient technical management services
Typical Blue Chip End User Base
Finance
Provides financial security for customers
Multi-cycle relationships with commercial lenders
Moderate leverage leads to stability
Creates shareholder value: Adjustable commercial strategy capable of taking advantage of market opportunities, no fees paid to third parties, and asset values acquired at the right time in cycle
Parakou Tankers, Inc.
13
| 3 |
|
Fully Integrated Platform with Low Cost Advantage |
Transparent and Experienced Management Team Delivers Lower OPEX
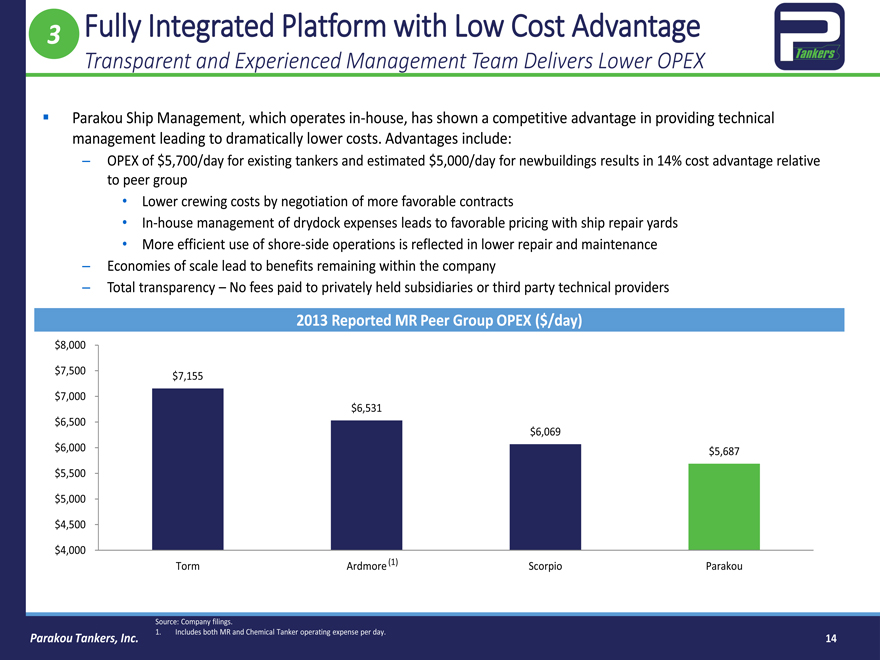
Parakou Ship Management, which operates in-house, has shown a competitive advantage in providing technical management leading to dramatically lower costs. Advantages include:
– OPEX of $5,700/day for existing tankers and estimated $5,000/day for newbuildings results in 14% cost advantage relative to peer group
Lower crewing costs by negotiation of more favorable contracts
In-house management of drydock expenses leads to favorable pricing with ship repair yards
More efficient use of shore-side operations is reflected in lower repair and maintenance
– Economies of scale lead to benefits remaining within the company
– Total transparency – No fees paid to privately held subsidiaries or third party technical providers
2013 Reported MR Peer Group OPEX ($/day)
$ 8,000
$ 7,500
$ 7,000
$ 6,500
$ 6,000
$ 5,500
$ 5,000
$ 4,500
$ 4,000
$7,155
$6,531
$6,069
$5,687
Torm
Ardmore(1)
Scorpio
Parakou
Source: Company filings.
1. Includes both MR and Chemical Tanker operating expense per day.
Parakou Tankers, Inc.
14
| 3 |
|
Fully Integrated Platform with Low Cost Advantage |
| 10 |
|
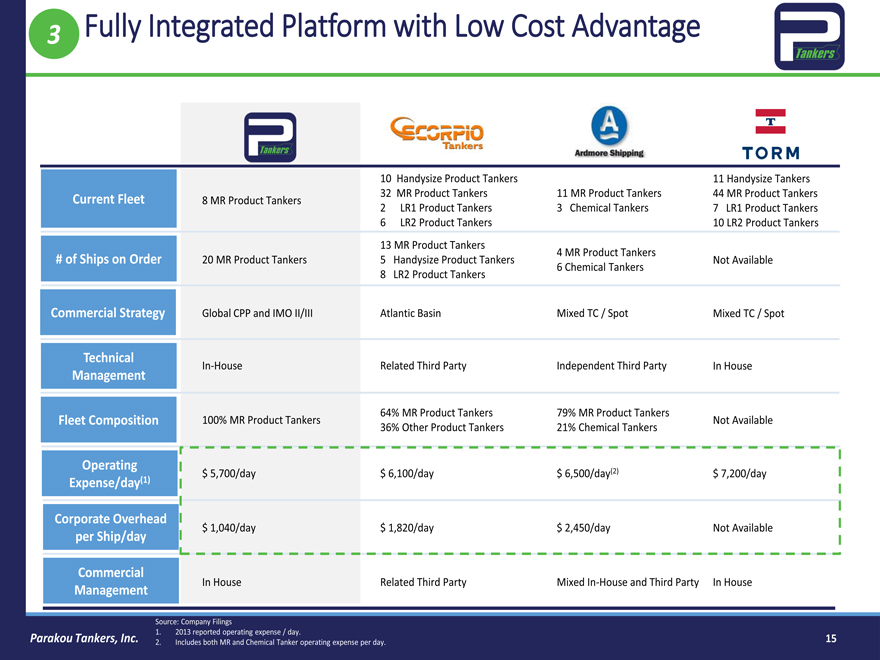
Handysize Product Tankers 11 Handysize Tankers |
Current Fleet 8 MR Product Tankers 32 MR Product Tankers 11 MR Product Tankers 44 MR Product Tankers
| 2 |
|
LR1 Product Tankers 3 Chemical Tankers 7 LR1 Product Tankers |
| 6 |
|
LR2 Product Tankers 10 LR2 Product Tankers |
| 13 |
|
MR Product Tankers |
| 4 |
|
MR Product Tankers |
# of Ships on Order 20 MR Product Tankers 5 Handysize Product Tankers Not Available
| 6 |
|
Chemical Tankers |
| 8 |
|
LR2 Product Tankers |
Commercial Strategy Global CPP and IMO II/III Atlantic Basin Mixed TC / Spot Mixed TC / Spot
Technical
In-House Related Third Party Independent Third Party In House
Management
64% MR Product Tankers 79% MR Product Tankers
Fleet Composition 100% MR Product Tankers Not Available
36% Other Product Tankers 21% Chemical Tankers
Operating
$ 5,700/day $ 6,100/day $ 6,500/day(2) $ 7,200/day
Expense/day(1)
Corporate Overhead
$ 1,040/day $ 1,820/day $ 2,450/day Not Available
per Ship/day
Commercial
In House Related Third Party Mixed In-House and Third Party In House
Management
Source: Company Filings
1. 2013 reported operating expense / day.
2. Includes both MR and Chemical Tanker operating expense per day.
Parakou Tankers, Inc.
15
| 4 |
|
Access to Strategically Important, High-Growth Asian Markets |
Enhances Earnings and Financing Opportunities
Established Asian Market Presence
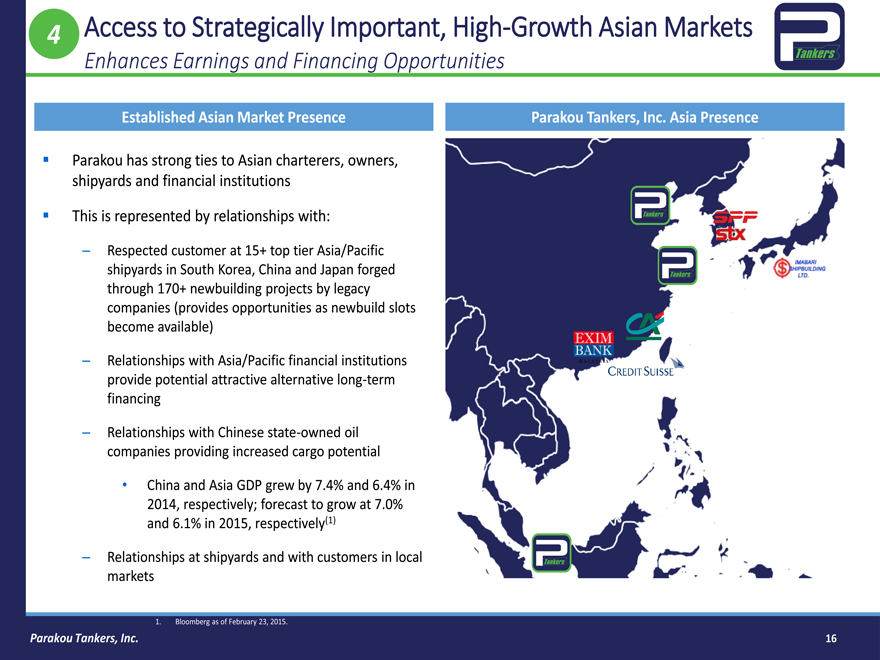
Parakou has strong ties to Asian charterers, owners, shipyards and financial institutions
This is represented by relationships with:
– Respected customer at 15+ top tier Asia/Pacific shipyards in South Korea, China and Japan forged through 170+ newbuilding projects by legacy companies (provides opportunities as newbuild slots become available)
– Relationships with Asia/Pacific financial institutions provide potential attractive alternative long-term financing
– Relationships with Chinese state-owned oil companies providing increased cargo potential
China and Asia GDP grew by 7.4% and 6.4% in 2014, respectively; forecast to grow at 7.0% and 6.1% in 2015, respectively(1)
– Relationships at shipyards and with customers in local markets
Parakou Tankers, Inc. Asia Presence
1. Bloomberg as of February 23, 2015.
Parakou Tankers, Inc.
16
| 4 |
|
Access to Strategically Important, High-Growth Asian Markets |
Supports Commercial Strategy
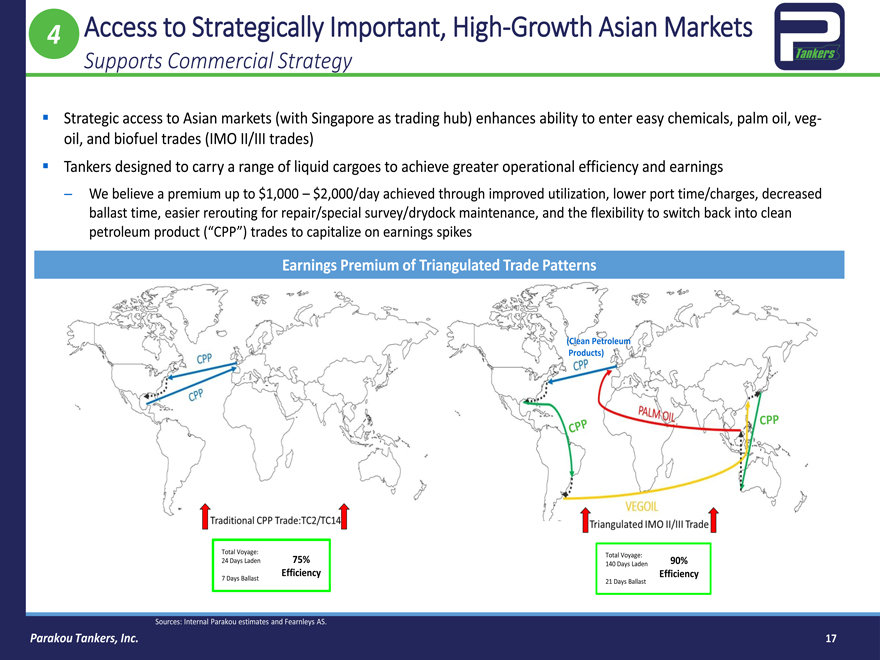
Strategic access to Asian markets (with Singapore as trading hub) enhances ability to enter easy chemicals, palm oil, veg-oil, and biofuel trades (IMO II/III trades) Tankers designed to carry a range of liquid cargoes to achieve greater operational efficiency and earnings
– We believe a premium up to $1,000 – $2,000/day achieved through improved utilization, lower port time/charges, decreased ballast time, easier rerouting for repair/special survey/drydock maintenance, and the flexibility to switch back into clean petroleum product (“CPP”) trades to capitalize on earnings spikes
Earnings Premium of Triangulated Trade Patterns
Total Voyage: 75%
24 Days Laden
Efficiency
| 7 |
|
Days Ballast |
Total Voyage:
140 Days Laden 90%
Efficiency
21 Days Ballast
Sources: Internal Parakou estimates and Fearnleys AS.
Parakou Tankers, Inc.
17
| 5 |
|
Highly Experienced Management Team and Board |
Management Team
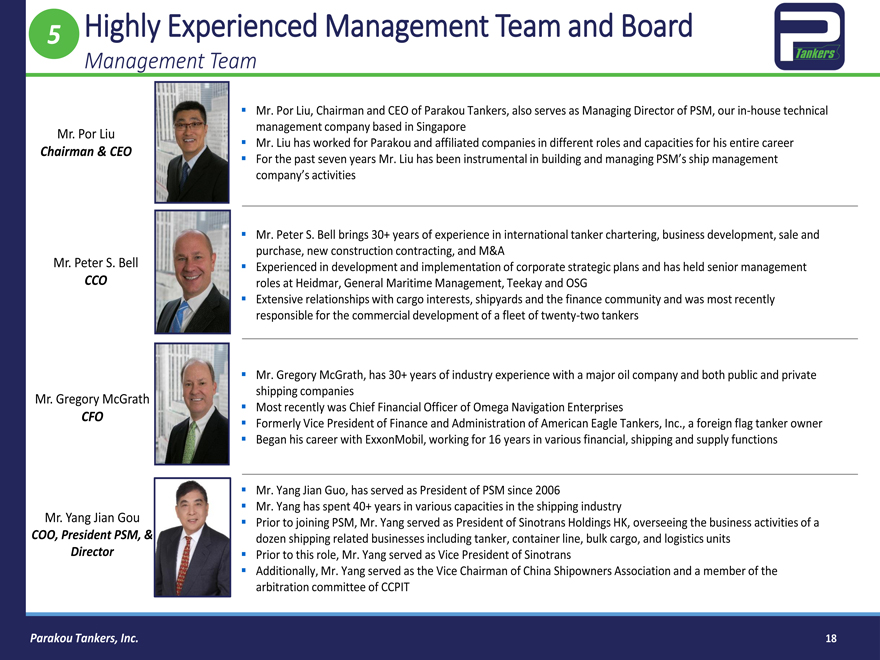
Mr. Por Liu
Chairman & CEO
Mr. Peter S. Bell
CCO
Mr. Gregory McGrath
CFO
Mr. Yang Jian Gou
COO, President PSM, &
Director
Mr. Por Liu, Chairman and CEO of Parakou Tankers, also serves as Managing Director of PSM, our in-house technical management company based in Singapore Mr. Liu has worked for Parakou and affiliated companies in different roles and capacities for his entire career
For the past seven years Mr. Liu has been instrumental in building and managing PSM’s ship management company’s activities
Mr. Peter S. Bell brings 30+ years of experience in international tanker chartering, business development, sale and purchase, new construction contracting, and M&A
Experienced in development and implementation of corporate strategic plans and has held senior management roles at Heidmar, General Maritime Management, Teekay and OSG
Extensive relationships with cargo interests, shipyards and the finance community and was most recently responsible for the commercial development of a fleet of twenty-two tankers
Mr. Gregory McGrath, has 30+ years of industry experience with a major oil company and both public and private shipping companies Most recently was Chief Financial Officer of Omega Navigation Enterprises Formerly Vice President of Finance and Administration of American Eagle Tankers, Inc., a foreign flag tanker owner Began his career with ExxonMobil, working for 16 years in various financial, shipping and supply functions
Mr. Yang Jian Guo, has served as President of PSM since 2006
Mr. Yang has spent 40+ years in various capacities in the shipping industry
Prior to joining PSM, Mr. Yang served as President of Sinotrans Holdings HK, overseeing the business activities of a dozen shipping related businesses including tanker, container line, bulk cargo, and logistics units Prior to this role, Mr. Yang served as Vice President of Sinotrans Additionally, Mr. Yang served as the Vice Chairman of China Shipowners Association and a member of the arbitration committee of CCPIT
Parakou Tankers, Inc.
18
| 5 |
|
Highly Experienced Management Team and Board |
Board of Directors
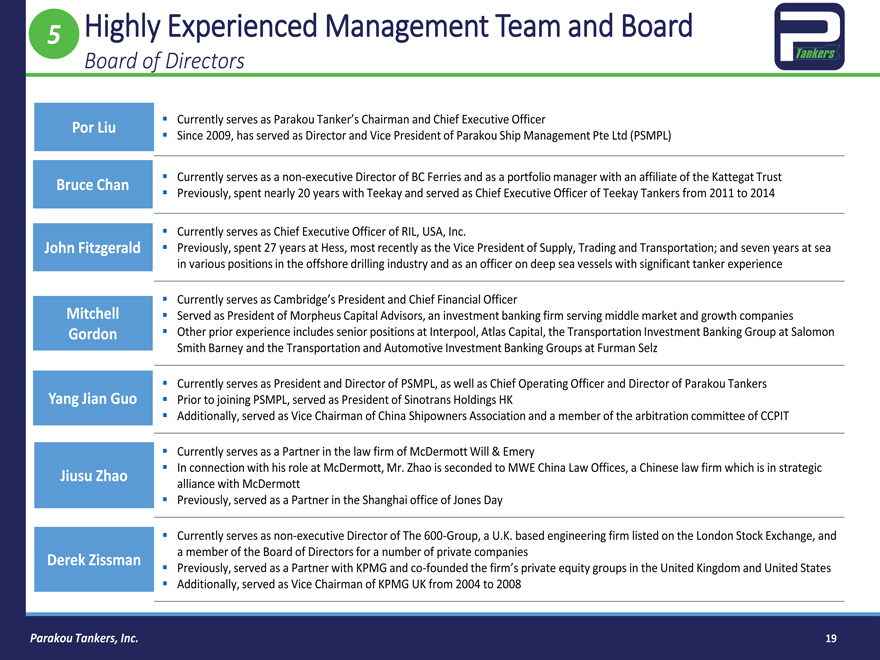
Por Liu
Bruce Chan
John Fitzgerald
Mitchell
Gordon
Yang Jian Guo
Jiusu Zhao
Derek Zissman
Currently serves as Parakou Tanker’s Chairman and Chief Executive Officer
Since 2009, has served as Director and Vice President of Parakou Ship Management Pte Ltd (PSMPL)
Currently serves as a non-executive Director of BC Ferries and as a portfolio manager with an affiliate of the Kattegat Trust Previously, spent nearly 20 years with Teekay and served as Chief Executive Officer of Teekay Tankers from 2011 to 2014
Currently serves as Chief Executive Officer of RIL, USA, Inc.
Previously, spent 27 years at Hess, most recently as the Vice President of Supply, Trading and Transportation; and seven years at sea in various positions in the offshore drilling industry and as an officer on deep sea vessels with significant tanker experience
Currently serves as Cambridge’s President and Chief Financial Officer
Served as President of Morpheus Capital Advisors, an investment banking firm serving middle market and growth companies Other prior experience includes senior positions at Interpool, Atlas Capital, the Transportation Investment Banking Group at Salomon Smith Barney and the Transportation and Automotive Investment Banking Groups at Furman Selz
Currently serves as President and Director of PSMPL, as well as Chief Operating Officer and Director of Parakou Tankers Prior to joining PSMPL, served as President of Sinotrans Holdings HK
Additionally, served as Vice Chairman of China Shipowners Association and a member of the arbitration committee of CCPIT
Currently serves as a Partner in the law firm of McDermott Will & Emery
In connection with his role at McDermott, Mr. Zhao is seconded to MWE China Law Offices, a Chinese law firm which is in strategic alliance with McDermott Previously, served as a Partner in the Shanghai office of Jones Day
Currently serves as non-executive Director of The 600-Group, a U.K. based engineering firm listed on the London Stock Exchange, and a member of the Board of Directors for a number of private companies
Previously, served as a Partner with KPMG and co-founded the firm’s private equity groups in the United Kingdom and United States
Additionally, served as Vice Chairman of KPMG UK from 2004 to 2008
Parakou Tankers, Inc.
19
| 6 |
|
Attractive Valuation with Significant Earnings Leverage |
Large Upside Potential Concurrent with Increases in Rates
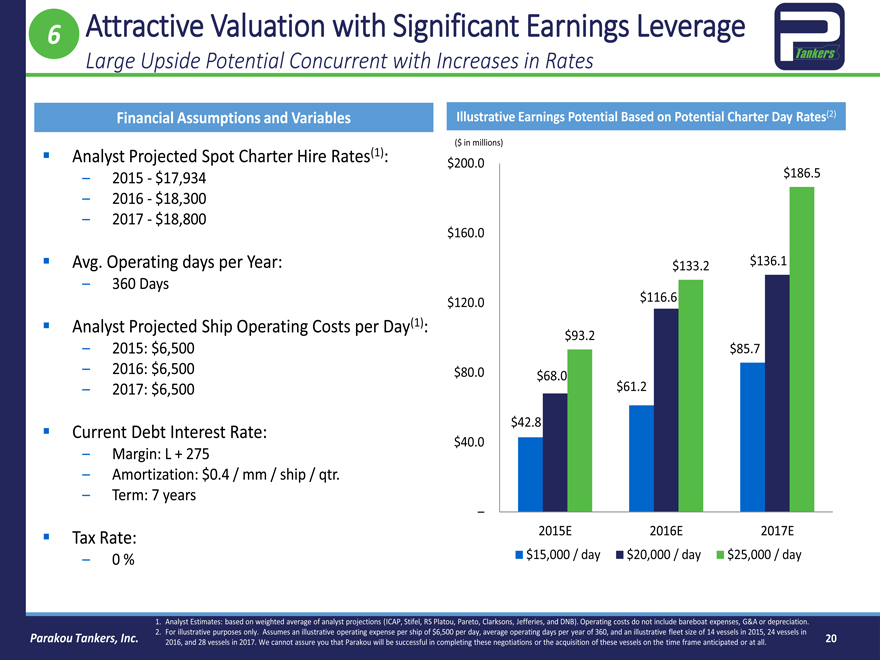
Financial Assumptions and Variables
Analyst Projected Spot Charter Hire Rates(1):
– 2015—$17,934
– 2016—$18,300
– 2017—$18,800
Avg. Operating days per Year:
– 360 Days
Analyst Projected Ship Operating Costs per Day(1):
– 2015: $6,500
– 2016: $6,500
– 2017: $6,500
Current Debt Interest Rate:
– Margin: L + 275
– Amortization: $0.4 / mm / ship / qtr.
– Term: 7 years
Tax Rate:
– 0 %
Illustrative Earnings Potential Based on Potential Charter Day Rates(2)
($ in millions)
$200.0 $160.0 $120.0 $80.0 $40.0
–
$186.5
$133.2 $136.1
$116.6
$93.2 $85.7
$68.0 $61.2 $42.8
2015E 2016E 2017E $15,000 / day $20,000 / day $25,000 / day
Analyst Estimates: based on weighted average of analyst projections (ICAP, Stifel, RS Platou, Pareto, Clarksons, Jefferies, and DNB). Operating costs do not include bareboat expenses, G&A or depreciation.
For illustrative purposes only. Assumes an illustrative operating expense per ship of $6,500 per day, average operating days per year of 360, and an illustrative fleet size of 14 vessels in 2015, 24 vessels in 2016, and 28 vessels in 2017. We cannot assure you that Parakou will be successful in completing these negotiations or the acquisition of these vessels on the time frame anticipated or at all.
Parakou Tankers, Inc.
20
| 6 |
|
Attractive Valuation with Significant Earnings Leverage |
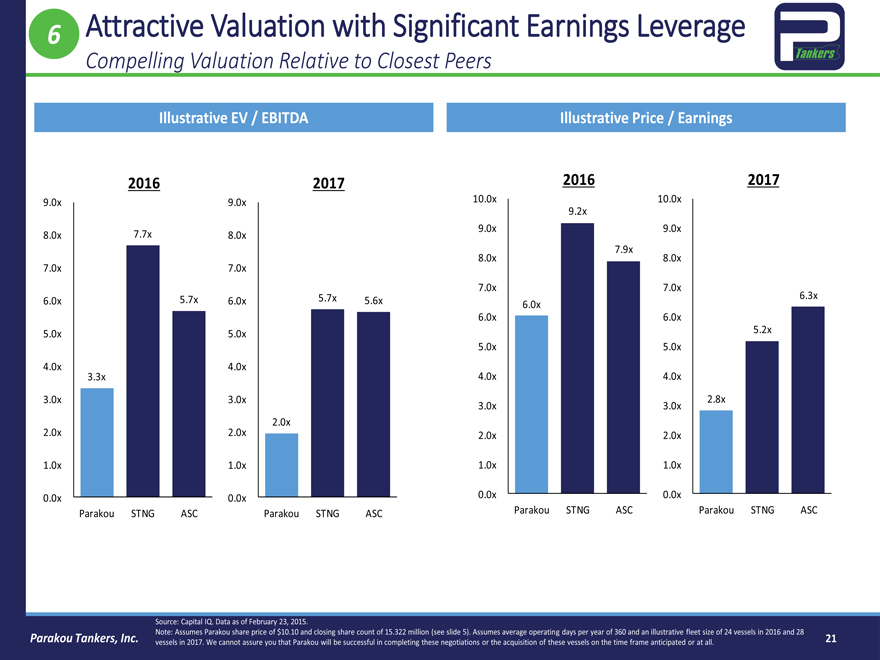
Compelling Valuation Relative to Closest Peers
Illustrative EV / EBITDA
2016 2017
| 9.0x |
|
9.0x |
| 8.0x |
|
7.7x 8.0x |
| 7.0x |
|
7.0x |
| 6.0x |
|
5.7x 6.0x 5.7x 5.6x |
| 5.0x |
|
5.0x |
| 4.0x |
|
4.0x |
3.3x
| 3.0x |
|
3.0x |
2.0x
| 2.0x |
|
2.0x |
| 1.0x |
|
1.0x |
| 0.0x |
|
0.0x |
Parakou STNG ASC Parakou STNG ASC
Illustrative Price / Earnings
2016 2017
| 10.0x |
|
10.0x |
9.2x
| 9.0x |
|
9.0x |
7.9x
| 8.0x |
|
8.0x |
| 7.0x |
|
7.0x |
6.3x
6.0x
| 6.0x |
|
6.0x |
5.2x
| 5.0x |
|
5.0x |
| 4.0x |
|
4.0x |
2.8x
| 3.0x |
|
3.0x |
| 2.0x |
|
2.0x |
| 1.0x |
|
1.0x |
| 0.0x |
|
0.0x |
Parakou STNG ASC Parakou STNG ASC
Source: Capital IQ. Data as of February 23, 2015.
Note: Assumes Parakou share price of $10.10 and closing share count of 15.322 million (see slide 5). Assumes average operating days per year of 360 and an illustrative fleet size of 24 vessels in 2016 and 28 vessels in 2017. We cannot assure you that Parakou will be successful in completing these negotiations or the acquisition of these vessels on the time frame anticipated or at all.
Parakou Tankers, Inc.
21
Investment Highlights
| 1 |
|
Positive industry dynamics |
| 2 |
|
Compelling growth strategy |
| 3 |
|
Fully integrated platform with low cost competitive advantage |
| 4 |
|
Access to strategically important, high-growth Asian markets |
| 5 |
|
Highly experienced management team and board |
| 6 |
|
Attractive valuation with significant earnings leverage |
Parakou Tankers, Inc.
22
Appendix
Parakou Tankers, Inc.
23
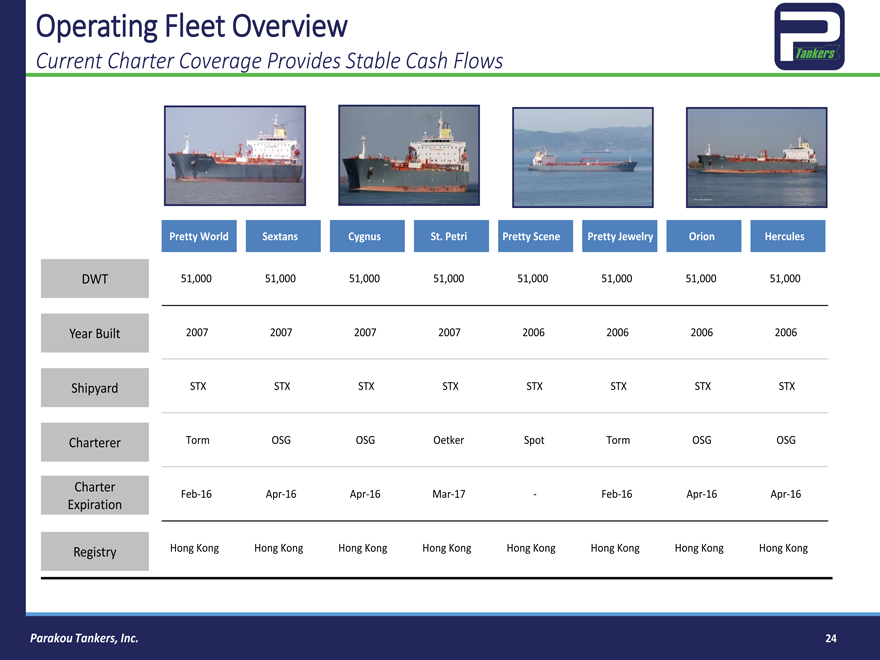
Operating Fleet Overview
Current Charter Coverage Provides Stable Cash Flows
Pretty World Sextans Cygnus St. Petri Pretty Scene Pretty Jewelry Orion Hercules
DWT 51,000 51,000 51,000 51,000 51,000 51,000 51,000 51,000
Year Built 2007 2007 2007 2007 2006 2006 2006 2006
Shipyard STX STX STX STX STX STX STX STX
Charterer Torm OSG OSG Oetker Spot Torm OSG OSG
Charter Feb-16 Apr-16 Apr-16 Mar-17—Feb-16 Apr-16 Apr-16
Expiration
Registry Hong Kong Hong Kong Hong Kong Hong Kong Hong Kong Hong Kong Hong Kong Hong Kong
Parakou Tankers, Inc.
24
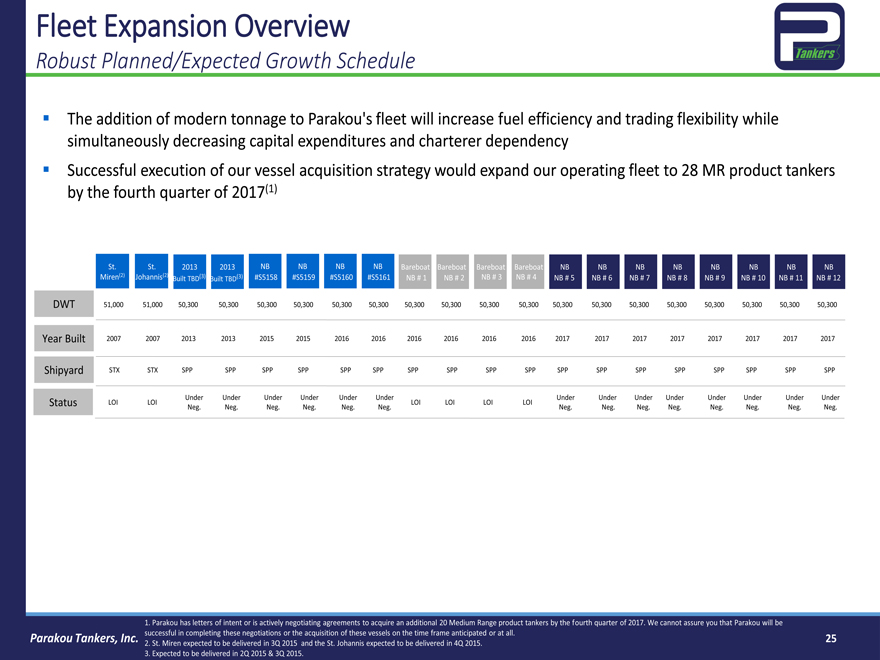
Fleet Expansion Overview
Robust Planned/Expected Growth Schedule
The addition of modern tonnage to Parakou’s fleet will increase fuel efficiency and trading flexibility while simultaneously decreasing capital expenditures and charterer dependency Successful execution of our vessel acquisition strategy would expand our operating fleet to 28 MR product tankers by the fourth quarter of 2017(1)
St. St. 2013 2013 NB NB NB NB Bareboat Bareboat Bareboat Bareboat NB NB NB NB NB NB NB NB
Miren(2) Johannis(2) Built TBD(3) Built TBD(3) #S5158 #S5159 #S5160 #S5161 NB # 1 NB # 2 NB # 3 NB # 4 NB # 5 NB # 6 NB # 7 NB # 8 NB # 9 NB # 10 NB # 11 NB # 12
DWT 51,000 51,000 50,300 50,300 50,300 50,300 50,300 50,300 50,300 50,300 50,300 50,300 50,300 50,300 50,300 50,300 50,300 50,300 50,300 50,300
Year Built 2007 2007 2013 2013 2015 2015 2016 2016 2016 2016 2016 2016 2017 2017 2017 2017 2017 2017 2017 2017
Shipyard STX STX SPP SPP SPP SPP SPP SPP SPP SPP SPP SPP SPP SPP SPP SPP SPP SPP SPP SPP
Under Under Under Under Under Under Under Under Under Under Under Under Under Under
Status LOI LOI LOI LOI LOI LOI
Neg. Neg. Neg. Neg. Neg. Neg. Neg. Neg. Neg. Neg. Neg. Neg. Neg. Neg.
1. Parakou has letters of intent or is actively negotiating agreements to acquire an additional 20 Medium Range product tankers by the fourth quarter of 2017. We cannot assure you that Parakou will be successful in completing these negotiations or the acquisition of these vessels on the time frame anticipated or at all.
2. St. Miren expected to be delivered in 3Q 2015 and the St. Johannis expected to be delivered in 4Q 2015.
3. Expected to be delivered in 2Q 2015 & 3Q 2015.
Parakou Tankers, Inc.
25
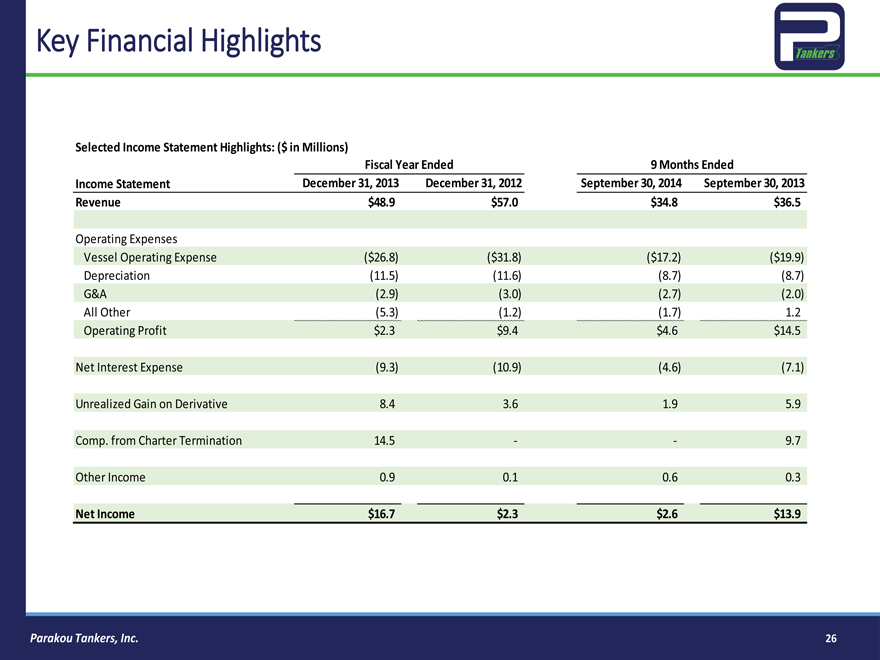
Key Financial Highlights
Selected Income Statement Highlights: ($ in Millions)
Fiscal Year Ended 9 Months Ended
Income Statement December 31, 2013 December 31, 2012 September 30, 2014 September 30, 2013
Revenue $48.9 $57.0 $34.8 $36.5
Operating Expenses
Vessel Operating Expense($26.8)($31.8)($17.2)($19.9)
Depreciation(11.5)(11.6)(8.7)(8.7)
G&A(2.9)(3.0)(2.7)(2.0)
All Other(5.3)(1.2)(1.7) 1.2
Operating Profit $2.3 $9.4 $4.6 $14.5
Net Interest Expense(9.3)(10.9)(4.6)(7.1)
Unrealized Gain on Derivative 8.4 3.6 1.9 5.9
Comp. from Charter Termination 14.5 — 9.7
Other Income 0.9 0.1 0.6 0.3
Net Income $16.7 $2.3 $2.6 $13.9
Parakou Tankers, Inc.
26
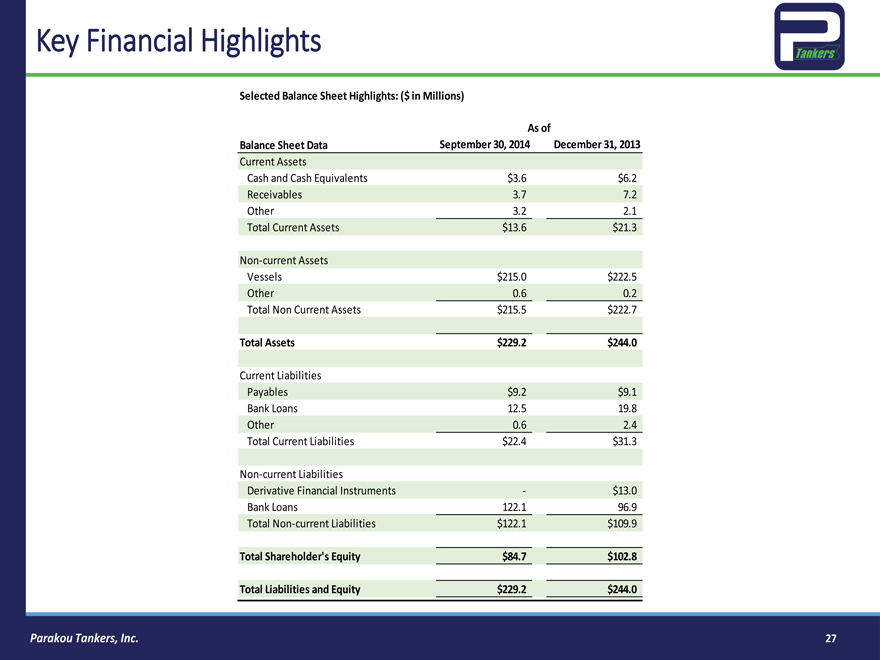
Key Financial Highlights
Selected Balance Sheet Highlights: ($ in Millions)
As of
Balance Sheet Data September 30, 2014 December 31, 2013
Current Assets
Cash and Cash Equivalents $3.6 $6.2
Receivables 3.7 7.2
Other 3.2 2.1
Total Current Assets $13.6 $21.3
Non-current Assets
Vessels $215.0 $222.5
Other 0.6 0.2
Total Non Current Assets $215.5 $222.7
Total Assets $229.2 $244.0
Current Liabilities
Payables $9.2 $9.1
Bank Loans 12.5 19.8
Other 0.6 2.4
Total Current Liabilities $22.4 $31.3
Non-current Liabilities
Derivative Financial Instruments—$13.0
Bank Loans 122.1 96.9
Total Non-current Liabilities $122.1 $109.9
Total Shareholder’s Equity $84.7 $102.8
Total Liabilities and Equity $229.2 $244.0
Parakou Tankers, Inc.
27