Attached files
| file | filename |
|---|---|
| 8-K - FORM 8-K - NAVISTAR INTERNATIONAL CORP | d883322d8k.htm |
| EX-99.1 - EX-99.1 - NAVISTAR INTERNATIONAL CORP | d883322dex991.htm |
 International
®
is a registered trademark of
, Inc.
Q1 2015 EARNINGS PRESENTATION
MARCH 3, 2015
Exhibit 99.2 |
 2
NYSE: NAV
Q1 2015 Earnings –
3/3/2015
Safe Harbor
Statement
Information provided and statements contained in this report that are
not purely historical are forward-looking statements within
the meaning of Section 27A of the Securities Act of 1933, as
amended, Section 21E of the Securities Exchange Act of 1934, as
amended, and the Private Securities Litigation Reform Act of
1995. Such forward-looking statements only speak as of the date
of this report and the Company assumes no obligation to update the
information included in this report. Such forward-looking
statements include information concerning our possible or assumed
future results of operations, including descriptions of our business
strategy. These statements often include words such as
“believe,” “expect,” “anticipate,” “intend,” “plan,” “estimate,” or similar
expressions. These statements are not guarantees of performance or
results and they involve risks, uncertainties, and assumptions.
For a further description of these factors, see the risk factors set forth
in our filings with the Securities and Exchange Commission, including
our annual report on Form 10-K for the year ended October
31, 2014. Although we believe that these forward-looking
statements are based on reasonable assumptions, there are many factors
that could affect our actual financial results or results of
operations and could cause actual results to differ materially from those
in the forward-looking statements. All future written and oral
forward-looking statements by us or persons acting on our
behalf are expressly qualified in their entirety by the cautionary statements
contained or referred to above. Except for our ongoing obligations to
disclose material information as required by the federal
securities laws, we do not have any obligations or intention to release
publicly any revisions to any forward-looking statements to reflect
events or circumstances in the future or to reflect the
occurrence of unanticipated events. |
 3
NYSE: NAV
Q1 2015 Earnings –
3/3/2015
Other Cautionary Notes
The financial information herein contains audited and unaudited
information and has been prepared by management in good faith
and based on data currently available to the Company.
Certain non-GAAP measures are used in this presentation to assist
the reader in understanding our core manufacturing business. We
believe this information is useful and relevant to assess and
measure the performance of our core manufacturing business as it
illustrates manufacturing performance. It also excludes
financial services and other items that may not be related to the core
manufacturing business or underlying results. Management often uses
this information to assess and measure the underlying
performance of our operating segments. We have chosen to provide this
supplemental information to investors, analysts, and other interested
parties to enable them to perform additional analyses of
operating results. The non-GAAP numbers are reconciled to the most
appropriate GAAP number in the appendix of this presentation. |
 4
NYSE: NAV
Q1 2015 Earnings –
3/3/2015
Agenda
Overview
Troy Clarke
Financial Results
Walter Borst
Summary
Troy Clarke |
 1
ST
QUARTER 2015 RESULTS
Troy Clarke, President & CEO
NYSE: NAV |
 6
Q1 2015 Earnings –
3/3/2015
Our Mission: Uptime
Finish the
Turnaround
Uptime
Advantage
Leadership
Advantage
Fewer service incidents
Shorten repair times
NYSE: NAV |
 Q1 2015 Earnings –
3/3/2015
Capitalizing on Industry Momentum
U.S.
economy
continues
to
improve
Favorable
market
conditions
expected
to
continue
in
2015
Consumer
spending
growing
Steady
gains
in
construction
Industry:
NYSE: NAV
7 |
 8
NYSE: NAV
Q1 2015 Earnings –
3/3/2015
Q1 Performance:
•
$91 million year-over-year
adjusted EBITDA
improvement
Significant Progress on Cost:
•
Reduced warranty spend
and expense
•
Improved material,
manufacturing, and
structural costs
1st Quarter Summary
Positive Sales Momentum:
•
Chargeouts
(A)
up 17%
-
Class 6-7 Medium up 25%
-
School Bus up 42%
•
Backlog up 27%
•
Parts up 7%
(A) Includes U.S. and Canada School bus and Class 6-8
medium and heavy truck. |
 NYSE: NAV
FINANCIAL RESULTS
Walter Borst, Executive Vice President & CFO
|
 10
NYSE: NAV
Q1 2015 Earnings –
3/3/2015
Q1 2015 Segment Realignment
Changes within our reporting segments:
Current Segments
Prior Segments
Export Truck
Truck
Global Operations
Export Parts
Parts
Global Operations
Military Parts
Truck
North America Parts |
 11
NYSE: NAV
Q1 2015 Earnings –
3/3/2015
Income Statement Summary
Note:
This slide contains non-GAAP information; please see the
REG G in appendix for a detailed reconciliation.
$ in millions, except per share
Quarters Ended
January 31
2015
2014
Chargeouts
(A)
13,500
11,500
Sales and Revenues
$2,421
$2,208
Income (Loss) from Continuing Operations, Net of Tax
(B)
($42)
($249)
Diluted Loss Per Share from Continuing Operations
(B)
($0.52)
($3.07)
EBITDA
$101
($110)
(A)
Includes U.S. and Canada School bus and Class 6-8 medium
and heavy truck.
(B) Amounts attributable to Navistar International
Corporation. |
 12
NYSE: NAV
Q1 2015 Earnings –
3/3/2015
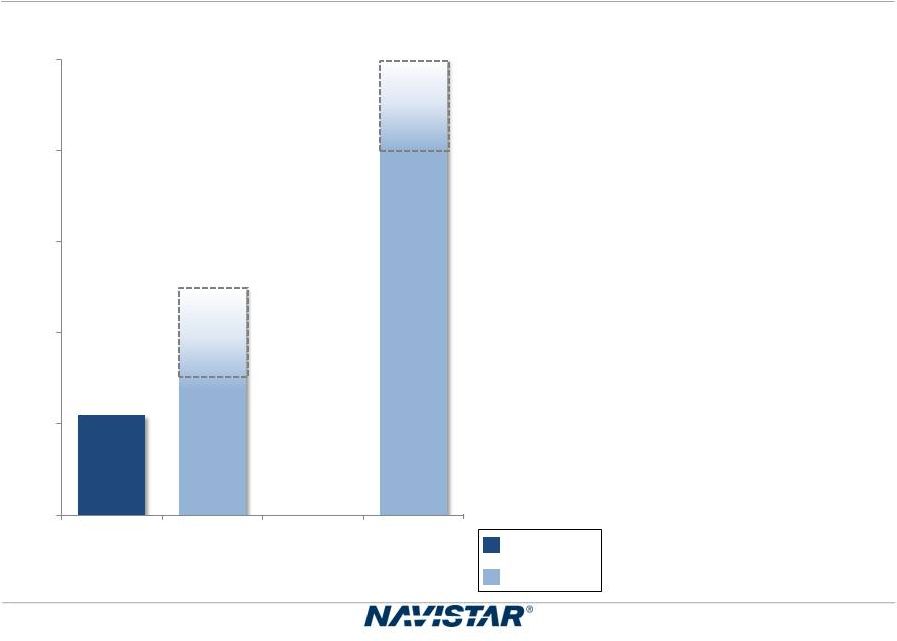
Q1 2015 EBITDA
$ in millions
Note:
This slide contains non-GAAP information; please see the
REG G in appendix for a detailed reconciliation.
* Excluding pre-existing warranty and one-time items.
*
$101
$54
$57
($10)
$0
$50
$100
$150
Q1 2015
Actual EBITDA
Pre-existing Warranty
Adjustment
One-time Items
Q1 2015
Adjusted EBITDA
Q1
Guidance:
$0-$50 |
 13
NYSE: NAV
Q1 2015 Earnings –
3/3/2015
Q1 2015 Segment Results
Segment Results:
Truck
($18)
($208)
Parts
$145
$108
Global Operations
($15)
($35)
Financial Services
$24
$23
Quarters Ended
January 31
2015
2014
$ in millions
Beginning in the first quarter of 2015, the Company realigned its
reporting segments. The segment results have been restated to
reflect this change. |
 14
NYSE: NAV
Q1 2015 Earnings –
3/3/2015
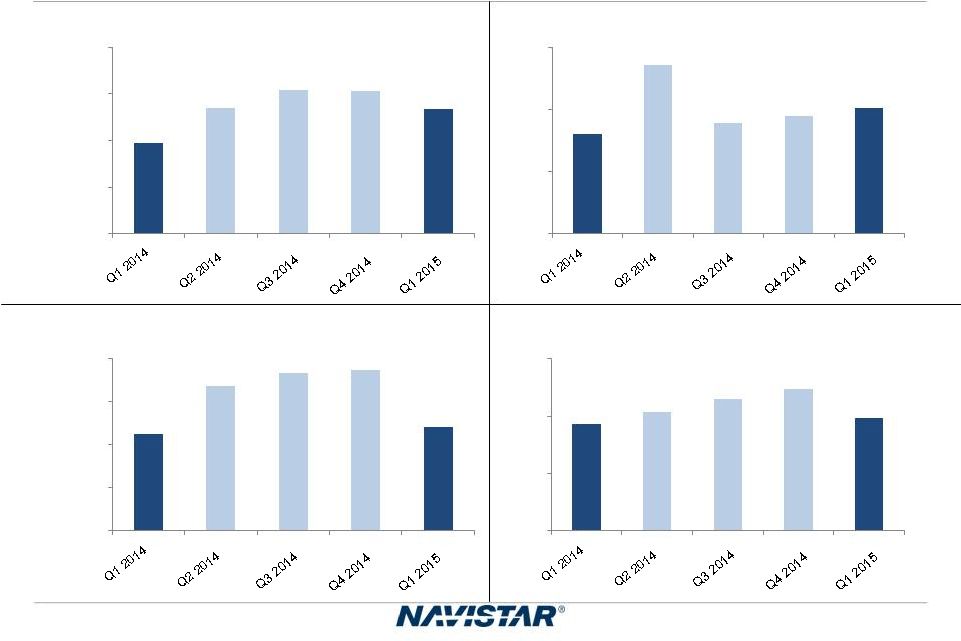
First Quarter Progress
(A) Includes U.S. and Canada School bus and Class 6-8
medium and heavy truck.
(B) Excludes amounts related to pre-existing
warranties. 10,000
11,000
12,000
13,000
14,000
1Q14
1Q15
Chargeouts
(A)
10%
12%
14%
16%
1Q14
1Q15
Structural Costs % Manufacturing Revenue
2%
3%
4%
1Q14
1Q15
Current Warranty Expense
(B)
%
Manufacturing Revenue
-2%
0%
2%
4%
1Q14
1Q15
Adjusted EBITDA Margin
Note:
This slide contains non-GAAP information; please see the
REG G in appendix for a detailed reconciliation.
|
 15
NYSE: NAV
Q1 2015 Earnings –
3/3/2015
Operational Cost Status
Gross Material Savings*
% Manufacturing Revenue
*Excludes incremental SCR costs
Manufacturing
Savings
Actual
Forecast
•
Achieved a quarter of our
annual savings in Q1
•
On track to achieve
annual savings
1.2%
1.7%
1.5 –
1.8%
0%
1%
2%
3%
2013
2014
2015
$44
$79
$40 –
$60
$0
$25
$50
$75
$100
2013
2014
2015 |
 16
NYSE: NAV
Q1 2015 Earnings –
3/3/2015
Used Truck Update
•
Q1 ending gross
inventory balance of
$365 million
•
Inventory expected to
peak in 2015 as we
accelerate the trade cycle |
 17
Q1 2015 Earnings –
3/3/2015
Q1 2015 Manufacturing Cash Update
$ in millions
*Guidance as provided on 12/16/2014 **Cash balance includes
marketable securities ^ Excluding one-time items
and pre-existing warranty ^^Includes incremental
$43 million NFC intercompany loan Note:
This slide contains non-GAAP information; please see the
REG G in appendix for a detailed reconciliation.
Guidance*
Actual
Q4 2014 Manufacturing Cash Balance**
$1,018
$1,018
Consolidated Adjusted EBITDA
^
$0 -
$50
$54
Capex/Cash Interest/Pension & OPEB Funding
($160) -
($170)
($134)
Change in Net Working Capital/Debt and
Warranty/Other ^^
($158) –
($98)
($205)
Q1 2015 Manufacturing Cash Balance**
$700-800
$733 |
 18
Q1 2015 Earnings –
3/3/2015
Guidance: Q2 2015 Manufacturing Cash
$ in millions
* Cash balance includes marketable securities.
** Excluding one-time items and pre-existing warranty
Note:
This slide contains non-GAAP information; please see the
REG G in appendix for a detailed reconciliation.
Q2 2015
Guidance
Q1 2015 Manufacturing Cash Balance*
$733
Consolidated Adjusted EBITDA**
$100 -
$150
Capex/Cash Interest/Pension & OPEB Funding
($120) -
($110)
Change in Net Working Capital/Debt and Warranty/Other
($13) -
$27
Q2 2015 Manufacturing Cash Balance*
$700 -
$800 |
 19
Q1 2015 Earnings –
3/3/2015
8-10%
Adjusted EBITDA Margin Improvement
$ in millions
Note:
This slide contains non-GAAP information; please see the
REG G in appendix for a detailed reconciliation.
•
Q1 adjusted EBITDA
margin up 400 basis
points year-over-year
•
Continued progress
towards our 2015 target
2.2%
3-5%
2015 Adjusted EBITDA Margin
2015 Actual
2015 Forecast
0%
2%
4%
6%
8%
10%
Q1
Q2
Q3
Q4 |
 20
NYSE: NAV
Q1 2015 Earnings –
3/3/2015
Q1 2015 Accomplishments:
•
Increased chargeouts by 2,000 units year-over-year
•
Continued growth in Parts business
•
Improved quality performance contributing to lower warranty
expense
•
Continued material, manufacturing and structural cost reductions
Adjusted EBITDA goal of 8-10% exiting 2015 is on track
Summing It Up |
 NYSE: NAV
SUMMARY
Troy Clarke, President & CEO |
 22
NYSE: NAV
Q1 2015 Earnings –
3/3/2015
Q2:
Full Year 2015:
2015 Expectations
•
Chargeouts up over 20% sequentially
•
Adjusted EBITDA of $100-$150 million
•
Manufacturing cash balance of $700-$800 million
•
Class 6-8 truck and bus industry: 350,000 to 380,000
-
Class 8 industry: 250,000 to 280,000
•
Additional cost reduction opportunities
•
Exiting adjusted EBITDA goal of 8-10%: On track
|
 NYSE: NAV
APPENDIX |
 24
NYSE: NAV
Q1 2015 Earnings –
3/3/2015
Navistar Financial Corporation
Highlights
•
Financial Services Segment profit of $24 million for Q1 2015
•
Total U.S. financing availability of $353 million as of January 31,
2015 •
Financial Services Debt/Equity Leverage of 3.8:1
•
Dealer funding facility issued November 2014 for $250 million
Retail Notes
Bank Facility
•
$840 million facility ($500 million
revolver and $340 million term
loan matures in December 2016)
–
Funding for retail notes,
wholesale notes, retail accounts,
and dealer open accounts
•
On balance sheet
•
NFSC wholesale trust as of
January 2015
–
$1 billion funding facility
–
Variable portion matures January
2016
–
Term portions mature September
2015 and October 2016
•
On balance sheet
•
Broader product offering
•
Enhanced ability to support large
fleets
•
Better access to less expensive
capital
Dealer Floor Plan |
 25
NYSE: NAV
Q1 2015 Earnings –
3/3/2015
Chargeouts
-
1,000
2,000
3,000
4,000
School Bus
-
2,000
4,000
6,000
Class 6-7 Medium
-
2,000
4,000
6,000
8,000
Class 8 Heavy
-
1,000
2,000
3,000
Class 8 Severe |
 26
NYSE: NAV
Q1 2015 Earnings –
3/3/2015
Retail Market Share in Commercial Vehicle Segments
Class 6/7
Medium-Duty
Class 8
Severe Service
Class 8
Heavy
Three Months Ended
January 31,
2015
October 31,
2014
July 31,
2014
April 30,
2014
January 31,
2014
Core
Markets (U.S. and Canada)
Class 6 and 7 medium trucks
.........................................................
21%
19%
20
%
26
%
17
%
Class 8 heavy trucks
......................................................................
10%
15%
14
%
14
%
12
%
Class 8 severe service trucks
.........................................................
14%
14%
15
%
17
%
19
%
Combined class 8 trucks
................................................................
11%
15%
14
%
15
%
14
% |
 27
NYSE: NAV
Q1 2015 Earnings –
3/3/2015
Worldwide Truck Chargeouts
Three Months Ended
(in units)
2015
2014
Change
% Change
Core
Markets (U.S. and Canada)
School buses
.......................................................................................
2,700
1,900
800
42
%
Class
6 and 7 medium trucks
..............................................................
4,000
3,200
800
25
%
Class
8 heavy trucks
..........................................................................
4,800
4,500
300
7%
Class
8 severe service trucks
.............................................................
2,000
1,900
100
5%
Total Core markets
13,500
11,500
2,000
17
%
Other
markets
(A)
..................................................................................
7,000
5,500
1,500
27
%
Total worldwide units
..............................................................................
20,500
17,000
3,500
21
%
Combined Class 8 trucks
6,800
6,400
400
6%
We define chargeouts as trucks that have been invoiced to customers.
The units held in dealer inventory represent the principal difference between
retail deliveries and chargeouts. This table summarizes our approximate
worldwide chargeouts from our continuing operations. We define our Core markets to include U.S. and Canada School bus and
Class 6 through 8 medium and heavy truck. Our Core markets include
CAT-branded units sold to Caterpillar under our North America
supply agreement. (A) Includes: chargeouts related to Blue Diamond Truck ("BDT")
of 3,400 units and 2,400 units during the three months ended January 31, 2015.
..................................................................
January 31,
..............................................................................
|
 28
NYSE: NAV
Q1 2015 Earnings –
3/3/2015
Worldwide Engine Shipments
Three Months Ended
January 31,
(in units)
2015
2014
Change
% Change
OEM sales-South America
..................................................................
17,200
20,400
(3,200)
(16
)%
Intercompany sales
..............................................................................
10,800
9,500
1,300
14
%
Other OEM sales
..................................................................................
1,400
2,400
(1,000)
(42
)%
Total sales
......................................................................................
29,400
32,300
(2,900)
(9
)% |
 29
NYSE: NAV
Q1 2015 Earnings –
3/3/2015
U.S. and Canada Dealer Stock Inventory*
*Includes U.S. and Canada Class 4-8 and school bus inventory, but
does not include U.S. IC Bus. 3,000
4,000
5,000
6,000
7,000
8,000
9,000
10,000
11,000 |
 30
NYSE: NAV
Q1 2015 Earnings –
3/3/2015
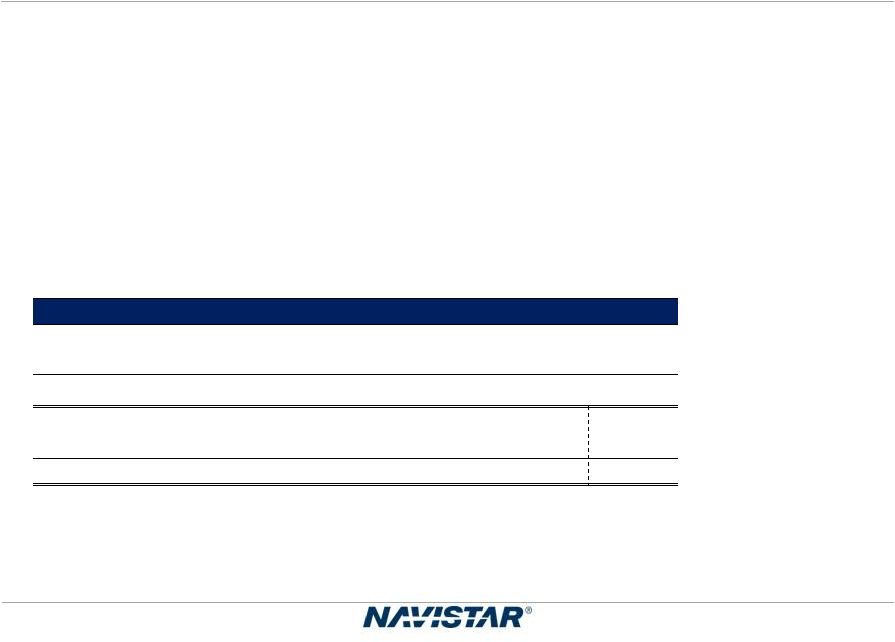
Frequently Asked Questions
Q1:
What is included in Corporate and Eliminations?
A:
The primary drivers of Corporate and Eliminations are Corporate
SG&A, pension and OPEB expense (excluding amounts allocated
to the segments), annual incentive, manufacturing interest expense, and
the elimination of intercompany sales and profit between
segments.
Q2:
What is included in your equity in loss of non-consolidated
affiliates? A:
Equity in loss of non-consolidated affiliates is derived from our
ownership interests in partially-owned affiliates that are not
consolidated.
Q3:
What is your net income attributable to non-controlling
interests? A:
Net income attributable to non-controlling interests is the result
of the consolidation of subsidiaries in which we do not own 100%,
and is primarily comprised of Ford's non-controlling interest in
our Blue Diamond Parts joint venture. Q4:
What are your expected 2015 and beyond pension funding
requirements? A:
Future contributions are dependent upon a number of factors,
principally the changes in values of plan assets, changes in interest rates
and the impact of any funding relief currently under consideration. For
the three months ended January 31, 2015, we contributed $30
million to meet the minimum required contributions for all plans. In
August 2014, the Highway and Transportation Funding Act of 2014,
which included an extension of the pension funding interest rate relief, was signed into law. As a result, we lowered our funding
expectations. We expect to contribute an additional $117 million to our
pension plans during 2015. We currently expect that from
2016 through 2017, the Company will be required to contribute at least
$100 million per year to the plans, depending on asset
performance and discount rates. |
 31
NYSE: NAV
Q1 2015 Earnings –
3/3/2015
Frequently Asked Questions
Q5:
What is your expectation for future cash tax payments?
A:
Our cash tax payments are expect to remain low in 2015 and will
gradually increase as we utilize available net operating losses
(NOLs) and tax credits in future years.
Q6:
What is the current balance of net operating losses as compared to other
deferred tax assets? A:
As of October 31, 2014 the Company has deferred tax assets for U.S.
federal NOLs valued at $870 million, state NOLs valued at
$144
million,
and
foreign
NOLs
valued
at
$199
million,
for
a
total
undiscounted
cash
value
of
$1.2
billion.
In
addition
to
NOLs,
the
Company has deferred tax assets for accumulated tax credits of $256
million and other deferred tax assets of $1.9 billion resulting in
net deferred tax assets before valuation allowances of approximately
$3.4 billion. Of this amount, $3.2 billion is subject to a
valuation allowance at the end of FY2014.
Q7:
How does your FY 2015 Class 8 industry outlook compare to ACT Research?
A:
U.S. and Canadian Class 8 Truck Sales
Reconciliation
to
ACT
-
Retail
Sales
2015
ACT*
302,000
CY to FY adjustment
(5,393)
Total (ACT comparable Class 8 to Navistar)
296,607
Navistar Industry Retail Deliveries Combined Class 8 Trucks
250,000
280,000
Navistar difference from ACT
46,607
16,607
*Source:
ACT
N.A.
Commercial
Vehicle
Outlook
-
February
2015
15.7%
5.6% |
 32
NYSE: NAV
Q1 2015 Earnings –
3/3/2015
Frequently Asked Questions
Q8:
What is your manufacturing interest expense for Fiscal Year 2015?
A:
Manufacturing interest for 2015 is forecasted to be down approximately
5% compared to 2014. For reference, interest expense was $243
million and $251 million for FY 2014 and 2013, respectively.
Q9:
What should we assume for capital expenditures in Fiscal Year 2015?
A:
Capital expenditures for 2015 is forecasted to be between $150 -
200 million. In comparison, capital expenditures were $88 million
and $167 million for FY 2014 and 2013, respectively.
|
 33
NYSE: NAV
Q1 2015 Earnings –
3/3/2015
Outstanding Debt Balances
(in millions)
January 31,
2015
October 31,
2014
Manufacturing operations
Senior Secured Term Loan Credit Facility, as amended, due 2017, net of
unamortized discount of $3, at both
dates...........................................................................................................................
$
694
$
694
8.25% Senior Notes, due 2021, net of unamortized discount of $19 and
$20, respectively............. 1,181
1,180
4.50% Senior Subordinated Convertible Notes, due 2018, net of
unamortized discount of $18 and $19,
respectively..............................................................................................................................
182
181
4.75% Senior Subordinated Convertible Notes, due 2019, net of
unamortized discount of $38 and $40,
respectively.............................................................................................................................
373
371
Debt of majority-owned dealerships
....................................................................................................
28
30
Financing arrangements and capital lease
obligations.........................................................................
51
54
Loan Agreement related to 6.5% Tax Exempt Bonds, due
2040......................................................
225
225
Promissory
Note.......................................................................................................................................
8
10
Financed lease obligations
..................................................................................................................
160
184
Other
......................................................................................................................................................
27
29
Total Manufacturing operations debt
......................................................................................
2,929
2,958
Less: Current portion
.................................................................................................................
114
100
Net long-term Manufacturing operations debt
.......................................................................
$
2,815
$
2,858
(in millions)
January 31,
2015
October 31,
2014
Financial Services operations
Asset-backed debt issued by consolidated SPEs, at fixed and
variable rates, due serially through
2018......................................................................................................................................................
$
887
$
914
Bank
revolvers,
at
fixed
and
variable
rates,
due
dates
from
2015
through
2020......................
1,169
1,242
Commercial paper, at variable rates, program matures in
2017..........................................................
64
74
Borrowings secured by operating and finance leases, at various rates,
due serially through 2018.... 33
36
Total Financial Services operations
debt.................................................................................
..
2,153
2,266
Less: Current portion
.....................................................................................................................
927
1,195
Net long-term Financial Services operations debt
................................................................
$
1,226
$
1,071 |
 34
NYSE: NAV
Q1 2015 Earnings –
3/3/2015
SEC Regulation G Non-GAAP Reconciliation
SEC Regulation G Non-GAAP Reconciliation
The financial measures
presented below are unaudited and not in accordance with, or an alternative for, financial measures presented in accordance with U.S.
generally accepted accounting principles ("GAAP"). The
non-GAAP financial information presented herein should be considered supplemental to, and not as a
substitute for, or superior to, financial measures calculated in
accordance with GAAP and are reconciled to the most appropriate GAAP number below.
Earnings (loss) Before Interest, Income Taxes, Depreciation, and
Amortization (“EBITDA”):
We define EBITDA as our consolidated net income (loss) from continuing
operations attributable to Navistar International Corporation, net of tax, plus
manufacturing interest expense, income taxes, and depreciation and
amortization. We believe EBITDA provides meaningful information to the performance of
our business and therefore we use it to supplement our GAAP reporting.
We have chosen to provide this supplemental information to investors, analysts and other
interested parties to enable them to perform additional analyses of
operating results.
Adjusted EBITDA:
We believe that adjusted EBITDA, which excludes certain
identified items that we do not consider to be part of our ongoing business, improves the comparability
of year to year results, and is representative of our underlying
performance. Management uses this information to assess and measure the performance of our
operating segments. We have chosen to provide this supplemental
information to investors, analysts and other interested parties to enable them to perform
additional analyses of operating results, to illustrate the results of
operations giving effect to the non-GAAP adjustments shown in the below reconciliations,
and to provide an additional measure of performance. Adjusted EBITDA
margin:
We define Adjusted EBITDA margin as a percentage of the Company's
consolidated sales and revenues. We have chosen to provide this supplemental information
to investors, analysts and other interested parties to enable them to
perform additional analyses of operating results, to illustrate the results of operations giving
effect to the non-GAAP adjustments shown in the below
reconciliations, and to provide an additional measure of performance.
Manufacturing Cash, Cash Equivalents, and Marketable Securities: Manufacturing
cash, cash equivalents, and marketable securities represents the Company’s consolidated cash, cash equivalents, and marketable securities
excluding cash, cash equivalents, and marketable securities of our
financial services operations. We include marketable securities with our cash and cash
equivalents when assessing our liquidity position as our investments
are highly liquid in nature. We have chosen to provide this supplemental information to
investors, analysts and other interested parties to enable them to
perform additional analyses of our ability to meet our operating requirements, capital
expenditures, equity investments, and financial obligations. Structural costs
consists of Selling, general and administrative expenses and
Engineering and product development costs. |
 35
NYSE: NAV
Q1 2015 Earnings –
3/3/2015
SEC Regulation G Non-GAAP Reconciliations
Manufacturing segment cash and cash equivalents and marketable securities
reconciliation: Jan. 31,
Oct. 31,
(in millions)
2015
2014
Manufacturing Operations:
Cash and cash equivalents
$
583
$
440
Marketable securities
150
578
Manufacturing Cash and cash equivalents and Marketable securities
$
733
$
1,018
Financial Services Operations:
Cash and cash equivalents
$
37
$
57
Marketable securities
25
27
Financial Services Cash and cash equivalents and Marketable
securities $
62
$
84
Consolidated Balance Sheet
Cash and cash equivalents
$
620
$
497
Marketable Securities
175
605
Consolidated Cash and cash equivalents and Marketable securities
$
795
$
1,102
..........................................
....................................................................................................................
.............................................................................................................
.............................................................................................................
............................
.....................................................................................................................
.............................................................................................................
.....................................................................................................................
.............................................................................................................
......................................
|
 36
NYSE: NAV
Q1 2015 Earnings –
3/3/2015
SEC Regulation G Non-GAAP Reconciliations
Earnings (loss) before interest, taxes, depreciation, and amortization
("EBITDA") reconciliation ______________________
______________________
* For more detail on the items noted, please see slide 37 footnotes
(A) and (C), respectively. Quarters
Ended
January 31,
(in millions)
2015
2014
Loss from continuing operations attributable to NIC, net of tax
$
(42)
$
(249)
Plus:
Depreciation and amortization expense
79
86
Manufacturing interest expense
(A)
57
65
Less:
Income tax benefit (expense)
(7)
12
EBITDA
$
101
$
(110)
Quarters
Ended
January 31,
(in millions)
2015
2014
Interest expense
77
82
Less: Financial services interest expense
20
17
Manufacturing interest expense
$
57
$
65
Quarters
Ended
January 31,
(in millions)
2015
2014
EBITDA (reconciled above)
$
101
$
(110)
Less significant items of:
Adjustments to pre-existing warranties*
(57)
52
North America asset impairment charges*
7
18
Cost reduction and other strategic initiatives
3
3
Total adjustments
(47)
73
Adjusted EBITDA
$
54
$
(37)
Adjusted EBITDA margin
2.2%
(1.7)%
..................................................................................................................................
...............................................................................................
........................................................................................
...............................................................................
....................................................
....................................................................................................................
......................................................................................
..................................................................................................
................................................................................................
............................................................................
.......................................................................
....................................................................
...............................................................................................................
.....................................................................................................
(A) Manufacturing interest expense is the net interest
expense primarily generated for borrowings that support the manufacturing and corporate
operations, adjusted to eliminate intercompany interest expense with
our Financial Services segment. The following table reconciles
Manufacturing interest expense to the consolidated interest expense:
|
 37
NYSE: NAV
Q1 2015 Earnings –
3/3/2015
Significant Items Included Within Our Results
______________________
(A)
Adjustments to pre-existing warranties reflect changes in our
estimate of warranty costs for products sold in prior periods.
(B)
In the first quarter of 2015, the Truck segment recognized charges of
$13 million for the acceleration of depreciation of certain assets related to the foundry
facilities.
(C)
In the first quarter of 2015, the Company concluded it had a
triggering event related to certain operating leases. As a result, the Truck segment recorded $7
million of asset impairment charges. In the first quarter of
2014, the Company concluded it had a triggering event related to potential sales of assets
requiring assessment of impairment for certain intangible and
long-lived assets in the Truck segment. As a result, the Truck segment recognized asset
impairment charges of $18 million.
The above items did not have a material impact on taxes due to the
valuation allowances on our U.S. and Brazil deferred tax assets.
Quarters
Ended
January 31,
(in millions)
Expense (income):
2015
2014
Adjustments to pre-existing warrants
(A)
..
$
(57)
$
52
Accelerated depreciation
(B)
.....................................................................................................................
13
—
North America asset impairment charges
(C)
7
18
Other restructuring charges and strategic initiatives
3
3
.................................................................................................
.............................................................................................
................................................................................
|