Attached files
| file | filename |
|---|---|
| EX-21.1 - EX-21.1 - TRULIA, INC. | d848960dex211.htm |
| EX-31.2 - EX-31.2 - TRULIA, INC. | d848960dex312.htm |
| EX-32.1 - EX-32.1 - TRULIA, INC. | d848960dex321.htm |
| EX-31.1 - EX-31.1 - TRULIA, INC. | d848960dex311.htm |
| EXCEL - IDEA: XBRL DOCUMENT - TRULIA, INC. | Financial_Report.xls |
Table of Contents
UNITED STATES
SECURITIES AND EXCHANGE COMMISSION
Washington, D.C. 20549
FORM 10-K
| x | ANNUAL REPORT PURSUANT TO SECTION 13 OR 15(d) OF THE SECURITIES EXCHANGE ACT 1934 |
For the fiscal year ended December 31, 2014
or
| ¨ | TRANSITION REPORT PURSUANT TO SECTION 13 OR 15(d) OF THE SECURITIES EXCHANGE ACT OF 1934 |
Commission File Number: 001-35650
Trulia, Inc.
(Exact name of registrant as specified in its charter)
| Delaware | 20-2958261 | |
| (State or other jurisdiction of incorporation or organization) |
(I.R.S. Employer Identification Number) |
535 Mission Street, Suite 700
San Francisco, California 94105
(Address of principal executive offices) (Zip Code)
415.648.4358
(Registrant’s telephone number, including area code)
Securities registered pursuant to Section 12(b) of the Act:
| Common Stock, par value $0.00001 per share |
The New York Stock Exchange | |
| (Title of each class) | (Name of each exchange on which registered) |
Securities registered pursuant to Section 12(g) of the Act:
None
Indicate by check mark if the registrant is a well-known seasoned issuer, as defined in Rule 405 of the Securities Act: Yes x No ¨
Indicate by check mark if the registrant is not required to file reports pursuant to Section 13 or 15(d) of the Act: Yes ¨ No x
Indicate by check mark whether the registrant (1) has filed all reports required to be filed by Section 13 or 15(d) of the Securities Exchange Act of 1934 during the preceding 12 months (or for such shorter period that the registrant was required to file such reports), and (2) has been subject to such filing requirements for the past 90 days. Yes x No ¨
Indicate by check mark whether the registrant has submitted electronically and posted on its corporate Web site, if any, every Interactive Data File required to be submitted and posted pursuant to Rule 405 of Regulation S-T (§232.405 of this chapter) during the preceding 12 months (or for such shorter period that the registrant was required to submit and post such files). Yes x No ¨
Indicate by check mark if disclosure of delinquent filers pursuant to Item 405 of Regulation S-K is not contained herein, and will not be contained, to the best of registrant’s knowledge, in definitive proxy or information statements incorporated by reference in Part III of this Form 10-K or any amendment to this Form 10-K. ¨
Indicate by check mark whether the registrant is a large accelerated filer, an accelerated filer, a non-accelerated filer, or a smaller reporting company. See the definitions of “large accelerated filer,” “accelerated filer” and “smaller reporting company” in Rule 12b-2 of the Exchange Act.
| Large accelerated filer | x | Accelerated filer | ¨ | |||
| Non-accelerated filer | ¨ (Do not check if a smaller reporting company) | Smaller reporting company | ¨ |
Indicate by check mark whether the registrant is a shell company (as defined in Rule 12b-2 of the Exchange Act). Yes ¨ No x
The aggregate market value of voting stock held by non-affiliates of the registrant was $727,949,559, as of the end of the registrant’s second fiscal quarter (based on the closing sales price for the common stock on the New York Stock Exchange on June 30, 2014). Shares of common stock held by each executive officer, director, and holder of 5% or more of the outstanding common stock have been excluded in that such persons may be deemed to be affiliates. This determination of affiliate status is not necessarily a conclusive determination for other purposes.
As of February 13, 2015, 38,519,391 shares of the registrant’s common stock, $0.00001 par value, were outstanding.
Table of Contents
Trulia Inc.
Annual Report on Form 10-K
For the Fiscal Year Ended December 31, 2014
Table of Contents
As used in this Annual Report on Form 10-K, the terms “the Company,” “we,” “us” and “our” refer to Trulia, Inc., unless the context indicates otherwise.
SPECIAL NOTE REGARDING FORWARD-LOOKING STATEMENTS
This Annual Report on Form 10-K contains forward-looking statements within the meaning of the federal securities laws, which statements involve substantial risks and uncertainties. Forward-looking statements generally relate to future events or our future financial or operating performance. In some cases, you can identify forward-looking statements because they contain words such as “may,” “will,” “should,” “expects,” “plans,” “anticipates,” “could,” “intends,” “target,” “projects,” “contemplates,” “believes,” “estimates,” “predicts,” “potential” or “continue” or the negative of these words or other similar terms or expressions that concern our expectations, strategy, plans or intentions. Forward-looking statements contained in this Annual Report on Form 10-K include, but are not limited to, statements about:
| • | our future financial performance, including our revenue, cost of revenue, gross profit or gross margin, operating expenses, ability to generate positive cash flow, and ability to achieve and maintain profitability; |
| • | the sufficiency of our cash and cash equivalents to meet our liquidity needs; |
| • | our ability to increase the number of consumers using our website and mobile applications; |
| • | our ability to attract and retain real estate professionals that subscribe to our products; |
| • | our ability to increase revenue from real estate professionals subscribing to our products; |
| • | our ability to attract and retain advertisers that purchase display advertising on our website; |
| • | the continued availability of home listing and other information relevant to the real estate industry; |
| • | the growth in the usage of our mobile applications and our ability to successfully monetize this usage; |
| • | our ability to develop and deploy new features and products and provide a superior user experience; |
| • | our ability to foster the growth of user-generated content; |
| • | our ability to capitalize on strategic and adjacent opportunities; |
| • | our ability to achieve the anticipated benefits of the Market Leader acquisition; |
| • | the extent of disruption to our business caused by the merger with Zillow and its effect on our strategic relationships; |
| • | the effects of the market for real estate and general economic conditions on our business; and |
| • | the attraction and retention of qualified employees and key personnel. |
We caution you that the foregoing list may not contain all of the forward-looking statements made in this Annual Report on Form 10-K.
You should not rely upon forward-looking statements as predictions of future events. We have based the forward-looking statements contained in this Annual Report on Form 10-K primarily on our current expectations and projections about future events and trends that we believe may affect our business, financial condition, results of operations, and prospects. The outcome of the events described in these forward-looking statements is subject to risks, uncertainties, and other factors described in the section titled “Risk Factors” and elsewhere in this Annual Report on Form 10-K. Moreover, we operate in a very competitive and rapidly changing environment. New risks and uncertainties emerge from time to time, and it is not possible for us to predict all risks and uncertainties that could have an impact on the forward-looking statements contained in this Annual
1
Table of Contents
Report on Form 10-K. We cannot assure you that the results, events, and circumstances reflected in the forward-looking statements will be achieved or occur, and actual results, events, or circumstances could differ materially from those described in the forward-looking statements.
The forward-looking statements made in this Annual Report on Form 10-K relate only to events as of the date on which the statements are made. We undertake no obligation to update any forward-looking statements made in this Annual Report on Form 10-K to reflect events or circumstances after the date of this Annual Report on Form 10-K or to reflect new information or the occurrence of unanticipated events, except as required by law. We may not actually achieve the plans, intentions, or expectations disclosed in our forward-looking statements and you should not place undue reliance on our forward-looking statements. Our forward-looking statements do not reflect the potential impact of any future acquisitions, mergers, dispositions, joint ventures, or investments we may make.
2
Table of Contents
PART I
| Item 1. | Business |
Overview
Trulia is redefining the home search experience for consumers and changing the way that real estate professionals build their businesses. Our marketplace, delivered through the web and mobile applications, gives consumers powerful tools to research homes and neighborhoods and enables real estate professionals to efficiently market their listings and attract new clients. We believe we deliver the best home search experience by combining our superior user interface with our comprehensive database of real estate properties, local insights, and user-generated content. We also offer a comprehensive suite of free and subscription products that provide real estate professionals with access to transaction-ready consumers and help them to grow and manage their online presence. In the year ended December 31, 2014, we had 48.0 million monthly unique visitors. As of December 31, 2014, we had more than 540,000 active real estate professionals in our Trulia marketplace and 181,000 active real estate professionals using our Market Leader software and services. Approximately 79,300 of these real estate professionals were paying subscribers (assuming 20% overlap between Trulia subscribers and Marker Leader’s premium subscribers).
We empower consumers to make more informed housing decisions by delivering unparalleled insights and information on homes, neighborhoods, and real estate professionals through an intuitive and engaging user experience. Our large, continually refreshed, and searchable database contains more than 114.0 million properties, including 3.0 million homes for sale and rent. We supplement listings data with local information on schools, crime, and neighborhood amenities to provide unique insights into each community. In addition, we harness rich, insightful user-generated content from our active community of contributors, which includes consumers, local enthusiasts, and real estate professionals. With more than 16.6 million unique user contributions, we believe we have the largest collection of user-generated content on homes, neighborhoods, and real estate professionals.
We enable real estate professionals to better promote themselves and their listings, connect with transaction-ready consumers and manage ongoing relationships with potential buyers through our online and mobile marketing products, including personalized, customer-branded websites with multiple listing service integration that are optimized to generate consumer response. Our free products allow real estate professionals to build their personal brand by creating an online profile, contributing content to our marketplace, leveraging social media for endorsements, and establishing their presence through mobile features such as “check-ins.” Our subscription products provide a comprehensive end-to-end platform for real estate professionals, enabling them to increase their visibility, promote their listings in search results, target mobile users, generate more highly qualified leads from our large audience of transaction-ready consumers, and effectively manage these leads until a transaction has closed. We further enable real estate professionals to cultivate clients and leverage a library of sales and marketing materials in order to design, create, publish, and manage their own personalized marketing campaigns through our proprietary customer relationship management products. We believe that our consumer audience is highly motivated and ready to purchase homes, as supported by our surveys conducted between January 2014 and December 2014 in which 75% of over 391,000 respondents contacting real estate professionals through our marketplace indicated that they are planning to move in the next six months, and 38% of over 267,000 respondents stated that they are pre-approved for a mortgage. We believe that the combination of our compelling solution with our transaction-ready audience results in a high return on investment for real estate professionals who purchase our subscription products.
We are a leading mobile platform for the home search process and mobile devices are increasingly critical to consumers and real estate professionals. We have introduced iPhone, iPad, Android Phone, Android Tablet and Kindle Fire applications that provide tailored mobile experiences, which has led to rapid growth in the mobile use of our solution. In the year ended December 31, 2014, our aggregate mobile monthly unique visitors were 23.7 million across Trulia and our wholly owned subsidiary Market Leader, Inc., an increase of 67% over 2013. Our mobile users are more likely than our web users to contact real estate professionals through our marketplace.
3
Table of Contents
Our online marketplace is continuing to experience growth. Monthly unique visitors to our marketplace increased to 48.0 million in the year ended December 31, 2014 from 37.8 million in the year ended December 31, 2013, or a 27% increase, and our subscribers increased to approximately 79,300 (assuming a 20% overlap with Market Leader’s premium subscribers) as of December 31, 2014 from 59,700 as of December 31, 2013, a 33% increase. Our efforts to maintain or increase consumer traffic and subscribers include the February 2014 launch of a national marketing campaign that is designed to attract serious home buyers and sellers to our marketplace and that we expect will enable us to connect even more transaction-ready consumers with real estate professionals.
We generate revenue primarily from sales of subscription products to real estate professionals. We also generate revenue from display advertising sold to leading real estate and consumer brand advertisers seeking to reach our attractive audience. For the years ended December 31, 2014, 2013 and 2012, we generated revenue of $251.9 million, $143.7 million and $68.1 million, respectively. During the same periods, we had net losses of $75.8 million, $17.8 million and $10.9 million, respectively.
On July 28, 2014, we entered into an Agreement and Plan of Merger (the “Merger Agreement”) with Zillow, Inc. (“Zillow”) and Zillow Group, Inc., (f/k/a Zebra HoldCo, Inc.) (“HoldCo”), pursuant to which Zillow acquired us on February 17, 2015. Pursuant to the Merger Agreement, both we and Zillow became wholly-owned subsidiaries of HoldCo, which series of transactions we refer to as the Zillow Merger.
Upon completion of the Zillow Merger, (i) each outstanding share of our common stock was converted into the right to receive 0.444 of a share of Class A common stock of HoldCo; (ii) each outstanding share of Class A common stock of Zillow was converted into the right to receive one share of Class A common stock of HoldCo; and (iii) each outstanding share of Class B common stock of Zillow was converted into the right to receive one share of Class B common stock of HoldCo. The Class A common stock of HoldCo has one vote per share and the Class B common stock of HoldCo has ten votes per share, similar to the former capital structure of Zillow. In addition, subject to certain exceptions, each Trulia stock option, restricted stock unit and stock appreciation right outstanding immediately prior to the consummation of the Zillow Merger, whether or not vested and exercisable, was assumed by HoldCo and converted into a corresponding equity award to purchase, acquire shares of, or participate in the appreciation in price of, HoldCo Class A common stock. The terms of each assumed equity award are the same except that the number of shares subject to each equity award and the per share exercise price, if any, was adjusted based on the exchange ratio per a formula set forth in the Merger Agreement.
On September 12, 2014, HoldCo filed a Registration Statement on Form S-4 with the SEC to register the shares of HoldCo’s common stock to be issued to shareholders of Zillow and stockholders of Trulia as consideration in the acquisition in exchange for the Zillow and Trulia common stock. The Registration Statement on Form S-4 was declared effective by the SEC on November 17, 2014. On December 18, 2014, Zillow’s shareholders and Trulia’s stockholders approved the Zillow Merger. In connection with the closing of the Zillow Merger on February 17, 2015, Trulia filed an application on Form 25 with the SEC to remove Trulia’s common stock from listing on the NYSE and from registration under Section 12(b) of the Securities Exchange Act of 1934, as amended (the “Exchange Act”). Trulia intends to file a certificate on Form 15 requesting that its reporting obligations under Sections 13 and 15(d) of the Exchange Act be terminated. HoldCo Class A Common Stock began trading on the NASDAQ Global Select Market on February 18, 2015.
4
Table of Contents
The Trulia Marketplace
Our marketplace provides the following key benefits for consumers, real estate professionals, and advertisers:
Key benefits for consumers
| • | Large, continually refreshed, searchable database of homes for sale and rent. We provide consumers with access to a large, continually refreshed, and searchable database of properties. We enable consumers to customize their searches with property-specific filters to obtain up-to-date listings that are rich with property facts, price, and sale data. |
| • | Trusted insights, social recommendations, and proprietary analytics that provide local context. We provide consumers with local insights, critical to a successful home search, not available elsewhere on an easy-to-use and comprehensive basis. These insights include information about schools, crime, neighborhood amenities, and real estate professionals. |
| • | Anytime and anywhere access. Our marketplace is accessible anytime and anywhere on the web and on major mobile platforms. Since the introduction of our first mobile application in 2008, mobile use of our marketplace has grown rapidly. |
Key benefits for real estate professionals
| • | Broad reach to transaction-ready consumers. We provide real estate professionals the ability to connect with our large audience of transaction-ready consumers at scale on the web and through our mobile applications. We believe that a large portion of consumers using Trulia do not use our primary competitors’ websites, and that this enables real estate professionals on Trulia to effectively identify and market themselves to consumers not easily found anywhere else. |
| • | Products that boost presence and deliver high-quality leads. Our free products enable real estate professionals to create and manage an online profile, promote their personal brand with consumers by contributing content to our marketplace, and leverage social media for endorsements. Our subscription products enable real estate professionals to boost their visibility, promote their listings in search results, and generate more high-quality leads from potential home buyers. |
| • | Comprehensive end-to-end software-as-a-service-based marketing services. We provide software-as-a-service customer relationship management (CRM) tools, personalized websites and marketing tools to help our real estate professional customers manage and cultivate prospects. By automating many of the repetitive tasks that are required in order to follow up and communicate with potential clients, these tools allow our customers to focus on transacting their current business while efficiently marketing their services to potential clients, maintaining a pipeline of future business opportunities. |
| • | Anytime and anywhere access to critical information and tools. We offer mobile applications designed specifically for real estate professionals to take their business on the go. Using our mobile applications, real estate professionals can access critical information that they need to conduct their business, including listings details, contacts, driving directions, and local information about neighborhoods. |
| • | Significant return on investment. We believe that our subscription products deliver a high return on investment to real estate professionals. |
Key benefits for advertisers
| • | Attractive audience. We believe our audience is highly attractive to consumer brand advertisers. A substantial portion of our audience is either college educated, has a household income above $75,000, or is in the 25 to 54 age group. U.S. consumers with these characteristics tend to spend more of their annual income on home maintenance, insurance, household furnishings, apparel and services, and entertainment than the average consumer, according to the Bureau of Labor Statistics 2012 Consumer Expenditure Survey, which makes our audience attractive for consumer brand advertisers. |
5
Table of Contents
| • | Display advertising products that efficiently reach target consumers. We enable our advertisers to reach segments of our audience that are attractive to them. Advertisers benefit from improved reach, impact, relevancy, and measurement of their marketing campaigns in our marketplace. |
Our Strengths
We believe that our competitive advantage reflects the following strengths:
| • | Empower customers by delivering unparalleled insights and a superior user experience. We are one of the leading online real estate marketplaces and provide consumers with powerful tools and unique content that together deliver valuable insights into homes, neighborhoods, and real estate professionals. For example, our crime heat maps provide consumers with a view into neighborhood safety and our Facebook integration gives consumers recommendations on real estate professionals from people in their social network. We invest significant resources into technology development and product design to create a superior user interface that provides compelling features and rich functionality for our users. |
| • | Most Comprehensive Platform for Real Estate Professionals. We believe we have the most comprehensive, end-to-end platform for real estate professionals to grow and manage their businesses. We provide innovative lead generation products for real estate professionals to market themselves to consumers and generate new business. We also provide an integrated software platform with powerful analytics though which real estate professionals cultivate these leads and turn them into transactions. Moreover, we provide this comprehensive platform at scale, servicing five of the ten largest brokers and three of the largest real estate franchises in the United States. |
| • | Large, differentiated, transaction-ready audience. Our website and mobile applications have attracted 48.0 million monthly unique visitors in the year ended December 31, 2014 and, based on data from comScore, Inc., a marketing research company, a significant portion of our visitors do not visit our primary competitors’ websites. We believe that our audience is highly motivated and ready to purchase homes, as supported by our surveys conducted between January 2014 and December 2014 in which 75% of over 391,000 respondents contacting real estate professionals through our marketplace are planning to move in the next six months, and 38% of over 267,000 respondents stated that they are pre-approved for a mortgage. |
| • | Strong mobile monetization. We believe that we are one of the few companies that is monetizing its mobile products at a higher rate than web products. Since we launched our subscription product for mobile devices in May 2012, we have sold this product at prices that yield a higher average monthly revenue per subscriber than our subscription products that are not focused on mobile devices. In addition, our users are more likely to contact real estate professionals through our mobile applications than our website. |
| • | High ROI for real estate professionals. We believe our subscription products provide compelling value and a better return on investment than other marketing channels. |
| • | Powerful network effects driven by unique content. We benefit from a self-reinforcing network effect that helps build our brand, drives user engagement in our marketplace, and attracts more users to our website and mobile applications. Consumers post questions in our marketplace, attracting real estate professionals who add more content by answering these questions, which in turn attracts more consumers to our marketplace. |
| • | Big data and analytics platform. We employ proprietary advanced analytics and heuristics capabilities to aggregate, filter, and analyze large amounts of data from disparate sources that we have cultivated over the years. Our expertise in handling large amounts of externally-sourced data and combining it with user activity data collected from our marketplace allows us to improve the user experience by developing innovative new tools and new functionality. |
6
Table of Contents
Our Strategy
Our goal is to build the leading online real estate marketplace. We intend to focus on the following key strategies in pursuit of our goal:
| • | Expand our audience and increase user engagement. We intend to grow our large, transaction-ready audience by focusing our marketing efforts to consumers who are in the market and ready to move and by continuing to offer superior products for consumers. We launched a multi-channel marketing campaign in 2014 to drive increases in audience and user engagement. We plan to continuously enhance and refresh our database of homes, partner with third parties to add new and relevant local content, and encourage our users to contribute useful content. We also plan to develop new features and tools that deepen our users’ engagement with our website and mobile applications, and to promote and foster interaction in our vibrant user community. |
| • | Grow the number of real estate professionals in our marketplace. We intend to further penetrate the large base of more than 2.8 million real estate professionals in the United States by communicating the value proposition of our free and subscription products, growing our audience of transaction-ready consumers, and creating additional products. |
| • | Increase revenue. We plan to increase our revenue by selling more subscription and advertising products and by optimizing our pricing. |
| • | Increase brand awareness. We launched a multi-channel marketing campaign in 2014 to drive awareness of our brand, especially among consumers in the market ready to move. We also plan to continue to grow our brand by providing our users with superior and innovative products. |
Data
Management of data is a critical component of our solution. We manage over one terabyte of data on a daily basis. For Trulia.com, our Trulia mobile applications and our Trulia partner network, the graphic below illustrates how we organize data as listings data, local information, and user-generated content:
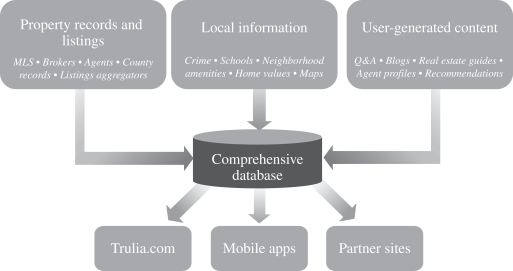
Listings data
We refresh and supplement the Trulia listings database of over 114.0 million properties and for sale and for rent listings with data we receive from thousands of feeds on a daily basis. We receive feeds covering millions of
7
Table of Contents
new and existing for sale and for rent listings every day from MLSs, real estate brokerages, real estate agents, real estate listings aggregators, and other third parties. We also obtain detailed ownership and property data from vendors who collect and digitize information from public county records.
We process this wealth of data through our proprietary algorithms and heuristic data validation engine to sort, augment, and select the most up-to-date and accurate data to display. As a next step, we apply our search logic to the data, and overlay additional local information on schools, crime, neighborhood amenities, home values, and other community information. The final product is a complete profile of a property or listing with property facts, price data, local information, and agent contact information, which we publish in our marketplace in an intuitive and engaging user experience.
In addition, for our Market Leader solutions, we process data feeds from approximately 500 multiple listing services to populate more than 177,000 real estate professional websites we host.
Local information
We inform consumers on what it is like to live in a neighborhood by delivering insights on schools, crime, neighborhood amenities, commute times, home values, historical earthquake, flood and other natural disaster data, and other community information.
| • | Schools. We provide information on schools by district, type, parent reviews, and ratings, which is based on data that we receive from third parties. We overlay this information onto our maps and color code the data points with a sliding color scale to differentiate between schools with low, medium, or high ratings. |
| • | Crime. We receive raw data from third parties about the occurrence, type, location, and description of non-violent and violent crime. We conduct proprietary analysis on the data and aggregate our findings into a tabular format or into our proprietary crime heat map. Our crime heat map provides an overview, visualized through a sliding color scale of the incidence of crime in the area and highlights in callout text boxes the number of violent crimes in the area. |
| • | Enhanced map visualizations of natural disasters. We enable consumers to view historical earthquake and flood data, allowing them to assess the risk of these natural disasters on a block-by-block level. We also provide interactive natural hazard maps pinpointing areas across the United States that are prone to hurricanes, wildfires, and tornadoes. With these maps, users are able to visualize where their dream home is located relative to where natural hazards have hit. Our map visualizations are also fully integrated into our mobile offerings. |
| • | Neighborhood amenities. We provide the location, names, and ratings of nearby restaurants, grocery stores, banks, and gas stations on our maps based on data that we receive from Yelp. |
| • | Home values. Based on our analysis of the sales records and property information in our database, we have developed market- and local-level views of the trends in price, number of sales, and number of listings by property type and location, which we publish on our listings pages and on the Local Info section of our website in interactive chart formats and in our proprietary heat map format. |
| • | Other community information. We analyze data from the U.S. Census Bureau to provide users with information on how the median household and family income, age of homes, and commute times of a neighborhood compare to those of the city. |
Additionally, we have an agreement with Google to use its basic maps, over which we integrate our proprietary insights.
8
Table of Contents
User-generated content
The user-generated data in our marketplace is organized under the Advice section of our website by type of content, questions and answers, blogs, real estate guides, and along topics relevant to our audience such as local information, tips on home buying and selling, and observed market trends. We also allow real estate professionals to publish their own profile and receive recommendations from their clients under the Find an Agent section of our website.
The content in our marketplace is generated by our vibrant community of users. Users can vote on the quality of content using our “thumbs up” or “thumbs down” icons and can follow the voting results. Additionally, users can “flag” inappropriate content on our site, which is escalated to our Trulia community team whose enforcement actions follow the terms and conditions for user-submitted content as published on our website.
Our Products for Consumers
Our products for consumers focus on helping them find the right home. Our consumer products are offered for free and provide a robust set of tools for evaluating where to live.
Searchable database
Search
We maintain one of the largest searchable databases of homes for sale and rent in the United States. Our database includes more than 114.0 million properties with 3.0 million listings of homes for sale and rent. We provide users with the ability to search our database along a variety of parameters as described below:
| All Properties |
Sale properties only |
Rentals only |
Sold properties only | |||
| City Bedrooms Bathrooms Price range Square footage Property type Keyword search |
Open houses Year built Foreclosure type MLS ID |
Pets Amenities |
Time since sale date |
Our users can customize their search along as few or many features as they prefer and by keyword search of specific property attributes. From our search results, users have access to the detailed data on each home in our database, photos of the home, and the for sale or for rent listing information.
Additionally, we enhance our users’ experience by giving them the choice to display their search results in listings or map formats. The map format provides the added functionality of polygonal search, which enables users to delineate the precise area of their searches. We offer products that further enhance our users’ experience with visually impactful maps, graphics, and photos of homes and neighborhood characteristics.
Trulia Estimates
Trulia Estimates is our estimate of an off-market property’s value based on our proprietary analysis of relevant home data such as recent sales of similar homes and property facts. This search function allows users to conduct a precise search by street address to find our estimate of the value of that home. Additionally, home owners may claim their home in our database and edit their home’s specific facts and details so that our proprietary system can revise its estimated value.
Rich insights and content
We provide users with rich insights and content that are critical to a successful home search and that cannot be discovered through home listings data alone. We deliver these insights through the following products:
9
Table of Contents
| • | Local Info. We aggregate local data from a variety of sources and make it more useful to our consumers through Google Maps overlays using our proprietary data visualization tools. These types of local insights include crime heat maps, historical earthquake, flood and other natural disaster data maps, school boundary and performance statistics, local amenity location and reviews through our integration with Yelp, and commute information. |
| • | Advice. We provide our users with insights on homes, neighborhoods, and real estate professionals based on the advice generated by our active community of contributors. Users of our marketplace can post questions and receive answers in the Trulia Voices portion of our website and also scour the collection of advice columns and blogs that other users post. With over 16.6 million unique user contributions and over 1.4 million topics discussed on Trulia Voices, we believe we have amassed the largest online collection of user-generated content in the U.S. residential real estate market. This gives our users access to the insights of consumers, local enthusiasts, and real estate professionals who are knowledgeable about the neighborhoods in which our users are searching. |
| • | Find an Agent. We provide consumers with a directory that includes more than 2.8 million real estate professionals that is searchable by location, name, and type of professional. Our platform integrates with Facebook to leverage the power of social networks for clients to recommend real estate professionals and for real estate professionals to take advantage of online “word of mouth” referrals. For example, a consumer searching for a real estate agent in our marketplace can quickly find whether someone in their social network has recommended an agent in a particular area in which they are looking. |
| • | Value information. Each property detail page features information and analytics on the property value, including price comparisons of similar properties based on median home sale data by neighborhood, zip code and city, price history and trends, and property taxes based on assessed property values. We believe this information helps users better assess the value of the property beyond what can be gleaned from price data alone. |
| • | Mortgage. Given the significant cost of a home purchase, we provide our users with guides on how to finance their purchase, information on mortgage rate trends, and calculators to determine their estimated mortgage payment based on the rates and terms quoted. |
Mobile
Our products are accessible anytime and anywhere online and on mobile devices. We provide the following differentiated Trulia mobile applications for consumers on several major mobile platforms and devices:
| • | m.trulia.com: A mobile-optimized website accessible on mobile device browsers |
| • | Real Estate App: Our full-featured Trulia real estate mobile application, available on iPhone, iPad, Android Phone, Android Tablet and Kindle Fire. |
| • | Rental App: Our mobile application optimized for users looking to rent a home, which is available on iPhone, iPad, Android Phone, Android Tablet and Kindle Fire, and provides a mobile offering customized to the needs of our rapidly growing rentals audience. |
| • | Agents App: Our mobile application optimized for real estate professionals, available on iPhone and Android Phone. |
| • | Mortgage App: Our mobile application optimized for users looking for mortgage information, available on iPhone and iPad. |
10
Table of Contents
Our Products for Real Estate Professionals
We sell three sets of products to real estate professionals on a subscription basis. The first set of products enables real estate professionals to promote themselves to potential buyers or sellers by targeting a local market area. Real estate professionals purchase subscriptions to these products for their desired city or zip code, at a fixed monthly price, for periods ranging from one month to one year, with pricing depending on demand, location, and the percentage of market share purchased or estimated number of leads. These products include:
| • | Trulia Local Ads. Real estate professionals can purchase local advertising on Trulia’s website by zip code or city and by share of a given market. This functionality enables them to enhance their presence in their chosen market and generate more leads. |
| • | Trulia Mobile Ads. Real estate professionals can purchase local advertising on our mobile applications and mobile website by zip code and by share of a given market. This functionality enables them to feature their profile and contact information on search results and listings, thereby enhancing their visibility with transaction-ready consumers. |
| • | Trulia Seller Ads. Real estate professionals can purchase differently priced Trulia Seller Ads packages to generate leads from consumers interested in selling their homes. This functionality enables them to market directly to sellers through a free home value report that features the real estate professional and includes useful valuation information, such as price history and comparable homes sold. |
Our second set of products allows real estate professionals to receive prominent placement of their listings in our search results. Real estate professionals sign up for new subscriptions to this product at a fixed monthly price for periods that generally range from 1 month to 24 months. This set of products includes:
| • | Trulia Pro. Real estate agents can purchase one of three differently priced Trulia Pro packages to enhance their online presence, feature their listings in search results, and interact with potential clients more effectively. Benefits include enhanced lead generation, greater local lead rotation, featured listings, robust property pages, detailed contact information in search results, instant leads via mobile, and integrated recommendations with Facebook. We provide similar products to real estate brokers under the name Premium Listings. |
Our third set of products is our comprehensive software-as-a-service that allows real estate professionals to manage and cultivate clients and potential clients by automating daily tasks and efficiently marketing their services. We charge real estate professionals subscription fees for our software-as-a-service products. We also generate revenue through enterprise marketing agreements with real estate franchise networks. We provide a base level software-as-a-service product to all agents and/or brokerages in these franchise networks in exchange for certain minimum payments from the real estate franchise networks. We also generate revenue through the sale of premium software and marketing products to individual agents, teams and brokerage offices within these real estate franchise networks.
With our software-as-a-service-based marketing products, we offer a bundle of services that may include some or all of the following:
| • | Software-as-a-service, including customer relationship management (CRM) tools, personalized websites, marketing tools, and content designed to help real estate professionals build online relationships with prospective home buyers and sellers. |
| • | Marketplace products that utilize our advertising expertise and leverage our national real estate websites to produce leads in the local neighborhoods where real estate professionals do business. |
| • | Community and training services that enable real estate professionals to share and learn best practices to help them close more business with consumers. |
11
Table of Contents
We also offer real estate professionals a set of free products that allows them to promote themselves and their listings online and to connect with consumers searching to buy or sell homes. Our free products include:
| • | Property listings. We offer real estate professionals the ability to reach a large, transaction-ready audience and the potential to acquire leads by listing their properties in our marketplace for free. |
| • | Mobile application. We have developed an Agent App for the iPhone and Android Phone that enables real estate professionals to manage their businesses anytime and anywhere. |
| • | Agent profile. Agents can create their own profile in our marketplace by posting contact information, photos, and qualifications, and can manage their brand by linking their profile to their activity on our forums and to Facebook. Agent profiles are posted on the Find an Agent section of our website. |
| • | Communities. Through our Trulia Voices forum and our Active Rain network, we enable real estate professionals to promote their presence by allowing them to connect meaningfully with consumers, network with other professionals, follow topics of interest to their audience, receive updates on neighborhoods, and broadcast their thoughts on our blogging platform. |
| • | Recommendations. We have built social search functionality into our Find an Agent database of agent profiles where users can sort agent profiles by number of recommendations. Additionally, real estate professionals can publish their recommendations on their Facebook Wall through integration with Facebook Connect. |
| • | Check-ins. Our real estate professionals can “check-in” on the Trulia mobile agent application to establish their presence at a property. |
| • | Agent training and advice blogs. We publish two blogs, Trulia Pro and Trulia Corporate, written by real estate industry experts with whom we partner to provide tips, advice, and education for buyers, sellers, and renters. |
| • | Tools and widgets. We offer real estate professionals a number of tools and widgets that they can incorporate into their personal websites to display local real estate information such as a slideshow widget to play photos of properties or a widget to broadcast their contributions on Trulia Voices on their blog or website. |
Our Products for Advertisers
We sell display media advertising on a cost-per-impression and cost-per-click basis to national advertisers seeking to reach the large and attractive audience for our online properties and those of our publisher partners. We display their advertisements on our home page and on individual web pages through graphical displays and text links, and help these customers optimize their advertisements’ effectiveness through our robust targeting capabilities. We also offer display media advertising on our mobile website that is optimized for mobile device web browsers.
Seasonality
From time to time, we experience seasonality in subscription revenue and display advertising due to fluctuations in traffic to our website and mobile applications. During the fourth quarter of each year, traffic to our marketplace has historically declined and our revenue has historically grown more slowly than in other quarters or has declined sequentially. Conversely, we typically experience higher growth in traffic and revenue during the spring and summer months, when consumers are more likely to buy new homes. We expect that seasonality will continue to affect traffic in our marketplace, as well as our revenue from subscriptions and advertising.
We rely on advertising to attract consumers to our Market Leader websites and to generate traffic and leads on these websites. As a result, we are subject to seasonal fluctuations in advertising rates and marketing services. Changing consumer behavior at various times throughout the year affects our advertising expenses. We expect
12
Table of Contents
that seasonal fluctuations in advertising costs will affect our operating expenses, as well as our operating margins.
Technology and Engineering
Product development and innovation are core pillars of our engineering culture that aims to delight our users and customers with our products. We provide our web and mobile products using a combination of in-house and third-party technology and products.
Big data and proprietary algorithms. We have developed our technology platform to handle data at large scale. On a daily basis, we process several million home listings from thousands of data feeds through our proprietary algorithms and heuristic data validation engine to sort, augment, and select the most up-to-date and accurate data to display.
Infrastructure. We currently manage our www.trulia.com website and mobile applications from four locations. The primary location where we host our production environment, is within a shared data center in Santa Clara, California. We also placed into service a second hosted facility, located in Denver, Colorado in 2013, where we support our production environment and provide redundancy, backup, and load balancing. We use a third hosted facility, located in Oakland, California, for production service backup and for our development environment. Our website and mobile applications are designed to have high availability, from the Internet connectivity providers we choose, to the servers, databases, and networking hardware that we deploy. Our Market Leader operations are hosted in Bellevue, Washington, at co-location facilities in Kent, Washington and at other locations operated by third parties. We design our systems such that the failure of any individual component is not expected to affect the overall availability of our platform. We also leverage content delivery networks and use other third-party cloud computing services, including map-related and ad serving services, to ensure fast and local access to content. We employ a host of encryption, antivirus, firewall, monitoring, and patch-management technology to protect and maintain our systems.
Innovation. In addition to our new product development efforts, we encourage technological advances by directing a portion of our engineering team’s time towards organized innovation days. Each quarter, our product managers and engineers share ideas and experiments and recruit their peers to join their projects to bring a new concept to life. As progress is shared with the larger group, these new ideas receive additional input and product planning and are frequently the basis of new products and features we offer.
Agile methodology and quality focus. Our software development methodology is agile and promotes teamwork, collaboration, and process adaptability throughout the life cycle of a development project. We believe this methodology yields robust, high quality, efficient, and nimble software development. We also invest heavily in the quality of our technology with robust testing at each stage in our development process.
In June 2012, we entered into a Platform Services Agreement (the “ListHub Agreement”) with Move Sales, Inc., (“ListHub”), which provides us with a substantial portion of the unique listings in our marketplace. This agreement supersedes our prior agreement with ListHub for the provision by ListHub of listings to us. Under the terms of this agreement, ListHub grants to us a nonexclusive license to display listings on our platform and use these listings for the purpose of providing real estate professionals with information relating to lead generation management and advertising products. This agreement contains a 48-month term and renews automatically for additional one year terms unless canceled upon the provision of 90 days prior notice by either party. This agreement is not cancelable by ListHub except in the case of material uncured breach by us, assignment of the contract by us under certain circumstances and to certain other third parties, or our filing for bankruptcy, insolvency or assignment for the benefit of creditors, or if a receiver is appointed on our behalf. On February 19, 2015, we received a notice from ListHub, that pursuant to the ListHub Agreement, that ListHub is terminating the ListHub Agreement effective February 25, 2015, as a result of Zillow’s acquisition of us. On February 20, 2015, we filed a complaint and an application for a temporary restraining order in the Superior Court of the State
13
Table of Contents
of California, County of San Francisco against ListHub. The complaint and the application allege, among other things, breach of contract by ListHub in seeking to terminate the ListHub Agreement and seek injunctive relief to prevent termination of the Agreement and termination of the listings feeds ListHub provides to Trulia. On February, 23, 2015, the Superior Court granted our application for a temporary restraining order and set March 12, 2015 as the date for a hearing on a preliminary injunction on the matter.
We maintain our primary technology infrastructure at a facility in Santa Clara, California maintained by Equinix Operating Company, Inc., or Equinix. Equinix provides data center space to us under the terms of a master service agreement. This agreement terminates on the earlier of the date that it is terminated by either party or the last order made under the agreement terminates or expires. This agreement is not cancelable by Equinix except in the case of material uncured breach by us, the suspension by Equinix three or more times during any twelve month period of its services pursuant to the terms of this agreement, our liquidation, cessation to do business or insolvency, or the condemnation of the physical space subject to this agreement.
Marketing
Our principal marketing strategy has been to develop a superior user experience that will drive audience growth and brand recognition. We have not historically spent significantly on marketing programs, but have focused on organic and viral growth driven by our user base. We currently expect that our marketing and product development expenses are likely to increase as we seek to attract additional consumers and real estate professionals to our marketplace. For example, we launched a multi-channel, national marketing campaign in 2014 to drive awareness of our brand, especially among consumers in the market ready to move. As our consumer audience has grown, real estate professionals have followed consumers to Trulia. We have also grown our brand among real estate professionals and the real estate industry through tradeshow participation, social engagement, and ongoing education via webinars, newsletters, and word of mouth.
Our marketing strategy includes the use of paid channels such as SEM, organic channels such as SEO as well as engagement channels such as email. These channels are used to drive consumer visits and engagement across all platforms. In addition we build connections with consumers via social channels such as Facebook and Twitter. Our brand efforts include consumer blogs and media outreach efforts that engage consumers directly with topical content. This type of content is used by, and our Chief Economist is quoted regularly in, major news outlets, including The Wall Street Journal, Bloomberg, The New York Times, Time Magazine, and U.S. News & World Report.
| • | Advice for real estate professionals. Our blogs for real estate professionals, Trulia Pro and Trulia Corporate, written by well-known real estate industry experts with whom we partner, elevate Trulia’s brand awareness amongst the community of real estate professionals. |
| • | Celebrity and luxury homes. Luxe Living is our blog dedicated to the latest developments on celebrity and luxury homes. This blog and its content have been featured on ExtraTV, E! News, US Weekly, The Los Angeles Times, and more. |
We expect that our efforts to maintain or increase consumer traffic and subscribers are likely to include, among other things, increases to our marketing spending and expenditures to increase the number of our engineering and product development personnel.
Customers
Real estate professionals that pay for our subscription products include:
| • | Agents, who collaborate with consumers, seek leads, and manage transactions; |
| • | Brokers, which recruit, train, and provide core real estate services to agents; and |
| • | National real estate franchisors, which provide real estate services to franchisees to enable the growth of their brand. |
14
Table of Contents
The majority of our real estate professional subscribers are agents. As of December 31, 2014, we had more than 540,000 active real estate professionals in our Trulia marketplace and 181,000 active real estate professionals using our Market Leader software and services. Approximately 79,300 of these real estate professionals were paying subscribers (assuming a 20% overlap between Trulia subscribers and Market Leader’s premium subscribers). A key focus of our sales and marketing activities has been to further penetrate the large base of more than 2.8 million real estate professionals in the United States. If we are unable to increase the number of total subscribers in our marketplace, our revenue may not grow and our operating results could suffer.
Our advertising solutions are purchased by a diverse cross-section of brand advertisers that operate within the real estate ecosystem, and those that seek to reach our highly educated and affluent audience. In each of the years ended December 31, 2014, 2013, and 2012, the ten largest advertising partners for the respective period accounted for more than 61%, 65%, and 63%, respectively, of our media revenue.
No customer represented 10% or more of total revenue during the years ended December 31, 2014, 2013, and 2012. No customer represented 10% or more of our gross accounts receivable as of the year ended December 31, 2014, and one customer accounted for 13.0% of the gross accounts receivable as of December 31, 2013.
Sales and Customer Support
We have dedicated sales teams that support our marketplace business and our display advertising business.
For our marketplace business, the majority of our sales are made by our inside sales team that sells our subscription products to real estate professionals. Our inside sales teams are located in our Bellevue, Denver, and San Francisco offices and attract new subscribers through a combination of outbound calling and inbound customer requests generated from our website and marketing activities. We also have a field sales team that sells our marketplace products at larger deal sizes to real estate brokers, franchisors, and builders.
For our display advertising business, we maintain a field sales team based in New York, to specifically target large advertising customers in the real estate and related content categories, such as insurance companies, mortgage providers, and home improvement companies, as well as other brand advertisers that seek to reach our audience. Our field sales team develops direct relationships with these advertisers and the agencies that serve them.
We place a high value on providing quality support to our users, marketplace subscribers, and advertisers. Our customer support team, based in Bellevue, Denver, and San Francisco, responds to commercial and technical questions from our users and advertisers.
Competition
The markets in which we operate are highly competitive and fragmented. Consumers research homes through a variety of sources. Similarly, real estate professionals use a variety of marketing channels to promote themselves and find clients. Consequently, we face competition from a variety of direct and indirect channels, and we believe we compete favorably.
Competition for consumers
We compete to attract consumers to our websites and mobile applications primarily on the basis of the breadth and quality of listings; user experience; the breadth, depth, and relevance of the insights on homes, neighborhoods, and real estate professionals; brand and reputation; and the quality of mobile products.
Our principal competitors for consumers include:
15
Table of Contents
| • | Print media, including local newspapers, magazines, and home/apartment guide publications; |
| • | Online real estate marketplaces such as Homes.com, MSN Real Estate, Realtor.com, and Yahoo! Real Estate; |
| • | Online brokerage service providers such as Redfin and ZipRealty; |
| • | MLSs across the United States; |
| • | Full-service real estate brokerage service providers such as Century 21 and Coldwell Banker; |
| • | Online rental listing providers such as ApartmentGuide.com, ApartmentList.com and Rent.com; |
| • | General online classifieds such as Craigslist; |
| • | Search engines such as Bing, Google, and Yahoo!; and |
| • | Websites of real estate brokerages and individual agents. |
Competition for real estate professionals
We compete for a share of real estate professionals’ overall marketing spend with traditional, offline media, and other online marketing channels. We compete primarily on the basis of the size and attractiveness of the consumer audience; quality and measurability of leads; perceived return on investment; effectiveness of marketing and workflow tools; and quality of mobile products.
Our principal competitors for real estate professionals include:
| • | Print media, including local newspapers, magazines, and home/apartment guide publications; |
| • | Other traditional media, including television and radio; |
| • | Other online real estate marketplaces; |
| • | Social networking services such as Facebook and Twitter; |
| • | Search engines such as Bing, Google, and Yahoo!; |
| • | Websites offering display advertising; |
| • | Email marketing software and tools; and |
| • | Providers of customer relationship management (CRM) software for real estate professionals. |
Competition for advertisers
We face competition to attract advertisers to market their products on our website. The basis of competition includes size, demographics, and overall attractiveness of an audience; pricing; and the ability to target desired audience segments.
Intellectual Property
We protect our intellectual property through a combination of trademarks, domain names, copyrights, trade secrets, and patents, as well as contractual provisions and restrictions on access to our proprietary technology.
We registered “Trulia” and the Trulia marker logo as trademarks in the United States and several other jurisdictions. We hold twenty-three trademarks registered in the United States and thirty-nine trademarks registered in other jurisdictions associated with our Trulia and Market Leader business. We also have filed other trademark applications in the United States and certain other jurisdictions, and will pursue additional trademark registrations to the extent we believe it would be beneficial and cost effective.
We have five patents registered and 12 patent applications pending in the United States and internationally, which seek to cover proprietary techniques relevant to our products. We intend to pursue additional patent protection to the extent we believe it would be beneficial and cost effective.
16
Table of Contents
We currently hold the “Trulia.com,” “Marketleader.com,” “Housevalues.com” and “RealEstate.com” Internet domain names and various other related domain names.
In addition to the protection provided by our intellectual property rights, we enter into confidentiality and proprietary rights agreements with our employees, consultants, contractors, and business partners. Our employees and contractors are also subject to invention assignment agreements. We further control the use of our proprietary technology and intellectual property through provisions in both our general and product-specific terms of use on our website.
Litigation or proceedings before the U.S. Patent and Trademark Office or other governmental authorities and administrative bodies in the United States and abroad may be necessary in the future to enforce our intellectual property rights, to protect our patent rights, trade secrets, and domain names and to determine the validity and scope of the proprietary rights of others. Our efforts to enforce or protect our proprietary rights may be ineffective and could result in substantial costs and diversion of resources, which could harm our business and operating results.
Employees
As of December 31, 2014, we had 1,055 employees, with 241 in technology, 732 in sales, marketing, and customer support, and 82 in general and administrative functions. We had 409 full-time employees in our San Francisco headquarters, 312 in our Denver location, 31 in our New York office, 279 in our Bellevue office and 24 of our employees work remotely. None of our employees is represented by a labor union with respect to his or her employment with us.
Additional Information
Trulia, Inc. was incorporated in Delaware in June 2005. Our principal executive offices are located at 535 Mission Street, Suite 700, San Francisco, California 94105, and our telephone number is (415) 648-4358. Our website address is www.trulia.com. In addition, we maintain a Facebook page at www.facebook.com/trulia and a Twitter feed at www.twitter.com/trulia. Information contained on, or that can be accessed through, our or Zillow Group’s website, Facebook page or Twitter feed does not constitute part of this Annual Report on Form 10-K.
Copies of annual reports on Form 10-K, quarterly reports on Form 10-Q, current reports on Form 8-K, and amendments to these reports filed or furnished pursuant to Section 13(a) or 15(d) of the Securities Exchange Act of 1934, as amended (the “Exchange Act”) are available, free of charge, on the Zillow Group website at investors.zillowgroup.com as soon as reasonably practicable after we file such material electronically with or furnish it to the Securities and Exchange Commission (“SEC”). The SEC also maintains a website that contains our SEC filings. The address of the site is www.sec.gov.
17
Table of Contents
| Item 1A. | Risk Factors |
RISK FACTORS
Investing in our common stock involves a high degree of risk. You should carefully consider the risks and uncertainties described below, together with all of the other information in this Annual Report on Form 10-K, before making a decision to invest in our common stock. If any of the risks actually occur, our business, financial condition, operating results, and prospects could be materially and adversely affected. In that event, the trading price of our common stock could decline, and you could lose part or all of your investment.
We may not realize the expected benefits of the Zillow Merger quickly or at all.
On July 28, 2014, we entered into the Merger Agreement with Zillow and HoldCo, pursuant to which Zillow acquired us on February 17, 2015. Pursuant to the Merger Agreement, both we and Zillow have become wholly-owned subsidiaries of HoldCo. The success of the Zillow Merger will depend , in part, on our ability to realize the anticipated business opportunities and growth prospects from combining our businesses with those of Zillow. We may never realize these business opportunities and growth prospects. Integrating operations will be complex and will require significant efforts and expenditures. Our management might have its attention diverted while trying to integrate operations and corporate and administrative infrastructures. We might experience increased competition that limits our ability to expand our business, and we might fail to capitalize on expected business opportunities, including retaining current customers.
We are in the early stages of integrating our business and operations with Zillow’s business and operations. The integration process could result in the loss of key employees, the disruption of each company’s ongoing businesses, tax costs or inefficiencies, or inconsistencies in standards, controls, information technology systems, procedures and policies, any of which could adversely affect our ability to maintain relationships with clients, employees or other third parties or our ability to achieve the anticipated benefits of the Zillow Merger and could harm our financial performance.
If we are unable to successfully or timely integrate our operations and business with Zillow’s business, we may be unable to realize revenue growth, synergies and other anticipated benefits resulting from the Zillow Merger and our business and results of operations could be adversely affected.
We have a limited operating history in an evolving industry, which makes it difficult to evaluate our future prospects and may increase the risk that we will not be successful.
We have a limited operating history in an evolving industry that may not develop as expected. Assessing our business and future prospects is challenging in light of the risks and difficulties we may encounter. These risks and difficulties include our ability to:
| • | increase the number of consumers using our websites and mobile applications; |
| • | continue to obtain home listing information, as well as information on schools, crime, commute times, neighborhood amenities, rental prices and historical earthquake and flood data; |
| • | increase the number of real estate professionals subscribing to our products; |
| • | increase the revenue from real estate professionals subscribing to our products; |
| • | increase the revenue from advertisers on our websites; |
| • | successfully develop and deploy new features and products; |
| • | encourage and foster the growth of user-generated content; |
| • | increase our brand awareness among consumers and real estate professionals; |
| • | successfully compete with other companies that are currently in, or may in the future enter, the business of providing residential real estate information online and on mobile applications, as well as with companies that provide this information offline; |
18
Table of Contents
| • | successfully compete with existing and future providers of other forms of offline, online, and mobile advertising; |
| • | successfully compete with existing and future providers of customer relationship management (CRM) tools and other solutions that help real estate professionals manage and grow their businesses; |
| • | successfully navigate fluctuations in the real estate market; |
| • | effectively manage the growth of our business; |
| • | successfully expand our business into adjacent markets, such as rentals, mortgages, and home improvement; |
| • | successfully integrate Market Leader; and |
| • | successfully expand internationally. |
If the demand for residential real estate information online does not develop as we expect, or if we fail to address the needs of consumers, real estate professionals, or advertisers, our business will be harmed. We may not be able to successfully address these risks and difficulties, which could harm our business and cause our operating results to suffer.
We have a history of losses and we may not achieve or maintain profitability in the future.
We have not been profitable on a quarterly or annual basis since we were founded, and as of December 31, 2014, we had an accumulated deficit of $140.6 million. We expect to make future investments in the development and expansion of our business which may not result in increased revenue or growth. In addition, as a public company, we incurred significant legal, accounting, and other expenses that we did not incur as a private company. As a result of these increased expenditures, we must generate and sustain increased revenue to achieve and maintain future profitability. While our revenue has grown in recent periods, this growth may not be sustainable and we may not achieve sufficient revenue to achieve or maintain profitability. We may incur significant losses in the future for a number of reasons, including slowing demand for our products, a decrease in the growth rate of our monthly unique visitors, increasing competition, weakness in the residential real estate market, our inability to effectively integrate acquired businesses, such as Market Leader, as well as other risks described in this Annual Report on Form 10-K, and we may encounter unforeseen expenses, difficulties, complications and delays, and other unknown factors. Accordingly, we may not be able to achieve or maintain profitability and we may continue to incur significant losses in the future.
If real estate professionals do not continue to subscribe to our products, or we are unable to attract new subscribers, our business and operating results would be harmed.
We rely primarily on subscriptions purchased by real estate professionals to generate a substantial portion of our marketplace revenue. Marketplace revenue accounted for 83%, 79%, and 70% of our revenue in the years ended December 31 2014, 2013 and 2012, respectively. We generally offer subscriptions for periods between six months to 12 months, with most real estate professionals preferring to subscribe for periods shorter than 12 months. Our ability to attract and retain real estate professionals as subscribers, and to generate subscription revenue, depends on a number of factors, including:
| • | our ability to attract transaction-ready consumers to our websites and mobile applications; |
| • | the number of unique visitors using our websites and mobile applications; |
| • | the quality of the leads that we provide to our subscribers; |
| • | the number of leads that we provide to our subscribers; |
| • | the rate of adoption of our software-as-a-service based products; |
| • | the success of our marketing relationships with leading national real estate franchise networks; |
| • | the success of our efforts to upsell customers from promotional offers to higher revenue services; |
19
Table of Contents
| • | the success of any increased marketing and product development efforts directed at attracting additional consumers and real estate professionals to our marketplace; |
| • | the strength of the real estate market; |
| • | the competition for real estate professionals’ marketing dollars; and |
| • | the strength of our brand. |
A key focus of our sales and marketing activities has been to further penetrate the large base of more than 2.8 million real estate professionals in the United States. As of December 31, 2014, we had more than 540,000 active real estate professionals in our Trulia marketplace and 181,000 active real estate professionals using our software and services. Approximately 79,300 of these real estate professionals were paying subscribers (assuming a 20% overlap between Trulia subscribers and Market Leader’s premium subscribers). We spend a considerable portion of our operating expenses on sales and marketing activities. Our sales and marketing expenses were our largest operating expenses in the years ended December 31, 2014 and 2013. Sales and marketing expenses reflect many of the costs that we incur in acquiring new subscribers and retaining existing subscribers, and we expect that sales and marketing expenses will continue to increase in absolute dollars as we seek to grow the number of subscribers in our marketplace. If we are unable to increase the number of total subscribers in our marketplace, our revenue may not grow and our operating results could suffer.
Real estate professionals may not continue to subscribe with us if we do not deliver a strong return on their investment in subscriptions, and we may not be able to replace them with new subscribers. In addition, real estate professionals associated with our real estate franchise network partners may choose not to use our premium services if they are unable to convert leads we provide into closed sales, resulting in a loss of incremental revenue associated with our premium services. In addition, real estate professionals sometimes do not renew their subscriptions with us because of dissatisfaction with our products. This may occur for a number of reasons, including because we have made changes to our products or services, which we do periodically. If subscribers do not renew their subscriptions with us with the same or higher subscription fees, or at all, or if we are unable to attract new subscribers, our business and operating results would be harmed.
Further, although a majority of our revenue in the years ended December 31, 2014 and 2013 was generated from subscriptions purchased by real estate professionals, we cannot be certain that subscribers will renew their subscriptions with us and that we will be able to achieve the same or higher amounts of subscription revenue in the future.
Our ability to increase the number of subscribers to our services also depends, to some degree, on whether we can increase the inventory of marketing products and services available for us to sell in different geographic markets. If we are unable to create additional inventory by offering new services or reconfiguring our existing services, we may not be able to grow the number of subscribers to our services quickly or at all. Even if we are able to offer new services or reconfigure our existing services, there can be no assurance that new subscribers will purchase them or existing subscribers will be satisfied with the changes we make. For instance, in March 2013 we initiated an inventory expansion program offering additional advertising slots on our real estate listing detail pages to feature more than one subscriber. While this allowed us to sell additional subscriptions in a given location, some existing subscribers were dissatisfied with the change and elected not to renew their subscriptions.
In addition, if we need to reduce our subscription fees due to competition, our business, operating results, financial condition, and prospects would suffer if we are unable to offset any reductions in our fees by increasing our number of consumers and advertisers, reducing our costs, or successfully developing and deploying new features on a timely basis.
If we are not able to optimize our pricing and increase our average revenue per subscriber, we may not be able to grow our revenue over time.
Our ability to grow revenue depends, in part, on our ability to optimize pricing and increase average monthly revenue per subscriber over time. Since launching our first subscription product in 2007, we have
20
Table of Contents
continued to expand our products and optimize pricing of our products. As we continue to optimize our pricing, real estate professionals may not accept these new prices, which may harm our business and growth prospects. In August 2013, we acquired Market Leader, which offers subscription-based real estate marketing software and lead generation products. Market Leader historically generated lower average revenue per subscriber than us. As a result, we may experience difficulty in increasing our average revenue per subscriber, which may impact our ability to grow revenue over time and may harm our business and growth prospects.
If advertisers reduce or end their advertising spending with us, or if we are unable to attract new advertisers, our business and operating results would be harmed.
Display advertising accounted for 17%, 21%, and 30% of our revenue in the years ended December 31, 2014, 2013 and 2012, respectively. Our advertisers can generally terminate their contracts with us at any time or on very short notice. Our ability to attract and retain advertisers, and to generate advertising revenue, depends on a number of factors, including:
| • | the number of consumers using our websites and mobile applications; |
| • | our ability to continue to attract an audience that advertisers find attractive; |
| • | the strength of our brand: |
| • | our ability to compete effectively for advertising spending with other real estate marketplaces, offline companies, and online companies; |
| • | how advertisers value our advertising network, which consists of our online properties and those of our publishing partners; |
| • | the amount of spending on online advertising generally; |
| • | our ability to deliver an attractive return on investment to advertisers; and |
| • | a shift by advertisers from direct to programmatic ad buying. |
In addition, expenditures by advertisers tend to be cyclical, reflecting overall economic conditions and budgeting and buying patterns. Adverse macroeconomic conditions can also have a material impact on demand for advertising and cause our advertisers to reduce the amounts they spend on advertising, which could adversely affect our revenues and our business.
We may not succeed in capturing more spending from advertisers if we are unable to demonstrate to advertisers the effectiveness of advertising in our marketplace as compared to alternatives, including traditional offline advertising media such as newspapers and magazines.
If advertisers reduce or terminate their advertising spending with us and we are unable to attract new advertisers, our revenue, business, operating results, and financial condition would be harmed. In our display advertising business, we also have a limited ability to replace the loss of revenue resulting from the loss of a customer during a particular quarter because of the significant time required to secure an alternative advertiser for such advertising inventory, run the alternative advertising campaign on our marketplace, and satisfy our revenue recognition criteria from such campaign. As a result, the loss of a customer during a quarter could result in our inability to replace the lost revenue from such customer within that quarter and, therefore, we will sometimes encounter variances in our Media revenue.
If we are unable to maintain or increase consumer traffic to our marketplace, our business and operating results would be harmed.
Our ability to generate revenue from our marketplace business and media business depends, in part, on our ability to attract consumers to our websites and mobile applications. If we fail to maintain or increase consumer traffic to our marketplace, our ability to acquire additional subscribers, deliver leads to existing subscribers, and
21
Table of Contents
sell advertising to third parties could be negatively affected. While we believe the number of consumers visiting our marketplace will continue to grow, our growth rate of monthly unique visitors has decreased on a year-over-year basis from 68% in year ended December 31, 2013 to 27% in the year ended December 31, 2014. We expect that our efforts to maintain or increase consumer traffic are likely to include, among other things, increases to our marketing expenditures and expenditures to increase the number of our engineering and product development personnel. There can be no assurance that any increases in our expenses will be successful in generating additional consumer traffic. Even if we are able to attract additional consumers to our marketplace, an increase in our operating expenses could negatively impact our operating results if we are unable to generate more revenue through increased sales of subscriptions to our marketplace products and display advertising. Accordingly, if we are unable to increase consumer traffic to our marketplace, or if we are unable to generate enough additional revenue to offset any increase in expenses related to increasing consumer traffic to our marketplace, our business and operating results would be harmed.
Our recent revenue growth rates may not be indicative of our future growth, and we may not continue to grow at our recent pace, or at all.
From the year ended 2008 to the year ended December 31, 2014, our revenue grew from $8.1 million to $251.9 million, which represents a compounded annual growth rate of approximately 77%. In the future, our revenue may not grow as rapidly as it has over the past several years. We believe that our future revenue growth will depend, among other factors, on our ability to:
| • | acquire additional subscribers and sell additional products to existing subscribers; |
| • | sell advertising to third parties; |
| • | attract a growing number of users to our websites and mobile applications; |
| • | increase our brand awareness; |
| • | successfully develop and deploy new products for the residential real estate industry; |
| • | maximize our sales personnel’s productivity; |
| • | respond effectively to competitive threats; |
| • | successfully expand our business into adjacent markets, such as rentals and mortgages; |
| • | successfully integrate Market Leader; and |
| • | successfully expand internationally. |
We may not be successful in our efforts to do any of the foregoing, and any failure to be successful in these matters could materially and adversely affect our revenue growth.
You should not consider our past revenue growth to be indicative of our future growth.
If we cannot obtain comprehensive and accurate real estate listing information on a timely basis or at all, our business will suffer.
Our offerings are based on receiving current and accurate real estate listing data. We depend on, and expect to continue to depend on, relationships with various third parties to provide this data to us, including real estate listing aggregators, multiple listing services, real estate brokerages, apartment management companies, and other third parties. Many of our agreements with our listing sources are short-term agreements that may be terminated with limited or no notice. If our relationship with one or more of these parties is disrupted, the quality of the experience we provide to users would suffer.
We currently depend on a listing aggregator to provide us with a substantial portion of the unique listings in our database. While these listings are available from their original sources, it would take substantial time and
22
Table of Contents
effort for us to aggregate these listings from all of the original sources. On February 19, 2015, we received a notice from our largest listing aggregator of their intent to terminate our agreement, as a result of Zillow’s acquisition of us. On February 20, 2015, we filed a complaint and an application for a temporary restraining order in the Superior Court of the State of California, County of San Francisco, against the listing aggregator. The complaint and the application allege, among other things, breach of contract by the listing aggregator in seeking to terminate the agreement and seek injunctive relief to prevent termination of the agreement and termination of the listings feeds the listing aggregator provides to us. On February, 23, 2015, the Superior Court of the State of California, County of San Francisco granted our application for a temporary restraining order and set March 12, 2015 as the date for a hearing on a preliminary injunction on the matter. Therefore, if this agreement with our largest listing aggregator is terminated, we may not be able to fully replace the listings in a timely manner or on terms favorable to us, or at all, which would adversely affect our business and operating results. In addition, as real estate brokers and multiple listing services typically control the distribution and use of listings, our business could suffer if real estate brokers or multiple listing services withheld listings from us or delayed the delivery of their listings to us. From time to time in the past, real estate brokers have refused to syndicate listings to us and multiple listing services have delayed the delivery of listings to us, and we cannot assure you this will not happen in the future. If real estate brokers or multiple listing services refuse to syndicate listings or delay such syndication to us, the quality of our products would suffer due to the decline of timely and accurate information, which could adversely affect our business and operating results.
We rely on information from real estate multiple listing services provided by third parties that we do not control.
The websites we provide to our software-as-a-service based customers combine aerial maps and for sale home listings, including listings in most of the major metropolitan markets in the United States. In addition, in selected markets, including most of the major metropolitan markets in the United States, we provide customers with functionality that allows them to automatically email their prospective clients information about newly available homes that meet the prospective clients’ criteria. The for sale home listings information provided by our websites and the automated email functionality are supplied only in markets in which we, our broker customers, or the broker affiliated with our agent customers have a relationship with the local multiple listing service (MLS). Our agreements with MLSs to display property listings have short terms, or can be terminated by the MLSs, or, in some cases, the broker, with little notice. The success of our products depends in part on our continued ability to provide customers with MLS listings and data, as well as our ability to expand listings in markets in which it is not currently available. Our inability to obtain MLS listings and data will harm our business and operating results.
If use of our mobile products does not continue to grow or we are not able to successfully monetize them as we expect, our operating results could be harmed and our growth could be negatively affected.
Our future success depends in part on the continued growth in the use of our mobile products by our users and our ability to monetize them. During the year ended December 31, 2014, our mobile products accounted for 49% of our total traffic, which has grown significantly since we launched our first subscription product for mobile devices in May 2012. We currently monetize our mobile offerings through our Trulia Mobile Ads subscription product for real estate professionals and through our mobile websites, including our Trulia mobile website and more than 177,000 agent websites powered by Market Leader. We monetize our mobile applications principally through our Trulia Mobile Ads subscription product through which real estate professionals can purchase local advertising on our mobile applications and our Trulia mobile website by zip code and by share of a given market. We monetize our Trulia mobile website and Trulia mobile applications through the sale of display advertisements and we also provide our Trulia subscribers rotational placement in a local lead form that appears on certain pages of our Trulia mobile website and mobile applications. The use of mobile technology may not continue to grow at historical rates, and consumers may not continue to use mobile technology for real estate research. Further, mobile technology may not be accepted as a viable long-term platform for a number of reasons, including actual or perceived lack of security of information and possible disruptions of service or connectivity. In addition, traffic on our mobile applications may not continue to grow if we do not continue to
23
Table of Contents
innovate and introduce enhanced products on mobile platforms, or if users believe that our competitors offer superior mobile products. The growth of traffic on our mobile products may also slow or decline if our mobile applications are no longer compatible with operating systems such as iOS or Android, or the devices they support. Additionally, real estate professionals and advertisers may choose to devote less of their spending to target mobile users for a number of reasons, including a perceived lack of effectiveness of display advertising on mobile devices. Although we have seen strong results in our mobile product monetization efforts with the launch of Trulia Mobile Ads in May 2012 and our product redesign in March 2013, we cannot assure you that we will continue to monetize our mobile products as effectively in the future. If use of our mobile products does not continue to grow, or if real estate professionals or advertisers decrease their spending on our mobile products, our business and operating results could be harmed.
If we do not continue to innovate and provide useful products, we may not remain competitive, and our business and financial performance could suffer.
Our success depends in part on our ability to continue to innovate. This is particularly true with respect to mobile applications, which are increasingly being used by our audience. Our competitors regularly enhance their offerings and create new offerings for consumers, real estate professionals, and others involved in the residential real estate industry. If we are unable to continue to offer innovative products or to keep pace with our competitors’ offerings, our business and operating results will suffer.
We rely on Internet search engines to drive traffic to our websites, and if we fail to appear high up in the search results, our traffic would decline and our business would be adversely affected.
We depend in part on Internet search engines, such as Google, Bing, and Yahoo!, to drive traffic to our websites. For example, when a user types a property address into a search engine, we rely on a high organic search ranking of our webpages in these search results to refer the user to our websites. However, our ability to maintain high organic search result rankings is not within our control. Our competitors’ search engine optimization, or SEO, efforts may result in their websites receiving a higher search result page ranking than ours, or Internet search engines could revise their methodologies in a way that would adversely affect our search result rankings. If Internet search engines modify their search algorithms in ways that are detrimental to us, or if our competitors’ SEO efforts are more successful than ours, overall growth in our user base could slow. Search engine providers could provide listings and other real estate information directly in search results or choose to align with our competitors. Our websites have experienced fluctuations in search result rankings in the past, and we anticipate similar fluctuations in the future. Any reduction in the number of users directed to our websites through search engines could harm our business and operating results.
We rely on assumptions and estimates to calculate certain of our key metrics, and real or perceived inaccuracies in such metrics may harm our reputation and negatively affect our business.
Our key metrics of monthly unique visitors and mobile monthly unique visitors are calculated using internal company data that has not been independently verified. While these numbers are based on what we believe to be reasonable calculations for the applicable period of measurement, there are inherent challenges in measuring such information. For example, our metrics may be affected by applications that automatically contact our servers to access our online properties with no user action involved, and this activity can cause our system to count the user associated with such a device as a unique visitor on the day such contact occurs. The calculations of monthly unique visitors and mobile monthly unique visitors presented in this report may be affected by this activity.
We regularly review and may adjust our processes for calculating our internal metrics to improve their accuracy. Our measures of monthly unique visitors and mobile monthly unique visitors may differ from estimates published by third parties or from similarly-titled metrics of our competitors due to differences in methodology. If real estate professionals, advertisers or investors do not perceive our user metrics to be accurate representations of our user base or user engagement, or if we discover material inaccuracies in our user metrics, our reputation
24
Table of Contents
may be harmed and real estate professionals and advertisers may be less willing to allocate their budgets or resources to our products and services, which could negatively affect our business and operating results.
Our revenue and operating results could vary significantly from period to period.
We generate revenue through sales of subscriptions to real estate professionals and sales of display advertising to advertisers. Our subscription and advertising sales can be difficult to predict and may result in fluctuations in our revenue from period to period. Our revenue and operating results have fluctuated in the past, and may continue to fluctuate in the future, as a result of a variety of factors, many of which are outside of our control. As a result, comparing our revenue and operating results on a period-to-period basis may not be meaningful, and you should not rely on past results as an indication of future performance.
Our revenue, operating results, or both, may be affected by a number of factors, including:
| • | our subscription and advertising sales, particularly large advertising campaigns; |
| • | fluctuations in user activity on our websites and mobile applications, including as a result of seasonal variations; |
| • | competition and the impact of offerings and pricing policies of our competitors; |
| • | competing effectively for advertising dollars with other online media companies; |
| • | offering an attractive return on investment to our advertisers for their advertising spending with us; |
| • | the effects of changes in search engine placement and prominence of our websites; |
| • | the amount and timing of operating expenses related to the maintenance and expansion of our business, operations, and infrastructure; |
| • | our ability to control costs, particularly those of third-party data providers; |
| • | our ability to reduce costs in a given period to compensate for unexpected shortfalls in revenue; |
| • | the timing of costs related to the development or acquisition of technologies or businesses; |
| • | our inability to complete or integrate efficiently any acquisitions that we have undertaken; |
| • | our ability to collect amounts owed to us from advertisers; |
| • | changes in our tax rates or exposure to additional tax liabilities; |
| • | claims of intellectual property infringement against us and any resulting temporary or permanent injunction prohibiting us from selling our products or requirements to pay damages or expenses associated with any of those claims; |
| • | our ability to successfully expand in existing markets and enter new markets; |
| • | our ability to keep pace with changes in technology; |
| • | changes in government regulation affecting our business; |
| • | the effectiveness of our internal controls; |
| • | conditions in the real estate market; and |
| • | general economic conditions. |
For example, individuals hired to join our sales team typically do not reach their maximum productivity until they have been employed for several months or more. Our fixed expenses related to the addition of personnel may not result in an increase in revenue in a given period or at all.
As a result of the foregoing factors and others discussed in this “Risk Factors” section, our operating results in one or more future periods may fail to meet or exceed our projections or the expectations of securities analysts or investors.
25
Table of Contents
Seasonality may cause fluctuations in our traffic, revenue, operating expenses and operating results.
From time to time, we experience seasonality in subscription revenue and display advertising due to fluctuations in traffic to our websites and mobile applications. During the fourth quarter of each year, traffic to our marketplace has historically declined and our revenue has historically grown more slowly than in other quarters or has declined sequentially. For example, we experienced a decrease in the number of unique visitors to our marketplace in the fourth quarter of 2014 compared to the third quarter of 2014, due in part to seasonality. Conversely, we typically experience higher growth in traffic and revenue during the spring and summer months, when consumers are more likely to buy new homes. We expect that seasonality will continue to affect traffic in our marketplace, as well as our revenue from subscriptions and advertising.
Declines in, or changes to, the real estate industry could adversely affect our business and financial performance.
Our business and financial performance are affected by the health of, and changes to, the residential real estate industry. Although we have built and grown our business during a worldwide economic downturn, home-buying patterns are sensitive to economic conditions and tend to decline or grow more slowly during these periods. A decrease in home purchases could lead to reductions in user traffic, reductions in subscriptions by real estate professionals, and a decline in marketing spend by real estate professionals. Furthermore, online advertising products may be viewed by some existing and potential advertisers on our websites and mobile applications as a lower priority, which could cause advertisers to reduce the amounts they spend on advertising, terminate their use of our products, or default on their payment obligations to us. In addition, we may become subject to rules and regulations in the real estate industry that may restrict or complicate our ability to deliver our products. These changes would harm our business and operating results.
Most recently, beginning in 2008, domestic and global economic conditions deteriorated rapidly, resulting in a dramatic slowdown in the housing market, which slowed advertising spending in the real estate industry. In addition, changes to the regulation of the real estate industry and related areas, including mortgage lending and the deductibility of home mortgage interest, may negatively affect the prevalence of home purchases. Real estate markets also may be negatively impacted by a significant natural disaster, such as earthquake, fire, flood, or other disruption. Declines or disruptions in the real estate market or increases in mortgage interest rates could reduce demand for our products and could harm our business and operating results.
We participate in a highly competitive market, and pressure from existing and new companies may adversely affect our business and operating results.
The market to provide home listings and marketing services for the residential real estate industry is highly competitive and fragmented. Homes are not typically marketed exclusively through any single channel. Consumers can access home listings and related data through more than one source. Accordingly, current and potential competitors could aggregate a set of listings similar to ours. We compete with online real estate marketplaces, such as Realtor.com, other real estate websites, and traditional offline media. We compete to attract consumers primarily on the basis of the number and quality of listings; user experience; the breadth, depth, and relevance of insights and other content on homes, neighborhoods, and professionals; brand and reputation; and the quality of mobile products. We expect that our marketing and product development expenses are likely to increase as we continue to seek to attract additional consumers and real estate professionals to our marketplace. For example, in 2014, we launched a national marketing campaign that is designed to attract serious home buyers and sellers to our marketplace.
We compete to attract real estate professionals primarily on the basis of the quality of our websites and mobile products, the size and attractiveness of the consumer audience, the quality and measurability of the leads we generate, the perceived return on investment we deliver, and the effectiveness of marketing and workflow tools. We also compete for advertisers against other media, including print media, television and radio, social networks, search engines, other websites, and email marketing. We compete primarily on the basis of the size and attractiveness of the audience; pricing; and the ability to target desired audiences.
26
Table of Contents
Many of our existing and potential competitors have substantial competitive advantages, such as:
| • | greater scale; |
| • | stronger brands and greater name recognition; |
| • | longer operating histories; |
| • | more financial, research and development, sales and marketing, and other resources; |
| • | more extensive relationships with participants in the residential real estate industry, such as brokers, agents, and advertisers; |
| • | strong relationships with third-party data providers, such as multiple listing services and listing aggregators; |
| • | access to larger user bases; and |
| • | larger intellectual property portfolios. |
The success of our competitors could result in fewer users visiting our websites and mobile applications, the loss of subscribers and advertisers, price reductions for our subscriptions and display advertising, weaker operating results, and loss of market share. Our competitors also may be able to provide users with products that are different from or superior to those we can provide, or to provide users with a broader range of products and prices.
We expect increased competition if our market continues to expand. In addition, current or potential competitors may be acquired by third parties with greater resources than ours, which would further strengthen these current or potential competitors and enable them to compete more vigorously or broadly with us. If we are not able to compete effectively, our business and operating results will be materially and adversely affected. Any increased marketing spending by one of our primary competitors could cause us to incur additional expenses, could reduce consumer traffic to, and subscribers of, our marketplace, or could harm our operating results.
If our users do not continue to contribute content or their contributions are not valuable to other users, our marketplace would be less attractive, which could negatively affect our unique visitor traffic and revenue.
Our success depends on our ability to provide consumers with the information they seek, which in turn depends in part on the content contributed by our users. We believe that one of our primary competitive advantages is the quality and quantity of the user-generated content in our marketplace, and that information is one of the main reasons consumers use our platform. If we are unable to provide consumers with the information they seek because our users do not contribute content, or because the content that they contribute is not helpful and reliable, the number of consumers visiting our websites and using our mobile applications may decline. If we experience a decline in consumers visiting our websites and using our mobile applications, real estate professionals and advertisers may not view our marketplace as attractive for their marketing expenditures, and may reduce their spending with us. Any decline in visits to our websites and usage of our mobile applications by consumers and any decline in spending by real estate professionals and advertisers with us would harm our business and operating results.
In addition, we monitor new contributions to user-generated content because we believe this metric is a key indicator of our user engagement and the strength of our community. In the event that the number of new contributions to user-generated content declines, this metric may provide a leading indicator of the health of our business. However, if the quantity of new contributions to user-generated content continues to increase but the quality of user-generated content declines, this metric would not capture any corresponding declines in user engagement or the strength of our community as evidenced by the lower quality of user-generated content, and such data would be of limited use in those circumstances.
27
Table of Contents
Our growth depends in part on our relationship with third parties to provide us with local information.
Third parties provide us with information that we use to provide users with insights that go beyond listings, such as information about schools, crime, and neighborhood amenities. Property descriptions and sale transactions obtained via third-party data providers also inform the valuations provided by our Trulia Estimates feature. If these third-party data providers terminate their relationships with us, the information that we provide to users may be limited or the quality of the information may suffer. If we are unable to renew our agreements with these data providers on favorable terms to us or to secure alternative sources for this information, our costs may increase and our business may be harmed.
If we do not display accurate and complete information on a timely basis, our user traffic may decline, our reputation would suffer, and our business and operating results would be harmed.
We receive listing and other information provided by listing aggregators and other third parties that we include on our websites and mobile applications. Our reputation with consumers depends on the accuracy and completeness of the information that we provide, although the accuracy and completeness of this data is often outside of our control. We cannot independently verify the accuracy or completeness of all of the information provided to us by third parties. If third parties provide us with inaccurate or incomplete information that we then display on our websites and mobile applications, consumers may become dissatisfied with our products, our traffic may decrease, and our reputation may suffer. Real estate professionals also expect listings data and other information to be accurate and complete, and to the extent our information is incorrect or incomplete, our reputation and business relationships may suffer.
In addition, we update the listing information that we provide on our websites and mobile applications on a daily basis. To the extent that we are no longer able to update information in our marketplace on a timely basis, or if consumers begin to expect updates in a more timely manner, we may be forced to make investments which allow us to update information with higher frequency. There can be no assurance that we will be able to provide information at a pace necessary to satisfy consumers in a cost-effective manner, or at all.
Growth of our business will depend on a strong brand, and any failure to maintain, protect, and enhance our brand would hurt our ability to retain or expand our base of users, or our ability to increase their level of engagement.
We believe that a strong brand is necessary to continue to attract and retain consumers and, in turn, the real estate professionals and others who choose to advertise on our websites and mobile applications. We need to maintain, protect, and enhance the “Trulia” and “Market Leader” brands in order to expand our base of users and increase their engagement with our websites and mobile applications. This will depend in part on our ability to continue to provide high-value, differentiated products, and we may not be able to do so effectively. This will also depend on our ability to successfully execute a broader marketing campaign to further promote our brand. In 2014, we launched a national marketing campaign that is designed to attract serious home buyers and sellers to our marketplace. If this campaign is not successful, our business could suffer. Furthermore, negative publicity about our company, including our content, technology, sales practices, personnel, or customer service could diminish confidence in and the use of our products, which could harm our operating results. If we are unable to maintain or enhance user and advertiser awareness of our brand cost effectively, our business, operating results, and financial condition could be harmed. In addition, our trulia.com and activerain.com websites serve as a forum for expression by our users, and if some of our users contribute inappropriate content and offend other users, our reputation could be harmed.
Our Market Leader brand could be harmed if customers do not provide quality service to prospective home buyers and sellers.
We rely on real estate professionals who are our customers of our Market Leader marketing services products to promote our Market Leader brand by providing high-quality service to prospective home buyers and sellers. We have little control over the activities of customers. If customers do not provide prospective home
28
Table of Contents
buyers and sellers with high-quality service, or if they use the functionality of our systems to send unwanted email to prospective home buyers or sellers, our brand value and our ability to generate leads may diminish.
We rely on a small number of advertising partners for a substantial portion of our Media revenue, and we are subject to risks as a result of this advertiser concentration.
In the years ended December 31, 2014, 2013 and 2012, our ten largest advertising partners accounted for more than 61%, 65%, and 63% of our Media revenue, respectively. One of our growth strategies is to increase the amount large advertisers spend in our marketplace, and we expect this revenue concentration to continue. If one or more of these large advertisers were to decrease or discontinue advertising with us, our business and operating results will be adversely affected.
Our operating results may be adversely affected by a failure to collect amounts owed to us by advertisers.
We often run display advertisements in our marketplace prior to receiving payment from an advertiser, which makes us subject to credit risks. In the past, certain advertisers have been unable to pay us due to bankruptcy or other reasons, and we cannot assure you that we will not experience collection issues in the future. If we have difficulty collecting amounts owed to us by advertisers, or fail to collect these amounts at all, our results of operations and financial condition would be adversely affected.
We depend on our talented personnel to grow and operate our business, and if we are unable to hire, retain, manage, and motivate our personnel, or if our new personnel do not perform as we anticipate, we may not be able to grow effectively.
Our future success will depend upon our continued ability to identify, hire, develop, motivate, and retain talented personnel. We may not be able to retain the services of any of our employees or other members of senior management in the future. We do not have employment agreements other than offer letters with any key employee, and we do not maintain key person life insurance for any employee. In addition, from time to time, there may be changes in our senior management team that may be disruptive to our business. If our senior management team fails to work together effectively and to execute our plans and strategies, our business could be harmed.
Our growth strategy also depends on our ability to expand our organization by hiring high-quality personnel. Identifying, recruiting, training, integrating, managing, and motivating talented individuals will require significant time, expense, and attention. Competition for talent is intense, particularly in the San Francisco Bay Area, where our headquarters is located. If we are not able to effectively recruit and retain our talent, our business and our ability to achieve our strategic objectives would be harmed.
Growth may place significant demands on our management and our infrastructure.
We have experienced substantial growth in our business that has placed, and may continue to place, significant demands on our management and our operational and financial infrastructure. As our operations grow in size, scope, and complexity, we will need to improve and upgrade our systems and infrastructure. The expansion of our systems and infrastructure will require us to commit substantial financial, operational, and technical resources in advance of an increase in the volume of business, with no assurance that the volume of business will increase. Continued growth could also strain our ability to maintain reliable service levels for our users and advertisers, develop and improve our operational, financial, and management controls, enhance our reporting systems and procedures, and recruit, train, and retain highly skilled personnel.
Our products are accessed by a large number of users, often at the same time. If the use of our marketplace continues to expand, we may not be able to scale our technology to accommodate increased capacity requirements, which may result in interruptions or delays in service. The failure of our systems and operations to meet our capacity requirements could result in interruptions or delays in service or impede our ability to scale our operations.
29
Table of Contents
Our employee growth will also require significant financial and management resources. For example, in 2014, we entered into a lease for new headquarters in San Francisco and relocated to the facility, as we needed additional headquarters office space to accommodate our growth. As lease rates in the San Francisco commercial real estate market have increased significantly in recent years, we will incur significantly higher facilities expenses for the new larger facility for our headquarters.
Managing our growth will require significant expenditures and allocation of valuable management resources. If we fail to achieve the necessary level of efficiency in our organization as it grows, our business, operating results, and financial condition would be harmed.
A significant disruption in service on our websites or of our mobile applications could damage our reputation and result in a loss of users of our products and of advertisers, which could harm our business, operating results, and financial condition.
Our brand, reputation, and ability to attract users and advertisers depend on the reliable performance of our network infrastructure, software platform and content delivery. We may experience significant interruptions with our systems in the future. Interruptions in these systems, whether due to system failures, computer viruses, or physical or electronic break-ins, could affect the security or availability of our products on our websites and mobile applications, and prevent or inhibit the ability of users to access our products. Problems with the reliability or security of our systems could harm our reputation, result in a loss of users of our products and of advertisers, and result in additional costs.
Substantially all of the communications, network, and computer hardware used to operate our trulia.com website and mobile applications are located at a single colocation facility in Santa Clara, California. Our software as a service operations depend on our ability to maintain and protect our computer systems, located in Bellevue, Washington and at other co-location facilities in Kent, Washington and other locations operated by third parties. While we have made investments to back up our system in the event of a disruption involving these facilities, our systems are not fully redundant. In addition, we do not own or control the operation of these facilities. Our systems and operations are vulnerable to damage or interruption from fire, flood, power loss, telecommunications failure, terrorist attacks, acts of war, electronic and physical break-ins, computer viruses, earthquakes, and similar events. The occurrence of any of these events could result in damage to our systems and hardware or could cause them to fail.
Problems faced by our third-party web hosting providers could adversely affect the experience of our users. Our third-party web hosting providers could close their facilities without adequate notice. Any financial difficulties, up to and including bankruptcy, faced by our third-party web hosting providers or any of the service providers with whom they contract may have negative effects on our business, the nature and extent of which are difficult to predict. If our third-party web hosting providers are unable to keep up with our growing capacity needs, our business could be harmed.
Any errors, defects, disruptions, or other performance or reliability problems with our network operations could cause interruptions in access to our products as well as delays and additional expense in arranging new facilities and services and could harm our reputation, business, operating results, and financial condition.
Our failure to protect confidential information of our users against security breaches could damage our reputation and brand and harm our business and operating results.
We maintain sensitive information provided by users and advertisers. We rely on encryption and authentication technology licensed from third parties to effect secure transmission of confidential information, including personally identifiable information and credit card numbers. We may need to expend significant resources to protect against security breaches or to address problems caused by breaches. If we are unable to maintain the security of confidential information that is provided to us by our users, our reputation and brand could be harmed and we may be exposed to a risk of loss or litigation and possible liability, any of which could harm our business and operating results.
30
Table of Contents
Failure to adequately protect our intellectual property could harm our business and operating results.
Our business depends on our intellectual property, the protection of which is crucial to the success of our business. We rely on a combination of patent, trademark, trade secret, and copyright law and contractual restrictions to protect our intellectual property. In addition, we attempt to protect our intellectual property, technology, and confidential information by requiring our employees and consultants to enter into confidentiality and assignment of inventions agreements and third parties to enter into nondisclosure agreements. These agreements may not effectively prevent unauthorized use or disclosure of our confidential information, intellectual property, or technology and may not provide an adequate remedy in the event of unauthorized use or disclosure of our confidential information, intellectual property, or technology. Despite our efforts to protect our proprietary rights, unauthorized parties may attempt to copy aspects of our websites features, software, and functionality or obtain and use information that we consider proprietary.
We have registered “Trulia” as a trademark in the United States, and several other jurisdictions. We hold twenty-three trademarks registered in the United States and thirty-nine trademarks registered in other jurisdictions associated with our Trulia and Market Leader business. We have five patents registered and 12 patents pending application in the United States. Competitors may adopt service names similar to ours, thereby harming our ability to build brand identity and possibly leading to user confusion. In addition, there could be potential trade name or trademark infringement claims brought by owners of other registered trademarks or trademarks that incorporate variations of the terms “Trulia” or “Market Leader.”
We currently hold the “Trulia.com,” “Marketleader.com,” “Housevalues.com” and “RealEstate.com” Internet domain names and various other related domain names. The regulation of domain names in the United States is subject to change. Regulatory bodies could establish additional top-level domains, appoint additional domain name registrars, or modify the requirements for holding domain names. As a result, we may not be able to acquire or maintain all domain names that use the names Trulia, Market Leader, Housevalues, or RealEstate.
Litigation or proceedings before the U.S. Patent and Trademark Office or other governmental authorities and administrative bodies in the United States and abroad may be necessary in the future to enforce our intellectual property rights, to protect our patent rights, trade secrets, and domain names and to determine the validity and scope of the proprietary rights of others. Our efforts to enforce or protect our proprietary rights may be ineffective and could result in substantial costs and diversion of resources, which could harm our business and operating results.
Intellectual property infringement assertions by third parties could result in significant costs and harm our business and operating results.
Other parties have asserted, and may in the future assert, that we have infringed their intellectual property rights. Such litigation may involve patent holding companies or other adverse patent owners who have no relevant product revenue, and therefore our own issued and pending patents may provide little or no deterrence. We could also be required to pay damages in an unspecified amount. For example, in September 2011, we entered into a settlement agreement with CIVIX-DDI LLC, or CIVIX, relating to a claim by CIVIX that we infringed two CIVIX patents relating to searching and locating real estate. Under the settlement agreement, we agreed to pay CIVIX to settle the litigation.
Litigation matters could cause us to incur significant expenses and costs. In addition, the outcome of any litigation is inherently unpredictable, and as a result of our litigation matters, we may be required to pay damages, an injunction may be entered against us that requires us to change certain features in our marketplace, or a license or other right to continue to deliver an unmodified version of such features may not be made available to us at all or may require us to pay ongoing royalties and comply with unfavorable terms. Any of these outcomes could harm our business. Even if we were to prevail, litigation matters can be costly and time-consuming, could divert the attention of our management and key personnel from our business operations, and may discourage consumers, real estate professionals, and advertisers from using our marketplace.
31
Table of Contents
From time to time, we also have other claims brought against us by third parties alleging infringement of their intellectual property. We cannot predict whether other assertions of third-party intellectual property rights or claims arising from such assertions will substantially harm our business and operating results. The defense of these claims and any future infringement claims, whether they are with or without merit or are determined in our favor, may result in costly litigation and diversion of technical and management personnel. Furthermore, an adverse outcome of a dispute may require us to pay damages, potentially including treble damages and attorneys’ fees, if we are found to have willfully infringed a party’s patent or copyright rights; cease making, licensing or using products that are alleged to incorporate the intellectual property of others; expend additional development resources to redesign our products; and enter into potentially unfavorable royalty or license agreements in order to obtain the right to use necessary technologies. Royalty or licensing agreements, if required, may be unavailable on terms acceptable to us, or at all. In any event, we may need to license intellectual property, which would require us to pay royalties or make one-time payments. Even if these matters do not result in litigation or are resolved in our favor or without significant cash settlements, the time and resources necessary to resolve them could harm our business, operating results, financial condition, and reputation.
We are subject to certain purported class action lawsuits relating to the Zillow Merger, which could materially adversely affect our business, financial condition and operating results.
We and our directors, Zillow and Zillow’s directors and HoldCo are subject to certain purported class action lawsuits relating to the Zillow Merger and additional lawsuits may be filed. While we intend to defend against the actions vigorously, the costs of the defense of such lawsuits and other effects of such litigation could have an adverse effect on our business, financial condition and operating results.
Valuation and other proprietary data may be subject to disputes.
We provide data that is relevant to the decision to purchase a home and some of this data is subject to revision, interpretation, or dispute. For example, our Trulia Estimates tool provides users with home valuations and is based on algorithms we have developed to analyze third-party data. We revise our algorithms regularly, which may cause valuations to differ from those previously provided. Consumers and real estate professionals sometimes disagree with our estimates. Any such variation in or disagreements about the estimates that we present could result in negative user feedback, harm our reputation, or lead to legal disputes.
We are subject to payments-related risks.
We accept payments using a variety of methods, including credit and debit cards. For certain payment methods, including credit and debit cards, we pay bank interchange and other fees, which may increase over time and raise our operating costs and lower profitability. We rely on third parties to provide payment processing services, including the processing of credit and debit cards, and our business would be disrupted if these companies become unwilling or unable to provide these services to us. We are also subject to payment card association operating rules, certification requirements, and rules governing electronic funds transfers, which could change or be reinterpreted to make it difficult or impossible for us to comply. If we fail to comply with these rules or requirements, we may be subject to fines and higher transaction fees and lose our ability to accept credit and debit card payments from consumers or facilitate other types of online payments, and our business and operating results could be adversely affected.
If we fail to comply with the various laws and regulations that govern the real estate industry, our business may be harmed.
Our business is governed by various federal, state and local laws and regulations governing the real estate industry, including the Real Estate Settlement Procedures Act (RESPA), the Fair Housing Act, state and local real estate broker licensing laws, federal and state laws prohibiting unfair and deceptive acts and practices, and federal and state advertising laws. We may not have always been and may not always be in compliance with each of these requirements. Failure to comply with these requirements may result in, among other things, revocation
32
Table of Contents
of required licenses, indemnification liability to contract counterparties, class action lawsuits, administrative enforcement actions and civil and criminal liability.
Due to the geographic scope of our operations and the nature of the services we provide, we may be required to obtain and maintain real estate brokerage licenses in certain states in which we operate. In connection with such licenses, we are required to designate individual licensed brokers of record. We cannot assure you that we are, and will remain at all times, in full compliance with state real estate licensing laws and regulations and we may be subject to fines or penalties in the event of any non-compliance. If in the future a state agency were to determine that we are required to obtain a real estate brokerage license in that state in order to receive payments or commissions from real estate professionals, or if we lose the services of a designated broker, we may be subject to fines or legal penalties or our business operations in that state may be suspended until we obtain the license or replace the designated broker. Any failure to comply with applicable laws and regulations may limit our ability to expand into new markets, offer new products or continue to operate in one or more of our current markets.
We may be limited in the way in which we market our business or generate revenue by federal law prohibiting referral fees in real estate transactions.
RESPA generally prohibits the payment or receipt of fees or any other thing of value for the referral of business related to a residential real estate settlement service, including real estate brokerage services. RESPA also prohibits fee shares or splits or unearned fees in connection with the provision of residential real estate settlement services. However, RESPA expressly permits payments pursuant to cooperative brokerage and referral arrangements or agreements between real estate agents and brokers. In addition, RESPA permits payments for goods or facilities furnished or for services actually performed, so long as those payments bear a reasonable relationship to the market value of the goods or facilities furnished or the services performed, excluding the value of any referrals that may be provided in connection with such goods, facilities or services. Failure to comply with RESPA may result in, among other things, administrative enforcement actions, class action lawsuits, and civil and criminal liability.
There has been limited guidance by the appropriate federal regulator or the courts regarding the applicability of RESPA to online marketing relationships for real estate or mortgage services, including those we provide. Nonetheless, RESPA may restrict our ability to enter into marketing and distribution arrangements with third parties, particularly to the extent that such arrangements may be characterized as involving payments for the referral of residential real estate settlement service business.
Our business is subject to a variety of state and federal laws, many of which are unsettled and still developing and which could subject us to claims or otherwise harm our business.
We are subject to a variety of federal and state laws, including laws regarding data retention, privacy, and consumer protection that are continuously evolving and developing. The scope and interpretation of the laws that are or may be applicable to us are often uncertain and may be conflicting. For example, laws relating to the liability of providers of online services for activities of their users and other third parties are currently being tested by a number of claims, including actions based on invasion of privacy and other torts, unfair competition, copyright and trademark infringement, and other theories based on the nature and content of the materials searched, the ads posted, or the content provided by users. In addition, regulatory authorities are considering a number of legislative and regulatory proposals concerning data protection and other matters that may be applicable to our business. Changes to existing laws or regulations or the adoption of new laws or regulations could negatively affect our business. It is difficult to predict how existing laws will be applied to our business and the new laws to which we may become subject.
Our operating results may be harmed if we are required to collect sales taxes for our products.
There is general uncertainty in the industry about the obligation of Internet-based businesses to collect and remit sales taxes in jurisdictions where their commerce is solely virtual. In the current climate, it is possible that
33
Table of Contents
one or more states or countries could seek to impose sales or other tax collection obligations on us or our subscribers with regards to our products, which taxes may be applicable to past sales. A successful assertion that we should be collecting additional sales or other taxes on our products could result in substantial tax liabilities for past sales, discourage subscribers from purchasing our products, or otherwise harm our business and operating results.
If we fail to expand effectively into adjacent markets, our growth prospects could be harmed.
We intend to expand our operations into adjacent markets, such as rentals, mortgages, and home improvement, and into international geographies. We may incur losses or otherwise fail to enter these markets successfully. Our expansion into these markets will place us in competitive environments with which we are unfamiliar and involves various risks, including the need to invest resources and the possibility that returns on such investments will not be achieved for several years, or at all. In attempting to establish a presence in new markets, we expect to incur expenses and face various other challenges, such as expanding our sales force and management personnel to cover these markets.
| Item 1B. | Unresolved Staff Comments |
None.
| Item 2. | Properties |
On March 10, 2014, we entered into a lease effective November 1, 2014, for approximately 79,000 square feet of new office space at 535 Mission Street in San Francisco that houses our principal executive office. This office space replaced our former principal office at 116 New Montgomery Street in San Francisco, for which the lease expired in the fourth quarter of 2014. On July 25, 2014 we entered into a lease amendment under which we will lease an additional 26,620 square feet of office space commencing in October 2015 under the same terms and conditions.
On April 10, 2014, we entered into a lease effective May 1, 2014 for approximately 65,000 square feet of office space in the Denver metropolitan area. In September 2013, we entered into a lease effective through September 2021, for approximately 72,000 square feet of office space that houses our offices in Bellevue, WA. We lease additional office space in New York. We believe our facilities are sufficient for our current needs.
| Item 3. | Legal Proceedings |
From time to time, we are subject to legal proceedings and claims in the ordinary course of business. We have received, and may in the future continue to receive, claims from third parties asserting, among other things, infringement of their intellectual property rights.
Zillow Merger Litigation
Between August 7, 2014 and August 20, 2014, four plaintiffs filed purported class action lawsuits against us and our directors, Zillow and HoldCo in connection with the Zillow Merger. Three of those purported class actions were brought in the Delaware Court of Chancery, captioned Shue et al. v. Trulia, Inc., et al., Case No. 10020 (August 7, 2014), Sciabacucci et al. v. Trulia, Inc., et al., Case No. 10022 (August 8, 2014), and Steinberg et al. v. Trulia, Inc. et al., Case No. 10049 (August 20, 2014). The fourth of those purported class actions was brought in the Superior Court of the State of California for the County of San Francisco, captioned Collier et al. v. Trulia, Inc., et al., Case No. CGC 14-540985 (August 7, 2014).
Each of the lawsuits alleges that our directors breached their fiduciary duties to Trulia stockholders, and that the other defendants aided and abetted such breaches, by seeking to sell Trulia through an allegedly unfair
34
Table of Contents
process and for an unfair price and on unfair terms. The Collier complaint filed in Delaware and the Sciabacucci complaint (as amended, as described below) also allege that our directors breached their fiduciary duties to Trulia stockholders, and that the other defendants aided and abetted such breaches, with respect to the contents of HoldCo’s registration statement on Form S-4. All lawsuits seek, among other things, equitable relief that would enjoin the consummation of the Zillow Merger and attorneys’ fees and costs. The Delaware actions also seek rescission of the Merger Agreement (to the extent it has already been implemented) or rescissory damages, and orders directing the individual defendants to account for alleged damages suffered by the plaintiff and the purported class as a result of the defendants’ alleged wrongdoing.
On September 23, 2014, the plaintiff in the Sciabacucci action filed an amended complaint, alleging substantially the same claims and seeking substantially the same relief as in the original complaint, and on September 24, 2014, the plaintiff filed (1) a motion for expedited proceedings, (2) a motion for a preliminary injunction, (3) a request for production of documents from defendants, and (4) notice of depositions. On October 7, 2014, the plaintiff in the Collier action filed a new complaint in Delaware Court of Chancery, captioned Collier et al. v. Trulia, Inc., et al., Case No. 10209 (October 7, 2014), alleging substantially the same claims and seeking substantially the same relief as the original complaint filed in California. On October 8, 2014, the plaintiff in the Collier action filed a request for dismissal of the California case without prejudice. On October 13, 2014, the Delaware Court of Chancery issued an order consolidating all of the Delaware actions into one matter captioned In re Trulia, Inc. Stockholder Litigation, C.A. No. 10020-CB and appointed a lead counsel. On October 13 and 14, 2014, the above-referenced motions were refiled under the consolidated case number.
On November 19, 2014, the defendants entered into a memorandum of understanding with the In re Trulia, Inc. Stockholder Litigation plaintiffs regarding the settlement of that action. In connection with the settlement contemplated by the memorandum of understanding, with the defendants expressly denying that any of the claims has any merit, Trulia agreed to make certain additional disclosures related to the proposed merger, which disclosures Trulia made in a Form 8-K filed with the SEC on November 19, 2014. The memorandum of understanding contemplates that the parties will seek to enter into a stipulation of settlement.
The stipulation of settlement will be subject to customary conditions, including court approval following notice to the Trulia stockholders. In the event that the parties enter into a stipulation of settlement, a hearing will be scheduled at which the Delaware Court of Chancery will consider the fairness, reasonableness, and adequacy of the settlement. There can be no assurance that the parties will ultimately enter into a stipulation of settlement or that the Delaware Court of Chancery will approve the settlement even if the parties were to enter into such stipulation. In such event, the proposed settlement as contemplated by the memorandum of understanding may not be consummated
Although the results of litigation and claims cannot be predicted with certainty, we believe the final outcome of the matters discussed above will not have a material and adverse effect on our business, financial position, results of operations, or cash flows. We will, however, accrue for losses for any known contingent liabilities when future payment is probable and the amount is reasonably estimable.
| Item 4. | Mine Safety Disclosures. |
Not applicable.
35
Table of Contents
PART II
| Item 5. | Market for Registrant’s Common Equity, Related Stockholder Matters and Issuer Purchases of Equity Securities |
Market Information and Holders of Record
Our common stock first listed on the New York Stock Exchange (“NYSE”) under the symbol “TRLA” on September 20, 2012. Prior to that date, there was no public trading market for our common stock. The following table sets forth for the periods indicated the high and low sales price per share of our common stock as reported on the NYSE for the periods indicated:
| Year Ended December 31, 2014: | High | Low | ||||||
| First Quarter |
$ | 39.83 | $ | 28.15 | ||||
| Second Quarter |
$ | 48.68 | $ | 29.23 | ||||
| Third Quarter |
$ | 67.50 | $ | 38.38 | ||||
| Fourth Quarter |
$ | 54.05 | $ | 40.38 | ||||
| Year Ended December 31, 2013: | High | Low | ||||||
| First Quarter |
$ | 38.22 | $ | 16.50 | ||||
| Second Quarter |
$ | 35.33 | $ | 27.52 | ||||
| Third Quarter |
$ | 52.71 | $ | 30.81 | ||||
| Fourth Quarter |
$ | 51.54 | $ | 26.35 | ||||
As of December 31, 2014, we had 58 holders of record of our common stock. The actual number of stockholders is greater than this number of record holders and includes stockholders who are beneficial owners but whose shares are held in street name by brokers and other nominees. This number of holders of record also does not include stockholders whose shares may be held in trust by other entities.
On July 28, 2014, we entered into the Merger Agreement with Zillow and HoldCo, pursuant to which Zillow acquired us on February 17, 2015. On February 17, 2015, Trulia notified the NYSE that the Zillow Merger had been completed, and requested that trading of our common stock on the NYSE be suspended. In addition, an application on Form 25 was filed with the Securities and Exchange Commission to remove our common stock from listing on the NYSE and from registration under Section 12(b) of the Exchange Act. As a result, trading of our common stock on the NYSE was suspended before trading commenced on February 18, 2015.
Upon completion of the Zillow Merger, (i) each outstanding share of our common stock was converted into the right to receive 0.444 of a share of Class A common stock of HoldCo; (ii) each outstanding share of Class A common stock of Zillow was converted into the right to receive one share of Class A common stock of HoldCo; and (iii) each outstanding share of Class B common stock of Zillow was converted into the right to receive one share of Class B common stock of HoldCo. The Class A common stock of HoldCo has one vote per share and the Class B common stock of HoldCo has ten votes per share, similar to the former capital structure of Zillow.
Dividends
We have never declared or paid a cash dividend on our capital stock. We currently intend to retain any future earnings and do not expect to pay any dividends in the foreseeable future. Any future determinations to pay cash dividends will be made at the discretion of our board of directors, subject to applicable laws, and will depend on a number of factors, including our financial condition, results of operations, capital requirements, contractual restrictions, general business conditions, and any other factors that our board of directors may deem relevant.
Stock Performance Graph
We have presented below the cumulative total return to our stockholders during the period from September 20, 2012 (the date our common stock commenced trading on the NYSE) through December 31, 2014
36
Table of Contents
in comparison to the NYSE Composite Index and NYSE Arca Tech 100 Index. All values assume a $100 initial investment and data for the NYSE Composite Index and NYSE Arca Tech 100 Index assume reinvestment of dividends. The comparisons are based on historical data and are not indicative of, nor intended to forecast, the future performance of our common stock.
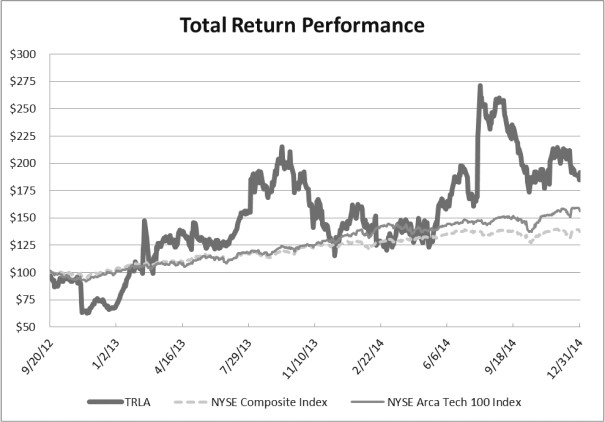
The information under “Stock Performance Graph” is not deemed to be “soliciting material” or “filed” with the SEC or subject to Regulation 14A or 14C, or to the liabilities of Section 18 of the Exchange Act, and is not to be incorporated by reference in any filing of Trulia under the Securities Act or the Exchange Act, whether made before or after the date of this Annual Report on Form 10-K and irrespective of any general incorporation language in those filings.
Recent Sales of Unregistered Securities and Use of Proceeds from Registered Securities
(a) Sales of Unregistered Securities
On December 17, 2013, we issued $230.0 million aggregate principal amount of 2.75% Convertible Senior Notes due 2020, or the 2020 Notes, which included a $30.0 million of principal amount issued pursuant to an option to purchase additional shares granted to the initial purchasers, in a private placement pursuant to exemptions from the registration requirements of the Securities Act. J.P. Morgan Securities LLC and Deustsche Bank Securities Inc. acted as representatives of the initial purchasers of the 2020 Notes. The 2020 Notes were issued only to “qualified institutional buyers” in compliance with Rule 144A under the Securities Act. We incurred $6.9 million in underwriting fees that were paid out of the gross proceeds from this offering.
In connection with the closing of the Zillow Merger on February 17, 2015, each outstanding 2020 Note which was convertible into shares of our common stock is now convertible into shares of Zillow Group, Inc. Class A common stock.
37
Table of Contents
(b) Use of Proceeds
On September 25, 2012, we closed our IPO pursuant to which we sold 5,900,000 shares of our common stock, which includes 900,000 shares sold pursuant to the exercise by the underwriters of an over-allotment option, at a public offering price of $17.00 per share, resulting in net proceeds to us of $89.4 million, after deducting underwriting discounts and commissions and offering expenses payable by us. In addition, another 1,000,000 shares were sold by certain selling stockholders. We did not receive any proceeds from sales by the selling stockholders. J.P. Morgan Securities LLC, Deutsche Bank Securities Inc., RBC Capital Markets, LLC, Needham & Company, LLC, and William Blair & Company, L.L.C acted as underwriters. No payments were made by us to directors, officers or persons owning ten percent or more of our common stock or to their associates, or to our affiliates. We maintain the funds received in cash and cash equivalents. There has been no material change in the planned use of proceeds from our initial public offering as described in our final prospectus filed pursuant to Rule 424(b) with the Securities and Exchange Commission on September 19, 2012. From the effective date of the registration statement through December 31, 2014, we have used the net proceeds of the offering in connection with the acquisition of Market Leader and for working capital purposes and other general corporate purposes.
On March 20, 2013, we closed our follow-on public offering pursuant to which we sold 3,500,000 shares of our common stock, at a public offering price of $29.75 per share, resulting in net proceeds to us of $98.1 million, after deducting underwriting discounts and commissions and offering expenses payable by us. On March 26, 2013, we sold an additional 525,000 shares of our common stock pursuant to the exercise by the underwriters of an option to purchase additional shares, at a public offering price of $29.75 per share, resulting in net proceeds to us of $14.9 million, after deducting underwriting discounts and commissions and offering expenses payable by us. In addition, another 3,117,311 shares were sold by certain selling stockholders, which includes 406,606 shares sold pursuant to the exercise by the underwriters of an option to purchase additional shares. We did not receive any proceeds from sales by the selling stockholders. Deutsche Bank Securities Inc., J.P. Morgan Securities LLC, RBC Capital Markets, LLC, Needham & Company, LLC, and William Blair & Company, L.L.C acted as underwriters. No payments were made by us to directors, officers or persons owning ten percent or more of our common stock or to their associates, or to our affiliates. We maintain the funds received in cash and cash equivalents. There has been no material change in the planned use of proceeds from our secondary public offering as described in our final prospectus filed pursuant to Rule 424(b) with the Securities and Exchange Commission on March 15, 2013. From the effective date of the registration statement through December 31, 2014, we have used the net proceeds of the offering in connection with the acquisition of Market Leader and for working capital purposes and other general corporate purposes.
On December 17, 2013 we issued $230.0 million aggregate principal amount of the 2020 Notes, which included a $30.0 million of principal amount issued pursuant to an option to purchase additional notes granted to the initial purchasers. We received net proceeds of $222.4 million, after deducting offering expenses of $7.6 million payable by us. Interest began to accrue on December 17, 2013 and is payable semi-annually every June 15 and December 15, starting on June 15, 2014. We may not redeem the 2020 Notes prior to December 20, 2018. We may redeem the notes, at our option, in whole or in part on or after December 20, 2018, subject to certain conditions. Holders of the notes may convert all or portion all or any portion of their notes, in multiples of $1,000 principal amount, at their option at any time prior to the close of business on the business day immediately preceding the maturity date. At the time of the Zillow Merger the notes were convertible at a conversion rate of a number of shares of HoldCo Class A common stock equal to 27.8303 times 0.444 per $1,000 principal amount of notes, subject to adjustment in certain events.
38
Table of Contents
c) Issuer Purchases of Equity Securities
| Period |
(a) Total Number of Shares (Units) Purchased |
(b) Average Price Paid per Share (or Unit) |
(c
) Total Number of Shares (or Units) Purchased as Part of Publicly Announced Plans or Programs |
(c) Maximum number (or Approximate Dollar Value) of Shares (or Units) that May Yet Be Purchased Under the Plans or Programs |
||||||||||||
| Month #1 (October 1, 2013—October 31, 2013) * |
521 | $ | 43.73 | — | — | |||||||||||
| Month #2 (November 1, 2013—November 30, 2013) |
— | — | — | — | ||||||||||||
| Month #3 (December 1, 2013—December 31, 2013) ** |
1,085,383 | 27.64 | — | — | ||||||||||||
|
|
|
|
|
|
|
|
|
|||||||||
| Total |
1,085,904 | $ | 27.65 | — | — | |||||||||||
|
|
|
|
|
|
|
|
|
|||||||||
| * | We paid $23,000 to repurchase shares of our common stock in the open market at the market price of our common stock on the date of this transaction. |
| ** | We used $30.0 million of the net proceeds received from the issuance of the 2020 Notes to repurchase shares of our common stock from purchasers of the 2020 Notes in privately negotiated transactions effected through J.P. Morgan Securities LLC or its affiliate as our agent. The purchase price per share of the common stock repurchased in this transactions was equal the closing price per share of our common stock on December 11, 2013, which was $27.64. |
Securities Authorized for Issuance Under Equity Compensation Plans
See Item 12, “Security Ownership of Certain Beneficial Owners and Management and Related Stockholder Matters” for information regarding securities authorized for issuance.
39
Table of Contents
| Item 6. | Selected Financial and Other Data |
The following selected historical financial data below should be read in conjunction with Item 7, “Management’s Discussion and Analysis of Financial Condition and Results of Operations,” our financial statements, and the related notes appearing in Item 8, “Financial Statements and Supplementary Data”, of this Annual Report on Form 10-K to fully understand factors that may affect the comparability of the information presented below.
The statements of operations data for the years ended December 31, 2014, 2013, and 2012 and the balance sheet data as of December 31, 2014 and 2013 are derived from our audited financial statements appearing in Item 8, “Financial Statements and Supplementary Data”, of this Annual Report on Form 10-K. The statements of operations for the years ended December 31, 2011 and 2010, and the balance sheet data as of December 31, 2012, 2011 and 2010 are derived from audited financial statements not included in this Annual Report on Form 10-K. The statement of operations for the year ended December 31, 2013 includes results of Market Leader operations in the post-acquisition period from August 21, 2013 through December 31, 2013. Our historical results are not necessarily indicative of the results to be expected in the future.
| Year Ended December 31, | ||||||||||||||||||||
| 2014 | 2013 | 2012 | 2011 | 2010 | ||||||||||||||||
| (In thousands, except share and per share data) | ||||||||||||||||||||
| Statement of Operations Data: |
||||||||||||||||||||
| Revenue |
$ | 251,937 | $ | 143,728 | $ | 68,085 | $ | 38,518 | $ | 19,785 | ||||||||||
| Cost and operating expenses: (1) |
||||||||||||||||||||
| Cost of revenue (exclusive of amortization) (2) |
44,538 | 23,122 | 9,999 | 5,795 | 3,657 | |||||||||||||||
| Technology and development |
57,643 | 34,612 | 20,199 | 14,650 | 8,803 | |||||||||||||||
| Sales and marketing |
144,180 | 71,370 | 33,747 | 17,717 | 8,638 | |||||||||||||||
| General and administrative |
49,964 | 32,702 | 13,659 | 6,123 | 2,501 | |||||||||||||||
| Acquisition costs |
18,144 | 6,065 | — | — | — | |||||||||||||||
| Restructuring costs |
4,987 | — | — | — | — | |||||||||||||||
|
|
|
|
|
|
|
|
|
|
|
|||||||||||
| Total cost and operating expenses |
319,456 | 167,871 | 77,604 | 44,285 | 23,599 | |||||||||||||||
|
|
|
|
|
|
|
|
|
|
|
|||||||||||
| Loss from operations |
(67,519 | ) | (24,143 | ) | (9,519 | ) | (5,767 | ) | (3,814 | ) | ||||||||||
| Other income (expense) |
(431 | ) | 121 | 50 | 17 | 15 | ||||||||||||||
| Interest expense |
(7,386 | ) | (1,107 | ) | (1,016 | ) | (389 | ) | (39 | ) | ||||||||||
| Change in fair value of warrant liability |
— | — | (369 | ) | (16 | ) | — | |||||||||||||
| Loss on extinguishment of debt |
— | (141 | ) | — | — | — | ||||||||||||||
|
|
|
|
|
|
|
|
|
|
|
|||||||||||
| Loss before provision for income taxes |
(75,336 | ) | (25,270 | ) | (10,854 | ) | (6,155 | ) | (3,838 | ) | ||||||||||
| Income tax (provision) benefit |
(427 | ) | 7,511 | (67 | ) | — | — | |||||||||||||
|
|
|
|
|
|
|
|
|
|
|
|||||||||||
| Net loss attributable to common stockholders |
$ | (75,763 | ) | $ | (17,759 | ) | $ | (10,921 | ) | $ | (6,155 | ) | $ | (3,838 | ) | |||||
|
|
|
|
|
|
|
|
|
|
|
|||||||||||
| Net loss per share attributable to common stockholders, basic and diluted (3) |
$ | (2.03 | ) | $ | (0.54 | ) | $ | (0.87 | ) | $ | (0.92 | ) | $ | (0.64 | ) | |||||
|
|
|
|
|
|
|
|
|
|
|
|||||||||||
| Weighted average shares used in computing net loss per share attributable to common stockholders, basic and diluted (3) |
37,335,200 | 33,129,572 | 12,538,769 | 6,657,045 | 6,016,550 | |||||||||||||||
|
|
|
|
|
|
|
|
|
|
|
|||||||||||
| Other Financial Information: |
||||||||||||||||||||
| Adjusted EBITDA (4) |
$ | 29,705 | $ | 17,106 | $ | (3,364 | ) | $ | (1,787 | ) | $ | (2,497 | ) | |||||||
|
|
|
|
|
|
|
|
|
|
|
|||||||||||
40
Table of Contents
| (1) | Compensation paid in stock was allocated as follows: |
| Year Ended December 31, | ||||||||||||||||||||
| 2014 | 2013 | 2012 | 2011 | 2010 | ||||||||||||||||
| (In thousands) | ||||||||||||||||||||
| Cost of revenue |
$ | 3,088 | $ | 718 | $ | 32 | $ | 11 | $ | 8 | ||||||||||
| Technology and development |
10,671 | 6,365 | 930 | 482 | 176 | |||||||||||||||
| Sales and marketing |
14,172 | 5,663 | 398 | 183 | 97 | |||||||||||||||
| General and administrative |
17,002 | 10,227 | 1,210 | 808 | 73 | |||||||||||||||
| Restructuring costs |
82 | — | — | — | — | |||||||||||||||
|
|
|
|
|
|
|
|
|
|
|
|||||||||||
| Total compensation paid in stock |
$ | 45,015 | $ | 22,973 | $ | 2,570 | $ | 1,484 | $ | 354 | ||||||||||
|
|
|
|
|
|
|
|
|
|
|
|||||||||||
|
(2) Amortization of product development costs were included in technology and development as follows: |
$ | 6,363 | $ | 2,660 | $ | 1,108 | $ | 708 | $ | 366 | ||||||||||
|
|
|
|
|
|
|
|
|
|
|
|||||||||||
| (3) | See Note 11 to our audited financial statements for an explanation of the method used to calculate basic and diluted net loss per share attributable to common stockholders and the weighted average number of shares used in the computation of the per share amounts. |
| (4) | See “Non-GAAP Financial Measures” for more information and a reconciliation of Adjusted EBITDA to net loss, the most directly comparable financial measure calculated and presented in accordance with generally accepted accounting principles in the United States, or GAAP. |
| As of December 31, | ||||||||||||||||||||
| 2014 | 2013 | 2012 | 2011 | 2010 | ||||||||||||||||
| (In thousands) | ||||||||||||||||||||
| Balance Sheet Data: |
||||||||||||||||||||
| Cash and cash equivalents and short-term investments |
$ | 198,781 | $ | 225,597 | $ | 100,017 | $ | 11,341 | $ | 4,395 | ||||||||||
| Working capital (deficit) |
181,564 | 213,336 | 82,632 | 4,165 | (132 | ) | ||||||||||||||
| Property and equipment, net |
49,755 | 22,289 | 7,069 | 5,548 | 3,465 | |||||||||||||||
| Total assets |
640,514 | 655,409 | 118,964 | 24,195 | 15,710 | |||||||||||||||
| Deferred revenue |
9,320 | 10,002 | 13,296 | 4,827 | 1,810 | |||||||||||||||
| Total indebtedness |
230,000 | 230,000 | 9,759 | 9,592 | 1,955 | |||||||||||||||
| Preferred stock warrant liability |
— | — | — | 297 | — | |||||||||||||||
| Total stockholders’ equity |
360,247 | 381,076 | 86,534 | 3,039 | 7,142 | |||||||||||||||
Non-GAAP Financial Measures
Adjusted EBITDA is a financial measure that is not calculated in accordance with generally accepted accounting principles in the United States, or GAAP. We define Adjusted EBITDA as net loss adjusted to exclude interest income, interest expense, loss on extinguishment of debt, income taxes, depreciation and amortization, change in the fair value of our warrant liability, compensation paid in stock, and certain other infrequently occurring items that Trulia does not believe are indicative of ongoing results (such as acquisition or restructuring costs). Below, we have provided a reconciliation of Adjusted EBITDA to our net loss, the most directly comparable financial measure calculated and presented in accordance with GAAP. Adjusted EBITDA should not be considered as an alternative to net loss or any other measure of financial performance calculated and presented in accordance with GAAP. Our Adjusted EBITDA may not be comparable to similarly titled measures of other organizations because other organizations may not calculate Adjusted EBITDA in the same manner as we calculate the measure.
We include Adjusted EBITDA in this Annual Report on Form 10-K because it is an important measure upon which our management assesses our operating performance. We use Adjusted EBITDA as a key performance measure because we believe it facilitates operating performance comparisons from period to period by excluding potential differences primarily caused by variations in capital structures, tax positions, the impact of depreciation and amortization expense on our fixed assets, changes related to the fair value remeasurements of our preferred
41
Table of Contents
stock warrant, and the impact of the compensation paid in stock. Because Adjusted EBITDA facilitates internal comparisons of our historical operating performance on a more consistent basis, we also use Adjusted EBITDA for business planning purposes, to incentivize and compensate our management personnel, and in evaluating acquisition opportunities. In addition, we believe Adjusted EBITDA and similar measures are widely used by investors, securities analysts, ratings agencies, and other parties in evaluating companies in our industry as a measure of financial performance and debt-service capabilities.
Our use of Adjusted EBITDA has limitations as an analytical tool, and you should not consider it in isolation or as a substitute for analysis of our results as reported under GAAP. Some of these limitations are:
| • | Adjusted EBITDA does not reflect our cash expenditures for capital equipment or other contractual commitments; |
| • | Although depreciation and amortization are non-cash charges, the assets being depreciated and amortized may have to be replaced in the future, and Adjusted EBITDA does not reflect capital expenditure requirements for such replacements; |
| • | Adjusted EBITDA does not reflect changes in, or cash requirements for, our working capital needs; |
| • | Adjusted EBITDA does not reflect the interest expense or the cash requirements necessary to service interest or principal payments on our indebtedness; and |
| • | Other companies, including companies in our industry, may calculate Adjusted EBITDA measures differently, which reduces their usefulness as a comparative measure. |
In evaluating Adjusted EBITDA, you should be aware that in the future we will incur expenses similar to the adjustments in this presentation. Our presentation of Adjusted EBITDA should not be construed as an inference that our future results will be unaffected by these expenses or any unusual or non-recurring items. When evaluating our performance, you should consider Adjusted EBITDA alongside other financial performance measures, including our net loss and other GAAP results.
The following table presents a reconciliation of Adjusted EBITDA to our net loss, the most comparable GAAP measure, for each of the periods indicated:
| Year Ended December 31, | ||||||||||||||||||||
| 2014 | 2013 | 2012 | 2011 | 2010 | ||||||||||||||||
| (In thousands) | ||||||||||||||||||||
| Net loss attributable to common stockholders |
$ | (75,763 | ) | $ | (17,759 | ) | $ | (10,921 | ) | $ | (6,155 | ) | $ | (3,838 | ) | |||||
| Non-GAAP adjustments: |
||||||||||||||||||||
| Other (income) expense |
431 | (121 | ) | (50 | ) | (17 | ) | (15 | ) | |||||||||||
| Interest expense |
7,386 | 1,107 | 1,016 | 389 | 39 | |||||||||||||||
| Loss on extinguishment of debt |
— | 141 | — | — | — | |||||||||||||||
| Depreciation and amortization |
28,772 | 12,211 | 3,585 | 2,496 | 963 | |||||||||||||||
| Change in fair value of warrant liability |
— | — | 369 | 16 | — | |||||||||||||||
| Income tax provision (benefit) |
427 | (7,511 | ) | 67 | — | — | ||||||||||||||
| Compensation paid in stock |
44,933 | 22,973 | 2,570 | 1,484 | 354 | |||||||||||||||
| Acquisition costs |
18,144 | 6,065 | — | — | — | |||||||||||||||
| Restructuring costs—GAAP |
4,987 | — | — | — | — | |||||||||||||||
| Restructuring costs—Other |
388 | — | — | — | — | |||||||||||||||
|
|
|
|
|
|
|
|
|
|
|
|||||||||||
| Adjusted EBITDA |
$ | 29,705 | $ | 17,106 | $ | (3,364 | ) | $ | (1,787 | ) | $ | (2,497 | ) | |||||||
|
|
|
|
|
|
|
|
|
|
|
|||||||||||
42
Table of Contents
| Item 7. | Management’s Discussion and Analysis of Financial Condition and Results of Operations |
The following discussion and analysis of our financial condition and results of operations should be read in conjunction with our financial statements and related notes appearing elsewhere in this Annual Report on Form 10-K. In addition to historical financial information, the following discussion contains forward-looking statements that reflect our plans, estimates and beliefs. Statements containing words such as “may,” “believe,” “anticipate,” “expect,” “intend,” “plan,” “project,” “projections,” “business outlook,” “estimate,” or similar expressions constitute forward-looking statements. Our actual results could differ materially from those contained in or implied by any forward-looking statements. Factors that could cause or contribute to these differences include those discussed below and elsewhere in this Annual Report on Form 10-K.
Overview
Trulia is redefining the home search experience for consumers and changing the way that real estate professionals build their businesses. Our marketplace, delivered through the web and mobile applications, gives consumers powerful tools to research homes and neighborhoods and enables real estate professionals to efficiently market their listings and attract and manage new clients. We believe we deliver the best home search experience by combining our superior user interface with our comprehensive database of real estate properties, local insights, and user-generated content. We also offer a comprehensive suite of free and subscription products that provide real estate professionals with access to transaction-ready consumers and help them to grow and manage their online presence. We also generate media revenue from sales of display advertising on our websites and mobile applications.
Key elements of our marketplace are extensive consumer reach, an engaged base of real estate professionals, and a comprehensive database of real estate information and local insights. We also offer free and subscription-based products that provide comprehensive marketing and customer relationship management (“CRM”) solutions for real estate professionals. In the year ended December 31, 2014, we had approximately 48.0 million monthly unique visitors. In addition, as of December 31, 2014, we had more than 540,000 active real estate professionals in our Trulia marketplace and 181,000 active real estate professionals using our Market Leader software and services. Approximately 79,300 of these real estate professionals were paying subscribers (assuming a 20% overlap between Trulia subscribers and Market Leader’s premium subscribers).
Our large, continually refreshed, and searchable database contains approximately 114.0 million properties, including 3.0 million homes for sale and rent. We supplement listings data with local information on schools, crime, commute time, neighborhood amenities, rental prices, and historical earthquake, flood and other natural disaster data to provide unique insights into each community. In addition, we harness rich, insightful user-generated content from our active community of contributors, including consumers, local enthusiasts, and real estate professionals. With 16.6 million unique user contributions, we believe we have the largest collection of user-generated content on homes, neighborhoods, and real estate professionals. We deliver this information on mobile devices through our iPhone, iPad, Android Phone, Android tablet, and Kindle Fire applications and also provide tailored mobile experiences, such as GPS-based search.
We offer our products free to consumers. We deliver hard to find insights on homes, neighborhoods, and real estate professionals in an intuitive and engaging way, helping consumers make more informed housing decisions. Our free products attract users to our marketplace and the quality of our products drives the growth of our audience and promotes deep engagement by our users. We believe this leads real estate professionals to convert to paying subscribers and brand advertisers to purchase our advertising products.
For real estate professionals, we offer a suite of free and subscription products to promote themselves and their listings online, manage and grow their businesses and to connect with consumers searching for homes. We generate revenue primarily from sales of subscription marketing products and our software-as-a-service customer relationship management products that we offer to real estate professionals. Our Trulia Pro and Trulia Premium Listings products allow real estate professionals to receive prominent placement of their listings in our search
43
Table of Contents
results. With our Trulia Local Ads and Trulia Mobile Ads products, real estate professionals can purchase local advertising on our Trulia website and mobile applications, respectively, by locale and by share of a given market. With our recently launched Trulia Seller Ads product, real estate professionals can generate leads from consumers interested in selling their homes. With our software-as-a-service products, real estate professionals can manage and cultivate clients and potential clients by automating daily tasks and efficiently marketing their services. We charge real estate professionals subscription fees for our software-as-a-service products. We also generate revenue through enterprise marketing agreements with real estate franchise networks. We provide a base level software-as-a-service product to all agents and/or brokerages in these franchise networks in exchange for certain minimum payments from the real estate franchise networks. We also generate revenue through the sale of premium software and marketing products to individual agents, teams and brokerage offices within these real estate franchise networks.
In addition, we generate revenue from display advertising we sell to leading advertisers engaged in promoting their brand to our attractive audience. Pricing for our display advertisements is based on advertisement size and position on our web page, and fees are primarily based on a Cost-Per-Thousand, Cost-Per-Click, or Cost-Per-Lead basis.
To date, we have focused our efforts and investments on developing and delivering superior products and user experiences, attracting consumers and real estate professionals to our marketplace, selling our products and growing our revenue. We intend to continue to spend on technology and engineering in order to further improve the experience of our users and offer the most comprehensive end-to-end marketing and customer relationship management solutions for real estate professionals.
We believe that the growth of our business and our future success are dependent upon many factors including our ability to increase our audience size and user engagement, grow the number of our paying subscribers, increase the value of our advertising and software-as-a-service products, achieve the anticipated benefits of the Market Leader acquisition, and successfully invest in our growth. While each of these areas presents significant opportunities for us, they also pose important challenges that we must successfully address in order to sustain the growth of our business and improve our operating results. We also expect that our efforts to maintain or increase consumer traffic and subscribers are likely to include, among other things, increases to our marketing spending and expenditures to increase the number of our engineering and product development personnel. In 2014, we launched a national marketing campaign that is designed to attract serious home buyers and sellers to our marketplace.
Acquisition by Zillow, Inc.
On July 28, 2014, we entered into the Merger Agreement with Zillow and HoldCo, pursuant to which Zillow acquired us on February 17, 2015. Pursuant to the Merger Agreement, both we and Zillow have become wholly-owned subsidiaries of HoldCo.
Upon completion of the Zillow Merger, (i) each outstanding share of our common stock was converted into the right to receive 0.444 of a share of Class A common stock of HoldCo; (ii) each outstanding share of Class A common stock of Zillow was converted into the right to receive one share of Class A common stock of HoldCo; and (iii) each outstanding share of Class B common stock of Zillow was converted into the right to receive one share of Class B common stock of HoldCo. The Class A common stock of HoldCo has one vote per share and the Class B common stock of HoldCo has ten votes per share, similar to the former capital structure of Zillow.
In addition, subject to certain exceptions, each Trulia stock option, restricted stock unit and stock appreciation right outstanding immediately prior to the consummation of the Merger, whether or not vested and exercisable was assumed by HoldCo and converted into a corresponding equity award to purchase, acquire shares of, or participate in the appreciation in price of, HoldCo Class A Common Stock. The terms of each assumed equity award are the same except that the number of shares subject to each equity award and the per share exercise price, if any, was adjusted based on the exchange ratio per a formula set forth in the Merger Agreement.
44
Table of Contents
On September 12, 2014, HoldCo filed a Registration Statement on Form S-4 with the SEC to register the shares of HoldCo’s common stock to be issued to shareholders of Zillow and stockholders of Trulia as consideration in the acquisition in exchange for the Zillow and Trulia common stock. The Registration Statement on Form S-4 was declared effective by the SEC on November 17, 2014. On December 18, 2014, Zillow’s shareholders and Trulia’s stockholders approved the Zillow Merger. In connection with the closing of the Zillow Merger on February 17, 2015, Trulia filed an application on Form 25 with the SEC to remove Trulia’s common stock from listing on the NYSE and from registration under Section 12(b) of the Securities Exchange Act of 1934, as amended (the “Exchange Act”). Trulia intends to file a certificate on Form 15 requesting that its reporting obligations under Sections 13 and 15(d) of the Exchange Act be terminated. HoldCo Class A Common Stock began trading on the NASDAQ Global Select Market on February 18, 2015.
Restructuring
On February 17, 2015, in connection with the Zillow Merger, we undertook a restructuring plan that will result in a total workforce reduction of approximately 342 employees, or approximately 32% of our workforce, at our Bellevue, Denver, New York and San Francisco locations, primarily in the sales and marketing functions. The restructuring plan is a result of the integration of our business and operations with and into Zillow’s business. Employees directly affected by the restructuring plan will be provided with severance payments, vesting acceleration, and outplacement assistance.
As a result of the restructuring plan, we plan to record a one-time restructuring charge of between approximately $21.5 million and $24.5 million in 2015, primarily representing cash payments for severance and other personnel related expenses, and non-cash expenses related to stock vesting acceleration. Severance payments will be paid out by the end of 2015. The restructuring charge that we expect to incur in connection with the restructuring is subject to a number of assumptions, and actual results may materially differ. We may also incur other material charges not currently contemplated due to events that may occur as a result of, or associated with, the restructuring plan.
In June 2014, our board of directors approved a restructuring plan to accelerate the integration of our Market Leader operations with those of Trulia, to eliminate overlapping positions, and to streamline operations. We implemented this restructuring plan to shorten the time to market for our products and to drive further growth. Further details on the restructuring are presented in Note 12 to our audited consolidated financial statement included in this Annual Report on Form 10-K.
Convertible Senior Notes
On December 17, 2013 we issued $230.0 million aggregate principal amount of 2.75% Convertible Senior Notes due in 2020, or the 2020 Notes, which included a $30.0 million of principal amount issued pursuant to an option to purchase additional notes granted to the initial purchasers. The aggregate principal amount of the 2020 Notes is due on December 15, 2020. We received net proceeds of $222.4 million, after deducting offering expenses of $7.6 million payable by us. Interest began to accrue on December 17, 2013 and is payable semi-annually every June 15 and December 15, starting on June 15, 2014. We may not redeem the 2020 Notes prior to December 20, 2018. We may redeem the 2020 Notes, at our option, in whole or in part on or after December 20, 2018, subject to certain conditions. Holders of the 2020 Notes may convert all or any portion of their notes, in multiples of $1,000 principal amount, at their option at any time prior to the close of business on the business day immediately preceding the maturity date. At the time of the Zillow Merger, the notes were convertible at a conversion rate of a number of shares of HoldCo Class A common stock equal to 27.8303 times 0.444 per $1,000 principal amount of notes, subject to adjustment in certain events.
In connection with the closing of the Zillow Merger on February 17, 2015, each outstanding 2020 Note which was convertible into shares of our common stock is now convertible into shares of HoldCo Class A Common Stock.
45
Table of Contents
Acquisition of Market Leader, Inc.
On August 20, 2013 we completed the acquisition of Market Leader, Inc., or Market Leader, for approximately $372.7 million, including 4,412,489 million shares of our common stock valued at $189.3 million, and $170.5 million in cash and assumed Market Leader equity awards valued at $26.7 million, $12.9 million of which was included in the purchase price and the remaining amount was subject to post-acquisition service requirement and was being expensed prospectively. Market Leader is a provider of software-as-a-service based customer relationship management software for the real estate sector. We acquired Market Leader to help accelerate our growth, including by expanding our product portfolio for real estate professionals and increasing our subscriber base. Our consolidated financial statements include the results of operations for Market Leader beginning on August 21, 2013.
Follow-on Public Offering
In March 2013, we completed our follow-on public offering in which we sold an aggregate of 4,025,000 shares of our common stock, which included 525,000 shares sold pursuant to the exercise by the underwriters of an option to purchase additional shares, at a public offering price of $29.75 per share. In addition, another 3,117,311 shares were sold by certain selling stockholders, which included 406,606 shares sold pursuant to the exercise by the underwriters of an option to purchase additional shares. We received aggregate net proceeds of $113.0 million, after deducting underwriting discounts and commissions and offering expenses payable by us, from sales of our shares in the offering. We did not receive any of the proceeds from the sales of shares by the selling stockholders.
Key Business Metrics
To analyze our business performance, determine financial forecasts, and help develop long-term strategic plans, we review the key business metrics below.
| • | Monthly Unique Visitors. We count a unique visitor the first time a computer or mobile device with a unique IP address accesses trulia.com (including our Trulia blogs), any of our more than 177,000 agent websites powered by Market Leader, or our mobile websites and applications during a calendar month. If an individual accesses any of the websites or mobile applications using different IP addresses within a given month, the first access by each such IP address is counted as a separate unique visitor. If an individual accesses more than any one of our websites in a single month, the first access to each website is counted as a separate unique user since unique users are tracked separately for each domain. Our number of monthly unique visitors includes mobile monthly unique visitors. We calculate our monthly unique visitors based on the monthly average over the applicable period. The third quarter of 2013 was the first quarter in which we included our consumer facing blogs in our monthly unique visitor count, and starting in March 2014 of the first quarter of 2014 we began including all other blogs in our monthly unique visitor count. We view monthly unique visitors as a key indicator of the growth in our business and audience reach, the quality of our products, and the strength of our brand awareness. In the year ended December 31, 2014, the total number of monthly unique visitors increased to 48.0 million from 37.8 million in the year ended December 31, 2013, a 27% increase. We attribute the growth in our monthly unique visitors principally to our marketing campaign efforts, the popularity of our mobile products, and the overall industry trend of more consumers using the web and mobile applications to research housing decisions. |
| • | Mobile Monthly Unique Visitors. We count a unique mobile visitor the first time a mobile device with a unique IP address accesses trulia.com (including our Trulia blogs starting March 2014), any of our more than 177,000 agent websites powered by Market Leader, or our mobile websites and applications during a calendar month. We calculate our mobile monthly unique visitors based on the monthly average over the applicable period. These mobile monthly unique visitors are included in our monthly unique visitors metric. We view mobile monthly unique visitors as a key indicator of the growth in our business and audience reach, and believe that having more unique visitors using our mobile applications will drive faster growth in our revenue. We plan to expand our mobile products to support our rapidly growing mobile user base. In the year ended December 31, 2014, the number of mobile |
46
Table of Contents
| monthly unique visitors increased to 23.7 million from 14.2 million in the year ended December 31, 2013, a 67% increase. We attribute this growth to our marketing campaign efforts, the overall adoption of smartphones and the growth of mobile applications and mobile web use by consumers. We also attribute the growth in our mobile monthly unique visitors to our increased efforts in developing a mobile website and mobile applications. Due to the significant growth rate of usage of our mobile products and solutions, our mobile monthly unique visitors has grown as a percentage of our monthly unique visitors over recent periods and we expect this trend to continue. |
| • | New Contributions to User-Generated Content. We define user-generated content as any content contributed by a user through trulia.com, or Trulia’s mobile websites or applications, such as Q&A discussions, blogs, blog comments, user votes, recommendations, and neighborhood ratings and reviews. In the year ended December 31, 2014, new contributions to user-generated content increased by approximately 4.8 million contributions, and we now have over 16.6 million cumulative contributions on our marketplace. We expect new contributions to user-generated content to continue to grow as our monthly unique visitors and total subscribers grow and as we introduce new features to trulia.com and our Trulia mobile websites and applications. While the absolute number of new contributions to user-generated content may continue to grow period-over-period, the rate of growth has slowed and we expect that the rate of growth may continue to slow as the aggregate size of our user-generated content increases. We believe the slowing growth rate of new contributions to user-generated content is a function of the large historical number of new contributions to user-generated content on our marketplace, which makes achievement of increasing rates of growth more challenging. We continue to focus on promoting new contributions to user-generated content to increase the engagement of our users with our marketplace. |
| • | Total Subscribers. We define a subscriber as a real estate professional with a paid subscription at the end of a period. This includes agents using our premium software-as-a-service product under a licensed purchased by their brokerage, and excludes subscribers to certain legacy Market Leader properties, such as activerain.com and SharperAgent. Total subscribers has been, and we expect will continue to be, a key driver of revenue growth. It is also an indicator of our market penetration, the value of our products, and the attractiveness of our consumer audience to real estate professionals. As of December 31, 2014, we had approximately 79,300 total subscribers, a 33% increase from approximately 60,000 total subscribers as of December 31, 2013, assuming a 20% overlap between Trulia and Market Leader. We attribute the growth in our total subscribers to our increasing sales and marketing efforts, principally from the growth of our inside sales team, as well as growth in monthly unique visitors. Although our total subscribers are growing period-over-period and we expect total subscribers to continue to grow, the rate of growth may slow as we increase efforts to sell more products to existing subscribers. In addition, subscribers often purchase subscriptions for limited periods as a result of seasonality, as part of their advertising campaigns, and other factors. |
| • | Average Monthly Revenue per Subscriber. We calculate our average monthly revenue per subscriber by dividing the revenue generated from subscriptions of our lead generation products and our software-as-a-service products in a period by the average number of subscribers in the period, divided again by the number of months in the period. Our average number of subscribers is calculated by taking the average of the beginning and ending number of subscribers for the period, and assumes a 20% overlap between Trulia and Market Leader. Our average monthly revenue per subscriber is a key indicator of our ability to monetize our marketplace and the performance of our software-as-a-service subscription products for real estate professionals, and we monitor changes in this metric to measure the effectiveness of our monetization strategy. As our new and existing subscribers mature, we have been able to increase our average monthly revenue per subscriber by launching new products to sell to these customers, redesigning existing products to expand inventory in high demand zip codes, raising prices in certain geographic markets, and selling to existing subscribers the additional advertising inventory created by traffic growth to our marketplace. In addition, in geographic markets that show strong demand for our Trulia subscription products—those where inventory is sold out and wait lists to purchase our products |
47
Table of Contents
| exist—average monthly revenue per subscriber is higher than in markets with less demand for these products. While our average monthly revenue per subscriber has increased and may continue to increase in absolute dollars year-over-year, the rate of increase has slowed and we expect that the rate of increase may continue to slow. We believe that the slowing growth rate of our average monthly revenue per subscriber is the result of the consolidation of the historically lower Market Leader average monthly revenue per subscriber into this key business metric, our larger subscriber base and the resulting challenge associated with achieving higher growth rates and our efforts to introduce new, lower priced, entry level lead generation products to attract new subscribers. Despite this slowing growth rate, we believe we have significant opportunities to continue to increase average monthly revenue per subscriber by further penetrating markets and by offering new products to existing subscribers. |
Our key business metrics are as follows:
| Year Ended December 31, | ||||||||||||
| 2014 | 2013 | 2012 | ||||||||||
| Monthly unique visitors (in thousands) |
48,030 | 37,756 | 23,145 | |||||||||
| Mobile monthly unique visitors (in thousands) |
23,696 | 14,203 | 6,760 | |||||||||
| New contributions to user-generated content (in thousands) |
4,795 | 4,362 | 3,050 | |||||||||
| Total subscribers (at period end) |
79,254 | 59,677 | 24,443 | |||||||||
| Average monthly revenue per subscriber ($) |
209 | 193 | 156 | |||||||||
Components of Statements of Operations
Revenue
Our revenue is comprised of Marketplace revenue and Media revenue.
Marketplace Revenue. Marketplace revenue primarily consists of products and services sold to real estate professionals, including agents, brokers, agents of property managers, builders, and mortgage lenders on a fixed fee subscription, Cost Per Click (“CPC”) or Cost Per Lead (“CPL”) basis. We currently sell four sets of products to real estate professionals on a subscription basis. The first set of products, which includes Trulia Local Ads and Trulia Mobile Ads, enables real estate professionals to promote themselves on our search results pages and property details pages for a local market area. Real estate professionals purchase subscriptions to these products based upon their specified market share for a city or zip code, at a fixed monthly price, for periods ranging from one month to one year, with pricing depending on demand, location, and the percentage of market share purchased. Our second set of products allows real estate professionals to receive prominent placement of their listings in our search results. Real estate professionals sign up for new subscriptions to this product at a fixed monthly price for periods that generally range from 6 months to 24 months. Our third set of products includes Trulia Seller Ads that enable real estate professionals to generate leads from consumers interested in selling their homes. Our fourth set of products is our comprehensive premium software-as-a-service based marketing products typically sold to real estate professionals as a bundle of products under a fixed fee subscription. We also sell a base version of these products to strategic franchise networks for specified contractual amounts over a number of years and partner with them to drive adoption of our premium solution across their network.
Media Revenue. Media revenue primarily consists of display advertising sold on a Cost per Thousand (“CPM”), CPC, and CPL basis to advertisers promoting their brand on trulia.com, our mobile website, m.trulia.com and our partners websites (cumulatively “Trulia Websites”). Impressions are the number of times an advertisement is loaded on a web page and clicks are the number of times users click on an advertisement. Revenue is recognized in the periods the clicks or impressions are delivered. Pricing is primarily based on advertisement size and position on the Trulia Websites and fees are generally billed monthly. As our mobile web pages and mobile applications offer less space on which to display advertising, a shift in user traffic from our websites to mobile products could decrease our advertising inventory and negatively affect our Media revenue. Recently, we have experienced a shift in user traffic as our mobile monthly unique visitors have continued to grow at a rapid pace and our monthly unique visitors have stayed relatively constant.
48
Table of Contents
In the third quarter of 2013, we changed how we define our Marketplace revenue and Media revenue. The changes primarily relate to the re-classification of products and services sold to mortgage lenders. The change in definitions did not change total revenue reported in any period. The following table provides a comparison of Marketplace revenue and Media revenue as currently classified and as previously classified for all periods presented. Marketplace revenue and Media revenue have been reclassified for all periods disclosed herein.
| Year Ended December 31, | ||||||||||||
| 2014 | 2013 | 2012 | ||||||||||
| Marketplace revenue (current definition) |
$ | 210,335 | $ | 113,383 | $ | 47,805 | ||||||
| Marketplace revenue (previous definition) |
$ | — | $ | 107,712 | $ | 45,475 | ||||||
| Media revenue (current definition) |
$ | 41,602 | $ | 30,345 | $ | 20,280 | ||||||
| Media revenue (previous definition) |
$ | — | $ | 36,016 | $ | 22,610 | ||||||
In addition, as noted above, in the year ended December 31, 2013, we have added the contribution of Market Leader to Marketplace revenue from August 21, 2013 (the day after the closing of our acquisition of Market Leader) through December 31, 2013.
Cost and Operating Expenses
Cost of Revenue. Cost of revenue consists primarily of expenses related to operating our websites and mobile applications, including those associated with the operation of our data centers and customer websites, hosting fees, customer service related headcount related expenses including salaries, bonuses, benefits and compensation paid in stock, cost to generate leads for customers, licensed content, multiple listing services fees, revenue sharing costs, credit card processing fees, third-party contractor fees, and allocated overhead.
Technology and Development. Technology and development expenses consist primarily of headcount related expenses including salaries, bonuses, benefits and compensation paid in stock, third-party contractor fees, and allocated overhead primarily associated with developing new technologies. Technology and development also includes amortization expenses related to capitalized costs from internal and external development activities for our marketplace.
Sales and Marketing. Sales and marketing expenses consist primarily of headcount related expenses including salaries, bonuses, commissions, benefits and compensation paid in stock for sales, customer service, marketing, and public relations employees; advertising expenses and third-party contractor fees. Sales and marketing expenses also include other sales expenses related to promotional and marketing activities, and allocated overhead.
General and Administrative. General and administrative expenses consist primarily of headcount related expenses including salaries, bonuses, benefits and compensation paid in stock for executive, finance, accounting, legal, human resources, recruiting, and administrative support personnel. General and administrative expenses also include legal, accounting, and other third-party professional service fees, bad debt, and allocated overhead costs.
Interest Income
Interest income consists primarily of interest earned on our cash and cash equivalent and short-term investment balances.
Interest Expense
Interest expense consists primarily of interest on our outstanding long-term debt and capital lease obligations. See Note 7 of our audited consolidated financial statements included in this Annual Report on Form 10-K for more information about our long-term debt.
49
Table of Contents
Change in Fair Value of Warrant Liability
Change in fair value of the warrant liability includes charges from the remeasurement of our preferred stock warrant liability on a mark-to-market basis as of each period end. These preferred stock warrants became warrants to purchase common stock upon the completion of our IPO, at which time the warrant liability was remeasured to fair value and the remaining liability was reclassified as additional paid-in capital
Provision for Income Taxes
Our provision for income taxes has not been historically significant to our business as we have incurred operating losses to date.
As a result of the acquisition of Market Leader in August 2013, we recorded a tax benefit of $7.9 million as a discrete item in the three months ended September 30, 2013. This tax benefit is a result of the partial release of its existing valuation allowance immediately prior to the acquisition since the acquired deferred tax liabilities from Market Leader will provide a source of income for us to realize a portion of our deferred tax assets, for which a valuation allowance is no longer needed.
Critical Accounting Policies and Estimates
Our financial statements are prepared in accordance with generally accepted accounting principles in the United States, or US GAAP. The preparation of these financial statements requires us to make estimates and assumptions that affect the reported amounts of assets, liabilities, revenue, costs and expenses, and related disclosures. We base our estimates on historical experience and on various other assumptions that we believe to be reasonable. In many instances, we could have reasonably used different accounting estimates, and in other instances changes in the accounting estimates are reasonably likely to occur from period-to-period. Actual results could differ significantly from our estimates. To the extent that there are material differences between these estimates and actual results, our future financial statement presentation, financial condition, results of operations and cash flows will be affected. We believe that the accounting policies discussed below are critical to understanding our historical and future performance, as these policies relate to the more significant areas involving our judgments and estimates.
Revenue Recognition
We recognize revenue when persuasive evidence of an arrangement exists, delivery has occurred, the price to the buyer is fixed or determinable, and collection is reasonably assured. We consider a signed agreement, a binding insertion order, or other similar documentation reflecting the terms and conditions under which products will be provided to be persuasive evidence of an arrangement. Collectability is assessed based on a number of factors, including payment history and the creditworthiness of a customer. If it is determined that collection is not reasonably assured, revenue is not recognized until collection becomes reasonably assured, which is generally upon receipt of cash.
Our revenue is comprised of Marketplace revenue and Media revenue.
We enter into arrangements with customers that include combinations of CPC media placements, CPM media placements, and subscription products.
We allocate arrangement consideration in multiple-element revenue arrangements at the inception of an arrangement to all deliverables or those packages in which all components of the package are delivered at the same time, based on the relative selling price method in accordance with the selling price hierarchy, which includes: (i) vendor-specific objective evidence (“VSOE”), if available; (ii) third-party evidence (“TPE”), if VSOE is not available; and (iii) best estimate of selling price (“BESP”), if neither VSOE nor TPE is available.
50
Table of Contents
VSOE- We determine VSOE based on our historical pricing and discounting practices for the specific product when sold separately. In determining VSOE, we require that a substantial majority of the standalone selling prices for these products fall within a reasonably narrow pricing range. For certain subscription products, we have been able to establish VSOE.
TPE- When VSOE cannot be established for deliverables in multiple-element arrangements, we apply judgment with respect to whether we can establish a selling price based on TPE. TPE is determined based on competitor prices for similar deliverables when sold separately. Generally, our go-to-market strategy differs from that of our peers and our offerings contain a significant level of differentiation such that the comparable pricing of our products cannot be obtained. Furthermore, we are unable to reliably determine what similar competitor selling prices are on a standalone basis. As a result, we have not been able to establish selling price based on TPE.
BESP- When we are unable to establish selling price using VSOE or TPE, we use BESP in our allocation of arrangement consideration. The objective of BESP is to determine the price at which we would transact a sale if the service was sold regularly on a standalone basis. As we have not been able to establish VSOE or TPE for CPM media placements, CPC media placements, and certain subscription products, we determine BESP for these deliverables based on the following:
| • | The list price represents a component of the go-to-market strategy established by senior management. Our list prices are based on the features of the products offered. These features, which consist of the size and placement of the advertisements on our website, impact the list prices which vary depending on the specifications of the features. In addition, the list prices are impacted by market conditions, including the conditions of the real estate market and economy in general, and our competitive landscape; and |
| • | Analysis of our selling prices for these deliverables. |
We limit the amount of allocable arrangement consideration to amounts that are fixed or determinable and that are not contingent on future performance or future deliverables. We regularly review BESP. Changes in assumptions or judgments or changes to the elements in the arrangement could cause a material increase or decrease in the amount of revenue that we report in a particular period.
We recognize the relative fair value of the products as they are delivered assuming all other revenue recognition criteria are met.
Allowances for Doubtful Accounts
We record a provision for doubtful accounts based on historical experience and a detailed assessment of the collectability of our accounts receivable. To assist with the estimate, our management considers certain factors such as historical experience, industry data, credit quality, age of accounts receivable balances, and current economic conditions that may affect a customer’s ability to pay. In cases where we become aware of circumstances that may impair a specific customer’s ability to meet its financial obligations, we record a specific allowance against amounts due from the customer and thereby reduce the net recognized receivable to the amount we reasonably believe will be collected. There is significant judgment involved in estimating the allowance for doubtful accounts.
51
Table of Contents
Property and Equipment
Property and equipment is initially recorded at cost and depreciated using a straight-line method over the estimated useful lives of the assets. Maintenance and repair costs are charged to expense as incurred. The useful lives of our property and equipment are as follows:
| Computer equipment |
2 to 3 years | |
| Office equipment, furniture and fixtures |
3 years | |
| Capitalized product development costs |
2 to 3 years | |
| Network equipment |
5 years | |
| Leasehold improvements |
Shorter of the lease term or 5 years |
Depreciation expense of assets acquired through capital leases is included in depreciation and amortization expense in the statements of operations.
Market Leader Restructuring Costs
The main components of our restructuring plan relate to workforce reduction and contract termination costs. Workforce reduction charges are accrued when it is probable that the employees are entitled to the severance payments and the amounts can be reasonably estimated. One-time involuntary termination benefits are accrued when the plan of termination has been communicated to employees and certain other criteria are met. Contract termination costs are recognized as a liability when a contract is terminated in accordance with its terms, or at the cease-use date. If the amounts and timing of cash flows from restructuring activities are significantly different from what we have estimated, the actual amount of restructuring and other related charges could be materially different than those we have recorded.
Goodwill
Goodwill represents the excess of the aggregate purchase price paid over the fair value of net identifiable assets acquired. Goodwill is not amortized and is tested for impairment at least annually or whenever events or changes in circumstances indicate that the carrying value may not be recoverable. We have determined that we operate as one reporting unit and have selected December 1 as the date to perform our annual impairment test. The first step of the impairment test involves comparing the fair value of the reporting unit to its net book value, including goodwill. If the net book value exceeds its fair value, then we would perform the second step of the goodwill impairment test to determine the amount of the impairment loss. When performing the valuation of our goodwill, we make assumptions regarding our estimated future cash flows to determine the fair value of our business. If our estimates or related assumptions change in the future, we may be required to record impairment loss related to our goodwill. We have not recognized any goodwill impairments since our inception.
Impairment of Long-Lived Assets
We assess the impairment of long-lived assets whenever events or changes in circumstances indicate that the carrying amount of such assets may not be recoverable. Recoverability of assets to be held and used is measured first by a comparison of the carrying amount of an asset to the future undiscounted net cash flows expected to be generated by the asset. If such assets are considered to be impaired, an impairment loss would be recognized. When measuring the recoverability of these assets, we will make assumptions regarding our estimated future cash flows expected to be generated by the assets. If our estimates or related assumptions change in the future, we may be required to impair these assets. We have not recognized any impairment of long-lived assets to date.
Product Development Costs
Costs incurred in connection with the development of our marketplace are accounted for as follows: all costs incurred in the preliminary project and post-implementation stages are expensed as incurred. Certain costs incurred in the application development stage of a new product or projects to provide significant additional
52
Table of Contents
functionality to existing products are capitalized if certain criteria are met. Maintenance and enhancement costs are typically expensed as incurred. Such costs are amortized on a straight-line basis over the estimated useful lives of the related assets, which was estimated to be two years. Amortization expense is included in technology and development expense in the statements of operations.
Stock-Based Compensation
We recognize compensation costs related to stock-based awards granted to employees based on the estimated fair value of the awards on the date of grant, net of estimated forfeitures. We measure the grant date fair value of stock options and stock appreciation rights using the Black-Scholes option-pricing model. Grant date fair value of restricted stock units equals the fair value of our common stock on the date of grant. These fair values are recognized on a straight-line basis over the requisite service period, which is the vesting period of the respective awards.
We account for equity awards issued to nonemployees based on the fair value of these awards, which is remeasured at the end of each reporting period. The resulting change in value, if any, is recognized in the statement of operations during the period the related services are rendered.
The fair value of the stock options granted during the years ended December 31, 2014, 2013 and 2012 was calculated using the Black-Scholes option-pricing model with the following weighted average assumptions:
| Year Ended December 31, | ||||||||||||
| 2014 | 2013 | 2012 | ||||||||||
| Expected term (in years) |
5.3 | 5.5 | 5.5 | |||||||||
| Expected volatility |
48% | 52% | 53% | |||||||||
| Risk-free interest rate |
1.7% | 1.2% | 0.9% | |||||||||
| Dividend rate |
0% | 0% | 0% | |||||||||
The Black-Scholes option-pricing model requires the use of highly subjective and complex assumptions, including the expected term and the price volatility of the underlying stock, which determine the fair value of stock-based awards. These assumptions include:
| • | Expected term. The expected term represents the period that the stock-based awards are expected to be outstanding. We estimate the expected term of the options and stock appreciation rights based on a study of publicly traded industry peer companies and the historical data on employee exercises and post-vesting employment termination behavior taking into account the contractual life of the stock-based awards; |
| • | Expected volatility. The expected volatility is derived from the historical stock volatilities of several comparable publicly listed peers over a period approximately equal to the expected term of the stock-based awards. We use this method because we have limited information on the volatility of our common stock because of our short trading history. When making the selections of our comparable industry peers to be used in the volatility calculation, we considered the size, operational and economic similarities to our principle business operations; |
| • | Risk-free interest rate. The risk-free interest rate is based on the U.S. Treasury yield curve in effect at the time of grant for zero coupon U.S. Treasury notes with maturities approximately equal the expected term of the stock-based awards; and |
| • | Expected dividend. The expected dividend is assumed to be zero as we have never paid dividends and have no current plans to pay any dividends on our common stock. |
In addition to the assumptions used in the Black-Scholes option-pricing model, we must also estimate a forfeiture rate to calculate the stock-based compensation for our awards. Our forfeiture rate is based on an analysis of our actual forfeitures. We will continue to evaluate the appropriateness of the forfeiture rate based on
53
Table of Contents
actual forfeiture experience, analysis of employee turnover, and other factors. Quarterly changes in the estimated forfeiture rate can have a significant impact on our stock-based compensation expense as the cumulative effect of adjusting the rate is recognized in the period the forfeiture estimate is changed. If a revised forfeiture rate is higher than the previously estimated forfeiture rate, an adjustment is made that will result in a decrease to the stock-based compensation expense recognized in our financial statements. If a revised forfeiture rate is lower than the previously estimated forfeiture rate, an adjustment is made that will result in an increase to the stock-based compensation expense recognized in our financial statements.
We will continue to use judgment in evaluating the expected volatility, expected terms, and forfeiture rates utilized for our stock-based compensation calculations on a prospective basis. As we continue to accumulate additional data related to our common stock, we may have refinements to the estimates of our expected volatility, expected terms, and forfeiture rates, which could materially impact our future stock-based compensation expense.
Business Combination
We recognize identifiable assets acquired and liabilities assumed at their acquisition date fair values. Goodwill on the acquisition date is measured as the excess of consideration transferred over the net fair value of the assets acquired and the liabilities assumed. While we use our best estimates and assumptions as a part of the purchase price allocation process to accurately value assets acquired and liabilities assumed at the acquisition date, our estimates are inherently uncertain and subject to refinement. As a result, during the measurement period, which may be up to one year from the acquisition date, we may record adjustments to the assets acquired and liabilities assumed, with the corresponding offset to goodwill to the extent that we identify adjustments to the preliminary purchase price allocation. Upon the conclusion of the measurement period or final determination of the values of assets acquired and liabilities assumed, whichever comes first, any subsequent adjustments are recorded to our consolidated statements of operations.
Purchased Intangible Assets
Purchased intangible assets with a determinable economic life are carried at cost, less accumulated amortization. Amortization is computed over the estimated useful life of each asset on a straight-line basis. The useful lives of the purchased intangible assets are as follows (in years):
| Enterprise relationships |
10 years | |||
| Premium users |
5 years | |||
| Existing technology |
7 years | |||
| Trade names |
10 years | |||
| Home/MLS data feeds |
10 years |
Purchased intangible assets are reviewed for impairment whenever events or changes in circumstances indicate that the carrying amount of such assets may not be recoverable. Recoverability of assets to be held and used is measured first by a comparison of the carrying amount of an asset to future undiscounted net cash flows expected to be generated by the asset. If such assets are considered to be impaired, an impairment loss would be recognized when the carrying amount of the asset exceeds the fair value of the asset.
Income Taxes
We account for our income taxes in accordance with the asset and liability method. Under this method, deferred tax assets and liabilities are recognized for the expected future tax consequences of temporary differences between the financial reporting and tax bases of assets and liabilities, and for operating losses and tax credit carryforwards. Management must make assumptions, judgments, and estimates to determine our current provision for income taxes and also our deferred tax assets and liabilities, as well as any valuation allowance to be recorded against a deferred tax asset.
54
Table of Contents
Our assumptions, judgments, and estimates relative to the current provision for income taxes take into account current tax laws, our interpretation of current tax laws, and possible outcomes of current and future audits conducted by domestic tax authorities. We have established reserves for income taxes to address potential exposures involving tax positions that could be challenged by tax authorities. Although we believe our assumptions, judgments, and estimates are reasonable, changes in tax laws or our interpretation of tax laws, and the resolution of potential tax audits could significantly impact the amounts provided for income taxes in our financial statements.
Our assumptions, judgments, and estimates relative to the value of a deferred tax asset take into account predictions of the amount and category of future taxable income, such as income from operations or capital gains income. Actual operating results and the underlying amount and category of income in future years could render our current assumptions, judgments, and estimates of recoverable net deferred taxes inaccurate. Any of the assumptions, judgments, and estimates mentioned above could cause our actual income tax obligations to differ from our estimates, thus materially impacting our financial position and results of operations.
Since inception, we have incurred operating losses, and accordingly, we have generally not recorded significant provisions for income taxes for any of the periods presented. We generally do not expect any significant changes until we are no longer incurring losses. However, in the three months ended September 30, 2013, we recorded a discrete, one-time benefit of approximately $8 million associated with the acquisition of Market Leader which enabled us to recognize a portion of our deferred tax assets.
During the year ended December 31, 2013, we completed an analysis of certain research expenditures attributable to the legacy Trulia business to determine whether, and to what extent, federal and state research credits could be claimed and carried forward from inception through 2013. As a result of that analysis, we claimed research and development credits of approximately $2.9 million and $2.5 million, for federal and state purposes, respectively. These credits have been presented in Note 14 of our audited financial statements included elsewhere in this Annual Report on Form 10-K as an increase to deferred tax assets for the year ended December 31, 2013 but have also resulted in a corresponding increase to our valuation allowance. The claim therefore had no net impact to income tax expense. The federal credits will begin to expire in 2025 and the state credits can be carried forward indefinitely.
At December 31, 2014, we had approximately $192.2 million of federal net operating loss and $152.5 million of state net operating loss carryforwards available to reduce future taxable income, which will begin to expire in 2025 and 2015, respectively. Included in the above net operating loss carryforwards are $59 million and $45.7 million of federal and state net operating loss carryforwards, respectively, associated with a windfall tax benefit that will be recorded as additional paid in capital when realized.
Segment Information
We have one reportable segment. Our reportable segment has been identified based on how our chief operating decision-maker manages our business, makes operating decisions and evaluates operating performance. The chief executive officer acts as the chief operating decision-maker and reviews financial and operational information on an entity-wide basis.
Recently Issued and Adopted Accounting Pronouncements
In November 2014, the Financial Accounting Standards Board (“FASB”) issued the Accounting Standards Update No. 2014-17, “Business Combinations (Topic 805),” (“ASU 2014-17”). ASU 2014-17 provides an acquired entity an option to apply pushdown accounting in its separate financial statements when a change in control occurs. The acquired entity may make this election in the subsequent period, and that will constitute a change in accounting principle. If pushdown accounting option is elected for a specific change in control event, that election is irrevocable. This guidance is effective as of November 18, 2014. Adoption of this guidance has no impact on our financial position, results of operations or cash flows in the current or future periods.
55
Table of Contents
In May 2014, the FASB issued the Accounting Standards Update No. 2014-09, “Revenue from Contracts with Customers,” (“ASU 2014-09”). ASU 2014-09 requires entities to recognize revenue for promised goods or services to customers in an amount that reflects the consideration to which the entity expects to be entitled to in exchange. Additionally, entities should have sufficient disclosures about nature, amount, timing, and uncertainty of revenue and cash flows arising from contracts with customers. This guidance is effective for interim and annual reporting periods beginning after December 15, 2016. Early adoption is not permitted. We expect to adopt this guidance on January 1, 2017. We are in the process of assessing the impact on our financial position, results of operations and cash flows from the adoption of this guidance.
In July 2013, the FASB issued Accounting Standards Update No. 2013-11, “Presentation of an Unrecognized Tax Benefit When a Net Operating Loss Carryforward, a Similar Tax Loss, or Tax Credit Carryforward Exists,” (“ASU 2013-11”). ASU 2013-11 requires entities to present an unrecognized tax benefit, or a portion of an unrecognized tax benefit, as a reduction to a deferred tax asset for a net operating loss carryforward, a similar tax loss, or a tax credit carryforward when settlement in this manner is available under the tax law. This guidance is effective for interim and annual reporting periods beginning after December 15, 2013, with earlier adoption permitted, and may be applied prospectively or retrospectively. We adopted this guidance on January 1, 2014. Adoption of this guidance has no impact on our financial position, results of operations or cash flows in the current or future periods.
In February 2013, the FASB issued Accounting Standards Update No. 2013-02, “Comprehensive Income,” (“ASU 2013-02”). ASU 2013-02 requires entities to report the effect of significant reclassifications out of accumulated other comprehensive income on the respective line items in net income if the amount being reclassified is required under US GAAP to be reclassified in its entirety to net income. For other amounts that are not required under US GAAP to be reclassified in their entirety from accumulated other comprehensive income to net income in the same reporting period, an entity is required to cross-reference other disclosures required under US GAAP that provide additional detail about those amounts. This pronouncement is effective for fiscal years beginning after December 15, 2012. We adopted this standard on January 1, 2013. During the years ended December 31, 2014, 2013, and 2012 we did not have any other comprehensive income and, therefore, the net loss and comprehensive loss was the same for all periods presented.
56
Table of Contents
Results of Operations
The following tables set forth our results of operations for the periods presented in dollars and as a percentage of our total revenue:
| Year Ended December 31, | ||||||||||||
| 2014 | 2013 | 2012 | ||||||||||
| (In thousands) | ||||||||||||
| Statement of Operations Data: |
||||||||||||
| Revenue |
$ | 251,937 | $ | 143,728 | $ | 68,085 | ||||||
| Cost and operating expenses: (1) |
||||||||||||
| Cost of revenue (2) |
44,538 | 23,122 | 9,999 | |||||||||
| Technology and development |
57,643 | 34,612 | 20,199 | |||||||||
| Sales and marketing |
144,180 | 71,370 | 33,747 | |||||||||
| General and administrative |
49,964 | 32,702 | 13,659 | |||||||||
| Acquisition costs |
18,144 | 6,065 | — | |||||||||
| Restructuring costs |
4,987 | — | — | |||||||||
|
|
|
|
|
|
|
|||||||
| Total cost and operating expenses |
319,456 | 167,871 | 77,604 | |||||||||
|
|
|
|
|
|
|
|||||||
| Loss from operations |
(67,519 | ) | (24,143 | ) | (9,519 | ) | ||||||
| Other income (expense) |
(431 | ) | 121 | 50 | ||||||||
| Interest expense |
(7,386 | ) | (1,107 | ) | (1,016 | ) | ||||||
| Change in fair value of warrant liability |
— | — | (369 | ) | ||||||||
| Loss on extinguishment of debt |
— | (141 | ) | — | ||||||||
|
|
|
|
|
|
|
|||||||
| Loss before provision for income taxes |
(75,336 | ) | (25,270 | ) | (10,854 | ) | ||||||
| Income tax (provision) benefit |
(427 | ) | 7,511 | (67 | ) | |||||||
|
|
|
|
|
|
|
|||||||
| Net loss attributable to common stockholders |
$ | (75,763 | ) | $ | (17,759 | ) | $ | (10,921 | ) | |||
|
|
|
|
|
|
|
|||||||
| (1) | Compensation paid in stock was allocated as follows: |
| Year Ended December 31, | ||||||||||||||||
| 2014 | 2013 | 2012 | ||||||||||||||
| (In thousands) | ||||||||||||||||
| Cost of revenue |
$ | 3,088 | $ | 718 | $ | 32 | ||||||||||
| Technology and development |
10,671 | 6,365 | 930 | |||||||||||||
| Sales and marketing |
14,172 | 5,663 | 398 | |||||||||||||
| General and administrative |
17,002 | 10,227 | 1,210 | |||||||||||||
| Restructuring costs |
82 | — | — | |||||||||||||
|
|
|
|
|
|
|
|||||||||||
| Total compensation paid in stock |
$ | 45,015 | $ | 22,973 | $ | 2,570 | ||||||||||
|
|
|
|
|
|
|
|||||||||||
|
(2) Amortization of product development costs was included in technology and development as follows |
$ | 6,363 | $ | 2,660 | $ | 1,108 | ||||||||||
|
|
|
|
|
|
|
|||||||||||
57
Table of Contents
| Year Ended December 31, | ||||||||||||
| 2014 | 2013 | 2012 | ||||||||||
| Percentage of Revenue**: |
||||||||||||
| Revenue |
100 | % | 100 | % | 100 | % | ||||||
| Cost and operating expenses: |
||||||||||||
| Cost of revenue |
18 | 16 | 15 | |||||||||
| Technology and development |
23 | 24 | 30 | |||||||||
| Sales and marketing |
57 | 50 | 49 | |||||||||
| General and administrative |
20 | 23 | 20 | |||||||||
| Acquisition costs |
7 | 4 | — | |||||||||
| Restructuring costs |
2 | — | — | |||||||||
|
|
|
|
|
|
|
|||||||
| Total cost and operating expenses |
127 | 117 | 114 | |||||||||
|
|
|
|
|
|
|
|||||||
| Loss from operations |
(27 | ) | (17 | ) | (14 | ) | ||||||
| Other income (expense) |
* | * | * | |||||||||
| Interest expense |
(3 | ) | (1 | ) | (2 | ) | ||||||
| Change in fair value of warrant liability |
— | — | * | |||||||||
| Loss on extinguishment of debt |
— | * | — | |||||||||
|
|
|
|
|
|
|
|||||||
| Loss before provision for income taxes |
(30 | ) | (18 | ) | (16 | ) | ||||||
| Income tax benefit |
* | 5 | — | |||||||||
|
|
|
|
|
|
|
|||||||
| Net loss attributable to common stockholders |
(30 | )% | (12 | )% | (16 | )% | ||||||
|
|
|
|
|
|
|
|||||||
| * | Less than 0.5% of revenue. |
| ** | Certain numbers may not foot due to rounding. |
Comparison of the Years Ended December 31, 2014, 2013, and 2012
Revenue
| Year Ended December 31, | 2013 to 2014 % Change |
2012 to 2013 % Change |
||||||||||||||||||
| 2014 | 2013 | 2012 | ||||||||||||||||||
| (In thousands) | ||||||||||||||||||||
| Revenue |
$ | 251,937 | $ | 143,728 | $ | 68,085 | 75 | % | 111 | % | ||||||||||
2014 Compared to 2013
Revenue increased to $251.9 million in the year ended December 31, 2014 from $143.7 million in the year ended December 31, 2013, an increase of $108.2 million, or 75%. Marketplace revenue and Media revenue represented 83% and 17%, respectively, of total revenue in the year ended December 31, 2014, compared to 79% and 21%, respectively, of total revenue in the year ended December 31, 2013. The increase in total revenue was primarily attributable to the revenue from our acquisition of Market Leader in August 2013, the growth in our subscriber base, an increase in the average revenue per subscriber, the growth in our monthly unique visitors, and increased sales of our Trulia Mobile Ads and Trulia Seller Ads subscription products.
2013 Compared to 2012
Revenue increased to $143.7 million in the year ended December 31, 2013 from $68.1 million in the year ended December 31, 2012, an increase of $75.6 million, or 111%. Marketplace revenue and Media revenue represented 79% and 21%, respectively, of total revenue in the year ended December 31, 2013, compared to 70% and 30%, respectively, of total revenue in the year ended December 31, 2012. The increase in total revenue was attributable to the significant growth of our subscriber base, increase in average revenue per subscriber, as well as revenue from our acquisition of Market Leader in August 2013.
58
Table of Contents
During the years ended December 31, 2014, 2013, and 2012, we recognized Marketplace revenue and Media revenue as follows:
| Year Ended December 31, | 2013 to 2014 % Change |
2012 to 2013 % Change |
||||||||||||||||||
| 2014 | 2013 | 2012 | ||||||||||||||||||
| (In thousands) | ||||||||||||||||||||
| Marketplace revenue |
$ | 210,335 | $ | 113,383 | $ | 47,805 | 86 | % | 137 | % | ||||||||||
| Media revenue |
41,602 | 30,345 | 20,280 | 37 | % | 50 | % | |||||||||||||
|
|
|
|
|
|
|
|||||||||||||||
| Total revenue |
$ | 251,937 | $ | 143,728 | $ | 68,085 | 75 | % | 111 | % | ||||||||||
|
|
|
|
|
|
|
|||||||||||||||
2014 Compared to 2013
Marketplace revenue increased to $210.3 million in the year ended December 31, 2014 from $113.4 million in the year ended December 31, 2013, an increase of $96.9 million, or 86%. This increase was primarily attributable to the full year of revenue in 2014 from our acquisition of Market Leader in August 2013, the growth in our subscriber base, the growth in sales of our subscription products for agents, Trulia Mobile Ads and Trulia Seller Ads, and an increase in the average revenue per subscriber.
Overall our subscriber base grew by 33% to approximately 79,300 subscribers as of December 31, 2014 from 59,700 subscribers as of December 31, 2013. However, we estimate that there was a 20% overlap of subscribers between Trulia and Market Leader for the year ended December 31, 2014. Our Trulia Mobile Ads and Trulia Seller Ads subscription products contributed to Marketplace revenue growth in the year ended December 31, 2014. The average monthly revenue per subscriber increased from $193 in the year ended December 31, 2013 to $209 in the year ended December 31, 2014, largely due to increased sales of these products.
Media revenue increased to $41.6 million in the year ended December 31, 2014 from $30.3 million in the year ended December 31, 2013, an increase of $11.3 million, or 37%. This increase was driven by the strong execution in our builder, credit, and display advertising areas, as well as continued rapid growth of our mobile monthly unique visitors and our monthly unique visitors.
2013 Compared to 2012
Marketplace revenue increased to $113.4 million in the year ended December 31, 2013 from $47.8 million in the year ended December 31, 2012, an increase of $65.6 million, or 137%. This was primarily attributable to the growth in the number of subscribers, our inventory expansion program, increased sales of our mobile subscription product, Trulia Mobile Ads, increased prices, as well as $21.2 million of revenue from our acquisition of Market Leader in August 2013.
Overall our subscriber base grew by 144% to approximately 59,700 subscribers as of December 31, 2013 from 24,443 subscribers as of December 31, 2012. The subscriber numbers as of December 31, 2013 reflect our estimate that there was a 20% overlap of subscribers between Trulia and Market Leader as of December 31, 2013. Our mobile subscription product for agents, Trulia Mobile Ads, which we launched in May 2012, contributed to Marketplace revenue growth in the year ended December 31, 2013. The average monthly revenue per subscriber for Trulia standalone increased from $156 in the year ended December 31, 2012 to $191 in the year ended December 31, 2013, largely due to increased sales of our Trulia Local Ads and Trulia Mobile Ads products in our high demand zip codes as a result of monetization improvement of these products.
Media revenue increased to $30.3 million in the year ended December 31, 2013 from $20.3 million in the year ended December 31, 2012, an increase of $10.1 million, or 50%. This increase was driven by strong year over year growth in our average monthly unique visitors, which increased from 23.1 million in the year ended December 31, 2012 to 38.8 million in the year ended December 31, 2013, an increase of 68%.
59
Table of Contents
Cost of Revenue
| Year Ended December 31, | 2013 to 2014 % Change |
2012 to 2013 % Change |
||||||||||||||||||
| 2014 | 2013 | 2012 | ||||||||||||||||||
| (In thousands) | ||||||||||||||||||||
| Cost of revenue |
$ | 44,538 | $ | 23,122 | $ | 9,999 | 93 | % | 131 | % | ||||||||||
2014 Compared to 2013
Cost of revenue increased to $44.5 million in the year ended December 31, 2014 from $23.1 million in the year ended December 31, 2013, an increase of $21.4 million, or 93%. The increase was primarily due to a $12.4 million increase in labor and facilities related costs, including compensation paid in stock, largely as a result of a 60% increase in headcount in the year ended December 31, 2014, compared to the year ended December 31, 2013, partially as a result of the Market Leader acquisition. Also, $5.5 million of the increase was related to lead acquisition; $400,000 was related to the compensation paid in stock for the performance-based awards granted to certain employees in connection with the Market Leader acquisition; and $300,000 was related to the compensation paid in stock for equity awards granted to certain employees in connection with the Zillow Merger.
2013 Compared to 2012
Cost of revenue increased to $23.1 million in the year ended December 31, 2013 from $10.0 million in the year ended December 31, 2012, an increase of $13.1 million, or 131%. The increase was primarily due to a $2.7 million increase related to a new partnership arrangement that we entered into in the fourth quarter of 2012, and a $3.1 million increase in Trulia standalone labor and facilities related costs, including compensation paid in stock, largely as a result of a 23% increase in headcount in the year ended December 31, 2013. Market Leader’s contribution to cost of revenue was $6.0 million since August 21, 2013.
Technology and Development Expenses
| Year Ended December 31, | 2013 to 2014 % Change |
2012 to 2013 % Change |
||||||||||||||||||
| 2014 | 2013 | 2012 | ||||||||||||||||||
| (In thousands) | ||||||||||||||||||||
| Technology and development |
$ | 57,643 | $ | 34,612 | $ | 20,199 | 67 | % | 71 | % | ||||||||||
2014 Compared to 2013
Technology and development expenses increased to $57.6 million in the year ended December 31, 2014 from $34.6 million in the year ended December 31, 2013, an increase of $23.0 million, or 67%. The increase was primarily due to a $14.5 million increase in labor and facilities related costs, including compensation paid in stock, largely as a result of a 44% increase in headcount in the year ended December 31, 2014, compared to the year ended December 31, 2013, partially as a result of the Market Leader acquisition. Also, $2.9 million of the increase was related to amortization of the intangible assets acquired in the Market Leader transaction; $746,000 was related to the compensation paid in stock for the performance-based awards granted to certain employees in connection with the Market Leader acquisition; and $3.0 million was related to the compensation paid in stock for equity awards granted to certain employees in connection with the Zillow Merger.
2013 Compared to 2012
Technology and development expenses increased to $34.6 million in the year ended December 31, 2013 from $20.2 million in the year ended December 31, 2012, an increase of $14.4 million, or 71%. The increase was primarily due to a $7.3 million increase in Trulia standalone labor and facilities related costs, including compensation paid in stock, largely as a result of a 34% increase in headcount in the year ended December 31,
60
Table of Contents
2013. Also, $1.3 million of the increase was related to stock-based compensation expense for the performance-based awards we granted to existing employees of Trulia and Market Leader in connection with the Market Leader acquisition. Market Leader’s contribution to technology and development expenses was $6.1 million since August 21, 2013.
Sales and Marketing Expenses
| Year Ended December 31, | 2013 to 2014 % Change |
2012 to 2013 % Change |
||||||||||||||||||
| 2014 | 2013 | 2012 | ||||||||||||||||||
| (In thousands) | ||||||||||||||||||||
| Sales and marketing |
$ | 144,180 | $ | 71,370 | $ | 33,747 | 102 | % | 111 | % | ||||||||||
2014 Compared to 2013
Sales and marketing expenses increased to $144.2 million in the year ended December 31, 2014 from $71.4 million in the year ended December 31, 2013, an increase of $72.8 million, or 102%. The increase was primarily due to a $36.9 million increase in labor and facilities related costs, including compensation paid in stock, largely as a result of a 42% increase in headcount in the year ended December 31, 2014, compared to the year ended December 31, 2013, partially as a result of the Market Leader acquisition. Also, $25.9 million of the increase was related to our marketing and advertising activities, $4.1 million was related to the amortization of the intangible assets acquired in the Market Leader transaction, $2.4 million was related to the compensation paid in stock for the performance-based awards granted to certain employees in connection with the Market Leader acquisition, and $2.0 million was related to the compensation paid in stock for the equity awards granted to certain employees in connection with the Zillow Merger.
2013 Compared to 2012
Sales and marketing expenses increased to $71.4 million in the year ended December 31, 2013 from $33.7 million in the year ended December 31, 2012, an increase of $37.6 million, or 111%. The increase was primarily due to a $23.0 million increase in Trulia standalone labor and facilities related costs, including compensation paid in stock, largely as a result of a 34% increase in headcount in the year ended December 31, 2013. Also, $2.9 million of the increase was related to additional expenditures for marketing and advertising, and $0.7 million of the increase was related to stock-based compensation expense for the performance-based awards we granted to existing employees of Trulia and Market Leader in connection with the Market Leader acquisition. Market Leader’s contribution to sales and marketing expenses was $12.4 million since August 21, 2013.
General and Administrative Expenses
| Year Ended December 31, | 2013 to 2014 % Change |
2012 to 2013 % Change |
||||||||||||||||||
| 2014 | 2013 | 2012 | ||||||||||||||||||
| (In thousands) | ||||||||||||||||||||
| General and administrative |
$ | 49,964 | $ | 32,702 | $ | 13,659 | 53 | % | 139 | % | ||||||||||
2014 Compared to 2013
General and administrative expenses increased to $50.0 million in the year ended December 31, 2014 from $32.7 million in the year ended December 31, 2013, an increase of $17.3 million, or 53%. The increase was primarily due to a $9.3 million increase in labor and facilities related costs, including stock-based compensation, largely as a result of a 24% increase in headcount in the year ended December 31, 2014, compared to the year ended December 31, 2013, partially as a result of the Market Leader acquisition. Also, $2.7 million of the increase was related to the amortization of the intangible assets acquired in the Market Leader transaction, $1.9 million was related to the compensation paid in stock for the performance-based awards granted to certain
61
Table of Contents
employees in connection with the Market Leader acquisition; and $1.6 million was related to the compensation paid in stock for the equity awards granted to certain employees in connection with the Zillow Merger.
2013 Compared to 2012
General and administrative expenses increased to $32.7 million in the year ended December 31, 2013 from $13.7 million in the year ended December 31, 2012, an increase of $19.0 million, or 139%. The increase was primarily due to an $8.8 million increase in Trulia standalone labor and facilities related costs, including compensation paid in stock, largely as a result of a 29% increase in headcount in the year ended December 31, 2013. Also, $2.3 million of the increase was related to stock-based compensation expense for the performance-based awards we granted to existing employees of Trulia and Market Leader in connection with the Market Leader acquisition. Market Leader’s contribution to general and administrative expenses was $5.9 million since August 21, 2013.
Acquisition Related Costs
| Year Ended December 31, | 2013 to 2014 % Change |
2012 to 2013 % Change |
||||||||||||||||||
| 2014 | 2013 | 2012 | ||||||||||||||||||
| (In thousands) | ||||||||||||||||||||
| Acquisition related costs |
$ | 18,144 | $ | 6,065 | $ | — | 199 | % | 100 | % | ||||||||||
In the year ended December 31, 2014, we incurred $18.1 million of expenses in connection with the Zillow Merger primarily related to legal and other professional fees, compared to the $6.1 million of expenses incurred in connection with our acquisition of Market Leader in the year ended December 31, 2013.
Restructuring Costs
| Year Ended December 31, | 2013 to 2014 % Change |
2012 to 2013 % Change |
||||||||||||||||||
| 2014 | 2013 | 2012 | ||||||||||||||||||
| (In thousands) | ||||||||||||||||||||
| Restructuring costs |
$ | 4,987 | $ | — | $ | — | 100 | % | — | % | ||||||||||
In the year ended December 31, 2014 we incurred $5.0 million of expenses in connection with the restructuring activities related to our ongoing integration of Market Leader described further in Note 12 of our audited consolidated financial statements included in this Annual Report on Form 10-K.
Interest Expense
| Year Ended December 31, | 2013 to 2014 % Change |
2012 to 2013 % Change |
||||||||||||||||||
| 2014 | 2013 | 2012 | ||||||||||||||||||
| (In thousands) | ||||||||||||||||||||
| Interest expense |
$ | 7,386 | $ | 1,107 | $ | 1,016 | 567 | % | 9 | % | ||||||||||
2014 Compared to 2013
Interest expense increased to $7.4 million in the year ended December 31, 2014 from $1.1 million in the year ended December 31, 2013, an increase of $6.3 million, or 567%. The increase is primarily related to the 2020 Notes that we issued in December 2013, which accrue interest at 2.75% annually.
2013 Compared to 2012
Interest expense increased to $1.1 million in the year ended December 31, 2013 from $1.0 million in the year ended December 31, 2012, an increase of $0.1 million, or 9%. This increase is attributable to an incremental interest expense associated with our outstanding indebtedness.
62
Table of Contents
Change in Fair Value of Warrant Liability
| Year Ended December 31, | 2013 to 2014 % Change |
2012 to 2013 % Change |
||||||||||||||||||
| 2014 | 2013 | 2012 | ||||||||||||||||||
| (In thousands) | ||||||||||||||||||||
| Change in fair value of warrant liability |
$ | — | $ | — | $ | (369 | ) | — | % | (100 | )% | |||||||||
2013 Compared to 2012
Change in fair value of warrant liability decreased to $0 in the year ended December 31, 2013 from $369,000 in the year ended December 31, 2012, a decrease of $369,000, or 100%. We issued these warrants when a new credit facility was established in September 2011. Upon the first public filing of our registration statement in August 2012, the anti-dilution provisions in these warrants terminated. As a result, the preferred stock warrant liability was remeasured to fair value and the remaining liability was reclassified to additional paid-in capital. Immediately prior to completion of our initial public offering in September 2012, the preferred stock converted to common stock and these warrants to purchase preferred stock converted into warrants to purchase common stock. Because these warrant no longer contained anti-dilution provisions, they were no longer remeasured to fair value on an ongoing basis. The warrants were net exercised in February 2013 and were no longer outstanding as of December 31, 2013.
63
Table of Contents
Quarterly Results of Operations
The following unaudited quarterly statements of operations data for each of the eight quarters as of the year ended December 31, 2014 have been prepared on a basis consistent with our audited consolidated financial statements included in this Annual Report on Form 10-K and include, in our opinion, all normal recurring adjustments necessary for the fair presentation of the financial information contained in those statements. Our historical results are not necessarily indicative of the results that may be expected in the future. The following quarterly financial data should be read in conjunction with our audited financial statements and the related notes included in Item 8 of this Annual Report on Form 10-K.
| Three Months Ended | ||||||||||||||||||||||||||||||||
| Dec. 31, 2014 |
Sept. 30, 2014 |
June 30, 2014 |
March 31, 2014 |
Dec. 31, 2013 |
Sept. 30, 2013 |
June 30, 2013 |
March 31, 2013 |
|||||||||||||||||||||||||
| (Unaudited, in thousands, except share and per share data) | ||||||||||||||||||||||||||||||||
| Statement of Operations Data: |
||||||||||||||||||||||||||||||||
| Revenue |
$ | 66,218 | $ | 67,144 | $ | 64,086 | $ | 54,489 | $ | 49,730 | $ | 40,283 | $ | 29,713 | $ | 24,002 | ||||||||||||||||
| Cost and operating expenses: (1) |
||||||||||||||||||||||||||||||||
| Cost of revenue (exclusive of amortization) (2) |
11,535 | 12,025 | 10,881 | 10,097 | 9,428 | 6,069 | 4,443 | 3,181 | ||||||||||||||||||||||||
| Technology and development |
15,696 | 14,865 | 14,457 | 12,625 | 13,128 | 10,058 | 6,529 | 4,897 | ||||||||||||||||||||||||
| Sales and marketing |
34,684 | 38,867 | 37,485 | 33,144 | 25,586 | 20,189 | 13,302 | 12,293 | ||||||||||||||||||||||||
| General and administrative |
12,805 | 11,606 | 13,559 | 11,994 | 12,134 | 9,826 | 5,570 | 5,172 | ||||||||||||||||||||||||
| Acquisition costs |
7,312 | 10,832 | — | — | — | 4,060 | 2,005 | — | ||||||||||||||||||||||||
| Restructuring costs |
190 | 1,154 | 3,643 | — | — | — | — | — | ||||||||||||||||||||||||
|
|
|
|
|
|
|
|
|
|
|
|
|
|
|
|
|
|||||||||||||||||
| Total cost and operating expenses |
82,222 | 89,349 | 80,025 | 67,860 | 60,276 | 50,202 | 31,849 | 25,543 | ||||||||||||||||||||||||
|
|
|
|
|
|
|
|
|
|
|
|
|
|
|
|
|
|||||||||||||||||
| Loss from operations |
(16,004 | ) | (22,205 | ) | (15,939 | ) | (13,371 | ) | (10,546 | ) | (9,919 | ) | (2,136 | ) | (1,541 | ) | ||||||||||||||||
| Other income (expense) |
(831 | ) | 109 | 146 | 145 | 9 | 33 | 52 | 26 | |||||||||||||||||||||||
| Interest expense |
(1,857 | ) | (1,830 | ) | (1,872 | ) | (1,827 | ) | (451 | ) | (203 | ) | (217 | ) | (236 | ) | ||||||||||||||||
| Loss on extinguishment of debt |
— | — | — | — | (141 | ) | — | — | — | |||||||||||||||||||||||
|
|
|
|
|
|
|
|
|
|
|
|
|
|
|
|
|
|||||||||||||||||
| Loss before provision for income taxes |
(18,692 | ) | (23,926 | ) | (17,665 | ) | (15,053 | ) | (11,129 | ) | (10,089 | ) | (2,301 | ) | (1,751 | ) | ||||||||||||||||
| Income tax (provision) benefit |
(64 | ) | (67 | ) | (198 | ) | (98 | ) | (17 | ) | 7,869 | (110 | ) | (231 | ) | |||||||||||||||||
|
|
|
|
|
|
|
|
|
|
|
|
|
|
|
|
|
|||||||||||||||||
| Net loss attributable to common stockholders |
$ | (18,756 | ) | $ | (23,993 | ) | $ | (17,863 | ) | $ | (15,151 | ) | $ | (11,146 | ) | $ | (2,220 | ) | $ | (2,411 | ) | $ | (1,982 | ) | ||||||||
|
|
|
|
|
|
|
|
|
|
|
|
|
|
|
|
|
|||||||||||||||||
| Net loss per share attributable to common stockholders, basic and diluted |
$ | (0.50 | ) | $ | (0.64 | ) | $ | (0.48 | ) | $ | (0.41 | ) | $ | (0.30 | ) | $ | (0.06 | ) | $ | (0.07 | ) | $ | (0.07 | ) | ||||||||
|
|
|
|
|
|
|
|
|
|
|
|
|
|
|
|
|
|||||||||||||||||
| Weighted average shares used in computing net loss per share attributable to common stockholders, basic and diluted |
38,001,317 | 37,540,527 | 37,068,035 | 36,726,178 | 37,270,375 | 34,557,842 | 32,150,829 | 28,427,025 | ||||||||||||||||||||||||
|
|
|
|
|
|
|
|
|
|
|
|
|
|
|
|
|
|||||||||||||||||
| Other Financial Information: |
||||||||||||||||||||||||||||||||
| Adjusted EBITDA (3) |
$ | 15,611 | $ | 6,710 | $ | 4,611 | $ | 2,773 | $ | 7,683 | $ | 4,811 | $ | 3,403 | $ | 1,211 | ||||||||||||||||
|
|
|
|
|
|
|
|
|
|
|
|
|
|
|
|
|
|||||||||||||||||
64
Table of Contents
| (1) | Compensation paid in stock was allocated as follows: |
| Three Months Ended | ||||||||||||||||||||||||||||||||
| Dec. 31, 2014 |
Sept. 30, 2014 |
June 30, 2014 |
March 31, 2014 |
Dec. 31, 2013 |
Sept. 30, 2013 |
June 30, 2013 |
March 31, 2013 |
|||||||||||||||||||||||||
| (Unaudited, in thousands) | ||||||||||||||||||||||||||||||||
| Cost of revenue |
$ | 1,339 | $ | 1,129 | $ | 194 | $ | 426 | $ | 420 | $ | 200 | $ | 57 | $ | 41 | ||||||||||||||||
| Technology and development |
4,312 | 2,179 | 2,336 | 1,844 | 3,337 | 2,039 | 578 | 411 | ||||||||||||||||||||||||
| Sales and marketing |
5,209 | 2,391 | 3,079 | 3,493 | 3,315 | 1,526 | 485 | 337 | ||||||||||||||||||||||||
| General and administrative |
5,000 | 3,476 | 4,401 | 4,125 | 5,233 | 3,525 | 866 | 603 | ||||||||||||||||||||||||
|
|
|
|
|
|
|
|
|
|
|
|
|
|
|
|
|
|||||||||||||||||
| Total compensation paid in stock related to vesting of stock based compensation. |
15,860 | 9,175 | 10,010 | 9,888 | 12,305 | 7,290 | 1,986 | 1,392 | ||||||||||||||||||||||||
| Other compensation paid in stock: |
||||||||||||||||||||||||||||||||
| Restructuring costs |
— | — | 82 | — | — | — | — | — | ||||||||||||||||||||||||
|
|
|
|
|
|
|
|
|
|
|
|
|
|
|
|
|
|||||||||||||||||
| Total compensation paid in stock. |
$ | 15,860 | $ | 9,175 | $ | 10,092 | $ | 9,888 | $ | 12,305 | $ | 7,290 | $ | 1,986 | $ | 1,392 | ||||||||||||||||
|
|
|
|
|
|
|
|
|
|
|
|
|
|
|
|
|
|||||||||||||||||
| (2) Amortization of product development costs was included in technology and development as follows |
$ | 120 | $ | 1,817 | $ | 3,263 | $ | 1,163 | $ | 1,505 | $ | 559 | $ | 397 | $ | 199 | ||||||||||||||||
|
|
|
|
|
|
|
|
|
|
|
|
|
|
|
|
|
|||||||||||||||||
| (3) | See “Non-GAAP Financial Measures” for more information and a reconciliation of Adjusted EBITDA to net loss, the most directly comparable financial measure calculated and presented in accordance with generally accepted accounting principles in the United States. |
| Three Months Ended | ||||||||||||||||||||||||||||||||
| Dec. 31, 2014 |
Sept. 30, 2014 |
June 30, 2014 |
March 31, 2014 |
Dec. 31, 2013 |
Sept. 30, 2013 |
June 30, 2013 |
March 31, 2013 |
|||||||||||||||||||||||||
| (Unaudited, in thousands) | ||||||||||||||||||||||||||||||||
| Marketplace revenue (current definition) |
$ | 55,513 | $ | 55,875 | $ | 53,196 | $ | 45,750 | $ | 42,152 | $ | 31,308 | $ | 21,964 | $ | 17,959 | ||||||||||||||||
| Marketplace revenue (previous definition) |
— | — | — | — | 40,000 | 29,422 | 20,933 | 17,357 | ||||||||||||||||||||||||
| Media revenue (current definition) |
10,705 | 11,269 | 10,890 | 8,739 | 7,578 | 8,975 | 7,749 | 6,043 | ||||||||||||||||||||||||
| Media revenue (previous definition) |
— | — | — | — | 9,730 | 10,861 | 8,780 | 6,645 | ||||||||||||||||||||||||
|
|
|
|
|
|
|
|
|
|
|
|
|
|
|
|
|
|||||||||||||||||
| Total revenue |
$ | 66,218 | $ | 67,144 | $ | 64,086 | $ | 54,489 | $ | 49,730 | $ | 40,283 | $ | 29,713 | $ | 24,002 | ||||||||||||||||
|
|
|
|
|
|
|
|
|
|
|
|
|
|
|
|
|
|||||||||||||||||
| Dec. 31, 2014 |
Sept. 30, 2014 |
June 30, 2014 |
March 31, 2014 |
Dec. 31, 2013 |
Sept. 30, 2013 |
June 30, 2013 |
March 31, 2013 |
|||||||||||||||||||||||||
| Percentage of Revenue**: |
||||||||||||||||||||||||||||||||
| Revenue |
100 | % | 100 | % | 100 | % | 100 | % | 100 | % | 100 | % | 100 | % | 100 | % | ||||||||||||||||
| Cost and operating expenses: |
||||||||||||||||||||||||||||||||
| Cost of revenue |
17 | 18 | 17 | 19 | 19 | 15 | 15 | 13 | ||||||||||||||||||||||||
| Technology and development |
24 | 22 | 23 | 23 | 26 | 25 | 22 | 20 | ||||||||||||||||||||||||
| Sales and marketing |
52 | 58 | 58 | 61 | 51 | 50 | 45 | 51 | ||||||||||||||||||||||||
| General and administrative |
19 | 17 | 21 | 22 | 24 | 24 | 19 | 22 | ||||||||||||||||||||||||
| Acquisition costs |
11 | 16 | — | — | — | 10 | 6 | — | ||||||||||||||||||||||||
| Restructuring costs |
* | 2 | 6 | — | — | — | — | — | ||||||||||||||||||||||||
|
|
|
|
|
|
|
|
|
|
|
|
|
|
|
|
|
|||||||||||||||||
| Total cost and operating expenses |
124 | 133 | 125 | 125 | 121 | 125 | 107 | 106 | ||||||||||||||||||||||||
|
|
|
|
|
|
|
|
|
|
|
|
|
|
|
|
|
|||||||||||||||||
| Loss from operations |
(24 | ) | (33 | ) | (25 | ) | (25 | ) | (21 | ) | (25 | ) | (7 | ) | (6 | ) | ||||||||||||||||
| Other income (expense) |
(1 | ) | * | * | * | * | * | * | * | |||||||||||||||||||||||
| Interest expense |
(3 | ) | (3 | ) | (3 | ) | (3 | ) | (1 | ) | (1 | ) | (1 | ) | (1 | ) | ||||||||||||||||
| Loss on extinguishment of debt |
— | — | — | — | * | — | — | — | ||||||||||||||||||||||||
|
|
|
|
|
|
|
|
|
|
|
|
|
|
|
|
|
|||||||||||||||||
| Loss before provision for income taxes |
(28 | ) | (36 | ) | (28 | ) | (28 | ) | (22 | ) | (25 | ) | (8 | ) | (7 | ) | ||||||||||||||||
| Income tax (provision) benefit |
* | * | * | * | * | 20 | — | (1 | ) | |||||||||||||||||||||||
|
|
|
|
|
|
|
|
|
|
|
|
|
|
|
|
|
|||||||||||||||||
| Net loss attributable to common stockholders |
(28 | )% | (36 | )% | (28 | )% | (28 | )% | (22 | )% | (6 | )% | (8 | )% | (8 | )% | ||||||||||||||||
|
|
|
|
|
|
|
|
|
|
|
|
|
|
|
|
|
|||||||||||||||||
| * | Less than 0.5% of revenue |
| ** | Certain numbers may not foot due to rounding. |
65
Table of Contents
Adjusted EBITDA
The following table presents a reconciliation of Adjusted EBITDA to our net loss, the most comparable GAAP measure, for each of the periods indicated below. See the section titled “Selected Financial and Other Data” for the detailed reconciliation to our net loss and for more information on our use and the limitations of Adjusted EBITDA as a measure of our financial performance.
| Three Months Ended | ||||||||||||||||||||||||||||||||
| Dec. 31, 2014 |
Sept. 30, 2014 |
June 30, 2014 |
March 31, 2014 |
Dec. 31, 2013 |
Sept. 30, 2013 |
June 30, 2013 |
March 31, 2013 |
|||||||||||||||||||||||||
| (Unaudited, in thousands) | ||||||||||||||||||||||||||||||||
| Net loss attributable to common stockholders |
$ | (18,756 | ) | $ | (23,993 | ) | $ | (17,863 | ) | $ | (15,151 | ) | $ | (11,146 | ) | $ | (2,220 | ) | $ | (2,411 | ) | $ | (1,982 | ) | ||||||||
| Non-GAAP adjustments: |
||||||||||||||||||||||||||||||||
| Other income (expense) |
831 | (109 | ) | (146 | ) | (145 | ) | (9 | ) | (33 | ) | (52 | ) | (26 | ) | |||||||||||||||||
| Interest expense |
1,857 | 1,830 | 1,872 | 1,827 | 451 | 203 | 217 | 236 | ||||||||||||||||||||||||
| Loss on extinguishment of debt |
— | — | — | — | 141 | — | — | — | ||||||||||||||||||||||||
| Depreciation and amortization |
7,865 | 7,754 | 6,897 | 6,256 | 5,924 | 3,380 | 1,548 | 1,360 | ||||||||||||||||||||||||
| Compensation paid in stock |
15,860 | 9,175 | 10,010 | 9,888 | 12,305 | 7,290 | 1,986 | 1,392 | ||||||||||||||||||||||||
| Income tax provision (benefit) |
64 | 67 | 198 | 98 | 17 | (7,869 | ) | 110 | 231 | |||||||||||||||||||||||
| Acquisition costs |
7,312 | 10,832 | — | — | — | 4,060 | 2,005 | — | ||||||||||||||||||||||||
| Restructuring costs—GAAP |
190 | 1,154 | 3,643 | — | — | — | — | — | ||||||||||||||||||||||||
| Restructuring costs—Other |
388 | — | — | — | — | — | — | — | ||||||||||||||||||||||||
|
|
|
|
|
|
|
|
|
|
|
|
|
|
|
|
|
|||||||||||||||||
| Adjusted EBITDA |
$ | 15,611 | $ | 6,710 | $ | 4,611 | $ | 2,773 | $ | 7,683 | $ | 4,811 | $ | 3,403 | $ | 1,211 | ||||||||||||||||
|
|
|
|
|
|
|
|
|
|
|
|
|
|
|
|
|
|||||||||||||||||
Liquidity and Capital Resources
As of December 31, 2014 our principal sources of liquidity were cash and cash equivalents totaling $198.8 million, which consisted of bank deposits and money market funds.
On December 17, 2013 we issued $230.0 million aggregate principal amount of the 2020 Notes, which included $30.0 million of principal amount issued pursuant to an option to purchase additional notes granted to the initial purchasers. The aggregate principal amount of the 2020 Notes is due on December 15, 2020. We received net proceeds of $222.4 million after deducting offering expenses of $7.6 million payable by us. In connection with our acquisition by Zillow, the 2020 Notes were assumed by HoldCo.
On August 20, 2013 we acquired all the outstanding shares of capital stock of Market Leader for 4,412,489 shares of our common stock and $170.5 million in cash. Under the terms of the Market Leader Merger Agreement, each outstanding share of Market Leader common stock was converted into the right to receive (a) $6.00 in cash, without interest, and subject to applicable withholding tax, and (b) 0.1553 of a share of the Company’s common stock, for a total purchase price of $372.7 million. In connection with the merger, all of the outstanding stock options, stock appreciation rights and restricted stock units of Market Leader were converted into stock options, stock appreciation rights and restricted stock units, respectively, denominated in shares of our common stock based on formulas set forth in the Market Leader Merger Agreement.
66
Table of Contents
On March 20, 2013 we completed our follow-on public offering pursuant to which we sold an aggregate of 3,500,000 shares of our common stock, at a public offering price of $29.75 per share, resulting in aggregate net proceeds to us of $98.1 million, after deducting underwriting discounts and commissions and offering expenses payable by us. On March 26, 2013, we sold an additional 525,000 shares of our common stock pursuant to the exercise by the underwriters of an option to purchase additional shares, at a public offering price of $29.75 per share, resulting in aggregate net proceeds to us of $14.8 million, after deducting underwriting discounts and commissions and offerings expenses payable by us. In addition, another 3,117,311 shares were sold by certain selling stockholders, which included 406,606 shares sold pursuant to the exercise by the underwriters of an option to purchase additional shares. We did not receive any proceeds from sales by the selling stockholders. Prior to our follow-on public offering, our operations were financed primarily by the net proceeds of $89.4 million from our initial public offering in September 2012, and $10.0 million in proceeds from the issuance of indebtedness from a Credit Facility. We repaid in full the outstanding balance of the Credit Facility in December 2013 with the net proceeds received from issuance of the 2020 Notes.
We have incurred cumulative losses of $140.6 million from our operations to date, and expect to incur additional losses in the future. We believe that our cash balances and the cash flows generated by operations will be sufficient to satisfy our anticipated cash needs for working capital and capital expenditures for at least the next 12 months. However, our future capital requirements will depend on many factors, including our rate of revenue growth, the cash that may be used in connection with acquisitions or other investments, the expansion of our sales and marketing activities, and the timing and extent of our spending to support our technology and development efforts. To the extent that existing cash and cash equivalents, and cash from operations are insufficient to fund our future activities, we may need to raise additional funds through public or private equity or debt financing. Additional funds may not be available on terms favorable to us or at all.
Cash Flows
The following table summarizes our cash flows for the periods indicated:
| Year Ended December 31, | ||||||||||||
| 2014 | 2013 | 2012 | ||||||||||
| (In thousands) | ||||||||||||
| Cash provided by (used in) operating activities |
$ | 12,056 | $ | (1,372 | ) | $ | 4,153 | |||||
| Cash used in investing activities |
(46,359 | ) | (175,143 | ) | (1,970 | ) | ||||||
| Cash provided by financing activities |
7,487 | 302,095 | 90,793 | |||||||||
Cash Flows from Operating Activities
Cash provided by operating activities for the year ended December 31, 2014 was $12.1 million. The primary component of our cash flows during the year ended December 31, 2014 was our net loss of $75.8 million. The cash flows from our net loss were increased by our non-cash operating activities and net cash flows provided through changes in certain of our operating assets and liabilities. Specifically, we recognized non-cash charges of $28.8 million for depreciation and amortization of our property and equipment and $44.9 million for compensation paid in stock. We also recognized changes in operating assets and liabilities which provided $9.5 million of cash from operating activities. The primary driver of the changes in our operating assets and liabilities was a $3.5 million decrease in prepaid expenses and other current assets. Changes in our operating assets and liabilities were also affected by an increase in deferred rent of $7.3 million primarily due to the our new office lease in San Francisco and an increase in accrued liabilities of $1.8 million due to the costs related to the Zillow Merger. This was offset by a $1.3 million decrease in accrued compensation and benefits due to our restructuring of the Market Leader operations and lower costs in the fourth quarter.
Cash used in operating activities for the year ended December 31, 2013 was $1.4 million. The primary component of our cash flows during the year ended December 31, 2013 was our net loss of $17.8 million. The cash flows from our net loss were increased by our non-cash operating activities and net cash flows provided
67
Table of Contents
through changes in certain of our operating assets and liabilities. Specifically, we recognized non-cash charges of $12.2 million for depreciation and amortization of our property and equipment, $23.0 million for compensation paid in stock, and $7.9 million for release of valuation allowance related to the Market Leader acquisition. We also recognized changes in operating assets and liabilities which used $11.6 million of cash from operating activities. The primary driver of the changes in our operating assets and liabilities was a $6.5 million increase in prepaid expenses and other current assets and a $6.7 million decrease in accounts payable. Changes in our operating assets and liabilities were also affected by an increase in deferred rent of $4.9 million primarily due to the acquisition of Market Leader and their lease in Bellevue, Washington; an increase in accounts receivable of $5.0 million due to timing of collections; an increase in accrued liabilities of $3.3 million primarily due to the overall growth in our business during the year; and a decrease in deferred revenue of $3.3 million primarily due to our revenue growth but also due to the timing of collections.
Cash provided by operating activities for the year ended December 31, 2012 was $4.2 million. The primary component of our cash flows during the year ended December 31, 2012 was our net loss of $10.9 million. The cash flows from our net loss were more than offset by our non-cash operating activities and net cash flows provided through changes in certain of our operating assets and liabilities. Specifically, we recognized non-cash charges of $3.6 million for depreciation and amortization of our property and equipment, $2.6 million for stock-based compensation, and $0.4 million for the fair value remeasurement of the preferred stock warrant liability. We also recognized changes in operating assets and liabilities which provided $8.3 million of cash from operating activities. Of this $8.3 million, $1.0 million related to an accrued withholding tax from stock options exercise collected from a former employee, which we remitted to the appropriate tax authorities after December 31, 2012. The primary driver of the changes in our operating assets and liabilities was an $8.5 million increase in deferred revenue due to the increase in the number of total subscribers and average monthly revenue per subscriber during the year. Changes in our operating assets and liabilities were also affected by an increase in accrued liabilities in the amount of $1.8 million, due primarily to the overall growth in our business during the year; increases in accrued compensation and benefits of $2.5 million due to the growth in our headcount, an increase in accounts receivable of $2.5 million, primarily due to our revenue growth but also to timing of collections; and increases in prepaid expenses and other current assets of $0.9 million mainly due to expansion of our facilities in Denver and overall growth in our business.
Cash Flows from Investing Activities
Cash used in investing activities of $46.4 million for the year ended December 31, 2014 was primarily related to the $41.2 million expenditures related to our new office space in San Francisco and Denver and restructuring activities relating to our Market Leader offices in Bellevue.
Cash used in investing activities of $175.1 million for the year ended December 31, 2013 was primarily related to the acquisition of Market Leader for $160.8 million, net of cash acquired of $9.7 million. We used $16.6 million to purchases property and equipment for our offices in San Francisco, New York, and Bellevue due to expansion of our offices and increases in headcount.
Cash used in investing activities for the year ended December 31, 2012 was primarily related to the maturity of short-term investments in the amount of $4.3 million, which was more than offset by the acquisition of property and equipment in the amount of $5.5 million.
Cash Flows from Financing Activities
Cash flows from financing activities for the year ended December 31, 2014 of $7.5 million were primarily comprised of proceeds of $11.3 million from exercises of stock options, partially offset by a $3.7 million of equity awards withheld for tax liabilities.
Cash flows from financing activities for the year ended December 31, 2013 of $302.1 million were primarily comprised of net proceeds of $223.1 million from the issuance of our 2020 Notes in December 2013,
68
Table of Contents
net proceeds of $113.0 million from our follow-on public offering in March 2013, and $7.0 million proceeds from exercise of stock options. These inflows were partially offset by a $30.0 million payment to repurchase our outstanding shares and $10.0 million of repayments on our long-term debt.
Cash flows from financing activities for the year ended December 31, 2012 of $90.8 million was comprised of net proceeds of $89.4 million from our IPO in September 2012 and proceeds of $1.7 million from the exercise of stock options, partially offset by $0.3 million of capital lease payments.
Contractual Obligations and Other Commitments
On March 10, 2014, we entered into the Lease effective November 1, 2014, for approximately 79,000 square feet of new office space at 535 Mission Street in San Francisco that houses our principal executive office. This office space replaced our former principal office at 116 New Montgomery Street in San Francisco, for which the lease expired in the fourth quarter of 2014. On July 25, 2014, we entered into a lease amendment under which we will lease an additional 26,620 square feet of office space commencing in October 2015 under the same terms and conditions. The term of the Lease is approximately 107 months and the future minimum lease payments range from $182,000 to $347,000 per month. To secure our lease obligation we entered into a secured letter of credit arrangement with a financial institution for $3.8 million. This deposit is classified as restricted cash in our balance sheet as of December 31, 2014.
On April 10, 2014, we entered into a lease agreement for approximately 65,000 square feet of office space in the Denver metropolitan area, effective May 1, 2014. The term of the lease is approximately 90 calendar months, and future minimum lease payments range from $124,000 to $141,000 per month, starting in November 2014, after a six month rent abatement period. In connection with this lease agreement we entered into a secured letter of credit arrangement with a financial institution for $1.1 million to secure our lease obligation. This deposit is classified as restricted cash in our balance sheet as of December 31, 2014.
In September 2013, we entered into a lease effective through September 2021 for approximately 72,000 square feet of office space that houses our offices in Bellevue, WA. The term of the lease is approximately 97 calendar months and the future minimum lease payments range from $193,000 to $235,000 per month, starting in October 2014, after a 13 month rent abatement period.
We lease additional office space in New York area. We believe our facilities are sufficient for our current needs.
The following table summarizes our contractual obligations as of December 31, 2014:
| Payments Due by Period | ||||||||||||||||||||
| Contractual Obligations: |
Less Than 1 Year |
1 to 3 Years |
3 to 5 Years |
More Than 5 Years |
Total | |||||||||||||||
| (In thousands) | ||||||||||||||||||||
| Long-term debt |
$ | — | $ | — | $ | — | $ | 230,000 | $ | 230,000 | ||||||||||
| Interest on long-term debt (1) |
6,325 | 12,650 | 12,650 | 6,325 | 37,950 | |||||||||||||||
| Operating leases (2) |
7,128 | 17,365 | 18,317 | 27,963 | 70,773 | |||||||||||||||
|
|
|
|
|
|
|
|
|
|
|
|||||||||||
| Total contractual obligations |
$ | 13,453 | $ | 30,015 | $ | 30,967 | $ | 264,288 | $ | 338,723 | ||||||||||
|
|
|
|
|
|
|
|
|
|
|
|||||||||||
| (1) | The 2020 Notes carry a 2.75% stated interest rate. |
| (2) | Operating leases include total future minimum rent payments under noncancelable operating lease agreements. |
We had unrecognized tax benefits in the amount of $6.7 million as of December 31, 2014 related to uncertain tax positions. However, there is uncertainty regarding when these liabilities will require settlement so these amounts were not included in the contractual obligations table above.
69
Table of Contents
Off-Balance Sheet Arrangements
We have not entered into any off-balance sheet arrangements and do not have any holdings in variable interest entities.
Segment Information
We have one business activity and operate in one reportable segment.
| Item 7A. | Quantitative and Qualitative Disclosures about Market Risk |
We are exposed to certain market risks in the ordinary course of our business. These risks primarily include interest rate sensitivities as follows:
Interest Rate Risk
We had cash and cash equivalents of $198.8 million as of December 31 2014, which consisted of bank deposits and money market funds. Such interest-earning instruments carry a degree of interest rate risk. To date, fluctuations in interest income have not been significant. We also had the $230.0 million aggregate principal amount of the 2020 Notes outstanding as of December 31, 2014, due on December 15, 2020. The 2020 Notes carry a fixed interest rate of 2.75% per year.
The primary objective of our investment activities is to preserve principal while maximizing income without significantly increasing risk. We do not enter into investments for trading or speculative purposes and have not used any derivative financial instruments to manage our interest rate risk exposure. Due to the short-term nature of our investments, we have not been exposed to, nor do we anticipate being exposed to, material risks due to changes in interest rates. The interest rate on our outstanding debt is fixed. A hypothetical 10% change in interest rates during any of the periods presented would not have had a material impact on our financial statements.
70
Table of Contents
| Item 8. | Financial Statements and Supplementary Data |
| Page | ||||
| 72 | ||||
| 73 | ||||
| 74 | ||||
| 75 | ||||
| 76 | ||||
| 77 | ||||
71
Table of Contents
REPORT OF INDEPENDENT REGISTERED PUBLIC ACCOUNTING FIRM
To the Board of Directors and Stockholders of Trulia, Inc.
San Francisco, California
We have audited the accompanying consolidated balance sheets of Trulia, Inc. and subsidiaries (the “Company”) as of December 31, 2014 and 2013, and the related consolidated statements of operations, stockholders’ equity, and cash flows for each of the three years in the period ended December 31, 2014. Our audits also included the consolidated financial statement schedule listed in the Index at Item 15. These financial statements and financial statement schedule are the responsibility of the Company’s management. Our responsibility is to express an opinion on these financial statements and financial statement schedule based on our audits.
We conducted our audits in accordance with the standards of the Public Company Accounting Oversight Board (United States). Those standards require that we plan and perform the audit to obtain reasonable assurance about whether the financial statements are free of material misstatement. An audit includes examining, on a test basis, evidence supporting the amounts and disclosures in the financial statements. An audit also includes assessing the accounting principles used and significant estimates made by management, as well as evaluating the overall financial statement presentation. We believe that our audits provide a reasonable basis for our opinion.
In our opinion, such consolidated financial statements present fairly, in all material respects, the financial position of Trulia, Inc. and subsidiaries as of December 31, 2014 and 2013, and the results of their operations and their cash flows for each of the three years in the period ended December 31, 2014, in conformity with accounting principles generally accepted in the United States of America. Also, in our opinion, such financial statement schedule, when considered in relation to the basic consolidated financial statements taken as a whole, present fairly, in all material respects, the information set forth therein.
As discussed in Note 16 to the consolidated financial statements, on February 17, 2015, the Company was acquired by Zillow Group, Inc. pursuant to an Agreement and Plan of Merger dated as of July 28, 2014.
We have also audited, in accordance with the standards of the Public Company Accounting Oversight Board (United States), the Company’s internal control over financial reporting as of December 31, 2014, based on the criteria established in Internal Control — Integrated Framework (2013) issued by the Committee of Sponsoring Organizations of the Treadway Commission and our report dated February 27, 2015 expressed an unqualified opinion on the Company’s internal control over financial reporting.
/s/ DELOITTE & TOUCHE LLP
San Jose, California
February 27, 2015
72
Table of Contents
TRULIA, INC.
(In thousands, except share and per share data)
| As of December 31, | ||||||||
| 2014 | 2013 | |||||||
| ASSETS |
||||||||
| CURRENT ASSETS: |
||||||||
| Cash and cash equivalents |
$ | 198,781 | $ | 225,597 | ||||
| Accounts receivable, net of allowance for doubtful accounts of $86 and $411 as of December 31, 2014 and 2013, respectively |
12,630 | 11,697 | ||||||
| Prepaid expenses and other current assets |
6,950 | 12,272 | ||||||
|
|
|
|
|
|||||
| Total current assets |
218,361 | 249,566 | ||||||
| Restricted cash |
6,717 | 1,589 | ||||||
| Property and equipment, net |
49,755 | 22,289 | ||||||
| Intangible assets, net |
102,567 | 117,888 | ||||||
| Goodwill |
255,904 | 255,904 | ||||||
| Other assets |
7,210 | 8,173 | ||||||
|
|
|
|
|
|||||
| TOTAL ASSETS |
$ | 640,514 | $ | 655,409 | ||||
|
|
|
|
|
|||||
| LIABILITIES AND STOCKHOLDERS’ EQUITY |
||||||||
| CURRENT LIABILITIES: |
||||||||
| Accounts payable |
$ | 1,974 | $ | 3,018 | ||||
| Accrued liabilities and restructuring costs |
13,883 | 11,261 | ||||||
| Accrued compensation and benefits |
10,587 | 10,863 | ||||||
| Deferred revenue |
9,320 | 10,002 | ||||||
| Deferred rent, current portion |
1,009 | 1,035 | ||||||
| Capital lease liability, current portion |
24 | 51 | ||||||
|
|
|
|
|
|||||
| Total current liabilities |
36,797 | 36,230 | ||||||
| Deferred rent, net of current portion |
12,085 | 4,751 | ||||||
| Capital lease liability, net of current portion |
70 | 84 | ||||||
| Long-term debt |
230,000 | 230,000 | ||||||
| Other long-term liabilities |
1,315 | 3,268 | ||||||
|
|
|
|
|
|||||
| Total liabilities |
280,267 | 274,333 | ||||||
|
|
|
|
|
|||||
| Commitments and contingencies (NOTE 8) |
||||||||
| STOCKHOLDERS’ EQUITY: |
||||||||
| Preferred stock, par value of $0.00001, 20,000,000 shares authorized as of December 31, 2014 and 2013; no shares issued or outstanding as of December 31, 2014 and 2013 |
— | — | ||||||
| Common stock, par value of $0.00001, 1,000,000,000 shares authorized as of December 31, 2014 and 2013; 39,318,329 and 37,668,476 shares issued as of December 31, 2014 and 2013, respectively; 38,232,425 and 36,582,572 shares outstanding as of December 31, 2014 and 2013, respectively |
— | — | ||||||
| Treasury stock at $27.65, 1,085,904 as of December 31, 2014 and 2013 |
— | — | ||||||
| Additional paid-in capital |
500,894 | 445,960 | ||||||
| Accumulated deficit |
(140,647 | ) | (64,884 | ) | ||||
|
|
|
|
|
|||||
| Total stockholders’ equity |
360,247 | 381,076 | ||||||
|
|
|
|
|
|||||
| TOTAL LIABILITIES AND STOCKHOLDERS’ EQUITY |
$ | 640,514 | $ | 655,409 | ||||
|
|
|
|
|
|||||
See accompanying notes to consolidated financial statements.
73
Table of Contents
TRULIA, INC.
Consolidated Statements of Operations
(In thousands, except share and per share data)
| Year Ended December 31, | ||||||||||||
| 2014 | 2013 | 2012 | ||||||||||
| Revenue |
$ | 251,937 | $ | 143,728 | $ | 68,085 | ||||||
| Cost and operating expenses: |
||||||||||||
| Cost of revenue (exclusive of amortization of product development cost) |
44,538 | 23,122 | 9,999 | |||||||||
| Technology and development |
57,643 | 34,612 | 20,199 | |||||||||
| Sales and marketing |
144,180 | 71,370 | 33,747 | |||||||||
| General and administrative |
49,964 | 32,702 | 13,659 | |||||||||
| Acquisition costs |
18,144 | 6,065 | — | |||||||||
| Restructuring costs |
4,987 | — | — | |||||||||
|
|
|
|
|
|
|
|||||||
| Total cost and operating expenses |
319,456 | 167,871 | 77,604 | |||||||||
|
|
|
|
|
|
|
|||||||
| Loss from operations |
(67,519 | ) | (24,143 | ) | (9,519 | ) | ||||||
| Other income (expense) |
(431 | ) | 121 | 50 | ||||||||
| Interest expense |
(7,386 | ) | (1,107 | ) | (1,016 | ) | ||||||
| Change in fair value of warrant liability |
— | — | (369 | ) | ||||||||
| Loss on debt extinguishment |
— | (141 | ) | — | ||||||||
|
|
|
|
|
|
|
|||||||
| Loss before provision for income taxes |
(75,336 | ) | (25,270 | ) | (10,854 | ) | ||||||
| Income tax (provision) benefit |
(427 | ) | 7,511 | (67 | ) | |||||||
|
|
|
|
|
|
|
|||||||
| Net loss attributable to common stockholders |
$ | (75,763 | ) | $ | (17,759 | ) | $ | (10,921 | ) | |||
|
|
|
|
|
|
|
|||||||
| Net loss per share attributable to common stockholders, basic and diluted |
$ | (2.03 | ) | $ | (0.54 | ) | $ | (0.87 | ) | |||
|
|
|
|
|
|
|
|||||||
| Weighted average shares used in computing net loss per share attributable to common stockholders, basic and diluted |
37,335,200 | 33,129,572 | 12,538,769 | |||||||||
|
|
|
|
|
|
|
|||||||
See accompanying notes to consolidated financial statements.
74
Table of Contents
TRULIA, INC.
Consolidated Statements of Stockholders’ Equity
(In thousands, except share data)
| Convertible Preferred Stock | Common Stock | Treasury Stock | Additional Paid-in Capital |
Accumulated Deficit |
Total Stockholders’ Equity |
|||||||||||||||||||||||||||||||
| Shares | Amount | Shares | Amount | Shares | Amount | |||||||||||||||||||||||||||||||
| Balance—January 1, 2012 |
14,161,444 | $ | — | 6,919,892 | $ | — | — | $ | — | $ | 39,243 | $ | (36,204 | ) | $ | 3,039 | ||||||||||||||||||||
| Issuance of common stock in connection with initial public offering, net of offering costs |
— | — | 5,900,000 | — | — | — | 89,447 | — | 89,447 | |||||||||||||||||||||||||||
| Conversion of convertible preferred stock to common stock in connection with initial public offering |
(14,161,444 | ) | — | 14,161,444 | — | — | — | — | — | — | ||||||||||||||||||||||||||
| Conversion of preferred stock warrant to common stock warrant in connection with initial public offering |
— | — | — | — | — | — | 666 | — | 666 | |||||||||||||||||||||||||||
| Exercises of common stock options |
— | — | 541,445 | — | — | — | 1,681 | — | 1,681 | |||||||||||||||||||||||||||
| Exercises of common stock warrants |
— | — | 33,380 | — | — | — | — | — | — | |||||||||||||||||||||||||||
| Shares returned from escrow related to acquisition of Movity, Inc. |
— | — | (3,343 | ) | — | — | — | (14 | ) | — | (14 | ) | ||||||||||||||||||||||||
| Stock-based compensation expense related to options granted to employees and nonemployees |
— | — | — | — | — | — | 2,636 | — | 2,636 | |||||||||||||||||||||||||||
| Net loss and total comprehensive loss |
— | — | — | — | — | — | — | (10,921 | ) | (10,921 | ) | |||||||||||||||||||||||||
|
|
|
|
|
|
|
|
|
|
|
|
|
|
|
|
|
|
|
|||||||||||||||||||
| Balance—December 31, 2012 |
— | — | 27,552,818 | — | — | — | 133,659 | (47,125 | ) | 86,534 | ||||||||||||||||||||||||||
| Issuance of common stock in connection with follow-on public offering, net of offering costs |
— | — | 3,500,000 | — | — | — | 98,144 | — | 98,144 | |||||||||||||||||||||||||||
| Issuance of additional shares of common stock in connection with follow-on public offering |
— | — | 525,000 | — | — | — | 14,878 | — | 14,878 | |||||||||||||||||||||||||||
| Issuance of common stock as consideration for Market Leader |
— | — | 4,412,489 | — | — | — | 189,296 | — | 189,296 | |||||||||||||||||||||||||||
| Assumption of stock-based awards in connection with the acquisition of Market Leader |
— | — | — | — | — | — | 12,871 | — | 12,871 | |||||||||||||||||||||||||||
| Exercises of common stock options |
— | — | 1,484,251 | — | — | — | 7,003 | — | 7,003 | |||||||||||||||||||||||||||
| Non-cash exercises of stock appreciation rights |
— | — | 32,169 | — | — | — | — | — | — | |||||||||||||||||||||||||||
| Vesting of restricted stock units |
— | — | 151,164 | — | — | — | — | — | — | |||||||||||||||||||||||||||
| Value and shares of equity awards withheld for tax liability and award exercises |
— | — | (28,620 | ) | — | — | — | (783 | ) | — | (783 | ) | ||||||||||||||||||||||||
| Non-cash exercises of common stock warrants |
— | — | 56,054 | — | — | — | — | — | — | |||||||||||||||||||||||||||
| Warrants withheld for exercises |
— | — | (16,849 | ) | — | — | — | — | — | — | ||||||||||||||||||||||||||
| Shares repurchases |
— | — | — | — | (1,085,904 | ) | — | (30,032 | ) | — | (30,032 | ) | ||||||||||||||||||||||||
| Stock-based compensation expense related to options granted to employees |
— | — | — | — | — | — | 20,924 | — | 20,924 | |||||||||||||||||||||||||||
| Net loss and total comprehensive loss |
— | — | — | — | — | — | — | (17,759 | ) | (17,759 | ) | |||||||||||||||||||||||||
|
|
|
|
|
|
|
|
|
|
|
|
|
|
|
|
|
|
|
|||||||||||||||||||
| Balance—December 31, 2013 |
— | — | 37,668,476 | — | (1,085,904 | ) | — | 445,960 | (64,884 | ) | 381,076 | |||||||||||||||||||||||||
| Exercises of common stock options and stock appreciation rights |
— | — | 997,431 | — | — | — | 11,267 | — | 11,267 | |||||||||||||||||||||||||||
| Vesting of restricted stock units |
— | — | 757,438 | — | — | — | — | — | — | |||||||||||||||||||||||||||
| Value and shares of equity awards withheld for tax liability and award exercises |
— | — | (105,016 | ) | — | — | — | (3,739 | ) | — | (3,739 | ) | ||||||||||||||||||||||||
| Stock-based compensation expense related to options granted to employees and nonemployees |
— | — | — | — | — | — | 47,324 | — | 47,324 | |||||||||||||||||||||||||||
| Restructuring costs |
— | — | — | — | — | — | 82 | — | 82 | |||||||||||||||||||||||||||
| Net loss and total comprehensive loss |
— | — | — | — | — | — | — | (75,763 | ) | (75,763 | ) | |||||||||||||||||||||||||
|
|
|
|
|
|
|
|
|
|
|
|
|
|
|
|
|
|
|
|||||||||||||||||||
| Balance—December 31, 2014 |
— | $ | — | 39,318,329 | $ | — | (1,085,904 | ) | $ | — | $ | 500,894 | $ | (140,647 | ) | $ | 360,247 | |||||||||||||||||||
|
|
|
|
|
|
|
|
|
|
|
|
|
|
|
|
|
|
|
|||||||||||||||||||
See accompanying notes to consolidated financial statements.
75
Table of Contents
TRULIA, INC.
Consolidated Statements of Cash Flows
(In thousands, except share data)
| Year Ended December 31, |
||||||||||||
| 2014 | 2013 | 2012 | ||||||||||
| CASH FLOWS FROM OPERATING ACTIVITIES: |
||||||||||||
| Net loss |
$ | (75,763 | ) | $ | (17,759 | ) | $ | (10,921 | ) | |||
| Adjustments to reconcile net loss to net cash provided by (used in) operating activities: |
||||||||||||
| Depreciation and amortization |
28,772 | 12,211 | 3,585 | |||||||||
| Compensation paid in stock |
44,933 | 22,973 | 2,570 | |||||||||
| Provision for doubtful accounts |
(135 | ) | 351 | 95 | ||||||||
| Loss on disposal of fixed assets |
787 | 45 | — | |||||||||
| Release of valuation allowance |
— | (7,923 | ) | — | ||||||||
| Restructuring costs |
2,708 | — | — | |||||||||
| Change in fair value of warrant liability |
— | — | 369 | |||||||||
| Amortization of debt discount |
— | 106 | 167 | |||||||||
| Amortization of debt issue cost |
133 | 83 | 30 | |||||||||
| Amortization of underwriting fee |
880 | 34 | — | |||||||||
| Loss on extinguishment of debt |
— | 141 | — | |||||||||
| Changes in operating assets and liabilities, net of acquisition of business: |
||||||||||||
| Accounts receivable |
(798 | ) | (5,005 | ) | (2,475 | ) | ||||||
| Prepaid expenses and other current assets |
3,490 | (6,467 | ) | (889 | ) | |||||||
| Other assets |
(50 | ) | — | (13 | ) | |||||||
| Accounts payable |
(267 | ) | (6,698 | ) | (864 | ) | ||||||
| Accrued liabilities and restructuring costs |
1,996 | 3,309 | 1,811 | |||||||||
| Accrued compensation and benefits |
(1,344 | ) | 1,586 | 2,458 | ||||||||
| Deferred rent |
7,308 | 4,935 | (174 | ) | ||||||||
| Deferred revenue |
(682 | ) | (3,294 | ) | 8,469 | |||||||
| Other long-term liabilities |
88 | — | (65 | ) | ||||||||
|
|
|
|
|
|
|
|||||||
| Net cash provided by (used in) operating activities |
12,056 | (1,372 | ) | 4,153 | ||||||||
|
|
|
|
|
|
|
|||||||
| CASH FLOWS FROM INVESTING ACTIVITIES: |
||||||||||||
| Increase in restricted cash and deposits |
(5,128 | ) | (791 | ) | (764 | ) | ||||||
| Maturities of short-term investments |
— | 2,999 | 4,300 | |||||||||
| Purchases of property and equipment |
(41,231 | ) | (16,572 | ) | (5,506 | ) | ||||||
| Disposals of property and equipment |
— | 34 | — | |||||||||
| Acquisition, net of cash acquired of $9.7 million in 2013 |
— | (160,813 | ) | — | ||||||||
|
|
|
|
|
|
|
|||||||
| Net cash used in investing activities |
(46,359 | ) | (175,143 | ) | (1,970 | ) | ||||||
|
|
|
|
|
|
|
|||||||
| CASH FLOWS FROM FINANCING ACTIVITIES: |
||||||||||||
| Proceeds from initial public offering, net of underwriting discounts |
— | — | 93,279 | |||||||||
| Proceeds from follow-on public offering, net of underwriting discounts |
— | 114,056 | — | |||||||||
| Payments of costs related to public offerings |
— | (1,034 | ) | (3,832 | ) | |||||||
| Proceeds from long-term debt |
— | 230,000 | — | |||||||||
| Repayments on long-term debt |
— | (10,006 | ) | — | ||||||||
| Payment of debt issuance costs |
— | (6,910 | ) | — | ||||||||
| Value of equity awards withheld for tax liability |
(3,739 | ) | (782 | ) | — | |||||||
| Repayments on capital lease liability |
(41 | ) | (200 | ) | (334 | ) | ||||||
| Proceeds from exercises of stock options |
11,267 | 7,003 | 1,680 | |||||||||
| Shares repurchased |
— | (30,032 | ) | — | ||||||||
|
|
|
|
|
|
|
|||||||
| Net cash provided by financing activities |
7,487 | 302,095 | 90,793 | |||||||||
|
|
|
|
|
|
|
|||||||
| NET INCREASE (DECREASE) IN CASH AND CASH EQUIVALENTS |
(26,816 | ) | 125,580 | 92,976 | ||||||||
| CASH AND CASH EQUIVALENTS—Beginning of period |
225,597 | 100,017 | 7,041 | |||||||||
|
|
|
|
|
|
|
|||||||
| CASH AND CASH EQUIVALENTS—End of period |
$ | 198,781 | $ | 225,597 | $ | 100,017 | ||||||
|
|
|
|
|
|
|
|||||||
| SUPPLEMENTAL DISCLOSURES OF CASH FLOW INFORMATION: |
||||||||||||
| Cash paid for interest |
$ | 6,290 | $ | 696 | $ | 791 | ||||||
|
|
|
|
|
|
|
|||||||
| Cash paid for income taxes |
$ | 533 | $ | 418 | $ | 4 | ||||||
|
|
|
|
|
|
|
|||||||
| NON-CASH INVESTING AND FINANCING ACTIVITIES: |
||||||||||||
| Stock-based compensation capitalized in product development costs |
$ | 3,114 | $ | 685 | $ | 66 | ||||||
|
|
|
|
|
|
|
|||||||
| Conversion of preferred stock warrants to common stock warrants |
$ | — | $ | — | $ | 666 | ||||||
|
|
|
|
|
|
|
|||||||
| Purchases of equipment under capital leases |
$ | — | $ | 105 | $ | 119 | ||||||
|
|
|
|
|
|
|
|||||||
| Net change related to purchases of equipment in accounts payable and accrued liabilities |
$ | (2,645 | ) | $ | 3,325 | $ | 54 | |||||
|
|
|
|
|
|
|
|||||||
| Purchases of equipment with accounts payable and accrued liabilities at period end |
$ | 1,319 | $ | 3,964 | $ | 226 | ||||||
|
|
|
|
|
|
|
|||||||
| Release of valuation allowance |
$ | — | $ | 7,923 | $ | — | ||||||
|
|
|
|
|
|
|
|||||||
| Other compensation to be paid in stock |
$ | 3,460 | $ | 2,524 | $ | — | ||||||
|
|
|
|
|
|
|
|||||||
| Common stock issued and stock awards assumed in connection with Market Leader acquisition |
— | 5,340,271 | — | |||||||||
|
|
|
|
|
|
|
|||||||
| Common stock warrants exercised in a net settlement transaction |
— | 56,054 | — | |||||||||
|
|
|
|
|
|
|
|||||||
| Stock appreciation rights exercised in a net settlement transaction |
85,893 | 32,169 | — | |||||||||
|
|
|
|
|
|
|
|||||||
See accompanying notes to consolidated financial statements.
76
Table of Contents
TRULIA, INC.
Consolidated Notes to Financial Statements
1. Organization and Description of Business
We were incorporated on June 1, 2005 in the state of Delaware as Realwide, Inc. On September 22, 2005, we changed our name to Trulia, Inc.
Our marketplace, delivered through the web and mobile applications, gives consumers powerful tools to research homes and neighborhoods and enables real estate professionals to efficiently market their listings and attract new clients. We also offer a comprehensive suite of free and subscription products that provide real estate professionals with access to transaction-ready consumers and help them grow and manage their online presence.
Acquisition by Zillow Group, Inc.
On July 28, 2014, we entered into an Agreement and Plan of Merger, or the Merger Agreement, with Zillow, Inc. (“Zillow”) and Zillow Group, Inc., f/k/a/ Zebra HoldCo, Inc., (“HoldCo”), pursuant to which both we and Zillow became wholly-owned subsidiaries of HoldCo, which series of transactions we refer to as the Zillow Merger.
Upon completion of the Zillow Merger, (i) each outstanding share of our common stock was converted into the right to receive 0.444 of a share of Class A common stock of HoldCo; (ii) each outstanding share of Class A common stock of Zillow was converted into the right to receive one share of Class A common stock of HoldCo; and (iii) each outstanding share of Class B common stock of Zillow was converted into the right to receive one share of Class B common stock of HoldCo. The Class A common stock of HoldCo has one vote per share and the Class B common stock of HoldCo has ten votes per share, similar to the former capital structure of Zillow.
In addition, subject to certain exceptions, each Trulia stock option, restricted stock unit and stock appreciation right outstanding immediately prior to the consummation of the Zillow Merger, whether or not vested and exercisable was assumed by HoldCo and converted into a corresponding equity award to purchase, acquire shares of, or participate in the appreciation in price of HoldCo Class A Common Stock. The terms of each assumed equity award are the same except that the number of shares subject to each equity award and the per share exercise price, if any, was adjusted based on the exchange ratio per a formula set forth in the Merger Agreement. See Note 16 for further details on this subsequent event.
Convertible Senior Notes
On December 17, 2013, we issued $230.0 million aggregate principal amount of 2.75% Convertible Senior Notes, due in 2020, (“2020 Notes”), which included $30.0 million of principal amount issued pursuant to an over-allotment option granted to the initial purchasers. The aggregate principal amount of the 2020 Notes is due on December 15, 2020. We received net proceeds of $222.4 million, after deducting offering expenses payable by us. Interest began to accrue on December 17, 2013 and is payable semi-annually every June 15 and December 15, starting on June 15, 2014. We may not redeem the 2020 Notes prior to December 20, 2018. We may redeem the 2020 Notes, at our option, in whole or in part on or after December 20, 2018, if the last reported sale price per share of our common stock has been at least 130% of the conversion price then in effect for at least 20 trading days (whether or not consecutive) during any 30 consecutive trading day period. Holders of the 2020 Notes may convert all or any portion of their notes, in multiples of $1,000 principal amount, at their option at any time prior to the close of business on the business day immediately preceding the maturity date. The notes are convertible at an initial conversion rate of 27.8303 shares of our common stock per $1,000 principal amount of notes, subject to adjustment in certain events. In connection with our acquisition by Zillow, the 2020 Notes were assumed by HoldCo. Further details on the 2020 Notes are presented in Note 7 of these consolidated financial statements.
77
Table of Contents
Acquisition of Market Leader, Inc.
In August 2013, we acquired all the outstanding shares of capital stock of Market Leader, Inc. (“Market Leader”) for 4,412,489 shares of our common stock and $170.5 million in cash. Market Leader is a provider of software-as-a-service (“SaaS”)-based customer relationship management software for the real estate sector. Under the terms and conditions of the Agreement and Plan of Merger (“Market Leader Merger Agreement”) each outstanding share of Market Leader common stock was converted into the right to receive (a) $6.00 in cash, without interest, and subject to applicable withholding tax, and (b) 0.1553 of a share of our common stock, for a total purchase consideration of $372.7 million. In connection with the merger, all of the outstanding stock options, stock appreciation rights and restricted stock units of Market Leader were converted into stock options, stock appreciation rights and restricted stock units, respectively, denominated in shares of our common stock based on formulas set forth in the Market Leader Merger Agreement. We have included Market Leader’s results of operations prospectively after August 20, 2013, the date of acquisition. Further details on this business combination are presented in Note 5 of these consolidated financial statements.
In June 2014, our board of directors approved a restructuring plan to accelerate the integration of our Market Leader operations with those of Trulia, to eliminate overlapping positions, and to streamline operations. We implemented this restructuring plan to shorten the time to market for our products and to drive further growth. Further details on the restructuring are presented in Note 12 of these consolidated financial statements.
Follow-on Public Offering
In March 2013, we completed a follow-on public offering in which we sold an aggregate of 4,025,000 shares of our common stock, which included 525,000 shares sold pursuant to the exercise by the underwriters of an option to purchase additional shares, at a public offering price of $29.75 per share. In addition, another 3,117,311 shares were sold by certain selling stockholders, which included 406,606 shares sold pursuant to the exercise by the underwriters of an option to purchase additional shares. We received aggregate net proceeds of $113.0 million, after deducting underwriting discounts and commissions and offering expenses payable by us, from sales of our shares in the offering. We did not receive any of the proceeds from the sales of shares by the selling stockholders.
Initial Public Offering
In September 2012, we completed an initial public offering (“IPO”) in which we sold 5,900,000 shares of our common stock, which included 900,000 shares sold pursuant to the exercise by the underwriters of an option to purchase additional shares, at a public offering price of $17.00 per share. In addition, another 1,000,000 shares were sold by certain selling stockholders. We received net proceeds of $89.4 million, after deducting underwriting discounts and commissions and offering expenses payable by us, from sales of our shares in the IPO. We did not receive any proceeds from sales by the selling stockholders. Immediately prior to the completion of the IPO, all shares of the then-outstanding convertible preferred stock automatically converted into an aggregate of 14,161,444 shares of common stock, and an outstanding warrant to purchase convertible preferred stock automatically converted into a warrant to purchase up to 120,961 shares of common stock.
Certain Significant Risks and Uncertainties
We operate in a dynamic industry and, accordingly, can be affected by a variety of factors. For example, we believe that changes in any of the following areas could have a significant negative effect on our future financial position, results of operations, or cash flows: ability to obtain additional financing; advances and trends in new technologies and industry standards; changes in certain strategic relationships or customer relationships; market acceptance of our products; development of sales channels; loss of significant customers; litigation or other claims against us; the hiring, training, and retention of key employees; changes in enacted tax rates; and new product introductions by competitors.
78
Table of Contents
2. Summary of Significant Accounting Policies
Basis of Presentation
Our consolidated financial statements have been prepared in conformity with accounting principles generally accepted in the United States of America (“US GAAP”).
Principles of Consolidation
The consolidated financial statements include the operations of Trulia and our wholly owned subsidiaries. All significant intercompany accounts and transactions have been eliminated in consolidation.
Use of Estimates
The preparation of the accompanying financial statements in conformity with US GAAP requires that we make estimates and assumptions about future events that affect the amounts of assets and liabilities reported, disclosures about contingent assets and liabilities, and reported amounts of revenues and expenses. Significant items subject to such estimates include: revenue recognition; useful lives of property and equipment and intangible assets; recoverability of long-lived assets and intangible assets with definite lives; income tax uncertainties, including a valuation allowance for deferred tax assets; accounting for business combinations; restructuring reserves; and contingencies. We base these estimates on historical and anticipated results, trends, and various other assumptions that we believe are reasonable under the circumstances, including assumptions as to future events. These estimates form the basis for making judgments about the carrying values of assets and liabilities and recorded revenue and expenses that are not readily apparent from other sources. Actual results could differ from those estimates.
Concentrations of Credit Risk and Credit Evaluations
Financial instruments which potentially subject us to concentrations of credit risk consist principally of cash and cash equivalents, and trade accounts receivable. We deposit our cash and cash equivalents with major financial institutions that management believes are of high credit quality; however, at times, balances exceed federally insured limits.
Our accounts receivable are derived from customers in the United States of America and Canada. We do not require our customers to provide collateral to support accounts receivable. We perform ongoing credit evaluations of our customers’ financial condition and maintain allowances for estimated credit losses. Actual credit losses may differ from our estimates. No customer represented 10% or more of total revenue during the years ended December 31, 2014, 2013 and 2012. No customer represented 10% or more of our gross accounts receivable as of December 31, 2014, and one customer accounted for 13.0% of the gross accounts receivable as of December 31, 2013.
Revenue Recognition
We recognize revenue when persuasive evidence of an arrangement exists, delivery has occurred, the price to the buyer is fixed or determinable, and collection is reasonably assured. We consider a signed agreement, a binding insertion order, or other similar documentation reflecting the terms and conditions under which products will be provided to be persuasive evidence of an arrangement. Collectability is assessed based on a number of factors, including payment history and the creditworthiness of a customer. If it is determined that collection is not reasonably assured, revenue is not recognized until collection becomes reasonably assured, which is generally upon receipt of cash.
Our revenue is comprised of Marketplace revenue and Media revenue.
79
Table of Contents
Marketplace Revenue. Marketplace revenue primarily consists of products and services sold to real estate professionals, including agents, brokers, agents of property managers, builders, and mortgage lenders on a fixed fee subscription, Cost Per Click (“CPC”) or Cost Per Lead (“CPL”) basis. We currently sell four sets of products to real estate professionals on a subscription basis. The first set of products, which includes Trulia Local Ads and Trulia Mobile Ads, enables real estate professionals to promote themselves on our search results pages and property details pages for a local market area. Real estate professionals purchase subscriptions to these products based upon their specified market share for a city or zip code, at a fixed monthly price, for periods ranging from one month to one year, with pricing depending on demand, location, and the percentage of market share purchased. Our second set of products allows real estate professionals to receive prominent placement of their listings in our search results. Real estate professionals sign up for new subscriptions to this product at a fixed monthly price for periods that generally range from six months to 12 months. Our third set of products includes Trulia Seller Ads that enable real estate professionals to generate leads from consumers interested in selling their homes. Our fourth set of products is our comprehensive premium software-as-a-service based marketing products typically sold to real estate professionals as a bundle of products under a fixed fee subscription. We also sell a base version of these products to strategic franchise networks for specified contractual amounts over a number of years and partner with them to drive adoption of our premium solution across their network.
Media Revenue. Media revenue primarily consists of display advertising sold on a Cost per Thousand (“CPM”), CPC, or CPL basis to advertisers promoting their brand on trulia.com, our mobile website, m.trulia.com, and our partners websites (cumulatively “Trulia Websites”). Impressions are the number of times an advertisement is loaded on a web page and clicks are the number of times users click on an advertisement. Revenue is recognized in the periods the clicks or impressions are delivered. Pricing is primarily based on advertisement size and position on the Trulia Websites and fees are generally billed monthly. As our mobile web pages and mobile applications offer less space on which to display advertising, a shift in user traffic from our websites to mobile products could decrease our advertising inventory and negatively affect our Media revenue. Recently, we have experienced a shift in user traffic as our mobile monthly unique visitors have continued to grow at a rapid pace and our monthly unique visitors have stayed relatively constant.
Multiple-Element Arrangements
We enter into arrangements with customers that include combinations of CPC media placements, CPM media placements, and subscription products.
We allocate arrangement consideration in multiple-element revenue arrangements at the inception of an arrangement to all deliverables or those packages in which all components of the package are delivered at the same time, based on the relative selling price method in accordance with the selling price hierarchy, which includes: (i) vendor-specific objective evidence (“VSOE”), if available; (ii) third-party evidence (“TPE”), if VSOE is not available; and (iii) best estimate of selling price (“BESP”), if neither VSOE nor TPE is available.
VSOE- We determine VSOE based on our historical pricing and discounting practices for the specific product when sold separately. In determining VSOE, we require that a substantial majority of the standalone selling prices for these products fall within a reasonably narrow pricing range. For certain subscription products, we have been able to establish VSOE.
TPE- When VSOE cannot be established for deliverables in multiple-element arrangements, we apply judgment with respect to whether it can establish a selling price based on TPE. TPE is determined based on competitor prices for similar deliverables when sold separately. Generally, our go-to-market strategy differs from that of our peers and our offerings contain a significant level of differentiation such that the comparable pricing of the products cannot be obtained. Furthermore, we are unable to reliably determine what similar competitor selling prices are on a standalone basis. As a result, we have not been able to establish selling price based on TPE.
BESP- When we are unable to establish selling price using VSOE or TPE, we use BESP in our allocation of arrangement consideration. The objective of BESP is to determine the price at which we would transact a
80
Table of Contents
sale if the service was sold regularly on a standalone basis. As we have not been able to establish VSOE or TPE for CPM media placements, CPC media placements, and certain subscription products, we determine BESP for these deliverables based on the following:
| • | The list price represents a component of the go-to-market strategy established by senior management. Our list prices are based on the features of the products offered. These features, which consist of the size and placement of the advertisements on our website, impact the list prices which vary depending on the specifications of the features. In addition, the list prices are impacted by market conditions, including the conditions of the real estate market and economy in general, and our competitive landscape; and |
| • | Analysis of our selling prices for these deliverables. |
We limit the amount of allocable arrangement consideration to amounts that are fixed or determinable and that are not contingent on future performance or future deliverables. We regularly review BESP. Changes in assumptions or judgments or changes to the elements in the arrangement could cause a material increase or decrease in the amount of revenue that we report in a particular period.
We recognize the relative fair value of the products as they are delivered assuming all other revenue recognition criteria are met.
Cost of Revenue
Cost of revenue consists primarily of expenses related to operating our websites and mobile applications, including those associated with the operation of our data centers and customer websites, hosting fees, customer service related headcount expenses including salaries, bonuses, benefits and stock-based compensation expense, cost to generate leads for customers, licensed content, multiple listing services fees, revenue sharing costs, credit card processing fees, third-party contractor fees, and allocated overhead.
Technology and Development
Costs to research and develop our products are expensed as incurred. These costs consist primarily of technology and development headcount related expenses including salaries, bonuses, benefits and stock-based compensation expense, third party contractor fees and allocated overhead primarily associated with developing new technologies. Technology and development also includes amortization of capitalized costs (“product development costs”) associated with the development of our marketplace.
Product Development Costs
Product development costs include costs related to the development of our marketplace which is inclusive of costs related to the development of our delivery points, the website and mobile applications. Product development costs are accounted for as follows: all costs incurred in the preliminary project and post-implementation stages are expensed as incurred, while certain costs incurred in the application development stage of a new product or projects to provide significant additional functionality to existing products are capitalized, if certain criteria are met. Maintenance and enhancement costs are typically expensed as incurred. We capitalized costs associated with product development of $19.1 million, $8.2 million and $2.5 million during the years ended December 31, 2014, 2013 and 2012, respectively, and recorded related amortization expense of $6.4 million, $2.7 million and $1.1 million during the years ended December 31, 2014, 2013 and 2012, respectively. The net book value of capitalized product development costs was $11.5 million and $7.5 million as of December 31, 2014 and 2013, respectively. Such costs are amortized on a straight-line basis over the estimated useful lives of the related assets, which have been estimated to be two years. Amortization expense is included in technology and development in the statements of operations.
81
Table of Contents
Advertising Expense
Advertising costs are expensed when incurred and are included in sales and marketing expenses. Barter transactions represent the exchange of online advertising through placement of links. No revenue or expense for such barter transactions is recognized because the fair value of neither the advertising surrendered nor the advertising received is determinable.
Our advertising expense was $33.8 million, $7.7 million and $2.6 million during the years ended December 31, 2014, 2013, and 2012, respectively.
Stock-Based Compensation
We recognize compensation costs related to stock options and restricted stock units granted to employees based on the estimated fair value of the awards on the date of grant, net of estimated forfeitures. We measure the grant date fair value of stock options and stock appreciation rights using the Black-Scholes option-pricing model. Grant date fair value of restricted stock units equals the fair value of our common stock on the date of grant. These fair values are recognized on a straight-line basis over the requisite service period, which is the vesting period of the respective awards.
We account for equity awards issued to nonemployees based on the fair value of these awards, similar to employee awards. This fair value is remeasured at the end of each reporting period and the resulting change in value, if any, is recognized in the statement of operations as cumulative compensation cost during the period the related services are rendered.
Income Taxes
We account for income taxes in accordance with the asset and liability method. Under this method, deferred tax assets and liabilities are measured based on differences between the financial reporting and the tax bases of assets and liabilities using enacted tax rates that are expected to be in effect when the differences are expected to reverse. A valuation allowance is established to reduce net deferred tax assets to amounts that are more likely than not to be realized.
We account for uncertainty in tax positions recognized in the financial statements by recognizing a tax benefit from an uncertain tax position when it is more likely than not that the position will be sustained upon examination, including resolutions of any related appeals or litigation processes, based on the technical merits. Income tax positions must meet a more-likely-than-not recognition threshold at the effective date to be recognized.
Our policy for classifying interest and penalties associated with unrecognized income tax benefits is to include such items as tax expense.
Restructuring Costs
The main components of our restructuring plan relate to workforce reduction and contract termination costs. Workforce reduction charges are accrued when it is probable that the employees are entitled to the severance payments and the amounts can be reasonably estimated. One-time involuntary termination benefits are accrued when the plan of termination has been communicated to the employees and certain other criteria are met. Contract termination costs are recognized as a liability when a contract is terminated in accordance with its terms, or at the cease-use date. If the amounts and timing of cash flows from restructuring activities are significantly different from what we have estimated, the actual amount of restructuring and other related charges could be materially different than those we have recorded. Further details on the restructuring are presented in Note 12 of these audited consolidated financial statements.
82
Table of Contents
Comprehensive Loss
During the years ended December 31, 2014, 2013 and 2012, we did not have any other comprehensive income and, therefore, the net loss and comprehensive loss were the same for all periods presented.
Net Loss per Share Attributable to Common Stockholders
We calculate the basic and diluted net loss per share attributable to common stockholders in conformity with the two-class method required for companies with participating securities. Immediately prior to the completion of our IPO in September 2012, all shares of outstanding preferred stock automatically converted into 14,161,444 shares of common stock. In addition, our outstanding preferred stock warrants converted into 56,054 common stock warrants. Under the two-class method, in periods when we have net income, net income attributable to common stockholders is determined by allocating undistributed earnings, calculated as net income less current period convertible preferred stock non-cumulative dividends, between common stock and the convertible preferred stock. In computing diluted net income attributable to common stockholders, undistributed earnings are re-allocated to reflect the potential impact of dilutive securities. Our basic net loss per share attributable to common stockholders is calculated by dividing the net loss attributable to common stockholders by the weighted average number of shares of common stock outstanding for the period. The diluted net loss per share attributable to common stockholders is computed by giving effect to all potential dilutive common stock equivalents outstanding for the period. For purposes of this calculation, options to purchase common stock, and common stock warrants are considered common stock equivalents but have been excluded from the calculation of diluted net loss per share attributable to common stockholders as their effect is antidilutive.
Cash and Cash Equivalents
Cash and cash equivalents include cash and highly liquid investments with original maturities of three months or less at the time of acquisition. Our cash equivalents consist of money market funds. All credit card and debit card transactions that process as of the last day of the fiscal year and settle within a few days in the subsequent period are also classified as cash and cash equivalents. The amounts due from the third party merchant processors for these transactions classified as cash totaled $469,000 and $349,000 as of December 31, 2014 and 2013, respectively.
Accounts Receivable and Allowance for Doubtful Accounts
We perform ongoing credit evaluations of our customers. Accounts receivable are recorded at invoiced amounts, net of our estimated allowances for doubtful accounts. The allowance for doubtful accounts is estimated based on an assessment of our ability to collect on customer accounts receivable. We regularly review the allowance by considering certain factors such as historical experience, industry data, credit quality, age of accounts receivable balances and current economic conditions that may affect a customer’s ability to pay. In cases where we are aware of circumstances that may impair a specific customer’s ability to meet their financial obligations, we record a specific allowance against amounts due from the customer and thereby reduce the net recognized receivable to the amount we reasonably believe will be collected. We write-off accounts receivable against the allowance when we determine the balance is uncollectible and no longer actively pursue collection of the receivable. We recorded a provision for uncollectible accounts receivable of $(135,000), $351,000 and $95,000 during the years ended December 31, 2014, 2013, and 2012, respectively.
Restricted Cash
Restricted cash consists of certificates of deposit held as collateral at a financial institution related to property leases in our name, and to insure the corporate credit card spending. These certificates of deposit have contractual maturities of less than three years. The balance of the restricted cash was $6.7 million and $1.6 million as of December 31, 2014 and 2013, respectively.
83
Table of Contents
Property and Equipment
Property and equipment is initially recorded at cost and depreciated using a straight-line method over the estimated useful lives of the assets. Maintenance and repair costs are charged to expense as incurred. The useful lives of our property and equipment are as follows:
| Computer equipment |
2 to 3 years | |
| Office equipment, furniture and fixtures |
3 years | |
| Capitalized product development costs |
2 to 3 years | |
| Network equipment |
5 years | |
| Leasehold improvements |
Shorter of the lease term or 5 years |
Depreciation expense of assets acquired through capital leases is included within respective functional expenses in the statements of operations.
Business Combination
We recognize identifiable assets acquired and liabilities assumed at their acquisition date fair values. Goodwill is measured as the excess of the consideration transferred over the net fair value of assets acquired and liabilities assumed on the acquisition date. While we use our best estimates and assumptions as part of the purchase price allocation process to accurately value assets acquired and liabilities assumed, our estimates are inherently uncertain and subject to refinement. As a result, during the measurement period, which may be up to one year from the acquisition date, we may record adjustments to the assets acquired and liabilities assumed, with the corresponding offset to goodwill to the extent that we identify adjustments to the preliminary purchase price allocation. Upon conclusion of the measurement period or final determination of the values of the assets acquired and liabilities assumed, whichever comes first, any subsequent adjustments are recorded to our consolidated statements of operations.
Purchased Intangible Assets
Purchased intangible assets with a determinable economic life are carried at cost, less accumulated amortization. Amortization is computed over the estimated useful life of each asset on a straight-line basis. The useful lives of the purchased intangible assets are as follows:
| Enterprise relationships |
10 years | |||
| Premium users |
5 years | |||
| Existing technology |
7 years | |||
| Trade names |
10 years | |||
| Home/MLS data feeds |
10 years |
Purchased intangible assets are reviewed for impairment whenever events or changes in circumstances indicate that the carrying amount of such assets may not be recoverable. Recoverability of assets to be held and used is measured first by a comparison of the carrying amount of an asset to future undiscounted net cash flows expected to be generated by the asset. If such assets are considered to be impaired, an impairment loss would be recognized when the carrying amount of the asset exceeds the fair value of the asset.
Goodwill
Goodwill represents the excess of the aggregate purchase price paid over the fair value of the net identifiable assets acquired. Goodwill is not amortized and is tested for impairment at least annually or whenever events or changes in circumstances indicate that the carrying value may not be recoverable. We have determined that we operate as one reporting unit and have selected December 1 as the date to perform our annual impairment
84
Table of Contents
test. In the valuation of our goodwill, we must make assumptions regarding estimated future cash flows to be derived from our business. If these estimates or their related assumptions change in the future, we may be required to record impairment for these assets. The first step of the impairment test involves comparing the fair value of the reporting unit to its net book value, including goodwill. If the net book value exceeds its fair value, then we would perform the second step of the goodwill impairment test to determine the amount of the impairment loss. The impairment loss would be calculated by comparing the implied fair value of the entity to its net book value. In calculating the implied fair value of our goodwill, the fair value of the entity would be allocated to all of the other assets and liabilities based on their fair values. The excess of the fair value of the entity over the amount assigned to the other assets and liabilities is the implied fair value of goodwill. An impairment loss would be recognized when the carrying amount of goodwill exceeds its implied fair value. We had no impairment of goodwill in the years ended December 31, 2014, 2013, or 2012.
Impairment of Long-Lived Assets
Long-lived assets are reviewed for impairment whenever events or changes in circumstances indicate that the carrying amount of such assets may not be recoverable. Recoverability of assets to be held and used is measured first by a comparison of the carrying amount of an asset to future undiscounted net cash flows expected to be generated by the asset. If such assets are considered to be impaired, an impairment loss would be recognized when the carrying amount of the asset exceeds the fair value of the asset. To date, we believe that no such impairment has occurred.
Deferred Revenue
Deferred revenue consists of prepaid but unrecognized subscription revenue, advertising fees received or billed in advance of delivery and for amounts received in instances when revenue recognition criteria have not been met. Deferred revenue is recognized when all revenue recognition criteria have been met.
Segment Information
We have one reportable segment. Our reportable segment has been identified based on how our chief operating decision maker manages our business, makes operating decisions and evaluates operating performance. The chief executive officer acts as the chief operating decision maker and reviews financial and operational information on an entity-wide basis.
Recently Issued Accounting Pronouncements
In November 2014, the Financial Accounting Standards Board, or FASB, issued the Accounting Standards Update No. 2014-17, “Business Combinations (Topic 805),” (“ASU 2014-17”). ASU 2014-17 provides an acquired entity an option to apply pushdown accounting in its separate financial statements when a change in control occurs. The acquired entity may make this election in the subsequent period, which will constitute a change in accounting principle. If pushdown accounting option is elected for a specific change in control event, that election is irrevocable. We adopted this guidance prospectively from its effective date of November 18, 2014. Adoption of this guidance has no impact on our financial position, results of operations or cash flows in the current or future periods.
In May 2014, the FASB issued the Accounting Standards Update No. 2014-09, “Revenue from Contracts with Customers,” (“ASU 2014-09”). ASU 2014-09 requires entities to recognize revenue for promised goods or services to customers in an amount that reflects the consideration to which the entity expects to be entitled to in exchange. Additionally, entities should have sufficient disclosures about nature, amount, timing, and uncertainty of revenue and cash flows arising from contracts with customers. This guidance is effective for interim and annual reporting periods beginning after December 15, 2016. Early adoption is not permitted. We expect to adopt this guidance on January 1, 2017. We are in the process of assessing the impact on our financial position, results of operations and cash flows from the adoption of this guidance.
85
Table of Contents
In July 2013, the FASB issued Accounting Standards Update No. 2013-11, “Presentation of an Unrecognized Tax Benefit When a Net Operating Loss Carryforward, a Similar Tax Loss, or Tax Credit Carryforward Exists,” (“ASU 2013-11”). ASU 2013-11 requires entities to present an unrecognized tax benefit, or a portion of an unrecognized tax benefit, as a reduction to a deferred tax asset for a net operating loss carryforward, a similar tax loss, or a tax credit carryforward when settlement in this manner is available under the tax law. This guidance is effective for interim and annual reporting periods beginning after December 15, 2013, with earlier adoption permitted, and may be applied prospectively or retrospectively. We adopted this guidance on January 1, 2014. Adoption of this guidance has no impact on our financial position, results of operations or cash flows in the current or future periods.
In February 2013, the FASB issued Accounting Standards Update No. 2013-02, “Comprehensive Income,” (“ASU 2013-02”). ASU 2013-02 requires entities to report the effect of significant reclassifications out of accumulated other comprehensive income on the respective line items in net income, if the amount being reclassified is required under US GAAP to be reclassified in its entirety to net income. For other amounts that are not required under US GAAP to be reclassified in their entirety from accumulated other comprehensive income to net income in the same reporting period, an entity is required to cross-reference other disclosures required under US GAAP that provide additional detail about those amounts. This pronouncement is effective for fiscal years beginning after December 15, 2012. We adopted this guidance on January 1, 2013 prospectively. In the years ended December 31, 2014, 2013 and 2012, we did not have any other comprehensive income and, therefore, the net loss and comprehensive loss was the same for all periods presented.
3. Fair Value Measurements
Fair value is defined as the exchange price that would be received for an asset or an exit price paid to transfer a liability in the principal or most advantageous market for the asset or liability in an orderly transaction between market participants on the measurement date. Valuation techniques used to measure fair value must maximize the use of observable inputs and minimize the use of unobservable inputs. The current accounting guidance for fair value measurements defines a three-level valuation hierarchy for disclosures as follows:
Level I—Unadjusted quoted prices in active markets for identical assets or liabilities;
Level II—Inputs, other than quoted prices included within Level I, that are observable, unadjusted quoted prices in markets that are not active, or other inputs that are observable or can be corroborated by observable market data; and
Level III—Unobservable inputs that are supported by little or no market activity, which requires us to develop our own assumptions.
The categorization of a financial instrument within the valuation hierarchy is based upon the lowest level of input that is significant to the fair value measurement.
The carrying values of our financial instruments, including cash equivalents, accounts receivable, accounts payable, and restricted cash, approximate their fair values. The estimated fair value and carrying value of our 2020 Notes were $343.6 million and $230.0 million, respectively, as of December 31, 2014, and $252.0 million and $230.0 million, respectively, as of December 31, 2013. We determined the estimated fair value of the 2020 Notes through use of binomial option pricing model. The fair value is classified as Level III due to the use of significant unobservable inputs such as estimated long-term volatility of our common stock and credit risk premium.
We determined the fair value of the 2020 Notes using the following assumptions:
|
As of December 31, 2014 | ||
| Stock price |
$46.03 | |
| Time to maturity |
5.96 years | |
| Volatility |
51% | |
| Risk free rate |
1.8% | |
| Discount spread |
8.5% - 10.5% |
86
Table of Contents
During the year ended December 31, 2012, we recognized a charge to earnings of $369,000 from remeasurement of the fair value of warrants to purchase preferred stock when they were converted into warrants to purchase common stock on the day of our IPO.
Fair Value Measurements on a Recurrent Basis (in thousands):
| As of December 31, 2014 | ||||||||||||||||
| Level I | Level II | Level III | Total | |||||||||||||
| Financial Assets: |
||||||||||||||||
| Money market funds |
$ | 6,683 | $ | — | $ | — | $ | 6,683 | ||||||||
| Restricted cash |
6,717 | — | — | 6,717 | ||||||||||||
|
|
|
|
|
|
|
|
|
|||||||||
| Total financial assets |
$ | 13,400 | $ | — | $ | — | $ | 13,400 | ||||||||
|
|
|
|
|
|
|
|
|
|||||||||
| As of December 31, 2013 | ||||||||||||||||
| Level I | Level II | Level III | Total | |||||||||||||
| Financial Assets: |
||||||||||||||||
| Money market funds |
$ | 6,683 | $ | — | $ | — | $ | 6,683 | ||||||||
| Restricted cash |
1,589 | — | — | 1,589 | ||||||||||||
|
|
|
|
|
|
|
|
|
|||||||||
| Total financial assets |
$ | 8,272 | $ | — | $ | — | $ | 8,272 | ||||||||
|
|
|
|
|
|
|
|
|
|||||||||
None of the cash equivalents or the restricted cash held by us had unrealized losses and there were no realized losses for the years ended December 31, 2014 and 2013. There were no other-than-temporary impairments for these instruments as of December 31, 2014 or 2013. In the year ended December 31, 2014, our restricted cash increased by $5.1 million, of which $3.8 million was related to our new lease agreement in San Francisco, and $968,000 related to the amendment of our continuing lease agreement in Denver. As of December 31, 2014, the contractual maturities of all certificates of deposit were less than three years.
4. Balance Sheet Components
Property and Equipment
Property and equipment consists of the following (in thousands):
| As of December 31, | ||||||||
| 2014 | 2013 | |||||||
| Computer equipment |
$ | 8,534 | $ | 7,275 | ||||
| Capitalized product development costs |
21,822 | 9,934 | ||||||
| Furniture and fixtures |
5,323 | 3,276 | ||||||
| Leasehold improvements |
22,209 | 8,985 | ||||||
| Software |
1,908 | 183 | ||||||
| Assets not yet in service |
10,879 | 3,868 | ||||||
|
|
|
|
|
|||||
| Total property and equipment |
70,675 | 33,521 | ||||||
| Less: accumulated depreciation and amortization |
(20,920 | ) | (11,232 | ) | ||||
|
|
|
|
|
|||||
| Total property and equipment, net |
$ | 49,755 | $ | 22,289 | ||||
|
|
|
|
|
|||||
Depreciation expense during the years ended December 31, 2014, 2013, and 2012 was $13.1 million, $6.4 million and $3.6 million, respectively.
87
Table of Contents
Accrued Liabilities
Accrued liabilities consist of the following (in thousands):
| As of December 31, | ||||||||
| 2014 | 2013 | |||||||
| Legal and professional fees |
$ | 1,344 | $ | 2,253 | ||||
| Marketing and advertising expenses |
2,494 | 1,326 | ||||||
| Interest |
316 | 246 | ||||||
| Sales taxes |
3,190 | 2,355 | ||||||
| Payroll taxes |
426 | 651 | ||||||
| Acquisition of property and equipment |
1,216 | 3,084 | ||||||
| Restructuring costs |
2,857 | — | ||||||
| Other |
2,040 | 1,346 | ||||||
|
|
|
|
|
|||||
| Total accrued liabilities |
$ | 13,883 | $ | 11,261 | ||||
|
|
|
|
|
|||||
Accrued Compensation and Benefits
Accrued compensation and benefits consist of the following (in thousands):
| As of December 31, | ||||||||
| 2014 | 2013 | |||||||
| Bonus |
$ | 3,579 | $ | 3,645 | ||||
| Payroll and related expenses |
3,121 | 3,191 | ||||||
| Commissions |
2,160 | 2,166 | ||||||
| Vacation |
1,727 | 1,861 | ||||||
|
|
|
|
|
|||||
| Total accrued compensation and benefits |
$ | 10,587 | $ | 10,863 | ||||
|
|
|
|
|
|||||
5. Acquisition of Market Leader
During the third quarter of fiscal year 2013, we acquired all the outstanding shares of capital stock of Market Leader, Inc. for 4,412,489 shares of our common stock and $170.5 million in cash. Market Leader is a provider of software-as-a-service (“SaaS”)-based customer relationship management software for the real estate sector. Under the terms and conditions of the Market Leader Merger Agreement, each outstanding share of Market Leader common stock was converted into the right to receive (a) $6.00 in cash, without interest, and subject to applicable withholding tax, and (b) 0.1553 of a share of the Company’s common stock, for a total purchase price of $372.7 million. In connection with the merger, all of the outstanding stock options, stock appreciation rights and restricted stock units of Market Leader were converted into stock options, stock appreciation rights and restricted stock units, respectively, denominated in shares of our common stock based on formulas set forth in the Market Leader Merger Agreement. We have included Market Leader’s results of operations prospectively after the acquisition date of August 20, 2013.
The acquisition adds additional products and services to our offerings for real estate professionals. With these additional products, we now offer products and services that encompass the entire real estate agent workflow—from generating and capturing initial leads through nurturing those leads into clients and real estate transactions. The acquisition has also added new customers, technology assets and intellectual property assets.
The purchase price of $372.7 million reflects the cash amount paid and the fair value of our common stock transferred as consideration for all outstanding shares of Market Leader, and the fair value of pre-combination
88
Table of Contents
services of Market Leader employees reflected in the vested equity awards assumed by us in the acquisition. The purchase price components are summarized in the following table (in thousands):
| Cash paid for the outstanding stock of Market Leader |
$ | 170,497 | ||
| Fair value of common stock transferred as consideration for the outstanding stock of Market Leader (4,412,489 shares) |
189,296 | |||
| Fair value of vested equity awards assumed by us |
12,871 | |||
|
|
|
|||
| Total purchase price |
$ | 372,664 | ||
|
|
|
The fair value of the 4,412,489 shares of our common stock issued as part of the consideration paid for Market Leader was determined on the basis of the closing market price of our common stock on the acquisition date. The fair value of the vested equity awards was determined by using a Black-Scholes option pricing model with the applicable assumptions as of the acquisition date.
The fair value of Market Leader unvested stock awards (that were converted to our awards) related to post-combination services of Market Leader employees were recorded and continue to be recorded as share-based compensation expense over the respective vesting periods after the acquisition date.
For this business combination the measurement period allowed by FASB Accounting Standards Codification Topic 805, “Business Combinations” (“ASC 805”), expired and the purchase price allocation to the net tangible and intangible assets was finalized on August 20, 2014. No adjustments to the purchase price were made during the measurement period. The excess of the purchase price over the fair value of net identifiable assets was recorded as goodwill. Goodwill recorded as a result of this acquisition includes intangible assets that do not qualify for separate recognition, such as the assembled workforce and anticipated synergies from complementary products and largely non-overlapping customer bases. Goodwill is not deductible for income tax purposes. Our purchase price allocation is as follows (in thousands):
| Cash |
$ | 9,662 | ||
| Short-term investments |
2,999 | |||
| Other identifiable tangible assets |
3,732 | |||
|
|
|
|||
| Total tangible assets |
16,393 | |||
|
|
|
|||
| Accounts payable |
(7,058 | ) | ||
| Accrued expenses and other current liabilities |
(3,104 | ) | ||
| Accrued compensation and benefits |
(2,253 | ) | ||
| Other identifiable liabilities |
(8,163 | ) | ||
|
|
|
|||
| Total liabilities |
(20,578 | ) | ||
|
|
|
|||
| Net acquired tangible assets |
(4,185 | ) | ||
|
|
|
|||
| Identifiable intangible assets |
123,100 | |||
| Goodwill |
253,749 | |||
|
|
|
|||
| Total purchase price allocation |
$ | 372,664 | ||
|
|
|
We acquired a net deferred tax liability of $7.9 million related to Market Leader in this business combination.
89
Table of Contents
Intangible assets acquired consist of the following (in thousands):
| Estimated Amortization Period (in years) |
||||||||
| Enterprise relationships |
$ | 29,000 | 10 | |||||
| Premium users |
15,200 | 5 | ||||||
| Existing technology |
32,300 | 7 | ||||||
| Trade names |
42,900 | 10 | ||||||
| Home/MLS data feeds |
3,700 | 10 | ||||||
|
|
|
|||||||
| Total intangible assets acquired |
$ | 123,100 | ||||||
|
|
|
|||||||
Enterprise relationships consist of contracts with national real estate franchisors that serve as channels for selling Market Leader products and services to real estate agents. Premium users consist of real estate professionals and brokerages that purchase enhanced versions of Market Leader’s products and services. Existing technology consists of software products and supporting technology infrastructure developed by Market Leader. Trade names includes the several registered trademarks, logos and domain names owned by Market Leader, including Market Leader, House Values and Sharper Agent. MLS data feeds means the contractual rights to display for sale home listings from hundreds of multiple listing services in the United States.
The estimated fair value of the intangible assets acquired was determined by us, and we considered or relied in part upon a valuation report of a third-party expert. We used an income approach to measure the fair value of the enterprise relationships based on the multi-period excess earnings method, whereby the fair value is estimated based upon the present value of cash flows that the applicable asset is expected to generate. We used an income approach to measure the fair value of the customer relationships based on the multi-period excess earnings method, whereby the fair value is estimated based upon the present value of cash flows that the applicable asset is expected to generate. We used an income approach to measure the fair values of the developed technology and trade names based on the relief-from-royalty method. We used a cost approach to measure the fair value of the home/MLS data feed based on the estimated cost to replace the data feed library.
Net tangible assets were valued at their respective carrying amounts, as we believe that these amounts approximated their current fair values on the date of acquisition.
Acquisition-related costs, including legal and accounting fees and other external costs directly related to the acquisition, were expensed as incurred. Acquisition-related costs of $6.1 million for the year ended December 31, 2013 are included as a separate line item in our combined statement of operations.
The following pro forma condensed combined financial information gives effect to the acquisition of Market Leader as if it was consummated on January 1, 2012 (the beginning of the comparable prior reporting period), and includes pro forma adjustments related to the amortization of acquired intangible assets, share-based compensation expense and direct and incremental transaction costs reflected in the historical financial statements. Direct and incremental transaction costs are excluded from the annual period ended December 31, 2013 pro forma condensed combined financial information presented below, and included in the annual period ended December 31, 2012 pro forma condensed combined financial information presented below. The tax benefit of $6.7 million that resulted from the acquisition is recorded in the annual period ended December 31, 2012 pro-forma period. The pro forma condensed combined financial information is presented for informational purposes only. The pro forma condensed combined financial information is not intended to represent or be indicative of the results of operations that would have been reported had the acquisition occurred on January 1, 2012 and should not be taken as representative of future results of operations of the combined company. The following table presents the unaudited pro forma condensed combined financial information (in thousands, except per share
90
Table of Contents
amounts). Market Leader’s portion of the revenue and net loss in the period from the acquisition and through December 31, 2013 were $21.2 million and $9.3 million, respectively.
| Years Ended December 31, | ||||||||
| 2013 | 2012 | |||||||
| Revenue |
$ | 178,151 | $ | 113.073 | ||||
| Net loss attributable to common shareholders |
$ | (33,056 | ) | $ | (49,461 | ) | ||
| Net loss per share attributable to common shareholders—basic and diluted |
$ | (0.92 | ) | $ | (2.92 | ) | ||
6. Goodwill and Intangible Assets
Goodwill
Goodwill recorded as a result of the Market Leader acquisition includes intangible assets that do not qualify for separate recognition, such as the assembled workforce and anticipated synergies from complimentary products and largely non-overlapping customer bases. Goodwill balance as of December 31, 2014 and 2013 was as follows:
| Balance as of December 31, 2012 |
$ | 2,155 | ||
| Goodwill recorded in connection with the acquisition of Market Leader |
253,749 | |||
|
|
|
|||
| Balance as of December 31, 2013 |
255,904 | |||
| Change in goodwill |
— | |||
|
|
|
|||
| Balance as of December 31, 2014 |
$ | 255,904 | ||
|
|
|
Intangible Assets
The following table presents the detail of intangible assets subject to amortization (in thousands):
| Year Ended December 31, 2014 | ||||||||||||
| Cost | Accumulated Amortization |
Net | ||||||||||
| Enterprise relationships |
$ | 29,000 | $ | (3,952 | ) | $ | 25,048 | |||||
| Premium users |
15,200 | (4,143 | ) | 11,057 | ||||||||
| Existing technology |
32,300 | (6,289 | ) | 26,011 | ||||||||
| Trade names |
42,900 | (5,847 | ) | 37,053 | ||||||||
| Home/MLS data feeds |
3,700 | (504 | ) | 3,196 | ||||||||
| Other |
891 | (689 | ) | 202 | ||||||||
|
|
|
|
|
|
|
|||||||
| Total |
$ | 123,991 | $ | (21,424 | ) | $ | 102,567 | |||||
|
|
|
|
|
|
|
|||||||
| Year Ended December 31, 2013 | ||||||||||||
| Cost | Accumulated Amortization |
Net | ||||||||||
| Enterprise relationships |
$ | 29,000 | $ | (1,052 | ) | $ | 27,948 | |||||
| Premium users |
15,200 | (1,103 | ) | 14,097 | ||||||||
| Existing technology |
32,300 | (1,675 | ) | 30,625 | ||||||||
| Trade names |
42,900 | (1,557 | ) | 41,343 | ||||||||
| Home/MLS data feeds |
3,700 | (134 | ) | 3,566 | ||||||||
| Other |
701 | (392 | ) | 309 | ||||||||
|
|
|
|
|
|
|
|||||||
| Total |
$ | 123,801 | $ | (5,913 | ) | $ | 117,888 | |||||
|
|
|
|
|
|
|
|||||||
91
Table of Contents
Amortization expense recorded for intangible assets for the years ended December 31, 2014 and 2013 was $15.7 million and $5.8 million, respectively.
Future amortization expense is expected to be as follows over each of the next five years (in thousands):
| Total | ||||
| 2015 |
$ | 15,311 | ||
| 2016 |
15,230 | |||
| 2017 |
15,230 | |||
| 2018 |
14,127 | |||
| 2019 |
12,190 | |||
| Thereafter |
30,479 | |||
|
|
|
|||
| Total |
$ | 102,567 | ||
|
|
|
|||
7. Debt
Convertible Senior Notes
On December 17, 2013, we issued $230.0 million aggregate principal amount of the 2020 Notes, which included $30.0 million of principal amount issued pursuant to an over-allotment option granted to the initial purchasers. The aggregate principal amount of the 2020 Notes is due on December 15, 2020. We received net proceeds of $222.4 million after deducting offering expenses payable by us. The effective interest rate on the 2020 Notes is not materially different from the stated interest rate of 2.75%.
We pay 2.75% interest per annum on the outstanding principal amount of the 2020 Notes semi-annually on June 15 and December 15 of each year beginning on June 15, 2014. Interest began to accrue on December 17, 2013. The 2020 Notes are unsecured senior obligations of Trulia. These 2020 Notes were offered and sold only to qualified institutional investors, as defined in Rule 144 under the Securities Act of 1933 (“Securities Act”), and the 2020 Notes and the shares of our common stock issuable upon conversion of the 2020 Notes have not been registered under the Securities Act.
We may not redeem the 2020 Notes prior to December 20, 2018. We may redeem the 2020 Notes, at our option, in whole or in part on or after December 20, 2018, if the last reported sale price per share of our common stock has been at least 130% of the conversion price then in effect for at least 20 trading days (whether or not consecutive) during any 30 consecutive trading day period.
Holders of the 2020 Notes may convert all or any portion of their notes, in multiples of $1,000 principal amount, at their option at any time prior to the close of business on the business day immediately preceding the maturity date. The 2020 Notes are convertible at an initial conversion rate of 27.8303 shares of our common stock per $1,000 principal amount of notes. This is equivalent to an initial conversion price of approximately $35.93 per share of our common stock. The conversion rate will be adjusted for certain dilutive events and will be increased in the case of corporate events that constitute a “Make-Whole Fundamental Change” (as defined in the indenture governing the notes). The holders of the 2020 Notes will have the ability to require us to repurchase the notes in whole or in part upon the occurrence of an event that constitutes a “Fundamental Change” (as defined in the indenture governing the notes including such events as a “change in control” or “termination of trading”). In such case, the repurchase price would be 100% of the principal amount of the 2020 Notes plus accrued and unpaid interest, if any, to, but excluding, the fundamental change repurchase price. Certain events are also considered “Events of Default,” which may result in the acceleration of the maturity of the 2020 Notes, as described in the indenture governing the notes, including, among other events, our failure to file with the SEC the reports required pursuant to Section 13 or 15(d) of the Securities Exchange of 1934, as amended, within 180 days after the time such report was required to be filed. There are no financial covenants to these 2020 Notes.
92
Table of Contents
The conversion option of the 2020 Notes has no cash settlement provisions. Total issuance costs for the 2020 Notes were $7.6 million. We use the effective interest method to amortize the debt issuance costs. We believe that the conversion option does not meet the criteria for separate accounting as a derivative as it is indexed to our own stock.
In connection with the completion of the Zillow Merger on February 17, 2015, the 2020 Notes became obligations of HoldCo, and became convertible for shares of HoldCo Class A common stock. Additional details on the Merger Agreement and the Zillow Merger are presented in Notes 1 and 14 of these consolidated financial statements.
The estimated fair value of the 2020 Notes as of December 31, 2014 and 2013 was $343.6 million and $252.0 million, respectively. We recognized interest expense and amortization of debt issue costs related to the 2020 Notes in the year ended December 31, 2014, and for the period from December 17, 2013 through December 31, 2013 of $7.3 million and $284,000, respectively.
Credit Facility
In September 2011, we entered into a $20.0 million loan and security agreement which provided for a secured term loan facility (“Credit Facility”) issuable in tranches, with a financial institution. Under the Credit Facility, the first tranche of $5.0 million was drawn down in full in September 2011 and was used to repay our outstanding debt at the time. The second tranche of $5.0 million was also drawn down in full in September 2011. The Credit Facility carried an interest rate equal to the greater of the prime rate plus 2.75% or 6% for the first tranche, and a rate equal to the greater of the prime rate plus 5.5% or 8.75% for the second and third tranches. The loan facility was subject to interest-only payments through September 2012, which was repayable in 30 equal monthly installments of principal and interest after the interest-only period, and had a maturity date of March 2015. However, during the six months ended June 30, 2012, we achieved certain financial milestones under the Credit Facility which provided for the extension of: a) the drawdown period from August 2012 to December 2012, b) the beginning of the interest-only period from September 2012 to March 2013, and c) the maturity date from March 2015 to September 2015. On December 31, 2012, the drawdown period for the remaining $10.0 million expired.
In conjunction with the Credit Facility, we issued warrants to purchase up to 120,961 shares of our stock as follows: (1) shares of Series D convertible preferred stock with an exercise price equal to $8.4738 per share or (2) shares of the next round of preferred stock financing at the per share price for such shares upon drawdown of the entire loan amount. Of this amount, warrants to purchase 56,054 shares of Series D convertible preferred stock became exercisable upon the drawdown of the first and second tranches and have an exercise price of $8.4738 per share. At the time of issuance, the aggregate fair value of these warrants was $281,000. We also paid a net facility charge of $165,000 upon drawdown of the first tranche of the loan. The fair value of warrants and net facility charge were recorded as debt discount to be amortized as interest expense over the contractual term of the loan agreement using the effective interest rate method. As a result of the debt discount, the effective interest rate for the Credit Facility differed from the contractual rate. During the years ended December 31, 2013 and 2012, we recognized interest expense related to amortization and write off of the remaining debt discount in the amount of $241,000 and $167,000, respectively. The warrants were net exercised in February 2013 and were no longer outstanding as of December 31, 2013.
On December 17, 2013 when the outstanding balance of the Credit Facility was $7.2 million, we repaid it with the proceeds from the 2020 Notes discussed above. We recorded a loss on debt extinguishment of $141,000.
93
Table of Contents
8. Commitments and Contingencies
Operating Leases
We lease our corporate offices under noncancelable operating leases in San Francisco, Bellevue, Denver, and New York that range from one to nine years in term.
On March 10, 2014, we entered into a lease agreement (“Lease”) effective November 1, 2014, for approximately 79,000 square feet of new office space at 535 Mission Street in San Francisco that houses our principal executive office. This office space replaced our former principal office at 116 New Montgomery Street in San Francisco, for which the lease expired in the fourth quarter of 2014. On July 25, 2014, we entered into a lease amendment under which we will lease an additional 26,620 square feet of office space commencing in October 2015 under the same terms and conditions. The term of the Lease is approximately 107 months and the future minimum lease payments range from $182,000 to $347,000 per month.
On April 10, 2014, we entered into a lease effective May 1, 2014 for approximately 65,000 square feet of office space in the Denver metropolitan area. The term of the lease is approximately 90 calendar months and the future minimum lease payments range from $124,000 to $141,000 per month, starting in November 2014 after a six month rent abatement period.
In September 2013, we entered into a lease effective through September 2021 for approximately 72,000 square feet of office space that houses our offices in Bellevue, WA. The term of the lease is approximately 97 calendar months and the future minimum lease payments range from $193,000 to $235,000 per month, starting in October 2014, after a 13 month rent abatement period.
We lease additional office space in New York area. We believe our facilities are sufficient for our current needs.
Rent expense from the leases of the facilities we currently occupy is recognized on a straight-line basis over the lease term. The rent expense for the years ended December 31, 2014 and 2013 was $5.7 million and $3.6 million, respectively.
As of December 31, 2014, our minimum payments under the noncancelable operating leases were as follows (in thousands):
| Year Ending December 31: |
Operating Lease |
|||
| 2015 |
$ | 7,128 | ||
| 2016 |
8,577 | |||
| 2017 |
8,788 | |||
| 2018 |
9,033 | |||
| 2019 |
9,283 | |||
| Thereafter |
27,963 | |||
|
|
|
|||
| Total minimum lease payments |
$ | 70,772 | ||
|
|
|
|||
Contingencies
Zillow Merger Litigation
Between August 7, 2014 and August 20, 2014, four plaintiffs filed purported class action lawsuits against us and our directors, Zillow and HoldCo in connection with the Zillow Merger. Three of those purported class actions were brought in the Delaware Court of Chancery, captioned Shue et al. v. Trulia, Inc., et al., Case No. 10020 (August 7, 2014), Sciabacucci et al. v. Trulia, Inc., et al., Case No. 10022 (August 8, 2014), and
94
Table of Contents
Steinberg et al. v. Trulia, Inc. et al., Case No. 10049 (August 20, 2014). The fourth of those purported class actions was brought in the Superior Court of the State of California for the County of San Francisco, captioned Collier et al. v. Trulia, Inc., et al., Case No. CGC 14-540985 (August 7, 2014).
Each of the lawsuits alleges that our directors breached their fiduciary duties to Trulia stockholders, and that the other defendants aided and abetted such breaches, by seeking to sell Trulia through an allegedly unfair process and for an unfair price and on unfair terms. The Collier complaint filed in Delaware and the Sciabacucci complaint (as amended, as described below) also allege that our directors breached their fiduciary duties to Trulia stockholders, and that the other defendants aided and abetted such breaches, with respect to the contents of HoldCo’s registration statement on Form S-4. All lawsuits seek, among other things, equitable relief that would enjoin the consummation of the Zillow Merger and attorneys’ fees and costs. The Delaware actions also seek rescission of the Merger Agreement (to the extent it has already been implemented) or rescissory damages, and orders directing the individual defendants to account for alleged damages suffered by the plaintiff and the purported class as a result of the defendants’ alleged wrongdoing.
On September 23, 2014, the plaintiff in the Sciabacucci action filed an amended complaint, alleging substantially the same claims and seeking substantially the same relief as in the original complaint, and on September 24, 2014, the plaintiff filed (1) a motion for expedited proceedings, (2) a motion for a preliminary injunction, (3) a request for production of documents from defendants, and (4) notice of depositions. On October 7, 2014, the plaintiff in the Collier action filed a new complaint in Delaware Court of Chancery, captioned Collier et al. v. Trulia, Inc., et al., Case No. 10209 (October 7, 2014), alleging substantially the same claims and seeking substantially the same relief as the original complaint filed in California. On October 8, 2014, the plaintiff in the Collier action filed a request for dismissal of the California case without prejudice. On October 13, 2014, the Delaware Court of Chancery issued an order consolidating all of the Delaware actions into one matter captioned In re Trulia, Inc. Stockholder Litigation, C.A. No. 10020-CB, and appointed a lead counsel. On October 13 and 14, 2014, the above-referenced motions were refiled under the consolidated case number.
On November 19, 2014, the defendants entered into a memorandum of understanding with the In re Trulia, Inc. Stockholder Litigation plaintiffs regarding the settlement of that action. In connection with the settlement contemplated by the memorandum of understanding, with the defendants expressly denying that any of the claims has any merit, Trulia agreed to make certain additional disclosures related to the proposed merger, which disclosures Trulia made in a Form 8-K filed with the SEC on November 19, 2014. The memorandum of understanding contemplates that the parties will seek to enter into a stipulation of settlement.
The stipulation of settlement will be subject to customary conditions, including court approval following notice to the Trulia stockholders. In the event that the parties enter into a stipulation of settlement, a hearing will be scheduled at which the Delaware Court of Chancery will consider the fairness, reasonableness, and adequacy of the settlement. There can be no assurance that the parties will ultimately enter into a stipulation of settlement or that the Delaware Court of Chancery will approve the settlement even if the parties were to enter into such stipulation. In such event, the proposed settlement as contemplated by the memorandum of understanding may not be consummated.
From time to time, we are subject to legal proceedings and claims in the ordinary course of business. We have received, and may in the future continue to receive, claims from third parties asserting, among other things, infringement of their intellectual property rights.
Although the results of litigation and claims cannot be predicted with certainty, we believe the final outcome of the matters discussed above will not have a material and adverse effect on our business, financial position, results of operations, or cash flows. We will, however, accrue for losses for any known contingent liabilities when future payment is probable and the amount is reasonably estimable.
95
Table of Contents
Indemnifications
In the ordinary course of business, we enter into contractual arrangements under which we agree to provide indemnification of varying scope and terms to business partners and other parties with respect to certain matters, including, but not limited to, losses arising out of the breach of such agreements and out of intellectual property infringement claims made by third parties. In these circumstances, payment may be conditional on the other party making a claim pursuant to the procedures specified in the particular contract. Further, our obligations under these agreements may be limited in terms of time and/or amount, and in some instances, we may have recourse against third parties for certain payments. In addition, we have indemnification agreements with certain of its directors and executive officers that require us, among other things, to indemnify them against certain liabilities that may arise by reason of their status or service as directors or officers. The terms of such obligations may vary. No such obligations existed as of December 31, 2014 and 2013.
9. Stockholders’ Equity
Shares Repurchases
In December 2013, we used $30.0 million of the net proceeds received from the issuance of the 2020 Notes to repurchase 1,085,383 shares of our common stock from purchasers of the 2020 Notes in privately negotiated transactions effected through J.P. Morgan Securities LLC or its affiliate as our agent. The purchase price per share of the common stock repurchased in this transaction was equal to the closing price per share of our common stock on December 11, 2013, which was $27.64. We also repurchased nominal other amounts of shares of our common stock in the open market at their effective market prices at the time of purchase. All shares repurchases were accounted for at cost.
Common Stock
As of December 31, 2014 and 2013, we had reserved shares of common stock for issuance as follows:
| As of December 31, 2014 |
As of December 31, 2013 |
|||||||
| Stock options and awards issued and outstanding |
5,550,417 | 6,452,832 | ||||||
| Stock options and awards available for grant under 2012 Plan |
2,644,920 | 1,976,815 | ||||||
| Stock options and awards available for grant under the 2004 Plan |
— | 82,784 | ||||||
|
|
|
|
|
|||||
| Total |
8,195,337 | 8,512,431 | ||||||
|
|
|
|
|
|||||
The common stock warrants were net exercised in February 2013 at an exercise price of $8.47 per share for an aggregate of 39,025 shares of common stock.
Preferred Stock
Under our amended and restated certificate of incorporation registered in September 2012, we were authorized to issue 20,000,000 shares of preferred stock at $0.00001 par value per share. The preferred stock may be issued from time to time in one or more series pursuant to a resolution or resolutions duly adopted by the board of directors. Our board of directors is authorized to determine by resolution the relevant powers of each issue of the preferred stock, such as designations, preferences, participation, dividend rights, divided rates, conversion rights, voting rights, etc. As of December 31, 2014 and 2013 no shares of preferred stock were issued or outstanding.
96
Table of Contents
10. Stock-Based Compensation
2005 Stock Plan
We granted options under our 2005 Stock Incentive Plan (“the 2005 Plan”) until September 2012 when the 2005 Plan was terminated. Since the date of the plan termination, no more stock options or awards were issued under the plan, however the stock options issued prior to the plan termination continue to be outstanding. Under the terms of the 2005 Plan, we had the ability to grant incentive (“ISO”) and nonstatutory (“NSO”) stock options, restricted stock awards (“RSA”) and restricted stock units (“RSU”). The options were granted at a price per share not less than 100% of the fair market value per share at the grant date. Options granted under the 2005 Plan generally vest at a rate of 25% after the first year and then at 1/36 of the remaining shares each month thereafter and expire 10 years from the grant date. Certain options vest monthly over two to four years.
2012 Equity Incentive Plan
Effective September 19, 2012, our board of directors adopted, and our stockholders approved, a 2012 Equity Incentive Plan (“the 2012 Plan”). The 2012 Plan provides for the grant of ISOs, NSOs, restricted stock, restricted stock units, stock appreciation rights, performance units, and performance shares to our employees, directors, and consultants. Upon adoption of the 2012 Plan, a total of 2,370,000 shares of common stock were reserved for issuance plus up to 1,000,000 shares from the expiration or termination of awards under the 2005 Plan. The shares available are increased at the beginning of each fiscal year by the lesser of (i) 2,100,000 shares, (ii) 4% of outstanding common stock on the last day of the immediately preceding fiscal year, or (iii) such number determined by our board of directors. On January 1, 2015 and 2014 the shares available for grant under the 2012 Plan were automatically increased by 1,529,297 and 1,463,303 shares, respectively. On June 5, 2013, the stockholders approved a 2,000,000 share increase to the 2012 Plan. Under the 2012 Plan, both the ISOs and NSOs are granted at a price per share not less than 100% of the fair market value per share of the underlying stock at the grant date. The board of directors determines the vesting period for each option award on the grant date, and the options generally expire 10 years from the grant date or such shorter term as may be determined by the board of directors. The restricted stock units are granted for zero purchase price.
Market Leader 2004 Equity Incentive Plan
In connection with our acquisition of Market Leader and pursuant to the Market Leader Merger Agreement, we assumed Market Leader’s 2004 Equity Incentive Plan (“the 2004 Plan”) including all outstanding shares of restricted stock, all outstanding stock appreciation rights, all outstanding options, and all shares available for future issuance under the 2004 Plan, and all of such securities became issuable for shares of our common stock. We granted equity awards, to the extent permissible by applicable law and NYSE rules, under the 2004 Plan until it expired on December 9, 2014. The equity awards issued prior to the 2004 Plan expiration continue to be outstanding and are governed by the provisions of the 2004 Plan.
We did not assume House Value’s 1999 Stock Incentive Plan (“the 1999 Plan”). However, pursuant to the Market Leader Merger Agreement, we have assumed all outstanding shares of restricted stock, all outstanding stock appreciation rights, and all outstanding options issued under the 1999 Plan. These equity awards continue to be outstanding and are governed by the provisions of the 1999 Plan.
Total shares of common stock available for grant under our 2012 Plan and 2004 Plan were 2,644,920 and 2,059,599 as of December 31, 2014 and 2013, respectively. The 2004 Plan expired on December 9, 2014, consequently no shares were available under the 2004 Plan as of December 31, 2014.
97
Table of Contents
Equity Awards Activity
The equity awards activity under the 2005 Plan, 2012 Plan, 1999 Plan, and 2004 Plan presented below includes employee and nonemployee awards.
Stock Option Activity
| Stock Options Outstanding |
Weighted Average Exercise Price |
Weighted Average Remaining Contractual Life (Years) |
Aggregate Intrinsic Value |
|||||||||||||
| (In thousands) | ||||||||||||||||
| Balance—January 1, 2014 |
3,088,449 | $ | 13.90 | 7.42 | $ | 68,131 | ||||||||||
| Granted |
346,084 | 39.02 | ||||||||||||||
| Canceled |
(303,306 | ) | 30.48 | |||||||||||||
| Exercised |
(911,538 | ) | 12.33 | |||||||||||||
|
|
|
|||||||||||||||
| Balance—December 31, 2014 |
2,219,689 | $ | 16.19 | 6.93 | $ | 66,553 | ||||||||||
|
|
|
|||||||||||||||
| Options exercisable—December 31, 2014 |
1,304,211 | $ | 9.84 | 6.06 | $ | 47,261 | ||||||||||
|
|
|
|||||||||||||||
| Options vested and expected to vest—December 31, 2014 |
2,109,256 | $ | 15.75 | 6.86 | $ | 64,323 | ||||||||||
|
|
|
|||||||||||||||
The options exercisable as of December 31, 2014 included options that were exercisable prior to vesting. The weighted average grant date fair value of options granted during the years ended December 31, 2014, 2013, and 2012 was $17.36, $15.24, and $6.77, respectively.
Aggregate intrinsic value represents the difference between the estimated fair value of the underlying common stock and the exercise price of outstanding, in-the-money options. The aggregate intrinsic value of options exercised was $30.0 million, $45.9 million, and $5.3 million for the years ended December 31, 2014, 2013, and 2012, respectively. The total estimated grant date fair value of employee options vested during the years ended December 31, 2014, 2013 and 2012 was $7.5 million, $6.4 million and $4.6 million, respectively. As of December 31, 2014, total unrecognized compensation cost related to non-vested stock options granted to employees was $10.5 million, net of estimated forfeitures of $5.7 million. These costs will be amortized on a straight-line basis over a weighted average vesting period of 2.17 years.
Stock Appreciation Rights Activity
| Stock Appreciation Rights Outstanding |
Weighted Average Exercise Price |
Weighted Average Remaining Contractual Life (Years) |
Aggregate Intrinsic Value |
|||||||||||||
| (In thousands) | ||||||||||||||||
| Balance—January 1, 2014 |
127,544 | $ | 11.83 | 3.08 | $ | 2,990 | ||||||||||
| Granted |
— | — | ||||||||||||||
| Canceled |
(24,992 | ) | 12.78 | |||||||||||||
| Exercised |
(85,893 | ) | 11.37 | |||||||||||||
|
|
|
|||||||||||||||
| Balance—December 31, 2014 |
16,659 | $ | 12.78 | 2.16 | $ | 554 | ||||||||||
|
|
|
|||||||||||||||
| Exercisable—December 31, 2014 |
3,077 | $ | 11.61 | 2.06 | $ | 106 | ||||||||||
|
|
|
|||||||||||||||
| Vested and expected to vest—December 31, 2014 |
15,081 | $ | 12.75 | 2.16 | $ | 502 | ||||||||||
|
|
|
|||||||||||||||
98
Table of Contents
We measure the fair value of our stock appreciation rights similar to stock options. Our stock appreciation rights typically vest on a graded basis over either a two or four year period and typically expire on the earlier of five years from the date of grant or ninety days following termination of employment.
We did not have stock appreciation rights in the year ended December 31, 2012. The aggregate intrinsic value of the stock appreciation rights exercised during the years ended December 31, 2014 and 2013 was $3.6 million and $908,000, respectively. The total estimated grant date fair value of the stock appreciation rights vested during the years ended December 31, 2014 and 2013 was $2.0 million and $736,000, respectively. As of December 31, 2014, total unrecognized compensation cost related to non-vested stock appreciation rights granted to employees was $767,000, net of estimated forfeitures of $423,000. These costs will be amortized on a straight-line basis over a weighted average vesting period of 1.18 years.
Restricted Stock Units Activity
| RSUs Outstanding |
Weighted Average Grant Date fair Value |
Weighted Average Remaining Contractual Life (Years) |
Aggregate Intrinsic Value |
|||||||||||||
| (In thousands) | ||||||||||||||||
| Unvested—January 1, 2014 |
1,660,589 | $ | 35.28 | 1.94 | $ | 58,569 | ||||||||||
| Granted |
1,612,050 | 44.34 | ||||||||||||||
| Canceled |
(383,629 | ) | 38.55 | |||||||||||||
| Released |
(757,441 | ) | 34.32 | |||||||||||||
|
|
|
|||||||||||||||
| Unvested—December 31, 2014 |
2,131,569 | $ | 41.73 | 2.24 | $ | 98,247 | ||||||||||
|
|
|
|||||||||||||||
| Restricted stock units expected to vest—December 31, 2014 |
1,632,663 | $ | 42.36 | 2.10 | $ | 75,151 | ||||||||||
|
|
|
|||||||||||||||
In the second half of 2014, we granted restricted stock units to certain of our employees in connection with the Zillow Merger. These awards were set to vest on the earlier of (i) immediately prior to the closing of the Merger, or (ii) 18 months. On February 17, 2015, in connection with closing of the Zillow Merger, all of these awards have vested. We recorded a $6.9 million stock-based compensation expense associated with these awards in the year ended December 31, 2014.
As of December 31, 2014, total unrecognized compensation cost related to the non-vested RSUs granted was $77.8 million, net of estimated forfeitures of $19.3 million. This cost will be amortized on a straight-line basis over a weighted average vesting period of 2.10 years.
99
Table of Contents
In May and August of 2013 we granted 2,105,000 stock unit awards in relation to the Market Leader acquisition, of which 1,576,250 were performance-based awards (“PSU”), and 528,750 were time-based awards. The performance-based awards were contingent upon closing of the Market Leader acquisition referred to in Note 1 of these consolidated financial statements, achievement of certain performance metrics, including comparative market-based returns, and the employees’ continued service relationship with us. The time-based awards were contingent upon closing of the Market Leader acquisition and the employees’ continued service relationship with us. On August 20, 2013, the first contingency was resolved when we closed the acquisition of Market Leader. Hence, the time-based awards were classified as restricted stock units and included in the RSU table above. The market condition for the performance-based awards has been achieved in the fourth quarter of 2014. The performance-based awards are summarized in the table below.
| PSUs Outstanding |
Weighted Average Grant Date fair Value |
Weighted Average Remaining Contractual Life (Years) |
Aggregate Intrinsic Value |
|||||||||||||
| (In thousands) | ||||||||||||||||
| Unvested—January 1, 2014 |
1,576,250 | $ | 22.84 | 3.0 | $ | 55,594 | ||||||||||
| Granted |
— | — | ||||||||||||||
| Canceled |
(393,750 | ) | 31.57 | |||||||||||||
| Released |
— | — | ||||||||||||||
|
|
|
|||||||||||||||
| Unvested—December 31, 2014 |
1,182,500 | $ | 20.11 | 1.38 | $ | 54,430 | ||||||||||
|
|
|
|||||||||||||||
| Restricted stock units expected to vest—December 31, 2014 |
1,111,464 | $ | 20.11 | 1.38 | $ | 51,161 | ||||||||||
|
|
|
|||||||||||||||
We estimated the fair value of the performance-based awards using a Monte Carlo simulation model. Total compensation cost recorded related to performance-based awards in the years ended December 31, 2014 and 2013 was $5.4 million and $4.4 million, respectively. We had no PSUs in the year ended December 31, 2012.
As of December 31, 2014, total unrecognized compensation cost related to the unvested performance-based awards granted to employees was $13.8 million, net of estimated forfeitures of $7.7 million, respectively. This cost will be amortized on a straight-line basis over a weighted average vesting period of 1.38 years.
Determining Fair Value of Stock Based Awards
The fair value of each grant of stock option and stock appreciation right awards is determined by us using the methods and assumptions discussed below. Each of these inputs is subjective and generally requires significant judgment to determine.
Valuation Method—We estimate the fair value of our stock option and stock appreciation right awards using the Black-Scholes option-pricing model.
Expected Term—The expected term represents the period that the stock option awards are expected to be outstanding. We estimate the expected term for our awards grants based on a study of publicly traded industry peer companies and the historical data on our employee exercises and post-vesting employment termination behavior taking into account the contractual life of the award.
Expected Volatility—The expected volatility is derived from the historical stock volatilities of several comparable publicly listed peers over a period approximately equal to the expected term of the awards because we have limited information on the volatility of our common stock since we do not have significant trading history. When making the selections of the comparable industry peers to be used in the volatility calculation, we considered the size, operational and economic similarities to our principle business operations.
100
Table of Contents
Fair Value of Common Stock—Prior to our IPO, the fair value of the common stock underlying the stock option awards was determined by our board of directors. Because there had been no public market for our stock, the board of directors had determined the fair value of the common stock at the time of the option grant by considering a number of objective and subjective factors including contemporaneous valuations performed by unrelated third party specialists, valuations of comparable companies, operating and financial performance, lack of liquidity of capital stock and general and industry-specific economic outlook, amongst other factors. After our IPO we have been using the listed stock price on the date of grant as its fair value.
Risk-Free Interest Rate—The risk-free interest rate is based on the U.S. Treasury yield curve in effect at the time of grant for zero coupon U.S. Treasury notes with maturities approximately equal to the expected term of the options.
Expected Dividends—The expected dividend has been zero as we have never paid dividends and have no expectations to do so.
Forfeiture Rate—We estimate our forfeiture rates based on an analysis of our actual forfeitures and will continue to evaluate the adequacy of the forfeiture rate based on actual forfeiture experience, analysis of employee turnover behavior, and other factors. The impact from a forfeiture rate adjustment will be recognized in full in the period of adjustment, and if the actual number of future forfeitures differs from that estimated, we may be required to record adjustments to stock-based compensation expense in future periods.
Summary of Assumptions
The fair value of employee stock option awards is estimated on the date of grant using a Black-Scholes option-pricing model with the following weighted average assumptions:
| Year Ended December 31, | ||||||||||||
| 2014 | 2013 | 2012 | ||||||||||
| Expected term (in years) |
5.3 | 5.5 | 5.5 | |||||||||
| Expected volatility |
48 | % | 52 | % | 53 | % | ||||||
| Risk-free interest rate |
1.7 | % | 1.2 | % | 0.9 | % | ||||||
| Dividend rate |
0 | % | 0 | % | 0 | % | ||||||
The fair value of the restricted stock units equals the market value of the underlying stock on the date of grant.
The fair value of the performance-based awards was estimated using a Monte Carlo simulation model with the following weighted average assumptions:
| As of May 29, 2013 |
As of August 29, 2013 |
|||||||
| Stock price |
$ | 30.31 | $ | 41.67 | ||||
| Simulation period |
2.93 years | 2.68 years | ||||||
| Risk free rate |
0.47 | % | 0.65 | % | ||||
| Volatility |
52.6 | % | 52.6 | % | ||||
| Dividend yield |
0 | % | 0 | % | ||||
| Cost of equity |
12.6 | % | 12.3 | % | ||||
Equity awards granted to non-employees
We granted 3,911, 0 and 0 stock based awards to nonemployees during the years ended December 31, 2014, 2013, and 2012, respectively. During the year ended December 31, 2014, as a result of the restructuring of our
101
Table of Contents
Market Leader operations, certain equity awards continued to vest as nonemployee awards. Such awards were subject to remeasurement at fair value at the end of each reporting period. The stock-based compensation expense recognized in connection with these awards was $1.6 million in the year ended December 31, 2014.
In the years ended December 31, 2013 and 2012, a total of $0 and $58,000 of stock-based compensation expense was recognized related to nonemployee options.
Compensation Paid in Stock
We recorded compensation expense for the stock-based awards granted to employees and other compensation paid in stock as follows (in thousands):
| Years Ended December 31, | ||||||||||||
| 2014 | 2013 | 2012 | ||||||||||
| Stock-based compensation: |
||||||||||||
| Cost of revenue |
$ | 2,812 | $ | 644 | $ | 32 | ||||||
| Technology and development |
9,466 | 5,659 | 930 | |||||||||
| Sales and marketing |
13,425 | 4,880 | 398 | |||||||||
| General and administrative |
15,770 | 9,266 | 1,210 | |||||||||
|
|
|
|
|
|
|
|||||||
| Total stock-based compensation expense |
41,473 | 20,449 | 2,570 | |||||||||
|
|
|
|
|
|
|
|||||||
| Other compensation paid in stock: |
||||||||||||
| Cost of revenue |
276 | 74 | — | |||||||||
| Technology and development |
1,205 | 706 | — | |||||||||
| Sales and marketing |
747 | 783 | — | |||||||||
| General and administrative |
1,232 | 961 | — | |||||||||
|
|
|
|
|
|
|
|||||||
| Total stock-based compensation expense and other compensation paid in stock |
44,933 | 22,973 | 2,570 | |||||||||
|
|
|
|
|
|
|
|||||||
| Restructuring costs |
82 | — | — | |||||||||
|
|
|
|
|
|
|
|||||||
| Total compensation paid in stock |
$ | 45,015 | $ | 22,973 | $ | 2,570 | ||||||
|
|
|
|
|
|
|
|||||||
We capitalized stock-based compensation of $3.1 million, $685,000 and $66,000 in product development costs during the years ended December 31, 2014, 2013, and 2012, respectively.
11. Net Loss per Share Attributable to Common Stockholders
The following table sets for the computation of our basic and diluted net loss per share attributable to common stockholders during the years ended December 31, 2014, 2013 and 2012 (in thousands, except share and per share data):
| Year Ended December 31, | ||||||||||||
| 2014 | 2013 | 2012 | ||||||||||
| Net loss attributable to common stockholders |
$ | (75,763 | ) | $ | (17,759 | ) | $ | (10,921 | ) | |||
|
|
|
|
|
|
|
|||||||
| Shares used in computing net loss per share attributable to common stockholders, basic and diluted |
37,335,200 | 33,129,572 | 12,538,769 | |||||||||
|
|
|
|
|
|
|
|||||||
| Net loss per share attributable to common stockholders, basic and diluted |
$ | (2.03 | ) | $ | (0.54 | ) | $ | (0.87 | ) | |||
|
|
|
|
|
|
|
|||||||
102
Table of Contents
The following outstanding shares of common stock equivalents were excluded from the computation of the diluted net loss per share attributable to common stockholders for the periods presented because including them would have been antidilutive:
| Year Ended December 31, | ||||||||||||
| 2014 | 2013 | 2012 | ||||||||||
| Stock options to purchase common stock |
2,219,689 | 3,088,449 | 3,570,566 | |||||||||
| Restricted stock units |
3,314,069 | 3,236,839 | 37,760 | |||||||||
| Stock appreciation rights |
16,659 | 127,544 | — | |||||||||
| Heldback shares in connection with Movity acquisition |
— | 30,524 | 30,524 | |||||||||
| Common stock warrants |
— | — | 56,054 | |||||||||
| Convertible senior notes |
6,400,969 | 6,400,969 | — | |||||||||
12. Market Leader Restructuring
In June 2014, as an ongoing effort to fully integrate Market Leader’s operations, we committed to a restructuring plan according to which we reduced headcount by 83 employees and incurred certain contract termination and other costs. We substantially completed these restructuring activities as of December 31, 2014.
A summary of total restructuring activities is shown in the table below (in thousands):
| One-time Termination Benefits |
Contract Termination Costs |
Other Associated Costs |
Total | |||||||||||||
| Restructuring costs |
$ | 598 | $ | 2,168 | $ | 877 | $ | 3,643 | ||||||||
| Cash payments |
(329 | ) | — | (649 | ) | (978 | ) | |||||||||
|
|
|
|
|
|
|
|
|
|||||||||
| Balance as of June 30, 2014 |
269 | 2,168 | 228 | 2,665 | ||||||||||||
|
|
|
|
|
|
|
|
|
|||||||||
| Restructuring costs |
565 | 614 | 45 | 1,224 | ||||||||||||
| Cash payments |
(591 | ) | (6 | ) | (192 | ) | (789 | ) | ||||||||
| Non-cash charges |
(82 | ) | — | — | (82 | ) | ||||||||||
| Change in estimate |
(25 | ) | — | (45 | ) | (70 | ) | |||||||||
|
|
|
|
|
|
|
|
|
|||||||||
| Balance as of September 30, 2014 |
136 | 2,776 | 36 | 2,948 | ||||||||||||
| Restructuring costs |
— | — | 257 | 257 | ||||||||||||
| Cash payments |
(41 | ) | (150 | ) | (90 | ) | (281 | ) | ||||||||
| Change in estimate |
— | — | (67 | ) | (67 | ) | ||||||||||
|
|
|
|
|
|
|
|
|
|||||||||
| Balance as of December 31, 2014 |
$ | 95 | $ | 2,626 | $ | 136 | $ | 2,857 | ||||||||
|
|
|
|
|
|
|
|
|
|||||||||
In the year ended December 31, 2014, we incurred $5.0 million in restructuring costs, most of which were general and administrative in nature. The restructuring accruals, which totaled $2.9 million at December 31, 2014, are recorded as part of the accrued liabilities in our consolidated balance sheet. This balance reflects estimated future cash outlays.
13. Self-Insurance
We are self-insured for a portion of our employees’ medical and dental coverage. The medical plan carries a stop-loss policy, which will protect from individual claims during the plan year exceeding $100,000 or when cumulative medical claims exceed 125% of expected claims for the plan year. We record estimates of the total costs of claims incurred as of the balance sheet date based on an analysis of historical data and independent estimates. Our liability for self-insured medical and dental claims is included in the accrued compensation and benefits balance in our consolidated balance sheets and was $707,000 and $225,000, as of December 31, 2014 and 2013, respectively.
103
Table of Contents
14. Income Taxes
We account for income taxes in accordance with authoritative guidance, which requires the use of the asset and liability method. Under this method, deferred income tax assets and liabilities are determined based upon the difference between the financial statement carrying amounts and the tax basis of assets and liabilities and are measured using the enacted tax rate expected to apply to taxable income in the years in which the differences are expected to be reversed.
As a result of the acquisition of Market Leader in August 2013, we recorded a tax benefit of $7.9 million as a discrete item in the third quarter of 2013. This tax benefit is a result of the partial release of our existing valuation allowance in conjunction with the acquisition since the acquired deferred tax liabilities from Market Leader will provide a source of income for us to realize a portion of its deferred tax assets, for which a valuation allowance is no longer needed.
The components of the provision for income taxes for the years ended December 31, 2014, 2013 and 2012 are as follows (in thousands):
| Year Ended December 31, | ||||||||||||
| 2014 | 2013 | 2012 | ||||||||||
| Current: |
||||||||||||
| State |
$ | 427 | $ | 412 | $ | 67 | ||||||
| Deferred: |
||||||||||||
| Federal |
— | (5,123 | ) | — | ||||||||
| State |
— | (2,800 | ) | — | ||||||||
|
|
|
|
|
|
|
|||||||
| TOTAL |
$ | 427 | $ | (7,511 | ) | $ | 67 | |||||
|
|
|
|
|
|
|
|||||||
A reconciliation of the statutory federal income tax rate of 35% and 34% for 2014 and 2013, respectively, to the actual tax rate for the years ended December 31 is as follows (in thousands):
| As of December 31, | ||||||||
| 2014 | 2013 | |||||||
| Tax at federal statutory rate |
$ | (26,430 | ) | $ | (8,592 | ) | ||
| Permanent items |
244 | 128 | ||||||
| State taxes |
(844 | ) | (499 | ) | ||||
| Net operating loss not benefitted |
21,110 | 8,004 | ||||||
| Acquisition related costs |
6,216 | 1,072 | ||||||
| Valuation allowance release |
— | (7,923 | ) | |||||
| Stock-based compensation |
131 | 299 | ||||||
|
|
|
|
|
|||||
| Income tax expense |
$ | 427 | $ | (7,511 | ) | |||
|
|
|
|
|
|||||
104
Table of Contents
Deferred income taxes reflect the net tax effect of temporary differences between the carrying amount of assets and liabilities for financial reporting purposes, and the amount used for income tax purposes. Our deferred tax assets and liabilities are detailed below (in thousands):
| As of December 31, | ||||||||
| 2014 | 2013 | |||||||
| Assets: |
||||||||
| Net operating loss carryforwards |
$ | 50,824 | $ | 40,828 | ||||
| Tax credit carryforwards |
8,371 | 5,210 | ||||||
| Accruals and reserves |
8,337 | 5,082 | ||||||
| Stock-based compensation |
10,891 | 9,034 | ||||||
| Other |
16 | 27 | ||||||
|
|
|
|
|
|||||
| Gross deferred tax assets |
78,439 | 60,181 | ||||||
| Valuation allowance |
(46,191 | ) | (20,995 | ) | ||||
|
|
|
|
|
|||||
| Total deferred tax assets |
32,248 | 39,186 | ||||||
|
|
|
|
|
|||||
| Liabilities: |
||||||||
| Deferred Revenue |
— | (58 | ) | |||||
| Prepaid expenses and other |
(1,097 | ) | (1,085 | ) | ||||
| Fixed assets and intangibles |
(31,151 | ) | (38,043 | ) | ||||
|
|
|
|
|
|||||
| Total deferred tax liabilities |
(32,248 | ) | (39,186 | ) | ||||
|
|
|
|
|
|||||
| Net deferred tax assets |
$ | — | $ | — | ||||
|
|
|
|
|
|||||
Total net deferred tax assets and liabilities are included in the Company’s consolidated balance sheets as follows:
| As of December 31, | ||||||||
| 2014 | 2013 | |||||||
| Current deferred tax assets |
$ | 1,206 | $ | 3,038 | ||||
| Non-current deferred tax assets |
— | 2,525 | ||||||
| Non-current deferred tax liabilities |
(1,206 | ) | (5,563 | ) | ||||
|
|
|
|
|
|||||
| Net deferred tax liabilities |
$ | — | $ | — | ||||
|
|
|
|
|
|||||
We have evaluated the available positive and negative evidence surrounding our ability to realize our deferred tax assets. In our evaluation, we determined that our recent and cumulative history of pre-tax book losses, as well as our expectation of pre-tax losses in the near future, presents overwhelming negative evidence of our ability to realize our deferred tax assets in excess of our deferred tax liabilities. Accordingly, we have established a full valuation allowance against our net deferred tax assets. Our valuation allowance was approximately $21.0 million at December 31, 2013 and was increased by approximately $25.2 million to approximately $46.2 million at December 31, 2014.
On December 19, 2014, the Tax Increase Prevention Act of 2014 was signed into law which retroactively extends most of the provisions that expired at the end of 2013 until the end of 2014. This change in tax law did not materially impact our tax provision as a result of the full valuation allowance recorded against our net deferred tax assets.
At December 31, 2014, we had approximately $192.2 million of federal net operating loss and $152.5 million of state net operating loss carryforwards available to reduce future taxable income, which will begin to expire in 2025 and 2015, respectively. Included in the above net operating loss carryforwards are $59.0 million and $45.7 million of federal and state net operating loss carryforwards, respectively, associated with a windfall tax benefit that will be recorded as additional paid in capital when realized.
105
Table of Contents
During the year ended December 31, 2013, we completed an analysis of certain research expenditures attributable to the legacy Trulia business to determine whether, and to what extent, federal and state research credits could be claimed and carried forward from inception through 2013. As a result of that analysis, we claimed research and development credits of approximately $2.9 million and $2.5 million, for federal and state purposes, respectively. These credits have been presented as an increase to deferred tax assets in the table above for the year ended December 31, 2013 but have also resulted in a corresponding increase to our valuation allowance. The claim therefore had no net impact to income tax expense.
At December 31, 2014, we had approximately $6.6 million of federal research credit and $5.7 million of state research credit carryforwards. In addition, we had approximately $1.3 million of state enterprise zone credits carryforwards. The federal credits will begin to expire in 2025 and the state credits can be carried forward indefinitely.
Utilization of the net operating loss and tax credit carryforwards are subject to annual use limitations due to certain ownership change rules provided by the Internal Revenue Code of 1986, as amended, and similar state provisions. However, we do not anticipate these limitations will significantly impact our ability to utilize our net operating losses and tax credit carryforwards.
A reconciliation of our unrecognized tax benefits, excluding accrued interest and penalties, for 2014, 2013 and 2012 is as follows (in thousands):
| As of December 31, | ||||||||||||
| 2014 | 2013 | 2012 | ||||||||||
| Balance at the beginning of the year |
$ | 2,336 | $ | 20 | $ | 475 | ||||||
| Increases (decreases) related to prior year tax positions |
1,253 | — | (475 | ) | ||||||||
| Current year increases |
3,113 | 2,316 | 20 | |||||||||
|
|
|
|
|
|
|
|||||||
| Balance at the end of the year |
$ | 6,702 | $ | 2,336 | $ | 20 | ||||||
|
|
|
|
|
|
|
|||||||
We recognize interest and penalties related to income tax matters as a component of income tax expense. As of December 31, 2014, there were no accrued interest and penalties related to uncertain tax positions. We do not have any tax positions that are expected to significantly increase or decrease within the next 12 months.
We file income tax returns in the U.S. federal and various state jurisdictions. Our tax years for 2011 and forward are subject to examination by the U.S. tax authorities, our tax years for 2010 and forward are subject to examination by various state tax authorities. However, due to the fact that we had net operating losses and credits carried forward in most jurisdictions, certain items attributable to technically closed years are still subject to adjustment by the relevant taxing authority through an adjustment to tax attributes carried forward to open years. In addition, to the extent we are deemed to have a sufficient connection to a particular taxing jurisdiction to enable that jurisdiction to tax us but we have not filed an income tax return in that jurisdiction for the year(s) at issue, the jurisdiction would typically be able to assert a tax liability for such years without limitation on the number of years it may examine.
15. Employee Benefit Plan
Effective April 1, 2014, we have a single defined contribution 401(k) retirement plan covering Trulia and Market Leader employees who have met certain eligibility requirements (“the Trulia 401(k) Plan”). Eligible employees may contribute pretax compensation up to a maximum amount allowable under the Internal Revenue Service limitations. Employee contributions and earnings thereon vest immediately.
106
Table of Contents
We currently match up to 4% of employee contributions under the Trulia 401(k) Plan. Our expense related to the Trulia 401(k) Plan was $2.9 million and $1.1 million for the years ended December 31, 2014 and 2013, respectively.
16. Subsequent Events
Zillow Merger
As previously announced, Trulia, Zillow and HoldCo entered into the Merger Agreement on July 28, 2014. Pursuant to the terms of the Merger Agreement, on February 17, 2015, (i) a wholly owned subsidiary of HoldCo (“Zillow Merger Sub”) was merged with and into Zillow, the separate corporate existence of Zillow Merger Sub thereupon ceased and Zillow continued as the surviving corporation (the “Zillow Merger”) and (ii) a separate wholly owned subsidiary of HoldCo (“Trulia Merger Sub”) merged with and into Trulia, the separate corporate existence of Trulia Merger Sub thereupon ceased and Trulia continued as the surviving corporation (the “Trulia Merger” and, together with the Zillow Merger, the “Mergers”). As a result of the Mergers, both Trulia and Zillow are now wholly owned subsidiaries of HoldCo.
Pursuant to the terms of the Merger Agreement, upon completion of the Mergers, (a) each share of Trulia Common Stock issued and outstanding immediately prior to the Trulia Merger (other than shares owned by Trulia as treasury stock and shares owned by Zillow or HoldCo or any direct or indirect wholly owned subsidiary of Zillow or Trulia) converted into the right to receive 0.444 of a share of fully paid and nonassessable HoldCo Class A Common Stock, (b) each share of Class A common stock, par value $0.0001 per share, of Zillow (the “Zillow Class A Common Stock”) issued and outstanding immediately prior to the Zillow Merger (other than shares owned by Zillow as treasury stock, shares owned by Trulia or HoldCo, or any direct or indirect wholly owned subsidiary of Zillow or Trulia) converted into the right to receive one fully paid and nonassessable share of HoldCo Class A Common Stock; and (c) each share of Class B common stock, par value $0.0001 per share, of Zillow (the “Zillow Class B Common Stock”) issued and outstanding immediately prior to the Zillow Merger (other than shares owned by Zillow as treasury stock, shares owned by Trulia or HoldCo, or any direct or indirect wholly owned subsidiary of Zillow or Trulia) converted into the right to receive one fully paid and nonassessable share of Class B common stock, par value $0.0001 per share, of HoldCo (the “HoldCo Class B Common Stock”). The HoldCo Class A Common Stock has one vote per share, and the HoldCo Class B Common Stock has ten votes per share, similar to the former capital structure of Zillow. As a result of the Mergers, Zillow’s founders, Richard Barton and Lloyd Frink, became the beneficial owners of more than a majority of the outstanding voting power of the shares of HoldCo Class A Common Stock and HoldCo Class B Common Stock.
In connection with the closing of the Mergers, we notified the New York Stock Exchange, or NYSE, that the Mergers had been completed, and requested that trading of our common stock on the NYSE be suspended after close of market on February 17, 2015 and that our common stock be delisted on the New York Stock Exchange and with the Securities and Exchange Commission. In addition, after we file this Annual Report on Form 10-K, we will request that the Securities and Exchange Commission terminate our reporting obligations under Sections 13 and 15(d) of the Exchange Act.
Pursuant to the terms of the Merger Agreement, all of the members of our Board of Directors, other than Peter Flint, Gregory Waldorf, and Erik Bardman, resigned as of the Merger effective time, including Theresia Gouw, Daniel Stephen Hafner, Sami Inkinen and Robert Moles. Messrs. Flint, Waldorf and Bardman are expected to resign immediately following the filing of this Annual Report on Form 10-K. In addition, the following executive officers of Trulia resigned their offices as of the Merger effective time: Daniele Farnedi, Chief Technology Officer and Scott Darling, Vice President, General Counsel and Corporate Secretary. Messrs. Aggarwal and Flint are expected to resign their offices as executive officers immediately following the filing of this Annual Report on Form 10-K.
Further, on February 17, 2015, in connection with the Mergers, we undertook a restructuring plan that will result in a total workforce reduction of approximately 342 employees, or approximately 32% of our workforce, at
107
Table of Contents
our Bellevue, Denver, New York and San Francisco locations, primarily in the sales and marketing functions. The restructuring plan is a result of the integration of our business and operations with and into Zillow’s business. Employees directly affected by the restructuring plan will be provided with severance payments, vesting acceleration, and outplacement assistance. We expect to complete the restructuring by the end of 2015.
As a result of the restructuring plan, we plan to record a one-time restructuring charge of between approximately $21.5 million and $24.5 million in 2015, primarily representing cash payments for severance and other personnel related expenses, and non-cash expenses related to stock vesting acceleration. Severance payments will be paid out by the end of 2015. The restructuring charge that we expect to incur in connection with the restructuring is subject to a number of assumptions, and actual results may materially differ. We may also incur other material charges not currently contemplated due to events that may occur as a result of, or associated with, the restructuring plan.
In addition, in connection with the closing of the Zillow Merger on February 17, 2015, the 2020 Notes were assumed by HoldCo and each outstanding 2020 Note which was convertible into shares of our common stock is now convertible into shares of HoldCo Class A Common Stock.
ListHub Litigation
On February 19, 2015, Move Sales Inc., the parent company of our largest for-sale listings data provider, ListHub, notified us that it plans to terminate our existing Platform Services Agreement on February 26, 2015 due to our acquisition by Zillow. On February 20, 2015, we filed a complaint and an application for a temporary restraining order in the Superior Court of the State of California, County of San Francisco against ListHub. The complaint and the application allege, among other things, breach of contract by ListHub in seeking to terminate the Agreement and seek injunctive relief to prevent termination of the Agreement and termination of the listings feeds ListHub provides to Trulia. On February 23, 2015, the Superior Court granted our application for a temporary restraining order and set March 12, 2015 as the date for a hearing on a preliminary injunction on the matter.
* * * * * *
108
Table of Contents
| Item 9. | Changes in and Disagreements with Accountants on Accounting and Financial Disclosure |
None.
| Item 9A. | Controls and Procedures |
Evaluation of Disclosure Controls and Procedures
Our management, with the participation of our Chief Executive Officer and our Chief Financial Officer, evaluated the effectiveness of our disclosure controls and procedures as of December 31, 2014. The term “disclosure controls and procedures,” as defined in Rules 13a-15(e) and 15d-15(e) under the Exchange Act, means controls and other procedures of a company that are designed to ensure that information required to be disclosed by a company in the reports that it files or submits under the Exchange Act is recorded, processed, summarized and reported, within the time periods specified in the SEC’s rules and forms. Disclosure controls and procedures include, without limitation, controls and procedures designed to ensure that information required to be disclosed by a company in the reports that it files or submits under the Exchange Act is accumulated and communicated to the company’s management, including its principal executive and principal financial officers, as appropriate to allow timely decisions regarding required disclosure. Management recognizes that any controls and procedures, no matter how well designed and operated, can provide only reasonable assurance of achieving their objectives and management necessarily applies its judgment in evaluating the cost-benefit relationship of possible controls and procedures. Based on the evaluation of our disclosure controls and procedures as of December 31, 2014, our Chief Executive Officer and Chief Financial Officer concluded that, as of such date, our disclosure controls and procedures were effective at the reasonable assurance level.
Management’s Annual Report on Internal Control Over Financial Reporting
Our management is responsible for establishing and maintaining adequate internal control over financial reporting as defined in Rule 13a-15(f) and Rule 15d-15(f) of the Exchange Act. Our internal control over financial reporting is a process to provide reasonable assurance regarding the reliability of financial reporting and the preparation of financial statements for external purposes in accordance with generally accepted accounting principles. Our internal control over financial reporting includes those policies and procedures that:
| (i) | pertain to the maintenance of records that, in reasonable detail, accurately and fairly reflect the transactions and dispositions of our assets; |
| (ii) | provide reasonable assurance that transactions are recorded as necessary to permit preparation of financial statements in accordance with generally accepted accounting principles, and that our receipts and expenditures are being made only in accordance with authorizations of our management and directors; and |
| (iii) | provide reasonable assurance regarding prevention or timely detection of unauthorized acquisition, use or disposition of our assets that could have a material effect on the financial statements. |
The effectiveness of any system of internal control over financial reporting, including ours, is subject to inherent limitations, including the exercise of judgment in designing, implementing, operating, and evaluating the controls and procedures, and the inability to eliminate misconduct completely. Accordingly, any system of internal control over financial reporting, including ours, no matter how well designed and operated, can only provide reasonable, not absolute, assurances. Also, projections of any evaluation of effectiveness to future periods are subject to the risk that controls may become inadequate because of changes in conditions or that the degree of compliance with the policies or procedures may deteriorate.
Management conducted an evaluation of the effectiveness of our internal control over financial reporting based on the framework in Internal Control—Integrated Framework (2013) issued by the Committee of Sponsoring Organizations of the Treadway Commission. Based on this evaluation, management concluded that Trulia’s internal control over financial reporting was effective as of December 31, 2014.
109
Table of Contents
Deloitte & Touche LLP, an independent registered public accounting firm, has audited the consolidated financial statements included in this Annual Report on Form 10-K, and, as part of the audit, has issued a report, included herein, on the effectiveness of Trulia’s internal control over financial reporting as of December 31, 2014.
110
Table of Contents
REPORT OF INDEPENDENT REGISTERED PUBLIC ACCOUNTING FIRM
To the Board of Directors and Stockholders of Trulia, Inc.
San Francisco, California
We have audited the internal control over financial reporting of Trulia, Inc. and subsidiaries (the “Company”) as of December 31, 2014, based on criteria established in Internal Control — Integrated Framework (2013) issued by the Committee of Sponsoring Organizations of the Treadway Commission. The Company’s management is responsible for maintaining effective internal control over financial reporting and for its assessment of the effectiveness of internal control over financial reporting, included in the accompanying Management’s Annual Report on Internal Control Over Financial Reporting. Our responsibility is to express an opinion on the Company’s internal control over financial reporting based on our audit.
We conducted our audit in accordance with the standards of the Public Company Accounting Oversight Board (United States). Those standards require that we plan and perform the audit to obtain reasonable assurance about whether effective internal control over financial reporting was maintained in all material respects. Our audit included obtaining an understanding of the internal control over financial reporting, assessing the risk that a material weakness exists, testing and evaluating the design and operating effectiveness of internal control based on the assessed risk, and performing such other procedures as we considered necessary in the circumstances. We believe that our audit provides a reasonable basis for our opinion.
A company’s internal control over financial reporting is a process designed by, or under the supervision of, the company’s principal executive and principal financial officers, or persons performing similar functions, and effected by the company’s board of directors, management, and other personnel to provide reasonable assurance regarding the reliability of financial reporting and the preparation of financial statements for external purposes in accordance with generally accepted accounting principles. A company’s internal control over financial reporting includes those policies and procedures that (1) pertain to the maintenance of records that, in reasonable detail, accurately and fairly reflect the transactions and dispositions of the assets of the company; (2) provide reasonable assurance that transactions are recorded as necessary to permit preparation of financial statements in accordance with generally accepted accounting principles, and that receipts and expenditures of the company are being made only in accordance with authorizations of management and directors of the company; and (3) provide reasonable assurance regarding prevention or timely detection of unauthorized acquisition, use, or disposition of the company’s assets that could have a material effect on the financial statements.
Because of the inherent limitations of internal control over financial reporting, including the possibility of collusion or improper management override of controls, material misstatements due to error or fraud may not be prevented or detected on a timely basis. Also, projections of any evaluation of the effectiveness of the internal control over financial reporting to future periods are subject to the risk that the controls may become inadequate because of changes in conditions, or that the degree of compliance with the policies or procedures may deteriorate.
In our opinion, the Company maintained, in all material respects, effective internal control over financial reporting as of December 31, 2014, based on the criteria established in Internal Control—Integrated Framework (2013) issued by the Committee of Sponsoring Organizations of the Treadway Commission.
We have also audited, in accordance with the standards of the Public Company Accounting Oversight Board (United States), the consolidated financial statements and financial statement schedule as of and for the year ended December 31, 2014 of the Company and our report dated February 27, 2015 expressed an unqualified opinion on those financial statements and financial statement schedule.
/s/ DELOITTE & TOUCHE LLP
San Jose, California
February 27, 2015
111
Table of Contents
Changes in Internal Control over Financial Reporting
There were no changes in our internal control over financial reporting identified in connection with the evaluation required by Rule 13a-15(d) and 15d-15(d) of the Exchange Act that occurred during the year ended December 31, 2014 that have materially affected, or are reasonably likely to materially affect, our internal control over financial reporting.
| Item 9B. | Other Information |
Not applicable.
112
Table of Contents
Part III
| Item 10. | Directors, Executive Officers and Corporate Governance |
The information included under this Item 10 is as of February 15, 2015. On February 17, 2015, and pursuant to the Merger Agreement we entered into with Zillow and Zillow Group, Inc., both we and Zillow become wholly-owned subsidiaries of Zillow Group, Inc., which transaction we refer to as the Zillow Merger. For additional information regarding certain corporate governance matters of Trulia following the Zillow Merger, please refer to the Current Report on Form 8-K filed by Trulia on February 17, 2015. For information regarding the directors, executive officers, and certain corporate governance matters of Zillow Group, Inc., please refer to the Current Reports on Form 8-K filed by Zillow Group, Inc. on February 17, 2015.
Executive Officers
The following table and accompanying disclosure provides information regarding our executive officers as of February 15, 2015 and prior to the effectiveness of the Zillow Merger on February 17, 2015. In connection with the closing of the Zillow Merger, Daniele Farnedi, Chief Technology Officer and Scott Darling, Vice President, General Counsel and Corporate Secretary resigned their offices on February 17, 2015. Furthermore, Messrs. Aggarwal and Flint are expected to resign their offices as executive officers immediately following the filing of this Annual Report on Form 10-K.
| Name |
Age | Position | ||||
| Peter Flint |
40 | Co-Founder, Chairman, and Chief Executive Officer | ||||
| Prashant “Sean” Aggarwal |
49 | Chief Financial Officer | ||||
| Paul Levine |
44 | Chief Operating Officer | ||||
| Daniele Farnedi* |
47 | Chief Technology Officer | ||||
| Scott Darling* |
42 | Vice President, General Counsel, and Corporate Secretary | ||||
| * | In connection with the closing of the Zillow Merger, on February 17, 2015, these executive officers resigned their offices. |
Peter Flint. Mr. Flint is our co-founder and has served as our Chief Executive Officer and as Chairman of our board of directors since our inception in June 2005. From July 1998 to June 2003, Mr. Flint served in a variety of executive roles at lastminute.com Ltd., a European online travel company that he helped launch, including Head of Interactive Marketing and Business Development. Mr. Flint holds a Master of Physics degree from the University of Oxford and a Master of Business Administration degree from Stanford University.
We believe that Mr. Flint is qualified to serve as a member of our board of directors because of the perspective and experience he brings as our Chief Executive Officer and one of our founders, his perspective as one of our significant stockholders, and his extensive background as an executive of companies in the Internet industry.
Prashant “Sean” Aggarwal. Mr. Aggarwal has served as our Chief Financial Officer since November 2011. Prior to joining us, Mr. Aggarwal served as Vice President of Finance and Chief Accounting Officer at PayPal, Inc., an online payments company, from June 2008 to October 2011. From March 2003 to May 2008, Mr. Aggarwal worked at eBay Inc. in various finance roles including as Vice President of Finance and Vice President of Financial Planning & Analysis. Prior to eBay, Mr. Aggarwal served as Director of Finance at Amazon.com, Inc. Mr. Aggarwal started his career in investment banking with Merrill Lynch, Pierce, Fenner & Smith Incorporated. Mr. Aggarwal holds a Bachelor of Arts degree from the College of Wooster and a Master of Management degree from Northwestern University’s Kellogg School of Management.
Paul Levine. Mr. Levine has served as our Chief Operating Officer since February 2011. Prior to joining us, Mr. Levine served as President of Digital at Current Media LLC, a broadcast media company, from February 2009 to February 2011. Prior to Current Media, Mr. Levine was Vice President of Marketing at AdBrite, Inc., an
113
Table of Contents
online advertising network, from August 2007 to October 2008. Prior to AdBrite, Mr. Levine served as Vice President and General Manager of Local at Yahoo! Inc., from April 2003 to July 2007. Mr. Levine has also held management positions at E*TRADE Financial Services Corporation. Mr. Levine earned his Bachelor of Arts degree from Amherst College and a Master of Business Administration degree from Stanford University.
Daniele Farnedi. Mr. Farnedi has served as our Chief Technology Officer since March 2013. Prior to serving as Chief Technology Officer, Mr. Farnedi served as our Vice President, Engineering since January 2007. Prior to joining us, Mr. Farnedi served as Director of Technology at Shopping.com, Inc., a price comparison company that was acquired by eBay, from October 2004 to January 2007. Prior to Shopping.com, Mr. Farnedi served as Director of Software Engineering at Looksmart, Ltd., from May 2000 to October 2004. Prior to Looksmart, Mr. Farnedi served as a Data Architect for Barclays Global Investors, a division of Barclays PLC, from April 1998 to May 2000, and as a Senior Software Engineer at Assyst GmbH, a leading computer-aided design software development company, from September 1995 to February 1998. Mr. Farnedi holds a Laurea degree in Electrical Engineering from the University of Bologna.
Scott Darling. Mr. Darling has served as our Vice President, General Counsel, and Corporate Secretary since October 2011. Prior to joining us, Mr. Darling served as Vice President, General Counsel, and Corporate Secretary at Imperva, Inc., from September 2010 until June 2011. Prior to Imperva, Mr. Darling served as Senior Attorney for Microsoft Corporation from May 2008 to September 2010 following the acquisition by Microsoft of Danger, Inc., a mobile software-as-a-service company. Mr. Darling served as Danger’s Vice President, General Counsel, and Corporate Secretary from November 2004 to April 2008, and as Senior Corporate Counsel from September 2002 to October 2004. Mr. Darling started his career as an attorney at the law firm of Gunderson Dettmer Stough Villeneuve Franklin & Hachigian, LLP. Mr. Darling holds a Bachelor of Arts degree from Yale University and a Juris Doctor degree from the University of Michigan.
Each executive officer serves at the discretion of our board of directors and holds office until his successor is duly elected and qualified or until his earlier resignation or removal. There are no family relationships among any of our directors or executive officers.
Board of Directors and Corporate Governance
General
The following table and accompanying disclosure provides information regarding our directors as of February 15, 2015 and prior to the effectiveness of the Zillow Merger on February 17, 2015. Pursuant to the terms of the Merger Agreement, all of the members of our Board of Directors, other than Peter Flint, Gregory Waldorf, and Erik Bardman, resigned on February 17, 2015, as of the Merger effective time, including Theresia Gouw, Daniel Stephen Hafner, Sami Inkinen and Robert Moles. Messrs. Flint, Waldorf and Bardman are expected to resign immediately following the filing of this Annual Report on Form 10-K.
| Directors |
Class | Age | Position |
Director Since |
Current Term Expires |
|||||||||||||
| Peter Flint |
I | 40 | Co-Founder, Chairman, and Chief Executive Officer | 2005 | 2016 | |||||||||||||
| Daniel Stephen Hafner (1)* |
I | 45 | Director | 2013 | 2016 | |||||||||||||
| Gregory Waldorf (1)(2)(3)(4)(5) |
I | 46 | Director | 2005 | 2016 | |||||||||||||
| Theresia Gouw (1)(2)(3)* |
II | 46 | Director | 2005 | 2014 | |||||||||||||
| Sami Inkinen* |
II | 39 | Director and Co-Founder | 2005 | 2014 | |||||||||||||
| Erik Bardman (3)(4)(5) |
III | 48 | Director | 2012 | 2015 | |||||||||||||
| Robert Moles (4)(5)* |
III | 60 | Director | 2006 | 2015 | |||||||||||||
| (1) | Member of the compensation committee |
| (2) | Member of the integration oversight committee |
| (3) | Member of the strategic transactions committee |
| (4) | Member of the audit committee |
114
Table of Contents
| (5) | Member of the nominating and corporate governance committee |
| * | In connection with the closing of the Zillow Merger, on February 17, 2015, these directors resigned from our board of directors. |
Our business affairs are managed under the direction of our board of directors, which is currently composed of seven members. Five of our directors are independent within the meaning of the listing rules of the New York Stock Exchange. Our board of directors is divided into three staggered classes of directors.
Each director’s term continues until the election and qualification of his or her successor, or his or her earlier death, resignation, or removal. Any increase or decrease in the number of directors will be distributed among the three classes so that, as nearly as possible, each class will consist of one-third of the directors. This classification of our board of directors may have the effect of delaying or preventing changes in control of our company.
Board of Directors
Erik Bardman. Mr. Bardman has served as a director since June 2012. From May 2013 until September 2014, Mr. Bardman served as the Chief Financial Officer of Roku, Inc. He served as the Chief Financial Officer and Senior Vice President Finance of Logitech International S.A. from October 2009 to April 2013. Prior to joining Logitech, Mr. Bardman served as Acting Chief Financial Officer of ZillionTV Corporation, a personalized television service, from March 2009 to September 2009. Prior to ZillionTV, Mr. Bardman served in a number of positions at eBay, Inc., over five and one half years, including Vice President and Chief Financial Officer of eBay Marketplaces from May 2005 to September 2008. Prior to eBay, Mr. Bardman served in a number of positions at General Electric Company, over the course of 15 years, including Vice President of Strategic Pricing at GE Global Consumer Finance from October 1999 to June 2003. Mr. Bardman holds a Bachelor of Arts degree from Dickinson College and is also a graduate of General Electric’s Financial Management Program.
We believe that Mr. Bardman is qualified to serve as a member of our board of directors because of his deep expertise in finance and his experience as an executive at several successful technology companies.
Peter Flint. Mr. Flint is our co-founder and has served as our Chief Executive Officer and as Chairman of our board of directors since our inception in June 2005. From July 1998 to June 2003, Mr. Flint served in a variety of executive roles at lastminute.com Ltd., a European online travel company that he helped launch, including Head of Interactive Marketing and Business Development. Mr. Flint holds a Master of Physics degree from the University of Oxford and a Master of Business Administration degree from Stanford University.
We believe that Mr. Flint is qualified to serve as a member of our board of directors because of the perspective and experience he brings as our Chief Executive Officer and one of our founders, his perspective as one of our significant stockholders, and his extensive background as an executive of companies in the Internet industry.
Theresia Gouw. Ms. Gouw has served as a director since December 2005. In 2014, Ms. Gouw co-founded Aspect Ventures, a venture capital firm that invests in companies leveraging data and interconnectivity to create breakthrough technologies, products and services for multi-platform, multi-device environments. From 1999 to 2014 Ms. Gouw was a general partner at Accel Partners, a venture capital firm, where she focused on software investments, with a specific interest in social commerce, vertical media, security, and consumer Internet/mobile applications. Ms. Gouw serves on the board of directors of Imperva, Inc., as well as on the boards of directors of several other software and technology companies. Ms. Gouw holds a Bachelor of Science degree from Brown University and a Master of Business Administration degree from Stanford University.
We believe that Ms. Gouw is qualified to serve as a member of our board of directors because of her experience in the software and technology industries as an investment professional and as an executive, and her experience as a director of other technology companies.
115
Table of Contents
Daniel Stephen Hafner. Mr. Hafner has served as a director since October 2013. He has served as the co-founder and CEO of KAYAK since January 2004. Prior to KAYAK, Mr. Hafner helped found Orbitz Inc., the online travel agency site. Previously, Mr. Hafner worked as a strategy consultant at the Boston Consulting Group. He received a Bachelor of Arts degree in economics from Dartmouth College in 1991 and a Master of Business Administration from the Kellogg School at Northwestern University in 1997.
We believe that Mr. Hafner is qualified to serve as a member of our board of directors because of his leadership experience in building a world-class team for a fast growth Internet company and extensive knowledge in e-commerce advertising and marketing.
Sami Inkinen. Mr. Inkinen is our co-founder, served as our President from February 2010 to March 2012, and has served as a director since our inception in 2005. Mr. Inkinen served as our Chief Financial Officer and Chief Operating Officer from our inception until his promotion to President in February 2010. From June 2000 to November 2002, Mr. Inkinen served as Co-Founder and Vice President, Business Development of Matchem Ltd., a wireless software company, of which he was a co-founder. Mr. Inkinen also was an associate consultant with McKinsey & Company, Inc. from January 2003 to August 2003. Mr. Inkinen holds a Master of Engineering degree from the Helsinki University of Technology and a Master of Business Administration degree from Stanford University.
We believe that Mr. Inkinen is qualified to serve as a member of our board of directors because of the perspective and experience he brings as one of our former executives and a founder.
Robert Moles. Mr. Moles has served as a director since June 2006. Mr. Moles has served as the Chairman of Intero Real Estate Services, Inc., a real estate brokerage company, since April 2004. Prior to joining Intero, Mr. Moles served as President and Chief Executive Officer of the Real Estate Franchise Group of Cendant Corporation from October 2001 to June 2004. Prior to Cendant, from March 1997 to October 2001, Mr. Moles served as President and Chief Executive Officer of Century 21 Real Estate LLC, a real estate franchise company. Mr. Moles serves on the board of directors for Heritage Bank of Commerce, Heritage Commerce Corporation, and Western Bancorp, Inc. He has served as an advisor to Santa Clara University and the University of San Diego. Mr. Moles holds a Bachelor of Science degree from Santa Clara University.
We believe that Mr. Moles is qualified to serve as a member of our board of directors because of his experience and expertise as an executive at several companies in the real estate industry and his experience as a director of other public companies.
Gregory Waldorf. Mr. Waldorf has served as a director since September 2005. Since April 2014, Mr. Waldorf has served as Chief Executive Officer of Invoice2go. Mr. Waldorf previously served as Chief Executive Officer of eHarmony, Inc., an online dating company, from April 2006 to January 2011. Mr. Waldorf has also served on the boards of directors of several private companies. Mr. Waldorf holds a Bachelor of Arts degree from the University of California, Los Angeles and a Master of Business Administration degree from Stanford University.
We believe that Mr. Waldorf is qualified to serve as a member of our board of directors because he brings strategic insights and operational leadership and experience as a former chief executive officer of a technology company, as well as because of the experience and perspective he has obtained in his roles as an investor in, advisor to, and board member of, numerous companies.
Leadership Structure
Mr. Flint currently serves as both Chairman of our board of directors and Chief Executive Officer. Our board of directors believes that the current board leadership structure, coupled with a strong emphasis on board independence, provides effective independent oversight of management while allowing the board and
116
Table of Contents
management to benefit from Mr. Flint’s leadership and years of experience as an executive in the technology industry. Serving on our board of directors and as Chief Executive Officer since June 2005, Mr. Flint is best positioned to identify strategic priorities, lead critical discussion and execute our strategy and business plans. Mr. Flint possesses detailed in-depth knowledge of the issues, opportunities, and challenges facing us. Independent directors and management sometimes have different perspectives and roles in strategy development. Our independent directors bring experience, oversight and expertise from outside of our company, while the Chief Executive Officer brings company specific experience and expertise. The board of directors believes that Mr. Flint’s combined role enables strong leadership, creates clear accountability, and enhances our ability to communicate our message and strategy clearly and consistently to stockholders.
Lead Independent Director
Our corporate governance guidelines provide that one of our independent directors should serve as a lead independent director at any time when the Chairman is not independent. Because our Chief Executive Officer, Mr. Flint, is our Chairman, our board of directors has appointed Mr. Waldorf to serve as our lead independent director. In addition, from time to time, our lead independent director, Mr. Waldorf, will preside over periodic meetings of our independent directors, serve as a liaison between our Chairman and the independent directors, and perform such additional duties as our board of directors may otherwise determine and delegate.
Board Meetings and Committees
During the year ended December 31, 2014, the board of directors held 13 meetings (including regularly scheduled and special meetings), and no director, except Sami Inkinen, attended fewer than 75% of the total number of meetings of the board of directors and the committees of which he or she was a member. A majority of our directors attended our 2014 Annual Meeting of Stockholders.
Although we do not have a formal policy regarding attendance by members of our board of directors at annual meetings of stockholders, we encourage, but do not require, our directors to attend.
As of February 15, 2015, our board of directors has an audit committee, a compensation committee, a nominating and corporate governance committee, an integration oversight committee, and a strategic transactions committee, each of which will have the composition and responsibilities described below. Members serve on these committees until their resignation or until otherwise determined by our board of directors. All of the directors on the board’s standing committees are independent, and each of these committees is led by a committee chair.
Audit Committee
Our audit committee currently consists of Messrs. Bardman and Waldorf, with Mr. Bardman serving as Chairman, and, prior to the closing of the Zillow Merger, Mr. Moles was also a member of our audit committee. The composition of our audit committee meets the requirements for independence under current New York Stock Exchange listing standards and SEC rules and regulations. Each member of our audit committee meets the financial literacy requirements of the New York Stock Exchange listing standards. In addition, our board of directors has determined that Mr. Bardman is an “audit committee financial expert” within the meaning of the rules and regulations of the SEC. The audit committee had six meetings in 2014. Our audit committee, among other things:
| • | selects a qualified firm to serve as the independent registered public accounting firm to audit our financial statements; |
| • | helps to ensure the independence and performance of the independent registered public accounting firm; |
117
Table of Contents
| • | discusses the scope and results of the audit with the independent registered public accounting firm, and reviews, with management and the independent registered public accounting firm, our interim and year-end operating results; |
| • | develops procedures for employees to submit concerns anonymously about questionable accounting or audit matters; |
| • | reviews our policies on risk assessment and risk management; |
| • | reviews related party transactions; |
| • | reviews and monitors compliance with our code of business conduct and ethics; |
| • | reviews actual and potential conflicts of interest of members of our board of directors and corporate officers, and approves or prohibits any involvement of such persons in matters that may involve a conflict of interest or the taking of a corporate opportunity; |
| • | obtains and reviews a report by the independent registered public accounting firm at least annually, that describes our internal control procedures, any material issues with such procedures, and any steps taken to deal with such issues; and |
| • | approves (or, as permitted, pre-approves) all audit and all permissible non-audit services, other than de minimis non-audit services, to be performed by the independent registered public accounting firm. |
Our audit committee operates under a written charter that was adopted by our board of directors and satisfies the applicable rules of the SEC and the listing standards of the New York Stock Exchange. A copy of the Audit Committee Charter is available on our website at ir.trulia.com.
Compensation Committee
Our compensation committee currently consists of Mr. Waldorf and Mr. Waldorf serves as Chairman, and, prior to the closing of the Zillow Merger, Ms. Gouw and Mr. Hafner were also members of our compensation committee. The composition of our compensation committee meets the requirements for independence under New York Stock Exchange listing standards and SEC rules and regulations. Each member of the compensation committee is also a non-employee director, as defined pursuant to Rule 16b-3 promulgated under the Exchange Act, and an outside director, as defined pursuant to Section 162(m) of the Internal Revenue Code. The compensation committee had six meetings in 2014. The purpose of our compensation committee is to discharge the responsibilities of our board of directors relating to compensation of our executive officers. Our compensation committee, among other things:
| • | reviews, approves, and determines, or makes recommendations to our board of directors regarding, the compensation of our executive officers; |
| • | administers our stock and equity incentive plans; and |
| • | reviews and approves and makes recommendations to our board of directors regarding incentive compensation and equity plans. |
Our compensation committee operates under a written charter that satisfies the applicable rules of the SEC and the listing standards of the New York Stock Exchange. A copy of the Compensation Committee Charter is available on our website at ir.trulia.com.
118
Table of Contents
Nominating and Corporate Governance Committee
Our nominating and corporate governance committee currently consists of Messrs. Bardman and Waldorf, with Mr. Waldorf serving as Chairman, and, prior to the closing of the Zillow Merger, Mr. Moles was also a member of our nominating and corporate governance committee. The composition of our nominating and corporate governance committee meets the requirements for independence under New York Stock Exchange listing standards and SEC rules and regulations. The nominating and corporate governance committee had two meetings in 2014. Our nominating and corporate governance committee, among other things:
| • | identifies, evaluates and selects, or makes recommendations to our board of directors regarding, nominees for election to our board of directors and its committees; |
| • | evaluates the performance of our board of directors and of individual directors; |
| • | considers and makes recommendations to our board of directors regarding the composition of our board of directors and its committees; |
| • | reviews developments in corporate governance practices; |
| • | evaluates the adequacy of our corporate governance practices and reporting; and |
| • | develops and makes recommendations to our board of directors regarding corporate governance guidelines and matters. |
The nominating and corporate governance committee operates under a written charter that satisfies the applicable listing requirements and rules of the New York Stock Exchange. A copy of the Nominating and Corporate Governance Committee Charter is available on our website at ir.trulia.com.
Integration Oversight Committee
Our integration oversight committee consisted of Ms. Gouw and Mr. Waldorf, with Mr. Waldorf serving as Chairman. The integration oversight committee had eight meeting in 2014. Our integration oversight committee, among other things, provided guidance to our management in its integration of the business (including customers, suppliers, and other business partners), personnel, and infrastructure of Market Leader with us and assisted our board of directors in its oversight of such integration. The integration oversight committee operated under a written charter. The integration oversight committee was disbanded in 2015.
Strategic Transactions Committee
Our strategic transactions committee currently consists of Messrs. Bardman and Waldorf, with Mr. Waldorf serving as Chairman, and, prior to the Zillow Merger, Ms. Gouw was also a member of the strategic transactions committee. The strategic transactions committee had ten meeting in 2014. Our strategic transactions committee, among other things, evaluates, negotiates, and makes recommendations to our board of directors regarding strategic transactions involving us, including, without limitation, (i) business combination transactions, (ii) an acquisition or sale of us, (iii) recapitalizations, restructurings or other similar transactions, (iv) sales, divestitures and other dispositions of businesses or assets, (v) financing transactions by and involving us, including equity and debt securities offerings, debt financings, secured transactions, and other financing arrangements, and (vi) any other strategic transactions involving us. The strategic transactions committee operates under a written charter.
Compensation Committee Interlocks and Insider Participation
As of February 15, 2015, none of our executive officers currently serves, or in the past year has served, as a member of the board of directors or compensation committee of any entity that has one or more executive officers serving on our board of directors or compensation committee.
119
Table of Contents
Communications with the Board of Directors
Any stockholders or any other interested party wishing to communicate with the entire board of directors, the non-management directors as a group, or with any individual member of the board of directors may do so by writing to the board of directors or to the particular member of the board of directors, and mailing the correspondence to our General Counsel at Trulia, Inc., 535 Mission Street, Suite 700, San Francisco, California, 94105, Attn: Legal Department. Our General Counsel or Legal Department will review all incoming stockholder or other interested party communications and, if appropriate, such communications will be forwarded to the appropriate member or members of the board of directors, or if none is specified, to the Chairman of the board of directors.
Corporate Governance Guidelines and Code of Ethics
Our board of directors has adopted Corporate Governance Guidelines. These guidelines address items such as the qualifications and responsibilities of our directors and director candidates and corporate governance policies and standards applicable to us in general. The full text of our Corporate Governance Guidelines in effect as of February 15, 2015 is posted on the Investor Relations portion of our website at ir.trulia.com.
The board of directors of Zillow Group, Inc. has adopted a Code of Ethics that applies to the company’s chief executive officer, chief financial officer, principal accounting officer, and controller and persons performing similar functions. The Zillow Group, Inc. Code of Ethics became applicable to Trulia as of February 17, 2015 and is available at http://investors.zillowgroup.com/corporate-governance.cfm. Zillow Group, Inc. intends to satisfy the disclosure requirements under Item 5.05 of Form 8-K regarding an amendment to, or waiver from, a provision of the Code of Ethics by posting such information on its website at the address specified above.
Risk Management
Risk is inherent with every business, and we face a number of risks, including strategic, financial, business and operational, legal and compliance, and reputational. We have designed and implemented processes to manage risk in our operations. Management is responsible for the day-to-day management of risks the company faces, while our board of directors, as a whole and assisted by its committees, has responsibility for the oversight of risk management. In its risk oversight role, our board has the responsibility to satisfy itself that the risk management processes designed and implemented by management are appropriate and functioning as designed.
Our board of directors believes that open communication between management and the board of directors is essential for effective risk management and oversight. Our board meets with our Chief Executive Officer and other members of the senior management team at quarterly board meetings, where, among other topics, they discuss strategy and risks facing the company.
While our board of directors is ultimately responsible for risk oversight, our board committees assist the board of directors in fulfilling its oversight responsibilities in certain areas of risk. The audit committee assists our board of directors in fulfilling its oversight responsibilities with respect to risk management in the areas of internal control over financial reporting and disclosure controls and procedures, legal and regulatory compliance, and discusses with management and the independent auditor guidelines and policies with respect to risk assessment and risk management. The audit committee also reviews management’s assessment of the key risks facing us, including the key controls it relies on to mitigate those risks. The audit committee also monitors certain key risks at each of its regularly scheduled meetings, such as risk associated with internal control over financial reporting and liquidity risk. The nominating and corporate governance committee assists our board in fulfilling its oversight responsibilities with respect to the management of risk associated with board organization, membership and structure, and corporate governance. The compensation committee assesses risks created by the incentives inherent in our compensation policies. Finally, the full board of directors reviews strategic and
120
Table of Contents
operational risk in the context of reports from the management team, receives reports on all significant committee activities at each regular meeting, and evaluates the risks inherent in significant transactions.
Non-Employee Director Compensation
The following table provides information concerning the compensation paid by us to each of our non-employee directors in the year ended December 31, 2014. Mr. Flint does not receive any additional compensation for his service as a director. For all of our non-employee directors, we offer to reimburse any travel expenses or other related expenses for attending meetings.
| Name (1)(2) |
Fees Earned or Paid in Cash |
Stock Awards (3) |
Option Awards |
Non-Equity Incentive Plan Compensation |
Change in Pension Value and Nonqualified Deferred Compensation Earnings |
All Other Compensation |
Total | |||||||||||||||||||||
| Current non-employee directors: |
||||||||||||||||||||||||||||
| Erik Bardman |
$ | 19,500 | $ | 199,976 | — | — | — | — | $ | 219,476 | ||||||||||||||||||
| Theresia Gouw |
5,000 | 99,969 | — | — | — | — | 104,969 | |||||||||||||||||||||
| Daniel Stephen Hafner |
5,000 | 99,969 | — | — | — | — | 104,969 | |||||||||||||||||||||
| Sami Inkinen |
0 | 99,969 | — | — | — | — | 99,969 | |||||||||||||||||||||
| Robert Moles |
13,500 | 99,969 | — | — | — | — | 113,469 | |||||||||||||||||||||
| Gregory Waldorf |
27,000 | 199,976 | — | — | — | — | 226,976 | |||||||||||||||||||||
| (1) | In fiscal 2014, each of our non-employee directors (other than Mr. Bardman and Mr. Waldorf) received, on June 3, 2014, a restricted stock unit award of 2,628 shares, with a grant date fair value of $99,969. Mr. Bardman and Mr. Waldorf each received, on June 3, 2014, a restricted stock unit award of 5,257 shares, with a grant date fair value of $199,976. |
| (2) | As of December 31, 2014, the aggregate number of shares underlying stock awards and outstanding option awards for each of our non-employee directors was: |
| Name |
Outstanding Stock Awards |
Outstanding Option Awards |
||||||
| Erik Bardman |
5,257 | 18,375 | ||||||
| Theresia Gouw |
2,628 | 10,500 | ||||||
| Daniel Stephen Hafner |
5,182 | — | ||||||
| Sami Inkinen |
2,628 | 10,500 | ||||||
| Robert Moles |
2,628 | 63,175 | ||||||
| Gregory Waldorf |
5,257 | — | ||||||
| (3) | Reflects the aggregate grant date fair value computed in accordance with Financial Accounting Standards Board’s (“FASB”) Accounting Standards Codification (“ASC”) Topic 718, Stock Compensation. The assumptions used in the valuation of these awards are set forth in the notes to our consolidated financial statements, which are included in this Annual Report on Form 10-K for the year ended December 31, 2014. These amounts do not necessarily correspond to the actual value that may be recognized by the director. |
Outside Director Compensation Policy
On October 30, 2012, our board of directors adopted the Outside Director Compensation Policy to formalize our practices regarding cash and equity compensation to non-employee directors.
121
Table of Contents
Cash Compensation
Under the Outside Director Compensation Policy, non-employee directors will receive annual cash retainers for service in the following positions:
| Position |
Annual Cash Retainer |
|||
| Audit committee chair |
$ | 16,000 | ||
| Audit committee member other than chair |
10,000 | |||
| Compensation committee chair |
10,000 | |||
| Compensation committee member other than chair |
5,000 | |||
| Nominating and corporate governance committee chair |
7,000 | |||
| Nominating and corporate governance committee member other than chair |
3,500 | |||
Equity Compensation
Non-employee directors are eligible to receive all types of equity awards (except incentive stock options) under the 2012 Equity Incentive Plan, or the 2012 Plan, including discretionary awards not covered under the Outside Director Compensation Policy. All awards under the Outside Director Compensation Policy will be automatic and non-discretionary.
The Outside Director Compensation Policy provides that on the date of each annual meeting of stockholders following our IPO, each non-employee director will be granted an annual award of restricted stock units under the 2012 Plan having a value equal to $100,000. In addition, the lead independent director and the audit committee chair will each receive an additional annual award having a value equal to $100,000 at each annual meeting. Each annual award will fully vest on the earlier to occur of: (i) the next annual meeting following the date of grant or (ii) the anniversary of the grant date, in each case, subject to continued service as a director through the vesting date. For purposes of the Outside Director Compensation Policy, value means the per share fair market value of our common stock on a given date, multiplied by the shares subject to the annual award.
Notwithstanding the vesting schedule described above, the vesting of all equity awards granted to a non-employee director, including any award granted outside of the Outside Director Compensation Policy, will vest in full upon a “change in control” (as defined in the 2012 Plan).
Section 16(A) Beneficial Ownership Reporting Compliance
Section 16(a) of the Securities Exchange Act of 1934, as amended, requires that our executive officers and directors, and persons who own more than 10% of our common stock, file reports of ownership and changes of ownership with the SEC. Such directors, executive officers, and 10% stockholders are required by SEC regulation to furnish us with copies of all Section 16(a) forms they file.
SEC regulations require us to identify in this Annual Report on Form 10-K anyone who filed a required report late during the most recent year. Based on our review of forms we received, or written representations from reporting persons stating that they were not required to file these forms, we believe that during 2014, all Section 16(a) filing requirements were satisfied on a timely basis, except that one form to report a sale of long shares for Mr. Levine and one form to report the vesting of certain restricted stock units for Mr. Morris were filed late because of an inadvertent administrative error. Such late filings did not result in any liability under Section 16(b) of the Securities Exchange Act of 1934, as amended.
Codes of Ethics
The board of directors of Zillow Group, Inc. has adopted a Code of Ethics that applies to the company’s chief executive officer, chief financial officer, principal accounting officer, and controller and persons
122
Table of Contents
performing similar functions. The Zillow Group, Inc. Code of Ethics became applicable to Trulia as of February 17, 2015 and is available at http://investors.zillowgroup.com/corporate-governance.cfm. Zillow Group, Inc. intends to satisfy the disclosure requirements under Item 5.05 of Form 8-K regarding an amendment to, or waiver from, a provision of the Code of Ethics by posting such information on its website at the address specified above.
| Item 11. | Executive Compensation |
Compensation Discussion and Analysis
The compensation provided to our named executive officers for 2014 is detailed in the 2014 Summary Compensation Table and accompanying footnotes and narrative. This section explains our executive compensation philosophy and objectives, our compensation-setting process, and the elements of our compensation program for 2014.
Our named executive officers in 2014 were:
| • | Peter Flint, our Chief Executive Officer, or CEO, and co-founder; |
| • | Prashant “Sean” Aggarwal, our Chief Financial Officer, or CFO; |
| • | Paul Levine, our Chief Operating Officer, or COO; |
| • | Daniele Farnedi, our Chief Technology Officer, or CTO; |
| • | Scott Darling, our Vice President, General Counsel and Corporate Secretary; and |
| • | Ian Morris, our former President of Market Leader and current consultant. |
Mr. Morris’s service as an executive officer ended as of July 2014. Mr. Morris continues to serve us as a consultant. See the summary description of the transition letter for Mr. Morris in the section titled “Executive Confirmatory Employment Letters, Offer Letter Agreements and Transition Letter.”
Executive Compensation Philosophy and Objectives
Our executive compensation philosophy is to provide a compensation program that attracts and retains our executive officers, including our named executive officers, and motivates them to pursue our corporate objectives while encouraging the creation of long-term value for our stockholders. We strive to provide compensation packages to our executive officers that are competitive, reward achievement of our business objectives, and align executive and stockholder interests through equity ownership.
Our executive compensation program is designed to achieve the following principal objectives:
| • | attract, motivate and retain qualified executives to support growth expectations; |
| • | provide total direct compensation, consisting of salary and short-term and long-term incentive awards, that are competitive with the market while remaining internally equitable and fair; |
| • | ensure our executive compensation program and actual payouts are aligned with financial performance and strategic business goals; |
| • | ensure a substantial portion of each executive’s total compensation is at-risk and varies based on company and individual performance; and |
| • | align the executive compensation program with both short-term and long-term stockholder interests. |
Compensation-Setting Process
Role of the Board of Directors and Compensation Committee
The initial compensation arrangements with our executive officers, including the named executive officers, were determined in negotiations with each individual executive when he joined us. Historically, our board of directors or our CEO has been responsible for negotiating these arrangements.
123
Table of Contents
In February 2012, we established a compensation committee of our board of directors that oversees our executive compensation program and approves the compensation of our CEO and our executive officers. Our compensation committee determined the base salary, incentive compensation opportunity, and the equity awards provided to our named executive officers for the 2014 performance period. See the summary description of our compensation committee’s composition and charter in the section titled “Board of Directors and Corporate Governance—Board Meetings and Committees—Compensation Committee.”
Role of Senior Management
Our CEO makes recommendations to our compensation committee with respect to our other named executive officers. Our CEO reviewed the performance of the other named executive officers and consulted with our compensation committee on a formal and an informal basis on his conclusions and recommendations as to their compensation, including base salary adjustments and cash bonus payouts. Our CEO advised our compensation committee on recommended equity awards to the other named executive officers, and those recommendations were subject to formal approval by our compensation committee.
Role of Compensation Consultant
Our compensation committee is authorized to retain the services of one or more executive compensation advisors in connection with the establishment of our compensation programs and related policies.
In 2014, our compensation committee continued to retain Compensia, a national compensation consulting firm. Compensia provided a competitive assessment of our 2014 executive compensation program and provided a framework and peer group for 2014 executive compensation decisions. Also, our compensation committee requested that Compensia assist management with certain retention projects related to our transaction with Zillow.
In the context of our annual executive compensation review, with assistance from Compensia and input from our CEO and compensation committee, our compensation committee approved a peer group of publicly-traded companies, which met some or all of the following criteria: (i) operated in internet software and services industries; (ii) annual revenues approximately between $70 million and $270 million; (iii) revenue growth greater than 30%; (iv) a market capitalization between approximately $500 million to $4.5 billion and (v) a market capitalization as a multiple of annual revenue that was greater than ten. The following publicly-traded companies made up our compensation peer group for 2014 compensatory decisions: Bazaarvoice, Benefitfocus, Cvent, Demandware, eHealth, Ellie Mae, Jive Software, LivePerson, LogMeIn, Marketo, Move, OpenTable, PROS Holdings, SPS Commerce, Tangoe, Yelp and Zillow.
With respect to 2014 compensatory decisions, our compensation committee used the peer group for a general understanding of market compensation practices and our positioning within the peer group with respect to each element of our compensation program, but our compensation committee did not specifically benchmark certain targets in the peer group for 2014 executive compensation decisions.
With respect to our compensation consultants, in 2014, the compensation committee considered the factors specified in the SEC rules and the listing standards of the NYSE and determined that the work performed by Compensia did not give rise to any conflict of interest.
Say on Pay
At our Annual Meeting of Stockholders held on June 5, 2013, we held our initial stockholder advisory vote on the compensation of our named executive officers, commonly referred to as a say-on-pay vote. Our stockholders approved our 2012 named executive officer compensation with over 99% of the shares voted in favor of this proposal. We believe that the outcome of our say-on-pay vote signals our stockholders’ support of
124
Table of Contents
our compensation approach. However, even though stockholders demonstrated overwhelming support for our compensation approach in 2013, the compensation committee annually reevaluates our compensation practices to determine how they might be improved.
At our annual meeting of stockholders held on June 5, 2013, we held a stockholder advisory vote on the frequency of the say-on-pay vote. Our stockholders indicated their preference for a triennial say-on-pay vote. Our board of directors has determined to hold say on pay votes on a triennial basis.
Elements of Executive Compensation
Our executive compensation program consists of both cash and equity components. Beginning in 2013, we introduced restricted stock units as a form of equity compensation to our named executive officers. We also introduced performance-based restricted stock units to our named executive officers to emphasize a pay-for-performance approach. We believe that equity awards offer our named executive officers a valuable long-term incentive that aligns their interests with the interests of our stockholders.
We also offer cash compensation to our named executive officers in the form of a base salary and an annual cash incentive award opportunity at levels that we believe are competitive for our stage of development and industry. Our annual cash incentive award opportunities generally focus on the achievement of specific near-term financial and strategic objectives and individual key performance objectives that will further our longer-term growth objectives. In addition, in order to attract and induce potential executive officers to leave their existing employment, we occasionally provide for a sign-on bonus. In the case of the recruitment of our CFO, we also offered certain relocation benefits. In 2014, we provided for a retention bonus to Mr. Darling, as described below.
Base Salaries
Base salaries provide our named executive officers with a fixed amount of consistent compensation and are an important motivating factor in attracting and retaining these individuals. We do not apply specific formulas to determine adjustments to base salary. In 2014, our compensation committee was responsible for reviewing and approving base salaries for our named executive officers. For our CEO, our compensation committee considered the scope of our CEO’s performance, individual contributions, responsibilities, experience, and prior base salary level. For our other named executive officers, our CEO reviewed and recommended adjustments of base salary to our compensation committee, taking into consideration the scope of the named executive officer’s performance, individual contributions, responsibilities, experience, prior base salary level, and peer group market data. With respect to Mr. Morris, his service as an executive officer ended as of July 2014. Mr. Morris continues to serve us as a consultant. See the summary description of the transition letter for Mr. Morris in the section titled “Executive Confirmatory Employment Letters, Offer Letter Agreements and Transition Letter.”
In February 2014, our compensation committee approved base salary increases for our current named executive officers as set forth below. In making these adjustments, our compensation committee considered the subjective factors described above, the peer group analysis performed by Compensia, as well as the contributions expected from, and responsibilities of, each named executive officer as we continue to grow.
| Named Executive Officer |
Base Salary at End of 2013 |
Base Salary at End of 2014 |
Percent Increase in 2014 |
|||||||||
| Peter Flint |
$ | 350,000 | $ | 400,000 | % 14 | |||||||
| Prashant Aggarwal |
300,000 | 315,000 | 5 | |||||||||
| Paul Levine |
300,000 | 315,000 | 5 | |||||||||
| Daniele Farnedi |
260,000 | 270,000 | 4 | |||||||||
| Scott Darling |
260,000 | 270,000 | 4 | |||||||||
125
Table of Contents
Annual Incentive Compensation
In establishing our annual incentive compensation plan, our objective is to provide cash awards linked to company and individual performance, remain competitive in the marketplace and drive performance toward company goals. Corporate goals focus on overarching objectives for the organization, while individual objectives represent key performance expectations at the departmental or individual level. In setting these objectives, we identify the financial and operational results required to successfully grow the business, while also recognizing that internal and external factors may hinder this progress. As such, these objectives are intended to be challenging to achieve but within reach. Our annual incentive compensation plan for named executive officers is a component of the SMT Bonus Plan, which is summarized and described in the section titled “—Employee Benefit and Stock Plans” below.
2014 SMT Bonus Plan
Our named executive officers (other than Mr. Morris) participate in a 2014 component of the SMT Bonus Plan, or the 2014 SMT Bonus Plan. The 2014 SMT Bonus Plan was further segregated into two sub-components for named executive officer participants: (i) a sub-component for general and administrative named executive officers considering the entire Trulia business (including Market Leader) (“G&A 2014 Bonus Plan”); and (ii) a sub-component for our COO and CTO that partly considers the legacy Trulia standalone business (the “Standalone 2014 Bonus Plan”). The rationale for separate sub-components was to allow us to differentiate incentives through goals that the named executive officer directly impacts.
For 2014, our compensation committee determined that the appropriate performance period would be annual because our compensation committee believed a full annual period reflected the best means for evaluating and rewarding performance. Our compensation committee selected revenue and (adjusted) EBITDA as the corporate performance goals because these represented key objectives for us in 2014. For the G&A 2014 Bonus Plan, the revenue goal was specifically GAAP revenue of the entire Trulia business, as reflected in our quarterly and annual financial statements. For the Standalone 2014 Bonus Plan, the revenue goal was the revenue of the legacy Trulia business, which is GAAP revenue of the entire Trulia business, as reflected in our quarterly and annual financial statements adjusted to exclude revenue from the Market Leader business. We defined (adjusted) EBITDA as net loss adjusted to exclude interest income, interest expense, loss on extinguishment of debt, income taxes, depreciation and amortization, compensation paid in stock, and certain other infrequently occurring items that we do not believe are indicative of ongoing results (such as acquisition or restructuring related costs). The determination of (adjusted) EBITDA is made without considering the effect of payments under the 2014 SMT Bonus Plan. Consistent with our incentive compensation philosophy, our compensation committee set targets for these key objectives to be challenging but reachable with exemplary corporate performance.
Each corporate performance goal includes a threshold level of achievement (with payout at 50% for the applicable goal), a target level of achievement (with payout at 100% for the applicable goal), a high level of achievement (with payout of 150% for the applicable goal), and a maximum level of achievement (with payout at 200% for the applicable goal). If achievement is between two performance target levels, the bonus payout is prorated on a linear basis based on revenue achievement.
Our compensation committee determined the relative weighting between corporate and individual performance based on the role of the executive officer within the company. The percentage breakdown between corporate goals and individual goals was (i) 90% corporate / 10% individual for our CEO, CFO and COO; and (ii) 70% corporate / 30% individual for our CTO and General Counsel. The higher corporate weighting for our CEO, CFO and COO reflects that these named executive officers have a greater direct impact on corporate level achievement.
Our CEO reviews the individual objectives for, and achievements of, the named executive officers (other than himself) because he is best suited to evaluate his direct reports and then makes recommendations to our
126
Table of Contents
compensation committee for final approval. Our compensation committee reviews the individual objectives for, and achievements of, our CEO.
For 2014, corporate and individual achievement were each capped at 200% because our compensation committee wanted to continue incentivizing our named executive officers to exceed the performance goals, while maintaining cost certainty with respect to incentive compensation. In addition to the annual bonus plan, our compensation committee approved a discretionary overachievement pool of potentially $500,000 or $1,000,000 if we exceeded both of our 2014 corporate goals beyond a certain level. Individual allocations under this discretionary overachievement pool to any eligible employee in our 2014 Bonus Plan would be recommended by our CEO, subject to approval by our compensation committee.
Payments under our 2014 SMT Bonus Plan may be made in cash or cash equivalents at the discretion of our compensation committee.
Incentive Targets under the 2014 SMT Bonus Plan
For 2014, our annual cash incentive award opportunities were designed to reward our named executive officers based on our performance and the individual named executive officer’s contribution to that performance. The target award opportunity for our CEO was established by our compensation committee. The 2014 target award opportunities were as follows:
| Named Executive Officer |
2014 Target Bonus |
Percent Increase in 2014 |
||||||
| Peter Flint |
$ | 300,000 | % 50 | |||||
| Prashant Aggarwal |
173,250 | 73 | ||||||
| Paul Levine |
173,250 | 73 | ||||||
| Daniele Farnedi |
121,500 | 143 | ||||||
| Scott Darling |
121,500 | 143 | ||||||
In determining the 2014 target bonus opportunities, our compensation committee considered the Compensia peer group data which showed that the then-existing total target cash compensation for each named executive officer (other than Mr. Morris) was at or below the 25th percentile of the peer group largely due to target bonus compensation as a percentage of base salary being below the 50th percentile of the peer group.
Incentive Payments under the 2014 SMT Bonus Plan
For 2014, we achieved $252 million of revenue, and $188 million of revenue for the Trulia standalone business and 12% (adjusted) EBITDA percentage (determined prior to payment of bonuses). The applicable target levels of achievement for each respective component of the 2014 SMT Bonus Plan were as follows:
| Plan |
Revenue Target | aEBITDA Target | Corporate Performance % | |||||||||
| G&A 2014 Bonus Plan |
||||||||||||
| Minimum |
$ | 247,000,000 | 9 | % | 50 | % | ||||||
| Target |
$ | 260,000,000 | 11 | % | 100 | % | ||||||
| High |
$ | 273,000,000 | 13 | % | 150 | % | ||||||
| Max |
$ | 286,000,000 | 15 | % | 200 | % | ||||||
| Standalone 2014 Bonus Plan |
||||||||||||
| Minimum |
$ | 165,000,000 | 9 | % | 50 | % | ||||||
| Target |
$ | 178,000,000 | 11 | % | 100 | % | ||||||
| High |
$ | 191,000,000 | 13 | % | 150 | % | ||||||
| Max |
$ | 204,000,000 | 15 | % | 200 | % | ||||||
127
Table of Contents
Consequently in accordance with the 2014 SMT Bonus Plan, we paid our named executive officers in the G&A 2014 Bonus Plan 69% of their target awards for the corporate performance portion of their award and we paid our named executive officers in the Standalone 2014 Bonus Plan 140% of their target award for the corporate performance portion of their award.
With respect to individual performance, the compensation committee paid out the individual performance portion as follows: (i) CEO, CFO, COO and General Counsel: 150%; and (ii) CTO: 100%.
In accordance with applicable corporate and individual achievement levels, our compensation committee determined payouts as follows:
| Named Executive Officer |
Actual Award Payment |
|||
| Peter Flint |
$ | 186,300 | ||
| Prashant Aggarwal |
107,588 | |||
| Paul Levine |
244,283 | |||
| Daniele Farnedi |
155,520 | |||
| Scott Darling |
113,359 | |||
With respect to the form of payment, our compensation committee exercised its discretion to payout the 2014 SMT Bonus Plan amounts in the form of fully vested restricted stock units. The cash value of the actual award payment will be divided by the closing price of a single share of our common stock (fractional shares shall be rounded down) on the earlier to occur of, (i) the end of the first full trading day following the date of the filing of our financial results for the fiscal quarter ended December 31, 2014 on Form 8-K with the Securities and Exchange Commission (the “SEC”), (ii) end of the first full trading day following the date of filing of our Annual Report on Form 10-K for fiscal year ended December 31, 2014 with the SEC, or (iii) the close of business on the third business days prior to the proposed “Effective Date” of the acquisition of the Company by Zillow as such term is defined in that certain Agreement and Plan of Merger dated July 28, 2014, between the Company, Zillow, and Zillow Group, Inc. (f/k/a Zebra HoldCo, Inc).
Retention Bonus
In addition, to the incentive opportunity under our 2014 SMT Bonus Plan, we provided Mr. Darling with an ability to earn a retention bonus of $225,000 in connection with our proposed acquisition by Zillow. The retention bonus was provided to help ensure that Mr. Darling remains with us through the closing of the transaction with Zillow. The retention bonus is payable in cash on the earlier to occur of: (i) the closing of the Zillow transaction; or (ii) January 28, 2016, in each case, subject to continued employment with us on the payment date.
Equity-Based Incentive Compensation
We use stock options to attract, motivate, and incentivize the executive talent necessary to accomplish our business objectives while also providing a significant long-term interest in our success by rewarding the creation of stockholder value. Vesting for stock options is based on continued employment with us, generally over four years, thereby also encouraging the retention of our executive officers. Also following our IPO, we started granting restricted stock units to provide for certain equity incentives regardless of fluctuations in our stock price. In 2013, we introduced restricted stock units with performance-based vesting as part of our pay-for-performance equity strategy. The performance goals of our 2013 pay-for-performance equity strategy were achieved in 2014, resulting in significant stockholder value creation and significant ability for our named executive officers to be compensated commensurately.
Historically, we have not applied a formula to determine the size of individual stock options granted to our named executive officers. Instead, our board of directors or our compensation committee has generally
128
Table of Contents
determined the size of individual grants using its collective business judgment and experience, taking into account, among other factors, the role and responsibility of the individual executive officer, the competitive market for the executive officer’s position and the size, value, and vesting status of existing equity awards. Based upon these factors, our board of directors or our compensation committee sets the size of each equity award at a level it considers appropriate to create a meaningful incentive.
2014 Equity Awards
At the beginning of each year, our compensation committee generally conducts an annual focal review and considers each named executive officer’s relative vesting of existing awards, the intrinsic value of unvested equity holdings, peer group data provided by Compensia, performance for the previous year, and anticipated future contributions to the company.
At the time it approved the performance-based equity awards granted in 2013, our compensation committee did not intend to make focal grants to any of our named executive officers in 2014. However, our compensation committee decided to grant Mr. Farnedi an equity award intended to have a value of approximately $350,000 in order to provide proactive retention of the senior leadership of the engineering team.
Outside of the focal review process, in June 2014, our compensation committee decided to grant Mr. Levine equity awards intended to have a value of approximately $4 million in recognition of Mr. Levine’s increased responsibilities related to the integration of Market Leader and the transition of Mr. Morris.
The following table summarizes the focal grant to named executive officers in 2014:
| Named Executive Officer |
Number of Shares of Common Stock Underlying Focal Stock Option Grant in 2014 |
Number of Shares of Common Stock Underlying Focal RSU Grant in 2014 |
||||||
| Daniele Farnedi |
7,785 | 7,785 | ||||||
| Paul Levine |
103,492 | 51,746 | ||||||
Retirement and Other Benefits
Our named executive officers receive health and welfare benefits under the same programs and subject to the same terms and conditions as our other salaried employees. These benefits include medical, dental, and vision benefits; health savings accounts; short-term and long-term disability insurance; accidental death and dismemberment insurance; and basic life insurance. In addition, to promote preventative health measures, we provide all of our employees with the ability to reimburse a portion of their gym membership fees.
Our named executive officers (other than Mr. Morris) are eligible to participate in our 401(k) retirement savings plan on the same basis as other employees. We may make discretionary contributions to the plan in any year, subject to certain limits. In 2014, we made matching contributions under our 401(k) retirement savings plan to all eligible participants. Mr. Morris was eligible to participate in Market Leader’s 401(k) retirement savings plan which we assumed in the Market Leader acquisition. In 2014, there were no matching contributions made to Mr. Morris under the Market Leader 401(k) plan.
Generally, we have not provided perquisites or other personal benefits to our named executive officers, other than those offered to our other salaried employees. However, in 2014, we provided our CFO, on a tax-neutral basis, with an apartment in San Francisco for his use so long as Mr. Aggarwal is required to work in San Francisco. This is done because our CFO’s residence is more than 50 miles from our offices in San Francisco. At
129
Table of Contents
the time of his hiring in 2011, we believed that without providing this benefit, we would not have been able to induce Mr. Aggarwal to join us and we continued this benefit in 2014. Currently, we do not view perquisites or other personal benefits as a component of our executive compensation program.
Certain Arrangements with Executive Officers
In August 2012, we entered into confirmatory employment letter agreements with Messrs. Flint and Farnedi that confirmed the terms of their employment with us. In addition, the initial terms and conditions of employment for Messrs. Aggarwal, Levine and Darling are set forth in written offer letter agreements. Each of the agreements with our named executive officers was negotiated on our behalf by our CEO, who consulted with our board of directors, except for our confirmatory employment letter agreement with Mr. Flint, which was negotiated on our behalf by our compensation committee. We believe that the confirmatory employment letter and offer letter agreements were necessary to induce these individuals to forego other opportunities or, in the case of the offer letter agreements, to leave their current employment for the uncertainty of a demanding position in a new and unfamiliar organization. In connection with his transition from an executive role to a consultant, we entered into a transition letter with Mr. Morris. For a summary of the material terms and conditions of these letter agreements, see “—Executive Confirmatory Employment Letters, Offer Letter Agreements and Transition Letter.”
Severance and Change in Control Arrangements
The confirmatory employment letter and offer letter agreements and/or equity award agreements entered into with certain of our named executive officers provide certain protections in the event of their termination of employment under specified circumstances, including following a change in control of our company. We believe that these protections serve our executive retention objectives by helping our named executive officers maintain continued focus and dedication to their responsibilities to maximize stockholder value, including in the event of certain qualifying terminations of employment or a transaction that could result in a change in control of our company. The terms of these agreements were determined after review by our board of directors of our retention goals for each named executive officer. For a summary of the potential payments due upon severance or change in control, see the section titled “—Potential Payments Upon Termination or Change in Control.”
Other Compensation Policies
Stock Ownership Guidelines
As of February 15, 2015, our compensation committee has not adopted stock ownership guidelines with respect to our named executive officers. In connection with our IPO, we established an insider trading policy that prohibits, among other things, short sales, hedging of stock ownership positions, and transactions involving derivative securities relating to our common stock.
Compensation Recovery Policy
As of February 15, 2015, we have not implemented a policy regarding retroactive adjustments to any cash or equity-based incentive compensation paid to our executive officers and other employees where the payments were predicated upon the achievement of financial results that were subsequently the subject of a financial restatement. Our compensation committee intends to adopt a general compensation recovery, or clawback, policy covering our annual and long-term incentive award plans and arrangements after the SEC adopts final rules implementing the requirement of Section 954 of the Dodd-Frank Wall Street Reform and Consumer Protection Act.
Our pay-for-performance equity awards granted in 2013 provide that if our financial statements are subsequently restated as a result of fraud or intentional misconduct, our compensation committee reserves the right to claw-back and/or cancel the future settlement of the performance equity awards.
130
Table of Contents
Tax and Accounting Treatment of Compensation
Deductibility of Executive Compensation
Section 162(m) of the Internal Revenue Code generally disallows public companies a tax deduction for federal income tax purposes of remuneration in excess of $1 million paid to the chief executive officer and each of the three other most highly compensated executive officers (other than the chief financial officer) in any taxable year. Generally, remuneration in excess of $1 million may only be deducted if it is “performance-based compensation” within the meaning of the Code. Our compensation committee may consider the deductibility of compensation when making decisions, but may authorize the payment of compensation that is not deductible when it believes it appropriate.
Taxation of “Parachute” Payments and Deferred Compensation
We did not provide any executive officer, including any named executive officer, with a “gross-up” or other reimbursement payment for any tax liability that he or she might owe as a result of the application of Sections 280G, 4999, or 409A of the Internal Revenue Code during 2014, and we have not agreed and are not otherwise obligated to provide any named executive officer with such a “gross-up” or other reimbursement. Sections 280G and 4999 of the Internal Revenue Code provide that executive officers and directors who hold significant equity interests and certain other service providers may be subject to an excise tax if they receive payments or benefits in connection with a change in control that exceeds certain prescribed limits and that we, or a successor, may forfeit a deduction on the amounts subject to this additional tax. Section 409A also imposes additional significant taxes on the individual in the event that an executive officer, director, or other service provider receives “deferred compensation” that does not meet the requirements of Section 409A of the Internal Revenue Code.
Accounting for Stock-Based Compensation
We follow Financial Accounting Standards Board Accounting Standards Codification Topic 718, or ASC Topic 718, formerly known as SFAS 123(R), for our equity-based awards. ASC Topic 718 requires companies to measure the compensation expense for all equity-based payment awards made to employees and directors, including stock options and restricted stock awards, based on the grant date “fair value” of these awards. This calculation is performed for accounting purposes and reported in the compensation tables below, even though our executive officers may never realize any value from their awards. ASC Topic 718 also requires companies to recognize the compensation cost of their equity-based compensation awards in their income statements over the period that an executive officer is required to render service in exchange for the option or other award.
Risk Assessment and Compensation Practices
Our management assesses and discusses with our compensation committee our compensation policies and practices for our employees as they relate to our overall risk management, and based upon this assessment, we believe that any risks arising from such policies and practices are not reasonably likely to have a material adverse effect on us.
Compensation Committee Report
The compensation committee has reviewed and discussed the section captioned “Executive Compensation,” included in this Annual Report on Form 10-K, with management and, based on such review and discussion, the compensation committee has recommended to our board of directors that this “Executive Compensation” section be included in this Annual Report on Form 10-K.
131
Table of Contents
Submitted by the compensation committee of the board of directors on February 10, 2015:
Gregory Waldorf (Chair)
Theresia Gouw
Daniel Stephen Hafner
2014 Summary Compensation Table
The following table provides information regarding the total compensation for services rendered in all capacities that was earned by each individual who served as our principal executive officer or principal financial officer at any time during 2014, and our three other named executive officers who were serving as executive officers as of December 31, 2014. These individuals were our named executive officers for 2014.
| Name and Principal Position |
Year | Salary ($) | Bonus ($) (1) |
Stock Awards ($) (1) |
Option Awards ($) (1) |
Non-Equity Incentive Plan Compensation ($) |
All
Other Compensation ($) (2) |
Total ($) | ||||||||||||||||||||||||
| Peter Flint Chief Executive Officer |
|
2014 2013 2012 |
|
$
|
398,333 351,314 278,917 |
|
|
— — — |
|
$
|
— 6,270,600 — |
|
$
|
— 2,841,390 — |
|
$ |
186,300 310,000 |
(3) |
$
|
12,375 — — |
|
$
|
587,008 9,773,304 278,917 |
| ||||||||
| Sean Aggarwal Chief Financial Officer |
|
2014 2013 2012 |
|
|
315,250 302,436 256,000 |
|
|
— — — |
|
|
— 5,899,188 — |
|
|
— 426,209 — |
|
|
107,588 155,000 |
(3) |
|
57,299 100,539 87,489 |
(4)
|
|
480,137 6,883,372 343,489 |
| ||||||||
| Paul Levine Chief Operating Officer |
|
2014 2013 2012 |
|
|
315,250 303,269 264,180 |
|
|
— — — |
|
|
1,999,983 5,394,250 — |
|
|
1,758,101 189,426 — |
|
|
244,283 155,000 — |
(3)
|
|
11,364 8,400 6,933 |
|
|
4,328,982 6,050,345 271,113 |
| ||||||||
| Daniele Farnedi Chief Technology Officer |
|
2014 2013 2012 |
|
|
270,396 262,118 220,323 |
|
|
— — — |
|
|
233,316 998,156 |
|
|
105,403 165,748 131,328 |
|
|
155,520 72,500 — |
(3)
|
|
7,167 7,208 6,106 |
|
|
771,803 1,505,730 357,757 |
| ||||||||
| Ian Morris* President, Market Leader (for a portion of 2014) |
|
2014 2013 |
|
|
372,738 124,857 |
|
|
— — |
|
|
— 17,136,450 |
|
|
— 2,488,663 |
|
|
87,300 87,300 |
(5)
|
|
73,962 — |
(6)
|
|
534,000 19,837,270 |
| ||||||||
| Scott Darling VP & General Counsel |
|
2014 2013 2012 |
|
|
270,397 253,962 226,462 |
|
|
— — — |
|
|
— — — |
|
|
— — — |
|
|
113,359 82,500 |
(3) |
|
10,767 10,767 8,750 |
|
|
394,524 347,229 235,212 |
| ||||||||
| * | Mr. Morris joined the company in August 2013 following the closing of our acquisition of Market Leader and transitioned to a consultant in September 2014 as part of our Market Leader reorganization. |
| (1) | The amounts reported represent the aggregate grant-date fair value of equity awards to the named executive officer in 2014, calculated in accordance with ASC Topic 718. Such grant-date fair value does not take into account any estimated forfeitures related to service-vesting conditions. The assumptions used in calculating the grant-date fair value of the equity awards reported in this column are set forth in the stock-based compensation note to our audited financial statements included in this Annual Report on Form 10-K for the year ended December 31, 2014. |
| (2) | Unless otherwise described in the footnotes below, the amounts reported for 2014 represent the amount of the matching contributions made by us to the named executive officer’s account under our 401(k) plan. |
| (3) | The amounts reported represent performance-based awards earned by each named executive officer based on the achievement of certain of our company and individual management goals and the individual’s target incentive compensation amount. The material terms of the incentive compensation awards are described in the section titled “—Elements of Executive Compensation—Annual Incentive Compensation.” The amounts reported were paid in cash equivalents in the form of fully-vested restricted stock units. We anticipate that the amounts reported will be paid in February 2015. |
| (4) | Of the amount reported, $56,299 represents costs incurred by and reimbursed to Mr. Aggarwal in 2014 for housing costs in San Francisco as further discussed in “—Executive Confirmatory Employment Letter and Offer Letter Agreements—Prashant “Sean” Aggarwal.” |
| (5) | The amount reported represents a lump sum bonus of $87,300 paid to Mr. Morris in connection with the transition of employment as described in the section titled “—Executive Confirmatory Employment Letters, Offer Letter Agreements and Transition Letter—Ian Morris Transition Letter.” |
| (6) | The amount reported represents severance paid to Mr. Morris in connection with the transition of employment as described in the section titled “—Executive Confirmatory Employment Letters, Offer Letter Agreements and Transition Letter—Ian Morris Transition Letter.” |
132
Table of Contents
2014 Grants of Plan-Based Awards
The following table presents information regarding grants of plan-based awards made to our named executive officers during fiscal 2014 under any plan.
| Name |
Grant Date |
Units or Rights Under Non-Equity Incentive Plan Awards (1) |
Estimated Future Payouts Under Non- Equity Incentive Plan Awards (2) |
All Other Stock Awards: Number of Shares of Stock or Units |
All Other Option Awards: Number of Securities Underlying Options |
Exercise or Base Price of Option Awards ($/sh) (3) |
Grant Date Fair Value/ Incremental Fair Value (4) |
Grant Date Fair Value of Stock and Option Awards |
||||||||||||||||||||||||||||
| Target | Maximum | |||||||||||||||||||||||||||||||||||
| Peter Flint |
— | $ | 300,000 | $ | 600,000 | |||||||||||||||||||||||||||||||
| 2/18/14 | 10,012 | $ | 0.00 | $ | 30.96 | $ | 309,972 | |||||||||||||||||||||||||||||
| Sean Aggarwal |
— | 173,250 | 346,500 | |||||||||||||||||||||||||||||||||
| 2/14/14 | 5,171 | 0.00 | 29.97 | 154,975 | ||||||||||||||||||||||||||||||||
| Paul Levine |
— | 173,250 | 346,500 | |||||||||||||||||||||||||||||||||
| 2/14/14 | 5,171 | 0.00 | 29.97 | 154,975 | ||||||||||||||||||||||||||||||||
| 6/05/14 | 51,746 | (5) | 0.00 | 38.65 | 1,999,983 | |||||||||||||||||||||||||||||||
| 6/05/14 | 103,492 | (6) | 38.65 | 16.98 | 1,758,101 | |||||||||||||||||||||||||||||||
| Daniele Farnedi |
— | 121,500 | 243,000 | |||||||||||||||||||||||||||||||||
| 2/14/14 | 2,419 | 0.00 | 29.97 | 72,497 | ||||||||||||||||||||||||||||||||
| 2/14/14 | 7,785 | (7) | 0.00 | 29.97 | 233,316 | |||||||||||||||||||||||||||||||
| 2/14/14 | 7,785 | (6) | 29.97 | 13.53 | 105,403 | |||||||||||||||||||||||||||||||
| Ian Morris |
— | 233,880 | 467,760 | |||||||||||||||||||||||||||||||||
| Scott Darling |
— | 121,500 | 243,000 | |||||||||||||||||||||||||||||||||
| 2/14/14 | 2,752 | 0.00 | 29.97 | 82,477 | ||||||||||||||||||||||||||||||||
| (1) | The amounts reported represent performance-based awards earned by each named executive officer based on the achievement of certain of our company and individual management goals and the individual’s target incentive compensation amount for performance during our 2013 fiscal year. The amounts reported were paid in cash equivalents in the form of fully-vested restricted stock units in February 2014 and are being reported on this table because the grants were made during 2014. The amounts were reported in our 2013 Summary Compensation Table as Non-Equity Incentive Plan Compensation earned in our 2013 fiscal year. |
| (2) | The amounts to all named executive officers other than Mr. Morris represent performance-based amounts payable under our 2014 SMT Bonus Plan. Payments under this plan are not subject to a minimum payment requirement but are subject to a maximum payment at 200% of the target amount. The material terms of the awards are discussed in the section titled “Elements of Executive Compensation—Annual Incentive Compensation.” The value of the amounts earned for fiscal 2014 are reflected in the “Non-Equity Incentive Plan Compensation” column of the “Summary Compensation Table.” The Company expects that the amounts reported in the “Summary Compensation Table” will be paid in February 2015 in cash equivalents in the form of fully-vested restricted stock units. Each named executive officer other than Mr. Morris received the following number of fully-vested restricted stock units: (i) Peter Flint, 4,161; (ii) Prashant Aggarwal, 2,403; (iii) Paul Levine, 5,456; (iv) Daniele Farnedi, 3,473; and (v) Scott Darling, 2,532. |
| (3) | The exercise price is set at the fair market value per share of our common stock on the grant date. For a discussion of our methodology for determining the fair value of our common stock, see the section titled “Management’s Discussion and Analysis of Financial Condition and Results of Operations—Critical Accounting Policies and Estimates—Stock-Based Compensation” in this Annual Report on Form 10-K for the year ended December 31, 2014. |
| (4) | The amounts reported represent the aggregate grant-date fair value of the equity awards to the named executive officer in 2014, calculated in accordance with ASC Topic 718. Such grant-date fair value does not take into account any estimated forfeitures related to service-vesting conditions. The assumptions used in calculating the grant date fair value of the equity awards reported in this column are set forth in the notes to our audited financial statements included in this Annual Report on Form 10-K for the year ended December 31, 2014. |
| (5) | The restricted stock units granted pursuant to our 2012 Plan will vest over a four-year period, with 1/16th of the number restricted stock units granted vesting on August 13, 2014, and the balance vesting in 15 successive equal quarterly installments upon the completion of each additional quarter of service thereafter. |
| (6) | The shares of common stock subject to the stock options were granted pursuant to our 2012 Plan and will vest in 48 successive equal monthly installments upon the completion of each month of service measured. For Mr. Levine, the vesting commencement date was June 1, 2014, and for Mr. Farnedi the vesting commencement date was February 1, 2014. |
133
Table of Contents
| (7) | The restricted stock units granted pursuant to our 2012 Plan will vest over a four-year period, with a 12.5% of the shares vesting upon the first quarterly vesting period to occur on or after six months of service measured from February 1, 2014, and the balance will vest in 14 successive equal quarterly installments upon the completion of each additional quarter of service thereafter. |
Outstanding Equity Awards at 2014 Year-End
The following table sets forth information regarding outstanding equity awards held by our named executive officers at the end of 2014.
| Option Awards (1) | Stock Awards (2) | |||||||||||||||||||||||||||
| Name |
Grant Date | Number of Securities Underlying Unexercised Options: Exercisable |
Number of Securities Underlying Unexercised Options: Unexercisable |
Option Exercise Price ($) |
Option Expiration Date |
Number of Shares or Units of Stock That Have Not Vested (3) |
Market Value of Shares or Units of Stock That Have Not Vested ($) (3) |
|||||||||||||||||||||
| Peter Flint |
2/8/11 | 327,804 | (4) | — | $ | 4.29 | 2/7/21 | |||||||||||||||||||||
| 3/5/13 | 103,125 | (5) | 121,875 | 26.93 | 3/4/23 | |||||||||||||||||||||||
| 5/29/13 | 300,000 | (6) | $ | 13,809,000 | ||||||||||||||||||||||||
| Sean Aggarwal |
11/9/11 | 146,772 | (7)(8) | — | 5.55 | 11/8/21 | ||||||||||||||||||||||
| 3/5/13 | 15,468 | (5) | 18,282 | 26.93 | 3/4/23 | |||||||||||||||||||||||
| 3/5/13 | 18,984 | 873,834 | ||||||||||||||||||||||||||
| 5/29/13 | 250,000 | (6) | 11,507,500 | |||||||||||||||||||||||||
| Paul Levine |
5/11/11 | 82,307 | 22,324 | 4.29 | 5/10/21 | |||||||||||||||||||||||
| 3/5/13 | 6,875 | (5) | 8,125 | 26.93 | 3/4/23 | |||||||||||||||||||||||
| 6/5/14 | 12,936 | (9) | 90,556 | 38.65 | 6/4/24 | |||||||||||||||||||||||
| 3/5/13 | 8,437 | 388,355 | ||||||||||||||||||||||||||
| 5/29/13 | 250,000 | (6) | 11,507,500 | |||||||||||||||||||||||||
| 6/5/14 | 45,278 | (10) | 2,084,146 | |||||||||||||||||||||||||
| Daniele Farnedi |
1/31/07 | 107,254 | — | 0.15 | 1/30/17 | |||||||||||||||||||||||
| 2/8/11 | 55,485 | (4) | 1,181 | 4.29 | 2/7/21 | |||||||||||||||||||||||
| 7/27/12 | 6,151 | 6,945 | 16.53 | 7/26/22 | ||||||||||||||||||||||||
| 3/5/13 | — | (5) | 7,110 | 26.93 | 3/4/23 | |||||||||||||||||||||||
| 2/14/14 | — | 6,164 | (11) | 29.97 | 2/13/24 | |||||||||||||||||||||||
| 3/5/13 | 7,382 | 339,793 | ||||||||||||||||||||||||||
| 5/29/13 | 3,750 | (12) | 172,613 | |||||||||||||||||||||||||
| 5/29/13 | 22,500 | (6) | 1,035,675 | |||||||||||||||||||||||||
| 2/14/14 | 6,326 | 291,186 | ||||||||||||||||||||||||||
| Ian Morris |
8/29/13 | 120,313 | 5,538,007 | |||||||||||||||||||||||||
| Scott Darling |
11/9/11 | 12,059 | 20,149 | 5.55 | 11/8/21 | |||||||||||||||||||||||
| 3/5/13 | 3,437 | (5) | 4,063 | 26.93 | 3/4/23 | |||||||||||||||||||||||
| 3/5/13 | 4,218 | 194,155 | ||||||||||||||||||||||||||
| 5/29/13 | 3,750 | (12) | 172,613 | |||||||||||||||||||||||||
| 5/29/13 | 22,500 | (6) | 1,035,675 | |||||||||||||||||||||||||
| (1) | Each stock option granted prior to December 31, 2012 was granted pursuant to our 2005 Plan, and each stock option granted after December 31, 2012 was granted pursuant to our 2012 Plan. Unless otherwise described in the footnotes below, the stock options are not immediately exercisable. Unless otherwise described in the footnotes below, the shares of common stock subject to such stock options will vest over a four-year period, with 25% of the shares to vest upon completion of one year of service measured from the vesting commencement date, and the balance will vest in 36 successive equal monthly installments upon the completion of each additional month of service thereafter. |
| (2) | Each restricted stock unit was granted pursuant to our 2012 Plan. Unless otherwise described in the footnotes below, the restricted stock units vest over a four-year period, with 12.5% of the shares vesting upon the first quarterly vesting period to occur on or after six months of service measured from the vesting commencement date, and the balance will vest in 14 successive equal quarterly installments upon the completion of each additional quarter of service thereafter. |
| (3) | Market value of shares or units of stock that have not vested is computed by multiplying (i) $46.03, the closing price on the New York Stock Exchange of our common stock on December 31, 2014, the last trading day of fiscal 2014, by (ii) the number of shares or units of stock. |
134
Table of Contents
| (4) | These stock options were granted to Messrs. Flint and Farnedi on February 8, 2011. The options are fully vested as to Mr. Flint. As to Mr. Farnedi, the shares of common stock subject to the stock option will vest in 48 successive equal monthly installments upon the completion of each month of service measured from January 18, 2011, the vesting commencement date. |
| (5) | The shares of common stock subject to such stock options will vest over a four-year period, with 1/48 of the shares to vest upon completion of each month of service measured from the vesting commencement date of February 1, 2013. |
| (6) | The performance-based restricted stock units granted in May 2013 are subject to the attainment of a company performance milestone as well as a continued service requirement after the milestone is achieved. After achievement of the performance milestone, which occurred in December 2014, the performance-based restricted stock units vest as to 1/6th of the restricted stock units on the Company’s first quarterly vesting date that is after the date of the achievement of the performance milestone, subject to continued service through such date. On each of the next five Company quarterly vesting dates thereafter, 1/6th of the number of performance-based restricted stock units granted will vest, subject to continued service through each such date. |
| (7) | The stock option granted to Mr. Aggarwal was immediately exercisable at grant for any or all of the shares subject thereto. However, any unvested shares purchased under such option will be subject to repurchase by us, at the lower of the original price paid per share or the current fair market value per share, should he cease to provide services to us prior to vesting in those shares. As of December 31, 2014, 55,407 shares subject to Mr. Aggarwal’s option remain unvested. |
| (8) | The shares of common stock subject to this stock option will vest in 48 successive equal monthly installments upon the completion of each month of service measured from the vesting commencement date of November 9, 2011. |
| (9) | The shares of common stock subject to the stock options were granted pursuant to our 2012 Plan and will vest in 48 successive equal monthly installments upon the completion of each month of service measured from the vesting commencement date of June 1, 2014. |
| (10) | The restricted stock units granted pursuant to our 2012 Plan will vest over a four-year period, with 1/16th of the number restricted stock units granted vesting on August 13, 2014, and the balance vesting in 15 successive equal quarterly installments upon the completion of each additional quarter of service thereafter. |
| (11) | The shares of common stock subject to the stock options were granted pursuant to our 2012 Plan and will vest in 48 successive equal monthly installments upon the completion of each month of service measured from the vesting commencement date of February 1, 2014. |
| (12) | The restricted stock units are subject to 24-months vesting and vested as to 50% of the number of restricted stock units granted on November 12, 2014. On each of the next four Company quarterly vesting dates, 1/8th of the number of restricted stock units granted shall vest, subject to continued service through each such date. |
2014 Option Exercises and Stock Vested
The following table presents information concerning the exercise of options and vesting of stock awards during 2014 for each of our named executive officers.
| Option Awards | Stock Awards | |||||||||||||||
| Name |
Number of Shares Acquired on Exercise |
Value Realized on Exercise ($) (1) |
Number of Shares Acquired on Vesting (2)(3) |
Value Realized on Vesting ($) (2)(4) |
||||||||||||
| Peter Flint |
— | $ | — | — | $ | — | ||||||||||
| Sean Aggarwal |
— | — | 8,437 | 356,431 | ||||||||||||
| Paul Levine |
176,310 | 7,525,382 | 10,218 | 489,128 | ||||||||||||
| Daniele Farnedi |
16,206 | 437,174 | 8,490 | 384,690 | ||||||||||||
| Ian Morris |
118,604 | 3,332,154 | 43,750 | 1,849,320 | ||||||||||||
| Scott Darling |
27,300 | 1,035,016 | 5,625 | 247,675 | ||||||||||||
| (1) | Reflects the difference between the market price of our common stock at the time of exercise on the exercise date and the exercise price of the option. |
| (2) | The amounts reported (except for Mr. Morris) exclude performance-based awards earned by each named executive officer under our 2013 SMT Bonus Plan. Incentives earned under our 2013 SMT Bonus Plan were paid in cash equivalents, in the form of fully vested restricted stock units. Shares were determined based on the value of the cash incentive earned, divided by our market price on February 14, 2014. |
| (3) | The amounts reported (except for Mr. Morris) include performance-based awards earned by each named executive officer under our 2014 SMT Bonus Plan based on the achievement of certain of our company and individual management goals and the individual’s target incentive compensation amount. The material terms of the incentive compensation awards are described in the section titled “—Elements of Executive Compensation—Annual Incentive Compensation.” Incentives earned under our 2014 SMT Bonus Plan were paid in cash equivalents, in the form of fully vested restricted stock units. Shares were determined based on the value of the cash incentive earned, divided by our market price on February 11, 2015. |
| (4) | Reflects the market price of our common stock on the vesting date. |
135
Table of Contents
Pension Benefits and Nonqualified Deferred Compensation
We do not provide a pension plan for our employees, and none of our named executive officers participated in a nonqualified deferred compensation plan during 2014.
Executive Confirmatory Employment Letters, Offer Letter Agreements and Transition Letter
Peter Flint
We entered into a confirmatory employment letter agreement with Mr. Flint, our CEO, in August 2012. The confirmatory employment letter agreement has no specific term and constitutes at-will employment.
Sean Aggarwal
We entered into an offer letter agreement with Mr. Aggarwal, our CFO, in October 2011. The offer letter agreement has no specific term and constitutes at-will employment. Mr. Aggarwal was provided with a $50,000 sign-on bonus payable within 30 days of his joining us. Mr. Aggarwal’s offer letter agreement provides that, in the event his employment is either terminated by us without “cause” (as defined below) or he resigns for “good reason” (as defined below), within 12 months following a change in control, then, in each case, Mr. Aggarwal will be entitled to accelerated vesting in 50% of the then-unvested shares subject to his sign-on stock option award. Also, we reimburse Mr. Aggarwal for an apartment in San Francisco on a tax-neutral basis so long as Mr. Aggarwal is required to work in San Francisco.
Paul Levine
We entered into an offer letter agreement with Mr. Levine, our COO, in February 2011. The offer letter agreement has no specific term and constitutes at-will employment. Mr. Levine’s offer letter agreement provides that, in the event his employment is either terminated by us without “cause” (as defined below) or he resigns for “good reason” (as defined below), within 12 months following a change in control, then, in each case, Mr. Levine will be entitled to accelerated vesting in 50% of the then-unvested shares subject to his sign-on stock option award.
Daniele Farnedi
We entered into a confirmatory employment letter agreement with Mr. Farnedi, our Chief Technology Officer, in August 2012. The confirmatory employment letter agreement has no specific term and constitutes at-will employment. Mr. Farnedi’s confirmatory employment letter agreement provides that, in the event his employment is either terminated by us without “cause” (as defined below) or he resigns for “good reason” (as defined below), within 12 months following a change in control, then, in each case, Mr. Farnedi will be entitled to accelerated vesting in 50% of the then-unvested shares subject to the stock option granted to Mr. Farnedi in February 2011 and July 2012.
Scott Darling
We entered into an offer letter agreement with Mr. Darling, our Vice President, General Counsel, and Corporate Secretary, in October 2011. The offer letter agreement has no specific term and constitutes at-will employment. Mr. Darling’s offer letter agreement provides that, in the event his employment is either terminated by us without “cause” (as defined below) or he resigns for “good reason” (as defined below), within 12 months following a change in control, then, in each case, Mr. Darling will be entitled to accelerated vesting in 50% of the then-unvested shares subject to his sign-on stock option award.
Definitions of Terms
For purposes of the offer letter agreements and confirmatory employment letter agreement with Mr. Farnedi, “cause” means dishonesty, fraud, serious misconduct, unauthorized use or disclosure of confidential information
136
Table of Contents
or trade secrets, or conduct prohibited by criminal law (except minor violations), in each case as determined by our board of directors, whose determination shall be conclusive and binding.
For purposes of the offer letter agreements of Messrs. Aggarwal, Levine and Darling, and the confirmatory employment letter agreement with Mr. Farnedi, “good reason” means:
| • | A reduction in base compensation of greater than 25% due to a change in control; |
| • | The executive is subjected to discrimination, harassment or abuse as a result of race, color, religion, creed, sex, age, national origin, sexual orientation, or disability; or |
| • | Upon our or our successor’s request, the executive refuses to relocate to a facility or location outside the San Francisco Bay Area. |
Ian Morris Transition Letter
In connection with the integration of Market Leader with Trulia, on June 3, 2014, we entered into a transition letter with Mr. Morris, pursuant to which Mr. Morris’ last day of employment with us was September 4, 2014. Mr. Morris provided transition employment duties through his termination of employment date. After his employment terminated, and without any break in service, Mr. Morris provides transition business advisory services, as a consultant, to us through August 31, 2015.
Additionally, upon the completion of Mr. Morris’ transition employment term, he was entitled to:
| • | 12 months of salary continuation; |
| • | a lump sum bonus payment of $87,300; |
| • | up to 18 months of paid COBRA continuation coverage; |
| • | all unvested shares subject to equity awards granted to Mr. Morris prior to August 29, 2013 that would have been exercisable on the fourth quarterly vesting date following Mr. Morris’s termination of employment date will be deemed vested and exercisable; and |
| • | the stock option grant made to Mr. Morris on September 23, 2010 will remain exercisable until its original termination/expiration date. |
During the consulting term, Mr. Morris’s time-based restricted stock unit grant awarded to him on August 29, 2013 and any unvested equity awards granted prior to August 29, 2013 will continue to vest. If prior to the end of the consulting term, we terminate Mr. Morris’ consulting relationship without cause, then the equity awards that would have vested through the end of the consulting term will become vested.
The foregoing benefits are subject to a release of claims by Mr. Morris for all claims (other than for his existing rights to indemnification as an officer) and certain other restrictive covenants.
Potential Payments Upon Termination or Change in Control
The following table provides information concerning the estimated payments and benefits that would be provided in the circumstances described above for each of our named executive officers. For purposes of the table, a qualifying termination of employment is considered “in connection with a change in control” if such involuntary termination without cause or voluntary termination for good reason occurs within the period 12 months, unless otherwise described in the footnotes below, following the “change in control” (as defined in each agreement). Payments and benefits are estimated assuming that the triggering event took place on December 31, 2014. There can be no assurance that an actual triggering event would produce the same or similar results as those estimated below if such event occurs on any other date or at any other price, or if any other assumption
137
Table of Contents
used to estimate potential payments and benefits is not correct. Due to the number of factors that affect the nature and amount of any potential payments or benefits, any actual payments and benefits may be different.
| Name |
Accelerating Vesting of Equity ($) (1) |
|||
| Peter Flint (2) |
$ | 9,232,313 | ||
| Sean Aggarwal (3) |
8,098,207 | |||
| Paul Levine (4) |
8,139,419 | |||
| Daniele Farnedi (5) |
1,597,004 | |||
| Ian Morris (6) |
1,510,382 | |||
| Scott Darling (7) |
1,283,717 | |||
| (1) | Reflects the aggregate market value of unvested option grants, unvested restricted stock unit awards, and unvested performance-based restricted stock unit awards. For unvested option grants, aggregate market value is computed by multiplying (i) the number of shares underlying unvested options at December 31, 2014 that would become vested by (ii) the difference between $46.03 and the exercise price of such option. Outstanding options that have an exercise price in excess of $46.03 are not included in the calculation. For unvested restricted stock unit awards, aggregate market value is computed by multiplying (i) the number of unvested shares at December 31, 2014 that would become vested by (ii) $46.03. $46.03 reflects the closing price of our common stock on December 31, 2014. |
| (2) | Mr. Flint’s March 2013 stock option grant provides for 100% acceleration of unvested shares if, within 12 months following a change in control, Mr. Flint is involuntarily terminated without “cause” (as defined in the notice of grant) or voluntarily terminates for “good reason” (as defined in the notice of grant). Mr. Flint has the same protection for his performance-based restricted stock units, except the acceleration would cover 50% of the unvested restricted stock units. As of December 31, 2014, 271,875 shares of common stock subject to Mr. Flint’s options and restricted stock unit awards would have accelerated if his employment had been terminated in connection with a change in control. |
| (3) | Mr. Aggarwal’s November 2011 stock option grant provides for 50% acceleration of unvested shares if, within 12 months following a change in control, Mr. Aggarwal is involuntarily terminated without cause (as defined in the notice of grant) or voluntarily terminates for “good reason” (as defined in the notice of grant). Mr. Aggarwal’s March 2013 stock option and restricted stock unit grants provide for 100% acceleration of unvested shares if, within 12 months following a change in control, Mr. Aggarwal is involuntarily terminated without “cause” (as defined in the notice of grant) or voluntarily terminates for “good reason” (as defined in the notice of grant). Mr. Aggarwal has the same protection for his performance-based restricted stock units, except the acceleration would cover 50% of the unvested restricted stock units. As of December 31, 2014, 189,970 shares of common stock subject to Mr. Aggarwal’s options and restricted stock unit awards would have accelerated if his employment had been terminated in connection with a change in control. |
| (4) | Mr. Levine’s May 2011 stock option grant provides for 50% acceleration of unvested shares if, within 12 months following a change in control, Mr. Levine is involuntarily terminated without “cause” (as defined in the notice of grant) or voluntarily terminates for “good reason” (as defined in the notice of grant). Mr. Levine’s March 2013 stock option and restricted stock unit grants provide for 100% acceleration of unvested shares if, within 12 months following a change in control, Mr. Levine is involuntarily terminated without “cause” (as defined in the notice of grant) or voluntarily terminates for “good reason” (as defined in the notice of grant). Mr. Levine has the same protection for his performance-based restricted stock units, except the acceleration would cover 50% of the unvested restricted stock units. Mr. Levine’s June 2014 stock option and restricted stock unit grants provide for 50% acceleration of unvested shares if, within 12 months following a change in control, Mr. Levine is involuntarily terminated without “cause” (as defined in the notice of grant) or voluntarily terminates for “good reason” (as defined in the notice of grant). As of December 31, 2014, 220,641 shares of common stock subject to Mr. Levine’s options and restricted stock unit awards would have accelerated if his employment had been terminated in connection with a change in control. |
| (5) | Mr. Farnedi’s February 2011 and July 2012 stock option grants each provide for 50% acceleration of unvested shares if, within 12 months following a change in control, Mr. Farnedi is involuntarily terminated without “cause” (as defined in the notice of grant) or voluntarily terminates for “good reason” (as defined in the notice of grant). Mr. Farnedi’s March 2013 and February 2014 stock option and restricted stock unit grants provide for 100% acceleration of unvested shares if, within 12 months following a change in control, Mr. Farnedi is involuntarily terminated without “cause” (as defined in the notice of grant) or voluntarily terminates for “good reason” (as defined in the notice of grant). Mr. Farnedi has the same protection for his performance-based restricted stock units and the time-based restricted stock units granted in May 2013, except the acceleration would cover 50% of the unvested restricted stock units. As of December 31, 2014, 44,170 shares of common stock subject to Mr. Farnedi’s options and restricted stock unit awards would have accelerated if his employment had been terminated in connection with a change in control. |
| (6) | Mr. Morris’s August 2013 restricted stock unit grant as amended by Mr. Morris’s transition letter provides for accelerated vesting of shares that would have vested through August 31, 2015 if Mr. Morris’s consulting term is terminated without “cause” (as defined in the transition letter). As of December 31, 2014, 32,813 shares of common stock subject to Mr. Morris’s restricted stock unit award would have accelerated if his consultancy had been terminated prior to the end of his consulting term. |
| (7) | Mr. Darling’s November 2011 stock option grant provides for 50% acceleration of unvested shares if, within 12 months following a change in control, Mr. Darling is involuntarily terminated without cause (as defined in the notice of grant) or voluntarily terminates for “good reason” (as defined in the notice of grant). Mr. Darling’s March 2013 stock option and restricted stock unit grants provide for 100% acceleration of unvested shares if, within 12 months following a change in control, Mr. Darling is involuntarily terminated without |
138
Table of Contents
| “cause” (as defined in the notice of grant) or voluntarily terminates for “good reason” (as defined in the notice of grant). Mr. Darling has the same protection for his performance-based restricted stock units and the time-based restricted stock units granted in May 2013, except the acceleration would cover 50% of the unvested restricted stock units. As of December 31, 2014, 31,481 shares of common stock subject to Mr. Darling’s options and restricted stock unit awards would have accelerated if his employment had been terminated in connection with a change in control. |
| Item 12. | Security Ownership of Certain Beneficial Owners and Management and Related Stockholder Matters |
The following table sets forth certain information with respect to the beneficial ownership of our common stock as of February 1, 2015, for:
| • | each of our executive officers named in the 2014 Summary Compensation Table; |
| • | each of our directors; |
| • | all of our directors and executive officers as a group; and |
| • | each person known by us to be the beneficial owner of more than five percent of any class of our voting securities; |
We have determined beneficial ownership in accordance with the rules of the SEC, and thus it represents sole or shared voting or investment power with respect to our securities. Unless otherwise indicated below, to our knowledge, the persons and entities named in the table have sole voting and sole investment power with respect to all shares that they beneficially owned, subject to community property laws where applicable. We have deemed shares of our common stock subject to options that are currently exercisable or exercisable within 60 days of February 1, 2015 to be outstanding and to be beneficially owned by the person holding the option for the purpose of computing the percentage ownership of that person but have not treated them as outstanding for the purpose of computing the percentage ownership of any other person. We have based percentage ownership of our common stock on 38,242,298 shares of our common stock outstanding as of February 1, 2015. Unless otherwise indicated, the address of each beneficial owner listed in the table below is c/o Trulia, Inc., 535 Mission Street, Suite 700, San Francisco, California 94105.
| Common Stock Beneficially Owned | ||||||||
| Name of Beneficial Owner |
Number | Percentage | ||||||
| Executive Officers and Directors: |
||||||||
| Peter Flint (1) |
1,847,107 | 4.8 | % | |||||
| Sean Aggarwal (2) |
219,866 | * | ||||||
| Paul Levine (3) |
207,315 | * | ||||||
| Daniele Farnedi (4) |
184,682 | * | ||||||
| Scott Darling (5) |
33,621 | * | ||||||
| Ian Morris (6) |
10,938 | * | ||||||
| Erik Bardman (7) |
25,217 | * | ||||||
| Theresia Gouw (8) |
87,000 | * | ||||||
| Daniel Stephen Hafner (9) |
2,188 | * | ||||||
| Sami Inkinen (10) |
607,424 | 1.6 | ||||||
| Robert Moles (11) |
66,596 | * | ||||||
| Gregory Waldorf (12) |
10,236 | * | ||||||
| All executive officers and directors as a group (12 persons) (13) |
3,302,190 | 8.4 | ||||||
| Caledonia (Private) Investments Pty Limited (14) |
10,245,823 | 26.8 | ||||||
| UBS Group AG (15) |
2,650,728 | 6.9 | ||||||
| Vanguard Group (16) |
2,185,435 | 5.7 | ||||||
| BlackRock, Inc. (17) |
2,014,102 | 5.3 | ||||||
| * | Represents beneficial ownership of less than one percent (1%) of the outstanding shares of our common stock. |
| (1) | Consists of (i) 1,347,428 shares held of record by Mr. Flint, (ii) 449,679 shares subject to outstanding options which are exercisable as of April 1, 2015, and (iii) 50,000 shares of common stock issuable upon the settlement of RSUs releaseable within 60 days of February 1, 2015. |
139
Table of Contents
| (2) | Consists of (i) 11,037 shares held of record by Mr. Aggarwal, (ii) 165,053 shares subject to outstanding options, all of which are exercisable as of April 1, 2015, 124,757 of which will be vested as of April 1, 2015, and (iii) 43,776 shares of common stock issuable upon the settlement of RSUs releaseable within 60 days of February 1, 2015. |
| (3) | Consists of (i) 27,162 shares held of record by Mr. Levine, (ii) 134,316 shares subject to outstanding options which are exercisable as of April 1, 2015, all of which will be vested as of April 1, 2015, and (iii) 45,837 shares of common stock issuable upon the settlement of RSUs releaseable within 60 days of February 1, 2015. |
| (4) | Consists of (i) 5,922 shares held of record by Mr. Farnedi, (ii) 172,765 shares subject to outstanding options which are exercisable as of April 1, 2015, all of which will be vested as of April 1, 2015, and (iii) 5,995 shares of common stock issuable upon the settlement of RSUs releaseable within 60 days of February 1, 2015. |
| (5) | Consists of (i) 6,300 shares held of record by Mr. Darling, (ii) 22,165 shares subject to outstanding options which are exercisable as of April 1, 2015, all of which will be vested as of April 1, 2015, and (iii) 5,156 shares of common stock issuable upon the settlement of RSUs releaseable within 60 days of February 1, 2015. |
| (6) | Consists of 10,938 shares subject to an outstanding option which is exercisable as of April 1, 2015, all of which will be vested as of April 1, 2015. |
| (7) | Consists of (i) 6,842 shares held of record by Mr. Bardman, (ii) 18,375 shares subject to an outstanding option which is exercisable as of April 1, 2015, all of which will be vested as of April 1, 2015. |
| (8) | Consists of (i) 11,005 shares of common stock owned by Ms. Gouw, (ii) 32,057 shares held of record by the SGLG 2013 T GRAT Trust UA 08/01/2013 (the “GRAT Trust”) for which Ms. Gouw serves as trustee; (iii) 15,609 shares held of record by the Theresia Gouw TR UA 12/11/2012 SGLG 2012 Living Trust (“2012 Living Trust”) for which Ms. Gouw serves as trustee, (iv) 17,829 shares held of record by the Theresia Gouw Ranzetta Accel IX Grat Trust (the “Accel Grat Trust,” and together with the GRAT Trust and the 2012 Living Trust, the “Gouw Trusts”), and (v) 10,500 shares subject to outstanding options which are exercisable as of April 1, 2015, all of which will be vested as of April 1, 2015. Ms. Gouw has sole voting and investment power over the Gouw Trusts’ shares. |
| (9) | Consists of (i) 1,823 shares held of record by Mr. Hafner and (ii) 365 shares of common stock issuable upon the settlement of RSUs releaseable within 60 days of February 1, 2015. |
| (10) | Consists of (i) 596,924 shares held of record by Mr. Inkinen and (ii) 10,500 shares subject to outstanding options all of which are exercisable as of April 1, 2015, all of which will be vested as of April 1, 2015. |
| (11) | Consists of (i) 3,421 shares held of record by Mr. Moles, and (ii) 63,175 shares subject to outstanding options which are exercisable as of April 1, 2015, all of which will be vested as of April 1, 2015. |
| (12) | Consists of (i) 6,199 shares held of record by Mr. Waldorf, and (ii) 4,037 shares held of record by GLW 2004 Revocable Trust dated 11/15/2004 for which Mr. Waldorf serves as trustee. |
| (13) | Consists of (i) 2,093,595 shares held of record by our current directors and executive officers, (ii) 1,046,528 shares subject to outstanding options which are exercisable as of April 1, 2015, 1,006,232 of which will be vested as of April 1, 2015, and (iii) 162,067 shares of common stock issuable upon the settlement of RSUs releaseable within 60 days of February 1, 2015. |
| (14) | According to a Schedule 13G/A filed on February 13, 2015, Caledonia (Private) Investments Pty Limited owns 10,245,823 shares of our common stock. The principal address of Caledonia (Private) Investments Pty Limited is Level 7, Gold Fields House, 1 Alfred Street, Sydney NSW 2000, Australia. |
| (15) | According to a Schedule 13G filed on January 21, 2015, UBS Group AG directly and on behalf of certain subsidiaries owns 2,650,728 shares of our common stock. The principal address of UBS Group AG is Bahnhofstrasse 45, PO Box CH-8021, Zurich, Switzerland. |
| (16) | According to a Schedule 13G filed on February 10, 2015, Vanguard Group Inc. owns 2,185,435 shares of our common stock. The Principal address of Vanguard Group Inc. is 100 Vanguard Blvd., Malvern, PA 19355. |
| (17) | According to a Schedule 13G filed on February 3, 2015, Blackrock, Inc. directly and on behalf of certain subsidiaries owns 2,014,102 shares of our common stock. The principal address of BlackRock Inc. is 55 East 52nd Street, New York, NY 10022. |
140
Table of Contents
Equity Compensation Plan Information
The following table provides information as of December 31, 2014 with respect to the shares of our common stock that may be issued under our existing equity compensation plans.
| Plan Category |
(a) Number of Securities to be Issued Upon Exercise of Outstanding Options, Warrants and Rights |
(b) Weighted Average Exercise Price of Outstanding Options, Warrants and Rights |
(c) Number of Securities Remaining Available for Future Issuance Under Equity Compensation Plans (Excluding Securities Reflected in Column (a)) |
|||||||||
| Equity compensation plans approved by stockholders(1) |
5,138,818 | (1)(2) | $ | 15.93 | (3) | 2,644,920 | ||||||
| Equity compensation plans not approved by stockholders |
411,599 | (4)(5) | 20.87 | (6) | — | |||||||
|
|
|
|
|
|||||||||
| Total |
5,550,417 | 2,644,920 | ||||||||||
|
|
|
|
|
|||||||||
| (1) | Includes the following plans: Trulia, Inc. 2005 Stock Incentive Plan (the “2005 Plan”) and Trulia, Inc. 2012 Equity Incentive Plan, as amended (the “2012 Plan”). As of December 31, 2014, a total of 2,644,920 shares of our common stock have been reserved for issuance pursuant to the 2012 Plan, which number excludes the 1,529,297 shares that were added to the 2012 Plan as a result of the automatic annual increase on January 1, 2015. In addition, the shares reserved for issuance under the 2012 Plan also include shares returned to the 2005 Plan as the result of expiration or termination of awards (provided that the maximum number of shares that may be added to the 2012 Plan pursuant to this provision is 1,000,000 shares). Our 2012 Plan provides that on January 1st of each year commencing in 2013 and ending on (and including) January 1, 2022, the number of authorized shares for issuance under the 2012 Plan is automatically increased by a number equal to the lesser of (i) 2,100,000 shares, (ii) 4% of the outstanding shares of our common stock as of the last day of our immediately preceding year, or (iii) such other amount as our board of directors may determine. |
| (2) | Includes 3,030,019 shares that may be issued under restricted stock unit awards as of December 31, 2014. |
| (3) | Excludes 3,030,019 shares that may be issued under restricted stock unit awards as of December 31, 2014. |
| (4) | Includes the following plans: Housevalues, Inc. 1999 Stock Incentive Plan, which shares under the plan were assumed by us and the Market Leader, Inc. Amended and Restated 2004 Equity Incentive Plan, which plan was assumed by us in connection with our acquisition of Market Leader, Inc. in August 2013. No future grants may be made under the Housevalues, Inc. 1999 Stock Incentive Plan. See Note 10 to our audited financial statements contained in this Annual Report on Form 10-K for the fiscal year ended December 31, 2014 for a description of the Market Leader, Inc. Amended and Restated 2004 Equity Incentive Plan. |
| (5) | Includes 286,759 shares that may be issued under restricted stock unit awards as of December 31, 2014. |
| (6) | Excludes 286,759 shares that may be issued under restricted stock unit awards as of December 31, 2014. |
Changes in Control
On July 28, 2014, we entered into the Merger Agreement, with Zillow and HoldCo, pursuant to which Zillow acquired us on February 17, 2015. Pursuant to the Merger Agreement, both we and Zillow have become wholly-owned subsidiaries of HoldCo,
| Item 13. | Certain Relationships and Related Transactions and Director Independence |
In addition to the compensation arrangements, including employment, termination of employment and change in control arrangements and indemnification arrangements, discussed, when required, in the section titled “Executive Compensation,” the following is a description of each transaction since January 1, 2014 and each currently proposed transaction in which:
| • | we have been or are to be a participant; |
| • | the amount involved exceeded or exceeds $120,000; and |
| • | any of our directors, executive officers, or holders of more than 5% of our capital stock, or any immediate family member of, or person sharing the household with, any of these individuals, had or will have a direct or indirect material interest. |
141
Table of Contents
Zillow Merger
As previously announced, Trulia, Zillow, Inc., a Washington corporation (“Zillow”), and Zillow Group, Inc. (f/k/a Zebra HoldCo, Inc.), or HoldCo, entered into an Agreement and Plan of Merger (the “Merger Agreement”) on July 28, 2014. Pursuant to the terms of the Merger Agreement, on February 17, 2015, (i) a wholly owned subsidiary of HoldCo (“Zillow Merger Sub”) was merged with and into Zillow, the separate corporate existence of Zillow Merger Sub thereupon ceased and Zillow continued as the surviving corporation (the “Zillow Merger”) and (ii) a separate wholly owned subsidiary of HoldCo (“Trulia Merger Sub”) merged with and into Trulia, the separate corporate existence of Trulia Merger Sub thereupon ceased and Trulia continued as the surviving corporation (the “Trulia Merger” and, together with the Zillow Merger, the “Mergers”). As a result of the Mergers, both Trulia and Zillow are now wholly owned subsidiaries of HoldCo.
In connection with the Mergers, certain of Trulia’s executive officers and non-employee directors have interests in the merger that are different from, or in addition to, those of the Trulia stockholders generally. These interests may create potential conflicts of interest. The Trulia board was aware of and considered these interests, among other matters, in reaching its decision to approve, and declare advisable, the Merger Agreement, the Mergers and other transactions contemplated by the Merger Agreement.
Change in Control Equity Acceleration for Executive Officers
We have entered into change in control arrangements with certain of our executive officers that, among other things, provide for certain severance and change in control benefits. Certain executive officers are entitled to partial and/or full “double trigger” equity acceleration upon a termination by Trulia without “cause” or a resignation for “good reason,” each within twelve months of the Zillow Merger, pursuant to pre-existing offer letters and/or equity award agreements entered into with Trulia. See the section titled “Compensation Discussion and Analysis—Potential Payments Upon Termination or Change in Control” for more information regarding these agreements.
Retention Payment
In connection with the Zillow Merger, Scott Darling was entitled to receive a retention cash payment upon closing of the Zillow Merger. See the section titled “Compensation Discussion and Analysis—Retention Bonus” for more information regarding this payment.
Continuing Employment with the Trulia Surviving Corporation
Upon completion of the Mergers, Messrs. Farnedi and Darling ceased being executive officers of Trulia and Messrs. Aggarwal and Flint are expected to resign their offices as executive officers immediately following the filing of this Annual Report on Form 10-K. Mr. Levine, President of Trulia will continue his employment with the Trulia surviving corporation following the merger on substantially similar terms and conditions as those terms and conditions in existence immediately prior to the effective time of the Trulia merger and the remaining executive officers will transition from their employment with Trulia through the second quarter of 2015.
Continuing Services as Directors on HoldCo Board
In connection with the closing of the Zillow Merger and pursuant to the terms of the Merger Agreement, all of the members of Trulia’s board of directors, other than Peter Flint, Gregory Waldorf, and Erik Bardman, resigned as of the effective time of the Zillow Merger, including Theresia Gouw, Daniel Stephen Hafner, Sami Inkinen, and Robert Moles. Messrs. Flint, Waldorf, and Bardman expect to resign immediately following the filing of this Annual Report on Form 10-K. The HoldCo board after the Zillow Merger will include two directors from the current Trulia board. It is currently expected that the compensation to be paid to non-employee directors
142
Table of Contents
of HoldCo will be substantially similar in nature to the compensation paid to non-employee Zillow directors immediately prior to the effective time of the Zillow Merger.
Transition Agreement
We entered into a transition agreement and release with Sami Inkinen, our former President, dated March 28, 2012. The agreement provides that Mr. Inkinen’s employment terminated on March 31, 2012 and in consideration for executing a release, Mr. Inkinen received: (1) continuing payments of his then-current base salary for six months; (2) continued eligibility to receive the rollover bonus described above on a pro-rated basis, subject to achievement of the 2012 performance measures; (3) reimbursement for mobile phone, voice, and data service expenses, up to $200 per month, for six months; and (4) COBRA reimbursements for a period of six months, or until Mr. Inkinen has secured other employment and has become eligible for health benefits from such new employer, whichever occurs first.
As a part of the transition agreement, Mr. Inkinen agreed to continue to serve as a member of our board of directors until at least December 31, 2013. We will reimburse Mr. Inkinen for reasonable travel and other incidental expenses approved by us related to director service, so long as Mr. Inkinen provides us with appropriate receipts or other relevant documentation.
Letter Agreements
In January 2012, we entered into a letter agreement with Gregory Waldorf confirming his agreement to serve as the lead independent director of our board of directors. Pursuant to the letter agreement, in February 2012, our board of directors granted to Mr. Waldorf a stock option to purchase 24,500 shares of common stock at a price per share of $6.81, which was the fair market value of our common stock on the date of grant. The stock option granted to Mr. Waldorf is fully vested. In addition, pursuant to the letter agreement, we also paid Mr. Waldorf a cash bonus of $25,000 in April 2012, and agreed to reimburse him for reasonable travel and incidental expenses that we approve. Additionally, in July 2012, our board of directors granted to Mr. Waldorf a stock option to purchase 24,500 shares of common stock at a price per share of $16.53, which was the fair market value of our common stock on the date of grant. The stock option granted to Mr. Waldorf is fully vested.
In May 2012, we entered into a letter agreement with Erik Bardman confirming his agreement to serve on our board of directors and as the chairman of our audit committee. Pursuant to the letter agreement, our board of directors granted to Mr. Bardman a stock option to purchase 24,500 shares of our common stock at a price per share of $13.32, which was the fair market value of our common stock on the date of grant. The stock option granted to Mr. Bardman is fully vested.
In October 2013, in connection with his appointment to our board of directors, we entered into letter agreement with Daniel Stephen Hafner, pursuant to which Mr. Hafner was granted restricted stock units having a fair market value equal to $200,000 based on the closing price of our common stock on October 18, 2013. The restricted stock units will vest in twelve equal quarterly installments over approximately a three-year period following Mr. Hafner’s appointment to the board of directors, subject to Mr. Hafner’s continued service on the board of directors on each applicable vesting date. Notwithstanding this vesting schedule, the vesting of all equity awards granted to Mr. Hafner will vest in full upon a “change in control” (as defined in our 2012 Equity Incentive Plan, or the 2012 Plan). The restricted stock unit award is subject to the terms and conditions of the 2012 Plan and the related restricted stock unit award agreement. Furthermore, in accordance with our Outside Director Compensation Policy, Mr. Hafner is also entitled to additional cash and equity compensation for his service on the board of directors and its committees.
Investor Rights Agreement
On May 8, 2008, we entered into a Third Amended and Restated Investor Rights Agreement with the holders of our outstanding convertible preferred stock, including entities affiliated with Accel Partners, Fayez
143
Table of Contents
Sarofim Investment Partnership, and Sequoia Capital, which each held more than 5% of our outstanding capital stock at the time of our initial public offering, and Peter Flint and Sami Inkinen, our co-founders.
Executive Confirmatory Employment Letter and Offer Letter Agreements
We have entered into confirmatory employment letter and offer letter agreements with certain of our executive officers. See the section titled “Executive Compensation—Executive Confirmatory Employment Letters, Offer Letter Agreements and Transition Letter” for more information regarding these agreements.
Other Transactions
We have granted stock options to our executive officers and certain of our directors. See the sections titled “Executive Compensation—2014 Grants of Plan-Based Awards” and “Board of Directors and Corporate Governance—Non-Employee Director Compensation” for a description of these options.
Other than as described above under this section titled “Certain Relationships and Related Party Transactions,” since January 1, 2014, we have not entered into any transactions, nor are there any currently proposed transactions, between us and a related party where the amount involved exceeds, or would exceed, $120,000, and in which any related person had or will have a direct or indirect material interest. We believe the terms of the transactions described above were comparable to terms we could have obtained in arm’s-length dealings with unrelated third parties.
Policies and Procedures for Related Party Transactions
The audit committee has the primary responsibility for reviewing and approving or disapproving “related party transactions,” which are transactions between us and related persons in which the aggregate amount involved exceeds or may be expected to exceed $120,000 and in which a related person has or will have a direct or indirect material interest. We have adopted a policy regarding transactions between us and related persons. For purposes of this policy, a related person is defined as a director, executive officer, nominee for director, or greater than 5% beneficial owner of our common stock, in each case since the beginning of the most recently completed year, and their immediate family members. Our audit committee charter provides that the audit committee shall review and approve or disapprove any related party transactions.
Director Independence
As of February 15, 2015, our common stock was listed on the New York Stock Exchange. Under the rules of the New York Stock Exchange, independent directors must comprise a majority of a listed company’s board of directors. In addition, the rules of the New York Stock Exchange require that, subject to specified exceptions, each member of a listed company’s audit, compensation, and nominating and corporate governance committees be independent. Under the rules of the New York Stock Exchange, a director will only qualify as an “independent director” if, in the opinion of that company’s board of directors, that person does not have a relationship that would interfere with the exercise of independent judgment in carrying out the responsibilities of a director. Audit committee members must also satisfy the independence criteria set forth in Rule 10A-3 under the Securities Exchange Act of 1934, as amended, or the Exchange Act.
In order to be considered independent for purposes of Rule 10A-3, a member of an audit committee of a listed company may not, other than in his or her capacity as a member of the audit committee, the board of directors, or any other board committee: (1) accept, directly or indirectly, any consulting, advisory, or other compensatory fee from the listed company or any of its subsidiaries; or (2) be an affiliated person of the listed company or any of its subsidiaries.
Our board of directors has undertaken a review of the independence of each director. Based on information provided by each director concerning his or her background, employment, and affiliations, our board of directors
144
Table of Contents
determined that as of February 15, 2015 Ms. Gouw and Messrs. Bardman, Hafner, Moles, and Waldorf do not have a relationship that would interfere with the exercise of independent judgment in carrying out the responsibilities of a director and that each of these directors is “independent” as that term is defined under the applicable rules and regulations of the SEC and the listing standards of the New York Stock Exchange. In making these determinations, our board of directors considered the current and prior relationships that each non-employee director has with our company and all other facts and circumstances our board of directors deemed relevant in determining their independence, including the beneficial ownership of our capital stock by each non-employee director, and the transactions involving them described in the section titled “Certain Relationships and Related Party Transactions.”
| Item 14. | Principal Accountant Fees and Services |
Fees Paid to the Independent Registered Public Accounting Firm
The following table presents fees for professional audit services and other services rendered to our company by Deloitte for the years ended December 31, 2014 and 2013.
| 2014 | 2013 | |||||||
| Audit fees (1) |
$ | 2,705,506 | $ | 2,092,797 | ||||
| Tax fees (2) |
— | — | ||||||
|
|
|
|
|
|||||
| Total audit and tax fees |
$ | 2,705,506 | $ | 2,092,797 | ||||
|
|
|
|
|
|||||
| (1) | “Audit Fees” consist of professional services rendered in connection with the audit of our annual financial statements, including audited financial statements presented in our annual report on Form 10-K, review of our quarterly financial statements presented in our quarterly report on Form 10-Q, and services that are normally provided by the independent registered public accountants in connection with statutory and regulatory filings or engagements for those fiscal years. Fees for 2013 also consisted of professional services rendered in connection with our Form S-1 related to our follow-on public offering of common stock completed in March 2013, our Form S-4 filed in connection with our acquisition of Market Leader, Inc., and our Form S-8 related to the assumption of certain equity incentive plans, also in connection with our acquisition of Market Leader, Inc. Fees for 2014 also consisted of professional services rendered in connection with our Form S-4 related to our acquisition by Zillow Group, Inc. |
| (2) | “Tax Fees” consist of professional services for tax compliance, tax advice, and tax planning. These services include assistance regarding federal, state, and international tax compliance. |
Part IV
| Item 15. | Exhibits and Financial Statement Schedules |
(a) The following documents are filed as part of this report:
1. Financial Statements
See Index to Financial Statements at Item 8 herein.
2. Financial Statement Schedules
145
Table of Contents
SCHEDULE II—VALUATION AND QUALIFYING ACCOUNTS
| Year Ended December 31, |
||||||||||||
| 2014 | 2013 | 2012 | ||||||||||
| (In thousands) | ||||||||||||
| Allowance for Doubtful Accounts: |
||||||||||||
| Beginning balance |
$ | 411 | $ | 142 | $ | 80 | ||||||
| Charged to costs and expenses |
(135 | ) | 351 | 95 | ||||||||
| Reductions and write-offs |
(190 | ) | (82 | ) | (33 | ) | ||||||
|
|
|
|
|
|
|
|||||||
| Ending balance |
$ | 86 | $ | 411 | $ | 142 | ||||||
|
|
|
|
|
|
|
|||||||
All other schedules have been omitted because they are not required, not applicable, or the required information is otherwise included.
3. Exhibits
See the Exhibit Index immediately following the signature page of this Annual Report on Form 10-K.
146
Table of Contents
SIGNATURES
Pursuant to the requirements of the Securities Exchange Act of 1934, as amended, the registrant has duly caused this report to be signed on its behalf by the undersigned thereunto duly authorized.
| Trulia, Inc. | ||||||
| Date: February 27, 2015 | /s/ PETER FLINT | |||||
| Peter Flint | ||||||
| Chief Executive Officer and Director (Principal Executive Officer) | ||||||
| Date: February 27, 2015 | /s/ PRASHANT “SEAN” AGGARWAL | |||||
| Prashant “Sean” Aggarwal | ||||||
| Chief Financial Officer (Principal Accounting and Financial Officer) | ||||||
| Date: February 27, 2015 | /s/ ERIK BARDMAN | |||||
| Erik Bardman | ||||||
| Director | ||||||
| Date: February 27, 2015 | /s/ GREGORY WALDORF | |||||
| Gregory Waldorf | ||||||
| Director | ||||||
147
Table of Contents
EXHIBIT INDEX
| Exhibit |
Description |
Incorporated by Reference | ||||||||||
| Form | File No. | Exhibit | Filing Date | |||||||||
| 2.1 | Agreement and Plan of Merger, dated May 7, 2013, by and among Trulia, Inc., Mariner Acquisition Corp., a wholly owned subsidiary of Trulia, Inc. and Market Leader, Inc. | 8-K | 001-35650 | 2.1 | May 8, 2013 | |||||||
| 2.2 | Agreement and Plan of Merger, dated as of July 28, 2014, by and among Zillow, Inc., Zebra HoldCo, Inc. and Trulia, Inc. | 8-K | 2.1 | July 28, 2014 | ||||||||
| 3.1 | Amended and Restated Certificate of Incorporation of the Registrant. | 8-K | 001-35650 | 3.1 | February 18, 2015 | |||||||
| 3.2 | Amended and Restated Bylaws of the Registrant. | 8-K | 001-35650 | 3.2 | February 18, 2015 | |||||||
| 4.1 | Form of common stock certificate of the Registrant. | S-1/A | 333-183364 | 4.1 | September 19, 2012 | |||||||
| 4.2 | Third Amended and Restated Investor Rights Agreement, dated May 8, 2008, by and among the Registrant and certain of its stockholders. | S-1 | 333-183364 | 4.4 | August 17, 2012 | |||||||
| 4.3 | Indenture between Trulia, Inc. and Wells Fargo Bank, National Association, dated as of December 17, 2013. | 8-K | 001-35650 | 4.1 | December 17, 2013 | |||||||
| 4.4 | Form of Note for Trulia, Inc.’s 2.75% Convertible Senior Notes due 2020 (incorporated by reference to Exhibit 4.3 hereto). | |||||||||||
| 4.5 | Supplemental Indenture, dated as of February 27, 2015, by and among Trulia, Inc., Zillow Group, Inc. and Wells Fargo Bank, N.A., as Trustee. | 8-K | 001-35650 | 4.1 | February 18, 2015 | |||||||
| 10.1* | Form of Indemnity Agreement between the Registrant and each of its directors and executive officers. | S-1 | 333-183364 | 10.1 | August 17, 2012 | |||||||
| 10.2* | Trulia, Inc. 2005 Stock Incentive Plan, as amended, and form of Stock Option Agreement and form of Stock Option Grant Notice thereunder. | S-1 | 333-183364 | 10.2 | August 17, 2012 | |||||||
| 10.3*† | Trulia, Inc. SMT Bonus Plan. | S-1 | 333-183364 | 10.4 | August 17, 2012 | |||||||
| 10.4* | Outside Director Compensation Policy | 10-Q | 001-35650 | 10.2 | November 13, 2012 | |||||||
| 10.5* | Confirmatory Employment Letter, dated August 3, 2012, between the Registrant and Peter Flint. | S-1 | 333-183364 | 10.5 | August 17, 2012 | |||||||
148
Table of Contents
| Exhibit |
Description |
Incorporated by Reference | ||||||||||
| Form | File No. | Exhibit | Filing Date | |||||||||
| 10.6* | Employment Offer Letter, dated October 17, 2011, between the Registrant and Prashant “Sean” Aggarwal. | S-1 | 333-183364 | 10.6 | August 17, 2012 | |||||||
| 10.7* | Employment Offer Letter, dated January 13, 2011, between the Registrant and Paul Levine. | S-1 | 333-183364 | 10.7 | August 17, 2012 | |||||||
| 10.8* | Employment Offer Letter, dated October 17, 2011, between the Registrant and Scott Darling. | S-1 | 333-183364 | 10.8 | August 17, 2012 | |||||||
| 10.9* | Confirmatory Employment Letter, dated August 3, 2012, between the Registrant and Daniele Farnedi. | S-1 | 333-183364 | 10.9 | August 17, 2012 | |||||||
| 10.10* | Letter Agreement, dated January 5, 2012, between the Registrant and Gregory Waldorf. | S-1 | 333-183364 | 10.10 | August 17, 2012 | |||||||
| 10.11* | Letter Agreement, dated May 23, 2012, between the Registrant and Erik Bardman. | S-1 | 333-183364 | 10.11 | August 17, 2012 | |||||||
| 10.12* | Transition Agreement and Release, dated March 28, 2012, between the Registrant and Sami Inkinen. | S-1 | 333-183364 | 10.12 | August 17, 2012 | |||||||
| 10.13† | Platform Services Agreement, dated June 19, 2012, between the Registrant and Move Sales, Inc. | S-1/A | 333-183364 | 10.13 | September 19, 2012 | |||||||
| 10.14 | Master Service Agreement, dated June 2, 2008, between the Registrant and Equinix Operating Co., Inc. | S-1 | 333-183364 | 10.14 | August 17, 2012 | |||||||
| 10.15 | Multi-Tenant Office Lease, dated January 24, 2011, between the Registrant and LBA Realty Fund II—WBP III, LLC. | S-1 | 333-183364 | 10.16 | August 17, 2012 | |||||||
| 10.16 | First Amendment to Multi-Tenant Office Lease, dated August 31, 2012, between the Registrant and LBA Realty Fund II—WBP III, LLC. | S-1/A | 333-183364 | 10.17 | September 19, 2012 | |||||||
| 10.17* | Trulia, Inc. 2012 Equity Incentive Plan, as amended and restated. | 10-Q | 001-35650 | 10.1 | August 12, 2013 | |||||||
| 10.18* | Letter Agreement, dated October 16, 2013, between the Trulia, Inc. and Steve Hafner. | 8-K | 001-35650 | 10.1 | October 23, 2013 | |||||||
| 10.19 | Purchase Agreement by and among Trulia, Inc., J.P. Morgan Securities LLC and Deutsche Bank Securities Inc., dated December 11, 2013. | 8-K | 001-35650 | 10.1 | December 17, 2013 | |||||||
149
Table of Contents
| Exhibit |
Description |
Incorporated by Reference | ||||||||||
| Form | File No. | Exhibit | Filing Date | |||||||||
| 10.20 | Consent and Sixth Amendment, dated as of December 11, 2013, to the Loan and Security Agreement, dated as of September 15, 2011, between Trulia, Inc. and Hercules Technology Growth Capital, Inc. | 8-K | 001-35650 | 10.2 | December 17, 2013 | |||||||
| 10.21 | Lease, dated March 10, 2014, between the Company and LBA Realty Fund II—Company XII, LLC. | 10-Q | 001-35650 | 10.1 | May 1, 2014 | |||||||
| 10.22 | Amendment to Office Lease, dated July 25, 2014, between the Company and BXP Mission 535 LLC. | 10-Q | 001-35650 | 10.1 | August 8, 2014 | |||||||
| 21.1 | List of subsidiaries of the Registrant. | |||||||||||
| 31.1 | The certification of Peter Flint, Chief Executive Officer, pursuant to Rule 13a-14(a)/15d-14(a), as adopted pursuant to Section 302 of the Sarbanes-Oxley Act of 2002. | |||||||||||
| 31.2 | Certification of Prashant “Sean” Aggarwal, Chief Financial Officer, pursuant to Rule 13a-14(a)/15d-14(a), as adopted pursuant to Section 302 of the Sarbanes-Oxley Act of 2002. | |||||||||||
| 32.1 | Certification of Peter Flint, Chief Executive Officer, and Prashant “Sean” Aggarwal, Chief Financial Officer, pursuant to 18 U.S.C. Section 1350, as adopted pursuant to Section 906 of the Sarbanes-Oxley Act of 2002. | |||||||||||
| 101.INS | XBRL Instance Document. | |||||||||||
| 101.SCH | XBRL Taxonomy Extension Schema Document. | |||||||||||
| 101.CAL | XBRL Taxonomy Extension Calculation Linkbase Document. | |||||||||||
| 101.DEF | XBRL Taxonomy Extension Definition Linkbase Document | |||||||||||
| 101.LAB | XBRL Taxonomy Extension Label Linkbase Document | |||||||||||
| 101.PRE | XBRL Taxonomy Extension Presentation Linkbase Document | |||||||||||
| * | Management contract, compensatory plan or arrangement. |
| † | Portions of this exhibit have been omitted pursuant to a determination by the Securities and Exchange Commission that these portions should be granted confidential treatment. |
150