Attached files
| file | filename |
|---|---|
| EXCEL - IDEA: XBRL DOCUMENT - Seventy Seven Energy Inc. | Financial_Report.xls |
| EX-23.1 - EX-23.1 - Seventy Seven Energy Inc. | ex231-20141231.htm |
| EX-32.2 - EX-32.2 - Seventy Seven Energy Inc. | ex322-20141231.htm |
| EX-32.1 - EX-32.1 - Seventy Seven Energy Inc. | ex321-20141231.htm |
| EX-31.2 - EX-31.2 - Seventy Seven Energy Inc. | ex312-20141231.htm |
| EX-31.1 - EX-31.1 - Seventy Seven Energy Inc. | ex311-20141231.htm |
| EX-12.1 - EX-12.1 - Seventy Seven Energy Inc. | ex121-20141231.htm |
| EX-10.24 - EX-10.24 - Seventy Seven Energy Inc. | ex1024-20141231.htm |
UNITED STATES
SECURITIES AND EXCHANGE COMMISSION
Washington, D.C. 20549
Form 10-K
ý | ANNUAL REPORT PURSUANT TO SECTION 13 OR 15(d) OF THE SECURITIES EXCHANGE ACT OF 1934 |
FOR THE FISCAL YEAR ENDED DECEMBER 31, 2014
¨ | TRANSITION REPORT PURSUANT TO SECTION 13 OR 15(d) OF THE SECURITIES EXCHANGE ACT OF 1934 |
FOR THE TRANSITION PERIOD FROM TO
Commission File No. 333-187766
Seventy Seven Energy Inc.
(Exact name of registrant as specified in its charter)
Oklahoma | 45-3338422 | |
(State or other jurisdiction of incorporation or organization) | (I.R.S. Employer Identification No.) | |
777 N.W. 63rd Street Oklahoma City, Oklahoma | 73116 | |
(Address of principal executive offices) | (Zip Code) | |
(405) 608-7777
(Registrant's telephone number, including area code)
Securities registered pursuant to Section 12(b) of the Act:
Title of Each Class | Name of Each Exchange on Which Registered | |
Common Stock, par value $0.01 | New York Stock Exchange | |
Securities registered pursuant to Section 12(g) of the Act:
None
Indicate by check mark whether the registrant is a well-known seasoned issuer, as defined in Rule 405 of the Securities Act. Yes ¨ No ý
Indicate by check mark whether the registrant is not required to file reports pursuant to Section 13 or Section 15(d) of the Act. Yes ¨ No ý
Indicate by check mark whether the registrant (1) has filed all reports required to be filed by Section 13 or 15(d) of the Securities Exchange Act of 1934 during the preceding 12 months (or for such shorter period that the registrant was required to file such reports), and (2) has been subject to such filing requirements for the past 90 days. Yes ý No ¨
Indicate by check mark whether the registrant has submitted electronically and posted on its corporate Web site, if any, every Interactive Data File required to be submitted and posted pursuant to Rule 405 of Regulation S-T during the preceding 12 months (or for such shorter period that the registrant was required to submit and post such files). Yes ý No ¨
Indicate by check mark if disclosure of delinquent filers pursuant to Item 405 of Regulation S-K is not contained herein and will not be contained, to the best of the registrant's knowledge, in definitive proxy or information statements incorporated by reference in Part III of this Form 10-K or any amendment to this Form 10-K. ý
Indicate by check mark whether the registrant is a large accelerated filer, accelerated filer, non-accelerated filer, or smaller reporting company. See the definitions of "large accelerated filer," "accelerated filer" and "smaller reporting company" in Rule 12b-2 of the Exchange Act.
Large accelerated filer | ý | Accelerated filer | ¨ | |||
Non-accelerated filer | ¨ (Do not check if a smaller reporting company) | Smaller reporting company | ¨ | |||
Indicate by check mark whether the registrant is a shell company (as defined in Rule 12b-2 of the Exchange Act). Yes ¨ No ý
The aggregate market value of the common equity held by non-affiliates as of June 30, 2014: $1.1 billion. At February 25, 2015, there were 51,249,477 shares of our $0.01 par value common stock outstanding.
TABLE OF CONTENTS
Page | ||
Item 1. | ||
Item 1A. | ||
Item 1B. | ||
Item 2. | ||
Item 3. | ||
Item 4. | ||
Item 5. | ||
Item 6. | ||
Item 7. | ||
Item 7A. | ||
Item 8. | ||
Item 9. | ||
Item 9A. | ||
Item 9B. | ||
Item 10. | ||
Item 11. | ||
Item 12. | ||
Item 13. | ||
Item 14. | ||
Item 15. | ||
Forward-Looking Statements
All references in this report to "SSE", the "Company", "us", "we", and "our" are to Seventy Seven Energy Inc. and its consolidated subsidiaries. Certain statements contained in this report constitute forward-looking statements within the meaning of Section 27A of the Securities Act of 1933 and Section 21E of the Securities Act of 1934. These statements relate to future events or our future performance. All statements other than statements of historical fact may be forward-looking statements. Forward-looking statements are often, but not always, identified by the use of words such as "seek," "anticipate," "plan," "continue," "estimate," "expect," "may," "project," "predict," "potential," "targeting," "intend," "could," "might," "should," "believe" and similar expressions. These statements involve known and unknown risks and uncertainties and involve assumptions that may cause actual results or events to differ materially from those anticipated in such forward-looking statements. Seventy Seven Energy Inc. believes the expectations reflected in these forward-looking statements are reasonable, but we cannot assure you that these expectations will prove to be correct. We caution you not to place undue reliance on the forward-looking statements contained in this report, which speak only as of the filing date.
Our actual results could differ materially from those anticipated in these forward-looking statements as a result of many factors, including the following factors:
• | dependence on Chesapeake Energy Corporation ("Chesapeake") and its working interest partners for a majority of our revenues and our ability to secure new customers or provide additional services to existing customers; |
• | our customers' expenditures for oilfield services; |
• | the limitations that our level of indebtedness may have on our financial flexibility and restrictions in our debt agreements; |
• | the cyclical nature of the oil and natural gas industry; |
• | market prices for oil and natural gas; |
• | changes in supply and demand of drilling rigs, hydraulic fracturing fleets and other equipment; |
• | our credit profile; |
• | access to and cost of capital; |
• | hazards and operational risks that may not be fully covered by insurance; |
• | increased labor costs or the unavailability of skilled workers; |
• | competitive conditions; |
• | legislative or regulatory changes, including changes in environmental regulations, drilling regulations and liability under federal and state environmental laws and regulations; and |
• | the factors generally described in Item 1A "Risk Factors" in this report. |
If one or more events related to these or other risks and uncertainties materialize, or if our underlying assumptions prove to be incorrect, our actual results may differ materially from what we anticipate. Except as may be required by law, we do not intend, and do not assume any obligation, to update any forward-looking statements.
PART I
Item 1. | Business |
We are a diversified oilfield services company that provides a wide range of wellsite services and equipment to U.S. land-based exploration and production ("E&P") customers operating in unconventional resource plays. We offer services and equipment that are strategic to our customers' oil and natural gas operations. Our services include drilling, hydraulic fracturing, oilfield rentals, rig relocation and fluid handling and disposal. Our operations are geographically diversified across many of the most active oil and natural gas plays in the onshore United States, including the Anadarko and Permian Basins and the Barnett, Eagle Ford, Haynesville, Marcellus, Niobrara and Utica Shales.
On June 30, 2014, we separated from Chesapeake in a series of transactions, which we refer to as the "spin-off." Prior to the spin-off, we were an Oklahoma limited liability company operating under the name "Chesapeake Oilfield Operating, L.L.C." ("COO") and an indirect, wholly-owned subsidiary of Chesapeake. As part of the spin-off, we converted to an Oklahoma corporation operating under the name "Seventy Seven Energy Inc." All of the equity in our Company was distributed pro rata to Chesapeake's shareholders and we became an independent, publicly traded company. Please read "—The Spin-Off" for further discussion of the transactions in which SSE became an independent public company and the agreements we entered into with Chesapeake in connection with the spin-off.
Information About Us
We make available free of charge on our website at www.77nrg.com our annual reports on Form 10-K, quarterly reports on Form 10-Q, current reports on Form 8-K, and amendments to those reports as soon as reasonably practicable after we electronically file such material with or furnish it to the U.S. Securities and Exchange Commission (the "SEC").
Our Operating Segments
We conduct our business through four operating segments: Drilling, Hydraulic Fracturing, Oilfield Rentals, and Oilfield Trucking. For financial information pertaining to our operating segments, please read "Management's Discussion and Analysis of Financial Condition and Results of Operations" and Note 14 of Notes to Consolidated Financial Statements in Items 7 and 8, respectively, of this report.
Drilling
Our drilling segment is operated through our wholly-owned subsidiary, Nomac Drilling, L.L.C., and provides land drilling and drilling-related services, including directional drilling for oil and natural gas E&P activities.
Drilling rig fleet. According to Rig Data, we have the 4th largest active U.S. land-based drilling rig fleet, which we categorize into three operational "Tiers." All of our Tier 1 and Tier 2 rigs are electronically driven and equipped with top drives. Our AC powered Tier 1 and DC powered Tier 2 rigs are predominantly equipped with 1,600 horsepower mud pumps. Approximately 77% of our Tier 1 and Tier 2 rigs are multi-well pad capable, equipped with skidding or walking systems. Our Tier 3 rigs are legacy, mechanical drive rigs.
As of December 31, 2014, our marketed fleet consisted of 26 Tier 1 rigs, including 16 proprietary PeakeRigs™, 57 Tier 2 rigs and seven Tier 3 rigs. We also have 10 PeakeRigs™ under construction, all of which are under contract upon delivery. Our PeakeRigs™ are designed for long lateral drilling of multiple wells from a single location, which makes them well suited for unconventional resource development. We are aggressively pursuing a strategy of upgrading our fleet to better align with the market's demand for multi-well pad drilling in unconventional resource plays. At the end of 2014, we were operating seven Tier 3 rigs and, upon contract completion, we do not intend to continue to actively market these rigs. As part of our long-term strategy, we plan to upgrade or sell all of the Tier 3 rigs that we own and expect that our fleet will consist of only Tier 1 and Tier 2 rigs by the end of 2015.
1
The following table depicts the geographic areas in which our drilling segment operated as of December 31, 2014, including the number of active rigs contracted by Chesapeake and other customers in each geographic area and the total number of active rigs in each geographic area according to Baker Hughes.
Rigs Contracted by | |||||||
Geographic Area | Chesapeake | Other Customers | Total SSE Rigs | Total Active Rigs in Area | |||
Anadarko Basin | 14 | 18 | 32 | 165 | |||
Utica Shale | 8 | 12 | 20 | 49 | |||
Eagle Ford Shale | 15 | 1 | 16 | 185 | |||
Haynesville Shale | 7 | 1 | 8 | 43 | |||
Niobrara Shale | 3 | 2 | 5 | 54 | |||
Permian Basin | — | 4 | 4 | 487 | |||
Marcellus Shale | 2 | — | 2 | 75 | |||
Total | 49 | 38 | 87 | 1,058 | |||
Drilling customers and contracts. Our customers, as operators of the wells that we service, engage us and pay our fees. These contracts provide for drilling services on a well-by-well basis or for a term of a certain number of days or a certain number of wells. The specific terms of each request for other services are typically set forth in a field ticket or purchase or work order. As of December 31, 2014, all of our drilling contracts were daywork contracts. A daywork contract generally provides for a basic rate per day when drilling (the day rate for our providing a rig and crew) and for lower rates when the rig is moving, or when drilling operations are interrupted or restricted by equipment breakdowns, adverse weather conditions or other certain conditions beyond our control. In addition, daywork contracts may provide for a lump-sum fee for the mobilization and demobilization of the rig, which in most cases approximates our incurred costs. As of December 31, 2014, our drilling backlog was $1.0 billion and our total drilling contract early termination value related to this drilling backlog was $476.1 million.
Hydraulic Fracturing
Our hydraulic fracturing segment is operated through our wholly-owned subsidiary, Performance Technologies, L.L.C. ("PTL"), and provides high-pressure hydraulic fracturing (or frac) services and other well stimulation services.
Hydraulic fracturing services. As of December 31, 2014, we owned 10 hydraulic fracturing fleets with an aggregate of 400,000 horsepower and currently seven of these fleets are contracted by Chesapeake in the Anadarko Basin and the Eagle Ford and Utica Shales. Our equipment had an average age of 29 months as of December 31, 2014, which we believe to be among the newest in the industry.
Hydraulic fracturing process. The fracturing process consists of pumping a fracturing fluid into a well at sufficient pressure to fracture the formation. Materials known as proppants, primarily sand or sand coated with resin, are suspended in the fracturing fluid and are pumped into the fracture to prop it open. The fracturing fluid is designed to "break," or lose viscosity, and be forced out of the formation by its pressure, leaving the proppants suspended in the fractures.
Companies offering fracturing services typically own and operate fleets of mobile, high-pressure pumping systems and other heavy equipment. We refer to these pumping systems, each of which consists of a high pressure reciprocating pump, diesel engine, transmission and various hoses, valves, tanks and other supporting equipment, all typically mounted to a flat-bed trailer, as "fracturing units." The group of fracturing units, other equipment and vehicles necessary to perform a typical fracturing job is referred to as a "fleet." Each fleet typically consists of eight to 20 fracturing units; two or more blenders (one used as a backup), which blend the proppant and chemicals into the fracturing fluid; sand bins, which are large containers used to store sand on location; various vehicles used to transport sand, chemicals, gels and other materials; and various service trucks and a monitoring van equipped with monitoring equipment and computers that control the fracturing process. The personnel assigned to each fleet are commonly referred to as a "crew."
An important element of fracturing services is determining the proper fracturing fluid, proppants and injection program to maximize results. We employ field engineering personnel to provide technical evaluation and job design recommendations for customers as an integral element of our fracturing service. Technological developments in the industry over the past several years have focused on proppant density control, liquid gel concentrate capabilities, computer design and monitoring of jobs and cleanup properties for fracturing fluids.
2
We purchase the fracturing fluid additives used in our hydraulic fracturing activities from third-party suppliers. The suppliers are responsible for storage, handling and compatibility of the chemicals used in the fracturing fluid. In addition to performing internal vendor environmental and operational quality control at the well site, we also require our suppliers to adhere to strict environmental and quality standards and to maintain minimum inventory levels at regional hubs, thus ensuring adequate supply for our hydraulic fracturing operations.
Hydraulic fracturing customers and contracts. We contract with our customers pursuant to master services agreements that specify payment terms, audit rights and insurance requirements and allocates certain operational risks through indemnity and similar provisions. We supplement these agreements for each engagement with a bid proposal, subject to customer acceptance, containing terms such as the estimated number of fracturing stages to be performed, pricing, quantities of products required, with horsepower and pressure ratings of the hydraulic fracturing fleets to be used. We are generally compensated based on the number of fracturing stages we complete, and we recognize revenue upon the completion of each fracturing stage. We typically complete one or more fracturing stages per day during the course of a job. A stage is considered complete when the customer requests that pumping discontinue for that stage. Invoices typically include service charges that are determined by hydraulic horsepower requirements and achieved rate of barrels per minute along with product charges for sand, chemicals and other products actually consumed during the course of providing our services.
Oilfield Rentals
Our oilfield rentals segment is operated through our wholly-owned subsidiary, Great Plains Oilfield Rental, L.L.C. ("GPOR"), and provides premium rental tools and specialized services for land-based oil and natural gas drilling, completion and workover activities. We offer an extensive line of rental tools, including a full line of tubular products specifically designed for horizontal drilling and completion, with high-torque, premium-connection drill pipe, drill collars and tubing. Additionally, we offer surface rental equipment including blowout preventers, frac tanks, mud tanks and environmental containment that leverage all phases of the hydrocarbon extraction and production process. Our air drilling equipment and services enable extraction in select basins where segments of certain formations preclude the use of drilling fluid, permitting operators to drill through problematic zones without the risk of fluid absorption and damage to the wellbore. We also provide frac-support services, including rental and rig-up/rig-down of wellhead pressure control equipment ("frac stacks"), delivery of on-site frac water through a water transfer operation and monitoring and controlling of production returns. As of December 31, 2014, we offered oilfield rental services in the Anadarko and Permian Basins and the Eagle Ford, Barnett, Haynesville, Marcellus, Niobrara and Utica Shales. We price our rentals and services based on the type of equipment being rented and the services being performed. Substantially all rental revenue we earn is based upon a charge for the actual period of time the rental is provided to our customer on a market-based fixed per-day or per-hour fee.
Oilfield Trucking
Our oilfield trucking segment is operated through our wholly-owned subsidiaries, Hodges Trucking Company, L.L.C. ("Hodges") and Oilfield Trucking Solutions, L.L.C. ("OTS"). Hodges provides drilling rig relocation and logistics services. As of December 31, 2014, Hodges owned a fleet of 263 rig relocation trucks and 67 cranes and forklifts, which were operating in the Anadarko and Permian Basins and the Barnett, Eagle Ford, Haynesville, Marcellus, and Utica Shales. OTS provides water transport and disposal services. As of December 31, 2014, OTS owned a fleet of 141 water transport trucks that transport water to and from wells in the Eagle Ford, Marcellus and Utica Shales. We price these services by the hour and volume and recognize revenue as services are performed.
Our Strategies
Our principal business objective is to profitably grow our business and to increase shareholder value. We expect to achieve this objective through execution of the following strategies:
Expand and develop relationships with existing and new customers. We intend to utilize our deep understanding of the needs of unconventional resource developers and our strategic position in some of the most active unconventional resource plays in the United States to continue to obtain new customers. We also intend to leverage our drilling relationships with our existing drilling customers and our reputation for quality to provide additional services throughout the drilling and completion lifecycle. We believe the uniquely broad range of services we offer, as well as our diverse geographic footprint, positions us well to attract new customers and cross-sell services to existing customers. We intend to devote significant business development resources to market all of our services, leverage existing relationships and expedite our growth potential. Moreover, we plan to continue to invest capital and move resources to meet our customers' needs. We believe this strategy will strengthen our overall relationships with our customers and increase our market share.
3
Grow and enhance our asset base. As an independent company, we have increased operational control of our business and no longer compete for capital with other Chesapeake businesses. We intend to continue to upgrade our rigs and place in service the new Tier 1 rigs that we are fabricating. Currently, 24 of our 26 Tier 1 rigs and 39 of our 57 Tier 2 rigs are multi-well pad-ready and able to meet the robust demands of E&P customers focused on unconventional resource development. We took delivery of six proprietary PeakeRigsTM in 2014. Additionally, we are fabricating 10 additional PeakeRigsTM, of which eight are expected to be delivered in 2015 and two in 2016. We also have options for two additional PeakeRigTM deliveries in 2016 that may be exercised based upon future market conditions. In response to customer demand, we invested in innovative lay flat pipe for water transfer as an alternative to more expensive and time-consuming steel tubing. We currently expect to spend approximately $190.0 million in aggregate growth capital expenditures in 2015. We believe that targeting the development of high margin services through geographic expansion, vertical integration and asset additions will provide us with greater returns on our investments and support future growth. We also intend to explore opportunistic acquisitions, particularly within our hydraulic fracturing segment, in a manner that is complementary to our existing asset base.
Increase utilization of our oilfield rental assets. We have devoted significant local business development resources to deploy unused capacity in our oilfield rental business, and this investment has resulted in an increase of our non-Chesapeake revenue as a percentage of total oilfield rental revenue from 5% in 2013 to 19% in 2014. We believe we can continue to leverage our relationships with existing drilling and hydraulic fracturing customers to further increase the utilization of our oilfield rental assets over time. We will also continue to bundle our equipment and services to provide value for our customers while increasing utilization.
Leverage our comprehensive service offerings. Our modern, high quality asset base is capable of providing unique operational advantages to our customers. We provide extensive end-to-end complementary services to our customers aimed at reducing time spent on drilling and completion and their total wellhead cost. In addition, the experience gained as an integrated part of Chesapeake, one of the most active developers of unconventional resources in the United States, makes us unique, allows us to better understand our customers' needs and provide high service and efficiency levels across each of our service lines. This allows us to offer our customers significant cost and cycle time advantages. We also believe that over time our bundled service offerings will allow us to move from transactional supplier to strategic partner for a significant number of our customers.
Continue our industry leading safety performance. We are committed to maintaining and continually improving the safety, reliability and efficiency of our operations, which we believe is key to attracting new customers and maintaining relationships with our current customers, regulators and the communities in which we operate. We have a strong Total Recordable Incidence Rate ("TRIR") as compared to our industry peers. In addition, our business goals include safety metrics, which drives continuous improvement regarding quality and safety. We have adopted and developed a management system that requires rigorous processes and procedures to facilitate our compliance with environmental regulations and policies. We also conduct internal and external assessments to verify compliance and identify areas for improvement. We work diligently to meet or exceed applicable safety and environmental regulations and we intend to continue to incorporate safety, environmental and quality principals into our operating procedures as our business grows and operating conditions change.
Continue our strong business relationship with Chesapeake. We have built a strong partnership with Chesapeake from the field level up to the senior management level. Our regional offices and equipment yards are often located near Chesapeake field operations. We believe we can continue to leverage these relationships as an independent company. Even while growing the percentage of our business attributable to other customers, we expect to continue to benefit from our strong relationship with Chesapeake as a valued customer. Please read "—The Spin-Off—Agreements Between Us and Chesapeake" for further discussion of our relationship with Chesapeake.
Improve flexibility in our balance sheet. As an independent company, we have increased financial control of our business and intend to manage our balance sheet to enhance our financial flexibility. Once we have completed our planned growth capital expenditures, we intend to shift our focus toward using excess cash flows from operations to reduce our long-term debt. We believe that the successful execution of our growth strategies together with a reduction in long-term debt over time will enhance our financial flexibility and better position us to take advantage of future business opportunities.
Enhance our liquidity. As we enter what we expect to be a challenging 2015, we intend to focus on the areas that we can control to enhance our liquidity, including by having ongoing discussions with many of our suppliers to reduce product and material costs where possible, shifting a portion of the capital expenditures that we originally budgeted for 2015 to 2016 and working to reduce general and administrative expenses.
4
Customers and Competition
The markets in which we operate are highly competitive and we are dependent on Chesapeake for a significant portion of our revenues. Our customers pay us market-based rates for the services we provide. To the extent that competitive conditions increase and prices for the services and products we provide decrease, the prices we are able to charge our customers for such products and services may decrease.
We are a party to a master services agreement (the "Master Services Agreement") with Chesapeake, pursuant to which we provide drilling and other services and supply materials and equipment to Chesapeake. The Master Services Agreement contains general terms and provisions, specifies payment terms, audit rights and insurance requirements and allocates certain operational risks through indemnity and similar provisions. The agreement will remain in effect until we or Chesapeake provide 30 days written notice of termination. The specific terms of each drilling services request are typically provided pursuant to drilling contracts on a well-by-well basis or for a term of a certain number of days or wells. The specific terms of each request for other services are typically set forth in a field ticket or purchase or work order. We believe that our drilling contracts, field tickets or purchase or work orders with Chesapeake are substantially similar to those in prevailing industry contracts, specifically as they relate to pricing, liabilities and payment terms.
In connection with the spin-off, we supplemented the Master Service Agreement with certain new services agreements, including new drilling contracts and a services agreement for hydraulic fracturing services, among others. Please read "—The Spin-Off—Agreements Between Us and Chesapeake" for further discussion of the new services agreements.
Competitors in each of our operating segments include:
• | Drilling - Helmerich & Payne, Inc., Patterson-UTI Energy, Inc., Trinidad Drilling Ltd., Nabors Industries Ltd., Pioneer Energy Services Corp., and Precision Drilling Corporation. |
• | Hydraulic Fracturing - Halliburton Company, Schlumberger Limited, Baker Hughes Incorporated, FTS International, Inc., and C&J Energy Services, Inc. |
• | Oilfield Rentals - Key Energy Services, Inc., RPC, Inc., Oil States International, Inc., Baker Oil Tools, Weatherford International plc, Basic Energy Services, Inc., Superior Energy Services, Inc., Quail Tools (owned by Parker Drilling Company), and Knight Oil Tools. |
• | Oilfield Trucking - Basic Energy Services, Inc., Key Energy Services, Inc., and Superior Energy Services, Inc. |
We also compete in each of our operating segments against a significant number of other companies with national, regional, or local operations.
Suppliers
We purchase a wide variety of raw materials, parts and components that are made by other manufacturers and suppliers for our use. We are not dependent on any single source of supply for those parts, supplies or materials.
For our drilling rigs, we generally purchase individual components from reputable original equipment manufacturers and then assemble and commission the rigs ourselves at an internal facility, which we believe results in cost savings and higher quality.
We have purchased the majority of our hydraulic fracturing units from United Engines and FTS International. We purchase the raw materials we use in our hydraulic fracturing operations, such as sand, chemicals and diesel fuel, from a variety of suppliers throughout the U.S.
To date, we have generally been able to obtain on a timely basis the equipment, parts and supplies necessary to support our operations. Where we currently source materials from one supplier, we believe that we will be able to make satisfactory alternative arrangements in the event of interruption of supply. However, given the limited number of suppliers of certain of our raw materials, we may not always be able to make alternative arrangements should one of our suppliers fail to deliver or timely deliver our materials.
5
Employees
At every level of our operations, our employees are critical to our success and committed to operational excellence. Our senior management team has extensive experience building, acquiring and managing oilfield services and other assets. Their focus is on optimizing our business and expanding operations. On an operations level, our supervisory and field personnel are empowered with the training, tools and confidence required to succeed in their jobs. As of December 31, 2014, we employed approximately 5,000 people. None of these employees is covered by collective bargaining agreements, and we consider our relationships with our employees to be good.
Risk Management and Insurance
The oilfield services business involves a variety of operating risks, including the risk of fire, explosions, blow-outs, pipe failure, abnormally pressured formations and environmental hazards such as oil spills, natural gas leaks, ruptures or discharges of toxic gases. If any of these should occur, we could incur legal defense costs and suffer substantial losses due to injury or loss of life, severe damage to or destruction of property, natural resources and equipment, pollution or other environmental damage, clean-up responsibilities, regulatory investigation and penalties, and suspension of operations.
We are covered under policies of insurance that we believe are customary in the industry with customary deductibles or self-insured retentions. However, there are no assurances that this insurance will be adequate to cover all losses or exposure to liability. We carry a $200.0 million comprehensive general liability umbrella policy and a $25.0 million contractor's pollution liability policy. We provide workers' compensation insurance coverage to employees in all states in which we operate. While we believe these policies are customary in the industry, they do not provide complete coverage against all operating risks. In addition, our insurance does not cover penalties or fines that may be assessed by a governmental authority. A loss not fully covered by insurance could have a material adverse effect on our financial position, results of operations and cash flows. The insurance coverage that we maintain may not be sufficient to cover every claim made against us and may not be available for purchase in the future on terms we consider commercially reasonable, or at all. Also, in the past, insurance rates have been subject to wide fluctuation, and changes in coverage could result in less coverage, increases in cost or higher deductibles and self-insured retentions.
Our master services agreements include certain indemnification provisions for losses resulting from operations. Generally, we take responsibility for our own people and property while our customers take responsibility for their own people, property and liabilities related to the well and subsurface operations, regardless of either party's negligence or fault. For example, our Master Services Agreement with Chesapeake provides that Chesapeake assumes liability for (a) damage to the hole, including the cost to re-drill; (b) damages or claims arising from loss of control of a well or a blowout; (c) damage to the reservoir, geological formation or underground strata; (d) damages arising from the use of radioactive tools or any contamination resulting therefrom; (e) damages arising from pollution or contamination (other than surface spills attributable to our negligence); (f) liability arising from damage to, or escape of any substance from, any pipeline, vessel or storage or production facility; and (g) allegations of subsurface trespass.
In general, any material limitations on contractual indemnity obligations arise only by applicable state law or public policy. Many states place limitations on contractual indemnity agreements, particularly agreements that indemnify a party against the consequences of its own negligence. Furthermore, certain states, including Texas, Louisiana, New Mexico and Wyoming, have enacted statutes generally referred to as "oilfield anti-indemnity acts" expressly prohibiting certain indemnity agreements contained in or related to oilfield services agreements. Such oilfield anti-indemnity acts may restrict or void a party's indemnification of us. Please read "Risk Factors—Risks Relating to Our Industry and Our Business" in Item 1A of this report.
Safety and Maintenance
Our business involves the operation of heavy and powerful equipment which can result in serious injuries to our employees and third parties and substantial damage to property and the environment. We have comprehensive health, safety and environmental ("HSE") and training programs designed to reduce accidents in the workplace and improve the efficiency of our operations. In addition, our largest customers place great emphasis on HSE and the quality management programs of their contractors. We believe that these factors will gain further importance in the future. We have directed substantial resources toward employee HSE and quality management training programs as well as our employee review process and have benefited from steadily decreasing incident frequencies.
6
Regulation of Operations
We operate under the jurisdiction of a number of federal, state and local regulatory bodies that regulate worker safety standards, the handling of hazardous materials, the transportation of explosives, the protection of the environment and driving standards of operation. Regulations concerning equipment certification create an ongoing need for regular maintenance that is incorporated into our daily operating procedures. Please read "Risk Factors—Risks Relating to Our Industry and Our Business" in Item 1A of this report.
Among the services we provide, we operate as a motor carrier and therefore are subject to regulation by the U.S. Department of Transportation and by various state agencies. These regulatory authorities exercise broad powers, governing activities such as the authorization to engage in motor carrier operations and regulatory safety, financial reporting and certain mergers, consolidations and acquisitions. There are additional regulations specifically relating to the trucking industry, including testing and specification of equipment and product handling requirements. The trucking industry is subject to possible regulatory and legislative changes that may affect the economics of the industry by requiring changes in operating practices or by changing the demand for common or contract carrier services or the cost of providing truckload services. Some of these possible changes include increasingly stringent environmental regulations, changes in the hours of service regulations that govern the amount of time a driver may drive in any specific period, onboard black box recorder devices or limits on vehicle weight and size.
Interstate motor carrier operations are subject to safety requirements prescribed by the U.S. Department of Transportation. To a large degree, intrastate motor carrier operations are subject to safety regulations that mirror federal regulations. Such matters as weight and dimension of equipment are also subject to federal and state regulations. Department of Transportation regulations mandate drug testing of drivers.
From time to time, various legislative proposals are introduced, such as proposals to increase federal, state, or local taxes, including taxes on motor fuels, which may increase our costs or adversely impact the recruitment of drivers. We cannot predict whether, or in what form, any increase in such taxes applicable to us will be enacted.
Environmental Matters
Our operations are subject to various federal, state and local environmental, health and safety laws and regulations pertaining to the release, emission or discharge of materials into the environment, the generation, storage, transportation, handling and disposal of materials (including solid and hazardous wastes), the safety of employees, or otherwise relating to preservation or protection of human health and safety, pollution prevention or remediation, natural resources, wildlife or the environment. Federal environmental, health and safety requirements that govern our operations include the Comprehensive Environmental Response, Compensation, and Liability Act ("CERCLA"), the Clean Water Act, the Safe Drinking Water Act ("SDWA"), the Clean Air Act (the "CAA"), the Resource Conservation and Recovery Act ("RCRA"), the Endangered Species Act, the Migratory Bird Treaty Act, the Occupational Safety and Health Act, and the regulations promulgated pursuant to such laws.
Federal laws, including CERCLA and analogous state laws, may impose joint and several liability, without regard to fault or legality of the original conduct, on classes of persons who are considered responsible for releases of a hazardous substance into the environment. These persons may include the current or former owner or operator of the site where the release occurred and persons that generated, disposed of or arranged for the disposal of hazardous substances at the site. CERCLA and analogous state laws also authorize the Environmental Protection Agency (the "EPA"), state environmental agencies and, in some cases, third parties to take action to mitigate, prevent or respond to threats to human health or the environment and to seek to recover the costs of such actions from responsible classes of persons.
Other federal and state laws, in particular RCRA, regulate hazardous wastes and non-hazardous solid wastes. In the course of our operations, we generate petroleum hydrocarbon wastes and other maintenance wastes. We believe we are in material compliance with all regulations regarding the handling of wastes from our operations. Some of our wastes are not currently classified as hazardous wastes, but may in the future be designated as hazardous wastes and may thus become subject to more rigorous and costly compliance and disposal requirements. Such additional regulation could have a material adverse effect on our business.
We own or lease a number of properties that have been used as service yards in support of oil and natural gas exploration and production activities. Although we have utilized operating and disposal practices that we considered to be standard in the industry at the time, repair and maintenance activities on rigs and equipment stored in these service yards may have resulted in the disposal or release of hydrocarbons, wastes, or hazardous substances, including Naturally Occurring Radioactive Material
7
("NORM") at or from these yards or at or from other locations where these wastes have been taken for treatment, storage or disposal. In addition, we own or lease properties that in the past were used by third parties whose operations were not under our control. These properties and any hydrocarbons or other materials handled thereon may be subject to CERCLA, RCRA or analogous state laws. Under these type of laws, we could be required to remove or remediate previously released hazardous substances, wastes or property contamination.
Further, our operations are subject to the federal CAA and comparable state laws and regulations. These laws and regulations govern emissions of air pollutants from various industrial sources, including our non-road mobile engines, and impose various monitoring and reporting requirements. In 2012, the EPA published final New Source Performance Standards ("NSPS") and National Emissions Standards for Hazardous Air Pollutants ("NESHAP") that amended the existing NSPS and NESHAP standards for oil and gas facilities, and created new NSPS standards for oil and gas production, transmission and distribution facilities. Among other things, these final rules require the reduction of volatile organic compound ("VOC") emissions from natural gas wells through the use of reduced emission completions or "green completions" on all hydraulically fractured gas wells constructed or refractured after January 1, 2015. The final rules under NESHAP include maximum achievable control technology ("MACT") standards for "small" glycol dehydrators that are located at major sources of hazardous air pollutants and modifications to the leak detection standards for valves. At the industry's urging, the EPA amended portions of these rules in 2013 and 2014, and continues to evaluate additional changes. Compliance with the increasingly stringent emissions regulations may result in increased costs as we continue to grow. Beyond that, federal and state regulatory agencies can impose administrative, civil and criminal penalties for non-compliance with air permits or other requirements of the federal CAA and associated state laws and regulations.
The Federal Water Pollution Control Act (commonly known as "the Clean Water Act") and resulting regulations, which are primarily implemented through a system of permits, govern the discharge of certain contaminants into waters of the United States. Sanctions for failure to comply strictly with the Clean Water Act are generally resolved by payment of fines and correction of any identified deficiencies. However, regulatory agencies could require us to cease construction or operation of certain facilities or to cease hauling wastewaters to facilities owned by others that are the source of water discharges. In addition, the Federal Oil Pollution Act of 1990 (OPA) and resulting regulations impose a variety of obligations on responsible parties related to the prevention of oil spills and liability for damages resulting from such spills in waters of the United States. The term "waters of the United States" has been broadly defined to include inland water bodies, including wetlands and intermittent streams. The OPA may assign strict joint and several liability to each responsible party for oil removal costs and for a variety of public and private damages. The OPA also imposes ongoing requirements on a responsible party, including the preparation of oil spill response plans and proof of financial responsibility to cover environmental cleanup and restoration costs that could be incurred in connection with an oil spill.
The SDWA and comparable local and state provisions restrict the disposal, treatment or release of water produced or used during oil and gas development. Subsurface emplacement of fluids (including disposal wells or enhanced oil recovery) is governed by federal or state regulatory authorities that, in some cases, includes the state oil and gas regulatory authority or the state's environmental authority. These regulations may increase the costs of compliance for some facilities.
We seek to manage environmental liability risks through provisions in our contracts with our customers that allocate risks relating to surface activities associated with the fracturing process to us and risks relating to "down-hole" liabilities to our customers. Our contracts generally require our customers to indemnify us against pollution and environmental damages originating below the surface of the ground or arising out of water disposal, or otherwise caused by the customer, other contractors or other third parties. In turn, our contracts generally require us to indemnify our customers for pollution and environmental damages originating at or above the surface caused solely by us. We seek to maintain consistent risk-allocation and indemnification provisions in our customer agreements to the greatest extent possible. Some of our contracts may, however, contain less explicit indemnification provisions, which would typically provide that each party will indemnify the other against liabilities to third parties resulting from the indemnifying party's actions, except to the extent such liability results from the indemnified party's gross negligence, willful misconduct or intentional act.
Federal and state occupational safety and health laws require us to organize and maintain information about hazardous materials used, released or produced in our operations. Certain portions of this information must be provided to employees, state and local governmental authorities and local citizens. We are also subject to the requirements and reporting set forth in federal workplace standards.
We have made and will continue to make expenditures to comply with health, safety and environmental regulations and requirements. These are necessary business costs in the oilfield services industry. Although we are not fully insured against all environmental, health and safety risks, and our insurance does not cover any penalties or fines that may be issued by a governmental authority, we maintain insurance coverage which we believe is customary in the industry. Moreover, it is possible
8
that other developments, such as stricter and more comprehensive environmental, health and safety laws and regulations, as well as claims for damages to property or persons, resulting from company operations, could result in substantial costs and liabilities, including administrative, civil and criminal penalties, to us. We believe that we are in material compliance with applicable health, safety and environmental laws and regulations. We believe that the cost of maintaining compliance with these laws and regulations will not have a material adverse effect on our business, financial position and results of operations, but new or more stringent regulations could increase the cost of doing business and could have a material adverse effect on our business. Moreover, accidental releases or spills may occur in the course of our operations, causing us to incur significant costs and liabilities, including for third-party claims for damage to property and natural resources or personal injury. Please read "Risk Factors—Risks Relating to Our Industry and Our Business" in Item 1A of this report.
Hydraulic Fracturing. Vast quantities of oil, natural gas liquids and natural gas deposits exist in deep shale unconventional formations. It is customary in our industry to recover these resources from these deep formations through the use of hydraulic fracturing, combined with horizontal drilling.
Hydraulic fracturing techniques have been used by the industry since 1947, and currently, more than 90% of all oil and natural gas wells drilled in the U.S. employ hydraulic fracturing. We strive to conduct our fracturing operations in accordance with best practices, industry standards, and all regulatory requirements. For example, we monitor rate and pressure to ensure that the services are performed as planned. We also perform fracturing for wells that have been constructed with multiple layers of protective steel casing surrounded by cement that are specifically designed to protect freshwater aquifers.
Legislative and regulatory efforts at the federal level and in some states have been initiated that may impose additional requirements on our oilfield services, including hydraulic fracturing. Although hydraulic fracturing is typically regulated by state oil and gas commissions, the EPA has asserted federal regulatory authority over hydraulic fracturing involving diesel fuels under the Safe Drinking Water Act's Underground Injection Control Program and has a draft guidance document regarding the process for obtaining a permit for hydraulic fracturing involving diesel fuel. We believe that the guidance will not have a direct material effect on our operations because we do not currently use diesel fuel in connection with our hydraulic fracturing; however, the guidance may lead to the adoption of other permitting restrictions on the use of hydraulic fracturing. The EPA also has commenced a study of the potential impacts of hydraulic fracturing activities on drinking water resources, with a progress report released in late 2012 and a final draft report expected to be released for public comment and peer review in 2015. In addition, the Bureau of Land Management ("BLM") proposed rules in 2013 that would impose new requirements in hydraulic fracturing operations conducted on federal lands, including, among other things, the disclosure of chemical additives used.
Also, legislation has been introduced, from time to time, in Congress to provide for federal regulation of hydraulic fracturing and to require disclosure of the chemicals used in the fracturing process. The states where we operate have developed their own regulations governing oil and gas operations in general, as well as hydraulic fracturing in particular, and they continue to evaluate additional potential requirements. A number of local communities have likewise adopted standards for oil and gas development. In a few instances these have included bans on hydraulic fracturing. To date, these initiatives have not materially affected our operations, but they could spur further action towards federal, state, or local legislation and regulation of hydraulic fracturing activities. At this time, it is not possible to estimate the potential impact on our business of such additional federal, state, or local legislation or regulations affecting hydraulic fracturing. In addition, there is a growing trend among states to require us to provide information about the chemicals and products we maintain on location and use during hydraulic fracturing activities. Many of these laws and regulations require that we disclose information about these chemicals and products. In certain cases, these chemicals and products are manufactured and/or imported by third parties and we therefore must rely upon such third parties for such information. The consequences of any inaccurate disclosure, failure to disclose, or disclosure of confidential or proprietary information by us could have a material adverse effect on our business, financial condition and operational results.
Additional Regulations. Various state governments and regional organizations comprising state governments are considering enacting new legislation and promulgating new regulations governing or restricting the emission of methane, carbon dioxide and other greenhouse gases ("GHG") from stationary sources such as our equipment and operations or promoting the use of renewable energy. Legislative and regulatory proposals for restricting greenhouse gas emissions or otherwise addressing climate change could require us to incur additional operating costs and could adversely affect the oil and natural gas industry and, therefore, could reduce the demand for our products and services. The potential increase in our operating costs could include new or increased costs to obtain permits, operate and maintain our equipment and facilities, install new emission controls on our equipment and facilities, acquire allowances to authorize our greenhouse gas emissions, pay taxes related to our greenhouse gas emissions and administer and manage a greenhouse gas emissions program. Moreover, incentives to conserve energy or use alternative energy sources could reduce demand for oil, natural gas and natural gas liquids. States may pursue the issue either directly or indirectly even in the absence of national legislation. At the federal level, the EPA is pursuing various rulemakings under the CAA to reduce GHG emissions. For example, the EPA (in cooperation with the
9
National Highway Traffic Safety Administration) has promulgated rules restricting greenhouse gas emissions from light, medium and heavy-duty vehicles. The EPA also has announced that it intends to issue a proposed rule in the summer of 2015 to set standards for methane and VOC emissions from new and modified oil and gas production sources and natural gas processing and transmission sources, with a final rule planned for 2016. Restrictions on emissions of methane or carbon dioxide that may be imposed, whether in various states or at the federal level, could adversely affect the oil and natural gas industry and, therefore, could reduce the demand for our products and services.
The Spin-Off
The transactions in which SSE became an independent, publicly traded company, including the distribution, are referred to collectively as the "spin-off". Prior to the spin-off, we conducted our business as COO. As part of the spin-off, we completed the following transactions, among others, which we refer to as the "Transactions":
• | the entrance into our new $275.0 million senior secured revolving credit facility (the "New Credit Facility") and a $400.0 million secured term loan (the "Term Loan"). We used the proceeds from borrowings under these new facilities to repay in full and terminate our existing $500.0 million senior secured revolving credit facility (the "Old Credit Facility"); |
• | the issuance of new 6.50% senior unsecured notes due 2022 (the "2022 Notes") and used the net proceeds of approximately $493.8 million to make a cash distribution of approximately $391.0 million to Chesapeake, to repay a portion of outstanding indebtedness under the New Credit Facility and for general corporate purposes. |
• | we distributed our compression unit manufacturing and geosteering businesses to Chesapeake. Please read "Results of Operations" in Item 7 of this report for further discussion of the financial impact of these businesses to our historical financial results. |
• | we sold our crude hauling assets to a third party and used a portion of the net proceeds received to make a $30.9 million cash distribution to Chesapeake. |
• | Chesapeake transferred to us buildings and real estate used in our business, including property and equipment, at cost of approximately $212.5 million and accumulated depreciation of $22.2 million as of the spin-off date. Prior to the spin-off, we leased these buildings and real estate from Chesapeake pursuant to a facilities lease agreement between us and Chesapeake and incurred lease expense of $8.2 million, $16.5 million and $11.8 million for the years ended December 31, 2014, 2013, and 2012, respectively. In connection with the spin-off, the facilities lease agreement was terminated. |
• | COO transferred all of its existing assets, operations and liabilities, including our 6.625% senior unsecured notes due 2019 (the "2019 Notes"), to Seventy Seven Operating LLC ("SSO"). SSO is an Oklahoma limited liability company, our direct wholly-owned subsidiary and, after giving effect to the Transactions, the direct owner of all our operating subsidiaries. |
• | COO was renamed SSE and converted from a limited liability company to a corporation. |
Agreements Between Us and Chesapeake
In connection with the spin-off, we supplemented the Master Services Agreement with the new agreements described below.
New Services Agreements
In connection with the spin-off, we entered into several services agreements which supplement the Master Services Agreement. Under the new services agreement governing our provision of hydraulic fracturing services for Chesapeake (the "New Services Agreement"), Chesapeake is required to utilize the lesser of (i) seven, five and three of our hydraulic fracturing crews in years one, two and three of the agreement, respectively, or (ii) fifty percent (50%) of the total number of all hydraulic fracturing crews working for Chesapeake in all its operating regions during the respective year. Chesapeake is also required to utilize our hydraulic fracturing services for a minimum number of stages as set forth in the agreement. Chesapeake is entitled to terminate the agreement in certain situations, including in the event we fail to materially comply with the overall quality of service provided by similar service providers. Additionally, Chesapeake's requirement to utilize our services may be suspended under certain circumstances, such as when we are unable to timely accept and supply services ordered by Chesapeake or as a result of a force majeure event. Our hydraulic fracturing backlog under the New Services Agreement as of December 31, 2014 was approximately $1.0 billion.
10
In connection with the spin-off, we also entered into New Services Agreements with Chesapeake governing our provision of oilfield trucking, drilling rig relocation and logistics and oilfield rentals services having terms similar to those we currently use for non-Chesapeake customers. Each agreement was effective on July 1, 2014 and expired on December 31, 2014.
Drilling Contracts
In connection with the spin-off, we entered into rig-specific daywork drilling contracts with Chesapeake for the provision of drilling services having terms similar to those we currently use for other customers (the "Drilling Contracts"). The Drilling Contracts had a commencement date of July 1, 2014 and terms ranging from three months to three years. Chesapeake has the right to terminate a drilling contract in certain circumstances. Our drilling backlog under the Drilling Contracts as of December 31, 2014 was approximately $810.1 million and our early contract termination value related to the Drilling Contracts was $362.7 million.
Master Separation Agreement
The master separation agreement entered into between us and Chesapeake governs the separation of our businesses from Chesapeake, the distribution of our shares to Chesapeake shareholders and other matters related to Chesapeake's relationship with us, including cross-indemnities between us and Chesapeake. In general, Chesapeake agreed to indemnify us for any liabilities relating the Chesapeake's business and we agreed to indemnify Chesapeake for any liabilities relating to our business.
Tax Sharing Agreement
In connection with the spin-off, we and Chesapeake entered into a tax sharing agreement that governs our respective rights, responsibilities, and obligations with respect to tax liabilities and benefits, tax attributes, the preparation and filing of tax returns, the control of audits and other tax proceedings, and certain other matters regarding taxes. References in this summary description of the tax sharing agreement to the terms "tax" or "taxes" mean taxes as well as any interest, penalties, additions to tax or additional amounts in respect of such taxes.
Under the tax sharing agreement, we generally are liable for and will indemnify Chesapeake against all taxes attributable to our business and will be allocated all tax benefits attributable to such business. Chesapeake generally is liable for and will indemnify us against all taxes attributable to its other businesses and will be allocated all tax benefits attributable to such businesses.
Chesapeake generally will be responsible for preparing and filing all tax returns that include both taxes or tax benefits allocable to Chesapeake and taxes or tax benefits allocable to us. Chesapeake generally will be responsible for preparing and filing all tax returns that include only taxes or tax benefits allocable to Chesapeake, and we generally will be responsible for preparing and filing all tax returns that include only taxes or tax benefits allocable to us. However, we generally will not be permitted to take a position on any such tax return that is inconsistent with our or Chesapeake's past practice.
The party responsible for preparing and filing a tax return generally will also have the authority to control all tax proceedings, including tax audits, involving any taxes or adjustment to taxes reported on such tax return, except that we may be entitled, in Chesapeake's discretion, to control tax proceedings relating to tax returns prepared and filed by Chesapeake to the extent that such taxes or adjustments are allocable exclusively to us. The tax sharing agreement further provides for cooperation between us and Chesapeake with respect to tax matters, including the exchange of information and the retention of records that may affect our respective tax liabilities.
Finally, the tax sharing agreement will require that neither we nor any of our affiliates take or fail to take any action after the effective date of the tax sharing agreement that (i) would be reasonably likely to be inconsistent with or cause to be untrue any material statement, covenant or representation in any representation letters, tax opinions or Internal Revenue Service ("IRS") private letter ruling obtained by Chesapeake or (ii) would be inconsistent with the spin-off generally qualifying as a tax-free transaction described under Sections 355 and 368(a)(1)(D) of the Code.
Moreover, Chesapeake generally will be liable for and indemnify us for any taxes arising from the spin-off or certain related transactions that are imposed on us, Chesapeake or its other subsidiaries. However, we would be liable for and indemnify Chesapeake for any such taxes to the extent such taxes result from certain actions or failures to act by us that occur after the effective date of the tax sharing agreement.
11
Employee Matters Agreement
In connection with the spin-off, we and Chesapeake entered into an employee matters agreement, which provides that each of Chesapeake and SSE has responsibility for its own employees and compensation plans. The agreement also contains provisions concerning benefit protection for both SSE and Chesapeake employees, treatment of holders of Chesapeake stock options, restricted stock, restricted stock units and performance share units, and cooperation between us and Chesapeake in the sharing of employee information and maintenance of confidentiality.
Transition Services Agreements
Prior to the spin-off, we had an administrative services agreement (the "Administrative Services Agreement") with Chesapeake pursuant to which Chesapeake allocated certain expenses to us. Under the Administrative Services Agreement, in return for the general and administrative services provided by Chesapeake, we reimbursed Chesapeake on a monthly basis for the overhead expenses incurred by Chesapeake on our behalf in accordance with its allocation policy, which included actual out-of-pocket fees, costs and expenses incurred in connection with the provision of any of the services under the agreement, including the wages and benefits of Chesapeake employees who performed services on our behalf. In connection with the spin-off, we terminated the Administrative Services Agreement and entered into a transition services agreement (the "Transition Services Agreement"). Under the Transition Services Agreement, Chesapeake provides and/or makes available to us various administrative services and assets, for specified periods. The services that Chesapeake currently provides us include:
• | information technology services; |
• | tax services; |
• | internal audit services; |
• | accounting services; |
• | treasury services; and |
• | certain other services specified in the agreement. |
In consideration for such services, we pay Chesapeake fees, a portion of which is a flat fee, generally in amounts intended to allow Chesapeake to recover all of its direct and indirect costs incurred in providing those services. The personnel performing services for us under the Transition Services Agreement are employees and/or independent contractors of Chesapeake and are not under our direction or control. The Transition Services Agreement also contains customary indemnification provisions. During the term of the Transition Services Agreement, we have the right to request a discontinuation of one or more specific services. The Transition Services Agreement will terminate upon cessation of all services provided thereunder. We incurred monthly charges of $3.1 million beginning on July 1, 2014 and by the end of 2014, we reduced our monthly charges to $2.4 million. Beginning on January 1, 2015, our monthly charges decreased to $1.9 million. We plan to terminate the Transition Services Agreement by July 1, 2015.
Item 1A. | Risk Factors |
Risks Relating to Our Industry and Our Business
We are dependent on Chesapeake for a significant portion of our revenues. Therefore, we are indirectly subject to the business and financial risks of Chesapeake. We have no control over Chesapeake's business decisions and operations, and Chesapeake is under no obligation to adopt a business strategy that is favorable to us.
We currently provide a significant percentage of our oilfield services and equipment to Chesapeake and its working interest partners. However, revenues derived from other E&P customers have increased since 2012. For the years ended December 31, 2014, 2013 and 2012, Chesapeake and its working interest partners accounted for approximately 81%, 90% and 94% of our revenues, respectively. If Chesapeake ceases to engage us on terms that are attractive to us during any period, our business, financial condition and results of operations would be materially adversely affected during such period. Accordingly, we are indirectly subject to the business and financial risks of Chesapeake, some of which are the following:
• | the volatility of oil and natural gas prices, which could have a negative effect on the value of Chesapeake's oil and natural gas properties, its drilling program, its ability to finance its operations and its willingness to allocate capital toward exploration and development activities; |
• | the availability of capital on favorable terms to fund its exploration and development activities; |
12
• | its discovery rate of new oil and natural gas reserves and the speed at which it develops such reserves; |
• | uncertainties inherent in estimating quantities of natural gas and oil reserves and projecting future rates of production; |
• | its drilling and operating risks, including potential environmental liabilities; |
• | pipeline, storage and other transportation capacity constraints and interruptions; |
• | adverse effects of governmental and environmental regulation; and |
• | losses from pending or future litigation. |
In particular, Chesapeake has generally made capital expenditures in excess of its operating cash flows. To fund these expenditures, Chesapeake obtained capital from its revolving credit facility, the debt capital markets, oil and natural gas asset sales and other sources. If Chesapeake is unable to generate cash flow from operations sufficient to fund its capital expenditures, Chesapeake may be required to spend less on drilling and completion activities than it otherwise would have, which could have a material adverse impact on our business, financial condition and results of operations.
We serve customers who are involved in drilling for and producing oil and natural gas. Adverse developments affecting the oil and natural gas industry or drilling and completions activity, including sustained low oil, natural gas, or natural gas liquids prices, reduced demand for oil and natural gas products and increased regulation of drilling and production, could have a material adverse effect on our business, financial condition and results of operations.
Our revenues are generated from customers who are engaged in drilling for and producing oil and natural gas. Developments that adversely affect oil and natural gas drilling and production services could adversely affect our customers' demand for our products and services, resulting in a material adverse effect on our business, financial condition and results of operations.
The predominant factor that would reduce demand for our products and services is reduced land-based drilling and completions activity in the continental United States. Commodity prices, and market expectations of potential changes in these prices, may significantly affect this level of activity, as well as the rates paid for our services. Oil and natural gas prices are volatile and have fluctuated dramatically recently. The New York Mercantile Exchange ("NYMEX") price of natural gas futures contracts per MMBtu rebounded from a low of $1.90 in 2011 to a high of $6.15 in early 2014 and dropped to $2.90 as of February 25, 2015. In addition, oil prices reached record highs in 2008, dropped below $40 per barrel in 2009, rose to $107 per barrel in 2014 and traded on the NYMEX at a West Texas Intermediate (WTI) spot price of $50.25 per barrel as of February 25, 2015. We negotiate the rates payable under our contracts based on prevailing market prices. Declines in the prices of oil, natural gas, or natural gas liquids could have an adverse impact on the level of drilling, exploration and production activity, which could materially and adversely affect the demand for our products and services and our results of operations. However, higher commodity prices do not necessarily translate into increased drilling and completions activity because our customers' expectations of future prices also influences their activity. Additionally, we have incurred costs and had downtime in the past as we redeployed equipment and personnel from one play to another to meet our customers' needs and may in the future incur redeployment costs and have downtime any time our customers' activities are refocused towards different drilling regions.
Another factor that would reduce demand for our products and services is a decline in the level of drilling and production activity as a result of increased government regulation of that activity. Our customers' drilling and production operations are subject to extensive federal, state, local and foreign laws and government regulations concerning emissions of pollutants and greenhouse gases; hydraulic fracturing; the handling of oil and natural gas and byproducts thereof and other materials and substances used in connection with oil and natural gas operations, including drilling fluids and wastewater; well spacing; production limitations; plugging and abandonment of wells; unitization and pooling of properties; and taxation. More stringent legislation or regulation, a moratorium on drilling or hydraulic fracturing, or increased taxation of oil and natural gas drilling and completions activity could directly curtail such activity or increase the cost of drilling, resulting in reduced levels of drilling and completions activity and therefore reduced demand for our products and services.
13
Demand for services in our industry is cyclical and depends on drilling and completion spending by Chesapeake and other E&P companies in the U.S., and the level of such activity is cyclical.
Demand for services in our industry is cyclical, and we depend on Chesapeake's and our other customers' willingness to make capital and operating expenditures to explore for, develop and produce oil and natural gas in the U.S. Our customers' willingness to undertake these activities depends largely upon prevailing industry conditions that are influenced by numerous factors over which we have no control, including:
• | prices, and expectations about future prices, of oil and natural gas; |
• | domestic and foreign supply of and demand for oil and natural gas; |
• | the availability, pricing and perceived safety of pipeline, trucking, train storage and other transportation capacity; |
• | lead times associated with acquiring equipment and availability of qualified personnel; |
• | the expected rates of decline in production from existing and prospective wells; |
• | the discovery rates of new oil and natural gas reserves; |
• | laws and regulations relating to environmental matters; |
• | federal, state and local regulation of hydraulic fracturing and other oilfield activities, including public pressure on governmental bodies and regulatory agencies to regulate our industry; |
• | adverse weather conditions, including hurricanes that can affect oil and natural gas operations over a wide area; |
• | oil refining capacity; |
• | merger and divestiture activity among oil and gas producers; |
• | tax laws, regulation and policies; |
• | the availability of water resources and suitable proppants in sufficient quantities and on acceptable terms for use in hydraulic fracturing operations; |
• | the availability, capacity and cost of disposal and recycling services for used hydraulic fracturing fluids; |
• | the political environment in oil and natural gas producing regions, including uncertainty or instability resulting from civil disorder, terrorism or war; |
• | advances in exploration, development and production technologies or in technologies affecting energy consumption; |
• | the price and availability of alternative fuels and energy sources; |
• | uncertainty in capital and commodities markets; and |
• | the ability of oil and natural gas producers to raise capital on favorable terms. |
Anticipated future prices for crude oil and natural gas are a primary factor affecting spending and drilling and completions activity by E&P companies, including Chesapeake. Actual or anticipated lower prices or volatility in prices for oil and natural gas typically decrease spending and drilling and completions activity, which can cause rapid and material declines in demand for our services and in the prices we are able to charge for our services. Worldwide political, economic and military events as well as natural disasters and other factors beyond our control contribute to oil and natural gas price levels and volatility and are likely to continue to do so in the future.
We negotiate the rates payable under our contracts based on prevailing market prices, and, consequently, the prices we are able to charge will fluctuate with market conditions. A material decline in oil and natural gas prices or drilling and completions
14
activity levels or sustained lower prices or activity levels could have a material adverse effect on our business, financial condition, results of operations and cash flows. For example, since the end of the fourth quarter of 2014, we have been experiencing a decline in the demand for our services and the prices we are able to charge in conjunction with the sharp decline in oil prices. If the decline in prices worsens or is prolonged, there would likely be a further negative affect on oil and natural gas production levels and, therefore, we would likely see a further negative affect on the demand for and prices of the services we provide. Additionally, we may incur costs and have downtime any time our customers' activities are refocused towards different drilling regions.
Spending by E&P companies can also be impacted by conditions in the capital markets. Limitations on the availability of capital, or higher costs of capital, for financing expenditures may cause Chesapeake and other E&P companies to make additional reductions to capital budgets in the future even if oil or natural gas prices increase from current levels. Any such cuts in spending will curtail drilling and completion programs as well as discretionary spending on wellsite services, which may result in a reduction in the demand for our services, the rates we can charge and the utilization of our services. Moreover, reduced discovery rates of new oil and natural gas reserves, or a decrease in the development rate of reserves in our market areas, whether due to increased governmental or environmental regulation, limitations on exploration and drilling and completions activity or other factors, could also have an impact on our business, even in a stronger oil and natural gas price environment. An adverse development in any of these areas could have an adverse impact on our customers' operations or financial condition, which could in turn result in reduced demand for our products and services.
Our industry is highly competitive. If we are unable to compete successfully, our profitability may be reduced.
The market for oilfield services in which we operate is highly competitive. Price competition, rig or fleet availability, location and suitability, experience of the workforce, safety records, reputation, operating integrity and condition of the equipment are all factors used by customers in awarding contracts. Our future success and profitability will partly depend upon our ability to keep pace with our customers' demands with respect to these factors. Our competitors are numerous, ranging from terminal companies and major oil companies to other independent marketers and distributors of varying sizes, financial resources and experience. Some of our competitors may have greater financial, technical and personnel resources than us. Contracts are traditionally awarded on the basis of competitive bids or direct negotiations with customers. The competitive environment could intensify if there is consolidation among E&P companies because such consolidation would reduce the number of available customers. The fact that drilling rigs and other oilfield services equipment are mobile and can be moved from one market to another in response to market conditions heightens the competition in the industry. In addition, any increase in the supply of land drilling rigs and hydraulic fracturing fleets could have a material adverse impact on market prices under our contracts and utilization rates of our services. This increased supply could also require higher capital investment to keep our services competitive.
Our business involves many hazards and operational risks, and we are not insured against all the risks we face.
Our operations are subject to many hazards and risks, including the following:
• | accidents resulting in serious bodily injury and the loss of life or property; |
• | liabilities from accidents or damage by our fleet of trucks, rigs and other equipment; |
• | pollution and other damage to the environment; |
• | well blow-outs, the uncontrolled flow of oil, natural gas or other well fluids into or through the environment, including onto the ground or into the atmosphere, surface waters or an underground formation; |
• | fires and explosions; |
• | mechanical or technological failures; |
• | spillage handling and disposing of materials; |
• | adverse weather conditions; and |
• | failure of our employees to comply with our internal environmental health and safety guidelines. |
15
If any of these hazards occur, they could result in suspension of operations, termination of contracts without compensation, damage to or destruction of our equipment and the property of others, or injury or death to our personnel or third parties and could expose us to substantial liability or losses. The frequency and severity of such incidents will affect operating costs, insurability and relationships with customers, employees and regulators. In addition, these risks may be greater for us upon the acquisition of another company that has not allocated significant resources and management focus to safety and has a poor safety record.
We are not fully insured against all risks inherent in our business. For example, we do not have any business interruption/loss of income insurance that would provide coverage in the event of damage to any of our equipment or facilities. Although we are insured for environmental pollution resulting from environmental accidents that occur on a sudden and accidental basis, we may not be insured against all environmental accidents that might occur, some of which may result in toxic tort claims. If a significant accident or event occurs for which we are not adequately insured, it could adversely affect our business, financial condition and results of operations. Furthermore, we may not be able to maintain or obtain insurance of the type and amount we desire at reasonable rates. As a result of market conditions, premiums and deductibles for certain of our insurance policies may substantially increase. In some instances, certain insurance could become unavailable or available only for reduced amounts of coverage. Please read "Business—Risk Management and Insurance" in Item 1 of this report.
Our business may be adversely affected by a deterioration in general economic conditions or the further weakening of the broader energy industry.
A prolonged economic slowdown, another recession in the United States, adverse events relating to the energy industry and local, regional and national economic conditions and factors, particularly a worsening of the recent slowdown in the E&P industry, could negatively impact our operations and therefore, adversely affect our results. The risks associated with our business are more acute during periods of economic slowdown or recession because such periods may be accompanied by decreased spending by our customers.
Restrictions in the agreements governing our outstanding indebtedness could adversely affect our business, financial condition and results of operations.
The operating and financial restrictions in our credit facility, term loan, and in the indentures governing our outstanding notes and any future financing agreements could restrict our ability to finance future operations or capital needs, or otherwise pursue our business activities. For example, our credit facility and the indenture governing our outstanding notes limit our and our subsidiaries' ability to, among other things:
• | incur additional debt or issue guarantees; |
• | incur or permit certain liens to exist; |
• | make certain investments, acquisitions or other restricted payments; |
• | dispose of assets; |
• | engage in certain types of transactions with affiliates; |
• | merge, consolidate or transfer all or substantially all of our assets; and |
• | prepay certain indebtedness. |
Furthermore, our credit facility contains a covenant requiring us to maintain a minimum fixed charge coverage ratio when availability is below a certain threshold and for a certain period.
A failure to comply with the covenants in the agreements governing our indebtedness could result in an event of default, which, if not cured or waived, would permit the exercise of remedies against us that would be likely to have a material adverse effect on our business, financial condition and results of operations. Remedies under our credit facility and term loan include foreclosure on the collateral securing the indebtedness, which includes operating assets and accounts receivable. Moreover, the existence of these covenants may also prevent or delay us from pursuing business opportunities that we believe would otherwise benefit us.
16
We are highly leveraged and may incur additional debt in the future.
As of December 31, 2014, we had $1.599 billion of indebtedness, comprised of $1.150 billion of senior notes, $398.0 million of borrowings outstanding under our term loan, and $50.5 million of borrowings outstanding under our credit facility. As of December 31, 2014, we had approximately $218.7 million of additional borrowing capacity, net of letters of credit of $5.8 million.
Our level of indebtedness will have several important effects on our future operations, including, without limitation:
• | requiring us to dedicate a significant portion of our cash flows from operations to support the payment of debt service; |
• | increasing our vulnerability to adverse changes in general economic and industry conditions, and putting us at a competitive disadvantage relative to competitors that have fewer fixed obligations and greater cash flows to devote to their businesses; |
• | limiting our ability to obtain additional financing for working capital, capital expenditures, general corporate and other purposes; and |
• | limiting our flexibility in operating our business and preventing us from engaging in certain transactions that might otherwise be beneficial to us. |
Any failure to make payments of interest and principal on our outstanding indebtedness on a timely basis or to satisfy our liquidity needs would likely result in a reduction of our credit rating, which could harm our ability to incur additional indebtedness. Any of the foregoing could have a material adverse effect on our business, financial condition and results of operations.
In addition, our credit facility, term loan, and the indentures governing our senior notes restrict, but do not prohibit, us from incurring additional indebtedness and other obligations in the future. If we incur additional debt, the related risks that we face could intensify.
Our assets may require significant amounts of capital for maintenance, upgrades and refurbishment.
Our drilling rigs and hydraulic fracturing fleets may require significant capital investment in maintenance, upgrades and refurbishment to maintain the competitiveness of our assets. Our rigs and fleets typically do not generate revenue while they are undergoing maintenance, refurbishment or upgrades. Any maintenance, upgrade or refurbishment project for our assets could increase our indebtedness or reduce cash available for other opportunities. Further, such projects may require proportionally greater capital investments as a percentage of total asset value, which may make such projects difficult to finance on acceptable terms. To the extent we are unable to fund such projects, we may have fewer rigs and fleets available for service or our rigs and fleets may not be attractive to potential or current customers. Such demands on our capital or reductions in demand for our rigs and fleets could have a material adverse effect on our business, financial condition and results of operations.
We participate in a capital intensive industry and we may not be able to finance our capital needs.
We intend to rely primarily on cash flows from operating activities and borrowings under our credit facility to fund our future capital expenditures. If our cash flows from operating activities and borrowings under our credit facility are not sufficient to fund our capital expenditures, we would be required to fund these expenditures through the issuance of debt or equity or alternative financing plans, such as:
• | refinancing or restructuring our debt; |
• | selling assets; or |
• | reducing or delaying acquisitions or capital investments, such as planned upgrades or acquisitions of equipment and refurbishments of our rigs and related equipment, even if previously publicly announced. |
The terms of existing or future debt instruments may restrict us from adopting some of these alternatives. If debt and equity capital or alternative financing plans are not available on favorable terms or at all, we would be required to curtail our
17
capital spending, and our ability to sustain or improve our profits may be adversely affected. Our ability to refinance or restructure our debt will depend on the condition of the capital markets and our financial condition at such time, among other things. Any refinancing of our debt could be at higher interest rates and may require us to comply with more onerous covenants, which could further restrict our business operations.
We may need to obtain additional capital or financing to fund expansion of our asset base, which could increase our financial leverage.
In order to expand our asset base, we will need to make growth capital expenditures. These expenditures may be significant because our assets require significant capital to purchase and modify. If we do not make sufficient or effective expansion capital expenditures, we will be unable to expand our business operations and may be required to use cash from our operations or incur borrowings or sell common stock or other securities in order to fund our expansion capital expenditures. Our ability to obtain financing or to access the capital markets for future equity or debt offerings may be limited by our financial condition at the time of any such financing or offering, as well as by the covenants in our debt agreements, general economic conditions and contingencies and uncertainties that are beyond our control. In addition, incurring additional debt may significantly increase our interest expense and financial leverage, and issuing common stock may result in significant dilution to our current shareholders.
We may not be successful in identifying and making acquisitions.
Part of our strategy to grow our business is dependent on our ability to make acquisitions that result in an increase in revenues and customer contracts. We may be unable to make accretive acquisitions or realize expected benefits of any acquisitions for any of the following reasons:
• | failure to identify attractive targets in the marketplace; |
• | incorrect assumptions regarding the future results of acquired operations or assets or expected cost reductions or other synergies expected to be realized as a result of acquiring operations or assets; |
• | failure to obtain acceptable financing; |
• | restrictions in our debt agreements; |
• | failure to integrate successfully the operations or management of any acquired operations or assets in a timely manner; |
• | failure to retain or attract key employees; and |
• | diversion of management's attention from existing operations or other priorities. |
Our acquisition strategy requires that we successfully integrate acquired companies into our business practices as well as our procurement, management and enterprise-wide information technology systems. We may not be successful in implementing our business practices at acquired companies, and our acquisitions could face difficulty in transitioning from their previous information technology systems to our own. Any such difficulties, or increased costs associated with such integration, could affect our financial performance and operations.
If we are unable to identify, complete and integrate acquisitions, it could have a material adverse effect on our growth strategy, business, financial condition and results of operations.
Shortages or increases in the costs of the equipment we use in our operations could adversely affect our operations in the future.
We generally do not have long term contracts in place that provide for the delivery of equipment, including, but not limited to, drill pipe, replacement parts and other equipment. We could experience delays in the delivery of the equipment that we have ordered and its placement into service due to factors that are beyond our control. New federal regulations regarding diesel engines, demand by other oilfield services companies and numerous other factors beyond our control could adversely affect our ability to procure equipment that we have not yet ordered or cause the prices of such equipment to increase. Price
18
increases, delays in delivery and interruptions in supply may require us to increase capital and repair expenditures and incur higher operating costs. In certain instances, we may have the ability to cancel purchases of equipment that may no longer be needed. Each of these could have a material adverse effect on our business, financial condition and results of operations.
We are dependent on a small number of suppliers for key raw materials and finished products.
We do not have long term contracts with third party suppliers for many of the raw materials and finished products that we use in large volumes in our operations, including, in the case of our hydraulic fracturing operations, proppants, acid, gels, including guar gum, chemicals and water, and fuels used in our equipment and vehicles. Especially during periods in which oilfield services are in high demand, the availability of raw materials and finished products used in our industry decreases and the price of such raw materials and finished products increases. We are dependent on a small number of suppliers for key raw materials and finished products. Our reliance on such suppliers could increase the difficulty of obtaining such raw materials and finished products in the event of shortage in our industry or cause us to pay higher prices to obtain such raw materials and finished products. Price increases, delays in delivery and interruptions in supply may require us to incur higher operating costs. Each of these could have a material adverse effect on our business, financial condition and results of operations.
The loss of key executives could adversely affect our ability to effectively operate and manage our business.
We are dependent upon the efforts and skills of our executives to operate and manage our business. We cannot assure you that we will be able to retain these employees, and the loss of the services of one or more of our key executives could increase our exposure to the other risks described in this "Risk Factors" section. We do not maintain key man insurance on any of our personnel.
Increased labor costs or the unavailability of skilled workers could hurt our operations.
We are dependent upon an available pool of skilled employees to maintain our business. We compete with other oilfield services businesses and other employers to attract and retain qualified personnel with the technical skills and experience required to provide the highest quality service. The demand for skilled workers is high and the supply is limited during periods of high drilling and completions activity levels, and a shortage in the labor pool of skilled workers or other general inflationary pressures or changes in applicable laws and regulations could make it more difficult for us to attract and retain personnel and could require us to enhance our wage and benefits packages thereby increasing our operating costs.
Although our employees are not covered by a collective bargaining agreement, union organizational efforts could occur and, if successful, could increase our labor costs. A significant increase in the wages paid by competing employers or the unionization of groups of our employees could result in increases in the wage rates that we must pay. Likewise, laws and regulations to which we are subject, such as the Fair Labor Standards Act, which governs such matters as minimum wage, overtime and other working conditions, can increase our labor costs or subject us to liabilities to our employees. We cannot assure you that labor costs will not increase. Increases in our labor costs or unavailability of skilled workers could impair our capacity and diminish our profitability, having a material adverse effect on our business, financial condition and results of operations.
Historically, our industry has experienced a high annual employee turnover rate. We believe that the high turnover rate is attributable to the nature of the work, which is physically demanding and performed outdoors, and to the volatility and cyclical nature of the oilfield services industry. As a result, workers may choose to pursue employment in fields that offer a more desirable work environment at wage rates that are competitive with ours. We cannot assure you that we will be able to recruit, train and retain an adequate number of workers to replace departing workers. The inability to maintain an adequate workforce could have a material adverse effect on our business, financial condition and results of operations.
We may record losses or impairment charges related to idle assets or assets that we sell.
Prolonged periods of low utilization, changes in technology or the sale of assets below their carrying value may cause us to experience losses. These events could result in the recognition of impairment charges that reduce our net income. Please read Note 4 to the audited consolidated financial statements in Item 8 of this report for more information, including a summary of impairment charges we have recognized previously. Significant impairment charges as a result of a decline in market conditions or otherwise could have a material adverse effect on our financial condition.
19
Our inability to obtain or implement new technology may cause us to become less competitive.
The oilfield services industry is subject to the introduction of new drilling and completion techniques and services using new technologies, some of which may be subject to patent protection or costly to obtain. As competitors and others use or develop new technologies in the future, we may be placed at a competitive disadvantage. Furthermore, we may face competitive pressure to implement or acquire certain new technologies at a substantial cost. Some of our competitors have greater financial, technical and personnel resources that may allow them to enjoy technological advantages and implement new technologies before we can. We cannot be certain that we will be able to implement new technologies or products on a timely basis or at an acceptable cost. Thus, limits on our ability to effectively use and implement new and emerging technologies may have a material adverse effect on our business, financial condition and results of operations.
Any future decreases in the rate at which oil or natural gas reserves are discovered or developed could decrease the demand for our services.
Reduced discovery rates of new oil and natural gas reserves, or a decrease in the development rate of reserves, in our market areas, whether due to increased governmental regulation, limitations on exploration and drilling and completions activity or other factors, could have a material adverse impact on our business, financial condition and results of operations even in a stronger oil and natural gas price environment.
Oilfield anti-indemnity provisions enacted by many states may restrict or prohibit a party's indemnification of us.
We typically enter into agreements with our customers governing the provision of our services, which usually include certain indemnification provisions for losses resulting from operations. Such agreement may require each party to indemnify the other against certain claims regardless of the negligence or other fault of the indemnified party; however, many states place limitations on contractual indemnity agreements, particularly agreements that indemnify a party against the consequences of its own negligence. Furthermore, certain states, including Louisiana, New Mexico, Texas and Wyoming, have enacted statutes generally referred to as "oilfield anti-indemnity acts" expressly prohibiting certain indemnity agreements contained in or related to oilfield services agreements. Such oilfield anti-indemnity acts may restrict or void a party's indemnification of us, which could have a material adverse effect on our business, financial condition and results of operations.
Our current backlog of contract drilling and hydraulic fracturing revenue may not be fully realized.
As of December 31, 2014, the contract backlog associated with our drilling and hydraulic fracturing services was approximately $2.0 billion. This amount reflects the number of days remaining in our existing drilling contracts multiplied by the applicable contractual day rate and the number of guaranteed stages remaining in our existing New Services Agreement for hydraulic fracturing multiplied by the estimated rate per stage, based on the then current contract pricing. The contractual rate may be higher than the actual rate we receive because of a number of factors, including downtime or suspension of operations. Several factors could cause downtime or a suspension of operations, many of which are beyond our control, including:
• | breakdowns of equipment; |
• | work stoppages, including labor strikes; |
• | shortages or material and skilled labor; |
• | severe weather or harsh operating conditions; and |
• | force majeure events. |
With respect to our hydraulic fracturing backlog, our New Services Agreement provides for periodic adjustments of the rates we may charge for our services thereunder, which will be negotiated based on then prevailing market pricing and in the future may be higher or lower than the current rates we charge. Moreover, we can provide no assurance that our customers will be able or willing to fulfill their contractual commitments to us. Liquidity issues could lead our customers to go into bankruptcy or could encourage our customers to seek to repudiate, cancel or renegotiate our contracts for various reasons. Many of our contracts permit early termination of the contracts by the customer for convenience (without cause), generally exercisable upon advance notice to us and in some cases without making an early termination payment to us. We calculate our contract drilling early termination value assuming each rig remains stacked for the remainder of the term of the terminated contract. Our
20
inability to realize the full amount of our contract backlog amounts and early termination amounts may have a material adverse effect on our business, financial position and results of operations.
Conservation measures and technological advances could reduce demand for oil and natural gas.
Fuel conservation measures, alternative fuel requirements, increasing consumer demand for alternatives to oil and natural gas, technological advances in fuel economy and energy generation devices could reduce demand for oil and natural gas. Management cannot predict the impact of the changing demand for oil and natural gas services, and any major changes may have a material adverse effect on our business, financial condition and results of operations.
Delays in obtaining permits by our customers for their operations could impair our business.
Our customers are required to obtain permits from one or more governmental agencies in order to perform drilling and/or completion activities. Such permits are typically required by state agencies but can also be required by federal and local governmental agencies. The requirements for such permits vary depending on the location where such drilling and completion activities will be conducted. As with all governmental permitting processes, there is a degree of uncertainty as to whether a permit will be granted, the time it will take for a permit to be issued and the conditions which may be imposed in connection with the granting of the permit. Certain regulatory authorities have delayed or suspended the issuance of permits while the potential environmental impacts associated with issuing such permits can be studied and appropriate mitigation measures evaluated. Permitting delays, an inability to obtain new permits or revocation of our or our customers' current permits could cause a loss of revenue and could materially and adversely affect our business, financial condition and results of operations.
Changes in trucking regulations may increase our costs and negatively impact our results of operations.
For the transportation and relocation of our drilling rigs and oilfield services equipment and our fluid handling operations, we operate trucks and other heavy equipment. Therefore, we are subject to regulation as a motor carrier by the U.S. Department of Transportation and by various state agencies, whose regulations include certain permit requirements of highway and safety authorities. These regulatory authorities exercise broad powers over our trucking operations, generally governing such matters as the authorization to engage in motor carrier operations, safety, equipment testing and specifications and insurance requirements. The trucking industry is subject to possible regulatory and legislative changes that may impact our operations, such as changes in fuel emissions limits, the hours of service regulations that govern the amount of time a driver may drive or work in any specific period, limits on vehicle weight and size and other matters. On May 21, 2010, President Obama signed an executive memorandum directing the National Highway Traffic Safety Administration ("NHTSA") and the EPA to develop new, stricter fuel efficiency standards for medium- and heavy-duty trucks. On September 15, 2011, the NHTSA and the EPA published regulations that regulate fuel efficiency and greenhouse gas emissions from medium- and heavy-duty trucks, beginning with vehicles built for model year 2014. As a result of these regulations, we may experience an increase in costs related to truck purchases and maintenance, an impairment of equipment productivity, a decrease in the residual value of these vehicles and an increase in operating expenses. Proposals to increase federal, state or local taxes, including taxes on motor fuels, are also made from time to time, and any such increase would increase our operating costs. We cannot predict whether, or in what form, any legislative or regulatory changes applicable to our trucking operations will be enacted and to what extent any such legislation or regulations could increase our costs or otherwise adversely affect our business, financial condition and results of operations.
Changes in laws or government regulations regarding hydraulic fracturing could increase our costs of doing business, limit the areas in which our customers can operate and reduce oil and natural gas production by our customers, which could adversely impact our business.
Recently, there has been increased public concern regarding the adequacy of water supplies, an alleged potential for hydraulic fracturing to adversely affect drinking water, and the suitability of disposal outlets. This has led to federal, state and local proposals that would increase the regulatory burden on hydraulic fracturing. Presently, hydraulic fracturing is regulated primarily at the state level, typically by state oil and natural gas commissions and similar agencies. Several states where we conduct our water and environmental services business, such as Texas and Pennsylvania, have either adopted or proposed laws and/or regulations to require oil and natural gas operators to disclose chemical ingredients and water volumes used to hydraulically fracture wells. The chemical ingredient information is generally available to the public via online databases, and this may bring more public scrutiny to hydraulic fracturing operations. Apart from disclosure obligations, states have been imposing more stringent well construction and monitoring requirements. Local governments likewise have been enacting restrictions on fracturing. Congress has in recent legislative sessions considered legislation to amend the SDWA, including legislation that would repeal the exemption for hydraulic fracturing from the definition of "underground injection" and require
21
federal permitting and regulatory control of hydraulic fracturing, as well as legislative proposals to require disclosure of the chemical constituents of the fluids used in the fracturing process. The U.S. Congress may consider similar SDWA legislation in the future.
Federal agencies have been pursuing a variety of initiatives relating to hydraulic fracturing. For example, the EPA has asserted federal regulatory authority pursuant to the SDWA over certain hydraulic fracturing activities involving the use of diesel fuels and published permitting guidance on February 11, 2014 addressing the performance of such activities using diesel fuels in those states where the EPA is the permitting authority. Also, in 2014, the EPA issued an advance notice or rulemaking under the Toxic Substances Control Act to solicit public input on the information that should be reported or disclosed for hydraulic fracturing chemical substances and mixtures. Further, the EPA has announced its intention to propose federal Clean Water Act regulations in 2015 that would govern wastewater discharges from hydraulic fracturing and certain other natural gas operations. In addition, the U.S. Department of the Interior published a revised proposed rule on May 16, 2013 that would update existing regulation of hydraulic fracturing activities on federal lands, including requirements for disclosure, well bore integrity and handling of flowback water. Moreover, in June 2012, the Occupational Safety and Health Administration ("OSHA") and the National Institute of Occupational Safety and Health ("NIOSH") issued a joint hazard alert for workers who use silica (commonly referred to as "sand") in hydraulic fracturing activities. OSHA formally proposed to lower the permissible exposure limit for airborne silica in 2013, and it has prepared guidance identifying other workplace hazards resulting from hydraulic fracturing along with ways to reduce exposure to those hazards.
In addition, the EPA is conducting a study of the potential impacts of hydraulic fracturing activities on drinking water. The EPA issued a Progress Report in December 2012 and a draft final report is anticipated in 2015 for peer review and public comment. As part of this study, the EPA requested that certain companies provide them with information concerning the chemicals used in the hydraulic fracturing process. This study, or other studies that may be undertaken by the EPA or other governmental authorities, could spur still additional initiatives to regulate hydraulic fracturing under the SDWA or otherwise. If new federal, state or local laws or regulations that significantly restrict hydraulic fracturing activities are adopted, such legal requirements could result in delays, eliminate certain drilling and completions activities and make it more difficult or costly for us to perform fracturing. Any such regulations limiting or prohibiting hydraulic fracturing could reduce oil and natural gas exploration and production activities by our customers and, therefore, adversely affect our business. Such laws or regulations could also materially increase our costs of compliance and doing business by more strictly regulating how hydraulic fracturing wastes are handled or disposed. The impact of such requirements could be materially adverse to our business, financial condition and results of operations.
We and our customers are subject to federal, state and local laws and regulations regarding issues of health, safety, climate change and protection of the environment. Under these laws and regulations, we may become liable for penalties, damages or costs of remediation or other corrective measures. Any changes in laws or government regulations could increase our costs of doing business.
Our and our customers' operations are subject to stringent federal, state and local laws and regulations relating to, among other things, protection of natural resources, wetlands, endangered species, the environment, health and safety, waste management, waste disposal and transportation of waste and other materials. Our operations pose risks of environmental liability, including leakage from our operations to surface or subsurface soils, surface water or groundwater. Environmental laws and regulations often impose strict liability and may impose joint and several liability. Therefore, in some situations, we could be exposed to liability as a result of our conduct that was lawful at the time it occurred or the conduct of, or conditions caused by, third parties without regard to whether we caused or contributed to the conditions. Actions arising under these laws and regulations could result in the shutdown of our operations, fines and penalties, expenditures for remediation or other corrective measures, and claims for liability for property damage, exposure to hazardous materials, exposure to hazardous waste or personal injuries. Sanctions for noncompliance with applicable environmental laws and regulations also may include the assessment of administrative, civil or criminal penalties, revocation of permits, temporary or permanent cessation of operations in a particular location and issuance of corrective action orders. Such claims or sanctions and related costs could cause us to incur substantial costs or losses and could have a material adverse effect on our business, financial condition and results of operations. Additionally, an increase in regulatory requirements on oil and natural gas exploration and completion activities could significantly delay or interrupt our operations.
In response to certain scientific studies suggesting that emissions of GHGs, including carbon dioxide and methane, are contributing to the warming of the Earth's atmosphere and other climatic conditions, the U.S. Congress has considered adopting comprehensive legislation to reduce emissions of GHGs, and almost one-half of the states have already taken legal measures to reduce emissions of GHGs, primarily through measures to promote the use of renewable energy and/or regional GHG cap-and-trade programs. In addition, in December 2009, the EPA determined that emissions of carbon dioxide, methane and certain
22
other GHGs endanger public health and the environment because emissions of such gases are, according to the EPA, contributing to warming of the Earth's atmosphere and other climatic changes. Based on these findings, the EPA has begun adopting and implementing regulations to restrict emissions of GHGs under existing provisions of the Clean Air Act ("CAA"). The EPA has already adopted rules under the CAA that require a reduction in emissions of GHGs from motor vehicles, permits for certain large stationary sources of GHGs, and monitoring and reporting of GHG emissions from specified GHG emission sources, including oil and natural gas exploration and production operations, on an annual basis. The EPA continues to consider other GHG rules, including standards for existing power plants that could lend to the creation of additional state GHG control programs. Although it is not possible at this time to estimate how potential future laws or regulations addressing GHG emissions would impact our business, either directly or indirectly, any future federal, state or local laws or implementing regulations that may be adopted to address GHG emissions in areas where we operate could require us or our customers to incur increased compliance and operating costs. Regulation of GHGs could also result in a reduction in demand for and production of oil and natural gas, which would result in a decrease in demand for our services. Additionally, to the extent that unfavorable weather conditions are exacerbated by global climate change or otherwise, our operations may be adversely affected to a greater degree than we have previously experienced, including an increase in delays and costs. We cannot predict with any certainty at this time how these possibilities may affect our operations, but effects could be materially adverse. Restrictions on emissions of methane or carbon dioxide that may be imposed in various states likewise could adversely affect the oil and natural gas industry. Moreover, incentives to conserve energy or use alternative energy sources could reduce demand for oil and natural gas.
The EPA regulates air emissions from certain off-road diesel engines that are used by us to power equipment in the field. Under these Tier IV regulations, we are required to retrofit or retire certain engines, and we are limited in the number of non-compliant off-road diesel engines we can purchase. Tier IV engines are costlier and are not always available. Until Tier IV-compliant engines that meet our needs are available, these regulations could limit our ability to acquire a sufficient number of engines to expand our fleet and to replace existing engines as they are taken out of service.
Laws protecting the environment generally have become more stringent over time and we expect them to continue to do so, which could lead to material increases in our costs for future environmental compliance and remediation.
Severe weather could have a material adverse effect on our business.
Adverse weather can directly impede our operations. Repercussions of severe weather conditions may include:
• | curtailment of services; |
• | weather-related damage to facilities and equipment, resulting in suspension of operations; |
• | inability to deliver equipment and personnel to job sites in accordance with contract schedules; and |
• | loss of productivity. |
These constraints could delay our operations and materially increase our operating and capital costs. Unusually warm winters or cool summers may also adversely affect the demand for our services by decreasing the demand for natural gas. Our operations in semi-arid regions can be affected by droughts and other lack of access to water used in our operations, especially with respect to our hydraulic fracturing operations.
Our historical financial information is not necessarily indicative of our future financial condition or future results of operations nor does it reflect what our financial condition or results of operations would have been as an independent public company during the periods presented.
The historical financial information prior to June 30, 2014 that we have included in this Form 10-K does not reflect what our financial condition or results of operations would have been as an independent public company during the periods presented and is not necessarily indicative of our future financial condition or future results of operations. This is primarily a result of the following factors:
• | our historical financial results prior to June 30, 2014 reflect allocations of expenses for services historically provided by Chesapeake, and those allocations may be significantly lower than the comparable expenses we would have incurred as an independent company; |
23
• | our historical financial results prior to June 30, 2014 reflect Chesapeake's guarantee of utilization levels for our drilling rigs and following the spin-off such guarantee was terminated; |
• | our historical financial results prior to June 30, 2014 do not reflect various transactions that were effected in connection with the spin-off; |
• | contracts with customers may be at less favorable rates than those in place under our arrangement with Chesapeake prior to the spin-off; |
• | our cost of debt and other capitalization is different from that reflected in our historical financial statements; and |
• | the historical financial information may not fully reflect the increased costs associated with being an independent public company, including significant changes in our cost structure, management, financing arrangements, cash tax payment obligations and business operations as a result of our spin-off from Chesapeake, including all the costs related to being an independent public company. |
We have a relatively short history of operating as an independent public company. We may encounter difficulties in making the changes necessary to operate as an independent public company, and we may incur greater costs as an independent public company.
Prior to June 30, 2014, we used Chesapeake's infrastructure to support our business functions, including the following functions:
• | accounting; |
• | information technology and systems; |
• | legal; |
• | tax; |
• | internal audit; |
• | human resources; |
• | provision of office and yard space; |
• | risk management; and |
• | treasury. |
Since the spin-off, we have not had the same access to Chesapeake's support services as we had prior to the spin-off, and we have been establishing our own. We currently pay Chesapeake for many support services on a transitional basis pursuant to the Transition Services Agreement. For more information regarding the Transition Services Agreement, please read "Business—The Spin-Off—Agreements Between Us and Chesapeake" in Item 1 of this report. However, we cannot assure you that all these functions will be successfully executed by Chesapeake during the transition period or that we will not have to expend significant efforts or costs materially in excess of those estimated in the Transition Services Agreement. Any interruption in these services could have a material adverse effect on our business, financial condition and results of operations. In addition, at the end of this transition period, we will need to perform these functions ourselves or hire third parties to perform these functions on our behalf. The costs associated with performing or outsourcing these functions may exceed those charged by Chesapeake when we were part of Chesapeake or during the transition period. A significant increase in the costs of performing or outsourcing these functions could adversely affect our business, financial condition and results of operations.
Our accounting and other management systems and resources may not be sufficient to allow us to meet the financial reporting and other requirements to which we are subject following the spin-off.
Prior to the spin-off, we utilized Chesapeake's systems, software and personnel to meet our reporting obligations pursuant to the Securities Exchange Act of 1934, as amended (the "Exchange Act"), including Section 404 of the Sarbanes-Oxley Act of
24
2002, which requires annual assessments of the effectiveness of our internal control over financial reporting and a report by our independent registered public accounting firm expressing an opinion on the effectiveness of our internal control over financial reporting. Since the spin-off, we have been required to assume responsibility for these functions. Transitioning these functions requires, in some cases, that we add personnel and upgrade our systems, including information technology, implement additional financial and managerial controls, reporting systems and procedures and transition various services to third party vendors. These activities place significant demands on our management, administrative and operational resources, including accounting resources, and involve risks relating to our failure to manage this transition adequately. If we are unable to upgrade our financial and management controls, reporting systems, information technology and procedures in a timely and effective fashion, our ability to comply with our financial reporting requirements and other rules that apply to reporting companies under the Exchange Act could be adversely effected. For instance, in this annual report on Form 10-K, we have disclosed a material weakness in our internal control over financial reporting relating to the transition of payroll functions to a third party payroll processor. While this material weakness did not result in any material misstatement in our financial statements included within this Form 10-K, the existence of material weaknesses or significant deficiencies could result in errors in our financial statements, and substantial costs and resources may be required to rectify any internal control deficiencies. If we cannot produce reliable financial reports, investors could lose confidence in our reported financial information, our stock price could decline, our ability to obtain financing might be adversely impacted and our business and financial condition could be harmed.
A delay in completing the implementation, or a sustained failure of, our enterprise resource planning systems could adversely affect our business.
Since the spin-off, we have begun to implement and use enterprise resource planning systems to operate our business. A delay in completing the implementation, or a sustained failure, of these systems could adversely affect our business by preventing us from:
• | closing our financials and preparing financial statements; |
• | tracking our repair and maintenance, payroll and other expenses; |
• | tracking fixed assets or purchase orders and receipts for supply chain purchases; |
• | gaining visibility of the financial performance at each of lines of business; and |
• | being able to properly manage the needs of customers. |
Following the completion of implementation, we will integrate our enterprise resource planning systems into our operations. If our information technology systems are disrupted due to problems with the integration of such systems or otherwise, our customers could determine that we have become unreliable and decrease their utilization of our services. Such a disruption to our information technology systems could have an adverse effect on our business, financial condition and results of operations.
We are subject to continuing contingent liabilities of Chesapeake following the spin-off.
There are several significant areas where the liabilities of Chesapeake may become our obligations. For example, under the Internal Revenue Code (the "Code") and the related rules and regulations, each corporation that was a member of Chesapeake's consolidated tax reporting group during any taxable period or portion of any taxable period ending on or before the effective time of the spin-off is jointly and severally liable for the federal income tax liability of the entire consolidated tax reporting group for that taxable period. We have entered into a tax sharing agreement with Chesapeake that allocates the responsibility for prior period taxes of Chesapeake's consolidated tax reporting group between us and Chesapeake and its subsidiaries. Please read "Business—The Spin-Off—Agreements Between Us and Chesapeake" in Item 1 of this report. However, if Chesapeake were unable to pay, we nevertheless could be required to pay the entire amount of such taxes. Other provisions of federal law establish similar liability for other matters, including laws governing tax-qualified pension plans as well as other contingent liabilities.
Our tax sharing agreement limits our ability to take certain actions and may require us to indemnify Chesapeake for significant tax liabilities which cannot be precisely quantified at this time.
Under the terms of our tax sharing agreement with Chesapeake, we generally are responsible for all taxes attributable to our business, whether accruing before, on or after the date of the spin-off, and Chesapeake generally is responsible for any taxes
25
arising from the spin-off or certain related transactions that are imposed on us, Chesapeake or its other subsidiaries. Although Chesapeake generally will be responsible for any taxes arising from the spin-off, we would be responsible for any such taxes to the extent such taxes result from certain actions or failures to act by us that occur after June 30, 2014, the effective date of the tax sharing agreement. Our liabilities under the tax sharing agreement could have a material adverse effect on us. At this time, we cannot precisely quantify the amount of liabilities we may have under the tax sharing agreement and there can be no assurances as to their final amounts.
In addition, in the tax sharing agreement we covenanted not to take any action, or fail to take any action, after the effective date of the tax sharing agreement, which action or failure to act is inconsistent with the spin-off qualifying under Sections 355 and 368(a)(1)(D) of the Code. In particular, we might determine to continue to operate certain of our business operations for the foreseeable future even if a sale or discontinuance of such business might otherwise have been advantageous. Moreover, in light of the requirements of Section 355(e) of the Code, we might determine to forgo certain transactions, including share repurchases, stock issuances, certain asset dispositions or other strategic transactions for some period of time following the spin-off. In addition, our indemnity obligation under the tax sharing agreement might discourage, delay or prevent a change of control transaction for some period of time following the spin-off.
For a more detailed discussion, please read "Business—The Spin-Off—Agreements Between Us and Chesapeake" in Item 1 of this report.
Potential indemnification liabilities to Chesapeake pursuant to the master separation agreement could materially adversely affect our company.
The master separation agreement with Chesapeake provides for, among other things, provisions governing the relationship between our company and Chesapeake resulting from the spin-off. For a description of the terms of the master separation agreement, please read "Business—The Spin-Off—Agreements Between Us and Chesapeake" in Item 1 of this report. Among other things, the master separation agreement provides for indemnification obligations designed to make our company financially responsible for substantially all liabilities that may exist relating to our business activities incurred after the spin-off. If we are required to indemnify Chesapeake under the circumstances set forth in the master separation agreement, we may be subject to substantial liabilities. Additionally, in certain circumstances, we will be prohibited from making an indemnity claim until we first seek an insurance recovery.
In connection with our separation from Chesapeake, Chesapeake will indemnify us for certain liabilities. However, there can be no assurance that the indemnity will be sufficient to insure us against the full amount of such liabilities, or that Chesapeake's ability to satisfy its indemnification obligation will not be impaired in the future.
Pursuant to the master separation agreement and tax sharing agreement, Chesapeake has agreed to indemnify us for certain liabilities. However, third parties could seek to hold us responsible for any of the liabilities that Chesapeake has agreed to retain, and there can be no assurance that the indemnity from Chesapeake will be sufficient to protect us against the full amount of such liabilities, or that Chesapeake will be able to fully satisfy its indemnification obligations. Moreover, even if we ultimately succeed in recovering from Chesapeake any amounts for which we are held liable, we may be temporarily required to bear these losses. If Chesapeake is unable to satisfy its indemnification obligations, the underlying liabilities could have a material adverse effect on our business, financial condition and results of operations.
Several members of our board and management may have conflicts of interest because of their ownership of shares of common stock or performance share units of Chesapeake.
Several members of our board and management own shares of common stock of Chesapeake, and with respect to our Chief Executive Officer, performance share units of Chesapeake, because of their prior relationships with Chesapeake. This ownership could create, or appear to create, potential conflicts of interest when our directors and executive officers are faced with decisions that could have different implications for our company and Chesapeake.
Item 1B. | Unresolved Staff Comments | |||
None.
26
Item 2. | Properties | |||
We conduct our operations out of a number of field offices, yards, shops, terminals and other facilities principally located in Ohio, Oklahoma, Pennsylvania, Texas, West Virginia and Wyoming. Each of these facilities were transferred to us from Chesapeake at the time of the spin-off. We do not believe that any one of these facilities is individually material to our operations.
Item 3. | Legal Proceedings | |||
We are subject to various legal proceedings and claims arising in the ordinary course of our business. Our management does not expect the outcome of any of these known legal proceedings, individually or collectively, to have a material adverse effect on our financial condition or results of operations.
Item 4. | Mine Safety Disclosures | |||
Not applicable.
27
PART II. OTHER INFORMATION
Item 5. | Market for Registrant's Common Equity, Related Stockholder Matters and Issuer Purchases of Equity Securities. |
Market Information
Our common stock is traded on the New York Stock Exchange ("NYSE") under the symbol "SSE." The following table presents the high and low sales prices of our common stock for each quarter starting July 1, 2014, the date on which our stock began trading "regular way" on the NYSE:
High | Low | ||||||
2014 | |||||||
Third Quarter | $ | 27.17 | $ | 21.89 | |||
Fourth Quarter | $ | 24.39 | $ | 4.54 | |||
As of February 25, 2015, there were 1,486 registered holders of our issued and outstanding common stock.
Dividends
No dividends were paid during the years ended December 31, 2014 and 2013.
Our debt arrangements restrict our ability to distribute dividends.
Issuer Purchases of Equity Securities
The following table presents information about repurchases of our common stock during the quarter ended December 31, 2014:
Period | Total Number of Shares Purchased(a) | Average Price Paid per Share(a) | Total Number of Shares Purchased as Part of Publicly Announced Plans or Programs | Maximum Number of Shares that May Yet Be Purchased under the Plans or Program | |||||||||
October 1, 2014 - October 31, 2014 | 4,101 | $ | 13.70 | — | — | ||||||||
November 1, 2014 - November 30, 2014 | 943 | 7.81 | — | — | |||||||||
December 1, 2014 - December 31, 2014 | 4,390 | 4.92 | — | — | |||||||||
Total | 9,434 | $ | 9.03 | — | — | ||||||||
(a) | Reflects shares surrendered as payment for statutory withholding taxes upon the vesting of restricted stock issued pursuant to the Seventy Seven Energy Inc. 2014 Incentive Plan. |
Equity Compensation Plan Information
Information required by this item with respect to compensation plans under which our equity securities are authorized for issuance is incorporated by reference to Part III, Item 12 of this report.
28
Performance Graph
The following graph compares the cumulative total return of our common stock from July 1, 2014, the date on which our stock began trading "regular way" on the NYSE, through December 31, 2014, with the total cumulative return of the Standard & Poors Stock Index and the Philadelphia Stock Exchange Oil Service Sector Index.
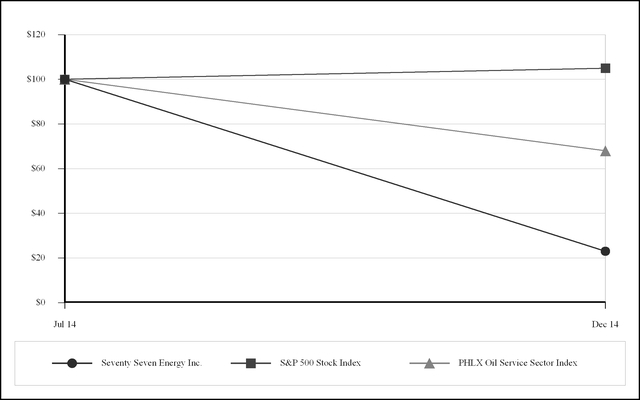
July 1, | December 31, | ||||||
2014 | 2014 | ||||||
Seventy Seven Energy Inc. | $ | 100.00 | $ | 22.97 | |||
S&P 500 Stock Index | $ | 100.00 | $ | 105.03 | |||
PHLX Oil Service Sector Index | $ | 100.00 | $ | 67.80 | |||
This graph shall not be deemed to be "soliciting material" or to be "filed" with the SEC.
29
Item 6. | Selected Financial Data |
The following table sets forth certain consolidated financial data for the periods presented, which has been derived from our audited consolidated financial statements and the audited consolidated financial statements of our predecessor, COO. The historical combined financial statements of COO for periods and as of dates prior to its formation on October 25, 2011 were prepared on a "carve-out" basis from Chesapeake and are intended to represent the financial results of Chesapeake's oilfield services operations, which is COO's accounting predecessor, for the periods presented. The selected historical financial data is not necessarily indicative of results to be expected in future periods and does not necessarily reflect what our financial position and results of operations would have been had we operated as an independent public company during periods prior to our spin-off from Chesapeake. The selected historical financial data should be read in conjunction with Item 7 and Item 8 of this report.
Year Ended December 31, | |||||||||||||||||||
2014 | 2013 | 2012 | 2011 | 2010 | |||||||||||||||
(in thousands, except per share data) | |||||||||||||||||||
Income Statement Data: | |||||||||||||||||||
Revenues | $ | 2,080,892 | $ | 2,188,205 | $ | 1,920,022 | $ | 1,303,496 | $ | 815,756 | |||||||||
Operating Expenses: | |||||||||||||||||||
Operating costs(a) | 1,580,353 | 1,717,709 | 1,390,786 | 986,239 | 667,927 | ||||||||||||||
Depreciation and amortization | 292,912 | 289,591 | 231,322 | 175,790 | 103,339 | ||||||||||||||
General and administrative | 108,139 | 80,354 | 66,360 | 37,074 | 25,312 | ||||||||||||||
Net (gains) losses on sales of property and equipment | (6,272 | ) | (2,629 | ) | 2,025 | (3,571 | ) | (854 | ) | ||||||||||
Impairments and other(b) | 30,764 | 74,762 | 60,710 | 2,729 | 9 | ||||||||||||||
Total Operating Expenses | 2,005,896 | 2,159,787 | 1,751,203 | 1,198,261 | 795,733 | ||||||||||||||
Operating income | 74,996 | 28,418 | 168,819 | 105,235 | 20,023 | ||||||||||||||
Other Income (Expense): | |||||||||||||||||||
Interest expense | (79,734 | ) | (56,786 | ) | (53,548 | ) | (48,802 | ) | (38,795 | ) | |||||||||
Losses and impairments from equity investees | (6,094 | ) | (958 | ) | (361 | ) | — | (2,243 | ) | ||||||||||
Other income (expense) | 664 | 1,758 | 1,543 | (2,464 | ) | 211 | |||||||||||||
Total Other Expense | (85,164 | ) | (55,986 | ) | (52,366 | ) | (51,266 | ) | (40,827 | ) | |||||||||
(Loss) Income Before Income Taxes | (10,168 | ) | (27,568 | ) | 116,453 | 53,969 | (20,804 | ) | |||||||||||
Income Tax (Benefit) Expense | (2,189 | ) | (7,833 | ) | 46,877 | 26,279 | (4,195 | ) | |||||||||||
Net (Loss) Income | (7,979 | ) | (19,735 | ) | 69,576 | 27,690 | (16,609 | ) | |||||||||||
Less: Net Loss Attributable to Noncontrolling Interest | — | — | — | (154 | ) | (639 | ) | ||||||||||||
Net (Loss) Income Attributable to Seventy Seven Energy | $ | (7,979 | ) | $ | (19,735 | ) | $ | 69,576 | $ | 27,844 | $ | (15,970 | ) | ||||||
(Loss) Earnings Per Common Share(c): | |||||||||||||||||||
Basic | $ | (0.17 | ) | $ | (0.42 | ) | $ | 1.48 | $ | 0.59 | $ | (0.34 | ) | ||||||
Diluted | $ | (0.17 | ) | $ | (0.42 | ) | $ | 1.48 | $ | 0.59 | $ | (0.34 | ) | ||||||
Cash Flow Data: | |||||||||||||||||||
Cash flows provided by operations | $ | 265,296 | $ | 337,071 | $ | 211,151 | $ | 240,046 | $ | 94,385 | |||||||||
Cash flows used in investing activities | $ | (367,646 | ) | $ | (296,817 | ) | $ | (577,324 | ) | $ | (658,470 | ) | $ | (226,716 | ) | ||||
Cash flows provided by (used in) financing activities | $ | 101,563 | $ | (39,803 | ) | $ | 366,870 | $ | 418,584 | $ | 132,465 | ||||||||
Other Financial Data: | |||||||||||||||||||
Capital expenditures (including acquisitions) | $ | 457,618 | $ | 349,806 | $ | 622,825 | $ | 752,715 | $ | 273,154 | |||||||||
(a) | Historical operating costs include the effect of $18.9 million, $76.9 million, $100.8 million, $105.6 million and $94.7 million of rig rent expense associated with our lease of drilling rigs for the years December 31, 2014, 2013, 2012, 2011 |
30
and 2010, respectively. As of December 31, 2014, we have purchased all rigs that were subject to these lease arrangements.
(b) | We recorded impairments of long-lived assets and lease termination costs of $21.1 million and $9.7 million, respectively, for the year ended December 31, 2014. We recorded impairments of long-lived assets and lease termination costs of $52.4 million and $22.4 million, respectively, for the year ended December 31, 2013. We recorded impairments of long-lived assets and lease termination costs of $35.8 million and $24.9 million, respectively, for the year ended December 31, 2012. |
(c) | On June 30, 2014 we distributed 46,932,433 shares of our common stock to Chesapeake shareholders in conjunction with the spin-off. For comparative purposes, and to provide a more meaningful calculation for weighted average shares, we have assumed this amount to be outstanding for periods prior to the spin-off. |
As of December 31, | |||||||||||||||||||
2014 | 2013 | 2012 | 2011 | 2010 | |||||||||||||||
(in thousands) | |||||||||||||||||||
Balance Sheet Data: | |||||||||||||||||||
Cash | $ | 891 | $ | 1,678 | $ | 1,227 | $ | 530 | $ | 370 | |||||||||
Property and equipment, net | $ | 1,767,053 | $ | 1,497,476 | $ | 1,581,519 | $ | 1,247,817 | $ | 923,694 | |||||||||
Total assets | $ | 2,312,552 | $ | 2,026,893 | $ | 2,119,511 | $ | 1,597,136 | $ | 1,059,607 | |||||||||
Long-term debt, net of current maturities | $ | 1,594,500 | $ | 1,055,000 | $ | 1,068,200 | $ | 679,000 | $ | 629,200 | |||||||||
Total equity | $ | 291,023 | $ | 547,192 | $ | 596,817 | $ | 548,896 | $ | 170,430 | |||||||||
31
Item 7. | Management's Discussion and Analysis of Financial Condition and Results of Operations | |||
Comparability of Historical Results
The historical results discussed in this section prior to June 30, 2014 are those of COO, which is our predecessor. The transactions in which SSE became an independent, publicly traded company, including the distribution of our common stock on June 30, 2014, are referred to collectively as the "spin-off". The historical results discussed in this section prior to the spin-off do not purport to reflect what the results of operations, financial position, or cash flows would have been had we operated as an independent public company prior to June 30, 2014 and do not give effect to certain spin-off transactions on our consolidated statements of operations. For a detailed description of the basis of presentation of the historical financial statements, please read Note 1 to our consolidated financial statements in Item 8 of this report.
In particular, the historical results for periods prior to the spin-off discussed in this section do not reflect the effects of the following transactions related to our spin-off, which impact our results of operations subsequent to the spin-off:
• | we entered into the New Credit Facility and Term Loan. We used the proceeds from borrowings under these new facilities to repay in full and terminate our Old Credit Facility. |
• | the issuance of new 2022 Notes; |
• | the distribution to Chesapeake of our compression unit manufacturing and geosteering businesses; |
• | the sale of our crude hauling assets to a third party; |
• | the transfer to us by Chesapeake of certain land and buildings used in our business, most of which were previously leased by us; and |
• | the potential increase in our cash requirements as an independent public company, including tax obligations and incremental public company expenses. |
Overview
We are a diversified oilfield services company that provides a wide range of wellsite services to U.S. land-based E&P customers operating in unconventional resource plays. We offer services and equipment that are strategic to our customers' oil and natural gas operations. We conduct our business through four operating segments: Drilling, Hydraulic Fracturing, Oilfield Rentals, and Oilfield Trucking. Our operations are geographically diversified across many of the most active oil and natural gas plays in the onshore United States, including the Anadarko and Permian Basins and the Barnett, Eagle Ford, Haynesville, Marcellus, Niobrara and Utica Shales.
Since we commenced operations in 2001, we have actively grown our business and modernized our asset base. As of December 31, 2014, our marketed fleet consisted of 26 Tier 1 rigs, including 16 proprietary PeakeRigs, 57 Tier 2 rigs and seven Tier 3 rigs. As of December 31, 2014, we also owned (a) 10 hydraulic fracturing fleets with an aggregate of 400,000 horsepower; (b) a diversified oilfield rentals business; and (c) an oilfield trucking fleet consisting of 263 rig relocation trucks, 67 cranes and forklifts used in the movement of drilling rigs and other heavy equipment, and 141 water transport trucks. We continue to modernize our asset base and are currently building 10 additional PeakeRigs. For additional information regarding our business and strategies, please read "Business" in Item 1 of this report.
Cyclical Nature of Industry
We operate in a highly cyclical industry. The main factor influencing demand for oilfield services is the level of drilling and completions activity by E&P companies, which in turn depends largely on current and anticipated future crude oil and natural gas prices and production depletion rates. The most critical factors in assessing the outlook for the industry is the worldwide supply and demand for oil and the domestic supply and demand for natural gas. Demand for oil and natural gas is cyclical and is subject to large and rapid fluctuations. This is primarily because the industry is driven by commodity demand and corresponding price increases. When oil and natural gas price increases occur, producers increase their capital expenditures, which generally results in greater revenues and profits for oilfield service companies. The increased capital expenditures also ultimately result in greater production, which historically has resulted in increased supplies and reduced prices that, in turn, tends to reduce demand for oilfield services. For these reasons, our results of operations may fluctuate from quarter-to-quarter and from year-to-year, and these fluctuations may distort period-to-period comparisons of our results of operations.
32
The recent decline in commodity prices has reduced the level of onshore United States drilling and completions activity and, consequently, the demand for our services. Since mid-2014, NYMEX WTI oil spot prices have declined by more than 50% to their lowest levels since 2009, as global production growth led by unconventional resource development onshore in the United States outpaced demand. In addition, NYMEX natural gas prices have fallen from multi-year highs in early 2014 as sustained production growth more than met growing domestic demand. We believe our modern, high quality asset base, diversified footprint and strong relationship with Chesapeake will offset the consequences of decreasing drilling and completions activity levels to some extent; however, we expect to experience reduced equipment utilization and increased market pricing pressure across each of our operating segments relative to 2014 until there is a sustained recovery in commodity prices and robust demand for our services returns. The extent and length of the current down cycle is uncertain. If it is prolonged or worsens, it would likely have a material adverse impact on our business, financial condition and results of operations.
Backlog
Our hydraulic fracturing and drilling backlog as of December 31, 2014, which is based on existing contracts, was approximately $1.0 billion and $1.0 billion with average durations of 20 months and 15 months, respectively. We calculate our drilling backlog by multiplying the day rate under our contracts by the number of days remaining under the contract. We calculate our hydraulic fracturing backlog by multiplying the estimated rate per stage, based on then current contract pricing, by the number of guaranteed stages remaining under the contract. With respect to our hydraulic fracturing backlog, our New Services Agreement provides for periodic adjustments of the rates we may charge for our services thereunder, which will be negotiated based on then prevailing market pricing and in the future may be higher or lower than the current rates we charge. The backlog calculation does not include any reduction in revenues related to mobilization or demobilization, nor does it include potential reductions in rates for unscheduled standby or during periods in which the rig is moving, on standby or incurring maintenance and repair time in excess of what is permitted under the drilling contract. In addition, many of our contracts are subject to termination by the customer on short notice and provide for an early termination payment to us in the event that the contract is terminated by the customer. We calculate our contract drilling early termination value assuming each rig remains stacked for the remainder of the term of the terminated contract. As a result, revenues could differ materially from the backlog and early termination amounts presented.
As of December 31, 2014, our revenue backlog was as follows (in millions):
2015 | 2016 | Thereafter | |||||||||
Backlog | $ | 1,007.9 | $ | 713.6 | $ | 305.7 | |||||
As of December 31, 2014, our total contract early termination value related to our drilling backlog was as follows (in millions):
2015 | 2016 | Thereafter | |||||||||
Drilling contract early termination value | $ | 256.5 | $ | 141.6 | $ | 78.0 | |||||
Since December 31, 2014, three of our drilling contracts have been terminated early, which will reduce our drilling revenue backlog by $4.9 million, and we expect to recognize $1.7 million in early termination compensation during the first quarter of 2015 associated with these terminations. In addition, we entered into an agreement for incremental hydraulic fracturing and oilfield rental services in exchange, in part, for waiving early termination compensation associated with two other drilling contracts. Currently, one of these rigs remains active and the other is preparing to mobilize to another customer. Furthermore, we have received notices that up to an additional 11 term-contracted rigs may be idled temporarily without crews. During these idle periods, our contracts allow us to invoice for the full operating margin.
How We Evaluate Our Operations
Our management team uses a variety of tools to monitor and manage our operations in the following eight areas: (a) segment gross margin, (b) equipment maintenance performance, (c) customer satisfaction, (d) asset utilization, (e) safety performance, (f) Adjusted EBITDA, (g) adjusted revenues and (h) adjusted operating costs.
Segment Gross Margin. We define segment gross margin as segment revenues less segment operating costs, excluding depreciation and amortization, general and administrative expenses, net gains on sales of property and equipment and
33
impairments and other. We view segment gross margin as one of our key management tools for managing costs at the segment level and evaluating segment performance. Our management tracks segment gross margin both as an absolute amount and as a percentage of revenues compared to prior periods.
Equipment Maintenance Performance. Equipment reliability ("uptime") is an important factor to the success of our business. Uptime is beneficially impacted through preventive maintenance on our equipment. We have formal preventive maintenance procedures which are regularly monitored for compliance. Further, management monitors maintenance expenses as a percentage of revenue. This metric provides a leading indicator with respect to the execution of preventive maintenance and ensures that equipment reliability issues do not negatively impact operational uptime.
Customer Satisfaction. Upon completion of many of our services, we encourage our customers to provide feedback on the services provided. The evaluation of our performance is based on various criteria and our customer comments are indicative of their overall satisfaction level. This feedback provides us with the necessary information to reinforce positive performance and remedy negative issues and trends.
Asset Utilization. By consistently monitoring our operations' activity levels, pricing and relative performance of each of our rigs and fleets, we can more efficiently allocate our personnel and equipment to maximize revenue generation. We measure our activity levels by the total number of jobs completed by each of our drilling rigs and hydraulic fracturing fleets on a periodic basis. We also monitor the utilization rates of our drilling rigs. We define utilization of our drilling rigs as the number of rigs that have operated in the past 30 days divided by the number of rigs that have operated in the last 90 days. Our drilling rig utilization rate was 99%, 95% and 92% for the years ended December 31, 2014, 2013 and 2012, respectively.
Safety Performance. Maintaining a strong safety record is a critical component of our operational success. We maintain a safety database that our management uses to identify negative trends in operational incidents so that appropriate measures can be taken to maintain and enhance our safety standards.
Adjusted EBITDA. Our primary financial and operating measurement that our management uses to analyze and monitor the operating performance of our business is Adjusted EBITDA, which we define as net income before interest expense, income tax expense, depreciation and amortization, as further adjusted to add back non-cash stock compensation, impairments and other, gain or loss on sale of property and equipment, rig rent expense and certain non-recurring items, such as the distribution of our compression manufacturing and geosteering businesses to Chesapeake and the sale of our crude hauling assets to a third party. The table below shows our Adjusted EBITDA for the years ended December 31, 2014, 2013 and 2012.
Years Ended December 31, | |||||||||||
2014 | 2013 | 2012 | |||||||||
(unaudited) (in thousands) | |||||||||||
Adjusted EBITDA: | |||||||||||
Consolidated | $ | 446,247 | $ | 448,507 | $ | 545,026 | |||||
Drilling | $ | 300,917 | $ | 257,223 | $ | 320,415 | |||||
Hydraulic Fracturing | $ | 144,494 | $ | 138,889 | $ | 109,966 | |||||
Oilfield Rentals | $ | 52,326 | $ | 58,425 | $ | 95,230 | |||||
Oilfield Trucking | $ | 15,568 | $ | 18,653 | $ | 38,143 | |||||
Adjusted Revenues and Adjusted Operating Costs. Key financial and operating measurements that our management uses to analyze and monitor our period-over-period operating performance are "adjusted revenues" and "adjusted operating costs", which we define as revenues and operating costs before revenues and operating costs associated with our compression unit manufacturing business and geosteering businesses that were distributed to Chesapeake and our crude hauling assets that were sold to a third party as part of the spin-off. Adjusted operating costs is further adjusted to subtract rig rent expense.
Non-GAAP Financial Measures
"Adjusted EBITDA", "adjusted revenues" and "adjusted operating costs" are non-GAAP financial measures. Adjusted EBITDA, adjusted revenues and adjusted operating costs as used and defined by us, may not be comparable to similarly titled measures employed by other companies and are not measures of performance calculated in accordance with generally accepted accounting principles ("GAAP").
34
Adjusted revenues and adjusted operating costs should not be considered in isolation or as a substitute for revenues and operating costs, respectively, prepared in accordance with GAAP. However, our management uses adjusted revenues and adjusted operating costs to evaluate our period over period operating performance because our management believes these measures improve the comparability of our continuing business and for the same reasons believes these measures may be useful to an investor in evaluating our operating performance. A reconciliation of adjusted revenues and adjusted operating costs to the GAAP measures of revenues and operating costs, respectively, is provided below in "—Results of Operations" for each period discussed.
Adjusted EBITDA should not be considered in isolation or as a substitute for operating income, net income or loss, cash flows provided by operating, investing and financing activities, or other income or cash flow statement data prepared in accordance with GAAP. However, our management uses Adjusted EBITDA to evaluate our performance and liquidity and believes Adjusted EBITDA may be useful to an investor in evaluating our operating performance and liquidity because this measure:
• | is widely used by investors in the oilfield services industry to measure a company's operating performance without regard to items excluded from the calculation of such measure, which can vary substantially from company to company depending upon accounting methods, book value of assets, capital structure and the method by which assets were acquired, among other factors; |
• | is a financial measurement that is used by rating agencies, lenders and other parties to evaluate our creditworthiness; and |
• | is used by our management for various purposes, including as a measure of performance of our operating entities and as a basis for strategic planning and forecasting. |
There are significant limitations to using Adjusted EBITDA as a measure of performance, including the inability to analyze the effect of certain recurring and non-recurring items that materially affect our net income or loss. Additionally, because Adjusted EBITDA excludes some, but not all, items that affect net income and is defined differently by different companies in our industry, our definition of Adjusted EBITDA may not be comparable to similarly titled measures of other companies.
On a consolidated basis, the following tables present a reconciliation of Adjusted EBITDA to the GAAP financial measures of net income and cash provided by operating activities. The following tables also present a reconciliation of Adjusted EBITDA to the GAAP financial measure of net income for each of our operating segments.
35
Consolidated
Years Ended December 31, | |||||||||||
2014 | 2013 | 2012 | |||||||||
(In thousands) | |||||||||||
Net (loss) income | $ | (7,979 | ) | $ | (19,735 | ) | $ | 69,576 | |||
Add: | |||||||||||
Interest expense | 79,734 | 56,786 | 53,548 | ||||||||
Income tax (benefit) expense | (2,189 | ) | (7,833 | ) | 46,877 | ||||||
Depreciation and amortization | 292,912 | 289,591 | 231,322 | ||||||||
Impairments and other | 30,764 | 74,762 | 60,710 | ||||||||
Net (gains) losses on sales of property and equipment | (6,272 | ) | (2,629 | ) | 2,025 | ||||||
Non-cash compensation | 47,184 | — | — | ||||||||
Impairment of equity method investment | 4,500 | 1,789 | — | ||||||||
Rent expense on buildings and real estate transferred from Chesapeake(a) | 8,187 | 16,459 | 11,829 | ||||||||
Rig rent expense(b) | 18,900 | 76,923 | 100,802 | ||||||||
Less: | |||||||||||
Compression unit manufacturing Adjusted EBITDA | 13,073 | 18,965 | 15,049 | ||||||||
Geosteering Adjusted EBITDA | 957 | 2,870 | 4,926 | ||||||||
Crude hauling Adjusted EBITDA | (5,066 | ) | 15,771 | 11,688 | |||||||
Non-recurring credit to stock compensation expense | 10,530 | — | — | ||||||||
Adjusted EBITDA | $ | 446,247 | $ | 448,507 | $ | 545,026 | |||||
(a) | Rent expense on buildings and real estate transferred from Chesapeake as part of the spin-off is included in operating costs and general and administrative expenses on the consolidated statement of operations included in Item 8 of this report. Our operating costs include $8.0 million, $15.7 million and $11.3 million of rent expense associated with our lease of these facilities for the years ended December 31, 2014, 2013 and 2012. Our general and administrative expenses include $0.2 million, $0.8 million, and $0.5 million of rent expense associated with our lease of these facilities for the years ended December 31, 2014, 2013 and 2012. |
(b) | Rig rent expense associated with our lease of drilling rigs is included in operating costs on the consolidated statement of operations included in Item 8 of this report. As of December 31, 2014, we had repurchased all of our leased drilling rigs. |
36
Years Ended December 31, | |||||||||||
2014 | 2013 | 2012 | |||||||||
(In thousands) | |||||||||||
Cash provided by operating activities | $ | 265,296 | $ | 337,071 | $ | 211,151 | |||||
Add: | |||||||||||
Changes in assets and liabilities | 88,588 | (36,731 | ) | 168,775 | |||||||
Interest expense | 79,734 | 56,786 | 53,548 | ||||||||
Lease termination costs | 9,701 | 22,362 | 24,855 | ||||||||
Amortization of sale/leaseback gains | 5,414 | 15,995 | 8,821 | ||||||||
Amortization of deferred financing costs | (6,122 | ) | (2,928 | ) | (2,906 | ) | |||||
(Loss) income from equity investees | (1,594 | ) | 831 | (361 | ) | ||||||
Provision for doubtful accounts | (2,887 | ) | (436 | ) | (310 | ) | |||||
Current tax expense | 674 | 1,422 | 749 | ||||||||
Rent expense on buildings and real estate transferred from Chesapeake(a) | 8,187 | 16,459 | 11,829 | ||||||||
Rig rent expense(b) | 18,900 | 76,923 | 100,802 | ||||||||
Other | (150 | ) | (1,641 | ) | (264 | ) | |||||
Less: | |||||||||||
Compression unit manufacturing Adjusted EBITDA | 13,073 | 18,965 | 15,049 | ||||||||
Geosteering Adjusted EBITDA | 957 | 2,870 | 4,926 | ||||||||
Crude hauling Adjusted EBITDA | (5,066 | ) | 15,771 | 11,688 | |||||||
Non-recurring credit to stock compensation expense | 10,530 | — | — | ||||||||
Adjusted EBITDA | $ | 446,247 | $ | 448,507 | $ | 545,026 | |||||
(a) | Rent expense on buildings and real estate transferred from Chesapeake as part of the spin-off is included in operating costs and general and administrative expenses on the consolidated statement of operations included in Item 8 of this report. Our operating costs include $8.0 million, $15.7 million and $11.3 million of rent expense associated with our lease of these facilities for the years ended December 31, 2014, 2013 and 2012. Our general and administrative expenses include $0.2 million, $0.8 million, and $0.5 million of rent expense associated with our lease of these facilities for the years ended December 31, 2014, 2013 and 2012. |
(b) | Rig rent expense associated with our lease of drilling rigs is included in operating costs on the consolidated statement of operations included in Item 8 of this report. As of December 31, 2014, we had repurchased all of our leased drilling rigs. |
37
Drilling
Years Ended December 31, | |||||||||||
2014 | 2013 | 2012 | |||||||||
(In thousands) | |||||||||||
Net income (loss) | $ | 49,528 | $ | (17,378 | ) | $ | 26,428 | ||||
Add: | |||||||||||
Income tax expense (benefit) | 30,471 | (8,982 | ) | 17,739 | |||||||
Depreciation and amortization | 140,884 | 133,745 | 117,756 | ||||||||
Impairments and other | 29,602 | 71,548 | 53,621 | ||||||||
Net losses on sales of property and equipment | 17,931 | 663 | 5,527 | ||||||||
Non-cash compensation | 17,188 | — | — | ||||||||
Rent expense on buildings and real estate transferred from Chesapeake | 1,688 | 3,574 | 3,468 | ||||||||
Rig rent expense | 18,900 | 76,923 | 100,802 | ||||||||
Less: | |||||||||||
Geosteering Adjusted EBITDA | 957 | 2,870 | 4,926 | ||||||||
Non-recurring credit to stock compensation expense | 4,318 | — | — | ||||||||
Adjusted EBITDA | $ | 300,917 | $ | 257,223 | $ | 320,415 | |||||
Hydraulic Fracturing
Years Ended December 31, | |||||||||||
2014 | 2013 | 2012 | |||||||||
(In thousands) | |||||||||||
Net income | $ | 38,985 | $ | 40,472 | $ | 51,123 | |||||
Add: | |||||||||||
Income tax expense | 24,563 | 26,752 | 31,500 | ||||||||
Depreciation and amortization | 72,105 | 69,507 | 26,491 | ||||||||
Impairments | 207 | — | — | ||||||||
Net (gains) losses on sales of property and equipment | (17 | ) | — | 43 | |||||||
Non-cash compensation | 3,369 | — | — | ||||||||
Impairment of equity method investment | 4,500 | — | — | ||||||||
Rent expense on buildings and real estate transferred from Chesapeake | 1,259 | 2,158 | 809 | ||||||||
Less: | |||||||||||
Non-recurring credit to stock compensation expense | 477 | — | — | ||||||||
Adjusted EBITDA | $ | 144,494 | $ | 138,889 | $ | 109,966 | |||||
38
Oilfield Rentals
Years Ended December 31, | |||||||||||
2014 | 2013 | 2012 | |||||||||
(In thousands) | |||||||||||
Net (loss) income | $ | (1,705 | ) | $ | (1,001 | ) | $ | 16,596 | |||
Add: | |||||||||||
Income tax (benefit) expense | (754 | ) | (1,543 | ) | 10,538 | ||||||
Depreciation and amortization | 52,680 | 59,559 | 62,762 | ||||||||
Impairments | 955 | 1 | 6,929 | ||||||||
Net gains on sales of property and equipment | (2,355 | ) | (1,146 | ) | (3,579 | ) | |||||
Non-cash compensation | 2,691 | — | — | ||||||||
Rent expense on buildings and real estate transferred from Chesapeake | 1,415 | 2,555 | 1,984 | ||||||||
Less: | |||||||||||
Non-recurring credit to stock compensation expense | 601 | — | — | ||||||||
Adjusted EBITDA | $ | 52,326 | $ | 58,425 | $ | 95,230 | |||||
Oilfield Trucking
Years Ended December 31, | |||||||||||
2014 | 2013 | 2012 | |||||||||
(In thousands) | |||||||||||
Net income | $ | 3,502 | $ | 2,706 | $ | 14,269 | |||||
Add: | |||||||||||
Income tax expense | 2,857 | 2,849 | 9,744 | ||||||||
Depreciation and amortization | 21,817 | 25,870 | 23,523 | ||||||||
Net (gains) losses on sales of property and equipment | (21,853 | ) | (2,249 | ) | 35 | ||||||
Non-cash compensation | 4,281 | — | — | ||||||||
Impairment of equity method investment | — | 1,789 | — | ||||||||
Rent expense on buildings and real estate transferred from Chesapeake | 1,724 | 3,459 | 2,260 | ||||||||
Less: | |||||||||||
Crude hauling Adjusted EBITDA | (5,066 | ) | 15,771 | 11,688 | |||||||
Non-recurring credit to stock compensation expense | 1,826 | — | — | ||||||||
Adjusted EBITDA | $ | 15,568 | $ | 18,653 | $ | 38,143 | |||||
Liquidity and Capital Resources
We require capital to fund ongoing operations, including operating expenses, organic growth initiatives, investments, acquisitions and debt service. We expect our future capital needs will be provided for by cash flows from operations, borrowings under our New Credit Facility, access to capital markets and other financing transactions. We believe we will have adequate liquidity over the next twelve months to operate our business and meet our cash requirements.
As of December 31, 2014, we had cash of $0.9 million and working capital of $208.6 million. As of December 31, 2013, we had cash of $1.7 million and working capital of $172.8 million.
39
Long-Term Debt
The following table presents our long-term debt as of December 31, 2014 and 2013:
December 31, | |||||||
2014 | 2013 | ||||||
(in thousands) | |||||||
6.625% Senior Notes due 2019 | $ | 650,000 | $ | 650,000 | |||
6.50% Senior Notes due 2022 | 500,000 | — | |||||
Term Loan | 398,000 | — | |||||
Credit Facilities | 50,500 | 405,000 | |||||
Total debt | 1,598,500 | 1,055,000 | |||||
Less: Current portion of long-term debt | 4,000 | — | |||||
Total long-term debt | $ | 1,594,500 | $ | 1,055,000 | |||
On June 26, 2014, we issued $500.0 million in aggregate principal amount of 6.50% Senior Notes due 2022. We incurred $7.2 million in financing costs related to the 2022 Notes issuance, which have been deferred and are being amortized over the life of the 2022 Notes. We used the net proceeds of $493.8 million from the 2022 Notes issuance to make a distribution of approximately $391.0 million to Chesapeake and for general corporate purposes.
On June 25, 2014, we entered into a $400.0 million seven-year term loan credit agreement. We incurred $6.9 million in financing costs related to entering into the Term Loan, which have been deferred and are being amortized over the life of the Term Loan. We used the net proceeds of $393.9 million to repay and terminate the Old Credit Facility.
On June 25, 2014, we, through SSO, entered into a five-year senior secured revolving bank credit facility with total commitments of $275.0 million. We incurred $1.8 million in financing costs related to the New Credit Facility, which have been deferred and are being amortized over the life of the New Credit Facility. As of December 31, 2014, we had outstanding borrowings of $56.3 million and availability of $218.7 million, net of letters of credit of $5.8 million, under the New Credit Facility. As of February 25, 2015, we had no outstanding borrowings and had availability of $269.2 million, net of letters of credit of $5.8 million, under the New Credit Facility.
For further information on our long-term debt, please read Note 5 to our consolidated financial statements included in Item 8 of this report.
Capital Expenditures
Our business is capital-intensive, requiring significant investment to maintain, upgrade and purchase equipment to meet our customers' needs and industry demand. To date, our capital requirements have consisted primarily of:
• | growth capital expenditures, which are defined as capital expenditures made to acquire additional equipment and other assets, increase our service lines, expand geographically or advance other strategic initiatives for the purpose of growing our business; |
• | maintenance capital expenditures, which are defined as capital expenditures that are necessary to maintain the service capability of our existing assets and include the replacement of components and equipment which are worn or obsolete; and |
• | the purchase of leased drilling rigs. |
We anticipate that our capital requirements going forward will consist primarily of growth capital expenditures and maintenance capital expenditures.
Total capital expenditures, including growth, maintenance and the purchase of leased drilling rigs, were $457.6 million, $349.8 million, and $622.8 million for the years ended December 31, 2014, 2013 and 2012, respectively. In 2014, we purchased 45 of our leased drilling rigs for approximately $158.4 million, which ended our drilling rig leasing program. We currently expect to spend approximately $190.0 million in aggregate growth capital expenditures in 2015. We may increase, decrease or re-allocate our anticipated capital expenditures during any period based on industry conditions, the availability of capital or other factors, and a significant component of our anticipated capital spending is discretionary.
40
Cash Flow
Our cash flow depends on the level of spending by our customers on exploration, development and production activities. Sustained increases or decreases in the price of oil or natural gas could have a material impact on these activities, thus materially affecting our future cash flows. The following is a discussion of our cash flow for the years ended December 31, 2014, 2013 and 2012.
Years Ended December 31, | |||||||||||
2014 | 2013 | 2012 | |||||||||
(in thousands) | |||||||||||
Cash Flow Statement Data: | |||||||||||
Net cash provided by operating activities | $ | 265,296 | $ | 337,071 | $ | 211,151 | |||||
Net cash used in investing activities | $ | (367,646 | ) | $ | (296,817 | ) | $ | (577,324 | ) | ||
Net cash provided by (used in) financing activities | $ | 101,563 | $ | (39,803 | ) | $ | 366,870 | ||||
Cash, beginning of period | $ | 1,678 | $ | 1,227 | $ | 530 | |||||
Cash, end of period | $ | 891 | $ | 1,678 | $ | 1,227 | |||||
Operating Activities. Cash provided by operating activities was $265.3 million, $337.1 million and $211.2 million for the years ended December 31, 2014, 2013 and 2012, respectively. Changes in working capital items (decreased) increased cash flow provided by operating activities by ($88.6) million, $36.7 million and ($168.8) million for the years ended December 31, 2014, 2013 and 2012, respectively. In 2014, we experienced an increase in accounts receivable due to changes in invoice processing procedures, at the time of the spin-off, that delayed payment of certain invoices and resulted in an increase in our days sales outstanding. We believe these delays are temporary and that invoice processing and payments will be normalized in 2015. Factors affecting changes in operating cash flows are largely the same as those that affect net income, with the exception of non-cash expenses such as depreciation and amortization, amortization of sale-leaseback gains, gains or losses on sales of property and equipment, impairments, non-cash compensation, losses from equity investees and deferred income taxes.
Investing Activities. Cash used in investing activities was $367.6 million, $296.8 million and $577.3 million for the years ended December 31, 2014, 2013 and 2012, respectively. Capital expenditures are the main component of our investing activities. The majority of our capital expenditures for the years ended December 31, 2014, 2013 and 2012 were related to our investment in new hydraulic fracturing equipment and PeakeRigs™ and the purchase of certain leased drilling rigs. We purchased 45 leased drilling rigs for $158.4 million during 2014, 23 leased drilling rigs for approximately $140.2 million during 2013, and 25 leased drilling rigs for approximately $36.2 million in 2012. Cash used in investing activities was partially offset by proceeds from asset sales in the amounts of $88.6 million, $50.6 million and $47.4 million for the years ended December 31, 2014, 2013 and 2012, respectively.
Financing Activities. Net cash provided by (used in) financing activities was $101.6 million, ($39.8) million and $366.9 million for the years ended December 31, 2014, 2013 and 2012, respectively. In November 2011, we entered into a five-year $500.0 million senior secured credit facility. In connection with the spin-off, we repaid in full the borrowings outstanding under this credit facility and terminated this credit facility. We entered into a new five-year senior secured revolving bank credit facility with total commitments of $275.0 million. We had borrowings and repayments under our credit facilities of $1.201 billion and $1.556 billion, respectively, during 2014. We had borrowings and repayments under our credit facilities of $1.217 billion and $1.230 billion, respectively, during 2013. We had borrowings and repayments under our credit facilities of $1.389 billion and $999.9 million, respectively, during 2012. On June 26, 2014, we issued $500.0 million in aggregate principal amount of 6.50% Senior Notes due 2022 and used the net proceeds of $493.8 million from the 2022 Notes issuance to make a distribution of approximately $391.0 million to Chesapeake and for general corporate purposes. On June 25, 2014, we entered into a $400.0 million seven-year term loan credit agreement and used the net proceeds of $393.9 million to repay and terminate the Old Credit Facility. We paid $3.6 million in deferred financing costs in 2014. For the years ended December 31, 2014, 2013 and 2012 our distributions to Chesapeake were $422.8 million, $29.9 million and $22.3 million, respectively.
41
Results of Operations
Years Ended December 31, 2014, 2013 and 2012
The following table sets forth our consolidated statements of operations for the years ended December 31, 2014, 2013 and 2012.
Years Ended December 31, | |||||||||||
2014 | 2013 | 2012 | |||||||||
(in thousands) | |||||||||||
Revenues: | |||||||||||
Revenues | $ | 2,080,892 | $ | 2,188,205 | $ | 1,920,022 | |||||
Operating Expenses: | |||||||||||
Operating costs | 1,580,353 | 1,717,709 | 1,390,786 | ||||||||
Depreciation and amortization | 292,912 | 289,591 | 231,322 | ||||||||
General and administrative | 108,139 | 80,354 | 66,360 | ||||||||
(Gains) losses on sales of property and equipment | (6,272 | ) | (2,629 | ) | 2,025 | ||||||
Impairments and other | 30,764 | 74,762 | 60,710 | ||||||||
Total Operating Expenses | 2,005,896 | 2,159,787 | 1,751,203 | ||||||||
Operating Income | 74,996 | 28,418 | 168,819 | ||||||||
Other (Expense) Income: | |||||||||||
Interest expense | (79,734 | ) | (56,786 | ) | (53,548 | ) | |||||
Loss and impairment from equity investees | (6,094 | ) | (958 | ) | (361 | ) | |||||
Other income | 664 | 1,758 | 1,543 | ||||||||
Total Other Expense | (85,164 | ) | (55,986 | ) | (52,366 | ) | |||||
(Loss) Income Before Income Taxes | (10,168 | ) | (27,568 | ) | 116,453 | ||||||
Income Tax (Benefit) Expense | (2,189 | ) | (7,833 | ) | 46,877 | ||||||
Net (Loss) Income | $ | (7,979 | ) | $ | (19,735 | ) | $ | 69,576 | |||
42
Comparison of Years Ended December 31, 2014 and 2013
Revenues. For the years ended December 31, 2014 and 2013, revenues were $2.081 billion and $2.188 billion, respectively. The $107.3 million decrease from 2013 to 2014 was due to the distribution to Chesapeake of our compression unit manufacturing and geosteering businesses and the sale of our crude hauling assets to a third party as part of the spin-off. Adjusted revenues were $1.978 billion and $1.975 billion for the years ended December 31, 2014 and 2013, respectively, which excludes the impact of the compression unit manufacturing and geosteering businesses and crude hauling assets. The majority of our revenues historically have been derived from Chesapeake and its working interest partners. Please read "Business—The Spin-Off—Agreements Between Us and Chesapeake" in Item 1 of this report for further discussion of the agreements entered into as part of the spin-off, including a new services agreement and rig-specific daywork drilling contracts. Our revenues and adjusted revenues for the years ended December 31, 2014 and 2013 are detailed below:
Years Ended December 31, | |||||||
2014 | 2013 | ||||||
(in thousands) | |||||||
Drilling | $ | 774,530 | $ | 740,812 | |||
Hydraulic fracturing | 885,907 | 897,809 | |||||
Oilfield rentals | 153,120 | 160,241 | |||||
Oilfield trucking | 190,479 | 244,380 | |||||
Other operations | 76,856 | 144,963 | |||||
Total | $ | 2,080,892 | $ | 2,188,205 | |||
Adjusted Revenue(a): | |||||||
Revenue | $ | 2,080,892 | $ | 2,188,205 | |||
Less: | |||||||
Compression unit manufacturing revenues | 74,650 | 143,995 | |||||
Geosteering revenues | 3,940 | 8,516 | |||||
Crude hauling revenues | 23,829 | 60,645 | |||||
Adjusted Revenue | $ | 1,978,473 | $ | 1,975,049 | |||
(a) | "Adjusted revenue" is a non-GAAP financial measure we define as revenues before revenues associated with the compression unit manufacturing business and geosteering business distributed to Chesapeake and crude hauling assets sold to a third party as part of the spin-off. For a description of our calculation of adjusted revenues and the reasons our management uses this measure to evaluate our business, please read "—How We Evaluate Our Operations" and "—Non-GAAP Financial Measures." |
43
Operating Costs. For the years ended December 31, 2014 and 2013, operating costs were $1.580 billion and $1.718 billion, respectively. The decrease in operating costs was due to the distribution to Chesapeake of our compression unit manufacturing and geosteering businesses and the sale of our crude hauling assets to a third party. Adjusted operating costs for the years ended December 31, 2014 and 2013 were $1.471 billion and $1.468 billion, respectively, which excludes operating costs associated with the compression unit manufacturing and geosteering businesses distributed to Chesapeake and crude hauling assets sold to a third party as part of the spin-off, further adjusted to subtract rig rent expense. For a description of our calculation of adjusted operating costs and the reasons why our management uses this measure to evaluate our business, please read "—How We Evaluate Our Operations" and "—Non-GAAP Financial Measures." As a percentage of adjusted revenues, adjusted operating costs were 74% for the years ended December 31, 2014 and 2013. Our operating costs and adjusted operating costs for the years ended December 31, 2014 and 2013 are detailed below:
Years Ended December 31, | |||||||
2014 | 2013 | ||||||
(in thousands) | |||||||
Drilling | $ | 499,059 | $ | 543,279 | |||
Hydraulic fracturing | 735,967 | 740,439 | |||||
Oilfield rentals | 102,025 | 101,746 | |||||
Oilfield trucking | 180,084 | 207,692 | |||||
Other operations | 63,218 | 124,553 | |||||
Total | $ | 1,580,353 | $ | 1,717,709 | |||
Adjusted Operating Costs: | |||||||
Operating costs | $ | 1,580,353 | $ | 1,717,709 | |||
Less: | |||||||
Rig rent expense(a) | 18,900 | 76,923 | |||||
Compression unit manufacturing operating costs(b) | 60,616 | 123,020 | |||||
Geosteering operating costs(b) | 2,895 | 5,427 | |||||
Crude hauling operating costs(b) | 27,254 | 44,061 | |||||
Adjusted Operating Costs | $ | 1,470,688 | $ | 1,468,278 | |||
(a) | Our operating costs include $18.9 million and $76.9 million of rig rent expense associated with our lease of drilling rigs for the years ended December 31, 2014 and 2013, respectively. As of December 31, 2014, we had repurchased all of our leased drilling rigs. |
(b) | As part of the spin-off, we distributed our compression unit manufacturing and geosteering businesses to Chesapeake and sold our crude hauling assets to a third party. |
44
Drilling
Years Ended December 31, | |||||||
2014 | 2013 | ||||||
(in thousands, except average rigs, utilization, revenue day and per revenue day amounts) | |||||||
Revenues | $ | 774,530 | $ | 740,812 | |||
Operating costs(a) | 499,059 | 543,279 | |||||
Gross margin | $ | 275,471 | $ | 197,533 | |||
Adjusted EBITDA | $ | 300,917 | $ | 257,223 | |||
Revenue days(b) | 30,195 | 28,040 | |||||
Average revenue per revenue day(b) | $ | 23,686 | $ | 23,678 | |||
Average operating costs per revenue day(a) (b) | $ | 14,663 | $ | 17,000 | |||
Average rigs operating | 84 | 80 | |||||
Utilization | 99 | % | 95 | % | |||
Adjusted operating costs(c): | |||||||
Operating costs(a) | $ | 499,059 | $ | 543,279 | |||
Less: | |||||||
Operating costs for drilling-related services | 56,296 | 66,602 | |||||
Rig rent expense(a) | 18,900 | 76,923 | |||||
Adjusted operating costs(b) (c) | $ | 423,863 | $ | 399,754 | |||
Adjusted average operating costs per revenue day(b) | $ | 14,038 | $ | 14,257 | |||
(a) | Our operating costs and average operating costs per revenue day include $18.9 million and $76.9 million of rig rent expense associated with our lease of drilling rigs for the years ended December 31, 2014 and 2013, respectively. As of December 31, 2014, we had repurchased all of our leased drilling rigs. Our drilling operating costs primarily consist of labor-related costs, repairs and maintenance, and direct contract-related expenses, such as mobilization and equipment rentals. |
(b) | These metrics exclude our drilling-related services, including directional drilling, mudlogging and geosteering. Our management excludes drilling-related services from these metrics because we do not provide our drilling-related services on every job. |
(c) | "Adjusted operating costs" is a non-GAAP financial measure that we define as operating costs before operating costs associated with the geosteering business that was distributed to Chesapeake as part of the spin-off, further adjusted to subtract rig rent expense. For a description of our calculation of adjusted operating costs and the reasons why our management uses this measure to evaluate our business, please read "—How We Evaluate Our Operations" and "—Non-GAAP Financial Measures." |
Drilling revenues for the year ended December 31, 2014 increased $33.7 million, or 5%, from the year ended December 31, 2013 primarily due to an increase in revenue days of 2,155 days, or 8%. Revenues from non-Chesapeake customers increased $113.6 million to 34% of total segment revenues in 2014 compared to 20% for 2013.
Drilling operating costs for the year ended December 31, 2014 decreased $44.2 million, or 8%, from the year ended December 31, 2013 primarily as result of a $58.0 million reduction in rig rent expense due to the repurchase of 45 drilling rigs during 2014. As a percentage of drilling revenues, drilling operating costs were 64% and 73% for the years ended December 31, 2014 and 2013, respectively. As a percentage of drilling revenues, rig rent expense was 2% and 10% for the years ended December 31, 2014 and 2013, respectively.
45
As part of the spin-off, we distributed our geosteering business to Chesapeake. This business and its operating results were historically included in our drilling segment. The geosteering revenues and operating costs are detailed below:
Years Ended December 31, | |||||||
2014 | 2013 | ||||||
(in thousands) | |||||||
Revenues | $ | 3,940 | $ | 8,516 | |||
Operating costs | 2,895 | 5,427 | |||||
Gross margin | $ | 1,045 | $ | 3,089 | |||
Hydraulic Fracturing
Years Ended December 31, | |||||||
2014 | 2013 | ||||||
(in thousands) | |||||||
Revenues | $ | 885,907 | $ | 897,809 | |||
Operating costs | 735,967 | 740,439 | |||||
Gross margin | $ | 149,940 | $ | 157,370 | |||
Adjusted EBITDA | $ | 144,494 | $ | 138,889 | |||
Hydraulic fracturing revenues for the year ended December 31, 2014 decreased $11.9 million, or 1%, from the year ended December 31, 2013. This decrease was due to a 15% decrease in revenue per stage from 2013 to 2014, partially offset by a 16% increase in completed stages from 2013 to 2014. The decrease in revenue per stage was primarily due to market pricing pressure. Revenues from non-Chesapeake customers increased $22.0 million to 3% of total segment revenues in 2014.
Hydraulic fracturing operating costs for the year ended December 31, 2014 decreased $4.5 million from the year ended December 31, 2013, primarily due to a decrease in product costs, partially offset by an increase in repairs and maintenance expenses. As a percentage of hydraulic fracturing revenues, hydraulic fracturing operating costs increased from 82% in 2013 to 83% in 2014.
Oilfield Rentals
Years Ended December 31, | |||||||
2014 | 2013 | ||||||
(in thousands) | |||||||
Revenues | $ | 153,120 | $ | 160,241 | |||
Operating costs | 102,025 | 101,746 | |||||
Gross margin | $ | 51,095 | $ | 58,495 | |||
Adjusted EBITDA | $ | 52,326 | $ | 58,425 | |||
Oilfield rental revenues for the year ended December 31, 2014 decreased $7.1 million, or 4%, from the year ended December 31, 2013. The decrease was primarily due to market pricing pressure for certain of our equipment. Revenues from non-Chesapeake customers increased $21.0 million to 19% of total segment revenues in 2014 compared to 5% for the 2013.
Oilfield rental operating costs for the year ended December 31, 2014 increased $0.3 million, or less than 1%, from the year ended December 31, 2013. As a percentage of oilfield rental revenues, oilfield rental operating costs were 67% and 63% for the years ended December 31, 2014 and 2013, respectively. The increase in oilfield rental operating costs as a percentage of oilfield rental revenues was primarily attributable to market pricing pressure for certain services, which compressed margins, and an increase in labor-related costs related to the expansion of our business development organization. As a percentage of oilfield rental revenues, labor-related costs were 32% and 29% in the years ended December 31, 2014 and 2013, respectively.
46
Oilfield Trucking
Years Ended December 31, | |||||||
2014 | 2013 | ||||||
(in thousands) | |||||||
Revenues | $ | 190,479 | $ | 244,380 | |||
Operating costs | 180,084 | 207,692 | |||||
Gross margin | $ | 10,395 | $ | 36,688 | |||
Adjusted EBITDA | $ | 15,568 | $ | 18,653 | |||
Oilfield trucking revenues for the year ended December 31, 2014 decreased $53.9 million or 22%, from the year ended December 31, 2013. The decrease was primarily due to the sale of our crude hauling assets to a third party in the second quarter of 2014. Revenues from non-Chesapeake customers increased $26.9 million to 32% of total segment revenues in 2014 compared to 14% for 2013.
Oilfield trucking operating costs for the years ended December 31, 2014 decreased $27.6 million, or 13%, from the year ended December 31, 2013. As a percentage of oilfield trucking revenue, oilfield trucking operating costs were 95% and 85% for the years ended December 31, 2014 and 2013, respectively. The increase in operating costs as a percentage of revenue was primarily attributable to an increase in labor-related costs due to higher wages in a competitive market for trucking labor, and secondarily, a decrease in utilization of our assets which resulted in fixed costs being spread over a smaller revenue base. As a percentage of oilfield trucking revenues, labor-related costs were 46% and 42% for the years ended December 31, 2014 and 2013, respectively.
During the second quarter of 2014, we sold our crude hauling assets to a third party. The operating results related to the crude hauling assets were historically included in our oilfield trucking segment and the associated revenues and operating costs are detailed below:
Years Ended December 31, | |||||||
2014 | 2013 | ||||||
(in thousands) | |||||||
Revenues | $ | 23,829 | $ | 60,645 | |||
Operating costs | 27,254 | 44,061 | |||||
Gross margin | $ | (3,425 | ) | $ | 16,584 | ||
Other Operations
Years Ended December 31, | |||||||
2014 | 2013 | ||||||
(in thousands) | |||||||
Revenues | $ | 76,856 | $ | 144,963 | |||
Operating costs | 63,218 | 124,553 | |||||
Gross margin | $ | 13,638 | $ | 20,410 | |||
Our other operations currently consists of corporate functions. As part of the spin-off, we distributed our compression manufacturing business to Chesapeake, which was historically included in our other operations results. For the year ended December 31, 2014, revenues from our other operations decreased $68.1 million from the year ended December 31, 2013, which was primarily attributable to the distribution of our compression manufacturing business to Chesapeake.
47
For the year ended December 31, 2014, operating costs for our other operations decreased $61.3 million from the year ended December 31, 2013, which was primarily attributable to the distribution of our compression manufacturing business to Chesapeake. This business was historically included in our other operations results and the associated revenues and operating costs are detailed below:
Years Ended December 31, | |||||||
2014 | 2013 | ||||||
(in thousands) | |||||||
Revenues | $ | 74,650 | $ | 143,995 | |||
Operating costs | 60,616 | 123,020 | |||||
Gross margin | $ | 14,034 | $ | 20,975 | |||
Depreciation and Amortization. Depreciation and amortization for the years ended December 31, 2014 and 2013 was $292.9 million and $289.6 million, respectively. As a percentage of revenues, depreciation and amortization expense was 14% and 13% for 2014 and 2013, respectively.
General and Administrative Expenses. General and administrative expenses for the years ended December 31, 2014 and 2013 were $108.1 million and $80.4 million, respectively. The increase was primarily due to an increase in labor-related costs and secondarily, the incremental costs of being a stand-alone public entity and implementing an enterprise resource planning system. Prior to the spin-off, we were allocated corporate overhead from Chesapeake which covered functions such as legal, accounting, treasury, environmental safety, information technology and other corporate services. These charges from Chesapeake were $26.8 million and $55.5 million for 2014 and 2013, respectively. Following the spin-off, we incurred charges of $18.0 million for services provided to us by Chesapeake pursuant to a transition services agreement. As a percentage of revenues, general and administrative expenses were 5% and 4% for 2014 and 2013, respectively.
(Gains) Losses on Sales of Property and Equipment. During the year ended December 31, 2014, we sold 28 drilling rigs and ancillary equipment not utilized in our business as well as our crude hauling fleet, which included 124 fluid handling trucks and 122 trailers. During the year ended December 31, 2013, we sold 14 drilling rigs and ancillary equipment not utilized in our business. We recorded net gains on sales of property and equipment of approximately $6.3 million and $2.6 million related to these asset sales during the years ended December 31, 2014 and 2013, respectively.
Impairments and Other. During the years ended December 31, 2014 and 2013, we recognized $11.2 million and $23.6 million, respectively, of impairment charges for certain drilling rigs and spare equipment that we identified for sale as part of our broader strategy to divest non-essential drilling rigs. We also identified certain drilling rigs during the years ended December 31, 2014 and 2013 that we deemed to be impaired based on our assessment of future demand, and the suitability of the identified rigs in light of this demand. We recorded impairment charges of $8.4 million and $25.4 million during the years ended December 31, 2014 and 2013, respectively, related to these drilling rigs.
During the year ended December 31, 2014, we purchased 45 of our drilling rigs for approximately $158.4 million and paid lease termination costs of $9.7 million. During the year ended December 31, 2013, we purchased 23 of our drilling rigs for approximately $140.2 million and paid lease termination costs of $22.4 million.
We identified certain other property and equipment during the years ended December 31, 2014 and 2013 that we deemed to be impaired based on our assessment of the fair value of such assets. We recorded impairment charges of $1.5 million and $3.4 million during the years ended December 31, 2014 and 2013, respectively, related to these assets.
Interest Expense. Interest expense for the years ended December 31, 2014 and 2013 was $79.7 million and $56.8 million, respectively. The increase in interest expense from 2013 to 2014 was due to the additional debt issued in conjunction with the spin-off.
Loss and Impairment from Equity Investees. Loss from equity investees was $6.1 million and $1.0 million for the years ended December 31, 2014 and 2013, respectively, which was a result of our investments in Maalt Specialized Bulk, L.L.C. ("Maalt") and Big Star Crude Co., L.L.C. ("Big Star"). We own 49% of the membership interest in Maalt. In the second quarter of 2014, we recorded a non-cash impairment charge of $4.5 million, which resulted from an excess of carrying value over the estimated fair value for this investment. During the year ended December 31, 2013, we sold our membership interest in Big Star and recorded a loss on sale of $1.8 million.
48
Other Income. Other income for the years ended December 31, 2014 and 2013 was $0.7 million and $1.8 million, respectively.
Income Tax Benefit. We recorded income tax benefit of $2.2 million and $7.8 million for the years ended December 31, 2014 and 2013, respectively. The $5.6 million decrease in income tax benefit recorded for 2014 was primarily the result of a decrease in our pre-tax loss from $27.6 million in 2013 to $10.2 million in 2014. Our effective income tax rate for 2014 and 2013 was 22% and 28%, respectively. The decrease in our effective tax rate from 2013 to 2014 was primarily the result of permanent differences having a greater impact on our effective income tax rate due to lower pre-tax loss base in 2014 compared to 2013.
Comparison of Years Ended December 31, 2013 and 2012
Revenues. For the years ended December 31, 2013 and 2012, revenues were $2.188 billion and $1.920 billion, respectively. The $268.2 million increase from 2012 to 2013 was primarily due to the growth of our hydraulic fracturing business, which resulted in an increase in hydraulic fracturing revenues of approximately $482.6 million, partially offset by decreases in revenues of $174.4 million and $74.2 million for our drilling and oilfield rental segments, respectively. The growth in hydraulic fracturing revenues was due to a 154% increase in the number of stages completed in 2013. The decrease in revenues for our drilling and oilfield rental segments was due primarily to an overall reduction in drilling activity by Chesapeake and secondarily, a decrease in the size of our drilling rig fleet and market pricing pressure for our oilfield rentals segment, partially offset by an increase in revenues from other customers. Our revenues and adjusted revenues for the years ended December 31, 2013 and 2012 are detailed below:
Years Ended December 31, | |||||||
2013 | 2012 | ||||||
(in thousands) | |||||||
Drilling | $ | 740,812 | $ | 915,208 | |||
Hydraulic fracturing | 897,809 | 415,168 | |||||
Oilfield rentals | 160,241 | 234,456 | |||||
Oilfield trucking | 244,380 | 226,161 | |||||
Other operations | 144,963 | 129,029 | |||||
Total | $ | 2,188,205 | $ | 1,920,022 | |||
Adjusted Revenue(a): | |||||||
Revenue | $ | 2,188,205 | $ | 1,920,022 | |||
Less: | |||||||
Compression unit manufacturing revenues | 143,995 | 127,164 | |||||
Geosteering revenues | 8,516 | 10,074 | |||||
Crude hauling revenues | 60,645 | 36,102 | |||||
Adjusted Revenue | $ | 1,975,049 | $ | 1,746,682 | |||
(a) | "Adjusted revenue" is a non-GAAP financial measure we define as revenues before revenues associated with the compression unit manufacturing and geosteering businesses distributed to Chesapeake and crude hauling assets sold to a third party as part of the spin-off. For a description of our calculation of adjusted revenues and the reasons our management uses this measure to evaluate our business, please read "—How We Evaluate Our Operations" and "—Non-GAAP Financial Measures." |
49
Operating Costs. As a percentage of revenues, operating costs were 78% and 72% for the years ended December 31, 2013 and 2012, respectively. The increase in operating costs as a percentage of revenues from 2012 to 2013 was primarily attributable to lower utilization rates and market pricing pressure for certain segments, which compressed margins. Operating costs for the years ended December 31, 2013 and 2012 were $1.718 billion and $1.391 billion, respectively. The increase in operating costs from 2012 to 2013 was due primarily to the growth of our hydraulic fracturing business, which resulted in an increase in hydraulic fracturing operating costs of approximately $437.4 million, partially offset by decreases in operating costs of $124.9 million for our drilling segment. The decrease in operating costs for our drilling segment was due primarily to an overall reduction in drilling and completion activity by Chesapeake and a decrease in the size of our drilling rig fleet. Our operating costs for the years ended December 31, 2013 and 2012 are detailed below:
Years Ended December 31, | |||||||
2013 | 2012 | ||||||
(in thousands) | |||||||
Drilling | $ | 543,279 | $ | 668,203 | |||
Hydraulic fracturing | 740,439 | 303,079 | |||||
Oilfield rentals | 101,746 | 134,075 | |||||
Oilfield trucking | 207,692 | 173,327 | |||||
Other operations | 124,553 | 112,102 | |||||
Total | $ | 1,717,709 | $ | 1,390,786 | |||
Adjusted Operating Costs: | |||||||
Operating costs | $ | 1,717,709 | $ | 1,390,786 | |||
Less: | |||||||
Rig rent expense(a) | 76,923 | 100,802 | |||||
Compression unit manufacturing operating costs(b) | 123,020 | 110,645 | |||||
Geosteering operating costs(b) | 5,427 | 4,524 | |||||
Crude hauling operating costs(b) | 44,061 | 22,601 | |||||
Adjusted Operating Costs | $ | 1,468,278 | $ | 1,152,214 | |||
(a) | Our operating costs include $76.9 million and $100.8 million of rig rent expense associated with our lease of drilling rigs for the years ended December 31, 2013 and 2012, respectively. As of December 31, 2014, we had repurchased all of our leased drilling rigs. |
(b) | As part of the spin-off, we distributed our compression unit manufacturing and geosteering businesses to Chesapeake and sold our crude hauling assets to a third party. |
50
Drilling
Years Ended December 31, | |||||||
2013 | 2012 | ||||||
(in thousands, except average rigs, utilization, revenue day and per revenue day amounts) | |||||||
Revenues | $ | 740,812 | $ | 915,208 | |||
Operating costs(a) | 543,279 | 668,203 | |||||
Gross margin | $ | 197,533 | $ | 247,005 | |||
Adjusted EBITDA | $ | 257,223 | $ | 320,415 | |||
Revenue days(b) | 28,040 | 35,249 | |||||
Average revenue per revenue day(b) | $ | 23,678 | $ | 23,645 | |||
Average operating costs per revenue day(a) (b) | $ | 17,000 | $ | 16,961 | |||
Average rigs operating | 80 | 98 | |||||
Utilization | 95 | % | 92 | % | |||
Adjusted operating costs(c): | |||||||
Operating costs | $ | 543,279 | $ | 668,203 | |||
Less: | |||||||
Operating costs for drilling-related services | 66,602 | 70,348 | |||||
Rig rent expense(a) | 76,923 | 100,802 | |||||
Adjusted operating costs(b) (c) | $ | 399,754 | $ | 497,053 | |||
Adjusted average operating costs per day(b) | $ | 14,257 | $ | 14,101 | |||
(a) | Our operating costs and average operating costs per revenue day include $76.9 million and $100.8 million of rig rent expense associated with our lease of drilling rigs for the years ended December 31, 2013 and 2012, respectively. As of December 31, 2014, we had repurchased all of our leased drilling rigs. Our drilling operating costs primarily consist of labor-related costs, repairs and maintenance, and direct contract-related expenses, such as mobilization and equipment rentals. |
(b) | These metrics exclude our drilling-related services, including directional drilling, mudlogging and geosteering. Our management excludes drilling-related services from these metrics because we do not provide our drilling-related services on every job. |
(c) | "Adjusted operating costs" is a non-GAAP financial measure that we define as operating costs before operating costs associated with the geosteering business that was distributed to Chesapeake as part of the spin-off, further adjusted to subtract rig rent expense. For a description of our calculation of adjusted operating costs and the reasons why our management uses this measure to evaluate our business, please read "—How We Evaluate Our Operations" and "—Non-GAAP Financial Measures." |
Drilling revenues for the year ended December 31, 2013 decreased $174.4 million, or 19%, from the year ended December 31, 2012 primarily due to an overall reduction in drilling activity by Chesapeake and a reduction in the size of our drilling rig fleet. Our average number of operating drilling rigs decreased from 98 in 2012 to 80 in 2013, largely due to Chesapeake's reduced drilling activity and the sale of 32 non-essential drilling rigs during 2012 and 2013 as part of our ongoing strategic positioning process. The 29% decrease in our revenues from Chesapeake was partially offset by an increase in revenues from other customers of $69.2 million from 2012 to 2013. Revenues from other customers increased to 20% of total segment revenues for 2013 compared to 9% for 2012.
Drilling operating costs for the year ended December 31, 2013 decreased $124.9 million, or 19%, from the year ended December 31, 2012. This decrease was primarily due to an overall reduction in drilling activity by Chesapeake and a decrease in the size of our drilling rig fleet. The decrease in our average number of operating rigs resulted in lower labor-related costs, repairs and maintenance and other operating costs. Our average employee headcount decreased 17% from 2012 to 2013. As a percentage of drilling revenues, drilling operating costs were 73% for both 2013 and 2012.
51
As part of the spin-off, we distributed our geosteering business to Chesapeake. This business and its operating results were historically included in our drilling segment. The geosteering revenues and operating costs are detailed below:
Years Ended December 31, | |||||||
2013 | 2012 | ||||||
(in thousands) | |||||||
Revenues | $ | 8,516 | $ | 10,074 | |||
Operating costs | 5,427 | 4,524 | |||||
Gross margin | $ | 3,089 | $ | 5,550 | |||
Hydraulic Fracturing
Years Ended December 31, | |||||||
2013 | 2012 | ||||||
(in thousands) | |||||||
Revenues | $ | 897,809 | $ | 415,168 | |||
Operating costs | 740,439 | 303,079 | |||||
Gross margin | $ | 157,370 | $ | 112,089 | |||
Adjusted EBITDA | $ | 138,889 | $ | 109,966 | |||
Hydraulic fracturing revenues for the year ended December 31, 2013 increased $482.6 million, or 116%, from the year ended December 31, 2012. This increase was due to an increase in our average number of operating fleets from five in 2012 to eight in 2013 resulting in a 154% increase in completed stages, partially offset by a 15% decrease in revenue per stage from 2012 to 2013. The decrease in revenue per stage was due primarily to market pricing pressure.
Hydraulic fracturing operating costs for the year ended December 31, 2013 increased $437.4 million, or 144%, from the year ended December 31, 2012 primarily due to a 154% increase in the number of completed stages. As a percentage of hydraulic fracturing revenues, hydraulic fracturing operating costs increased from 73% in 2012 to 82% in 2013. This increase was primarily attributable to market pricing pressure for our hydraulic fracturing services and an increase in product costs, which compressed margins. Revenue per stage decreased 15% from 2012 to 2013. As a percentage of hydraulic fracturing revenues, product costs were 50% in 2013 and 42% in 2012. These increases were partially offset by a reduction in labor-related costs, which as a percentage of hydraulic fracturing revenues decreased from 11% in 2012 to 8% in 2013.
Oilfield Rentals
Years Ended December 31, | |||||||
2013 | 2012 | ||||||
(in thousands) | |||||||
Revenues | $ | 160,241 | $ | 234,456 | |||
Operating costs | 101,746 | 134,075 | |||||
Gross margin | $ | 58,495 | $ | 100,381 | |||
Adjusted EBITDA | $ | 58,425 | $ | 95,230 | |||
Oilfield rental revenues for the year ended December 31, 2013 decreased $74.2 million, or 32%, from the year ended December 31, 2012 primarily due to lower utilization as a result of Chesapeake's reduction in drilling and completion activity and market pricing pressure for certain of our equipment. The utilization of our oilfield rental equipment has historically correlated with fluctuations in Chesapeake's drilling and completion activity.
52
Oilfield rental operating costs for the year ended December 31, 2013 decreased $32.3 million, or 24%, from the year ended December 31, 2012. The decrease was primarily due to an overall reduction in drilling and completion activity by Chesapeake, which resulted in lower labor-related costs, supplies, repairs and maintenance, freight and third party expenses. Our average oilfield rental employee headcount decreased 14% from 2012 to 2013. As a percentage of oilfield rental revenues, oilfield rental operating costs were 63% and 57% for 2013 and 2012, respectively. The increase in oilfield rental operating costs as a percentage of oilfield rental revenues from 2012 to 2013 was primarily attributable to market pricing pressure for certain services, which compressed margins, and spread our fixed costs over a smaller revenue base. As a percentage of oilfield rental revenues, labor-related costs were 29% and 24% in 2013 and 2012, respectively.
Oilfield Trucking
Years Ended December 31, | |||||||
2013 | 2012 | ||||||
(in thousands) | |||||||
Revenues | $ | 244,380 | $ | 226,161 | |||
Operating costs | 207,692 | 173,327 | |||||
Gross margin | $ | 36,688 | $ | 52,834 | |||
Adjusted EBITDA | $ | 18,653 | $ | 38,143 | |||
Oilfield trucking revenues for the year ended December 31, 2013 increased $18.2 million, or 8%, from the year ended December 31, 2012. These increases were primarily due to the expansion of our crude hauling fleet, partially offset by lower revenues from our rig relocation services. Our fluid handling services revenues increased approximately $45.5 million from 2012 to 2013 due primarily to Chesapeake's increased activity in liquids-rich plays. The decrease in revenues from our rig relocation services was primarily due to an overall reduction in drilling and completion activity by Chesapeake.
Oilfield trucking operating costs for the year ended December 31, 2013 increased $34.4 million, or 20%, from the year ended December 31, 2012 primarily due to the growth of our fluid handling services. Our fluid handling services operating costs increased approximately $42.1 million from 2012 to 2013. As a percentage of oilfield trucking revenue, oilfield trucking operating costs were 85% and 77% for 2013 and 2012, respectively. The increase in operating costs as a percentage of revenue was primarily attributable to an increase in labor-related costs due to a competitive market for trucking labor. As a percentage of oilfield trucking revenues, labor-related costs were 42% and 34% for 2013 and 2012, respectively.
As part of the spin-off, we sold our crude hauling assets to a third party. The operating results related to the crude hauling assets were historically included in our oilfield trucking segment and the associated revenues and operating costs are detailed below:
Years Ended December 31, | |||||||
2013 | 2012 | ||||||
(in thousands) | |||||||
Revenues | $ | 60,645 | $ | 36,102 | |||
Operating costs | 44,061 | 22,601 | |||||
Gross margin | $ | 16,584 | $ | 13,501 | |||
Other Operations
Years Ended December 31, | |||||||
2013 | 2012 | ||||||
(in thousands) | |||||||
Revenues | $ | 144,963 | $ | 129,029 | |||
Operating costs | 124,553 | 112,102 | |||||
Gross margin | $ | 20,410 | $ | 16,927 | |||
Our other operations currently consists of corporate functions. As part of the spin-off, we distributed our compression manufacturing business to Chesapeake, which was historically included in our other operations results. For the year ended December 31, 2013, revenues from our other operations increased $15.9 million, or 12%, from the year ended December 31,
53
2012. The increase was primarily due to a change in product mix and higher revenue rates. We sold natural gas compressor packages with total horsepower of approximately 138,000 and 130,000 in 2013 and 2012, respectively.
For the year ended December 31, 2013, operating costs for our other operations increased $12.5 million, or 11%, from the year ended December 31, 2012. The increase was primarily due to an increase in demand for our small natural gas compressors, which resulted in higher costs of goods sold. We sold natural gas compressor packages with total horsepower of approximately 138,000 and 130,000 in 2013 and 2012, respectively. As a percentage of compression manufacturing revenues, compression manufacturing costs were 85% and 87% in 2013 and 2012, respectively. The decrease in costs as a percentage of revenues was due to higher production of small natural gas compressors, which have comparatively higher margins.
The revenues and operating costs of our compression unit manufacturing business distributed to Chesapeake as part of the spin-off are detailed below:
Years Ended December 31, | |||||||
2013 | 2012 | ||||||
(in thousands) | |||||||
Revenues | $ | 143,995 | $ | 127,164 | |||
Operating costs | 123,020 | 110,645 | |||||
Gross margin | $ | 20,975 | $ | 16,519 | |||
Depreciation and Amortization. Depreciation and amortization for the years ended December 31, 2013 and 2012 was $289.6 million and $231.3 million, respectively. The increase reflects the additional investments in our asset base as a result of capital expenditures, primarily for new hydraulic fracturing equipment and PeakeRigs™. As a percentage of revenues, depreciation and amortization expense was 13% and 12% for 2013 and 2012, respectively.
General and Administrative Expenses. General and administrative expenses for the years ended December 31, 2013 and 2012 were $80.4 million and $66.4 million, respectively. The increase was due to hiring certain members of our senior management team in 2012 and additional allocated charges from Chesapeake for indirect corporate overhead to cover costs of functions such as legal, accounting, treasury, environmental safety, information technology and other corporate services, all related to an increase in our overall operating activity. Our administrative expense allocation was based on a percentage of revenues for us and determined by Chesapeake using the estimated costs incurred on our behalf. These charges from Chesapeake were $55.5 million and $49.4 million for 2013 and 2012, respectively. As a percentage of revenues, general and administrative expenses were 4% and 3% for 2013 and 2012, respectively.
(Gains) Losses on Sales of Property and Equipment. During the year ended December 31, 2013, we sold 14 drilling rigs and ancillary equipment not utilized in our business. During the year ended December 31, 2012, we sold 18 drilling rigs and ancillary equipment not utilized in our business. We recorded (gains) losses on sales of property and equipment of approximately ($2.6) million and $2.0 million related to these asset sales during the years ended December 31, 2013 and 2012, respectively.
Impairments and Other. During the years ended December 31, 2013 and 2012, we recognized $23.6 million and $11.8 million, respectively, of impairment charges for certain drilling rigs and spare equipment that we identified for sale as part of our broader strategy to divest non-essential drilling rigs. We also identified certain drilling rigs during the years ended December 31, 2013 and 2012 that we deemed to be impaired based on our assessment of future demand, and the suitability of the identified rigs in light of this demand. We recorded impairment charges of $25.4 million and $14.9 million during the years ended December 31, 2013 and 2012, respectively, related to these drilling rigs.
During the year ended December 31, 2013, we purchased 23 leased drilling rigs for approximately $140.2 million and paid lease termination costs of approximately $22.4 million. During the year ended December 31, 2012, we purchased 25 leased drilling rigs for approximately $36.2 million and paid lease termination costs of approximately $24.9 million.
During the year ended December 31, 2012, we also identified certain excess drill pipe that had become obsolete. The carrying value of such drill pipe was reduced to fair value, and we recorded impairment charges of $7.5 million to reduce the carrying amount of such drill pipe to its estimated fair value.
We identified certain other property and equipment during the years ended December 31, 2013 and 2012 that we deemed to be impaired based on our assessment of the fair value of such assets. We recorded impairment charges of $3.4 million and $1.7 million during the years ended December 31, 2013 and 2012, respectively, related to these assets.
54
Interest Expense. Interest expense for the years ended December 31, 2013 and 2012 was $56.8 million and $53.5 million, respectively.
Loss from Equity Investees. Loss from equity investees was $1.0 million and $0.4 million for the years ended December 31, 2013 and 2012, which was a result of our investments in Maalt and Big Star.
Other Income. Other income for the years ended December 31, 2013 and 2012 was $1.8 million and $1.5 million, respectively.
Income Tax (Benefit) Expense. We recorded income tax (benefit) expense of ($7.8) million and $46.9 million for the years ended December 31, 2013 and 2012, respectively. The $54.7 million increase in income tax benefit recorded for 2013 was primarily the result of a decrease in pre-tax income from $116.5 million of pre-tax income in 2012 to a pre-tax loss of $27.6 million in 2013. Our effective income tax rate for 2013 and 2012 was 28% and 40%, respectively. The decrease in our effective tax rate from 2012 to 2013 was primarily the result of permanent differences, including meals and entertainment, stock based compensation and fines and penalties, having a greater impact on our effective income tax rate due to lower pre-tax (loss) income base in 2013 compared to 2012.
Contractual Commitments and Obligations
In the normal course of business, we enter into various contractual obligations that impact, or could impact, our liquidity. The following table summarizes our material obligations as of December 31, 2014:
Payments Due by Period | |||||||||||||||||||
Less Than | 1-3 | 4-5 | More Than | ||||||||||||||||
Total | 1 Year | Years | Years | 5 Years | |||||||||||||||
(unaudited) | |||||||||||||||||||
(in thousands) | |||||||||||||||||||
Long-Term Debt: | |||||||||||||||||||
6.625% Senior Notes due 2019 | $ | 650,000 | $ | — | $ | — | $ | 650,000 | $ | — | |||||||||
6.50% Senior Notes due 2022 | 500,000 | — | — | — | 500,000 | ||||||||||||||
Term Loan | 398,000 | 4,000 | 8,000 | 8,000 | 378,000 | ||||||||||||||
Revolving bank credit facility | 50,500 | — | — | 50,500 | — | ||||||||||||||
Interest(a) | 589,237 | 91,401 | 180,895 | 180,327 | 136,614 | ||||||||||||||
Purchase obligations(b) | 182,787 | 182,787 | — | — | — | ||||||||||||||
Operating leases(c) | 19,332 | 7,676 | 9,319 | 2,337 | — | ||||||||||||||
Total | $ | 2,389,856 | $ | 285,864 | $ | 198,214 | $ | 891,164 | $ | 1,014,614 | |||||||||
(a) | Amount includes contractual interest payments on the 2019 Senior Notes, 2022 Senior Notes, and Term Loan. |
(b) | Consists of unconditional obligations to purchase equipment. Please read Note 7 to our consolidated financial statements included in Item 8 of this report. |
(c) | Consists of rail car and other operating leases. Amounts disclosed assume no exercise of options to renew or extend the leases. Please read Note 7 to our consolidated financial statements included in Item 8 of this report. |
Off-Balance Sheet Arrangements
As of December 31, 2014, we were party to five lease agreements with various third parties to lease rail cars for initial terms of five to seven years. Additional rental payments are required for the use of rail cars in excess of the allowable mileage stated in the respective agreement. We account for these leases as operating leases.
As of December 31, 2014, we were also party to various lease agreements for other property and equipment with varying terms. We account for these leases as operating leases.
55
Aggregate undiscounted minimum future lease payments as of December 31, 2014 under our rail car and other operating leases are presented below:
Rail Cars | Other | Total | |||||||||
(in thousands) | |||||||||||
2015 | $ | 5,823 | $ | 1,853 | $ | 7,676 | |||||
2016 | 5,823 | 902 | 6,725 | ||||||||
2017 | 2,168 | 426 | 2,594 | ||||||||
2018 | 1,445 | 170 | 1,615 | ||||||||
2019 | 722 | — | 722 | ||||||||
Total | $ | 15,981 | $ | 3,351 | $ | 19,332 | |||||
Other Commitments
Much of the equipment we purchase requires long production lead times. As a result, we usually have outstanding orders and commitments for such equipment. As of December 31, 2014, we had $182.8 million of purchase commitments related to future inventory and capital expenditures that we expect to incur in 2015.
Critical Accounting Policies
Our consolidated financial statements are prepared in accordance with generally accepted accounting principles, which require us to make estimates and assumptions that affect the reported amounts of assets and liabilities and disclosure of contingent assets and liabilities at the dates of the financial statements and the reported amounts of revenues and expenses during the reported periods.
Property and Equipment
Property and equipment are carried at cost less accumulated depreciation. Depreciation is calculated using the straight-line method, based on estimates, assumptions and judgments relative to the assets' estimated useful lives and salvage values. These estimates are based on various factors, including age (in the case of acquired assets), manufacturing specifications, technological advances and historical data concerning useful lives of similar assets. Upon the disposition of an asset, we eliminate the cost and related accumulated depreciation and include any resulting gain or loss in the consolidated statements of operations as (gains) losses on the sale of property and equipment. Expenditures for maintenance and repairs that do not add capacity or extend the useful life of an asset are expensed as incurred.
Interest is capitalized on the average amount of accumulated expenditures for major capital projects under construction using a weighted average interest rate based on our outstanding borrowings until the underlying assets are placed into service. The capitalized interest is added to the cost of the assets and amortized to depreciation expense over the useful life of the assets.
Impairment of Long-Lived Assets
We review our long-lived assets, such as property and equipment, whenever, in management's judgment, events or changes in circumstances indicate the carrying amount of the assets may not be fully recoverable. Factors that might indicate a potential impairment include a significant decrease in the market value of the long-lived asset, a significant change in the long-lived asset's physical condition, a change in industry conditions or a reduction in cash flows associated with the use of the long-lived asset. If these or other factors indicate the carrying amount of the asset may not be recoverable, we determine whether an impairment has occurred through analysis of the future undiscounted cash flows of the asset. If an impairment has occurred, we recognize a loss for the difference between the carrying amount and the fair market value of the asset. We measure the fair value of the asset using market prices or, in the absence of market prices, based on an estimate of discounted cash flows.
Goodwill, Intangible Assets and Amortization
Goodwill represents the cost in excess of fair value of the net assets of businesses acquired. Goodwill is not amortized. Intangible assets with finite lives are amortized on a basis that reflects the pattern in which the economic benefits of the intangible assets are realized, which is generally on a straight-line basis over an asset's estimated useful life.
56
We review goodwill for impairment annually on October 1 or more frequently if events or changes in circumstances indicate that the carrying amount of the reporting unit exceeds its fair value. Circumstances that could indicate a potential impairment include a significant adverse change in the economic or business climate, a significant adverse change in legal factors, an adverse action or assessment by a regulator, unanticipated competition, loss of key personnel and the likelihood that a reporting unit or significant portion of a reporting unit will be sold or otherwise disposed of. We have the option to first assess qualitative factors to determine whether the existence of events or circumstances leads to a determination that it is more likely than not that the fair value of one of our reporting units is greater than its carrying amount. If, after assessing the totality of events or circumstances, we determine it is more likely than not that the fair value of a reporting unit is greater than its carrying amount, then there is no need to perform any further testing. However, if we conclude otherwise, accounting guidance requires a two-step process for testing impairment. First, the fair value of each reporting unit is compared to its carrying value to determine whether an indication of impairment exists. Second, if impairment is indicated, the fair value of the reporting unit's goodwill is determined by allocating the unit's fair value to its assets and liabilities (including any unrecognized intangible assets) as if the reporting unit had been acquired in a business combination on the impairment test date. The amount of impairment for goodwill is measured as the excess of the carrying value of the reporting unit over its fair value. We have the option to bypass the qualitative assessment for any reporting unit in any period and proceed directly to performing the first step of the two-step goodwill impairment test.
When estimating fair values of a reporting unit for our goodwill impairment test, we use the income approach. The income approach provides an estimated fair value based on the reporting unit's anticipated cash flows that are discounted using a weighted average cost of capital rate. Estimated cash flows are primarily based on projected revenues, operating expenses and capital expenditures and are discounted using comparable industry average rates for weighted average cost of capital.
Revenue Recognition
We recognize revenue when services are performed, collection of receivables is reasonably assured, persuasive evidence of an arrangement exists and the price is fixed or determinable.
Drilling. We earn revenues by drilling oil and natural gas wells for our customers under daywork contracts. We recognize revenue on daywork contracts for the days completed based on the day rate each contract specifies. Payments received and costs incurred for mobilization services are recognized as earned over the days of mobilization.
Hydraulic Fracturing. We recognize revenue upon the completion of each fracturing stage. We typically complete one or more fracturing stages per day per active crew during the course of a job. A stage is considered complete when the customer requests or the job design dictates that pumping discontinue for that stage. Invoices typically include a lump sum equipment charge determined by the rate per stage each contract specifies and product charges for sand, chemicals and other products actually consumed during the course of providing our services.
Oilfield Rentals. We rent many types of oilfield equipment, including drill pipe, drill collars, tubing, blowout preventers, frac tanks, mud tanks and environmental containment. We also provide air drilling, flowback services and services associated with the transfer of water to the wellsite for well completions. We price our rentals and services by the day or hour based on the type of equipment rented and the services performed and recognize revenue ratably over the term of the rental.
Oilfield Trucking. Oilfield trucking provides rig relocation and logistics services as well as fluid handling services. Our trucks move drilling rigs, crude oil, other fluids and construction materials to and from the wellsite and also transport produced water from the wellsite. We price these services by the hour and volume and recognize revenue as services are performed.
Income Taxes
Through the effective date of the spin-off, our operations were included in the consolidated federal income tax return and other state returns for Chesapeake. The income tax provision for the period before the spin-off has been prepared on a separate return basis for us and all of our subsidiaries. Accordingly, we have recognized deferred tax assets and liabilities for the future tax consequences attributable to differences between the financial statement carrying amounts of existing assets and liabilities and their respective tax bases for all our subsidiaries as if each entity were a corporation, regardless of its actual characterization for U.S. federal income tax purposes. Effective with the spin-off, we entered into a tax sharing agreement with
57
Chesapeake which governs the respective rights, responsibilities and obligations of each company, for tax periods prior to the spin-off, with respect to the payment of taxes, filing of tax returns, reimbursement of taxes, control of audits and other tax proceedings, liability for taxes that may be triggered as a result of the spin-off and other matters regarding taxes. Following the spin-off, we are not entitled to federal income tax net operating loss ("NOL") carryforwards that were generated prior to the spin-off and that have historically been reflected in our net deferred income tax liabilities on our consolidated balance sheet.
A valuation allowance for deferred tax assets is recognized when it is more likely than not that some or all of the benefit from the deferred tax asset will not be realized. To assess that likelihood, we use estimates and judgment regarding our future taxable income, as well as the jurisdiction in which such taxable income is generated, to determine whether a valuation allowance is required. Such evidence can include our current financial position, our results of operations, both actual and forecasted, the reversal of deferred tax liabilities, and tax planning strategies as well as the current and forecasted business economics of our industry. We had no income tax valuation allowance as of December 31, 2014 and 2013.
The benefit of an uncertain tax position taken or expected to be taken on an income tax return is recognized in the consolidated financial statements at the largest amount that is more likely than not to be sustained upon examination by the relevant taxing authority. Interest and penalties, if any, related to uncertain tax positions would be recorded in interest expense and other expense, respectively. There were no uncertain tax positions as of December 31, 2014 and 2013.
New Accounting Pronouncements
In August 2014, the FASB issued ASU No 2014-15, "Presentation of Financial Statements - Going Concern," which requires management to evaluate whether there are conditions or events, considered in the aggregate, that raise substantial doubt about the entity's ability to continue as a going concern within one year after the date that the financial statements are issued (or within one year after the date that the financial statements are available to be issued when applicable). ASU 2014-15 is effective for fiscal years, and interim periods within those years, beginning after December 15, 2016, with early application permitted. We are currently evaluating what impact this standard will have on our consolidated financial statements.
In May 2014, the FASB issued ASU No. 2014-09, "Revenue from Contracts with Customers," which supersedes the revenue recognition requirements in "Revenue Recognition (Topic 605)," and requires entities to recognize revenue in a way that depicts the transfer of promised goods or services to customers in an amount that reflects the consideration to which the entity expects to be entitled to in exchange for those goods or services. ASU 2014-09 is effective for fiscal years, and interim periods within those years, beginning after December 15, 2016, with early application not permitted. We are currently evaluating what impact this standard will have on our consolidated financial statements.
In April 2014, the FASB issued ASU No. 2014-08, "Presentation of Financial Statements (Topic 205) and Property, Plant, and Equipment (Topic 360): Reporting Discontinued Operations and Disclosures of Disposals of Components of an Entity." ASU 2014-08 raises the threshold for a disposal to qualify as a discontinued operation and requires new disclosures of both discontinued operations and certain other disposals that do not meet the definition of a discontinued operation. It is effective for annual periods beginning on or after December 15, 2014. Early adoption is permitted but only for disposals that have not been reported in financial statements previously issued. We early adopted ASU 2014-08 in 2014. We applied this standard in our evaluation of the distributions of businesses and assets sales completed in 2014 and concluded that these disposals did not qualify as discontinued operations.
Inflation
Inflation in the U.S. has been relatively low in recent years and did not have a material impact on our results of operations for the years ended December 31, 2014, 2013 and 2012. Although the impact of inflation has been insignificant in recent years, it is still a factor in the U.S. economy and we tend to experience inflationary pressure on the cost of energy services and equipment as increasing oil and natural gas prices increase activity in our areas of operations.
58
Item 7A. | Quantitative and Qualitative Disclosures About Market Risk | |||
Historically, we have provided a significant percentage of our oilfield services to Chesapeake and its working interest partners. For the years ended December 31, 2014, 2013 and 2012, Chesapeake and its working interest partners accounted for approximately 81%, 90% and 94% of our revenues, respectively. Sustained low oil and natural gas prices and volatile commodity prices in general, could have an adverse effect on our customers' capital spending, which could adversely impact our cash flows and financial position and thereby adversely affect our ability to comply with the financial covenant under our New Credit Facility and further limit our ability to fund our planned capital expenditures. Furthermore, if there is a material change in economic conditions or other circumstances influencing the estimate of future cash flows or fair value, we could be required to recognize impairment charges in future periods.
Changes in interest rates affect the amount of interest we earn on our cash, cash equivalents and short-term investments and the interest rate we pay on borrowings under our New Credit Facility and Term Loan. We have borrowings outstanding under, and may in the future borrow under, fixed rate and variable rate debt instruments that give rise to interest rate risk. For fixed rate debt, changes in interest rates generally affect the fair value of the debt instrument, but not our earnings or cash flows. Conversely, for variable rate debt, changes in interest rates generally do not impact the fair value of the debt instrument, but may affect our future earnings and cash flows. Our primary exposure to interest rate risk results from outstanding borrowings under our New Credit Facility and Term Loan.
The following table provides information about our debt instruments that are sensitive to changes in interest rates. The table presents principal cash flows and related weighted-average interest rates by expected maturity dates. Weighted-average variable rates are based on effective rates at the reporting date.
Fixed Rate Maturity | Average Interest Rate | Floating Rate Maturity | Average Interest Rate | ||||||||||
(in thousands) | (in thousands) | ||||||||||||
2015 | $ | — | — | $ | 4,000 | 3.750 | % | ||||||
2016 | — | — | 4,000 | 3.750 | % | ||||||||
2017 | — | — | 4,000 | 3.750 | % | ||||||||
2018 | — | — | 4,000 | 3.750 | % | ||||||||
2019 | 650,000 | 6.625 | % | 54,500 | 3.778 | % | |||||||
After 2019 | 500,000 | 6.500 | % | 378,000 | 3.750 | % | |||||||
Total | $ | 1,150,000 | $ | 448,500 | |||||||||
Fair Value | $ | 815,438 | $ | 426,502 | |||||||||
Our fuel costs, which consist primarily of diesel fuel used by our various trucks and other equipment, can expose us to commodity price risk and, as our hydraulic fracturing operations grow, we will face increased risks associated with the prices of materials used in hydraulic fracturing, such as sand and chemicals. The prices for fuel and these materials can be volatile and are impacted by changes in supply and demand, as well as market uncertainty and regional shortages.
Historically, we have not used derivative financial instruments to manage our exposure to these risks.
59
Item 8. | Financial Statements and Supplementary Data | |||
INDEX TO FINANCIAL STATEMENTS | |
SEVENTY SEVEN ENERGY INC. | |
Page | |
Consolidated Financial Statements: | |
Report of Independent Registered Public Accounting Firm | |
Consolidated Balance Sheets at December 31, 2014 and 2013 | |
Consolidated Statements of Operations for the Years Ended December 31, 2014, 2013 and 2012 | |
Consolidated Statements of Changes in Equity for the Years Ended December 31, 2014, 2013 and 2012 | |
Consolidated Statements of Cash Flows for the Years Ended December 31, 2014, 2013 and 2012 | |
Notes to Consolidated Financial Statements | |
60
Report of Independent Registered Public Accounting Firm
To the Board of Directors and Shareholders of Seventy Seven Energy Inc.:
In our opinion, the accompanying consolidated balance sheets and the related consolidated statements of operations, of changes in equity and of cash flows present fairly, in all material respects, the financial position of Seventy Seven Energy Inc. and its subsidiaries at December 31, 2014 and 2013, and the results of their operations and their cash flows for each of the three years in the period ended December 31, 2014 in conformity with accounting principles generally accepted in the United States of America. Also in our opinion, the Company did not maintain, in all material respects, effective internal control over financial reporting as of December 31, 2014, based on criteria established in Internal Control - Integrated Framework (2013) issued by the Committee of Sponsoring Organizations of the Treadway Commission (COSO) because a material weakness in internal control over financial reporting related to the Company's change in providers used in the processing of its payroll existed as of that date. A material weakness is a deficiency, or a combination of deficiencies, in internal control over financial reporting, such that there is a reasonable possibility that a material misstatement of the annual or interim financial statements will not be prevented or detected on a timely basis. The material weakness referred to above is described in Management's Annual Report on Internal Control Over Financial Reporting appearing under Item 9A. We considered this material weakness in determining the nature, timing, and extent of audit tests applied in our audit of the 2014 consolidated financial statements, and our opinion regarding the effectiveness of the Company's internal control over financial reporting does not affect our opinion on those consolidated financial statements. The Company's management is responsible for these financial statements, for maintaining effective internal control over financial reporting and for its assessment of the effectiveness of internal control over financial reporting, included in management's report referred to above. Our responsibility is to express opinions on these financial statements and on the Company's internal control over financial reporting based on our integrated audits. We conducted our audits in accordance with the standards of the Public Company Accounting Oversight Board (United States). Those standards require that we plan and perform the audits to obtain reasonable assurance about whether the financial statements are free of material misstatement and whether effective internal control over financial reporting was maintained in all material respects. Our audits of the financial statements included examining, on a test basis, evidence supporting the amounts and disclosures in the financial statements, assessing the accounting principles used and significant estimates made by management, and evaluating the overall financial statement presentation. Our audit of internal control over financial reporting included obtaining an understanding of internal control over financial reporting, assessing the risk that a material weakness exists, and testing and evaluating the design and operating effectiveness of internal control based on the assessed risk. Our audits also included performing such other procedures as we considered necessary in the circumstances. We believe that our audits provide a reasonable basis for our opinions.
A company's internal control over financial reporting is a process designed to provide reasonable assurance regarding the reliability of financial reporting and the preparation of financial statements for external purposes in accordance with generally accepted accounting principles. A company's internal control over financial reporting includes those policies and procedures that (i) pertain to the maintenance of records that, in reasonable detail, accurately and fairly reflect the transactions and dispositions of the assets of the company; (ii) provide reasonable assurance that transactions are recorded as necessary to permit preparation of financial statements in accordance with generally accepted accounting principles, and that receipts and expenditures of the company are being made only in accordance with authorizations of management and directors of the company; and (iii) provide reasonable assurance regarding prevention or timely detection of unauthorized acquisition, use, or disposition of the company's assets that could have a material effect on the financial statements.
Because of its inherent limitations, internal control over financial reporting may not prevent or detect misstatements. Also, projections of any evaluation of effectiveness to future periods are subject to the risk that controls may become inadequate because of changes in conditions, or that the degree of compliance with the policies or procedures may deteriorate.
/s/ PricewaterhouseCoopers LLP
Oklahoma City, Oklahoma
March 2, 2015
61
SEVENTY SEVEN ENERGY INC.
Consolidated Balance Sheets
December 31, | |||||||
2014 | 2013 | ||||||
(in thousands) | |||||||
Assets: | |||||||
Current Assets: | |||||||
Cash | $ | 891 | $ | 1,678 | |||
Accounts receivable, net of allowance of $3,311 and $524 at December 31, 2014 and December 31, 2013, respectively | 421,555 | 375,439 | |||||
Inventory | 25,073 | 45,035 | |||||
Deferred income tax asset | 7,463 | 5,318 | |||||
Prepaid expenses and other | 19,072 | 20,301 | |||||
Total Current Assets | 474,054 | 447,771 | |||||
Property and Equipment: | |||||||
Property and equipment, at cost | 2,749,886 | 2,241,350 | |||||
Less: accumulated depreciation | (982,833 | ) | (773,282 | ) | |||
Property and equipment held for sale, net | — | 29,408 | |||||
Total Property and Equipment, Net | 1,767,053 | 1,497,476 | |||||
Other Assets: | |||||||
Equity method investment | 7,816 | 13,236 | |||||
Goodwill | 27,434 | 42,447 | |||||
Intangible assets, net | 5,420 | 7,429 | |||||
Deferred financing costs | 23,851 | 14,080 | |||||
Other long-term assets | 6,924 | 4,454 | |||||
Total Other Assets | 71,445 | 81,646 | |||||
Total Assets | $ | 2,312,552 | $ | 2,026,893 | |||
Liabilities and Equity: | |||||||
Current Liabilities: | |||||||
Accounts payable | $ | 45,657 | $ | 64,866 | |||
Current portion of long-term debt | 4,000 | — | |||||
Other current liabilities | 215,752 | 210,123 | |||||
Total Current Liabilities | 265,409 | 274,989 | |||||
Long-Term Liabilities: | |||||||
Deferred income tax liabilities | 159,273 | 145,747 | |||||
Long-term debt, less current maturities | 1,594,500 | 1,055,000 | |||||
Other long-term liabilities | 2,347 | 3,965 | |||||
Total Long-Term Liabilities | 1,756,120 | 1,204,712 | |||||
Commitments and Contingencies (Note 7) | |||||||
Common stock. $0.01 par value: authorized 250,000,000 shares; issued and outstanding 51,158,968 shares at December 31, 2014 | 512 | — | |||||
Paid-in capital | 301,644 | — | |||||
Accumulated deficit | (11,133 | ) | — | ||||
Owner's equity | — | 547,192 | |||||
Total Equity | 291,023 | 547,192 | |||||
Total Liabilities and Equity | $ | 2,312,552 | $ | 2,026,893 | |||
The accompanying notes are an integral part of these consolidated financial statements.
62
SEVENTY SEVEN ENERGY INC.
Consolidated Statements of Operations
Years Ended December 31, | |||||||||||
2014 | 2013 | 2012 | |||||||||
(in thousands) | |||||||||||
Revenues: | |||||||||||
Revenues | $ | 2,080,892 | $ | 2,188,205 | $ | 1,920,022 | |||||
Operating Expenses: | |||||||||||
Operating costs | 1,580,353 | 1,717,709 | 1,390,786 | ||||||||
Depreciation and amortization | 292,912 | 289,591 | 231,322 | ||||||||
General and administrative | 108,139 | 80,354 | 66,360 | ||||||||
(Gains) losses on sales of property and equipment | (6,272 | ) | (2,629 | ) | 2,025 | ||||||
Impairments and other | 30,764 | 74,762 | 60,710 | ||||||||
Total Operating Expenses | 2,005,896 | 2,159,787 | 1,751,203 | ||||||||
Operating Income | 74,996 | 28,418 | 168,819 | ||||||||
Other (Expense) Income: | |||||||||||
Interest expense | (79,734 | ) | (56,786 | ) | (53,548 | ) | |||||
Loss and impairment from equity investees | (6,094 | ) | (958 | ) | (361 | ) | |||||
Other income | 664 | 1,758 | 1,543 | ||||||||
Total Other Expense | (85,164 | ) | (55,986 | ) | (52,366 | ) | |||||
(Loss) Income Before Income Taxes | (10,168 | ) | (27,568 | ) | 116,453 | ||||||
Income Tax (Benefit) Expense | (2,189 | ) | (7,833 | ) | 46,877 | ||||||
Net (Loss) Income | $ | (7,979 | ) | $ | (19,735 | ) | $ | 69,576 | |||
(Loss) Earnings Per Common Share (Note 3) | |||||||||||
Basic | $ | (0.17 | ) | $ | (0.42 | ) | $ | 1.48 | |||
Diluted | $ | (0.17 | ) | $ | (0.42 | ) | $ | 1.48 | |||
Weighted Average Common Shares Outstanding | |||||||||||
Basic | 47,236 | 46,932 | 46,932 | ||||||||
Diluted | 47,236 | 46,932 | 46,932 | ||||||||
The accompanying notes are an integral part of these consolidated financial statements.
63
SEVENTY SEVEN ENERGY INC.
Consolidated Statements of Changes in Equity
Common Stock | Common Stock | Paid-in Capital | Owner's Equity | Accumulated Deficit | Total Stockholders' / Owner's Equity | |||||||||||||||||
(Shares) | (in thousands) | |||||||||||||||||||||
Balance at December 31, 2011 | — | $ | — | $ | — | $ | 548,896 | $ | — | $ | 548,896 | |||||||||||
Net income | — | — | — | 69,576 | — | 69,576 | ||||||||||||||||
Distributions to Chesapeake, net | — | — | — | (21,655 | ) | — | (21,655 | ) | ||||||||||||||
Balance at December 31, 2012 | — | — | — | 596,817 | — | 596,817 | ||||||||||||||||
Net loss | — | — | — | (19,735 | ) | — | (19,735 | ) | ||||||||||||||
Distributions to Chesapeake, net | — | — | — | (29,890 | ) | — | (29,890 | ) | ||||||||||||||
Balance at December 31, 2013 | — | $ | — | $ | — | $ | 547,192 | $ | — | $ | 547,192 | |||||||||||
Net income (loss) | — | — | — | 3,154 | (11,133 | ) | (7,979 | ) | ||||||||||||||
Contributions from Chesapeake | — | — | — | 190,297 | — | 190,297 | ||||||||||||||||
Distributions to Chesapeake | — | — | — | (482,001 | ) | — | (482,001 | ) | ||||||||||||||
Reclassification of owner's equity to paid-in capital | — | — | 258,642 | (258,642 | ) | — | — | |||||||||||||||
Issuance of common stock at spin-off | 46,932 | 469 | (469 | ) | — | — | — | |||||||||||||||
Share-based compensation | 4,227 | 43 | 43,471 | — | — | 43,514 | ||||||||||||||||
Balance at December 31, 2014 | 51,159 | $ | 512 | $ | 301,644 | $ | — | $ | (11,133 | ) | $ | 291,023 | ||||||||||
The accompanying notes are an integral part of these consolidated financial statements.
64
SEVENTY SEVEN ENERGY INC.
Consolidated Statements of Cash Flows
Years Ended December 31, | |||||||||||
2014 | 2013 | 2012 | |||||||||
(in thousands) | |||||||||||
CASH FLOWS FROM OPERATING ACTIVITIES: | |||||||||||
NET (LOSS) INCOME | $ | (7,979 | ) | $ | (19,735 | ) | $ | 69,576 | |||
ADJUSTMENTS TO RECONCILE NET INCOME TO CASH PROVIDED BY OPERATING ACTIVITIES: | |||||||||||
Depreciation and amortization | 292,912 | 289,591 | 231,322 | ||||||||
Amortization of sale/leaseback gains | (5,414 | ) | (15,995 | ) | (8,821 | ) | |||||
Amortization of deferred financing costs | 6,122 | 2,928 | 2,906 | ||||||||
(Gains) losses on sales of property and equipment | (6,272 | ) | (2,629 | ) | 2,025 | ||||||
Impairments | 21,063 | 52,400 | 35,855 | ||||||||
Loss and impairment from equity investees | 6,094 | 958 | 361 | ||||||||
Provision for doubtful accounts | 2,887 | 436 | 310 | ||||||||
Non-cash compensation | 47,184 | — | — | ||||||||
Deferred income tax (benefit) expense | (2,863 | ) | (9,255 | ) | 46,128 | ||||||
Other | 150 | 1,641 | 264 | ||||||||
Changes in operating assets and liabilities, | |||||||||||
Accounts receivable | (81,001 | ) | (12,385 | ) | (159,657 | ) | |||||
Inventory | (6,543 | ) | 7,193 | (23,782 | ) | ||||||
Accounts payable | (11,954 | ) | 4,464 | (15,688 | ) | ||||||
Other current liabilities | 9,949 | 38,324 | 33,957 | ||||||||
Other | 961 | (865 | ) | (3,605 | ) | ||||||
Net cash provided by operating activities | 265,296 | 337,071 | 211,151 | ||||||||
CASH FLOWS FROM INVESTING ACTIVITIES: | |||||||||||
Additions to property and equipment | (457,618 | ) | (349,806 | ) | (622,825 | ) | |||||
Proceeds from sales of assets | 88,556 | 50,602 | 47,421 | ||||||||
Proceeds from sale of investment | — | 2,790 | — | ||||||||
Additions to investments | (675 | ) | (431 | ) | (1,920 | ) | |||||
Other | 2,091 | 28 | — | ||||||||
Net cash used in investing activities | (367,646 | ) | (296,817 | ) | (577,324 | ) | |||||
CASH FLOWS FROM FINANCING ACTIVITIES: | |||||||||||
Distributions to Chesapeake | (422,839 | ) | (29,890 | ) | (22,330 | ) | |||||
Proceeds from issuance of senior notes, net of offering costs | 493,825 | — | — | ||||||||
Proceeds from issuance of term loan, net of issuance costs | 393,879 | — | — | ||||||||
Payments on term loan | (2,000 | ) | — | — | |||||||
Borrowings from revolving credit facility | 1,201,400 | 1,216,900 | 1,389,100 | ||||||||
Payments on revolving credit facility | (1,555,900 | ) | (1,230,100 | ) | (999,900 | ) | |||||
Deferred financing costs | (3,597 | ) | — | — | |||||||
Other | (3,205 | ) | 3,287 | — | |||||||
Net cash provided by (used in) financing activities | 101,563 | (39,803 | ) | 366,870 | |||||||
Net (decrease) increase in cash | (787 | ) | 451 | 697 | |||||||
Cash, beginning of period | 1,678 | 1,227 | 530 | ||||||||
Cash, end of period | $ | 891 | $ | 1,678 | $ | 1,227 | |||||
SUPPLEMENTAL DISCLOSURE OF SIGNIFICANT NON-CASH INVESTING AND FINANCING ACTIVITIES: | |||||||||||
Increase (decrease) in other current liabilities related to purchases of property and equipment | $ | 18,999 | $ | (54,457 | ) | $ | 30,466 | ||||
Property and equipment distributed to Chesapeake at spin-off | $ | (792 | ) | $ | — | $ | — | ||||
Property and equipment contributed from Chesapeake at spin-off | $ | 190,297 | $ | — | $ | — | |||||
Increase in distributions to Chesapeake due to transfer of tax attributes | $ | — | $ | — | $ | (675 | ) | ||||
SUPPLEMENTAL DISCLOSURE OF CASH PAYMENTS: | |||||||||||
Interest, net of amount capitalized | $ | 54,439 | $ | 55,250 | $ | 51,579 | |||||
The accompanying notes are an integral part of these consolidated financial statements.
65
SEVENTY SEVEN ENERGY INC.
NOTES TO CONSOLIDATED FINANCIAL STATEMENTS
1. Spin-off, Basis of Presentation and Nature of Business
Spin-Off
On June 9, 2014, Chesapeake Energy Corporation ("Chesapeake") announced that its board of directors approved the spin-off of its oilfield services division through the pro rata distribution of 100% of the shares of common stock of Seventy Seven Energy Inc. ("SSE," "we," "us," "our" or "ours") to Chesapeake's shareholders of record as of the close of business on June 19, 2014, the record date. On June 30, 2014, each Chesapeake shareholder received one share of SSE common stock for every fourteen shares of Chesapeake common stock held by such shareholder on the record date, and SSE became an independent, publicly traded company as a result of the distribution. The transactions in which SSE became an independent, publicly traded company, including the distribution, are referred to collectively as the "spin-off". Prior to the spin-off, we conducted our business as Chesapeake Oilfield Operating, L.L.C. ("COO"), a wholly owned subsidiary of Chesapeake. Following the spin-off, Chesapeake retained no ownership interest in SSE, and each company has separate public ownership, boards of directors and management. A registration statement on Form 10, as amended through the time of its effectiveness, describing the spin-off was filed by SSE with the U.S. Securities and Exchange Commission ("SEC") and was declared effective on June 17, 2014. On July 1, 2014, SSE stock began trading the "regular-way" on the New York Stock Exchange under the ticker symbol of "SSE". See Note 13 for further discussion of agreements entered into as part of the spin-off, including a master separation agreement, a transition services agreement, an employee matters agreement and a tax sharing agreement, among others. As part of the spin-off, we completed the following transactions, among others, which we refer to as the "Transactions":
• | we entered into a new $275.0 million senior secured revolving credit facility (the "New Credit Facility") and a $400.0 million secured term loan (the "Term Loan"). We used the proceeds from borrowings under these new facilities to repay in full and terminate our $500.0 million senior secured revolving credit facility (the "Old Credit Facility"). |
• | we issued new 6.50% senior unsecured notes due 2022 (the "2022 Notes") and used the net proceeds of approximately $493.8 million to make a cash distribution of approximately $391.0 million to Chesapeake, to repay a portion of outstanding indebtedness under the New Credit Facility and for general corporate purposes. |
• | we distributed our compression unit manufacturing and geosteering businesses to Chesapeake. |
• | we sold our crude hauling assets to a third party and used a portion of the net proceeds received to make a $30.9 million cash distribution to Chesapeake. |
• | Chesapeake transferred to us buildings and real estate used in our business, including property and equipment, at cost of approximately $212.5 million and accumulated depreciation of $22.2 million as of the date of the spin-off. |
• | COO transferred all of its existing assets, operations and liabilities, including our 6.625% senior unsecured notes due 2019 (the "2019 Notes"), to Seventy Seven Operating LLC ("SSO"). SSO is an Oklahoma limited liability company, our direct wholly-owned subsidiary and, after giving effect to the Transactions, the owner of all our operating subsidiaries. |
• | COO was renamed SSE and converted from a limited liability company to a corporation. |
66
As part of the spin-off, we distributed our compression unit manufacturing and geosteering businesses to Chesapeake. The following table presents the carrying value of the major categories of assets and liabilities of the businesses distributed to Chesapeake on June 26, 2014, and as reflected on our consolidated balance sheets as of December 31, 2013.
June 26, 2014 | December 31, 2013 | ||||||
(in thousands) | |||||||
Current Assets: | |||||||
Accounts receivable | $ | 24,608 | $ | 15,838 | |||
Inventory | 26,137 | 19,672 | |||||
Deferred income tax asset | 165 | 416 | |||||
Prepaid expenses and other | — | 27 | |||||
Total current assets | 50,910 | 35,953 | |||||
Property and equipment, net | 792 | 803 | |||||
Goodwill | 15,013 | 15,013 | |||||
Total assets | $ | 66,715 | $ | 51,769 | |||
Current Liabilities: | |||||||
Accounts payable | $ | 9,177 | $ | 5,594 | |||
Other current liabilities | 20,409 | 5,393 | |||||
Total current liabilities | 29,586 | 10,987 | |||||
Deferred income tax liabilities | 2,221 | 4,429 | |||||
Total liabilities | $ | 31,807 | $ | 15,416 | |||
Basis of Presentation
The accompanying consolidated financial statements and related notes include the accounts of SSE and its subsidiaries, all of which are 100% owned. SSE's accounting and financial reporting policies conform to accounting principles and practices generally accepted in the United States of America ("GAAP"). All significant intercompany accounts and transactions within SSE have been eliminated.
Seventy Seven Finance Inc. ("SSF") is a 100% owned finance subsidiary of SSE that was incorporated for the purpose of facilitating the offering of SSE's 2019 Notes (see Note 5). SSF does not have any operations or revenues.
Nature of Business
We provide a wide range of wellsite services and equipment, including drilling, hydraulic fracturing, oilfield rentals, rig relocation, and fluid handling and disposal. We conduct our operations in Kansas, Louisiana, New Mexico, North Dakota, Ohio, Oklahoma, Pennsylvania, Texas, West Virginia, Wisconsin and Wyoming. As of December 31, 2014, our primary owned assets consisted of 92 drilling rigs, 10 hydraulic fracturing fleets, 263 rig relocation trucks, 67 cranes and forklifts and 141 fluid hauling trucks. Our reportable business segments are drilling, hydraulic fracturing, oilfield rentals, oilfield trucking and other operations (see Note 14).
67
SEVENTY SEVEN ENERGY INC.
NOTES TO CONSOLIDATED FINANCIAL STATEMENTS – (Continued)
2. Significant Accounting Policies
Accounting Estimates
The preparation of consolidated financial statements in conformity with GAAP requires management to make estimates and assumptions that affect the reported amounts of assets and liabilities and disclosure of contingent assets and liabilities at the balance sheet date and the reported amounts of revenues and expenses during the reporting periods. Although management believes these estimates are reasonable, actual results could differ from those estimates. Areas where critical accounting estimates are made by management include:
• | estimated useful lives of assets, which impacts depreciation and amortization of property and equipment; |
• | impairment of long-lived assets, goodwill and intangibles; |
• | income taxes; |
• | accruals related to revenue, expenses, capital costs and contingencies; and |
• | cost allocations as described in Note 13. |
Risks and Uncertainties
Historically, we have provided a significant percentage of our oilfield services to Chesapeake. For the years ended December 31, 2014, 2013 and 2012, Chesapeake accounted for approximately 81%, 90% and 94%, respectively, of our revenues. Sustained low oil and natural gas prices, or periods of volatility in commodity prices, could have a material adverse effect on our customers and our own financial position, results of operations and cash flows, which could limit our ability to fund our planned capital expenditures. Furthermore, if there is a material change in economic conditions or other circumstances influencing the estimate of future cash flows or fair value, we could be required to recognize impairment charges in future periods.
Accounts Receivable
Trade accounts receivable are recorded at the invoice amount and do not bear interest. The majority of our receivables, 77% and 83% at December 31, 2014 and 2013, respectively, are with Chesapeake and its subsidiaries. The allowance for doubtful accounts represents our best estimate for losses that may occur resulting from disputed amounts with our customers and their inability to pay amounts owed. We determine the allowance based on historical write-off experience and information about specific customers. During the years ended December 31, 2014, 2013 and 2012, we recognized $2.9 million, $0.4 million and $0.3 million, respectively, of bad debt expense related to potentially uncollectible receivables. We also recognized reductions to our allowance of $0.1 million, $0.4 million and a nominal amount as we wrote off specific receivables against our allowance for the years ended December 31, 2014, 2013 and 2012, respectively.
Inventory
We value inventory at the lower of cost or market using the average cost method. Average cost is derived from third-party invoices and production cost. Production cost includes material, labor and manufacturing overhead. Inventory primarily consists of proppants and chemicals used in our hydraulic fracturing operations and components used in our compressor manufacturing business, which was distributed to Chesapeake in 2014. A summary of our inventory is as follows:
December 31, | |||||||
2014 | 2013 | ||||||
(in thousands) | |||||||
Raw materials, components and supplies | $ | 25,073 | $ | 40,725 | |||
Work in process | — | 4,310 | |||||
Total inventory | $ | 25,073 | $ | 45,035 | |||
Property and Equipment
Property and equipment are carried at cost less accumulated depreciation. Depreciation of assets is based on estimates, assumptions and judgments relative to useful lives and salvage values. Upon the disposition of an asset, we eliminate the cost and related accumulated depreciation and include any resulting gain or loss in operating expenses in the consolidated statements
68
SEVENTY SEVEN ENERGY INC.
NOTES TO CONSOLIDATED FINANCIAL STATEMENTS – (Continued)
of operations. Expenditures for maintenance and repairs that do not add capacity or extend the useful life of an asset are expensed as incurred.
A summary of our property and equipment amounts and useful lives is as follows:
Estimated | |||||||||
December 31, | Useful | ||||||||
2014 | 2013 | Life | |||||||
(in thousands) | (in years) | ||||||||
Drilling rigs and related equipment | $ | 1,521,561 | $ | 1,146,747 | 3-15 | ||||
Hydraulic fracturing equipment | 360,122 | 327,448 | 2-7 | ||||||
Oilfield rental equipment | 332,085 | 327,430 | 2-10 | ||||||
Trucking and fluid disposal equipment | 183,511 | 209,255 | 5-8 | ||||||
Leasehold improvements(a) | — | 110,660 | 3-5 | ||||||
Vehicles | 53,316 | 56,022 | 3 | ||||||
Buildings and improvements | 202,196 | 5,731 | 3-39 | ||||||
Land | 21,613 | 2,290 | — | ||||||
Other | 75,482 | 55,767 | 3-10 | ||||||
Total property and equipment, at cost | 2,749,886 | 2,241,350 | |||||||
Less: accumulated depreciation and amortization | (982,833 | ) | (773,282 | ) | |||||
Property and equipment held for sale, net | — | 29,408 | |||||||
Total property and equipment, net | $ | 1,767,053 | $ | 1,497,476 | |||||
(a) | In 2014, we purchased the remaining drilling rigs that were subject to various master lease agreements. |
Depreciation is calculated using the straight-line method based on the assets' estimated useful lives and salvage values. These estimates are based on various factors including age (in the case of acquired assets), manufacturing specifications, technological advances and historical data concerning useful lives of similar assets.
We review the estimated useful lives of our property and equipment on an ongoing basis. Based on this review, we concluded that the estimated useful lives of certain of our Tier 2 and Tier 3 drilling rigs were shorter than the estimated useful lives used for depreciation in our consolidated financial statements. As a result, effective July 1, 2014, we changed our estimates of the useful lives of these Tier 2 and Tier 3 drilling rigs to better reflect the estimated periods during which these drilling rigs will remain in service. The effect of this change in estimate increased 2014 depreciation expense by $3.9 million, decreased 2014 net income by $3.9 million, and decreased 2014 basic and diluted earnings per share by $0.08.
Depreciation expense on property and equipment for the years ended December 31, 2014, 2013 and 2012 was $290.9 million, $285.6 million and $227.2 million, respectively. Included in property and equipment are $139.3 million and $106.1 million at December 31, 2014 and 2013, respectively, of assets that are being constructed or have not been placed into service, and therefore are not subject to depreciation.
Interest is capitalized on the average amount of accumulated expenditures for major capital projects under construction using a weighted average interest rate based on our outstanding borrowings until the underlying assets are placed into service. Capitalized interest is added to the cost of the assets and amortized to depreciation expense over the useful life of the assets. During the years ended December 31, 2014, 2013 and 2012, we capitalized interest of approximately $2.1 million, $1.1 million and $2.2 million, respectively.
Impairment of Long-Lived Assets
We review our long-lived assets, such as property and equipment, whenever, in management's judgment, events or changes in circumstances indicate the carrying amount of the assets may not be recoverable. Factors that might indicate a potential impairment include a significant decrease in the market value of the long-lived asset, a significant change in the long-lived asset's physical condition, a change in industry conditions or a reduction in cash flows associated with the use of the long-lived asset. If these or other factors indicate the carrying amount of the asset may not be recoverable, we determine whether an impairment has occurred through analysis of the future undiscounted cash flows of the asset. If an impairment has occurred, we
69
SEVENTY SEVEN ENERGY INC.
NOTES TO CONSOLIDATED FINANCIAL STATEMENTS – (Continued)
recognize a loss for the difference between the carrying amount and the fair value of the asset. We measure the fair value of the asset using market prices or, in the absence of market prices, based on an estimate of discounted cash flows.
Investments
Investments in securities are accounted for under the equity method in circumstances where we have the ability to exercise significant influence over the operating and investing policies of the investee but do not have control. Under the equity method, we recognize our share of the investee's earnings in our consolidated statements of operations. We consolidate all subsidiaries in which we hold a controlling interest.
We evaluate our investments for impairment and recognize a charge to earnings when any identified impairment is determined to be other than temporary. See Note 10 for further discussion of investments.
Goodwill, Intangible Assets and Amortization
Goodwill represents the cost in excess of fair value of the net assets of businesses acquired. In 2011, we recorded goodwill in the amounts of $27.4 million and $15.1 million related to our acquisitions of Bronco Drilling Company, Inc. ("Bronco") and Horizon Oilfield Services, L.L.C. ("Horizon"), respectively. In connection with the spin-off, the Horizon goodwill was distributed to Chesapeake with our geosteering business. The goodwill is assigned to our drilling segment. Goodwill is not amortized. Intangible assets with finite lives are amortized on a basis that reflects the pattern in which the economic benefits of the intangible assets are realized, which is generally on a straight-line basis over an asset's estimated useful life.
We review goodwill for impairment annually on October 1 or more frequently if events or changes in circumstances indicate that the carrying amount of the reporting unit exceeds its fair value. Circumstances that could indicate a potential impairment include a significant adverse change in the economic or business climate, a significant adverse change in legal factors, an adverse action or assessment by a regulator, unanticipated competition, loss of key personnel and the likelihood that a reporting unit or significant portion of a reporting unit will be sold or otherwise disposed of. Under GAAP, we have the option to first assess qualitative factors to determine whether the existence of events or circumstances leads to a determination that it is more likely than not that the fair value of one of our reporting units is greater than its carrying amount. If, after assessing the totality of events or circumstances, we determine it is more likely than not that the fair value of a reporting unit is greater than its carrying amount, then there is no need to perform any further testing. However, if we conclude otherwise, accounting guidance requires a two-step process for testing impairment. First, the fair value of each reporting unit is compared to its carrying value to determine whether an indication of impairment exists. Second, if impairment is indicated, the fair value of the reporting unit's goodwill is determined by allocating the unit's fair value to its assets and liabilities (including any unrecognized intangible assets) as if the reporting unit had been acquired in a business combination on the impairment test date. The amount of impairment for goodwill is measured as the excess of the carrying value of the goodwill over its implied fair value.
When estimating fair values of a reporting unit for our goodwill impairment test, we use the income approach. The income approach provides an estimated fair value based on the reporting unit's anticipated cash flows that are discounted using a weighted average cost of capital rate. Estimated cash flows are primarily based on projected revenues, operating expenses and capital expenditures and are discounted using comparable industry average rates for weighted average cost of capital. For purposes of performing the impairment tests for goodwill, all of our goodwill relates to our drilling reporting unit. We performed the two-step process for testing goodwill for impairment on October 1, 2014 and concluded that the fair value of the drilling reporting unit exceeded its carrying amount.
70
SEVENTY SEVEN ENERGY INC.
NOTES TO CONSOLIDATED FINANCIAL STATEMENTS – (Continued)
Our definite-lived intangible assets, consisting of customer relationships and a trade name, are amortized using the straight-line method. A summary of these assets and their useful lives is as follows:
Estimated | |||||||||
December 31, | Useful | ||||||||
2014 | 2013 | Life | |||||||
(in thousands) | (in years) | ||||||||
Customer relationships | $ | 19,600 | $ | 19,600 | 3-20 | ||||
Trade name | 1,400 | 1,400 | 10 | ||||||
Total intangible assets, at cost | 21,000 | 21,000 | |||||||
Less: accumulated amortization | (15,580 | ) | (13,571 | ) | |||||
Total intangible assets, net | $ | 5,420 | $ | 7,429 | |||||
Amortization expense was $2.0 million, $3.9 million and $3.9 million for the years ended December 31, 2014, 2013 and 2012, respectively. Future estimated amortization expense is presented below.
December 31, | |||
2014 | |||
(in thousands) | |||
2015 | $ | 620 | |
2016 | 480 | ||
2017 | 480 | ||
2018 | 480 | ||
2019 | 480 | ||
After 2019 | 2,880 | ||
Total | $ | 5,420 | |
Deferred Financing Costs
Legal fees and other costs incurred in obtaining financing are amortized over the term of the related debt using a method that approximates the effective interest method. We had gross capitalized costs of $31.0 million and $20.4 million, net of accumulated amortization of $7.1 million and $6.4 million, at December 31, 2014 and 2013, respectively. Amortization expense related to deferred financing costs was $6.1 million, $2.9 million, and $2.9 million for the years ended December 31, 2014, 2013, and 2012, respectively, and is included in interest expense in the consolidated statements of operations.
In 2014, we capitalized costs of $15.9 million associated with the 2022 Notes, Term Loan, and New Credit Facility as part of the spin-off (see Note 1). Additionally, we recorded a charge of $2.5 million related to the write-off of deferring financing costs associated with the termination of the Old Credit Facility as part of the spin-off (see Note 1).
Accounts Payable
Included in accounts payable at December 31, 2014 and 2013 are liabilities of $4.5 million and $7.7 million, respectively, representing the amount by which checks issued, but not yet presented to our banks for collection, exceeded balances in applicable bank accounts, considering the legal right of offset.
Revenue Recognition
We recognize revenue when services are performed, collection of receivables is reasonably assured, persuasive evidence of an arrangement exists and the price is fixed or determinable.
Drilling. We earn revenues by drilling oil and natural gas wells for our customers under daywork contracts. We recognize revenue on daywork contracts for the days completed based on the day rate each contract specifies. Payments received and costs incurred for mobilization services are recognized as earned over the days of mobilization.
71
SEVENTY SEVEN ENERGY INC.
NOTES TO CONSOLIDATED FINANCIAL STATEMENTS – (Continued)
Hydraulic Fracturing. We recognize revenue upon the completion of each fracturing stage. We typically complete one or more fracturing stages per day per active crew during the course of a job. A stage is considered complete when the customer requests or the job design dictates that pumping discontinue for that stage. Invoices typically include a lump sum equipment charge determined by the rate per stage each contract specifies and product charges for sand, chemicals and other products actually consumed during the course of providing our services.
Oilfield Rentals. We rent many types of oilfield equipment including drill pipe, drill collars, tubing, blowout preventers, frac tanks, mud tanks and environmental containment. We also provide air drilling, flowback services and services associated with the transfer of water to the wellsite for well completions. We price our rentals and services by the day or hour based on the type of equipment rented and the services performed and recognize revenue ratably over the term of the rental.
Oilfield Trucking. Oilfield trucking provides rig relocation and logistics services as well as fluid handling services. Our trucks move drilling rigs, crude oil, and other fluids and construction materials to and from the wellsite and also transport produced water from the wellsite. We price these services by the hour and volume and recognize revenue as services are performed. As part of the spin-off, we sold our crude hauling business to a third party.
Other Operations. We designed, engineered and fabricated natural gas compression packages, accessories and related equipment that we sold to Chesapeake and other customers. We priced our compression units based on certain specifications such as horsepower, stages and additional options. We recognized revenue upon completion and transfer of ownership of the natural gas compression equipment. As part of the spin-off, we distributed our compression unit manufacturing business to Chesapeake.
Litigation Accruals
We estimate our accruals related to litigation based on the facts and circumstances specific to the litigation and our past experience with similar claims. We estimate our liability related to pending litigation when we believe the amount or a range of the loss can be reasonably estimated. We record our best estimate of a loss when the loss is considered probable. When a loss is probable and there is a range of estimated loss with no best estimate in the range, we record the minimum estimated liability related to a lawsuit or claim. As additional information becomes available, we assess the potential liability related to our pending litigation and claims and revise our estimates accordingly.
Environmental Costs
Our operations involve the storage, handling, transport and disposal of bulk waste materials, some of which contain oil, contaminants and regulated substances. These operations are subject to various federal, state and local laws and regulations intended to protect the environment. Environmental expenditures are expensed or capitalized depending on their future economic benefit. Expenditures that relate to an existing condition caused by past operations and that have no future economic benefit are expensed. There were no amounts capitalized as of December 31, 2014 and 2013. We record liabilities on an undiscounted basis when remediation efforts are probable and the costs to conduct such remediation efforts can be reasonably estimated.
Leases
We lease rail cars and other property and equipment through various leasing arrangements (see Note 7). When we enter into a leasing arrangement, we analyze the terms of the arrangement to determine its accounting treatment. As of December 31, 2014, all leases have been accounted for as operating leases.
We periodically incur costs to improve the assets that we lease under these arrangements. We record the improvement as a component of property and equipment and amortize the improvement over the shorter of the useful life of the improvement or the remaining lease term.
Share-Based Compensation
Our share-based compensation program consists of restricted stock and stock options granted to employees and restricted stock granted to non-employee directors under the SSE 2014 Incentive Plan (the "2014 Plan"). We recognize in our financial statements the cost of employee services received in exchange for restricted stock and stock options based on the fair value of the equity instruments as of the grant date. In general, this value is amortized over the vesting period; for grants with a non-substantive service condition, this value is recognized immediately. Amounts are recognized in operating costs and general and administrative expenses.
72
SEVENTY SEVEN ENERGY INC.
NOTES TO CONSOLIDATED FINANCIAL STATEMENTS – (Continued)
Income Taxes
Through the effective date of the spin-off, our operations were included in the consolidated federal income tax return and other state returns for Chesapeake. The income tax provision for the period before the spin-off has been prepared on a separate return basis for us and all of our subsidiaries. Accordingly, we have recognized deferred tax assets and liabilities for the future tax consequences attributable to differences between the financial statement carrying amounts of existing assets and liabilities and their respective tax bases for all our subsidiaries as if each entity were a corporation, regardless of its actual characterization for U.S. federal income tax purposes. Our effective tax rate was 22%, 28% and 40% for the years ended December 31, 2014, 2013 and 2012, respectively. Our effective tax rate can fluctuate as a result of the impact of state income taxes, permanent differences and changes in pre-tax income. Effective with the spin-off, we entered into a tax sharing agreement with Chesapeake which governs the respective rights, responsibilities and obligations of each company, for tax periods prior to the spin-off, with respect to the payment of taxes, filing of tax returns, reimbursement of taxes, control of audits and other tax proceedings, liability for taxes that may be triggered as a result of the spin-off and other matters regarding taxes. Following the spin-off, we are not entitled to federal income tax net operating loss ("NOL") carryforwards that were generated prior to the spin-off and that have historically been reflected in our net deferred income tax liabilities on our consolidated balance sheet. As of the spin-off date, we made an adjustment to our deferred tax liabilities of approximately $178.8 million to reflect the treatment of NOLs under the tax sharing agreement. In connection with the spin-off, we received a one-time step-up in tax basis of our assets due to the tax gain recognized by Chesapeake related to the spin-off in the tax affected amount of approximately $202.6 million.
A valuation allowance for deferred tax assets is recognized when it is more likely than not that some or all of the benefit from the deferred tax asset will not be realized. To assess that likelihood, we use estimates and judgment regarding our future taxable income, as well as the jurisdiction in which such taxable income is generated, to determine whether a valuation allowance is required. Such evidence can include our current financial position, our results of operations, both actual and forecasted, the reversal of deferred tax liabilities, and tax planning strategies as well as the current and forecasted business economics of our industry. We had no valuation allowance at December 31, 2014 and 2013.
The benefit of an uncertain tax position taken or expected to be taken on an income tax return is recognized in the consolidated financial statements at the largest amount that is more likely than not to be sustained upon examination by the relevant taxing authority. Interest and penalties, if any, related to uncertain tax positions would be recorded in interest expense and other expense, respectively. There were no uncertain tax positions at December 31, 2014 and 2013.
73
3. Earnings Per Share
Basic earnings per share is based on the weighted average number of shares of common stock outstanding and includes the effect of any participating securities as appropriate. Participating securities consist of unvested restricted stock issued to our employees and non-employee directors that provide dividend rights. Diluted earnings per share assumes the issuance of common shares for all potentially dilutive securities, provided the effect is dilutive. There was no material impact to basic or diluted earnings per share due to participating securities and no potentially dilutive securities for the periods presented below.
On June 30, 2014, we distributed 46,932,433 shares of our common stock to Chesapeake shareholders in conjunction with the spin-off. For comparative purposes, and to provide a more meaningful calculation for weighted average shares, we have assumed this amount to be outstanding for periods prior to the spin-off presented in the calculation of weighted average shares.
Years Ended December 31, | |||||||||||
2014 | 2013 | 2012 | |||||||||
(in thousands, except per share data) | |||||||||||
Basic earnings per share: | |||||||||||
Allocation of earnings: | |||||||||||
Net (loss) income | $ | (7,979 | ) | $ | (19,735 | ) | $ | 69,576 | |||
Weighted average common shares outstanding | 47,236 | 46,932 | 46,932 | ||||||||
Basic (loss) earnings per share | $ | (0.17 | ) | $ | (0.42 | ) | $ | 1.48 | |||
Diluted earnings per share: | |||||||||||
Allocation of earnings: | |||||||||||
Net (loss) income | $ | (7,979 | ) | $ | (19,735 | ) | $ | 69,576 | |||
Weighted average common shares outstanding | 47,236 | 46,932 | 46,932 | ||||||||
Effect of dilutive securities | — | — | — | ||||||||
Weighted average common shares, including dilutive effect | 47,236 | 46,932 | 46,932 | ||||||||
Diluted (loss) earnings per share | $ | (0.17 | ) | $ | (0.42 | ) | $ | 1.48 | |||
4. Asset Sales, Assets Held for Sale and Impairments and Other
Asset Sales
During 2014, we sold 28 drilling rigs and ancillary equipment that were not being utilized in our business for $44.8 million, net of selling expenses. Additionally, we sold our crude hauling assets, which included 124 fluid handling trucks and 122 trailers, for $43.8 million. net of selling expenses. We used a portion of the net proceeds received to make a $30.9 million cash distribution to Chesapeake. During 2013, we sold 14 drilling rigs and ancillary equipment that were not being utilized in our business for $50.6 million, net of selling expenses. During 2012, we sold 18 drilling rigs and ancillary equipment for $47.4 million, net of selling expenses. We recorded net (gains) losses on sales of property and equipment of approximately ($6.3) million, ($2.6) million and $2.0 million during the years ended December 31, 2014, 2013 and 2012, respectively.
74
SEVENTY SEVEN ENERGY INC.
NOTES TO CONSOLIDATED FINANCIAL STATEMENTS – (Continued)
Assets Held for Sale and Impairments and Other
A summary of our impairments and other is as follows:
Years Ended December 31, | ||||||||||||
2014 | 2013 | 2012 | ||||||||||
(in thousands) | ||||||||||||
Drilling rigs held for sale | $ | 11,237 | $ | 23,574 | $ | 11,750 | ||||||
Drilling rigs held for use | 8,366 | 25,417 | 14,871 | |||||||||
Lease termination costs | 9,701 | 22,362 | 24,855 | |||||||||
Drill pipe | — | — | 7,486 | |||||||||
Other | 1,460 | 3,409 | 1,748 | |||||||||
Total impairments and other | $ | 30,764 | $ | 74,762 | $ | 60,710 | ||||||
During the years ended December 31, 2014, 2013 and 2012, we recognized $11.2 million, $23.6 million and $11.8 million, respectively, of impairment charges for certain drilling rigs and spare equipment we had identified to sell as part of our broader strategy to divest of non-essential drilling rigs. We are required to present such assets at the lower of carrying amount or fair value less the anticipated costs to sell at the time they meet the criteria for held for sale accounting. Estimated fair value was based on the expected sales price, less costs to sell. Included in property and equipment held for sale on our consolidated balance sheet was $29.4 million as of December 31, 2013. These assets were included in our drilling segment and were sold during 2014. We had no assets held for sale as of December 31, 2014.
We also identified certain drilling rigs during the years ended December 31, 2014, 2013 and 2012 that we deemed to be impaired based on our assessment of future demand and the suitability of the identified rigs in light of this demand. We recorded impairment charges of $8.4 million, $25.4 million and $14.9 million during the years ended December 31, 2014, 2013 and 2012, respectively, related to these drilling rigs. Estimated fair value for these drilling rigs was determined using significant unobservable inputs (Level 3) based on a market approach.
During the year ended December 31, 2014, we purchased 45 leased rigs for approximately $158.4 million and paid lease termination costs of approximately $9.7 million. During the year ended December 31, 2013, we purchased 23 leased drilling rigs for approximately $140.2 million and paid lease termination costs of approximately $22.4 million. During the year ended December 31, 2012, we purchased 25 leased drilling rigs for approximately $36.2 million and paid lease termination costs of approximately $24.9 million.
During the year ended December 31, 2012, we also identified certain excess drill pipe that had become obsolete. The carrying value of such drill pipe was reduced to fair value, and we recorded impairment charges of $7.5 million based on the difference between carrying amount and fair value of such drill pipe.
We identified certain other property and equipment during the years ended December 31, 2014, 2013 and 2012 that we deemed to be impaired based on our assessment of the market value and expected future cash flows of the long-lived asset. We recorded impairment charges of $1.5 million, $3.4 million and $1.7 million during the years ended December 31, 2014, 2013 and 2012, respectively, related to these assets. Estimated fair value for this property and equipment was determined using significant unobservable inputs (Level 3) based on an income approach.
The market approach was based on external industry data for similar equipment. The assumptions used in the impairment evaluation for long-lived assets are inherently uncertain and require management's judgment. A prolonged period of lower oil and natural gas prices or reduction in capital expenditures by Chesapeake or our other customers, and the potential impact of these factors on our utilization and day rates, could result in the recognition of future impairment charges on the same or additional rigs and other property and equipment if future cash flow estimates, based upon information then available to management, indicate that their carrying value may not be recoverable.
75
SEVENTY SEVEN ENERGY INC.
NOTES TO CONSOLIDATED FINANCIAL STATEMENTS – (Continued)
5. Debt
As of December 31, 2014 and 2013, our long-term debt consisted of the following:
December 31, | |||||||
2014 | 2013 | ||||||
(in thousands) | |||||||
6.625% Senior Notes due 2019 | $ | 650,000 | $ | 650,000 | |||
6.50% Senior Notes due 2022 | 500,000 | — | |||||
Term Loan | 398,000 | — | |||||
Credit Facilities | 50,500 | 405,000 | |||||
Total debt | 1,598,500 | 1,055,000 | |||||
Less: Current portion of long-term debt | 4,000 | — | |||||
Total long-term debt | $ | 1,594,500 | $ | 1,055,000 | |||
2019 Senior Notes
In October 2011, we issued $650.0 million in aggregate principal amount of 6.625% Senior Notes due 2019 (the "2019 Senior Notes"). We incurred $14.8 million in financing costs related to the 2019 Senior Notes issuance which have been deferred and are being amortized over the life of the 2019 Senior Notes. We used the net proceeds of $637.0 million from the 2019 Senior Notes issuance to pay down a portion of our affiliate debt with Chesapeake. The 2019 Senior Notes will mature on November 15, 2019 and interest is payable semi-annually in arrears on May 15 and November 15 of each year. The 2019 Senior Notes are guaranteed by all of our existing subsidiaries other than certain immaterial subsidiaries and SSF, which is a co-issuer of the 2019 Senior Notes.
Prior to November 15, 2015, we may redeem some or all of the 2019 Senior Notes at a price equal to 100% of the principal amount plus a make-whole premium determined pursuant to a formula set forth in the Indenture governing the 2019 Senior Notes (the "Indenture"), plus accrued and unpaid interest. On and after November 15, 2015, we may redeem all or part of the 2019 Senior Notes at the following prices (as a percentage of principal), plus accrued and unpaid interest, if redeemed during the 12-month period beginning on November 15 of the years indicated below:
Year | Redemption Price | |
2015 | 103.313 | % |
2016 | 101.656 | % |
2017 and thereafter | 100.000 | % |
The 2019 Senior Notes are subject to covenants that, among other things, limit our ability and the ability of certain of our subsidiaries to: (1) sell assets; (2) declare dividends or make distributions on our equity interests or purchase or redeem our equity interests; (3) make investments or other specified restricted payments; (4) incur or guarantee additional indebtedness and issue disqualified or preferred equity; (5) create or incur certain liens; (6) enter into agreements that restrict the ability of our restricted subsidiaries to pay dividends, make intercompany loans or transfer assets to us; (7) effect a merger, consolidation or sale of all or substantially all of our assets; (8) enter into transactions with affiliates; and (9) designate subsidiaries as unrestricted subsidiaries. The 2019 Senior Notes also have cross default provisions that apply to other indebtedness SSE or any of its guarantor subsidiaries may have from time to time with an outstanding principal amount of $50.0 million or more. If the 2019 Senior Notes achieve an investment grade rating from either Moody's Investors Service, Inc. ("Moody's") or Standard & Poor's Rating Services ("S&P"), our obligation to comply with certain of these covenants will be suspended, and if the 2019 Senior Notes achieve an investment grade rating from both Moody's and S&P, then such covenants will terminate.
2022 Senior Notes
On June 26, 2014, we issued $500.0 million in aggregate principal amount of 6.50% Senior Notes due 2022 (the "2022 Notes"). We incurred $7.2 million in financing costs related to the 2022 Notes issuance, which have been deferred and are being amortized over the life of the 2022 Notes. We used the net proceeds of $493.8 million from the 2022 Notes issuance to make a distribution of approximately $391.0 million to Chesapeake and for general corporate purposes. The 2022 Notes will mature on
76
SEVENTY SEVEN ENERGY INC.
NOTES TO CONSOLIDATED FINANCIAL STATEMENTS – (Continued)
July 15, 2022 and interest is payable semi-annually in arrears on July 15 and January 15 of each year. Prior to the full repayment or refinancing of the 2019 Notes, the 2022 Notes will become fully and unconditionally guaranteed on a senior unsecured basis by each of our domestic subsidiaries, if any, that has outstanding indebtedness or guarantees in an aggregate principal amount greater than $15.0 million, other than (i) guarantors of the 2019 Notes, (ii) SSO or (iii) subsidiaries of SSO. We do not have any such subsidiaries currently; therefore, the 2022 Notes are not guaranteed. Upon the full repayment of the 2019 Notes, the 2022 Notes will be fully and unconditionally guaranteed on a senior unsecured basis by each of our domestic subsidiaries that has outstanding indebtedness or guarantees in an aggregate principal amount greater than $15.0 million.
We may redeem up to 35% of the 2022 Notes with proceeds of certain equity offerings at a redemption price of 106.5% of the principal amount plus accrued and unpaid interest prior to July 15, 2017, subject to certain conditions. Prior to July 15, 2017, we may redeem some or all of the 2022 Notes at a price equal to 100% of the principal amount plus a make-whole premium determined pursuant to a formula set forth in the indenture governing the 2022 Notes, plus accrued and unpaid interest. On or after July 15, 2017, we may redeem all or part of the 2022 Notes at the following prices (as a percentage of principal), plus accrued and unpaid interest, if redeemed during the 12-month period beginning on July 15 of the years indicated below:
Year | Redemption Price | |
2017 | 104.875 | % |
2018 | 103.250 | % |
2019 | 101.625 | % |
2020 and thereafter | 100.000 | % |
The indenture governing the 2022 Notes subjects us to covenants that, among other things, limit our ability and the ability of certain of our subsidiaries to: (1) sell assets; (2) declare dividends or make distributions on our equity interests or purchase or redeem our equity interests; (3) make investments or other specified restricted payments; (4) incur or guarantee additional indebtedness and issue disqualified or preferred equity; (5) create or incur certain liens; (6) enter into agreements that restrict the ability of our restricted subsidiaries to pay dividends, make intercompany loans or transfer assets to us; (7) effect a merger, consolidation or sale of all or substantially all of our assets; (8) enter into transactions with affiliates; and (9) designate subsidiaries as unrestricted subsidiaries. The 2022 Notes also have cross default provisions that apply to other indebtedness of SSE and certain of our subsidiaries. If the 2022 Notes achieve an investment grade rating from either Moody's or S&P, our obligation to comply with certain of these covenants will be suspended, and if the 2022 Notes achieve an investment grade rating from both Moody's and S&P, then all such covenants will terminate.
Term Loan
On June 25, 2014, we, through SSO, entered into a $400.0 million seven-year term loan credit agreement. We incurred $6.9 million in financing costs related to entering into the Term Loan, which have been deferred and are being amortized over the life of the Term Loan. We used the net proceeds of $393.9 million to repay and terminate the Old Credit Facility. Borrowings under the Term Loan bear interest at our option at either (i) the Base Rate, calculated as the greatest of (1) the Bank of America, N.A. prime rate, (2) the federal funds rate plus 0.50% and (3) a one-month London Interbank Offered Rate ("LIBOR") rate adjusted daily plus 1.00% or (ii) LIBOR, with a floor of 0.75%, plus, in each case, an applicable margin. The applicable margin for borrowings is 2.00% for Base Rate loans and 3.00% for LIBOR loans, depending on whether the Base Rate or LIBOR is used, provided that if and for so long as the leverage ratio is less than a certain level and the term loans have certain ratings from each of S&P and Moody's, such margins will be reduced by 0.25%. The Term Loan is repayable in equal consecutive quarterly installments equal to 0.25% (1.00% per annum) of the original principal amount of the Term Loan and will mature in full on June 25, 2021.
Obligations under the Term Loan are guaranteed jointly and severally by all of our present and future direct and indirect wholly-owned material domestic subsidiaries, other than certain excluded subsidiaries. Amounts borrowed under the Term Loan are secured by liens on all of our equity interests in our current and future subsidiaries, and all of our subsidiaries' present and future real property, equipment (including drilling rigs and frac spread equipment), fixtures and other fixed assets.
We may prepay all or a portion of our Term Loan at any time, subject to a 1.00% principal premium on the repayment of principal pursuant to a refinancing within six months after the closing date. Borrowings under our Term Loan may be subject to mandatory prepayments with the net cash proceeds of certain issuances of debt, certain asset sales and other dispositions and
77
SEVENTY SEVEN ENERGY INC.
NOTES TO CONSOLIDATED FINANCIAL STATEMENTS – (Continued)
certain condemnation events, and with excess cash flow in any calendar year in which our leverage ratio exceeds 3.25 to 1.00. The Term Loan contains various covenants and restrictive provisions which limit our ability to (1) enter into asset sales; (2) incur additional indebtedness; (3) make investments or loans and create liens; (4) pay certain dividends or make other distributions and (5) engage in transactions with affiliates.
Credit Facilities
In November 2011, we entered into a five-year senior secured revolving bank credit facility with total commitments of $500.0 million. In connection with the spin-off, we repaid in full borrowings outstanding under this credit facility and terminated this credit facility.
On June 25, 2014, we, through SSO, entered into a five-year senior secured revolving bank credit facility with total commitments of $275.0 million. We incurred $1.8 million in financing costs related to entering into the New Credit Facility, which have been deferred and are being amortized over the life of the New Credit Facility. The maximum amount that we may borrow under the New Credit Facility is subject to the borrowing base, which is based on a percentage of eligible accounts receivable, subject to reserves and other adjustments. As of December 31, 2014, the New Credit Facility had availability of $218.7 million, net of letters of credit of $5.8 million. All obligations under the New Credit Facility are fully and unconditionally guaranteed jointly and severally by SSE, and all of our present and future direct and indirect material domestic subsidiaries. Borrowings under the New Credit Facility are secured by liens on cash and accounts receivable of the borrowers and the guarantors, and bear interest at our option at either (i) the Base Rate, calculated as the greatest of (1) the rate of interest publicly announced by Wells Fargo Bank, National Association, as its "prime rate," subject to each increase or decrease in such prime rate effective as of the date such change occurs, (2) the federal funds effective rate plus 0.50% and (3) the one-month LIBOR Rate plus 1.00%, each of which is subject to an applicable margin, or (ii) LIBOR, plus, in each case, an applicable margin. The applicable margin ranges from 0.50% to 1.00% per annum for Base Rate loans and 1.50% to 2.00% per annum for LIBOR loans. The unused portion of the New Credit Facility is subject to a commitment fee that varies from 0.250% to 0.375% per annum, according to average unused amounts. Interest on LIBOR loans is payable at the end of the selected interest period, but no less frequently than quarterly. Interest on Base Rate loans is payable monthly in arrears.
The New Credit Facility contains various covenants and restrictive provisions which limit our ability to (1) enter into asset sales; (2) incur additional indebtedness; (3) make investments or loans and create liens; (4) pay certain dividends or make other distributions and (5) engage in transactions with affiliates. The New Credit Facility requires maintenance of a fixed charge coverage ratio based on the ratio of consolidated EBITDA (minus unfinanced capital expenditures) to fixed charges, in each case as defined in the New Credit Facility agreement, at any time availability is below a certain threshold and for a certain period of time thereafter. If we fail to perform our obligations under the agreement, the New Credit Facility could be terminated and any outstanding borrowings under the New Credit Facility may be declared immediately due and payable. The New Credit Facility also contains cross default provisions that apply to our other indebtedness.
6. Other Current Liabilities
Other current liabilities as of December 31, 2014 and 2013 are detailed below:
December 31, | |||||||
2014 | 2013 | ||||||
(in thousands) | |||||||
Other Current Liabilities: | |||||||
Accrued expenses | $ | 88,538 | $ | 101,007 | |||
Payroll related | 47,711 | 47,796 | |||||
Self-insurance reserves | 14,521 | 27,245 | |||||
Interest | 25,035 | 5,862 | |||||
Income, property, sales, use, and other taxes | 13,937 | 17,904 | |||||
Property and equipment | 26,010 | 7,010 | |||||
Deferred gain on sale/leasebacks | — | 3,299 | |||||
Total Other Current Liabilities | $ | 215,752 | $ | 210,123 | |||
78
SEVENTY SEVEN ENERGY INC.
NOTES TO CONSOLIDATED FINANCIAL STATEMENTS – (Continued)
7. Commitments and Contingencies
Operating Leases
As of December 31, 2014, we were party to five lease agreements with various third parties to lease rail cars for initial terms of five to seven years. Additional rental payments are required for the use of rail cars in excess of the allowable mileage stated in the respective agreement.
As of December 31, 2014, we were also party to various lease agreements for other property and equipment with varying terms.
Aggregate undiscounted minimum future lease payments under our operating leases at December 31, 2014 are presented below:
Rail Cars | Other | Total | |||||||||
(in thousands) | |||||||||||
2015 | $ | 5,823 | $ | 1,853 | $ | 7,676 | |||||
2016 | 5,823 | 902 | 6,725 | ||||||||
2017 | 2,168 | 426 | 2,594 | ||||||||
2018 | 1,445 | 170 | 1,615 | ||||||||
2019 | 722 | — | 722 | ||||||||
Total | $ | 15,981 | $ | 3,351 | $ | 19,332 | |||||
Rent expense for drilling rigs, real property, rail cars and other property and equipment for the years ended December 31, 2014, 2013 and 2012 was $35.5 million, $103.9 million and $121.4 million, respectively, and was included in operating costs in our consolidated statements of operations.
Other Commitments
Much of the equipment we purchase requires long production lead times. As a result, we usually have outstanding orders and commitments for such equipment. As of December 31, 2014, we had $182.8 million of purchase commitments related to future inventory and capital expenditures that we expect to incur in 2015.
Litigation
We are involved in various lawsuits and disputes incidental to our business operations, including commercial disputes, personal injury claims, property damage claims and contract actions. Although the outcome of litigation cannot be predicted with certainty, management is of the opinion that no pending or threatened lawsuit or dispute incidental to our business operations is likely to have a material adverse effect on our consolidated financial position, results of operations or cash flows. The final resolution of such matters could exceed amounts accrued and actual results could differ materially from management's estimates.
Self-Insured Reserves
We are self-insured up to certain retention limits with respect to workers' compensation and general liability matters. We maintain accruals for self-insurance retentions that we estimate using third-party data and claims history. Included in operating costs is workers' compensation expense of $8.3 million, $13.6 million and $14.1 million during the years ended December 31, 2014, 2013 and 2012, respectively.
79
SEVENTY SEVEN ENERGY INC.
NOTES TO CONSOLIDATED FINANCIAL STATEMENTS – (Continued)
8. Share-Based Compensation
Prior to the spin-off, our employees participated in the Chesapeake share-based compensation program and received restricted stock, and in the case of senior management, stock options. Effective July 1, 2014, our employees participate in the SSE 2014 Incentive Plan (the "2014 Plan").
The 2014 Plan authorizes the Compensation Committee of our Board of Directors to grant incentive and nonqualified stock options, stock appreciation rights, restricted stock, restricted stock units, cash awards and performance awards. No more than 8.4 million shares of SSE common stock may be issued under the 2014 Plan.
In connection with the spin-off, unvested awards granted under the Chesapeake share-based compensation program were cancelled and substituted as follows:
• | Each outstanding award of options to purchase shares of Chesapeake common stock was replaced with a substitute award of options to purchase shares of SSE common stock. The substitute awards of options are intended to preserve the intrinsic value of the original option and the ratio of the exercise price to the fair market value of the stock subject to the option. |
• | The Chesapeake restricted stock awards and restricted stock unit awards were replaced with substitute awards in SSE common stock, each of which generally preserved the value of the original award. |
Awards granted in connection with the substitution of awards originally issued under the Chesapeake share-based compensation program are a part of the 2014 Plan and reduce the maximum number of shares of common stock available for delivery under the 2014 Plan.
Equity-Classified Awards
Restricted Stock. The fair value of restricted stock awards was determined based on the fair market value of SSE shares of common stock on the date of the grant. This value is amortized over the vesting period.
A summary of the status and changes of the unvested shares of restricted stock under the 2014 Plan is presented below.
Number of Unvested Restricted Shares | Weighted Average Grant-Date Fair Value | |||||
(in thousands) | ||||||
Unvested shares as of July 1, 2014 | 2,097 | $ | 25.06 | |||
Granted | 2,473 | $ | 23.38 | |||
Vested | (373 | ) | $ | 25.02 | ||
Forfeited | (264 | ) | $ | 24.57 | ||
Unvested shares as of December 31, 2014 | 3,933 | $ | 24.04 | |||
The aggregate intrinsic value of restricted stock vested for the year ended December 31, 2014, as reflected in the table above, was approximately $9.3 million based on the market price of our common stock at the time of vesting.
As of December 31, 2014, there was $69.0 million of total unrecognized compensation cost related to the unvested restricted stock. The cost is expected to be recognized over a weighted average period of approximately three years.
Stock Options. Our incentive-based stock options vest ratably over a three-year period and our retention-based stock options will vest one-third on each of the third, fourth and fifth anniversaries of the grant date of the original Chesapeake award, in the case of a replacement award. Our non-replacement stock option awards have an exercise price equal to the closing price of SSE's common stock on the grant date. Outstanding options expire ten years from the date of grant of the original Chesapeake award, in the case of a replacement award.
80
SEVENTY SEVEN ENERGY INC.
NOTES TO CONSOLIDATED FINANCIAL STATEMENTS – (Continued)
The following table provides information related to stock option activity for the year ended December 31, 2014:
Number of Shares Underlying Options | Weighted Average Exercise Price Per Share | Weighted Average Contract Life in Years | Aggregate Intrinsic Value(a) | |||||||||
(in thousands) | (in thousands) | |||||||||||
Outstanding at July 1, 2014 | 348 | $ | 16.19 | 9.24 | $ | 3,463 | ||||||
Granted | — | $ | — | |||||||||
Exercised | — | $ | — | |||||||||
Outstanding at December 31, 2014 | 348 | $ | 16.19 | 8.23 | $ | — | ||||||
Exercisable at December 31, 2014 | 35 | $ | 15.29 | 8.08 | $ | — | ||||||
(a) | The intrinsic value of a stock option is the amount by which the current market value or the market value upon exercise of the underlying stock exceeds the exercise price of the option. |
As of December 31, 2014, there was $1.6 million of total unrecognized compensation cost related to stock options. The cost is expected to be recognized over a weighted average period of approximately two years.
Through the date of the spin-off we were charged by Chesapeake for share-based compensation expense related to our direct employees. Pursuant to the employee matters agreement with Chesapeake, our employees received a new award under the 2014 Plan in substitution for each unvested Chesapeake award then held (which were cancelled). We recorded a non-recurring credit of $10.5 million to operating costs and general and administrative expenses during the second quarter of 2014 as a result of the cancellation of the unvested Chesapeake awards.
Included in operating costs and general administrative expenses is stock-based compensation expense of $29.8 million, $13.2 million and $12.1 million for the years ended December 31, 2014, 2013 and 2012. Prior to the spin-off, we reimbursed Chesapeake for these costs in accordance with the administrative services agreement. To the extent the compensation costs relates to employees indirectly involved in oilfield services operations, such amounts were charged to us through an overhead allocation and are reflected as general and administrative expenses.
Other
Performance Share Units. Chesapeake granted PSUs to our chief executive officer under Chesapeake's Long Term Incentive Plan that includes both an internal performance measure and external market condition as it relates to Chesapeake. Following the spin-off, compensation expense is recognized through the changes in fair value of the PSUs over the vesting period with a corresponding adjustment to equity and any related cash obligations are the responsibility of Chesapeake. We recognized (credits) expenses of ($0.4) million, $1.4 million and $0.1 million related to the PSUs for the years ended December 31, 2014, 2013 and 2012.
9. Income Taxes
The components of income tax (benefit) expense for each of the periods presented below are as follows:
Years Ended December 31, | |||||||||||
2014 | 2013 | 2012 | |||||||||
(in thousands) | |||||||||||
Current | $ | 674 | $ | 1,422 | $ | 749 | |||||
Deferred | (2,863 | ) | (9,255 | ) | 46,128 | ||||||
Total | $ | (2,189 | ) | $ | (7,833 | ) | $ | 46,877 | |||
81
SEVENTY SEVEN ENERGY INC.
NOTES TO CONSOLIDATED FINANCIAL STATEMENTS – (Continued)
The effective income tax (benefit) expense differed from the computed "expected" federal income tax expense on earnings before income taxes for the following reasons:
Years Ended December 31, | |||||||||||
2014 | 2013 | 2012 | |||||||||
(in thousands) | |||||||||||
Income tax expense (benefit) at the federal statutory rate (35%) | $ | (3,559 | ) | $ | (9,649 | ) | $ | 40,758 | |||
State income taxes (net of federal income tax benefit) | 538 | 677 | 3,859 | ||||||||
Other permanent differences | 601 | 1,369 | 2,153 | ||||||||
Effect of change in state taxes | — | — | 273 | ||||||||
Other | 231 | (230 | ) | (166 | ) | ||||||
Total | $ | (2,189 | ) | $ | (7,833 | ) | $ | 46,877 | |||
Deferred income taxes are provided to reflect temporary differences in the basis of net assets for income tax and financial reporting purposes. As of the spin-off date, we made an adjustment to our deferred tax liabilities of approximately $178.8 million to reflect the treatment of federal income tax NOL carryforwards under the tax sharing agreement. In connection with the spin-off, we received a one-time step-up in tax basis of our assets due to the tax gain recognized by Chesapeake related to the spin-off in the tax affected amount of approximately $202.6 million. The tax-effected temporary differences and tax loss carryforwards which comprise deferred taxes are as follows:
Years Ended December 31, | |||||||
2014 | 2013 | ||||||
(in thousands) | |||||||
Deferred tax liabilities: | |||||||
Property and equipment | $ | (230,480 | ) | $ | (350,662 | ) | |
Intangible assets | (2,032 | ) | (2,801 | ) | |||
Prepaid expenses | (4,262 | ) | (2,697 | ) | |||
Other | (779 | ) | (2,584 | ) | |||
Deferred tax liabilities | (237,553 | ) | (358,744 | ) | |||
Deferred tax assets: | |||||||
Net operating loss carryforwards | 62,826 | 200,200 | |||||
Deferred stock compensation | 9,682 | 5,068 | |||||
Deferred gain on sale leaseback | — | 802 | |||||
Accrued liabilities | 9,840 | 6,871 | |||||
State tax payments | — | 3,125 | |||||
Other | 3,395 | 2,249 | |||||
Deferred tax assets | 85,743 | 218,315 | |||||
Net deferred tax liability | $ | (151,810 | ) | $ | (140,429 | ) | |
Reflected in accompanying balance sheets as: | |||||||
Current deferred income tax asset | $ | 7,463 | $ | 5,318 | |||
Non-current deferred income tax liability | (159,273 | ) | (145,747 | ) | |||
Total | $ | (151,810 | ) | $ | (140,429 | ) | |
At December 31, 2014, SSE had NOL carryforwards of approximately $168.9 million. The NOL carryforwards expire in 2034. The value of these carryforwards depends on the ability of SSE to generate taxable income. We considered both positive and negative evidence in our determination of the need for valuation allowances for the deferred tax assets associated with our
82
SEVENTY SEVEN ENERGY INC.
NOTES TO CONSOLIDATED FINANCIAL STATEMENTS – (Continued)
NOLs and other deferred tax assets. We determined it is more-likely-than-not that our NOLs and other deferred tax assets will be utilized, and accordingly no valuation allowance has been recorded. However, some or all of these NOLs could expire unused if we are unable to generate sufficient taxable income in the future to utilize them or we enter into transactions that limit our right to use them. If it became more-likely-than-not NOLs would expire unused, we would have to create a valuation allowance to reflect this fact, which could materially increase our income tax expense, and therefore, adversely effect our results of operations in the period in which it is recorded. We will continue to assess the need for a valuation allowance in the future.
10. Equity Method Investment
We own 49% of the membership interest in Maalt Specialized Bulk, L.L.C. ("Maalt"). Maalt privides bulk transportation, transloading and sand hauling services, and its assets consist primarily of trucks and trailers. We use the equity method of accounting to account for our investment in Maalt, which had a carrying value of $7.8 million as of December 31, 2014. We recorded equity method adjustments to our investment of ($1.6) million, $0.2 million and $0.1 million for our share of Maalt's (loss) income for the years ended December 31, 2014, 2013 and 2012, respectively. We also made additional investments of $0.7 million, $0.4 million and $0.5 million during the years ended December 31, 2014, 2013 and 2012, respectively. As of December 31, 2014, the carrying value of our investment in Maalt is in excess of the underlying equity in Maalt's net assets by approximately $8.1 million. This excess is attributable to goodwill recorded on Maalt's financial statements and is not being amortized.
We review our equity method investments for impairment whenever certain impairment indicators exist including the absence of an ability to recover the carrying amount of the investment or inability of the investee to sustain an earnings capacity which would justify the carrying amount of the investment. A loss in value of an investment which is other than a temporary decline should be recognized. We estimated that the fair value of our investment in Maalt was approximately $7.9 million as of June 30, 2014, which was below the carrying value of the investment and resulted in a non-cash impairment charge of $4.5 million in the year ended December 31, 2014, which is included in (loss) income and impairment from equity investees on our condensed consolidated statements of operations. Estimated fair value for our investment in Maalt was determined using significant unobservable inputs (Level 3) based on an income approach.
11. Fair Value Measurements
The fair value measurement standard defines fair value as the price that would be received to sell an asset or paid to transfer a liability in an orderly transaction between market participants at the measurement date (referred to as an "exit price"). Authoritative guidance on fair value measurements and disclosures clarifies that a fair value measurement for a liability should reflect the entity's non-performance risk. In addition, a fair value hierarchy is established that prioritizes the inputs to valuation techniques used to measure fair value. The hierarchy gives the highest priority to unadjusted quoted market prices in active markets for identical assets and liabilities (Level 1 measurements) and the lowest priority to unobservable inputs (Level 3 measurements). The three levels of the fair value hierarchy are:
Level 1- Unadjusted quoted prices in active markets that are accessible at the measurement date for identical, unrestricted assets or liabilities.
Level 2- Quoted prices in markets that are not active, or inputs which are observable, either directly or indirectly, for substantially the full term of the asset or liability. This category includes quoted prices for similar assets or liabilities in active markets; quoted prices for identical or similar assets or liabilities in markets that are not active; inputs other than quoted prices that are observable for the asset or liability; and inputs that are derived principally from or corroborated by observable market data by correlation or other means.
Level 3- Measured based on prices or valuation models that require inputs that are both significant to the fair value measurement and less observable from objective sources.
Fair Value on Recurring Basis
The carrying values of cash, trade receivables and trade payables are considered to be representative of their respective fair values due to the short-term nature of these instruments.
83
SEVENTY SEVEN ENERGY INC.
NOTES TO CONSOLIDATED FINANCIAL STATEMENTS – (Continued)
Fair Value on Non-Recurring Basis
Fair value measurements were applied with respect to our non-financial assets and liabilities measured on a non-recurring basis, which consist primarily of long-lived asset impairments based on Level 3 inputs. See Note 4 for additional discussion.
Fair Value of Other Financial Instruments
The fair value of debt is the estimated amount a market participant would have to pay to purchase our debt, including any premium or discount attributable to the difference between the stated interest rate and market rate of interest at the balance sheet date. Fair values are based on quoted market prices or average valuations of similar debt instruments at the balance sheet date for those debt instruments for which quoted market prices are not available. Estimated fair values are determined by using available market information and valuation methodologies. Considerable judgment is required in interpreting market data to develop the estimates of fair value. The use of different market assumptions or valuation methodologies may have a material effect on the estimated fair value amounts.
December 31, 2014 | December 31, 2013 | ||||||||||||||
Carrying Amount | Fair Value (Level 2) | Carrying Amount | Fair Value (Level 2) | ||||||||||||
(in thousands) | |||||||||||||||
Financial liabilities: | |||||||||||||||
6.625% Senior Notes due 2019 | $ | 650,000 | $ | 519,188 | $ | 650,000 | $ | 679,660 | |||||||
6.50% Senior Notes due 2022 | $ | 500,000 | $ | 296,250 | $ | — | $ | — | |||||||
Term Loan | $ | 398,000 | $ | 379,095 | $ | — | $ | — | |||||||
Credit Facilities | $ | 50,500 | $ | 47,407 | $ | 405,000 | $ | 399,592 | |||||||
12. Concentration of Credit Risk and Major Customers
Financial instruments that potentially subject us to concentrations of credit risk consist principally of cash and trade receivables. Accounts receivable from Chesapeake and its affiliates were $326.7 million and $312.5 million as of December 31, 2014 and December 31, 2013, or 77% and 83%, respectively, of our total accounts receivable. Revenues from Chesapeake and its affiliates were $1.676 billion, $1.960 billion and $1.811 billion for the years ended December 31, 2014, 2013 and 2012, or 81%, 90% and 94%, respectively, of our total revenues. We believe that the loss of this customer would have a material adverse effect on our operating results as there can be no assurance that replacement customers would be identified and accessed in a timely fashion.
13. Transactions with Affiliates
Prior to the completion of our spin-off on June 30, 2014, we were a wholly owned subsidiary of Chesapeake, and transactions between us and Chesapeake (including its subsidiaries) were considered to be transactions with affiliates. Subsequent to June 30, 2014, Chesapeake and its subsidiaries are not considered affiliates of us or any of our subsidiaries. We have disclosed below agreements entered into between us and Chesapeake prior to the completion of our spin-off.
On June 25, 2014, we entered into a master separation agreement and several other agreements with Chesapeake as part of the spin-off. The master separation agreement entered into between Chesapeake and us governs the separation of our businesses from Chesapeake, the distribution of our shares to Chesapeake shareholders and other matters related to Chesapeake's relationship with us, including cross-indemnities between us and Chesapeake. In general, Chesapeake agreed to indemnify us for any liabilities relating to Chesapeake's business and we agreed to indemnify Chesapeake for any liabilities relating to our business.
On June 25, 2014, we entered into a tax sharing agreement with Chesapeake, which governs the respective rights, responsibilities and obligations of Chesapeake and us with respect to tax liabilities and benefits, tax attributes, the preparation and filing of tax returns, the control of audits and other tax proceedings, and certain other matters regarding taxes.
84
SEVENTY SEVEN ENERGY INC.
NOTES TO CONSOLIDATED FINANCIAL STATEMENTS – (Continued)
On June 25, 2014, we entered into an employee matters agreement with Chesapeake providing that each company has responsibility for our own employees and compensation plans. The agreement also contains provisions concerning benefit protection for both SSE and Chesapeake employees, treatment of holders of Chesapeake stock options, restricted stock, restricted stock units and performance share units, and cooperation between us and Chesapeake in the sharing of employee information and maintenance of confidentiality.
On June 25, 2014, we entered into a transition services agreement with Chesapeake under which Chesapeake provides or makes available to us various administrative services and assets for specified periods beginning on the distribution date. In consideration for such services, we pay Chesapeake fees, a portion of which is a flat fee, generally in amounts intended to allow Chesapeake to recover all of its direct and indirect costs incurred in providing those services. During the term of the transition services agreement, we have the right to request a discontinuation of one or more specific services. The transition services agreement will terminate upon cessation of all services provided thereunder. These charges from Chesapeake were $18.0 million for the year ended December 31, 2014. The services that Chesapeake is providing to us as of December 31, 2014 include:
•information technology services;
•risk management services;
•tax services;
•internal audit services;
•accounting services;
•treasury services; and
•certain other services specified in the agreement.
We are party to a master services agreement with Chesapeake pursuant to which we provide drilling and other services and supply materials and equipment to Chesapeake. Drilling services are typically provided pursuant to rig-specific daywork drilling contracts similar to those we use for other customers. The specific terms of each request for other services are typically set forth in a field ticket, purchase order or work order. The master services agreement contains general terms and provisions, including minimum insurance coverage amounts that we are required to maintain and confidentiality obligations with respect to Chesapeake's business, and allocates certain operational risks between Chesapeake and us through indemnity provisions. The master services agreement will remain in effect until we or Chesapeake provides 30 days written notice of termination, although such agreement may not be terminated during the term of the services agreement described below.
Prior to the spin-off, we were party to a services agreement with Chesapeake under which Chesapeake guaranteed the utilization of a portion of our drilling rig and hydraulic fracturing fleets during the term of the agreement. In connection with the spin-off, we entered into new services agreements with Chesapeake which supplements the master services agreement. Under the new services agreement, Chesapeake is required to utilize the lesser of (i) seven, five and three of our hydraulic fracturing crews in years one, two and three of the agreement, respectively, or (ii) 50% of the total number of all hydraulic fracturing crews working for Chesapeake in all its operating regions during the respective year. Chesapeake is required to utilize our hydraulic fracturing services for a minimum number of stages as set forth in the agreement. Chesapeake is entitled to terminate the agreement in certain situations, including in the event we fail to materially comply with the overall quality of service provided by similar service providers. Additionally, Chesapeake's requirement to utilize our services may be suspended under certain circumstances, such as if we are unable to timely accept and supply services ordered by Chesapeake or as a result of a force majeure event.
In connection with the spin-off, we entered into rig-specific daywork drilling contracts with Chesapeake for the provision of drilling services. The drilling contracts had a commencement date of July 1, 2014 and terms ranging from three months to three years. Chesapeake has the right to terminate the drilling contracts under certain circumstances.
Prior to the spin-off, we were party to a facilities lease agreement with Chesapeake pursuant to which we leased a number of the storage yards and physical facilities out of which we conduct our operations. We incurred $8.2 million, $16.5 million and $11.8 million of lease expense for the years ended December 31, 2014, 2013 and 2012, respectively, under this facilities lease agreement. In connection with the spin-off, we acquired the property subject to the facilities lease agreement, and the facilities lease agreement was terminated.
Prior to the spin-off, Chesapeake provided us with general and administrative services and the services of its employees pursuant to an administrative services agreement. These services included legal, accounting, treasury, environmental, safety, information technology and other corporate services. In return for the general and administrative services provided by
85
SEVENTY SEVEN ENERGY INC.
NOTES TO CONSOLIDATED FINANCIAL STATEMENTS – (Continued)
Chesapeake, we reimbursed Chesapeake on a monthly basis for the overhead expenses incurred by Chesapeake on our behalf in accordance with its allocation policy, which included costs and expenses incurred in connection with the provision of any of the services under the agreement, including the wages and benefits of Chesapeake employees who perform services on our behalf. The administrative expense allocation was determined by multiplying revenues by a percentage determined by Chesapeake based on the historical average of costs incurred on our behalf. All of the administrative cost allocations were based on assumptions that management believes are reasonable; however, these allocations are not necessarily indicative of the costs and expenses that would have resulted if we had been operating as a stand-alone entity. These charges from Chesapeake were $26.8 million, $55.5 million and $49.4 million for the years ended December 31, 2014, 2013 and 2012, respectively. In connection with the spin-off, we terminated the administrative services agreement and entered into the transition services agreement.
14. Segment Information
Our revenues, income (loss) before income taxes and identifiable assets are primarily attributable to four reportable segments. Each of these segments represents a distinct type of business. These segments have separate management teams which report to our chief operating decision maker. The results of operations in these segments are regularly reviewed by the chief operating decision maker for purposes of determining resource allocation and assessing performance. Management evaluates the performance of our segments based upon earnings before interest, taxes, depreciation and amortization, as further adjusted to add back nonrecurring items. The following is a description of the segments and other operations:
Drilling. Our drilling segment provides land drilling and drilling-related services, including directional drilling for oil and natural gas exploration and development activities. As of December 31, 2014, we owned a fleet of 92 land drilling rigs.
Hydraulic Fracturing. Our hydraulic fracturing segment provides hydraulic fracturing and other well stimulation services. As of December 31, 2014, we owned 10 hydraulic fracturing fleets with an aggregate of 400,000 horsepower.
Oilfield Rentals. Our oilfield rentals segment provides premium rental tools for land-based oil and natural gas drilling, completion and workover activities.
Oilfield Trucking. Our oilfield trucking segment provides drilling rig relocation and logistics services as well as fluid handling services. As of December 31, 2014, we owned a fleet of 263 rig relocation trucks, 67 cranes and forklifts and 141 water hauling trucks. As part of the spin-off, we sold our crude hauling assets to a third party.
Other Operations. Prior to the spin-off, our other operations consisted primarily of our compression unit manufacturing business and corporate functions, including our 2019 Notes, 2022 Notes, Term Loan and credit facilities. As part of the spin-off, we distributed our compression unit manufacturing business to Chesapeake.
86
SEVENTY SEVEN ENERGY INC.
NOTES TO CONSOLIDATED FINANCIAL STATEMENTS – (Continued)
Drilling | Hydraulic Fracturing | Oilfield Rentals | Oilfield Trucking | Other Operations | Intercompany Eliminations | Consolidated Total | |||||||||||||||||||||
(in thousands) | |||||||||||||||||||||||||||
For The Year Ended December 31, 2014: | |||||||||||||||||||||||||||
Revenues | $ | 774,888 | $ | 885,907 | $ | 154,416 | $ | 195,618 | $ | 109,942 | $ | (39,879 | ) | $ | 2,080,892 | ||||||||||||
Intersegment revenues | (358 | ) | — | (1,296 | ) | (5,139 | ) | (33,086 | ) | 39,879 | — | ||||||||||||||||
Total revenues | $ | 774,530 | $ | 885,907 | $ | 153,120 | $ | 190,479 | $ | 76,856 | $ | — | $ | 2,080,892 | |||||||||||||
Depreciation and amortization | 140,884 | 72,105 | 52,680 | 21,817 | 5,426 | — | 292,912 | ||||||||||||||||||||
Losses (gains) on sales of property and equipment | 17,931 | (17 | ) | (2,355 | ) | (21,853 | ) | 22 | — | (6,272 | ) | ||||||||||||||||
Impairments and other(a) | 29,602 | 207 | 955 | — | — | — | 30,764 | ||||||||||||||||||||
Interest expense | — | — | — | — | (79,734 | ) | — | (79,734 | ) | ||||||||||||||||||
Loss from equity investees | — | (6,094 | ) | — | — | — | — | (6,094 | ) | ||||||||||||||||||
Other income (expense) | 364 | 60 | 179 | 226 | (165 | ) | — | 664 | |||||||||||||||||||
(Loss) Income Before Income Taxes | $ | 79,999 | $ | 63,548 | $ | (2,459 | ) | $ | 6,359 | $ | (157,615 | ) | $ | — | $ | (10,168 | ) | ||||||||||
Total Assets | $ | 1,322,160 | $ | 449,966 | $ | 155,683 | $ | 138,909 | $ | 247,013 | $ | (1,179 | ) | $ | 2,312,552 | ||||||||||||
Capital Expenditures | $ | 373,353 | $ | 37,211 | $ | 22,337 | $ | 3,599 | $ | 21,118 | $ | — | $ | 457,618 | |||||||||||||
For The Year Ended December 31, 2013: | |||||||||||||||||||||||||||
Revenues | $ | 745,800 | $ | 897,809 | $ | 161,676 | $ | 250,495 | $ | 165,500 | $ | (33,075 | ) | $ | 2,188,205 | ||||||||||||
Intersegment revenues | (4,988 | ) | — | (1,435 | ) | (6,115 | ) | (20,537 | ) | 33,075 | — | ||||||||||||||||
Total revenues | $ | 740,812 | $ | 897,809 | $ | 160,241 | $ | 244,380 | $ | 144,963 | $ | — | $ | 2,188,205 | |||||||||||||
Depreciation and amortization | 133,785 | 69,507 | 59,559 | 25,870 | 870 | — | 289,591 | ||||||||||||||||||||
Losses (gains) on sales of property and equipment | 663 | — | (1,146 | ) | (2,249 | ) | 103 | — | (2,629 | ) | |||||||||||||||||
Impairments and other(a) | 71,548 | — | 1 | — | 3,213 | — | 74,762 | ||||||||||||||||||||
Interest expense | — | — | — | — | (56,786 | ) | — | (56,786 | ) | ||||||||||||||||||
Income (loss) from equity investees | — | 159 | — | (1,117 | ) | — | — | (958 | ) | ||||||||||||||||||
Other (expense) income | (231 | ) | 254 | 1,129 | 184 | 422 | — | 1,758 | |||||||||||||||||||
(Loss) Income Before Income Taxes | $ | (26,360 | ) | $ | 67,224 | $ | (2,544 | ) | $ | 5,555 | $ | (71,443 | ) | $ | — | $ | (27,568 | ) | |||||||||
Total Assets | $ | 1,134,026 | $ | 454,559 | $ | 184,285 | $ | 204,386 | $ | 55,432 | $ | (5,795 | ) | $ | 2,026,893 | ||||||||||||
Capital Expenditures | $ | 284,354 | $ | 41,286 | $ | 16,925 | $ | 3,712 | $ | 3,529 | $ | — | $ | 349,806 | |||||||||||||
For The Year Ended December 31, 2012: | |||||||||||||||||||||||||||
Revenues | $ | 921,378 | $ | 419,692 | $ | 235,743 | $ | 232,067 | $ | 141,733 | $ | (30,591 | ) | $ | 1,920,022 | ||||||||||||
Intersegment revenues | (6,170 | ) | (4,524 | ) | (1,287 | ) | (5,906 | ) | (12,704 | ) | 30,591 | — | |||||||||||||||
Total revenues | $ | 915,208 | $ | 415,168 | $ | 234,456 | $ | 226,161 | $ | 129,029 | $ | — | $ | 1,920,022 | |||||||||||||
Depreciation and amortization | 117,756 | 26,491 | 62,762 | 23,523 | 790 | — | 231,322 | ||||||||||||||||||||
Losses (gains) on sales of property and equipment | 5,526 | 43 | (3,579 | ) | 35 | — | — | 2,025 | |||||||||||||||||||
Impairments and other(a) | 53,621 | — | 6,929 | — | 160 | — | 60,710 | ||||||||||||||||||||
Interest expense | — | — | — | — | (53,548 | ) | — | (53,548 | ) | ||||||||||||||||||
Income (loss) from equity investees | — | 139 | — | (500 | ) | — | — | (361 | ) | ||||||||||||||||||
Other income (expense) | 1,061 | 152 | 87 | (6 | ) | 249 | — | 1,543 | |||||||||||||||||||
Income (Loss) Before Income Taxes | $ | 44,167 | $ | 82,623 | $ | 27,133 | $ | 24,013 | $ | (61,483 | ) | $ | — | $ | 116,453 | ||||||||||||
Total Assets | $ | 1,113,856 | $ | 452,206 | $ | 254,983 | $ | 236,580 | $ | 71,282 | $ | (9,396 | ) | $ | 2,119,511 | ||||||||||||
Capital Expenditures | $ | 237,672 | $ | 237,483 | $ | 85,729 | $ | 61,063 | $ | 878 | $ | — | $ | 622,825 | |||||||||||||
(a) | Includes lease termination costs of $9.7 million, $22.4 million, and $24.9 million for the years ended December 31, 2014, 2013 and 2012, respectively. |
87
SEVENTY SEVEN ENERGY INC.
NOTES TO CONSOLIDATED FINANCIAL STATEMENTS – (Continued)
15. Condensed Consolidating Financial Information
In October 2011, we issued and sold the 2019 Senior Notes with an aggregate principal amount of $650.0 million (see Note 5). In connection with the spin-off, COO transferred all of its assets, operations, and liabilities, including the 2019 Notes, to SSO, which has been reflected retrospectively in the consolidating financial information. Pursuant to the Indenture governing the 2019 Senior Notes, such notes are fully and unconditionally and jointly and severally guaranteed by SSO's parent, SSE, and all of SSO's material subsidiaries, other than SSF, which is a co-issuer of the 2019 Senior Notes. Each of the subsidiary guarantors is 100% owned by SSO and there are no material subsidiaries of SSO other than the subsidiary guarantors. SSF and Western Wisconsin Sand Company, LLC are minor non-guarantor subsidiaries whose condensed consolidating financial information is included with the subsidiary guarantors. SSE and SSO have independent assets and operations. There are no significant restrictions on the ability of SSO or any subsidiary guarantor to obtain funds from its subsidiaries by dividend or loan.
Set forth below are condensed consolidating financial statements for SSE ("Parent") and SSO ("Subsidiary Issuer") on a stand-alone, unconsolidated basis, and its combined guarantor subsidiaries as of December 31, 2014 and December 31, 2013 and for the years ended December 31, 2014, 2013 and 2012. The financial information may not necessarily be indicative of results of operations, cash flows or financial position had the subsidiaries operated as independent entities.
88
SEVENTY SEVEN ENERGY INC.
NOTES TO CONSOLIDATED FINANCIAL STATEMENTS – (Continued)
CONDENSED CONSOLIDATING BALANCE SHEET
AS OF DECEMBER 31, 2014
(in thousands)
Parent | Subsidiary Issuer | Guarantor Subsidiaries | Eliminations | Consolidated | |||||||||||||||
Assets: | |||||||||||||||||||
Current Assets: | |||||||||||||||||||
Cash | $ | 77 | $ | 733 | $ | 81 | $ | — | $ | 891 | |||||||||
Accounts receivable | — | 4 | 421,551 | — | 421,555 | ||||||||||||||
Inventory | — | — | 25,073 | — | 25,073 | ||||||||||||||
Deferred income tax asset | — | 2,091 | 6,029 | (657 | ) | 7,463 | |||||||||||||
Prepaid expenses and other | — | 5,309 | 13,763 | — | 19,072 | ||||||||||||||
Total Current Assets | 77 | 8,137 | 466,497 | (657 | ) | 474,054 | |||||||||||||
Property and Equipment: | |||||||||||||||||||
Property and equipment, at cost | — | 22,397 | 2,727,489 | — | 2,749,886 | ||||||||||||||
Less: accumulated depreciation | — | (643 | ) | (982,190 | ) | — | (982,833 | ) | |||||||||||
Total Property and Equipment, Net | — | 21,754 | 1,745,299 | — | 1,767,053 | ||||||||||||||
Other Assets: | |||||||||||||||||||
Equity method investment | — | — | 7,816 | — | 7,816 | ||||||||||||||
Goodwill | — | — | 27,434 | — | 27,434 | ||||||||||||||
Intangible assets, net | — | — | 5,420 | — | 5,420 | ||||||||||||||
Deferred financing costs, net | 6,740 | 17,111 | — | — | 23,851 | ||||||||||||||
Other long-term assets | — | 38,950 | 5,731 | (37,757 | ) | 6,924 | |||||||||||||
Investments in subsidiaries and intercompany advances | 803,383 | 1,853,480 | — | (2,656,863 | ) | — | |||||||||||||
Total Other Assets | 810,123 | 1,909,541 | 46,401 | (2,694,620 | ) | 71,445 | |||||||||||||
Total Assets | $ | 810,200 | $ | 1,939,432 | $ | 2,258,197 | $ | (2,695,277 | ) | $ | 2,312,552 | ||||||||
Liabilities and Equity: | |||||||||||||||||||
Current Liabilities: | |||||||||||||||||||
Accounts payable | $ | — | $ | 6,579 | $ | 39,078 | $ | — | $ | 45,657 | |||||||||
Current portion of long-term debt | — | 4,000 | — | — | 4,000 | ||||||||||||||
Other current liabilities | 18,032 | 29,776 | 168,601 | (657 | ) | 215,752 | |||||||||||||
Total Current Liabilities | 18,032 | 40,355 | 207,679 | (657 | ) | 265,409 | |||||||||||||
Long-Term Liabilities: | |||||||||||||||||||
Deferred income tax liabilities | 1,145 | — | 195,885 | (37,757 | ) | 159,273 | |||||||||||||
Long-term debt, less current maturities | 500,000 | 1,094,500 | — | — | 1,594,500 | ||||||||||||||
Other long-term liabilities | — | 1,194 | 1,153 | — | 2,347 | ||||||||||||||
Total Long-Term Liabilities | 501,145 | 1,095,694 | 197,038 | (37,757 | ) | 1,756,120 | |||||||||||||
Total Equity | 291,023 | 803,383 | 1,853,480 | (2,656,863 | ) | 291,023 | |||||||||||||
Total Liabilities and Equity | $ | 810,200 | $ | 1,939,432 | $ | 2,258,197 | $ | (2,695,277 | ) | $ | 2,312,552 | ||||||||
89
SEVENTY SEVEN ENERGY INC.
NOTES TO CONSOLIDATED FINANCIAL STATEMENTS – (Continued)
CONDENSED CONSOLIDATING BALANCE SHEET
AS OF DECEMBER 31, 2013
(in thousands)
Parent | Subsidiary Issuer | Guarantor Subsidiaries | Eliminations | Consolidated | |||||||||||||||
Assets: | |||||||||||||||||||
Current Assets: | |||||||||||||||||||
Cash | $ | — | $ | 1,613 | $ | 65 | $ | — | $ | 1,678 | |||||||||
Accounts receivable | — | 1,142 | 374,297 | — | 375,439 | ||||||||||||||
Inventory | — | — | 45,035 | — | 45,035 | ||||||||||||||
Deferred income tax asset | — | — | 5,318 | — | 5,318 | ||||||||||||||
Prepaid expenses and other | — | 853 | 19,448 | — | 20,301 | ||||||||||||||
Total Current Assets | — | 3,608 | 444,163 | — | 447,771 | ||||||||||||||
Property and Equipment: | |||||||||||||||||||
Property and equipment, at cost | — | 3,103 | 2,238,247 | — | 2,241,350 | ||||||||||||||
Less: accumulated depreciation | — | (133 | ) | (773,149 | ) | — | (773,282 | ) | |||||||||||
Property and equipment held for sale, net | — | — | 29,408 | — | 29,408 | ||||||||||||||
Total Property and Equipment, Net | — | 2,970 | 1,494,506 | — | 1,497,476 | ||||||||||||||
Other Assets: | |||||||||||||||||||
Equity method investment | — | — | 13,236 | — | 13,236 | ||||||||||||||
Goodwill | — | — | 42,447 | — | 42,447 | ||||||||||||||
Intangible assets, net | — | — | 7,429 | — | 7,429 | ||||||||||||||
Deferred financing costs, net | — | 14,080 | — | — | 14,080 | ||||||||||||||
Other long-term assets | — | 54,958 | 4,454 | (54,958 | ) | 4,454 | |||||||||||||
Investments in subsidiaries and intercompany advances | 547,192 | 1,542,365 | — | (2,089,557 | ) | — | |||||||||||||
Total Other Assets | 547,192 | 1,611,403 | 67,566 | (2,144,515 | ) | 81,646 | |||||||||||||
Total Assets | $ | 547,192 | $ | 1,617,981 | $ | 2,006,235 | $ | (2,144,515 | ) | $ | 2,026,893 | ||||||||
Liabilities and Equity: | |||||||||||||||||||
Current Liabilities: | |||||||||||||||||||
Accounts payable | $ | — | $ | 2,889 | $ | 61,977 | $ | — | $ | 64,866 | |||||||||
Other current liabilities | — | 11,669 | 198,454 | — | 210,123 | ||||||||||||||
Total Current Liabilities | — | 14,558 | 260,431 | — | 274,989 | ||||||||||||||
Long-Term Liabilities: | |||||||||||||||||||
Deferred income tax liabilities | — | — | 200,705 | (54,958 | ) | 145,747 | |||||||||||||
Long-term debt | — | 1,055,000 | — | — | 1,055,000 | ||||||||||||||
Other long-term liabilities | — | 1,231 | 2,734 | — | 3,965 | ||||||||||||||
Total Long-Term Liabilities | — | 1,056,231 | 203,439 | (54,958 | ) | 1,204,712 | |||||||||||||
Total Equity | 547,192 | 547,192 | 1,542,365 | (2,089,557 | ) | 547,192 | |||||||||||||
Total Liabilities and Equity | $ | 547,192 | $ | 1,617,981 | $ | 2,006,235 | $ | (2,144,515 | ) | $ | 2,026,893 | ||||||||
90
SEVENTY SEVEN ENERGY INC.
NOTES TO CONSOLIDATED FINANCIAL STATEMENTS – (Continued)
CONDENSED CONSOLIDATING STATEMENT OF OPERATIONS
YEAR ENDED DECEMBER 31, 2014
(in thousands)
Parent | Subsidiary Issuer | Guarantor Subsidiaries | Eliminations | Consolidated | |||||||||||||||
Revenues: | |||||||||||||||||||
Revenues | $ | — | $ | 3,531 | $ | 2,080,812 | $ | (3,451 | ) | $ | 2,080,892 | ||||||||
Operating Expenses: | |||||||||||||||||||
Operating costs | — | 4,652 | 1,580,974 | (5,273 | ) | 1,580,353 | |||||||||||||
Depreciation and amortization | — | 218 | 292,694 | — | 292,912 | ||||||||||||||
General and administrative | 166 | 78,175 | 29,798 | — | 108,139 | ||||||||||||||
(Gains) losses on sales of property and equipment | — | 6 | (6,278 | ) | — | (6,272 | ) | ||||||||||||
Impairments and other | — | — | 30,764 | — | 30,764 | ||||||||||||||
Total Operating Expenses | 166 | 83,051 | 1,927,952 | (5,273 | ) | 2,005,896 | |||||||||||||
Operating (Loss) Income | (166 | ) | (79,520 | ) | 152,860 | 1,822 | 74,996 | ||||||||||||
Other (Expense) Income: | |||||||||||||||||||
Interest expense | (17,168 | ) | (62,566 | ) | — | — | (79,734 | ) | |||||||||||
Income from equity investees | — | — | (6,094 | ) | — | (6,094 | ) | ||||||||||||
Other (expense) income | — | (216 | ) | 880 | — | 664 | |||||||||||||
Equity in net earnings of subsidiary | 2,656 | 90,446 | — | (93,102 | ) | — | |||||||||||||
Total Other (Expense) Income | (14,512 | ) | 27,664 | (5,214 | ) | (93,102 | ) | (85,164 | ) | ||||||||||
(Loss) Income Before Income Taxes | (14,678 | ) | (51,856 | ) | 147,646 | (91,280 | ) | (10,168 | ) | ||||||||||
Income Tax (Benefit) Expense | (6,699 | ) | (53,382 | ) | 57,200 | 692 | (2,189 | ) | |||||||||||
Net (Loss) Income | $ | (7,979 | ) | $ | 1,526 | $ | 90,446 | $ | (91,972 | ) | $ | (7,979 | ) | ||||||
91
SEVENTY SEVEN ENERGY INC.
NOTES TO CONSOLIDATED FINANCIAL STATEMENTS – (Continued)
CONDENSED CONSOLIDATING STATEMENT OF OPERATIONS
YEAR ENDED DECEMBER 31, 2013
(in thousands)
Parent | Subsidiary Issuer | Guarantor Subsidiaries | Eliminations | Consolidated | |||||||||||||||
Revenues: | |||||||||||||||||||
Revenues | $ | — | $ | 8,011 | $ | 2,187,966 | $ | (7,772 | ) | $ | 2,188,205 | ||||||||
Operating Expenses: | |||||||||||||||||||
Operating costs | — | 9,513 | 1,717,235 | (9,039 | ) | 1,717,709 | |||||||||||||
Depreciation and amortization | — | 27 | 289,564 | — | 289,591 | ||||||||||||||
General and administrative | — | 20,506 | 59,848 | — | 80,354 | ||||||||||||||
(Gains) on sales of property and equipment | — | — | (2,629 | ) | — | (2,629 | ) | ||||||||||||
Impairments and other | — | — | 74,762 | — | 74,762 | ||||||||||||||
Total Operating Expenses | — | 30,046 | 2,138,780 | (9,039 | ) | 2,159,787 | |||||||||||||
Operating (Loss) Income | — | (22,035 | ) | 49,186 | 1,267 | 28,418 | |||||||||||||
Other (Expense) Income: | |||||||||||||||||||
Interest expense | — | (56,786 | ) | — | — | (56,786 | ) | ||||||||||||
Loss from equity investees | — | — | (958 | ) | — | (958 | ) | ||||||||||||
Other income | — | — | 1,758 | — | 1,758 | ||||||||||||||
Equity in net earnings of subsidiary | (18,948 | ) | 29,334 | — | (10,386 | ) | — | ||||||||||||
Total Other (Expense) Income | (18,948 | ) | (27,452 | ) | 800 | (10,386 | ) | (55,986 | ) | ||||||||||
(Loss) Income Before Income Taxes | (18,948 | ) | (49,487 | ) | 49,986 | (9,119 | ) | (27,568 | ) | ||||||||||
Income Tax Expense (Benefit) | 787 | (29,752 | ) | 21,439 | (307 | ) | (7,833 | ) | |||||||||||
Net (Loss) Income | $ | (19,735 | ) | $ | (19,735 | ) | $ | 28,547 | $ | (8,812 | ) | $ | (19,735 | ) | |||||
92
SEVENTY SEVEN ENERGY INC.
NOTES TO CONSOLIDATED FINANCIAL STATEMENTS – (Continued)
CONDENSED CONSOLIDATING STATEMENT OF OPERATIONS
YEAR ENDED DECEMBER 31, 2012
(in thousands)
Parent | Subsidiary Issuer | Guarantor Subsidiaries | Eliminations | Consolidated | |||||||||||||||
Revenues: | |||||||||||||||||||
Revenues | $ | — | $ | 4,756 | $ | 1,919,797 | $ | (4,531 | ) | $ | 1,920,022 | ||||||||
Operating Expenses: | |||||||||||||||||||
Operating costs | — | 6,587 | 1,390,474 | (6,275 | ) | 1,390,786 | |||||||||||||
Depreciation and amortization | — | — | 231,322 | — | 231,322 | ||||||||||||||
General and administrative | — | 19,531 | 46,829 | — | 66,360 | ||||||||||||||
Losses on sales of property and equipment | — | — | 2,025 | — | 2,025 | ||||||||||||||
Impairments and other | — | — | 60,710 | — | 60,710 | ||||||||||||||
Total Operating Expenses | — | 26,118 | 1,731,360 | (6,275 | ) | 1,751,203 | |||||||||||||
Operating (Loss) Income | — | (21,362 | ) | 188,437 | 1,744 | 168,819 | |||||||||||||
Other Income (Expense): | |||||||||||||||||||
Interest expense | — | (53,546 | ) | (2 | ) | — | (53,548 | ) | |||||||||||
Loss from equity investees | — | — | (361 | ) | — | (361 | ) | ||||||||||||
Other income | — | 2 | 1,541 | — | 1,543 | ||||||||||||||
Equity in net earnings of subsidiary | 70,659 | 116,694 | — | (187,353 | ) | — | |||||||||||||
Total Other Income (Expense) | 70,659 | 63,150 | 1,178 | (187,353 | ) | (52,366 | ) | ||||||||||||
Income (Loss) Before Income Taxes | 70,659 | 41,788 | 189,615 | (185,609 | ) | 116,453 | |||||||||||||
Income Tax Expense (Benefit) | 1,083 | (27,788 | ) | 74,004 | (422 | ) | 46,877 | ||||||||||||
Net Income (Loss) | $ | 69,576 | $ | 69,576 | $ | 115,611 | $ | (185,187 | ) | $ | 69,576 | ||||||||
93
SEVENTY SEVEN ENERGY INC.
NOTES TO CONSOLIDATED FINANCIAL STATEMENTS – (Continued)
CONDENSED CONSOLIDATING STATEMENTS OF CASH FLOWS
YEAR ENDED DECEMBER 31, 2014
(in thousands)
Parent | Subsidiary Issuer | Guarantor Subsidiaries | Eliminations | Consolidated | |||||||||||||||
Cash Flows From Operating Activities: | $ | 53,039 | $ | (59,411 | ) | $ | 363,855 | $ | (92,187 | ) | $ | 265,296 | |||||||
Cash Flows From Investing Activities: | |||||||||||||||||||
Additions to property and equipment | — | (17,888 | ) | (439,730 | ) | — | (457,618 | ) | |||||||||||
Proceeds from sale of assets | — | — | 88,556 | — | 88,556 | ||||||||||||||
Additions to investments | (119,711 | ) | (38,218 | ) | (675 | ) | 157,929 | (675 | ) | ||||||||||
Other | — | — | 2,091 | — | 2,091 | ||||||||||||||
Cash used in investing activities | (119,711 | ) | (56,106 | ) | (349,758 | ) | 157,929 | (367,646 | ) | ||||||||||
Cash Flows From Financing Activities: | |||||||||||||||||||
Distributions to Chesapeake | (422,839 | ) | — | — | — | (422,839 | ) | ||||||||||||
Contributions from (distributions to) affiliates | — | 79,823 | (14,081 | ) | (65,742 | ) | — | ||||||||||||
Proceeds from issuance of senior notes, net of offering costs | 493,825 | — | — | — | 493,825 | ||||||||||||||
Proceeds from issuance of term loan, net of issuance costs | — | 393,879 | — | — | 393,879 | ||||||||||||||
Payments on term loan | — | (2,000 | ) | — | — | (2,000 | ) | ||||||||||||
Borrowings from revolving credit facility | — | 1,201,400 | — | — | 1,201,400 | ||||||||||||||
Payments on revolving credit facility | — | (1,555,900 | ) | — | — | (1,555,900 | ) | ||||||||||||
Deferred financing costs | (1,032 | ) | (2,565 | ) | — | — | (3,597 | ) | |||||||||||
Other | (3,205 | ) | — | — | — | (3,205 | ) | ||||||||||||
Net cash provided by (used in) financing activities | 66,749 | 114,637 | (14,081 | ) | (65,742 | ) | 101,563 | ||||||||||||
Net increase (decrease) in cash | 77 | (880 | ) | 16 | — | (787 | ) | ||||||||||||
Cash, beginning of period | — | 1,613 | 65 | — | 1,678 | ||||||||||||||
Cash, end of period | $ | 77 | $ | 733 | $ | 81 | $ | — | $ | 891 | |||||||||
94
SEVENTY SEVEN ENERGY INC.
NOTES TO CONSOLIDATED FINANCIAL STATEMENTS – (Continued)
CONDENSED CONSOLIDATING STATEMENTS OF CASH FLOWS
YEAR ENDED DECEMBER 31, 2013
(in thousands)
Parent | Subsidiary Issuer | Guarantor Subsidiaries | Eliminations | Consolidated | |||||||||||||||
Cash Flows From Operating Activities: | $ | — | $ | 13,766 | $ | 404,170 | $ | (80,865 | ) | $ | 337,071 | ||||||||
Cash Flows From Investing Activities: | |||||||||||||||||||
Additions to property and equipment | — | (3,103 | ) | (346,703 | ) | — | (349,806 | ) | |||||||||||
Proceeds from sale of assets | — | — | 50,602 | — | 50,602 | ||||||||||||||
Proceeds from sale of investment | — | — | 2,790 | — | 2,790 | ||||||||||||||
Additions to investments | — | — | (431 | ) | — | (431 | ) | ||||||||||||
Other | — | — | 28 | — | 28 | ||||||||||||||
Cash used in investing activities | — | (3,103 | ) | (293,714 | ) | — | (296,817 | ) | |||||||||||
Cash Flows From Financing Activities: | |||||||||||||||||||
Contributions from (distributions to) affiliates | — | — | (110,755 | ) | 80,865 | (29,890 | ) | ||||||||||||
Borrowings from revolving credit facility | — | 1,216,900 | — | — | 1,216,900 | ||||||||||||||
Payments on revolving credit facility | — | (1,230,100 | ) | — | — | (1,230,100 | ) | ||||||||||||
Other | — | 3,287 | — | — | 3,287 | ||||||||||||||
Net cash provided by financing activities | — | (9,913 | ) | (110,755 | ) | 80,865 | (39,803 | ) | |||||||||||
Net increase (decrease) in cash | — | 750 | (299 | ) | — | 451 | |||||||||||||
Cash, beginning of period | — | 863 | 364 | — | 1,227 | ||||||||||||||
Cash, end of period | $ | — | $ | 1,613 | $ | 65 | $ | — | $ | 1,678 | |||||||||
95
SEVENTY SEVEN ENERGY INC.
NOTES TO CONSOLIDATED FINANCIAL STATEMENTS – (Continued)
CONDENSED CONSOLIDATING STATEMENTS OF CASH FLOWS
YEAR ENDED DECEMBER 31, 2012
(in thousands)
Parent | Subsidiary Issuer | Guarantor Subsidiaries | Eliminations | Consolidated | |||||||||||||||
Cash Flows From Operating Activities: | $ | — | $ | (73,940 | ) | $ | 285,091 | $ | — | $ | 211,151 | ||||||||
Cash Flows From Investing Activities: | |||||||||||||||||||
Additions to property and equipment | — | — | (622,825 | ) | — | (622,825 | ) | ||||||||||||
Proceeds from sale of assets | — | — | 47,421 | — | 47,421 | ||||||||||||||
Additions to investments | — | (314,397 | ) | (1,920 | ) | 314,397 | (1,920 | ) | |||||||||||
Cash used in investing activities | — | (314,397 | ) | (577,324 | ) | 314,397 | (577,324 | ) | |||||||||||
Cash Flows From Financing Activities: | |||||||||||||||||||
Contributions from (distributions to) affiliates | — | — | 292,067 | (314,397 | ) | (22,330 | ) | ||||||||||||
Borrowings from revolving credit facility | — | 1,389,100 | — | — | 1,389,100 | ||||||||||||||
Payments on revolving credit facility | — | (999,900 | ) | — | — | (999,900 | ) | ||||||||||||
Net cash provided by financing activities | — | 389,200 | 292,067 | (314,397 | ) | 366,870 | |||||||||||||
Net increase (decrease) in cash | — | 863 | (166 | ) | — | 697 | |||||||||||||
Cash, beginning of period | — | — | 530 | — | 530 | ||||||||||||||
Cash, end of period | $ | — | $ | 863 | $ | 364 | $ | — | $ | 1,227 | |||||||||
96
SEVENTY SEVEN ENERGY INC.
NOTES TO CONSOLIDATED FINANCIAL STATEMENTS – (Continued)
16. Quarterly Financial Data (unaudited)
Summarized unaudited quarterly financial data for 2014 and 2013 are as follows:
Quarters Ended | |||||||||||||||
March 31, 2014 | June 30, 2014 | September 30, 2014 | December 31, 2014 | ||||||||||||
(in thousands) | |||||||||||||||
Revenues | $ | 509,710 | $ | 549,466 | $ | 526,773 | $ | 494,943 | |||||||
Operating (loss) income(a)(b) | $ | (14,016 | ) | $ | 57,475 | $ | 19,852 | $ | 11,685 | ||||||
Net (loss) income(a)(b) | $ | (18,557 | ) | $ | 21,710 | $ | (1,770 | ) | $ | (9,362 | ) | ||||
(Loss) earnings per share(c)(d): | |||||||||||||||
Basic | $ | (0.40 | ) | $ | 0.46 | $ | (0.04 | ) | $ | (0.20 | ) | ||||
Diluted | $ | (0.40 | ) | $ | 0.46 | $ | (0.04 | ) | $ | (0.20 | ) | ||||
Quarters Ended | |||||||||||||||
March 31, 2013 | June 30, 2013 | September 30, 2013 | December 31, 2013 | ||||||||||||
(in thousands) | |||||||||||||||
Revenues | $ | 543,887 | $ | 583,064 | $ | 550,403 | $ | 510,851 | |||||||
Operating income (loss)(a) | $ | 37,837 | $ | 27,297 | $ | (16,336 | ) | $ | (20,380 | ) | |||||
Net income (loss)(a) | $ | 14,233 | $ | 7,176 | $ | (18,684 | ) | $ | (22,460 | ) | |||||
Earnings (loss) per share(c): | |||||||||||||||
Basic | $ | 0.30 | $ | 0.15 | $ | (0.39 | ) | $ | (0.48 | ) | |||||
Diluted | $ | 0.30 | $ | 0.15 | $ | (0.39 | ) | $ | (0.48 | ) | |||||
(a) | Includes $7.8 million, $3.2 million and $19.8 million of impairments and other for the quarters ended September 30, 2014, June 30, 2014 and March 31, 2014, respectively. Includes $44.4 million, $23.6 million and $6.7 million of impairments and other for the quarters ended December 31, 2013, September 30, 2013 and June 30, 2013, respectively. |
(b) | Includes a non-recurring credit of $10.5 million for the quarter ended June 30, 2014 as a result of the cancellation of the unvested Chesapeake restricted stock and stock option awards. |
(c) | On June 30, 2014 we distributed 46,932,433 shares of our common stock to Chesapeake shareholders in conjunction with the spin-off. For comparative purposes, and to provide a more meaningful calculation for weighted average shares, we have assumed this amount to be outstanding for periods prior to the spin-off. |
(d) | The sum of quarterly net income per share may not agree to the total for the year as each period's computation is based on the weighted average number of common shares outstanding during each period. |
17. Recently Issued and Proposed Accounting Standards
Recently Issued Accounting Standards
In August 2014, the FASB issued ASU No 2014-15, "Presentation of Financial Statements - Going Concern," which requires management to evaluate whether there are conditions or events, considered in the aggregate, that raise substantial doubt about the entity's ability to continue as a going concern within one year after the date that the financial statements are issued (or within one year after the date that the financial statements are available to be issued when applicable). ASU 2014-15 is effective for fiscal years, and interim periods within those years, beginning after December 15, 2016, with early application permitted. We are currently evaluating what impact this standard will have on our consolidated financial statements.
In May 2014, the FASB issued ASU No. 2014-09, "Revenue from Contracts with Customers," which supersedes the revenue recognition requirements in "Revenue Recognition (Topic 605)," and requires entities to recognize revenue in a way that depicts the transfer of promised goods or services to customers in an amount that reflects the consideration to which the entity expects to be entitled to in exchange for those goods or services. ASU 2014-09 is effective for fiscal years, and interim periods within those years, beginning after December 15, 2016, with early application not permitted. We are currently evaluating what impact this standard will have on our consolidated financial statements.
97
In April 2014, the FASB issued ASU No. 2014-08, "Presentation of Financial Statements (Topic 205) and Property, Plant, and Equipment (Topic 360): Reporting Discontinued Operations and Disclosures of Disposals of Components of an Entity." ASU 2014-08 raises the threshold for a disposal to qualify as a discontinued operation and requires new disclosures of both discontinued operations and certain other disposals that do not meet the definition of a discontinued operation. It is effective for annual periods beginning on or after December 15, 2014. Early adoption is permitted but only for disposals that have not been reported in financial statements previously issued. We early adopted ASU 2014-08 in 2014. We applied this standard in our evaluation of the distributions of businesses and assets sales completed in 2014 and concluded that these disposals did not qualify as discontinued operations.
18. Subsequent Events
Due to the decline in oil prices, certain of our customers are reducing their drilling and completions activity and related capital expenditure budgets. As a result, subsequent to December 31, 2014, three of our drilling contracts have been terminated early and we expect to recognize $1.7 million in early termination compensation during the first quarter of 2015 associated with these terminations. In addition, we entered into an agreement for incremental hydraulic fracturing and oilfield rental services in exchange for waiving early termination compensation associated with two other drilling contracts.
98
Item 9. | Changes In and Disagreements with Accountants on Accounting and Financial Disclosure | |||
Not applicable.
99
Item 9A. | Controls and Procedures | |||
Disclosure Controls and Procedures
We maintain disclosure controls and procedures that are designed to provide reasonable assurance that information required to be disclosed by us in reports that we file or submit under the Securities Exchange Act of 1934, as amended (the "Exchange Act") is recorded, processed, summarized and reported within the time periods specified in the SEC's rules and forms, and that such information is accumulated and communicated to our management, including our chief executive officer ("CEO") (principal executive officer) and chief financial officer ("CFO") (principal financial officer), as appropriate, to allow for timely decisions regarding required disclosure. In designing and evaluating the disclosure controls and procedures, management recognizes that any controls and procedures, no matter how well designed and operated, can provide only reasonable assurance of achieving the desired control objectives, and management is required to apply its judgment in evaluating the cost-benefit relationship of possible controls and procedures.
As required by SEC Rule 13a-15(b), we carried out an evaluation, under the supervision and with the participation of our management, including our chief executive officer and chief financial officer, of the effectiveness of our disclosure controls and procedures as of December 31, 2014. Based on their evaluation, the Company's CEO and CFO have concluded that the Company's disclosure controls and procedures were not effective as of December 31, 2014 because of the material weakness in our internal control over financial reporting described below.
Management's Report on Internal Control Over Financial Reporting
Our management is responsible for establishing and maintaining adequate internal control over financial reporting, as such term is defined in Rule 13a-15(f) of the Exchange Act. Under the supervision and with the participation of our management, including the CEO and the CFO, we carried out an evaluation of the effectiveness of our internal control over financial reporting as of December 31, 2014 using the criteria established in "Internal Control-Integrated Framework" (2013), issued by the Committee of Sponsoring Organizations of the Treadway Commission (COSO).
A material weakness is a deficiency, or a combination of deficiencies, in internal control over financial reporting, such that there is a reasonable possibility that a material misstatement of the Company's annual or interim financial statements will not be prevented or detected on a timely basis. Management has identified a control deficiency associated with the change in third party payroll providers in November 2014 that constitutes a material weakness in our internal control over financial reporting as of December 31, 2014 as the Company did not maintain effective controls related to the change in providers used in the processing of its payroll. Specifically, the Company did not design and maintain effective controls with respect to the migration and validation of employee data in conjunction with the change in payroll providers in November 2014, nor did it validate that ongoing changes to employee data were completely and accurately reflected in the data provided to and from the payroll provider.
This control deficiency did not result in a material misstatement to the Company's consolidated financial statements for the year ended December 31, 2014. However, the control deficiency could result in a misstatement of payroll expense that would result in a material misstatement to the annual or interim consolidated financial statements that would not be prevented or detected. Accordingly, our management has determined that the control deficiency constitutes a material weakness. Because of the material weakness, management concluded that the Company did not maintain effective internal control over financial reporting as of December 31, 2014 based on criteria in "Internal Control - Integrated Framework" issued by the COSO.
The effectiveness of our internal control over financial reporting as of December 31, 2014 has been audited by PricewaterhouseCoopers LLP, an independent registered public accounting firm, as stated in their report, which is included in Item 8 of this Annual Report.
/s/ Jerry Winchester
Jerry Winchester
Director, President and Chief Executive Officer
/s/ Cary Baetz
Cary Baetz
Chief Financial Officer and Treasurer
March 2, 2015
100
Status of Remediation Efforts
Management is actively engaged in the planning for, and implementation of, remedial efforts to address the material weakness identified above. Specifically, management is in the process of implementing changes, including designing and implementing new controls, to validate the completeness and accuracy of data provided to the payroll provider used in the processing of the Company's payroll.
We are committed to maintaining a strong internal control environment and believe that these remediation efforts will be effective in remediating the material weakness described above.
While we believe that implementing additional controls around the completeness and accuracy of data will remediate the identified material weakness, the material weakness in internal control will not be considered fully addressed until the new procedures have been in place for a sufficient period of time and tested to allow management to conclude that the controls are effective.
Changes in Internal Control Over Financial Reporting
There were no changes in our internal control over financial reporting during the quarter ended December 31, 2014 which materially affected, or are reasonably likely to materially affect, our internal control over financial reporting.
Item 9B. | Other Information | |||
On February 26, 2015, the Board of Directors of the Company, in accordance with the recommendation from the Compensation Committee of the Board, approved 2015 long-term equity compensation awards for certain of the Company's employees, including its executive officers, consisting of restricted shares of the Company's common stock pursuant to the Company's 2014 Incentive Plan (the "Plan"). The dollar value of the awards approved for the Company's named executive officers are set forth in the table below.
Value of Award | |||
Jerry Winchester | $ | 3,149,000 | |
Karl Blanchard | $ | 1,697,000 | |
Cary Baetz | $ | 1,114,000 | |
James Minmier | $ | 1,000,000 | |
William Stanger | $ | 717,000 | |
The Company will determine the number of shares associated with each award based on the closing price of the Company's common stock on Tuesday, March 3, 2015, the expected grant date. The awards will vest in equal annual installments on a three year schedule, and so long as such officer is employed by the Company or its affiliates at such time, unless vesting is otherwise accelerated or continues pursuant to the terms of the employment agreements or the Plan.
101
PART III
Item 10. | Directors, Executive Officers and Corporate Governance | |||
Information required by Item 10 of Part III is incorporated herein by reference to the definitive Proxy Statement to be filed by us pursuant to Regulation 14A of the General Rules and Regulations under the Securities Exchange Act of 1934 not later than April 30, 2015 (the "2015 Proxy Statement").
Item 11. | Executive Compensation | |||
The information required by Item 11 of Part III is incorporated by reference to the 2015 Proxy Statement.
Item 12. | Security Ownership of Certain Beneficial Owners and Management and Related Stockholder Matters | |||
The information required by Item 12 of Part III is incorporated by reference to the 2015 Proxy Statement.
Item 13. | Certain Relationships and Related Transactions and Director Independence | |||
Certain relationships and related transactions are incorporated by reference from Item 1 of this report under "Business—Agreements Between Us and Chesapeake." The other information required by Item 13 of Part III is incorporated by reference to the 2015 Proxy Statement.
Item 14. | Principal Accountant Fees and Services | |||
The information required by Item 14 of Part III is incorporated by reference to the 2015 Proxy Statement.
102
PART IV
Item 15. | Exhibits, Financial Statement Schedules | |||
The following exhibits are filed as a part of this report:
Incorporated by Reference | ||||||||||||||||
Exhibit Number | Exhibit Description | Form | Commission File No. | Exhibit | Filing Date | Filed Herewith | Furnished Herewith | |||||||||
2.1 | Master Separation Agreement, dated as of June 25, 2014, by and between Chesapeake Oilfield Operating, L.L.C., and Chesapeake Energy Corporation. | 8-K | 001-36354 | 2.1 | 7/1/2014 | |||||||||||
3.1 | Certificate of Incorporation of Seventy Seven Energy Inc. | 8-K | 001-36354 | 3.1 | 7/1/2014 | |||||||||||
3.2 | Bylaws of Seventy Seven Energy Inc. | 8-K | 001-36354 | 3.2 | 7/1/2014 | |||||||||||
4.1 | Form of Common Stock Certificate of Seventy Seven Energy Inc. | 10-12B | 001-36354 | 4.1 | 6/13/2014 | |||||||||||
4.2 | Indenture dated June 26, 2014, by and between Chesapeake Oilfield Operating, L.L.C. and Wells Fargo Bank, National Association. | 8-K | 001-36354 | 4.2 | 7/1/2014 | |||||||||||
4.3 | Form of 6.5% Senior Note due 2022 (included in Exhibit 4.2). | |||||||||||||||
4.4 | Indenture, dated as of October 28, 2011, among Chesapeake Oilfield Operating, L.L.C., Chesapeake Oilfield Finance, Inc., the guarantors named therein and The Bank of New York Mellon Trust Company, N.A., as trustee. | S-4 | 333-187766 | 4.4 | 5/30/2013 | |||||||||||
4.5 | Form of 6.625% Senior Note due 2019 (included in Exhibit 4.4). | |||||||||||||||
4.6 | Supplemental Indenture, dated June 26, 2014, by and between Chesapeake Oilfield Operating, L.L.C., Chesapeake Oilfield Finance, Inc., Seventy Seven Operating LLC and The Bank of New York Mellon Trust Company, N.A., as trustee. | 8-K | 001-36354 | 4.1 | 7/1/2014 | |||||||||||
10.1 | Master Services Agreement, dated as of October 25, 2011, between COS Holdings, L.L.C. and Chesapeake Operating, Inc. | S-4 | 333-187766 | 10.1 | 5/30/2013 | |||||||||||
10.2 | Letter Agreement, dated June 25, 2014, to the Master Services Agreement, dated October 25, 2011, between Chesapeake Operating, L.L.C. and Chesapeake Oilfield Operating, L.L.C. | 10-Q | 001-36354 | 10.7 | 8/5/2014 | |||||||||||
10.3 | Tax Sharing Agreement, dated June 25, 2014, by and between Chesapeake Oilfield Operating, L.L.C. and Chesapeake Energy Corporation. | 8-K | 001-36354 | 10.1 | 7/1/2014 | |||||||||||
10.4 | Employee Matters Agreement, dated June 25, 2014, by and between Chesapeake Oilfield Operating, L.L.C. and Chesapeake Energy Corporation. | 8-K | 001-36354 | 10.2 | 7/1/2014 | |||||||||||
103
10.5 | Transition Services Agreement, dated as of June 25, 2014, by and between Chesapeake Oilfield Operating, L.L.C. and Chesapeake Energy Corporation. | 8-K | 001-36354 | 10.3 | 7/1/2014 | |||||||||||
10.6 | Services Agreement (hydraulic fracturing), dated June 25, 2014, by and between Performance Technologies, L.L.C. and Chesapeake Operating, Inc. | 8-K | 001-36354 | 10.4 | 7/1/2014 | |||||||||||
10.7 | Term Loan Credit Agreement dated June 25, 2014, by and among Chesapeake Oilfield Operating, L.L.C., Seventy Seven Operating LLC, as borrower, Bank of America, N.A., as administrative agent and the lenders name therein. | 8-K | 001-36354 | 10.5 | 7/1/2014 | |||||||||||
10.8 | ABL Credit Agreement, dated June 25, 2014, by and among Nomac Drilling, L.L.C., Performance Technologies, L.L.C., Great Plains Oilfield Rental, L.L.C., Hodges Trucking Company, L.L.C., and Oilfield Trucking Solutions, L.L.C., as borrowers, the guarantors named therein, Wells Fargo Bank, National Association and Bank of America, N.A., as joint lead arrangers and joint book runners, Bank of America, N.A., as syndication agent, Credit Agricole Corporate and Investment Bank and SunTrust Bank, as co-documentation agents, and the lenders name therein. | 8-K | 001-36354 | 10.6 | 7/1/2014 | |||||||||||
10.9 | Employment Agreement with Jerry Winchester dated August 2014.* | 10-Q | 001-36354 | 10.8 | 8/5/2014 | |||||||||||
10.10 | Employment Agreement with Cary Baetz dated August 2014.* | 10-Q | 001-36354 | 10.9 | 8/5/2014 | |||||||||||
10.11 | First Amendment to Employment Agreement with Cary Baetz, made effective October 29, 2014.* | 10-Q | 001-36354 | 10.1 | 10/30/2014 | |||||||||||
10.12 | Employment Agreement with Karl Blanchard, made effective August 2014.* | 10-Q | 001-36354 | 10.10 | 8/5/2014 | |||||||||||
10.13 | First Amendment to Employment Agreement with Karl Blanchard, made effective October 29, 2014.* | 10-Q | 001-36354 | 10.2 | 10/30/2014 | |||||||||||
10.14 | Employment Agreement with James Minmier, made effective August 2014.* | 10-Q | 001-36354 | 10.11 | 8/5/2014 | |||||||||||
10.15 | First Amendment to Employment Agreement with James Minmier, made effective October 29, 2014.* | 10-Q | 001-36354 | 10.3 | 10/30/2014 | |||||||||||
10.16 | Employment Agreement with Bill Stanger, made effective August 2014.* | 10-Q | 001-36354 | 10.12 | 8/5/2014 | |||||||||||
10.17 | First Amendment to Employment Agreement with Bill Stanger, made effective October 29, 2014.* | 10-Q | 001-36354 | 10.4 | 10/30/2014 | |||||||||||
10.18 | Seventy Seven Energy Inc. 2014 Incentive Plan. | 8-K | 001-36354 | 10.8 | 7/1/2014 | |||||||||||
10.19 | Form of Restricted Stock Unit Replacement Agreement under 2014 Incentive Plan.* | 10-Q | 001-36354 | 10.13 | 8/5/2014 | |||||||||||
104
10.20 | Form of 2013 Restricted Stock Replacement Agreement under 2014 Incentive Plan.* | 10-Q | 001-36354 | 10.14 | 8/5/2014 | |||||||||||
10.21 | Form of 2003 Restricted Stock Replacement Agreement under 2014 Incentive Plan.* | 10-Q | 001-36354 | 10.15 | 8/5/2014 | |||||||||||
10.22 | Form of Director Restricted Stock Agreement under 2014 Incentive Plan. | 10-Q | 001-36354 | 10.16 | 8/5/2014 | |||||||||||
10.23 | Form of Employee Restricted Stock Agreement under 2014 Incentive Plan.* | 10-Q | 001-36354 | 10.17 | 8/5/2014 | |||||||||||
10.24 | 2014 Executive Performance Management Plan.* | X | ||||||||||||||
12.1 | Schedule of Computation of Ratio of Earnings to Fixed Charges. | X | ||||||||||||||
23.1 | Consent of PricewaterhouseCoopers LLP. | X | ||||||||||||||
31.1 | Certification of Chief Executive Officer pursuant to Rule 13(a)-14 and 15(d)-14 under the Securities Exchange Act of 1934. | X | ||||||||||||||
31.2 | Certification of Chief Financial Officer pursuant to Rule 13(a)-14 and 15(d)-14 under the Securities Exchange Act of 1934. | X | ||||||||||||||
32.1 | Certification of Chief Executive Officer pursuant to 18 U.S.C. Section 1350, as adopted pursuant to Section 906 of the Sarbanes-Oxley Act of 2002. | X | ||||||||||||||
32.2 | Certification of Chief Financial Officer pursuant to 18 U.S.C. Section 1350, as adopted pursuant to Section 906 of the Sarbanes-Oxley Act of 2002. | X | ||||||||||||||
101.1 | Interactive data files pursuant to Rule 405 of Regulation S-T. | † | ||||||||||||||
† | Pursuant to Rule 406T of Regulation S-T, interactive data files are deemed not filed or part of a registration statement or prospectus for purposes of sections 11 and 12 of the Securities Act of 1933, are deemed not filed for purposes of Section 18 of the Securities Exchange Act of 1934 and otherwise are not subject to any liability under those sections. |
* | Management contract or compensatory plan or arrangement. |
105
SIGNATURES
Pursuant to the requirements of Section 13 or 15(d) of the Securities Exchange Act of 1934, the registrant has duly caused this report to be signed on its behalf by the undersigned, thereunto duly authorized.
SEVENTY SEVEN ENERGY INC.
Date: March 2, 2015 By: /s/ Jerry Winchester
Jerry Winchester
Director, President and Chief Executive Officer
Pursuant to the requirements of the Securities Exchange Act of 1934, this report has been signed below by the following persons on behalf of the registrant and in the capacities and on the dates indicated.
Signature | Capacity | Date | ||
/s/ Jerry Winchester | Director, President and Chief Executive Officer (Principal Executive Officer) | March 2, 2015 | ||
Jerry Winchester | ||||
/s/ Cary Baetz | Chief Financial Officer and Treasurer (Principal Financial Officer and Principal Accounting Officer) | March 2, 2015 | ||
Cary Baetz | ||||
/s/ Edward J. DiPaolo | Chairman of the Board | March 2, 2015 | ||
Edward J. DiPaolo | ||||
/s/ Anne-Marie Ainsworth | Director | March 2, 2015 | ||
Anne-Marie Ainsworth | ||||
/s/ Bob G. Alexander | Director | March 2, 2015 | ||
Bob G. Alexander | ||||
/s/ Ronnie Irani | Director | March 2, 2015 | ||
Ronnie Irani | ||||
/s/ Alvin Bernard Krongard | Director | March 2, 2015 | ||
Alvin Bernard Krongard | ||||
/s/ Tucker Link | Director | March 2, 2015 | ||
Tucker Link | ||||
/s/ Marran H. Ogilvie | Director | March 2, 2015 | ||
Marran H. Ogilvie | ||||
106
INDEX TO EXHIBITS
Incorporated by Reference | ||||||||||||||||
Exhibit Number | Exhibit Description | Form | Commission File No. | Exhibit | Filing Date | Filed Herewith | Furnished Herewith | |||||||||
2.1 | Master Separation Agreement, dated as of June 25, 2014, by and between Chesapeake Oilfield Operating, L.L.C., and Chesapeake Energy Corporation. | 8-K | 001-36354 | 2.1 | 7/1/2014 | |||||||||||
3.1 | Certificate of Incorporation of Seventy Seven Energy Inc. | 8-K | 001-36354 | 3.1 | 7/1/2014 | |||||||||||
3.2 | Bylaws of Seventy Seven Energy Inc. | 8-K | 001-36354 | 3.2 | 7/1/2014 | |||||||||||
4.1 | Form of Common Stock Certificate of Seventy Seven Energy Inc. | 10-12B | 001-36354 | 4.1 | 6/13/2014 | |||||||||||
4.2 | Indenture dated June 26, 2014, by and between Chesapeake Oilfield Operating, L.L.C. and Wells Fargo Bank, National Association. | 8-K | 001-36354 | 4.2 | 7/1/2014 | |||||||||||
4.3 | Form of 6.5% Senior Note due 2022 (included in Exhibit 4.2). | |||||||||||||||
4.4 | Indenture, dated as of October 28, 2011, among Chesapeake Oilfield Operating, L.L.C., Chesapeake Oilfield Finance, Inc., the guarantors named therein and The Bank of New York Mellon Trust Company, N.A., as trustee. | S-4 | 333-187766 | 4.4 | 5/30/2013 | |||||||||||
4.5 | Form of 6.625% Senior Note due 2019 (included in Exhibit 4.4). | |||||||||||||||
4.6 | Supplemental Indenture, dated June 26, 2014, by and between Chesapeake Oilfield Operating, L.L.C., Chesapeake Oilfield Finance, Inc., Seventy Seven Operating LLC and The Bank of New York Mellon Trust Company, N.A., as trustee. | 8-K | 001-36354 | 4.1 | 7/1/2014 | |||||||||||
10.1 | Master Services Agreement, dated as of October 25, 2011, between COS Holdings, L.L.C. and Chesapeake Operating, Inc. | S-4 | 333-187766 | 10.1 | 5/30/2013 | |||||||||||
10.2 | Letter Agreement, dated June 25, 2014, to the Master Services Agreement, dated October 25, 2011, between Chesapeake Operating, L.L.C. and Chesapeake Oilfield Operating, L.L.C. | 10-Q | 001-36354 | 10.7 | 8/5/2014 | |||||||||||
10.3 | Tax Sharing Agreement, dated June 25, 2014, by and between Chesapeake Oilfield Operating, L.L.C. and Chesapeake Energy Corporation. | 8-K | 001-36354 | 10.1 | 7/1/2014 | |||||||||||
10.4 | Employee Matters Agreement, dated June 25, 2014, by and between Chesapeake Oilfield Operating, L.L.C. and Chesapeake Energy Corporation. | 8-K | 001-36354 | 10.2 | 7/1/2014 | |||||||||||
10.5 | Transition Services Agreement, dated as of June 25, 2014, by and between Chesapeake Oilfield Operating, L.L.C. and Chesapeake Energy Corporation. | 8-K | 001-36354 | 10.3 | 7/1/2014 | |||||||||||
10.6 | Services Agreement (hydraulic fracturing), dated June 25, 2014, by and between Performance Technologies, L.L.C. and Chesapeake Operating, Inc. | 8-K | 001-36354 | 10.4 | 7/1/2014 | |||||||||||
107
10.7 | Term Loan Credit Agreement dated June 25, 2014, by and among Chesapeake Oilfield Operating, L.L.C., Seventy Seven Operating LLC, as borrower, Bank of America, N.A., as administrative agent and the lenders name therein. | 8-K | 001-36354 | 10.5 | 7/1/2014 | |||||||||||
10.8 | ABL Credit Agreement, dated June 25, 2014, by and among Nomac Drilling, L.L.C., Performance Technologies, L.L.C., Great Plains Oilfield Rental, L.L.C., Hodges Trucking Company, L.L.C., and Oilfield Trucking Solutions, L.L.C., as borrowers, the guarantors named therein, Wells Fargo Bank, National Association and Bank of America, N.A., as joint lead arrangers and joint book runners, Bank of America, N.A., as syndication agent, Credit Agricole Corporate and Investment Bank and SunTrust Bank, as co-documentation agents, and the lenders name therein. | 8-K | 001-36354 | 10.6 | 7/1/2014 | |||||||||||
10.9 | Employment Agreement with Jerry Winchester dated August 2014.* | 10-Q | 001-36354 | 10.8 | 8/5/2014 | |||||||||||
10.10 | Employment Agreement with Cary Baetz dated August 2014.* | 10-Q | 001-36354 | 10.9 | 8/5/2014 | |||||||||||
10.11 | First Amendment to Employment Agreement with Cary Baetz, made effective October 29, 2014.* | 10-Q | 001-36354 | 10.1 | 10/30/2014 | |||||||||||
10.12 | Employment Agreement with Karl Blanchard, made effective August 2014.* | 10-Q | 001-36354 | 10.10 | 8/5/2014 | |||||||||||
10.13 | First Amendment to Employment Agreement with Karl Blanchard, made effective October 29, 2014.* | 10-Q | 001-36354 | 10.2 | 10/30/2014 | |||||||||||
10.14 | Employment Agreement with James Minmier, made effective August 2014.* | 10-Q | 001-36354 | 10.11 | 8/5/2014 | |||||||||||
10.15 | First Amendment to Employment Agreement with James Minmier, made effective October 29, 2014.* | 10-Q | 001-36354 | 10.3 | 10/30/2014 | |||||||||||
10.16 | Employment Agreement with Bill Stanger, made effective August 2014.* | 10-Q | 001-36354 | 10.12 | 8/5/2014 | |||||||||||
10.17 | First Amendment to Employment Agreement with Bill Stanger, made effective October 29, 2014.* | 10-Q | 001-36354 | 10.4 | 10/30/2014 | |||||||||||
10.18 | Seventy Seven Energy Inc. 2014 Incentive Plan. | 8-K | 001-36354 | 10.8 | 7/1/2014 | |||||||||||
10.19 | Form of Restricted Stock Unit Replacement Agreement under 2014 Incentive Plan.* | 10-Q | 001-36354 | 10.13 | 8/5/2014 | |||||||||||
10.20 | Form of 2013 Restricted Stock Replacement Agreement under 2014 Incentive Plan.* | 10-Q | 001-36354 | 10.14 | 8/5/2014 | |||||||||||
10.21 | Form of 2003 Restricted Stock Replacement Agreement under 2014 Incentive Plan.* | 10-Q | 001-36354 | 10.15 | 8/5/2014 | |||||||||||
10.22 | Form of Director Restricted Stock Agreement under 2014 Incentive Plan. | 10-Q | 001-36354 | 10.16 | 8/5/2014 | |||||||||||
108
10.23 | Form of Employee Restricted Stock Agreement under 2014 Incentive Plan.* | 10-Q | 001-36354 | 10.17 | 8/5/2014 | |||||||||||
10.24 | 2014 Executive Performance Management Plan.* | X | ||||||||||||||
12.1 | Schedule of Computation of Ratio of Earnings to Fixed Charges. | X | ||||||||||||||
23.1 | Consent of PricewaterhouseCoopers LLP. | X | ||||||||||||||
31.1 | Certification of Chief Executive Officer pursuant to Rule 13(a)-14 and 15(d)-14 under the Securities Exchange Act of 1934. | X | ||||||||||||||
31.2 | Certification of Chief Financial Officer pursuant to Rule 13(a)-14 and 15(d)-14 under the Securities Exchange Act of 1934. | X | ||||||||||||||
32.1 | Certification of Chief Executive Officer pursuant to 18 U.S.C. Section 1350, as adopted pursuant to Section 906 of the Sarbanes-Oxley Act of 2002. | X | ||||||||||||||
32.2 | Certification of Chief Financial Officer pursuant to 18 U.S.C. Section 1350, as adopted pursuant to Section 906 of the Sarbanes-Oxley Act of 2002. | X | ||||||||||||||
101.1 | Interactive data files pursuant to Rule 405 of Regulation S-T. | † | ||||||||||||||
† | Pursuant to Rule 406T of Regulation S-T, interactive data files are deemed not filed or part of a registration statement or prospectus for purposes of sections 11 and 12 of the Securities Act of 1933, are deemed not filed for purposes of Section 18 of the Securities Exchange Act of 1934 and otherwise are not subject to any liability under those sections. |
* | Management contract or compensatory plan or arrangement. |
109