Attached files
| file | filename |
|---|---|
| 8-K - FORM 8-K - PUBLIC SERVICE ENTERPRISE GROUP INC | d879750d8k.htm |
 We have the
energy
to make things better
…
for you, for our investors
and for our stakeholders.
EXHIBIT 99 |
 2
Forward-Looking Statement
All
of
the
forward-looking
statements
made
in
this
report
are
qualified
by
these
cautionary
statements
and
we
cannot
assure
you
that
the
results
or
developments
anticipated
by
management
will
be
realized
or
even
if
realized,
will
have
the
expected
consequences
to,
or
effects
on,
us
or
our
business
prospects,
financial
condition
or
results
of
operations.
Readers
are
cautioned
not
to
place
undue
reliance
on
these
forward-looking
statements
in
making
any
investment
decision.
Forward-looking
statements
made
in
this
report
apply
only
as
of
the
date
of
this
report.
While
we
may
elect
to
update
forward-looking
statements
from
time
to
time,
we
specifically
disclaim
any
obligation
to
do
so,
even
if
internal
estimates
change,
unless
otherwise
required
by
applicable
securities
laws.
The
forward-looking
statements
contained
in
this
report
are
intended
to
qualify
for
the
safe
harbor
provisions
of
Section
27A
of
the
Securities
Act
of
1933,
as
amended,
and
Section
21E
of
the
Securities
Exchange
Act
of
1934,
as
amended.
Certain
of
the
matters
discussed
in
this
report
about
our
and
our
subsidiaries‘
future
performance,
including,
without
limitation,
future
revenues,
earnings,
strategies,
prospects,
consequences
and
all
other
statements
that
are
not
purely
historical
constitute
“forward-looking
statements”
within
the
meaning
of
the
Private
Securities
Litigation
Reform
Act
of
1995.
Such
forward-looking
statements
are
subject
to
risks
and
uncertainties,which
could
cause
actual
results
to
differ
materially
from
those
anticipated.
Such
statements
are
based
on
management’s
beliefs
as
well
as
assumptions
made
by
and
information
currently
available
to
management.
When
used
herein,
the
words
“anticipate,”
“intend,”
“estimate,”
“believe,”
“expect,”
“plan,”
“should,”
“hypothetical,”
“potential,”
“forecast,”
“project,”
variations
of
such
words
and
similar
expressions
are
intended
to
identify
forward-looking
statements.
Factors
that
may
cause
actual
results
to
differ
are
often
presented
with
the
forward-looking
statements
themselves.
Other
factors
that
could
cause
actual
results
to
differ
materially
from
those
contemplated
in
any
forward-looking
statements
made
by
us
herein
are
discussed
in
filings
we
make
with
the
United
States
Securities
and
Exchange
Commission
(SEC),
including
our
Annual
Report
on
Form
10-K
and
subsequent
reports
on
Form
10-Q
and
Form
8-K
and
available
on
our
website:
http://www.pseg.com.
These
factors
include,
but
are
not
limited
to:
•
adverse
changes
in
the
demand
for
or
the
price
of
the
capacity
and
energy
that
we
sell
into
wholesale
electricity
markets,
•
adverse changes in energy industry law, policies and regulation,
including market structures and transmission planning,
•
any
inability
of
our
transmission
and
distribution
businesses
to
obtain
adequate
and
timely
rate
relief
and
regulatory
approvals
from
federal
and
state
regulators,
•
changes
in
federal
and
state
environmental
regulations
and
enforcement
that
could
increase
our
costs
or
limit
our
operations,
•
changes
in
nuclear
regulation
and/or
general
developments
in
the
nuclear
power
industry,
including
various
impacts
from
any
accidents
or
incidents
experienced
at
our
facilities
or
by
others
in
the
industry,
that
could
limit
operations
of
our
nuclear
generating
units,
•
actions
or
activities
at
one
of
our
nuclear
units
located
on
a
multi-unit
site
that
might
adversely
affect
our
ability
to
continue
to
operate
that
unit
or
other
units
located
at
the
same
site,
•
any
inability
to
manage
our
energy
obligations,
available
supply
and
risks,
•
adverse
outcomes
of
any
legal,
regulatory
or
other
proceeding,
settlement,
investigation
or
claim
applicable
to
us
and/or
the
energy
industry,
•
any
deterioration
in
our
credit
quality
or
the
credit
quality
of
our
counterparties,
•
availability
of
capital
and
credit
at
commercially
reasonable
terms
and
conditions
and
our
ability
to
meet
cash
needs,
•
changes
in
the
cost
of,
or
interruption
in
the
supply
of,
fuel
and
other
commodities
necessary
to
the
operation
of
our
generating
units,
•
delays
in
receipt
of
necessary
permits
and
approvals
for
our
construction
and
development
activities,
•
delays
or
unforeseen
cost
escalations
in
our
construction
and
development
activities,
•
any inability to achieve, or continue to sustain, our expected levels of operating
performance, •
any
equipment
failures,
accidents,
severe
weather
events
or
other
incidents
that
impact
our
ability
to
provide
safe
and
reliable
service
to
our
customers,
and
any
inability
to
obtain
sufficient
insurance
coverage
or
recover
proceeds
of
insurance
with
respect
to
such
events,
•
acts
of
terrorism,
cybersecurity
attacks
or
intrusions
that
could
adversely
impact
our
businesses,
•
increases
in
competition
in
energy
supply
markets
as
well
as
for
transmission
projects,
•
any
inability
to
realize
anticipated
tax
benefits
or
retain
tax
credits,
•
challenges
associated
with
recruitment
and/or
retention
of
a
qualified
workforce,
•
adverse
performance
of
our
decommissioning
and
defined
benefit
plan
trust
fund
investments
and
changes
in
funding
requirements,
•
changes
in
technology,
such
as
distributed
generation
and
micro
grids,
and
greater
reliance
on
these
technologies,
and
•
changes
in
customer
behaviors,
including
increases
in
energy
efficiency,
net-metering
and
demand
response. |
 3
GAAP Disclaimer
These materials and other financial releases can be found on the
pseg.com
website under the investor tab, or at http://investor.pseg.com/
PSEG presents Operating Earnings in addition to its Net Income reported in
accordance with accounting principles generally accepted in the United
States (GAAP). Operating Earnings is a non-GAAP financial measure
that differs from Net Income because it excludes gains or losses
associated with Nuclear Decommissioning Trust (NDT),
Mark-to-Market (MTM) accounting, and other material one-time
items. PSEG presents Operating Earnings because management believes that
it is appropriate for investors to consider results excluding these
items in addition to the results reported in accordance with GAAP. PSEG
believes that the non-GAAP financial measure of Operating Earnings
provides a consistent and comparable measure of performance of its
businesses to help shareholders understand performance trends. This
information is not
intended to be viewed as an alternative to GAAP information.
The last slide in this presentation includes a list of items excluded from Net
Income to reconcile to Operating Earnings, with a reference to those
slides included on each of the slides where the non-GAAP information
appears. |
 4
2015 PSEG Conference Agenda
Presentation
Presenter
Welcome and Introductions
Kathleen Lally
PSEG
Ralph Izzo
PSE&G
Ralph LaRossa
Q&A Session
Break
PSEG Power
William Levis
Power ER&T
Shahid Malik
Q&A Session
Financial Review & Outlook
Caroline Dorsa
Summary and Q&A
Conference Conclusion |
 STRATEGY –
DELIVERING GROWTH
CHAIRMAN,
PRESIDENT
AND
CHIEF
EXECUTIVE
OFFICER
Ralph Izzo |
 6
Operational
Excellence:
Maintaining
reliability and improving performance as we
control costs in low price environment
Financial
Strength:
Strong
financial
position
supports investment program and dividend
growth
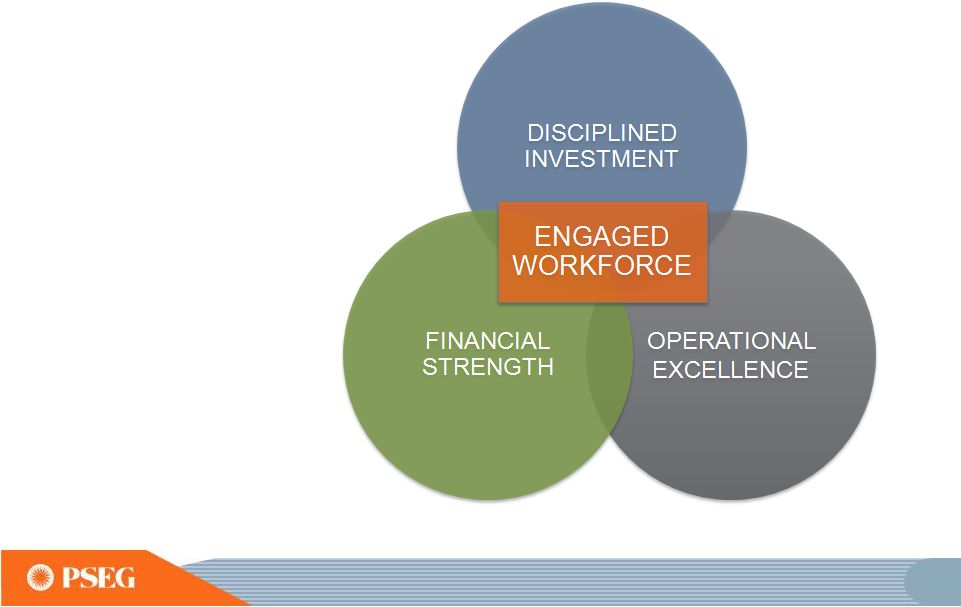
Disciplined Investment:
Results
PSEG’s Strategy
Investment program delivering results
•
Transformed business mix
•
Robust pipeline of opportunities
•
Project
3
rd
year
of
EPS
growth
•
Increased rate of dividend growth
•
Best in class utility growth rate
•
Stable business mix with upside
potential from power markets
DISCIPLINED
INVESTMENT
OPERATIONAL
EXCELLENCE
FINANCIAL
STRENGTH
ENGAGED
WORKFORCE |
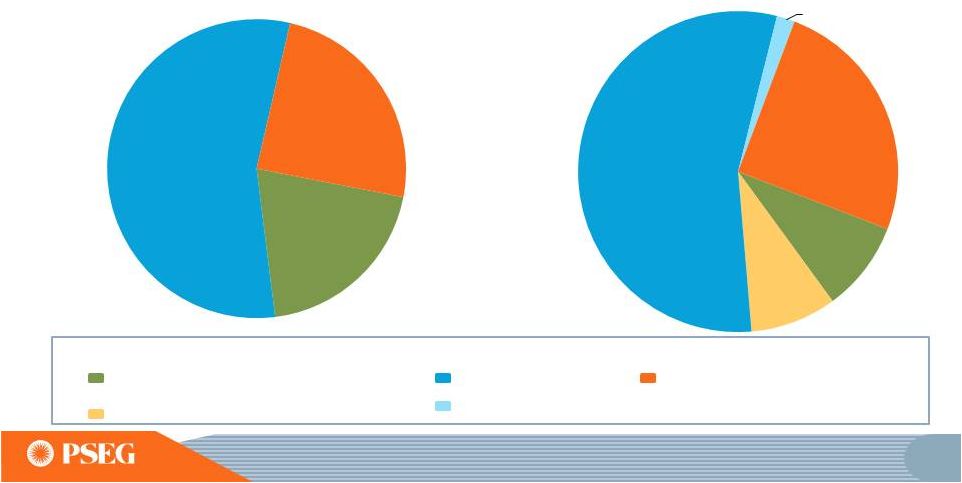
 7
Two complementary businesses
A stable platform, each with growth opportunities
Strategy:
Diverse
(fuel
and
dispatch)
fleet
geographically
and
environmentally
well
positioned,
with
investments
to
enhance
competitiveness
Value
Proposition:
Provides
substantial
free
cash
flow
in
current
environment
and
upside
from
market
rule
improvements
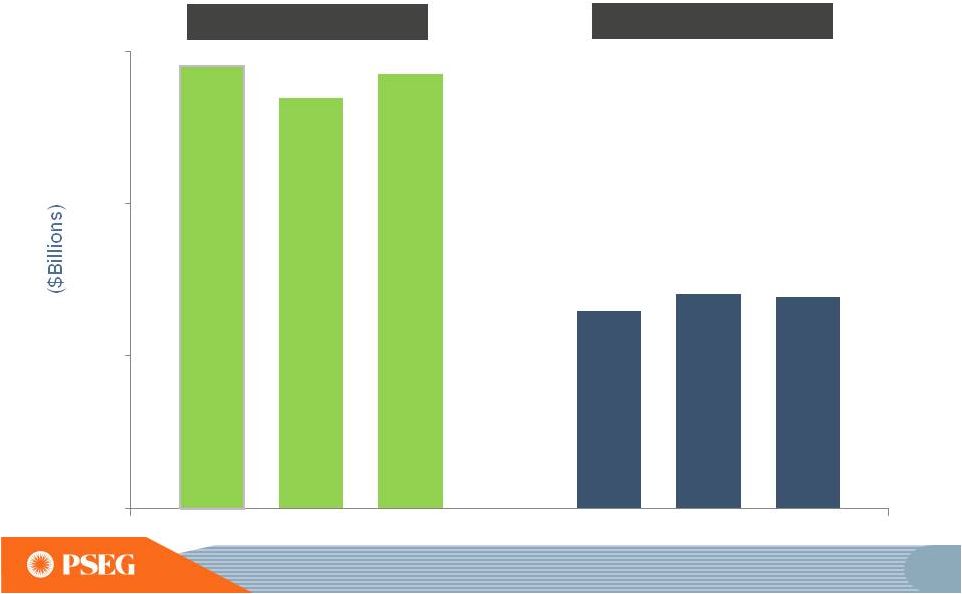
Assets $12B
Operating Earnings $642M
Regional Competitive Generation
Strategy:
Investments
aligned
with
public
policy and customer needs
Value
Proposition:
An
$11
billion
infrastructure
program
–
focused
on
transmission
–
produces
double-digit
rate
base
growth
through
2019
Assets $22B
Operating Earnings $725M
Electric & Gas Delivery
and Transmission
2014
2014
ASSETS AND OPERATING EARNINGS ARE FOR THE YEAR ENDED 12/31/2014.
PSE&G AND POWER DO NOT ADD TO TOTAL DUE TO PARENT AND PSEG LONG ISLAND
ACTIVITY. SEE SLIDE A FOR ITEMS EXCLUDED FROM INCOME FROM CONTINUING
OPERATIONS/NET INCOME TO RECONCILE TO OPERATING EARNINGS.
|
 8
Delivering on commitments and realizing growth
Operational
Excellence
•
PSE&G: Mid-Atlantic Reliability Award (13
th
consecutive year), top ranked
among eastern electric and gas utilities in business customer
satisfaction •
PSEG Power: Record output from combined cycle units
•
PSEG Long Island: Demonstrated management and integration capability
through a successful transition in first year
•
PSEG: Cost-control benefits continue
Financial
Strength
•
Earnings performance exceeded guidance
•
Cash flows and business mix support strong credit ratings and ability to fully
fund robust investment pipeline without issuing new equity
•
Increased rate of dividend growth in 2015
Disciplined
Investment
•
PSE&G
Transmission capital program execution and growth
Energy Strong infrastructure program underway
Energy efficiency program extension
Further growth planned –
Gas System Modernization Program
•
Power: Unit uprates, PennEast Pipeline, Solar Source
|
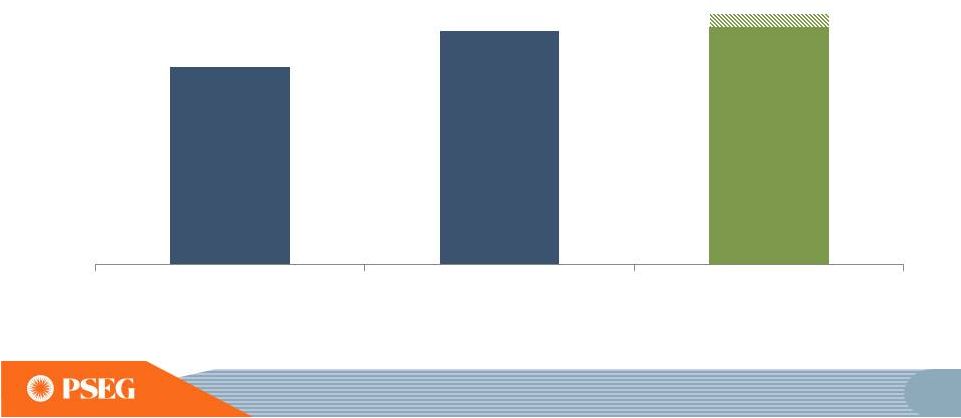
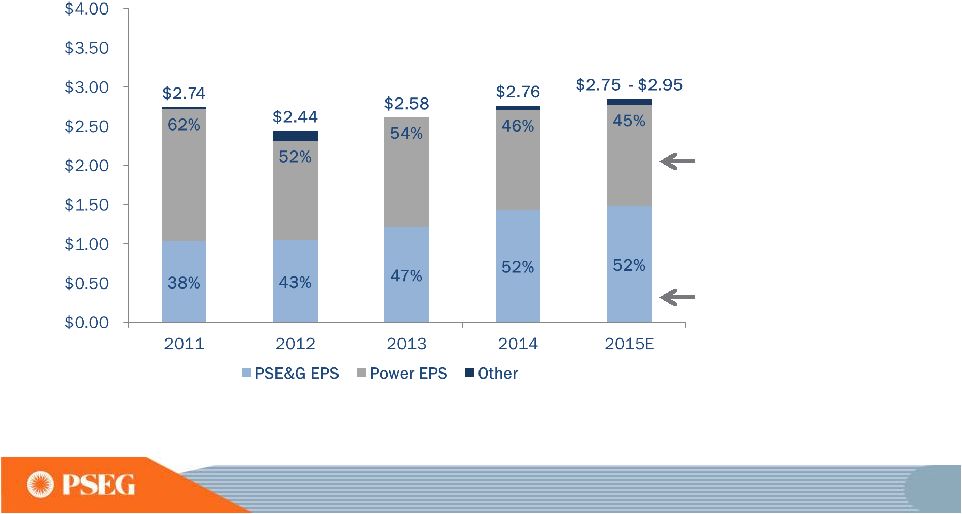 9
**
**
Operating Earnings
Disciplined investment program and focus on operational
excellence have supported growth
Power’s
diverse fuel
mix and dispatch
flexibility continue to
generate strong
earnings and free cash
flow in low price
environment
PSE&G’s
investment
program has driven
double digit compound
annual earnings
growth since 2010
Operating Earnings* Contribution by Subsidiary
*SEE SLIDE A FOR ITEMS EXCLUDED FROM INCOME FROM
CONTINUING OPERATIONS/ NET INCOME TO RECONCILE TO OPERATING
EARNINGS. E=ESTIMATE ** 2015 PERCENTS USE MIDPOINT OF EARNINGS
GUIDANCE. |
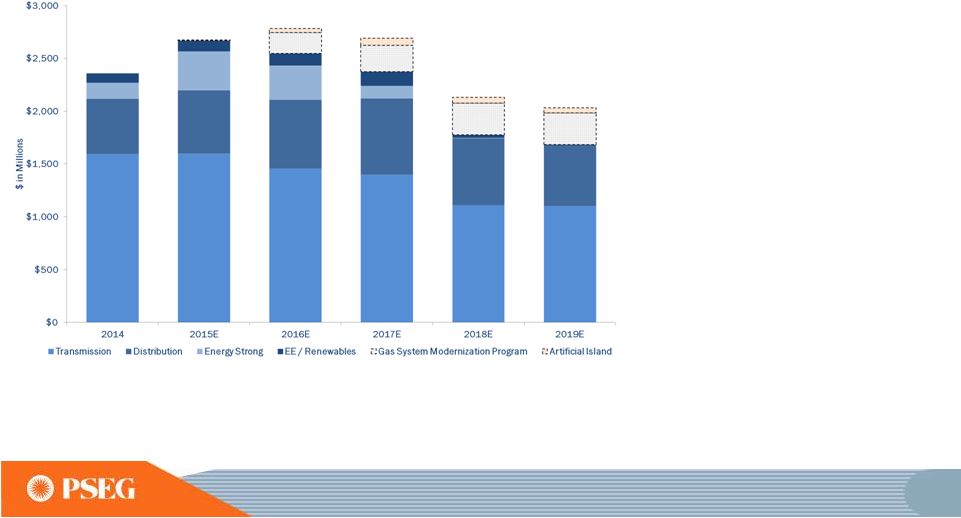
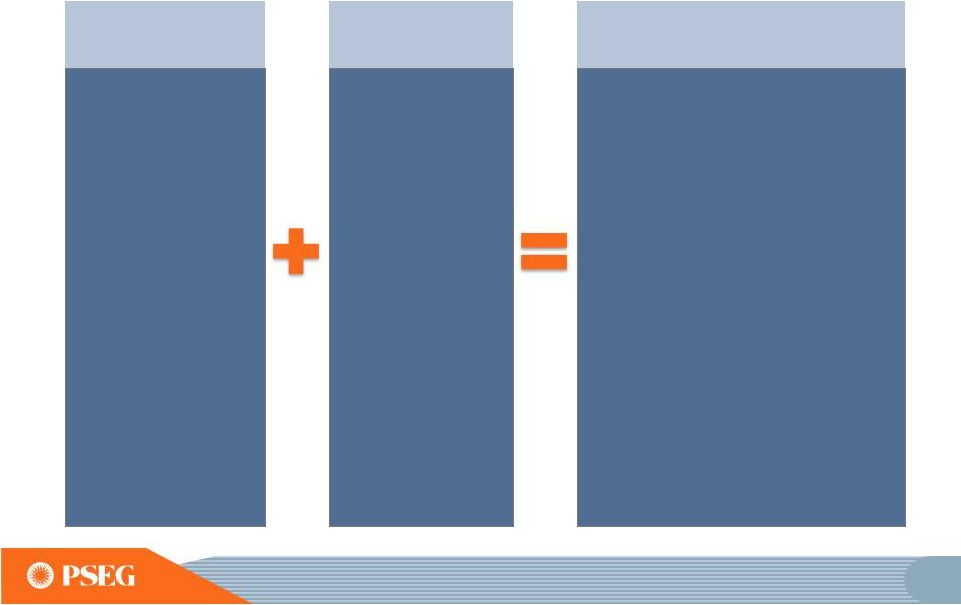
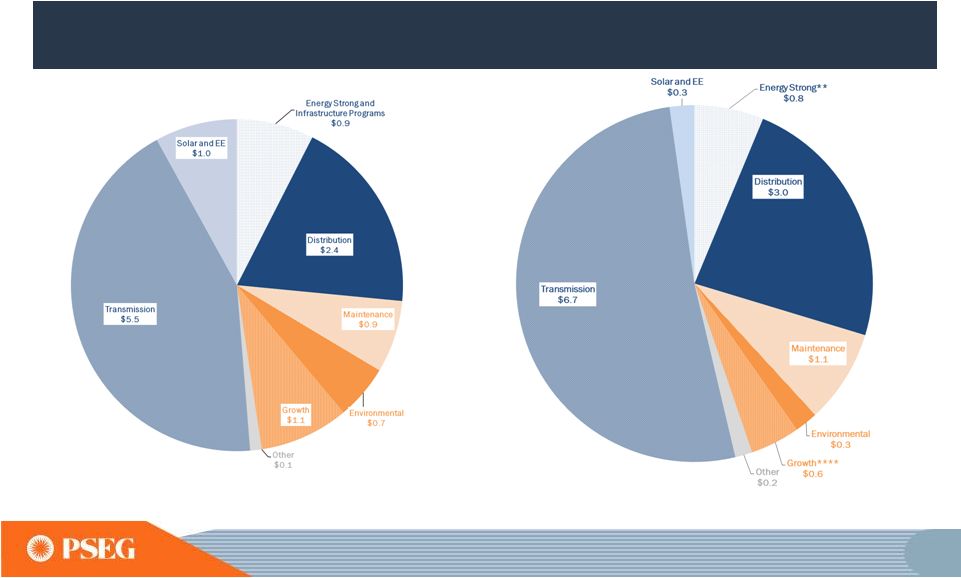 10
Robust pipeline of investment opportunities
supports growth objectives
2015E -
2019E*: $13 Billion
2010 –
2014: $12.6 Billion
Power Total***
$2.7B
PSE&G Total
$9.8B
PSE&G Total
$10.8B
PSEG Capital Spending
Power Total***
$2.0B
2015E–2019E:
•
$1.3B of capital for Gas System Modernization Program and Artificial Island
would be incremental *INCLUDES ALL PLANNED SPENDING. **ENERGY STRONG
EXCLUDES RISK AND CONTINGENCY. ***POWER CAPITAL SPENDING EXCLUDES
NUCLEAR FUEL. ****INCLUDES PENNEAST PIPELINE EQUITY INVESTMENT OF
$0.1B. E=ESTIMATE. DATA AS OF MARCH 2, 2015. |
 11
Balance sheet strength supports capital
allocation
Timeframe
Actions taken
2010 –
2014:
Transformed
business mix
•
Applied $16 billion towards investments and dividends
•
Improved credit ratings
•
Monetized Energy Holdings’
portfolio
•
Strong balance sheet sustained during period of low power
prices, while increasing the dividend
2015 –
Forward:
Strong financial
position supports
continued growth
•
Increased rate of dividend growth in 2015
•
$13 billion investment program through 2019
•
Gas System Modernization Program and Artificial Island
increase capital program by $1.3 billion through 2019
•
Financial capability supports further expansion of the
current capital plan |
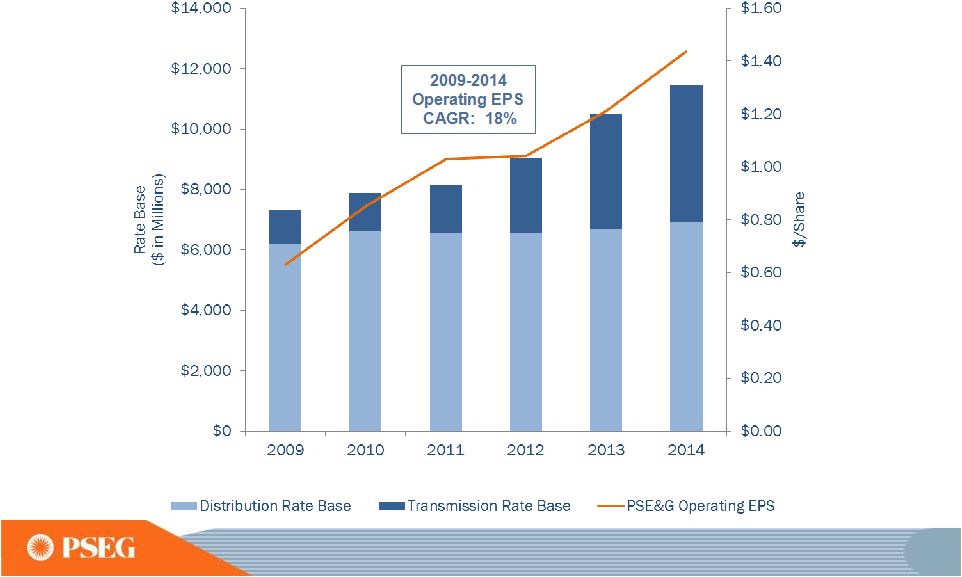 12
PSE&G’s investment program
Meeting public policy goals and customer needs
PSE&G Rate Base and Operating Earnings*
*SEE SLIDE A FOR ITEMS EXCLUDED FROM INCOME FROM
CONTINUING OPERATIONS/ NET INCOME TO RECONCILE TO OPERATING EARNINGS.
|
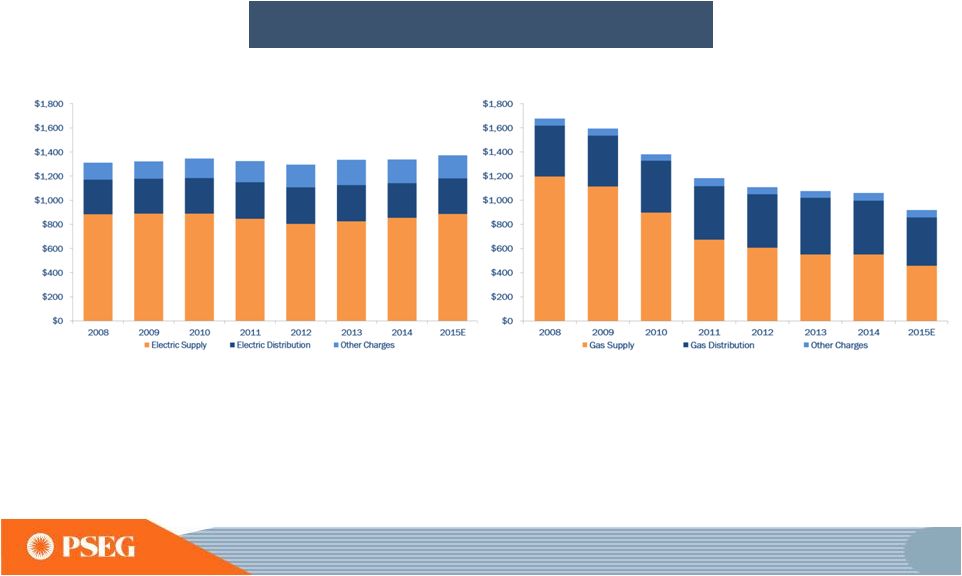 13
Containing customer bills while investing
in the system
•
PSE&G customers’
combined electric and gas bills declined 23% over the period.
•
Low gas prices drove rate decreases; in addition, gas customers received
bill credits of ~$400 in total from 2012 through 2014.
Gas
Electric
PSE&G Typical Residential Customer Bills*
*FOR ALL YEARS THE BILLING ASSUMES 7,200 KWH FOR ELECTRIC AND 1,010 THERMS FOR
GAS ANNUALLY. E = ESTIMATE |
 14
PSE&G Planned and Potential Capital Projects
•
Planned capital spending
expected to drive double digit
rate base growth and high
single digit EPS growth
through 2017
•
Transmission expected to
grow to >50% of rate base in
2019
•
Gas System Modernization
Program and Artificial Island
investments would be
incremental
•
Seeking to broaden platform
to expand energy efficiency
and other investments
PSE&G’s
robust capital investment pipeline
E=ESTIMATE |
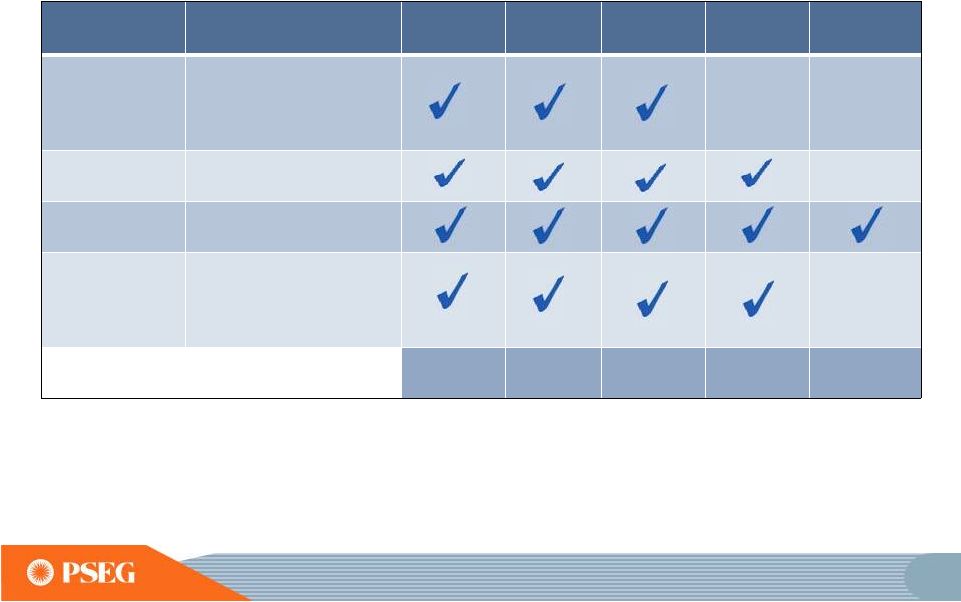 15
Economic
Drivers
Outlook
Combined
Cycle
Nuclear
Scrubbed
Coal
Peakers
Renewable
Energy Margins
•
Low natural gas and
energy prices
•
Robust portfolio of gas
pipeline contracts
n/a
n/a
Capacity
Markets
•
Tightened rules proposed
for capacity performance
n/a
Environmental
Regulations
•
Tighter air emissions
standards
Location
•
Assets in well-designed
markets, premium regions
•
Opportunities on
brownfield sites
n/a
PSEG Power Capacity (GW)
Total 13 GW
3.2
3.6
2.4
3.7
0.1
Power’s fleet has the desired attributes to be
successful in today’s and tomorrow’s market
•
Largest
nuclear
site
in
the
eastern
U.S.
and
ownership
in
large,
fully
scrubbed
coal
facilities
at
Keystone
and
Conemaugh
provide
economies
of
scale
that
enhance
energy
margins
in
current
low
market,
and
provide
for
upside
potential
if
prices
improve.
•
Dual
fuel
peakers
meet
reliability
criteria
in
capacity
markets
and
provide
option
value
in
energy
market.
Opportunity
exists
to
repower
peakers
that
do
not
meet
NJ
HEDD
environmental
regulations. |
 16
Power
–
Growing
value
by
improving
market
rules
and
developing
investment
opportunities
Value Source
Opportunities and Actions Taken
Improving rules
will better
recognize
value of our
fleet
•
PJM’s Capacity market –
2014 limits on demand response and
2015 Capacity Performance proposal
•
Demand response treatment at U.S. Courts / FERC
•
Energy price formation at FERC
•
Increasing air standards through Federal and State regulations
Our footprint
provides
growth
opportunities
•
Nuclear and Combined Cycle plant uprates are underway
•
Brownfield expansions at existing sites
New peakers built at New Haven and Kearny sites
Continue to explore further opportunities
•
PennEast pipeline -
equity investment and gas portfolio enhancement
•
Solar Source owns ~123 MW*, with significant project pipeline
•
Continue to seek opportunities to expand the fleet
*PROJECT SIZE IN MEGAWATTS SHOWN IN DC (DIRECT CURRENT), AC EQUIVALENT IS 96
MW. |
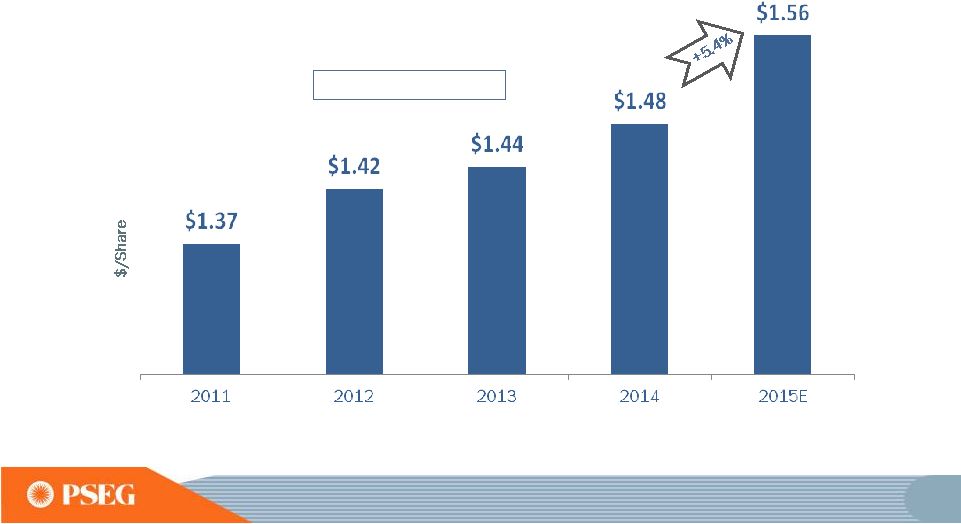 17
PSEG Annual Dividend
An increased dividend growth rate with potential for consistent and
sustainable growth given our business mix and financial position
Payout
Ratio
50%
58%
56%
54%
55%*
PSEG Annual Dividend Rate
2011-2014 CAGR: 2.6%
*2015E PAYOUT RATIO REFLECTS THE MIDPOINT OF OPERATING EARNINGS GUIDANCE.
E=ESTIMATE |
 18
Focus areas over business plan horizon
PSE&G
•
Capital
program
execution
–
Transmission,
Energy
Strong
and
additional
programs
•
Operational excellence and cost control
•
Regulatory framework
•
Continue to develop incremental growth opportunities
PSEG Power
•
Operational excellence and cost control
•
Strong
performance
at
Nuclear
and
Fossil
to
maximize
fleet
value
in
dynamic
markets
•
Monitor
and
shape
market
rules
-
Capacity
markets
and
environmental
regulations
•
Develop growth opportunities
PSEG Long Island
•
Continue
execution
–
Integration and achievement of performance metrics
|
 19
PSEG’s Value Proposition
•
A stable platform with predictable earnings and a robust
investment pipeline
•
PSE&G -
Best in class utility performance and growth profile
•
PSEG
Power
-
Well-positioned
fleet
that
generates
substantial
free
cash
flow
in
this
market
environment
with
upside
for
improvements
in
pricing
•
Strong
balance
sheet
-
Supports
strong
credit
rating,
growth
objectives
and
the
potential
for
sustainable
dividend
growth |
 We have the
energy
to make things better
…
for you, for our investors
and for our stakeholders. |
 PSE&G
PRESIDENT
AND
CHIEF
OPERATING
OFFICER
Ralph LaRossa |
 22
PSE&G
strategy
Building a
sustainable
platform that
balances
reliability,
customer rates
and public
policy to ensure
growth at
reasonable
returns |
 23
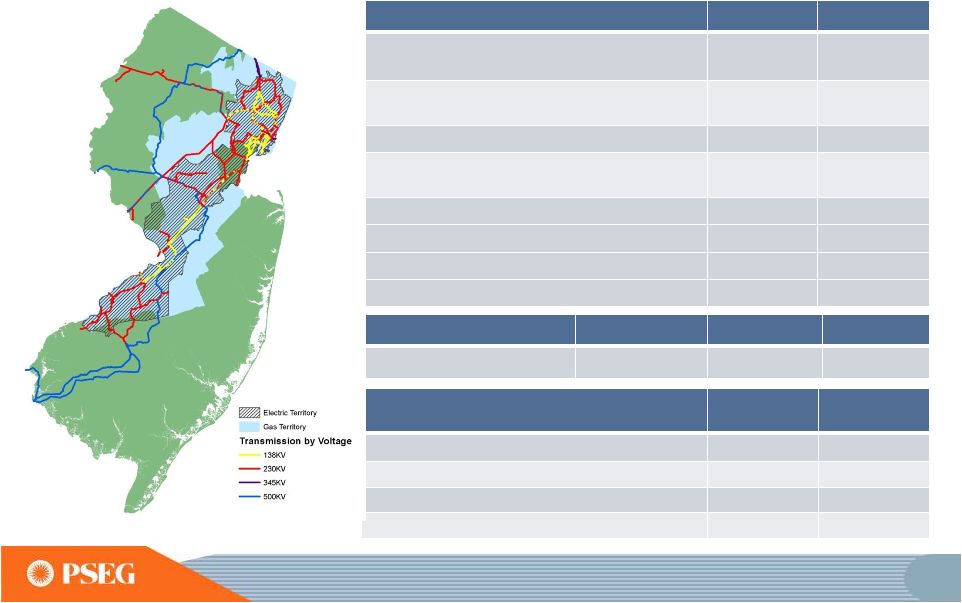
PSE&G is the largest electric and gas distribution and
transmission utility company in New Jersey
* GAS FIRM ONLY SALES.
** ESTIMATED ANNUAL GROWTH PER YEAR, ASSUMES NORMAL WEATHER.
*** SOME PROJECTS APPROVED FOR SPECIFIC ROE.
Electric
Gas
Customers
Growth (2010 –
2014)
2.2 Million
0.3%
1.8 Million
0.3%
2014 Electric Sales and Gas Sold and Transported
40,737 GWh
2,628M
Therms*
Projected Annual Load Growth (2015 –
2017)**
1.1%
0.5%
Projected Annual Load Growth
Transmission (2015 –
2017)
0.9%
Sales Mix
Residential
32%
60%
Commercial
58%
36%
Industrial
10%
4%
Transmission
Electric
Gas
Approved Rate of Return***
11.68% ROE
10.3% ROE
10.3% ROE
Renewables and Energy Efficiency
Approved Programs
2009-2014
Total
Program Plan
Solar Loan Capacity
83 MW
178.5 MW
Solar 4 All Capacity
100 MW
125 MW
Energy Efficiency Annual Electric savings
206 GWh
214 GWh
Energy Efficiency Annual Gas savings
6.5 M Therms
7 M Therms |
 24
Mid-Atlantic
ReliabilityOne
award winner
for 13
years in
a row |
 25
PSE&G’s
service and
reliability is
being
recognized by
customers |
 26
PSE&G has achieved annual growth in
operating earnings of ~18% over the past five years
with implementation of supportive rate mechanisms on our
expanded capital program and cost control
*SEE SLIDE A FOR ITEMS EXCLUDED FROM INCOME FROM
CONTINUING OPERATIONS/NET INCOME TO RECONCILE TO OPERATING EARNINGS.
PSE&G’s Contribution to
PSEG Operating Earnings* Per Share |
 27
PSE&G plans to invest $10.8B over the
next five years
PSE&G’s Capital Expenditures*
*INCLUDES AFUDC.
E=ESTIMATE. |
 28
PSE&G’s existing major Transmission
projects are being completed on schedule and on budget
Major Transmission Investments
Project Roster
Approved
ROE
Inclusion
of CWIP in
Rate Base
100%
Recovery
of Costs
Due to
Abandonment
Estimate
Up To
($ Millions)
Expected
In-service
Date
Susquehanna-Roseland
12.93%
$790
June 2014
-June 2015
Northeast Grid Reliability
11.93%
$907
June-Dec
2015
North Central Reliability
11.68%
$390
Completed
Burlington–Camden 230kV
11.68%
$399
Completed
Mickleton–Gloucester–Camden
230kV
11.68%
$435
June 2015 |
 29
A robust pipeline of Transmission
investments focus on reliability improvements and replacement
of aging infrastructure
Major Transmission Investments
Project Roster
Approved
ROE
Program Description
Estimate
Up To
($ Millions)
Expected
In-service
Date
Bergen—Linden Corridor 345kV
11.68%
PJM baseline project
receiving CWIP in rate base
treatment
$1,200
June
2018
PJM Regional Transmission
Expansion Plan (RTEP) –
multiple
projects
11.68%
PJM mandated system
reliability projects
$1,900
Various
69kV Upgrade –
multiple projects
11.68%
Upgrade of 26kV to 69kV
$1,500
Various
Transmission Lifecycle –
multiple
projects
11.68%
Replacement of aging
infrastructure
$1,100
Various
Transmission Hardening–
multiple projects
11.68%
Reliability projects focused
on system resiliency
$650
Various
*INCREMENTAL INVESTMENT IN HARDENING INCLUDED AS PART OF
OTHER PROGRAMS. |
 30
Bergen-Linden Corridor is a project which will
provide a double-circuit 345kV line designed to maintain
system reliability
Project Estimate
Up To
Through Year-end
2014
Expected
Completion Date
$1,200M
$40M
June 2018
•
PJM RTEP project b2436 and b2437 with phased in-
service dates
•
30 miles of underground cable
•
New ~ 23 miles
•
Reconductor (Upgrade of 138 to 345) ~7 miles
•
13 miles of double circuit overhead conductor (replacing
double circuit 138 with double circuit 345)
•
11 station upgrades to 345kV
Customer Benefit: Addresses thermal and short-circuit
reliability
Project Status: Engineering, Licensing and Construction
Marion Substation Pile Installation |
 31
Major Transmission programs focus on
reliability and replacing aging infrastructure
•
PJM’s Regional Transmission Expansion Plan (RTEP) identifies system
enhancements needed for reliability
•
69kV system upgrades improve system reliability and provide capacity
for future growth
•
Transmission Lifecycle is an ongoing program to manage transmission
asset life to maintain and improve system integrity and reliability
•
Transmission Hardening projects focus on increasing system resiliency
|
 32
PSE&G has successfully worked with
regulators to develop multiple solutions for New Jersey’s energy and economic
development goals •
Solar Loan I
–
2008
•
Solar Loan II
–
2009
•
Solar 4 All
–
2009
•
Solar Loan III
–
2013
•
Solar 4 All Ext
–
2013
RENEWABLES
creative solutions to install
solar generation
•
Carbon Abatement
–
2008
•
Demand Response
–
2009
•
Energy Efficiency (EE) –
2009
•
EE Extension
–
2011
•
EE Extension II
–
2015
ENERGY EFFICIENCY
assisting customers with
controlling energy usage
•
NJ Capital Infrastructure
Program 1 (CIP 1)
–
2009
•
NJ Capital Infrastructure
Program 2 (CIP 2)
–
2011
•
Energy Strong
–
2014
DISTRIBUTION
improving electric and gas
delivery infrastructure
* IF APPROVED.
To date we have
invested over $2B in
the above programs
Over $1B
ahead in
Energy Strong, Energy
Efficiency Ext II*
and
Solar programs
Gas System
Modernization Program
would increase
potential investment by
~$1.6B |
 33
PSE&G is successfully executing on
Energy Strong
with ~$150M deployed during the
latter half of 2014
Program
Approved
Spend thru 2014
Flood Mitigation
$620M
$19M
Electric Contingency Reconfiguration
$100M
$26M
Electric Advanced Technology
$100M
$10M
Gas Utilization Pressure Cast Iron (UPCI)
$350M
$94M
Gas Metering & Regulating (M&R)
$50M
$1M
TOTAL
$1,220M
$150M
33 |
 34
Energy Strong will provide
increased reliability
and resiliency
•
Electric Flood Mitigation
•
Engineering and scheduling began on 16 of the 29 total planned substation
projects
•
Electric Contingency Reconfiguration
•
Over 100 projects have been started and 15 projects have been completed to
date, including installation of over 900 poles and 70 reclosers
•
Advanced Technology
•
A total of 60 relays replaced and 3 remote terminal unit (RTU) has been
installed •
Gas Utilization Pressure Cast Iron (UPCI)
•
Installed ~110 miles of gas main and replaced ~5,300 services
•
Gas Metering & Regulating (M&R)
•
Design and engineering completed for all of the eight stations scheduled
|
 35
Extension of PSE&G’s award winning
Energy Efficiency program
•
Energy Efficiency Extension II seeks to extend the investment and time
frame for three previously approved programs already in the marketplace
allowing PSE&G to factor in lessons learned and balance policy
issues •
$95M of rate base investment
•
If approved, would extend existing programs, two of which have sizable
waiting lists:
•
Hospitals
•
Multifamily
•
Direct install –
government, non-profit, and small business
•
Would allow PSE&G to leverage past investments in people, capabilities,
systems and processes |
 36
Gas System Modernization Program
of
~$1.6B focusing on aging gas mains
•
PSE&G’s gas distribution system currently operates and maintains over
4,800
miles
of
cast
iron
and
unprotected
steel
main,
the
largest
such
system in any single state
•
The program provides for investment of ~$1.6B focused on replacing cast
iron and unprotected steel main over a five-year period, beginning
mid- 2016
•
Program will replace approximately 160 miles of main per year
•
Requested accelerated clause-based recovery similar to the Energy Strong
program with a 9.75% ROE
•
This program is the first phase of a long-term replacement strategy
•
30-year cast iron and unprotected steel replacement program
•
Benefits:
•
Methane emission reduction is estimated at 24,500 metric tons of
CO
2
equivalent per year*
•
Higher pressure system allows usage of high efficiency appliances by
customers * EPA SUBPART W METHODOLOGY. |
 37
PSE&G’s demonstrated ability to
successfully execute projects on scope, on time, and on budget
leaves us well positioned to pursue FERC 1000 opportunities
•
Artificial Island
•
PSE&G’s proposal is one of four finalists
•
The proposal includes building 18 miles of 500kV transmission
line running from the Hope Creek Generating Station to the
Red Lion substation in Delaware
•
PJM 2014 Window #2
•
PJM staff has recommended awarding PSE&G two projects to
resolve criteria violations in the Sewaren and Mercer areas
|
 38
Traditional Recovery Mechanisms
Distribution Base Rates
FERC Formula Rates
Transmission
Artificial Island
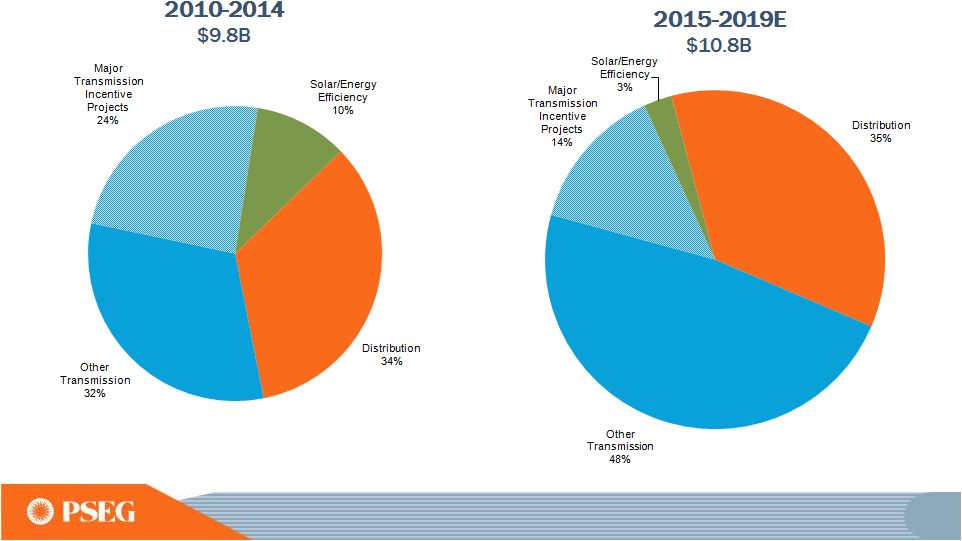
PSE&G continues to receive
contemporaneous/
formula rate recovery on ~75% of its investment program
Clause Recovery Mechanisms
Energy Strong / Infrastructure /
Solar / Energy Efficiency
Gas System Modernization Program
E = ESTIMATE. DATA AS OF MARCH 2, 2015
20%
56%
24%
2010-2014 PSE&G Capital Spending
by Recovery Method
$9.8B
9%
9%
55%
2%
25%
2015-2019E PSE&G Capital with
Potential Upside by Recovery Method
$12.1B |
 39
Cost control actions taken:
•
PSE&G is utilizing the Lean Six Sigma discipline to achieve costs savings
and process improvements
•
Conducted organizational reviews resulting in streamlining of processes
through restructuring
•
Continued focus on vendor and inventory practices ensuring maximum value
•
Successful management of pension
2009 to 2015 CAGR = 0.3%
PSE&G O&M Expense
E=ESTIMATE
PSE&G has
controlled costs
through process
improvements and will
continue to drive future
efficiencies
$0
$500
$1,000
$1,500
2009
2010
2011
2012
2013
2014
2015E |
 40
PSE&G’s 2015 operating earnings
expected to benefit from increased investment in Transmission
*SEE SLIDE A FOR ITEMS EXCLUDED FROM NET INCOME TO
RECONCILE TO OPERATING EARNINGS. E =ESTIMATE.
DATA AS OF MARCH 2, 2015. $612
$725
2013
2014
2015 Guidance
PSE&G Operating Earnings*
($ Millions)
$735 --
$775E |
 PSEG LONG ISLAND
CHAIRMAN OF THE BOARD
PSEG LONG ISLAND
Ralph LaRossa |
 42
PSEG Long Island is focused on
improving customer service and reliability
•
Provide best-in-class customer service, including building on our new
Call Center Technology platform to better serve our customers
•
According to J.D. Power, in 2014 PSEG Long Island showed the most
improvement in overall customer satisfaction of any large electric utility,
anywhere in the nation
•
Work to maintain industry-leading service reliability
•
Improve every aspect of the storm response process
•
Leveraged our new Outage Management System to improve storm logistics
and outage coordination
•
Contributed $0.02* to PSEG’s earnings per share in 2014, as
expected * EXCLUDES THE ENERGY RESOURCES & TRADE CONTRACT, WHICH
WILL BE INCLUDED IN PSEG POWER’S RESULTS. |
 |
 PSEG POWER
William Levis
PRESIDENT AND CHIEF OPERATING OFFICER
PSEG POWER |
 45
PSEG Power
strategy
Excellence in
operating our units
safely, reliably, cost-
competitively and in
an environmentally,
responsible manner
DISCIPLINED
INVESTMENT
DISCIPLINED
INVESTMENT
OPERATIONAL
EXCELLENCE
OPERATIONAL
EXCELLENCE
FINANCIAL
STRENGTH
FINANCIAL
STRENGTH
ENGAGED
WORKFORCE
ENGAGED
WORKFORCE |
 46
PSEG Power creating value by responding
to changing markets and regulations
Financial/Economic
Focus
Regulatory Focus
•
Nuclear units have performed well for
ten consecutive years
•
Hope Creek recorded its second
highest output in its history
•
Fleet diversity across the dispatch
curve and fuel types provide flexibility
to meet changing market conditions
•
Bergen 1 & 2 and Linden 1 individually,
and the CCGT fleet in total, set
generation records in 2014
•
Kearny 13 & 14 have shown increasing
output in each year since start-up
•
Getting the most out of
existing fleet
•
Locational advantage
•
O&M control programs
have delivered a CAGR of
2.6% between 2009 and
2015
•
Sites offer competitive
advantage for expansion
•
Strong regulatory
performance
•
Industry leadership in the
changing business
environment
Safety/Environmental
Focus
Fleet
Diversity/Efficiency
Focus |
 47
Financial
Strength
Disciplined
Investment
Operational
Excellence
•
Maximize value of existing generating
plants through implementation of the
Operational Excellence Model (OEM)
•
Workforce engagement and development
•
Deliver on Business Plan Commitments
•
Maintain competitive markets and improve
constituent
communication on issues
important to Power
•
Successfully complete the Advanced
Gas Path (AGP)
uprates •
Seek new opportunities in target
markets (PJM, ISO-NE,
NYISO) •
Develop our renewables business (solar)
•
Maintain new nuclear option by successfully
managing the Early Site Permit (ESP) process
PSEG Power Delivering on priorities
•
OEM implemented and
achieving measures
•
Resource sharing program
between Nuclear & Fossil
initiated
•
Exceeded earnings guidance
in 2014
•
Ongoing effort in key markets
showing success
•
Successful court outcome
against subsidized generation
•
Accelerated schedule for
AGP to maximize opportunity
•
LIPA contract for fuel and generation
dispatch began January 1, 2015
•
Completed three projects with one
underway, bringing Solar Source’s
portfolio to 123 MW
DC
•
Nuclear ESP is expected in 2016 |
 48
PSEG Power met 2014’s challenges
Storm and
weather challenges
•
All of the generation
sites affected by
SuperStorm Sandy
were restored to
service by mid-2014,
with ongoing repairs
•
Cold weather
extremes created a
challenging
operating
environment, but
also presented
opportunities
Market
challenges
•
Transmission
(outages and build
outs) and gas
markets resulted
in pressure on
basis
•
Lower gas cost
impacted dark
spread pressuring
coal unit dispatch
•
Load impacted by
economy
Value
delivered
•
Expedited return from storm outages,
restored margin opportunities
•
High availability when needed
•
Flexibility of portfolio captured real-
time basis opportunities
•
Captured value through coal/gas
switching, unit flexibility
•
Management of gas assets benefited
customers and fleet
•
Achieved fuel cost savings |
 49
PSEG Power exceeded 2014’s earnings guidance GUIDANCE
RANGE
Over $60M of additional
value gained from:
•
Weather, basis volatility
•
Fuel flexibility
•
Lower gas cost
•
Spark/dark spread
Initial
Guidance
Actual
Revised
Guidance
*EXCLUDES IMPACTS FROM STORM RECOVERY COSTS. SEE SLIDE A FOR ITEMS EXCLUDED
FROM NET INCOME TO RECONCILE TO OPERATING EARNINGS.
2014 PSEG Power Operating Earnings*
($ Millions)
$642M
$550-$610M |
 50
PSEG Power has generating assets
in three competitive markets
•
Assets located near load
centers
•
Low cost portfolio
Fuel flexibility with gas cost
advantage
•
Positioned to benefit
from volatility in real-time
markets
•
Readiness for capacity
performance (CP) in PJM
•
Fleet positioned to
maintain diversity and
efficiency after HEDD
•
Sites suitable for
expansion
ISO
New
England
New Haven
Bridgeport
Bethlehem Energy Center
(Albany)
Conemaugh
Keystone
Peach Bottom
Bergen
Kearny
Essex
Sewaren
Edison
Linden
Mercer
Burlington
National Park
Hudson
Hope Creek
Salem
Yards Creek
New York ISO
PJM |
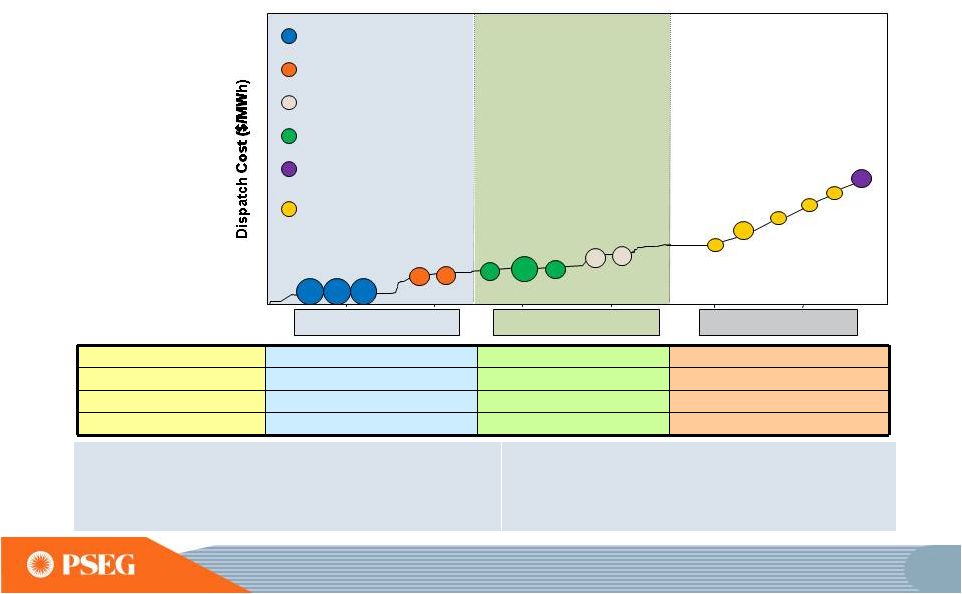 51
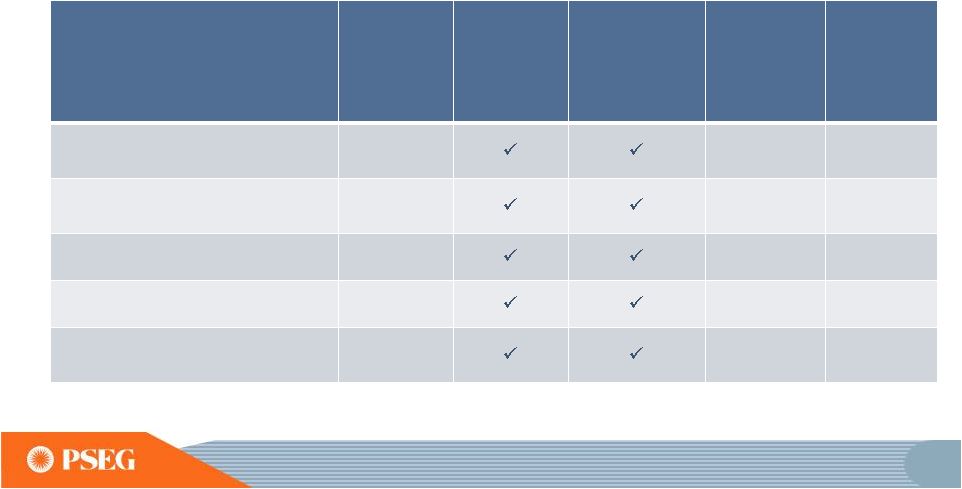
Power’s PJM assets along the dispatch curve reduce
the risk of serving full requirement load contracts and can
take advantage of volatile market conditions
Energy Revenue
X
X
X
Capacity Revenue
X
X
X
Ancillary Revenue
X
X
Dual Fuel
X
X
•
Base Load ensures cash flow certainty
•
Load Following provides ability to serve load shape
•
Readiness for Capacity Performance (CP)
•
Peaking takes advantage of real-time prices and
reduces operational risk
•
Dual fuel capability at 87% of load following and
peaking units
Illustrative
Salem
Hope
Creek
Keystone
Conemaugh
Hudson 2
Linden 1,2
Bergen 1
Mercer 1, 2
Bergen 2
Peach
Bottom
Essex 9
Sewaren 1-4
Burlington 12
Yards Creek
Base Load Units
Peaking Units
Load Following Units
Kearny 12-13-14
Nuclear
Coal
Coal/Gas
Combined Cycle
Steam
Combustion Turbine /
Pumped Storage
Linden 5-8
POST -
HEDD |
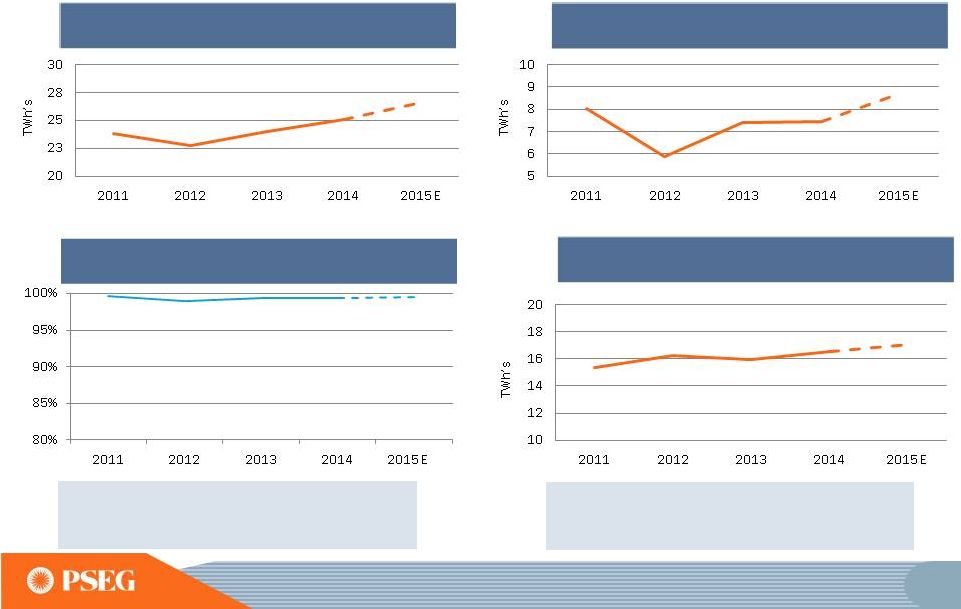
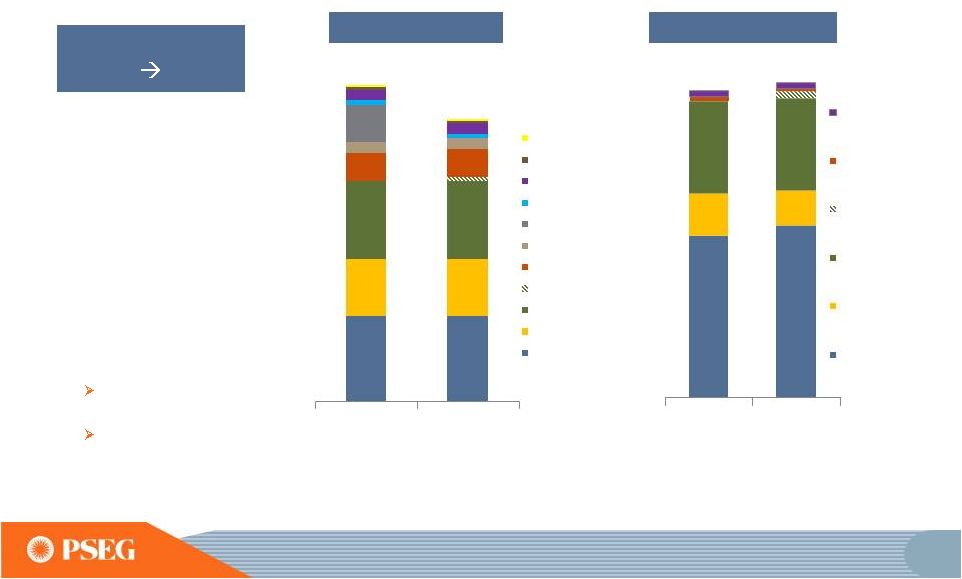 52
PSEG Power positioned to maintain diversity and
efficiency after a realignment of the fleet following HEDD
retirements
•
Maintain fuel diversity
•
Maintain load-serving
capability
•
Maintain low cost
structure
•
Improve
environmental &
heat rate profiles
•
Complete
Peach Bottom (PB)
uprate
Advanced Gas Path
(AGP)
Objective
2015
2017
13,337 MW
11,900 MW
Fuel Diversity
Energy Produced
55 -
57 TWh
54 TWh
E=ESTIMATE
Solar
Kalaeloa
Oil
Pumped
Storage
HEDD
Other
Peakers
AGP/PB
EPU
CCGT
Coal
Nuclear
Peakers
AGP/PB EPU
CCGT
Coal
Nuclear
Oil, Other gas, HEDD,
Pumped storage,
kalaeloa, Solar
2014
2017
2014
2017
E
E |
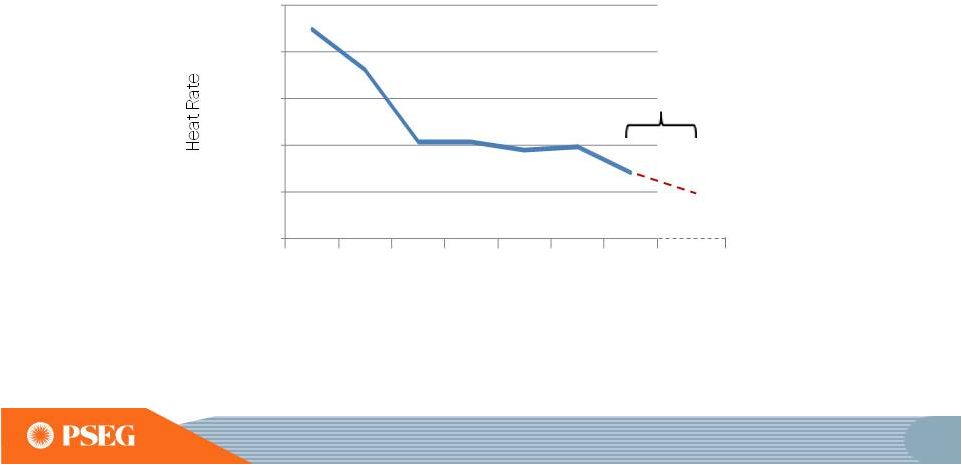
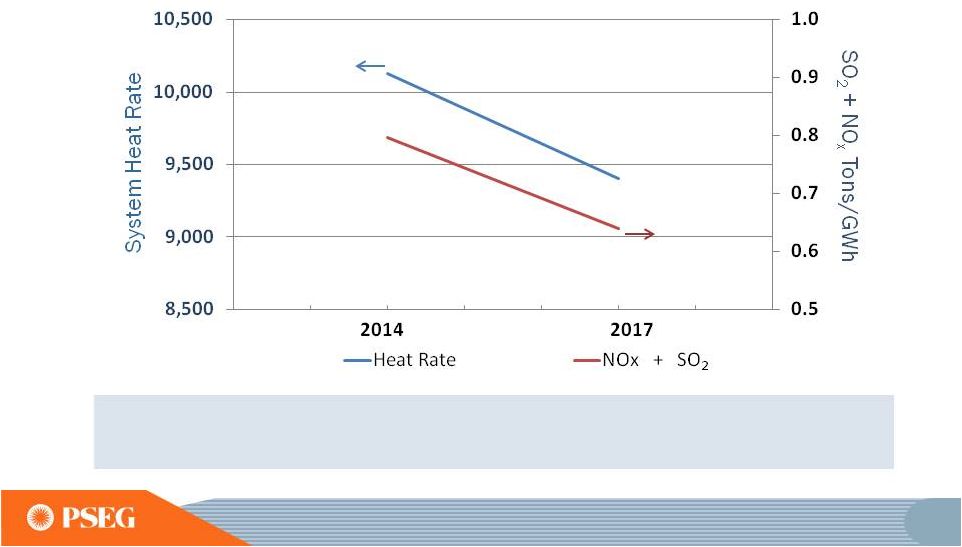 53
PSEG
Power’s
fleet
is
expected
to
see
improvement in heat rate and decline in
emissions
•
AGP (Advanced Gas Path) investments
•
Other Efficiency improvements
•
HEDD retirements |
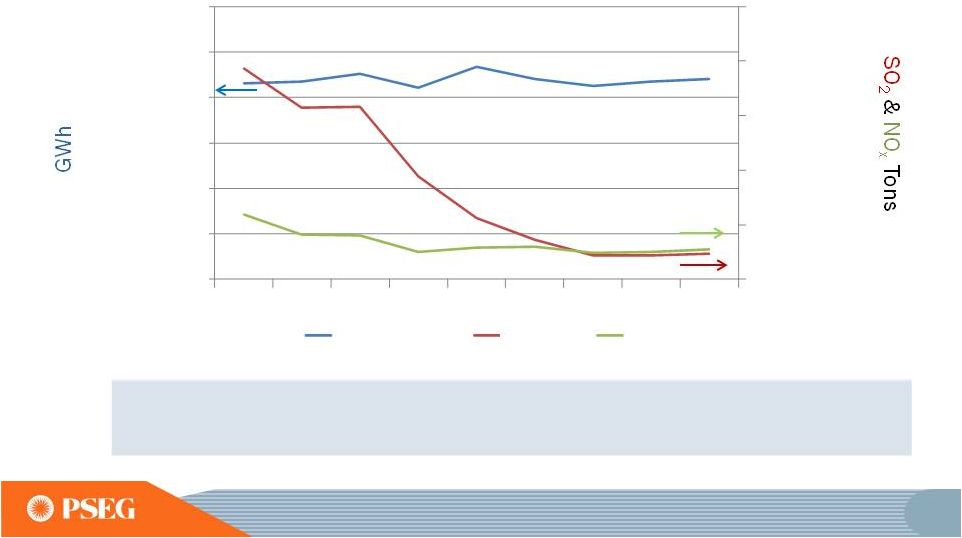 54
PSEG Power’s fleet is among the lowest
emitting in the industry
0
20,000
40,000
60,000
80,000
100,000
10,000
20,000
30,000
40,000
50,000
60,000
70,000
2006
2007
2008
2009
2010
2011
2012
2013
2014
Generation
SO
NOx
2
•
Mercury reduced 80% across the timeframe above
•
More efficient testing and improved operational flexibility through
utilization of Continuous Emission Monitoring System testing
|
 55
PSEG
Power
Nuclear
is
a
critical
element
of our success
Hope Creek
•
Operated by PSEG Nuclear
•
PSEG Ownership: 100%
•
Technology: Boiling Water
Reactor
•
Total Capacity: 1,178 MW
•
•
License Expiration: 2046
•
Next Refueling
Spring 2015
Salem
Units 1 and 2
•
Operated by PSEG Nuclear
•
PSEG Ownership: 57%
•
Technology: Pressurized Water
Reactor
•
Total Capacity: 2,307 MW
•
Owned Capacity: 1,324 MW
•
License Expiration: 2036
and 2040
•
Next Refueling
Unit 1 –
Spring 2016
Unit 2 --
Fall 2015
Peach Bottom
Units 2 and 3
•
Operated by Exelon
•
PSEG Ownership: 50%
•
Technology: Boiling Water
Reactor
•
Total Capacity: 2,242 MW
•
Owned Capacity:
1,121 MW
•
License Expiration: 2033
and 2034
•
Next Refueling
Unit 2 -
Spring 2016
Unit 3 -
Fall 2015
•
Uprate: 130 MW (PS Share)
Unit 2 -
March 2015
Unit 3 -
2016
Owned
Capacity:
1,178
MW |
 56
PSEG Power Nuclear has competitive advantages
*STRATEGY
KNOWN
AS
THE
“DIVERSE
AND
FLEXIBLE
MITIGATION
CAPABILITY”
OR
FLEX,
ADDRESSES
RECOMMENDATIONS OF THE NUCLEAR REGULATORY COMMISSION’S FUKUSHIMA TASK
FORCE. Continued strong nuclear operations
Nuclear excellence program
Top quartile of cost performance/MWh
Brought security services in-house
Significant earnings contributor
Recruitment of the best new and
experienced talent, and attractive
training program
Fukushima action plan
in response to NRC staff review
FLEX* plan submitted with implementation
underway
Peach Bottom extended power
uprate, 130 MW Power’s share,
scheduled in service 2015/2016
Active and influential participation at
INPO, NEI, EPRI, USA Alliance |
 57
Power’s nuclear fleet is well positioned
with significantly lower-than-average US cost structure
*SOURCE: ELECTRIC UTILITY COST GROUP.
** SOURCE: PSEG NUCLEAR.
Total Fuel, Capital and O&M Costs*
3 YEAR AVERAGE 2011 -
2013
$44/MWh
$37/MWh
0
25
50
All US*
PSEG Nuclear** |
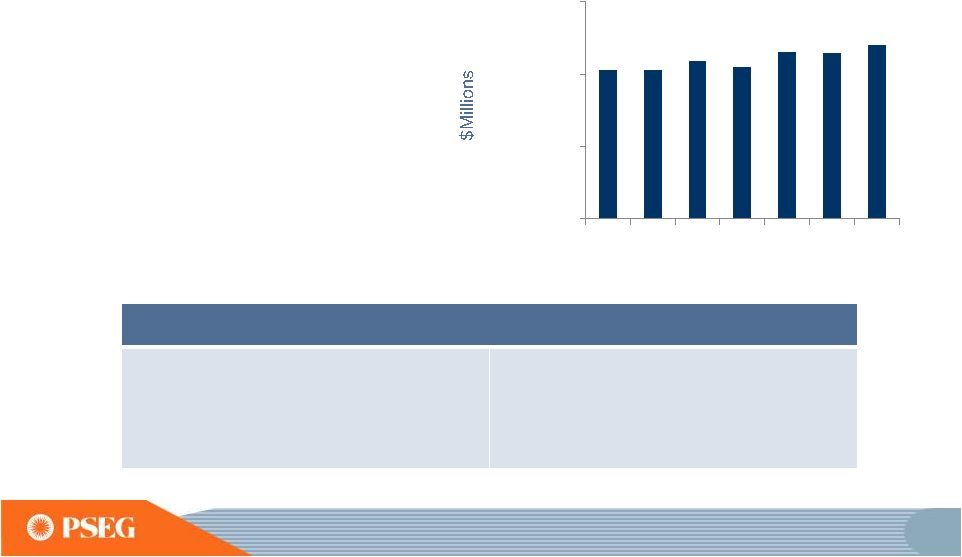 58
Cost
control
actions
taken:
•
Fossil plant assessment
•
CCGT material condition assessment
•
Vendor contract renegotiations
•
Nuclear security services brought in-
house to control costs
•
Nuclear maintenance productivity study
•
Nuclear outage efficiency initiative
•
Materials management
2009 to 2015 CAGR = 2.6%
Power O&M Expense*
*EXCLUDES IMPACTS FROM STORM RECOVER COSTS. E=ESTIMATES
PSEG Power’s
focus on costs
has resulted in moderate
increase in O&M for
seven years
$0
$500
$1,000
$1,500
2009
2010
2011
2012
2013
2014
2015E
•
Fossil plant assessment
•
CCGT material condition assessment
•
Vendor contract renegotiations
•
Nuclear security services brought in-
house to control costs
•
Nuclear maintenance productivity study
•
Nuclear outage efficiency initiative
•
Materials management |
 59
PSEG Power’s Fossil Fleet has shown
improvement in performance
*LM6000 AND 7EA UNITS E =
ESTIMATE. •
Fossil Generation rebounded with market
•
Peaking Units maintain high start success
•
Record output from Kearny 13 & 14 peakers
•
Combined Cycle Generation set record
•
Bergen AGP uprate project scheduled for 2015
Fossil Generation
Peaking Start Success*
Coal Generation
Combined Cycle Generation |
 60
PSEG Power initiatives result in
continuing improvement in combined cycle heat rate
AGP projected efficiency
improvement 2015-2018
2018E
E= ESTIMATE.
7,300
7,400
7,500
7,600
7,700
7,800
2008
2009
2010
2011
2012
2013
2014 |
 61
PSEG Power CCGT/Fossil initiatives
Actions Taken to Create Value
Capacity
•
Advanced
Gas
Path
(AGP)
investments
2014
through
2018
to
provide
additional
efficient capacity, heat rate improvements
•
New lower cost gas line at BEC with Dominion
Performance
•
EPRI efficiency initiatives
•
GE initiatives for large data analytic
•
Consolidation of unit testing
•
Auto tuning software
Maintenance
•
Ongoing outage efficiency improvement
•
Improvements to reliability
•
Central fleet monitoring and diagnostic center |
 62
PSEG Power’s capital expenditures for
environmental requirements are essentially complete*
*BASED ON CURRENTLY KNOWN AND QUANTIFIABLE ENVIRONMENTAL REQUIREMENTS.
E=ESTIMATE. DATA AS OF DECEMBER 31, 2014.
COMPLETION OF
CONEMAUGH
SCR/FGD IN 2015
$0
$200
$400
$600
$800
$1,000
2010
2011
2012
2013
2014
2015E
2016E
2017E
Penn East (equity investment)
Growth
Environmental/Regulatory
Maintenance |
 63
PSEG Power’s Growth Investments
Site
Project
Cost
Benefits
Status
BEC
Dominion Gas Line
$8
Access
to
a
2
nd
,
lower
cost
gas
supply:
Completed
Linden
AGP Upgrade
$69
Increased
capacity
and
improved
heat
rate:
Completed
Linden
Kearny
Black Start:
Linden 7/8
Kearny 12
$13
New ancillary revenue source:
Linden Completed
Kearny Underway
CA / TX / VT
Solar Source Projects
$44
Increased capacity: 21 MW
Completed
Peach Bottom
Peach Bottom EPU
(2014 –
2015)
$417
Increased capacity: 130 MW
PB2 March 2015,
PB3 in 2016
Bergen / BEC
Future AGP
Upgrades:
Bergen (2015)
BEC (2017-2018)
$98
Increased capacity and improved heat rate:
Underway
Various
Interim ISA’s*
No cost
Increased capacity: 69 MW
Completed
Eastern PA to
Mercer, NJ
PennEast Pipeline
$119
Estimated Earnings in 2019:
Underway
Total Increased Capacity –
371
MW
* INTERCONNECTION SERVICE AGREEMENTS.
($ millions)
$13 million
88 MW capacity increase
~1.2% heat rate improvement
~ $3 million per year
63 MW capacity increase
~1.2% heat rate improvement
$8-9 million/year increase in margin |
 64
Additional investment opportunities under
consideration
Site
Project
Benefits
Bridgeport Harbor
CCGT development
New ISO NE Capacity: 475 MW
Hope Creek
Uprate
Additional PJM Nuclear Capacity: 20 MW
Edison / Essex
SCR retrofit
Continued operation of FT4s
Edison: up to ~ 470 MW
Essex: up to ~ 330 MW
Bergen
Bergen 1 Uprate
(AGP-type uprate)
Additional PJM Capacity: Up to 50 MW
Sewaren
CCGT development
New
PJM
Capacity:
450
–
625
MW
Various
Additional solar projects
under investigation
100’s of MW of new solar capacity under
evaluation |
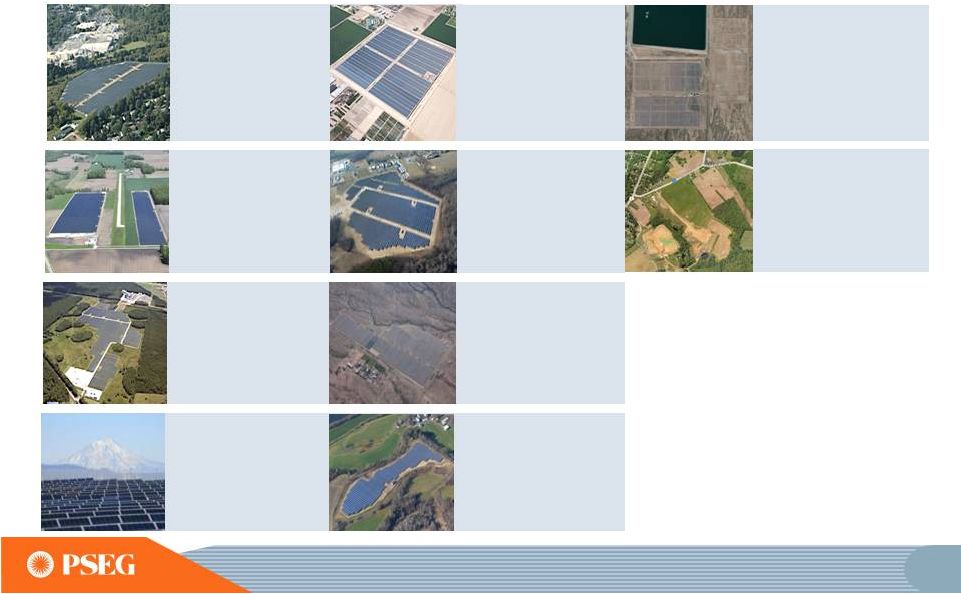 65
Hackettstown (Mars)
New Jersey (2 MW)
COD September 2009
Thin film panels –
fixed tilt
Investment $13 million
15 year PPA with Mars, Inc.
Milford
Delaware (15 MW)
COD December 2012
Polycrystalline -
fixed tilt
Investment $47 million
20 year PPA with DEMEC
Badger I
Arizona (19 MW)
COD November 2013
Polycrystalline -
single axis
Investment $48 million
30 year PPA with APS
PSEG Solar Source owns ~123 MW
of solar facilities
*
with long term contracted revenues
*PROJECT SIZE IN MEGAWATTS SHOWN IN DC (DIRECT CURRENT), AC EQUIVALENT IS 96
MEGAWATTS. E=ESTIMATE. In Construction –
Rockfish
Maryland (13 MW)
COD -
June 2015E
Polycrystalline -
single axis
20 year PPA with SMECO
Queen Creek
Arizona (25 MW)
COD October 2012
Polycrystalline - single axis
Investment $75 million
20 year PPA with SRP
Newman
Texas (13 MW)
COD December 2014
Polycrystalline - single axis
Investment $22 million
30 year PPA with El Paso Elec.
Wyandot
Ohio (12 MW)
COD May 2010
Thin film panels – fixed tilt
Investment $44 million
20 year PPA with AEP
JEA
Florida (15 MW)
COD September 2010
Thin film panels – fixed tilt
Investment $59 million
30 year PPA with JEA
Shasta A & B
California (4 MW)
COD March 2014
Polycrystalline - single axis
Investment $13 million
20 year PPAs with PG&E
Whitcomb
Vermont (4 MW)
COD October 2014
Polycrystalline - single axis
Investment $10 million
25 year PPA with VT Electric
Power Producers, Inc. |
 66
Gas Asset Optimization
Large wholesale provider to PSE&G and others
Storage capacity of approximately 75 Bcf (in the Gulf and market
regions)
Firm transportation of 1.3 Bcf/day on seven pipelines
Off-system sales margins shared with residential customers
Commercial & Industrial customers (C&I)
Weather and price volatility
Ancillary Services
LIPA Fuel and energy dispatch management
PSEG Power has other attractive sources of revenues to
round out a robust portfolio, in addition to energy and
capacity |
 67
PSEG Power has delivered on its commitments
during volatile market conditions
2009
2010
2011
2012
2013
2014
Annual Cooling Degree Days
% greater/(less) than average
(17%)
35%
26%
13%
7%
(5%)
Annual Heating Degree Days
% greater/(less) than average
(1%)
(8%)
(11%)
(17%)
(1%)
5%
# Days over 90 degrees
12
48
29
29
21
12
# Days below 20 degrees
24
14
13
7
13
33
Gas Volatility: Transco Z6
Min $2.50
Max $19.93
Min $3.76
Max $23.43
Min $3.38
Max $18.93
Min $2.40
Max $12.43
Min $3.10
Max $39.43
Min $1.39
Max $115.00
LMP Volatility:
PS Zone
Min $4
Max $156
Min $7
Max $289
Min $15
Max $417
Min $5
Max $370
Min $10
Max $335
Min $5
Max $1,021
Basis Volatility:
PJM-W to PS Zone
Min ($22)
Max $50
Min ($29)
Max $71
Min ($40)
Max $116
Min ($49)
Max $97
Min ($28)
Max $79
Min ($131)
Max $455
Power Earnings
On
Guidance
On
Guidance
High End
of Guidance
Above
Guidance
High End
of Guidance
High End
of Guidance |
 68
PSEG Power is an established leader
within the industry
•
National Nuclear Accrediting Board
•
Communications Advisory Committee
•
Board of Directors
•
Board of Directors Executive Committee
•
Emergency Preparedness Working Group
•
Security Working Group
•
Fukushima Response Steering Committee
•
Joint Information System Task Force
•
Nuclear Strategic Issues Advisory Committee Steering
Group
•
Chairman Nuclear Power Council
•
Executive Committee Nuclear Power Council
•
Vice Chair of the Executive Oversight Committee
•
Chair
•
Executive committee member
•
Chair of the Cooling Systems Committee
•
Member of various Committees at PJM
•
Chairman & Vice-Chair of the Supplier Sector of the New
England Power Pool (NEPOOL)
•
Chair of the PJM Power Providers Board
•
Board member & member of the board’s Executive
Committee of Independent Power Producers of New York
(IPPNY)
•
Member of water resources subcommittee
•
Member of Executive Committee
Utilities Service Alliance (USA) Fleet
BWR Owners Group
EPRI
NEI
INPO
National Coal Council
EEI
PJM/NY/ISO-NE
EPSA
UWAG |
 69
Developing People to drive operational excellence
and to optimize the workforce
•
Succession planning and development planning
•
Recent CNO retirement & succession was part of the plan
•
Training & development of employees
•
Rotational assignments for key leaders in PSEG Power
•
Outreach programs
•
Employee engagement
•
Shared resources between Fossil and Nuclear (outage support)
•
Diversity & inclusion |
 70
Power’s 2015 operating earnings
maintain solid performance
Power Operating Earnings
($ Millions)*
•
75-80% hedged at
$52/MWh
•
Increase in average
hedge price for energy
helps mitigate reset in
capacity price and volume
2015 Observations
2013
2014
2015 Guidance
$710
$642
$620 –
680E
*SEE SLIDE A FOR ITEMS EXCLUDED FROM NET INCOME TO RECONCILE TO OPERATING
EARNINGS. |
 PSEG POWER
ER&T
PSEG POWER
Shahid Malik
PRESIDENT |
 72
Agenda
•
Gas, Power, Spark Spreads
•
Gas and Power Basis
PSEG Power’s Portfolio
•
PJM
•
Northeast
PSEG Power’s Locational and Fleet Strengths
•
Robust capacity market pricing
•
Advantageous medium-term full requirements opportunity in NJ
•
Hedging plan mitigates risk while allowing for upside
Market Review |
 73
Market Review: 2014 was influenced by extremes in weather
highlighting the importance of winter
Q1:
Periods of extreme
cold temperatures
resulted in high gas
prices, significant
basis differentials, and
higher energy demand.
Q3:
A cooler than
normal summer,
combined with
increased supply of
gas, reduced energy
prices and basis.
2014 Q1 Gas
2014 Q1 PS Zone Electric
2014 Q3 PS Zone Electric
2014 Q3 Gas |
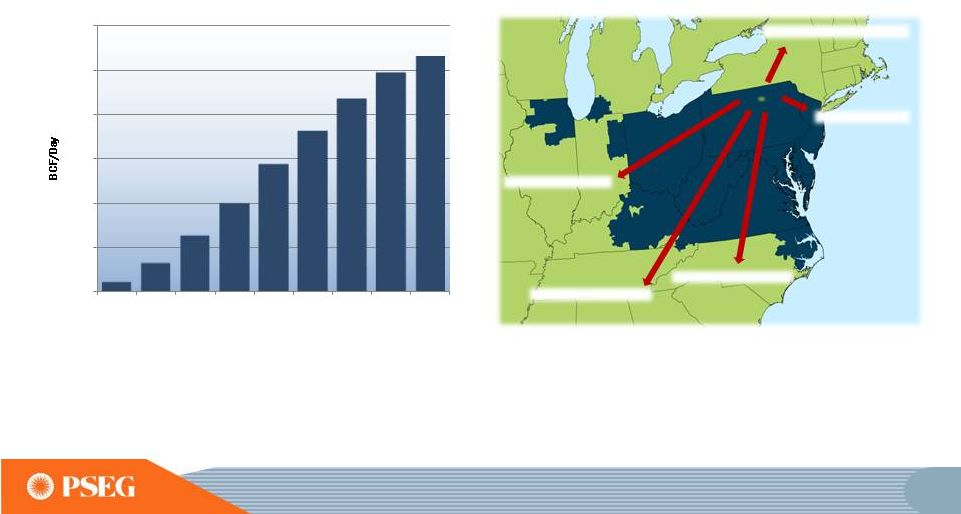
 74
Market Review: PSEG’s extensive gas asset portfolio gives unparalleled
access to Marcellus Shale gas •
PSEG Power maintains a robust portfolio
of pipeline and storage assets in the
Mid-Atlantic
•
PSEG Power’s gas for generation was
~100 BCF in 2014, of which >60%
was supplied by Shale gas
•
PSEG Power procured over 400 BCF in
2014 with ~75% going to PSE&G’s utility
gas customers
•
When gas is surplus to customer needs,
PSEG Power sells surplus to others;
margins from such sales benefit PSE&G
gas customers and PSEG Power
Power’s Gas for Generation in 2014
Eastern PA Shale
Western PA Shale
Gulf Coast
Delivered Gas |
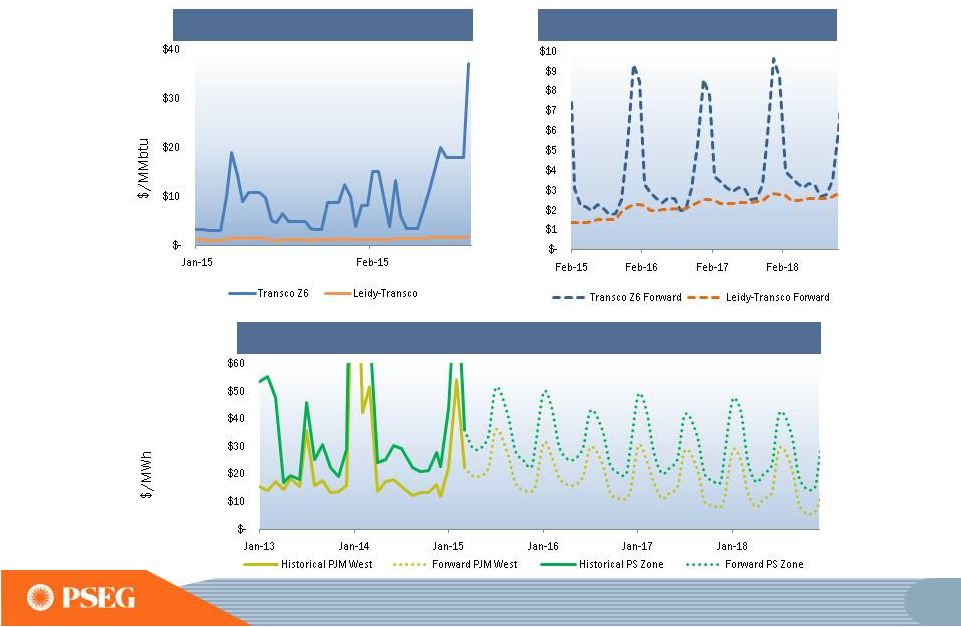 75
Market
Review:
Winter
Z6
gas
prices
retain
seasonal
volatility;
spark spreads have continued to be robust in PJM
FORWARDS AS OF DECEMBER 31, 2014
2015 YTD Z6
PJM West vs. PS Zone Spark Spreads (2013-2018)
2015-2018 Z6 |
 76
Market
Review:
New
pipelines
will
move
significant
quantities
of
Marcellus gas out of the region by 2018
New pipeline investment is expected to increase takeaway capacity from the low
cost Marcellus/Utica
shale
and
reduce
regional
surpluses
and
increase
gas
prices
by
2018
Pipeline capacity grows significantly by
2018
Historical and Expected Marcellus
Production
New England 3.4 bcf/d
Southeast 6.4 bcf/d
Midwest 5.9 bcf/d
Gulf Coast 3.1 bcf/d
NJ/NY 1.4 bcf/d
0
5
10
15
20
25
30
2010
2011
2012
2013
2014
2015
2016
2017
2018 |
 77
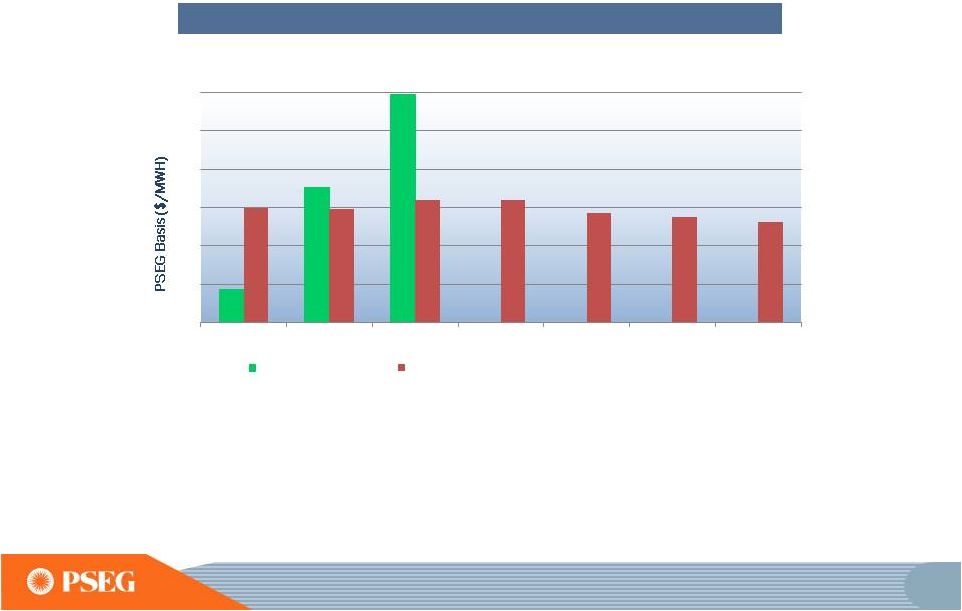
ANNUAL FORWARD BASIS TO PJM-WEST AS OF DECEMBER 31, 2014.
Power Basis in Eastern PJM:
Expected to be volatile but
positive on an annual basis with winter pricing driving value
Electric Basis will remain positive overall and stabilize within
3 years due to:
•
•
•
Export
of
~18
bcf/day
of
gas
which
will
significantly
strengthen
regional
gas
prices
Easing of transmission constraints in Virginia/Maryland
Construction of significant new gas-fired generation in VA/MD
PS Zone RTC Basis to PJM West
0
1
2
3
4
5
6
2012
2013
2014
2015
2016
2017
2018
PS Basis
Forward Curve for Electric Basis (prior to delivery year)
|
 78
Regulatory
Framework:
Significant
reforms
already
implemented
and
new rules being promulgated to improve energy and capacity market designs
ISSUE /POLICY
OUTCOME
PJM
CAPACITY
•
Higher payments for enhanced reliability (Capacity Performance)
DEMAND RESPONSE
RULES
•
Stricter rules for eligibility and deployment
ENERGY PRICE
FORMATION
•
PJM and FERC forcing improvements to energy price formation;
higher caps
ISO-NE
CAPACITY
•
Higher prices in recent auction better reflect tight supply conditions
•
Implementation of sloping demand curve in FCA 9
•
Zonal demand curves expected in FCA 10
ENERGY
•
Demand response required to participate in Day Ahead markets
•
Implemented hourly offers/real time reoffers
•
Reserve market prices better reflect scarcity prices
•
5 minute interval LMP settlements expected Q1 2016
NYISO
CAPACITY
•
New Capacity Zone (LHV) leads to more accurate price signals
ENERGY
•
Improvement in price formation during reserve shortage conditions
FEDERAL
DEMAND RESPONSE
•
EPSA VS. FERC and national implications
ENVIRONMENTAL
REGULATIONS
•
HEDD, CPP, HAPS/MACT will lead to tightening of supply in
2015+ timeframe |
 79
Agenda
Market Review
•
•
PSEG Power’s Portfolio
•
•
PSEG Power’s Locational and Fleet Strengths
•
•
•
Gas, Power, Spark Spreads
Gas and Power Basis
PJM
Northeast
Robust capacity market pricing
Advantageous medium-term full requirements opportunity in NJ
Hedging plan mitigates risk while allowing for upside
|
 80
PJM Capacity Performance Proposal: aims to
increase electric supply reliability
•
Capacity
performance
(CP)
proposal
places
emphasis
on
reliability,
given
observed outages during times of extreme weather stress and anticipated
retirements; Imposition of higher penalty structure and enhanced
opportunities for cost recovery to encourage reliability
•
Elimination
of
2.5%
holdback
offsetting
weak
demand
growth,
making
all
capacity resources annual products in end state, net CONE bidding safe
harbor, and the change in the demand curve (VRR) support price formation
and improve resource adequacy
•
Generator
performance/flexibility
is
key
objective
for
units
with
secure
fuel
supply capable of meeting more stringent operating standards
|
 81
Capacity
Performance:
capacity performance standards with minimal to moderate investment
CP Compliant Assets
* EXCLUDES 205MW OF PUMPED STORAGE
Combined
Cycle
Steam
Nuclear
Combustion
Turbine
Meets CP
Requirement
with No to
Minimal
Investment
Moderate
Investment to
Meet CP
Requirement
Larger
Investment to
Meet CP
Requirement
of
PSEG’s
PJM
capacity
meets
the
new
How
does
our
fleet
stack
up?
*
>90% |
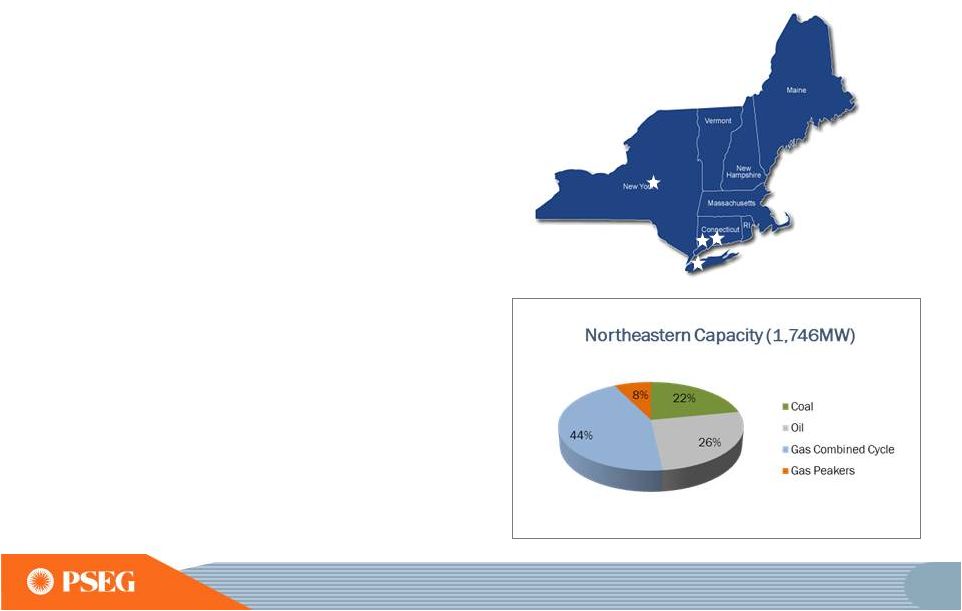 Northeast Portfolio: New York and New England
82
•
Long Island Power Authority Management
Contract
•
Investment in new lateral to connect to the
Dominion pipeline at Bethlehem Energy
Center (BEC) allows for access to fuel supply
from Marcellus
•
Single state ISO
New York (774MW)
•
Gas pipeline infrastructure poses supply
challenges/opportunity
•
Significant siting and permitting challenges
•
High volatility due to extreme (winter) weather
conditions
•
Significant improvement in market construct
•
Small but dynamic market
New England (972MW) |
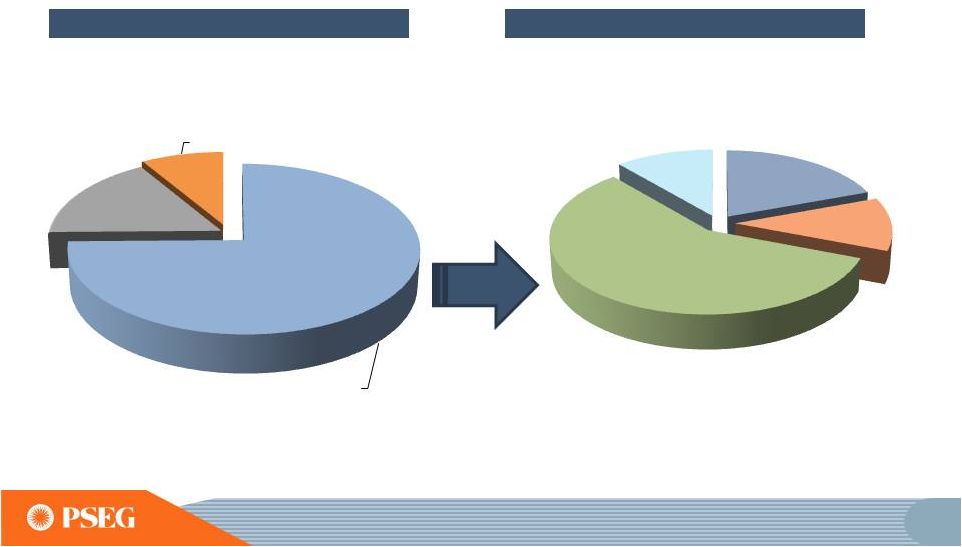
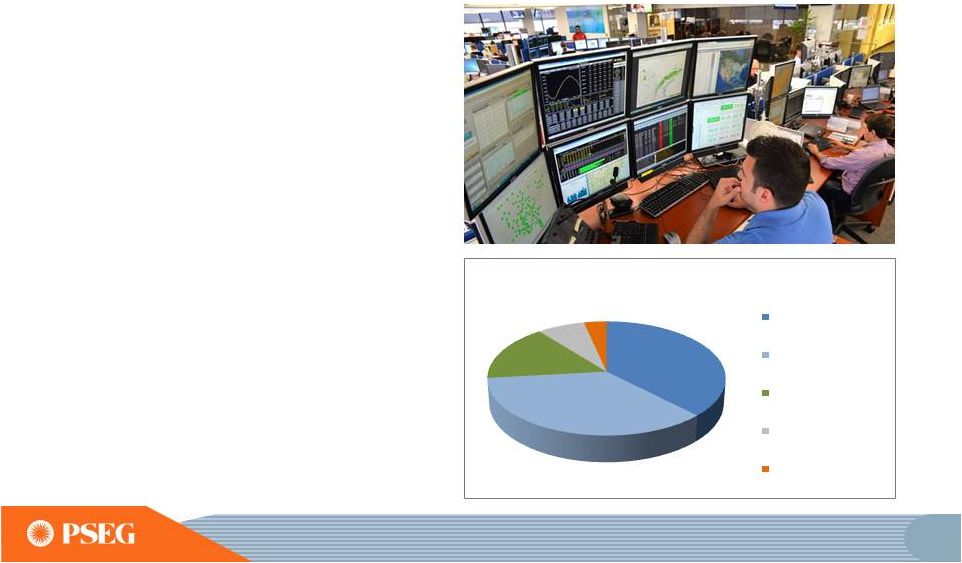 83
PSEG Power acting as an agent for LIPA began
January 2015
Northeast
Portfolio:
Expanding
our
footprint
with
PSEG
Long
Island
38%
36%
16%
7%
3%
LIPA Capacity (6,163MW)
Steam
Combustion Turbine
Cables
Combined Cycle
Resource Recovery,
Pumped Storage, Solar
•
Additional experience in Eastern
NY and Connecticut markets
•
Bigger natural gas footprint
•
Fee-based services contract
•
Performing ISO bidding for LIPA’s
6,000MWs of generation/tolls
•
Procuring natural gas and oil for the
majority of these assets
•
Scheduling two DC transmission cables
(ISO-NE and PJM) into Long Island
•
Entering into financial hedges to reduce
LIPA customer’s price volatility
This relationship has provided PSEG Power: |
 84
Agenda
•
Robust capacity market pricing
•
Advantageous medium-term full requirements opportunity in NJ
•
Hedging plan mitigates risk while allowing for upside
PSEG Power’s Locational and Fleet Strengths
•
PJM
•
Northeast
PSEG Power’s Portfolio
•
Gas, Power, Spark Spreads
•
Gas and Power Basis
Market Review |
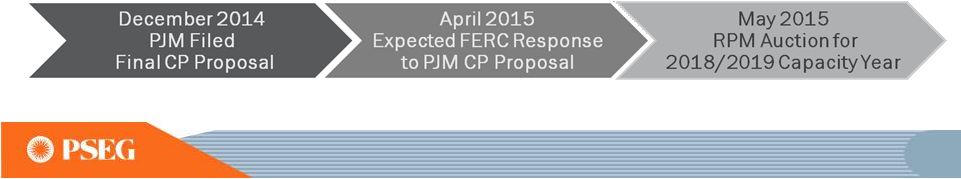
 85
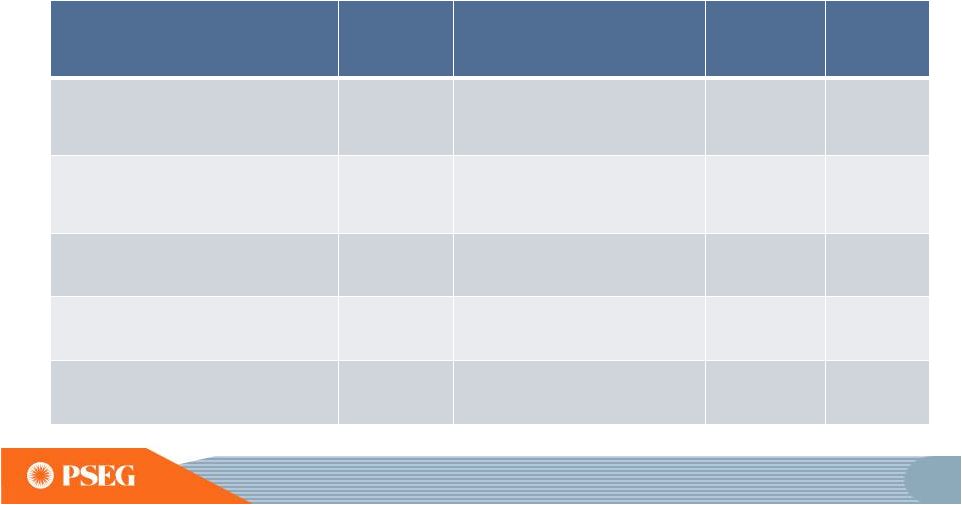
2018 Onwards RPM Auction Impacted By:
•
Capacity
Performance
•
Demand response rules
•
Convex Demand Curve
•
Elimination of 2.5% Holdback
•
Change in Net CONE
•
Reduction in Load Forecast
•
Change in PJM Parameters
•
Environmental Retirements
Capacity Market Pricing:
PJM’s capacity market is transitioning
to recognize operating performance as well as locational value
*PSEG POWER’S AVERAGE PRICES AND CLEARED CAPACITY (MW) REFLECT BASE AND
INCREMENTAL RPM AUCTION RESULTS AS OF FEBRUARY 2015. DELIVERY
YEAR RUNS FROM JUNE 1 TO MAY 31 OF THE NEXT CALENDAR YEAR. RPM Auction
Results ($/MW-day)
Power’s
Average Prices
$242
$168
$168
$167
$165
Rest of Pool
Prices
$28
$126
$136
$59
$120
Power’s Cleared
Capacity (MW)
10,900
10,600
8,800
8,700
8,700
2013
/
2014*
2014 / 2015*
2015 / 2016*
2016 / 2017*
2017 / 2018 |
 86
Auction Results: BGS Auction provides ability to forward
hedge our generation and protect our power basis
Capacity
Load shape
Transmission
Congestion
Ancillary
services
Risk premium
Green
$56
-
$58
BGS sales account for approximately 20% of our forward portfolio
of hedges
3 Year Average
Round the Clock
PJM West
Forward Energy
Price
$/MWH; BGS PRICES REFLECT PSE&G ZONE; RESULTS FOR 2013-2015 ARE THE
NEW BLENDED PRICES BEGINNING JUNE 1, 2015. $94.30
$83.88
~ $46
$92.18
~ $48
~ $53
~ $59
$97.39
$48
-
$50
$45
-
$47
$39
-
$40
$37
-
$38
$38
-
$39
~ $62
$37
-
$38
$99.54
2011
2012
2013
2014
2015 |
 87
Hedging strategy:
designed to protect gross margin
while leveraging the portfolio
2015
2016
2017
Volume TWh
36
36
36
Base Load
% Hedged
100%
80-85%
40-45%
(Nuclear and Base Load Coal)
Price $/MWh
$52
$52
$52
Volume TWh
21
19
19
Intermediate Coal, Combined
% Hedged
40-45%
0%
0%
Cycle, Peaking
Price $/MWh
$52
$52
$52
Volume TWh
55-57
55-57
55-57
Total
% Hedged
75-80%
50-55%
25-30%
Price $/MWh
$52
$52
$52
HEDGE PERCENTAGES AND PRICES AS OF FEBRUARY 2015. REVENUES OF FULL REQUIREMENT
LOAD DEALS BASED ON CONTRACT PRICE, INCLUDING
RENEWABLE ENERGY CREDITS, ANCILLARY, AND TRANSMISSION COMPONENTS BUT EXCLUDING
CAPACITY. HEDGES INCLUDE POSITIONS WITH MTM
ACCOUNTING TREATMENT AND OPTIONS. EXCLUDES SOLAR AND KALAELOA. |
 88
PSEG Power’s Value Proposition
•
Well-positioned fleet of merchant generating assets in attractive
markets •
Advantaged by low cost structure, fuel diversity and dispatch
flexibility •
Value add from strong gas supply capability
•
Significant drive by regulatory bodies to improve market constructs
•
Low capital requirements to meet enhanced performance standards
•
Organic growth opportunities to increase nuclear and combined cycle
generation
•
Hedging strategy is responsive to changing market dynamics, providing
attractive returns and free cash flow |
 We have the
energy
to make things better
…
for you, for our investors
and for our stakeholders. |
 PSEG
EXECUTIVE VICE PRESIDENT AND CHIEF
FINANCIAL OFFICER
Caroline Dorsa |
 91
Strong financial position to support our
business initiatives
2014 Financial Position
Strong 2014 earnings growth
Exceeded earnings guidance
Executed major PSE&G capital program
Strong balance sheet with no long term Parent debt
Solid credit metrics
2015 and Beyond
Third year of anticipated positive earnings growth in 2015
Controlled O&M growth
Balance Sheet and Cash Flow support investment program without equity issuance
Substantial additional investment capacity
Growth in PSE&G investments with contemporaneous/formula rate returns
Consistent and strong cash flow from both Power and PSE&G
Potential for accelerated and sustainable dividend growth
|
 92
Earnings increase of 7% exceeded
guidance
*SEE SLIDE A FOR ITEMS EXCLUDED FROM INCOME FROM CONTINUING
OPERATIONS/NET INCOME TO RECONCILE TO OPERATING EARNINGS.
PSEG Operating Earnings
2013
2014
PSE&G
$612
$725
PSEG Power
$710
$642
Other
($13)
$33
Operating Earnings
$1,309
$1,400
Operating EPS*
$2.58
$2.76
Revised Earnings Guidance (Oct 2014)
$2.60 -
$2.75
Earnings Guidance (Feb 2014)
$2.55 -
$2.75
Key Takeaways
18% increase in PSE&G
earnings
52% regulated earnings
contribution in 2014
Power’s results
exceeded guidance
$ Millions (except
EPS) |
 93
Power produced significant and
consistent
Free Cash Flow
2012
Power Cash From Ops
2013
2014
2012
2013
2014
Power Free Cash Flow
$0.0
$0.5
$1.0
$1.5 |
 94
PSE&G delivers increasing cash flow due
to investment program
2012
PSE&G Cash Investment
PSE&G Cash From Ops
(1)
2013
2014
(1)
PSE&G CASH FROM OPERATIONS ADJUSTS FOR SECURITIZATION PRINCIPAL REPAYMENTS
OF ~$215 TO ~$240 MILLION OVER 3 YEAR PERIOD
2012
2013
2014
$0.0
$0.5
$1.0
$1.5
$2.0
$2.5 |
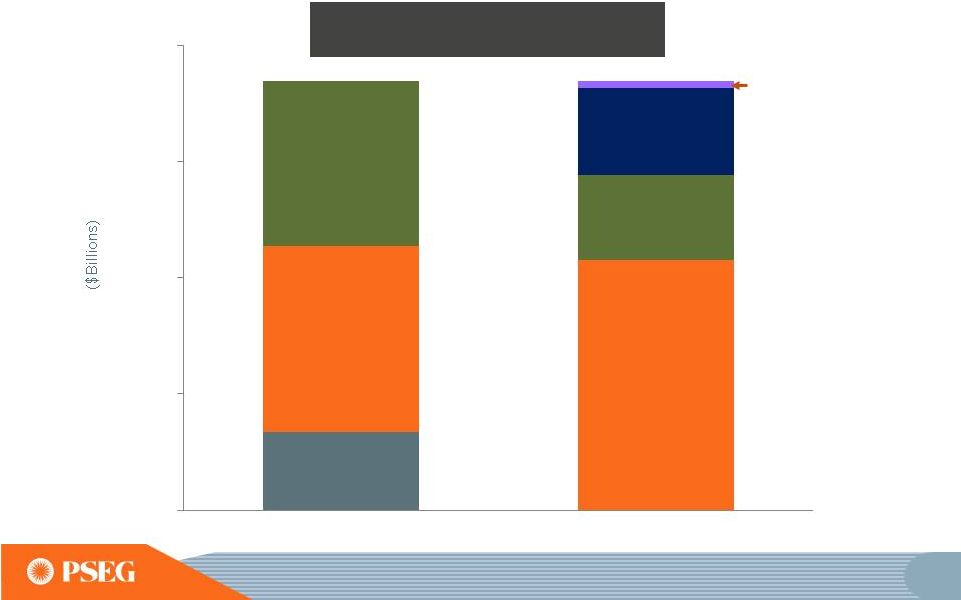 95
In 2014, Power’s Free Cash Flow supported PSE&G’s
capital program and shareholder dividend
Power
Cash from Ops
~$1.4B
PSE&G
Cash from Ops
(1)
~$1.6B
PSE&G
Cash Investment
~$2.2B
Power
Cash Investment
(3)
~$0.7B
Shareholder
Dividend
~$0.7B
PSE&G
Net Debt
~$0.7B
(1)
PSE&G CASH FROM OPERATIONS ADJUSTS FOR SECURITIZATION PRINCIPAL REPAYMENTS
OF ~$240 MILLION. (2)
OTHER CASH FLOW INCLUDES HOLDINGS NET CASH FLOW AND INVESTED CASH
(3)
POWER CASH INVESTMENT INCLUDES NUCLEAR FUEL AND EMISSION PURCHASES
Other
Cash Flow
(2)
~$0.1B
PSEG Consolidated
2014 Sources and Uses
$0.0
$1.0
$2.0
$3.0
$4.0
Sources
Uses |
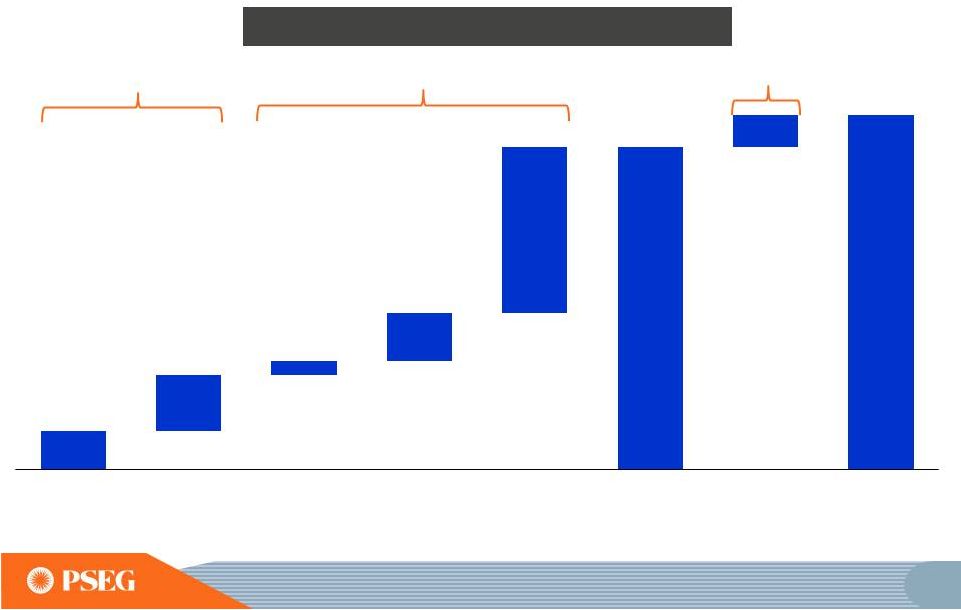 96
PSEG 2015–
2019E Capital Expenditures
(1)
PSEG growth spend represents ~70% of
total investment with new PSE&G investment opportunities of
over $1B Power & Other
Maintenance
PSE&G
Distribution
Maintenance
Power
Growth
PSE&G
Transmission
Growth
PSE&G
Energy Strong,
Solar and
New Business
(1)
INCLUDES AFUDC AND IDC; PENNEAST PIPELINE EQUITY INVESTMENT OF~$0.1B IS
INCLUDED IN POWER GROWTH. E = ESTIMATE.
PSEG
Planned
Spend
Maintenance ~$3.8B
PSE&G
Potential
Upside
PSEG
Potential
Spend
Potential Upside ~$1.3B
~$1.6B
~$0.6B
~$2.2B
~$1.9B
~$6.7B
~$14.3B
~$1.3B
~$13.0B
Planned
Growth
Investment
~
$9.2B |
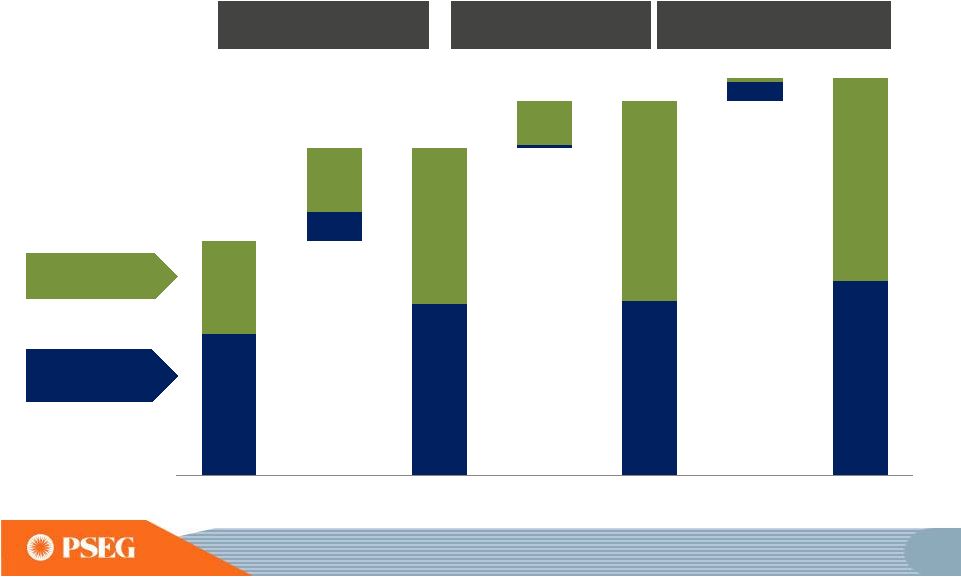 97
2014 –
2017E Rate Base
CAGR Growth of ~12%
Distribution
Transmission
PSE&G’s Capital Program drives double-digit growth in rate base
through 2019 ~$11.4B
~$16.0B
~$6.9B
~$4.5B
~$2.1B
~$9.7B
~$3.1B
~$8.5B
Rate Base
Growth
E = ESTIMATE
~$0.1B
2014
Rate Base
Planned
2017E
Rate Base
Potential
Upside
Potential
2019E
Rate Base
Planned
2019E
Rate Base
~$1.5B
~$8.4B
~$7.6B
~$18.2B
~$1.0B
~$9.5B
~$9.9B
~$19.4B
~$0.2B
2014 –
2019E Rate Base
CAGR Growth of ~10%
Rate Base
Growth
2014 –
2019E Potential Rate
Base CAGR Growth of ~11% |
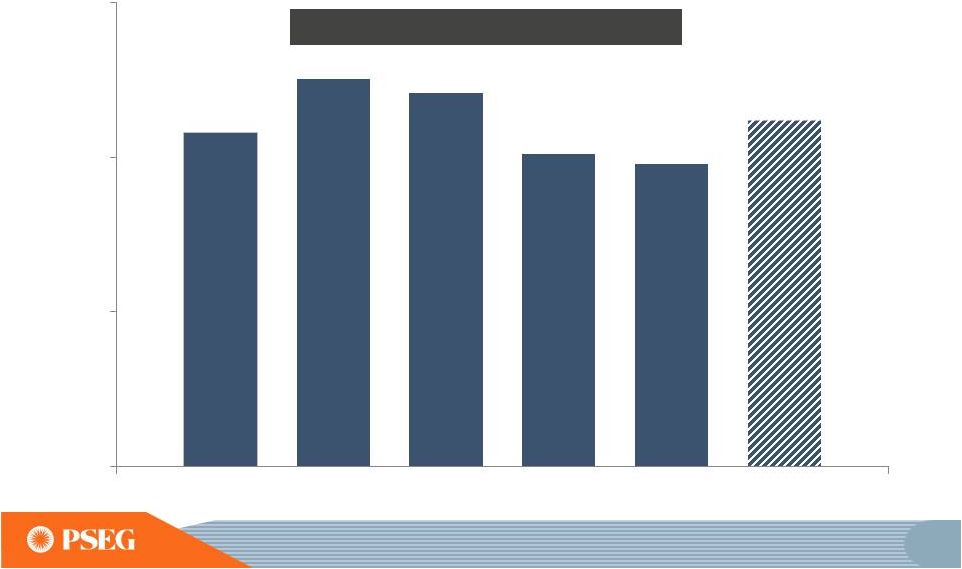 98
Continuing our track record of 5 year
double digit rate base growth leading to high single-digit growth in
earnings through 2017
2010 –
2015E
PSE&G 5 Year Rate Base CAGR
2011 –
2016E
2012 –
2017E
2013 –
2018E
2014 –
2019E
~11%
~13%
~12%
~10%
~10%
~11%
PLANNED
POTENTIAL
E = ESTIMATE.
0%
5%
10%
15% |
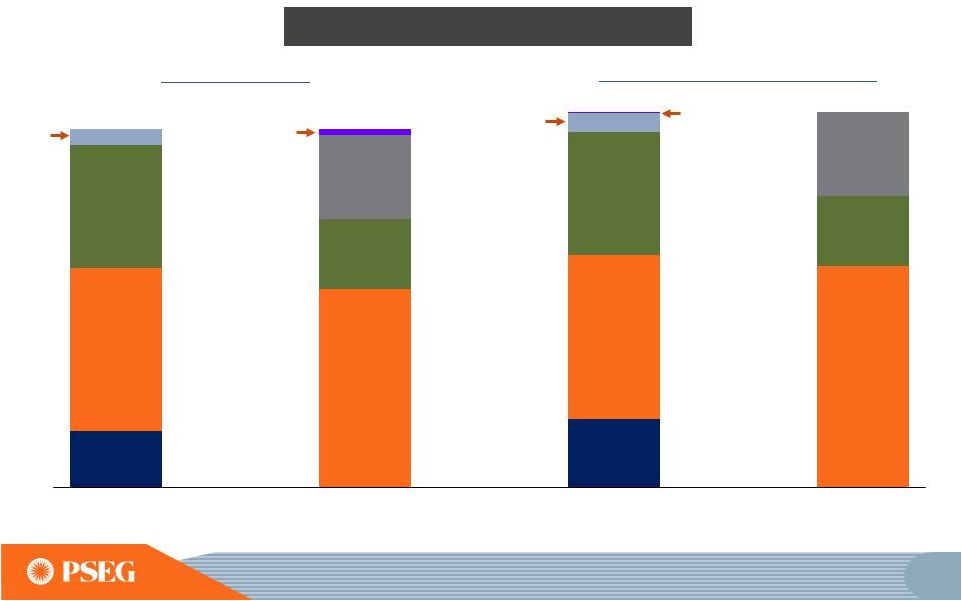 99
Substantial internal cash generation
supports our planned growth capital program and potential
investment opportunities without the need for equity
PSE&G
Cash from
Ops
(1)
PSE&G Cash
Investment
PSE&G
Net Debt
PSEG 2015 -
2019E Sources and Uses
(1)
PSE&G CASH FROM OPERATIONS ADJUSTS FOR SECURITIZATION PRINCIPAL REPAYMENTS
OF ~$260M FROM 2015-2019 (2)
OTHER CASH FLOW INCLUDES PSEG LI, HOLDINGS NET CASH FLOW, INVESTED CASH, AND
PARENT SHORT-TERM DEBT (3)
POWER CASH INVESTMENT INCLUDES NUCLEAR FUEL AND EMISSION
PURCHASES E = ESTIMATES. PSE&G
Cash from
Ops
(1)
PSE&G Net
Debt
Planned Programs
Including Potential Upside Projects
Shareholder
Dividend
Power
Cash from Ops
Shareholder
Dividend
Power
Cash from
Ops
Power Cash
Investment
(3)
PSE&G Cash
Investment
Power Net
Debt
Other Cash
Flow
(2)
Other Cash
Flow
(2)
Power Net
Debt
Power Cash
Investment
(3)
Sources
Uses
Sources
Uses |
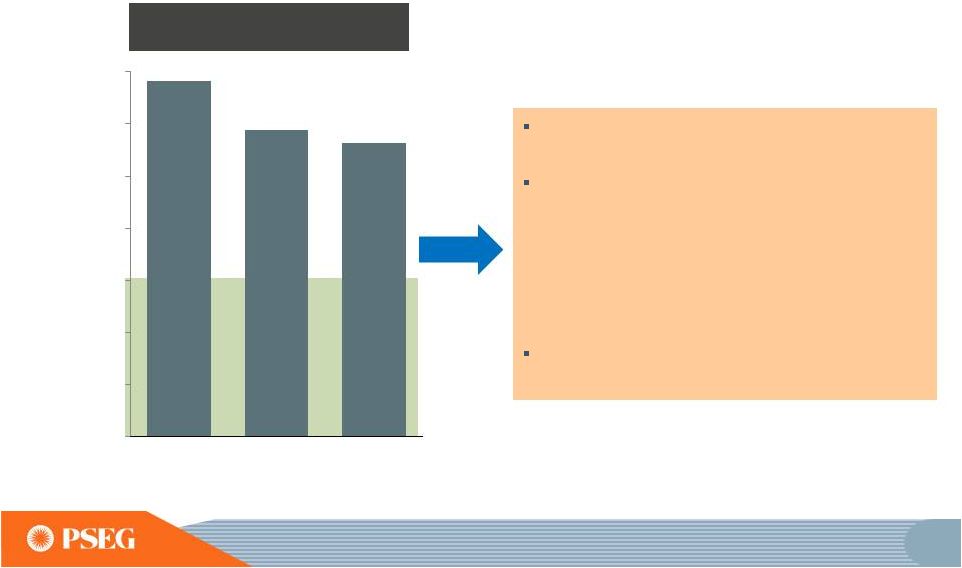 100
Power’s key credit metric
remains strong
providing opportunity for incremental investment
2015-2017E
Average
Increased contribution to earnings from the more
stable regulated business
Power’s annual Cash From Operations and Funds
From Operations each average ~$1.4B over the
2015 to 2017 period supported by:
-
Capacity Revenues
-
Hedged Generation
-
O&M Control
Financial strength can be used to pursue future
growth in both businesses beyond current plans
E = ESTIMATE
2013
2014
PSEG Power
Funds from Operations / Debt
0%
10%
20%
30%
40%
50%
60%
70% |
 101
Total Incremental Investment Capacity
through 2017
Substantial Investment Capacity to pursue
additional growth without the need for equity
Average Funds from Operations /Debt
2015 -
2017
Our incremental investment capacity can support over $6B in
regulated investments
$0.0
$4.0
Power
Parent
Total
($ Billions)
Power
PSEG
Estimate
~ 55%
~30%
Minimum
Threshold
30%
Low -
20’s |
 102
Pension Fund Returns
for the periods ending December 2014
Well Funded Pension due to our long term asset
allocation strategy
2014 Funded Ratio ~93%
Cumulative pension contributions
total
less
than
$50M
through
2017
(1)
Modest pension expense in 2015
with pension income expected by
2017 given fully funded level
Annualized Return (%)
(1)
REPRESENTS CONTRIBUTIONS TO QUALIFIED PENSION PLANS.
Total company pension expense of <$0.07 per share in 2015, expected
return to pension income by 2017
0
5
10
15
1 Year
3 Year
5 Year |
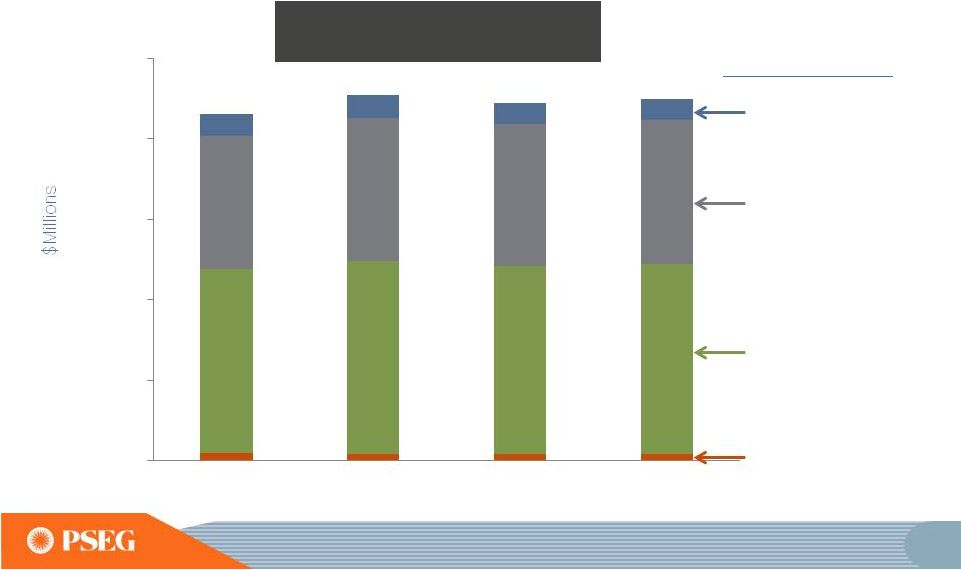 103
(1)
POWER EXCLUDES IMPACTS FROM STORM RECOVERY COSTS AND POTENTIAL RELATED
INSURANCE PROCEEDS. N.M.= NOT
MATERIAL E = ESTIMATE. 2014
– 2017E CAGR
Transmission
~(1.4%)
Distribution
~2.7%
Power
~1.0%
Other: N.M.
Controlling O&M growth, with manageable
pension impacts and PSE&G continuing to grow its asset base
PSEG
O&M
Expense
(1)
2014
-
2017E
CAGR:
~1.4%
$0
$500
$1,000
$1,500
$2,000
$2,500
2014
2015E
2016E
2017E |
 104
PSEG Operating Earnings
$ Millions (except EPS)
2013
2014
2015E
PSE&G
$612
$725
$735 -
$775
PSEG Power
$710
$642
$620 -
$680
Enterprise/Other
($13)
$33
$40 -
$45
Operating Earnings*
$1,309
$1,400
$1,395 -
$1,500
Operating EPS*
$2.58
$2.76
$2.75
-
$2.95
Regulated % of Earnings
47%
52%
52%
(1)
Increasing
PSE&G earnings with stable
contribution from Power
(1) REPRESENTS MID POINT OF GUIDANCE
*SEE SLIDE A FOR ITEMS EXCLUDED FROM INCOME FROM CONTINUING
OPERATIONS/NET INCOME TO RECONCILE TO OPERATING EARNINGS. E+
ESTMATE. |
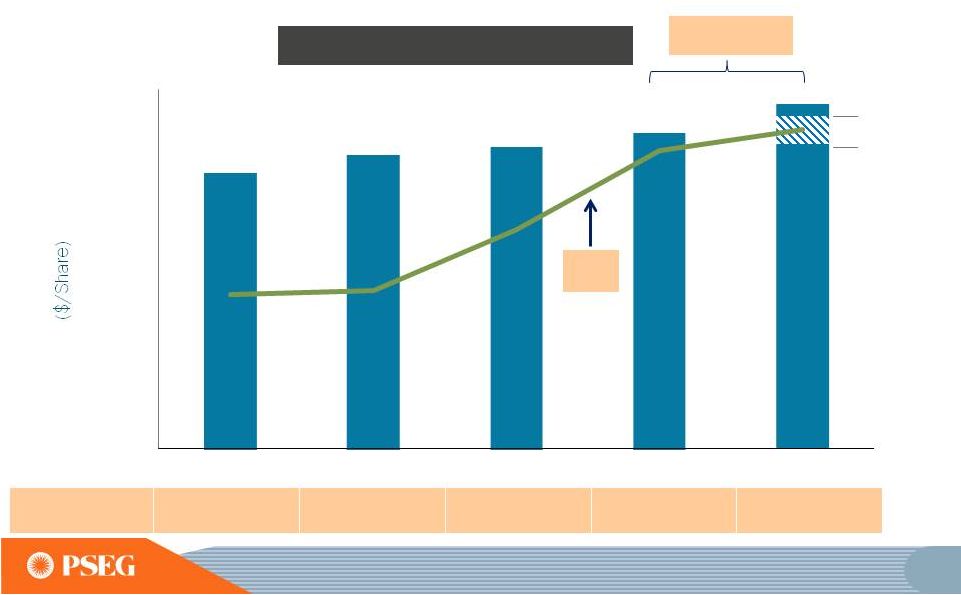 105
PSE&G
EPS
Annual Dividend Per Share
2011 –
2014 CAGR: 2.6%
(1)
THE 2015 PAYOUT RATIO IS BASED ON THE MIDPOINT OF PSEG'S 2015 OPERATING
EARNINGS GUIDANCE OF $2.75-$2.95E PER SHARE. SEE SLIDE A FOR ITEMS
EXCLUDED FROM INCOME FROM CONTINUING OPERATIONS/NET INCOME TO RECONCILE TO
OPERATING EARNINGS. E= ESTIMATE. Potential for
meaningful and sustainable
dividend growth given significant contribution from regulated
earnings and Power’s strong free cash flow
5.4%
increase
Payout Ratio
50%
58%
56%
54%
55%
(1)
$1.53
$1.45
$1.37
$1.42
$1.44
$1.48
$1.56
$0.60
$0.80
$1.00
$1.20
$1.40
$1.60
2011
2012
2013
2014
2015E |
 106
PSEG’s longer-term outlook is influenced by
Power’s hedge position and increased investment at
PSE&G 2015E
2016E
Segment EPS Drivers
Sensitivities derived from typical annual market variability*
*
Estimated
annual
variability
approximating
one
standard
deviation
based
on
2011
–
2013
historical
data
and
forward
curve estimates applied to PSEG Power open positions.
E = ESTIMATE. POWER EARNINGS SENSITIVITIES UPDATED FOR 2015
BGS AUCTION AND 12/31/14 PRICE CURVES. 2015E
2016E
2017E
2017E
Each $0.75/mcf Change in Natural Gas
Each $2/MWh Change in Spark Spread
Each $5/MWh Change in Dark Spread
Each 1% Change in Nuclear Capacity Factor
Each $100 Million of Incremental Investment
Each 1% Change in Sales
Electric
Gas
Each 1% Change in O&M
Each 10 basis point Change in Distribution ROE
Each 10 basis point Change in Transmission ROE
$0.01
$0.01
$0.01
$0.01
$0.01
$0.01
$0.03-$0.06
$0.04
$0.04
$0.01
$0.02-$0.04
$0.03
$0.01
$0.01
$0.01
$0.01
$0.01
$0.01
$0.01
$0.01
$0.10-$0.13
$0.04
$0.04
$0.01
$0.01
$0.01
$0.01
$0.01
$0.01
$0.01 |
 107
PSEG Summary
•
Our 2014 earnings of $2.76 exceeded our revised operating earnings
guidance of $2.60 -
$2.75 per share
•
Continued third year of anticipated positive earnings trend in 2015 with
operating earnings guidance of $2.75 to $2.95 per share
•
Continued 5
straight year of expected double digit, 5 year growth in rate base
•
Anticipated high single digit earnings growth at PSE&G on three-year
basis from 2014 to 2017, driven by transmission investments and planned
programs •
Power’s continued focus on operational excellence, market expertise
and financial strength delivers value in current price environment
•
Strong Balance Sheet and Cash Flow support full capital program and new
potential opportunities without the need for equity
•
Our $0.08 per share dividend increase is consistent with our long
history of returning cash to the shareholder through the common
dividend, with potential for consistent and sustainable growth
th |
 PSEG EXECUTIVE
PROFILES |
 109
CHAIRMAN, PRESIDENT AND CHIEF EXECUTIVE OFFICER
PUBLIC SERVICE ENTERPRISE GROUP INCORPORATED
Ralph Izzo
Ralph Izzo was elected chairman and chief executive officer of Public
Service Enterprise Group Incorporated (PSEG) in April 2007. He was
named as the company’s president and chief operating officer and a
member of the board of directors of PSEG in October 2006.
Previously, Mr. Izzo was president and chief operating officer of Public
Service Electric and Gas Company (PSE&G).
Since joining PSE&G in 1992 Mr. Izzo was elected to several executive
positions within PSEG’s family of companies, including PSE&G
senior vice president
–
utility
operations,
PSE&G
vice
president
–
appliance
service,
PSEG
vice
president
-
corporate
planning,
and
PSE&G
vice
president -
electric ventures. In these capacities he broadened his experience in the
areas of general management, strategic planning and finance.
Mr. Izzo is a well-known leader within the utility industry, as well as the
public policy arena. He is frequently asked to testify before
Congress and speak to organizations on matters pertaining to national
energy policy. Mr. Izzo’s career began as a research scientist at
the Princeton Plasma Physics Laboratory, performing numerical
simulations of fusion energy experiments. He has published or
presented over 35 papers on magnetohydrodynamic modeling. Mr. Izzo
received his Bachelor of Science and Master of Science degrees in
mechanical engineering and his Doctor of Philosophy degree in applied
physics from Columbia University. He also received a Master of
Business Administration degree, with a concentration in finance from
the Rutgers Graduate School of Management. He is listed in numerous
editions of Who’s Who and has been
the
recipient
of
national
fellowships
and
awards.
Mr.
Izzo
has
received Honorary Degrees from the New Jersey Institute of Technology
(Doctor of Science), Thomas A. Edison State College (Doctor of Humane
Letters),
Bloomfield
College
(Doctor
of
Humane
Letters),
Rutgers
University
(Doctor of Humane Letters), and Raritan Valley Community College
(Associate of Science).
Mr. Izzo serves as chair of the New Jersey Chamber of Commerce, and on
the board of directors for The Williams Companies, the New Jersey Utilities
Association, the Edison Electric Institute (EEI), the Nuclear Energy
Institute (NEI), and The Center for Energy Workforce Development. He is
the past Chair of the Rutgers University Board of Governors. He
is also a member of the Board of Trustees of Peddie School, Columbia
University School of Engineering Board of Visitors and the Princeton
University Adlinger Center for Energy and the Environment Advisory
Council, as well as a member of the
Visiting
Committee
for
the
Department
of
Nuclear
Engineering
at
MIT. |
 110
EXECUTIVE VICE PRESIDENT AND CHIEF FINANCIAL OFFICER
PUBLIC SERVICE ENTERPRISE GROUP INCORPORATED, PUBLIC SERVICE ELECTRIC
AND GAS COMPANY, PSEG POWER LLC AND PSEG SERVICES CORPORATION
Caroline Dorsa
Caroline Dorsa was named executive vice president and chief financial
officer for Public Service Enterprise Group Incorporated (PSEG) in April
2009. She is also the executive vice president and chief financial officer
of Public Service Electric and Gas Company (PSE&G), PSEG Power and
PSEG Services Corporation.
Ms. Dorsa is responsible for all financial functions, including Internal Audit
Services, Investor Relations and Corporate Development. Given the array
of financial instruments which serve as the primary means of selling
wholesale
energy
to
customers,
Ms.
Dorsa
also
has
responsibility
for
the
Risk Management function, which provides independent oversight of the
PSEG Power trading organization. In addition to her financial
responsibilities, Ms. Dorsa leads the Information Technology and
Procurement organizations. She is a member of PSEG’s Executive
Officer Group.
In her role as chief financial officer, she has overseen the execution of the
Company’s financial strategy, which has involved a significant
deleveraging of the balance sheet and enhancement of the company’s
financial strength. The company is in the midst of a major capital
investment program focused on deploying more than $6 billion over three
years to ensure the reliability and efficiency of the energy generation
and distribution system in New Jersey. PSEG has an uninterrupted
record of paying dividends to shareholders for 108 years.
Ms. Dorsa had been a member of the PSEG Board of Directors for six years,
and a member of PSEG's Audit, Corporate Governance and Finance
Committees before joining the company’s management. Her previous
management position had been with Merck & Co., where she was senior
vice
president
–
global
human
health,
strategy
and
integration.
Prior
to
this,
Ms. Dorsa served as senior vice president and chief financial officer at
Avaya, Inc. Earlier in her career, she held a range of financial
positions at Merck, including serving as vice president and treasurer
of the company for over 12 years. She was also the Secretary of the
Finance Committee of Merck's Board of Directors.
Before joining Merck, Ms. Dorsa worked for Mayor Edward Koch of the City
of New York promoting economic development in midtown Manhattan.
Ms. Dorsa is a member of the Junior Achievement of New Jersey State
Board of Directors. She is a member of the Board of Directors and the
financial expert for the Finance and Audit Committee of Biogen Idec
(NASDAQ: BIIB), a biopharmaceutical company located in Cambridge,
MA. Ms. Dorsa is also a member of the Board of Directors and
Chairman of the Audit Committee of Joule, a privately financed solar
fuels company based in Bedford, MA.
Ms.
Dorsa
holds
a
B.A.
from
Colgate
University
and
an
M.B.A
from
Columbia
Business School. |
 111
EXECUTIVE VICE PRESIDENT
AND GENERAL COUNSEL
PUBLIC SERVICE ENTERPRISE GROUP INCORPORATED, PUBLIC SERVICE
ELECTRIC AND GAS COMPANY, PSEG POWER, PSEG SERVICES
CORPORATION
Tamara L. Linde
Tamara Linda was named executive vice president and general counsel
for Public Service Enterprise Group Incorporated (PSEG) in July 2014.
She is also the executive vice president and general counsel of Public
Service Electric and Gas Company (PSE&G), PSEG Power and PSEG
Services Corporation.
As PSEG’s chief legal officer, Ms. Linde has responsibility for all legal
and regulatory
functions,
and
has
general
supervisory
responsibilities
for
the
office
of
corporate
secretary,
business
assurance
and
resilience
and
federal affairs and sustainability. Ms. Linde is a member of PSEG’s
Executive Officer Group.
Previously
Ms.
Linde
was
vice
president
–
regulatory,
PSEG.
She
has
led
the company’s federal and state regulatory functions, as well as
managed corporate, environmental and labor/employment practices
within the company.
Ms. Linde has served as regulatory counsel on many
of the company’s most important initiatives in recent years.
Ms. Linde joined the law department of Public Service Electric and Gas
Company (PSE&G), as an attorney in 1990 handling a variety of natural gas
and
electric
regulatory
and
transactional
matters.
After
holding
several
other
legal positions at PSE&G she became general solicitor, in 2000. In that
position she was responsible for the regulatory affairs of the PSEG
companies including electric, gas and nuclear matters. She has
had significant experience working on regulatory matters before various
state and federal regulatory agencies on industry issues relating to
electric transmission and distribution and energy markets.
Ms. Linde is a member of the New Jersey, New York, District of Columbia
and Texas bars. She is past President of the Northeast Chapter of the
Energy Bar Association and served as chair of the Energy Bar
Association Electricity Regulation and Compliance Committee. Ms.
Linde graduated from Seton Hall University School of Law with a Juris
Doctorate and from Seton Hall University with a bachelor’s
degree. |
 112
Ralph A. LaRossa
PRESIDENT AND CHIEF OPERATING OFFICER
PUBLIC SERVICE ELECTRIC AND GAS COMPANY
Mr. LaRossa joined PSE&G in 1985 as an associate engineer and
advanced through a variety of management positions in the utility’s gas
and electric operations. In 1998, he received Gas Industry
Magazine’s Outstanding Manager of the Year Award.
Mr.
LaRossa
is
a
graduate
of
Stevens
Institute
of
Technology
and
has
completed the Harvard Business School’s Program for Management
Development. He serves on the board of directors for the American Gas
Association (AGA), New Jersey Utilities Association (NJUA), New Jersey
Performing Arts Center (NJPAC), Partnership for a Drug-Free NJ, and
Bergen County’s United Way. Mr. LaRossa is Chairman of Choose New
Jersey, Inc. and serves on its board of directors. He is also the
Chairman of Montclair State University and serves on its board of
trustees. Ralph
A.
LaRossa
was
named
president
and
chief
operating
officer
of
Public Service Electric and Gas Company (PSE&G) in October 2006.
PSE&G is New Jersey’s oldest and largest regulated gas and electric
delivery utility, serving approximately 2.4 million customers, nearly
three- quarters of the state’s population. Prior to this
position he was vice president -
electric delivery for PSE&G.
In addition, on January 1, 2014, Mr. LaRossa became Chairman of the
Board of PSEG Long Island, a subsidiary of Public Service Enterprise
Group (PSEG), which manages the electric transmission and distribution
systems on Long Island and in the Rockaways. PSEG Long Island serves
1.1 million customers. |
 113
William Levis
PRESIDENT AND CHIEF OPERATING OFFICER
PSEG
POWER
Mr. Levis has a Bachelor of Science degree in marine engineering
from the U.S. Naval Academy and holds an SRO (senior reactor
operator) certification. He retired as a commander in the Naval
Reserves and attained his professional engineer license in 1985.
Mr. Levis is a member of Nuclear Energy Institute’s (NEI) Board of
Directors and serves as a member of the Institute of Nuclear Power
Operations (INPO) National Nuclear Accrediting Board. He is a
member of the Philadelphia Archdiocese Catholic Charities Appeals
Board and its Operations Committee and is a member of the CEO
Council for Growth based in Philadelphia.
William Levis is president and chief operating officer of PSEG Power, a
position he’s held since June 2007. PSEG Power is a major,
unregulated independent power producer in the U.S. with four main
subsidiaries: PSEG Nuclear, PSEG Fossil, PSEG Energy Resources and
Trade (ER&T) and PSEG Power Ventures.
PSEG Power operates one of the most balanced portfolios in the
country, both in terms of fuel mix and market segment (based load
units, load following units and peaking units). Its low-cost, load
following
fleet
is
geographically
well
positioned
in
competitive
markets.
Its 13,337 MWs represent a diverse fuel mix which includes 45 percent
natural
gas,
27
percent
nuclear;
18
percent
coal,
8
percent
oil,
1 percent pumped storage, and 1 percent solar.
Before coming to PSEG, Mr. Levis was Exelon Nuclear’s vice-president
– Mid-Atlantic operations. Prior to joining Exelon, Mr.
Levis worked at Ontario Hydro’s Pickering Plant and held several
positions over a five- year period with Carolina Power and
Light’s Brunswick facility. |
 114
Shahid Malik
PRESIDENT
PSEG ENERGY RESOURCES & TRADE
company’s strategy and operations and led a successful turnaround of
the company, achieving significant growth in products and services while
reducing costs.
Mr. Malik’s career has included Executive Leadership positions with
several energy
companies
in
the
US
and
Europe.
In
addition,
he
served
on
the
Board
of Directors of South Jersey Industries (NYSE: SJI) immediately prior to
joining PSEG.
Mr. Malik has been in the energy business for more than 20 years, since
receiving his Economics degree from Manchester University in England and
an MBA from Rice University, Houston. He sits on the Executive
Committee of the Board of Trustees of Newark Museum as well as the
Board of the Electric Power Suppliers Association in Washington DC.
Shahid Malik was elected President of PSEG Energy Resources & Trade
(ER&T) in 2011. PSEG operates one of the most balanced
generation and marketing portfolios in the country, both in terms of
fuel mix and market segment (base load units, load following units and
peaking units), and Mr. Malik is essentially responsible for managing
these assets and taking them to market. He oversees PSEG’s
generation portfolio and the purchase, sale and risk management of all
energy commodities. Mr. Malik has an extensive background in the energy
industry across the oil, gas, electric and renewable energy sectors in
Europe and the United States. Previously, he was with Pittiglio,
Rabin, Todd & McGrath (PRTM) in Pittsburgh,
PA
and
was
responsible
for
all
aspects
of
the
global
energy
business, with a primary focus on the North American utility sector.
Prior to that he served as President & CEO of Strategic Energy,
Great Plains Energy’s retail marketing subsidiary and a provider of
energy and services to business clients in North America. He was
accountable for the |
 115
Derek M. DiRisio
PRESIDENT
PSEG SERVICES CORPORATION
Derek M. Di Risio was named President, PSEG Services Corporation, in July
2014. He is responsible for the coordination and delivery of
several centralized services currently residing within PSEG Services
Corporation including corporate communications, corporate citizenship,
corporate real estate, information technology, procurement, payroll and
other transactional services.
Prior to his current role, Mr. Di Risio was vice president and controller of
Public Service Enterprise Group (PSEG), Public Service Electric and Gas
Company (PSE&G), PSEG Services Corporation, PSEG Energy
Holdings (Holdings) and PSEG Power, a position he assumed in December
2006. He
was
previously
vice
president
and
assistant
controller,
since
July 2004.
Mr.
Di
Risio
had
been
vice
president
–
planning
and
analysis
of
Holdings
since
March
2004,
and
vice
president
–
controller
for
Holdings
since
July
1998.
Prior
to
that
he
was
director
–
accounting
services
and
responsible
for several accounting and planning functions for Holdings, including
overall coordination of the business planning process, accounting research
and policy development, financial forecasts and analysis.
Mr. Di Risio was also responsible for the budgeting, analysis and reporting
process for PSE&G.
Mr. Di Risio joined PSE&G in September 1991 and has held a variety of
positions, including assignments with the internal auditing, electric
business, and corporate planning departments. He was instrumental
in reengineering the Enterprise business planning process, and
advancing the use of performance metrics and balanced scorecard
measures to improve business results. Prior to joining PSE&G he
worked for several firms, including Chase Manhattan Bank.
Mr. Di Risio graduated from Rutgers University with a degree in
accounting/computer science, and received a Master of Business
Administration degree from the same university. He is a certified public
accountant (inactive) and a certified internal auditor. Mr. Di
Risio also completed the Program for Management Development at the
Graduate School of Business Administration of Harvard University.
He served on the Drew University Board of Trustees and is currently a
co-chairman of the Board of Directors of the New Jersey All Stars
Project Inc. |
 116
PRESIDENT AND CHIEF NUCLEAR OFFICER
PSEG NUCLEAR
Thomas P. Joyce
Thomas
P.
Joyce
was
named
president
and
chief
nuclear
officer
of
PSEG
Nuclear (Nuclear), in October 2008. Mr. Joyce has announced his
retirement from PSEG effective the end of March 2015. He had been
senior vice president –
operations of Salem/Hope Creek for Nuclear, since
June
2007.
Mr.
Joyce
was
also
vice
president
–
Salem,
since
January
2007, and previously assumed the role of PSEG Nuclear’s site vice
president as part of the Nuclear Operating Services Agreement between
PSEG and Exelon Corporation in 2005.
PSEG Nuclear’s Salem and Hope Creek Generating stations comprise the
second largest commercial nuclear power facility in the United States.
Together the units provide enough electricity for three million homes.
Together the plants also provide 49 percent of New Jersey’s
electricity. Mr. Joyce has more than 38 years of experience in commercial
nuclear power operations. Under his leadership as president and chief
nuclear officer, Salem and Hope Creek combined to set a new site
generation record in 2009. In 2011, the stations also received approval
from the Nuclear Regulatory Commission (NRC) to extend their operating
licenses an additional 20 years. Reinforcing the company’s strong
ties to the local community, the license renewal approvals did not
encounter any formal legal contentions like many other plants across the
country. While leading Salem, the station completed two successful
reactor vessel head replacement outages. Salem Unit 1 completed its
outage capturing the world record for shortest head replacement
outage. Prior to coming to PSEG Mr. Joyce was site vice president at
Exelon Nuclear’s Braidwood Station. During his tenure the station
achieved overall performance improvements and retained their excellent
INPO rating.
The
plant
completed
a
refueling
in
15
days,
14
hours
–
setting
a
record for outage efficiency among U.S. pressurized water reactors.
Before serving at Braidwood he held leadership positions at
Exelon’s Byron, Dresden, and Zion Stations, and in the corporate
offices of both Exelon Corporation and Exelon Nuclear.
Mr. Joyce holds a Bachelor of Science degree in nuclear engineering from
the University of Missouri at Rolla, and a Master of Business
Administration degree from the Keller Graduate School of Management.
While at Byron, he earned his senior reactor operators (SRO)
license. A
recognized
leader
in
the
nuclear
industry,
Mr.
Joyce
currently
serves
as
chairman of the Utilities Service Alliance (USA). The organization is
comprised of eight of America’s leading electric utilities operating 14
nuclear reactors located at 10 stations. Its two major objectives are
to improve individual plant and fleet performance and to reduce
operating and maintenance costs. Mr. Joyce also chairs the Nuclear
Energy Institute’s (NEI) Emergency Preparedness Working Group and
the EPRI Nuclear Power Council. |
 117
Richard P. Lopriore
PRESIDENT
PSEG FOSSIL
Mr. Lopriore has been a valuable part of the electric generation
industry for
more than 43 years. Prior to joining PSEG Fossil, he had been senior vice
president -
mid-Atlantic operations for Exelon Nuclear, responsible for oversight
of the Limerick, Peach Bottom, Oyster Creek and Three Mile Island
stations. During his tenure, Three Mile Island achieved INPO 1
status (2007). From 1997-1999, Mr. Lopriore was an Executive Advisor
for Ontario Hydro Nuclear Power Plant’s recovery and performance
improvement program. Mr. Lopriore joined Exelon as plant manager
of Byron Stations in 1999 and was
promoted to site vice president in 2001. In 2003 he became corporate vice
president -
operations support at Exelon’s nuclear headquarters, responsible for
both the Midwest and mid-Atlantic regions. He then became vice
president - operations, Midwest boiling water reactors in 2004
responsible for the Dresden, LaSalle County, Quad Cities and Clinton
nuclear plants. Prior to Exelon, Mr. Lopriore held several key
management positions at the Brunswick Nuclear Plant in North Carolina,
including plant manager. At Vermont Yankee, he achieved an operational
SRO certification for Boiling Water
Reactors.
Mr. Lopriore received his Bachelor of Science degree from Southern Vermont
College and is a member of the American Nuclear Society.
He also served in the National Guard.
Richard P. Lopriore was elected president of PSEG Fossil in May 2007. He
oversees operations for 13 generation facilities spanning four states.
He is also responsible
for the oversight of two service groups: Laboratory & Testing Services, and
Maintenance & Repair Services. Additionally, he is responsible for
Construction, Capital Projects and Engineering.
The PSEG Fossil fleet is comprised of natural gas, coal and oil-fired
electric generating units that contribute about 9,700 megawatts of
electricity to PSEG Power’s generation portfolio. This includes an
ownership interest of 1,000 megawatts in three jointly-owned
facilities. Under Lopriore’s leadership, nine LM6000 peaking units
were constructed. Fossil also outfitted its two New Jersey coal
plants with about $1.5 billion in new pollution control equipment
resulting in substantial reductions in emissions. These plants are
among the cleanest, most responsible coal stations in the country.
Mr. Lopriore instituted an in-depth Operational Excellence Model (OEM), one
of the first programs in the nation to drive standardization across a
Fossil fleet. The program resulted in consistent improvement in
operating results, reliability and fleet
performance and the achievement of all-time generation records. He also
revamped PSEG Fossil’s training program. Two industry-first,
award-winning mobile training trailers were developed to take
training directly to the work sites reducing costs and increasing
productivity. |
 118
Robert C. Braun
SENIOR VICE PRESIDENT & CHIEF OPERATING OFFICER
PSEG NUCLEAR
Robert C. Braun was elected President and Chief Nuclear
Officer to succeed Thomas Joyce, upon Mr. Joyce’s retirement
at the end of March 2015. Mr. Braun will continue to be
responsible for the day-to-day operations of PSEG’s Salem and
Hope Creek Generating Stations. He will report directly to
William Levis, and be a member of PSEG’s Executive Officers
Group. Mr. Braun was named senior vice president and chief
operating officer of PSEG Nuclear, in September 2012. He had
been
senior
vice
president
–
PSEG
Nuclear
since
2009.
Mr. Braun joined PSEG Nuclear in March 2007 as vice
president of Operations Support. Mr. Braun has more than 30
years of experience in commercial nuclear power operations.
Previously, Mr. Braun was site vice president of Exelon Corporation’s
Peach Bottom Atomic Power Station. Prior to his appointment at
Peach
Bottom,
he
was
vice
president
–
nuclear
oversight
of
Exelon’s
nuclear group headquarters and previously served as plant manager
of the company’s Limerick Generating Station, where he held a senior
reactor
operator
license.
Mr.
Braun
began
his
career
at
Limerick
in
1982.
Mr. Braun has a Bachelor of Mechanical Engineering degree from
Villanova University and earned his Senior Reactor Operator (SRO)
license while at Exelon. |
 119
Margaret M. Pego,
SPHR
SENIOR
VICE
PRESIDENT
–
HUMAN
RESOURCES
AND
CHIEF HUMAN RESOURCES OFFICER
PSEG SERVICES CORPORATION
Margaret
M.
Pego
was
named
senior
vice
president
–
human
resources
and chief human resources officer of PSEG Services Corporation in
December
2006.
Prior,
she
had
been
vice
president
–
human
resources.
Ms. Pego joined PSEG in 1974, and has held a variety of management
positions in the human resources department.
Ms. Pego holds a Bachelor of Arts degree in business administration
from William Paterson College, and a Master of Business Administration
degree with a concentration in management and labor relations from
Seton Hall University. In addition, she holds a certificate in EEO studies
from Cornell University, and has completed the Human Resources
Executive Program at the University of Michigan. She is also certified as a
senior professional in human resources.
Ms. Pego was named one of 2013’s HR Top 10 Breakaway Leaders by
Evanta, a leading organization that fosters leadership development and
collaborative exchange among North America’s top executives.
Ms. Pego is active in several local and national organizations, including the
EEI Chief HR Executive Advisory Committee; the American Gas Association
HR Policy Committee; the Conference Board Advisory Council of HR
Management –
Council of HR Executives; and the Society for Human
Resources Management. In addition, she is Chair of the Children’s
Specialized Hospital Board, a member of the Children’s Specialized
Hospital Foundation Board, RWJ Health Care Corporation Board and
Rutgers Business School. She is the former Chair of the Center for
Energy Workforce Development (CEWD) Executive Council. She is a former
member of the Supreme Court of New Jersey Attorney Ethics Committee.
Ms. Pego is a 2002 Leadership New Jersey fellow, 1997 TWIN Honoree,
2006 Executive Woman of New Jersey Honoree and 2008 NJ Best 50
Women in Business Honoree. |
 120
PSE&G
APPENDIX |
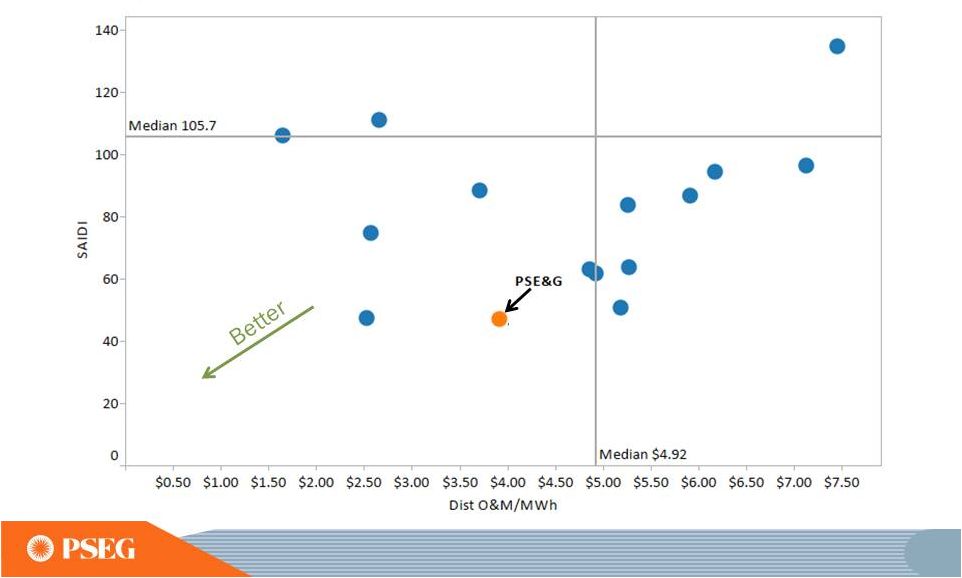 121
PSE&G provides high reliability at below
average cost which creates superior value to customers
SAIDI
=
SYSTEM
AVERAGE
INTERRUPTION
DURATION
INDEX,
A
MEASURE
OF
AVERAGE
OUTAGE
DURATION
FOR
ALL
CUSTOMERS
SERVED,
EXCLUDING
MAJOR
EVENTS.
SOURCES:
PSE&G
PEER
PANEL
STUDY,
FIRST
QUARTILE
BENCHMARK
STUDY
AND
VARIOUS
REGULATORY REPORTS.. |
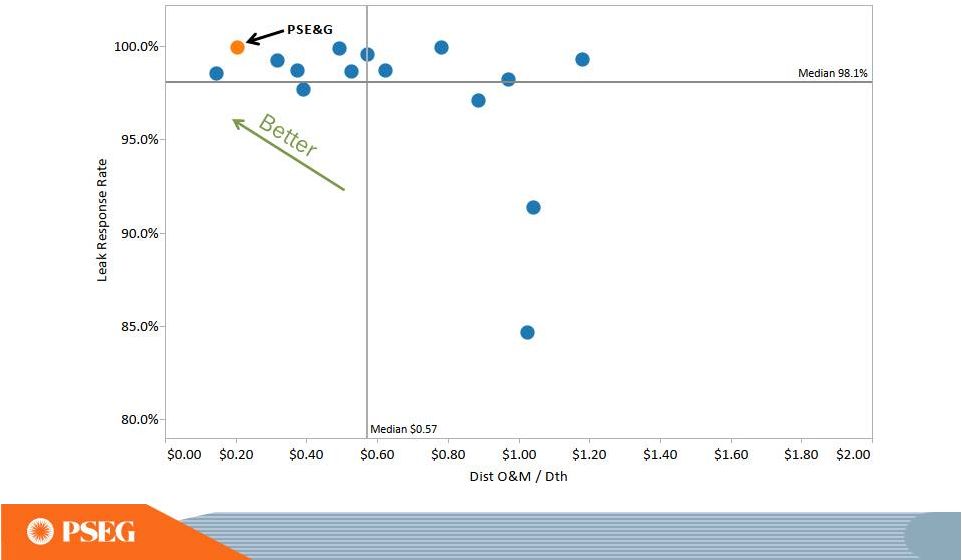 122
PSE&G prioritizes public safety
while maintaining value to customers
LEAK
RESPONSE
RATE
=
PERCENTAGE
OF
UTILITY
RESPONSES
TO
REPORTED
LEAKS
WITHIN
ONE
HOUR.
SOURCES:
PSE&G
PEER
PANEL
STUDY
AND AGA BENCHMARK STUDY. |
 123
PSEG POWER
AND ER&T
APPENDIX |
 124
$0
$5
$10
2015
2016
2017
Nuclear fuel needs have been hedged through 2017
Anticipated Nuclear Fuel Cost
Hedged |
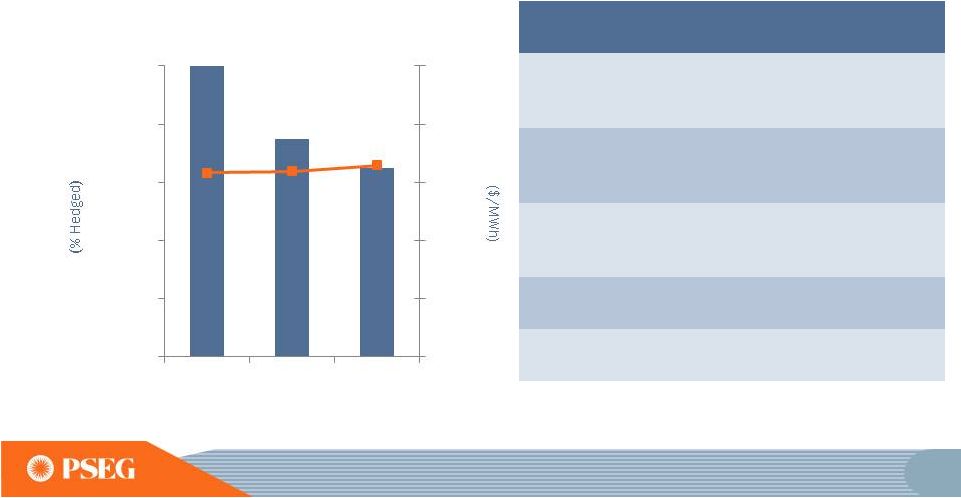 125
Power’s coal hedging reflects 2015 supply
matched with 2015 sales
Contracted Coal
Station
Coal Type
Pricing
($/MWh)*
Comments
Bridgeport
Harbor
Adaro
Low $40’s
Higher price,
lower BTU,
enviro coal
Hudson
CAPP
Mid $40’s
Coal/Gas
Fuel
Flexibility
Mercer
Metallurgical
CAPP/NAPP
Mid $40’s
More limited
segment of
coal market
Keystone
NAPP
Mid $20’s
Prices
steady
Conemaugh
NAPP
Mid $20’s
Prices
steady
% Hedged
(left scale)
$/MWh
(right scale)
*COMMODITY PLUS TRANSPORTATION
$0
$10
$20
$30
$40
$50
0%
20%
40%
60%
80%
100%
2015
2016
2017 |
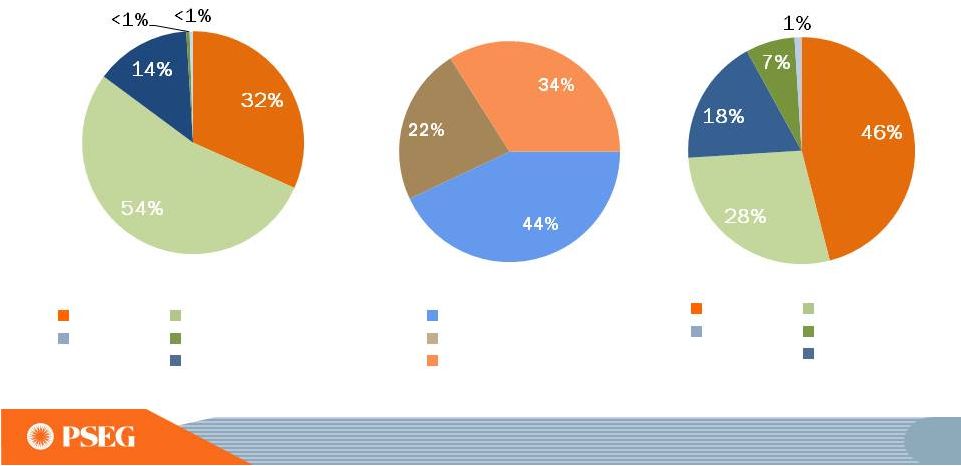 126
PSEG Power value advantaged
by asset diversity, fuel flexibility and location
Fuel Diversity*
Total MW: 13,146
Energy Produced*
Total GWh: 54,162
Energy Market
Served* Total
MW: 13,146 *2014, EXCLUDES SOLAR AND KALAELOA.
**INCLUDES NEW JERSEY UNITS THAT FUEL SWITCH TO GAS.
Load Following
Peaking
Base load
Gas
Pumped
Storage
Nuclear
Oil
Coal**
Gas
Pumped
Storage
Nuclear
Oil
Coal** |
 127
The full requirements BGS rate recognizes the
forward PJM capacity market price
Capacity Price per BGS Tranche
2015-2016
166
$
Three Year Average ($/MW-day)
$173
2016-2017
177
$
Average MW per Tranche (varies by EDC)
111
2017-2018
175
$
Days per Year
365
173
$
7,007,656
$
MWh per Tranche
Average MW per Tranche (varies by EDC)
111
Hours per Year
8,768
Load Factor (varies by EDC)
~37%
MWh per Tranche, approx.
355,000
Capacity Cost per MWh
20
$
Capacity Price per RPM
Auction for PSEG Zone Average Capacity Price ($/MW-day)
Average Capacity Cost per Tranche |
 128
PSEG
FINANCIAL
APPENDIX |
 129
Power Cash
from Ops
~$1.4B
Power Cash
Investment
(1)
~0.7B
Dividend
to Parent
~$0.9B
Power 2014 Cash Flows
Free Cash Flow
~$0.7B
Cash Used
~$0.2B
(2)
In 2014, Power had significant free cash flow
(1) POWER CAPITAL INVESTMENT INCLUDES NUCLEAR FUEL AND EMISSION
PURCHASES (2) POWER INVESTED CASH BALANCE DECREASED FROM ~$0.8B TO
~$0.6B ~$0.7B
Shareholder
dividend
~$0.2B Capital
contribution to
PSE&G
$0.0
$0.5
$1.0
$1.5 |
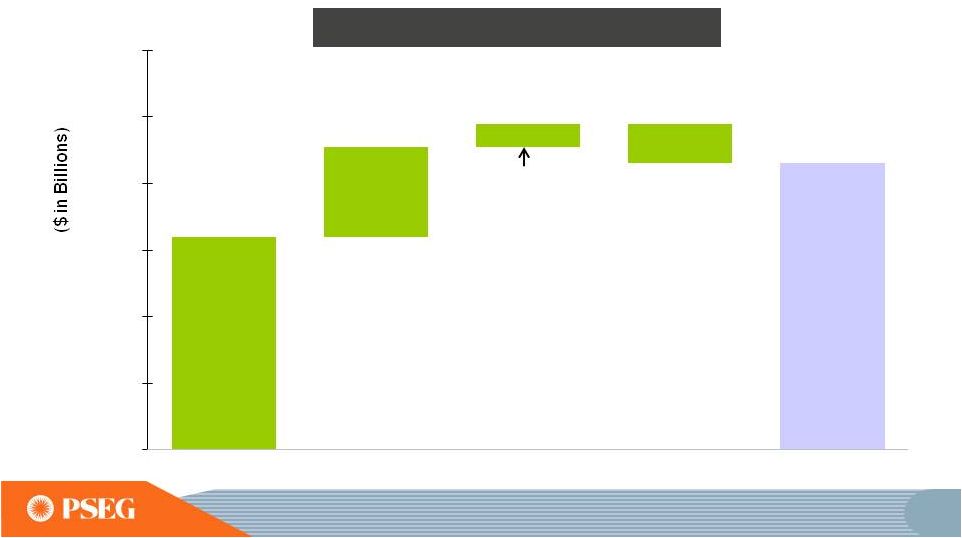 130
PSE&G Cash
from Ops
(1)
~$1.6B
PSE&G Cash
Investment
~$2.2B
In 2014, PSE&G used $1.6B of internally
generated cash flow
and debt to invest over $2B while
maintaining its capital structure
(1) PSE&G CASH FROM OPERATIONS ADJUSTS FOR SECURITIZATION PRINCIPAL
REPAYMENTS OF ~$240 MILLION. Cash Invested
~$0.3B
PSE&G 2014 Cash Flows
PSE&G
Net Debt
~$0.7B
Parent Capital
Contribution
~$0.2B
$0.0
$0.5
$1.0
$1.5
$2.0
$2.5
$3.0 |
 131
December 31, 2014
$
Billions
PSEG
PSE&G
Power
Cash and Cash Equivalents
$0.4
$0.3
$0.0
Short Term Debt
$0.0
$0.0
N/A
Long Term Debt
(1)
8.9
6.3
2.5
Common Equity
12.2
6.8
5.6
Total Capitalization
$21.1
$13.1
$8.1
Total Debt / Capitalization
42%
48%
31%
PSE&G Regulated Equity Ratio
(2)
51.4%
Our balance sheet remains strong
(1)INCLUDES L-T DEBT DUE WITHIN 1 YEAR; EXCLUDES SECURITIZATION DEBT OF
$259 MILLION AND NON-RECOURSE DEBT OF $16 MILLION. (2)REGULATED
EQUITY RATIO INCLUDES CUSTOMER DEPOSITS OF ~$98 MILLION AND EXCLUDES SHORT-TERM DEBT. |
 132
PSEG Liquidity as of December 31, 2014
Expiration
Total
Available
Company
Facility
Date
Facility
Usage
Liquidity
($Millions)
PSE&G
5-year Credit Facility
Mar-18
$600
1
$14
$586
5-Year Credit Facility (Power)
Apr-19
$1,600
$97
$1,503
5-Year Credit Facility (Power)
Mar-18
$1,000
$0
$1,000
5-Year Bilateral (Power)
Sep-15
$100
$100
$0
5-year Credit Facility (PSEG)
Apr-19
$500
$8
$492
5-year Credit Facility (PSEG)
Mar-18
$500
3
$0
$500
Total
$4,300
$219
$4,081
1 PSE&G Facility to be reduced by $29M on April 15, 2016
$71
2 Power Facility to be reduced by $48M on April 15, 2016
PSE&G ST Investment
$294
3 PSEG Facility to be reduced by $23M on April 15, 2016
Total Liquidity Available
$4,446
Total Parent / Power Liquidity
$3,566
PSEG /
Power
PSEG Money Pool ST Investment
2 |
 133
PSEG Energy Holdings
Investment Portfolio
Equipment
Investment
Balance*
at 12/31/14
($Millions)
Merchant Energy Leases
NRG REMA
Keystone, Conemaugh & Shawville (PA)
3 coal-fired plants (1,162 equity MW)
354
NRG Energy, Inc./Midwest Gen**
Powerton & Joliet Generating Stations
(IL)
2 coal-fired generating facilities (1,640 equity MW)
218
Regulated Energy Leases
Merrill Creek
Reservoir in NJ (PECO, MetEd, Delmarva Power & Light)
146
Grand Gulf
Nuclear station in Mississippi (175 equity MW)
55
Real Estate Leveraged Leases
GM Renaissance Center; Wal-Marts; E-D (shopping) Centers
62
Real Estate Operating Leases
Office
Towers,
Shopping
Centers
-
28
properties
42
Generation Legacy Assets
GWF (in wind down stage), GSOE
2
Other
Land
5
Total Holdings Investments
$884
* BOOK BALANCE EXCLUDING DEFERRED TAX ACCOUNTS.
**EME WAS ACQUIRED BY NRG ON APRIL 1 2014. |
 134
PSEG 2014 operating earnings up 7%
*
SEE SLIDE A FOR ITEMS EXCLUDED FROM INCOME FROM CONTINUING OPERATIONS/NET
INCOME TO RECONCILE TO OPERATING EARNINGS. Operating Earnings
Earnings per Share
$ Millions (except EPS)
2014
2013
2014
2013
PSE&G
$ 725
$ 612
$ 1.43
$ 1.21
PSEG Power
642
710
1.27
1.40
PSEG Enterprise/Other
33
(13)
0.06
(0.03)
Operating Earnings*
$ 1,400
$ 1,309
$ 2.76
$ 2.58
Twelve Months ended December 31 |
 Items Excluded from Income from Continuing
Operations/Net Income to Reconcile to Operating Earnings
PLEASE SEE PAGE 3 FOR AN EXPLANATION OF PSEG’S USE OF OPERATING EARNINGS
AS A NON-GAAP FINANCIAL MEASURE AND HOW IT DIFFERS FROM NET
INCOME. (a)
Includes the financial impact from positions with forward delivery
months. A
2014
2013
2012
2011
2010
2009
Earnings Impact ($ Millions)
Operating Earnings
1,400
$
1,309
$
1,236
$
1,389
$
1,584
$
1,567
$
Gain (Loss) on Nuclear Decommissioning Trust (NDT)
Fund Related Activity (PSEG Power)
68
40
52
50
46
9
Gain (Loss) on Mark-to-Market (MTM)
(a)
(PSEG Power)
66
(74)
(10)
107
(1)
(11)
Lease Transaction Activity (PSEG Enterprise/Other)
-
-
36
(173)
-
29
Storm O&M (PSEG Power)
(16)
(32)
(39)
-
-
-
Market Transition Charge Refund (PSE&G)
-
-
-
-
(72)
-
Gain (Loss) on Asset Sales and Impairments (PSEG Enterprise/Other)
-
-
-
34
-
-
Income from Continuing Operations
1,518
$
1,243
$
1,275
$
1,407
$
1,557
$
1,594
$
Discontinued Operations
-
-
-
96
7
(2)
Net Income
1,518
$
1,243
$
1,275
$
1,503
$
1,564
$
1,592
$
Fully Diluted Average Shares Outstanding (in Millions)
508
508
507
507
507
507
Per Share Impact (Diluted)
Operating Earnings
2.76
$
2.58
$
2.44
$
2.74
$
3.12
$
3.09
$
Gain (Loss) on NDT Fund Related Activity (PSEG Power)
0.13
0.08
0.10
0.10
0.09
0.02
Gain (Loss) on MTM
(a)
(PSEG Power)
0.13
(0.14)
(0.02)
0.21
-
(0.02)
Lease Transaction Activity (PSEG Enterprise/Other)
-
-
0.07
(0.34)
-
0.05
Storm O&M (PSEG Power)
(0.03)
(0.07)
(0.08)
-
-
-
Market Transition Charge Refund (PSE&G)
-
-
-
-
(0.14)
-
Gain (Loss) on Asset Sales and Impairments (PSEG Enterprise/Other)
-
-
-
0.06
-
-
Income from Continuing Operations
2.99
$
2.45
$
2.51
$
2.77
$
3.07
$
3.14
$
Discontinued Operations
-
-
-
0.19
0.01
-
Net Income
2.99
$
2.45
$
2.51
$
2.96
$
3.08
$
3.14
$
(Unaudited)
For the Year Ended
December 31,
PUBLIC SERVICE ENTERPRISE GROUP INCORPORATED
Reconciling Items, net of tax |