Attached files
| file | filename |
|---|---|
| 8-K - FORM 8-K - PNC FINANCIAL SERVICES GROUP, INC. | d877680d8k.htm |
Exhibit 99.1

|
The PNC Financial Services Group 2014 Annual Report |
|
The PNC Financial Services Group, Inc.
Financial Highlights
| Year ended December 31 In millions, except per share data |
||||||||||||
| Financial Results | 2014 | 2013 | 2012 | |||||||||
| Net interest income |
$ | 8,525 | $ | 9,147 | $ | 9,640 | ||||||
| Noninterest income |
6,850 | 6,865 | 5,872 | |||||||||
|
|
|
|
|
|
|
|||||||
| Total revenue |
15,375 | 16,012 | 15,512 | |||||||||
| Noninterest expense |
9,488 | 9,681 | 10,486 | |||||||||
|
|
|
|
|
|
|
|||||||
| Pretax, pre-provision earnings (non-GAAP) |
5,887 | 6,331 | 5,026 | |||||||||
| Provision for credit losses |
273 | 643 | 987 | |||||||||
| Net income |
$ | 4,207 | $ | 4,212 | $ | 2,994 | ||||||
| Diluted earnings per common share |
$ | 7.30 | $ | 7.36 | $ | 5.28 | ||||||
| Cash dividends declared per common share |
$ | 1.88 | $ | 1.72 | $ | 1.55 | ||||||
| Balance Sheet At year end | 2014 | 2013 | 2012 | |||||||||
| Assets |
$ | 345,072 | $ | 320,192 | $ | 305,029 | ||||||
| Loans |
$ | 204,817 | $ | 195,613 | $ | 185,856 | ||||||
| Deposits |
$ | 232,234 | $ | 220,931 | $ | 213,142 | ||||||
| Shareholders’ equity |
$ | 44,551 | $ | 42,334 | $ | 38,948 | ||||||
| Common shares outstanding |
523 | 533 | 528 | |||||||||
| Closing price per common share |
$ | 91.23 | $ | 77.58 | $ | 58.31 | ||||||
| Book value per common share |
$ | 77.61 | $ | 72.07 | $ | 66.95 | ||||||
| Tangible book value per common share (non-GAAP) |
$ | 59.88 | $ | 54.57 | $ | 49.07 | ||||||
| Selected Ratios | 2014 | 2013 | 2012 | |||||||||
| Return on average common shareholders’ equity |
9.91 | % | 10.85 | % | 8.29 | % | ||||||
| Return on average assets |
1.28 | % | 1.38 | % | 1.02 | % | ||||||
| Net interest margin |
3.08 | % | 3.57 | % | 3.94 | % | ||||||
| Noninterest income to total revenue |
45 | % | 43 | % | 38 | % | ||||||
| Transitional Basel III common equity Tier 1 capital ratio |
10.9 | % | ||||||||||
| Pro forma fully phased-in Basel III common equity Tier 1 capital ratio |
10.0 | % | 9.4 | % | 7.5 | % | ||||||
| Basel I Tier 1 common capital ratio |
10.5 | % | 9.6 | % | ||||||||
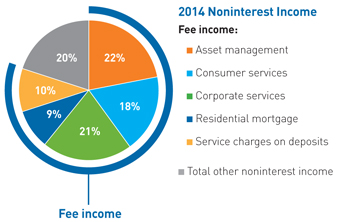
PNC’s fee income consists of these categories within noninterest income: asset management, consumer services, corporate services, residential mortgage and service charges on deposits. The fee income portion of noninterest income totaled $5.46 billion, $5.27 billion and $4.33 billion for 2014, 2013 and 2012, respectively. The residential mortgage income category was $.62 billion, $.87 billion and $.28 billion for 2014, 2013 and 2012, respectively.
PNC believes that pretax, pre-provision earnings serves as a useful tool to help evaluate the ability to provide for credit costs through operations.
PNC believes that tangible book value per common share serves as a useful tool to help evaluate the strength and discipline of a company’s capital management strategies and as an additional, conservative measure of total company value. See the Statistical Information (Unaudited) section included in Item 8 of the accompanying 2014 Form 10-K for additional information.
Transitional Basel III common equity Tier 1 capital ratio was calculated using the regulatory capital methodology applicable to PNC during 2014. The pro forma fully phased-in Basel III common equity Tier 1 capital ratios as of December 31, 2014 and 2013 were calculated under the standardized approach, and the December 31, 2012 ratio was calculated under the advanced approaches. Effective January 1, 2014, the Basel I Tier 1 common capital ratio no longer applies to PNC except for stress testing purposes. See the capital ratios discussion in the Supervision and Regulation section of Item 1 and in the Consolidated Balance Sheet Review section in Item 7 and see Statistical Information (Unaudited) in Item 8 of the accompanying 2014 Form 10-K for additional information.
These Financial Highlights should be read in conjunction with disclosures in the accompanying 2014 Form 10-K including the audited financial statements. Certain prior period amounts have been updated for adoption of ASU 2014-01. Certain prior period amounts have been reclassified to conform with the current period presentation.
From the CEO | March 2, 2015


|
Dear Shareholders,
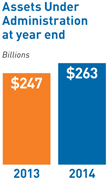
PNC had another successful year in 2014. We reported net income of $4.2 billion, or $7.30 per diluted common share. Our return on average assets was 1.28 percent. We added customers, grew loans by $9.2 billion and increased deposits by $11.3 billion. Additionally, we reduced expenses by nearly $200 million, strengthened our capital position and achieved a more liquid balance sheet.
| |
The fourth quarter of 2014 was PNC’s seventh consecutive quarter of $1 billion or more in net income. While past performance does not guarantee future results, that consistency through what continues to be a very challenging revenue environment is a testament to the soundness of our strategic direction and the commitment of our employees to creating long-term value for our shareholders.
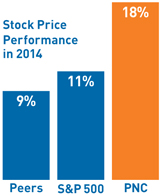
| In 2014, we grew tangible book value, an important estimate of shareholder value, by 10 percent over the prior year. Also, PNC’s stock reached an all-time high share price in December and finished the year 18 percent higher than at the close of 2013. That performance ranked second among the firms in our identified peer group, which averaged a 9 percent increase, and compared favorably with 11 percent for the S&P 500.
We also returned significant capital to shareholders in 2014.
We announced plans to repurchase up to $1.5 billion worth of common shares over the four quarters beginning in April 2014. Under that plan, as of December 31, we had repurchased 12.9 million common shares for $1.1 billion.
We also raised the quarterly dividend on our common stock to 48 cents per share in the |
|
second quarter. Given our strong capital position, we remain committed to returning additional capital to shareholders, subject to the regulatory Comprehensive Capital Analysis and Review (CCAR) process.
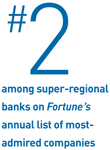
| And, we advanced to No. 2 among super-regional banks on Fortune’s annual list of most-admired companies. |
| |
| We have achieved all of this in the current environment in much the same way we established ourselves as one of the strongest-performing financial services companies and grew through the crisis – by focusing our efforts on helping our customers realize their financial goals without expanding our risk appetite and by helping our communities prosper. That’s what it means to us to be a Main Street bank rather than a Wall Street bank. |
Calling ourselves a Main Street bank is not a declaration of our capabilities or a comment on the sophistication of our people; it is a statement about the philosophy that governs how we relate to and serve our customers and communities. Those relationships are at the heart of our business model. By and large, we live and work where our customers live and work. We understand their financial goals. Whether they are saving for retirement, looking to buy a new home, building a small business or growing a large company, we are there to help. When they thrive, we thrive.
| At the heart of our corporate culture is the fundamental belief that if we always strive to do right by the people we serve and if we treat our customers well, we will make money and be profitable through time. | We have the experience, expertise and innovative products to provide our customers with the insight they need to chart their financial future and to match up against our Wall Street competitors, but we don’t take the same risks, and we don’t trade long-term value for short-term opportunity. At the heart of our corporate culture is the fundamental belief that if we always strive to do right by the people we serve and if we treat our customers well, we will make money and be profitable through time. It is a simple model, the purity of which is well suited for the environment in which we are operating.
This is a very challenging time for our industry. The regulatory environment continues to evolve, and the cost of compliance continues to rise. Competition grows more intense, even appearing at times to be irrational as other institutions seem to compromise long-term profitability for the sake of winning new business. And the perpetuation of historically low interest rates has made it extremely difficult for banks to grow net interest income. |
At PNC, we expect that interest rates will begin to rise later in the year as the domestic economy continues to expand. However, global macroeconomic factors are likely to persist and could affect the timing of otherwise anticipated rate increases.
Controlling What We Can Control – Executing on our Strategic Priorities
PNC is positioned to perform well in a rising rate environment, but we recognize that net interest income will remain under pressure until rates do rise. As a result, in recent years we have focused on strategic priorities aligned to drive an increase in fee income across our diversified lines of business. In essence, we are working to control what is in our power to control and to mitigate the impact of market headwinds.
Our strategic priorities work together to position us to achieve targeted outcomes – expanded market share, deeper customer relationships, increased fee income and improved operating efficiency – that form a solid foundation for long-term value creation. In 2014 we made important progress against each of our priorities.
Driving Growth in New and Underpenetrated Markets
Capturing More Investable Assets
Redefining the Retail Banking Experience

Building a Stronger Mortgage Business
Bolstering Critical Infrastructure and Streamlining Core Processes

Seeing Results
| We are making significant investments in our businesses and technology even as we have reduced expenses. At the same time, our execution against our strategic priorities is resulting in growth in fee income as designed. In 2014, we grew full year fee income by $189 million, or 4 percent. And, excluding residential mortgage, which continues to be subject to headwinds that are impacting the entire industry, fee income increased in 2014 by $442 million, or 10 percent. |
|
Delivering a Superior Banking Experience for Every Customer
In an industry built around products that, at their most basic level, are largely the same from one provider to the next, we aim to differentiate ourselves from the competition by continuing to improve the way we engage with our customers. In spite of industry consolidation in recent years, customers have nearly unlimited options when it comes to choosing a bank, so it is more important than ever that when a customer chooses PNC we deliver an unparalleled experience with exceptional service every time, across every channel.
|
Terry Jones, Jr. (left) and Alicia Moyes (right) work on a team of representatives dedicated to engaging customers through social media. Recognizing the importance of delivering the same high-quality experience through these channels that customers find in our branches, PNC has dramatically improved both the speed and quality of responses to customer posts on Facebook and Twitter. |
To that end, in 2014 we named PNC Executive Vice President and Chief Marketing Officer Karen Larrimer to serve as the company’s first Chief Customer Officer and to lead PNC’s new Office of the Customer. Under Karen’s leadership, the Office of the Customer is working to improve policies that unnecessarily burden or negatively impact our customers.
Building on the values that have long defined our culture, our employees are taking greater accountability for addressing customers’ concerns and solving customers’ problems. We are looking at and refreshing our approach to face-to-face, telephone care center and even social media engagement to have more productive conversations with the people we serve. And we are giving our employees more avenues by which to speak up when they have ideas for improving the customer experience or learn of customer concerns. |

While we recognize the reality that perfection is unattainable, we endeavor to distinguish ourselves and win in the marketplace through our efforts to deliver a superior banking experience for every customer.
Delivering for our Communities and Employees
Our success is not just determined by how well we serve our customers or the value we create for our shareholders; it also is dependent upon the efforts we undertake to help our communities and our employees prosper.
Throughout 2014 we celebrated the 10-year anniversary of PNC Grow Up Great, PNC’s $350 million initiative to expand access to quality early childhood education, particularly for underserved children. To date, Grow Up Great has helped more than 2 million children get a better academic start and a better chance at lifetime success.

PNC is a strong advocate for the physical, financial and personal wellness of our employees, customers and communities. In markets across our footprint, we are sponsoring events such as the GO! St. Louis Marathon and Family Fitness Weekend that bring together families and promote healthy living. These events have economic and other benefits for the communities where we do business and, at the same time, enable us to support our employees by offering wellness incentives to those who participate.
We also continued our commitment to green building, topping off construction of our new headquarters tower in Pittsburgh, which will be the world’s greenest office tower when it opens in the fall of 2015. And our net-zero-energy branch in southern Florida achieved LEED Platinum certification. Additionally, as you can read in our 2014 Corporate Responsibility Report, available at PNC.com, our businesses implemented a number of important changes to make health and environmental concerns a more prominent factor in PNC’s lending.
And for our employees, in 2014 we launched a major new talent development effort designed to create greater opportunity for professional growth and career advancement. The effort also makes managers throughout the company more accountable for building diverse teams and for identifying and promoting employees who distinguish themselves while demonstrating commitment to PNC’s values, risk management and ethical standards.
Great Expectations
Overall, we had a successful year in 2014. In spite of the challenges that persist, we are even more excited about the opportunities in front of us and how we are positioned as we enter 2015.
We are a year further into the execution of our strategic priorities and continue to make important progress. We enjoy a strong capital position. Our balance sheet is now compliant with the liquidity coverage ratio requirements that went into effect in 2015. And we have a terrific team of employees across the franchise committed to delivering a superior banking experience for every customer and focused on creating long-term value for our shareholders.
I would like to thank our customers for continuing to trust PNC to help them achieve financial well-being. I also would like to thank our board of directors for their service to our company on behalf of all of our shareholders, as well as for their ongoing counsel and support. In October, we welcomed a new director, A&R Development Corp. President and Chief Operating Officer Marjorie Rodgers Cheshire. And at this year’s annual meeting in April we will say goodbye to three directors who are retiring. Richard Berndt; George Walls, Jr.; and Helge Wehmeier are three extraordinary individuals whose leadership and vision helped to shape our strategic direction and guide our execution throughout their years of service on our board.
Finally, I would like to thank you for your confidence in our company and for your continued support as we work to deliver for our shareholders, customers, employees and communities.
Sincerely,

William S. Demchak
Chairman, President and Chief Executive Officer
For more information regarding certain factors that could cause future results to differ, possibly materially, from historical performance or from those anticipated in forward-looking statements, see the Cautionary Statement in Item 7 of our 2014 Annual Report on Form 10-K, which accompanies this letter. For additional information regarding PNC’s Peer Group and on digital consumer customers and non-teller deposit transactions, see Item 5 and the Retail Banking section of Item 7, respectively, of the accompanying 2014 Annual Report on Form 10-K. And for additional information on PNC’s tangible book value and fee income, see the inside front cover that precedes this letter and the Statistical Information (Unaudited) section included in Item 8 of the accompanying 2014 Annual Report on Form 10-K.

Estimated Transitional Basel III and Pro forma Fully Phased-In Basel III Common Equity Tier 1 Capital Ratios
As a result of the staggered effective dates of the final U.S. capital rules issued in July 2013, as well as the fact that PNC remains in the parallel run qualification phase for the advanced approaches, PNC’s regulatory risk-based capital ratios in 2014 were based on the definitions of, and deductions from, capital under Basel III (as such definitions and deductions were phased-in for 2014) and Basel I risk-weighted assets (subject to certain adjustments as defined by the Basel III rules). We refer to the capital ratios calculated using the Basel III phased-in provisions and applicable risk-weighted assets as the Transitional Basel III ratios.
We provide information below regarding PNC’s Basel regulatory capital, including PNC’s Transitional Basel III common equity Tier 1 capital ratio at December 31, 2014 and PNC’s estimated pro forma fully phased-in Basel III common equity Tier 1 capital ratio at December 31, 2014, 2013 and 2012. We previously referred to the Basel III common equity Tier 1 capital ratio as the Basel III Tier 1 common capital ratio. In addition, we provide information regarding PNC’s Basel I Tier 1 common capital ratios at December 31, 2012 and 2013, which were applicable to PNC in 2012 and 2013 under the U.S. regulatory capital rules.
Common equity Tier 1 capital as defined under the Basel III rules adopted by the U.S. banking agencies differs materially from Basel I Tier 1 common capital. For example, under Basel III, significant common stock investments in unconsolidated financial institutions, mortgage servicing rights and deferred tax assets must be deducted from capital to the extent they individually exceed 10%, or in the aggregate exceed 15%, of the institution’s adjusted common equity Tier 1 capital. Also, Basel I regulatory capital excludes accumulated other comprehensive income related to securities currently and previously held as available for sale, as well as pension and other postretirement plans, whereas under Basel III these items are a component of PNC’s capital.
| December 31, 2014 | ||||||||
| Dollars in millions |
Transitional Basel III (a) |
Pro forma Fully Phased-In Basel III (b)(c) |
||||||
| Common equity Tier 1 capital |
||||||||
| Common stock plus related surplus, net of treasury stock |
$ | 13,903 | $ | 13,903 | ||||
| Retained earnings |
26,200 | 26,200 | ||||||
| Accumulated other comprehensive income for securities currently and previously held as available for sale |
144 | 721 | ||||||
| Accumulated other comprehensive income for pension and other postretirement plans |
(104 | ) | (520 | ) | ||||
| Goodwill, net of associated deferred tax liabilities |
(8,855 | ) | (8,855 | ) | ||||
| Other disallowed intangibles, net of deferred tax liabilities |
(84 | ) | (421 | ) | ||||
| Other adjustments/(deductions) |
(63 | ) | (121 | ) | ||||
|
|
|
|
|
|||||
| Total common equity Tier 1 capital before threshold deductions |
31,141 | 30,907 | ||||||
| Total threshold deductions |
(212 | ) | (1,081 | ) | ||||
|
|
|
|
|
|||||
| Common equity Tier 1 capital |
30,929 | 29,826 | ||||||
|
|
|
|
|
|||||
| Additional Tier 1 capital |
||||||||
| Preferred stock |
3,946 | 3,946 | ||||||
| Trust preferred capital securities |
99 | |||||||
| Noncontrolling interests (d) |
790 | 43 | ||||||
| Other adjustments/(deductions) |
(77 | ) | (104 | ) | ||||
|
|
|
|
|
|||||
| Tier 1 capital |
35,687 | 33,711 | ||||||
|
|
|
|
|
|||||
| Additional Tier 2 capital |
||||||||
| Qualifying subordinated debt |
5,473 | 4,764 | ||||||
| Trust preferred capital securities |
99 | |||||||
| Allowance for loan and lease losses included in Tier 2 capital |
3,521 | 215 | ||||||
| Other |
2 | 10 | ||||||
|
|
|
|
|
|||||
| Total Basel III capital |
$ | 44,782 | $ | 38,700 | ||||
|
|
|
|
|
|||||
| Risk-Weighted Assets (e) |
||||||||
| Basel I risk-weighted assets calculated in accordance with transition rules for 2014 (f) |
$ | 284,018 | N/A | |||||
| Estimated Basel III standardized approach risk-weighted assets (g) |
N/A | $ | 298,786 | |||||
| Estimated Basel III advanced approaches risk-weighted assets (h) |
N/A | 285,870 | ||||||
| Average quarterly adjusted total assets |
329,827 | 328,562 | ||||||
| Basel III risk-based capital and leverage ratios |
||||||||
| Common equity Tier 1 |
10.9 | % | 10.0 | %(i)(k) | ||||
| Tier 1 |
12.6 | 11.3 | (i)(l) | |||||
| Total |
15.8 | 13.5 | (j)(m) | |||||
| Leverage (n) |
10.8 | 10.3 | ||||||
| (a) | Calculated using the regulatory capital methodology applicable to PNC during 2014. |
| (b) | PNC utilizes the pro forma fully phased-in Basel III capital ratios to assess its capital position (without the benefit of phase-ins), including comparison to similar estimates made by other financial institutions. |
| (c) | Basel III capital ratios and estimates may be impacted by additional regulatory guidance or analysis and, in the case of those ratios calculated using the advanced approaches, the ongoing evolution, validation and regulatory approval of PNC’s models integral to the calculation of advanced approaches risk-weighted assets. |
| (d) | Primarily includes REIT Preferred Securities. |
| (e) | Calculated as of period end. |
| (f) | Includes credit and market risk-weighted assets. |
| (g) | Estimated based on Basel III standardized approach rules and includes credit and market risk-weighted assets. |
| (h) | Estimated based on Basel III advanced approaches rules and includes credit, market and operational risk-weighted assets. |
| (i) | Pro forma fully phased-in Basel III capital ratio based on estimated Basel III standardized approach risk-weighted assets and rules. |
| (j) | Pro forma fully phased-in Basel III capital ratio based on estimated Basel III advanced approaches risk-weighted assets and rules. |
| (k) | For comparative purposes only, the pro forma fully phased-in advanced approaches Basel III Common equity Tier 1 capital ratio is 10.4%. This capital ratio is calculated using Common equity Tier 1 capital and dividing by estimated Basel III advanced approaches risk-weighted assets. |
| (l) | For comparative purposes only, the pro forma fully phased-in advanced approaches Basel III Tier 1 risk-based capital ratio is 11.8%. This capital ratio is calculated using Tier 1 capital and dividing by estimated Basel III advanced approaches risk-weighted assets. |
| (m) | For comparative purposes only, the pro forma fully phased-in standardized approach Basel III Total capital risk-based capital ratio is 14.1%. This ratio is calculated using additional Tier 2 capital which, under the standardized approach, reflects allowance for loan and lease losses of up to 1.25% of credit risk related risk-weighted assets and dividing by estimated Basel III standardized approach risk-weighted assets. |
| (n) | Leverage ratio is calculated based on Tier 1 capital divided by Average quarterly adjusted total assets. |
1
Estimated Pro forma Fully Phased-In Basel III Common Equity Tier 1 Capital Ratio — 2013 and 2012 (a)
| Pro forma Fully Phased-In Basel III | ||||||||
| Dollars in millions |
December 31 2013 |
December 31 2012 |
||||||
| Common stock, related surplus and retained earnings, net of treasury stock |
$ | 38,031 | $ | 34,579 | ||||
| Less regulatory capital adjustments: |
||||||||
| Goodwill and disallowed intangibles, net of deferred tax liabilities |
(9,321 | ) | (9,445 | ) | ||||
| Basel III total threshold deductions |
(1,386 | ) | (2,330 | ) | ||||
| Accumulated other comprehensive income (b) |
196 | 276 | ||||||
| All other adjustments (c) |
(64 | ) | (579 | ) | ||||
|
|
|
|
|
|||||
| Estimated Basel III Common equity Tier 1 capital |
$ | 27,456 | $ | 22,501 | ||||
| Estimated Basel III standardized approach risk-weighted assets (d) |
$ | 291,977 | N/A | |||||
| Estimated Basel III advanced approaches risk-weighted assets (e) |
$ | 290,080 | $ | 301,006 | ||||
| Estimated Basel III Common equity Tier 1 capital ratio |
9.4 | % | 7.5 | % | ||||
| Risk-weighted assets utilized |
Standardized | Advanced | ||||||
| (a) | Amounts have not been updated to reflect the first quarter 2014 adoption of ASU 2014-01 related to investments in low income housing tax credits. |
| (b) | Represents net adjustments related to accumulated other comprehensive income for securities currently and previously held as available for sale, as well as pension and other postretirement plans. |
| (c) | Includes adjustments as required based on whether the standardized approach or advanced approaches is utilized. |
| (d) | Basel III standardized approach risk-weighted assets were estimated based on the Basel III standardized approach rules and include credit and market risk-weighted assets. |
| (e) | Basel III advanced approaches risk-weighted assets were estimated based on the Basel III advanced approaches rules, and include credit, market and operational risk-weighted assets. |
2013 and 2012 Basel I Tier 1 Common Capital Ratio (a) (b)
| Dollars in millions |
December 31 2013 |
December 31 2012 |
||||||
| Basel I Tier 1 common capital |
$ | 28,484 | $ | 24,951 | ||||
| Basel I risk-weighted assets |
272,169 | 260,847 | ||||||
| Basel I Tier 1 common capital ratio |
10.5 | % | 9.6 | % | ||||
| (a) | Effective January 1, 2014, the Basel I Tier 1 common capital ratio no longer applies to PNC (except for stress testing purposes). Our 2013 Form 10-K included additional information regarding our Basel I capital ratios. |
| (b) | Amounts have not been updated to reflect the first quarter 2014 adoption of ASU 2014-01 related to investments in low income housing tax credits. |
2
The PNC Financial Services Group, Inc.
Tangible Book Value per Common Share Ratio (Non-GAAP)
Tangible book value per common share is a non-GAAP financial measure and is calculated based on tangible common shareholders’ equity divided by period-end common shares outstanding. We believe this non-GAAP financial measure serves as a useful tool to help evaluate the strength and discipline of a company’s capital management strategies and as an additional conservative measure of total company value.
Tangible Book Value per Common Share Ratio (Non-GAAP)
| December 31 - dollars in millions, except per share data |
2014 | 2013 | 2012 | |||||||||
| Book value per common share (a) |
$ | 77.61 | $ | 72.07 | $ | 66.95 | ||||||
| Tangible book value per common share |
||||||||||||
| Common shareholders’ equity (a) |
$ | 40,605 | $ | 38,392 | $ | 35,358 | ||||||
| Goodwill and Other Intangible Assets (b) |
(9,595 | ) | (9,654 | ) | (9,798 | ) | ||||||
| Deferred tax liabilities on Goodwill and Other |
||||||||||||
| Intangible Assets (b) |
320 | 333 | 354 | |||||||||
|
|
|
|
|
|
|
|||||||
| Tangible common shareholders’ equity |
$ | 31,330 | $ | 29,071 | $ | 25,914 | ||||||
| Period-end common shares outstanding (in millions) |
523 | 533 | 528 | |||||||||
| Tangible book value per common share (Non-GAAP) (c) |
$ | 59.88 | $ | 54.57 | $ | 49.07 | ||||||
| (a) | Amounts for prior periods have been updated to reflect the first quarter 2014 adoption of Accounting Standards Update (ASU) 2014-01 related to investments in low income housing tax credits. |
| (b) | Excludes the impact from mortgage servicing rights of $1.4 billion, $1.6 billion and $1.1 billion at December 31, 2014, 2013 and 2012, respectively. |
| (c) | We believe this non-GAAP financial measure serves as a useful tool to help evaluate the strength and discipline of a company’s capital management strategies and as an additional conservative measure of total company value. |
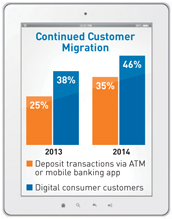
Non-teller deposit transactions by percentage represents percentage of total consumer and business banking deposit transactions processed at an ATM or through our mobile banking application.
Digital consumer customers by percentage represents percentage of consumer checking relationships that process the majority of their transactions through non-teller channels.
2014 Peer Group
The PNC Financial Services Group, Inc.
BB&T Corporation
Bank of America Corporation
Capital One Financial, Inc.
Comerica Inc.
Fifth Third Bancorp
JP Morgan Chase and Company
KeyCorp
M&T Bank
Regions Financial Corporation
SunTrust Banks, Inc.
U.S. Bancorp
Wells Fargo & Company