Attached files
| file | filename |
|---|---|
| 8-K - FORM 8-K 03/02/2015 - KITE REALTY GROUP TRUST | form8k_03022015.htm |

* Investor Presentation As Of Q4 2014

* COMPANY OVERVIEW City Center White Plains, NY

* COMPANY SNAPSHOT * ABR BY GEOGRAPHY (1) ABR excludes ground lease revenue attributable to parcels and outlots owned by the Company and ground leased to tenants. Note: All data as of December 31, 2014 unless otherwise noted. Sale assets include states that will be fully exited upon closing which is expected by the end of the first quarter. Source: Bloomberg; as of 02/17/15. Total return assumes dividend reinvestment. Dividend yield is inclusive of the recent increase, announced in February. Note: Dark gray shading denotes states that will be exited, pending announced disposition.

CURRENT PORTFOLIO OVERVIEW * (1) As of Q4 2014. (2) Other includes office, unanchored strip centers and single tenant assets. (3) Pro forma for tranche II sale of announced disposition. Source: demographic data from AGS. Total Leased (Owned SF) Total Leased (Owned SF) 94.8% Shop Leased (Owned SF) Shop Leased (Owned SF) 85.7% Annualized Base Rent per SF Annualized Base Rent per SF $15.15 Ground Lease (ABR) Ground Lease (ABR) $17.9mm 3-Mile Portfolio Demographics (3) 3-Mile Portfolio Demographics (3) 3-Mile Portfolio Demographics (3) Population / Growth (2014-19) ~58,000 / ~6% ~58,000 / ~6% Average Household Income ~$81,000 ~$81,000 Retail Diversification By ABR (1) Summary Statistics (1) By Property Type ~63% of assets anchored with a grocery (2) High-quality assets with 63% of properties having a grocery component, and the aggregate portfolio has an ABR over $15 per square foot

KITE 2.0 * 2010 Today Enhanced Scale 63 Properties 9 States 127 Properties 26 States Strong Leasing 78.0% Small Shops Leased 85.7% Small Shops Leased Quality Markets $12.80 ABR per GLA $15.15 ABR per GLA Geographically Diverse 41.1% % of ABR from IN ~13% % of ABR from IN Reduced Risk 15.5% CIP & LHD as a % of GAV < 5% CIP & LHD as a % of GAV Conservative Balance Sheet 9.1x Net Debt / EBITDA 6.5x Net Debt / EBITDA S&P: BBB- Moody’s: Baa3 Note: Financial information as of December 31, 2014. After the ~$300mm acquisition last November, the ~$2.1bn merger in July and the 15-asset disposition announced late in 2014, Kite has transformed in the recent past into Kite 2.0
* PORTFOLIO UPDATE Plaza at Cedar Hill Dallas, TX Delray Marketplace Delray, FL

2014 OPERATIONAL RECAP * FFO per share grew ~9% over the same period last year AFFO grew ~19% year-over-year Dividend growth of 13% over the last 12 months ABR per square foot grew 15% year-over-year Average center size increased over 12% year-over-year Executed 229 new and renewal leases for over 1.2 million SQFT
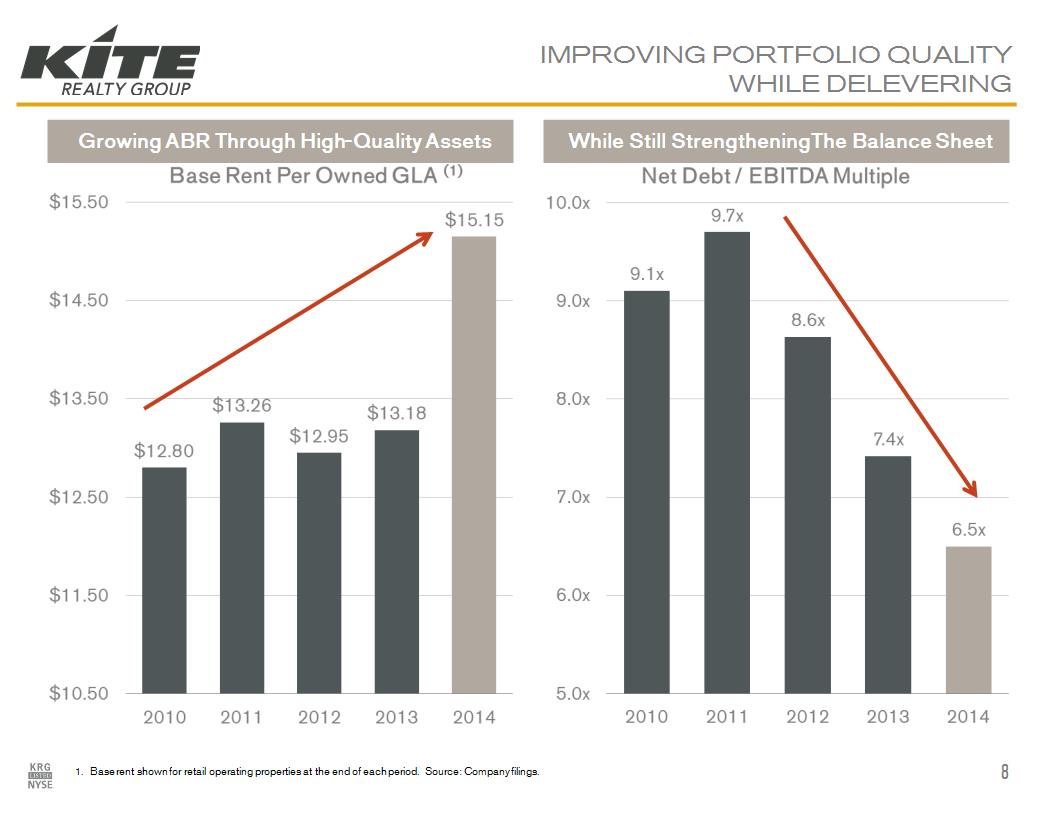
IMPROVING PORTFOLIO QUALITY WHILE DELEVERING Growing ABR Through High-Quality Assets While Still Strengthening The Balance Sheet 1. Base rent shown for retail operating properties at the end of each period. Source: Company filings. *

CONSISTENT OPERATIONAL PERFORMANCE Same-Property NOI Growth > 4% For 2 Years Average Cash Lease Spreads Of 15% 1. Base rent shown for retail operating properties at the end of each period. Source: Company filings. * Average: ~15%
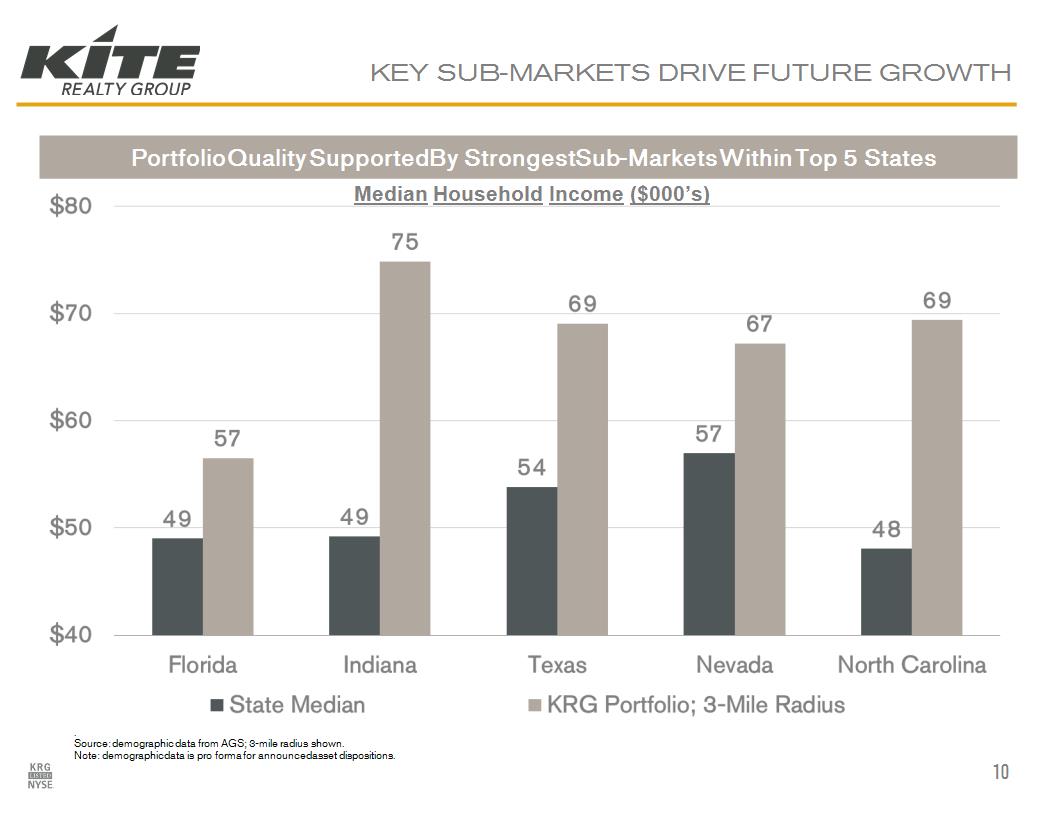
KEY SUB-MARKETS DRIVE FUTURE GROWTH * . Source: demographic data from AGS; 3-mile radius shown. Note: demographic data is pro forma for announced asset dispositions. Portfolio Quality Supported By Strongest Sub-Markets Within Top 5 States Median Household Income ($000’s)

HIGH-QUALITY & DIVERSIFIED TENANTS REMAIN CORE TO KITE 2.0 Strong relationships represented by top tenants by ABR; healthy diversification persists with no single tenant contributing >3.5% of ABR Top 10 Tenants By ABR (1) As of Q4 2014, includes development and redevelopment projects. TJ Maxx includes TJ Maxx, Marshalls and HomeGoods. * Tenant # Stores % ABR 19 3.4% 21 2.5% 20 2.3% 11 2.2% 20 2.1%

RAMPART ACQUISITION * Key Acquisition Highlights Summerlin-area of Las Vegas, Nevada ~81,000 SQFT shopping center; 100% leased Trade area estimated population: ~104,000 Trade area avg. household income: ~$111,000 Currently pursuing repositioning opportunities for the asset

* BALANCE SHEET Parkside Town Commons Cary, NC Beechwood Promenade Athens, GA

* A BALANCED APPROACH TO CAPITAL MANAGEMENT Extended Debt Maturities Lower Net Debt/EBITDA Fixed Charge Coverage 3 years 5 years 9.1x 6.5x 1.8x 3.0x Achieved Investment Grade Credit Ratings of Baa3 / BBB- (Moody’s / S&P) Committed To Investment Grade Ratings – Target Metrics To Achieve And Maintain: Further reduce net debt / EBITDA to ≤ 6.0x Increase unencumbered assets / GAV ≥ 50% in near-term and ≥ 65% over the next couple of years Maintain fixed charge coverage ≥ 2.5x

* WELL-LADDERED MATURITY PROFILE ($mm) ___________________________ (1) Chart excludes scheduled principal payments and net premiums. Term Loan is shown at final maturity after extension option exercised. Revolver scheduled to mature in 2019, after extension option exercised. Annual total amounts are pro forma for Tranche II asset sale. Revolver represents liquidity to the company. $160 $460 Existing LOC capacity exceeds liquidity needs in future years, even with no further debt maturity management Staggered debt maturity profile is conservative and manageable today; investment grade ratings provide additional opportunities which would further increase our financial flexibility Includes ability to increase total availability by $120mm
* FUTURE GROWTH INITIATIVES Portofino Shopping Center Houston, TX Kingwood Commons Houston, TX

PORTFOLIO NOI GROWTH COMPOSITION * 2015 guidance assumes only the $80mm of identified acquisition opportunities Additional investments will grow NOI further Contractual rent bumps to add ~1.25% of NOI growth annually (2015-2016) Target 3% annual rent bumps Lease-up opportunities Increase shop occupancy to 90%; estimated NOI of ~$4.5mm Maintain cash renewal spreads of 5-8% Operating expense control Anticipate $12-13mm incremental NOI from existing developments Begin construction at Tamiami and Holly Springs Phase II Target ~$100mm in redevelopment / repositioning opportunities over the next 18-24 months Begin construction at City Center in 2016 Operational Excellence Development Redevelopment / Repositioning 3% 2.5% 2% Expect average annual NOI growth to stem from various sources over the next 24 months; additional growth to come from external factors External Opportunities

DEVELOPMENT NOI : INCREMENTAL $12-13mm NOI * Development: 2.5% Development Annualized NOI Breakdown ($mm) ~$2mm ~$14-15mm Est. $24mm remaining spend Est. $29mm remaining spend Est. $7mm remaining spend Est. $2mm remaining spend Costs associated with Parkside have largely been incurred, yet it will be the biggest contributor to incremental development NOI Estimate an incremental $12-13mm in NOI from existing development projects

THE 3 R’S: REDEVELOPMENT, REPOSITION, REPUROPOSE * Redevelopment 60-65% Repurpose 10-15% Reposition 25% Redevelopment: 2% E.g. City Center, White Plains / New York Traditional redevelopment, involving substantial improvements E.g. Cool Springs, Nashville Optimizing tenant mix, minor asset enhancements E.g. The Corner, Indianapolis Transforming function / use of the asset to drive NOI growth The $100mm in redevelopment estimated over the next 18-24 months can be broken down into the 3 categories: redevelopment, repositioning and repurposing Redevelopment Pipeline Composition

FUTURE REDEVELOPMENT: CITY CENTER * Proposed Redevelopment Highlights Located in White Plains, NY Recent JV buyout provides full flexibility Redevelopment to commence in 2016 Significant repositioning of the asset to solidify its position within the market

FIRST CLASS REAL ESTATE * High-Quality Portfolio Well-Anchored Assets Strong Demographics $15.15 $14.67 63% 36% $81K $63K ABR Per SQFT Source: Company filings; SNL Financial and third party research. Peers include BRX, DDR, EQY, KIM, REG, RPAI, RPT, WRI. KRG demographic data per AGS; pro forma for announced sale. Grocery-Anchored Centers (% Of ABR) 3-Mile Avg. HH Income

SIGNIFICANT VALUE OPPORTUNITY REMAINS * FFO Multiple Below Peer Average Of 16.6x AFFO Multiple Below Peer Average Of 20.0x Source: Bloomberg; consensus data per SNL Financial, FactSet. Data as of 02/19/15. Average: 20.0x Average: 16.6x

Certain statements in this presentation that are not in the present or past tense or that discuss the Company’s expectations (including any use of the words “anticipate,” “assume,” “believe,” “estimate,” “expect,” “forecast,” “guidance,” “intend,” “may,” “might,” “outlook,” “project,” “should,” or similar expressions) are forward-looking statements within the meaning of the federal securities laws and as such are based upon current beliefs as to the outcome and timing of future events. These forward-looking statements, which are based on current expectations, estimates and projections about the industry and markets in which the Company operates and beliefs of and assumptions made by management, involve uncertainties that could significantly affect the financial results of the Company. There can be no assurance that actual future developments affecting the Company will be those anticipated by the Company. These forward-looking statements involve risks and uncertainties (some of which are beyond the control of the Company) and are subject to change based upon various factors including, but not limited to, the following risks and uncertainties: changes in the real estate industry and in performance of the financial markets and interest rates; the demand for and market acceptance of the Company’s properties for rental purposes; the ability of the Company to enter into new leases or renewal leases on favorable terms; the amount and growth of the Company’s expenses; tenant financial difficulties and general economic conditions, including interest rates, as well as economic conditions and competition in those areas where the Company owns properties; risks associated with joint venture partners; risks associated with the ownership and development of real property; the outcome of claims and litigation involving or affecting the Company; the ability to satisfy conditions necessary to close pending transactions and the ability to successfully integrate pending transactions; applicable regulatory changes; risks associated with acquisitions, including the integration of the Company’s and Inland Diversified Real Estate Trust, Inc.’s businesses; risks associated with achieving expected revenue synergies or cost savings; and other risks and uncertainties detailed from time to time in the Company’s filings with the Securities and Exchange Commission (the “SEC”). Should one or more of these risks or uncertainties occur, or should underlying assumptions prove incorrect, the business, financial condition, liquidity, cash flows and financial results of the Company could differ materially from those expressed in the forward-looking statements. Any forward-looking statement speaks only as of the date on which it is made. New risks and uncertainties arise over time, and it is not possible for us to predict the occurrence of those matters or the manner in which they may affect us. The Company does not undertake to update forward-looking statements (including EBITDA and net debt to adjusted EBITDA estimates) except as may be required by law. FORWARD – LOOKING STATEMENTS *