Attached files
| file | filename |
|---|---|
| EXCEL - IDEA: XBRL DOCUMENT - PRECIGEN, INC. | Financial_Report.xls |
| EX-32.2 - EXHIBIT 32.2 - PRECIGEN, INC. | xon-20141231exx322.htm |
| EX-23.1 - EXHIBIT 23.1 - PRECIGEN, INC. | xon-20141231exx231.htm |
| EX-32.1 - EXHIBIT 32.1 - PRECIGEN, INC. | xon-20141231exx321.htm |
| EX-23.2 - EXHIBIT 23.2 - PRECIGEN, INC. | xon-20141231exx232.htm |
| EX-31.2 - EXHIBIT 31.2 - PRECIGEN, INC. | xon-20141231exx312.htm |
| EX-21.1 - EXHIBIT 21.1 - PRECIGEN, INC. | xon-20141231exx211.htm |
| EX-31.1 - EXHIBIT 31.1 - PRECIGEN, INC. | xon-20141231exx311.htm |
UNITED STATES
SECURITIES AND EXCHANGE COMMISSION
Washington, D.C. 20549
FORM 10-K | ||
x | ANNUAL REPORT PURSUANT TO SECTION 13 OR 15(d) OF THE SECURITIES EXCHANGE ACT OF 1934 |
For the fiscal year ended December 31, 2014
OR
¨ | TRANSITION REPORT PURSUANT TO SECTION 13 OR 15(d) OF THE SECURITIES EXCHANGE ACT OF 1934 |
For the transition period from to .
Commission File Number: 001-36042
INTREXON CORPORATION
(Exact name of registrant as specified in its charter)
Virginia | 26-0084895 | |
(State or other jurisdiction of incorporation or organization) | (I.R.S. Employer Identification Number) | |
20374 Seneca Meadows Parkway Germantown, MD | 20876 | |
(Address of principal executive offices) | (Zip Code) | |
Registrant’s telephone number, including area code (301) 556-9900
Securities registered pursuant to Section 12(b) of the Act:
Title of each class | Name of each exchange on which registered | |
Intrexon Corporation Common Stock, No Par Value | New York Stock Exchange | |
Securities registered pursuant to Section 12(g) of the Act: None
Indicate by check mark if the registrant is a well-known seasoned issuer, as defined in Rule 405 of the Securities Act. Yes x No ¨
Indicate by check mark if the registrant is not required to file reports pursuant to Section 13 or Section 15(d) of the Act. Yes ¨ No x
Indicate by check mark whether the registrant: (1) has filed all reports required to be filed by Section 13 or 15(d) of the Securities Exchange Act of 1934 during the preceding 12 months (or for such shorter period that the registrant was required to file such reports), and (2) has been subject to such filing requirements for the past 90 days. Yes x No ¨
Indicate by check mark whether the registrant has submitted electronically and posted on its corporate Web site, if any, every Interactive Data File required to be submitted and posted pursuant to Rule 405 of Regulation S-T (§ 232.405 of this chapter) during the preceding 12 months (or for such shorter period that the registrant was required to submit and post such files). Yes x No ¨
Indicate by check mark if disclosure of delinquent filers pursuant to Item 405 of Regulation S-K is not contained herein, and will not be contained, to the best of registrant’s knowledge, in definitive proxy or information statements incorporated by reference in Part III of this Form 10-K or any amendment to this Form 10-K. x
Indicate by check mark whether the registrant is a large accelerated filer, an accelerated filer, a non-accelerated filer or a smaller reporting company. See definition of “large accelerated filer,” “accelerated filer” and “smaller reporting company” in Rule 12b-2 of the Exchange Act.
Large accelerated filer | x | Accelerated filer | ¨ | |||
Non-accelerated filer | ¨ (Do not check if a smaller reporting company) | Smaller reporting company | ¨ | |||
Indicate by check mark whether the registrant is a shell company (as defined in Rule 12b-2 of the Exchange Act). Yes ¨ No x
As of June 30, 2014, the aggregate market value of the registrant’s common stock held by non-affiliates based upon the closing price of such shares on the New York Stock Exchange on such date was approximately $902.2 million. Shares of common stock held by each executive officer, director and by each person who owns 5 percent or more of the outstanding common stock have been excluded in that such persons may be deemed to be affiliates. This determination of affiliate status is not necessarily a conclusive determination for other purposes.
As of February 15, 2015, there were issued and outstanding 104,981,271 shares of common stock.
Documents incorporated by reference: Portions of the registrant’s Proxy Statement for its 2015 Annual Meeting of stockholders are incorporated by reference in Part III of this Annual Report on Form 10-K where indicated. Such proxy statement will be filed with the Securities and Exchange Commission within 120 days of the registrant’s fiscal year ended December 31, 2014.
TABLE OF CONTENTS
Page | ||
Item 1. | ||
Item 1A. | ||
Item 1B. | ||
Item 2. | ||
Item 3. | ||
Item 4. | ||
Item 4A. | ||
Item 5. | ||
Item 6. | ||
Item 7. | ||
Item 7A. | ||
Item 8. | ||
Item 9. | ||
Item 9A. | ||
Item 9B. | ||
Item 10. | ||
Item 11. | ||
Item 12. | ||
Item 13. | ||
Item 14. | ||
Item 15. | ||
________________________
* | Portions of Item 10, and Items 11-14, are incorporated by reference from the Registrant’s 2015 Proxy Statement. |
3
Special Note Regarding Forward-Looking Statements
This Annual Report on Form 10-K contains forward-looking statements within the meaning of the federal securities laws, which statements involve substantial risks and uncertainties. All statements, other than statements of historical facts, included in this Annual Report on Form 10-K regarding our strategy, future events, future operations, future financial position, future revenue, projected costs, prospects, plans, objectives of management and expected market growth are forward-looking statements. The words “anticipate,” “believe,” “estimate,” “expect,” “intend,” “may,” “plan,” “predict,” “project,” “would” and similar expressions are intended to identify forward-looking statements, although not all forward-looking statements contain these identifying words. These forward-looking statements include, among other things, statements about:
• | our current and future exclusive channel collaborations (“ECCs”) and other collaborations; |
• | developments concerning our collaborators; |
• | our ability to successfully enter new markets or develop additional products, whether with our collaborators or independently; |
• | competition from existing technologies and products or new technologies and products that may emerge; |
• | actual or anticipated variations in our operating results; |
• | actual or anticipated fluctuations in our competitors’ or our collaborators’ operating results or changes in their respective growth rates; |
• | our cash position; |
• | market conditions in our industry; |
• | our ability, and the ability of our collaborators, to protect our intellectual property and other proprietary rights and technologies; |
• | our ability, and the ability of our collaborators, to adapt to changes in laws or regulations and policies; |
• | the ability of our collaborators to secure any necessary regulatory approvals to commercialize any products developed under the ECCs and joint ventures; |
• | the rate and degree of market acceptance of any products developed by a collaborator under an ECC or through a joint venture; |
• | our ability to retain and recruit key personnel; |
• | our expectations related to the use of proceeds from our public offerings and other financing efforts; and |
• | our estimates regarding expenses, future revenue, capital requirements and needs for additional financing. |
Forward-looking statements may also concern our expectations relating to our subsidiaries and other affiliates. We caution you that the foregoing list may not contain all of the forward-looking statements made in this Annual Report on Form 10-K.
We may not actually achieve the plans, intentions or expectations disclosed in our forward-looking statements, and you should not place undue reliance on our forward-looking statements. Actual results or events could differ materially from the plans, intentions and expectations disclosed in the forward-looking statements we make. We have included important factors in the cautionary statements included in this Annual Report on Form 10-K, particularly in Item 1A, “Risk Factors,” that could cause actual results or events to differ materially from the forward-looking statements that we make. Our forward-looking statements do not reflect the potential impact of any future acquisitions, mergers, dispositions, joint ventures or investments that we may make.
You should read this Annual Report on Form 10-K, the documents that we reference in this Annual Report on Form 10-K, the audited consolidated financial statements and related notes thereto included in this Annual Report on Form 10-K and the documents that we have filed as exhibits completely and with the understanding that our actual future results may be materially
4
different from what we expect. We do not assume any obligation to update any forward-looking statements, whether as a result of new information, future events or otherwise, except as required by law.
Intrexon®, BeyondBio®, UltraVector®, RheoSwitch®, RheoSwitch Therapeutic System®, AttSite®, and LEAP® are our and/or our affiliates registered trademarks in the United States and design-build-test-learn™, and mAbLogix™ are our common law trademarks in the United States. This annual report and the information incorporated herein by reference contain references to trademarks, service marks and trade names owned by us or other companies. Solely for convenience, trademarks, service marks and trade names referred to in this annual report and the information incorporated herein, including logos, artwork, and other visual displays, may appear without the ® or ™ symbols, but such references are not intended to indicate, in any way, that we will not assert, to the fullest extent under applicable law, our rights or the rights of the applicable licensor to these trademarks, service marks and trade names. We do not intend our use or display of other companies’ trade names, service marks or trademarks to imply a relationship with, or endorsement or sponsorship of us by, any other companies. Other trademarks, trade names and service marks appearing in this annual report are the property of their respective owners.
PART I
Item 1. | Business |
At present rates of global industrialization and population growth, food and energy supplies and environmental and healthcare resources are becoming more scarce and/or costly. We believe it is not a viable option for mankind to continue on this path — new solutions will be necessary to preserve and globally expand a high quality of life. We believe that synthetic biology is a solution.
We believe we are a leader in the field of synthetic biology, an emerging and rapidly evolving discipline that applies engineering principles to biological systems. Using our suite of proprietary and complementary technologies, we design, build and regulate gene programs, which are DNA sequences that consist of key genetic components. A single gene program or a complex, multi-genic program is fabricated and stored within a DNA vector. Vectors are segments of DNA used as a vehicle to transmit genetic information. DNA vectors can, in turn, be introduced into cells in order to generate a simple or complex cellular system, which are the basic and complex cellular activities that take place within a cell and the interaction of those systems in the greater cellular environment. It is these genetically modified cell systems that can be used to produce proteins, produce small molecules, or serve as cell-based products, which enable the development of new and improved products and manufacturing processes across a variety of end markets, including health, food, energy, environment and consumer. Our synthetic biology capabilities include the ability to precisely control the amount, location and modification of biological molecules to control the function and output of living cells and optimize for desired results at an industrial scale.
Working with our collaborators, we seek to create more effective, less costly and more sustainable solutions than can be provided through current industry practices. We believe our approach to synthetic biology can enable new and improved biotherapeutics, increase the productivity and quality of food crops and livestock, create sustainable alternative energy sources and chemical feed stocks and provide for enhanced environmental remediation. Our business model is to commercialize our technologies through exclusive channel collaborations, or ECCs, with collaborators that have industry expertise, development resources and sales and marketing capabilities to bring new and improved products and processes to market.
Our technologies combine the principles of precision engineering, statistical modeling, automation and production at an industrial scale. We efficiently engineer precise and complex gene programs across many cell types. We apply the engineering principle of a design-build-test-learn continuum, through which we accumulate knowledge about the characteristics and performance of gene programs and cell lines. This process of continuous learning allows us to enhance our ability to design and build improved and more complex gene programs and cellular systems.
While the field of synthetic biology is still emerging, the addressable markets that may benefit from this approach are large and well-established. In healthcare, synthetic biology may provide new approaches to treating diseases, as well as improvements to the manufacture of existing products. It is estimated that the global human pharmaceuticals market is over $900 billion and that biological therapeutics represent approximately $150 billion of this market. While genetically modified salmon or trout may be considered new products, the global market for aquaculture is valued at approximately $144 billion. Genetically modified agricultural plants are already grown on more than 180 million hectares around the world and are worth an estimated $15 billion. In energy, we are working to create novel, highly engineered organisms that use specific feedstocks to create commercially valuable end products, such as isobutanol, which already has a variety of technical and industrial applications and is also being investigated as a gasoline alternative.
5
We believe our technologies are broadly applicable across many diverse end markets, including some end markets that have failed to recognize the applicability of synthetic biology or failed to efficiently utilize biologically based processes to produce products. Our business model entails the formation of ECCs with collaborators that have expertise within specific industry sectors. To date, no commercial products have been enabled by our technologies. In our ECCs, we provide expertise in the engineering, fabrication and modification of gene programs and cellular systems, and our collaborators are responsible for providing market and product development expertise, as well as regulatory, sales and marketing capabilities. Generally, our collaborators compensate us through technology access fees, royalties, milestones and reimbursements of certain costs. This business model allows us to leverage our capabilities and capital across a broader landscape of product opportunities and end markets than we would be capable of addressing on our own. Alternatively, where a collaborator wishes to work with us to develop an early-stage program, we may execute a research collaboration pursuant to which we receive reimbursement for our development costs but the grant of exclusive license rights, and payment of the related access fee, are deferred until completion of an initial research program.
In certain strategic circumstances, we may enter into a joint venture with a third party collaborator whereby we may contribute access to our technology, cash or both into the joint venture which we will jointly control with our ECC collaborator. We may be required to contribute additional capital to the joint venture, and we may be able to receive a higher financial return than we would normally receive from an ECC to the extent that we and our collaborator are successful in developing one or more products.
In 2011, we entered into our first collaboration and have added new collaborations since then, either by entering into new agreements or expanding or adding fields to existing ECCs. To date, we have entered into 29 such agreements and expansions with 24 different counterparties, of which 27 remain active. We have 26 active ECCs, including four expansions, and one research collaboration that we anticipate could, if successful, become an ECC. Under the ECCs, we are developing products in the fields of healthcare, food, energy and consumer goods. We are also currently party to 3 joint venture arrangements.
Recent Developments
On January 13, 2015, we and ZIOPHARM Oncology, Inc., or ZIOPHARM, entered into a license agreement with The University of Texas System Board of Regents on behalf of The University of Texas M.D. Anderson Cancer Center, or MD Anderson. Pursuant to the license agreement, we hold an exclusive license to certain technologies owned and licensed by MD Anderson, including technologies relating to novel chimeric antigen receptor (CAR) T-cell therapies. The license agreement also includes co-licenses and non-exclusive licenses to certain other related technologies. Among the license rights, we received exclusive sublicensed rights, through MD Anderson, for intellectual property developed at the University of Minnesota for the development of cellular therapies to prevent, diagnose and/or treat cancers. We expect to employ the licensed technologies, together with our existing suite of proprietary technologies, through our existing exclusive collaboration agreement with ZIOPHARM to pursue the development and commercialization of non-viral adoptive cellular therapies based on designer cytokines and CARs under control of RheoSwitch technology targeting both hematologic and solid tumor malignancies. In addition to the licenses, the license agreement transferred to us and ZIOPHARM certain existing programs of MD Anderson, including ongoing clinical and preclinical programs. In connection with this transfer, ZIOPHARM committed to funding between $15 million and $20 million for ongoing research at MD Anderson for three years. We will have certain rights to technologies developed through such research, as provided in the agreement.
On January 27, 2015, we closed a public offering of 4,312,500 shares of our common stock at a public offering price of $27.00 per share for total gross proceeds of approximately $116.4 million, before deducting underwriting discounts, commissions and expenses.
On February 23, 2015, we acquired 100 percent of the membership interests of ActoGeniX NV ("ActoGeniX"), a European clinical stage biopharmaceutical company, for approximately $30.0 million in cash and 965,377 shares of our common stock, pursuant to a Stock Purchase Agreement dated as of February 13, 2015. ActoGeniX's platform technology complements our broad collection of technologies available for current and future collaborations.
What is synthetic biology?
History
Synthetic biology entails the application of engineering principles to biological systems for the purpose of designing and constructing new biological systems or redesigning/modifying existing biological systems. Biological systems are governed by DNA, the building blocks of gene programs, which control cellular processes by coding for the production of proteins and other molecules that have a functional purpose and by regulating the activities of these molecules. This regulation occurs via
6
complex biochemical and cellular reactions working through intricate cell signaling pathways, and control over these molecules modifies the output of biological systems.
In the early 1970s, scientists utilized basic tools and procedures for transferring DNA from one organism to another. Foundational tools included: gene programs contained in vectors; enzymes that could cut DNA at specific sites; and enzymes that could “glue” two complementary segments of DNA together. Developments between 1980 and the end of the 20th century advanced the field of genetic engineering, including automated DNA sequencing, DNA amplification via PCR and the creation of genetically modified organisms. However, the simplistic “cut-and-paste” nature of the available tools, and the absence of genomic sequence information, significantly restricted the scope of early synthetic biology efforts.
More recently, synthetic biology has been enabled by the application of information technology and advanced statistical analysis, also known as bioinformatics, to genetic engineering, as well as by improvements in DNA synthesis. Synthetic biology aims to engineer gene-based programs or codes to modify cellular function to achieve a desired biological outcome. For example, applications may include the replacement of a defective protein with a functional protein to treat a broad range of human and animal disease states, or the production of multiple proteins through the regulation of several genes in a cell to produce petrochemicals.
Our approach
The essence of our approach is to apply synthetic biology by using an iterative process that is rapid, automated and highly reproducible, in which we:
• | Design genes of interest and gene programs utilizing knowledge of cellular pathways and protein function; |
• | Build biological molecules, gene programs and their variants to optimize performance of the biological system; |
• | Test gene programs by inserting them into cellular systems and comparing the result(s) to the intended effects; and |
• | Learn by utilizing information gained in our iterative processes to create better DNA vectors and gene programs using a more informed and efficient process to achieve improved outcomes. |
As a result of our approach, we have developed extensive knowledge about many classes of DNA components and the rules governing their expression and activity. We have also assembled an inventory of these DNA components that we can use to rationally construct unique vectors rapidly and with predictable outcomes. The knowledge embedded in our DNA database allows us to create single gene and highly complex multigenic gene programs (an individual gene program containing multiple genes).
To support our approach, we have developed, acquired, and integrated a unique suite of technologies, and we continue to expand upon their capabilities. These technologies include: our UltraVector gene design and fabrication platform, and its associated library of modular DNA components; Cell Systems Informatics; RheoSwitch inducible gene switch; AttSite Recombinases; Protein Engineering; mAbLogix; and Laser-Enabled Analysis and Processing, or LEAP. These technologies are complementary in nature and share the following key characteristics:
• | Platform neutral — outcome oriented. We can work across different cell types with the objective of achieving the intended biological outcome allowing for product development across a broad spectrum of end markets. |
• | Knowledge driven. We use statistical modeling tools and computational analysis to continually acquire more knowledge about biological systems and their design to continually improve our ability to develop new and improved products and processes for our collaborators. |
• | Rationally designed. Our knowledge of biological systems and components allows us to design, build and select gene programs and predict the probable outcome of these programs. |
• | Capable of complexity. Our technologies enable the design and precise control of complex biological molecules and multigenic gene programs. |
• | Industrial scale. We use engineering principles and automation to enable products based on synthetic biology that are commercially viable. |
7
Our competitive strengths
We believe that our technologies and our approach to synthetic biology — design-build-test-learn — give us a competitive advantage over traditional industrial processes as well as current approaches to synthetic biology.
We believe that we have the following competitive strengths:
We have a suite of proprietary and complementary technologies
We have built a suite of proprietary and complementary technologies that provides us with a comprehensive ability to design, create, modify and regulate gene programs and cellular systems. By virtue of the complementary nature of our technologies, we are able to provide our collaborators with a diverse array of capabilities, representing a “one stop shop” to potentially develop and commercialize new and differentiated products enabled by synthetic biology.
Our design-build-test-learn continuum allows us to design and build improved and more complex gene programs
We have developed a core expertise and technologies to design, build and test complex gene programs, as well as technologies to isolate cells that best express the desired biological output. We have also developed an extensive bioinformatic software platform that combines information technology with advanced statistical analysis for DNA design and genetic engineering, enabling us to continually learn and create optimal conditions for our gene programs. Our approach allows us to build improved and more complex gene programs.
We believe we are a leader in synthetic biology
We believe we are the first company focused exclusively on applying synthetic biology across a broad spectrum of end markets and have been working in the field since 1998. Over the last 17 years, we have accumulated extensive knowledge and experience in the design, modification and regulation of gene programs. We believe all of these factors, coupled with our suite of proprietary and complementary technologies, provide us with a first-mover advantage in synthetic biology.
We serve large and diverse end markets with high built-in demand
A vast number of products consumed globally are or can be produced using biologically based processes. Natural resources are becoming more scarce as demand exceeds supply, creating unmet needs for improvements in development and manufacturing. As a result, the need for complex biologically engineered molecules such as those enabled by our synthetic biology technologies is large and spans multiple industries, including healthcare, food, energy and environmental sciences. Each of these markets faces unique challenges, however all have unmet needs for improvements in product development and manufacturing that can result in savings of both cost and time as compared to traditional means of industrial design and production. Because synthetic biology has the potential to deliver against these unmet needs, we believe that significant demand already exists for improved products enabled by synthetic biology. Additionally, there are markets utilizing traditional industrial processes that have failed to recognize the significant improvement in performance that could be achieved using synthetic biology.
We have a scalable ECC business model that allows us to leverage the broad potential of synthetic biology
We believe our ECC business model is a capital efficient and rapid way for us to participate in a more diversified range of product opportunities and industrial end markets than would otherwise be possible, including healthcare food, energy and environmental sciences. Our collaborators are primarily responsible for providing market and product development expertise, as well as sales, marketing and regulatory capabilities. Generally, our collaborators compensate us through technology access fees, royalties, milestones and reimbursements of certain costs. Our ECC business model allows us to participate in the potential upside from products that are enabled by our technologies across an extensive range of industries, without the need for us to invest considerable resources in bringing individual programs to market. Moreover, we believe that we will increasingly engage in ECCs in new fields at an accelerating pace with well-recognized collaborators.
We have experienced management and employees
Our management team, including our Chief Executive Officer, Randal J. Kirk, and our Chief Operating Officer, Krish S. Krishnan, consists of executives with a track record of success in building and managing research and development-driven companies, including New River Pharmaceuticals Inc., which was sold in 2007 to Shire plc for $2.6 billion. Our Chief Science
8
Officer, Thomas D. Reed, was responsible for the initial conception and creation of our UltraVector technology platform. As of December 31, 2014, we had 201 research and development employees.
Our suite of proprietary and complementary technologies
We apply the potential of synthetic biology through our suite of proprietary and complementary technologies that combine the principles of precision engineering, statistical modeling, automation and production at an industrial scale. This enables us to engineer precise and complex gene programs across many cell types rapidly and inexpensively. These technologies include: our UltraVector gene design and fabrication platform, and its associated library of modular DNA components; RheoSwitch inducible gene switch; Cell Systems Informatics; AttSite Recombinases; Protein Engineering; Antibody Discovery; and Laser-Enabled Analysis and Processing, or LEAP.
In order to create a highly functional biological system, we recognize the complexity of cellular processes and the necessity to construct an optimized gene program in conditions reflective of the natural environment to allow for the creation of the optimal biological product. This requires a rigorous understanding of cell signaling pathways as well as the interactions that influence the expression of protein. This knowledge is captured in our advanced Cell Systems Informatics, which uses statistical modeling and other analytic frameworks to determine the most efficient pathways for an intended biochemical result, and also plays a critical role in our research and development as this database of information allows us to explore new targets of potential interest to our current or future collaborators. Moreover, our bioinformatics and computational modeling platform is central to our Protein Engineering, which focuses on designing enhanced and/or novel protein functionalities, including stability, localization, and catalytic activity.
In addition to creating optimized gene programs via the most efficient cell signaling pathways and in the relevant cellular environments, we have a growing library of genetic components with our UltraVector platform that enable design and assembly of gene programs which facilitate control over the quality, function, and performance of living cells. Our RheoSwitch inducible gene switch provides quantitative dose-proportionate regulation of the amount and timing of target protein generated, thereby providing another mechanism to closely control activity of a newly constructed gene program. Further, our AttSite recombinases allow for stable, targeted gene integration and expression. Once cells have been engineered for the desired biological output, the LEAP automated platform can be used to identify and purify cells of interest, such as antibody expressing cells and stem cells.
Our technology platform is designed to provide a "one stop shop" for start-to-finish conceptualization, engineering, regulation, optimization and production of biologically-based solutions that we believe possess many advantages over traditional processes. Our leading-edge toolkit can empower many different cell platforms allowing for selection of the most effective host to create a desired product or solution for our partners.
Our markets
Synthetic biology has applicability across many diverse end markets. Our goal is to be a leader in the application of synthetic biology for products currently utilizing biologically based processes, and a leader in the replacement of conventional processes and products with biologically based substitutes. Through the application of our suite of proprietary and complementary technologies, we believe we can create optimized biological processes and create substitutes for traditional industrial techniques, leading to improved products that are developed and manufactured faster and more cost-effectively.
Health Sector
It is estimated that the global human pharmaceuticals market is approximately $900 billion and that biological therapeutics represent approximately $150 billion of this market. Additionally, the market for animal health therapeutics is currently estimated to be valued at more than $20 billion globally. The unreliable, costly discovery and development process for new medicines is being replaced by the engineering of biology at the genetic, molecular, and cellular level. Our ability to regulate complex gene programs and cellular systems by applying the principles of science, engineering, and computational bioinformatics with proprietary technologies is being utilized to design new therapies for humans and animals. We are applying our approach to develop targeted gene therapy applications and novel solutions within oncology, rare skin disorders, active pharmaceutical ingredients, ocular diseases, human infertility, infectious diseases, and animal health.
Food Sector
The Food and Agriculture Organization (FAO) of the United Nations, predicts that by 2050 the world’s population will exceed 9 billion, global demand for animal protein will more than double, food production will need to increase by 70 percent, and
9
global consumption of dairy and beef products will increase by 158 percent above present levels of $352 billion. We are focused on enabling efficient, high-quality food production that sustainably supports the necessities of our growing population. By applying our suite of technologies, we aim to facilitate development of agricultural, livestock and aquaculture resources that deliver innovative approaches and superior production yields in an environmentally responsible manner.
Energy Sector
Biological approaches hold significant potential to efficiently yield energy products. Despite this, existing attempts to produce “clean” energy are incredibly expensive, not achievable at an industrial scale, or require massive resources with low productivity. Additionally many alternative energy initiatives use food sources, like corn and sugarcane, which compete for arable land and water with sustenance crops. With our unique cellular engineering capabilities, we are developing microbial cell lines for bioconversion of methane to higher carbon content compounds. This proprietary platform holds the potential to transform the gas-to-liquids industry by generating valuable fuels and chemicals at a fraction of the costs of more traditional conversion methods. Our bioconversion approach seeks to attain the optimal balance of sustainable productive yield and attractive economic returns.
Environment Sector
As a result of industrialization and rapidly growing global populations, chemicals, heavy metals, oil products and various other pollutants are pervasive in the environment. These pollutants result in poor quality of drinking water, loss of water supply, contaminated ground water and soil, high clean-up costs, and potential health problems. We seek to engineer biological solutions that are designed to preserve the environment and either reduce the use of resources that are being rapidly depleted, like water and wood, or in some cases to even replenish them. These biological approaches may replace products that present an environmental hazard. Examples include microbial-based strategies to pest and rodent control with minimal impact on non-target species and solutions that can enhance the healthy growth of planned forests, reducing the burden on our world’s shrinking natural forests.
Consumer Sector
Global consulting firm A.T. Kearney estimates consumer spending will grow to $40 trillion by 2020 including an increase in spending on durable goods and personal care items. Despite its size and number of products that can be achieved through biological means, the consumer market has experienced limited impact from synthetic biology. We are committed to partnering with diverse companies to develop bio-based processes that displace petroleum-derived ingredients and polymers. Additionally, we are focused on reducing the wasteful practices associated with extracting compounds that occur in limiting amounts in plants and animals. Through our synthetic biology capabilities, we plan to utilize innovative biologically based applications for the development of products, such as personal care items and decorative arts, to improve the lives of consumers every day.
Our business model
We believe that because synthetic biology has applicability across many diverse end markets, we cannot take full advantage of synthetic biology with internal development programs alone. To address this, we have devised our business model to allow us to focus on our core expertise in synthetic biology while bringing many different commercial products to market via collaborations in a broad range of industries or end markets, thus minimizing and leveraging the use of our own capital.
Our business model is built primarily around the formation of ECCs. An ECC is an agreement with a collaborator to develop products based on our technologies in a specifically defined field. We seek collaborators that have expertise within a specific industry sector and the commitment to provide resources for the development and commercialization of products within that industry sector. In our ECCs, we provide expertise in the engineering of gene programs and cellular systems, and our collaborators are responsible for providing market and product development expertise, as well as regulatory, sales and marketing capabilities.
This business model allows us to leverage our capabilities and capital across numerous product development programs and a broader landscape of end markets than we would be capable of addressing on our own. Our ECC business model also allows us to participate in the potential upside from products that are enabled by our technologies across an extensive range of industries, without the need for us to invest considerable resources in bringing individual products to market. Additionally, the flexibility of the business model allows us to collaborate with a range of counterparts, from small innovative companies to global multinational conglomerates.
10
Alternatively, where a collaborator wishes to work with us to develop an early-stage program, we may execute a research collaboration pursuant to which we receive reimbursement for our development costs but the exclusive license rights, and related access fees, are deferred until completion of an initial research program.
In certain strategic circumstances, we may enter into a joint venture with a third party collaborator whereby we may contribute access to our technology, cash or both into the joint venture which we will jointly control with our collaborator. Pursuant to a joint venture agreement, we may be required to contribute additional capital to the joint venture, and we may be able to receive a higher financial return than we would normally receive from an ECC to the extent that we and our collaborator are successful in developing one or more products.
Our ECCs
Our ECCs typically share a number of key features. Each ECC is an agreement with a collaborator to develop products based on our technologies in one or more specifically defined fields. These fields may be narrowly defined (representing, for example, a specific therapeutic approach for a single indication) or may be broad (representing, for example, an entire class of related products). In each case, we and the collaborator precisely define the field based on factors such as the expertise of the collaborator, the relative markets for the prospective products, the collaborator’s resources available to commit to the ECC and our expectations as to other prospective ECCs in related areas. Regardless of the size of the field, under each ECC we grant the collaborator exclusive rights to our services and our suite of technologies to develop and commercialize products within the field. So long as our collaboration continues, the parties agree that each will not, alone or with another party, develop and commercialize products within the field of the ECC. The licensed technologies include those that we control at the time of the execution of the ECC as well as any technologies that we develop or acquire throughout the duration of the ECC.
We realize three general categories of revenue under our ECCs. First, for providing access to our technologies, we generally receive technology access fees either in cash or as an equity interest in the collaborator. These payments may be upfront or upon the achievement of developmental milestones or both. Second, through the duration of the ECC, we receive reimbursements from our collaborator to cover most of our time and material costs expended performing our obligations under the ECC. Reimbursable expenses may be for the time of our own personnel, materials we produce at our facilities or pass-through costs for the time and materials of third-party contractors. Third, we share in the potential future revenues, through royalties or other similar arrangements, derived from the commercialization of the product(s) that are enabled by our technologies.
Generally, each of our ECCs is designed to continue in perpetuity unless terminated. Given the relatively long development cycle for many of the products that could be enabled by our technologies, as well as our belief that we can enable the continual improvement of product offerings, it is our expectation that our ECCs will continue for many years and result in the development of multiple products. Each of our collaborators, however, retains the right to terminate the ECC for any reason by providing us written notice a certain period of time prior to such termination, generally ninety days. The ECC is also terminable by either party upon the other party’s breach of material provisions of the ECC. The failure of our collaborator to exercise diligent efforts to develop products within the field of the ECC constitutes such a breach.
In the event one of our ECCs terminates we are entitled to immediately pursue another collaboration within the field of the terminated ECC. Moreover, technologies and product candidates in a relatively early stage of development revert to us, along with data, materials and the rights to applicable regulatory filings related to the reverted products, enabling us to develop those products ourselves or incorporate them into a future collaboration. Product candidates that are at a more advanced stage of development, such as those already generating revenue or being considered for approval by the applicable regulatory body, for example, at the time of the ECC’s termination are retained by the former collaborator. The collaborator has the right to develop and commercialize such retained products although we are entitled to the royalties or other compensation to which we would be entitled as if the ECC were still in effect. Upon termination, we generally retain any technology access fees or other payments to which we are entitled through the date of termination.
In our ECCs, we retain rights to our existing intellectual property and generally any intellectual property developed using, or otherwise incorporating, our technologies. In addition, we are generally responsible for controlling the prosecution and enforcement of this intellectual property with the exception of the enforcement of patents directed solely and specifically to products developed within the field of each ECC.
Each of our ECCs requires the collaborator to indemnify us for all liability related to products produced pursuant to the ECC and to obtain insurance coverage related to product liability.
11
See Note 6 to our consolidated financial statements appearing elsewhere in this annual report on Form 10-K for a discussion of our significant ECCs.
Joint ventures
Intrexon Energy Partners
In March 2014, we and certain investors, or the Investors, entered into a Limited Liability Company Agreement which governs the affairs and conduct of business of Intrexon Energy Partners, LLC, or Intrexon Energy Partners, a joint venture formed to optimize and scale-up our gas-to-liquid bioconversion platform for the production of certain fuels and lubricants. We also entered into an ECC with Intrexon Energy Partners providing exclusive rights to our technology for the use in bioconversion, as a result of which we received a technology access fee of $25,000 while retaining a 50 percent membership interest in Intrexon Energy Partners. The Investors made initial capital contributions, totaling $25 million in the aggregate, in exchange for pro rata membership interests in Intrexon Energy Partners totaling 50 percent. Intrexon Energy Partners is governed by a board of managers, or Intrexon Energy Partners Board, which has five members. Two members of the board are designated by us and three members of the board are designated by a majority of the Investors. We committed to make capital contributions of up to $25 million, and the Investors, as a group and pro rata in accordance with their respective membership interests in Intrexon Energy Partners, have committed to make additional capital contributions of up to $25 million, at the request of the Intrexon Energy Partners Board, and subject to certain limitations. We and the Investors have the right, but not the obligation, to make additional capital contributions above these limits when and if solicited by the Intrexon Energy Partners Board.
See Note 6 to our consolidated financial statements appearing elsewhere in this annual report on Form 10-K for further discussion of the ECC.
Contemporaneously with the formation of the joint venture and entry into the ECC, we entered into securities purchase agreements with the Investors for the private placement of 972,004 shares of our common stock at a price per share of $25.72 for gross proceeds of $25 million.
OvaXon
In December 2013, we entered into an ECC with OvaScience, Inc., or OvaScience, a life sciences company focused on the discovery, development and commercialization of new treatments for infertility. Additionally, we and OvaScience formed OvaXon, LLC, or OvaXon, a joint venture to create new applications for improving human and animal health. Both we and OvaScience made an initial capital contribution of $1.5 million in January 2014 for a 50 percent membership interest in OvaXon. OvaXon is governed by the OvaXon board of managers, or the OvaXon Board, which has four members, two each from us and OvaScience. In cases in which the OvaXon Board determines that additional capital contributions are necessary in order for OvaXon to conduct business and comply with its obligations, each of us and OvaScience have the right, but not the obligation, to make additional capital contributions to OvaXon subject to the terms of the agreement. OvaScience also licensed certain technology relating to egg precursor cells to OvaXon pursuant to a separate license agreement.
Contemporaneously with the formation of the joint venture, we entered into an ECC with OvaXon. See Note 6 to our consolidated financial statements appearing elsewhere in this annual report on Form 10-K for a discussion of this ECC.
S & I Ophthalmic
In September 2013, we entered into a Limited Liability Company Agreement, or the Sun LLC Agreement, with Caraco Pharmaceutical Laboratories, Ltd., or Sun Pharmaceutical Subsidiary, an indirect subsidiary of Sun Pharmaceutical Industries Ltd., or Sun Pharmaceutical, an international specialty pharmaceutical company focused on chronic diseases, to form S & I Ophthalmic, LLC, or S & I Ophthalmic. The Sun LLC Agreement governs the affairs and the conduct of business of S & I Ophthalmic. S & I Ophthalmic leverages experience and technology from both us and Sun Pharmaceutical. Both we and Sun Pharmaceutical Subsidiary made an initial capital contribution of $5 million in October 2013 for a 50 percent membership interest in the joint venture. S & I Ophthalmic is governed by the S & I Ophthalmic board of managers, or the S & I Ophthalmic Board, which has four members, two each from us and Sun Pharmaceutical Subsidiary. In cases in which the S & I Ophthalmic Board determines that additional capital contributions are necessary in order for the joint venture to conduct business and comply with its obligations, each of us and Sun Pharmaceutical Subsidiary have committed to making additional capital contributions to S & I Ophthalmic, subject to certain limits defined in the agreement. Each has the right, but not the obligation, to make additional capital contributions above the defined limits when and if solicited by the S & I Ophthalmic Board.
12
Beginning on the seventh anniversary of the effective date of the Sun LLC Agreement, and upon the second anniversary thereafter, we, as well as Sun Pharmaceutical Subsidiary, may make a cash offer to purchase all of the other party’s interest in S & I Ophthalmic. Upon receipt of such an offer, the other party must either agree to tender its interests at the offered price or submit a counteroffer at a price higher than the original offer. Such offer and counteroffer may continue until one party agrees to the other’s price.
Contemporaneously with the formation of the joint venture, we entered into an ECC with S & I Ophthalmic. See Note 6 to our consolidated financial statements appearing elsewhere in this annual report on Form 10-K for a discussion of this ECC.
Mergers and acquisitions
We may augment our suite of proprietary technologies through mergers or acquisitions of technologies which then become available to new or existing collaborators. Among other things, these technologies must be complementary to our existing technologies and also meet our desired return on investment and other economic criteria. In certain cases, such technologies may already be applied in the production of products or services and in these cases, the target must also maintain a market leadership position for their existing products or services and an opportunity must exist for expansion of that leadership position when complemented by our technology.
On August 8, 2014, we acquired 100 percent of the membership interests of Trans Ova Genetics, L.C., or Trans Ova, a provider of bovine reproductive technologies. Intrexon and Trans Ova intend to build upon Trans Ova’s current platform with new capabilities with a goal of achieving higher levels of delivered value to dairy and beef cattle producers. The consideration paid for the membership interests in Trans Ova consisted of $63.6 million in cash and the issuance of an aggregate of 1,444,388 shares of the Company’s common stock. In addition, deferred cash valued at $20.1 million is payable to the former members of Trans Ova in three equal installments upon the first, second, and third anniversaries of the closing date. The agreement also provides for the payment to the former members of Trans Ova of a portion of certain cash proceeds in the event there is an award under certain litigation matters pending as of closing to which Trans Ova is a party. We began consolidating Trans Ova’s results of operations and financial position effective August 8, 2014.
On March 6, 2014, we acquired 100 percent of the outstanding common stock and securities convertible into common stock of Medistem, Inc., or Medistem, a pioneer in the development of Endometrial Regenerative Cells, or ERCs, which are universal donor adult stem cells that stimulate new blood vessel formation and are capable of generating different tissues including heart, brain, pancreas, liver, bone, cartilage and lung. We intend to employ our synthetic biology platforms to engineer a diverse array of cell-based therapeutic candidates using Medistem’s multipotent ERCs. We began consolidating Medistem’s results of operations and financial position effective March 6, 2014.
On October 1, 2013, we acquired 4,163,265 shares of common stock of Biological & Popular Culture, Inc., or BioPop, representing 51 percent of the outstanding shares of BioPop, resulting in our gaining control over BioPop and consolidating its results of operations and financial position from that date.
On November 16, 2012, we acquired 48,631,444 shares of common stock of AquaBounty Technologies, Inc., or AquaBounty, representing approximately 48 percent of the then outstanding shares. AquaBounty is a biotechnology company utilizing modern molecular biology to improve aquaculture productivity in a safe and environmentally sustainable manner. We originally accounted for our investment using the equity method. On March 15, 2013, we acquired 18,714,814 additional shares of AquaBounty common stock, increasing our aggregate ownership to approximately 54 percent, resulting in our gaining control over AquaBounty and consolidating its results of operations and financial position from that date. On March 20, 2014, we acquired 19,040,366 additional shares of AquaBounty common stock increasing our aggregate ownership to approximately 60 percent.
Competition
We believe that we are a leader in synthetic biology. We do not believe that we have any direct competitors who provide similar technologies which fully enable the commercialization of products developed using synthetic biology across a broad spectrum of biologically based industries. As a result, we believe our competition is more indirect and general in nature, and falls into three broad categories:
• | Synthetic biology service providers. There are companies that have competing technologies for individual pieces of our suite of complementary technologies. For example, there are companies that can synthesize DNA, and there are companies that can develop monoclonal antibodies. One portion of our proprietary technology related to DNA synthesis and assembly includes the ability to de novo synthesize DNA. We believe the following companies engage |
13
in the manufacture of DNA componentry: DNA 2.0, Inc., Blue Heron Biotech, LLC and Life Technologies Corporation, now part of Thermo Fisher Scientific Inc. Another portion of our proprietary technology includes development of fully human monoclonal antibodies. Our technology utilizes advanced methods of stimulating antibody production in naïve human B-cells in vitro and specifically selecting those cells which produce antibodies that can bind a desired target, such as human toxins, tumor cells or microbial pathogens. We believe the following companies engage in the manufacture of human or human-like monoclonal antibodies: AbD SeroTec (a Bio-Rad Laboratories, Inc. company), Alexion Pharmaceuticals, Inc., XOMA Corporation, Genmab US, Inc., MorphoSys AG, NovImmune SA, Société Des Systèmes Biologiques, or BIOTEM, Adimab, LLC, ProMab Biotechnologies, Inc., Abpro, Inc., AIIM Therapeutics and Open Monoclonal Technology, Inc.
• | Industrial companies who may develop their own approach to synthetic biology. Rather than becoming a collaborator with us, potential collaborators may decide to invest time and capital to internally develop their own synthetic biology capabilities. For example, large biopharmaceutical companies, energy companies, and ag-bio companies may pursue a proprietary synthetic biology strategy. |
• | Industrial companies who may develop competing products using other technologies. Products enabled by our synthetic biology will face competition in the market, including from products which have been developed using other industrial technologies. For example, large biopharmaceutical companies pursue other technologies for drug development, and large ag-bio companies pursue other technologies for the development of genetically modified crops. The rapidly evolving market for developing genetically engineered T-cells in particular, a primary focus of our collaboration with ZIOPHARM Oncology, Inc., is characterized by intense competition and rapid innovation. Genetically engineering T-cells faces significant competition in the chimeric antigen receptor (CAR) technology space from multiple companies and their collaborators, such as Novartis/University of Pennsylvania, Bluebird Bio/Celgene/Baylor College of Medicine, Kite Pharma/National Cancer Institute, Juno Therapeutics/Fred Hutchinson Cancer Research Center/Memorial Sloan-Kettering Cancer Center/Seattle Children’s Research Institute, Cellectis/Pfizer and Adaptimmune/GSK. We face competition from non-cell based treatments offered by other companies such as Amgen, AstraZeneca, Bristol-Myers, Incyte, Merck, and Roche. |
Intellectual property
As we advance technologies across multiple platforms and synthetic biology areas, correspondingly, we apply a multilayered approach for protecting intellectual property relating to the inventions we have developed internally as well as those we have acquired from third parties, such as by assignment or by in-license. We seek patent protection in the United States and in other countries for our inventions and discoveries, and we develop and protect our key know-how and trade secrets relating to our platform technologies as well as to the products we are developing with our collaborators.
We seek patent protection for our platform technologies, including but not limited to our (i) switch technology, (ii) activator ligands for our switch technology and (iii) cell identification and selection platform. In addition, we seek patents covering specific collaborator’s products. With respect to a particular collaborator’s product, we may seek patent protection on some or all of the following: the compound itself, its commercial composition, its production and its methods of use.
Through the use of our various platform technologies we seek to design and build proprietary compounds, vectors, methods and processes across a variety of end markets. In particular, we focus our intellectual property on synthetic biology technologies that provide platforms for the design and creation of cells, vectors and components for our collaborators. In addition, we may pursue intermediate and product-specific patents associated with our collaborators’ lead programs.
Our success depends, in part, upon our ability to obtain patents and maintain adequate protection for our intellectual property relating to our technologies and products and potential products. We have adopted a strategy of seeking patent protection in the United States and in other jurisdictions globally as we deem appropriate under the circumstances, with respect to certain of the technologies used in or relating to our products and processes. As of December 31, 2014, we owned at least 55 issued U.S. patents and 55 pending U.S. patent applications relating to certain aspects of our technologies, and we have pursued counterpart patents and patent applications in other jurisdictions around the world, as we have deemed appropriate. We continue to actively develop our portfolio through the filing of new patent applications, provisional and continuations relating to our technologies, methods and products as we and our collaborators deem appropriate.
We have strategic positioning with respect to our key technologies including patent portfolios directed to: our switch technology covering aspects of our gene switches, such as our RheoSwitch Therapeutic System, and gene modulation systems, vectors, cells and organisms containing these switches, and their use; our activator ligand technology covering aspects of our activator ligands and their use; and our cell identification and selection technology covering aspects of our cell identification
14
and selection platform, including our cell purification, isolation, characterization and manipulation technologies. We have also filed counterpart patents and patent applications in other countries, when appropriate, including Australia, Argentina, Brazil, Canada, China, Europe, Hong Kong, India, Indonesia, Israel, Japan, Korea, Mexico, New Zealand, Philippines, Russia, Singapore, South Africa and Taiwan. In the future we may file in these or additional jurisdictions as deemed appropriate for the protection of our technologies.
Additionally, we complement our intellectual property portfolio with exclusive and non-exclusive patent licenses and options for licenses to third party technologies.
A principal component of our strategy is maximizing the value of our ECCs through our intellectual property that covers our technologies, which is accentuated by intermediate and program-specific intellectual property protections. In addition to owned and in-licensed patents, we solidify our intellectual property protection through a combination of trade secrets, know-how, confidentiality, nondisclosure and other contractual provisions, and security measures to protect our confidential and proprietary information related to each platform and collaborator program. We regularly assess and review the risks and benefits of protecting our developments through each aspect of intellectual property available to us.
Because we rely on trade secrets, know-how and continuing technological advances to protect various aspects of our core technology, we require our employees, consultants and scientific collaborators to execute confidentiality and invention assignment agreements with us to maintain the confidentiality of our trade secrets and proprietary information. Our confidentiality agreements generally provide that the employee, consultant or scientific collaborator will not disclose our confidential information to third parties. These agreements also provide that inventions conceived by the employee, consultant or scientific collaborator in the course of working for us will be our exclusive property. Additionally, our employees agree to take certain steps to facilitate our assertion of ownership over such intellectual property. These measures may not adequately protect our trade secrets or other proprietary information. If they do not adequately protect our rights, third parties could use our technologies, and we could lose any competitive advantage we may have. In addition, others may independently develop similar proprietary information or techniques or otherwise gain access to our trade secrets, which could impair any competitive advantage we may have.
Regulatory environment
Regulations affecting Intrexon
Our ongoing research and development relies on evaluations in animals, which may become subject to bans or additional regulations, and, as described below, our research operations are subject to various environmental regulations. However, most of the laws and regulations concerning synthetic biology relate to the end products produced using synthetic biology, but that may change. For example, the Presidential Commission for the Study of Bioethical Issues in December 2010 recommended that the federal government oversee, but not regulate, synthetic biology research. The Presidential Commission also recommended that the federal government lead an ongoing review of developments in the synthetic biology field and that the federal government conduct a reasonable risk assessment before the field release of synthetic organisms. As discussed below, the products our collaborators produce are subject to extensive regulation. Refer to “Risk factors — The markets in which our collaborators are developing products using our technologies are subject to extensive regulation, and we rely on our collaborators to comply with all applicable laws and regulations” for more discussion of regulatory risks.
Environmental regulations affecting both Intrexon and our collaborators
Our collaborators and we are subject to various federal, state and local environmental laws, rules and regulations, including those relating to the discharge of materials into the air, water and ground, the generation, storage, handling, use, transportation and disposal of hazardous materials and the health and safety of employees with respect to laboratory activities required for the development of products and technologies. These laws and regulations require us and our collaborators to obtain environmental permits and comply with numerous environmental restrictions. These laws and regulations also may require expensive pollution control equipment or operation changes to limit actual or potential impacts to the environment.
Our laboratory activities and those of our collaborators inherently involve the use of potentially hazardous materials, which are subject to health, safety and environmental regulations. We design our infrastructure, procedures and equipment to meet our obligations under these regulations. We perform recurring internal and third-party audits and provide employees ongoing training and support, as required. All of our employees must comply with safety instructions and procedures, which are codified in our employment policies. Federal and state laws and regulations impose requirements on the production, importation, use and disposal of chemicals and genetically modified microorganisms, which impact us and our collaborators. Our collaborators’ processes may contain genetically engineered organisms which, when used in an industrial processes, are considered new
15
chemicals under the Toxic Substances Control Act program of the U.S. Environmental Protection Agency, or EPA. These laws and regulations would require our collaborators to obtain and comply with the EPA’s Microbial Commercial Activity Notice process to operate. In the European Union, our collaborators may be subject to a chemical regulatory program known as REACH (Registration, Evaluation, Authorization and Restriction of Chemical Substances). Under REACH, our collaborators are required to register their products with the European Commission, and the registration process could result in significant costs or delay the manufacture or sale of our collaborators’ products in the European Union.
Regulations affecting our collaborators
Human therapeutics regulation
As discussed in “Risk factors — Risks related to our dependence on third parties,” the products produced by our collaborators enabled by our technology platforms are subject to extensive regulation. We rely on our collaborators’ compliance with laws and regulations applicable to the products they produce. We do not independently monitor whether our collaborators comply with applicable laws and regulations. Please see the risk factor entitled “The markets in which our collaborations are developing products using our technologies are subject to extensive regulation, and we rely on our collaborations to comply with all applicable laws and regulations.”
Government authorities in the United States, at the federal, state and local level, and in other countries extensively regulate, among other things, the research, development, testing, manufacture, including any manufacturing changes, packaging, storage, recordkeeping, labeling, advertising, promotion, distribution, marketing, import and export of pharmaceutical products such as those being developed by our collaborators. The processes for obtaining regulatory approvals in the United States and in foreign countries, along with subsequent compliance with applicable statutes and regulations, require the expenditure of substantial time and financial resources.
In addition to regulations in the United States, our collaborators will be subject to a variety of foreign regulations governing clinical trials and commercial sales and distribution of the products enabled by our technologies. Whether or not our collaborators obtain FDA approval for a product, they must obtain approval by the comparable regulatory authorities of foreign countries or economic areas, such as the European Union, before they may commence clinical trials or market products in those countries or areas. The approval process and requirements governing the conduct of clinical trials, product licensing, pricing and reimbursement vary greatly from place to place, and the time may be longer or shorter than that required for FDA approval.
Animal health regulation
The sale of animal health products is governed by the laws and regulations specific to each country. In the majority of our target markets, the relevant health authority is separate from those governing human medicinal products. In the United States, the FDA regulates animal health pharmaceuticals, the United States Department of Agriculture, or USDA, regulates veterinary vaccines, and EPA regulates veterinary pesticides. Each U.S. agency has its own rules and regulations with which our collaborators must comply. In Europe, the European Medicines Agency, or EMA, is responsible for the scientific evaluation of medicines, including animal health products being developed by our collaborators with our technology platforms. Most other countries’ regulatory agencies will generally refer to the FDA, USDA, European Union and other international animal health entities.
Food product regulation
The manufacturing, marketing and certain areas of research related to some of the potential food products developed by our collaborators are subject to regulation by federal and state governmental authorities in the United States, including the FDA, the USDA, and the EPA. Comparable authorities are involved in other countries, including the EMA. The FDA regulates genetically engineered animals under new animal drug provisions of the law, and the agency must approve them before they are allowed on the market. Following marketing approval, the FDA continues to regulate drug and biological products extensively.
Energy and chemical regulation
Regulation by governmental authorities in the United States and other countries is a significant factor in the development, manufacture and marketing of biofuels. The biofuels developed by our collaborators with our technology platforms may require regulatory approval by governmental agencies prior to commercialization. In the United States, various federal, and, in some cases, state statutes and regulations also govern or impact the manufacturing, safety, storage and use of biofuels. The environmental regulations discussed above also govern the development, manufacture and marketing of energy and chemical products.
16
Regulations affecting AquaBounty
On December 26, 2012, the FDA published its environmental assessment, or EA, for AquAdvantage® Salmon, or AAS, along with its Finding of No Significant Impact, or FONSI, in the Federal Register, confirming that an approval of the pending New Animal Drug Application would not have an adverse effect on the environment and opened up a 60 day period for public comment. On February 13, 2013 the FDA extended the period for public comment by an additional 60 days, which expired April 26, 2013.
Prior to the publication of the EA and FONSI, in September 2010, the FDA had held a public meeting of its Veterinary Medicine Advisory Committee to review its findings regarding AAS.
The conclusion of its panel of experts was that AAS is indistinguishable from other farmed Atlantic salmon, is safe to eat and does not pose a threat to the environment under its conditions of use. Subsequently, the FDA initiated an EA in compliance with its obligations under the U.S. National Environmental Policy Act, which requires that all federal agencies consider the possible environmental impacts of any action that they authorize.
While we do not expect any further requirements prior to FDA approval for sale to the public and the public comment period on the EA and FONSI have closed as re-scheduled, the FDA has not provided AquaBounty with an indication of the process or associated timing that will occur subsequent to the conclusion of the re-scheduled period for public comment.
Research and development
As of December 31, 2014, we had 201 research and development employees. We incurred expenses of $59.0 million in 2014, $48.1 million in 2013 and $64.0 million in 2012 on research and development activities. We anticipate that our research and development expenditures will increase substantially as we investigate other applications for our synthetic biotechnologies. Our primary research and development operations are located in laboratory facilities in Blacksburg, Virginia; Budapest, Hungary; Germantown, Maryland; San Diego, California; and South San Francisco, California.
Financial Information
Collaboration revenues, product revenues, service revenues and other revenues and operating income for each of the last three fiscal years, along with assets at December 31, 2014, 2013, and 2012, are set forth in the consolidated financial statements, which are included in Item 8 of this Annual Report. Financial information about geographic areas is set forth in Note 2 to the consolidated financial statements.
Production
Our primary production facilities, including approximately 376 acres of land, are located in Sioux Center, Iowa. The land and facilities are primarily used for our embryo transfer and in vitro fertilization processes, as well as housing livestock used in such processes. We also lease satellite production facilities and land in Maryland, Missouri, Oklahoma and Texas for these purposes.
Employees
As of December 31, 2014, we had 480 full-time and 78 part-time employees. No employees are represented by a labor union and we consider our employee relations to be good.
Corporate information
We are a Virginia corporation and our principal executive offices are located at 20374 Seneca Meadows Parkway, Germantown, MD 20876, and our telephone number is (301) 556-9900.
Additional Information
Our website is www.dna.com. The information on, or that can be accessed through, our website does not constitute part of this Form 10-K. We post regulatory filings on this website as soon as reasonably practicable after they are electronically filed with or furnished to the SEC. These filings include annual reports on Form 10-K, quarterly reports on Form 10-Q, current reports on Form 8-K, Section 16 reports on Forms 3, 4, and 5, and any amendments to those reports filed with or furnished to the SEC. Access to these filings on our website is available free of charge. Copies are also available, without charge, from Intrexon
17
Corporation Investor Relations, 20374 Seneca Meadows Parkway, Germantown, Maryland 20876. Reports filed with the SEC may be viewed at www.sec.gov or obtained at the SEC Public Reference Room at 100 F Street, NE, Washington, D.C. 20549. Information regarding the operation of the Public Reference Room may be obtained by calling the SEC at 1-800-SEC-0330. We also post our press releases on our website. Information on our website is not deemed to be incorporated by reference into this Annual Report.
In addition, our Corporate Governance Guidelines, Code of Business Conduct and Ethics, and charters for the Audit Committee, the Compensation Committee and the Nominating and Corporate Governance Committee are available free of charge to shareholders and the public through the “Corporate Governance” section of our website. Printed copies of the foregoing are available to any shareholder upon written request to our Treasurer at the address set forth on the cover of this Annual Report or may be requested through our website, www.dna.com.
Item 1A. | Risk Factors |
Investing in our common stock involves a high degree of risk. You should carefully consider the risks described below, together with the other information contained in this Annual Report, including our consolidated financial statements and the related notes appearing at the end of this Annual Report, before making your decision to invest in shares of our common stock. We cannot assure you that any of the events discussed in the risk factors below will not occur. These risks could have a material and adverse impact on our business, results of operations, financial condition or prospects. If that were to happen, the trading price of our common stock could decline, and you could lose all or part of your investment.
This Annual Report also contains forward-looking statements that involve risks and uncertainties. Our actual results could differ materially from those anticipated in these forward-looking statements as a result of certain factors, including the risks faced by us described below and elsewhere in this Annual Report. See “Special note regarding forward-looking statements” for information relating to these forward-looking statements.
Risks related to our financial position, operating results and need for additional capital
We have a history of net losses, and we may not achieve or maintain profitability.
We have incurred net losses attributable to Intrexon since our inception, including losses attributable to Intrexon of $81.8 million, $39.0 million and $81.9 million in 2014, 2013 and 2012, respectively. As of December 31, 2014, we had an accumulated deficit of $458.2 million. We may incur losses and negative cash flow from operating activities for the foreseeable future. To date, we have derived a significant portion of our revenues from exclusive channel collaborations, or ECCs, and joint ventures, or JVs, and expect to derive a substantial portion of our revenues from these and additional ECCs and JVs for the foreseeable future. If our existing collaborators terminate their ECCs or JVs with us or we are unable to enter into new ECCs or JVs, our revenues could be adversely affected. In addition, certain of our collaborations provide for milestone payments, future royalties and other forms of contingent consideration, the payment of which are uncertain as they are dependent on our collaborators’ abilities and willingness to successfully develop and commercialize products. We expect a significant period of time will pass before the achievement of contractual milestones and the realization of royalties on products commercialized under our collaborations. As a result, we expect that our expenses will exceed revenues for the foreseeable future, and we may not achieve profitability. If we fail to achieve profitability, or if the time required to achieve profitability is longer than we anticipate, we may not be able to continue our business. Even if we do achieve profitability, we may not be able to sustain or increase profitability on a quarterly or annual basis.
We may need substantial additional capital in the future in order to fund our business.
We expect our future capital requirements will be substantial, particularly as we continue to develop our business and expand our synthetic biology technology platform. Although we believe that our existing cash and cash equivalents and short-term and long-term investments and cash expected to be received from our current collaborators will enable us to fund our operating expenses and capital expenditure requirements for at least the next 12 months, we may need additional capital if our current plans and assumptions change. Our need for additional capital will depend on many factors, including:
• | the commercial success of our ECCs and JVs; |
• | whether we are successful in obtaining payments from our collaborators; |
• | whether we can enter into additional ECCs or JVs; |
18
• | the progress and scope of the collaborative and independent research and development projects performed by us and our collaborators; |
• | whether an existing obligation under our ECC with ZIOPHARM Oncology, Inc., or ZIOPHARM, is triggered that could require us to make a further investment in their securities of up to $6.4 million, the timing of which is not within our control; |
• | the effect of any acquisitions of other businesses or technologies that we may make in the future; |
• | whether we decide to develop internal development or manufacturing capabilities; |
• | the costs associated with being a public company; and |
• | the filing, prosecution and enforcement of our intellectual property. |
If our capital resources are insufficient to meet our capital requirements, and we are unable to enter into or maintain ECCs or JVs with collaborators that are able or willing to fund development efforts or commercialize products enabled by our technologies, we will have to raise additional funds to continue the development of our technologies and complete the commercialization of products, if any, resulting from our technologies. On January 27, 2015, we sold 4,312,500 shares pursuant to an underwritten public offering. If future financings involve the issuance of equity securities, our existing shareholders would suffer further dilution. If we raise debt financing, we may be subject to restrictive covenants that limit our ability to conduct our business. We may not be able to raise sufficient additional funds on terms that are favorable to us, if at all. If we fail to raise sufficient funds and continue to incur losses, our ability to fund our operations, take advantage of strategic opportunities, develop products or technologies, or otherwise respond to competitive pressures could be significantly limited. If this happens, we may be forced to delay or terminate research or development programs or the commercialization of products resulting from our technologies, curtail or cease operations or obtain funds through ECCs, JVs or other collaborative and licensing arrangements that may require us to relinquish commercial rights, or grant licenses on terms that are not favorable to us. If adequate funds are not available, we will not be able to successfully execute our business plan or continue our business.
Our quarterly and annual operating results may fluctuate in the future. As a result, we may fail to meet or exceed the expectations of research analysts or investors, which could cause our stock price to decline.
Our financial condition and operating results have varied significantly in the past and may continue to fluctuate from quarter to quarter and year to year in the future due to a variety of factors, many of which are beyond our control. Factors relating to our business that may contribute to these fluctuations include the following factors, as well as other factors described elsewhere in this Annual Report:
• | our ability to achieve or maintain profitability; |
• | our relationships, and the associated exclusivity terms, with collaborators in our target end markets; |
• | our ability to develop and maintain technologies that our collaborators continue to use and that new collaborators are seeking; |
• | our ability to enter into ECCs or JVs; |
• | the feasibility of producing and commercializing products enabled by our technologies; |
• | obligations to provide resources to our collaborators or to the collaborations themselves pursuant to the terms of the relevant ECC or JV agreement; |
• | our ability to manage our growth; |
• | the outcomes of research programs, clinical trials, or other product development and approval processes conducted by our collaborators; |
• | the ability of our collaborators to develop and successfully commercialize products enabled by our technologies; |
• | risks associated with the international aspects of our business; |
19
• | our ability to integrate any businesses or technologies we may acquire with our business; |
• | potential issues related to our ability to accurately report our financial results in a timely manner; |
• | our dependence on, and the need to attract and retain, key management and other personnel; |
• | our ability to obtain, protect and enforce our intellectual property rights; |
• | our ability to prevent the theft or misappropriation of our intellectual property, know-how or technologies; |
• | potential advantages that our competitors, the competitors or our collaborators, and potential competitors may have in securing funding or developing competing technologies or products; |
• | our ability to obtain additional capital that may be necessary to expand our business; |
• | our collaborators’ ability to obtain additional capital that may be necessary to develop and commercialize products under our ECCs and JVs; |
• | our exposure to the volatility associated with recording the fair value of securities of our collaborators held by us; |
• | business interruptions such as power outages and other natural disasters; |
• | public concerns about the ethical, legal and social ramifications of genetically engineered products and processes; |
• | our ability to use our net operating loss carryforwards to offset future taxable income; and |
• | the results of our consolidated subsidiaries. |
Due to the various factors mentioned above, and others, the results of any prior quarterly or annual periods should not be relied upon as indications of our future operating performance.
We have a limited operating history, which may make it difficult to evaluate our current business and predict our future performance.
We have been in existence since 1998. From 1998 until 2010, our operations focused primarily on organizing and staffing our company and developing our technologies. Our current business model is just beginning to be tested. In January 2011, we recognized our first revenues from our first ECC. We entered into our first JV in 2013. Because our revenue growth has occurred in recent periods, our limited operating history may make it difficult to evaluate our current business and predict our future performance. Any assessments of our current business and predictions made about our future success or viability may not be as accurate as they could be if we had a longer operating history. We have encountered and will continue to encounter risks and difficulties frequently experienced by growing companies in rapidly changing industries. If we do not address these risks successfully, our business will be harmed.
We may pursue strategic acquisitions and investments which could have an adverse impact on our business if they are unsuccessful.
We have made acquisitions in the past and, if appropriate opportunities become available, we may acquire additional businesses, assets, technologies or products to enhance our business in the future. In connection with any future acquisitions, we could:
• | issue additional equity securities, which would dilute our current shareholders; |
• | incur substantial debt to fund the acquisitions; or |
• | assume significant liabilities. |
Although we conduct due diligence reviews of our acquisition targets, such processes may fail to reveal significant liabilities. Acquisitions involve numerous risks, including:
20
• | problems integrating the purchased operations, facilities, technologies or products; |
• | unanticipated costs and other liabilities; |
• | diversion of management’s attention from our core businesses; |
• | adverse effects on existing business relationships with current and/or prospective collaborators, customers and/or suppliers; |
• | risks associated with entering markets in which we have no or limited prior experience; and |
• | potential loss of key employees. |
Acquisitions also may require us to record goodwill and non-amortizable intangible assets that will be subject to impairment testing on a regular basis and potential periodic impairment charges, incur amortization expenses related to certain intangible assets, and incur large and immediate write-offs and restructuring and other related expenses, all of which could harm our operating results and financial condition. In addition, we may acquire companies that have insufficient internal financial controls, which could impair our ability to integrate the acquired company and adversely impact our financial reporting. If we fail in our integration efforts with respect to any of our acquisitions and are unable to efficiently operate as a combined organization, our business and financial condition may be adversely affected.
We may encounter difficulties in connection with our acquisition of Trans Ova.
In August 2014, we completed our acquisition of Trans Ova. We cannot be certain that this acquisition will be successful or that we will realize the anticipated benefits of the acquisition. In particular, we may not be able to realize the strategic and operational benefits and objectives we had anticipated. In addition, we may face increased competition in the markets for Trans Ova’s products. Any of the following factors may have a material adverse effect on our business, operating results and financial condition. These factors may include:
• | the potential disruption of our ongoing business and diversion of management resources; |
• | unanticipated expenses related to Trans Ova’s operations; |
• | the impairment of relationships with Trans Ova’s customers; |
• | the impairment of relationships with key suppliers and their ability to meet our demand; |
• | potential unknown liabilities associated with the acquired business and technology; |
• | potential liabilities related to litigation involving Trans Ova; |
• | potential periodic impairment of goodwill and intangible assets acquired; and |
• | potential inability to retain, integrate and motivate key personnel. |
We own equity interests in several of our collaborators and have exposure to the volatility and liquidity risks inherent in holding their common stock.
In connection with our collaborations, we generally receive technology access fees. Because several of our collaborators are private companies or public corporations with limited capital, we allow them to pay our access fee in stock. As a result, we own equity interests in several of our collaborators. We may continue to provide this alternative to our collaborators. Owning equity in our collaborators further increases our exposure to the risks of our collaborators’ businesses beyond our dependence on these collaborators to provide market and product development expertise, as well as sales, marketing and regulatory capabilities. Our equity ownership in our collaborators exposes us to volatility and the potential for negative returns. We may have restrictions on resale and/or limited markets to sell our equity ownership. In many cases, our equity position is a minority position which exposes us to further risk as we are not able to exert control over the companies in which we hold securities.
We select collaborators based on a variety of factors such as their capabilities, capacity and expertise in a defined field. As described above, we may allow the collaborator to pay our access fee or other consideration or capital due in cash or equity
21
securities. As a result, the process by which we obtain equity interests in our collaborators and the factors we consider in deciding whether to acquire, hold or dispose of these equity positions may differ significantly from those that an independent investor would consider when purchasing equity interests in the collaborator. One significant factor would include our own expectation as to the success of our efforts to assist the collaborator in developing products enabled by our technologies.
We own common stock of several publicly traded companies and the values of those equity interests are subject to market price volatility. For each collaborator where we own equity securities, we make an accounting policy election to present them at either the fair value at the end of each reporting period or using the cost or equity method depending on our level of influence. We have adopted the fair value method of accounting for certain of these securities, and therefore, have recorded them at fair value at the end of each reporting period with the unrealized gain or loss recorded as a separate component of other income or expense, net for the period. As of December 31, 2014 and 2013, the aggregate original cost basis of these securities was $173.9 million and $140.0 million, respectively, and the market value was $164.9 million and $141.5 million, respectively. The fair value of these securities is subject to fluctuation in the future due to the volatility of the stock market, changes in general economic conditions and changes in the financial conditions of one or more collaborators.
The common stock of our collaborators may not be publicly traded, and if it is traded publicly, the trading market could be limited or have low trading volume. In some cases, we could hold unregistered shares and we may not have demand registration rights with respect to those shares. We evaluate whether any discounts for trading restrictions or other basis for lack of marketability should be applied to the fair value of the securities at inception of the ECC or JV. In the event we conclude that a discount should be applied, the fair value of the securities is adjusted at inception of the ECC or JV and re-evaluated at each reporting period thereafter. In all of these instances, we have substantial liquidity risk related to these holdings, and we may not be able to sell, or sell quickly, all or part of these equity interests.
In connection with future ECCs or JVs, we may, from time to time, receive from collaborators, both public and private, warrants, rights and/or options, all of which involve special risks. To the extent we receive warrants or options in connection with future ECCs or JVs, we would be exposed to risks involving pricing differences between the market value of underlying securities and our exercise price for the warrants or options, a possible lack of liquidity and the related inability to close a warrant or options position, all of which could ultimately have an adverse effect.
We rely on our collaborators, subsidiaries and other third parties to deliver timely and accurate information in order to accurately report our financial results in the time frame and manner required by law.
We need to receive timely, accurate and complete information from a number of third parties in order to accurately report our financial results on a timely basis. We rely on our collaborators and subsidiaries to provide us with complete and accurate information regarding revenues, expenses and payments owed to or by us on a timely basis. In addition, we intend to rely on current and future collaborators under our ECCs and JVs to provide us with product sales and cost saving information in connection with royalties, if any, owed to us. If the information that we receive is not accurate, our consolidated financial statements may be materially incorrect and may require restatement, and we may not receive the full amount of consideration to which we are entitled under our ECCs or JVs. Although we have audit rights with these parties, performing such an audit could be expensive and time consuming and may not be adequate to reveal any discrepancies in a timeframe consistent with our reporting requirements. We own a significant equity position in several of our ECC collaborators, including a majority position in two of our ECC collaborators, AquaBounty Technologies, Inc., or AquaBounty, and Biological & Popular Culture, Inc., or BioPop. In 2013, we began to consolidate the financial statements of AquaBounty and BioPop into our consolidated financial statements. In the future, we may need to consolidate the financial statements of one or more other collaborators into our consolidated financial statements. Although we have contractual rights to receive information and certifications allowing us to do this, such provisions may not ensure that we receive information that is accurate or timely. As a result, we may have difficulty completing accurate and timely financial disclosures, which could have an adverse effect on our business.
Our ability to use our net operating loss carryforwards and certain other tax attributes may be limited.
As of December 31, 2014 and 2013, we had net operating loss carryforwards of approximately $254.5 million and $242.3 million, respectively, for U.S. federal income tax purposes available to offset future taxable income and U.S. federal and state research and development tax credits of $6.8 million and $7.0 million, respectively, prior to consideration of annual limitations that may be imposed under Section 382 of the Internal Revenue Code of 1986, as amended, or Section 382. These carryforwards begin to expire in 2022. Our past issuances of stock and mergers and acquisitions have resulted in ownership changes within the meaning of Section 382. As a result, the utilization of portions of our net operating losses may be subject to annual limitations. As of each of December 31, 2014 and 2013, approximately $16.4 million of our net operating losses generated prior to 2008 are limited by Section 382 to annual usage limits of approximately $1.5 million. As of December 31, 2014 and 2013, approximately $19.1 million and $14.8 million, respectively, of net operating losses were inherited via
22
acquisition and are limited based on the value of the target at the time of the transaction. Future changes in stock ownership may also trigger an ownership change and, consequently, a Section 382 limitation. Our direct foreign subsidiary has foreign loss carryforwards of approximately $11.8 million that do not expire.
Risks related to our technologies and business operations
Ethical, legal and social concerns about synthetic biologically engineered products and processes could limit or prevent the use of products or processes using our technologies and limit our revenues.
Our technologies involve the use of synthetic biologically engineered products or synthetic biological technologies. Public perception about the safety and environmental hazards of, and ethical concerns over, genetically engineered products and processes could influence public acceptance of our technologies, products and processes. If we and our collaborators are not able to overcome the ethical, legal and social concerns relating to synthetic biological engineering, products and processes using our technologies may not be accepted. These concerns could result in increased expenses, regulatory scrutiny, delays or other impediments to our programs or the public acceptance and commercialization of products and processes dependent on our technologies or inventions. The ability of our collaborators to develop and commercialize products, or processes using our technologies could be limited by public attitudes and governmental regulation.
The subject of genetically modified organisms has received negative publicity, which has aroused public debate. This adverse publicity could lead to greater regulation and trade restrictions on imports of genetically altered products. Further, there is a risk that products produced using our technologies could cause adverse health effects or other adverse events, which could also lead to negative publicity.
The synthetic biological technologies that we develop may have significantly enhanced characteristics compared to those found in naturally occurring organisms, enzymes or microbes. While we produce our synthetic biological technologies only for use in a controlled laboratory and industrial environment, the release of such synthetic biological technologies into uncontrolled environments could have unintended consequences. Any adverse effect resulting from such a release could have a material adverse effect on our business and financial condition, and we may have exposure to liability for any resulting harm.
We may become subject to increasing regulation in the future.
Our ongoing research and development relies on evaluations in animals, which may become subject to bans or additional regulations, and, as described above, our research operations are subject to various environmental regulations. However, most of the laws and regulations concerning synthetic biology relate to the end products produced using synthetic biology, but that may change. For example, the Presidential Commission for the Study of Bioethical Issues in December 2010 recommended that the federal government oversee, but not regulate, synthetic biology research. The Presidential Commission also recommended that the government lead an ongoing review of developments in the synthetic biology field and that the government conduct a reasonable risk assessment before the field release of synthetic organisms. Synthetic biology may become subject to additional government regulations as a result of the recommendations, which could require us to incur significant additional capital and operating expenditures and other costs in complying with these laws and regulations.
To date, no commercial products have been enabled by our technologies and even if our technologies prove to be effective, they still may not lead to commercially viable products.
To date, none of our collaborators has received marketing approval or has commercialized any products enabled by our technologies. There is no guarantee that we or our collaborators will be successful in creating products enabled by our technologies. Even if our collaborators are successful in using our technologies, they may not be able to commercialize the resulting products or may decide to use other methods competitive with our technologies that do not utilize synthetic biology.
The FDA has not yet approved any gene therapies for use in humans or animals.
The U.S. Food and Drug Administration, or FDA, has not yet approved any gene therapies for use in humans or animals. The field of gene therapies is experimental and has not yet proven successful in many clinical trials. Clinical trials with gene therapies have encountered a multitude of significant technical problems in the past, including unintended integration with host DNA leading to serious adverse events, poor levels of protein expression, transient protein expression, viral overload, immune reactions to either viral capsids utilized to deliver DNA, DNA itself, proteins expressed or cells transfected with DNA. There can be no assurance that our development efforts or those of our collaborators will be successful, that we or they will receive the regulatory approvals necessary to initiate clinical trials, where applicable, or that we will ever be able to successfully commercialize a product enabled by our technologies. To the extent that we or our collaborators utilize viral constructs or other
23
systems to deliver gene therapies and the same or similar delivery systems demonstrate unanticipated and/or unacceptable side effects in preclinical or clinical trials conducted by ourselves or others we may be forced to, or elect to, discontinue development of such products.
If we lose key personnel, including key management personnel, or are unable to attract and retain additional personnel, it could delay our product development programs, harm our research and development efforts, and we may be unable to pursue collaborations or develop our own products.
Our business involves complex operations across a variety of markets and requires a management team and employee workforce that is knowledgeable in the many areas in which we operate. The loss of any key members of our management, including our Chief Executive Officer, Randal J. Kirk, our Chief Operating Officer, Krish S. Krishnan, or our Chief Science Officer, Thomas D. Reed, or the failure to attract or retain other key employees who possess the requisite expertise for the conduct of our business, could prevent us from developing and commercializing our products for our target markets and entering into collaborations or licensing arrangements to execute on our business strategy. We currently maintain key man insurance on Dr. Reed in the amount of $25.0 million; however, that coverage would likely be inadequate to compensate for the loss of his services. In addition, the loss of any key scientific staff, or the failure to attract or retain other key scientific employees, could prevent us from developing our technologies for our target markets and entering into ECCs, JVs or licensing arrangements to execute on our business strategy. We may not be able to attract or retain qualified employees in the future due to the intense competition for qualified personnel among biotechnology, synthetic biology and other technology-based businesses, or due to the unavailability of personnel with the qualifications or experience necessary for our business. If we are not able to attract and retain the necessary personnel to accomplish our business objectives, we may experience staffing constraints that will adversely affect our ability to meet the demands of our collaborators and customers in a timely fashion or to support our internal research and development programs. In particular, our product and process development programs are dependent on our ability to attract and retain highly skilled scientists. Competition for experienced scientists and other technical personnel from numerous companies and academic and other research institutions may limit our ability to attract and retain such personnel on acceptable terms. All of our employees are at-will employees, which means that either the employee or we may terminate their employment at any time.
Our planned activities will require additional expertise in specific industries and areas applicable to the products and processes developed through our technologies or acquired through strategic or other transactions, especially in the end markets that we seek to penetrate. These activities will require the addition of new personnel, and the development of additional expertise by existing personnel. The inability to attract personnel with appropriate skills or to develop the necessary expertise could impair our ability to grow our business.
We may encounter difficulties managing our growth, which could adversely affect our business.
Currently, we are working simultaneously on multiple projects targeting several market sectors, including activities in human therapeutics, protein production, animal sciences, agricultural biotechnology and industrial products. These diversified operations place increased demands on our limited resources and require us to substantially expand the capabilities of our administrative and operational resources and to attract, train, manage and retain qualified management, technicians, scientists and other personnel. As our operations expand domestically and internationally, we will need to continue to manage multiple locations and additional relationships with various customers, collaborators, suppliers and other third parties. Our ability to manage our operations, growth and various projects effectively will require us to make additional investments in our infrastructure to continue to improve our operational, financial and management controls and our reporting systems and procedures and to attract and retain sufficient numbers of talented employees, which we may be unable to do effectively. As a result, we may be unable to manage our expenses in the future, which may negatively impact our gross margins or operating margins in any particular quarter. In addition, we may not be able to successfully improve our management information and control systems, including our internal control over financial reporting, to a level necessary to manage our growth.
Competitors and potential competitors may develop products and technologies that make ours obsolete or garner greater market share than ours.
We do not believe that we have any direct competitors who provide comparable technologies of similar depth and breadth which enable to the same extent the commercialization of products developed using synthetic biology across a broad spectrum of biologically based industries. However, there are companies that have competing technologies for individual pieces of our proprietary suite of complementary technologies. One portion of our proprietary technology related to DNA synthesis and assembly includes the ability to synthesize new DNA. We believe the following companies engage in the manufacture of DNA components: DNA 2.0, Inc., Blue Heron Biotech, LLC (a subsidiary of OriGene) and Life Technologies Corporation, now part of Thermo Fisher Scientific Inc. Another portion of our proprietary technology includes development of fully human
24
monoclonal antibodies. Our technology utilizes advanced methods of stimulating antibody production in naïve human B-cells in vitro, or in a test tube, and specifically selecting those cells which produce antibodies that can bind a desired target, such as human toxins, tumor cells and microbial pathogens. We believe the following companies engage in the manufacture of human or human-like monoclonal antibodies: AbD SeroTec (a Bio-Rad Laboratories, Inc. company), Alexion Pharmaceuticals, Inc., XOMA Corporation, Genmab US, Inc., MorphoSys AG, NovImmune SA, Société Des Systèmes Biologiques, or BIOTEM, Adimab, LLC, ProMab Biotechnologies, Inc., Abpro, Inc., AIIM Therapeutics, Inc. and Open Monoclonal Technology, Inc.
The synthetic biologics industry and each of the commercial sectors we have targeted are characterized by rapid technological change and extensive competition. Our future success will depend on our ability to maintain a competitive position with respect to technological advances. Academic institutions also are working in this field. Technological development by others may result in our technologies, as well as products developed by our collaborators using our technologies, becoming obsolete.
The rapidly evolving market for developing genetically engineered T-cells in particular, is characterized by intense competition and rapid innovation. Genetically engineering T-cells faces significant competition in the chimeric antigen receptor (CAR) technology space from multiple companies and their collaborators, such as Novartis/University of Pennsylvania, Bluebird Bio/Celgene/Baylor College of Medicine, Kite Pharma/National Cancer Institute, Juno Therapeutics/Fred Hutchinson Cancer Research Center/Memorial Sloan-Kettering Cancer Center/Seattle Children’s Research Institute, Cellectis/Pfizer and Adaptimmune/GSK. We face competition from non-cell based treatments offered by other companies such as Amgen, AstraZeneca, Bristol-Myers, Incyte, Merck, and Roche.
Our ability to compete successfully will depend on our ability to develop proprietary technologies that can be used by our collaborators to produce products that reach the market in a timely manner and are technologically superior to and/or are less expensive than other products on the market. Certain of our competitors may benefit from local government subsidies and other incentives that are not available to us or our collaborators. As a result, our competitors may be able to develop competing and/or superior technologies and processes, and compete more aggressively and sustain that competition over a longer period of time than we or our collaborators can. As more companies develop new intellectual property in our markets, a competitor could acquire patent or other rights that may limit products using our technologies, which could lead to litigation.
We may be sued for product liability.
Each of our collaborations requires the collaborator to indemnify us for liability related to products produced pursuant to the ECC or JV and to obtain insurance coverage related to product liability in amounts considered standard for the industry. We believe that these industry-standard coverage amounts range from $15.0 million to $40.0 million in the aggregate. Even so, we may be named in product liability suits relating to products that are produced by our collaborators using our technologies. These claims could be brought by various parties, including other companies who purchase products from our collaborators or by the end users of the products. We cannot guarantee that our collaborators will not breach the indemnity and insurance coverage provisions of the ECCs or JVs. Further, insurance coverage is expensive and may be difficult to obtain, and may not be available to us or to our collaborators in the future on acceptable terms, or at all. We cannot assure you that our collaborators will have adequate insurance coverage against potential claims. In addition, although we currently maintain product liability insurance for our technologies in amounts we believe to be commercially reasonable, if the coverage limits of these insurance policies are not adequate, a claim brought against us, whether covered by insurance or not, could have a material adverse effect on our business, results of operations, financial condition and cash flows. This insurance may not provide adequate coverage against potential losses, and if claims or losses exceed our liability insurance coverage, we may go out of business. If we cannot successfully defend ourselves against product liability claims, we may incur substantial liabilities or be required to limit commercialization of our product candidates. Regardless of the merits or eventual outcome, liability claims may result in:
• | reduced resources of our management to pursue our business strategy; |
• | decreased demand for products enabled by our technologies; |
• | injury to our or our collaborators’ reputation and significant negative media attention; |
• | withdrawal of clinical trial participants; |
• | initiation of investigations by regulators; |
• | product recalls, withdrawals or labeling, marketing or promotional restrictions; |
• | significant costs to defend resulting litigation; |
25
• | substantial monetary awards to trial participants or patients; |
• | loss of revenue; and |
• | the inability to commercialize any products using our technologies. |
We depend on sophisticated information technology and infrastructure.
We rely on various information systems to manage our operations. These systems are complex and include software that is internally developed, software licensed from third parties and hardware purchased from third parties. These products may contain internal errors or defects, particularly when first introduced or when new versions or enhancements are released. Failure of these systems could have an adverse effect on our business, which in turn may materially adversely affect our operating results and financial condition.
We may incur significant costs complying with environmental, health and safety laws and regulations, and failure to comply with these laws and regulations could expose us to significant liabilities.
We use hazardous chemicals and radioactive and biological materials in our business and are subject to a variety of federal, state, local and international laws and regulations governing, among other matters, the use, generation, manufacture, transportation, storage, handling, disposal of, and human exposure to these materials both in the United States and overseas, including regulation by governmental regulatory agencies, such as the Occupational Safety and Health Administration and the U.S. Environmental Protection Agency. We have incurred, and will continue to incur, capital and operating expenditures and other costs in the ordinary course of our business in complying with these laws and regulations.
We have international operations and assets, and may have additional international operations and assets in the future. Our international operations and assets may be subject to various economic, social and governmental risks.
Our international operations and any future international operations may expose us to risks that could negatively impact our future results. Our operations may not develop in the same way or at the same rate as might be expected in a country with an economy similar to the United States. The additional risks that we may be exposed to in these cases include, but are not limited to:
• | tariffs and trade barriers; |
• | currency fluctuations, which could decrease our revenues or increase our costs in U.S. dollars; |
• | regulations related to customs and import/export matters; |
• | tax issues, such as tax law changes and variations in tax laws; |
• | limited access to qualified staff; |
• | inadequate infrastructure; |
• | cultural and language differences; |
• | inadequate banking systems; |
• | different and/or more stringent environmental laws and regulations; |
• | restrictions on the repatriation of profits or payment of dividends; |
• | crime, strikes, riots, civil disturbances, terrorist attacks or wars; |
• | nationalization or expropriation of property; |
• | law enforcement authorities and courts that are weak or inexperienced in commercial matters; and |
• | deterioration of political relations among countries. |
26
Our plans to develop and commercialize, through our ECC with ZIOPHARM, non-viral adoptive cellular therapies based on designer cytokines and chimeric antigen receptor (CAR) T-cell therapies, or CARs, are new approaches to cancer treatment that present significant challenges in a competitive landscape and the success of our efforts depends in large part on our owned and licensed intellectual property, and our efforts may be affected by litigation and developments in intellectual property law outside of our control.
We intend to employ technologies licensed from MD Anderson (as described above in “Item 1. Business-Recent developments”), together with our existing suite of proprietary technologies, through our existing exclusive collaboration agreement with ZIOPHARM to pursue the development and commercialization of non-viral adoptive cellular therapies based on cytokines and CARs under control of RheoSwitch technology targeting a variety of cancer malignancies. Because this is a new approach to cancer immunotherapy and cancer treatment generally, developing and commercializing product candidates subjects us and our ECC partner ZIOPHARM to a number of challenges, including:
• | obtaining regulatory approval from the FDA and other regulatory authorities that have very limited experience with the commercial development of genetically modified T-cell therapies for cancer; |
• | developing and deploying consistent and reliable processes for engineering a patient’s T-cells ex vivo and infusing the engineered T-cells back into the patient; |
• | possibly conditioning patients with chemotherapy in conjunction with delivering each of the potential products, which may increase the risk of adverse side effects of the potential products; |
• | educating medical personnel regarding the potential side effect profile of each of the potential products, such as the potential adverse side effects related to cytokine release; |
• | developing processes for the safe administration of these potential products, including long-term follow-up for all patients who receive the potential products; |
• | sourcing additional clinical and, if approved, commercial supplies for the materials used to manufacture and process the potential products; |
• | developing a manufacturing process and distribution network with a cost of goods that allows for an attractive return on investment; |
• | establishing sales and marketing capabilities after obtaining any regulatory approval to gain market acceptance; |
• | developing therapies for types of cancers beyond those addressed by the current potential products; and |
• | not infringing the intellectual property rights, in particular, the patent rights, of third parties, including competitors developing alternative CAR T-cell therapies. |
We cannot be sure that T-cell immunotherapy technologies developed in our ECC with ZIOPHARM will yield satisfactory products that are safe and effective, scalable, or profitable.
We and ZIOPHARM are dependent on patents, know-how, and proprietary technology in our ECC, both our own and licensed from others. Any termination of these licenses could result in the loss of significant rights and could harm our ability to commercialize our product candidates. Disputes may also arise between us and these licensors regarding intellectual property subject to a license agreement, including those relating to:
• | the scope of rights granted under the license agreement and other interpretation-related issues; |
• | whether and the extent to which our technology and processes, and the technology and processes of ZIOPHARM, infringe on intellectual property of the licensor that is not subject to the license agreement; |
• | our right to sublicense patent and other rights to third parties under collaborative development relationships; |
• | whether we and ZIOPHARM are complying with our diligence obligations with respect to the use of the licensed technology in relation to our development and commercialization of our potential products under our ECC; and |
27
• | the allocation of ownership of inventions and know-how resulting from the joint creation or use of intellectual property by our licensors and by us and our ECC partner ZIOPHARM. |
If disputes over intellectual property that we or ZIOPHARM have licensed in connection with our ECC prevent or impair our or ZIOPHARM’s ability to maintain our current licensing arrangements, particularly with MD Anderson, on acceptable terms, we may be unable to successfully develop and commercialize the affected potential products. We are generally also subject to all of the same risks with respect to protection of intellectual property that we license as we are for intellectual property that we own. If we or our licensors fail to adequately protect this intellectual property, our ability to commercialize potential products under our ECCs could suffer.
Risks associated with our business model
If we fail to maintain and successfully manage our existing, or enter into new, ECCs or JVs, we may not be able to develop and commercialize our technologies and achieve or sustain profitability.
Our ability to enter into, maintain and manage collaborations in our target markets is fundamental to the success of our business. We currently rely, and intend to rely for the foreseeable future, on our collaborators to develop products enabled by our technologies and then to manufacture, market, distribute and sell these products. We intend to enter into other strategic ECCs or JVs to produce, market and sell products enabled by the technologies that we have developed and will continue to develop. However, we may not be successful in entering into ECCs or JVs with future strategic collaborators. Any failure to enter into ECCs or JVs in our target market sectors on favorable terms could delay or hinder our ability to develop and commercialize our technologies and could increase our costs of development and commercialization.
We have entered into ECCs or JVs with strategic collaborators to develop products enabled by our technologies. There can be no guarantee that we can successfully manage these ECCs or JVs. Under the ECCs, we must use diligent efforts to carry out development activities under the ECC. The exclusivity provisions of the ECCs restrict our ability to commercialize our technologies in the designated field covered by the ECC. In most cases, the collaborator may terminate the ECC with us for any reason upon 90 days’ notice. In all cases, the ECC may be terminated if we fail to exercise diligent efforts or breach, and fail to cure, other provisions of the ECC. In addition, since our efforts to date have focused on a small number of collaborators in certain targeted sectors, our business would be adversely affected if one or more of these collaborators terminate their ECCs or JVs, fail to use our technologies or fail to develop commercially viable products enabled by our technologies.
Dependence on ECCs or JVs also will subject us to other risks, including:
• | we have relinquished important rights regarding the commercialization, marketing and distribution of products and we may disagree with our collaborators’ plans in these areas; |
• | although we retain broad rights with respect to intellectual property developed under the ECCs, our collaborators have the right, under certain circumstances, to take control of the enforcement of such intellectual property; |
• | we may have lower revenues than if we were to develop, manufacture, market and distribute products enabled by our technologies ourselves; |
• | a collaborator could, without the use of our synthetic biology technologies, develop and market a competing product either independently or in collaboration with others, including our competitors; |
• | our collaborators could be undercapitalized or fail to secure sufficient resources to fund the development and/or commercialization of the products enabled by our technologies in accordance with the ECC; |
• | our collaborators could become unable or less willing to expend their resources on research and development or commercialization efforts with respect to our technologies due to general market conditions, their financial condition or other circumstances beyond our control; |
• | we may be unable to manage multiple simultaneous ECCs or JVs or fulfill our obligations with respect thereto; |
• | disagreements with a collaborator could develop and any conflict with a collaborator could reduce our ability to enter into future ECCs or JVs and negatively impact our relationships with one or more existing collaborators; |
28
• | our collaborators could terminate our ECC or JV with them, in which case, our collaborators may retain rights related to certain products, we may not be able to find another collaborator to develop different products in the field and we may not be able to develop different products in the field ourselves; |
• | our business could be negatively impacted if any of our collaborators undergo a change of control to a third party who is not willing to work with us on the same terms or commit the same resources as our current collaborator; and |
• | our collaborators may operate in countries where their operations could be adversely affected by changes in the local regulatory environment or by political unrest. |
If any of these events occur, or if we fail to maintain our ECCs or JVs with our collaborators, we may not be able to commercialize our existing and potential technologies, grow our business or generate sufficient revenues to support our operations.
Many of our collaborators, including some businesses over which we have significant influence, will need additional capital.
In order for many of our collaborators to execute on their business plans, these collaborators will have future capital requirements, and we may be asked to invest additional funds in these collaborators. If we fail to invest additional funds in a collaborator, the collaborator may not have sufficient capital to continue operations.
We rely on our collaborators to develop, commercialize and market products, and they may not be successful.
We depend on our collaborators to commercialize the products enabled by our technologies. If our collaborators are not able to successfully develop the products enabled by our technologies, none of our enabled products will become commercially available and we will receive no back-end payments under our ECCs or JVs. Because we do not currently and may never possess the resources necessary to independently develop and commercialize all of the potential products that may result from our technologies, our ability to succeed in markets we have currently targeted depends on our ability to enter into ECCs or JVs to develop and commercialize potential products. Some of our existing collaborators do not themselves have the resources necessary to commercialize products and they in turn will need to rely on additional sources of financing or third party collaborations. In addition, pursuant to our current ECCs or JVs and similar ECCs or JVs that we may enter into in the future, we have limited or no control over the amount or timing of resources that any collaborator is able or willing to devote to developing products or collaborative efforts. Any of our collaborators may fail to perform its obligations under the ECC. Our collaborators may breach or terminate their ECCs or JVs with us or otherwise fail to conduct their collaborative activities successfully and in a timely manner. If any of these events were to occur, our revenues, financial condition and results of operations could be adversely affected.
The sales process for our ECCs or JVs may be lengthy and unpredictable, and we may expend substantial funds and management effort with no assurance of successfully entering into new collaborations to commercialize our technologies.
The sales process for our ECCs or JVs may be lengthy and unpredictable. Our sales and licensing efforts may require the effective demonstration of the benefits, value, differentiation, validation of our technologies and services and significant education and training of multiple personnel and departments within the potential collaborator’s organization. Though we have made efforts to standardize our ECCs or JVs, we may be required to negotiate ECCs or JVs containing terms unique to each collaborator, which would lengthen the sales cycle. We may expend substantial funds and management effort with no assurance that we will execute an ECC, JV or otherwise sell our technologies or services. In addition, this lengthy sales cycle makes it more difficult for us to accurately forecast revenue in future periods and may cause revenues and operating results to vary significantly in such periods.
We have entered into a limited number of ECCs and JVs to date, and we require collaborators to successfully commercialize the products enabled by our technologies.
Our success depends upon entering into ECCs and JVs with a number of collaborators across a broad spectrum of industries. There is a risk that we may not be able to demonstrate the value proposition of our technologies with enough collaborators across enough industries for us to be successful. We intend to pursue additional ECCs and JVs, but may be unable to do so on terms satisfactory to us, or at all. Our current ECCs and JVs and any new collaborations we are able to enter into in one or more of the markets we have targeted may not be successful. Moreover, because we have limited financial and managerial resources, we will be required to prioritize our application of resources to particular development efforts. Any resources we expend on one or more of these efforts could be at the expense of other potentially profitable opportunities. If we focus our efforts and
29
resources on one or more of these markets and they do not lead to commercially viable products, our revenues, financial condition and results of operations could be adversely affected.
Many of our current collaborators have no experience producing products at the commercial scale needed for the development of their business, and they will not succeed if they cannot effectively commercialize their products.
In addition to developing products using our technologies, our collaborators must demonstrate the ability to utilize our technologies to produce desired products at the commercial scale and on an economically viable basis or they must collaborate with others to do so. The products and processes developed using our technologies may not perform as expected when applied at commercial scale, or our collaborators may encounter operational challenges for which we and they are unable to devise a workable solution. For example, contamination in the production process could decrease process efficiency, create delays and increase our collaborators’ costs. Moreover, under the terms of our ECCs or JVs, we limit the ability of our collaborators to partner their programs with third parties. We and our collaborators may not be able to scale up our production in a timely manner, if at all, even if our collaborators successfully complete product development in their laboratories and pilot and demonstration facilities. If this occurs, the ability of our collaborators to commercialize products and processes using our technologies will be adversely affected, and, with respect to any products that are brought to market, our collaborators may not be able to lower the cost of production, which would adversely affect our ability to increase the future profitability of our business.
The markets in which our collaborators are developing products using our technologies are subject to extensive regulation, and we rely on our collaborators to comply with all applicable laws and regulations.
Our technologies are used in products that are subject to extensive regulation by governmental authorities. We depend on our collaborators to comply with these laws and regulations with respect to products they produce using our technologies and we do not independently monitor whether our collaborators comply with applicable laws and regulations. If our collaborators fail to comply with applicable laws and regulations, we are subject to substantial financial and operating risks because we depend on our collaborators to produce the end products enabled by our technologies for sale, and because in many cases we have, or in the future may have, a substantial equity interest in our collaborators. These regulatory risks are extensive and include the following:
• | complying with these regulations, including seeking approvals, the uncertainty of the scope of future regulations, and the costs of continuing compliance with regulations could affect the sales and profitability of our collaborators and materially impact our operating results; |
• | our business could be adversely affected if the processes used by our collaborators to manufacture their final products fail to be approved by the applicable regulatory authorities; |
• | where products are subject to regulatory approval, the regulatory approval process can be lengthy, costly, time consuming and inherently unpredictable, and if our collaborators are ultimately unable to obtain regulatory approval for products using our technologies, our business will be substantially harmed; |
• | even if our collaborators are able to commercialize products using our technologies, the product may become subject to post-approval regulatory requirements, unfavorable pricing regulations, third-party payor reimbursement practices or regulatory reform initiatives that could harm our business; |
• | we and our collaborators conduct on-going research and development that relies on evaluations in animals, which may become subject to bans or additional regulations; |
• | compliance with existing or future environmental laws and regulations could have a material adverse impact on the development and commercialization of products using our technologies; and |
• | to the extent products produced using our technologies are commercialized outside the United States, they will be subject to additional laws and regulations under the jurisdictions in which such products are commercialized. |
The markets in which we and our collaborators are developing products using our technologies are highly competitive.
The markets in which we and our collaborators are developing products are, and will continue to be, highly competitive, and there can be no assurance that we or our collaborators will be able to compete effectively. There are numerous companies presently in these markets that are developing products that may compete with, and could adversely affect the prices for, any
30
products developed by our collaborators using our technologies. Many of these competitors and potential competitors are well-established companies with significant resources and experience, along with well-developed distribution systems and networks for their products, valuable historical relationships with potential customers and extensive sales and marketing programs for their products. Some of these competitors may use these resources and their market influence to impede the development and/or acceptance of the products developed by our collaborators using our technologies.
To the extent that any of our collaborators’ competitors are more successful with respect to any key competitive factor or our collaborators are forced to reduce, or are unable to raise, the price of any products enabled by our technologies in order to remain competitive, our operating results and financial condition could be materially adversely affected. Competitive pressure could arise from, among other things, safety and efficacy concerns, limited demand or a significant number of additional competitive products being introduced into a particular market, price reductions by competitors, the ability of competitors to capitalize on their economies of scale, the ability of competitors to produce or otherwise procure products similar or equivalent to those of our collaborators at lower costs and the ability of competitors to access more or newer technology than our collaborators can access (including our own).
Our right to terminate our ECCs is limited.
Generally, we do not have the right to terminate an ECC except in limited circumstances such as the collaborator’s failure to exercise diligent efforts in performing its obligations under the ECC, including its development of products enabled by our technologies, or its breach of a term of the ECC that remains uncured for a specified period of time. Moreover, each of our collaborators receives an exclusive license to use all of our technologies in a designated field, potentially in perpetuity. The collaborators we choose in particular fields may not be in the best position to maximize the value of our technologies in that field, if they are capable of commercializing any products at all. In addition, the scope of the field for a particular ECC may prove to be too broad and result in the failure to maximize the value of our technologies in that field.
A significant portion of our business is conducted by joint ventures that we cannot operate solely for our benefit.
A significant portion of our business is carried out by JVs. In JVs we share ownership and management of a company with one or more parties who may not have the same goals, strategies, priorities or resources as we do and may compete with us outside the JV. JVs are intended to be operated for the benefit of all JV partners, rather than for our exclusive benefit. Operating a business as a JV often requires additional organizational formalities as well as time-consuming procedures for sharing information and making decisions. In JVs we are required to foster our relationships with our JV partners as well as promote the overall success of the JV, and if a JV partner changes or relationships deteriorate, our success in the JV may be materially adversely affected. The benefits from a successful JV are shared among the JV partners, so we do not receive all the benefits from our successful JVs. Moreover, as a partial owner of a JV, we are exposed to potential risks and liabilities that we do not face when we enter into an ECC.
Risks related to our intellectual property
Our ability to compete may decline if we do not adequately protect our proprietary technologies or if we lose some of our intellectual property rights through costly litigation or administrative proceedings.
Our success depends in part on our ability to obtain patents and maintain adequate protection of our intellectual property in the United States and abroad for our suite of technologies and resultant products and potential products. We have adopted a strategy of seeking patent protection in the United States and abroad with respect to certain of the technologies used in or relating to our products and processes. We have also in-licensed rights to additional patents and pending patent applications in the United States and abroad. We intend to continue to apply for patents relating to our technologies, methods and products as we deem appropriate.
We have strategic positioning with respect to our key technologies including patent portfolios directed to: our switch technology covering aspects of our gene switches, such as our RheoSwitch Therapeutic System, and gene modulation systems, vectors, cells and organisms containing these switches, and their use; our activator ligand technology covering aspects of our activator ligands and their use; and our cell identification and selection technology covering aspects of our cell identification and selection platform, including our cell purification, isolation, characterization and manipulation technologies. We have also filed counterpart patents and patent applications in other countries, including Australia, Argentina, Brazil, Canada, China, Europe, Hong Kong, India, Indonesia, Israel, Japan, Korea, Mexico, New Zealand, Philippines, Russia, Singapore, South Africa and Taiwan. In the future we may file in these or additional jurisdictions as deemed appropriate for the protection of our technologies.
31
The enforceability of patents, as well as the actual patent term and expiration thereof, involves complex legal and factual questions and, therefore, the extent of enforceability cannot be guaranteed. Issued patents and patents issuing from pending applications may be challenged, invalidated or circumvented. Moreover, the United States Leahy-Smith America Invents Act, enacted in September 2011, brought significant changes to the U.S. patent system, which include a change to a “first to file” system from a “first to invent” system and changes to the procedures for challenging issued patents and disputing patent applications during the examination process, among other things. The effects of these changes on our patent portfolio and business have yet to be determined, as the final substantive provisions of the America Invents Act took effect on March 16, 2013. The United States Patent and Trademark Office, or the USPTO, only recently finalized the rules relating to these changes and the courts have yet to address the new provisions. These changes could increase the costs and uncertainties surrounding the prosecution of our patent applications and the enforcement or defense of our patent rights. Additional uncertainty may result from legal precedent handed down by the United States Court of Appeals for the Federal Circuit and United States Supreme Court as they determine legal issues concerning the scope and construction of patent claims and inconsistent interpretation of patent laws by the lower courts. Accordingly, we cannot ensure that any of our pending patent applications will result in issued patents, or even if issued, predict the breadth of the claims upheld in our and other companies’ patents. Given that the degree of future protection for our proprietary rights is uncertain, we cannot ensure that we were the first to invent the inventions covered by our pending patent applications, we were the first to file patent applications for these inventions, the patents we have obtained, particularly certain patents claiming nucleic acids, proteins, or methods, are valid and enforceable, and the proprietary technologies we develop will be patentable.
In addition, unauthorized parties may attempt to copy or otherwise obtain and use our products or technology. Monitoring unauthorized use of our intellectual property is difficult, and we cannot be certain that the steps we have taken will prevent unauthorized use of our technologies, particularly in certain foreign countries where the local laws may not protect our proprietary rights as fully as in the United States. Moreover, third parties could practice our inventions in territories where we do not have patent protection. Such third parties may then try to import into the United States or other territories products, or information leading to potentially competing products, made using our inventions in countries where we do not have patent protection for those inventions. If competitors are able to use our technologies, our ability to compete effectively could be harmed. Moreover, others may independently develop and obtain patents for technologies that are similar to or superior to our technologies. If that happens, we may need to license these technologies, and we may not be able to obtain licenses on reasonable terms, if at all, which could harm our business.
We also rely on trade secrets to protect our technologies, especially in cases when we believe patent protection is not appropriate or obtainable. However, trade secrets are difficult to protect. While we require our employees, academic collaborators, collaborators, consultants and other contractors to enter into confidentiality agreements, we may not be able to adequately protect our trade secrets or other proprietary or licensed information. If we cannot maintain the confidentiality of our proprietary and licensed technologies and other confidential information, our ability and that of our licensor to receive patent protection and our ability to protect valuable information owned or licensed by us may be imperiled. Enforcing a claim that a third-party entity illegally obtained and is using any of our trade secrets is expensive and time consuming, and the outcome is unpredictable. Moreover, our competitors may independently develop equivalent knowledge, methods and know-how.
Litigation or other proceedings or third-party claims of intellectual property infringement could require us to spend significant time and money and could prevent us from commercializing our technologies or impact our stock price.
Our commercial success also depends in part on not infringing patents and proprietary rights of third parties, and not breaching any licenses or other agreements that we have entered into with regard to our technologies, products and business. We cannot ensure that patents have not been issued to third parties that could block our or our collaborators’ ability to obtain patents or to operate as we would like. There may be patents in some countries that, if valid, may block our ability to make, use or sell our products in those countries, or import our products into those countries, if we are unsuccessful in circumventing or acquiring the rights to these patents. There also may be claims in patent applications filed in some countries that, if granted and valid, also may block our ability to commercialize products or processes in these countries if we are unable to circumvent or license them.
The biotechnology industry is characterized by frequent and extensive litigation regarding patents and other intellectual property rights. Many companies have employed intellectual property litigation as a way to gain a competitive advantage. Our involvement in litigation, interferences, opposition proceedings or other intellectual property proceedings inside and outside of the United States, to defend our intellectual property rights or as a result of alleged infringement of the rights of others, may divert management time from focusing on business operations and could cause us to spend significant amounts of money. Some of our competitors may have significantly greater resources and, therefore, they are likely to be better able to sustain the cost of complex patent or intellectual property litigation than we could. The uncertainties associated with litigation could have a
32
material adverse effect on our ability to raise the funds necessary to continue our business or to enter into additional collaborations with others. Furthermore, any potential intellectual property litigation also could force us or our collaborators to do one or more of the following:
• | stop selling, incorporating or using products that use the intellectual property at issue; |
• | obtain from the third party asserting its intellectual property rights a license to sell or use the relevant technology, which license may not be available on reasonable terms, if at all; or |
• | redesign those products or processes that use any allegedly infringing technology, or relocate the operations relating to the allegedly infringing technology to another jurisdiction, which may result in significant cost or delay to us, or which could be technically infeasible. |
The patent landscape in the field of synthetic biology is particularly complex. We are aware of U.S. and foreign patents and pending patent applications of third parties that cover various aspects of synthetic biology including patents that some may view as covering aspects of our technologies. In addition, there may be patents and patent applications in the field of which we are not aware. In many cases, the technologies we develop are early-stage technologies and we are and our collaborators are just beginning the process of designing and developing products using these technologies. Although we will seek to avoid pursuing the development of products that may infringe any patent claims that we believe to be valid and enforceable, we and our collaborators may fail to do so. Moreover, given the breadth and number of claims in patents and pending patent applications in the field of synthetic biology and the complexities and uncertainties associated with them, third parties may allege that we or our collaborators are infringing upon patent claims even if we do not believe such claims to be valid and enforceable.
Except for claims we believe will not be material to our financial results, no third party has asserted a claim of infringement against us, others may hold proprietary rights that could prevent products using our technologies from being marketed. Any patent-related legal action against persons who license our technologies, our collaborators or us claiming damages and seeking to enjoin commercial activities relating to products using our technologies or our processes could subject us to potential liability for damages and require our licensor or us to obtain a license to continue to manufacture or market such products or any future product candidates that use our technologies. We cannot predict whether we or our licensor would prevail in any such actions or that any license required under any of these patents would be made available on commercially acceptable terms, if at all. In addition, we cannot be sure that any such products or any future product candidates or processes could be redesigned to avoid infringement, if necessary. Accordingly, an adverse determination in a judicial or administrative proceeding, or the failure to obtain necessary licenses, could prevent our collaborators from developing and commercializing products using our technologies, which could harm our business, financial condition and operating results.
If any of our competitors have filed patent applications or obtained patents that claim inventions also claimed by us, we may have to participate in interference proceedings declared by the USPTO to determine priority of invention and, thus, the right to the patents for these inventions in the United States. These proceedings could result in substantial cost to us even if the outcome is favorable. Even if successful, an interference may result in loss of certain of our important claims.
Any litigation or proceedings could divert our management’s time and efforts. Even unsuccessful claims could result in significant legal fees and other expenses, diversion of management time, and disruption in our business. Uncertainties resulting from initiation and continuation of any patent or related litigation could harm our ability to compete.
Obtaining and maintaining our patent protection depends on compliance with various procedural, document submission, fee payment and other requirements imposed by governmental patent agencies, and our patent protection could be reduced or eliminated for non-compliance with these requirements.
The USPTO and various foreign governmental patent agencies require compliance with a number of procedural, documentary, fee payment and other provisions during the patent process. Given the size of our intellectual property portfolio, compliance with these provisions involves significant time and expense. There are situations in which noncompliance can result in abandonment or lapse of a patent or patent application, resulting in partial or complete loss of patent rights in the relevant jurisdiction. In such an event, competitors might be able to enter the market earlier than would otherwise have been the case.
33
If we do not obtain additional protection under the Hatch-Waxman Amendments and similar foreign legislation by extending the patent terms and obtaining data exclusivity for our technologies, our business may be materially harmed.
Depending upon the timing, duration and specifics of FDA marketing approval of products using our technologies, one or more of the U.S. patents we own or license may be eligible for limited patent term restoration under the Drug Price Competition and Patent Term Restoration Act of 1984, referred to as the Hatch-Waxman Amendments. The Hatch-Waxman Amendments permit a patent restoration term of up to five years as compensation for patent term lost during product development and the FDA regulatory review process. However, we may not be granted an extension because of, for example, failing to apply within applicable deadlines, failing to apply prior to expiration of relevant patents or otherwise failing to satisfy applicable requirements. Moreover, the applicable time period or the scope of patent protection afforded could be less than we request. If we are unable to obtain patent term extension or restoration or the term of any such extension is less than we request, our competitors may obtain approval of competing products following our patent expiration, and our ability to generate revenues could be materially adversely affected.
Enforcing our intellectual property rights may be difficult and unpredictable.
If we were to initiate legal proceedings against a third party to enforce a patent claiming one of our technologies, the defendant could counterclaim that our patent is invalid and/or unenforceable or assert that the patent does not cover its manufacturing processes, manufacturing components or products. Proving patent infringement may be difficult, especially where it is possible to manufacture a product by multiple processes. Furthermore, in patent litigation in the United States, defendant counterclaims alleging both invalidity and unenforceability are commonplace. Although we believe that we have conducted our patent prosecution in accordance with the duty of candor and in good faith, the outcome following legal assertions of invalidity and unenforceability during patent litigation is unpredictable. With respect to the validity of our patent rights, we cannot be certain, for example, that there is no invalidating prior art, of which we and the patent examiner were unaware during prosecution. If a defendant were to prevail on a legal assertion of invalidity and/or unenforceability, we would not be able to exclude others from practicing the inventions claimed therein. Such a loss of patent protection could have a material adverse impact on our business. Even if our patent rights are found to be valid and enforceable, patent claims that survive litigation may not cover commercially valuable products or prevent competitors from importing or marketing products similar to our own, or using manufacturing processes or manufacturing components similar to those used to produce the products using our technologies.
Although we believe we have obtained assignments of patent rights from all inventors, if an inventor did not adequately assign their patent rights to us, a third party could obtain a license to the patent from such inventor. This could preclude us from enforcing the patent against such third party.
We may not be able to enforce our intellectual property rights throughout the world.
The laws of some foreign countries do not protect intellectual property rights to the same extent as the laws of the United States. Many companies have encountered significant problems in protecting and defending intellectual property rights in certain foreign jurisdictions. The legal systems of certain countries, particularly certain developing countries, do not favor the enforcement of patents and other intellectual property protection, particularly those relating to synthetic biology. This could make it difficult for us to stop the infringement of our patents or misappropriation of our other intellectual property rights. Proceedings to enforce our patent rights in foreign jurisdictions could result in substantial costs and divert our efforts and attention from other aspects of our business. Accordingly, our efforts to protect our intellectual property rights in such countries may be inadequate.
If our technologies or products using our technologies are stolen, misappropriated or reverse engineered, others could use the technologies to produce competing technologies or products.
Third parties, including our collaborators, contract manufacturers, contractors and others involved in our business often have access to our technologies. If our technologies, or products using our technologies, were stolen, misappropriated or reverse engineered, they could be used by other parties that may be able to reproduce our technologies or products using our technologies for their own commercial gain. If this were to occur, it would be difficult for us to challenge this type of use, especially in countries with limited intellectual property protection.
Confidentiality agreements with employees and others may not adequately prevent disclosures of trade secrets and other proprietary information.
We have taken measures to protect our trade secrets and proprietary information, but these measures may not be effective. We require our new employees and consultants to execute confidentiality agreements upon the commencement of an employment
34
or consulting arrangement with us. These agreements generally require that all confidential information developed by the individual or made known to the individual by us during the course of the individual’s relationship with us be kept confidential and not disclosed to third parties. These agreements also generally provide that inventions conceived by the individual in the course of rendering services to us shall be our exclusive property. Nevertheless, our proprietary information may be disclosed, third parties could reverse engineer our technologies or products using our technologies and others may independently develop substantially equivalent proprietary information and techniques or otherwise gain access to our trade secrets. Costly and time-consuming litigation could be necessary to enforce and determine the scope of our proprietary rights, and failure to obtain or maintain trade secret protection could adversely affect our competitive business position.
Risks related to AquaBounty
Because we own a majority of the issued and outstanding shares of AquaBounty, the following risk factors that are applicable to AquaBounty’s business also apply to us.
AquaBounty will need additional capital.
In order for AquaBounty to execute on its business plan as announced by its management, AquaBounty will have future capital requirements, and we may be asked to invest additional funds in AquaBounty. If we fail to invest these additional funds, we may not retain control over AquaBounty. We have been advised by the management of AquaBounty that as of December 31, 2014, AquaBounty held $5.2 million of cash and cash equivalents and had a working capital balance of $4.6 million and that these amounts will provide adequate funds for AquaBounty’s ongoing operations into the middle of 2015. We have no contractual obligation to provide funds to AquaBounty and therefore we do not know whether, or to what extent, we will be required to invest additional funds in AquaBounty.
There is significant uncertainty regarding regulatory approval for AquaBounty’s AquAdvantage® Salmon.
As a genetically modified animal for human consumption, AquAdvantage® Salmon, or AAS, will require approval from the FDA and regulatory bodies in other countries before it can be sold. To date, there have been significant delays in the regulatory process. There is no guarantee that any approvals granted, if granted, will not be subject to onerous obligations. Any change to AAS or the development of a new product, including pursuant to our ECC, will require AquaBounty to again obtain approval from the FDA and regulatory bodies in other countries.
The regulatory approval process for commercial introduction of AAS will be based on evidence that the AAS are safe to eat and can be grown under conditions that are environmentally sound. AquaBounty is seeking regulatory approval for AAS under a New Animal Drug Application, or NADA. NADA includes all the study components required for Import Tolerance, or tolerances for unapproved new animal drugs where edible portions of animals imported into the United States may contain residues of such drugs, plus an efficacy study, a target animal safety study and a non-target environmental safety study.
Regulatory approval, under the U.S. Food, Drug and Cosmetic Act, requires the submission of studies demonstrating human food safety and consistency in the manufacturing process. From 1995 to 2010 AquaBounty submitted the results of a number of studies on the safety and manufacturing of AAS. AquaBounty completed all major submissions for its NADA for AAS with the FDA in 2010.
In September 2010, the FDA held a public meeting of its Veterinary Medicine Advisory Committee to review its findings regarding AAS. The conclusion of the committee was that AAS is indistinguishable from other farmed Atlantic salmon, is safe to eat and does not pose a threat to the environment under its conditions of use. Subsequently, the FDA initiated an environmental assessment in compliance with its obligations under the U.S. National Environmental Policy Act, which requires that all federal agencies consider the possible environmental impacts of any action which they authorize.
On December 26, 2012, the FDA published its environmental assessment for AAS, along with a Finding of No Significant Impact, in the Federal Register, confirming that an approval of the pending NADA would not have an adverse effect on the environment and opened up a 60 day period for public comment. On February 13, 2013, the FDA extended the period for public comment by an additional 60 days and the period expired on April 26, 2013.
As of February 15, 2015, AquaBounty is awaiting a report of final action by the FDA on the pending NADA. We do not know when the FDA will issue this report.
35
AquaBounty may have limited success in gaining consumer acceptance of its products, particularly in the face of current public opposition and current and potential future laws.
There is an active and vocal group of opponents to genetically modified organisms who wish to ban or restrict the technology and who, at a minimum, hope to sway consumer perceptions and acceptance of this technology. Their efforts include regulatory legal challenges and labeling campaigns for genetically modified products, as well as application of pressure to consumer retail outlets seeking a commitment not to carry genetically modified Atlantic salmon. Under current labeling laws, AquaBounty is not required to label its AquAdvantage® Salmon at the retail level as containing genetically modified ingredients but several states have either passed laws or are considering new laws that would require labeling genetically modified ingredients as such at the retail level, which could negatively impact consumer acceptance. Further, these groups have a history of bringing legal action against companies attempting to bring new biotechnology products to market. On January 16, 2014, an application was filed by two non-governmental organizations with the Canadian Federal Court seeking judicial review to declare invalid the decision by the Canadian Minister of the Environment to publish in the Canadian Gazette a Significant New Activity Notice, or SNAN, with respect to AquAdvantage® Salmon. AquaBounty may be subject to future additional litigation brought by one or more of these organizations in their attempt to block the development or sale of its products. In addition, animal rights groups and various other organizations and individuals have attempted to stop genetic engineering activities by pressing for legislation and additional regulation in these areas. AquaBounty may not be able to overcome the negative consumer perceptions and potential legal hurdles that these organizations seek to instill or assert against its products.
Atlantic salmon farming is subject to disease outbreaks which can increase the cost of production and/or reduce production harvests, and the loss of AquaBounty broodstock would result in the loss of AquaBounty’s commercial technology.
Although AquaBounty has stated that it will produce and grow its AquAdvantage® Salmon in land-based, closed containment facilities, which AquaBounty believes are at less risk of potential disease outbreak than open sea-cage systems, AquaBounty will still be at risk for potential disease outbreaks. The economic impact of disease to these production systems can be significant, as farmers must incur the cost of preventive measures, such as vaccines and antibiotics, and then if infected, the cost of lost or reduced harvests. AquaBounty has stated that it has implemented biosecurity measures in its facilities to prevent or mitigate disease impact, but there can be no assurance that any measures will be 100 percent effective.
Further, AquaBounty’s AAS intellectual property resides in the breeding population of live fish, or broodstock, themselves; destruction of AAS broodstocks by whatever means would result in the loss of the commercial technology. Live animals are subject to disease that may, in some cases, prevent or cause delay in the export of fish or eggs to customers. Disease organisms may be present undetected and transferred inadvertently. Such events may cause loss of revenue.
AquaBounty is exposed to exchange rate fluctuation.
As a consequence of the international nature of its business, AquaBounty is exposed to risks associated with changes in foreign currency exchange rates. AquaBounty is based in the United States and presents its financial statements in U.S. dollars and the majority of AquaBounty’s cash resources are held in U.S. dollars or in Canadian dollars. Some of AquaBounty’s future expenses and revenues are expected to be denominated in currencies other than in U.S. dollars. Therefore, movements in exchange rates to translate to foreign currencies may have an impact on AquaBounty’s reported results of operations, financial position and cash flows.
Risks related to our common stock
We do not anticipate paying cash dividends, and accordingly, shareholders must rely on stock appreciation for any return on their investment.
We have never declared or paid cash dividends on our capital stock. We do not anticipate paying cash dividends in the future and intend to retain all of our future earnings, if any, to finance the operations, development and growth of our business. As a result, only appreciation of the price of our common stock, which may never occur, will provide a return to shareholders. Investors seeking cash dividends should not invest in our common stock.
If securities or industry analysts do not publish research or reports, or publish inaccurate or unfavorable research or reports about our business, our share price and trading volume could decline.
The trading market for our shares of common stock depends, in part, on the research and reports that securities or industry analysts publish about us or our business. We do not have any control over these analysts. If securities or industry analysts do not continue to cover us, the trading price for our shares of common stock may be negatively impacted. If one or more of the analysts who covers us downgrades our shares of common stock, changes their opinion of our shares or publishes inaccurate or
36
unfavorable research about our business, our share price would likely decline. If one or more of these analysts ceases coverage of us or fails to publish reports on us regularly, demand for our shares of common stock could decrease and we could lose visibility in the financial markets, which could cause our share price and trading volume to decline.
If our executive officers, directors and largest shareholders choose to act together, they may be able to control our management and operations, acting in their own best interests and not necessarily those of other shareholders.
As of December 31, 2014, our executive officers, directors and beneficial holders of five percent or more of our outstanding stock owned approximately 63 percent of our voting stock, including shares subject to outstanding options and warrants. As a result, these shareholders, acting together, would be able to significantly influence all matters requiring approval by our shareholders, including the election of directors and the approval of mergers or other business combination transactions, as well as our management and affairs. The interests of this group of shareholders may not always coincide with the interests of other shareholders, and they may act in a manner that advances their best interests and not necessarily those of other shareholders. This concentration of ownership control may:
• | delay, defer or prevent a change in control; |
• | entrench our management and/or the board of directors; or |
• | impede a merger, consolidation, takeover or other business combination involving us that other shareholders may desire. |
We have engaged in transactions with companies in which Randal J. Kirk, our Chief Executive Officer, and his affiliates have an interest.
We have engaged in a variety of transactions with companies in which Mr. Kirk and affiliates of Mr. Kirk have an interest. Among these transactions are our ECCs with Genopaver, LLC, Fibrocell Science, Inc. and Persea Bio, LLC, our licensing arrangement with Halozyme Therapeutics, Inc., and our joint venture with Intrexon Energy Partners. We believe that each of these transactions was on terms no less favorable to us than terms we could have obtained from unaffiliated third parties, and each of these transactions was approved by at least a majority of the disinterested members of the audit committee of our board of directors. In addition, subsequent to our consummation of the ECCs with ZIOPHARM, Oragenics, Inc., Synthetic Biologics, Inc., AmpliPhi Biosciences Corp., Soligenix, Inc., Agilis Biotherapeutics LLC, and OvaScience, Inc., Mr. Kirk and his affiliates invested in these companies. Furthermore, as we execute on these ECCs or JVs going forward, a conflict may arise between our interests and those of Mr. Kirk and his affiliates. It is our intention to ensure that all future transactions, if any, between us and our officers, directors, principal shareholders and their affiliates, are approved by the audit committee or a majority of the independent and disinterested members of the board of directors in accordance with our written related person transaction policy, and are on terms no less favorable to us than those that we could obtain from unaffiliated third parties.
As of December 31, 2014, Randal J. Kirk controlled approximately 61 percent of our common stock and is able to control or significantly influence corporate actions, which may result in Mr. Kirk taking actions contrary to the desires of our other shareholders.
We have historically been controlled, managed and principally funded by Randal J. Kirk, our Chief Executive Officer, and affiliates of Mr. Kirk. As of December 31, 2014, Mr. Kirk and shareholders affiliated with him beneficially owned approximately 61 percent of our voting stock. On January 27, 2015, Mr. Kirk and certain of his affiliates purchased 555,556 shares of our common stock in a public offering. Mr. Kirk is able to control or significantly influence all matters requiring approval by our shareholders, including the election of directors and the approval of mergers or other business combination transactions. The interests of Mr. Kirk may not always coincide with the interests of other shareholders, and he may take actions that advance his personal interests and are contrary to the desires of our other shareholders.
A significant portion of our total outstanding shares of common stock is restricted from immediate resale but may be sold into the market in the near future. This could cause the market price of our common stock to drop significantly, even if our business is doing well.
Sales of a substantial number of shares of our common stock in the public market could occur at any time. These sales, or the perception in the market that the holders of a large number of shares of common stock intend to sell shares, could reduce the market price of our common stock. If Mr. Kirk or any of his affiliates were to sell a substantial portion of the shares they hold, it could cause our stock price to decline.
37
In addition, as of December 31, 2014, there were 8,323,544 shares subject to outstanding options that will become eligible for sale in the public market to the extent permitted by any applicable vesting requirements, lock-up agreements and Rules 144 and 701 under the Securities Act of 1933, as amended. Shares issuable upon the exercise of such options can be freely sold in the public market upon issuance and once vested.
We are subject to anti-takeover provisions in our articles of incorporation and bylaws and under Virginia law that could delay or prevent an acquisition of our Company, even if the acquisition would be beneficial to our shareholders.
Certain provisions of Virginia law, the commonwealth in which we are incorporated, and our articles of incorporation and bylaws could hamper a third party’s acquisition of us, or discourage a third party from attempting to acquire control of us. These provisions include:
• | a provision allowing our board of directors to issue preferred stock with rights senior to those of the common stock without any vote or action by the holders of our common stock. The issuance of preferred stock could adversely affect the rights and powers, including voting rights, of the holders of common stock; |
• | establish advance notice requirements for nominations for election to the board of directors or for proposing matters that can be acted on at shareholder meetings; |
• | the inability of shareholders to convene a shareholders’ meeting without the support of shareholders owning together 25 percent of our common stock; |
• | the application of Virginia law prohibiting us from entering into a business combination with the beneficial owner of 10 percent or more of our outstanding voting stock for a period of three years after the 10 percent or greater owner first reached that level of stock ownership, unless we meet certain criteria; |
• | allow the authorized number of our directors to be changed only by resolution of our board of directors; |
• | limit the manner in which shareholders can remove directors from the board; |
• | require that shareholder actions must be effected at a duly called shareholder meeting and prohibit actions by our shareholders by written consent; and |
• | limit who may call a special meeting of shareholder meetings. |
These provisions also could limit the price that certain investors might be willing to pay in the future for shares of our common stock. In addition, these provisions make it more difficult for our shareholders, should they choose to do so, to remove our board of directors or management.
We are no longer an “emerging growth company” under the JOBS Act, and thus are no longer permitted to rely on exemptions from certain disclosure requirements.
Based on the market value of our common stock held by non-affiliates as of June 30, 2014, we ceased to be an “emerging growth company” on December 31, 2014. As an “emerging growth company” under the JOBS Act, we were permitted to rely on exemptions from certain disclosure and other requirements, but we will now be required to:
• | have an auditor attest to, and report on, management’s assessment of our internal control over financial reporting pursuant to Section 404(b) of the Sarbanes-Oxley Act; |
• | comply with any requirement that may be adopted by the Public Company Accounting Oversight Board; and |
• | submit certain executive compensation matters to shareholder advisory votes, such as “say on pay” and “say on frequency.” |
We irrevocably elected not to avail ourselves of the JOBS Act accommodation allowing for delayed adoption of new or revised accounting standards, and, therefore, have been subject to the same new or revised accounting standards as other public companies that are not emerging growth companies.
38
If we fail to maintain an effective system of internal control over financial reporting, we may not be able to accurately report our financial results or prevent fraud. As a result, shareholders could lose confidence in our financial and other public reporting, which would harm our business and the trading price of our common stock.
Effective internal controls over financial reporting are necessary for us to provide reliable financial reports and, together with adequate disclosure controls and procedures, are designed to prevent fraud. Any failure to implement required new or improved controls, or difficulties encountered in their implementation could cause us to fail to meet our reporting obligations. In addition, any testing by us conducted in connection with Section 404 of the Sarbanes-Oxley Act, or any subsequent testing by our independent registered public accounting firm, may reveal deficiencies in our internal controls over financial reporting that are deemed to be material weaknesses or that may require prospective or retroactive changes to our financial statements or identify other areas for further attention or improvement. Inferior internal controls could also cause investors to lose confidence in our reported financial information, which could have a negative effect on the trading price of our common stock.
The financial reporting obligations of being a public company in the United States are expensive and time consuming, and may place significant additional demands on our management.
Prior to the consummation of our initial public offering in August 2013, we were not subject to public company reporting obligations in the United States. The additional obligations of being a public company in the United States require significant additional expenditures and place additional demands on our management, including costs resulting from public company reporting obligations under the Securities Exchange Act of 1934, as amended, and the rules and regulations regarding corporate governance practices, including those under the Sarbanes-Oxley Act, the Dodd-Frank Wall Street Reform and Consumer Protection Act, and the listing requirements of the New York Stock Exchange. Our management and other personnel devote a substantial amount of time to ensure that we comply with all of these requirements. Any changes that we make to comply with these obligations may not be sufficient to allow us to satisfy our obligations as a public company on a timely basis, or at all.
We also expect these rules and regulations to make it more difficult and more expensive for us to obtain director and officer liability insurance, and we may be required to accept reduced policy limits and coverage or incur substantially higher costs to obtain the same or similar coverage. These factors also could make it more difficult for us to attract and retain qualified persons to serve on our board of directors, particularly to serve on our audit and compensation committees, or as executive officers.
Item 1B. | Unresolved Staff Comments |
Not applicable.
Item 2. | Properties |
We establish the geographic locations of our research and development operations based on proximity to the relevant market expertise and access to available talent pools. The following table shows information about our primary lab operations as of December 31, 2014:
Location | Square Footage | ||
Blacksburg, VA | 35,456 | ||
Budapest, Hungary | 17,978 | ||
Germantown, MD | 56,258 | ||
San Diego, CA | 23,409 | ||
South San Francisco, CA | 29,409 | ||
Our primary production facilities are located in Sioux Center, Iowa, and include approximately 229,000 square feet of production and office facilities and approximately 367 acres of land. The land and production facilities are primarily used for embryo transfer and in vitro fertilization processes, as well as housing livestock used in such processes. We also lease satellite production facilities and land in Maryland, Missouri, Oklahoma and Texas for these purposes.
We lease an additional 27,000 square feet of administrative offices in West Palm Beach, Florida; Germantown, Maryland; and Blacksburg, Virginia. The original terms of our leases range from one to seven years. See also “Management’s Discussion and Analysis of Financial Condition and Results of Operations — Contractual Obligations and Commitments.”
39
Item 3. | Legal Proceedings |
We are involved in litigation or legal matters incidental to our business activities. While the outcome of these matters cannot be predicted with certainty, we are vigorously defending them and do not currently expect that any of them will have a material adverse effect on our business or financial position. However, should one or more of these matters be resolved in a manner adverse to our current expectation, the effect on our results of operations for a particular fiscal reporting period could be material.
Item 4. | Mine Safety Disclosures |
Not applicable.
Item 4A. | Executive Officers of the Registrant |
The following table sets forth certain information regarding our executive officers and directors as of February 15, 2015.
Name | Age | Position(s) | |||
Executive Officers | |||||
Randal J. Kirk | 60 | Chief Executive Officer and Chairman of the Board | |||
Krish S. Krishnan | 49 | Chief Operating Officer | |||
Thomas D. Reed, Ph.D. | 49 | Chief Science Officer | |||
Rick L. Sterling | 50 | Chief Financial Officer | |||
Donald P. Lehr | 40 | Chief Legal Officer | |||
Suma M. Krishnan | 49 | Senior Vice President — Product Development | |||
Darryl Webster | 54 | Senior Vice President — Intellectual Property | |||
Jeffrey T. Perez | 43 | Senior Vice President — Intellectual Property Affairs | |||
Thomas R. Kasser, Ph.D. | 60 | Senior Vice President — Food Sector | |||
Robert F. Walsh, III | 56 | Senior Vice President — Energy Sector | |||
Nir Nimrodi | 45 | Senior Vice President — Corporate Development and Environment Sector | |||
Gregory I. Frost, Ph.D. | 43 | Senior Vice President — Health Sector | |||
Executive officers
Randal J. Kirk, Chief Executive Officer and Chairman of the Board. Mr. Kirk has served as our Chief Executive Officer since April of 2009 and Chairman of the Board since February 2008. Mr. Kirk provides a wealth of strategic, operational and management experience. Mr. Kirk currently serves as the Senior Managing Director and Chief Executive Officer of Third Security, LLC, an investment management firm founded by Mr. Kirk in March 1999. Additionally, Mr. Kirk founded and became Chairman of the Board of New River Pharmaceuticals Inc. (previously traded on NASDAQ prior to its acquisition by Shire plc in 2007) in 1996, and was President and Chief Executive Officer between October 2001 and April 2007. Mr. Kirk currently serves in a number of additional capacities including as a member of the board of directors of Halozyme Therapeutics, Inc. (NASDAQ: HALO) since May 2007 and as a member of the board of directors of ZIOPHARM Oncology, Inc. (NASDAQ: ZIOP) since January 2011. Previously, Mr. Kirk served as a member of the board of directors of Scios, Inc. (previously traded on NASDAQ prior to its acquisition by Johnson & Johnson) between February 2000 and May 2002, and as a member of the board of directors of Clinical Data, Inc. (previously traded on NASDAQ prior to its acquisition by Forest Laboratories, Inc. in April 2011) from September 2002 to April 2011, and was Chairman of the board of directors from December 2004 to April 2011. Mr. Kirk served on the board of visitors of Radford University from July 2003 to June 2009, was Rector of the board of directors from September 2006 to September 2008, and served on the board of directors of the Radford University Foundation, Inc. from September 1998 to May 2011. He served on the board of visitors of the University of Virginia and Affiliated Schools from July 2009 to October 2012, on the Virginia Advisory Council on Revenue Estimates from July 2006 to October 2012 and on the Governor’s Economic Development and Jobs Creation Commission from April 2010 to October 2012. Mr. Kirk received a B.A. in Business from Radford University and a J.D. from the University of Virginia. We believe that Mr. Kirk’s business experience, including his extensive business experience as chief executive officer of multiple companies, his experience as an investor, his service on committees of academic institutions and other public company boards, combined with his business acumen and judgment, provide our board of directors with valuable strategic and operational expertise and leadership skills.
40
Krish S. Krishnan, M.S., M.B.A., Chief Operating Officer. Mr. Krishnan has served as Intrexon’s Chief Operating Officer since 2011. He brings many years of experience in the life sciences industry, having held key executive roles at several companies including Chief Executive Officer of Pinnacle Pharmaceuticals, Inc. from 2009 to 2011, Chief Financial Officer and Chief Operating Officer of New River Pharmaceuticals, Inc. (previously traded on NASDAQ prior to its acquisition by Shire plc) from April 2004 until April 2007, and Senior Managing Director of Third Security, LLC between 2001 and 2008. Additionally, Mr. Krishnan served as a member of the board of directors of Biotie Therapies Oyj (BTH1V:Helsinki) between 2008 and 2009 and New River Pharmaceuticals, Inc. from March 2003 until April 2007. Mr. Krishnan started his career as an engineer with E.I. Dupont de Nemours in Wilmington, Delaware. He received a B.S. in Mechanical Engineering from the Indian Institute of Technology, an M.S. in Engineering from the University of Toledo, and an M.B.A. in Finance from The Wharton School at the University of Pennsylvania.
Thomas D. Reed, Ph.D., Chief Science Officer. Dr. Reed co-founded Intrexon in 1998 and has served as Chief Science Officer since then and served on Intrexon’s board of directors until April 16, 2014. Dr. Reed is a molecular geneticist with over 20 years of experience in recombinant DNA technology. He has developed sophisticated transgenic model systems for studying the role of gene products in neuronal, cardiovascular, and cancer systems. Dr. Reed has published numerous peer-reviewed articles in the fields of subcellular modulation, gene regulation and cardiac function and is an inventor on numerous patents. Dr. Reed received his B.S. in Genetics from the University of California-Davis, an M.S. in Biological Science from Wright State University, and a Ph.D. in Molecular and Developmental Biology from the University of Cincinnati.
Rick L. Sterling, Chief Financial Officer. Mr. Sterling has served as our Chief Financial Officer since 2007. Prior to joining us, he was with KPMG where he worked in the audit practice for over 17 years, with a client base primarily in the healthcare, technology and manufacturing industries. Mr. Sterling’s experience includes serving clients in both the private and public sector, including significant experience with SEC filings and Sarbanes-Oxley compliance. He received a B.S. in Accounting and Finance from Virginia Polytechnical Institute and State University and is a licensed Certified Public Accountant.
Donald P. Lehr, Chief Legal Officer. Mr. Lehr has served as our Chief Legal Officer since 2011. From 2009 to 2011 he served as our Associate General Counsel. Mr. Lehr has broad experience in the areas of corporate, securities, and general business law. Prior to joining us, he was at Hogan Lovells LLP (formerly Hogan & Hartson, LLP) in Baltimore, Maryland from 2002 to 2009. While at Hogan, his practice included the representation of privately and publicly held corporations across many industries, including biotechnology, pharmaceuticals, health care, software, technology, and manufacturing. Prior to his time at Hogan, Mr. Lehr served as a judicial clerk for the Honorable Irma S. Raker of the Court of Appeals of Maryland. Mr. Lehr received a B.A. from Swarthmore College and received a J.D. from the University of Maryland School of Law.
Suma M. Krishnan, Senior Vice President — Product Development. Mrs. Krishnan has served as our Senior Vice President — Product Development since 2012. From 2009 to 2011, Mrs. Krishnan served as Senior Vice President of Product Development at Pinnacle Pharmaceuticals, Inc. From 2007 to 2009, she served as Chief Financial Officer of Light Matters Foundation. Previously, Mrs. Krishnan was Vice President, Product Development at New River Pharmaceuticals Inc. from September 2002 until its acquisition by Shire plc in April 2007. Mrs. Krishnan has 23 years’ experience in drug development. Prior to serving at New River Pharmaceuticals Inc., Mrs. Krishnan served in the following capacities: Director, Regulatory Affairs at Shire Pharmaceuticals, Inc., a specialty pharmaceutical company; Senior Project Manager at Pfizer, Inc., a multi-national pharmaceutical company; and a consultant at the Weinberg Group, a pharmaceutical and environmental consulting firm. Mrs. Krishnan began her career as a discovery scientist for Janssen Pharmaceuticals, Inc., a subsidiary of Johnson & Johnson, a multi-national pharmaceutical company, in May 1991. Mrs. Krishnan received an M.S. in Organic Chemistry from Villanova University, an M.B.A. from Institute of Management and Research (India) and an undergraduate degree in Organic Chemistry from Ferguson University (India).
Darryl Webster, Senior Vice President — Intellectual Property. Mr. Webster has served as our Senior Vice President — Intellectual Property since 2010. Mr. Webster has over 25 years of legal experience. During his law firm experience and 20 plus years of corporate IP practice, he has worked in scientific areas that match each of the markets we are targeting. Prior to joining us, Mr. Webster was most recently Senior Patent Counsel at Wyeth (now Pfizer Inc.), where he worked from 1993 to 2010. During his sixteen years at Wyeth, he was the lead patent counsel for several key products and areas including a $6B biological, the Asia Pacific Region, and the Wyeth Nutrition business. Before his work at Wyeth, he worked for more than four years in the core chemical and biochemical areas at AlliedSignal Inc., now Honeywell International Inc. Mr. Webster received Bachelors’ degrees in Chemistry (Biological Specialization) and Economics from Duke University and a J.D. from the University of Maryland School of Law.
Jeffrey T. Perez, Senior Vice President — Intellectual Property Affairs. Mr. Perez has served as Senior Vice President — Intellectual Property Affairs since August 2014. Before joining Intrexon, Mr. Perez was Managing Director and Associate General Counsel and Intellectual Property at Third Security, LLC, where he evaluated potential investments of Third Security’s
41
managed investment funds. Additionally, Mr. Perez worked with Third Security portfolio companies in evaluating and developing their intellectual property strategies and general corporate activities. Prior to joining Third Security, Mr. Perez practiced law in the area of intellectual property with the law firm of Hunton & Williams LLP in Washington D.C. Mr. Perez’s previous work involved client consultation, litigation, agreement work, opinion drafting and patent procurement. Mr. Perez received B.S. from Cornell University and his J.D. from George Mason University School of Law.
Thomas R. Kasser, Ph.D., M.B.A., Senior Vice President — Food Sector. Dr. Kasser has served as Senior Vice President — Food Sector since May 2013. Dr. Kasser served as President of Animal Sciences and Agricultural Biotechnology Divisions and Senior Vice President from April 2012 to May 2013 and, prior to that, as President of the Animal Sciences Division from March 2011. Dr. Kasser brings over 30 years of business management experience in the biotechnology and life sciences industries. He was most recently President and Chief Executive Officer of Angionics, Inc., an early-stage biotech company focused on novel anti-angiogenic technology directed at therapies for cancer and ocular diseases from June 2009 to March 2011. Prior to Angionics, he was a Covance Corporate Vice President and General Manager of Covance Research Products Inc. Dr. Kasser had over 20 years of experience at Monsanto Company both in commercial as well as scientific leadership roles, including tenures as General Manager of Monsanto Choice Genetics, Inc., directing new product development for the Nutrition and Consumer products business, and managing clinical safety and efficacy trials under the jurisdiction of the Food and Drug Administration’s Center for Veterinary Medicine. Dr. Kasser was designated a Monsanto Fellow in recognition of his scientific and technical excellence. He currently serves on the board of directors for AquaBounty Technologies, Inc., an aquaculture biotechnology company. Additionally, he is Chairman of the board of directors of Exemplar Genetics and serves on the boards of directors of Trans Ova Genetics and Viagen, all of which are wholly-owned subsidiaries of Intrexon Corporation. Dr. Kasser received an M.S. in Animal Nutrition from The Pennsylvania State University, an M.B.A. from Washington University — St. Louis and a Ph.D. in Nutrition from the University of Georgia.
Robert F. Walsh, III, Senior Vice President — Energy Sector. Mr. Walsh has served as our Senior Vice President — Energy Sector since 2013. Mr. Walsh has over 30 years of experience in the petroleum and chemical industries. Mr. Walsh served as Chief Commercial Officer of ZeaChem Inc., a cellulosic biofuel and biochemical company, from 2011 to 2013. Prior to his time at ZeaChem, Mr. Walsh served as Chief Executive Officer of Aurora Algae, Inc., an algae production company, from 2008 to 2010, President of LS9, Inc., an industrial biotechnology company, from 2007 to 2008, Senior Vice President and Chief Operating Officer of Chemoil Corporation, from 2005 to 2006, and General Manager Supply, Europe for Shell Europe Oil Products, from 2001 to 2006. Mr. Walsh received a B.S. in Chemical Engineering from Purdue University.
Nir Nimrodi, Senior Vice President — Corporate Development and Environment Sector. Mr. Nimrodi joined Intrexon as Senior Vice President — Environment Sector in March 2014 and in October 2014, Mr. Nimrodi became our Senior Vice President of Corporate Development. Mr. Nimrodi brings to Intrexon over 20 years of diverse international experience, in large global businesses in the life sciences, pharmaceutical, biotechnology, and diagnostics industries. Prior to joining Intrexon, Mr. Nimrodi was most recently the Vice President and General Manager of Life Technologies, Inc. Food Safety and Animal Health Business, now part of Thermo Fisher Scientific, and also served in numerous executive roles, including Chief Executive Officer and Board Member of Life Technologies Israel and Head of Protein Technologies. While at Life Technologies, he played a key part in its acquisition by Thermo Fisher Scientific. Previously, Mr. Nimrodi held leadership positions as CEO of Proneuron Biotechnologies, Inc. and also Mindsense Biosystems, as well as Director of Finance of Teva Pharmaceutical Industries, Ltd. Before joining the life sciences industry, he served in the Israeli Navy and worked for the Israeli Ministry of Defense. Mr. Nimrodi earned a B.A. in Economics and an M.B.A in Finance from Tel-Aviv University.
Gregory I. Frost, Ph.D., Senior Vice President — Health Sector. Dr. Frost has served as Senior Vice President — Health Sector, since January 2014. Dr. Frost brings to Intrexon more than 20 years of biotechnology industry and research experience in the areas of biochemistry, molecular pathology, pharmacology, and drug delivery. He was most recently Chief Executive Officer of Halozyme Therapeutics, Inc (NASDAQ: HALO), a company he co-founded in 1999, and has also served on the Board of Directors and in numerous operational roles, including Chief Scientific Officer. For more than 15 years, Dr. Frost led the research and development efforts at Halozyme from discovery through commercialization for a number of internal and partnered biotechnology products, as well as facilitating broad alliances with pharmaceutical companies such as Roche and Pfizer. Before co-founding Halozyme, Dr. Frost conducted research at the Sidney Kimmel Cancer Center. Prior to that, while in the Department of Pathology at the University of California, San Francisco, Dr. Frost led foundational studies to purify, clone, and characterize an enzyme gene family of human hyaluronidases. Dr. Frost received a B.A. in biochemistry and molecular biology from the University of California, Santa Cruz, and a Ph.D. in the Department of Pathology at the University of California, San Francisco.
42
PART II
Item 5. | Market for Registrant’s Common Equity, Related Stockholder Matters and Issuer Purchases of Equity Securities |
Market Information and Holders of Record
The following table sets forth for the periods indicated the high and low sales prices per share of our common stock as reported on the New York Stock Exchange:
High | Low | ||||||
Year Ended December 31, 2014 | |||||||
Fourth Quarter | $ | 28.78 | $ | 16.13 | |||
Third Quarter | 26.62 | 17.35 | |||||
Second Quarter | 26.60 | 13.13 | |||||
First Quarter | 38.50 | 22.53 | |||||
Year Ended December 31, 2013 | |||||||
Fourth Quarter | $ | 25.95 | $ | 17.52 | |||
Third Quarter (1) | 31.44 | 20.65 | |||||
(1) Our common stock commenced trading on the NYSE on August 8, 2013.
As of February 15, 2015, we had 144 holders of record of our common stock. The actual number of shareholders is greater than this number of record holders and includes shareholders who are beneficial owners but whose shares are held in street name by brokers and other nominees. This number of holders of record also does not include shareholders whose shares may be held in trust by other entities.
Securities Authorized for Issuance Under Equity Compensation Plans
Information about our equity compensation plans is incorporated herein by reference to Item 12 of Part III of this Annual Report on Form 10-K.
Dividends
We have never declared or paid any cash dividends on our capital stock. We currently intend to retain earnings, if any, to finance the growth and development of our business. We do not expect to pay any cash dividends on our common stock in the foreseeable future. Payment of future dividends, if any, will be at the discretion of our board of directors and will depend on our financial condition, results of operations, capital requirements, restrictions contained in current or future financing instruments, provisions of applicable law and other factors that our board of directors deems relevant.
Stock Performance Graph
This performance graph shall not be deemed “soliciting material” or to be “filed” with the SEC for purposes of Section 18 of the Securities Exchange Act of 1934, as amended (Exchange Act), or otherwise subject to the liabilities under that Section, and shall not be deemed to be incorporated by reference into any filing of Intrexon Corporation under the Securities Act of 1933, as amended, or the Exchange Act.
The following graph shows a comparison from August 8, 2013 (the date our common stock commenced trading on the New York Stock Exchange) through December 31, 2014 of the cumulative total return for our common stock, the Standard & Poor’s 500 Stock Index (S&P 500 Index) and the NYSE MKT ARCA Biotechnology Index. The graph assumes that $100 was invested at the market close on August 8, 2013 in the common stock of Intrexon Corporation, the S&P 500 Index and the NYSE MKT ARCA Biotechnology Index and data for the S&P 500 Index and the NYSE MKT ARCA Biotechnology Index assumes reinvestments of dividends. The stock price performance of the following graph is not necessarily indicative of future stock price performance.
43
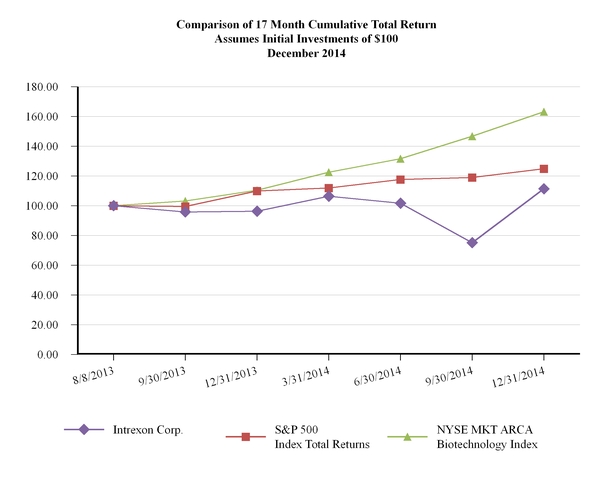
Company / Index | Base Period 8/8/2013 | 9/30/2013 | 12/31/2013 | 3/31/2014 | 6/30/2014 | 9/30/2014 | 12/31/2014 | ||||||||||||||||||||
Intrexon Corporation | $ | 100.00 | $ | 95.79 | $ | 96.24 | $ | 106.31 | $ | 101.62 | $ | 75.13 | $ | 111.32 | |||||||||||||
S&P 500 Index | 100.00 | 99.38 | 109.82 | 111.81 | 117.66 | 118.99 | 124.86 | ||||||||||||||||||||
NYSE MKT ARCA Biotechnology Index | 100.00 | 103.12 | 110.29 | 122.45 | 131.51 | 146.60 | 163.14 | ||||||||||||||||||||
Recent Sales of Unregistered Securities and Use of Proceeds from Registered Securities
(a) Sales of Unregistered Securities
From January 1, 2014 through December 31, 2014, we consummated the following transactions involving the issuance of unregistered securities:
• | a private placement of 972,004 shares of our common stock on March 26, 2014, as disclosed in our Current Report on Form 8-K filed on March 27, 2014, and |
• | the issuance of 1,378,631 shares of our common stock on August 8, 2014 in connection with our acquisition of Trans Ova, as disclosed in Item 3.02 of our Current Report on Form 8-K filed on August 11, 2014, as amended on October 24, 2014. |
(b) Use of Proceeds
On August 7, 2013, our registration statement on Form S-1 (File No. 333-189853) was declared effective by the Securities and Exchange Commission for our initial public offering pursuant to which we sold an aggregate of 11,499,998 shares of our common stock (inclusive of 1,499,999 shares of common stock sold by us pursuant to the full exercise of an overallotment option granted to the underwriters in connection with the offering) at a price to the public of $16.00 per share for aggregate
44
gross offering proceeds of approximately $184.0 million. J.P. Morgan Securities LLC and Barclays Capital Inc. acted as joint book-running managers. On August 13, 2013, we closed the sale of such shares, resulting in net proceeds to us of approximately $168.3 million after deducting underwriting discounts and commissions of approximately $12.9 million and other offering expenses of approximately $2.8 million. No payments were made by us to directors, officers or persons owning ten percent or more of our common stock or to their associates, or to our affiliates. We invested the funds received in cash equivalents and other short-term and long-term investments in accordance with our investment policy. There has been no material change in the planned use of proceeds from our initial public offering as described in our final prospectus, dated August 7, 2013, and filed with the Securities and Exchange Commission on August 8, 2013 pursuant to Rule 424(b).
On January 27, 2015, we closed a public offering of 4,312,500 shares of our common stock (inclusive of 562,500 shares of common stock sold by us pursuant to the full exercise of an option granted to the underwriters in connection with the offering) at a public offering price of $27.00 per share for aggregate gross offering proceeds of approximately $116.4 million. J.P. Morgan Securities LLC and Merrill Lynch, Pierce, Fenner & Smith Incorporate acted as joint book-running managers. Net proceeds to us were approximately $110.0 million after deducting underwriting discounts and commissions of approximately $6.1 million and other offering expenses of approximately $0.3 million. No payments were made by us to directors, officers or persons owning ten percent or more of our common stock or to their associates, or to our affiliates. We invested the funds received in cash equivalents and other short-term and long-term investments in accordance with our investment policy. There has been no material change in the planned use of proceeds from this offering as described in our final prospectus, dated January 21, 2015, and filed with the Securities and Exchange Commission on January 22, 2015 pursuant to Rule 424(b).
(c) Issuer Purchases of Equity Securities
None.
Item 6. | Selected Financial Data |
The following table sets forth our selected consolidated financial data for the periods and as of the dates indicated. You should read the following selected consolidated financial data in conjunction with our audited consolidated financial statements and the related notes thereto included elsewhere in this Annual Report and the “Management’s Discussion and Analysis of Financial Condition and Results of Operations” section of this Annual Report.
The selected consolidated financial data set forth below as of December 31, 2014 and 2013, and for the years ended December 31, 2014, 2013 and 2012, are derived from our audited consolidated financial statements included elsewhere in this report. The selected consolidated financial data set forth below as of December 31, 2012 and 2011, and for the year ended December 31, 2011, are derived from our audited consolidated financial statements contained in reports previously filed with the SEC, not included herein. Our audited and unaudited consolidated financial statements have been prepared in U.S. dollars in accordance with U.S. GAAP.
Our historical results for any prior period are not necessarily indicative of results to be expected in any future period, and our results for any interim period are not necessarily indicative of results to be expected for a full fiscal year.
45
Year Ended December 31, | |||||||||||||||
2014 | 2013 | 2012 | 2011 | ||||||||||||
(In thousands, except share and per share amounts) | |||||||||||||||
Statement of Operations Data: | |||||||||||||||
Collaboration revenues | $ | 45,212 | $ | 23,525 | $ | 13,706 | $ | 5,118 | |||||||
Product revenues | 11,481 | 164 | — | — | |||||||||||
Service revenues | 14,761 | — | — | — | |||||||||||
Total revenues | 71,930 | 23,760 | 13,774 | 8,013 | |||||||||||
Total operating expenses | 141,892 | 81,783 | 88,931 | 90,440 | |||||||||||
Operating loss | (69,962 | ) | (58,023 | ) | (75,157 | ) | (82,427 | ) | |||||||
Net loss | (85,616 | ) | (40,908 | ) | (81,874 | ) | (85,280 | ) | |||||||
Net loss attributable to noncontrolling interests | 3,794 | 1,928 | — | — | |||||||||||
Net loss attributable to Intrexon | (81,822 | ) | (38,980 | ) | (81,874 | ) | (85,280 | ) | |||||||
Accretion of dividends on redeemable convertible preferred stock | — | (18,391 | ) | (21,994 | ) | (13,868 | ) | ||||||||
Net loss attributable to common shareholders | (81,822 | ) | (57,371 | ) | (103,868 | ) | (99,148 | ) | |||||||
Net loss attributable to common shareholders per share, basic and diluted | $ | (0.83 | ) | $ | (1.40 | ) | $ | (18.77 | ) | $ | (18.92 | ) | |||
Weighted average shares outstanding, basic and diluted | 99,170,653 | 40,951,952 | 5,533,690 | 5,240,647 | |||||||||||
December 31, | |||||||||||||||
2014(4) | 2013(3) | 2012 | 2011(2) | ||||||||||||
(In thousands) | |||||||||||||||
Balance Sheet Data: | |||||||||||||||
Cash and cash equivalents | $ | 27,466 | $ | 49,509 | $ | 10,403 | $ | 19,628 | |||||||
Short-term and long-term investments | 115,608 | 188,561 | 260 | 258 | |||||||||||
Equity securities | 164,889 | 141,525 | 83,116 | 39,097 | |||||||||||
Total assets | 576,272 | 469,472 | 151,646 | 114,828 | |||||||||||
Deferred revenue, current and non-current | 113,209 | 73,571 | 58,636 | 16,921 | |||||||||||
Other liabilities(1) | 53,774 | 14,558 | 7,904 | 17,485 | |||||||||||
Redeemable convertible preferred stock | — | — | 406,659 | 301,681 | |||||||||||
Total Intrexon shareholders’ equity (deficit) | 384,761 | 366,722 | (321,553 | ) | (221,259 | ) | |||||||||
Noncontrolling interests | 24,528 | 14,621 | — | — | |||||||||||
Total equity (deficit) | 409,289 | 381,343 | (321,553 | ) | (221,259 | ) | |||||||||
(1) | Other liabilities include $8, $40, $91 and $168 related to capital leases as of December 31, 2014, 2013, 2012, and 2011, respectively; $10,369 and $1,653 of long term debt as of December 31, 2014 and 2013, respectively; and $20,485 of deferred consideration as of December 31, 2014. |
(2) | We acquired four businesses in 2011: Agarigen, Inc. on January 26, 2011; Neugenesis Corporation on April 18, 2011; GT Life Sciences, Inc. on October 5, 2011; and Immunologix, Inc. on October 21, 2011. |
(3) | In 2013, we acquired ownership interests in AquaBounty and BioPop which resulted in our gaining control over these entities, resulting in consolidation effective on the acquisition dates. |
(4) | In 2014, we acquired Medistem and Trans Ova and began including the results of their operations effective on the acquisition dates for each. |
46
Item 7. | Management’s Discussion and Analysis of Financial Condition and Results of Operations |
The following discussion and analysis of financial condition and results of operations is provided to enhance the understanding of, and should be read in conjunction with, Part I, Item 1, “Business” and Item 8, “Financial Statements and Supplementary Data.” For information on risks and uncertainties related to our business that may make past performance not indicative of future results, or cause actual results to differ materially from any forward-looking statements, see “Special Note Regarding Forward-Looking Statements,” and Part I, Item 1A, “Risk Factors.”
Overview
We believe we are a leader in the field of synthetic biology, an emerging and rapidly evolving discipline that applies engineering principles to biological systems. Using our suite of proprietary and complementary technologies, we design, build and regulate gene programs, which are DNA sequences that consist of key genetic components. A single gene program or a complex, multi-genic program are fabricated and stored within a DNA vector. Vectors are segments of DNA used as a vehicle to transmit genetic information. DNA vectors can, in turn, be introduced into cells in order to generate a simple or complex cellular system, which are the basic and complex cellular activities that take place within a cell and the interaction of those systems in the greater cellular environment. It is these genetically modified cell systems that can be used to produce proteins, produce small molecules, or serve as cell-based products, which enable the development of new and improved products and manufacturing processes across a variety of end markets, including health, food, energy, environment, and consumer. Our synthetic biology capabilities include the ability to precisely control the amount, location and modification of biological molecules to control the function and output of living cells and optimize for desired results at an industrial scale.
We have devised our business model to bring many different commercial products to market through the formation of exclusive channel collaborations, or ECCs, with collaborators that have expertise within specific industry sectors. Through our ECCs, we provide expertise in the engineering, creation and modification of gene programs and cellular systems, and our collaborators are responsible for providing market and product development expertise, as well as regulatory, sales and marketing capabilities. Generally, our collaborators compensate us through payment of technology access fees, royalties, milestones and reimbursement of certain costs. This business model allows us to leverage our capabilities and capital across a broader landscape of product opportunities and end markets than we would be capable of addressing on our own. Alternatively, where a collaborator wishes to work with us to develop an early-stage program, we may execute a research collaboration pursuant to which we receive reimbursement for our development costs but the exclusive license rights, and related access fee, are deferred until completion of an initial research program.
In certain strategic circumstances, we may enter into a joint venture with an ECC collaborator. In that event, we will enter into an ECC with a joint venture entity and may contribute access to our technology, cash or both into the joint venture which we will jointly control with our ECC collaborator. Pursuant to a joint venture agreement, we may be required to contribute additional capital to the joint venture, and we may be able to receive a higher financial return than we would normally receive from an ECC to the extent that we and our ECC collaborator are successful in developing one or more products. We currently are party to three such joint venture agreements: S & I Ophthalmic, LLC, or S & I Ophthalmic, which is a joint venture with Caraco Pharmaceutical Laboratories, Ltd., or Sun Pharmaceutical Subsidiary, an indirect subsidiary of Sun Pharmaceutical Industries Ltd., or Sun Pharmaceutical, an international specialty pharmaceutical company focused on chronic diseases, OvaXon, LLC, or OvaXon, which is a joint venture with OvaScience, Inc., or OvaScience, a life sciences company focused on the discovery, development and commercialization of new treatments for infertility and Intrexon Energy Partners, LLC, or Intrexon Energy Partners, a joint venture with a select group of external investors, to optimize and scale-up our gas-to-liquid bioconversion platform for the production of certain fuels and lubricants.
On August 13, 2013, we completed our initial public offering, or IPO, whereby we sold 11,499,998 shares of common stock (inclusive of 1,499,999 shares of common stock sold by us pursuant to the full exercise of an overallotment option granted to the underwriters in connection with the offering) at a price of $16.00 per share. The shares began trading on the NYSE on August 8, 2013. The aggregate net proceeds received by us from the IPO were $168.3 million, net of underwriting discounts and commissions and estimated offering expenses payable by us. Upon the closing of the IPO, all outstanding shares of convertible preferred stock, including accrued but unpaid dividends thereon, converted into 79,705,130 shares of common stock. Additionally, in connection with the closing of the IPO, we amended and restated our articles of incorporation pursuant to which we are authorized to issue 200,000,000 shares of common stock and 25,000,000 shares of undesignated preferred stock.
47
Mergers and acquisitions
We may augment our suite of proprietary technologies through mergers or acquisitions of technologies which then become available to new or existing collaborators. Among other things, we seek to ensure that these acquired technologies are complementary to our existing technologies and that these mergers and acquisitions meet our desired return on investment and other economic criteria. In certain cases, such technologies may already be applied in the production of products or services and in these cases, we seek to ensure that the target will maintain a market leadership position for their existing products or services and that there is an opportunity for expansion of that leadership position when complemented by our technology.
On August 8, 2014, we acquired 100 percent of the membership interests of Trans Ova Genetics, L.C., or Trans Ova, a provider of bovine reproductive technologies. Intrexon and Trans Ova intend to build upon Trans Ova’s current platform with new capabilities with a goal of achieving higher levels of delivered value to dairy and beef cattle producers. The consideration paid for all the membership interests in Trans Ova consisted of $63.6 million in cash and the issuance of an aggregate of 1,444,388 shares of the Company’s common stock. In addition, deferred cash valued at $20.1 million is payable to the former members of Trans Ova in three equal installments upon the first, second, and third anniversaries of the closing date. The agreement also provides for the payment to the former members of Trans Ova of a portion of certain cash proceeds in the event there is an award under certain litigation matters pending as of closing to which Trans Ova is a party. We began consolidating Trans Ova’s results of operations and financial position effective August 8, 2014.
On March 6, 2014, we acquired 100 percent of the outstanding common stock and securities convertible into common stock of Medistem, Inc., or Medistem, a pioneer in the development of Endometrial Regenerative Cells, or ERCs, which are universal donor adult-derived stem cells. We intend to employ our synthetic biology platforms to engineer a diverse array of cell-based therapeutic candidates using Medistem’s multipotent ERCs. We began consolidating Medistem’s results of operations and financial position effective March 6, 2014.
On October 1, 2013, we acquired 4,163,265 shares of common stock of Biological & Popular Culture, Inc., or BioPop, representing 51 percent of the outstanding shares of BioPop, resulting in us gaining control over BioPop and consolidating its results of operations and financial position from that point.
On November 16, 2012, we acquired 48,631,444 shares of common stock of AquaBounty Technologies, Inc., or AquaBounty, representing approximately 48 percent of the then outstanding shares of AquaBounty. AquaBounty is a biotechnology company utilizing modern molecular biology to improve aquaculture productivity in a safe and environmentally sustainable manner. We originally accounted for our investment using the equity method. On March 15, 2013, we acquired 18,714,814 additional shares of AquaBounty common stock increasing our aggregate ownership to approximately 54 percent, resulting in us gaining control over AquaBounty and consolidating its results of operations and financial position from that point. On March 20, 2014, we acquired 19,040,366 additional shares of AquaBounty common stock increasing our aggregate ownership to approximately 60 percent.
Financial overview
We have incurred significant losses since our inception. We anticipate that we may continue to incur significant losses for the foreseeable future, and we may never achieve or maintain profitability. We have never generated any royalty revenues from sales of products by our collaborators and may never be profitable.
We expect our future capital requirements will be substantial, particularly as we continue to develop our business and expand our synthetic biology technology platform. We believe that our existing cash and cash equivalents, short-term and long-term investments, and cash expected to be received through our current collaborators and for sales of products and services provided by our consolidated subsidiaries will enable us to fund our operating expenses and capital expenditure requirements for at least the next 12 months.
Sources of revenue
We derive our revenues through the execution of ECCs for the development and commercialization of products enabled by our technologies. Generally, the terms of our ECCs provide that we receive some or all of the following: (i) technology access fees upon signing; (ii) reimbursements of costs incurred by us for our research and development and/or manufacturing efforts related to the specific application provided for in the ECC; (iii) milestone payments upon the achievement of specified development, regulatory and commercial activities; and (iv) royalties on sales of products arising from the collaboration.
48
Our technology access fees and milestone payments may be in the form of cash or securities of the collaborator. Our ECCs contain multiple arrangements and we typically defer revenues from the technology access fees and milestone payments received and recognize such revenues in the future over the anticipated performance period. We are also entitled to sublicensing revenues in those situations where our collaborators choose to license our technologies to other parties.
We also generate revenue through sales of advanced reproductive technologies, including bovine embryos derived from our embryo transfer and in vitro fertilization processes and from genetic preservation and sexed semen processes and applications of such processes to other livestock, as well as sales of livestock used in production. Revenue is recognized when (i) persuasive evidence of an arrangement exists, (ii) services have been rendered or delivery has occurred such that risk of loss has passed to the customer, (iii) the price is fixed or determinable, and (iv) collection from the customer is reasonably assured.
In future periods, our revenues will depend on the number of ECCs to which we are party, the advancement and creation of programs within our ECCs and the extent to which our collaborators bring products enabled by our technologies to market. Our revenues will also depend upon our ability to maintain or improve the volume and pricing of our current product and service offerings and to develop new offerings, including those which may incorporate our technologies. Our revenues will also depend upon the ability of AquaBounty to receive regulatory approval and establish successful commercialization of its AquAdvantage® Salmon products. Our future revenues may also include additional revenue streams we may acquire through mergers and acquisitions. In light of our limited operating history and experience in consummating new ECCs and also the limited experience with our consolidated subsidiaries, there can be no assurance as to the timing, magnitude and predictability of revenues to which we might be entitled.
Cost of products and services revenues
Cost of products and services revenues includes primarily labor and related costs, drugs and supplies used primarily in the embryo transfer and in vitro fertilization processes, livestock and feed used in production, and facility charges, including rent and depreciation. Fluctuations in the price of livestock and feed have not had a significant impact on our operating margins and no derivative financial instruments are used to mitigate the price risk.
Research and development expenses
We recognize research and development expenses as they are incurred. Our research and development expenses consist primarily of:
• | salaries and benefits, including stock-based compensation expense, for personnel in research and development functions; |
• | fees paid to consultants and contract research organizations who perform research on our behalf and under our direction; |
• | costs related to laboratory supplies used in our research and development efforts; |
• | depreciation of leasehold improvements and laboratory equipment; |
• | amortization of patents and related technologies acquired in mergers and acquisitions; and |
• | rent and utility costs for our research and development facilities. |
We have no individually significant research and development projects and our research and development expenses primarily relate to either the costs incurred to expand or otherwise improve our multiple platform technologies or the costs incurred to develop a specific application of our technologies in support of current or prospective collaborators. Research and development expenses typically do not include significant development, including pre-clinical or clinical development, activities since they are the responsibility of our collaborators. Research and development expenses incurred for programs we support pursuant to an ECC agreement are typically reimbursed by the collaborator at cost and all other research and development programs may be terminated or otherwise deferred at our discretion. The amount of our research and development expenses may be impacted by, among other things, the number of ECCs and the number and size of programs we may support on behalf of an ECC.
The table below summarizes our research and development expenses incurred to expand or otherwise improve our multiple platform technologies or the costs incurred to develop a specific application of our technologies in support of current or prospective collaborators for the years ended December 31, 2014, 2013, and 2012. Other research and development expenses
49
for these periods include indirect salaries and overhead expenses that are not allocated to either expanding or improving our multiple platform technologies or specific applications of our technologies in support of current or prospective collaborators.
Year Ended December 31, | |||||||||||
2014 | 2013 | 2012 | |||||||||
(In thousands) | |||||||||||
Expansion or improvement of our platform technologies | $ | 13,858 | $ | 16,327 | $ | 35,075 | |||||
Specific applications of our technologies in support of current and prospective collaborators | 26,643 | 21,688 | 17,078 | ||||||||
Other | 18,482 | 10,128 | 11,881 | ||||||||
Total research and development expenses | $ | 58,983 | $ | 48,143 | $ | 64,034 | |||||
We expect that our research and development expenses will increase as we continue to enter into ECCs and as we expand our offerings across additional market sectors. We believe these increases will likely include increased costs related to the hiring of additional personnel in research and development functions, increased costs paid to consultants and contract research organizations and increased costs related to laboratory supplies. Research and development expenses may also increase as a result of ongoing research and development operations which we might assume through mergers and acquisitions.
Selling, general and administrative expenses
Selling, general and administrative expenses consist primarily of salaries and related costs, including stock-based compensation expense, for employees in executive, operational, finance, sales and marketing, information technology and legal functions. Other significant selling, general and administrative expenses include rent and utilities, advertising, insurance, legal services and expenses associated with obtaining and maintaining our intellectual property.
We expect that our selling, general and administrative expenses will increase as we continue to operate as a public company. We believe that these increases will likely include costs related to the hiring of additional personnel and increased fees for outside consultants, lawyers and accountants, including costs to comply with corporate governance, internal controls and similar requirements applicable to public companies. Selling, general and administrative expenses may also increase as a result of ongoing operations which we might assume through mergers and acquisitions.
Other income (expense), net
We hold equity securities received and/or purchased from certain collaborators. Other than investments accounted for using the equity method discussed below, we elected the fair value option to account for our equity securities held in these collaborators. These equity securities are recorded at fair value at each reporting date. Unrealized appreciation (depreciation) resulting from fair value adjustments are reported as other income (expense) in the consolidated statements of operations. As such, we bear the risk that fluctuations in the securities’ share prices may significantly impact our results of operations.
Interest income consists of interest earned on our cash and cash equivalents and short-term and long-term investments.
Interest expense pertains to deferred consideration payable to the former members of Trans Ova and long term debt.
On March 15, 2013, we recorded a gain on our previously held equity investment in AquaBounty which represented the adjustment to fair value of the pro rata share of our original investment.
Equity in net income (loss) of affiliate
Equity in net income or loss of affiliates is our pro-rata share of our equity method investments’ operating results, adjusted for accretion of basis difference. Through March 15, 2013, we accounted for our investment in AquaBounty using the equity method of accounting since we had the ability to exercise significant influence, but not control, over the operating activities of AquaBounty. On March 15, 2013, we acquired additional ownership interests in AquaBounty which resulted in us gaining control over AquaBounty, thereby requiring consolidation effective on that date. We account for investments in Intrexon Energy Partners, S & I Ophthalmic and OvaXon using the equity method of accounting since we have the ability to exercise significant influence, but not control, over the operating activities of these joint ventures.
50
Results of operations
Comparison of the year ended December 31, 2014 to the year ended December 31, 2013
The following table summarizes our results of operations for the years ended December 31, 2014 and 2013, together with the changes in those items in dollars and as a percentage:
Year Ended December 31, | Dollar Change | Percent Change | ||||||||||||
2014 | 2013 | |||||||||||||
(In thousands) | ||||||||||||||
Revenues: | ||||||||||||||
Collaboration revenues | $ | 45,212 | $ | 23,525 | $ | 21,687 | 92.2 | % | ||||||
Product revenues | 11,481 | 164 | 11,317 | 6,900.6 | % | |||||||||
Service revenues | 14,761 | — | 14,761 | N/A | ||||||||||
Other revenues | 476 | 71 | 405 | 570.4 | % | |||||||||
Total revenues | 71,930 | 23,760 | 48,170 | 202.7 | % | |||||||||
Operating expenses: | ||||||||||||||
Cost of products | 11,035 | 22 | 11,013 | 50,059.1 | % | |||||||||
Cost of services | 8,225 | — | 8,225 | N/A | ||||||||||
Research and development | 58,983 | 48,143 | 10,840 | 22.5 | % | |||||||||
Selling, general and administrative | 63,649 | 33,618 | 30,031 | 89.3 | % | |||||||||
Total operating expenses | 141,892 | 81,783 | 60,109 | 73.5 | % | |||||||||
Operating loss | (69,962 | ) | (58,023 | ) | (11,939 | ) | 20.6 | % | ||||||
Total other income (expense), net | (10,497 | ) | 17,721 | (28,218 | ) | (159.2 | )% | |||||||
Equity in loss of affiliates | (5,260 | ) | (606 | ) | (4,654 | ) | 768.0 | % | ||||||
Loss before income taxes | (85,719 | ) | (40,908 | ) | (44,811 | ) | 109.5 | % | ||||||
Income tax benefit | 103 | — | 103 | N/A | ||||||||||
Net loss | (85,616 | ) | (40,908 | ) | (44,708 | ) | 109.3 | % | ||||||
Net loss attributable to noncontrolling interests | 3,794 | 1,928 | 1,866 | 96.8 | % | |||||||||
Net loss attributable to Intrexon | $ | (81,822 | ) | $ | (38,980 | ) | $ | (42,842 | ) | 109.9 | % | |||
51
Collaboration Revenues
The following table shows the collaboration revenue recognized for upfront and milestone payments received from our collaborators and reimbursements for research and development services provided to our collaborators for the years ended December 31, 2014 and 2013, together with the changes in those items:
Upfront and Milestone Payments | Research and Development Services | Total | |||||||||||||||||||||||||||||||||
Year Ended December 31, | Dollar change | Year Ended December 31, | Dollar change | Year Ended December 31, | Dollar change | ||||||||||||||||||||||||||||||
2014 | 2013 | 2014 | 2013 | 2014 | 2013 | ||||||||||||||||||||||||||||||
(In thousands) | |||||||||||||||||||||||||||||||||||
ZIOPHARM Oncology, Inc. | $ | 2,577 | $ | 2,577 | $ | — | $ | 12,044 | $ | 7,818 | $ | 4,226 | $ | 14,621 | $ | 10,395 | $ | 4,226 | |||||||||||||||||
Synthetic Biologics, Inc. | 651 | 2,187 | (1,536 | ) | 273 | 1,048 | (775 | ) | 924 | 3,235 | (2,311 | ) | |||||||||||||||||||||||
Oragenics, Inc. | 1,045 | 673 | 372 | 598 | 1,517 | (919 | ) | 1,643 | 2,190 | (547 | ) | ||||||||||||||||||||||||
Fibrocell Science, Inc. | 1,794 | 970 | 824 | 4,398 | 3,736 | 662 | 6,192 | 4,706 | 1,486 | ||||||||||||||||||||||||||
Genopaver, LLC | 273 | 204 | 69 | 1,510 | 935 | 575 | 1,783 | 1,139 | 644 | ||||||||||||||||||||||||||
S & I Ophthalmic, LLC | — | — | — | 2,832 | 417 | 2,415 | 2,832 | 417 | 2,415 | ||||||||||||||||||||||||||
OvaXon, LLC | — | — | — | 2,799 | — | 2,799 | 2,799 | — | 2,799 | ||||||||||||||||||||||||||
Intrexon Energy Partners, LLC | 1,875 | — | 1,875 | 4,227 | — | 4,227 | 6,102 | — | 6,102 | ||||||||||||||||||||||||||
Other | 1,410 | 333 | 1,077 | 6,906 | 1,110 | 5,796 | 8,316 | 1,443 | 6,873 | ||||||||||||||||||||||||||
Total | $ | 9,625 | $ | 6,944 | $ | 2,681 | $ | 35,587 | $ | 16,581 | $ | 19,006 | $ | 45,212 | $ | 23,525 | $ | 21,687 | |||||||||||||||||
Collaboration revenues increased $21.7 million due to (i) the recognition of deferred revenue for upfront payments received from collaborations or expansions thereof signed by us in 2014, including Intrexon Energy Partners, a joint venture in which we own 50 percent, (ii) the recognition of research and development services performed by us pursuant to these new collaborations, and (iii) increased research and development services performed by us for collaborations in effect prior to 2014 as a result of the progression of current programs and initiation of new programs with the collaborations, including ZIOPHARM Oncology, Inc., or ZIOPHARM, and our joint ventures with S & I Ophthalmic and OvaXon.
Product and service revenues and cost of products and services
Product revenue includes $10.3 million from the sale of pregnant cows, live calves and livestock used in production. Service revenue totaling $11.7 million relates to the provision of in vitro fertilization and embryo transfer services performed. Cost of products and services were $18.9 million which primarily consist of employee compensation costs, livestock, feed, drug supplies and facility charges related to the production of such products and services.
Research and development expenses
Research and development expenses were $59.0 million for the year ended December 31, 2014 compared to $48.1 million for the year ended December 31, 2013, an increase of $10.9 million, or 22.5 percent. Salaries, benefits and other personnel costs increased $6.5 million due primarily to (i) increases in research and development headcount to support the new collaborations discussed above, (ii) stock-based compensation expenses for stock options granted to research and development employees in March 2014, and (iii) the inclusion of a full year of compensation costs for AquaBounty employees in 2014 compared to approximately nine and one-half months in 2013. Lab supplies and consultants expenses increased $4.0 million as a result of the increased level of research and development services provided to our collaborators. Depreciation and amortization increased $1.1 million as a result of equipment purchased to support the increase in collaborations and the amortization of intangibles arising from the acquisition of Trans Ova. These increases were partially offset by a $1.2 million decrease in third party maintenance fees related to the termination of an exclusive licensing agreement in May 2014.
52
Selling, general and administrative expenses
Selling, general and administrative expenses were $63.6 million for the year ended December 31, 2014 compared to $33.6 million for the year ended December 31, 2013, an increase of $30.0 million or 89.3 percent. Salaries, benefits and other personnel costs increased $20.0 million due to (i) our hiring additional employees needed to operate as a public company, (ii) the inclusion of Trans Ova employees since the date of acquisition, (iii) stock-based compensation expenses for stock options granted to general and administrative employees in March 2014, and (iv) the inclusion of a full year of costs for AquaBounty employees in 2014 compared to nine and one-half months in 2013. Stock-based compensation expenses for options granted to our non-employee directors increased $1.9 million due to changes in our director compensation plan which we adopted in conjunction with our transition to a public company. Legal and professional expenses increased $4.4 million primarily due to costs associated with merger and acquisition and other business development activities, the formation of our joint venture with Intrexon Energy Partners, and legal costs incurred by AquaBounty and Trans Ova.
Total other income (expense), net
Total other income (expense), net, is primarily comprised of unrealized appreciation (depreciation) in fair value of equity securities which was $(10.5) million for the year ended December 31, 2014 compared to $10.4 million for the year ended December 31, 2013. The unrealized appreciation (depreciation) is the result of market change for the equity securities we hold in certain of our collaborators. Total other income (expense), net, for the year ended December 31, 2013 includes a $7.4 million gain on our previously held equity interest in AquaBounty triggered by the requirement to consolidate AquaBounty as of March 15, 2013.
Equity in net loss of affiliates
Equity in net loss of affiliates for the years ended December 31, 2014 and 2013 includes our pro-rata share of the net losses of our investments we account for by the equity method of accounting. The $4.7 million increase in net loss of affiliates is due to (i) a full year of net losses at S & I Ophthalmic in 2014 compared to three months in 2013, (ii) net losses incurred by OvaXon after commencing significant activities in January 2014, and (iii) net losses incurred after the formation of Intrexon Energy Partners in March 2014.
Comparison of the year ended December 31, 2013 and the year ended December 31, 2012
The following table summarizes our results of operations for the years ended December 31, 2013 and 2012, together with the changes in those items in dollars and as a percentage:
Year Ended December 31, | Dollar Change | Percent Change | ||||||||||||
2013 | 2012 | |||||||||||||
(In thousands) | ||||||||||||||
Revenues: | ||||||||||||||
Collaboration revenues | $ | 23,525 | $ | 13,706 | $ | 9,819 | 71.6 | % | ||||||
Product revenues | 164 | — | 164 | N/A | ||||||||||
Other revenues | 71 | 68 | 3 | 4.4 | % | |||||||||
Total revenues | 23,760 | 13,774 | 9,986 | 72.5 | % | |||||||||
Operating expenses: | ||||||||||||||
Cost of products | 22 | — | 22 | N/A | ||||||||||
Research and development | 48,143 | 64,034 | (15,891 | ) | (24.8 | )% | ||||||||
Selling, general and administrative | 33,618 | 24,897 | 8,721 | 35.0 | % | |||||||||
Total operating expenses | 81,783 | 88,931 | (7,170 | ) | (8.0 | )% | ||||||||
Operating loss | (58,023 | ) | (75,157 | ) | 17,134 | (22.8 | )% | |||||||
Total other income (expense), net | 17,721 | (6,443 | ) | 24,164 | (375.0 | )% | ||||||||
Equity in loss of affiliates | (606 | ) | (274 | ) | (332 | ) | 121.2 | % | ||||||
Net loss | (40,908 | ) | (81,874 | ) | 40,966 | (50.0 | )% | |||||||
Net loss attributable to noncontrolling interest | 1,928 | — | 1,928 | N/A | ||||||||||
Net loss attributable to Intrexon | $ | (38,980 | ) | $ | (81,874 | ) | $ | 42,894 | (52.4 | )% | ||||
53
Collaboration revenues
The following table shows the collaboration revenue recognized for upfront and milestone payments received from our collaborators and reimbursements received for research and development services provided to our collaborators for the years ended December 31, 2013 and 2012, together with the changes in those items:
Upfront and Milestone Payments | Research and Development Services | Total | |||||||||||||||||||||||||||||||||
Year Ended December 31, | Dollar change | Year Ended December 31, | Dollar change | Year Ended December 31, | Dollar change | ||||||||||||||||||||||||||||||
2013 | 2012 | 2013 | 2012 | 2013 | 2012 | ||||||||||||||||||||||||||||||
(In thousands) | |||||||||||||||||||||||||||||||||||
ZIOPHARM Oncology, Inc. | $ | 2,577 | $ | 5,068 | $ | (2,491 | ) | $ | 7,818 | $ | 6,333 | $ | 1,485 | $ | 10,395 | $ | 11,401 | $ | (1,006 | ) | |||||||||||||||
Synthetic Biologics, Inc. | 2,187 | 293 | 1,894 | 1,048 | 327 | 721 | 3,235 | 620 | 2,615 | ||||||||||||||||||||||||||
Oragenics, Inc. | 673 | 320 | 353 | 1,517 | 516 | 1,001 | 2,190 | 836 | 1,354 | ||||||||||||||||||||||||||
Fibrocell Science, Inc. | 970 | 158 | 812 | 3,736 | 61 | 3,675 | 4,706 | 219 | 4,487 | ||||||||||||||||||||||||||
Genopaver, LLC | 204 | — | 204 | 935 | — | 935 | 1,139 | — | 1,139 | ||||||||||||||||||||||||||
S & I Ophthalmic, LLC | — | — | — | 417 | — | 417 | 417 | — | 417 | ||||||||||||||||||||||||||
Other | 333 | 12 | 321 | 1,110 | 618 | 492 | 1,443 | 630 | 813 | ||||||||||||||||||||||||||
Total | $ | 6,944 | $ | 5,851 | $ | 1,093 | $ | 16,581 | $ | 7,855 | $ | 8,726 | $ | 23,525 | $ | 13,706 | $ | 9,819 | |||||||||||||||||
Collaboration revenues increased $9.8 million due to (i) the recognition of deferred revenue for upfront payments received from collaborations or expansions thereof signed by us in 2013, including Genopaver, LLC, and Fibrocell Science, Inc., (ii) the recognition of $1.5 million of deferred revenue due to the termination of our first ECC with Synthetic Biologics, Inc. in April 2013, (iii) the recognition of research and development services performed by us pursuant to the new collaborations in 2013, and (iv) increased research and development services performed by us for collaborations in effect prior to 2013 as a result of the progression of current programs and initiation of new programs with the collaborations, including ZIOPHARM and Oragenics, Inc.
Research and development expenses
Research and development expenses were $48.1 million for the year ended December 31, 2013 compared to $64.0 million for the year ended December 31, 2012, a decrease of $15.9 million, or 24.8 percent. Salaries, benefits and other personnel costs decreased $7.9 million due primarily to a decrease in the number of employees in 2013 compared to 2012. Throughout 2012 and the first half of 2013, we eliminated certain positions due to improvements in our production processes as well as our reliance on additional automation. We also transitioned from a primary emphasis on building our parts inventory and other platforms towards applying such platforms towards specific applications for the benefit of our current and prospective collaborators. We also consolidated and centralized certain research and development functions to eliminate redundancies. Expenses related to consultants and third party contract research organizations decreased $0.8 million due to our efforts to reduce the level of research and development performed by third parties and, where practical, perform this research and development internally. Lab supply expenses decreased $4.8 million as a result of supplies used in DNA manufacturing decreasing $3.8 million in 2013 due to our transition from building our parts inventory towards applying our technologies for the benefit of current and prospective collaborators. The remaining decrease in lab supplies is the result of centralizing certain research and development functions.
Selling, general and administrative expenses
Selling, general and administrative expenses increased $8.7 million to $33.6 million for the year ended December 31, 2013 compared to $24.9 million for the year ended December 31, 2012. The $8.7 million increase is primarily the result of an increase in salaries, benefits and other personnel expenses of $4.7 million to $17.9 million in 2013 from $13.2 million in 2012. This increase is primarily the result of our hiring of additional employees as we prepared to become a public company, increased performance bonuses due to, among other items, the successful completion of our IPO and for the cost of AquaBounty employees after we began consolidating AquaBounty on March 15, 2013. Legal and professional expenses increased $2.4 million in 2013 compared to 2012 due to costs associated with becoming a public company and merger and
54
acquisitions activity, including the formation of two joint ventures. The remaining increase in selling, general and administrative expenses in 2013 is the result of additional costs for accounting and auditing fees, directors and officers insurance, exchange listing fees, and other costs that are directly related to being a public company.
Total other income (expense), net
Total other income (expense), net, is primarily comprised of unrealized appreciation (depreciation) in fair value of equity securities which was $10.4 million for the year ended December 31, 2013 compared to $(6.3) million for the year ended December 31, 2012. The unrealized appreciation (depreciation) is the result of market change for the equity securities we hold in certain of our collaborators. Total other income (expense), net, for the year ended December 31, 2013 includes a $7.4 million gain on our previously held equity interest in AquaBounty triggered by the requirement to consolidate AquaBounty as of March 15, 2013.
Equity in net loss of affiliates
Equity in net loss of affiliates for the years ended December 31, 2013 and 2012 includes our pro-rata share of the net losses of our investments we account for by the equity method of accounting. In 2012 and through March 15, 2013, we accounted for our investment in AquaBounty using the equity method of accounting. Commencing upon their formation in 2013, our investments in S & I Ophthalmic and OvaXon, are accounted for using the equity method of accounting.
Liquidity and capital resources
Sources of liquidity
We have incurred losses from operations since our inception in 1998 and as of December 31, 2014, we had an accumulated deficit of $458.2 million. From our inception through December 31, 2014, we have funded our operations principally with the proceeds received from the sale of $509.5 million of our preferred stock and net proceeds from our IPO of $168.3 million. As of December 31, 2014, we had cash and cash equivalents of $27.5 million and short-term and long-term investments of $115.6 million. On January 27, 2015, we closed a public offering of 4,312,500 shares of our common stock for total gross proceeds of approximately $116.4 million, before deducting underwriting discounts, commissions and expenses. Cash in excess of immediate requirements is invested primarily in money market funds, certificates of deposits, U.S. government debt securities and commercial paper in order to maintain liquidity and preserve capital.
We also generate cash receipts from technology access fees, reimbursement of research and development services performed by us and sales of products and services.
Cash flows
The following table sets forth the significant sources and uses of cash for the periods set forth below:
Year Ended December 31, | |||||||||||
2014 | 2013 | 2012 | |||||||||
(In thousands) | |||||||||||
Net cash provided by (used in): | |||||||||||
Operating activities | $ | (19,858 | ) | $ | (53,683 | ) | $ | (61,529 | ) | ||
Investing activities | (26,029 | ) | (223,663 | ) | (23,636 | ) | |||||
Financing activities | 24,004 | 316,451 | 75,940 | ||||||||
Effect of exchange rate changes on cash and cash equivalents | (160 | ) | 1 | — | |||||||
Net increase (decrease) in cash and cash equivalents | $ | (22,043 | ) | $ | 39,106 | $ | (9,225 | ) | |||
Cash flows from operating activities:
Net cash used in operating activities was $19.9 million during the year ended December 31, 2014 and resulted from our $85.6 million net loss, which, after deduction of noncash items of (i) $10.5 million of unrealized depreciation on our equity securities, (ii) $21.8 million of stock-based compensation expense and (iii) $10.4 million of depreciation and amortization expense was $42.9 million. This amount was partially offset by the receipt of a $25.0 million technology access fee from our ECC with Intrexon Energy Partners. Net cash used in operating activities of $53.7 million during the year ended December 31, 2013
55
resulted from our $40.9 million net loss and noncash items which primarily included (i) our unrealized appreciation on equity securities of $10.4 million and (ii) our $7.4 million gain on our previously held equity interest in AquaBounty. Net cash used in operating activities of $61.5 million during the year ended December 31, 2012 resulted from our $81.9 million net loss, unrealized depreciation on equity securities of $6.3 million and the receipt of $12.5 million from two of our collaborators for a prepayment of research and development services.
Cash flows from investing activities:
Net cash used in investing activities was $26.0 million for the year ended December 31, 2014. During 2014, we received net proceeds from the maturity and sale of short-term and long-term investments of $71.6 million. These net proceeds were offset by net cash outflows of $67.6 million for the acquisitions of Trans Ova and Medistem, the purchase of $19.5 million common stock from one of our collaborators and $6.4 million in purchases of property, plant and equipment. Net cash used in investing activities was $223.7 million for the year ended December 31, 2013. During 2013, we invested cash received from our Series F financing and our IPO to purchase $234.0 million of U.S. government debt securities, commercial paper and certificates of deposit and used $28.7 million to purchase shares of common stock of certain of our collaborative partners. These cash outflows were offset by $45.0 million received upon the maturation of short-term investments in 2013. Net cash used in investing activities was $23.6 million for the year ended December 31, 2012. During 2012, we paid $10.0 million to purchase shares of common stock of one of our collaborative partners and we used $7.5 million for property and equipment purchases primarily to expand certain of our lab facilities.
Cash flows from financing activities:
Net cash provided by financing activities was $24.0 million for the year ended December 31, 2014. During 2014, we received $25.0 million of proceeds from the private placement of our common stock which closed on March 27, 2014 and $1.5 million of proceeds from stock option exercises. These cash inflows were offset by $1.8 million of net payments on lines of credit used by Trans Ova. Net cash provided by financing activities was $316.5 million for the year ended December 31, 2013. During 2013, we received $146.9 million of net proceeds from the sale of our Series F Preferred Stock and $168.8 million of net proceeds from our IPO. Net cash provided by financing activities was $75.9 million for the year ended December 31, 2012. During 2012, we received $75.5 million of net proceeds from the sale of our Series E Redeemable Convertible Preferred Stock.
Future capital requirements
We established our current strategy and business model of commercializing our technologies through collaborations in 2010 and we consummated our first ECC in January 2011. We believe that we will continue to consummate ECCs with new companies across our various market sectors, which will result in additional upfront, milestone and cost recovery payments in the near future.
We believe that our existing cash and cash equivalents and short-term and long-term investments and cash expected to be received through our current collaborators will enable us to fund our operating expenses and capital expenditure requirements for at least the next 12 months.
We have based our estimates on assumptions that may prove to be wrong, and we may use our available capital resources sooner than we currently expect. Our future capital requirements will depend on many factors, including:
• | progress in our research and development programs, as well as the magnitude of these programs; |
• | the timing, receipt and amount of upfront, milestone and other payments, if any, from present and future collaborators, if any; |
• | the timing, receipt and amount of sales and royalties, if any, from our potential products; |
• | our ability to maintain or improve the volume and pricing of our current product and service offerings and to develop new offerings, including those which may incorporate new technologies; |
• | the timing, receipt and amount of funding under future government contracts, if any; |
• | our ability to maintain and establish additional collaborative arrangements and/or new business initiatives; |
• | the timing of regulatory approval of AquaBounty products; |
56
• | the resources, time and cost required for the preparation, filing, prosecution, maintenance and enforcement of patent claims; |
• | strategic mergers and acquisitions, including both the upfront acquisition cost as well as the cost to integrate, maintain, and expand the strategic target; |
• | the costs associated with legal activities, including litigation, arising in the course of our business activities and our ability to prevail in any such legal disputes; and |
• | the timing and extent of our obligation to participate in up to $6.4 million in equity financings of ZIOPHARM. |
Until such time, if ever, as we can generate positive operating cash flows, we may finance our cash needs through a combination of equity offerings, debt financings, government or other third-party funding, strategic alliances and licensing arrangements. To the extent that we raise additional capital through the sale of equity or convertible debt securities, the ownership interests of our common shareholders will be diluted, and the terms of these securities may include liquidation or other preferences that adversely affect the rights of our common shareholders. Debt financing, if available, may involve agreements that include covenants limiting or restricting our ability to take specific actions, such as incurring additional debt, making capital expenditures or declaring dividends. If we raise additional funds through government or other third-party funding, marketing and distribution arrangements or other collaborations, strategic alliances or licensing arrangements with third parties, we may have to relinquish valuable rights to our technologies, future revenue streams, research programs or product candidates or to grant licenses on terms that may not be favorable to us.
Contractual obligations and commitments
The following table summarizes our significant contractual obligations and commitments at December 31, 2014 and the effects such obligations are expected to have on our liquidity and cash flows in future periods:
Total | Less than 1 year | 1-3 years | 3-5 years | More than 5 years | |||||||||||||||
(In thousands) | |||||||||||||||||||
Operating leases | $ | 16,094 | $ | 4,177 | $ | 6,857 | $ | 2,630 | $ | 2,430 | |||||||||
Deferred consideration | 20,485 | 7,064 | 13,421 | — | — | ||||||||||||||
Long term debt | 8,443 | 1,675 | 1,257 | 696 | 4,815 | ||||||||||||||
ZIOPHARM equity purchase | 12,600 | 12,600 | — | — | — | ||||||||||||||
Total | $ | 57,622 | $ | 25,516 | $ | 21,535 | $ | 3,326 | $ | 7,245 | |||||||||
In addition to the obligations in the table above, as of December 31, 2014 we also have the following significant contractual obligations described below.
In conjunction with our ECC with ZIOPHARM in 2011, we agreed to purchase up to $50.0 million of ZIOPHARM common stock in conjunction with securities offerings that may be conducted by ZIOPHARM in the future, subject to certain conditions and limitations. The remaining obligation on this purchase commitment was approximately $19.0 million at December 31, 2014. On February 9, 2015, we purchased $12.6 million of ZIOPHARM common stock in a securities offering reducing the remaining obligation on this purchase commitment to approximately $6.4 million. The February 2015 purchase has been included in the table above; however the remaining $6.4 million obligation is not included in the table above due to the fact that the timing of such securities purchases cannot be predicted.
We acquired 100 percent of the outstanding capital stock of Immunologix in October 2011. The transaction included a contingent consideration arrangement which may require us to pay the selling shareholders 50 percent, subject to a maximum of $2.0 million, of revenue generated from Immunologix’s technology applied towards a specific target as defined in the agreement up to a maximum of $2.0 million. This amount is not included in the table above due to the uncertainty of whether, if ever, we will pay this contingent consideration.
In December 2012, we received $2.5 million from Synthetic Biologics as prepayment of research and development services to be provided to Synthetic Biologics. Any remaining balance of this prepayment is refundable to Synthetic Biologics in the event our August 2012 ECC is terminated. Synthetic Biologics may voluntarily terminate the ECC upon 90 days’ written notice to us.
57
The remaining balance of this prepayment is $1.0 million at December 31, 2014 and is not included in the table above due to the uncertainty of the timing of the performance of these services by us and the unlikely termination of the ECC by either party.
We are also party to in-licensed research and development agreements with various academic and commercial institutions where we could be required to make future payments for annual maintenance fees as well as for milestones and royalties we might receive upon commercial sales of products which incorporate their technologies. These agreements are generally subject to termination by us and therefore no amounts are included in the tables above. At December 31, 2014, we had research and development commitments with third parties totaling $4.5 million of which $2.2 million had not yet been incurred.
In January 2009, AquaBounty was awarded a grant to provide funding of a research and development project from the Atlantic Canada Opportunities Agency, a Canadian government agency. The total amount available under the award is USD$2.5 million, which AquaBounty can claim over a five year period. All amounts claimed by AquaBounty must be repaid in the form of a 10 percent royalty on any products commercialized out of this research and development project until fully paid. Because the timing of commercialization is subject to regulatory approval, the timing of repayment is uncertain. As of the acquisition date, AquaBounty had claimed $2.0 million of the available funds and this amount was recorded on our audited consolidated balance sheet at its acquisition date fair value of $1.1 million. The Company accretes the difference of $0.9 million between the face value of amounts drawn and the acquisition date fair value over the expected period of repayment. Since the acquisition date and through December 31, 2014, AquaBounty has made subsequent draws of $0.8 million resulting in total long-term debt of $1.9 million as of December 31, 2014. This amount is not included in the table above due to the uncertainty of the timing of repayment.
In conjunction with the formation of S & I Ophthalmic in September 2013, we committed to making future capital contributions to the joint venture, subject to certain conditions and limitations, in order to comply with the obligations of the joint venture. In cases in which the board of managers of the joint venture determines that additional capital contributions are necessary, we have committed to making additional capital contributions subject to certain limitations. These future capital contributions are not included in the table above due to the uncertainty of the timing and amounts of such contributions.
In conjunction with the formation of OvaXon in December 2013, we may make future capital contributions to the joint venture. In cases in which the board of the joint venture determines that additional capital contributions are necessary, we have the option of making additional capital contributions subject to certain limitations. These future capital contributions are not included in the table above due to the uncertainty of the timing and amounts of such contributions.
In conjunction with the formation of Intrexon Energy Partners in March 2014, we committed to making future capital contributions to the joint venture in the amount of $25.0 million at the request of the board of managers of Intrexon Energy Partners and subject to certain conditions and limitations. As of December 31, 2014, the Company's remaining commitment was $23.6 million. These future capital contributions are not included in the table above due to the uncertainty of the timing and amounts of such contributions.
On August 8, 2014, we acquired all of the membership interests of Trans Ova and agreed to pay a portion of certain cash proceeds in the event there is an award under certain litigation matters pending as of closing to which Trans Ova is a party. These amounts are not included in the table above due to the uncertainty of whether any amounts may be due.
In conjunction with a prior transaction associated with Trans Ova’s subsidiary, ViaGen, in September 2012, the Company may be obligated to make certain future contingent payments to the former equity holders of ViaGen, up to a total of $6.0 million if certain revenue targets, as defined in the share purchase agreement, are met. This amount is not included in the table above due to the uncertainty of when the Company will make any of these future payments, if ever.
Net operating losses
As of December 31, 2014, we had net operating loss carryforwards of approximately $254.5 million for U.S. federal income tax purposes available to offset future taxable income and U.S. federal and state research and development tax credits of $6.8 million, prior to consideration of annual limitations that may be imposed under Section 382 of the Internal Revenue Code of 1986, as amended, or Section 382. These carryforwards begin to expire in 2022. Our direct foreign subsidiary has foreign loss carryforwards of approximately $11.8 million, all of which do not expire.
Our past issuances of stock and mergers and acquisitions have resulted in ownership changes within the meaning of Section 382. As a result, the utilization of portions of our net operating losses may be subject to annual limitations. As of December 31, 2014, approximately $16.4 million of our net operating losses generated prior to 2008 are limited by Section 382 to annual usage limits of approximately $1.5 million. As of December 31, 2014, approximately $19.1 million of net operating
58
losses were inherited via acquisition and are limited based on the value of the target at the time of the transaction. Future changes in stock ownership may also trigger an ownership change and, consequently, a Section 382 limitation.
We do not file a consolidated income tax return with AquaBounty and BioPop. As of December 31, 2014, AquaBounty had loss carryforwards for federal and foreign income tax purposes of approximately $12.5 million and $4.6 million, respectively, available to offset future taxable income and foreign research and development credits of $2.6 million, prior to consideration of annual limitations that may be imposed under Section 382 or analogous foreign provisions. These carryforwards will begin to expire in 2018. As a result of our ownership in AquaBounty passing 50 percent in 2013, an annual Section 382 limitation of approximately $0.9 million per year will apply to losses and credits carried forward by AquaBounty from prior years, which are also subject to Section 382 limitations. As of December 31, 2014, BioPop had an insignificant amount of loss carryforwards for federal income tax purposes available to offset future taxable income.
Off-balance sheet arrangements
We did not have during the periods presented, and we do not currently have, any off-balance sheet arrangements, other than operating leases as mentioned above, as defined under Securities and Exchange Commission, or SEC, rules.
Critical accounting policies and estimates
Our management’s discussion and analysis of our financial condition and results of operations is based on our consolidated financial statements, which we have prepared in accordance with generally accepted accounting principles in the United States, or U.S. GAAP. The preparation of these consolidated financial statements requires us to make estimates and assumptions that affect the reported amounts of assets and liabilities and the disclosure of contingent assets and liabilities at the date of the financial statements, as well as the reported revenues and expenses during the reporting periods. We evaluate these estimates and judgments on an ongoing basis. We base our estimates on historical experience and on various other factors that we believe are reasonable under the circumstances, the results of which form the basis for making judgments about the carrying value of assets and liabilities that are not readily apparent from other sources. Our actual results may differ from these estimates under different assumptions or conditions.
While our significant accounting policies are more fully described in Note 2 to our consolidated financial statements appearing elsewhere in this annual report on Form 10-K, we believe that the following accounting policies are the most critical for fully understanding and evaluating our financial condition and results of operations.
Revenue recognition
Our ECCs typically contain multiple elements, or deliverables, including technology licenses, research and development services, and in certain cases manufacturing services. Our ECCs may provide for various types of payments to us including upfront payments or technology access fees, funding of research and development and/or manufacturing services, milestone payments, profit sharing and royalties on product sales. Effective January 1, 2011, we adopted the provisions of Accounting Standards Update, or ASU, No. 2009-13, Revenue Recognition (Topic 605): Multiple Deliverable Revenue Arrangements, or ASU 2009-13. In accordance with the provisions of ASU 2009-13, we identify the deliverables within the ECCs and evaluate which deliverables represent separate units of accounting. Analyzing the ECCs to identify deliverables requires the use of judgment. A deliverable is considered a separate unit of accounting when the deliverable has value to the collaborator on a standalone basis based on the consideration of the relevant facts and circumstances for each ECC.
Consideration received is allocated at the inception of the ECC to all identified units of accounting based on their relative selling price. When available, the relative selling price for each deliverable is determined using vendor specific objective evidence, or VSOE, of selling price or third-party evidence of selling price, if VSOE does not exist. If neither VSOE nor third-party evidence of selling price exists, we use our best estimate of the selling price for the deliverable. The amount of allocable consideration is limited to amounts that are fixed or determinable. The consideration received is allocated among the separate units of accounting, and the applicable revenue recognition criteria are applied to each of the separate units. We recognize the revenue allocated to each unit of accounting as we deliver the related goods or services. If we determine that we should treat certain deliverables as a single unit of accounting, then we recognize the revenue using either a proportional performance or straight-line method, depending on whether we can reasonably estimate the level of effort required to complete our performance obligations under an arrangement and whether such performance obligations are provided on a best-efforts basis. As we cannot reasonably estimate our performance obligations related to our collaborations, we recognize revenue on a straight-line basis over the period we expect to complete our performance obligations.
59
Typically, we must estimate our period of performance when the ECCs we enter into do not clearly define such information. Our estimated period of performance for our ECCs has been the expected life of our technologies based on the lack of significant experience we have with these types of agreements and the possibility for multiple products and/or treatments for each ECC’s defined field of use.
Our ECCs typically provide for milestone payments upon achievement of specified development, regulatory and commercial activities. We apply the provisions of ASU No. 2010-17, Revenue Recognition — Milestone Method, or the Milestone Method. Under the Milestone Method, we recognize consideration that is contingent upon the achievement of a milestone in its entirety as revenue in the period in which the milestone is achieved only if the milestone is substantive in its entirety. A milestone is considered substantive when it meets all of the following criteria:
• | The consideration is commensurate with either the entity’s performance to achieve the milestone or the enhancement of the value of the delivered item or items as a result of a specific outcome resulting from the entity’s performance to achieve the milestone; |
• | The consideration relates solely to past performance; and |
• | The consideration is reasonable relative to all of the deliverables and payment terms with the arrangement. |
In the event that a milestone is not considered substantive, we recognize the milestone consideration as revenue using the same method applied to the upfront payments.
Research and development services are a deliverable satisfied by us in accordance with the terms of the ECCs and we consider these services to be inseparable from the license to the core technology; thus reimbursements of services provided are recognized as revenue. Further, because reimbursement (i) is contingent upon performance of the services by us, (ii) does not include a profit component and (iii) does not relate to any future deliverable, the revenue is recognized during the period in which the related services are performed and collection of such amounts is reasonably assured. Payments received for manufacturing services will be recognized when the process related to the manufactured materials has been completed. Royalties to be received under our ECCs will be recognized as earned.
We recognized $45.2 million, $23.5 million and $13.7 million of collaboration revenues in the years ended December 31, 2014, 2013 and 2012, respectively. As of December 31, 2014 and 2013, we have $107.2 million and $72.2 million, respectively, of deferred revenue related to our receipt of upfront and milestone payments.
We also generate revenue through sales of advanced reproductive technologies, including bovine embryos derived from our embryo transfer and in vitro fertilization processes and from genetic preservation and sexed semen processes and applications of such processes to other livestock, as well as sales of livestock used in production. Revenue is recognized when (i) persuasive evidence of an arrangement exists, (ii) services have been rendered or delivery has occurred such that risk of loss has passed to the customer, (iii) the price is fixed or determinable, and (iv) collection from the customer is reasonably assured. We recognized $25.9 million of these product and services revenues for the year ended December 31, 2014.
Valuation of investments in equity securities
Fair value is the price that would be received to sell an asset or paid to transfer a liability in an orderly transaction between market participants at the measurement date. As such, fair value is a market-based measurement that should be determined based on assumptions that market participants would use in pricing an asset and liability. We use a three-tier fair value hierarchy to prioritize the inputs used in our fair value measurements. These tiers include: Level 1, defined as observable inputs such as quoted prices in active markets for identical assets, which includes our cash equivalents, short-term investments and certain investments in equity securities of our publicly held collaborators; Level 2, defined as inputs other than quoted prices included in Level 1 that are observable for the asset or liability either directly or indirectly, which includes certain investments in equity securities of our publicly held collaborators; and Level 3, defined as unobservable inputs for the asset or liability used to measure fair value to the extent that observable inputs are not available.
We hold equity securities received and/or purchased from certain collaborators. For each collaborator where we own equity securities, we make an accounting policy election to present them either (i) at the fair value at the end of each reporting period or (ii) using the cost or equity method depending on our level of influence. Other than investments accounted for using the equity method, we have elected to account for certain of these equity securities in publicly held collaborators using the fair value option. These equity securities in publicly held collaborators are recorded at fair value at each reporting date and are subject to market price volatility. Unrealized gains and losses resulting from fair value adjustments are reported as other income
60
(expense) in the consolidated statement of operations. The fair value of these equity securities in publicly held collaborators is subject to fluctuation in the future due to the volatility of the stock market, changes in general economic conditions and changes in the financial conditions of these collaborators. As of December 31, 2014 and 2013, our equity securities received from collaborators are valued at $164.9 million and $141.5 million, respectively.
We record the fair value of securities received on the date the collaboration is consummated or the milestone is achieved upon the closing, quoted price of the collaborator’s security on that date, assuming the transfer of the consideration is considered perfunctory. If the transfer of the consideration is not considered perfunctory, we consider the specific facts and circumstances to determine the appropriate date on which to evaluate fair value. We also evaluate whether any discounts for trading restrictions or other basis for lack of marketability should be applied to the fair value of the securities at inception of the collaboration. In the event we conclude that a discount should be applied, the fair value of the securities is adjusted at inception of the collaboration and re-evaluated at each reporting period thereafter.
We account for investments in which we have the ability to exercise significant influence over, but not control, the operating activities of the investee using the equity method or election of the fair value option. If the fair value option is elected, the investment is accounted for as described for equity securities above. Under the equity method, we include our pro-rata share of the investee’s operating results, adjusted for accretion of basis difference, in our consolidated statement of operations with the corresponding increase or decrease applied to the carrying value of the investment. Through March 15, 2013, we accounted for our investment in AquaBounty using the equity method of accounting. On March 15, 2013, we acquired additional ownership interests in AquaBounty which resulted in us gaining control over AquaBounty, thereby requiring consolidation effective on that date. We account for our investments in S & I Ophthalmic, OvaXon and Intrexon Energy Partners using the equity method of accounting.
Valuation allowance for net deferred tax assets
We record a valuation allowance to offset any net deferred tax assets if, based upon the available evidence, it is more likely than not that we will not recognize some or all of the deferred tax assets. We have had a history of net losses since inception, and as a result, we have established a 100 percent valuation allowance for our net deferred tax assets. If circumstances change and we determine that we will able to realize some or all of these net deferred tax assets in the future, we will record an adjustment to the valuation allowance.
Consolidation of variable interest entities
We identify entities as variable interest entities, or VIEs, either: (i) that do not have sufficient equity investment at risk to permit the entity to finance its activities without additional subordinated financial support, or (ii) in which the equity investors lack an essential characteristic of a controlling financial interest. We perform an initial and on-going evaluation of the entities with which we have variable interests to determine if any of these entities are VIEs. If an entity is identified as a VIE, we perform an assessment to determine whether we have both: (i) the power to direct activities of the VIE that most significantly impact the VIE’s economic performance, and (ii) have the obligation to absorb losses from or the right to receive benefits of the VIE that could potentially be significant to the VIE. If we have both these criterion, we are identified as the primary beneficiary of the VIE. As of December 31, 2014, four of our collaborators, Genopaver, LLC, Intrexon Energy Partners, OvaXon and Persea Bio, LLC, were identified as VIEs. We are not the primary beneficiary of these entities as we do not have the power to direct the activities that most significantly impact the economic performance of the VIEs. As of December 31, 2013, one of our collaborators, Genopaver, LLC, was identified as a VIE. We were not the primary beneficiary of this entity as we did not have the power to direct the activities that most significantly impact the economic performance of the VIE.
Valuation of goodwill and long-lived assets
We evaluate long-lived assets, which include property and equipment and intangible assets, for impairment whenever events or changes in circumstances indicate that the carrying amount of the assets may not be recoverable. Conditions that would necessitate an impairment assessment include a significant decline in the observable market value of an asset, a significant change in the extent or manner an asset is used, or a significant adverse change that would indicate that the carrying amount of an asset or group of assets is not recoverable.
Goodwill and indefinite-lived intangible assets, which include in-process research and development, are tested for impairment annually, or more frequently if events or circumstances between annual tests indicate that the assets may be impaired. Impairment losses on goodwill and indefinite-lived intangible assets are recognized based solely on a comparison of their fair value to carrying value, without consideration of any recoverability test. We monitor the progression of our in-process research and development, as the likelihood of success is contingent upon regulatory approval.
61
Stock-based compensation
We record the fair value of stock options issued to employees and non-employees as of the grant date as stock-based compensation expense. Stock-based compensation expense for employees and non-employees is recognized over the requisite service period, which is typically the vesting period. We recorded stock-based compensation expense of $21.8 million, $2.9 million and $1.5 million for the years ended December 31, 2014, 2013 and 2012, respectively. We utilize the Black-Scholes option-pricing model to estimate the grant-date fair value of all stock options. The Black-Scholes option-pricing model requires the use of weighted average assumptions for estimated expected volatility, estimated expected term of stock options, risk-free rate, estimated expected dividend yield, and the fair value of the underlying common stock at the date of grant. Because we do not have sufficient history to estimate the expected volatility of our common stock price, expected volatility is based on the average volatility of peer public entities that are similar in size and industry. We estimate the expected term of all stock options based on previous history of exercises. The risk-free rate is based on the U.S. Treasury yield curve in effect at the time of grant for the expected term of the stock option. The expected dividend yield is 0 percent as we have not declared any common stock dividends to date and do not expect to declare common stock dividends in the near future. Prior to our IPO, the fair value of the underlying common stock at the date of grant was determined based on a valuation of our common stock. Subsequent to our IPO, the fair value of the underlying common stock is determined based on the quoted market price of our common stock on the NYSE. We estimate forfeitures based on our historical analysis of actual stock option forfeitures. Actual forfeitures are recorded when incurred and estimated forfeitures are reviewed and adjusted at least annually. The assumptions used in the Black-Scholes option-pricing model for the years ended December 31, 2014, 2013 and 2012 are set forth below:
Year Ended December 31, | |||||
2014 | 2013 | 2012 | |||
Valuation Assumptions | |||||
Expected dividend yield | 0% | 0% | 0% | ||
Expected volatility | 62%—64% | 73%—75% | 71%—76% | ||
Expected term (years) | 6.25 | 6.25 | 6.00 | ||
Risk-free interest rate | 1.82%—2.14% | 0.96%—1.86% | 0.80%—1.10% | ||
We had 8,323,544 options outstanding as of December 31, 2014 of which 1,448,434 were exercisable. We had 2,840,648 options outstanding as of December 31, 2013 of which 1,227,563 were exercisable. Total unrecognized stock-based compensation expense related to non-vested awards at December 31, 2014 and December 31, 2013 was $62.3 million and $9.6 million, respectively, and is expected to be recognized over a weighted-average period of approximately three years. The weighted average grant date fair value for options granted in 2014 and 2013 was $16.40 and $12.91, respectively.
Inventory
The Company has livestock inventory which primarily includes adult female cows which are used in certain production processes and are recorded at acquisition cost using the first-in, first-out method or at market, whichever is lower. Work-in-process inventory includes allocations of production costs and facility costs on gestating livestock and are recorded at the lower of cost or market. Significant declines in the price of cows could result in unfavorable adjustments to inventory balances. As of December 31, 2014, total inventory is $25.8 million.
Recent accounting pronouncements
See Note 2 to our consolidated financial statements included in Part II, Item 8, “Financial Statements and Supplementary Data,” of this Annual Report on Form 10-K for a description of recent accounting pronouncements applicable to our business, which is incorporated herein by reference.
Emerging growth company status
Based on the market value of our common stock held by non-affiliates as of June 30, 2014, we ceased to be an emerging growth company as of December 31, 2014. Accordingly, we are no longer be able to take advantage of exemptions from various reporting requirements, including not being required to comply with the auditor attestation requirements of Section 404 of the Sarbanes-Oxley Act of 2002, or the Sarbanes-Oxley Act, reduced disclosure obligations regarding executive compensation, our periodic reports and proxy statements and exemptions from the requirements of holding a nonbinding advisory vote on executive compensation and shareholder approval of any golden parachute payments not previously approved.
62
Item 7A. | Quantitative and Qualitative Disclosures About Market Risk |
The following sections provide quantitative information on our exposure to interest rate risk, stock price risk, and foreign currency exchange risk. We make use of sensitivity analyses which are inherently limited in estimating actual losses in fair value that can occur from changes in market conditions.
Interest rate risk
We had cash, cash equivalents and short-term and long-term investments of $143.1 million and $238.1 million at December 31, 2014 and 2013, respectively. Our cash and cash equivalents and short-term and long-term investments consist of cash, money market funds, U.S. government debt securities, commercial paper and certificates of deposit. The primary objective of our investment activities is to preserve principal, maintain liquidity and maximize income without significantly increasing risk. Our investments consist of U.S. government debt securities, commercial paper and certificates of deposit which may be subject to market risk due to changes in prevailing interest rates that may cause the fair values of our investments to fluctuate. We believe that a hypothetical 100 basis point increase in interest rates would not materially affect the fair value of our interest-sensitive financial instruments and any such losses would only be realized if we sold the investments prior to maturity.
Investments in publicly traded companies
We have common stock investments in several publicly traded companies that are subject to market price volatility. We have adopted the fair value method of accounting for these investments, except for our investment in AquaBounty as further described below, and therefore, have recorded them at fair value at the end of each reporting period with the unrealized gain or loss recorded as a separate component of other income (expense), net for the period. As of December 31, 2014 and December 31, 2013 the original aggregate cost basis of these investments was $173.9 million and $140.0 million, respectively, and the market value was $164.9 million and $141.5 million, respectively. The fair value of these investments is subject to fluctuation in the future due to the volatility of the stock market, changes in general economic conditions and changes in the financial conditions of these companies. The fair value of these investments as of December 31, 2014 would be approximately $181.4 million and $131.9 million, respectively, based on a hypothetical 10 percent increase or 20 percent decrease in the value of the investments. The fair value of these investments as of December 31, 2013 would be approximately $155.7 million and $113.2 million, respectively, based on a hypothetical 10 percent increase or 20 percent decrease in the value of the investments.
In November 2012, we acquired 47.56 percent of the outstanding common stock of AquaBounty and we accounted for this investment under the equity method of accounting for the period from acquisition date through March 15, 2013. On March 15, 2013, we acquired 18,714,814 additional shares of AquaBounty common stock for $4.9 million, thereby increasing our aggregate ownership to 53.82 percent upon closing. Accordingly, effective upon closing of the acquisition of the additional shares, we consolidated the assets and operating results of AquaBounty in our consolidated financial statements. On March 20, 2014, we acquired 19,040,366 additional shares of AquaBounty common stock for $10.0 million, thereby increasing our aggregate ownership to 59.85 percent upon closing. The common stock of AquaBounty is traded on the London Stock Exchange and the fair value of our investment in AquaBounty at December 31, 2014 and December 31, 2013 was $22.8 million and $55.0 million, respectively. The fair value of our investment in AquaBounty as of December 31, 2014 would be approximately $25.1 million and $18.2 million, respectively, based on a hypothetical 10 percent increase or 20 percent decrease in the share price of AquaBounty. The fair value of our investment in AquaBounty as of December 31, 2013 would be approximately $60.5 million and $44.0 million, respectively, based on a hypothetical 10 percent increase or 20 percent decrease in the share price of AquaBounty.
Foreign currency exchange risk
Because the common stock of AquaBounty is traded on the London Stock Exchange, the fair value of our holdings is subject to fluctuations in foreign currency rates. In addition, some of our subsidiaries' assets and current expenses are denominated in foreign currencies. We do not hedge our foreign currency exchange rate risk. The effect of a hypothetical 10 percent change in foreign currency exchange rates applicable to our business would not have a material impact on our consolidated financial statements.
Item 8. | Financial Statements and Supplementary Data |
The information required by this Item 8 is contained on pages F-1 through F-43 of this annual report on Form 10-K and is incorporated herein by reference.
63
Item 9. | Changes in and Disagreements with Accountants on Accounting and Financial Disclosure |
None.
Item 9A. | Controls and Procedures |
Evaluation of Disclosure Controls and Procedures
Management, with the participation of our chief executive officer and our chief financial officer, evaluated the effectiveness of our disclosure controls and procedures as of December 31, 2014. The term “disclosure controls and procedures,” as defined in Rules 13a-15(e) and 15d-15(e) under the Securities Exchange Act of 1934, as amended (the "Exchange Act"), means controls and other procedures of a company that are designed to ensure that information required to be disclosed by a company in the reports that it files or submits under the Exchange Act is recorded, processed, summarized and reported, within the time periods specified in the SEC’s rules and forms. Disclosure controls and procedures include, without limitation, controls and procedures designed to ensure that information required to be disclosed by a company in the reports that it files or submits under the Exchange Act is accumulated and communicated to the company’s management, including its principal executive and principal financial officers, as appropriate to allow timely decisions regarding required disclosure. Management recognizes that any controls and procedures, no matter how well designed and operated, can provide only reasonable assurance of achieving their objectives and management necessarily applies its judgment in evaluating the cost-benefit relationship of possible controls and procedures. Based on their evaluation of our disclosure controls and procedures as of December 31, 2014, our chief executive officer and chief financial officer have concluded that, as of such date, our disclosure controls and procedures were effective at the reasonable assurance level.
Management’s Annual Report on Internal Control Over Financial Reporting
Our management is responsible for establishing and maintaining adequate internal control over financial reporting as such term is defined in Rule 13a-15(f) and Rule 15d-15(f) of the Exchange Act. Our internal control over financial reporting is a process designed to provide reasonable assurance regarding the reliability of financial reporting and the preparation of financial statements for external purposes in accordance with generally accepted accounting principles. Our internal control over financial reporting includes those policies and procedures that:
(i) pertain to the maintenance of records that, in reasonable detail, accurately and fairly reflect the transactions and dispositions of our assets;
(ii) provide reasonable assurance that transactions are recorded as necessary to permit preparation of consolidated financial statements in accordance with generally accepted accounting principles, and that our receipts and expenditures are being made only in accordance with authorizations of our management and directors; and
(iii) provide reasonable assurance regarding prevention or timely detection of unauthorized acquisition, use or disposition of our assets that could have a material effect on the consolidated financial statements.
Because of its inherent limitations, internal control over financial reporting may not prevent or detect misstatements. Also, projections of any evaluation of effectiveness to future periods are subject to the risk that controls may become inadequate because of changes in conditions or that the degree of compliance with the policies or procedures may deteriorate.
Our management assessed the effectiveness of our internal control over financial reporting as of December 31, 2014. In making this assessment, our management used the criteria set forth by the Committee of Sponsoring Organizations of the Treadway Commission (COSO) in Internal Control - Integrated Framework (2013). Based on this evaluation, management concluded that our internal control over financial reporting was effective as of December 31, 2014.
Management’s assessment of the Company's internal control over financial reporting as of December 31, 2014 excludes Trans Ova Genetics, L.C. (Trans Ova), which was acquired by the Company in a purchase business combination on August 8, 2014. Trans Ova had total assets of $63.3 million and total revenues of $26.4 million which are included in our consolidated financial statements as of and for the year ended December 31, 2014.
PricewaterhouseCoopers LLP, an independent registered public accounting firm, has audited the effectiveness of our internal control over financial reporting as of December 31, 2014, as stated in their report, which is included in Part II Item 8 of this Form 10-K.
64
Changes in Internal Control Over Financial Reporting
There have been no changes in our internal control over financial reporting during the quarter ended December 31, 2014 that have materially affected, or are reasonably likely to materially affect, our internal control over financial reporting.
Item 9B. | Other Information |
On February 23, 2015, we accepted all offers to tender the outstanding equity interests of our majority-owned subsidiary, Exemplar. In connection with the acquisition of all of the remaining equity interests in Exemplar from Exemplar members, we issued 307,074 shares of common stock (the “Exemplar Shares”) to certain members of Exemplar.
The Exemplar Shares were offered and sold in a private placement without registration under the Securities Act of 1933, as amended (the “Securities Act”), or the securities laws of certain states, in reliance on the exemptions provided by Rule 506 of Regulation D (“Regulation D”) promulgated under the Securities Act relating to sales by an issuer not involving any public offering and in reliance on similar exemptions under applicable state laws. Each member of Exemplar receiving Exemplar Shares in the transaction represented to us that it is an “accredited investor” as such term is defined under the Securities Act and that such person acquired the securities for its own account and not with a view to resale or distribution in violation of the Securities Act. The Exemplar Shares were not offered or sold by any form of general solicitation or general advertising (as such terms are used in Rule 502 under Regulation D).
On February 27, 2015, we entered into a definitive agreement (the “Agreement”) and related plan of arrangement (the “Arrangement”) to acquire 100 percent of Okanagan Specialty Fruits Inc. for cash and approximately $31.0 million in common stock (the “OSF Shares”), calculated as of the closing of the transaction using a volume-weighted average of the closing price of our common stock for the 30 days preceding closing.
The OSF Shares to be issued in connection with the Arrangement are expected to be issued in reliance upon an exemption from registration under federal securities laws provided by Section 3(a)(10) of the Securities Act for the issuance and exchange of securities approved after a public hearing on the fairness of the terms and conditions of the exchange by a court of competent jurisdiction at which all persons to whom the securities will be issued have the right to appear. The Arrangement will be subject to approval by the Supreme Court of British Columbia (the “Court”). We anticipate that, if the Arrangement becomes effective under the terms and conditions set forth in the Agreement (including receipt of the final order from the Court) the OSF Shares to be issued pursuant to the Agreement will be exempt from the registration requirements of the Securities Act pursuant to Section 3(a)(10) thereof.
PART III
Item 10. | Directors, Executive Officers and Corporate Governance |
The information required by this item is incorporated by reference to our Proxy Statement for the 2015 Annual Meeting of Shareholders to be filed with the SEC within 120 days of the fiscal year ended December 31, 2014. The information regarding executive officers is included in this report following Item 4 under the caption “Item 4A. Executive Officers of the Registrant” and incorporated herein by reference.
Our board of directors has adopted a Code of Business Conduct and Ethics applicable to all officers, directors and employees, which is available on our website (investors.dna.com) under “Corporate Governance.” We will provide a copy of this document, without charge, upon request, by writing to us at Intrexon Corporation, 20374 Seneca Meadows Parkway, Germantown, Maryland 20876, Attention: Investor Relations. We intend to satisfy the disclosure requirement under Item 5.05 of Form 8-K regarding amendment to, or waiver from, a provision of our Code of Business Conduct and Ethics by posting such information on our website at the address and location specified above.
Item 11. | Executive Compensation |
The information required by this item is incorporated by reference to our Proxy Statement for the 2015 Annual Meeting of Shareholders to be filed with the SEC within 120 days of the fiscal year ended December 31, 2014.
Item 12. | Security Ownership of Certain Beneficial Owners and Management and Related Stockholder Matters |
The information required by this item is incorporated by reference to our Proxy Statement for the 2015 Annual Meeting of Shareholders to be filed with the SEC within 120 days of the fiscal year ended December 31, 2014.
65
Item 13. | Certain Relationships and Related Transactions, and Director Independence |
The information required by this item is incorporated by reference to our Proxy Statement for the 2015 Annual Meeting of Shareholders to be filed with the SEC within 120 days of the fiscal year ended December 31, 2014.
Item 14. | Principal Accounting Fees and Services |
The information required by this item is incorporated by reference to our Proxy Statement for the 2015 Annual Meeting of Shareholders to be filed with the SEC within 120 days of the fiscal year ended December 31, 2014.
PART IV
Item 15. | Exhibits, Financial Statement Schedules |
(a) | The following consolidated financial statements of Intrexon Corporation and its subsidiaries, and the independent registered public accounting firm reports thereon, are included in Part II, Item 8 of this Annual Report on Form 10-K: |
1. | Financial Statements. |
Consolidated Financial Statements of Intrexon Corporation and Subsidiaries
Consolidated Balance Sheets as of December 31, 2014 and 2013
Consolidated Statements of Operations for the Years Ended December 31, 2014, 2013, and 2012
Consolidated Statements of Comprehensive Loss for the Years Ended December 31, 2014, 2013, and 2012
Consolidated Statements of Shareholders’ and Total Equity (Deficit) for the Years Ended December 31, 2014, 2013 and 2012
Consolidated Statements of Cash Flows for the Years Ended December 31, 2014, 2013, and 2012
Notes to Consolidated Financial Statements for the Years Ended December 31, 2014, 2013, and 2012
Financial Statements of ZIOPHARM Oncology, Inc.
Report of McGladrey LLP, Independent Registered Public Accounting Firm
Balance Sheets as of December 31, 2014 and 2013
Statements of Operations for the Years Ended December 31, 2014, 2013, and 2012
Statements of Changes in Stockholders’ Equity for the Years Ended December 31, 2014, 2013, and 2012
Statements of Cash Flows for the Years Ended December 31, 2014, 2013, and 2012
Notes to Financial Statements for the Years Ended December 31, 2014, 2013, and 2012
2. | Financial Statement Schedules. |
All financial statement schedules have been omitted because either the required information is not applicable or the information required is included in the consolidated financial statements and notes thereto included in this Form 10-K.
3. | Exhibits. |
The exhibits are listed in the Exhibit Index to this Annual Report.
(b) | Exhibits |
The response to this portion of Item 15 is submitted as a separate section to this Annual Report. See Exhibit Index.
66
(c) | Financial Statement Schedules |
The response to Item 15(a)2 is incorporated herein by reference.
67
SIGNATURES
Pursuant to the requirements of Section 13 or 15(d) of the Securities Exchange Act of 1934, as amended, the Registrant has duly caused this report to be signed on its behalf by the undersigned, thereunto duly authorized.
Dated: March 2, 2015
INTREXON CORPORATION | ||
By: | /S/ RANDAL J. KIRK | |
Randal J. Kirk Chief Executive Officer and Chairman of the Board of Directors | ||
Pursuant to the requirements of the Securities Exchange Act of 1934, as amended, this report has been signed below by the following persons on behalf of the Registrant and in the capacities and on the dates indicated.
Signature | Title | Date | ||
/S/ RANDAL J. KIRK | Chief Executive Officer and Chairman of the Board of Directors (Principal Executive Officer) | 3/2/2015 | ||
Randal J. Kirk | ||||
/S/ RICK L. STERLING | Chief Financial Officer (Principal Accounting and Financial Officer) | 3/2/2015 | ||
Rick L. Sterling | ||||
/S/ CESAR L. ALVAREZ | Director | 3/2/2015 | ||
Cesar L. Alvarez | ||||
/S/ STEVEN FRANK | Director | 3/2/2015 | ||
Steven Frank | ||||
/S/ LARRY D. HORNER | Director | 3/2/2015 | ||
Larry D. Horner | ||||
/S/ JEFFREY B. KINDLER | Director | 3/2/2015 | ||
Jeffrey B. Kindler | ||||
/S/ DEAN J. MITCHELL | Director | 3/2/2015 | ||
Dean J. Mitchell | ||||
/S/ ROBERT B. SHAPIRO | Director | 3/2/2015 | ||
Robert B. Shapiro | ||||
/S/ JAMES S. TURLEY | Director | 3/2/2015 | ||
James S. Turley | ||||
68
Index to the Financial Statements
Page(s) | |
F-1
Intrexon Corporation and Subsidiaries
Consolidated Financial Statements
December 31, 2014, 2013 and 2012
F-2
Report of Independent Registered Public Accounting Firm
To the Board of Directors and Shareholders of Intrexon Corporation
In our opinion, the consolidated financial statements of Intrexon Corporation listed in the accompanying index present fairly, in all material respects, the financial position of Intrexon Corporation and its subsidiaries at December 31, 2014 and 2013, and the results of their operations and their cash flows for each of the three years in the period ended December 31, 2014 in conformity with accounting principles generally accepted in the United States of America. Also in our opinion, the Company maintained, in all material respects, effective internal control over financial reporting as of December 31, 2014, based on criteria established in Internal Control - Integrated Framework (2013) issued by the Committee of Sponsoring Organizations of the Treadway Commission (COSO). The Company's management is responsible for these financial statements, for maintaining effective internal control over financial reporting and for its assessment of the effectiveness of internal control over financial reporting, included in Management's Annual Report on Internal Control Over Financial Reporting appearing under Item 9A. Our responsibility is to express opinions on these financial statements and on the Company's internal control over financial reporting based on our audits (which was an integrated audit in 2014). We conducted our audits in accordance with the standards of the Public Company Accounting Oversight Board (United States). Those standards require that we plan and perform the audits to obtain reasonable assurance about whether the financial statements are free of material misstatement and whether effective internal control over financial reporting was maintained in all material respects. Our audits of the financial statements included examining, on a test basis, evidence supporting the amounts and disclosures in the financial statements, assessing the accounting principles used and significant estimates made by management, and evaluating the overall financial statement presentation. Our audit of internal control over financial reporting included obtaining an understanding of internal control over financial reporting, assessing the risk that a material weakness exists, and testing and evaluating the design and operating effectiveness of internal control based on the assessed risk. Our audits also included performing such other procedures as we considered necessary in the circumstances. We believe that our audits provide a reasonable basis for our opinions.
A company’s internal control over financial reporting is a process designed to provide reasonable assurance regarding the reliability of financial reporting and the preparation of financial statements for external purposes in accordance with generally accepted accounting principles. A company’s internal control over financial reporting includes those policies and procedures that (i) pertain to the maintenance of records that, in reasonable detail, accurately and fairly reflect the transactions and dispositions of the assets of the company; (ii) provide reasonable assurance that transactions are recorded as necessary to permit preparation of financial statements in accordance with generally accepted accounting principles, and that receipts and expenditures of the company are being made only in accordance with authorizations of management and directors of the company; and (iii) provide reasonable assurance regarding prevention or timely detection of unauthorized acquisition, use, or disposition of the company’s assets that could have a material effect on the financial statements.
Because of its inherent limitations, internal control over financial reporting may not prevent or detect misstatements. Also, projections of any evaluation of effectiveness to future periods are subject to the risk that controls may become inadequate because of changes in conditions, or that the degree of compliance with the policies or procedures may deteriorate.
As described in Management's Annual Report on Internal Control Over Financial Reporting, management has excluded Trans Ova Genetics, L.C. (Trans Ova) from its assessment of internal control over financial reporting as of December 31, 2014 because it was acquired by the Company in a purchase business combination during 2014. We have also excluded Trans Ova from our audit of internal control over financial reporting. Trans Ova is a wholly-owned subsidiary whose total assets and total revenues represent $63.3 million and $26.4 million, respectively, of the related consolidated financial statement amounts as of and for the year ended December 31, 2014.
/s/ PricewaterhouseCoopers LLP
Charlotte, North Carolina
March 2, 2015
F-3
Intrexon Corporation and Subsidiaries
Consolidated Balance Sheets
December 31, 2014 and 2013
(Amounts in thousands, except share and per share data) | 2014 | 2013 | |||||
Assets | |||||||
Current assets | |||||||
Cash and cash equivalents | $ | 27,466 | $ | 49,509 | |||
Short-term investments | 88,495 | 127,980 | |||||
Receivables | |||||||
Trade, net | 14,582 | 790 | |||||
Related parties | 12,622 | 5,285 | |||||
Note | 1,501 | — | |||||
Other | 559 | 1,282 | |||||
Inventory | 25,789 | — | |||||
Prepaid expenses and other | 3,759 | 2,710 | |||||
Total current assets | 174,773 | 187,556 | |||||
Long-term investments | 27,113 | 60,581 | |||||
Equity securities | 164,889 | 141,525 | |||||
Property, plant and equipment, net | 38,000 | 16,629 | |||||
Intangible assets, net | 65,947 | 41,956 | |||||
Goodwill | 101,059 | 13,823 | |||||
Investments in affiliates | 3,220 | 6,284 | |||||
Other assets | 1,271 | 1,118 | |||||
Total assets | $ | 576,272 | $ | 469,472 | |||
Liabilities and Total Equity | |||||||
Current liabilities | |||||||
Accounts payable | $ | 6,267 | $ | 1,057 | |||
Accrued compensation and benefits | 7,736 | 5,157 | |||||
Other accrued liabilities | 5,731 | 4,217 | |||||
Deferred revenue | 16,522 | 7,793 | |||||
Lines of credit | 2,273 | — | |||||
Current portion of long term debt | 1,675 | — | |||||
Current portion of deferred consideration | 7,064 | — | |||||
Related party payables | 214 | 1,605 | |||||
Total current liabilities | 47,482 | 19,829 | |||||
Long term debt, net of current portion | 8,694 | 1,653 | |||||
Deferred consideration, net of current portion | 13,421 | — | |||||
Deferred revenue, net of current portion | 96,687 | 65,778 | |||||
Other long term liabilities | 699 | 869 | |||||
Total liabilities | 166,983 | 88,129 | |||||
Commitments and contingencies (Note 16) | |||||||
Total equity | |||||||
Common stock, no par value, 200,000,000 shares authorized as of December 31, 2014 and 2013; and 100,557,932 shares and 97,053,712 shares issued and outstanding as of December 31, 2014 and 2013, respectively | — | — | |||||
Additional paid-in capital | 843,001 | 743,084 | |||||
Accumulated deficit | (458,236 | ) | (376,414 | ) | |||
Accumulated other comprehensive income (loss) | (4 | ) | 52 | ||||
Total Intrexon shareholders’ equity | 384,761 | 366,722 | |||||
Noncontrolling interests | 24,528 | 14,621 | |||||
Total equity | 409,289 | 381,343 | |||||
Total liabilities and total equity | $ | 576,272 | $ | 469,472 | |||
The accompanying notes are an integral part of these consolidated financial statements.
F-4
Intrexon Corporation and Subsidiaries
Consolidated Statements of Operations
Years Ended December 31, 2014, 2013 and 2012
(Amounts in thousands, except share and per share data) | 2014 | 2013 | 2012 | ||||||||
Revenues | |||||||||||
Collaboration revenues | $ | 45,212 | $ | 23,525 | $ | 13,706 | |||||
Product revenues | 11,481 | 164 | — | ||||||||
Service revenues | 14,761 | — | — | ||||||||
Other revenues | 476 | 71 | 68 | ||||||||
Total revenues | 71,930 | 23,760 | 13,774 | ||||||||
Operating Expenses | |||||||||||
Cost of products | 11,035 | 22 | — | ||||||||
Cost of services | 8,225 | — | — | ||||||||
Research and development | 58,983 | 48,143 | 64,034 | ||||||||
Selling, general and administrative | 63,649 | 33,618 | 24,897 | ||||||||
Total operating expenses | 141,892 | 81,783 | 88,931 | ||||||||
Operating loss | (69,962 | ) | (58,023 | ) | (75,157 | ) | |||||
Other Income (Expense) | |||||||||||
Unrealized appreciation (depreciation) in fair value of equity securities | (10,469 | ) | 10,443 | (6,290 | ) | ||||||
Gain in previously held equity investment | — | 7,415 | — | ||||||||
Interest expense | (666 | ) | (141 | ) | (57 | ) | |||||
Interest income | 806 | 166 | 5 | ||||||||
Other expense, net | (168 | ) | (162 | ) | (101 | ) | |||||
Total other income (expense) | (10,497 | ) | 17,721 | (6,443 | ) | ||||||
Equity in net loss of affiliates | (5,260 | ) | (606 | ) | (274 | ) | |||||
Loss before income taxes | (85,719 | ) | (40,908 | ) | (81,874 | ) | |||||
Income tax benefit | 103 | — | — | ||||||||
Net loss | $ | (85,616 | ) | $ | (40,908 | ) | $ | (81,874 | ) | ||
Net loss attributable to the noncontrolling interests | 3,794 | 1,928 | — | ||||||||
Net loss attributable to Intrexon | $ | (81,822 | ) | $ | (38,980 | ) | $ | (81,874 | ) | ||
Accretion of dividends on redeemable convertible preferred stock | — | (18,391 | ) | (21,994 | ) | ||||||
Net loss attributable to common shareholders | $ | (81,822 | ) | $ | (57,371 | ) | $ | (103,868 | ) | ||
Net loss attributable to common shareholders per share, basic and diluted | $ | (0.83 | ) | $ | (1.40 | ) | $ | (18.77 | ) | ||
Weighted average shares outstanding, basic and diluted | 99,170,653 | 40,951,952 | 5,533,690 | ||||||||
The accompanying notes are an integral part of these consolidated financial statements.
F-5
Intrexon Corporation and Subsidiaries
Consolidated Statements of Comprehensive Loss
Years Ended December 31, 2014, 2013 and 2012
(Amounts in thousands) | 2014 | 2013 | 2012 | ||||||||
Net loss | $ | (85,616 | ) | $ | (40,908 | ) | $ | (81,874 | ) | ||
Other comprehensive income (loss): | |||||||||||
Unrealized gain on investments | 21 | 21 | — | ||||||||
Foreign currency translation adjustments | (33 | ) | 58 | — | |||||||
Comprehensive loss | (85,628 | ) | (40,829 | ) | (81,874 | ) | |||||
Comprehensive loss attributable to the noncontrolling interests | 3,750 | 1,901 | — | ||||||||
Comprehensive loss attributable to Intrexon | $ | (81,878 | ) | $ | (38,928 | ) | $ | (81,874 | ) | ||
The accompanying notes are an integral part of these consolidated financial statements.
F-6
Intrexon Corporation and Subsidiaries
Consolidated Statements of Shareholders’ and Total Equity (Deficit)
Years Ended December 31, 2014, 2013 and 2012
(Amounts in thousands, except share data) | Common Stock | Additional Paid-in Capital | Accumulated Other Comprehensive Income (Loss) | Accumulated Deficit | Total Intrexon Shareholders’ Equity (Deficit) | Noncontrolling Interests | Total Equity (Deficit) | |||||||||||||||||||||||
Shares | Amount | |||||||||||||||||||||||||||||
Balances at December 31, 2011 | 5,453,893 | $ | — | $ | — | $ | — | $ | (221,259 | ) | $ | (221,259 | ) | $ | — | $ | (221,259 | ) | ||||||||||||
Stock-based compensation expense | — | — | 1,458 | — | — | 1,458 | — | 1,458 | ||||||||||||||||||||||
Exercises of stock options | 194,570 | — | 473 | — | — | 473 | — | 473 | ||||||||||||||||||||||
Contribution of services by shareholder | — | — | 1,550 | — | — | 1,550 | — | 1,550 | ||||||||||||||||||||||
Shares issued to nonemployee members of the Board of Directors | 13,062 | — | 93 | — | — | 93 | — | 93 | ||||||||||||||||||||||
Accretion of dividends on redeemable convertible preferred shares | — | — | (3,574 | ) | — | (18,420 | ) | (21,994 | ) | — | (21,994 | ) | ||||||||||||||||||
Net loss | — | — | — | — | (81,874 | ) | (81,874 | ) | — | (81,874 | ) | |||||||||||||||||||
Balances at December 31, 2012 | 5,661,525 | — | — | — | (321,553 | ) | (321,553 | ) | — | (321,553 | ) | |||||||||||||||||||
Shares issued in IPO | 11,499,998 | — | 168,801 | — | — | 168,801 | — | 168,801 | ||||||||||||||||||||||
Stock-based compensation expense | — | — | 2,812 | — | — | 2,812 | 109 | 2,921 | ||||||||||||||||||||||
Exercises of stock options and warrants | 176,531 | — | 410 | — | — | 410 | 4 | 414 | ||||||||||||||||||||||
Contribution of services by shareholder | — | — | 1,550 | — | — | 1,550 | — | 1,550 | ||||||||||||||||||||||
Shares issued to nonemployee members of the Board of Directors | 10,595 | — | 124 | — | — | 124 | — | 124 | ||||||||||||||||||||||
Accretion of dividends on redeemable convertible preferred shares | — | — | (2,510 | ) | — | (15,881 | ) | (18,391 | ) | — | (18,391 | ) | ||||||||||||||||||
Conversion of redeemable convertible preferred shares, including accrued dividends, to common stock | 79,705,130 | — | 571,898 | — | — | 571,898 | — | 571,898 | ||||||||||||||||||||||
Settlement of fractional shares from reverse stock split | (67 | ) | — | (1 | ) | — | — | (1 | ) | — | (1 | ) | ||||||||||||||||||
Adjustments for noncontrolling interests | — | — | — | — | — | — | 16,409 | 16,409 | ||||||||||||||||||||||
Net loss | — | — | — | — | (38,980 | ) | (38,980 | ) | (1,928 | ) | (40,908 | ) | ||||||||||||||||||
Other comprehensive income | — | — | — | 52 | — | 52 | 27 | 79 | ||||||||||||||||||||||
Balances at December 31, 2013 | 97,053,712 | — | 743,084 | 52 | (376,414 | ) | 366,722 | 14,621 | 381,343 | |||||||||||||||||||||
Stock-based compensation expense | — | — | 21,692 | — | — | 21,692 | 157 | 21,849 | ||||||||||||||||||||||
Exercises of stock options and warrants | 374,471 | — | 1,477 | — | — | 1,477 | 12 | 1,489 | ||||||||||||||||||||||
Contribution of services by shareholder | — | — | 1,991 | — | — | 1,991 | — | 1,991 | ||||||||||||||||||||||
Shares issued to nonemployee members of the Board of Directors | 16,908 | — | 486 | — | — | 486 | — | 486 | ||||||||||||||||||||||
Shares issued in private placement, net | 972,004 | — | 25,000 | — | — | 25,000 | — | 25,000 | ||||||||||||||||||||||
Acquisitions | 2,140,837 | — | 51,682 | — | — | 51,682 | — | 51,682 | ||||||||||||||||||||||
Adjustments for noncontrolling interests | — | — | (2,411 | ) | — | — | (2,411 | ) | 13,488 | 11,077 | ||||||||||||||||||||
Net loss | — | — | — | — | (81,822 | ) | (81,822 | ) | (3,794 | ) | (85,616 | ) | ||||||||||||||||||
Other comprehensive income (loss) | — | — | — | (56 | ) | — | (56 | ) | 44 | (12 | ) | |||||||||||||||||||
Balances at December 31, 2014 | 100,557,932 | $ | — | $ | 843,001 | $ | (4 | ) | $ | (458,236 | ) | $ | 384,761 | $ | 24,528 | $ | 409,289 | |||||||||||||
The accompanying notes are an integral part of these consolidated financial statements.
F-7
Intrexon Corporation and Subsidiaries
Consolidated Statements of Cash Flows
Years Ended December 31, 2014, 2013 and 2012
(Amounts in thousands) | 2014 | 2013 | 2012 | ||||||||
Cash flows from operating activities | |||||||||||
Net loss | $ | (85,616 | ) | $ | (40,908 | ) | $ | (81,874 | ) | ||
Adjustments to reconcile net loss to net cash used in operating activities: | |||||||||||
Depreciation and amortization | 10,415 | 7,205 | 7,984 | ||||||||
Loss on disposal of property, plant and equipment | 208 | 349 | 101 | ||||||||
Unrealized (appreciation) depreciation on equity securities | 10,469 | (10,443 | ) | 6,290 | |||||||
Amortization of discount/premium of investments | 1,357 | 716 | — | ||||||||
Collaboration revenue recognized upon achievement of milestone | — | — | (3,591 | ) | |||||||
Equity in net loss of affiliates | 5,260 | 606 | 274 | ||||||||
Gain on previously held equity investment | — | (7,415 | ) | — | |||||||
Stock-based compensation expense | 21,849 | 2,921 | 1,458 | ||||||||
Contribution of services by shareholder | 1,991 | 1,550 | 1,550 | ||||||||
Shares issued to nonemployee members of the Board of Directors | 486 | 124 | 93 | ||||||||
Provision for bad debts | 565 | — | — | ||||||||
Other noncash items | 723 | (75 | ) | — | |||||||
Changes in operating assets and liabilities: | |||||||||||
Receivables: | |||||||||||
Trade | 4,332 | (644 | ) | (121 | ) | ||||||
Related parties | (6,117 | ) | (4,967 | ) | (93 | ) | |||||
Note | (1 | ) | — | — | |||||||
Other | 15 | (542 | ) | 1,015 | |||||||
Inventory | (7,313 | ) | — | — | |||||||
Prepaid expenses and other | (465 | ) | (347 | ) | (413 | ) | |||||
Other assets | 80 | (18 | ) | 658 | |||||||
Accounts payable | 1,266 | (43 | ) | (1,229 | ) | ||||||
Accrued compensation and benefits | 1,587 | 1,301 | 2,441 | ||||||||
Other accrued liabilities | (586 | ) | 1,558 | (806 | ) | ||||||
Deferred revenue | 20,934 | (4,368 | ) | 4,997 | |||||||
Related party payables | (1,137 | ) | 6 | (180 | ) | ||||||
Other long term liabilities | (160 | ) | (249 | ) | (83 | ) | |||||
Net cash used in operating activities | (19,858 | ) | (53,683 | ) | (61,529 | ) | |||||
Cash flows from investing activities | |||||||||||
Purchases of investments | (60,478 | ) | (233,979 | ) | (2 | ) | |||||
Sales of investments | 9,100 | — | — | ||||||||
Maturities of investments | 122,992 | 44,996 | — | ||||||||
Purchases of equity securities | (19,496 | ) | (28,650 | ) | (10,000 | ) | |||||
Acquisitions of businesses, net of cash received | (67,577 | ) | 517 | — | |||||||
Investments in affiliates | (2,875 | ) | (5,000 | ) | (6,000 | ) | |||||
Purchases of property, plant and equipment | (6,371 | ) | (1,527 | ) | (7,491 | ) | |||||
Proceeds from sale of property, plant and equipment | 176 | 480 | 23 | ||||||||
Issuance of notes receivable | (1,500 | ) | (1,000 | ) | (200 | ) | |||||
Proceeds from notes receivable | — | 500 | 34 | ||||||||
Net cash used in investing activities | (26,029 | ) | (223,663 | ) | (23,636 | ) | |||||
The accompanying notes are an integral part of these consolidated financial statements.
F-8
Intrexon Corporation and Subsidiaries
Consolidated Statements of Cash Flows
Years Ended December 31, 2013, 2012 and 2011
(Amounts in thousands) | 2014 | 2013 | 2012 | ||||||||
Cash flows from financing activities | |||||||||||
Proceeds from issuance of Series E redeemable convertible preferred shares | — | — | 75,560 | ||||||||
Proceeds from issuance of Series F redeemable convertible preferred shares | — | 150,000 | — | ||||||||
Proceeds from IPO, net of issuance costs | — | 168,801 | — | ||||||||
Proceeds from issuance of shares in a private placement | 25,000 | — | — | ||||||||
Settlement of fractional shares | — | (5 | ) | — | |||||||
Advances from lines of credit | 4,676 | — | — | ||||||||
Repayments of advances from lines of credit | (6,494 | ) | — | — | |||||||
Payments of capital lease obligations | (32 | ) | (51 | ) | (77 | ) | |||||
Proceeds from long term debt | 268 | 493 | — | ||||||||
Payments of long term debt | (647 | ) | (53 | ) | — | ||||||
Proceeds from stock option exercises | 1,489 | 414 | 473 | ||||||||
Payment of issuance costs | (256 | ) | (3,148 | ) | (16 | ) | |||||
Net cash provided by financing activities | 24,004 | 316,451 | 75,940 | ||||||||
Effect of exchange rate changes on cash and cash equivalents | (160 | ) | 1 | — | |||||||
Net increase (decrease) in cash and cash equivalents | (22,043 | ) | 39,106 | (9,225 | ) | ||||||
Cash and cash equivalents | |||||||||||
Beginning of period | 49,509 | 10,403 | 19,628 | ||||||||
End of period | $ | 27,466 | $ | 49,509 | $ | 10,403 | |||||
Supplemental disclosure of cash flow information | |||||||||||
Cash paid during the period for interest | $ | 158 | $ | 51 | $ | 12 | |||||
Significant noncash financing and investing activities | |||||||||||
Conversion of subscriptions payable into Series E redeemable convertible preferred shares | $ | — | $ | — | $ | 7,440 | |||||
Accretion of dividends on redeemable convertible preferred shares | — | 18,391 | 21,994 | ||||||||
Conversion of redeemable convertible preferred shares, including accrued dividends, to common stock | — | 571,898 | — | ||||||||
Stock received as upfront consideration for collaboration agreements | 14,246 | 19,303 | 21,979 | ||||||||
Stock received as consideration upon achievement of milestone | — | — | 18,330 | ||||||||
Common stock issued in acquisitions | 51,682 | — | — | ||||||||
Deferred consideration payable related to acquisition | 20,115 | — | — | ||||||||
Accrued investment in affiliate | — | 1,500 | — | ||||||||
Purchases of equipment included in accounts payable and other accrued liabilities | 790 | 361 | 24 | ||||||||
The accompanying notes are an integral part of these consolidated financial statements.
F-9
Intrexon Corporation and Subsidiaries
Notes to Consolidated Financial Statements
(Amounts in thousands, except share and per share data)
1. Organization and Basis of Presentation
Intrexon Corporation (“Intrexon”), a Virginia corporation, forms collaborations to create biologically based products and processes using synthetic biology. Intrexon has primary operations in California, Florida, Maryland, Virginia, and Budapest, Hungary. There have been no commercialized products derived from Intrexon’s collaborations to date.
Trans Ova Genetics, L.C. and Subsidiaries (“Trans Ova”), a provider of bovine reproductive technologies and other genetic processes to cattle breeders and producers, is a wholly owned subsidiary of Intrexon with primary operations in Iowa, Maryland, Missouri, Oklahoma and Texas (Note 3). ViaGen, L.C. (“ViaGen”), a provider of genetic preservation and cloning technologies to the cattle and equine industries, is a wholly owned subsidiary of Trans Ova. Exemplar Genetics, LLC (“Exemplar”), a provider of genetically engineered swine for medical and genetic research, is a consolidated, majority owned subsidiary of Trans Ova. At December 31, 2014, Trans Ova and ViaGen combined owned approximately 51% of Exemplar.
At December 31, 2014, Intrexon owned approximately 60% of AquaBounty Technologies, Inc. (“AquaBounty”), a biotechnology company focused on improving productivity in commercial aquaculture (Note 4), and 51% of Biological & Popular Culture, Inc. (“BioPop”) (Note 4).
Intrexon Corporation and its consolidated subsidiaries are herein after referred to as the “Company.”
Effective July 26, 2013, the Company’s board of directors and shareholders approved a reverse stock split of 1-for-1.75 of the Company’s shares of common stock. Shareholders entitled to fractional shares as a result of the reverse stock split received a cash payment in lieu of receiving fractional shares. Shares of common stock underlying outstanding stock options and warrants were proportionately reduced and the respective exercise prices were proportionately increased in accordance with the terms of the agreements governing such securities. All share and per share data of the Company’s common stock, including shares of common stock underlying stock options and warrants, have been retroactively adjusted in the accompanying consolidated financial statements to reflect the reverse stock split.
On August 13, 2013, the Company completed its initial public offering (“IPO”), whereby the Company sold 11,499,998 shares of common stock, inclusive of 1,499,999 shares of common stock sold by the Company pursuant to the full exercise of an overallotment option granted to the underwriters in connection with the IPO, at a price of $16.00 per share. The shares began trading on the New York Stock Exchange (“NYSE”) on August 8, 2013. The aggregate proceeds from the IPO were approximately $168,300, net of underwriting discounts and commissions of approximately $12,900 and offering expenses paid by the Company of approximately $2,800 (of which $2,300 were capitalized). Upon the closing of the IPO, all shares of the Company’s redeemable convertible preferred stock, including accrued but unpaid dividends thereon, converted into 79,705,130 shares of common stock. Additionally, in connection with the closing of the IPO, the Company amended and restated its articles of incorporation to increase the number of authorized shares of common stock to 200,000,000 and decrease the number of authorized shares of undesignated preferred stock to 25,000,000.
These consolidated financial statements are presented in United States dollars and are prepared under accounting principles generally accepted in the United States of America (“U.S. GAAP”).
2. Summary of Significant Accounting Policies
Principles of Consolidation
The accompanying consolidated financial statements reflect the operations of the Company and its subsidiaries. All intercompany accounts and transactions have been eliminated.
Revenue Recognition
The Company generates revenue through contractual agreements with collaborators (known as exclusive channel collaborations, “ECC” or “ECCs”) whereby the collaborators obtain exclusive access to the Company’s proprietary technologies for use in the research, development and commercialization of products and/or treatments in a contractually specified field of use. Generally, the terms of these collaborative agreements provide that the Company receives some or all of the following: (i) upfront payments upon consummation of the agreement, (ii) reimbursements for costs incurred by the
F-10
Company for research and development and/or manufacturing efforts related to specific application provided for in the agreement, (iii) milestone payments upon the achievement of specified development, regulatory and commercial activities, and (iv) royalties on sales of products arising from the collaboration.
The Company’s collaboration agreements typically contain multiple elements, or deliverables, including technology licenses, research and development services, and in certain cases manufacturing services. The Company applies the provisions of Accounting Standards Update (“ASU”) No. 2009-13, Revenue Recognition (Topic 605): Multiple Deliverable Revenue Arrangements (“ASU 2009-13”). In accordance with the provisions of ASU 2009-13, the Company identifies the deliverables within the agreements and evaluates which deliverables represent separate units of accounting. Analyzing the agreements to identify deliverables requires the use of judgment. A deliverable is considered a separate unit of accounting when the deliverable has value to the collaborator on a standalone basis based on the consideration of the relevant facts and circumstances for each agreement.
Consideration received is allocated at the inception of the agreement to all identified units of accounting based on their relative selling price. When available, the relative selling price for each deliverable is determined using vendor specific objective evidence (“VSOE”) of the selling price or third-party evidence of the selling price, if VSOE does not exist. If neither VSOE nor third-party evidence of the selling price exists, the Company uses its best estimate of the selling price (“BESP”) for the deliverable. The amount of allocable consideration is limited to amounts that are fixed or determinable. The consideration received is allocated among the separate units of accounting, and the applicable revenue recognition criteria are applied to each of the separate units. The Company recognizes the revenue allocated to each unit of accounting as the Company delivers the related goods or services. If the Company determines that certain deliverables should be treated as a single unit of accounting, then the revenue is recognized using either a proportional performance or straight-line method, depending on whether the Company can reasonably estimate the level of effort required to complete its performance obligations under an arrangement and whether such performance obligations are provided on a best-efforts basis. As the Company cannot reasonably estimate its performance obligations related to its collaborators, the Company recognizes revenue on a straight-line basis over the period it expects to complete its performance obligations.
The terms of the Company’s agreements may provide for milestone payments upon achievement of certain defined events. The Company applies ASU No. 2010-17, Revenue Recognition — Milestone Method (“ASU 2010-17” or “Milestone Method”). Under the Milestone Method, the Company recognizes consideration that is contingent upon the achievement of a milestone in its entirety as revenue in the period in which the milestone is achieved only if the milestone is substantive in its entirety. A milestone is considered substantive when it meets all of the following criteria:
(1) | The consideration is commensurate with either the entity’s performance to achieve the milestone or the enhancement of the value of the delivered item or items as a result of a specific outcome resulting from the entity’s performance to achieve the milestone; |
(2) | The consideration relates solely to past performance; and |
(3) | The consideration is reasonable relative to all of the deliverables and payment terms within the arrangement. |
In the event that a milestone is not considered substantive, the Company recognizes the milestone consideration as revenue using the same method applied to upfront payments.
Research and development services are a deliverable satisfied by the Company in accordance with the terms of the collaboration agreements and the Company considers these services to be inseparable from the license to the core technology; therefore, reimbursements of services performed are recognized as revenue. Because reimbursement (i) is contingent upon performance of the services by the Company, (ii) does not include a profit component, and (iii) does not relate to any future deliverable, the revenue is recognized during the period in which the related services are performed and collection of such amounts is reasonably assured. Payments received for manufacturing services will be recognized when the earnings process related to the manufactured materials has been completed. Royalties to be received under the agreements will be recognized as earned.
The Company also generates revenue through sales of advanced reproductive technologies, including bovine embryos derived from the Company's embryo transfer and in vitro fertilization processes and from genetic preservation and sexed semen processes and applications of such processes to other livestock, as well as sales of livestock used in production. Revenue is recognized when (i) persuasive evidence of an arrangement exists, (ii) services have been rendered or delivery has occurred such that risk of loss has passed to the customer, (iii) the price is fixed or determinable, and (iv) collection from the customer is reasonably assured.
F-11
Research and Development
The Company considers that regulatory and other uncertainties inherent in the research and development of new products preclude it from capitalizing such costs. Research and development expenses include salaries and related costs of research and development personnel, and the costs of consultants, facilities, materials and supplies associated with research and development projects as well as various laboratory studies. Indirect research and development costs include depreciation, amortization and other indirect overhead expenses.
The Company has research and development arrangements with third parties that include upfront and milestone payments and primarily relate to collaborations. At December 31, 2014 and 2013, the Company had research and development commitments with third parties totaling $4,541 and $2,445, respectively, of which $2,183 and $957, respectively, had not yet been incurred. The commitments are generally cancellable by the Company at any time upon written notice.
Cash and Cash Equivalents
All highly liquid investments with an original maturity of three months or less at the date of purchase are considered to be cash equivalents. Cash balances at a limited number of banks may periodically exceed insurable amounts. The Company believes that it mitigates its risk by investing in or through major financial institutions with high quality credit ratings. Recoverability of investments is dependent upon the performance of the issuer. At December 31, 2014 and 2013, the Company had cash equivalent investments in highly liquid money market accounts at major financial institutions of $16,598 and $43,733, respectively.
Short-term and Long-term Investments
At December 31, 2014, short-term and long-term investments include U.S. government debt securities and certificates of deposit. The Company determines the appropriate classification as short-term or long-term at the time of purchase based on original maturities and management’s reasonable expectation of sales and redemption. The Company reevaluates such classification at each balance sheet date. The Company’s written investment policy requires investments to be explicitly rated by two of the three following rating services: Standard & Poor’s, Moody’s and/or Fitch and to have a minimum rating of A1, P1 and/or F-1, respectively, from those agencies. In addition, the investment policy limits the amount of credit exposure to any one issuer.
Equity Securities
The Company holds equity securities received and/or purchased from certain collaborators. Other than investments accounted for using the equity method, the Company elected the fair value option to account for its equity securities held in these collaborators. These equity securities are recorded at fair value at each reporting date and are subject to market price volatility. Unrealized gains and losses resulting from fair value adjustments are reported in the consolidated statement of operations. The fair value of these equity securities is subject to fluctuation in the future due to the volatility of the stock market, changes in general economic conditions and changes in the financial conditions of these collaborators. These equity securities are classified as noncurrent in the consolidated balance sheet as the Company does not intend to sell these equity securities within one year. The Company has not sold any of these equity securities to date.
The Company records the fair value of securities received on the date the collaboration is consummated or the milestone is achieved using the closing, quoted price of the collaborator’s security on that date, assuming the transfer of consideration is considered perfunctory. If the transfer of the consideration is not considered perfunctory, the Company considers the specific facts and circumstances to determine the appropriate date on which to evaluate fair value. The Company also evaluates whether any discounts for trading restrictions or other basis for lack of marketability should be applied to the fair value of the securities at inception of the collaboration. In the event the Company concludes that a discount should be applied, the fair value of the securities is adjusted at inception of the collaboration and re-evaluated at each reporting period thereafter.
Fair Value of Financial Instruments
Fair value is the price that would be received to sell an asset or paid to transfer a liability in an orderly transaction between market participants at the measurement date. As such, fair value is a market-based measurement that should be determined based on assumptions that market participants would use in pricing an asset and liability. As a basis for considering such assumptions, the Company uses a three-tier fair value hierarchy that prioritizes the inputs used in its fair value measurements. The hierarchy gives the highest priority to unadjusted quoted prices in active markets for identical assets or liabilities (Level 1
F-12
measurements) and the lowest priority to unobservable inputs (Level 3 measurements). The three levels of the fair value hierarchy are as follows:
Level 1: | Quoted prices in active markets for identical assets and liabilities; |
Level 2: | Other than quoted prices included in Level 1 inputs that are observable for the asset or liability, either directly or indirectly; and |
Level 3: | Unobservable inputs for the asset or liability used to measure fair value to the extent that observable inputs are not available. |
Concentrations of Risk
Due to the Company’s mix of fixed and variable rate securities holdings, the Company’s investment portfolio is susceptible to changes in interest rates. As of December 31, 2014, gross unrealized losses on the Company’s investments were not material. From time to time, the Company may liquidate some or all of its investments to fund operational needs or other activities, such as capital expenditures or business acquisitions. Depending on which investments the Company liquidates to fund these activities, the Company could recognize a portion, or all, of the gross unrealized losses.
Financial instruments which potentially subject the Company to concentrations of credit risk consist primarily of trade receivables. The Company controls credit risk through credit approvals, credit limits and monitoring procedures. The Company performs ongoing credit evaluations of its customers, but generally does not require collateral to support accounts receivable.
Equity Method Investments
Through March 15, 2013, the Company accounted for its investment in AquaBounty using the equity method of accounting since the Company had the ability to exercise significant influence, but not control, over the operating activities of AquaBounty. The excess of the investment over the Company’s pro-rata share of AquaBounty’s net assets represented identifiable intangible assets and equity-method goodwill. On March 15, 2013, the Company acquired additional ownership interests in AquaBounty which resulted in the Company gaining control over AquaBounty, thereby requiring consolidation effective on that date (Note 4).
The Company has entered into three strategic joint ventures (Note 5). The Company accounts for its investments in these joint ventures using the equity method of accounting since the Company has the ability to exercise significant influence, but not control, over the operating activities of these entities.
The Company determined that it has significant influence over two of its collaborators, Ziopharm Oncology, Inc. ("Ziopharm") and Oragenics, Inc. ("Oragenics"), as of December 31, 2014 and 2013, based on its ownership interests, representation on the board of directors of the collaborators and other qualitative factors. The Company accounts for its investments in Ziopharm and Oragenics using the fair value option. As of December 31, 2012, the Company determined that one of these collaborators, Ziopharm, met the criteria of SEC Regulation S-X Article 3-9 for inclusion of separate financial statements of an equity method investment.
The fair value of the Company’s equity securities of Ziopharm was $83,099 and $71,134 as of December 31, 2014 and 2013, respectively, and is included as equity securities in the respective consolidated balance sheets. The Company’s ownership percentage of Ziopharm was 15.7% and 16.4% at December 31, 2014 and 2013, respectively. Unrealized appreciation (depreciation) in the fair value of the Company’s equity securities held in Ziopharm was $11,965, $4,836, and $(7,194) for the years ended December 31, 2014, 2013 and 2012, respectively.
The fair value of the Company’s equity securities of Oragenics was $7,192 and $22,161 as of December 31, 2014 and 2013, respectively, and is included as equity securities in the respective consolidated balance sheets. The Company’s ownership percentage of Oragenics was 24.4% and 24.6% at December 31, 2014 and 2013, respectively. Unrealized appreciation (depreciation) in the fair value of the Company’s equity securities held in Oragenics was $(14,969), $(90), and $3,540 for the years ended December 31, 2014, 2013, and 2012, respectively.
F-13
Summarized financial data as of December 31, 2014 and 2013, and for the years ended December 31, 2014, 2013, and 2012, for the Company's equity method investments for which separate financial statements are not included, pursuant to SEC Regulation S-X Article 3-09, are as follows:
December 31, | ||||||
2014 | 2013 | |||||
Current assets | $ | 19,540 | 26,655 | |||
Non-current assets | 109 | 27 | ||||
Total assets | 19,649 | 26,682 | ||||
Current liabilities | 4,520 | 1,276 | ||||
Net assets | $ | 15,129 | 25,406 | |||
Year Ended December 31, | |||||||||||
2014 | 2013 | 2012 | |||||||||
Revenues, net | $ | 940 | $ | 1,032 | $ | — | |||||
Operating expenses | 17,289 | 18,498 | 578 | ||||||||
Loss from operations | (16,349 | ) | (17,466 | ) | (578 | ) | |||||
Other | 35 | 137 | (1 | ) | |||||||
Net loss | $ | (16,314 | ) | $ | (17,329 | ) | $ | (579 | ) | ||
Variable Interest Entities
The Company identifies entities that (i) do not have sufficient equity investment at risk to permit the entity to finance its activities without additional subordinated financial support or (ii) in which the equity investors lack an essential characteristic of a controlling financial interest as variable interest entities (“VIE” or “VIEs”). The Company performs an initial and on-going evaluation of the entities with which the Company has variable interests to determine if any of these entities are VIEs. If an entity is identified as a VIE, the Company performs an assessment to determine whether the Company has both (i) the power to direct activities that most significantly impact the VIE’s economic performance and (ii) have the obligation to absorb losses from or the right to receive benefits of the VIE that could potentially be significant to the VIE. If both of these criteria are satisfied, the Company is identified as the primary beneficiary of the VIE.
As of December 31, 2014, the Company determined that Genopaver, LLC ("Genopaver"), Intrexon Energy Partners, LLC ("Intrexon Energy Partners"), OvaXon, LLC ("OvaXon") and Persea Bio, LLC ("Persea Bio") were VIEs. The Company was not the primary beneficiary for these entities since it did not have the power to direct the activities that most significantly impact the economic performance of the VIEs. As of December 31, 2013, the Company determined that Genopaver was a VIE. The Company was not the primary beneficiary for this entity since it did not have the power to direct the activities that most significantly impact the economic performance of the VIE.
Trade Receivables
Trade receivables consist of credit extended to the Company’s customers and collaborators in the normal course of business and are reported net of an allowance for doubtful accounts. The Company reviews its customer accounts on a periodic basis and records bad debt expense for specific amounts the Company evaluates as uncollectible. Past due status is determined based upon contractual terms. Amounts are written off at the point when collection attempts have been exhausted. Management estimates uncollectible amounts considering such factors as current economic conditions and historic and anticipated customer performance. This estimate can fluctuate due to changes in economic, industry or specific customer conditions which may require adjustment to the allowance recorded by the Company. Management has included amounts believed to be uncollectible in the allowance for doubtful accounts.
F-14
The following table shows the activity in the allowance for doubtful accounts for the year ended December 31, 2014:
2014 | |||
Beginning balance | $ | — | |
Charged to operating expenses | 565 | ||
Ending balance | $ | 565 | |
Inventory
The Company's inventory primarily includes adult female cows which are used in certain production processes and are recorded at acquisition cost using the first-in, first-out method or at market, whichever is lower. Work-in-process inventory includes allocations of production costs and facility costs for products currently in production and is recorded at the lower of cost or market. Significant declines in the price of cows could result in unfavorable adjustments to inventory balances.
Property, Plant and Equipment
Property, plant and equipment are stated at cost, less accumulated depreciation and amortization. Major additions or betterments are capitalized and repairs and maintenance are generally expensed as incurred. Depreciation and amortization is calculated using the straight-line method over the estimated useful lives of the assets. The estimated useful lives of these assets are as follows:
Years | |
Buildings and building improvements | 2–23 |
Furniture and fixtures | 1–7 |
Equipment | 1–10 |
Land improvements | 4–15 |
Computer hardware and software | 1–7 |
Leasehold improvements are amortized over the shorter of the useful life of the asset or the applicable lease term, generally one to fourteen years.
Goodwill
Goodwill represents the future economic benefits arising from other assets acquired in a business combination that are not individually identified and separately recognized (Notes 3 and 4). Goodwill is reviewed for impairment at least annually. The Company performs a qualitative assessment to determine whether it is more-likely-than-not that the fair value of a reporting unit is less than its carrying amount prior to performing the two-step goodwill impairment test. If this is the case, the two-step goodwill impairment test is required. If it is more-likely-than-not that the fair value of a reporting unit is greater than the carrying amount, the two-step goodwill impairment test is not required.
If the two-step goodwill impairment test is required, first, the fair value of the reporting unit is compared with its carrying amount (including goodwill). If the fair value of the reporting unit is less than its carrying amount, an indication of goodwill impairment exists for the reporting unit and the entity must perform step two of the impairment test. Under step two, an impairment loss is recognized for any excess of the carrying amount of the reporting unit’s goodwill over the implied fair value of that goodwill. The implied fair value of goodwill is determined by allocating the fair value of the reporting unit in a manner similar to a purchase price allocation and the residual fair value after this allocation is the implied fair value of the reporting unit goodwill. Fair value of the reporting unit is determined using a discounted cash flow analysis. If the fair value of the reporting unit exceeds its carrying amount, step two does not need to be performed.
The Company performs its annual impairment review of goodwill in the fourth quarter, or sooner if a triggering event occurs prior to the annual impairment review.
Intangible Assets
Intangible assets subject to amortization consist of patents and related technologies and know-how; customer relationships; and trademarks acquired as a result of mergers and acquisitions (Note 3). These intangible assets are subject to amortization, were
F-15
recorded at fair value at the date of acquisition and are stated net of accumulated amortization. Indefinite-lived intangible assets consist of in-process research and development acquired in mergers and acquisitions (Notes 3 and 4) and were recorded at fair value at the dates of the respective acquisitions.
The Company applies the provisions of ASC Topic 350, Intangibles, Goodwill and Other, which requires the amortization of long-lived intangible assets to reflect the pattern in which the economic benefits of the intangible asset are expected to be realized. The intangible assets are amortized over their remaining estimated useful lives, ranging from three to fourteen years for the patents, related technologies and know-how; customer relationships; and trademarks.
Impairment of Long-Lived Assets
Long-lived assets to be held and used, including property, plant and equipment and intangible assets subject to amortization, are reviewed for impairment whenever events or changes in circumstances indicate that the carrying amount of the assets may not be recoverable. Conditions that would necessitate an impairment assessment include a significant decline in the observable market value of an asset, a significant change in the extent or manner in which an asset is used, or a significant adverse change that would indicate that the carrying amount of an asset or group of assets is not recoverable.
Indefinite-lived intangible assets, including in-process research and development, are tested for impairment annually, or more frequently if events or circumstances between annual tests indicate that the asset may be impaired. Impairment losses on indefinite-lived intangible assets are recognized based solely on a comparison of their fair value to carrying value, without consideration of any recoverability test. The Company monitors the progression of its in-process research and development, as the likelihood of success is contingent upon commercial development or regulatory approval.
Foreign Currency Translation
The assets and liabilities of foreign subsidiaries, where the local currency is the functional currency, are translated from their respective functional currencies into United States dollars at the exchange rates in effect at the balance sheet date, with resulting foreign currency translation adjustments recorded in the consolidated statement of comprehensive loss. Revenue and expense amounts are translated at average rates during the period.
Income Taxes
Income taxes are accounted for under the asset and liability method. Deferred tax assets and liabilities are recognized for the future tax consequences attributable to both differences between the financial statement carrying amounts of existing assets and liabilities and their respective tax bases as well as operating loss and tax credit carryforwards. Deferred tax assets and liabilities are measured using enacted tax rates expected to apply to taxable income in the years in which those temporary differences are expected to be recovered or settled. The effect on deferred tax assets and liabilities of a change in tax rates is recognized in income in the period that includes the enactment date of the change. Valuation allowances are established when necessary to reduce deferred tax assets to the amount expected to be realized.
The Company identifies any uncertain income tax positions and recognizes the effect of income tax positions only if those positions are more likely than not of being sustained. Recognized income tax positions are measured at the largest amount that is greater than 50% likely of being realized. Changes in recognition or measurement are reflected in the period in which the change in judgment occurs. The Company records interest, if any, related to unrecognized tax benefits as a component of interest expense. Penalties, if any, are recorded in selling, general and administrative expenses.
Net Loss per Share
Basic net loss per share is calculated by dividing net loss attributable to common shareholders by the weighted average shares outstanding during the period, without consideration of common stock equivalents. Diluted net loss per share is calculated by adjusting weighted average shares outstanding for the dilutive effect of common stock equivalents outstanding for the period, using the treasury-stock method. For purposes of the diluted net loss per share calculation, preferred stock, stock options and warrants are considered to be common stock equivalents but are excluded from the calculation of diluted net loss per share because their effect would be anti-dilutive and, therefore, basic and diluted net loss per share were the same for all periods presented.
F-16
Segment Information
The Company has determined that it operates in one segment. The Company applies its technologies to create products and services which may be either sold directly to customers or developed through collaboration with third parties. Substantially all of the Company’s revenues are derived in the United States of America. Substantially all of the Company’s assets are located in the United States of America. As of December 31, 2014, the Company had $2,200 of property and equipment in foreign countries. For the year ended December 31, 2014, the Company recognized $2,166 of revenues earned in foreign countries.
Recently Issued Accounting Pronouncements
In May 2014, the Financial Accounting Standards Board (“FASB”) issued ASU 2014-9, Revenue from Contracts with Customers (“ASU 2014-9”). The FASB issued ASU 2014-9 to clarify the principles for recognizing revenue and to develop a common revenue standard for U.S. GAAP. The standard outlines a single comprehensive model for entities to use in accounting for revenue arising from contracts with customers and supersedes the most current revenue recognition guidance. This guidance is effective for fiscal years and interim periods within those years beginning after December 15, 2016, and is effective for the Company for the year ending December 31, 2017. The Company is currently evaluating the impact that the implementation of this standard will have on the Company’s consolidated financial statements.
In June 2014, the FASB issued ASU 2014-10, Development Stage Entities (Topic 915): Elimination of Certain Financial Reporting Requirements, Including an Amendment to Variable Interest Entities Guidance in Topic 810, Consolidation (“ASU 2014-10”). The provisions of ASU 2014-10 related to Topic 915 will not have a significant impact to the Company. ASU 2014-10 removes an exception provided to development-stage entities in Consolidation (Topic 810) for determining whether an entity is a variable interest entity. The revisions to Consolidation (Topic 810) are effective for interim and annual periods beginning after December 15, 2015, and are effective for the Company for the year ending December 31, 2016. The Company is currently evaluating the impact that the implementation of this standard will have on the Company’s consolidated financial statements.
Reclassifications
Certain insignificant reclassifications have been made to the prior year consolidated financial statements to conform to the current year presentation.
Use of Estimates
The preparation of financial statements in conformity with U.S. GAAP requires management to make estimates and assumptions that affect the reported amounts of assets and liabilities, the disclosure of contingent assets and liabilities at the date of the financial statements, and the reported amounts of revenues and expenses during the reporting periods. Actual results could differ from those estimates.
3. Mergers and Acquisitions
Trans Ova Acquisition
On August 8, 2014, the Company acquired 100% of the membership interests of Trans Ova, a provider of bovine reproductive technologies, pursuant to an Amended and Restated Membership Interest Purchase Agreement (the “Purchase Agreement”). Since the acquisition, Trans Ova has continued its operations. The Company and Trans Ova intend to build upon Trans Ova’s current platform with new capabilities with a goal of achieving higher levels of delivered value to dairy and beef cattle producers. Pursuant to the Purchase Agreement, the former members of Trans Ova received an aggregate of 1,444,388 shares of the Company's common stock and $63,625 in cash, and will receive deferred cash consideration valued at $20,115 in exchange for all membership interests of Trans Ova. The deferred cash consideration is payable in three equal installments upon the first, second, and third anniversaries of the transaction date. The Purchase Agreement also provides for payment to the former members of Trans Ova a portion of certain cash proceeds in the event there is an award under certain litigation matters pending as of the transaction date to which Trans Ova is a party. The results of Trans Ova's operations subsequent to August 8, 2014 have been included in the consolidated financial statements, including revenues of $26,352 and net income of $278 for the year ended December 31, 2014.
F-17
The fair value of the total consideration transferred, including the noncontrolling interest in a majority-owned subsidiary of Trans Ova, was $127,875. The acquisition date fair value of each class of consideration transferred and noncontrolling interest is presented below:
Cash | $ | 63,625 | |
Common shares | 32,802 | ||
Deferred cash consideration | 20,115 | ||
Total consideration transferred | 116,542 | ||
Fair value of noncontrolling interest | 11,333 | ||
Total | $ | 127,875 | |
The fair value of the shares of the Company’s common stock issued was based on the quoted closing price of the Company’s common stock on August 8, 2014. The estimated fair value of assets acquired and liabilities assumed at the acquisition date is shown in the table below along with subsequent adjustments during the measurement period to the fair value of assets acquired and liabilities assumed. The adjustments resulted from finalizing the valuation of trade receivables, property, plant and equipment and intangible assets.
Initial Estimated Fair Value | Adjustments | Adjusted Fair Value | |||||||||
Cash | $ | 960 | $ | — | $ | 960 | |||||
Trade receivables | 17,996 | 697 | 18,693 | ||||||||
Related party receivables | 1,219 | — | 1,219 | ||||||||
Inventory | 17,256 | 1,220 | 18,476 | ||||||||
Prepaid expenses and other | 590 | — | 590 | ||||||||
Property, plant and equipment | 18,686 | 2,478 | 21,164 | ||||||||
Intangible assets | 24,100 | (400 | ) | 23,700 | |||||||
Other non-current assets | 147 | — | 147 | ||||||||
Total assets acquired | 80,954 | 3,995 | 84,949 | ||||||||
Accounts payable | 3,317 | — | 3,317 | ||||||||
Accrued compensation and benefits | 913 | — | 913 | ||||||||
Other accrued liabilities | 271 | — | 271 | ||||||||
Deferred revenue | 2,420 | 2,038 | 4,458 | ||||||||
Lines of credit | 4,091 | — | 4,091 | ||||||||
Related party payables | 1,246 | — | 1,246 | ||||||||
Long term debt | 9,090 | — | 9,090 | ||||||||
Total liabilities assumed | 21,348 | 2,038 | 23,386 | ||||||||
Net assets acquired | 59,606 | 1,957 | 61,563 | ||||||||
Goodwill | 63,913 | 2,399 | 66,312 | ||||||||
Total consideration and fair value of noncontrolling interest | $ | 123,519 | $ | 4,356 | $ | 127,875 | |||||
The fair value of acquired inventory was determined using the cost approach, which establishes value based on the cost of reproducing or replacing the asset. The fair value of acquired property, plant and equipment was determined using the cost approach and the market approach. The market approach uses prices and other relevant information generated by market transactions involving identical or comparable assets. The acquired intangible assets include various developed technologies and know-how, customer relationships, and trademarks, and the fair values of these assets were determined using the relief-from-royalty, multi-period excess earnings, and with-and-without methods, which are all variations of the income approach that convert future cash flows to single discounted present value amounts. The acquired intangible assets are being amortized over useful lives ranging from three to nine years. Goodwill, which will be deductible for tax purposes, represents the assembled workforce, potential future expansion of Trans Ova business lines and anticipated buyer-specific synergies arising from the combination of the Company’s and Trans Ova’s technologies.
F-18
In conjunction with a prior transaction associated with Trans Ova’s subsidiary, ViaGen, in September 2012, the Company may be obligated to make certain future contingent payments to the former equity holders of ViaGen, up to a total of $6,000 if certain revenue targets, as defined in the share purchase agreement, are met. The Company does not expect these revenue targets to be met and accordingly has assigned no value to this liability.
As of December 31, 2014, the Company has incurred $713 of costs primarily for legal and due diligence services related to this acquisition, which are included in selling, general, and administrative expenses in the accompanying consolidated statements of operations for the year ended December 31, 2014.
Medistem Acquisition
On March 6, 2014, the Company acquired 100% of the outstanding common stock and securities convertible into common stock of Medistem, Inc. (“Medistem”), an entity engaged in the development of Endometrial Regenerative Cells (“ERCs”), for a combination of cash and Company common stock. The acquisition allows the Company to employ its synthetic biology platforms to engineer a diverse array of cell-based therapeutic candidates using Medistem’s multipotent ERCs. Pursuant to the terms of the merger agreement, Medistem equity holders received 714,144 shares of the Company’s common stock and $4,920 in cash in exchange for the outstanding Medistem common stock and securities convertible into common stock. Additionally, Medistem had issued the Company two promissory notes in the amount of $707, including accrued interest, both of which were settled upon closing of the merger. Certain members of Medistem’s management surrendered a total of 17,695 shares of their merger consideration to reimburse the Company for required payroll tax withholdings. The results of Medistem’s operations subsequent to March 6, 2014 have been included in the consolidated financial statements.
The fair value of the total consideration transferred was $24,995. The acquisition date fair value of each class of consideration transferred is presented below:
Cash | $ | 4,920 | |
Common shares | 19,368 | ||
Settlement of promissory notes | 707 | ||
$ | 24,995 | ||
The fair value of the shares of the Company’s common stock issued was based on the quoted closing price of the Company’s common stock on March 6, 2014. The estimated fair value of assets acquired and liabilities assumed at the acquisition date is shown in the table below along with subsequent adjustments during the measurement period to the fair value of assets acquired and liabilities assumed. The adjustments were due to the completed valuation of intangible assets and obtaining final balances of accrued expenses.
Initial Estimated Fair Value | Adjustments | Adjusted Fair Value | |||||||||
Cash | $ | 8 | $ | — | $ | 8 | |||||
Intangible assets | — | 4,824 | 4,824 | ||||||||
Total assets acquired | 8 | 4,824 | 4,832 | ||||||||
Accounts payable | 644 | — | 644 | ||||||||
Accrued compensation and benefits | 85 | (18 | ) | 67 | |||||||
Other accrued expenses | 150 | (100 | ) | 50 | |||||||
Total liabilities assumed | 879 | (118 | ) | 761 | |||||||
Net assets acquired (liabilities assumed) | (871 | ) | 4,942 | 4,071 | |||||||
Goodwill | 25,866 | (4,942 | ) | 20,924 | |||||||
Total consideration | $ | 24,995 | $ | — | $ | 24,995 | |||||
The fair value of acquired intangible assets was determined using the cost approach. The acquired intangible assets consist of in-process research and development, which is an indefinite-lived intangible asset. The goodwill consists of buyer-specific synergies between the Company’s and Medistem’s technologies present. The goodwill is not expected to be deductible for tax purposes.
F-19
In conjunction with the acquisition, the Company has incurred $680 of acquisition related costs, of which $310 and $370 is included in selling, general and administrative expenses in the accompanying consolidated statements of operations for the year ended December 31, 2014 and 2013, respectively.
Unaudited Condensed Pro Forma Financial Information
The results of operations of the mergers and acquisitions discussed above are included in the consolidated statements of operations beginning on the day after their respective acquisition dates. The following unaudited condensed pro forma financial information for the years ended December 31, 2014 and 2013, is presented as if the acquisitions had been consummated on January 1, 2013:
Year Ended December 31, | |||||||
2014 | 2013 | ||||||
Pro Forma | |||||||
Revenues | $ | 119,721 | $ | 86,991 | |||
Loss before income taxes | (82,041 | ) | (41,718 | ) | |||
Net loss | (81,938 | ) | (41,718 | ) | |||
Net loss attributable to the noncontrolling interests | 4,159 | 2,766 | |||||
Net loss attributable to Intrexon | (77,779 | ) | (38,952 | ) | |||
Accretion of dividends on redeemable convertible preferred stock | — | (18,391 | ) | ||||
Net loss attributable to common shareholders | (77,779 | ) | (57,343 | ) | |||
4. Consolidated Majority-Owned Subsidiaries
AquaBounty
On November 16, 2012, the Company acquired 48,631,444 shares of AquaBounty common stock, representing 47.56% of the then outstanding shares of AquaBounty, for $6,000 through a definitive purchase agreement with an existing AquaBounty shareholder and its affiliate. On November 29, 2012, the Company executed a promissory note purchase agreement (“promissory note”) with AquaBounty. The promissory note allowed for the Company to loan up to $500 to AquaBounty. Draws on the promissory note by AquaBounty accrued annual interest of 3% and matured no later than May 28, 2013. Between December 2012 and February 2013, AquaBounty had drawn $500 on the promissory note. On March 15, 2013, AquaBounty repaid the $500 promissory note plus accrued interest.
On March 15, 2013, the Company acquired 18,714,814 shares of AquaBounty for $4,907 in a private subscription offering, thereby increasing the Company’s ownership in AquaBounty to 53.82%, resulting in the Company consolidating AquaBounty pursuant to the step acquisition guidance in ASC 805, Business Combinations ("ASC 805"). The Company recognized a gain of $7,415 to account for the difference between the carrying value and the fair value of the previously held 47.56% equity interest. The fair value of the consideration transferred included:
Consideration paid | $ | 4,907 | |
Fair value of noncontrolling interest | 15,153 | ||
Fair value of the Company’s investment in affiliate held before the business combination | 12,751 | ||
Fair value of the consideration transferred and noncontrolling interest | $ | 32,811 | |
F-20
The Company used the private subscription price to measure fair value of the Company’s previously held investment and noncontrolling interest. The estimated fair value of assets acquired and liabilities assumed at the acquisition date is shown in the table below.
Cash | $ | 5,419 | |
Short-term investments | 14 | ||
Trade receivables | 4 | ||
Other receivables | 9 | ||
Prepaid expenses and other | 200 | ||
Property, plant and equipment | 1,241 | ||
Intangible assets | 14,900 | ||
Other assets | 22 | ||
Total assets acquired | 21,809 | ||
Accounts payable | 156 | ||
Accrued compensation | 94 | ||
Other accrued liabilities | 395 | ||
Long-term debt | 1,354 | ||
Total liabilities assumed | 1,999 | ||
Net assets acquired | 19,810 | ||
Goodwill | 13,001 | ||
Total consideration and fair value of noncontrolling interest | $ | 32,811 | |
The fair value of acquired intangible assets was determined using the multi-period excess earnings method. The acquired intangible assets consist of in-process research and development until regulatory approval is obtained, at which point the intangible assets will be accounted for as definite-lived intangible assets and amortized over the expected useful life of fifteen years. The goodwill represents future revenue opportunities and the potential for expansion of AquaBounty products and is not expected to be deductible for tax purposes.
The results of operations of AquaBounty are included in the consolidated statement of operations beginning on the acquisition date. The following unaudited condensed pro forma financial information for the years ended December 31, 2013 and 2012, is presented as if the acquisition had been consummated on January 1, 2012:
Year Ended December 31, | |||||||
2013 | 2012 | ||||||
Pro Forma | |||||||
Revenues | $ | 23,760 | $ | 13,774 | |||
Net loss | (48,760 | ) | (78,651 | ) | |||
Net loss attributable to noncontrolling interest | 2,310 | 2,062 | |||||
Net loss attributable to Intrexon | (46,450 | ) | (76,589 | ) | |||
Accretion of dividends on redeemable convertible preferred stock | (18,391 | ) | (21,994 | ) | |||
Net loss attributable to common shareholders | (64,841 | ) | (98,583 | ) | |||
The pro forma net loss for the year ended December 31, 2013 excludes the $7,415 non-recurring gain on remeasurement of the Company’s previously held investment in AquaBounty. The pro forma net loss for the year ended December 31, 2012 includes this non-recurring gain on remeasurement.
On March 20, 2014, the Company acquired 19,040,366 additional shares of AquaBounty common stock for $10,000 in a private subscription offering, thereby increasing the Company’s aggregate ownership in AquaBounty to 59.85% upon closing.
See Note 6 for discussion of the Company’s ECC with AquaBounty.
F-21
BioPop
On October 1, 2013, the Company paid $1,300 to acquire 51% of the outstanding common stock of BioPop, and effective on that date, the Company began consolidating BioPop in its consolidated results of operations and financial position pursuant to ASC 805. In connection with the transaction, the Company recorded goodwill of $822 and intangible assets of $430. The intangible assets consist of acquired technology and are being amortized over the expected useful life of four years.
5. Investments in Joint Ventures
Intrexon Energy Partners
In March 2014, the Company and certain investors (the “Investors”), including an affiliate of Third Security, LLC (“Third Security”), entered into a Limited Liability Company Agreement which governs the affairs and conduct of business of Intrexon Energy Partners, a joint venture formed to optimize and scale-up the Company’s gas-to-liquid bioconversion platform for the production of certain fuels and lubricants. The Company also entered into an ECC with Intrexon Energy Partners providing exclusive rights to our technology for the use in bioconversion, as a result of which the Company received a technology access fee of $25,000 while retaining a 50% membership interest in Intrexon Energy Partners. The Investors made initial capital contributions, totaling $25,000 in the aggregate, in exchange for pro rata membership interests in Intrexon Energy Partners totaling 50%. In addition, the Company committed to make capital contributions of up to $25,000, and the Investors, as a group and pro rata in accordance with their respective membership interests in Intrexon Energy Partners, have committed to make additional capital contributions of up to $25,000, at the request of Intrexon Energy Partners’ Board of Managers (the “Intrexon Energy Partners Board”) and subject to certain limitations. As of December 31, 2014, the Company's remaining commitment was $23,625. The Company and the Investors have the right, but not the obligation, to make additional capital contributions above these limits when and if solicited by the Intrexon Energy Partners Board. Intrexon Energy Partners is governed by a board of managers which has five members. Two members of the board are designated by the Company and three members of the board are designated by a majority of the Investors.
See further discussion of the ECC at Note 6. See discussion of a concurrent private placement securities purchase made by the Investors at Note 14.
The Company’s investment in Intrexon Energy Partners was $(740) as of December 31, 2014 and is included in other accrued liabilities in the accompanying consolidated balance sheet.
OvaXon
In December 2013, the Company and OvaScience, Inc. ("OvaScience"), a life sciences company focused on the discovery, development and commercialization of new treatments for infertility, entered into a Limited Liability Company Agreement (“OvaXon LLC Agreement”) to form OvaXon, LLC ("OvaXon"), a joint venture to create new applications for improving human and animal health. Both the Company and OvaScience made an initial capital contribution of $1,500 in January 2014 for a 50% membership interest in OvaXon. OvaXon is governed by the OvaXon board of managers ("OvaXon Board") which has four members, two each from the Company and OvaScience. In cases in which the OvaXon Board determines that additional capital contributions are necessary in order for OvaXon to conduct business and comply with its obligations, each of the Company and OvaScience have the right, but not the obligation, to make additional capital contributions to OvaXon subject to the OvaXon LLC Agreement.
Contemporaneously with the formation of the joint venture, the Company entered into an ECC with OvaXon (see Note 6).
The Company’s investment in OvaXon was $(83) and $1,500 as of December 31, 2014 and 2013, respectively, and is included in other accrued liabilities and investments in affiliates, respectively, in the accompanying consolidated balance sheets.
S & I Ophthalmic
In September 2013, the Company entered into a Limited Liability Company Agreement (“Sun LLC Agreement”) with Caraco Pharmaceutical Laboratories, Ltd. ("Sun Pharmaceutical Subsidiary"), an indirect subsidiary of Sun Pharmaceutical Industries Ltd. ("Sun Pharmaceutical"), an international specialty pharmaceutical company focused on chronic diseases, to form S & I Ophthalmic, LLC ("S & I Ophthalmic"). The Sun LLC Agreement governs the affairs and the conduct of business of S & I Ophthalmic. S & I Ophthalmic leverages experience and technology from both the Company and Sun Pharmaceutical. Both the Company and Sun Pharmaceutical Subsidiary made an initial capital contribution of $5,000 in October 2013 for a 50% membership interest in S & I Ophthalmic. S & I Ophthalmic is governed by a board of managers ("S & I Ophthalmic Board") which has four members, two each from the Company and Sun Pharmaceutical Subsidiary. In cases in which the S & I
F-22
Ophthalmic Board determines that additional capital contributions are necessary in order for S & I Ophthalmic to conduct business and comply with its obligations, each of the Company and Sun Pharmaceutical Subsidiary have committed to making additional capital contributions to S & I Ophthalmic subject to certain limits defined in the agreement. Each has the right, but not the obligation, to make additional capital contributions above the defined limits when and if solicited by the S & I Ophthalmic Board.
Beginning on the seventh anniversary of the effective date of the Sun LLC Agreement, and upon the second anniversary thereafter, the Company, as well as Sun Pharmaceutical Subsidiary, may make a cash offer to purchase all of the other party’s interest in S & I Ophthalmic. Upon receipt of such an offer, the other party must either agree to tender its interests at the offered price or submit a counteroffer at a price higher than the original offer. Such offer and counteroffer may continue until one party agrees to the other’s price.
Contemporaneously with the formation of the joint venture, the Company entered into an ECC with S & I Ophthalmic (see Note 6).
The Company’s investment in S & I Ophthalmic was $3,220 and $4,784 as of December 31, 2014 and 2013, respectively, and is included in investments in affiliates in the accompanying consolidated balance sheets.
6. Collaboration Revenue
The Company’s collaborations provide for multiple deliverables to be delivered by the Company and typically include a license to the Company’s technology platforms, participation in collaboration committees, the performance of certain research and development services and may include obligations for certain manufacturing services. The Company groups these deliverables into two units of accounting based on the nature of the deliverables and the separation criteria. The first deliverable (“Unit of Accounting 1”) includes the license to the Company’s technology platform, the Company’s participation on the collaboration committees and any research and development services associated with its technology platforms. The deliverables for Unit of Accounting 1 are combined because they cannot be individually separated. The second deliverable (“Unit of Accounting 2”) includes manufacturing services to be provided for any Company materials in an approved product. These services have standalone value and are contingent due to uncertainties on whether an approved product will ever be developed thereby requiring manufacture by the Company at that time. As VSOE and third party evidence of selling price is not available or practical, the BESP for each unit of accounting is determined using a historical cost approach due to the early stage of development of the Company’s technology. In establishing BESP for Unit of Accounting 1, the Company uses the accumulated costs incurred as of the collaboration by the Company on its technology platform licensed to the collaborator to approximate the cost to recreate the deliverables included in this unit of accounting. All upfront consideration is allocated to Unit of Accounting 1. Unit of Accounting 2 is determined to be a contingent deliverable at the inception of the collaboration due to the uncertainties surrounding whether an approved product will ever be developed and require manufacturing by the Company. The upfront consideration allocated to Unit of Accounting 1 is recognized over the expected life of the Company’s technology platform using a straight-line approach.
The Company recognizes the reimbursement payments received for research and development services in the period when the services are performed and collection is reasonably assured. At the inception of each collaboration, the Company determines whether any milestone payments are substantive and can be recognized when earned in accordance with ASU 2010-17. The milestone payments are typically not considered substantive. Royalties related to product sales will be recognized when earned since payments relate directly to products that have been fully developed and for which the Company has satisfied all of its obligations.
The Company determines whether collaborations are individually significant for disclosure based on a number of factors, including total revenue recorded by the Company pursuant to the collaboration, collaborators either consolidated or accounted for using the equity method, or other qualitative factors. Collaboration revenues generated from consolidated subsidiaries are eliminated in consolidation. The following table summarizes the amounts recorded in the consolidated statements of operations for each significant collaboration for the years ended December 31, 2014, 2013 and 2012.
F-23
Year Ended December 31, 2014 | |||||||||||
Collaboration Revenue Recognized From | Total | ||||||||||
Upfront and Milestone Payments | Research and Development Services | ||||||||||
ZIOPHARM Oncology, Inc. | $ | 2,577 | $ | 12,044 | $ | 14,621 | |||||
Synthetic Biologics, Inc. | 651 | 273 | 924 | ||||||||
Oragenics, Inc. | 1,045 | 598 | 1,643 | ||||||||
Fibrocell Science, Inc. | 1,794 | 4,398 | 6,192 | ||||||||
Genopaver, LLC | 273 | 1,510 | 1,783 | ||||||||
S & I Ophthalmic, LLC | — | 2,832 | 2,832 | ||||||||
OvaXon, LLC | — | 2,799 | 2,799 | ||||||||
Intrexon Energy Partners, LLC | 1,875 | 4,227 | 6,102 | ||||||||
Other | 1,410 | 6,906 | 8,316 | ||||||||
Total | $ | 9,625 | $ | 35,587 | $ | 45,212 | |||||
Year Ended December 31, 2013 | |||||||||||
Collaboration Revenue Recognized From | Total | ||||||||||
Upfront and Milestone Payments | Research and Development Services | ||||||||||
ZIOPHARM Oncology, Inc. | $ | 2,577 | $ | 7,818 | $ | 10,395 | |||||
Synthetic Biologics, Inc. | 2,187 | 1,048 | 3,235 | ||||||||
Oragenics, Inc. | 673 | 1,517 | 2,190 | ||||||||
Fibrocell Science, Inc. | 970 | 3,736 | 4,706 | ||||||||
Genopaver, LLC | 204 | 935 | 1,139 | ||||||||
S & I Ophthalmic, LLC | — | 417 | 417 | ||||||||
Other | 333 | 1,110 | 1,443 | ||||||||
Total | $ | 6,944 | $ | 16,581 | $ | 23,525 | |||||
Year Ended December 31, 2012 | |||||||||||
Collaboration Revenue Recognized From | Total | ||||||||||
Upfront and Milestone Payments | Research and Development Services | ||||||||||
ZIOPHARM Oncology, Inc. | $ | 5,068 | $ | 6,333 | $ | 11,401 | |||||
Synthetic Biologics, Inc. | 293 | 327 | 620 | ||||||||
Oragenics, Inc. | 320 | 516 | 836 | ||||||||
Fibrocell Science, Inc. | 158 | 61 | 219 | ||||||||
Other | 12 | 618 | 630 | ||||||||
Total | $ | 5,851 | $ | 7,855 | $ | 13,706 | |||||
The following is a summary of the terms of the Company’s significant collaborations.
Ziopharm Collaboration
In January 2011, the Company entered into an ECC with Ziopharm, a related party. Pursuant to the ECC, Ziopharm received a license to the Company’s technology platform within the field of oncology as defined more specifically in the agreement. Upon execution of the ECC, the Company received 3,636,926 shares of Ziopharm’s common stock valued at $17,457 as upfront consideration. In addition to the deliverables discussed above, the Company transferred two clinical product candidates to Ziopharm that resulted in a separate unit of accounting for which $1,115 of the upfront consideration was allocated and recognized as collaboration revenue in 2011. The remaining $16,342 of upfront consideration was allocated to Unit of
F-24
Accounting 1 discussed above. The Company is entitled to additional shares of common stock representing the lesser of (i) the original shares received or (ii) the number of shares representing 7.495% of Ziopharm’s outstanding shares at the date of the dosing of the first patient in a Phase II clinical trial of a product candidate created, produced or developed by Ziopharm using the Company’s technology (“Ziopharm Milestone”). In October 2012, the Ziopharm Milestone was achieved and the Company received 3,636,926 shares of Ziopharm’s common stock valued at $18,330 as milestone consideration. Since the Ziopharm Milestone was not substantive, the Company allocated the Ziopharm Milestone to the applicable units of accounting and is recognizing it in a manner similar to these units of accounting. The remaining balance of deferred revenue associated with upfront and milestone payments was $23,193 and $25,770 at December 31, 2014 and 2013, respectively. The Company receives reimbursement payments for research and development services provided and manufacturing services for Company materials provided to Ziopharm during the ECC. Subject to certain expense allocations, Ziopharm will pay the Company 50% of the quarterly net profits derived from the sale of products developed from the ECC, as defined in the agreement. Ziopharm is responsible for conducting preclinical and clinical development of product candidates, as well as for other aspects of commercialization or manufacturing of product candidates. The term of the ECC commenced in January 2011 and continues until terminated pursuant to the ECC agreement. The ECC may be terminated by either party in the event of certain material breaches defined in the agreement and may be terminated voluntarily by Ziopharm upon 90 days written notice to the Company.
See Note 17 for additional transactions with Ziopharm.
Synthetic Biologics, Inc. Collaborations
In November 2011, the Company entered into an ECC with Synthetic Biologics, Inc. (“Synthetic Biologics”), a publicly traded company focused on the development of innovative disease-modifying medicines for serious illnesses and a related party. Pursuant to the ECC, at the transaction effective date, Synthetic Biologics received a license to the Company’s technology platform within a designated field (“Field One”). Upon execution of the ECC, the Company received 3,123,558 shares of Synthetic Biologics’ common stock valued at $1,687 as upfront consideration. On April 16, 2013, the Company terminated its ECC with Synthetic Biologics in Field One. As a result of this termination, all licenses granted by the Company under the ECC for use in Field One reverted back to the Company and the Company recognized the balance of deferred revenue associated with the upfront consideration as collaboration revenue in April 2013.
In August 2012, the Company entered into its second ECC with Synthetic Biologics. Pursuant to this ECC, at the transaction effective date, Synthetic Biologics received a license to the Company’s technology platform within a second designated field (“Field Two”). Upon Synthetic Biologics’ shareholders’ approval in October 2012, the Company received a technology access fee of 3,552,210 shares of Synthetic Biologics common stock valued at $7,815 as upfront consideration. Upon the filing by Synthetic Biologics of an investigational new drug application with the U.S. Food and Drug Administration ("U.S. FDA"), the Company will receive cash or common stock at the option of Synthetic Biologics valued at $2,000. Upon the first to occur of either the first commercial sale of a product developed under the ECC or the granting of regulatory approval of a product developed under the ECC, the Company will receive cash or common stock at the option of Synthetic Biologics valued at $3,000. The remaining balance of deferred revenue associated with upfront and milestone payments was $6,349 and $7,000 at December 31, 2014 and 2013, respectively. The Company receives reimbursement payments for research and development services provided pursuant to the agreement and manufacturing services for preclinical Company materials provided to Synthetic Biologics during the ECC. The Company has the option to propose, and Synthetic Biologics can select, the Company to be the bulk manufacturer of products developed from the ECC. On a quarterly basis, Synthetic Biologics will pay the Company royalties with percentages ranging from upper-single digits to lower double digits of net sales of products developed from the ECC, as defined in the agreement. Synthetic Biologics is responsible for conducting preclinical and clinical development of product candidates, as well as for other aspects of commercialization and manufacturing of the product candidates. The term of the ECC commenced in August 2012 and continues until terminated pursuant to the ECC agreement. The ECC may be terminated by either party in the event of certain material breaches defined in the agreement and may be terminated voluntarily by Synthetic Biologics upon 90 days written notice to the Company.
In December 2012, the Company received $2,500 from Synthetic Biologics as a prepayment of research and development services to be provided in conjunction with either of the two ECCs. The Company recorded this amount as deferred revenue and recognizes collaboration revenue as services are performed. Any remaining balance of this prepayment is refundable to Synthetic Biologics in the event both ECCs are terminated.
See Note 17 for further discussion related to Synthetic Biologics.
F-25
Oragenics Collaborations
In June 2012, the Company entered into an ECC with Oragenics, a publicly traded company focused on becoming the world leader in novel antibiotics against infectious diseases and probiotics for oral health for humans and pets and a related party. Pursuant to the ECC, at the transaction effective date, Oragenics received a license to the Company’s technology platform within the field of lantibiotics for the treatment of infectious diseases in humans and companion animals as defined more specifically in the agreement. Upon execution of the ECC, the Company received a technology access fee of 4,392,425 shares of Oragenics’ common stock valued at $6,588 as upfront consideration. The Company is entitled to receive additional shares of common stock, or at Oragenics’ option, receive a cash payment based upon the fair market value of the shares, upon the separate achievement of certain regulatory milestones of the first product candidate developed from the ECC (“Oragenics ECC 1 Milestones”). The Oragenics ECC 1 Milestones include: (i) 1% of Oragenics’ outstanding shares as defined in the ECC agreement at the date of the filing of the first Investigative New Drug Application with the U.S. FDA for a product candidate created, produced or developed using the Company’s technology (“Oragenics ECC 1 Product”); (ii) 1.5% of Oragenics’ outstanding shares as defined in the ECC agreement at the date of the dosing of the first patient in the first Phase II clinical trial of an Oragenics ECC 1 Product; (iii) 2% of Oragenics’ outstanding shares as defined in the ECC agreement at the date of the dosing of the first patient in the first Phase III clinical trial of an Oragenics ECC 1 Product; (iv) 2.5% of Oragenics’ outstanding shares as defined in the ECC agreement at the date of the first New Drug Application or Biologics License Application with the U.S. FDA for an Oragenics ECC 1 Product, or alternatively the first equivalent regulatory filing with a foreign agency; and (v) 3% of Oragenics’ outstanding shares as defined in the ECC agreement at the date of the granting of the first regulatory approval of an Oragenics ECC 1 Product. The remaining balance of deferred revenue associated with upfront and milestone payments was $5,171 and $5,720 at December 31, 2014 and 2013, respectively. The Company receives reimbursement payments for research and development services provided pursuant to the agreement during the ECC and manufacturing services for Company materials provided to Oragenics during the ECC. Oragenics will pay the Company 25% of the quarterly profits derived from the sale of products developed from the ECC, as defined in the agreement.
Oragenics is responsible for funding the further development of lantibiotics toward the goal of commercialization, conducting preclinical and clinical development of product candidates, as well as for other aspects of commercialization or manufacturing of the product candidates. The term of the ECC commenced in June 2012 and continues until terminated pursuant to the ECC agreement. The ECC may be terminated by either party in the event of certain material breaches defined in the agreement and may be terminated voluntarily by Oragenics upon 90 days written notice to the Company.
In September 2013, the Company entered into its second ECC with Oragenics (“ECC 2”). Pursuant to ECC 2, at the transaction effective date, Oragenics received a license to the Company’s technology platform to develop and commercialize probiotics, specifically the direct administration to humans of genetically modified probiotics for the treatment of diseases of the oral cavity, throat, sinus and esophagus as defined more specifically in the agreement. Upon execution of ECC 2, the Company received a technology access fee of 1,348,000 shares of Oragenics’ common stock valued at $3,503 and a $1,956 convertible promissory note maturing on or before December 31, 2013 as upfront consideration. Prior to the maturity date, Oragenics had the right to convert the promissory note into shares of Oragenics’ common stock subject to its shareholders’ approval. The conversion price is equal to the closing price of Oragenics’ common stock on the last trading day immediately prior to the date of conversion. On December 18, 2013, Oragenics converted the promissory note into 698,241 shares of Oragenics’ common stock. The Company is entitled to receive additional shares of common stock, or at Oragenics’ option, receive a cash payment based upon the fair market value of the shares, upon the first instance of attainment of certain commercialization milestones of a product candidate developed from ECC 2 (“Oragenics ECC 2 Milestones”). The Oragenics ECC 2 Milestones include: (i) $2,000 within thirty days of the first instance of the achievement of the first dosing of a patient in a phase II clinical trial for an Oragenics product developed from ECC 2 (“Oragenics ECC 2 Product”); (ii) $5,000 within thirty days of the first instance of the achievement of the meeting of the primary endpoint in a phase III clinical trial for an Oragenics ECC 2 Product; and (iii) $10,000 within thirty days of the first instance of the achievement of the first to occur of (a) the first commercial sale of an Oragenics ECC 2 Product anywhere in the world, or (b) the regulatory approval for an Oragenics ECC 2 Product. The remaining balance of deferred revenue associated with upfront and milestone payments was $4,839 and $5,335 at December 31, 2014 and 2013, respectively. The Company receives reimbursement payments for research and development services provided pursuant to the agreement during the ECC and manufacturing services for Company materials provided to Oragenics during ECC 2. Oragenics will pay the Company 10% of the net sales derived from the sale of products developed from ECC 2, as defined in the agreement.
Oragenics is responsible for funding the further development of probiotics toward the goal of commercialization, conducting preclinical and clinical development of product candidates, as well as for other aspects of commercialization or manufacturing of the product candidates. The term of ECC 2 commenced in September 2013 and continues until terminated pursuant to ECC 2. ECC 2 may be terminated by either party in the event of certain material breaches defined in the agreement and may be terminated voluntarily by Oragenics upon 90 days written notice to the Company.
F-26
See Note 17 for additional arrangements with Oragenics.
Fibrocell Science, Inc. Collaboration
In October 2012, the Company entered into an ECC with Fibrocell Science, Inc. (“Fibrocell”), a publicly traded, autologous cellular therapeutic company focused on the development of innovative products for aesthetic, medical and scientific applications and a related party. Pursuant to the ECC, at the transaction effective date, Fibrocell received a license to the Company’s technology platform to develop and commercialize genetically modified and non-genetically modified autologous fibroblasts and autologous dermal cells in the United States of America. Upon execution of the ECC, the Company received a technology access fee of 1,317,520 shares of Fibrocell’s common stock valued at $7,576 as upfront consideration. The number of shares received reflects a 1-for-25 reverse stock split of Fibrocell’s common stock effective April 30, 2013. The Company receives reimbursement payments for research and development services provided pursuant to the agreement during the ECC and manufacturing services for Company materials provided to Fibrocell during the ECC. On a quarterly basis, Fibrocell will pay the Company royalties of 7% of net sales up to $25,000 and 14% of net sales above $25,000 on each product developed from the ECC, as defined in the agreement. If Fibrocell uses the Company’s technology platform to improve the production of a current or new Fibrocell product not developed from the ECC, Fibrocell will pay the Company a quarterly royalty equal to 33% of the cost of goods sold savings generated by the improvement, as defined in the agreement. Fibrocell is responsible for conducting preclinical and clinical development of product candidates, as well as for other aspects of commercialization and manufacturing of the product candidates. The term of the ECC commenced in October 2012 and continues until terminated pursuant to the ECC agreement. The ECC may be terminated by either party in the event of certain material breaches defined in the agreement and may be terminated voluntarily by Fibrocell upon 90 days written notice to the Company.
In June 2013, the Company entered into an amendment to the ECC with Fibrocell. The amendment expands the field of use defined in the ECC agreement. Under the terms of the amendment to the ECC, the Company received 1,243,781 shares of Fibrocell’s common stock valued at $7,612 as a supplemental technology access fee. The Company allocated this additional consideration to the appropriate unit of accounting and is recognizing it consistent with the unit of accounting.
In January 2014, the Company entered into a second amendment to the ECC with Fibrocell. The second amendment further expanded the field of use defined in the ECC agreement. Under the terms of the second amendment to the ECC, the Company received 1,024,590 shares of Fibrocell’s common stock valued at $5,225 as a technology access fee. The Company allocated this additional consideration to the appropriate unit of accounting and is recognizing it consistent with the unit of accounting. The remaining balance of deferred revenue associated with upfront and milestone payments was $17,491 and $14,060 at December 31, 2014 and 2013, respectively.
See Note 17 for further discussion related to Fibrocell.
Genopaver Collaboration
In March 2013, the Company entered into an ECC with Genopaver, an affiliate of Third Security (Note 17) and a related party. Genopaver was formed for the purpose of entering into the ECC and developing and commercializing products in the field of the fermentative production of alkaloids through genetically modified cell-lines and substrate feeds for use as active pharmaceutical ingredients or as commercially sold intermediates in the manufacture of active pharmaceutical ingredients. Upon execution of the ECC, the Company received a technology access fee of $3,000 as upfront consideration. The remaining balance of deferred revenue associated with upfront and milestone payments was $2,523 and $2,796 at December 31, 2014 and 2013, respectively. The Company receives reimbursement payments for research and development services provided pursuant to the agreement during the ECC. Genopaver will pay the Company a royalty as a percentage in the lower-double digits on the quarterly gross profits of product sales from products developed under the ECC, as defined in the agreement. Genopaver is responsible for the development and commercialization of the product candidates. The term of the ECC commenced in March 2013 and continues until terminated pursuant to the ECC agreement. The ECC may be terminated by either party in the event of certain material breaches defined in the agreement and may be terminated voluntarily by Genopaver upon 90 days written notice to the Company.
AquaBounty Collaboration
In February 2013, the Company entered into an ECC with AquaBounty, a majority-owned consolidated subsidiary. The Company will be reimbursed for research and development services as provided for in the ECC agreement. In the event of product sales from a product developed from the ECC, the Company will receive 16.66% of quarterly gross profits for each product, as defined in the agreement. All revenues and expenses related to this ECC are eliminated in consolidation (Note 4).
F-27
S & I Ophthalmic Collaboration
In September 2013, the Company entered into an ECC with S & I Ophthalmic, a joint venture between the Company and Sun Pharmaceutical Subsidiary, an indirect subsidiary of Sun Pharmaceutical, an international specialty pharmaceutical company focused on chronic diseases (Note 5) and a related party. The ECC grants S & I Ophthalmic an exclusive license to the Company’s technology platform to develop and commercialize therapies in humans for the treatment of ocular diseases defined more specifically in the agreement. The Company will be reimbursed for research and development services pursuant to the agreement and manufacturing services for Company materials provided to S & I Ophthalmic during the ECC. Subject to certain expense allocations, S & I Ophthalmic will pay the Company royalties with percentages ranging from mid-single digits and above of the net sales derived from the sale of products developed under the ECC, as defined in the agreement. The term of the ECC commenced in September 2013 and continues until terminated by either party in the event of certain material breaches defined in the agreement and may be terminated voluntarily by S & I Ophthalmic upon 90 days written notice to the Company.
BioPop Collaboration
In October 2013, the Company entered into an ECC with BioPop, a majority-owned consolidated subsidiary. The ECC grants BioPop an exclusive license to the Company’s technology platform to develop and commercialize artwork, children’s toys and novelty goods that are derived from living organisms or are enabled by synthetic biology. The Company will be reimbursed for research and development services and manufacturing services as provided for in the ECC agreement. The Company is entitled to royalties in the mid-single digits as a percentage of the net product sales of a product developed under the ECC, as defined in the agreement. All revenues and expenses related to this ECC are eliminated in consolidation (Note 4).
OvaXon Collaboration
In December 2013, the Company entered into an ECC with OvaXon, the joint venture between the Company and OvaScience, a life sciences company focused on infertility treatments (Note 5) and a related party. The ECC grants OvaXon an exclusive license to the Company’s technology platform to create new applications for improving human and animal health. OvaScience also licensed certain technology to OvaXon pursuant to a separate license agreement. The Company will be reimbursed for research and development services and manufacturing services as provided for in the ECC agreement. The term of the ECC commenced in December 2013 and continues until terminated by either party in the event of certain material breaches defined in the agreement and may be terminated voluntarily by OvaXon upon 90 days written notice to the Company.
Intrexon Energy Partners Collaboration
In March 2014, the Company entered into an ECC with Intrexon Energy Partners, a joint venture between the Company and certain investors, including an affiliate of Third Security (Note 5), and a related party. The ECC grants Intrexon Energy Partners an exclusive license to the Company’s technology platform to optimize and scale-up the Company’s gas-to-liquid bioconversion platform for the production of certain fuels and lubricants. Upon execution of the ECC, the Company received a technology access fee of $25,000 as upfront consideration. The remaining balance of deferred revenue associated with upfront and milestone payments was $23,125 at December 31, 2014. The Company will be reimbursed for research and development services as provided for in the ECC agreement. The term of the ECC commenced in March 2014 and continues until March 2034 unless terminated prior to that date by either party in the event of certain material breaches defined in the agreement and may be terminated voluntarily by Intrexon Energy Partners upon 90 days written notice to the Company.
Persea Bio Collaboration
In December 2014, the Company entered into an ECC with Persea Bio, an affiliate of Third Security (Note 17) and a related party. Persea Bio was formed for the purpose of entering into the ECC and developing and commercializing a food program, as defined in the agreement. Upon effectiveness of the ECC, the Company was entitled to receive a technology access fee of $5,000 as upfront consideration within ten business days. The Company collected this $5,000 in January 2015. The full amount of the upfront consideration was deferred at December 31, 2014. The Company receives reimbursement payments for research and development services provided pursuant to the agreement during the ECC. Persea Bio will pay the Company a royalty as a percentage in the lower-double digits on the quarterly gross profits of product sales from products derived from the ECC, as defined in the agreement. Persea Bio is responsible for the development and commercialization of the product candidates. The term of the ECC commenced in December 2014 and continues until terminated by either party in the event of certain material breaches defined in the agreement and may be terminated voluntarily by Persea Bio upon 90 days written notice to the Company.
F-28
Deferred Revenue
Deferred revenue primarily consists of consideration received for upfront and milestone payments in connection with the Company’s collaborations, prepayments for research and development services performed for collaborators and prepayments for product and service revenues. Deferred revenue consists of the following:
December 31, | |||||||
2014 | 2013 | ||||||
Upfront and milestone payments | $ | 107,228 | $ | 72,207 | |||
Prepaid research and development services | 1,045 | 1,319 | |||||
Prepaid product and service revenues | 4,365 | — | |||||
Other | 571 | 45 | |||||
Total | $ | 113,209 | $ | 73,571 | |||
Current portion of deferred revenue | 16,522 | 7,793 | |||||
Long-term portion of deferred revenue | 96,687 | 65,778 | |||||
Total | $ | 113,209 | $ | 73,571 | |||
7. Short-term and Long-term Investments
The Company’s investments are classified as available-for-sale. The following table summarizes the amortized cost, gross unrealized gains and losses and fair value of available-for-sale investments as of December 31, 2014:
Amortized Cost | Gross Unrealized Gains | Gross Unrealized Losses | Aggregate Fair Value | ||||||||||||
U.S. government debt securities | $ | 115,293 | $ | 54 | $ | (12 | ) | $ | 115,335 | ||||||
Certificates of deposit | 273 | — | — | 273 | |||||||||||
Total | $ | 115,566 | $ | 54 | $ | (12 | ) | $ | 115,608 | ||||||
The following table summarizes the amortized cost, gross unrealized gains and losses and fair value of available-for-sale investments as of December 31, 2013:
Amortized Cost | Gross Unrealized Gains | Gross Unrealized Losses | Aggregate Fair Value | ||||||||||||
U.S. government debt securities | $ | 178,277 | $ | 35 | $ | (13 | ) | $ | 178,299 | ||||||
Commercial paper | 7,997 | — | — | 7,997 | |||||||||||
Certificates of deposit | 2,266 | — | (1 | ) | 2,265 | ||||||||||
Total | $ | 188,540 | $ | 35 | $ | (14 | ) | $ | 188,561 | ||||||
For more information on the Company’s method for determining the fair value of its assets, see Note 2 – “Fair Value of Financial Instruments”.
The estimated fair value of available-for-sale investments classified by their contractual maturities as of December 31, 2014 was:
Due within one year | $ | 88,495 | |
After one year through two years | 27,113 | ||
Total | $ | 115,608 | |
Changes in market interest rates and bond yields cause certain investments to fall below their cost basis, resulting in unrealized losses on investments. The unrealized losses of the Company’s investments were primarily the result of unfavorable changes in interest rates subsequent to the initial purchase of these investments and have been in a loss position for less than 12 months.
F-29
As of December 31, 2014 and 2013, the Company did not consider any of its investments to be other-than-temporarily impaired. When evaluating its investments for other-than-temporary impairment, the Company reviews factors such as the length of time and extent to which fair value has been below its cost basis, the financial condition of the issuer, the Company’s ability and intent to hold the security and whether it is more likely than not that it will be required to sell the investment before recovery of its cost basis.
8. Fair Value Measurements
The carrying amount of cash and cash equivalents, receivables, prepaid expenses and other current assets, accounts payable, accrued compensation and benefits, other accrued liabilities, and related party payables approximate fair value due to the short maturity of these instruments.
The following table presents the placement in the fair value hierarchy of financial assets that are measured at fair value on a recurring basis, including the items for which the fair value option has been elected, at December 31, 2014:
Quoted Prices in Active Markets (Level 1) | Significant Other Observable Inputs (Level 2) | Significant Unobservable Inputs (Level 3) | December 31, 2014 | ||||||||||||
Assets | |||||||||||||||
U.S. government debt securities (Note 7) | $ | — | $ | 115,335 | $ | — | $ | 115,335 | |||||||
Certificates of deposit (Note 7) | — | 273 | — | 273 | |||||||||||
Equity securities (Note 6) | 143,927 | 20,962 | — | 164,889 | |||||||||||
$ | 143,927 | $ | 136,570 | $ | — | $ | 280,497 | ||||||||
The following table presents the placement in the fair value hierarchy of financial assets that are measured at fair value on a recurring basis, including the items for which the fair value option has been elected, at December 31, 2013:
Quoted Prices in Active Markets (Level 1) | Significant Other Observable Inputs (Level 2) | Significant Unobservable Inputs (Level 3) | December 31, 2013 | ||||||||||||
Assets | |||||||||||||||
U.S. government debt securities (Note 7) | $ | — | $ | 178,299 | $ | — | $ | 178,299 | |||||||
Commercial paper (Note 7) | — | 7,997 | — | 7,997 | |||||||||||
Certificates of deposit (Note 7) | — | 2,265 | — | 2,265 | |||||||||||
Equity securities (Note 6) | 110,297 | 31,228 | — | 141,525 | |||||||||||
$ | 110,297 | $ | 219,789 | $ | — | $ | 330,086 | ||||||||
Financial liabilities measured on a recurring basis were not significant at December 31, 2014 and 2013.
The method used to estimate the fair value of the Level 1 assets in the tables above is based on observable market data as these equity securities are publicly-traded. The method used to estimate the fair value of the Level 2 short-term and long-term investments in the tables above is based on professional pricing sources for identical or comparable instruments, rather than direct observations of quote prices in active markets. The method used to estimate the fair value of the Level 2 equity securities in the tables above is based on the quoted market price of the publicly-traded security, adjusted for a discount for lack of marketability.
There were no transfers between levels of the fair value hierarchy in the years ended December 31, 2014 and 2013.
F-30
9. Inventory
Inventory consists of the following:
December 31, 2014 | |||
Supplies, semen and embryos | $ | 1,184 | |
Work in process | 5,637 | ||
Livestock | 16,996 | ||
Feed | 1,972 | ||
Total inventory | $ | 25,789 | |
10. Property, Plant and Equipment, net
Property, plant and equipment consist of the following:
December 31, | |||||||
2014 | 2013 | ||||||
Land and land improvements | $ | 7,565 | $ | 55 | |||
Buildings and building improvements | 7,265 | 945 | |||||
Furniture and fixtures | 1,236 | 876 | |||||
Equipment | 31,983 | 22,275 | |||||
Leasehold improvements | 6,382 | 5,147 | |||||
Computer hardware and software | 5,060 | 4,294 | |||||
Construction in progress | 1,002 | 314 | |||||
60,493 | 33,906 | ||||||
Less: Accumulated depreciation and amortization | (22,493 | ) | (17,277 | ) | |||
Property, plant and equipment, net | $ | 38,000 | $ | 16,629 | |||
Depreciation expense was $6,178, $4,325 and $4,957 for the years ended December 31, 2014, 2013 and 2012, respectively.
11. Goodwill and Intangible Assets, net
The changes in the carrying amount of goodwill for the years ended December 31, 2014 and 2013, are as follows:
Balance as of December 31, 2012 | $ | — | |
Acquisitions | 13,823 | ||
Balance as of December 31, 2013 | 13,823 | ||
Acquisitions | 87,236 | ||
Balance as of December 31, 2014 | $ | 101,059 | |
No goodwill or accumulated impairment losses existed as of December 31, 2014 and 2013.
F-31
Intangible assets consist of the following at December 31, 2014:
Gross Carrying Amount | Accumulated Amortization | Net | |||||||||
Patents, related technologies and know-how | $ | 41,872 | $ | (10,849 | ) | $ | 31,023 | ||||
Customer relationships | 10,700 | (806 | ) | 9,894 | |||||||
Trademarks | 5,900 | (298 | ) | 5,602 | |||||||
In-process research and development | 19,428 | — | 19,428 | ||||||||
Total | $ | 77,900 | $ | (11,953 | ) | $ | 65,947 | ||||
Intangible assets consist of the following at December 31, 2013:
Gross Carrying Amount | Accumulated Amortization | Net | |||||||||
Patents, related technologies and know-how | $ | 34,772 | $ | (7,716 | ) | $ | 27,056 | ||||
In-process research and development | 14,900 | — | 14,900 | ||||||||
Total | $ | 49,672 | $ | (7,716 | ) | $ | 41,956 | ||||
Amortization expense was $4,237, $2,880 and $3,027 for the years ended December 31, 2014, 2013 and 2012, respectively. At December 31, 2014, the weighted average useful life for patents, related technologies and know-how; customer relationships; and trademarks was 11.5 years, 6.5 years, and 8.4 years, respectively. Total amortization expense is estimated to be $6,321 for each year from 2015 through 2016, $6,072 for 2017, $5,462 for 2018, $5,139 for 2019, and $17,204 for the cumulative period thereafter.
12. Lines of Credit and Long Term Debt
Lines of Credit
Trans Ova has a $10,000 revolving line of credit with First National Bank of Omaha which matures on May 1, 2015. The line of credit bears interest at the greater of 2.95% above the London Interbank Offered Rate or 3.00% and was 3.12% at December 31, 2014. As of December 31, 2014, there was an outstanding balance of $1,728. The amount available under the line of credit is based on the greater of eligible accounts receivable and inventory or the maximum line of credit amount. As of December 31, 2014, the amount available under the line of credit was $8,272.
Trans Ova's revolving line of credit is collateralized by certain of its assets and contain certain restricted covenants that include maintaining minimum tangible net worth, maximum allowable annual capital expenditures and working capital. Trans Ova was in compliance with these covenants as of December 31, 2014.
Exemplar has a $700 revolving line of credit with American State Bank which matures on November 1, 2015. The line of credit bears interest at 4.50% per annum. As of December 31, 2014, there was an outstanding balance of $545. As of December 31, 2014, the amount available under the line of credit was $155.
Long Term Debt
Long term debt consists of the following:
December 31, | |||||||
2014 | 2013 | ||||||
Notes payable | $ | 7,653 | $ | — | |||
Royalty-based financing | 1,926 | 1,653 | |||||
Other | 790 | — | |||||
Long term debt | 10,369 | 1,653 | |||||
Less current portion | 1,675 | — | |||||
Long term debt, less current portion | $ | 8,694 | $ | 1,653 | |||
F-32
Trans Ova has a note payable with American State Bank which matures in April 2033 and has an outstanding principal balance of $5,952 as of December 31, 2014. Trans Ova pays monthly installments of $39, which includes interest at 3.95%. The note payable is collateralized by all of Trans Ova's assets.
Trans Ova has a note payable with the Iowa Economic Development Authority which matures in July 2016 and has an outstanding principal balance of $1,099 as of December 31, 2014. Trans Ova pays quarterly installments of $183. The note payable is collateralized by certain of Trans Ova's real estate.
Exemplar has notes payable with outstanding principal balances totaling $602 as of December 31, 2014. Exemplar pays monthly installments ranging from $1 to $4 with interest rates ranging from 0% to 3.00%. These notes mature from September 2018 to May 2020 and are collateralized by certain of Exemplar's real estate or letters of credit of certain of its members.
AquaBounty has a royalty-based financing grant from the Atlantic Canada Opportunities Agency ("ACOA"), a Canadian government agency, to provide funding of a research and development project. The total amount available under the award is $2,470, which AquaBounty can claim over a five year period. All amounts claimed by AquaBounty must be repaid in the form of a 10% royalty on any products commercialized out of this research and development project until fully paid. Because the timing of commercialization is subject to regulatory approval, the timing of repayment is uncertain. As of the acquisition date, AquaBounty had claimed $1,952 of the available funds and this amount was recorded at its acquisition date fair value of $1,107 (Note 4). The Company accretes the difference of $845 between the face value of amounts drawn and the acquisition date fair value over the expected period of repayment. Since the acquisition date and through December 31, 2014, AquaBounty has made subsequent claims of $767 resulting in total long term debt of $1,926 as of December 31, 2014.
Future maturities of long term debt are as follows:
2015 | $ | 1,675 | |
2016 | 894 | ||
2017 | 363 | ||
2018 | 360 | ||
2019 | 336 | ||
Thereafter | 4,815 | ||
Total | $ | 8,443 | |
The AquaBounty royalty-based financing grant is not included in the table above due to the uncertainty of the timing of repayment.
13. Income Taxes
For the year ended December 31, 2014, domestic loss before income taxes totaled $83,256, while foreign loss before income taxes totaled $2,463. For the year ended December 31, 2013, domestic loss before income taxes totaled $39,250, while foreign loss before income taxes totaled $1,658. For the year ended December 31, 2012, loss before income taxes was solely domestic. The Company recognized a current tax benefit of $103 in a foreign jurisdiction during the year ended December 31, 2014. There is no deferred income tax benefit recognized for the year ended December 31, 2014, nor current or deferred income tax benefits recognized for the years ended December 31, 2013 and 2012 due to the Company’s and its subsidiaries’ histories of net losses combined with an inability to confirm recovery of the tax benefits of the Company’s and its subsidiaries’ losses and other net deferred tax assets. Income tax benefit for the years ended December 31, 2014, 2013 and 2012 differed from amounts computed by applying the applicable U.S. federal corporate income tax rate of 34% to loss before income taxes as a result of the following:
F-33
2014 | 2013 | 2012 | |||||||||
Computed statutory income tax benefit | $ | (29,144 | ) | $ | (13,909 | ) | $ | (27,837 | ) | ||
Increase in income tax benefit resulting from State income tax benefit, net of federal income taxes | (3,544 | ) | (1,834 | ) | (3,711 | ) | |||||
Nondeductible stock based compensation | 1,386 | 575 | 333 | ||||||||
Contribution of services by shareholder | 677 | 527 | 527 | ||||||||
Gain in previously held equity investment | — | (2,477 | ) | — | |||||||
Research and development tax credits | 258 | (1,203 | ) | — | |||||||
Other, net | 1,503 | 1,317 | (238 | ) | |||||||
(28,864 | ) | (17,004 | ) | (30,926 | ) | ||||||
Change in valuation allowance for deferred tax assets | 28,761 | 17,004 | 30,926 | ||||||||
Total income tax provision | $ | (103 | ) | $ | — | $ | — | ||||
The tax effects of temporary differences that comprise the deferred tax assets and liabilities at December 31, 2014 and 2013, are as follows:
2014 | 2013 | ||||||
Deferred tax assets | |||||||
Allowance for doubtful accounts | $ | 783 | $ | — | |||
Equity securities | 4,694 | 415 | |||||
Property, plant and equipment | 79 | — | |||||
Accrued liabilities and long-term debt | 2,703 | 1,445 | |||||
Stock-based compensation | 8,283 | 1,677 | |||||
Deferred revenue | 43,774 | 28,456 | |||||
Research and development tax credits | 9,661 | 10,062 | |||||
Net operating loss carryforwards | 103,114 | 97,395 | |||||
Total deferred tax assets | 173,091 | 139,450 | |||||
Less: Valuation allowance | 161,660 | 131,985 | |||||
Net deferred tax assets | 11,431 | 7,465 | |||||
Deferred tax liabilities | |||||||
Property, plant and equipment | — | 140 | |||||
Intangible assets | 11,431 | 7,325 | |||||
Total deferred tax liabilities | 11,431 | 7,465 | |||||
Net deferred tax assets (liabilities) | $ | — | $ | — | |||
Activity within the valuation allowance for deferred tax assets during the years ended December 31, 2014, 2013 and 2012 was as follows:
2014 | 2013 | 2012 | |||||||||
Valuation allowance at beginning of year | $ | 131,985 | $ | 113,051 | $ | 82,125 | |||||
Increase in valuation allowance as a result of | |||||||||||
Mergers and acquisitions, net | 914 | 1,930 | — | ||||||||
Current year operations | 28,761 | 17,004 | 30,926 | ||||||||
Valuation allowance at end of year | $ | 161,660 | $ | 131,985 | $ | 113,051 | |||||
In assessing the realizability of deferred tax assets, management considers whether it is more likely than not that some portion or all of the deferred tax assets will not be realized. The ultimate realization of deferred tax assets is dependent upon the generation of future taxable income during the periods in which those temporary differences become deductible. Management considers the scheduled reversal of deferred tax liabilities, projected future taxable income and tax planning strategies in making this assessment. Due to the Company and its subsidiaries’ histories of net losses incurred from inception, no income tax benefit has been recorded and the corresponding deferred tax assets have been fully reserved as the Company and its subsidiaries cannot sufficiently be assured that these deferred tax assets will be realized in accordance with the provisions of
F-34
ASC 740. The components of the deferred tax assets and liabilities as of the date of the mergers and acquisitions by the Company prior to consideration of the valuation allowance are substantially similar to the components of deferred tax assets presented herein.
The American Taxpayer Relief Act of 2012, which retroactively reinstated the federal research and development tax credit for 2012, was not enacted into law until January 2013. Therefore, the deferred tax asset and corresponding increase in the valuation allowance for the amount of the tax credit generated in 2012 are reflected in 2013 for financial statement purposes.
The Company’s past issuances of stock and mergers and acquisitions have resulted in ownership changes as defined in Section 382 of the Internal Revenue Code of 1986. As a result, utilization of portions of the net operating losses may be subject to annual limitations. As of December 31, 2014, approximately $16,400 of the Company’s net operating losses generated prior to 2008 are limited by Section 382 to annual usage limits of approximately $1,500. As of December 31, 2014, approximately $19,100 of the Company’s net operating losses were inherited via acquisition and are limited based on the value of the target at the time of the transaction.
At December 31, 2014, the Company has loss carryforwards for federal income tax purposes of approximately $254,528 available to offset future taxable income and federal and state research and development tax credits of $6,770, prior to consideration of annual limitations that may be imposed under Section 382. These carryforwards will begin to expire in 2022. Of these loss carryforwards, $8,856 relate to benefits from stock compensation deductions that will be recorded as a component of paid-in capital when realized. The Company's direct foreign subsidiary has foreign loss carryforwards of approximately $11,800 that do not expire.
The Company does not record deferred taxes on the undistributed earnings of its direct foreign subsidiary because it does not expect the temporary differences related to those unremitted earnings to reverse in the foreseeable future. At December 31, 2014, the Company’s direct foreign subsidiary had accumulated earnings of approximately $196. Future distributions of accumulated earnings of the Company’s direct foreign subsidiary may be subject to U.S. income and foreign withholding taxes.
The Company does not file a consolidated income tax return with AquaBounty or BioPop. At December 31, 2014, AquaBounty has loss carryforwards for federal and foreign income tax purposes of approximately $12,500 and $4,600, respectively, available to offset future taxable income and foreign research and development tax credits of $2,600, prior to consideration of annual limitations that may be imposed under Section 382 or analogous foreign provisions. These carryforwards will begin to expire in 2018. As a result of the Company’s ownership in AquaBounty passing 50% in 2013, an annual Section 382 of approximately $900 per year will apply to losses and credits carried forward by AquaBounty from prior years, which are also subject to prior Section 382 limitations. At December 31, 2014, BioPop had an insignificant amount of loss carryforwards for federal income tax purposes available to offset future taxable income.
The Company and its subsidiaries apply provisions related to the accounting for uncertain income tax positions in ASC 740-10. The Company and its subsidiaries do not have material unrecognized tax benefits as of December 31, 2014. The Company does not anticipate significant changes in the amount of unrecognized tax benefits in the next 12 months. The Company’s tax returns for years 2004 and forward are subject to examination by federal or state tax authorities due to the carryforward of unutilized net operating losses and research and development tax credits.
F-35
14. Redeemable Convertible Preferred Stock and Shareholders’ Equity
Redeemable Convertible Preferred Stock
The tables below represent a rollforward of the Redeemable Convertible Preferred Stock:
Series A Redeemable Convertible Preferred Stock | Series B Redeemable Convertible Preferred Stock | Series B-1 Redeemable Convertible Preferred Stock | ||||||||||||||||||
Shares | Amount | Shares | Amount | Shares | Amount | |||||||||||||||
Balances at December 31, 2011 | 705,400 | $ | 802 | 694,000 | $ | 639 | 1,212,360 | $ | 1,300 | |||||||||||
Accretion of dividends | — | 556 | — | 30 | — | 60 | ||||||||||||||
Balances at December 31, 2012 | 705,400 | 1,358 | 694,000 | 669 | 1,212,360 | 1,360 | ||||||||||||||
Accretion of dividends | — | 52 | — | 19 | — | 37 | ||||||||||||||
Conversion to common stock | (705,400 | ) | (1,410 | ) | (694,000 | ) | (688 | ) | (1,212,360 | ) | (1,397 | ) | ||||||||
Balances at December 31, 2013 | — | $ | — | — | $ | — | — | $ | — | |||||||||||
Series C Redeemable Convertible Preferred Stock | Series C-1 Redeemable Convertible Preferred Stock | Series C-2 Redeemable Convertible Preferred Stock | ||||||||||||||||||
Shares | Amount | Shares | Amount | Shares | Amount | |||||||||||||||
Balances at December 31, 2011 | 4,546,360 | $ | 6,729 | 15,934,528 | $ | 32,264 | 18,617,020 | $ | 41,987 | |||||||||||
Accretion of dividends | — | 405 | — | 1,937 | — | 2,525 | ||||||||||||||
Balances at December 31, 2012 | 4,546,360 | 7,134 | 15,934,528 | 34,201 | 18,617,020 | 44,512 | ||||||||||||||
Accretion of dividends | — | 266 | — | 1,272 | — | 1,660 | ||||||||||||||
Conversion to common stock | (4,546,360 | ) | (7,400 | ) | (15,934,528 | ) | (35,473 | ) | (18,617,020 | ) | (46,172 | ) | ||||||||
Balances at December 31, 2013 | — | $ | — | — | $ | — | — | $ | — | |||||||||||
Series C-3 Redeemable Convertible Preferred Stock | Series D Redeemable Convertible Preferred Stock | Series E Redeemable Convertible Preferred Stock | ||||||||||||||||||
Shares | Amount | Shares | Amount | Shares | Amount | |||||||||||||||
Balances at December 31, 2011 | 13,297,872 | $ | 28,082 | 19,803,685 | $ | 71,924 | 22,285,716 | $ | 117,954 | |||||||||||
Issuance of shares | — | — | — | — | 15,809,523 | 83,000 | ||||||||||||||
Accretion of dividends | — | 1,688 | — | 4,328 | — | 10,465 | ||||||||||||||
Stock issuance costs | — | — | — | — | — | (16 | ) | |||||||||||||
Balances at December 31, 2012 | 13,297,872 | 29,770 | 19,803,685 | 76,252 | 38,095,239 | 211,403 | ||||||||||||||
Accretion of dividends | — | 1,103 | — | 2,827 | — | 7,931 | ||||||||||||||
Conversion to common stock | (13,297,872 | ) | (30,873 | ) | (19,803,685 | ) | (79,078 | ) | (38,095,239 | ) | (219,332 | ) | ||||||||
Settlement of fractional shares upon conversion to common stock | — | — | — | (1 | ) | — | (2 | ) | ||||||||||||
Balances at December 31, 2013 | — | $ | — | — | $ | — | — | $ | — | |||||||||||
F-36
Series F Redeemable Convertible Preferred Stock | ||||||
Shares | Amount | |||||
Balances at December 31, 2012 | — | $ | — | |||
Issuance of shares | 19,047,619 | 150,000 | ||||
Accretion of dividends | — | 3,224 | ||||
Stock issuance costs | — | (3,148 | ) | |||
Conversion to common stock | (19,047,619 | ) | (150,075 | ) | ||
Settlement of fractional shares upon conversion to common stock | — | (1 | ) | |||
Balances at December 31, 2013 | — | $ | — | |||
The Series F Redeemable Convertible Preferred Stock (“Series F”), Series E Redeemable Convertible Preferred Stock (“Series E”), Series D Redeemable Convertible Preferred Stock (“Series D”), Series C-3 Redeemable Convertible Preferred Stock (“Series C-3”), Series C-2 Redeemable Convertible Preferred Stock (“Series C-2”), Series C-1 Redeemable Convertible Preferred Stock (“Series C-1”), Series C Redeemable Convertible Preferred Stock (“Series C”), Series B-1 Redeemable Convertible Preferred Stock (“Series B-1”), Series B Redeemable Convertible Preferred Stock (“Series B”) and Series A Redeemable Convertible Preferred Stock (“Series A”) collectively are referred to as the “Series Preferred”.
Upon closing of the IPO on August 13, 2013, all Series Preferred shares, including $68,850 of accrued but unpaid dividends thereon, automatically converted into 79,705,130 shares of common stock. Prior to conversion, the Series Preferred had optional redemption provisions whereby after May 25, 2016, but prior to the occurrence of a qualified IPO, the holders of greater than three-fourths of then issued and outstanding shares of the Series F, Series E, Series D, Series C-3, Series C-2, Series C-1 and Series C, voting as a separate class, could have elected by written notice to require the Company to redeem all of the then issued and outstanding shares of Series F, Series E, Series D, Series C-3, Series C-2, Series C-1 and Series C at an amount equal to the stated price adjusted for any stock dividends, combination or splits plus all accrued but unpaid dividends. Upon receipt of such written notice, the Company must notify the holders of the Series B-1, Series B and Series A of the redemption notice, upon which the holders of each of those classes could have required the Company to redeem all of the then issued and outstanding shares of such class. As a result of this optional redemption provision, the Company accreted changes in the redemption value from the date of issuance of all Series Preferred shares with a resultant change to additional paid-in capital or accumulated deficit in the absence of additional paid-in capital. As of December 31, 2012, $50,549 of cumulative dividends had been accreted to the redemption price for Series Preferred on the Company’s consolidated balance sheet.
Private Placement
On March 26, 2014 and concurrent with the formation of Intrexon Energy Partners, the Company entered into securities purchase agreements with each of the Investors in Intrexon Energy Partners for the private placement of 972,004 shares of the Company’s common stock at a price per share of $25.72 for gross proceeds of $25,000. Each Investor purchased an amount proportionate to its investment in Intrexon Energy Partners, including 243,001 shares, or $6,250, purchased by an affiliate of Third Security (Note 17).
15. Stock Option Plans
The Company records the fair value of stock options issued to employees and non-employees as of the grant date as stock-based compensation expense. Stock-based compensation expense for employees and non-employees is recognized over the requisite service period, which is typically the vesting period. Stock-based compensation costs included in the consolidated statements of operations are presented below:
Year Ended December 31, | |||||||||||
2014 | 2013 | 2012 | |||||||||
Cost of products | $ | 14 | $ | — | $ | — | |||||
Cost of services | 142 | — | — | ||||||||
Research and development | 4,817 | 514 | 377 | ||||||||
Selling, general and administrative | 16,876 | 2,407 | 1,081 | ||||||||
Total | $ | 21,849 | $ | 2,921 | $ | 1,458 | |||||
F-37
Intrexon Stock Option Plans
On April 18, 2008, Intrexon adopted the 2008 Equity Incentive Plan (the “2008 Plan”) for employees and nonemployees pursuant to which Intrexon’s board of directors may grant share based awards, including stock options, to officers, key employees and nonemployees. During 2011, the 2008 Plan was amended to increase the number of authorized awards under the 2008 Plan from 2,857,142 to 5,714,285. Upon the effectiveness of the 2013 Omnibus Incentive Plan (the “2013 Plan”), no new awards may be granted under the 2008 Plan. As of December 31, 2014, there were 1,747,494 stock options outstanding under the 2008 Plan.
On July 26, 2013, Intrexon adopted the 2013 Plan for employees and nonemployees pursuant to which Intrexon’s board of directors may grant share based awards, including stock options and shares of common stock, to employees, officers, consultants, advisors, and nonemployee directors. The 2013 Plan became effective upon the closing of the IPO. On June 9, 2014, Intrexon's shareholders voted to amend the 2013 Plan to increase the number of shares authorized for issuance under the 2013 Plan from 7,000,000 to 10,000,000. As of December 31, 2014, there were 6,576,050 stock options outstanding under the 2013 Plan, and there were 3,335,220 remaining shares available for Intrexon to grant under the 2013 Plan.
Stock options may be granted with an exercise price equal to or greater than the stock’s fair market value at the date of grant. Stock options may be granted with an exercise price less than the stock’s fair market value at the date of grant if the stock options are replacement options in accordance with certain U.S. Treasury regulations. Virtually all stock options have ten-year terms and vest no more than four years from the date of grant.
Intrexon uses the Black-Scholes option pricing model to estimate the grant-date fair value of all stock options. The Black-Scholes option pricing model requires the use of assumptions for estimated expected volatility, estimated expected term of stock options, risk-free rate, estimated expected dividend yield, and the fair value of the underlying common stock at the date of grant. Since Intrexon does not have sufficient history to estimate the expected volatility of our common stock price, expected volatility is based on the average volatility of peer public entities that are similar in size and industry. Intrexon estimates the expected term of all options based on previous history of exercises. The risk-free rate is based on the U.S. Treasury yield curve in effect at the time of grant for the expected term of the option. The expected dividend yield is 0% as Intrexon has not declared any common stock dividends to date and does not expect to declare common stock dividends in the near future. Prior to Intrexon’s IPO, the fair value of the underlying common stock is determined based on a valuation of Intrexon’s common stock. Subsequent to Intrexon’s IPO, the fair value of the underlying common stock is determined based on the quoted market price on the NYSE. Actual forfeitures are recorded when incurred and estimated forfeitures are reviewed and adjusted at least annually. The assumptions used in the Black-Scholes option pricing model for the years ended December 31, 2014, 2013 and 2012 are set forth below:
2014 | 2013 | 2012 | |||
Valuation assumptions | |||||
Expected dividend yield | 0% | 0% | 0% | ||
Expected volatility | 62%—64% | 73%—75% | 71%—76% | ||
Expected term (years) | 6.25 | 6.25 | 6.00 | ||
Risk-free interest rate | 1.82%—2.14% | 0.96%—1.86% | 0.80%—1.10% | ||
F-38
Stock option activity was as follows:
Number of Shares | Weighted Average Exercise Price | Weighted Average Remaining Contractual Term | ||||||
Balances at December 31, 2011 | 3,614,530 | $ | 5.22 | 6.67 | ||||
Granted | 548,571 | 7.12 | ||||||
Exercised | (194,570 | ) | (2.43 | ) | ||||
Forfeited | (1,210,857 | ) | (6.30 | ) | ||||
Expired | (444,148 | ) | (2.29 | ) | ||||
Balances at December 31, 2012 | 2,313,526 | 5.90 | 7.87 | |||||
Granted | 989,709 | 13.06 | ||||||
Exercised | (88,764 | ) | (6.04 | ) | ||||
Forfeited | (335,746 | ) | (6.94 | ) | ||||
Expired | (38,077 | ) | (5.17 | ) | ||||
Balances at December 31, 2013 | 2,840,648 | 8.27 | 7.75 | |||||
Granted | 7,655,050 | 27.51 | ||||||
Exercised | (315,964 | ) | (4.80 | ) | ||||
Forfeited | (1,855,578 | ) | (24.00 | ) | ||||
Expired | (612 | ) | (7.12 | ) | ||||
Balances at December 31, 2014 | 8,323,544 | 22.59 | 8.64 | |||||
Exercisable at December 31, 2014 | 1,448,434 | 8.27 | 6.25 | |||||
Vested and Expected to Vest at December 31, 2014(1) | 6,742,605 | 21.78 | 8.50 | |||||
(1) | The number of stock options expected to vest takes into account an estimate of expected forfeitures. |
Total unrecognized compensation costs related to nonvested awards at December 31, 2014, 2013 and 2012 were $62,281, $9,639 and $4,910, respectively, and are expected to be recognized over a weighted-average period of approximately three years.
The weighted average grant date fair value of options granted during 2014, 2013 and 2012 was $16.40, $12.91 and $4.60, respectively. The aggregate intrinsic value of options exercised during 2014, 2013 and 2012 was $6,350, $1,136 and $913, respectively. The aggregate intrinsic value of options is calculated as the difference between the exercise price of the underlying options and the fair value of Intrexon’s common stock for those shares that had exercise prices lower than the fair value of Intrexon’s common stock.
The following table summarizes additional information about stock options outstanding as of December 31, 2014:
Options Outstanding | Options Exercisable | |||||||||||||||||||||||||||||||
Range of Exercise Prices | Number of Options | Weighted Average Exercise Price | Weighted Average Remaining Life (Years) | Aggregate Intrinsic Value | Number of Options | Weighted Average Exercise Price | Weighted Average Remaining Life (Years) | Aggregate Intrinsic Value | ||||||||||||||||||||||||
$ | 0.39 | — | $ | 9.67 | 1,747,494 | $ | 6.49 | 6.25 | $ | 36,772 | 1,293,184 | $ | 6.07 | 5.90 | $ | 27,746 | ||||||||||||||||
$ | 15.39 | — | $ | 22.77 | 2,603,300 | 21.74 | 9.32 | 15,084 | 57,000 | 19.77 | 9.05 | 442 | ||||||||||||||||||||
$ | 24.73 | — | $ | 28.69 | 260,750 | 26.21 | 9.74 | 363 | 8,250 | 28.25 | 8.63 | 1 | ||||||||||||||||||||
$ | 29.95 | 1,000,000 | 29.95 | 9.21 | — | — | — | 0.00 | — | |||||||||||||||||||||||
$ | 30.72 | 2,712,000 | 30.72 | 9.22 | — | 90,000 | 30.72 | 9.22 | — | |||||||||||||||||||||||
8,323,544 | $ | 22.59 | 8.64 | $ | 52,219 | 1,448,434 | $ | 8.27 | 6.25 | $ | 28,189 | |||||||||||||||||||||
F-39
The following table summarizes additional information about stock options outstanding as of December 31, 2013:
Options Outstanding | Options Exercisable | |||||||||||||||||||||||||||||||
Range of Exercise Prices | Number of Options | Weighted Average Exercise Price | Weighted Average Remaining Life (Years) | Aggregate Intrinsic Value | Number of Options | Weighted Average Exercise Price | Weighted Average Remaining Life (Years) | Aggregate Intrinsic Value | ||||||||||||||||||||||||
$ | 0.39 | — | $ | 5.91 | 658,051 | $ | 3.15 | 4.96 | $ | 13,592 | 571,116 | $ | 2.78 | 4.63 | $ | 12,003 | ||||||||||||||||
$ | 7.12 | 1,194,887 | 7.12 | 7.80 | 19,931 | 546,805 | 7.12 | 7.77 | 9,121 | |||||||||||||||||||||||
$ | 9.67 | 701,710 | 9.67 | 9.41 | 9,915 | 107,142 | 9.67 | 9.41 | 1,514 | |||||||||||||||||||||||
$ | 19.83 | 225,500 | 19.83 | 9.96 | 895 | — | — | 0.00 | — | |||||||||||||||||||||||
$ | 26.76 | — | $ | 28.69 | 60,500 | 27.33 | 9.67 | — | 2,500 | 28.69 | 9.62 | — | ||||||||||||||||||||
2,840,648 | $ | 8.27 | 7.75 | $ | 44,333 | 1,227,563 | $ | 5.37 | 6.44 | $ | 22,638 | |||||||||||||||||||||
Intrexon currently uses authorized and unissued shares to satisfy share award exercises.
Other Plans
As of December 31, 2014, there were 397,000 options outstanding under the Exemplar membership interest unit option plan at a weighted average exercise price of $2.10 per unit of which 275,667 were exercisable.
As of December 31, 2014, there were 7,347,000 options outstanding under the AquaBounty 2006 Equity Incentive Plan at a weighted average exercise price of $0.31 per share of which 6,171,520 were exercisable. As of December 31, 2013, there were 6,624,000 options outstanding under the AquaBounty 2006 Equity Incentive Plan at a weighted average exercise price of $0.25 per share of which 6,052,000 were exercisable.
16. Commitments and Contingencies
Operating Leases
The Company leases facilities and certain equipment under noncancelable operating leases. The equipment leases are renewable at the option of the Company. At December 31, 2014, future minimum lease payments under operating leases having initial or remaining noncancelable lease terms in excess of one year are as follows:
2015 | $ | 4,177 | |
2016 | 4,162 | ||
2017 | 2,695 | ||
2018 | 1,355 | ||
2019 | 1,275 | ||
Thereafter | 2,430 | ||
$ | 16,094 | ||
Rent expense, including other facility expenses, was $8,511, $5,672 and $5,036 in 2014, 2013 and 2012, respectively.
The Company maintains subleases for certain of its facilities. Rental income under sublease agreements was $908, $365 and $151 for the years ended December 31, 2014, 2013 and 2012, respectively. Future rental income is $1,316 for 2015, $993 for 2016, and $96 for 2017.
Contingencies
On March 6, 2012, Trans Ova was named as a defendant in a licensing and patent infringement suit brought by XY, Inc. alleging that certain of Trans Ova's activities breach a licensing agreement and infringe on patents that XY, Inc. allegedly owns. Trans Ova is reviewing, defending and filing counter claims in the case. The matter may go to trial in 2015. Based on advice from legal counsel, Trans Ova believes that XY, Inc.'s complaints are without merit; however, no assurances can be given that
F-40
this matter will be resolved in Trans Ova's favor. Furthermore, no assurances can be made that the legal proceedings will be concluded in accordance with the present schedule.
The Company may become subject to claims and assessments from time to time in the ordinary course of business. Such matters are subject to many uncertainties and outcomes are not predictable with assurance. The Company accrues liabilities for such matters when it is probable that future expenditures will be made and such expenditures can be reasonably estimated. As of December 31, 2014 and 2013, the Company does not believe that any such matters, individually or in the aggregate, will have a material adverse effect on the Company’s business, financial condition, results of operations, or cash flows.
17. Related Party Transactions
Third Security and Affiliates
Certain affiliates of Third Security were shareholders of the Series B, B-1, C, C-1, C-2, C-3, D, E, and F Redeemable Convertible Preferred Stock.
The Company reimburses Third Security for certain out-of-pocket expenses incurred on the Company’s behalf. The total amount of expenses reimbursed by the Company for the years ended December 31, 2014, 2013 and 2012, was $291, $455, and $49, respectively.
On June 6, 2011, the Company entered into an exclusive licensing agreement with Halozyme Therapeutics, Inc. (“Halozyme”) for the use of Halozyme’s proprietary enzyme in one of the Company’s targeted therapeutics. The Company and Halozyme are related parties through common ownership by affiliates of Third Security. The Company’s CEO also serves on Halozyme’s board of directors. The Company terminated the agreement effective May 2014 and no further payments are due after that date.
The Manager of Third Security is also the Chief Executive Officer (“CEO”) and Chairman of the Board of Directors of the Company. The CEO has not received compensation for his services as CEO, and as a result, the Company recorded $1,991, $1,550 and $1,550 in compensation expense for the years ended December 31, 2014, 2013 and 2012, respectively, based on the estimated salary and benefits appropriate for the role.
Transactions with ECC Parties
In addition to entities controlled by Third Security, any entity in which the Company holds equity securities, including securities received as upfront or milestone consideration, and which also are party to a collaboration with the Company are considered to be related parties.
In conjunction with the ECC with Ziopharm (Note 6), the Company agreed to purchase up to an additional $50,000 of common stock in conjunction with securities offerings that may be conducted by Ziopharm in the future, subject to certain conditions and limitations. Between February 2011 and October 2013, the Company purchased an aggregate of $30,982 of Ziopharm securities. At December 31, 2014, the Company had $19,081 remaining on its purchase commitment. See discussion of the Company's purchase of additional common stock of Ziopharm subsequent to year-end at Note 21.
In conjunction with the ECC with Synthetic Biologics (Note 6), the Company is entitled to, at its election, purchase up to 19.99% of securities offerings that may be conducted by Synthetic Biologics in the future, subject to certain conditions and limitations. On December 17, 2013, the Company purchased 2,000,000 shares of Synthetic Biologics common stock at $1.00 per share in a securities offering under this right. The Company has been granted the right to make purchases of Synthetic Biologics’ common stock in the open market up to an additional 10% of Synthetic Biologics’ common stock, but has made no such purchases.
In conjunction with the ECC with Oragenics (Note 6), the Company is entitled to, at its election, purchase up to 30% of securities offerings that may be conducted by Oragenics in the future, subject to certain conditions and limitations. On November 20, 2013, the Company purchased 1,100,000 shares of Oragenics common stock at $2.50 per share. On September 30, 2013, the Company purchased 1,300,000 shares of Oragenics common stock at $3.00 per share in a private transaction.
On October 1, 2013, the Company purchased 2,439,024 shares of Fibrocell common stock at $4.10 per share.
The Company entered into an ECC with Histogenics Corporation ("Histogenics") in September 2014 and received a $10,000 convertible promissory note as upfront consideration. The note originally matured in September 2015 and accrued interest at 6.0% per annum. Upon the closing of Histogenics' IPO on December 7, 2014, the note, as well as accrued interest, was
F-41
converted to Histogenics' common stock. Additionally, the Company purchased 1,772,364 shares of Histogenics common stock at $11.00 per share in the IPO.
The Company recognized $41,030, $22,783, and $13,076 of collaboration revenues from related parties in the years ended December 31, 2014, 2013 and 2012, respectively.
18. Net Loss per Share
The following table presents the historical computation of basic and diluted net loss per share:
2014 | 2013 | 2012 | |||||||||
Historical net loss per share: | |||||||||||
Numerator: | |||||||||||
Net loss attributable to Intrexon | $ | (81,822 | ) | $ | (38,980 | ) | $ | (81,874 | ) | ||
Add: Accretion of dividends on redeemable convertible preferred stock | — | (18,391 | ) | (21,994 | ) | ||||||
Net loss attributable to common shareholders | $ | (81,822 | ) | $ | (57,371 | ) | $ | (103,868 | ) | ||
Denominator: | |||||||||||
Weighted average shares outstanding, basic and diluted | 99,170,653 | 40,951,952 | 5,533,690 | ||||||||
Net loss attributable to common shareholders per share, basic and diluted | $ | (0.83 | ) | $ | (1.40 | ) | $ | (18.77 | ) | ||
The following potentially dilutive securities as of December 31, 2014, 2013, and 2012, have been excluded from the computations of diluted weighted average shares outstanding for the years then ended as they would have been anti-dilutive:
December 31, | ||||||||
2014 | 2013 | 2012 | ||||||
Common shares issuable upon conversion of all Series Preferred | — | — | 64,517,977 | |||||
Options | 8,323,544 | 2,840,648 | 2,313,526 | |||||
Warrants | 352,483 | 414,404 | 511,098 | |||||
Total | 8,676,027 | 3,255,052 | 67,342,601 | |||||
In addition to the potentially dilutive securities in the table above, Series Preferred cumulative dividends convertible into common shares at a price per share equal to the fair market value of a common share at the time of conversion have been excluded from the computation of diluted weighted-average shares outstanding for the years ended December 31, 2013 and 2012.
19. Quarterly Financial Information (Unaudited)
The following information has been derived from unaudited consolidated statements that, in the opinion of management, include all recurring adjustments necessary for a fair statement of such information.
Three Months Ended | |||||||||||||||
March 31, 2014 | June 30, 2014 | September 30, 2014 | December 31, 2014 | ||||||||||||
Total revenues | $ | 7,854 | $ | 11,787 | $ | 21,197 | $ | 31,092 | |||||||
Operating loss | (17,872 | ) | (18,082 | ) | (15,047 | ) | (18,961 | ) | |||||||
Net income (loss) | 3,249 | (52,935 | ) | (53,862 | ) | 17,932 | |||||||||
Net income (loss) attributable to Intrexon | 4,115 | (52,043 | ) | (52,725 | ) | 18,831 | |||||||||
Net income (loss) attributable to common shareholders per share, basic | $ | 0.04 | $ | (0.53 | ) | $ | (0.53 | ) | $ | 0.19 | |||||
Net income (loss) attributable to common shareholders per share, diluted | 0.04 | (0.53 | ) | (0.53 | ) | 0.18 | |||||||||
F-42
Three Months Ended | |||||||||||||||
March 31, 2013 | June 30, 2013 | September 30, 2013 | December 31, 2013 | ||||||||||||
Total revenues | $ | 3,885 | $ | 6,690 | $ | 6,042 | $ | 7,143 | |||||||
Operating loss | (14,006 | ) | (14,254 | ) | (12,037 | ) | (17,726 | ) | |||||||
Net income (loss) | (36,362 | ) | (6,519 | ) | 14,991 | (13,018 | ) | ||||||||
Net income (loss) attributable to Intrexon | (36,311 | ) | (5,963 | ) | 15,498 | (12,204 | ) | ||||||||
Net income (loss) attributable to common shareholders per share, basic | $ | (7.54 | ) | $ | (2.45 | ) | $ | 0.15 | $ | (0.13 | ) | ||||
Net income (loss) attributable to common shareholders per share, diluted | (7.54 | ) | (2.45 | ) | 0.15 | (0.13 | ) | ||||||||
20. Defined Contribution Plans
The Company sponsors defined contribution plans covering employees who meet certain eligibility requirements. The Company makes contributions to the plans in accordance with terms specified in the plan agreement. The Company’s contributions to the plans were $776, $598 and $755 in 2014, 2013 and 2012, respectively.
21. Subsequent Events
On January 13, 2015, the Company and Ziopharm jointly entered into a license agreement with the University of Texas System Board of Regents on behalf of the University of Texas M.D. Anderson Cancer Center (“M.D. Anderson”) whereby the Company and Ziopharm received an exclusive license to certain technologies owned and licensed by M.D. Anderson, including technologies relating to novel chimeric antigen receptor (CAR) T-cell therapies, as well as co-licenses and non-exclusive licenses to certain other related technologies. The Company is obligated to issue 2,100,085 shares of its common stock valued at approximately $59,600 to M.D. Anderson as consideration within sixty days of the effective date.
In connection with the license agreement, the Company, Ziopharm, and M.D. Anderson agreed to enter into a research and development agreement which will govern certain operational activities between the parties and pursuant to which Ziopharm will provide funding for certain research and development activities of M.D. Anderson for a period of three years, in an amount between $15,000 and $20,000 per year. The Company and Ziopharm are obligated to reimburse M.D. Anderson for out of pocket expenses for maintaining patents covering the licensed technologies.
On January 27, 2015, the Company closed a public offering of 4,312,500 shares of its common stock, inclusive of 562,500 shares of common stock sold by the Company pursuant to the full exercise of an overallotment option granted to the underwriters in connection with the offering and 555,556 shares of common stock purchased by affiliates of Third Security (Note 17), at a public offering price of $27.00 per share. The aggregate proceeds of the offering were approximately $110,000, net of underwriting discounts and commissions of approximately $6,100 and offering expenses paid by the Company of approximately $300.
On February 9, 2015, the Company purchased $12,600 of Ziopharm common stock in a securities offering reducing the remaining obligation on the Company’s equity purchase commitment (Note 17) to $6,481.
On February 23, 2015, the Company acquired 100% of ActoGeniX NV ("ActoGeniX"), a European clinical stage biopharmaceutical company, for approximately $30,000 in cash and 965,377 shares of Company common stock, pursuant to a Stock Purchase Agreement dated as of February 13, 2015. ActoGeniX's platform technology complements the broad collection of technologies available for current and future collaborations.
On February 23, 2015, the Company acquired, through an exchange offer, the remaining outstanding membership interests of its majority-owned indirect subsidiary, Exemplar, for approximately $1,600 in cash and 307,074 shares of Company common stock.
On February 27, 2015, the Company entered into a definitive agreement to acquire 100% of Okanagan Specialty Fruits Inc. for approximately $31,000 in Company common stock and approximately $10,000 in cash. Consummation of the transaction, anticipated in the first half of 2015, is subject to customary closing conditions.
F-43
ZIOPHARM Oncology, Inc.
Financial Statements
December 31, 2014, 2013 and 2012
REPORT OF INDEPENDENT REGISTERED PUBLIC ACCOUNTING FIRM
To the Board of Directors and Stockholders of
ZIOPHARM Oncology, Inc.
Boston, Massachusetts
We have audited the accompanying balance sheets of ZIOPHARM Oncology, Inc. as of December 31, 2014 and 2013, and the related statements of operations, changes in stockholders' equity, and cash flows for each of the three years in the period ended December 31, 2014. ZIOPHARM Oncology, Inc’s management is responsible for these financial statements. Our responsibility is to express an opinion on these financial statements based on our audits.
We conducted our audits in accordance with the standards of the Public Company Accounting Oversight Board (United States). Those standards require that we plan and perform the audit to obtain reasonable assurance about whether the financial statements are free of material misstatement. An audit includes examining, on a test basis, evidence supporting the amounts and disclosures in the financial statements, assessing the accounting principles used and significant estimates made by management, as well as evaluating the overall financial statement presentation. We believe that our audits provide a reasonable basis for our opinion.
In our opinion, the financial statements referred to above present fairly, in all material respects, the financial position of ZIOPHARM Oncology, Inc. as of December 31, 2014 and 2013, and the results of its operations and its cash flows for each of the years in the three-year period ended December 31, 2014, in conformity with accounting principles generally accepted in the United States of America.
/s/ McGladrey LLP
Boston, Massachusetts
February 26, 2015
F-45
ZIOPHARM Oncology, Inc.
BALANCE SHEETS
(in thousands, except share and per share data)
December 31, 2014 | December 31, 2013 | |||||||
ASSETS | ||||||||
Current assets: | ||||||||
Cash and cash equivalents | $ | 42,803 | $ | 68,204 | ||||
Receivables | 145 | 145 | ||||||
Prepaid expenses and other current assets | 1,139 | 1,948 | ||||||
Total current assets | 44,087 | 70,297 | ||||||
Property and equipment, net | 531 | 801 | ||||||
Deposits | 128 | 128 | ||||||
Other non current assets | 491 | 528 | ||||||
Total assets | $ | 45,237 | $ | 71,754 | ||||
LIABILITIES AND STOCKHOLDERS’ EQUITY | ||||||||
Current liabilities: | ||||||||
Accounts payable | $ | 2,004 | $ | 422 | ||||
Accrued expenses | 7,182 | 6,357 | ||||||
Deferred revenue - current portion | 1,360 | 800 | ||||||
Deferred rent - current portion | 280 | 212 | ||||||
Total current liabilities | 10,826 | 7,791 | ||||||
Deferred revenue | — | 1,933 | ||||||
Deferred rent | 570 | 851 | ||||||
Warrant liabilities | — | 11,776 | ||||||
Other long term liabilities | — | 20 | ||||||
Total liabilities | $ | 11,396 | $ | 22,371 | ||||
Commitments and contingencies (note 8) | ||||||||
Stockholders’ equity: | ||||||||
Common stock, $0.001 par value; 250,000,000 shares authorized; 104,452,105 and 100,159,618 shares issued and outstanding at December 31, 2014 and 2013, respectively | $ | 104 | $ | 100 | ||||
Additional paid-in capital - common stock | 406,349 | 386,511 | ||||||
Additional paid-in capital - warrants issued | — | 3,603 | ||||||
Accumulated Deficit | (372,612 | ) | (340,831 | ) | ||||
Total stockholders’ equity | 33,841 | 49,383 | ||||||
Total liabilities and stockholders’ equity | $ | 45,237 | $ | 71,754 | ||||
The accompanying notes are an integral part of these financial statements.
F-46
ZIOPHARM Oncology, Inc.
STATEMENTS OF OPERATIONS
(in thousands, except share and per share data)
For the Year Ended December 31, | ||||||||||||
2014 | 2013 | 2012 | ||||||||||
Revenue | $ | 1,373 | $ | 800 | $ | 800 | ||||||
Operating expenses: | ||||||||||||
Research and development | 32,706 | 42,852 | 83,446 | |||||||||
General and administrative | 12,166 | 15,661 | 19,523 | |||||||||
Total operating expenses | 44,872 | 58,513 | 102,969 | |||||||||
Loss from operations | (43,499 | ) | (57,713 | ) | (102,169 | ) | ||||||
Other income (expense), net | (5 | ) | (579 | ) | (13 | ) | ||||||
Change in fair value of warrants | 11,723 | 1,185 | 6,050 | |||||||||
Net loss | $ | (31,781 | ) | $ | (57,107 | ) | $ | (96,132 | ) | |||
Basic and diluted net loss per share | $ | (0.31 | ) | $ | (0.66 | ) | $ | (1.22 | ) | |||
Weighted average common shares outstanding used to compute basic and diluted net loss per share | 101,130,710 | 85,943,175 | 78,546,112 | |||||||||
The accompanying notes are an integral part of these financial statements.
F-47
ZIOPHARM Oncology, Inc.
STATEMENTS OF CHANGES IN STOCKHOLDERS’ EQUITY
(in thousands, except share and per share data)
Stockholder’s Equity | ||||||||||||||||||||||||
Additional Paid-in Capital Common Stock | Additional Paid-in Capital Warrants | Deficit Accumulated During the Development Stage | Total Stockholders’ Equity | |||||||||||||||||||||
Common Stock | ||||||||||||||||||||||||
Shares | Amount | |||||||||||||||||||||||
Balance at December 31, 2011 | 69,206,044 | $ | 69 | $ | 246,519 | $ | 12,611 | $ | (187,592 | ) | $ | 71,607 | ||||||||||||
Stock-based compensation | — | — | 4,880 | — | — | 4,880 | ||||||||||||||||||
Issuance of common stock in a securities offering, net of commission and expenses of $3,426 | 10,114,401 | 11 | 49,159 | — | — | 49,170 | ||||||||||||||||||
Exercise of warrants to purchase common stock | 259,660 | — | 1,011 | (269 | ) | — | 742 | |||||||||||||||||
Exercise of employee stock options | 8,300 | — | 30 | — | — | 30 | ||||||||||||||||||
Issuance of restricted common stock | 258,032 | — | — | — | — | — | ||||||||||||||||||
Repurchase of shares of restricted common stock | (123,153 | ) | — | (546 | ) | — | — | (546 | ) | |||||||||||||||
Cancelled restricted stock | (123,370 | ) | — | — | — | — | — | |||||||||||||||||
Expired warrants | — | — | 5,433 | (5,433 | ) | — | — | |||||||||||||||||
Issuance of common stock in a collaboration agreeement | 3,636,926 | 3 | 18,691 | — | — | 18,694 | ||||||||||||||||||
Net loss | — | — | — | — | (96,132 | ) | (96,132 | ) | ||||||||||||||||
Balance at December 31, 2012 | 83,236,840 | $ | 83 | $ | 325,177 | $ | 6,909 | $ | (283,724 | ) | $ | 48,445 | ||||||||||||
The accompanying notes are an integral part of these financial statements.
F-48
ZIOPHARM Oncology, Inc.
STATEMENTS OF CHANGES IN STOCKHOLDERS’ EQUITY (Cont.)
(in thousands, except share and per share data)
Additional Paid-in Capital Common Stock | Additional Paid-in Capital Warrants | Deficit Accumulated During the Development Stage | Total Stockholders’ Equity/ | ||||||||||||||||||||
Common Stock | |||||||||||||||||||||||
Shares | Amount | ||||||||||||||||||||||
Stock-based compensation | — | — | 3,507 | — | — | 3,507 | |||||||||||||||||
Issuance of common stock, net of commission and expenses of $3,678 | 16,445,000 | 16 | 53,864 | — | — | 53,880 | |||||||||||||||||
Exercise of warrants to purchase common stock | 112,808 | — | 396 | (196 | ) | — | 200 | ||||||||||||||||
Exercise of employee stock options | 570,168 | 1 | 955 | — | — | 956 | |||||||||||||||||
Issuance of restricted common stock | 75,272 | — | — | — | — | — | |||||||||||||||||
Repurchase of shares of restricted common stock | (116,723 | ) | — | (498 | ) | — | — | (498 | ) | ||||||||||||||
Cancelled of restricted stock | (163,747 | ) | — | — | — | — | — | ||||||||||||||||
Expired warrants | — | — | 3,110 | (3,110 | ) | — | — | ||||||||||||||||
Net loss | — | — | — | — | (57,107 | ) | (57,107 | ) | |||||||||||||||
Balance at December 31, 2013 | 100,159,618 | $ | 100 | $ | 386,511 | $ | 3,603 | $ | (340,831 | ) | $ | 49,383 | |||||||||||
The accompanying notes are an integral part of these financial statements.
F-49
ZIOPHARM Oncology, Inc.
STATEMENTS OF CHANGES IN STOCKHOLDERS’ EQUITY (Cont.)
(in thousands, except share and per share data)
Stockholder’s Equity | |||||||||||||||||||||||
Additional Paid-in Capital Common Stock | Additional Paid-in Capital Warrants | Deficit Accumulated During the Development Stage | Total Stockholders’ Equity/ | ||||||||||||||||||||
Common Stock | |||||||||||||||||||||||
Shares | Amount | ||||||||||||||||||||||
Stock-based compensation | — | — | 4,743 | — | — | 4,743 | |||||||||||||||||
Exercise of warrants to purchase common stock | 3,747,254 | 4 | 13,963 | (3,313 | ) | — | 10,654 | ||||||||||||||||
Exercise of employee stock options | 613,138 | — | 1,386 | — | — | 1,386 | |||||||||||||||||
Issuance of restricted common stock | 66,828 | — | — | — | — | — | |||||||||||||||||
Repurchase of shares of restricted common stock | (112,333 | ) | — | (544 | ) | — | — | (544 | ) | ||||||||||||||
Cancelled of restricted stock | (22,400 | ) | — | — | — | — | — | ||||||||||||||||
Expired warrants | — | — | 290 | (290 | ) | — | — | ||||||||||||||||
Net loss | — | — | — | — | (31,781 | ) | (31,781 | ) | |||||||||||||||
Balance at December 31, 2014 | 104,452,105 | $ | 104 | $ | 406,349 | $ | 0 | $ | (372,612 | ) | $ | 33,841 | |||||||||||
The accompanying notes are an integral part of these financial statements.
F-50
ZIOPHARM Oncology, Inc.
STATEMENTS OF CASH FLOWS
(in thousands)
For the Year Ended December 31, | ||||||||||||
2014 | 2013 | 2012 | ||||||||||
Cash flows from operating activities: | ||||||||||||
Net loss | $ | (31,781 | ) | $ | (57,107 | ) | $ | (96,132 | ) | |||
Adjustments to reconcile net loss to net cash used in operating activities: | ||||||||||||
Depreciation and amortization | 462 | 738 | 658 | |||||||||
Stock-based compensation | 4,743 | 3,507 | 4,880 | |||||||||
Change in fair value of warrants | (11,723 | ) | (1,185 | ) | (6,050 | ) | ||||||
Loss on disposal of fixed assets | — | 585 | 48 | |||||||||
Common stock issued in exchange for in-process research and development | — | — | 18,694 | |||||||||
Change in operating assets and liabilities: | ||||||||||||
(Increase) decrease in: | ||||||||||||
Receivables | — | (87 | ) | 21 | ||||||||
Prepaid expenses and other current assets | 809 | 4,964 | (5,599 | ) | ||||||||
Other noncurrent assets | 37 | 473 | (230 | ) | ||||||||
Deposits | — | 4 | (43 | ) | ||||||||
Increase (decrease) in: | ||||||||||||
Accounts payable | 1,582 | (1,087 | ) | (218 | ) | |||||||
Accrued expenses | 827 | (10,159 | ) | 5,695 | ||||||||
Deferred revenue | (1,373 | ) | (800 | ) | (800 | ) | ||||||
Deferred rent | (213 | ) | 625 | 244 | ||||||||
Other noncurrent liabilities | (20 | ) | 20 | — | ||||||||
Net cash used in operating activities | (36,650 | ) | (59,509 | ) | (78,832 | ) | ||||||
Cash flows from investing activities: | ||||||||||||
Purchases of property and equipment | (193 | ) | (132 | ) | (1,559 | ) | ||||||
Proceeds from sale of property and equipment | — | 1 | — | |||||||||
Net cash used in investing activities | (193 | ) | (131 | ) | (1,559 | ) | ||||||
Cash flows from financing activities: | ||||||||||||
Proceeds from exercise of stock options | 1,386 | 956 | 30 | |||||||||
Payments to employees for repurchase of restricted common stock | (544 | ) | (498 | ) | (546 | ) | ||||||
Proceeds from exercise of warrants | 10,600 | 200 | 330 | |||||||||
Proceeds from issuance of common stock and warrants, net | — | 53,880 | 49,170 | |||||||||
Net cash provided by financing activities | 11,442 | 54,538 | 48,984 | |||||||||
Net decrease in cash and cash equivalents | (25,401 | ) | (5,102 | ) | (31,407 | ) | ||||||
Cash and cash equivalents, beginning of period | 68,204 | 73,306 | 104,713 | |||||||||
Cash and cash equivalents, end of period | $ | 42,803 | $ | 68,204 | $ | 73,306 | ||||||
Supplementary disclosure of cash flow information: | ||||||||||||
Cash paid for interest | $ | — | $ | — | $ | — | ||||||
Cash paid for income taxes | $ | — | $ | — | $ | — | ||||||
Supplementary disclosure of noncash investing and financing activities: | ||||||||||||
Exercise of equity-classified warrants to common shares | $ | 692 | $ | 196 | $ | 269 | ||||||
Exercise of liability-classified warrants to common shares | $ | 54 | $ | — | $ | 412 | ||||||
The accompanying notes are an integral part of these financial statements.
F-51
1. | Organization |
ZIOPHARM Oncology, Inc., which we refer to as “ZIOPHARM” or the “Company”, is a biopharmaceutical company that seeks to acquire, develop and commercialize, on its own or with commercial partners, a diverse portfolio of cancer therapies that can address unmet medical needs through synthetic biology.
The Company’s operations to date have consisted primarily of raising capital and conducting research and development. The Company’s fiscal year ends on December 31.
The Company has operated at a loss since its inception in 2003 and has minimal revenues. The Company anticipates that losses will continue for the foreseeable future. At December 31, 2014, the Company’s accumulated deficit was approximately $372.6 million. Taking into account the receipt of approximately $94.6 million in net proceeds from the February 2015 public offering of common stock, and given the development plans, the Company anticipates cash resources will be sufficient to fund operations into the first quarter of 2017. The Company’s ability to continue operations after its current cash resources are exhausted depends on its ability to obtain additional financing or to achieve profitable operations, as to which no assurances can be given. Cash requirements may vary materially from those now planned because of changes in the Company’s focus and direction of its research and development programs, competitive and technical advances, patent developments, regulatory changes or other developments. Additional financing will be required to continue operations after the Company exhausts its current cash resources and to continue its long-term plans for clinical trials and new product development. There can be no assurance that any such financing can be obtained by the Company, or if obtained, what the terms thereof may be, or that any amount that the Company is able to raise will be adequate to support the Company’s working capital requirements until it achieves profitable operations.
2. | Financings |
On February 3, 2015, the Company entered into an underwriting agreement with J.P. Morgan Securities LLC, as representative of the several underwriters named therein, relating to the issuance and sale of 10,000,000 shares of our common stock. The price to the public in the offering was $8.75 per share, and the underwriters agreed to purchase the shares from the Company pursuant to the underwriting agreement at a purchase price of $8.225 per share. Under the terms of the underwriting agreement, the Company also granted the underwriters an option, exercisable for 30 days, to purchase up to an additional 1,500,000 shares of common stock at a purchase price of $8.225 per share. The offering was made pursuant to the Company’s effective registration statement on Form S-3 (Registration Statement No. 333-201826) previously filed with the SEC, and a prospectus supplement thereunder. The underwriters purchased the 10,000,000 shares and the additional 1,500,000 shares on February 9 and February 17, 2015, respectively. The net proceeds from the offering were approximately $94.2 million after deducting underwriting discounts and estimated offering expenses payable by the Company.
On October 23, 2013, the Company entered into an underwriting agreement with J. P. Morgan Securities LLC, as representative of the several underwriters named therein, relating to the issuance and sale of 14,300,000 shares of our common stock. The price to the public in the offering was $3.50 per share, and the underwriters agreed to purchase the shares from the Company pursuant to the underwriting agreement at a purchase price of $3.29 per share. Under the terms of the underwriting agreement, the Company also granted the underwriters an option, exercisable for 30 days, to purchase up to an additional 2,145,000 shares of common stock at a purchase price of $3.29 per share, and the underwriters elected to exercise such option in full. The offering was made pursuant to the Company’s effective registration statement on Form S-3 (Registration Statement No. 333-177793) previously filed with the SEC, and a prospectus supplement thereunder. The underwriters purchased the 14,300,000 shares and the additional 2,145,000 shares on October 29, 2013. The net proceeds from the offering were approximately $53.9 million after deducting underwriting discounts and estimated offering expenses payable by the Company.
F-52
2. | Financings (Continued) |
On January 20, 2012, the Company entered into an underwriting agreement with J. P. Morgan Securities LLC, as representative of the several underwriters named therein, relating to the issuance and sale of 9,650,000 shares of our common stock. The price to the public in the offering was $5.20 per share, and the underwriters agreed to purchase the shares from the Company pursuant to the underwriting agreement at a purchase price of $4.888 per share. Under the terms of the underwriting agreement, the Company also granted the underwriters an option, exercisable for 30 days, to purchase up to an additional 1,447,500 shares of common stock at a purchase price of $4.888 per share. The offering was made pursuant to the Company’s effective registration statement on Form S-3 (Registration Statement No. 333-177793) previously filed with the SEC, and a prospectus supplement thereunder. The underwriters purchased the 9,650,000 shares on January 25, 2012 and purchased an additional 464,401 shares on January 31, 2012 pursuant to the partial exercise of their option to purchase additional shares, resulting in our issuing a total of 10,114,401 shares. The net proceeds from the offering were approximately $49.2 million after deducting underwriting discounts and estimated offering expenses payable by the Company.
3. Summary of Significant Accounting Policies
Basis of Presentation
The accompanying financial statements have been prepared in accordance with accounting principles generally accepted in the United States of America (“U.S. GAAP”).
Use of Estimates
The preparation of financial statements in conformity with accounting principles generally accepted in the United States of America requires management to make estimates and assumptions that affect the reported amounts of assets and liabilities and the disclosure of contingent assets and liabilities at the date of the financial statements and the reported amounts of revenues and expenses during the reporting period. Although the Company regularly assesses these estimates, actual results could differ from those estimates. Changes in estimates are recorded in the period in which they become known.
The Company’s most significant estimates and judgments used in the preparation of our financial statements are:
• | Clinical trial expenses; |
• | Fair value measurements for stock based compensation and warrants; and |
• | Income taxes. |
Subsequent Events
On January 13, 2015, the Company, together with Intrexon, entered into a license agreement, or the License, with The University of Texas M.D. Anderson Cancer Center (“MD Anderson”). Pursuant to the License, the Company and Intrexon hold an exclusive, worldwide license to certain technologies owned and licensed by MD Anderson including technologies relating to novel chimeric antigen receptor (CAR) T-cell therapies arising from the laboratory of Laurence Cooper, M.D., Ph.D., professor of pediatrics at MD Anderson, as well as either co-exclusive or non-exclusive licenses under certain related technologies.
Pursuant to the terms of the License, MD Anderson will receive, within sixty days of the date of the License, consideration of $50 million in shares of our common stock (or 10,124,561 shares), and $50 million in shares of Intrexon’s common stock in each case based on a trailing 20 day volume weighted average of the closing price of
F-53
3. Summary of Significant Accounting Policies (Continued)
the Company’s and Intrexon’s common stock ending on the date prior to the announcement of the entry into the License, collectively referred to as the License Shares, pursuant to the terms of the License Shares Securities Issuance Agreement described below. The Company and Intrexon also agreed to reimburse MD Anderson for out of pocket expenses for maintaining patents covering the licensed technologies.
In addition, pursuant to the License, MD Anderson has agreed to transfer to us certain existing research programs described in the License and to grant to Intrexon and us certain additional technology rights related thereto. In connection with such transfer, the terms of the License also require us and Intrexon to enter into a research and development agreement with MD Anderson pursuant to which the Company will provide funding for certain research and development activities of MD Anderson for a period of three years, in an amount between $15 and $20 million per year. The first quarterly payment of $3.75 million due under this arrangement is required to be made by us within 60 days of the date of the License.
The term of the License expires on the last to occur of (a) the expiration of all patents licensed thereunder, or (b) the twentieth anniversary of the date of the License; provided, however, that following the expiration of the term, the Company and Intrexon shall then have a fully-paid up, royalty free, perpetual, irrevocable and sublicensable license to use the licensed intellectual property thereunder. After ten years from the date of the License and subject to a 90 day cure period, MD Anderson will have the right to convert the License into a non-exclusive license if the Company and Intrexon are not using commercially reasonable efforts to commercialize the licensed intellectual property on a case-by-case basis. After five years from the date of the License and subject to a 180 day cure period, MD Anderson will have the right to terminate the License with respect to specific technology(ies) funded by the government or subject to a third party contract if the Company and Intrexon are not meeting the diligence requirements in such funding agreement or contract, as applicable. Subject to a 30 day cure period, MD Anderson has the right to terminate the License if the Company and Intrexon fail to timely deliver the shares due in consideration for the License. MD Anderson may also terminate the agreement with written notice upon material breach by us and Intrexon, if such breach has not been cured within 60 days of receiving such notice. In addition, the License will terminate upon the occurrence of certain insolvency events for both us and Intrexon and may be terminated by the mutual written agreement of us, Intrexon and MD Anderson.
On January 9, 2015, in order to induce MD Anderson to enter into the License on an accelerated schedule, the Company and Intrexon entered into a letter agreement, or the Letter Agreement, pursuant to which MD Anderson will receive consideration of $7.5 million in shares of the our common stock (or 1,597,602 shares), and $7.5 million in shares of Intrexon’s common stock in each case based on a trailing 20 day volume weighted average of the closing price of the our and Intrexon’s common stock ending on the date prior to the Letter Agreement, collectively referred to as the Incentive Shares, in the event that the License was entered into on or prior to 8:00 am pacific time on January 14, 2015, referred to as the Accelerated Closing Deadline. The Incentive Shares will be issued to MD Anderson within sixty days of the date of the License pursuant to the terms of the Incentive Shares Securities Issuance Agreement described below.
In connection with the entry into the License, on January 13, 2015, the Company entered into a Securities Issuance Agreement with MD Anderson, or the License Shares Securities Issuance Agreement, pursuant to which the Company agreed to issue and sell the License Shares to MD Anderson in consideration for the License. The closing of the issuance and sale of the License Shares under the License Shares Securities Issuance Agreement will occur within sixty days of the date of the License, subject to customary closing conditions.
In connection with the entry into the Letter Agreement, on January 13, 2015, the Company entered into a Securities Issuance Agreement with MD Anderson, or the Incentive Shares Securities Issuance Agreement,
F-54
3. Summary of Significant Accounting Policies (Continued)
pursuant to which the Company agreed to issue and sell the Incentive Shares to MD Anderson in consideration for the execution and delivery of the License on or prior to the Accelerated Closing Deadline in connection with the Letter Agreement. The closing of the issuance and sale of the Incentive Shares under the Incentive Shares Securities Issuance Agreement will occur within sixty days of the date of the License, subject to customary closing conditions.
Also in connection with the License and the issuance of the License Shares and the Incentive Shares, on January 13, 2015, the Company and MD Anderson entered into a Registration Rights Agreement, or the Registration Rights Agreement, pursuant to which the Company agreed to file a “resale” registration statement, or the Registration Statement, registering the resale of the License Shares, the Incentive Shares and any other shares of our common stock held by MD Anderson on the date that the Registration Statement is filed, within 15 days of the closing under the License Shares Securities Issuance Agreement. Under the Registration Rights Agreement, the Company is obligated to use our reasonable best efforts to cause the Registration Statement to be declared effective as promptly as practicable after filing and in no event later than 120 days of the closing under the License Shares Securities Issuance Agreement and to maintain the effectiveness of the Registration Statement until all securities therein are sold or are otherwise can be sold pursuant to Rule 144, without any restrictions.
Our director, Randall J. Kirk, is the CEO, a director, and the largest stockholder of Intrexon, which is a party to the License. Mr. Kirk is also one of our principal stockholders.
On February 3, 2015, the Company entered into an underwriting agreement with J.P. Morgan Securities LLC (see Note 2 above).
The Company evaluated all other events and transactions that occurred after the balance sheet date through the date of this filing. Except as disclosed above, the Company did not have any other material subsequent events that impacted its financial statements or disclosures.
Cash and Cash Equivalents
Cash equivalents consist primarily of demand deposit accounts and deposits in short-term U.S. treasury money market mutual funds. Cash equivalents are stated at cost, which approximates fair market value.
Concentrations of Credit Risk
Financial instruments which potentially subject the Company to concentrations of credit risk consist principally of cash and cash equivalents. The Company maintains cash accounts in commercial banks, which may, at times, exceed federally insured limits. The Company has not experienced any losses in such accounts. The Company believes it is not exposed to any significant credit risk on cash and cash equivalents.
Property and Equipment
Property and equipment are recorded at cost. Expenditures for maintenance and repairs are charged to expense while the costs of significant improvements are capitalized. Depreciation is provided using the straight-line method over the following estimated useful lives of the related assets, which is between three and five years. Upon retirement or sale, the cost of the assets disposed of and the related accumulated depreciation are eliminated from the balance sheets and related gains or losses are reflected in the statements of operations.
F-55
3. Summary of Significant Accounting Policies (Continued)
Restricted Cash
Other assets include $388 thousand that is restricted as collateral for the Company’s facility leases and $103 thousand that is restricted as collateral for a line of credit.
Long-Lived Assets
The Company reviews the carrying values of its long-lived assets for possible impairment whenever events or changes in circumstances indicate that the carrying amounts of the assets may not be recoverable. Any long-lived assets held for disposal are reported at the lower of their carrying amounts or fair values less costs to sell.
Warrants
The Company applies the accounting standard which provides guidance in assessing whether an equity-based financial instrument is indexed to an entity’s own stock for purposes of determining whether a financial instrument should be treated as a derivative. In applying the methodology the Company concluded that certain warrants issued by the Company have terms that do not meet the criteria to be considered indexed to the Company’s own stock and therefore are classified as liabilities in the Company’s balance sheet. The liability classified warrants are subject to re-measurement at each balance sheet date and any change in fair value is recognized as a component of “Other income, net” in the accompanying Statement of Operations. Fair value is measured using the binomial valuation model. In December 2011, the Company switched from the Black-Scholes valuation model to the binomial valuation model as it provides a better evaluation of the fair market value of the Company’s liability-classified warrants.
Fair Value Measurements
The Company has certain financial assets and liabilities recorded at fair value which have been classified as Level 1, 2 or 3 within the fair value hierarchy as described in the accounting standards for fair value measurements.
• | Level 1—Quoted prices in active markets for identical assets or liabilities. |
• | Level 2—Inputs other than Level 1 that are observable, either directly or indirectly, such as quoted prices for similar assets or liabilities; quoted prices in markets that are not active; or other inputs that are observable or can be corroborated by observable market data for substantially the full term of the assets or liabilities. |
• | Level 3—Unobservable inputs that are supported by little or no market activity and that are significant to the fair value of the assets or liabilities. |
Assets and liabilities measured at fair value on a recurring basis as of December 31, 2014 and 2013 are as follows:
($ in thousands) | Fair Value Measurements at Reporting Date Using | |||||||||||||||
Description | Balance as of December 31, 2014 | Quoted Prices in Active Markets for Identical Assets/Liabilities (Level 1) | Significant Other Observable Inputs (Level 2) | Significant Unobservable Inputs (Level 3) | ||||||||||||
Cash equivalents | $ | 37,290 | $ | 37,290 | $ | — | $ | — | ||||||||
Warrant liability | $ | — | $ | — | $ | — | $ | — | ||||||||
F-56
3. Summary of Significant Accounting Policies (Continued)
($ in thousands) | Fair Value Measurements at Reporting Date Using | |||||||||||||||
Description | Balance as of December 31, 2013 | Quoted Prices in Active Markets for Identical Assets/Liabilities (Level 1) | Significant Other Observable Inputs (Level 2) | Significant Unobservable Inputs (Level 3) | ||||||||||||
Cash equivalents | $ | 66,794 | $ | 66,794 | $ | — | $ | — | ||||||||
Warrant liability | $ | 11,776 | $ | — | $ | 11,776 | $ | — | ||||||||
The cash equivalents consist primarily of short term U.S. treasury money market mutual funds which are actively traded. The warrants were valued using a binomial valuation model. As of December 31, 2014, all liability classified warrants had expired. See Note 9 to the financial statements, Warrants, for additional disclosure on the valuation methodology and significant assumptions.
Revenue Recognition
The Company receives revenue from a collaboration agreement (see Note 8 to the financial statements, Commitments and Contingencies). Collaboration arrangements typically include payments for one or more of the following: non-refundable, upfront license fees, funding of research and development efforts, milestone payments if specified objectives are achieved and/or profit-sharing or royalties on product sales. Arrangements containing multiple elements are divided into separate units of accounting if certain criteria are met, including whether the delivered element has stand-alone value to the collaborative partner. The consideration received is then allocated among the separate units based on their respective fair values and the applicable revenue recognition criteria are applied to each of the separate units.
Revenue from non-refundable, upfront research and development fees is reported as research and development revenue and is recognized on a straight-line basis over the contracted or estimated period of performance, which is typically the development term. Research and development funding is earned over the period of effort.
Milestone payments are recognized as research and development revenue upon achievement of the milestone only if (1) the milestone payment is non-refundable, (2) substantive effort is involved in achieving the milestone and (3) the amount of the milestone is reasonable in relation to the effort expended or the risk associated with achievement of the milestone. If any of these conditions are not met, the milestone payment is deferred and recognized as revenue over the estimated remaining period of performance under the contract as the Company completes its performance obligations.
Research and Development Costs
Research and development expenditures are charged to the statement of operations as incurred. Such costs include proprietary research and development activities, purchased research and development, and expenses associated with research and development contracts, whether performed by the Company or contracted with independent third parties.
Income Taxes
Income taxes are accounted for under the liability method. Deferred tax assets and liabilities are recognized for the estimated future tax consequences of temporary differences between the financial statement carrying amounts
F-57
3. Summary of Significant Accounting Policies (Continued)
and their respective tax bases. Deferred tax assets and liabilities are measured using enacted tax rates expected to apply to taxable income in the year in which the temporary differences are expected to be recovered or settled. The Company evaluates the realizability of its deferred tax assets and establishes a valuation allowance when it is more likely than not that all or a portion of deferred tax assets will not be realized.
The Company accounts for uncertain tax positions using a “more-likely-than-not” threshold for recognizing and resolving uncertain tax positions. The evaluation of uncertain tax positions is based on factors including, but not limited to, changes in tax law, the measurement of tax positions taken or expected to be taken in tax returns, the effective settlement of matters subject to audit, new audit activity and changes in facts or circumstances related to a tax position. The Company evaluates this tax position on an annual basis. The Company also accrues for potential interest and penalties, related to unrecognized tax benefits in income tax expense (see Note 10 to the financial statements, Income Taxes).
Accounting for Stock-Based Compensation
Stock-based compensation cost is measured at the grant date, based on the estimated fair value of the award, and is recognized as expense over the employee’s requisite service period. Stock-based compensation expense is based on the number of awards ultimately expected to vest and is therefore reduced for an estimate of the awards that are expected to be forfeited prior to vesting. Consistent with prior years, the Company uses the Black-Scholes option pricing model which requires estimates of the expected term option holders will retain their options before exercising them and the estimated volatility of the Company’s common stock price over the expected term.
The Company recognizes the full impact of its share-based employee payment plans in the statements of operations for each of the years ended December 31, 2014, 2013, and 2012 and did not capitalize any such costs on the balance sheets. The Company recognized $3.7 million, $2.3 million, and $3.1 million of compensation expense related to vesting of employee stock options during the years ended December 31, 2014, 2013, and 2012, respectively. In the years ended December 31, 2014, 2013, and 2012, the Company recognized $1.0 million, $1.2 million, and $1.7 million of compensation expense, respectively, related to vesting of restricted stock (see Note 12 to the financial statements, Stock Option Plan). In the years ended December 31, 2014, 2013, and 2012, the Company recognized $4.7 million, $3.5 million, and $4.9 million of compensation expense, respectively, related to vesting of all employee and director awards. The following table presents share-based compensation expense included in the Company’s Statements of Operations:
Year ended December 31, | ||||||||||||
(in thousands) | 2014 | 2013 | 2012 | |||||||||
Research and development | $ | 1,416 | $ | 792 | $ | 1,917 | ||||||
General and administrative | 3,327 | 2,715 | 2,963 | |||||||||
Share based employee compensation expense before tax | 4,743 | 3,507 | 4,880 | |||||||||
Income tax benefit | — | — | — | |||||||||
Net share based employee compensation expense | $ | 4,743 | $ | 3,507 | $ | 4,880 | ||||||
The fair value of each stock option is estimated at the date of grant using the Black-Scholes option pricing model. The estimated weighted-average fair value of stock options granted to employees in 2014, 2013, and 2012 was approximately $3.58, $2.51, and $3.06 per share, respectively. Assumptions regarding volatility, expected term, dividend yield and risk-free interest rate are required for the Black-Scholes model. The volatility assumption is
F-58
3. Summary of Significant Accounting Policies (Continued)
based on the Company’s historical experience. The risk-free interest rate is based on a U.S. treasury note with a maturity similar to the option award’s expected life. The expected life represents the average period of time that options granted are expected to be outstanding. The Company calculated expected term using the simplified method described in SEC Staff Accounting Bulletin, or SAB, No. 107 and No. 110 as it continues to meet the requirements promulgated in Staff Accounting Bulletin No. 110. The assumptions for volatility, expected life, dividend yield and risk-free interest rate are presented in the table below:
2014 | 2013 | 2012 | ||||
Weighted average risk-free interest rate | 1.74 - 2.11% | 1.00 - 2.10% | 0.79 - 1.13% | |||
Expected life in years | 6 | 6 | 6 | |||
Expected volatility | 85.22 - 94.55% | 83.40 - 95.96% | 83.36 - 83.53% | |||
Expected dividend yield | — | — | — | |||
Net Loss Per Share
Basic net loss per share is computed by dividing net loss by the weighted average number of common shares outstanding for the period. The Company’s potential dilutive shares, which include outstanding common stock options, unvested restricted stock and warrants, have not been included in the computation of diluted net loss per share for any of the periods presented as the result would be antidilutive. Such potential common shares at December 31, 2014, 2013, and 2012 consist of the following:
December 31, | |||||||||
2014 | 2013 | 2012 | |||||||
Stock options | 6,505,664 | 6,747,303 | 7,147,303 | ||||||
Unvested restricted stock | 144,508 | 352,865 | 733,739 | ||||||
Warrants | — | 10,539,767 | 11,197,454 | ||||||
6,650,172 | 17,639,935 | 19,078,496 | |||||||
New Accounting Pronouncements
In August 2014, the FASB issued ASU 2014-15, Presentation of Financial Statements—Going Concern (Subtopic 205-40) in which management should evaluate whether there are conditions or events, considered in the aggregate, that raise substantial doubt about the entity’s ability to continue as a going concern within one year after the date that the financial statements are issued (or within one year after the date that the financial statements are available to be issued when applicable). When management identifies conditions or events that raise substantial doubt about an entity’s ability to continue as a going concern, management should consider whether its plans that are intended to mitigate those relevant conditions or events will alleviate the substantial doubt. This update is effective for annual periods beginning after December 15, 2016, and early application is permitted for any annual or interim period thereafter.
On June 10, 2014, the FASB issued ASU 2014-10, Development Stage Entities (Topic 915), which simplifies financial reporting for development stage entities by eliminating requirements specific to development stage entities. As a result, entities in a development stage will no longer need to present inception-to-date information about income statement line items, cash flows, and equity transactions. Instead, the new guidance clarifies how these entities should tailor existing disclosures to explain the risks and uncertainties related to their activities. This update is effective for annual periods beginning after December 15, 2014, and early application is permitted
F-59
3. Summary of Significant Accounting Policies (Continued)
for any annual or interim period for which the entity’s financial statements have not yet been issued. The Company adopted this guidance prior to issuing the financial statements in this Quarterly Report on Form 10-Q. The adoption of ASU 2014-10 impacted presentation and disclosure only and did not have any impact on financial position or results of operations.
In May 2014, the FASB issued ASU 2014-09, Revenue from Contracts with Customers (Topic 606), which clarifies the principles for recognizing revenue and develops a common revenue standard for U.S. GAAP and IFRS. This standard removes inconsistencies and weaknesses between U.S. GAAP and IFRS in revenue requirements, provides a more robust framework for addressing revenue issues, improves comparability of revenue recognition practices across entities, industries, jurisdictions, and capital markets, provides more useful information to users of financial statements through improved disclosure requirements, and simplifies the preparation of financial statements by reducing the number of requirements to which an entity must refer. This update is effective for annual periods beginning after December 15, 2016, including interim periods within that reporting period and early application is not permitted. The company believes that the adoption of this standard will not have an impact on our financial position or results of operations.
4. Restructuring
The Company underwent restructuring activities during the year ended December 31, 2013 which included a reduction in workforce and office space, resulting in sublease agreements in Boston and New York. As a result, the Company incurred restructuring charges of $1.7 million, $0.6 million was included in general and administrative expenses and $1.1 million was included in research and development expenses. The Company also incurred charges for exit and disposal activities from the Boston and New York sublease agreements which resulted in an aggregate loss of $0.8 million recorded in general and administrative expenses, and a loss on the disposal of fixed assets of $0.6 million, recorded in Other income in the Statement of Operations for the year ended December 31, 2013.
On October 17, 2013, the Company entered into a sublease agreement to lease 7,259 square feet in our New York office to a subtenant. The Company remains primarily liable to pay rent on the original lease. Accordingly, the Company recorded a loss on the sublease in the amount of $729 thousand for the year ended December 31, 2013, representing the remaining contractual obligation of $2.3 million, less $1.6 million in payments from our subtenant. The Company retired assets in this subleased area as a result of this sublease with a net book value of $392 thousand, and recorded a loss on disposal of fixed assets for the same amount for the year ended December 31, 2013.
On August 30, 2013, the Company entered into a sublease agreement to lease 5,249 square feet in our Boston office to a subtenant. The Company remains primarily liable to pay rent on the original lease. The Company recorded a loss on the sublease in the amount of $42 thousand for the year ended December 31, 2013, representing the remaining contractual obligation of $367 thousand, less $325 thousand in payments from our subtenant. The Company retired assets in this subleased area as a result of this sublease with a net book value of $194 thousand, and recorded a loss on disposal of fixed assets. The company previously held a security deposit of $20 thousand in accordance with the sublease, which was recorded in other non-current assets and other liabilities on the balance sheet for the year ended December 31, 2013. This sublease tenant vacated the lease in October 2014. As of December 31, 2014, the company applied the $20 thousand deposit against outstanding rent. The company is actively pursuing a subtenant to lease a portion of the space in the Boston Office that was vacated by a previous subtenant.
On July 16, 2012, the Company announced that it restructured its management team and closed its Germantown, MD office. As a result of this action, the Company recorded a restructuring charge, consisting primarily of
F-60
4. Restructuring (Continued)
severance, stock based compensation associated with stock option modifications (see Note 12 to the financial statements, Stock Option Plan) and health benefit continuation costs of approximately $1.3 million. These costs are included in general and administrative expense for the year ended December 31, 2012.
5. Property and Equipment, net
Property and equipment, net, consists of the following:
December 31, | ||||||||
(in thousands) | 2014 | 2013 | ||||||
Office and computer equipment | $ | 1,094 | $ | 1,076 | ||||
Software | 874 | 884 | ||||||
Leasehold improvements | 927 | 841 | ||||||
Manufacturing equipment | 251 | 153 | ||||||
3,146 | 2,954 | |||||||
Less: accumulated depreciation | (2,615 | ) | (2,153 | ) | ||||
Property and equipment, net | $ | 531 | $ | 801 | ||||
Depreciation and amortization charged to the Statement of Operations for the years ended December 31, 2014, 2013, and 2012 was: $462 thousand, $738 thousand and, $658 thousand, respectively.
6. Accrued Expenses
Accrued expenses consist of the following:
December 31, | ||||||||
(in thousands) | 2014 | 2013 | ||||||
Clinical consulting services | $ | 2,802 | $ | 3,751 | ||||
Preclinical services | 2,027 | 513 | ||||||
Employee compensation | 768 | 252 | ||||||
Professional services | 422 | 582 | ||||||
Payroll taxes and benefits | 417 | 255 | ||||||
Manufacturing services | 308 | 547 | ||||||
Other consulting services | 226 | 230 | ||||||
Accrued vacation | 212 | 227 | ||||||
Accrued expenses | $ | 7,182 | $ | 6,357 | ||||
7. Related Party Transactions
On January 6, 2011, the Company entered into an Exclusive Channel Partner Agreement, or Channel Agreement, with Intrexon Corporation, or Intrexon (see Note 8 to the financial statements, Commitments and Contingencies, for additional disclosure relating to the Channel Agreement). Our director, Randall J. Kirk, is the CEO, a director, and the largest stockholder of Intrexon. During the year ended December 31, 2012, the Company paid Intrexon approximately $11.4 million, of which $6.6 million was for preclinical and clinical research services already incurred and the remaining $4.8 million was for services expected to be incurred within a year. This amount was included as part of prepaid expenses and other current assets on the balance sheet as of December 31, 2012. During the year ended December 31, 2013, the Company expensed $7.8 million for services performed by Intrexon, of which $4.8 million was applied to the prepaid balance in other current assets, $2.4 million was paid to Intrexon and $0.6 million was recorded in accrued expenses. As of December 31, 2013, the prepaid balance in other current assets on the accompanying balance sheet has been reduced to $0. During the
F-61
7. Related Party Transactions (Continued)
year ended December 31, 2014, the Company expensed $12.0 million for services performed by Intrexon, of which $10.1 million was paid to Intrexon and $1.9 million was recorded in accounts payable and accrued expenses. As of December 31, 2014, the prepaid balance in other current assets on the accompanying balance sheet has been reduced to $0.
On January 25, 2012, Intrexon purchased 1,923,075 shares of common stock in the Company’s public offering (see Note 2 to the financial statements, Financings).
On November 7, 2012, the Company issued 3,636,926 shares of common stock to Intrexon (see Note 11 to the financial statements, Preferred Stock and Stockholders’ Equity).
On October 29, 2013, Intrexon purchased 2,857,143 shares of common stock in the Company’s public offering (see Note 2 to the financial statements, Financings).
On February 2, 2015, Intrexon purchased 1,440,000 shares of common stock in the Company’s public offering (see Note 2 to the financial statements, Financings).
Intrexon’s purchases were made on terms that were the same as others participating in the above financings.
8. Commitments and Contingencies
Operating Leases
Prior to December 31, 2012, the Company entered into an operating lease in New York, NY, consisting of 6,251 square feet of office space. In accordance with this agreement, the Company entered into a letter of credit in the amount of $388 thousand, naming the Company’s landlord as beneficiary. In January 2012, the Company amended the lease agreement, adding 1,008 square feet of office space. As of December 31, 2012, the Company occupied 7,259 square feet of space in New York, NY, and maintained a $388 thousand letter of credit. The collateral for the letter of credit is recorded in other non-current assets on the balance sheet as of December 31, 2014. The lease for office space in New York, NY expires in October 2018.
On October 17, 2013, the Company entered into a sublease agreement to lease 7,259 square feet in our New York office to a subtenant. The Company remains primarily liable to pay rent on the original lease. The Company recorded a loss on the sublease in the amount of $729 thousand for the year ended December 31, 2013, representing the remaining contractual obligation of $2.3 million, less $1.6 million in payments from our subtenant. The Company retired assets in this subleased area as a result of this sublease with a net book value of $392 thousand, and recorded a loss on disposal of fixed assets for the same amount for the year ended December 31, 2013. The Company continues to maintain a $388 thousand letter of credit. The collateral for the letter of credit is recorded in other non-current assets on the balance sheet as of December 31, 2014. The lease for office space in New York, NY expires in October 2018.
Prior to December 31, 2012, the Company entered into separate operating lease agreements for various spaces in a building in Boston, MA. That space consisted of 5,249 square feet on the first floor, 8,538 square feet on the second floor, and 6,959 square feet on the third floor. In June 2012, the Company re-negotiated a master lease for the entire Boston office space, added 9,800 square feet of office space on the fourth floor, surrendered 4,113 square feet from the second floor, and incorporated all floors’ lease agreements under the same master agreement expiring in August 2016. The Company provided an additional $41 thousand security deposit for the additional space on the fourth floor. As of December 31, 2012, a total security deposit of $127 thousand was paid to its landlord for security deposits for these agreements.
F-62
8. Commitments and Contingencies (Continued)
On August 30, 2013, the Company entered into a sublease agreement to lease 5,249 square feet in our Boston office to a subtenant. The Company remains primarily liable to pay rent on the original lease. The Company recorded a loss on the sublease in the amount of $42 thousand for the year ended December 31, 2013, representing the remaining contractual obligation of $367 thousand, less $325 thousand in payments from our subtenant. The Company retired assets in this subleased area as a result of this sublease with a net book value of $194 thousand, and recorded a loss on disposal of fixed assets. The company previously held a security deposit of $20 thousand in accordance with the sublease, which was recorded in other non-current assets and other liabilities on the balance sheet for the year ended December 31, 2013. This sublease tenant vacated the lease in October 2014. As of December 31, 2014, the company applied the $20 thousand deposit against outstanding rent. The company is actively pursuing a subtenant to lease a portion of the space in the Boston Office that was vacated by a previous subtenant.
As of December 31, 2014, the Company occupies 21,184 square feet of space in its Boston, MA office and has paid a total of $127 thousand for security deposits, which are recorded in other non-current assets on the balance sheet.
In April 2011, the Company entered into an operating lease for office space in Germantown, MD, consisting of 2,227 square feet. As of December 31, 2011, the Company recorded the $4 thousand security deposit in other non-current assets on the balance sheet. The lease would have expired in March 2014; however, on July 16, 2012, the Germantown, Maryland office was closed. In June 2013, the Company paid off the remainder of the Germantown, Maryland lease obligation.
Future net minimum lease payments under operating leases as of December 31, 2014 are as follows (in thousands):
2015 | $ | 1,235 | |
2016 | 997 | ||
2017 | 501 | ||
2018 | 424 | ||
2019 | — | ||
3,157 | |||
Less: contractual sublease income | (1,224 | ) | |
Future minimum lease payments, net | $ | 1,933 | |
Total rent expense was approximately $1.2 million, $1.0 million, and $1.1 million for the years ended December 31, 2014, 2013, and 2012. The Company records rent expense on a straight-line basis over the term of the lease. Accordingly, the Company has recorded a liability for deferred rent at December 31, 2014 and 2013 of $850 thousand ($280 thousand current and $570 long-term) and $1.1 million ($212 thousand current and $851 long-term) respectively, which is recorded in deferred rent on the balance sheet.
License Agreements
Exclusive Channel Partner Agreement with Intrexon Corporation
On January 6, 2011, the Company entered into an Exclusive Channel Partner Agreement, or the Channel Agreement, with Intrexon that governs a “channel partnering” arrangement in which the Company uses
F-63
8. Commitments and Contingencies (Continued)
Intrexon’s technology directed towards in vivo expression of effectors in connection with the development of Ad-RTS-IL-12 + veledimex and DC-RTS-IL-12 + veledimex and generally to research, develop and commercialize products, in each case in which DNA is administered to humans for expression of anti-cancer effectors for the purpose of treatment or prophylaxis of cancer, which the Company collectively refer to as the Cancer Program. The Channel Agreement establishes committees comprised of representatives of us and Intrexon that govern activities related to the Cancer Program in the areas of project establishment, chemistry, manufacturing and controls, clinical and regulatory matters, commercialization efforts and intellectual property.
The Channel Agreement grants us a worldwide license to use patents and other intellectual property of Intrexon in connection with the research, development, use, importing, manufacture, sale, and offer for sale of products involving DNA administered to humans for expression of anti-cancer effectors for the purpose of treatment or prophylaxis of cancer, which we collectively refer to as the ZIOPHARM Products. Such license is exclusive with respect to any clinical development, selling, offering for sale or other commercialization of ZIOPHARM Products, and otherwise is non-exclusive. Subject to limited exceptions, the Company may not sublicense the rights described without Intrexon’s written consent.
Under the Channel Agreement, and subject to certain exceptions, the Company is responsible for, among other things, the performance of the Cancer Program, including development, commercialization and certain aspects of manufacturing of ZIOPHARM Products. Intrexon is responsible for the costs of establishing manufacturing capabilities and facilities for the bulk manufacture of products developed under the Cancer Program, certain other aspects of manufacturing and costs of discovery-stage research with respect to platform improvements and costs of filing, prosecution and maintenance of Intrexon’s patents.
Subject to certain expense allocations and other offsets provided in the Channel Agreement, the Company will pay Intrexon on a quarterly basis 50% of net profits derived in that quarter from the sale of ZIOPHARM Products, calculated on a ZIOPHARM Product-by- ZIOPHARM Product basis. The Company has likewise agreed to pay Intrexon on a quarterly basis 50% of revenue obtained in that quarter from a sublicensor in the event of a sublicensing arrangement. In addition, in partial consideration for each party’s execution and delivery of the Channel Agreement, the Company entered into a Stock Purchase Agreement with Intrexon.
Upon termination of the Channel Agreement, the Company may continue to develop and commercialize any ZIOPHARM Product that, at the time of termination:
• | is being commercialized by us; |
• | Has received regulatory approval; |
• | Is a subject of an application for regulatory approval that is pending before the applicable regulatory authority; or |
• | Is the subject of at least an ongoing Phase 2 clinical trial (in the case of a termination by Intrexon due to an uncured breach or a voluntary termination by us), or an ongoing Phase 1 clinical trial in the field (in the case of a termination by us due to an uncured breach or a termination by Intrexon following an unconsented assignment by us or our election not to pursue development of a Superior Therapy). |
F-64
8. Commitments and Contingencies (Continued)
Our obligation to pay 50% of net profits or revenue described above with respect to these “retained” products will survive termination of the Channel Agreement.
License Agreement—The University of Texas M. D. Anderson Cancer Center
On January 13, 2015, the Company, together with Intrexon, entered into a license agreement, or the License, with MD Anderson. Pursuant to the License, the Company and Intrexon hold an exclusive, worldwide license to certain technologies owned and licensed by MD Anderson including technologies relating to novel chimeric antigen receptor (CAR) T-cell therapies arising from the laboratory of Laurence Cooper, M.D., Ph.D., professor of pediatrics at MD Anderson, as well as either co-exclusive or non-exclusive licenses under certain related technologies.
Pursuant to the terms of the License, MD Anderson will receive, within sixty days of the date of the License, consideration of $50 million in shares of our common stock (or 10,124,561 shares), and $50 million in shares of Intrexon’s common stock in each case based on a trailing 20 day volume weighted average of the closing price of the Company’s and Intrexon’s common stock ending on the date prior to the announcement of the entry into the License, collectively referred to as the License Shares, pursuant to the terms of the License Shares Securities Issuance Agreement described below. The Company and Intrexon also agreed to reimburse MD Anderson for out of pocket expenses for maintaining patents covering the licensed technologies.
In addition, pursuant to the License, MD Anderson has agreed to transfer to us certain existing research programs described in the License and to grant to Intrexon and us certain additional technology rights related thereto. In connection with such transfer, the terms of the License also require us and Intrexon to enter into a research and development agreement with MD Anderson pursuant to which the Company will provide funding for certain research and development activities of MD Anderson for a period of three years, in an amount between $15 and $20 million per year. The first quarterly payment of $3.75 million due under this arrangement is required to be made by us within 60 days of the date of the License.
The term of the License expires on the last to occur of (a) the expiration of all patents licensed thereunder, or (b) the twentieth anniversary of the date of the License; provided, however, that following the expiration of the term, the Company and Intrexon shall then have a fully-paid up, royalty free, perpetual, irrevocable and sublicensable license to use the licensed intellectual property thereunder. After ten years from the date of the License and subject to a 90 day cure period, MD Anderson will have the right to convert the License into a non-exclusive license if the Company and Intrexon are not using commercially reasonable efforts to commercialize the licensed intellectual property on a case-by-case basis. After five years from the date of the License and subject to a 180 day cure period, MD Anderson will have the right to terminate the License with respect to specific technology(ies) funded by the government or subject to a third party contract if the Company and Intrexon are not meeting the diligence requirements in such funding agreement or contract, as applicable. Subject to a 30 day cure period, MD Anderson has the right to terminate the License if the Company and Intrexon fail to timely deliver the shares due in consideration for the License. MD Anderson may also terminate the agreement with written notice upon material breach by us and Intrexon, if such breach has not been cured within 60 days of receiving such notice. In addition, the License will terminate upon the occurrence of certain insolvency events for both us and Intrexon and may be terminated by the mutual written agreement of us, Intrexon and MD Anderson.
On January 9, 2015, in order to induce MD Anderson to enter into the License on an accelerated schedule, the Company and Intrexon entered into a letter agreement, or the Letter Agreement, pursuant to which MD Anderson will receive consideration of $7.5 million in shares of common stock (or 1,597,602 shares), and $7.5 million in
F-65
8. Commitments and Contingencies (Continued)
shares of Intrexon’s common stock in each case based on a trailing 20 day volume weighted average of the closing price of the our and Intrexon’s common stock ending on the date prior to the Letter Agreement, collectively referred to as the Incentive Shares, in the event that the License was entered into on or prior to 8:00 am pacific time on January 14, 2015, referred to as the Accelerated Closing Deadline. The Incentive Shares will be issued to MD Anderson within sixty days of the date of the License pursuant to the terms of the Incentive Shares Securities Issuance Agreement described below.
In connection with the entry into the License, on January 13, 2015, the Company entered into a Securities Issuance Agreement with MD Anderson, or the License Shares Securities Issuance Agreement, pursuant to which the Company agreed to issue and sell the License Shares to MD Anderson in consideration for the License. The closing of the issuance and sale of the License Shares under the License Shares Securities Issuance Agreement will occur within sixty days of the date of the License, subject to customary closing conditions.
In connection with the entry into the Letter Agreement, on January 13, 2015, the Company entered into a Securities Issuance Agreement with MD Anderson, or the Incentive Shares Securities Issuance Agreement, pursuant to which the Company agreed to issue and sell the Incentive Shares to MD Anderson in consideration for the execution and delivery of the License on or prior to the Accelerated Closing Deadline in connection with the Letter Agreement. The closing of the issuance and sale of the Incentive Shares under the Incentive Shares Securities Issuance Agreement will occur within sixty days of the date of the License, subject to customary closing conditions.
Also in connection with the License and the issuance of the License Shares and the Incentive Shares, on January 13, 2015, the Company and MD Anderson entered into a Registration Rights Agreement, or the Registration Rights Agreement, pursuant to which the Company agreed to file a “resale” registration statement, or the Registration Statement, registering the resale of the License Shares, the Incentive Shares and any other shares of our common stock held by MD Anderson on the date that the Registration Statement is filed, within 15 days of the closing under the License Shares Securities Issuance Agreement. Under the Registration Rights Agreement, the Company is obligated to use our reasonable best efforts to cause the Registration Statement to be declared effective as promptly as practicable after filing and in no event later than 120 days of the closing under the License Shares Securities Issuance Agreement and to maintain the effectiveness of the Registration Statement until all securities therein are sold or are otherwise can be sold pursuant to Rule 144, without any restrictions.
License Agreement with DEKK-Tec, Inc.
On October 15, 2004, the Company entered into a license agreement with DEKK-Tec, Inc., pursuant to which it was granted an exclusive, worldwide license for palifosfamide.
In consideration for the license rights, DEKK-Tec is entitled to receive payments upon achieving certain milestones in varying amounts which on a cumulative basis may total $4.0 million. Of the aggregate milestone payments, most will be creditable against future royalty payments as referenced below. Additionally, the Company issued DEKK-Tec an option to purchase 27,616 shares of the Company’s common stock for $0.02 per share, of which 13,808 options are still outstanding. DEKK-Tec is entitled to receive single digit percentage royalty payments on the sales of palifosfamide should it be approved for commercial sale. The Company’s obligation to pay royalties will terminate on a country-by-country basis upon the expiration of all valid claims of patents in such country covering licensed product, subject to earlier termination in the event of defaults by the parties under the license agreement. No milestones under the license agreement have been reached or expensed since 2010.
F-66
8. Commitments and Contingencies (Continued)
License Agreement with Southern Research Institute
On December 22, 2004, the Company entered into an Option Agreement with the Southern Research Institute, or SRI, pursuant to which the Company was granted an exclusive option to obtain an exclusive license to SRI’s interest in certain intellectual property, including exclusive rights related to certain isophosphoramide mustard analogs. On February 5, 2007, the Company exercised its option and entered into the exclusive license agreement. Under the license agreement, the Company is required to remit minimum annual royalty payments of $25 thousand until the first commercial sale of a licensed product. These payments were made for the years ended December 31, 2014, 2013, and 2012. The Company may be required to make payments upon achievement of certain milestones in varying amounts which on a cumulative basis could total up to $775 thousand. In addition, SRI will be entitled to receive single digit percentage royalty payments on the sales of a licensed product in any country until all licensed patents rights in that country which are utilized in the product have expired. No milestones under the license agreement were reached or expensed since the agreement’s inception.
Patent and Technology License Agreement—The University of Texas M. D. Anderson Cancer Center and the Texas A&M University System.
On August 24, 2004, the Company entered into a patent and technology license agreement with The Board of Regents of the University of Texas System, acting on behalf of The University of Texas M. D. Anderson Cancer Center and the Texas A&M University System, which the Company refers to, collectively, as the Licensors. Under this agreement, the Company was granted an exclusive, worldwide license to rights (including rights to U.S. and foreign patent and patent applications and related improvements and know-how) for the manufacture and commercialization of two classes of organic arsenicals (water- and lipid-based) for human and animal use. The class of water-based organic arsenicals includes darinaparsin.
The Company issued options to purchase 50,222 shares outside the 2003 Stock Option Plan for $0.002 per share following the successful completion of certain clinical milestones, of which 37,666 have vested. The remaining 12,556 shares will vest upon enrollment of the first patient in a multi-center pivotal clinical trial i.e. a human clinical trial intended to provide the substantial evidence of efficacy necessary to support the filing of an approvable New Drug Application, or NDA. In addition, the Licensors are entitled to receive certain milestone payments. The Company may be required to make additional payments upon achievement of certain other milestones in varying amounts which on a cumulative basis could total up to an additional $4.5 million. In addition, the Licensors are entitled to receive single digit percentage royalty payments on sales from a licensed product and will also be entitled to receive a portion of any fees that the Company may receive from a possible sublicense under certain circumstances.
The license agreement also contains other provisions customary and common in similar agreements within the industry, such as the right to sublicense the Company rights under the agreement. On July 31, 2014, the Company amended and restated the License and Collaboration Agreement between the Company and Solasia Pharma K.K. or Solasia, granting to Solasia an exclusive worldwide license to develop and commercialize darinaparsin, and related organoarsenic molecules, in both intravenous and oral forms in all indications for human use. Solasia will be responsible for all costs related to the development, manufacturing and commercialization of darinaparsin. The Licensors will receive a portion of all milestone and royalty payments made by Solasia to the Company in accordance with the terms of the Company’s license agreement with the Licensors.
Collaboration Agreement with Solasia Pharma K.K.
On March 7, 2011, the Company entered into a License and Collaboration Agreement with Solasia Pharma K.K., or Solasia.
F-67
8. Commitments and Contingencies (Continued)
Pursuant to the License and Collaboration Agreement, the Company granted Solasia an exclusive license to develop and commercialize darinaparsin in both IV and oral forms and related organic arsenic molecules, in all indications for human use in a pan- Asian/Pacific territory comprised of Japan, China, Hong Kong, Macau, Republic of Korea, Taiwan, Singapore, Australia, New Zealand, Malaysia, Indonesia, Philippines and Thailand.
As consideration for the license, the Company received an upfront payment of $5.0 million to be used exclusively for further clinical development of darinaparsin outside of the pan-Asian/Pacific territory, and will be entitled to receive additional payments of up to $32.5 million in development-based milestones and up to $53.5 million in sales-based milestones. The Company will also be entitled to receive double digit royalty payments from Solasia based upon net sales of licensed products in the applicable territories, once commercialized, and a percentage of sublicense revenues generated by Solasia. Under the License and Collaboration Agreement, the Company provided Solasia with drug product to conduct clinical trials. These transfers were accounted for as a reduction of research and development costs and an increase in collaboration receivables. The agreement provides that Solasia will be responsible for the development and commercialization of darinaparsin in the pan-Asian/Pacific territory.
On July 31, 2014, the Company entered into an amendment and restatement of the License and Collaboration Agreement granting Solasia an exclusive worldwide license to develop and commercialize darinaparsin, and related organoarsenic molecules, in both intravenous and oral forms in all indications for human use. In exchange, the Company will be eligible to receive from Solasia development-and sales-based milestones, a royalty on net sales of darinaparsin, once commercialized, and a percentage of any sublicense revenues generated by Solasia. Solasia will be responsible for all costs related to the development, manufacturing and commercialization of darinaparsin. The Company’s Licensors will receive a portion of all milestone and royalty payments made by Solasia to the Company in accordance with the terms of the Company’s license agreement with the Licensors.
The $5.0 million upfront payment received in March 2011 is being amortized over the period of the Company’s research and development effort. The Company originally estimated this period to be 75 months. In accordance with the amended and restated License and Collaboration Agreement with Solasia, the Company is no longer obligated to continue their research and development efforts in connection with the upfront payment. However, there are certain deliverables that are included in the amended and restated License and Collaboration Agreement including transfer of intellectual property and prior research and development results, which were originally estimated by management to be completed by March 31, 2015 when the amended and restated License and Collaboration Agreement was signed in July 2014. Management reassessed the period of performance related to the remaining transitional services to be completed under the agreement and determined that the services are now expected to be completed by December 31, 2015. As a result, the Company has determined that the estimated remaining period for delivering the transitional services at September 30, 2014 was 15 months through December 31, 2015. Accordingly, the Company has recorded $1.4 million in revenue during the twelve months ended December 31, 2014 while the remaining deferred revenue balance of $1.4 million at December 31, 2014 has been classified as current.
License Agreement with Baxter Healthcare Corporation
On November 3, 2006, the Company entered into a definitive Asset Purchase Agreement for indibulin and a License Agreement to proprietary nanosuspension technology with affiliates of Baxter Healthcare S.A. The purchase included the entire indibulin intellectual property portfolio as well as existing drug substance and capsule inventories. The terms of the Asset Purchase Agreement included an upfront cash payment and an additional payment for existing inventory.
F-68
8. Commitments and Contingencies (Continued)
During each of the years ended December 31, 2014, 2013, and 2012, the installment payments of $250 thousand were met and expensed.
Collaboration Agreement with Harmon Hill, LLC
On April 8, 2008, the Company signed a collaboration agreement for Harmon Hill, LLC, or Harmon Hill, to provide consulting and other services for the development and commercialization of oncology therapeutics by ZIOPHARM.
The Company expensed $200 thousand during the year ended December 31, 2012 under this agreement. This agreement expired on November 8, 2012.
On June 27, 2013, the Company signed a new collaboration agreement with Harmon Hill to provide consulting and other services for the development and commercialization of oncology therapeutics by ZIOPHARM, effective April 1, 2013. Under the agreement the Company has agreed to pay Harmon Hill $15 thousand per month for the consulting services. Subject to renewal or extension by the parties, the term of the agreement is for a one year period. The Company expensed $135 thousand and $180 thousand for the years ended December 31, 2013 and 2014, respectively.
CRO Services Agreement with Novella Clinical, Inc.
On December 4, 2008, the Company entered into a Master Clinical Research Organization Services Agreement with Novella Clinical, Inc., or Novella, under which Novella provides CRO services in support of our clinical trials. The work order for the newest trial being conducted by Novella was signed on November 2, 2012. Novella was entitled to cumulative payments of up to $790 thousand under these arrangements, which is payable in varying amounts upon Novella achieving specified milestones. During the year ended December 31, 2012, the Company expensed $256 thousand upon the achievement of various milestones. During the year ended December 31, 2013, two database related milestones and one site activation related milestone were met and expensed totaling $136 thousand.
On August 18, 2014 and November 6, 2014, the Company signed two amendments of the Master Clinical Research Organization Services Agreement with Novella. The amendments reflect the removal of data management, statistical and clinical study report services, as well as a change in the timeline and scope of clinical trial support. During the year ended December 31, 2014, three clinical milestones were met and expensed totaling $236 thousand.
CRO Services Agreement with MS Clinical Services, LLC.
On July 24, 2014, the Company entered into a Master Clinical Research Organization Services Agreement with MS Clinical Services, LLC., or Medsource, under which Medsource provides CRO services in support of our clinical trials. There are no milestones associated with this agreement.
F-69
8. Commitments and Contingencies (Continued)
CRO Services Agreement with PPD Development, L. P.
The Company was party to a Master Clinical Research Organization Services Agreement with PPD Development, L. P., or PPD, dated January 29, 2010, a related work order dated June 25, 2010 and a related work order dated April 8, 2011 under which PPD provides clinical research organization, or CRO, services in support of the Company’s clinical trials. During the years ended December 31, 2012 and 2013, the Company expensed $3.8 million and $9.2 million respectively. There are no remaining milestones related to this agreement.
CRO Services Agreement with Pharmaceutical Research Associates, Inc.
On December 13, 2011, the Company entered into a Master Clinical Research Organization Services Agreement with Pharmaceutical Research Associates, Inc., or PRA, under which PRA provides CRO services in support of our clinical trials. During the years ended December 31, 2012 and 2013, the Company expensed $7.3 million and $2.2 million, respectively. There are no remaining milestones related to this agreement.
9. Warrants
The Company has issued both warrants that are accounted for as liabilities and warrants that are accounted for as equity instruments.
The Company follows accounting standards that provide guidance in assessing whether an equity-issued financial instrument is indexed to an entity’s own stock for purposes of determining whether a financial instrument should be treated as a derivative and classified as a liability. Accounting standards require that liability classified warrants be recorded at their fair value at each financial reporting period and the resulting gain or loss be recorded as other income (expense) in the Statements of Operations. Fair value is measured using the binomial valuation model.
In connection with the December 2009 public offering, the Company issued warrants to purchase an aggregate of 8,206,520 shares of common stock (including the investor warrants and 464,520 warrants issued to the Underwriters). The investor warrants were exercisable immediately and the underwriter warrants exercisable six months after the date of issuance. The warrants had an exercise price of $4.02 per share and a 5 year term. The fair value of the warrants was estimated at $22.9 million using a Black-Scholes model with the following assumptions: expected volatility of 105%, risk free interest rate of 2.14%, expected life of 5 years and no dividends.
Subject to certain exceptions, these warrants provide for anti-dilution protection should common stock or common stock equivalents be subsequently issued at a price less than the exercise price of the warrants then in effect, which was initially $4.02 per share. This provision was triggered in 2013 when stock was sold at $3.50 per share in our 2013 public offering. Accordingly, the outstanding warrants were increased by 184,367 warrants to 8,235,076 warrants.
The Company assessed whether the 2009 Warrants required accounting as derivatives. The Company determined that the warrants were not indexed to the Company’s own stock in accordance with accounting standards codification Topic 815, Derivatives and Hedging. As such, the Company concluded the warrants did not meet the scope exception for determining whether the instruments required accounting as derivatives and should be classified in liabilities.
On December 31, 2013, the liability-classified warrants were valued at $11.8 million using a Binomial/Monte Carlo valuation model. The decrease in the fair value of the warrant liabilities of $1.2 million for the year ended December 31, 2013 was recorded as Other income, net in the Statements of Operations.
F-70
9. Warrants (Continued)
On December 31, 2012, the liability-classified warrants were valued at $13.0 million using a Binomial/Monte Carlo valuation model. The decrease in the fair value of the warrant liabilities of $6.1 million for the year ended December 31, 2012 was recorded as Other income, net in the Statements of Operations.
The following pricing assumptions were used in the Binomial/Monte Carlo valuation model at December 31, 2013 and 2012:
December 31, 2013 | December 31, 2012 | |||||
Risk-free interest rate | 0.13 | % | 0.25 | % | ||
Expected life in years | 0.94 | 1.94 | ||||
Expected volatility | 80 | % | 70 | % | ||
Expected dividend yield | — | — | ||||
Warrants accounted for as equity instruments include the following issuances:
In connection with its 2009 private placement, the Company issued warrants to purchase an aggregate of 2,910,954 shares of common stock (including 138,617 warrants issued to the placement agents) which were exercisable immediately. The warrants have an exercise price of $2.04 per share and have a 5 year term. The fair value of the warrants was estimated at $4.2 million using a Black-Scholes model with the following assumptions: expected volatility of 105%, risk free interest rate of 2.41%, expected life of 5 years and no dividends. The fair value of the warrants was recorded in the equity section of the balance sheet. In October 2009, 136,986 of these warrants were exercised.
During 2012, no new warrants were issued. However, 553,914 warrants were exercised for 259,660 shares of common stock. Of these warrants, 186,297 were equity-classified and 373,617 were liability-classified. Additionally, 1,359,317 equity-classified warrants and 579 liability-classified warrants expired without being exercised.
During 2013, no new warrants were issued. However 135,346 warrants were exercised for 112,808 shares of common stock. Of these warrants, all 135,346 were equity-classified; there were no liability-classified warrants exercised. Additionally, 706,708 equity-classified warrants expired without being exercised.
During 2014, no new warrants were issued. However 4,004,907 warrants were exercised for 3,725,277 shares of common stock. Of these warrants, 2,249,062 were equity-classified and 1,755,845 were liability-classified warrants. Additionally, 12,329 equity-classified warrants and 6,479,231 liability-classified warrants expired without being exercised.
All warrants have expired and none are outstanding as of December 31, 2014.
F-71
10. Income Taxes
There is no provision for income taxes because the Company has incurred operating losses since inception. The reported amount of income tax expense for the years differs from the amount that would result from applying domestic federal statutory tax rates to pretax losses primarily because of the changes in the valuation allowance. Significant components of the Company’s deferred tax assets at December 31, 2014 and 2013 are as follows:
December 31, | ||||||||
(in thousands) | 2014 | 2013 | ||||||
Net operating loss carryforwards | $ | 79,050 | $ | 66,209 | ||||
Start-up and organizational costs | 38,562 | 41,529 | ||||||
Research and development credit carryforwards | 26,112 | 25,058 | ||||||
Stock compensation | 1,181 | 1,028 | ||||||
Capitalized acquisition costs | 11,376 | 12,323 | ||||||
Deferred revenue | 534 | 1,074 | ||||||
Depreciation | 208 | 129 | ||||||
Other | 1,547 | 1,254 | ||||||
158,570 | 148,604 | |||||||
Less valuation allowance | (158,570 | ) | (148,604 | ) | ||||
Net deferred tax assets | $ | — | $ | — | ||||
Deferred income taxes reflect the net tax effects of temporary differences between the carrying amount of assets and liabilities for financial reporting purposes and the amounts used for income tax purposes. At December 31, 2014, the Company has aggregate net operating loss carryforwards for federal tax purposes of approximately $206.9 million available to offset future federal taxable income to the extent permitted under the Internal Revenue Code of 1986, as amended, or IRC, expiring in varying amounts through 2033. Additionally, the Company has approximately $26.0 million of research and development credits at December 31, 2014, expiring in varying amounts through 2033, which may be available to reduce future taxes.
Under the IRC Section 382, certain substantial changes in the Company’s ownership may limit the amount of net operating loss carryforwards that can be utilized in any one year to offset future taxable income. The net operating loss carryforwards for the year ended December 31, 2014 includes approximately $4.4 million resulting from excess tax deductions from stock options. Pursuant to ASC 740, the deferred tax asset relating to excess tax benefits generated from exercises of stock options was not recognized for financial statement purposes.
Section 382 of the IRC provides limits to which a corporation that has undergone a change in ownership (as defined) can utilize any net operating loss, or NOL, and general business tax credit carryforwards it may have. The Company commissioned an analysis to determine whether Section 382 could limit the use of its carryforwards in this manner. After completing the analysis, it was determined an ownership change had occurred in February 2007. As a result of this change, the Company’s NOL’s and general business tax credits from February 23, 2007 and prior would be completely limited under IRC Section 382. The deferred tax assets related to NOL’s and general business credits have been reduced by $11.2 million and $636 thousand, respectively, as a result of the change. The Company updated the IRC Section 382 analysis through December 31, 2014. It was determined a change of ownership occurred on February 28, 2011. The Company’s NOL’s were not further limited as a result of the change.
The Company has provided a valuation allowance for the full amount of these net deferred tax assets, since it is more likely than not that these future benefits will not be realized. However, these deferred tax assets may be
F-72
10. Income Taxes (Continued)
available to offset future income tax liabilities and expenses. The valuation allowance increased by $10.0 million primarily due to net operating loss carryforwards, start-up and organizational costs, and the increase in research and development credits.
A reconciliation of income tax expense (benefit) at the statutory federal income tax rate and income taxes as reflected in the financial statements is as follows:
Year Ended December 31, | |||||||||
(in thousands) | 2014 | 2013 | 2012 | ||||||
Federal income tax at statutory rates | 34 | % | 34 | % | 34 | % | |||
State income tax, net of federal tax benefit | 2 | % | 4 | % | 5 | % | |||
Research and development credits | 3 | % | 9 | % | 10 | % | |||
Stock compensation | (4 | )% | (2 | )% | (1 | )% | |||
Uncertain tax position adjustment | — | % | — | % | — | % | |||
Federal R&D tax grant | — | % | — | % | — | % | |||
Other | (4 | )% | 1 | % | 2 | % | |||
Increase in valuation allowance | (31 | )% | (46 | )% | (49 | )% | |||
Effective tax rate | — | % | — | % | — | % | |||
The Company adopted ASC740, “Accounting for Uncertain Tax Positions” on January 1, 2007. ASC740 clarifies the accounting for uncertainty in income taxes recognized in an enterprise’s financial statements in accordance with FASB Statement No. 109, “Accounting for Income Taxes.” ASC 740 prescribes a recognition threshold and measurement of a tax position taken or expected to be taken in a tax return. The Company did not establish any additional reserves for uncertain tax liabilities upon adoption of ASC 740. A summary of the company’s adjustments to its uncertain tax positions in the years ended December 31, 2014, 2013, and 2012 are as follows:
(in thousands) | |||
Balance at December 31, 2011 | $ | 275 | |
Increase/Decrease for tax positions related to the current year | — | ||
Increase/Decrease for tax positions related to prior years | — | ||
Decreases for settlements with applicable taxing authorities | — | ||
Decreases for lapses of statute of limitations | — | ||
Balance at December 31, 2012 | $ | 275 | |
Increase/Decrease for tax positions related to the current year | — | ||
Increase/Decrease for tax positions related to prior years | (37 | ) | |
Decreases for settlements with applicable taxing authorities | — | ||
Decreases for lapses of statute of limitations | — | ||
Balance at December 31, 2013 | $ | 238 | |
Increase/Decrease for tax positions related to the current year | — | ||
Increase/Decrease for tax positions related to prior years | — | ||
Decreases for settlements with applicable taxing authorities | — | ||
Decreases for lapses of statute of limitations | — | ||
Balance at December 31, 2014 | $ | 238 | |
10. Income Taxes (Continued)
F-73
The Company has not recognized any interest and penalties in the statement of operations because of the Company’s net operating losses and tax credits that are available to be carried forward. When necessary, the Company will account for interest and penalties related to uncertain tax positions as part of its provision for federal and state income taxes. The Company does not expect the amounts of unrecognized benefits will change significantly within the next twelve months.
The Company is currently open to audit under the statute of limitations by the Internal Revenue Service and state jurisdictions for the years ended December 31, 1999 through 2014.
11. Preferred Stock and Stockholders’ Equity
On April 26, 2006, the date of the Company’s annual stockholders meeting that year, the shareholders approved the adoption of an Amended and Restated Certificate of Incorporation pursuant to which the Company has 280,000,000 shares of authorized capital stock, of which 250,000,000 shares are designated as common stock (par value $.001 per share), and 30,000,000 shares are designated as preferred stock (par value $.001 per share), which the Company refers to as the Preferred Stock.
Common Stock
On January 6, 2011, and in conjunction with the Company’s execution and delivery of a Channel Agreement, the Company entered into a Stock Purchase Agreement and Registration Rights Agreement. On January 12, 2011, and pursuant to that Stock Purchase Agreement, the Company sold 2,426,235 shares of the Company’s common stock in a private placement for a total purchase price of $11.6 million, or $4.80 per share. The Company simultaneously issued an additional 3,636,926 shares of its common stock for a cash purchase price equal to the $0.001 par value of such shares, which price was deemed paid in partial consideration for the execution and delivery of the Channel Agreement.
On January 20, 2012, pursuant to an underwriting agreement between the Company and J. P. Morgan Securities LLC, as representative of the several underwriters named therein, the Company completed the sale of an aggregate 10,114,401 shares of the Company’s common stock at a price of $5.20 per share in a public offering. The total gross proceeds resulting from the 2012 public offering were approximately $52.6 million, before deducting selling commissions and expenses (see Note 2 to the financial statements, Financings).
On November 7, 2012, the Company issued 3,636,926 shares of our common stock, which we refer to as the Milestone Shares, to Intrexon under the terms of its Stock Purchase Agreement with Intrexon dated January 6, 2011. Under the terms of the Stock Purchase Agreement with Intrexon, the Company agreed to issue the Milestone Shares under certain conditions upon dosing of the first patient in a ZIOPHARM-conducted Phase 2 clinical trial in the Unites States, or similar study as the parties may agree in a country other than the United States, of a product candidate that is created, produced, developed or identified directly or indirectly by us during the term of the Channel Agreement and that, subject to certain exceptions, involves DNA administered to humans for expression of anti-cancer effectors for the purpose of treatment or prophylaxis of cancer. On October 24, 2012, the Company initiated dosing in a Phase 2 study of Ad-RTS-IL-12 + veledimex for unresectable Stage III or IV melanoma, triggering the issuance of the Milestone Shares.
On October 29, 2013, pursuant to an underwriting agreement between the Company and J. P. Morgan Securities LLC, as representative of the several underwriters named therein, the Company completed the sale of an
F-74
11. Preferred Stock and Stockholders’ Equity (Continued)
aggregate 16,445,000 shares of the Company’s common stock at a price of $3.50 per share in a public offering. The total gross proceeds resulting from this public offering were approximately $57.6 million, before deducting selling commissions and expenses (see Note 2 to the financial statements, Financings).
As of December 31, 2014, the Company had 104,452,105 shares of common stock issued and outstanding and no shares of Preferred Stock issued and outstanding.
On February 3, 2015, the Company entered into an underwriting agreement with J.P. Morgan Securities LLC, as representative of the several underwriters named therein, relating to the issuance and sale of 10,000,000 shares of our common stock. The price to the public in the offering was $8.75 per share, and the underwriters agreed to purchase the shares from the Company pursuant to the underwriting agreement at a purchase price of $8.225 per share. Under the terms of the underwriting agreement, the Company also granted the underwriters an option, exercisable for 30 days, to purchase up to an additional 1,500,000 shares of common stock at a purchase price of $8.225 per share. The offering was made pursuant to the Company’s effective registration statement on Form S-3 (Registration Statement No. 333-201826) previously filed with the SEC, and a prospectus supplement thereunder. The underwriters purchased the 10,000,000 shares and the additional 1,500,000 shares on February 9 and 17, 2015, respectively. The net proceeds from the offering were approximately $94.2 million after deducting underwriting discounts and estimated offering expenses payable by the Company.
Preferred Stock
The Company’s Board of Directors are authorized to designate any series of Preferred Stock, to fix and determine the variations in relative rights, preferences, privileges and restrictions as between and among such series.
12. Stock Option Plan
The Company adopted the 2003 Stock Option Plan, or the 2003 Plan, in 2003, and it was approved by the Company’s stockholders on December 21, 2004. Upon approval of the 2012 Equity Incentive Plan, no additional stock awards may be granted under the 2003 Plan.
The Company adopted the 2012 Equity Incentive Plan, or the 2012 Plan, in May 2012, under which the Company initially reserved for the issuance of 4,000,000 shares of its common stock. The 2012 Plan was approved by the Company’s stockholders on June 20, 2012. On June 18, 2014, the date of the Company’s annual stockholders meeting, the Company’s stockholders approved an amendment to the 2012 Plan increasing the total shares reserved by 5,000,000 shares, for a total of 9,000,000 shares.
As of December 31, 2014, the Company had outstanding options issued to its employees to purchase up to 5,112,800 shares of the Company’s common stock, to its directors to purchase up to 902,529 shares of the Company’s common stock, as well as options to consultants in connection with services rendered to purchase up to 490,334 shares of the Company’s common stock.
Stock options to employees generally vest ratably over three years and have contractual terms of ten years. Stock options to directors generally vest ratably over two or three years and have contractual terms of ten years. Stock options are valued using the Black-Scholes option pricing model and compensation is recognized based on such fair value over the period of vesting on a straight-line basis. The Company has also reserved an aggregate of 26,364 additional shares for issuance under options granted outside of the 2003 Stock Option Plan. The options were granted to The University of Texas M. D. Anderson Cancer Center and DEKK-Tec, Inc. (see Note 8 to the financial statements, Commitments and Contingencies).
F-75
12. Stock Option Plan (Continued)
Proceeds from the option exercises during the years ended December 31, 2014, 2013, and 2012 amounted to $1.4 million, $956 thousand, and $30 thousand, respectively. The intrinsic value of these options amounted to $2.6 million, $1.4 million and $11 thousand for years ended December 31, 2014, 2013 and 2012, respectively.
Transactions under the Plan for the years ending December 31, 2014, 2013, and 2012 were as follows:
(in thousands, except share and per share data) | Number of Shares | Weighted- Average Exercise Price | Weighted- Average Contractual Term (Years) | Aggregate Intrinsic Value | |||||||
Outstanding, December 31, 2011 | 5,138,486 | 4.08 | |||||||||
Granted | 2,309,650 | 4.36 | |||||||||
Exercised | (8,300 | ) | 3.61 | ||||||||
Cancelled | (292,533 | ) | 5.70 | ||||||||
Outstanding, December 31, 2012 | 7,147,303 | 4.11 | |||||||||
Granted | 2,649,900 | 3.28 | |||||||||
Exercised | (570,168 | ) | 1.68 | ||||||||
Cancelled | (2,479,732 | ) | 4.58 | ||||||||
Outstanding, December 31, 2013 | 6,747,303 | 3.81 | |||||||||
Granted | 1,099,300 | 4.95 | |||||||||
Exercised | (613,138 | ) | 2.26 | ||||||||
Cancelled | (727,801 | ) | 4.54 | ||||||||
Outstanding, December 31, 2014 | 6,505,664 | $ | 4.07 | 7.19 | $9,084 | ||||||
Vested and unvested expected to vest at December 31, 2014 | 6,485,430 | $ | 4.10 | 5.80 | $9,056 | ||||||
Options exercisable, December 31, 2014 | 3,781,162 | $ | 4.10 | 5.80 | $4,130 | ||||||
Options exercisable, December 31, 2013 | 3,471,935 | $ | 4.01 | 5.03 | $2,654 | ||||||
Options available for future grant | 4,585,769 | ||||||||||
At December 31, 2014, total unrecognized compensation costs related to non-vested stock options outstanding amounted to $7.9 million. The cost is expected to be recognized over a weighted-average period of 1.62 years.
Restricted Stock
In December 2014, the Company issued 66,828 shares of restricted stock to its non-employee directors, which vest in their entirety on the one year anniversary of the grant date. In December 2013, the Company issued 75,272 shares of restricted stock to its non-employee directors, which vested in their entirety on the one year anniversary of the grant date. In January, February and May 2012, the Company issued 101,500, 43,802 and 25,000 shares of restricted stock to employees, which vested ratably in annual installments over three years, respectively, commencing on the first anniversary of the grant date. In December 2012, the Company also issued 87,730 shares of restricted stock to its non-employee directors, which vested ratably in annual installments over three years, commencing on the first anniversary of the grant date.
In January, February and December 2014, the Company repurchased 16,031, 14,600 and 81,702 shares at average prices of $4.37, $4.40 and $5.04 per share, respectively, to cover payroll taxes. In January, March, May
F-76
12. Stock Option Plan (Continued)
and December 2013, the Company repurchased 52,018, 5,400, 2,623, and 56,683 shares at average prices of $4.28, $4.50, $1.65 and $4.37 per share, respectively, to cover payroll taxes. In July and December 2012, the Company repurchased 15,740 and 107,413 shares at $6.06 and $4.19 per share, respectively, to cover payroll taxes. A summary of the status of non-vested restricted stock as of December 31, 2014, 2013 and 2012 is as follows:
Number of Shares | Weighted-Average Grant Date Fair Value | ||||||
Non-vested, December 31, 2011 | 950,906 | $ | 4.34 | ||||
Granted | 258,032 | 4.39 | |||||
Vested | (351,829 | ) | 4.32 | ||||
Cancelled | (123,370 | ) | 4.34 | ||||
Non-vested, December 31, 2012 | 733,739 | 4.37 | |||||
Granted | 75,272 | 4.34 | |||||
Vested | (292,399 | ) | 4.31 | ||||
Cancelled | (163,747 | ) | 4.42 | ||||
Non-vested, December 31, 2013 | 352,865 | 4.38 | |||||
Granted | 66,828 | 5.07 | |||||
Vested | (253,835 | ) | 4.38 | ||||
Cancelled | (21,350 | ) | 4.41 | ||||
Non-vested, December 31, 2014 | 144,508 | $ | 4.70 | ||||
As of December 31, 2014, there was $471 thousand of total unrecognized stock-based compensation expense related to non-vested restricted stock arrangements. The expense is expected to be recognized over a weighted-average period of 1.00 years.
13. Employee Benefit Plan
The Company sponsors a qualified 401(k) Retirement Plan under which employees are allowed to contribute certain percentages of their pay, up to the maximum allowed under Section 401(k) of the IIRC. The Company may make contributions to this plan at its discretion. The Company contributed approximately $79 thousand, $139 thousand, and $266 thousand to this plan during the years ended December 31, 2014, 2013, and 2012, respectively.
F-77
14. Selected Quarterly Information (Unaudited)
(in thousands, except per share amount)
Year Ended December 31, 2014 | First Quarter | Second Quarter | Third Quarter | Fourth Quarter | ||||||||||||
Revenue | $ | 200 | $ | 200 | $ | 633 | $ | 340 | ||||||||
Total operating expenses | 9,984 | 11,377 | 12,575 | 10,936 | ||||||||||||
Loss from operations | (9,784 | ) | (11,177 | ) | (11,942 | ) | (10,596 | ) | ||||||||
Change in fair value of warrants | 82 | 5,600 | 5,847 | 194 | ||||||||||||
Net (loss) | (9,711 | ) | (5,576 | ) | (6,093 | ) | (10,401 | ) | ||||||||
Loss per share, basic and diluted | $ | (0.10 | ) | $ | (0.06 | ) | $ | (0.06 | ) | $ | (0.09 | ) | ||||
Year Ended December 31, 2013 | First Quarter | Second Quarter | Third Quarter | Fourth Quarter | ||||||||||||
Revenue | $ | 200 | $ | 200 | $ | 200 | $ | 200 | ||||||||
Total operating expenses | 23,783 | 18,496 | 9,315 | 6,919 | ||||||||||||
Loss from operations | (23,583 | ) | (18,296 | ) | (9,115 | ) | (6,719 | ) | ||||||||
Change in fair value of warrants | 10,788 | (403 | ) | (7,407 | ) | (1,793 | ) | |||||||||
Net (loss) | (12,799 | ) | (18,692 | ) | (16,713 | ) | (8,903 | ) | ||||||||
Loss per share, basic and diluted | $ | (0.15 | ) | $ | (0.22 | ) | $ | (0.20 | ) | $ | (0.09 | ) | ||||
F-78
Exhibit index
Description of exhibit | ||
2.1* | Agreement and Plan of Merger, dated as of December 19, 2013 by and among Intrexon, Medistem Inc. and XON Cells, Inc.(7) | |
2.2* | First Amendment to Agreement and Plan of Merger, dated as of January 29, 2014, by and among Intrexon, Medistem Inc. and XON Cells, Inc.(9) | |
2.3* | Amended and Restated Membership Interest Purchase Agreement, dated as of August 8, 2014, by and among Intrexon Corporation, Trans Ova Genetics, L.C., the Sellers named on the signature pages thereto, and Pro-Edge, LP., as the Securityholders Representative (11) | |
3.1* | Amended and Restated Articles of Incorporation(4) | |
3.2* | Bylaws(4) | |
4.1* | Specimen certificate evidencing shares of common stock(2) | |
4.2* | Warrants to purchase shares of common stock(2) | |
4.3* | Eighth Amended and Restated Investors’ Rights Agreement, dated March 1, 2013, by and among Intrexon and the holders of the Company’s preferred stock and certain holders of Intrexon’s common stock and Joinder thereto(1) | |
10.1†* | Intrexon Corporation Amended and Restated 2008 Equity Incentive Plan and Form of Incentive Stock Option Agreement(2) | |
10.2†* | Intrexon Corporation 2013 Omnibus Incentive Plan and Forms of Award Agreements(2) | |
10.3#* | Exclusive Channel Partner Agreement, dated as of January 6, 2011, between Intrexon and ZIOPHARM Oncology, Inc., as amended(1) | |
10.4* | Stock Purchase Agreement, dated as of January 6, 2011, between Intrexon and ZIOPHARM Oncology, Inc.(1) | |
10.5#* | Exclusive Channel Collaboration Agreement, dated as of June 5, 2012, between Intrexon and Oragenics, Inc.(1) | |
10.6#* | Exclusive Channel Collaboration Agreement, dated as of August 6, 2012, between Intrexon and Synthetic Biologics, Inc.(1) | |
10.7#* | Exclusive Channel Collaboration Agreement, dated as of October 5, 2012, between Intrexon and Fibrocell Science, Inc.(1) | |
10.7A* | First Amendment to Exclusive Channel Collaboration Agreement, dated as of June 28, 2013, between Intrexon and Fibrocell Science, Inc.(1) | |
10.7B* | Second Amendment to Exclusive Channel Collaboration Agreement, dated as of January 10, 2014, between Intrexon and Fibrocell Science, Inc.(8) | |
10.7C* | Supplemental Stock Issuance Agreement, dated as of January 10, 2014, between Fibrocell Science, Inc. and Intrexon(8) | |
10.8#* | Exclusive Channel Collaboration Agreement, dated as of February 14, 2013, between Intrexon and AquaBounty Technologies, Inc.(1) | |
10.9* | Relationship Agreement, dated as of December 5, 2012, between Intrexon and AquaBounty Technologies, Inc.(1) | |
10.10#* | Exclusive Channel Collaboration Agreement, dated as of March 29, 2013, between Intrexon and Genopaver, LLC(1) | |
10.11†* | Second Amended and Restated Employment Agreement, dated as of August 31, 2006, between Intrexon and Thomas D. Reed(2) | |
10.12#* | Exclusive Channel Collaboration Agreement, dated as of September 30, 2013, between Intrexon and Oragenics, Inc.(5) | |
10.13#* | Exclusive Channel Collaboration Agreement, dated as of September 30, 2013, between Intrexon and S & I Ophthalmic, LLC(6) | |
F-79
10.14#* | Limited Liability Company Agreement, dated as of September 30, 2013, among Intrexon, Caraco Pharmaceutical Laboratories Ltd. and S & I Ophthalmic, LLC(6) | ||
10.15#* | Exclusive Channel Collaboration Agreement, dated as of March 26, 2014, by and between Intrexon Corporation and Intrexon Energy Partners, LLC (Exhibit 10.1 to Intrexon Corporation’s Current Report on Form 8-K/A, filed on April 4, 2014 with the Securities and Exchange Commission)(10) | ||
10.16#* | Amended and Restated Limited Liability Company Agreement of Intrexon Energy Partners, LLC, dated as of March 26, 2014, by and among Intrexon Corporation and the parties thereto (Exhibit 10.2 to Intrexon Corporation’s Current Report on Form 8-K/A, filed on April 4, 2014 with the Securities and Exchange Commission)(10) | ||
10.17* | Letter Agreement by and between ZIOPHARM Oncology, Inc., Intrexon Corporation and The University of Texas System Board of Regents on behalf of The University of Texas M.D. Anderson Cancer Center, dated as of January 9, 2015(12) | ||
10.18* | Securities Issuance Agreement by and among Intrexon Corporation, The University of Texas System Board of Regents on behalf of The University of Texas M.D. Anderson Cancer Center dated as of January 13, 2015 (12) | ||
10.19* | Securities Issuance Agreement by and among Intrexon Corporation, The University of Texas System Board of Regents on behalf of The University of Texas M.D. Anderson Cancer Center dated as of January 13, 2015 (12) | ||
10.20* | Registration Rights Agreement by and among Intrexon Corporation, The University of Texas System Board of Regents on behalf of The University of Texas M.D. Anderson Cancer Center dated as of January 13, 2015(12) | ||
10.21##* | License Agreement by and among ZIOPHARM Oncology, Inc., Intrexon Corporation and The University of Texas System Board of Regents on behalf of The University of Texas M.D. Anderson Cancer Center, dated as of January 13, 2015(13) | ||
21.1 | List of Subsidiaries of Intrexon Corporation | ||
23.1 | Consent of PricewaterhouseCoopers LLP | ||
23.2 | Consent of McGladrey LLP | ||
31.1 | Certification of Randal J. Kirk, Chairman and Chief Executive Officer (Principal Executive Officer) of Intrexon Corporation, pursuant to Rules 13a-14(a) and 15d-14(a) promulgated under the Securities Exchange Act of 1934, as amended, as adopted pursuant to Section 302 of the Sarbanes-Oxley Act of 2002 | ||
31.2 | Certification of Rick L. Sterling, Chief Financial Officer (Principal Financial Officer) of Intrexon Corporation, pursuant to Rules 13a-14(a) and 15d-14(a) promulgated under the Securities Exchange Act of 1934, as amended, as adopted pursuant to Section 302 of the Sarbanes-Oxley Act of 2002 | ||
32.1** | Certification of Randal J. Kirk, Chairman and Chief Executive Officer (Principal Executive Officer) of Intrexon Corporation, pursuant to 18 U.S.C. Section 1350, as adopted pursuant to Section 906 of the Sarbanes-Oxley Act of 2002 | ||
32.2** | Certification of Rick L. Sterling, Chief Financial Officer (Principal Financial Officer) of Intrexon Corporation, pursuant to 18 U.S.C. Section 1350, as adopted pursuant to Section 906 of the Sarbanes-Oxley Act of 2002 | ||
101** | Interactive Data File (Intrexon Corporation and Subsidiaries Consolidated Financial Statements for the years ended December 31, 2014, 2013 and 2012, furnished in XBRL (eXtensible Business Reporting Language)). | ||
Attached as Exhibit 101 are the following documents formatted in XBRL: (i) the Consolidated Balance Sheets at December 31, 2014 and 2013, (ii) the Consolidated Statements of Operations for the years ended December 31, 2014, 2013 and 2012, (iii) the Consolidated Statements of Shareholders' and Total Equity (Deficit) for the years ended December 31, 2014, 2013 and 2012, (iv) the Consolidated Statements of Cash Flows for the years ended December 31, 2014, 2013 and 2012 and (v) the Notes to Consolidated Financial Statements for the years ended December 31, 2014, 2013 and 2012. Users of this data are advised pursuant to Rule 406T of Regulation S-T that this interactive data file is deemed not filed or part of a registration statement or prospectus for purposes of sections 11 or 12 of the Securities Act of 1933, is deemed not filed for purposes of section 18 of the Securities and Exchange Act of 1934, and otherwise is not subject to liability under these sections. Users of this data are advised pursuant to Rule 406T of Regulation S-T that this interactive data file is deemed not filed or part of a registration statement or prospectus for purposes of sections 11 or 12 of the Securities Act of 1933, is deemed not filed for purposes of section 18 of the Securities and Exchange Act of 1934, and otherwise is not subject to liability under these sections. | |||
F-80
* | Previously filed and incorporated by reference to the exhibit indicated in the following filings by Intrexon: |
(1) | Registration Statement on Form S-1, filed with the Securities and Exchange Commission on July 9, 2013. |
(2) | Amendment No. 1 to Registration Statement on Form S-1, filed with the Securities and Exchange Commission on July 29, 2013. |
(3) | Amendment No. 2 to Registration Statement on Form S-1, filed with the Securities and Exchange Commission on August 6, 2013. |
(4) | Current Report on Form 8-K, filed with the Securities and Exchange Commission on August 15, 2013. |
(5) | Current Report on Form 8-K, filed with the Securities and Exchange Commission on October 1, 2013. |
(6) | Current Report on Form 8-K/A, filed with the Securities and Exchange Commission on October 30, 2013. |
(7) | Current Report on Form 8-K, filed with the Securities and Exchange Commission on December 23, 2013. |
(8) | Current Report on Form 8-K, filed with the Securities and Exchange Commission on January 13, 2014. |
(9) | Current Report on Form 8-K, filed with the Securities and Exchange Commission on January 30, 2014. |
(10) | Current Report on Form 8-K/A, filed with the Securities and Exchange Commission on April 4, 2014. |
(11) | Current Report on Form 8-K, filed with the Securities and Exchange Commission on August 11, 2014. |
(12) | Current Report on Form 8-K, filed with the Securities and Exchange Commission on January 14, 2015. |
(13) | Current Report on Form 8-K/A, filed with the Securities and Exchange Commission on January 28, 2015. |
** | Furnished herewith |
† | Indicates management contract or compensatory plan. |
# | Portions of the exhibit (indicated by asterisks) have been omitted pursuant to a confidential treatment order granted by the Securities and Exchange Commission. |
## | Portions of the exhibit (indicated by asterisks) have been omitted pursuant to a request for confidential treatment and this exhibit has been submitted separately to the Securities and Exchange Commission. |
F-81