Attached files
| file | filename |
|---|---|
| EX-4.1 - EX-4.1 - VEREIT, Inc. | d880830dex41.htm |
| EX-32.2 - EX-32.2 - VEREIT, Inc. | d880830dex322.htm |
| EX-31.2 - EX-31.2 - VEREIT, Inc. | d880830dex312.htm |
| EX-32.1 - EX-32.1 - VEREIT, Inc. | d880830dex321.htm |
| EX-31.1 - EX-31.1 - VEREIT, Inc. | d880830dex311.htm |
| EX-23.1 - EX-23.1 - VEREIT, Inc. | d880830dex231.htm |
Table of Contents
UNITED STATES
SECURITIES AND EXCHANGE COMMISSION
Washington, D.C. 20549
FORM 10-K/A
(Amendment No. 2)
(Mark One)
| x | ANNUAL REPORT PURSUANT TO SECTION 13 OR 15(d) OF THE SECURITIES EXCHANGE ACT OF 1934 |
For the fiscal year ended December 31, 2013
OR
| ¨ | TRANSITION REPORT PURSUANT TO SECTION 13 OR 15(d) OF THE SECURITIES EXCHANGE ACT OF 1934 |
For the transition period from to
Commission file number: 001-35263
AMERICAN REALTY CAPITAL PROPERTIES, INC.
(Exact name of registrant as specified in its charter)
| Maryland | 45-2482685 | |
| (State or other jurisdiction of incorporation or organization) |
(I.R.S. Employer Identification No.) | |
| 2325 E. Camelback Road, Suite 1100 Phoenix, AZ | 85016 | |
| (Address of principal executive offices) | (Zip Code) | |
(800) 606-3610
(Registrant’s telephone number, including area code)
Securities registered pursuant to Section 12(b) of the Securities Exchange Act of 1934:
| Title of each class: |
Name of each exchange on which registered: | |
| Common Stock, $0.01 par value per share | NASDAQ Stock Market | |
| Series F Preferred Stock, $0.01 par value per share | NASDAQ Stock Market |
Securities registered pursuant to Section 12(g) of the Securities Exchange Act of 1934:
None
Indicate by check mark if the registrant is a well-known seasoned issuer, as defined in Rule 405 of the Securities Act of 1933. Yes ¨ No x
Indicate by check mark if the registrant is not required to file reports pursuant to Section 13 or Section 15(d) of the Securities Exchange Act of 1934. Yes ¨ No x
Indicate by check mark whether the registrant (1) has filed all reports required to be filed by Section 13 or 15(d) of the Securities Exchange Act of 1934 during the preceding 12 months (or for such shorter period that the registrant was required to file such reports), and (2) has been subject to such filing requirements for the past 90 days. Yes ¨ No x
Indicate by check mark whether the registrant submitted electronically and posted on its corporate Web Site, if any, every Interactive Data File required to be submitted and posted pursuant to Rule 405 of Regulation S-T during the preceding 12 months (or for such shorter period that the registrant was required to submit and post such files). Yes ¨ No x
Indicate by check mark if disclosure of delinquent filers pursuant to Item 405 of Regulation S-K is not contained herein, and will not be contained, to the best of registrant’s knowledge, in definitive proxy or information statements incorporated by reference in Part III of this Form 10-K or any amendment to this Form 10-K. ¨
Indicate by check mark whether the registrant is a large accelerated filer, an accelerated filer, a non-accelerated filer, or a smaller reporting company. See definition of “large accelerated filer,” “accelerated filer,” and “smaller reporting company” in Rule 12b-2 of the Exchange Act.
| Large accelerated filer | x | Accelerated filer | ¨ | |||
| Non-accelerated filer | ¨ (Do not check if a smaller reporting company) | Smaller reporting company | ¨ | |||
Indicate by check mark whether the registrant is a shell company (as defined in Rule 12b-2 of the Exchange Act). Yes ¨ No x
The aggregate market value of the registrant’s common stock held by non-affiliates of the registrant as of June 30, 2013 was $2.78 billion.
The number of outstanding shares of the registrant’s common stock on February 27, 2015 was 905,338,684 shares.
DOCUMENTS INCORPORATED BY REFERENCE
Portions of the registrant’s proxy statement previously delivered to stockholders in connection with the registrant’s 2014 Annual Meeting of Stockholders are incorporated by reference into Part III of this Form 10-K/A.
Table of Contents
Explanatory Note
American Realty Capital Properties, Inc. (the “Company,” “its,” “we,” “our” or “us”) is filing this Amendment No. 2 on Form 10-K/A (this “Form 10-K/A”) to its Annual Report on Form 10-K for the fiscal year ended December 31, 2013, originally filed with the U.S. Securities and Exchange Commission (the “SEC”) on February 27, 2014 (the “Original Filing”) and amended by Amendment No. 1 thereto on Form 10-K/A filed with the SEC on September 4, 2014, to restate and amend its previously-issued audited consolidated financial statements and related financial information for the fiscal years ended December 31, 2013 and 2012.
This Form 10-K/A also reflects the recasting of the Company’s historical financial statements to present the Company’s January 3, 2014 acquisition of American Realty Capital Trust IV, Inc. (“ARCT IV”), an entity previously deemed to be under common control with the Company, from the earliest period of common control. Recasted audited consolidated financial statements reflecting the Company’s acquisition of ARCT IV were originally filed with the SEC by the Company as an exhibit to its Current Report on Form 8-K dated May 20, 2014.
Concurrently with the filing of this Form 10-K/A, the Company is filing amendments to its Quarterly Reports on Form 10-Q for the fiscal periods ended March 31, 2014 and June 30, 2014 to restate and amend its previously-issued unaudited consolidated financial statements and related financial information for these periods and the comparable fiscal periods of 2013 (collectively, with this Form 10-K/A, the “Amended Filings”). The Company’s Quarterly Report on Form 10-Q for the fiscal period ended September 30, 2014, which is also being concurrently filed, includes restated and amended unaudited consolidated financial statements and related financial information for the fiscal period ended September 30, 2013.
The following sections of this Form 10-K/A contain information that has been amended where necessary to reflect the restatement and certain other events that have occurred subsequent to February 27, 2014, the date of the Original Filing:
| • | Forward-Looking Statements |
| • | Part I, Item 1A. Risk Factors |
| • | Part I, Item 3. Legal Proceedings |
| • | Part II, Item 5. Market for Registrant’s Common Equity, Related Stockholder Matters and Issuer Purchases of Equity Securities |
| • | Part II, Item 6. Selected Financial Data |
| • | Part II, Item 7. Management’s Discussion and Analysis of Financial Condition and Results of Operations (Certain Sections As Restated) |
| • | Part II, Item 9A. Controls and Procedures |
| • | Part III |
| • | Part IV, Item 15. Exhibits, Financial Statement Schedules |
Except as described in this Explanatory Note, the information contained in the Original Filing has not been updated to reflect any subsequent events.
Background
On October 29, 2014, the Company filed a Current Report on Form 8-K (the “October 29 8-K”) reporting that the Audit Committee of the Company’s Board of Directors (the “Audit Committee”) had concluded that the previously-issued audited consolidated financial statements and other financial information contained in the Original Filing, the previously issued unaudited financial statements and other financial information contained in the Company’s Quarterly Reports on Form 10-Q for the fiscal periods ended March 31, 2014 and June 30, 2014, and the Company’s earnings releases and other financial communications for these periods should no longer be relied upon.
2
Table of Contents
The Audit Committee based its conclusion on the preliminary findings of its investigation into concerns regarding accounting practices and other matters that had first been reported to it on September 7, 2014. Promptly after learning of these concerns, the Audit Committee initiated an investigation, which was conducted with the assistance of independent counsel and forensic accountants. The investigation continued after the filing of the October 29 8-K and expanded in scope beyond the concerns initially brought to the Audit Committee’s attention. Certain key findings of the investigation are presented below.
The investigation found that Adjusted Funds From Operations (“AFFO”), a non-GAAP measure presented in the Company’s SEC filings and other financial communications, was overstated for fiscal year 2011, fiscal year 2012, fiscal year 2013 (including each fiscal quarter of 2013) and, as previously disclosed in the October 29 8-K, the first two fiscal quarters of 2014. Senior management considered AFFO to be an important metric used by analysts and investors in evaluating the Company’s performance and, for the first two quarters of 2014, sought to maintain reported AFFO within the 2014 guidance range of $1.13 to $1.19 per share announced at the end of 2013. The overstatements of AFFO were due in part to errors in reflecting amounts attributable to the limited partnership interests in the Company’s operating partnership, ARC Properties Operating Partnership, L.P., held by holders other than the Company (known as non-controlling interests or “NCI”). Prior to the filing of the Quarterly Report on Form 10-Q for the first quarter of 2014, some members of senior management were aware of NCI errors but allowed the report to be filed without completing an analysis of the errors. In the Company’s Quarterly Report on Form 10-Q for the second quarter of 2014, as previously reported in the October 29 8-K, the NCI errors in the first quarter were intentionally not corrected, and other AFFO and financial statement errors were intentionally made, resulting in an overstatement of AFFO and an understatement of the Company’s net loss for the three and six months ended June 30, 2014. See “Management’s Discussion and Analysis of Financial Condition and Results of Operations – Sources of Funds – Funds from Operations and Adjusted Funds from Operations (As Restated)” in Item 7 of this Form 10-K/A.
The investigation identified certain payments made by the Company to ARC Properties Advisors, LLC (the “Former Manager”) and certain affiliates of the Former Manager that were not sufficiently documented or otherwise warrant scrutiny. The Company has recovered consideration valued at approximately $8.5 million in respect of certain such payments. The Company is considering whether it has a right to seek recovery for any other such payments and, if so, its alternatives for seeking recovery. No asset has been recognized in the financial statements related to any potential recovery. See Note 19-Related Party Transactions and Arrangements (As Restated) to the consolidated financial statements in this Form 10-K/A.
The investigation found that the agreements relating to equity awards made to Nicholas S. Schorsch and Brian S. Block in connection with the transition from external to internal management of the Company contained provisions that, as drafted, were more favorable to them than the Compensation Committee of the Company’s Board of Directors (the “Compensation Committee”) had authorized. At the time the awards took effect, Mr. Schorsch was the Company’s Executive Chairman and Chief Executive Officer and Mr. Block was the Company’s Chief Financial Officer. Immediately prior to his resignation from the Company, Mr. Schorsch and the Company agreed that the terms of his equity awards should have been consistent with the Compensation Committee’s authorization. In connection with their resignations from the Company, Mr. Block relinquished all of his equity awards and Mr. Schorsch relinquished all of his equity awards other than 1,000,000 shares of restricted stock, the vesting of which was accelerated. These shares are subject to clawback by the Company if, in any proceeding, after all appeals, Mr. Schorsch is found to have breached his fiduciary duty of loyalty or is found to have committed or admits to fraud or misconduct in connection with his responsibilities as a director or officer of the Company. See “Management Changes” below.
The investigation also found material weaknesses in the Company’s internal control over financial reporting and its disclosure controls and procedures. See “Internal Control Considerations” below.
The Audit Committee believes that the scope and process of its investigation were sufficient to identify matters that could materially affect the Company’s consolidated financial statements and the calculation of AFFO.
Effects of the Restatements and Other Corrections
The restatements contained in this Form 10-K/A and the other Amended Filings correct errors in the consolidated financial statements contained in the original filings that were identified as a result of the Audit Committee investigation as well as additional errors identified as a result of a review performed by the Company’s new management. The restatements also reflect
3
Table of Contents
certain adjustments that the Company determined to be immaterial, both individually and in the aggregate, when the consolidated financial statements contained in the original filings were issued. In connection with the restatements, the Company has determined that it would be appropriate to reflect such adjustments. See Note 2 – Restatement of Previously Issued Financial Statements to the consolidated financial statements in this Form 10-K/A.
The Amended Filings also correct errors in the calculation of AFFO contained in the original filings that were identified as a result of the Audit Committee’s investigation or that otherwise reflect restatement adjustments. See “Management’s Discussion and Analysis of Financial Condition and Results of Operations – Sources of Funds – Funds from Operations and Adjusted Funds from Operations (As Restated)” in Item 7 of this Form 10-K/A.
The following tables summarize the effect of the restatements on certain key items of the Company’s previously issued consolidated financial statements and on its previously issued calculations of AFFO and AFFO per share for the year ended December 31, 2013, the three months ended March 31, 2014 and the three and six months ended June 30, 2014 (amounts in thousands, except for per share data).
| Year Ended December 31, 2013 | ||||||||||||||||
| As Previously Reported (1) |
As Restated | $ Change Fav/(Unfav) |
% Change | |||||||||||||
| Selected balance sheet amounts |
||||||||||||||||
| Total assets |
$ | 7,807,979 | $ | 7,809,083 | $ | 1,104 | 0.01 | % | ||||||||
| Total liabilities |
5,285,446 | 5,310,556 | (25,110 | ) | (0.48 | )% | ||||||||||
| Total equity |
2,253,234 | 2,229,228 | (24,006 | ) | (1.07 | )% | ||||||||||
| Selected statement of operations amounts |
||||||||||||||||
| Total revenues |
$ | 329,878 | $ | 329,323 | $ | (555 | ) | (0.17 | )% | |||||||
| Total operating expenses |
640,704 | 665,228 | (24,524 | ) | (3.83 | )% | ||||||||||
| Net loss attributable to stockholders |
(474,740 | ) | (491,499 | ) | (16,759 | ) | (3.53 | )% | ||||||||
| Selected cash flow amounts |
||||||||||||||||
| Net cash provided by operating activities |
$ | 12,769 | $ | 11,918 | $ | (851 | ) | (6.66 | )% | |||||||
| Net cash used in investing activities |
(4,542,759 | ) | (4,541,718 | ) | 1,041 | 0.02 | % | |||||||||
| Net cash provided by financing activities |
4,290,140 | 4,289,950 | (190 | ) | — | % | ||||||||||
| Net change in cash and cash equivalents |
(239,850 | ) | (239,850 | ) | — | — | % | |||||||||
| Funds from operations and adjusted funds from operations amounts - net method (2) |
||||||||||||||||
| Funds from operations |
$ | (263,382 | ) | $ | (285,076 | ) | $ | (21,694 | ) | (8.24 | )% | |||||
| Adjusted funds from operations |
236,374 | 192,416 | (43,958 | ) | (18.60 | )% | ||||||||||
| AFFO per share |
1.07 | (3) | 0.87 | (0.20 | ) | (18.69 | )% | |||||||||
| (1) | The amounts reflect the recasting of the Company’s historical financial statements to present the effects of the Company’s acquisition of ARCT IV, an entity previously deemed to be under common control with the Company, as if it had been completed at inception, as previously disclosed in the Company’s Current Report on From 8-K, dated May 20, 2014. |
| (2) | The net method is defined in “Management’s Discussion and Analysis of Financial Condition and Results of Operations – Sources of Funds – Funds from Operations and Adjusted Funds from Operations (As Restated)” in Item 7 of this Form 10-K/A. |
| (3) | AFFO per share was not previously reported in the Original Filing, although it was reported in the earnings release related to the year ended December 31, 2013. It has been calculated utilizing the previously reported AFFO and weighted average shares of 221,378,676. |
For discussion of the restatement adjustments, see Note 2 – Restatement of Previously Issued Financial Statements to the consolidated financial statements in this Form 10-K/A.
4
Table of Contents
| Three Months Ended March 31, 2014 (Unaudited) | ||||||||||||||||
| As Previously Reported |
As Restated | $ Change Fav/(Unfav) |
% Change | |||||||||||||
| Selected balance sheet amounts |
||||||||||||||||
| Total assets |
$ | 20,480,300 | $ | 20,488,095 | $ | 7,795 | 0.04 | % | ||||||||
| Total liabilities |
10,950,414 | 10,974,377 | (23,963 | ) | (0.22 | )% | ||||||||||
| Total equity |
9,260,587 | 9,244,419 | (16,168 | ) | (0.17 | )% | ||||||||||
| Selected statement of operations amounts |
||||||||||||||||
| Total revenues |
$ | 320,614 | $ | 321,154 | $ | 540 | 0.17 | % | ||||||||
| Total operating expenses |
512,851 | 482,128 | 30,723 | 5.99 | % | |||||||||||
| Net loss attributable to stockholders |
(308,681 | ) | (291,444 | ) | 17,237 | 5.58 | % | |||||||||
| Selected cash flow amounts |
||||||||||||||||
| Net cash provided by operating activities |
$ | (106,126 | ) | $ | (122,828 | ) | $ | (16,702 | ) | (15.74 | )% | |||||
| Net cash used in investing activities |
(1,212,122 | ) | (1,174,407 | ) | 37,715 | 3.11 | % | |||||||||
| Net cash provided by financing activities |
1,348,590 | 1,327,726 | (20,864 | ) | (1.55 | )% | ||||||||||
| Net change in cash and cash equivalents |
30,342 | 30,491 | 149 | 0.49 | % | |||||||||||
| Funds from operations and adjusted funds from operations amounts - net method (1) |
||||||||||||||||
| Funds from operations |
$ | (183,791 | ) | $ | (137,960 | ) | $ | 45,831 | 24.94 | % | ||||||
| Adjusted funds from operations |
147,389 | 108,892 | (38,497 | ) | (26.12 | )% | ||||||||||
| AFFO per share (2) |
$ | 0.26 | $ | 0.19 | (0.07 | ) | (26.92 | )% | ||||||||
| (1) | The net method is defined in “Management’s Discussion and Analysis of Financial Condition and Results of Operations – Sources of Funds – Funds from Operations and Adjusted Funds from Operations (As Restated)” in Item 7 of this Form 10-K/A. |
| (2) | As previously disclosed in the Company’s quarterly supplemental information furnished on Form 8-K on May 8, 2014. |
For discussion of the restatement adjustments, see Note 2 – Restatement of Previously Issued Financial Statements in the Company’s Quarterly Report on Form 10-Q/A for the fiscal period ended March 31, 2014.
| Three Months Ended June 30, 2014 (Unaudited) | Six Months Ended June 30, 2014 (Unaudited) | |||||||||||||||||||||||||||||||
| As Previously Reported |
As Restated | $ Change Fav/(Unfav) |
% Change | As Previously Reported |
As Restated | $ Change Fav/(Unfav) |
% Change | |||||||||||||||||||||||||
| Selected balance sheet amounts |
||||||||||||||||||||||||||||||||
| Total assets |
$ | 21,315,487 | $ | 21,310,496 | $ | (4,991 | ) | (0.02 | )% | $ | 21,315,487 | $ | 21,310,496 | $ | (4,991 | ) | (0.02 | )% | ||||||||||||||
| Total liabilities |
10,451,698 | 10,485,022 | (33,324 | ) | (0.32 | )% | 10,451,698 | 10,485,022 | (33,324 | ) | (0.32 | )% | ||||||||||||||||||||
| Total equity |
10,594,490 | 10,556,175 | (38,315 | ) | (0.36 | )% | 10,594,490 | 10,556,175 | (38,315 | ) | (0.36 | )% | ||||||||||||||||||||
| Selected statement of operations amounts |
||||||||||||||||||||||||||||||||
| Total revenues |
$ | 381,981 | $ | 382,178 | $ | 197 | 0.05 | % | $ | 702,595 | $ | 703,332 | $ | 737 | 0.10 | % | ||||||||||||||||
| Total operating expenses |
355,573 | 353,284 | 2,289 | 0.64 | % | 867,301 | 835,412 | 31,889 | 3.68 | % | ||||||||||||||||||||||
| Net loss attributable to the Company |
(40,328 | ) | (54,720 | ) | (14,392 | ) | (35.69 | )% | (349,009 | ) | (346,164 | ) | 2,845 | 0.82 | % | |||||||||||||||||
| Selected cash flow amounts |
||||||||||||||||||||||||||||||||
| Net cash provided by (used in) operating activities |
$ | 139,911 | $ | 154,021 | $ | 14,110 | 10.08 | % | $ | 33,785 | $ | 31,193 | $ | (2,592 | ) | (7.67 | )% | |||||||||||||||
| Net cash used in investing activities |
(734,300 | ) | (777,649 | ) | (43,349 | ) | (5.90 | )% | (1,946,422 | ) | (1,952,056 | ) | (5,634 | ) | (0.29 | )% | ||||||||||||||||
| Net cash provided by financing activities |
705,012 | 735,941 | 30,929 | 4.39 | % | 2,053,602 | 2,063,667 | 10,065 | 0.49 | % | ||||||||||||||||||||||
| Net change in cash and cash equivalents |
110,623 | 112,313 | 1,690 | 1.53 | % | 140,965 | 142,804 | 1,839 | 1.30 | % | ||||||||||||||||||||||
| Funds from operations and adjusted funds from operations amounts - gross method (1) |
||||||||||||||||||||||||||||||||
| Funds from operations |
$ | 174,661 | $ | 156,967 | $ | (17,694 | ) | (10.13 | )% | $ | (15,115 | ) | $ | 12,163 | $ | 27,278 | 180.47 | % | ||||||||||||||
| Adjusted funds from operations |
205,278 | 185,934 | (19,344 | ) | (9.42 | )% | 353,058 | 300,706 | (52,352 | ) | (14.83 | )% | ||||||||||||||||||||
| AFFO per share (2) |
$ | 0.24 | $ | 0.21 | (0.03 | ) | (12.50 | )% | $ | 0.49 | $ | 0.41 | (0.08 | ) | (16.33 | )% | ||||||||||||||||
5
Table of Contents
| (1) | The gross method is defined in “Management’s Discussion and Analysis of Financial Condition and Results of Operations – Sources of Funds – Funds from Operations and Adjusted Funds from Operations (As Restated)” in Item 7 of this Form 10-K/A. |
| (2) | As previously disclosed in the Company’s quarterly supplemental information furnished on Form 8-K on July 29, 2014. |
For discussion of the restatement adjustments, see Note 2 – Restatement of Previously Issued Financial Statements in the Company’s Quarterly Report on Form 10-Q/A for the fiscal periods ended June 30, 2014.
Internal Control Considerations
In light of the findings of the Audit Committee’s investigation and a review by the Company in connection with the preparation of the restatements, the Company’s new management re-evaluated the Company’s internal control over financial reporting and its disclosure controls and procedures and concluded that they were not effective at December 31, 2013. These material weaknesses had not been remediated, and additional material weaknesses in our internal control over financial reporting existed, at March 31, 2014, June 30, 2014 and September 30, 2014. In addition, at those dates, our disclosure controls and procedures were not effective. The material weaknesses existing at December 31, 2013 and the Company’s plans for remediation are described in Part II, Item 9A – Controls and Procedures in this Form 10-K/A. The Company is committed to remediating its material weaknesses as promptly as possible. Implementation of the Company’s remediation plans has commenced and is being overseen by the Audit Committee.
Management Changes
During the fourth quarter of 2014, the following executive officers resigned from all positions with the Company and its subsidiaries: Mr. Schorsch, Executive Chairman of the Board of Directors; Mr. Block, Chief Financial Officer; David S. Kay, Chief Executive Officer and a director; Lisa E. Beeson, President and Chief Operating Officer; and Lisa P. McAlister, Chief Accounting Officer. In connection with their resignations, these individuals relinquished an aggregate of approximately 2.7 million shares of stock as well as all outstanding interests in the Company’s 2014 Outperformance Plan.
Following the resignations of Mr. Block and Ms. McAlister, the Company’s Board of Directors appointed Michael Sodo as Chief Financial Officer and Gavin B. Brandon as Chief Accounting Officer. Following the resignations of Messrs. Schorsch and Kay and Ms. Beeson, the Board of Directors appointed William G. Stanley, who had been serving as Lead Independent Director, as Interim Chairman of the Board and Interim Chief Executive Officer. The Compensation Committee has commenced a search, with the assistance of an independent search firm, for a new independent Chairman of the Board and a new Chief Executive Officer.
Regulatory Investigations and Litigation Related to this Matter
Prior to the filing of the October 29 8-K, the Audit Committee previewed for the SEC the information contained in the filing. Subsequent to the filing, the SEC provided notice that it had commenced a formal investigation and issued subpoenas calling for the production of documents. In addition, the United States Attorney’s Office for the Southern District of New York contacted counsel for the Audit Committee and counsel for the Company with respect to this matter, and the Secretary of the Commonwealth of Massachusetts issued a subpoena calling for the production of various documents. The Audit Committee and the Company are cooperating with these regulators in their investigations.
The Company and certain of its current and former directors and officers have been named as defendants in a number of lawsuits filed in response to the October 29 8-K, including class actions, derivative actions and individual actions under the federal securities laws and state common and corporate laws in both federal and state courts in New York and Maryland. For information concerning these lawsuits, see “Risk Factors – New Risk Factors” in Item 1A of this Form 10-K/A and Note 24 – Subsequent Events (As Restated) to the consolidated financial statements contained in this Form 10-K/A.
6
Table of Contents
AMERICAN REALTY CAPITAL PROPERTIES, INC.
For the fiscal year ended December 31, 2013
| Page | ||||||
| Forward-Looking Statements | 8 | |||||
| PART I | ||||||
| Item 1. | 11 | |||||
| Item 1A. | 19 | |||||
| Item 1B. | 58 | |||||
| Item 2. | 58 | |||||
| Item 3. | 63 | |||||
| Item 4. | 63 | |||||
| PART II | ||||||
| Item 5. | 64 | |||||
| Item 6. | 71 | |||||
| Item 7. | Management’s Discussion and Analysis of Financial Condition and Results of Operations |
73 | ||||
| Item 7A. | 100 | |||||
| Item 8. | 100 | |||||
| Item 9. | Changes in and Disagreements With Accountants on Accounting and Financial Disclosure |
101 | ||||
| Item 9A. | 101 | |||||
| Item 9B. | 108 | |||||
| PART III | ||||||
| Item 10. | 110 | |||||
| Item 11. | 110 | |||||
| Item 12. | Security Ownership of Certain Beneficial Owners and Management and Related Stockholder Matters |
110 | ||||
| Item 13. | Certain Relationships and Related Transactions, and Director Independence |
110 | ||||
| Item 14. | 110 | |||||
| PART IV | ||||||
| Item 15. | 111 | |||||
| Signatures | 117 | |||||
| Index to Consolidated Financial Statements | F-1 | |||||
7
Table of Contents
Forward-Looking Statements (As Restated)
Certain statements included herein are forward-looking statements. Those statements include statements regarding the intent, belief or current expectations of American Realty Capital Properties, Inc. and members of our management team, as well as the assumptions on which such statements are based, and generally are identified by the use of words such as “may,” “will,” “seeks,” “anticipates,” “believes,” “estimates,” “expects,” “plans,” “intends,” “should” or similar expressions. Actual results may differ materially from those contemplated by such forward-looking statements. Further, forward-looking statements speak only as of the date they are made, and we undertake no obligation to update or revise forward-looking statements to reflect changed assumptions, the occurrence of unanticipated events or changes to future operating results over time, unless required by law. As used herein, the terms “ARCP,” “we,” “our” and “us” refer to American Realty Capital Properties, Inc., a Maryland corporation, together with our consolidated subsidiaries, including ARC Properties Operating Partnership, L.P., a Delaware limited partnership of which we are the sole general partner, which we refer to in herein as our “OP”; our “Former Manager” refers to ARC Properties Advisors, LLC, a Delaware limited liability company, our former external manager; “ARC” refers to AR Capital, LLC (formerly known as American Realty Capital II, LLC) and its affiliated companies, which formerly was our sponsor; and “the Contributor” refers to ARC Real Estate Partners, LLC, an affiliate of ARC, which contributed its 100% indirect ownership interests in the properties contributed to our OP in the formation transactions related to our initial public offering, or our IPO, described elsewhere herein, or the formation transactions. During the year ended December 31, 2013, we retained our Former Manager to manage our affairs on a day to day basis and, as a result, were generally externally managed, with the exception of certain acquisition, accounting and portfolio management services performed by our employees. Our board of directors determined that it is in the best interests of us and our stockholders to become self-managed, and we completed our transition to self-management on January 8, 2014. In connection with becoming self-managed and since the beginning of the third quarter of 2013, we terminated the existing management agreement with our Former Manager, entered into employment and incentive compensation arrangements with our executives.
The following are some of the risks and uncertainties, although not all risks and uncertainties, that could cause our actual results to differ materially from those presented in our forward-looking statements:
| • | We have a limited operating history and limited experience operating a public company. This inexperience makes our future performance difficult to predict. |
| • | The competition for the type of properties we desire to acquire may cause our dividends and the long-term returns of our investors to be lower than they otherwise would be. |
| • | We may be unable to renew leases, lease vacant space or re-lease space as leases expire on favorable terms or at all, which could have a material adverse effect on our financial condition, results of operations, cash flow, cash available for dividends to our stockholders, per share trading price of our common stock and our ability to satisfy our debt service obligations. |
| • | We depend on tenants for our revenue, and, accordingly, our revenue is dependent upon the success and economic viability of our tenants. |
| • | Failure by any major tenant with leases in multiple locations to make rental payments to us, because of a deterioration of its financial condition or otherwise, or the termination or non-renewal of a lease by a major tenant, would have a material adverse effect on us. |
| • | We are subject to tenant industry concentrations that make us more susceptible to adverse events with respect to certain industries. |
| • | Increases in interest rates could increase the amount of our debt payments and limit our ability to pay dividends to our stockholders. |
| • | We may be unable to make scheduled payments on our debt obligations. |
| • | We may not generate cash flows sufficient to pay our dividends to stockholders, and as such we may be forced to borrow at higher rates to fund our operations. |
| • | We may be unable to pay or maintain cash dividends or increase dividends over time. |
8
Table of Contents
| • | We may be affected by the incurrence of additional secured or unsecured debt. |
| • | We may be adversely affected by increases in interest rates or a failure to maintain our OP’s credit rating. |
| • | We may not be able to integrate the assets and businesses acquired in Recent Acquisitions (defined below) into our existing portfolio or with our business successfully, or may not realize the anticipated benefits within the expected timeframe or at all. |
| • | We may not be able to effectively manage or dispose of assets acquired in connection with our Recent Acquisitions that do not fit within our target assets. |
| • | We may not be able to effectively manage our expanded portfolio and operations following our Recent Acquisitions. |
| • | We may be affected by risks associated with current and future litigation, including pending and filed securities litigation and governmental inquiries. |
| • | We may not be able to successfully acquire future properties on advantageous terms. |
| • | We may not be able to achieve and maintain profitability. |
| • | We are subject to risks associated with lease terminations, tenant defaults, bankruptcies and insolvencies and tenant credit, geographic and industry concentrations. |
| • | We could be subject to unexpected costs or unexpected liabilities that may arise from our Recent Acquisitions. |
| • | We may fail to qualify to be treated as a real estate investment trust for U.S. federal income tax purposes (“REIT”). |
| • | We may be deemed to be an investment company under the Investment Company Act of 1940, as amended, (the “Investment Company Act”) and thus subject to regulation under the Investment Company Act. |
| • | Once we resume paying a dividend in respect of our common stock, there is no guarantee that such dividend will be paid at a rate equal to or at the same frequency as our previously declared monthly dividend. |
| • | Our financial condition may be affected by our recent credit rating downgrade which could impact our access to capital and the terms of potential financing. |
| • | We have material weaknesses in our disclosure controls and procedures and our internal control over financial reporting and we may not be able to remediate such material weaknesses in a timely enough manner to eliminate the risks posed by such material weaknesses in future periods. |
| • | Failure to timely deliver on or before March 31, 2015 our and the OP’s annual report on Form 10-K for the year ended December 31, 2014 in light of our obligations pursuant to an agreement with the lenders under the Credit Facility and pursuant to the terms of our indentures governing our senior unsecured and convertible notes could result in an event of default. |
| • | We may not satisfy NASDAQ’s requirements for regaining compliance with its listing rules and, if so, NASDAQ could delist our common stock and Series F Preferred Stock. |
All forward-looking statements should be read in light of the risks identified in Part I, Item 1A of this Form 10-K/A.
9
Table of Contents
We use certain defined terms throughout this document that have the following meanings:
We use the term “net lease” throughout this document. Under a net lease, the tenant occupying the leased property (usually as a single tenant) does so in much the same manner as if the tenant were the owner of the property. There are various forms of net leases, most typically classified as triple net or double net. Triple net leases typically require the tenant to pay all costs associated with a property, including real estate taxes, insurance, utilities and routine maintenance in addition to the base rent. Double net leases typically require the tenant to pay all the costs as triple net leases, but hold the landlord responsible for capital expenditures, including the repair or replacement of specific structural and/or bearing components of a property, such as the roof or structure of the building. Accordingly, the owner receives the rent “net” of these expenses, rendering the cash flow associated with the lease predictable for the term of the lease. Under a net lease, the tenant generally agrees to lease the property for a significant term and agrees that it will either have no ability or only limited ability to terminate the lease or abate rent prior to the expiration of the term of the lease as a result of real estate driven events such as casualty, condemnation or failure by the landlord to fulfill its obligations under the lease.
We use the term “modified gross lease” throughout this document. Under a modified gross lease, the commercial enterprises occupying the leased property pay base rent plus a proportional share of some of the other costs associated with the property, such as property taxes, utilities, insurance and maintenance.
We use the term “credit tenant” throughout this document. When we refer to a “credit tenant,” we mean a tenant that has entered into a lease that we determine is creditworthy and may include tenants with an investment grade or below investment grade credit rating, as determined by major credit rating agencies, or unrated tenants. To the extent we determine that a tenant is a “credit tenant” even though it does not have an investment grade credit rating, we do so based on our management’s determination that a tenant should have the financial wherewithal to honor its obligations under its lease with us. This determination is based on our management’s substantial experience closing net lease transactions and is made after evaluating all tenants’ due diligence materials that are made available to us, including financial statements and operating data.
We use the term “annualized rental income” throughout this document. When we refer to “annualized rental income,” we mean the rental income under our leases reflecting straight-line rent adjustments associated with contractual rent increases in the leases as required by generally accepted accounting principles in the United States (“U.S. GAAP”), which includes the effect of tenant concessions such as free rent, as applicable. We also use the term annualized rental income/net operating income (“NOI”) throughout this document. When we refer to “annualized rental income/NOI” for net leases, we mean rental income on a straight-line basis, which includes the effect of tenant concessions such as free rent as applicable. For modified gross leased properties, NOI is rental income on a straight-line basis, which includes the effect of tenant concessions such as free rent, as applicable, plus operating expense reimbursement revenue less property expenses.
When we refer to properties that are net leased on a “medium-term basis,” we mean properties originally leased long term (10 years or longer) that are currently subject to net leases with remaining primary lease terms of generally three to eight years, on average. When we refer to properties that are net leased on a “long-term basis,” we mean properties with remaining primary lease terms of generally 10 years or longer on average.
10
Table of Contents
Overview
We were incorporated on December 2, 2010 as a Maryland corporation that qualified as a REIT for U.S. federal income tax purposes beginning in the year ended December 31, 2011. On September 6, 2011, we completed our initial public offering (our “IPO”) and our shares of common stock began trading on the NASDAQ Global Select Market (“NASDAQ”) under the symbol “ARCP” on September 7, 2011.
We are a self-managed and self-administered real estate company that acquires, owns and operates single-tenant, free-standing commercial real estate properties primarily subject to net leases with high credit quality tenants. We focus on investing in properties that are net leased to (i) credit tenants, which are generally large public companies with investment-grade ratings and other creditworthy tenants and (ii) governmental, quasi-governmental and not-for-profit entities. Our long-term business strategy is to acquire a diverse portfolio consisting of approximately 70% long-term leases and 30% medium-term leases, with an average remaining lease term of 10 to 12 years. We expect this investment strategy to provide for stable income from credit tenants and to provide for growth opportunities from re-leasing of current below market leases.
Substantially all of our business is conducted through the OP. We are the sole general partner and holder of 96.1% of the equity interests in the OP as of December 31, 2013. As of December 31, 2013, certain of our affiliates and certain unaffiliated investors are limited partners and owners of 3.3% and 0.6%, respectively, of the equity interests in the OP. Under the limited partnership agreement of the OP, after holding units of limited partner interests in the OP (“OP Units”) for a period of one year, unless otherwise consented to by us, holders of OP Units have the right to redeem the OP Units for the cash value of a corresponding number of shares of our common stock or, at our option, as general partner of the OP, a corresponding number of shares of our common stock. The remaining rights of the holders of OP Units are limited, and do not include the ability to replace the general partner or to approve the sale, purchase or refinancing of the OP’s assets.
We have advanced our investment objectives by growing our net lease portfolio through self-origination of property acquisitions and strategic mergers and acquisitions. See Note 3 — Mergers and Acquisitions to the consolidated financial statements.
As of December 31, 2013, excluding one vacant property classified as held for sale, we owned 2,559 properties consisting of 43.8 million square feet, which were 99% leased with a weighted-average remaining lease term of 9.4 years. In constructing our portfolio, we are committed to diversification (by industry, tenant and geography). As of December 31, 2013, rental revenues derived from investment grade tenants and tenants affiliated with investment grade entities as determined by a major rating agency approximated 60% (we have attributed the rating of each parent company to its wholly owned subsidiary for purposes of this disclosure). Our strategy encompasses receiving the majority of our revenue from investment grade tenants as we further acquire properties and enter into (or assume) lease arrangements.
Completed Mergers and Major Acquisitions
The following summarizes mergers and portfolio acquisitions that have been consummated since January 1, 2013 (the “Recent Acquisitions”):
American Realty Capital Trust III, Inc. Merger
On December 14, 2012, we entered into an Agreement and Plan of Merger (the “ARCT III Merger Agreement”) with American Realty Capital Trust III, Inc. (“ARCT III”) and certain subsidiaries of each company. The ARCT III Merger Agreement provided for the merger of ARCT III (the “ARCT III Merger”) with and into a subsidiary of ours. The ARCT III Merger was consummated on February 28, 2013. See Note 3 — Mergers and Acquisitions for further discussion of the ARCT III Merger.
Also in connection with the ARCT III Merger, we entered into an agreement with ARC and its affiliates to internalize certain functions performed by them prior to the ARCT III Merger, reduce certain fees paid to affiliates, purchase certain corporate assets and pay certain merger related fees. See Note 19 — Related Party Transactions and Arrangements (As Restated) for further discussion.
11
Table of Contents
GE Capital Portfolio Acquisition
On June 27, 2013, we acquired, through subsidiaries of the OP, from certain affiliates of GE Capital Corp., the equity interests in the entities that own a real estate portfolio comprised of 447 properties, (the “GE Capital Portfolio”) for a purchase price of $773.9 million, exclusive of closing costs, with no liabilities assumed. The 447 properties are subject to 409 property operating leases, as well as 38 direct financing leases.
During the year ended December 31, 2013, ARCT IV (defined below) acquired, from certain affiliates of GE Capital Corp., the equity interests in the entities that own a real estate portfolio comprised of 924 properties (the “ARCT IV GE Capital Portfolio”) for a purchase price of $1.4 billion, exclusive of closing costs, with no liabilities assumed. The 924 properties are subject to 912 property operating leases, as well as 12 direct financing leases.
CapLease, Inc. Merger
On May 28, 2013, we entered into an Agreement and Plan of Merger (the “CapLease Merger Agreement”) with CapLease, Inc., a Maryland corporation (“CapLease”), and certain subsidiaries of each company. The CapLease Merger Agreement provided for the merger of CapLease with and into a subsidiary of ours (the “CapLease Merger”). On November 5, 2013, we completed the merger with CapLease based on the terms of the CapLease Merger Agreement. See Note 3 — Mergers and Acquisitions for further discussion of the CapLease Merger.
American Realty Capital Trust IV, Inc. Merger
On July 1, 2013, we entered into an Agreement and Plan of Merger, as amended on October 6, 2013 and October 11, 2013, (the “ARCT IV Merger Agreement”) with American Realty Capital Trust IV, Inc., a Maryland corporation (“ARCT IV”), and certain subsidiaries of each company. The ARCT IV Merger Agreement provided for the merger of ARCT IV with and into a subsidiary of the OP (the “ARCT IV Merger”). We consummated the ARCT IV Merger on January 3, 2014. See Note 3 — Mergers and Acquisitions for further discussion of the ARCT IV Merger.
ARCP and ARCT IV, from inception to the ARCT IV Merger date, were considered to be entities under common control. Both entities’ advisors were wholly owned subsidiaries of ARC. ARC and its related parties had ownership interests in us and in ARCT IV through the ownership of shares of common stock and other equity interests. In addition, the advisors of both entities were contractually eligible to receive potential fees for their services to both of the companies including asset management fees, incentive fees and other fees and had continued to receive fees from us prior to our transition to self-management on January 8, 2014. Due to the significance of these fees, the advisors and ultimately ARC were determined to have a significant economic interest in both companies in addition to having the power to direct the activities of the companies through advisory/management agreements, which qualified them as affiliated companies under common control in accordance with U.S. GAAP. The acquisition of an entity under common control is accounted for on the carryover basis of accounting, whereby the assets and liabilities of the companies are recorded upon the merger on the same basis as they were carried by the companies on the ARCT IV Merger date. In addition, U.S. GAAP requires us to present historical financial information as if the entities were combined from the earliest period of common control. Therefore, the accompanying financial statements including the notes thereto are presented as if the ARCT IV Merger, including the impact of the equity transactions entered to consummate the merger, had occurred at inception.
Fortress Portfolio Acquisition
On July 24, 2013, ARC and another related entity, on our behalf and certain other entities sponsored directly or indirectly by ARC, entered into a purchase and sale agreement with affiliates of funds managed by Fortress Investment Group LLC (“Fortress”) for the purchase and sale of 196 properties owned by Fortress for an aggregate contract purchase price of $972.5 million, subject to adjustments set forth in the purchase and sale agreement and exclusive of closing costs, which was allocated to us based on the pro rata fair value of the properties acquired by us relative to the fair value of all 196 properties to be acquired from Fortress. Of the 196 properties, 120 properties were allocated to us (the “Fortress Portfolio”). On October 1, 2013, we closed on 41 of the 120 properties with a total purchase price of $200.3 million, exclusive of closing costs. We closed the acquisition of the remaining 79 properties in the Fortress Portfolio on January 8, 2014, for an aggregate contract purchase price of $400.9 million, exclusive of closing costs. The total purchase price of the Fortress Portfolio was $601.2 million, exclusive of closing costs. See Note 3 — Mergers and Acquisitions for further discussion of the Fortress Portfolio acquisition.
12
Table of Contents
Cole Real Estate Investments, Inc. Merger
On October 22, 2013, we entered into an Agreement and Plan of Merger (the “Cole Merger Agreement”) with Cole Real Estate Investments, Inc. (“Cole”), a Maryland corporation, and a wholly owned subsidiary of ours. The Cole Merger Agreement provided for the merger of Cole with and into a wholly owned subsidiary of ours (the “Cole Merger”). We consummated the Cole Merger on February 7, 2014 (the “Cole Acquisition Date”). See Note 3 — Mergers and Acquisitions for further discussion of the Cole Merger.
Inland Portfolio Acquisition
On August 8, 2013, ARC entered into a purchase and sale agreement with Inland American Real Estate Trust, Inc. (“Inland”) for the purchase and sale of the equity interests of 67 companies owned by Inland for an aggregate contract purchase price of $2.3 billion, subject to adjustments set forth in the purchase and sale agreement and exclusive of closing costs. Of the 67 companies, the equity interests of 10 companies (the “Inland Portfolio”) were acquired, in total, by us from Inland for a purchase price of $501.0 million, subject to adjustments set forth in the purchase and sale agreement and exclusive of closing costs, which was allocated to us based on the pro rata fair value of the Inland Portfolio relative to the fair value of all 67 companies to be acquired from Inland by us and the other entities sponsored directly or indirectly by ARC. The Inland Portfolio is comprised of 33 properties. As of December 31, 2013, we had closed on five of the 33 properties for a total purchase price of $56.4 million, exclusive of closing costs. We closed the acquisition of 27 additional properties in the Inland Portfolio subsequent to December 31, 2013. We do not consider it probable that we will close on the remaining property.
Transition to Self-Management
During the year ended December 31, 2013, we retained our Former Manager, a wholly owned subsidiary of ARC, to manage our affairs on a day-to-day basis and, as a result, we were generally externally managed, with the exception of certain acquisition, accounting and portfolio management services performed by our employees. In August 2013, our board of directors determined that it was in the best interests of us and our stockholders to become self-managed, and we completed our transition to self-management on January 8, 2014. In connection with becoming self-managed, we terminated the existing management agreement with our Former Manager, entered into employment and incentive compensation arrangements with our executives and the Former Manager agreed to sell us certain assets.
Under the termination agreement, the Former Manager agreed to provide services previously provided under the management agreement with the Former Manager, to the extent required by ARCP, for a tail period of 60 days following January 8, 2014 and received a payment in the amount of $10.0 million for providing such services. In addition, pursuant to a separate transition services agreement, affiliates of the Former Manager agreed to provide certain transition services, including accounting support, acquisition support, investor relations support, public relations support, human resources and administration, general human resources duties, payroll services, benefits services, treasury, insurance and risk management, information technology, telecommunications and Internet and services relating to office supplies for a 60-day term, which may be extended by ARCP. For additional services that were required by ARCP, ARCP paid an hourly rate or flat rate to be agreed on, that did not exceed market rate. See Note 19 — Related Party Transactions and Arrangements (As Restated) and Note 24 — Subsequent Events (As Restated) for further discussion.
13
Table of Contents
Investment Policies
Our primary business objective is to generate dependable monthly cash dividends from a consistent and predictable level of funds from operations (“FFO”) and adjusted funds from operations (“AFFO”) per share and capital appreciation associated with extending expiring leases or repositioning our properties for lease to new credit tenants upon the expiration of a net lease. After consummation of the mergers and acquisitions discussed above, we will own a portfolio that uniquely combines all entities’ portfolio of properties with stable income from high credit quality tenants, with our portfolio, which has substantial growth opportunities. Our long-term business strategy is to acquire a diverse portfolio consisting of approximately 70% long-term leases and 30% medium-term leases, with an average remaining lease term of 10 to 12 years. We expect this investment strategy to provide for stable income from credit tenants and to provide for growth opportunities from the re-leasing of properties that are currently subject to below market leases. We intend to pursue an investment strategy that maximizes current cash flow and achieves sustainable long-term growth. We expect to achieve these objectives by acquiring net leased properties that either (a) have in-place rental rates below current average asking rents in the applicable sub-market and are located in sub-markets with stable or improving market fundamentals or (b) provide a vital location or infrastructure that is essential to the business operations of the tenant, which we believe will give incentive to the existing tenant or a new credit tenant to re-lease the property at a higher rental rate upon the expiration of the existing lease.
Primary Investment Focus
We focus on investing in properties that are net leased to (i) credit tenants, which are generally large public companies with investment grade or below investment grade ratings and (ii) governmental, quasi-governmental and not-for-profit entities. We intend to invest in properties with tenants that reflect a diversity of industries, geographies and sizes. A significant majority of our net lease investments have been and will continue to be in properties net leased to investment grade tenants, although at any particular time our portfolio may not reflect this. Our properties are primarily located in ’’Main & Main’’ locations in markets that we believe exhibit demographic trends that will support growth. We believe the diversification of our portfolio reduces the risks associated with potential adverse events that may impact any one tenant, industry, asset type or location. We believe our scale will enable us to continue to make significant acquisitions without exposing ourselves to excessive concentration risk. Our strategy encompasses receiving the majority of our revenue from investment grade tenants as we further acquire properties and enter into (or assume) lease arrangements.
Under net lease arrangements, tenants enter into long-term leases and pay most of the costs associated with the property and limited day-to-day property management by us is required. As a result, net lease companies are generally able to increase their size and scale with minimal incremental expense. This enables us to take advantage of economies of scale resulting in significant operational efficiencies as we grow. We believe that our focus on net leases has also enabled us to achieve greater tenant and geographic diversification, more stable cash flows, increased liquidity and lower cost of capital.
Investing in Real Property
We invest, and expect to continue to invest, in primarily freestanding, single-tenant retail properties net-leased to investment grade and other creditworthy tenants. When evaluating prospective investments in real property, our management will consider relevant real estate and financial factors, including the location of the property, the leases and other agreements affecting the property, the creditworthiness of major tenants, its income-producing capacity, its physical condition, its prospects for appreciation, its prospects for liquidity, tax considerations and other factors. In this regard, our management will have substantial discretion with respect to the selection of specific investments, subject to approval of our board of directors.
As of December 31, 2013, after giving effect to the properties owned by ARCT IV which we acquired on January 3, 2014, we owned nearly 2,559 double and triple-net lease assets across property types. As a percentage of rental income, as of December 31, 2013, retail properties represented 54%, office properties represented 27% and distribution properties represented 19% of our total portfolio. Our portfolio is located across 49 states, the District of Columbia and Puerto Rico. Our tenant base is comprised of approximately 486 tenants, which include well-known national as well as regional companies across 55 industries.
14
Table of Contents
The following table lists the tenants whose annualized rental income, on a straight-line basis, represented greater than 10% of consolidated annualized rental income on a straight-line basis as of December 31, 2013 and 2012:
| Tenant |
2013 | 2012 | ||||||
| Citizens Bank |
* | 13.8 | % | |||||
| Dollar General |
* | 12.3 | % | |||||
| FedEx |
* | 10.2 | % | |||||
| * | The tenants’ annualized rental income was not greater than 10% of total annualized rental income for all portfolio properties as of the period specified. |
The following table lists the states where we have concentrations of properties where annual rental income, on a straight-line basis, represented greater than 10% of consolidated annualized rental income, on a straight-line basis, as of December 31, 2013 and 2012:
| State |
2013 | 2012 | ||||||
| Texas |
10.7 | % | * | |||||
| Illinois |
* | 11.2 | % | |||||
| * | The state’s annualized rental income was not greater than 10% of total annualized rental income for all portfolio properties as of the period specified. |
We do not have any specific policy as to the amount or percentage of our assets which will be invested in any specific property, other than the requirements under REIT qualification rules. We currently anticipate that our real estate investments will continue to be diversified in multiple net leased single tenant properties and in multiple geographic markets.
Purchase and Sale of Investments
We may deliberately and strategically dispose of properties in the future and redeploy funds into new acquisitions that align with our strategic objectives. Further, on a limited and opportunistic basis, we intend to acquire and promptly resell medium-term net lease assets for immediate gain. To the extent we engage in these activities, to avoid adverse U.S. federal income tax consequences, we generally must do so through a taxable REIT subsidiary (“TRS”). In general, a TRS is treated as a regular “C corporation” and therefore must pay corporate-level taxes on its taxable income. Thus, our yield on such activities will be reduced by such taxes borne by the TRS. Our two vacant properties will be held in a TRS because we are contemplating various strategies including selling them as a means of maximizing our value from those properties.
Investments in Real Estate Mortgages
While our current portfolio consists of, and our business objectives emphasize, equity investments in real estate, we may, at the discretion of our board of directors and without a vote of our stockholders, invest in mortgages and other types of real estate interests consistent with our qualification as a REIT. We acquired $97.6 million of mortgage loans and $211.9 million of collateralized mortgage backed securities (“CMBS”), pursuant to the Cole merger and the CapLease merger. Investments in real estate mortgages run the risk that one or more borrowers may default under the mortgages and that the collateral securing those mortgages may not be sufficient to enable us to recoup our full investment. Investments in mortgages are also subject to our policy not to be treated as an “investment company” under the Investment Company Act.
15
Table of Contents
Securities of or Interests in Persons Primarily Engaged in Real Estate Activities and Other Issuers
Subject to the asset tests and income tests necessary for REIT qualification, we may invest in securities of other REITs, other entities engaged in real estate activities or securities of other issuers (including partnership interests, limited liability company interests, common stock and preferred stock), where such investment would be consistent with our investment objectives, including for the purpose of exercising control over such entities. There are no limitations on the amount or percentage of our total assets that may be invested in any one issuer, other than those imposed by the gross asset tests we must meet in order to qualify as a REIT under the Internal Revenue Code of 1986, as amended (the “Code”). We do not intend that our investments in securities will require us to register as an “investment company” under the Investment Company Act, and we would generally divest appropriate securities before any such registration would be required.
Build-to-Suit and Properties under Development
We are also expanding our investment activities beyond the traditional investment in completed properties with tenants in occupancy and paying rents by continuing the build-to-suit program and acquisition of properties under the development of Cole and CapLease. These programs involve acquisition of properties that are not yet developed or are under development. Through the build-to-suit program and acquisition of properties under development or that require substantial refurbishment or renovation, we seek to source investments at higher rates of return relative to completed projects. We believe that by entering into projects with established developer partners, we can provide the capital needed to get projects built, while at the same time, securing long-term investment assets for our company at yields significantly higher than those available for completed properties.
Cole Capital®
We acquired Cole Capital as part of our acquisition of Cole. Cole Capital sponsors and manages direct investment programs, which primarily includes five publicly registered, non-traded REITs. Cole Capital is responsible for managing the day-to-day affairs of the non-traded REITs, identifying and making acquisitions and investments on behalf of the non-traded REITs, and recommending to each of the respective board of directors of the non-traded REITs an approach for providing investors with liquidity. Cole Capital also develops new non-traded REIT offerings, distributes the shares of common stock for the non-traded REITs and advises them regarding offerings, manages relationships with participating broker-dealers and financial advisors and provides assistance in connection with compliance matters relating to the offerings.
Joint Ventures
We may acquire or enter into joint ventures from time to time, if we determine that doing so would be the most cost-effective and efficient means of raising capital. Equity investments may be subject to existing mortgage financing and other indebtedness or such financing or indebtedness may be incurred in connection with acquiring investments. Any such financing or indebtedness will have priority over our equity interest in such property.
Financing Policies
We rely on leverage to allow us to invest in a greater number of assets and enhance our asset returns. We expect our leverage levels to decrease over time, as a result of one or more of the following factors: scheduled principal amortization on our debt and lower leverage on new asset acquisitions. We expect to continue to strengthen our balance sheet through debt repayment or repurchase and also opportunistically grow our portfolio through new property acquisitions.
We intend to finance future acquisitions with the most advantageous source of capital available to us at the time of the transaction, which may include a combination of public and private offerings of our equity and debt securities, secured and unsecured corporate-level debt, property-level debt and mortgage financing and other public, private or bank debt. In addition, we may acquire properties in exchange for the issuance of common stock or OP Units and in many cases we may acquire properties subject to existing mortgage indebtedness.
In February 2014, we, through our OP, raised $2.55 billion in unsecured senior notes, and simultaneously with that financing, our credit agreement, which previously had been secured by pledges of interests in property-owning entities, was modified to eliminate these pledges. We intend to continue to emphasize unsecured corporate- or OP-level debt in our financing and seek to reduce the percentage of our assets which are secured by mortgage loans.
16
Table of Contents
When we use mortgage financing, we generally seek to finance our properties with, or acquire properties subject to, long-term, fixed-rate, non-recourse debt, effectively locking in the spread we expect to generate on our properties and isolating the default risk to solely the properties financed. Through non-recourse debt, we seek to limit the overall company exposure in the event we default on the debt to the amount we have invested in the asset or assets financed. We seek to finance our assets with “match-funded” or substantially “match-funded” debt, meaning that we seek to obtain debt whose maturity matches as closely as possible the lease maturity of the asset financed. We expect that over time the leverage on net leased properties with medium-term remaining lease durations will be approximately 45% to 55% of the property value. At December 31, 2013, our corporate leverage ratio (total debt outstanding less on-hand cash and cash equivalents divided by base purchase price of acquired properties) was 58.1%.
We also may obtain secured or unsecured debt to acquire properties, and we expect that our financing sources will include banks, institutional investment firms, including asset managers, and life insurance companies. Although we intend to maintain a conservative capital structure, with limited reliance on debt financing, our charter does not contain a specific limitation on the amount of debt we may incur and our board of directors may implement or change target debt levels at any time without the approval of our stockholders.
Lending Policies
We do not have a policy limiting our ability to make loans to other persons, although we may be so limited by applicable law, such as the Sarbanes-Oxley Act. Subject to REIT qualification rules, we may make loans to unaffiliated third parties. For example, we may consider offering purchase money financing in connection with the disposition of properties in instances where the provision of that financing would increase the value to be received by us for the property sold. We do not expect to engage in any significant lending in the future. We may choose to guarantee debt of certain joint ventures with third parties. Consideration for those guarantees may include, but is not limited to, fees, long-term management contracts, options to acquire additional ownership interests and promoted equity positions. Our board of directors may, in the future, adopt a formal lending policy without notice to or consent of our stockholders.
Dividend Policy
We intend to pay regular monthly dividends to holders of our common stock, Series D cumulative convertible preferred stock, Series F cumulative redeemable preferred stock and the units of ownership in the OP. U.S. federal income tax law generally requires that a REIT distribute annually at least 90% of its REIT taxable income, without regard to the deduction for dividends paid and excluding net capital gains, and that it pay tax at regular corporate rates to the extent that it annually distributes less than 100% of its REIT taxable income.
In September 2011, our board of directors authorized, and we began paying dividends in October 2011, on the 15th day of each month to common stockholders of record at the close of business on the eighth day of such month. Since October 2011, the board of directors has authorized the following increases in our common stock dividends:
| Declaration date |
Annualized dividend per share |
Distribution date | Record date | |||||||||
| September 7, 2011 |
$ | 0.875 | 10/15/2011 | 10/8/2011 | ||||||||
| February 27, 2012 |
$ | 0.880 | 3/15/2012 | 3/8/2012 | ||||||||
| March 16, 2012 |
$ | 0.885 | 6/15/2012 | 6/8/2012 | ||||||||
| June 27, 2012 |
$ | 0.890 | 9/15/2012 | 9/8/2012 | ||||||||
| September 30, 2012 |
$ | 0.895 | 11/15/2012 | 11/8/2012 | ||||||||
| November 29, 2012 |
$ | 0.900 | 2/15/2013 | 2/8/2013 | ||||||||
| March 17, 2013 |
$ | 0.910 | 6/15/2013 | 6/8/2013 | ||||||||
| May 28, 2013 |
$ | 0.940 | 12/13/2013 | 12/6/2013 | ||||||||
| October 23, 2013* |
$ | 1.000 | 2/15/2014 | 2/7/2014 | ||||||||
| * | The dividend increase was contingent upon, and became effective with, the close of the Cole merger, which was consummated on February 7, 2014. |
17
Table of Contents
Commencing on May 31, 2012, we began paying cumulative dividends on the Series A convertible preferred stock monthly in arrears at the annualized rate of $0.77 per share. Commencing on August 15, 2012, we began paying cumulative dividends on the Series B convertible preferred stock monthly in arrears at an annualized rate of $0.74 per share. These dividends were discontinued when the Series A and B convertible preferred stock were converted to common stock in August 2013. Commencing in June 2013, we began paying cumulative dividends on the Series C cumulative convertible preferred stock monthly in arrears at the annualized rate of $0.9104 per share. These dividends were discontinued when the Series C cumulative convertible preferred stock was converted to common stock and cash in November 2013. Commencing in November 2013, we began paying cumulative dividends on the Series D cumulative preferred stock monthly in arrears at the annualized rate of $0.7896 per share.
We have the ability to fund dividends from any source, including borrowing funds and using the proceeds of equity and debt offerings. Dividends made by us will be authorized by our board of directors in its sole discretion out of funds legally available therefore and will be dependent upon a number of factors, including restrictions under applicable law and our capital requirements.
We and our board of directors share a similar philosophy with respect to paying our dividend. The dividend should principally be derived from cash flows generated from real estate operations. The management agreement with our Former Manager, prior to the amendment thereof in connection with the ARCT III Merger, provided for payment of the asset management fee only if the full amount of the dividends declared by us in respect of our OP Units for the six immediately preceding months is equal to or greater than the amount of our AFFO. This condition has been satisfied. Prior to when it was satisfied, our Former Manager waived such portion of its management fee that, when added to our AFFO, without regard to the waiver of the management fee, increased our AFFO so that it equaled the dividends declared by us in respect of our OP Units for the prior six months. For the year ended December 31, 2013, $9.4 million in base management fees were incurred while certain of these fees were waived by our Former Manager that were in excess of certain net income thresholds related to the Company’s operations. Subsequent to December 31, 2013, the management agreement was terminated as a result of our transition to self-management. See Note 24 — Subsequent Events for further discussion.
As our real estate portfolio matures and one-time acquisition and transaction expenses are significantly reduced, we expect cash flows from operations to cover a more significant portion of our dividends and over time to cover dividends.
Tax Status
We elected to be taxed as a REIT under Sections 856 through 860 of the Code, effective for our taxable year ended December 31, 2011. We believe that we are organized and operate in such a manner as to qualify for taxation as a REIT under the Code. We intend to continue to operate in such a manner to qualify for taxation as a REIT, but no assurance can be given that we will operate in a manner so as to qualify or remain qualified as a REIT. Pursuant to our charter, our board of directors has the authority to make any tax elections on our behalf that, in their sole judgment, are in our best interest. This authority includes the ability to elect not to qualify as a REIT for U.S. federal income tax purposes or, after qualifying as a REIT, to revoke or otherwise terminate our status as a REIT. Our board of directors has the authority under our charter to make these elections without the necessity of obtaining the approval of our stockholders. In addition, our board of directors has the authority to waive any restrictions and limitations contained in our charter that are intended to preserve our status as a REIT during any period in which our board of directors has determined not to pursue or preserve our status as a REIT.
Competition
We are subject to competition in the acquisition of properties and intense competition in the leasing of our properties. We compete with a number of developers, owners and operators of retail, restaurant, industrial and office real estate, many of which own properties similar to ours in the same markets in which our properties are located, in the leasing of our properties. We also may face new competitors and, due to our focus on single-tenant properties located throughout the United States, and because many of our competitors are locally or regionally focused, we will not encounter the same competitors in each region of the United States.
Many of our competitors have greater financial and other resources and may have other advantages over our company. Our competitors may be willing to accept lower returns on their investments and may succeed in buying the properties that we have targeted for acquisition. We may also incur costs on unsuccessful acquisitions that we will not be able to recover.
18
Table of Contents
Regulations
Our investments are subject to various federal, state, local and foreign laws, ordinances and regulations, including, among other things, zoning regulations, land use controls, environmental controls relating to air and water quality, noise pollution and indirect environmental impacts such as increased motor vehicle activity. We believe that we have all permits and approvals necessary under current law to operate our investments.
Environmental Matters
Under various federal, state and local environmental laws, a current owner of real estate may be required to investigate and clean up contaminated property. Under these laws, courts and government agencies have the authority to impose cleanup responsibility and liability even if the owner did not know of and was not responsible for the contamination. For example, liability can be imposed upon us based on the activities of our tenants or a prior owner. In addition to the cost of the cleanup, environmental contamination on a property may adversely affect the value of the property and our ability to sell, rent or finance the property, and may adversely impact our investment in that property.
Prior to acquisition of a property, we will obtain Phase I environmental reports, or will rely on recent Phase I environmental reports. These reports will be prepared in accordance with an appropriate level of due diligence based on our standards and generally include a physical site inspection, a review of relevant federal, state and local environmental and health agency database records, one or more interviews with appropriate site-related personnel, review of the property’s chain of title and review of historic aerial photographs and other information on past uses of the property and nearby or adjoining properties. We may also obtain a Phase II investigation which may include limited subsurface investigations and tests for substances of concern where the results of the Phase I environmental reports or other information indicates possible contamination or where our consultants recommend such procedures.
Employees
As of December 31, 2013, we had 12 employees. On January 8, 2014, we successfully completed our transition to self-management. In connection with becoming self-managed, ARCP terminated its management agreement with its external manager and certain former executives and employees of our Former Manager became our employees. Subsequent to our transition to self-management on January 8, 2014 and including employees from the consummation of the Cole Merger, we had approximately 400 employees.
Financial Information About Industry Segments
Our current business consists of owning, managing, operating, leasing, acquiring, investing in and disposing of real estate assets. All of our consolidated revenues are from our consolidated real estate properties. We internally evaluate operating performance on an individual property level and view all of our real estate assets as one industry segment, and accordingly, all of our properties are aggregated into one reportable segment. Please see Part IV, Item 15 — Exhibits and Financial Statement Schedules included elsewhere in this annual report for more detailed financial information.
Available Information
We electronically file Annual Reports on Form 10-K, Quarterly Reports on Form 10-Q, current reports on Form 8-K and all amendments to those reports, and proxy statements, with the SEC. You may read and copy any materials we file with the SEC at the SEC’s Public Reference Room at 100 F Street, NE, Washington, D.C. 20549, or you may obtain information by calling the SEC at 1-800-SEC-0330. The SEC maintains an internet address at http://www.sec.gov that contains reports, proxy statements and information statements, and other information, which you may obtain free of charge. In addition, copies of our filings with the SEC may be obtained from the website maintained for us at www.arcpreit.com.
Item 1A. Risk Factors (Certain Sections Restated)
This “Risk Factors” section contains references to our “capital stock” and to our “stockholders.” Unless expressly stated otherwise, the references to our “capital stock” represent our common stock and any class or series of our preferred stock, while the references to our “stockholders” represent holders of our common stock and any class or series of our preferred stock.
19
Table of Contents
New Risk Factors in this Form 10-K/A
The following risk factors, which relate to the matters discussed in the Explanatory Note, have been added to this Form 10-K/A. Other than this section, “New Risk Factors in this Form 10-K/A,” the remainder of Item 1A. Risk Factors has not been updated to reflect developments since February 27, 2014, the date of the Original Filing, unless specified “as restated.” However, all Risk Factors not updated should be read in light of the information presented below.
We have not been in compliance with the requirements of the NASDAQ Stock Market for continued listing and if NASDAQ does not concur that we have adequately remedied our non-compliance, our common stock may be delisted from trading on NASDAQ, which could have a material adverse effect on us and our shareholders.
We have been delinquent in the filing of our Quarterly Report on Form 10-Q for the fiscal quarter ended September 30, 2014 (the “Third Quarter 10-Q”), as a result of which we have not been in compliance with the listing rules of the NASDAQ and are subject to having our stock delisted from trading on NASDAQ. We submitted a compliance plan to NASDAQ on January 12, 2015 and the staff at NASDAQ granted us an exception to file our Third Quarter 10-Q and any other delinquent SEC filings on or before April 15, 2015 in order to enable us to regain compliance with the listing rules. We are filing our Third Quarter 10-Q concurrently with this filing. As a result, we currently believe that we have adequately remedied our current non-compliance with NASDAQ’s listing rules within NASDAQ’s terms of exception. However, there can be no assurance that the NASDAQ will concur that we have remedied our current non-compliance or that we will timely file our Annual Report on Form 10-K for the fiscal year ended December 31, 2014, in either of which case our common stock could remain subject to delisting by NASDAQ. If our common stock were delisted, there can be no assurance whether or when it would again be listed for trading on NASDAQ or any other securities exchange. In addition, the market price of our shares might decline and become more volatile, and our shareholders might find that their ability to trade in our stock would be adversely affected. Furthermore, institutions whose charters do not allow them to hold securities in unlisted companies might sell our shares, which could have a further adverse effect on the price of our stock.
20
Table of Contents
Our inability to file and deliver our financial statements and certain other financial deliverables required under the terms of our Credit Agreement and the indentures governing our senior unsecured notes and convertible notes has adversely affected our overall borrowing flexibility, exposed us to actual and potential consequences of default and required us to pay certain additional expenses.
As a result of our failure to deliver our financial statements for the fiscal quarter ended September 30, 2014 and certain other financial deliverables (the “Q3 2014 Financial Information”) required under the terms of the Amended and Restated Credit Agreement (the “Credit Agreement”), dated as of June 30, 2014, by and among the Company, the OP, as the borrower thereunder, the lenders party thereto (the “Lenders”) and Wells Fargo Bank, National Association, as administrative agent, the Company and the OP entered into two consent and waiver agreements with respect to the Credit Agreement. On November 12, 2014, the Company and the OP entered into the Consent and Waiver Agreement and First Amendment to Credit Agreement (the “First Consent and Waiver”), which, among other things, provided for an extension for delivery of the Q3 2014 Financial Information until the earlier of five days following the date the company files with the SEC its Third Quarter 10-Q and January 5, 2015, modified certain financial covenants in the Credit Agreement relating to the OP’s indebtedness ratios and added certain other financial maintenance covenants. Based upon our determination that we would not deliver the Q3 2014 Financial Information by January 5, 2015 in accordance with the First Consent and Waiver, the Company and the OP entered into a subsequent Consent and Waiver Agreement (the “Second Consent and Waiver”) on December 23, 2014, which provided for a further extension for delivery of the Q3 2014 Financial Information until the earlier of March 2, 2015 and 45 days following the receipt of a notice of breach or default from the applicable trustee or the requisite percentage of holders under the Company’s and the OP’s respective indentures.
The First Consent and Waiver and the Second Consent and Waiver also, among other things, (i) provided an extension for delivery of the Company’s full year 2014 audited financial statements until the earlier of the fifth day after the date that the Company files its Annual Report on Form 10-K with the SEC for the fiscal year ended December 31, 2014 and March 31, 2015, (ii) permanently reduced the maximum amount of indebtedness under the Credit Agreement to $3.6 billion, including the reduction of commitments under the Company’s revolving facilities and the elimination of a $25 million swingline facility, (iii) provided that until the date that all of the required financial information and other deliverables were delivered, no further loans or letters of credit would be requested by the Company under the Credit Agreement, other than in accordance with the cash flow forecast provided by the Company to the lenders thereunder, (iv) provided that neither the Company nor the OP would pay any dividends on, or make any other Restricted Payment (as defined in the Credit Agreement) on, its respective common equity and provided that the Company and the OP would provide additional financial and other information to the Lenders from time to time. In connection with the First Consent and Waiver and Second Consent and Waiver, the Company and OP paid certain customary fees to the consenting Lenders and agreed to reimburse certain customary expenses of the arrangers. On February 20, 2015, we entered into a third consent (the “Third Consent”) to confirm that certain revisions to the required financial deliverables were agreed with the Lenders.
In addition, in connection with our failure to timely file our Third Quarter 10-Q containing the information required to be included in respect of the OP, which is required to be delivered pursuant to the terms of the senior notes Indenture, dated February 6, 2014, by and among the OP, U.S. Bank National Association, as trustee (the “Trustee”), and the guarantors named therein (the “Indenture”), the Company engaged in discussions with counsel to an ad hoc group of note holders (the “Senior Noteholder Group”), which we have been advised then represented a majority of the aggregate principal amounts outstanding of each of the 2.000% senior notes due 2017, the 3.000% senior notes due 2019 and the 4.600% senior notes due 2024, which, in each case, were issued by the OP and guaranteed by the Company under the Indenture. On January 22, 2015, we announced that we had entered into an agreement in principle, pursuant to which the Senior Noteholder Group agreed not to issue a notice of default, prior to March 3, 2015, for the Company’s failure to timely deliver such Third Quarter 10-Q. In exchange, we agreed to sign a confidentiality agreement with the Senior Noteholder Group’s counsel, pay reasonable and documented fees and out-of-pocket expenses of such counsel up to $300,000, and amend the Indenture to provide that if we have not furnished the required third quarter 2014 information to the Trustee prior to March 3, 2015, then any notice of default in relation to our failure to timely file such information will be deemed to have been given as of January 19, 2015 for purposes of determining the period during which we can cure that failure prior to it becoming an Event of Default (as defined in the Indenture). Such agreement was subsequently definitively documented, and a supplement to the Indenture was entered into on February 9, 2015. The Third Quarter 2014 10-Q will be filed with the SEC concurrently with this filing.
21
Table of Contents
In addition, we announced on January 22, 2015 that we received at our Phoenix, Arizona corporate office notice (the “Notice”) from the trustee under the indentures (the “Convertible Indentures”) governing each of the 3.00% convertible senior notes due 2018 issued by us on July 29, 2013 and the 3.75% convertible senior notes due 2020 issued by us on December 10, 2013 (collectively, the “Convertible Notes”) of our failure to timely deliver our Third Quarter 10-Q, which was required to be delivered pursuant to the terms of the Convertible Indentures. Subsequent to our announcement, we learned that we also received the Notice on January 16, 2015, at an address in New York City that was formerly our principal place of business. Pursuant to the terms of the Convertible Indentures, we have 60 days following receipt of a notice of default to deliver the required financial statements, after which such failure would become an event of default under each of the Convertible Indentures. Our Third Quarter 10-Q will be filed with the SEC concurrently with this filing and such default will be cured upon such filing.
We currently expect to file our Annual Report on Form 10-K for the year ended December 31, 2014, on or prior to March 31, 2015, in compliance with the terms of our Credit Agreement, consents, waivers and amendment described above, and the indentures for our senior and convertible notes; however we cannot assure you that we will so timely file and our failure to do so could expose us to further risks associated with noncompliance with the terms of those agreements.
22
Table of Contents
If we fail to comply with the terms of our financing agreements, including waivers, consents and amendments thereto, were to occur, our business, financial condition, results of operations, cash flows and ability to satisfy our debt service obligations could be materially and adversely affected. In addition, any foreclosure on our properties could create taxable income without accompanying cash proceeds, which could adversely affect our ability to meet the REIT dividend requirements imposed by the Code.
The recent downgrades in our credit ratings by Standard & Poor’s and Moody’s could impact our access to capital and materially adversely affect our business and financial condition.
Our credit rating has been downgraded to a non-investment grade credit rating and there can be no assurance that it will not be downgraded further. The current downgrade, and any further downgrade, could adversely affect the amount of capital we can access, as well as the terms of any financing we obtain. Since we depend in part on debt financing to fund our growth, such an adverse change in our credit rating could have a negative effect on our financial condition and future growth and on transactions in which we must obtain debt capital at an advantageous cost.
23
Table of Contents
As a result of the delayed filing of our periodic reports with the SEC, we are not currently eligible to use a registration statement on Form S-3 to register the offer and sale of securities, which may adversely affect our ability to raise future capital or complete acquisitions.
We are not currently eligible to register the offer and sale of our securities using a registration statement on Form S-3 and we will not become eligible until we have timely filed certain periodic reports required under the Securities Exchange Act of 1934 for one year. There can be no assurance when we will meet this requirement, which depends upon our ability to file our periodic reports on a timely basis in the future. Should we wish to register the offer and sale of our securities to the public before we are eligible to do so on Form S-3, our transaction costs and the amount of time required to complete the transaction could increase, making it more difficult to execute any such transaction successfully and potentially having an adverse effect on our financial condition.
The Amended Credit Agreement currently prohibits us and the OP from making distributions in respect of our respective common equity and there can be no assurance as to if, when or at what rate we and the OP will resume common equity distributions.
In connection with our entry into the Second Consent and Waiver, we agreed that, until such time as we have delivered the required financial statements and provided certain other financial deliverables to the lenders under the Amended Credit Agreement, we and the OP would not make distribution payments in respect of our respective common equity. There can be no assurance as to when we will satisfy these requirements. Once we have satisfied these requirements, our Board of Directors intends to reevaluate the reinstatement of a common equity distribution for both us and the OP. There can be no assurance that the reinstated dividends will be paid at rates equal to or at the same frequency as we and the OP previously declared common equity distributions, and any future common equity distributions to be paid by us and the OP to our respective common equity holders may be affected by our reduced borrowing capacity under the Amended Credit Agreement, potentially adversely affecting our ability to make required REIT dividend payments under the Code, which could jeopardize our status as a REIT.
Government investigations may require significant management time and attention, result in significant legal expenses or damages and cause our business, financial condition, results of operations and cash flows to suffer.
On November 13, 2014, we received a formal order of investigation from the staff of the SEC, and the SEC has issued subpoenas calling for the production documents. On December 19, 2014, we received a subpoena from the Securities Division of the Office of the Secretary of the Commonwealth of Massachusetts. The U.S. Attorney’s Office for the Southern District of New York has contacted counsel for the Company and counsel for the Audit Committee. We and the Audit Committee are cooperating with these regulators in their investigations. The amount of time needed to resolve these investigations is uncertain, and we cannot predict the outcome of these investigations or whether we will face additional government investigations, inquiries or other actions related to the matters described in this Form 10-K/A. Subject to certain limitations, we are obligated to indemnify our current and former directors, officers and employees in connection with the ongoing governmental investigations and any future government inquiries, investigations or actions. These matters could require us to expend significant management time and incur significant legal and other expenses and could result in civil and criminal actions seeking, among other things, injunctions against us and the payment of significant fines and penalties by us, which could have a material adverse effect on our financial condition, business, results of operations and cash flow. If any of these governmental authorities were to commence legal action, we could be required to pay significant penalties and could become subject to injunctions, a cease and desist order and other equitable remedies. We can provide no assurance as to the outcome of any governmental investigation.
ARCP and certain of our current and former officers and directors have been named as defendants in various lawsuits and other proceedings related to the matters described in this Form 10-K/A, and those lawsuits and other proceedings may require significant management time and attention, result in significant legal expenses or damages and have an adverse effect on our business, financial condition, results of operations and cash flows.
Between October 30, 2014 and January 20, 2015, the Company and its current and former officers and directors (along with others) were named as defendants in ten putative securities class action complaints in the United States District Court for the Southern District of New York. At a February 10, 2015 status conference, the court consolidated these actions, appointed a lead plaintiff, designated the complaint filed in Teachers Insurance and Annuity Association of America v. American Realty Capital Properties, Inc., et al., No. 15-cv-0421 (AKH), as the consolidated class action complaint, and set a
24
Table of Contents
deadline of April 10, 2015 for the defendants to respond to the consolidated class action complaint. The consolidated class action complaint asserts claims for violations of Sections 11, 12(a)(2) and 15 of the Securities Act of 1933 and Sections 10(b), 14(a) and 20(a) of the Securities Exchange Act of 1934 and Rules 10b-5 and 14a-9 promulgated thereunder, arising out of allegedly false and misleading statements in connection with the purchase or sale of the Company’s securities. The proposed class period runs from May 6, 2013 to October 29, 2014.
In addition, on November 25, 2014, an additional putative securities class action complaint was filed in the Circuit Court for Baltimore County, Maryland, which the Company removed to the United States District Court for the District of Maryland (Northern Division) on December 23, 2014 and seeks to have transferred to the Southern District of New York. This action asserts claims for violations of Sections 11 and 15 of the Securities Act of 1933, arising out of allegedly false and misleading statements made in connection with the Company’s securities issued in connection with the Cole Real Estate Investments, Inc. merger. The Company is not yet required to respond to this complaint.
Between November 17, 2014 and January 29, 2015, nine shareholder derivative actions, purportedly in the name and for the benefit of the Company, were filed against certain of the Company’s current and former officers and directors in the United States District Court for the Southern District of New York, the Circuit Court for Baltimore City, Maryland and the Supreme Court of the State of New York. On February 9, 2015 and February 20, 2015, three of the plaintiffs who filed actions in the New York federal court voluntarily dismissed those actions without prejudice. The remaining six actions seek money damages and other relief on behalf of the Company for, among other things, alleged breaches of fiduciary duty, abuse of control, gross mismanagement and unjust enrichment in connection with the alleged conduct underlying the claims asserted in the securities class actions negligence and breach of contract. On February 10, 2015, the New York federal court consolidated the New York federal court actions, appointed a lead plaintiff and ordered the lead plaintiff to file a consolidated amended complaint by March 10, 2015. The court also set a deadline of April 3, 2015 for the Company and defendants to respond to the consolidated amended complaint in the consolidated New York federal court action. On February 18, 2015 the parties to the New York state action entered into a stipulation setting a deadline of April 20, 2015 for the Company and defendants. The Company is not yet required to respond to the complaints in the Maryland state court actions.
On December 18, 2014, a former employee, Lisa McAlister, filed a defamation action against the Company and certain of its former officers and directors in the New York Supreme Court, captioned McAlister v. American Realty Capital Properties, Inc., et al., Index No. 162499/2014. On January 26, 2015, ARCP and defendants filed a motion to dismiss plaintiff’s complaint. Subsequently, plaintiff voluntarily dismissed her complaint.
On January 7, 2015, Ms. McAlister also filed a complaint, No. 2-4173-15-016, with the Occupational Safety and Health Administration of the United States Department of Labor. Subsequently, Ms. McAlister voluntarily withdrew her complaint.
On January 15, 2015 and February 20, 2015, the Company and certain of its former directors and officers were named as defendants in two individual securities fraud actions filed in the United States District Court for the Southern District of New York, captioned Jet Capital Master Fund, L.P. v. American Realty Capital Properties, Inc., et al., No. 15-cv-307 (AKH) (the “Jet Capital Action”) and Twin Securities, Inc. v. American Realty Capital Properties, Inc., No. 15-cv-1291 (AKH) (the “Twin Securities Action,” and together with the Jet Capital Action, the “Individual Securities Actions”). The Individual Securities Actions seek money damages and assert claims for alleged violations of Sections 11, 12(a)(2) and 15 of the Securities Act of 1933 and Sections 10(b), 14(a), 18 and 20(a) of the Securities Exchange Act of 1934 and Rules 10b-5 and 14a-9 promulgated thereunder, as well as common law fraud under New York law in connection with the purchase of the Company’s securities. At a February 10, 2015 status conference, the court set a deadline of April 10, 2015 for the defendants to respond to the complaint in the Jet Capital Action. The defendants are not yet required to respond to the complaint in the Twin Securities Action.
We have identified material weaknesses in our disclosure controls and procedures and internal control over financial reporting. If not remediated, our failure to establish and maintain effective disclosure controls and procedures and internal control over financial reporting could result in material misstatements in our financial statements and a failure to meet our reporting and financial obligations, each of which could have a material adverse effect on our financial condition and the trading price of our common stock.
Maintaining effective internal control over financial reporting and effective disclosure controls and procedures are necessary for us to produce reliable financial statements. As discussed in Item 9A – “Controls and Procedures” of this Form 10-K/A, we have re-evaluated our internal control over financial reporting and our disclosure controls and procedures and concluded that they were not effective as of December 31, 2013. As disclosed in Item 4 of our Quarterly reports on Form 10-Q/A for the first and second quarters of 2014 and our Third Quarter 10-Q, the material weaknesses in our internal control over financial reporting at December 31, 2013 had not been remediated, and additional material weaknesses in our internal control over financial reporting existed, at March 31, 2014, June 30, 2014 and September 30, 2014. In addition, at those dates, our disclosure controls and procedures were not effective. Finally, in our Annual Report on Form 10-K for the fiscal year ended December 31, 2014, we expect to report our conclusions that our disclosure controls and procedures and internal control over financial reporting were not effective as of that date.
25
Table of Contents
A material weakness is defined as a deficiency, or a combination of deficiencies, in internal control over financial reporting such that there is a reasonable possibility that a material misstatement of our annual or interim financial statements will not be prevented or detected on a timely basis.
The Company is committed to remediating its material weaknesses as promptly as possible. Implementation of the Company’s remediation plans has commenced and is being overseen by the Audit Committee. However, there can be no assurance as to when these material weaknesses will be remediated or that additional material weaknesses will not arise in the future. Any failure to remediate the material weaknesses, or the development of new material weaknesses in our internal control over financial reporting, could result in material misstatements in our financial statements and cause us to fail to meet our reporting and financial obligations, which in turn could have a material adverse effect on our financial condition and the trading price of our common stock.
Risks Related to Our Properties and Operations
Our growth will partially depend upon our ability to successfully acquire future properties, and we may be unable to enter into and consummate property acquisitions on advantageous terms or our property acquisitions may not perform as we expect due to competitive conditions and other factors.
We acquire and intend to continue to acquire primarily freestanding, single tenant retail properties net leased primarily to investment grade and other credit tenants. The acquisition of properties entails various risks, including the risks that our investments may not perform as we expect, that we may be unable to quickly and efficiently integrate our new acquisitions into our existing operations and that our cost estimates for bringing an acquired property up to market standards may prove inaccurate. Further, we face significant competition for attractive investment opportunities from other well capitalized real estate investors, including both publicly-traded REITs and private institutional investment funds including REITs and funds sponsored by the PCM business and these competitors may have greater financial resources than us and a greater ability to borrow funds and acquire properties. This competition increases as investments in real estate become increasingly attractive relative to other forms of investment. As a result of competition, we may be unable to acquire additional properties as we desire or the purchase price may be significantly elevated. In addition, we expect to finance future acquisitions through a combination of borrowings under our revolving credit facility, proceeds from equity or debt offerings by us or our operating partnership or its subsidiaries and proceeds from property contributions and divestitures, which may not be available and which could adversely affect our cash flows. Any of the above risks could adversely affect our financial condition, results of operations, cash flows and ability to pay distributions on, and the market price of, our common stock.
In addition, our growth strategy includes the disciplined acquisition of properties as opportunities arise. Our ability to acquire properties on satisfactory terms and successfully integrate and operate them is subject to the following significant risks:
| • | we may be unable to acquire desired properties because of competition from other real estate investors with more capital, including other real estate operating companies, REITs and investment funds; |
| • | we may acquire properties that are not accretive to our results upon acquisition, and we may not successfully manage and lease those properties to meet our expectations; |
| • | competition from other potential acquirers may significantly increase the purchase price of a desired property; |
| • | we may be unable to generate sufficient cash from operations, or obtain the necessary debt or equity financing to consummate an acquisition or, if obtainable, financing may not be on satisfactory terms; |
| • | we may need to spend more than budgeted amounts to make necessary improvements or renovations to acquired properties; |
| • | agreements for the acquisition of properties are typically subject to customary conditions to closing, including satisfactory completion of due diligence investigations, and we may spend significant time and money on potential acquisitions that we do not consummate; |
26
Table of Contents
| • | the process of acquiring or pursuing the acquisition of a new property may divert the attention of our management from our existing business operations; |
| • | we may be unable to quickly and efficiently integrate new acquisitions, particularly acquisitions of portfolios of properties, into our existing operations; |
| • | market conditions may result in future vacancies and lower-than-expected rental rates; and |
| • | we may acquire properties without any recourse, or with only limited recourse, for liabilities, whether known or unknown, such as cleanup of environmental contamination, claims by tenants, vendors or other persons against the former owners of the properties and claims for indemnification by general partners, directors, officers and others indemnified by the former owners of the properties. |
If we cannot complete property acquisitions on favorable terms, or operate acquired properties to meet our goals or expectations, our business, financial condition, results of operations and cash flow; the per share trading price of our common stock; and our ability to satisfy our debt service obligations and to make dividends to our stockholders could be materially and adversely affected.
We may be unable to renew leases, lease vacant space or re-lease space as leases expire on favorable terms or at all, which could have a material adverse effect on our financial condition, results of operations, cash flow, cash available for dividends to our stockholders, the per share trading price of our common stock and our ability to satisfy our debt service obligations.
Because we compete with a number of real estate operators in connection with the leasing of our properties, the possibility exists that one or more of our tenants will extend or renew its lease with us when the lease term expires on terms that are less favorable to us than the terms of the then-expiring lease, or that such tenant or tenants will not renew at all. Because we depend, in large part, on rental payments from our tenants, if one or more tenants renews its lease on terms less favorable to us, does not renew its lease or we do not re-lease a significant portion of the space made available due to vacancy, our financial condition, results of operations, cash flow, cash available for dividends to our stockholders, the per share trading price of our common stock and our ability to satisfy our debt service obligations could be materially adversely affected.
We are dependent on single-tenant leases for our revenue and, accordingly, lease terminations or tenant defaults could have a material adverse effect on our results of operations.
We focus our investment activities on ownership of freestanding, single-tenant commercial properties that are net leased to a single tenant. Therefore, the financial failure of, or other default in payment by, a single tenant under its lease is likely to cause a significant reduction in our operating cash flows from that property and a significant reduction in the value of the property, and could cause a significant reduction in our revenues. If a lease is terminated or defaulted on, we may experience difficulty or significant delay in re-leasing such property, or we may be unable to find a new tenant to re-lease the vacated space, which could result in us incurring a loss. The current economic conditions may put financial pressure on and increase the likelihood of the financial failure of, or other default in payment by, one or more of the tenants to whom we have exposure.
The failure by any major tenant with leases in multiple locations to make rental payments to us, because of a deterioration of its financial condition or otherwise, or the termination or non-renewal of a lease by a major tenant, would have a material adverse effect on us.
Our ability to generate cash from operations is dependent on the rents that we are able to charge and collect from our tenants. While we evaluate the creditworthiness of our tenants by reviewing available financial and other pertinent information, there can be no assurance that any tenant will be able to make timely rental payments or avoid defaulting under its lease. At any time, our tenants may experience an adverse change in their business. For example, the downturn in the global economy that commenced in 2008 may have adversely affected, or may in the future adversely affect, one or more of our tenants. If any of our tenants’ business experience significant adverse changes, they may decline to extend or renew leases upon expiration, fail to make rental payments when due, close a number of stores, exercise early termination rights (to the extent such rights are available to the tenant) or declare bankruptcy. If a tenant defaults, we may experience delays in enforcing our rights as landlord and may incur substantial costs in protecting our investment.
27
Table of Contents
If any of the foregoing were to occur, it could result in the termination of the tenant’s leases and the loss of rental income attributable to the terminated leases. If a lease is terminated or defaulted on, we may be unable to find a new tenant to re-lease the vacated space at attractive rents or at all, which would have a material adverse effect on our results of operations and our financial condition. Furthermore, the consequences to us would be exacerbated if one of our major tenants were to experience an adverse development in their business that resulted in them being unable to make timely rental payments or to default under their lease. The occurrence of any of the situations described above would have a material adverse effect on our results of operations and our financial condition.
If a sale-leaseback transaction is re-characterized in a tenant’s bankruptcy proceeding, our financial condition could be adversely affected.
We have entered and may continue to enter into sale-leaseback transactions, whereby we would purchase a property and then lease the same property back to the person from whom we purchased it. In the event of the bankruptcy of a tenant, a transaction structured as a sale-leaseback may be re-characterized as either a financing or a joint venture, either of which outcomes could adversely affect our financial condition, cash flow and the amount available for distributions to our stockholders.
If the sale-leaseback were re-characterized as a financing, we might not be considered the owner of the property, and as a result would have the status of a creditor in relation to the tenant. In that event, we would no longer have the right to sell or encumber our ownership interest in the property. Instead, we would have a claim against the tenant for the amounts owed under the lease, with the claim arguably secured by the property. The tenant/debtor might have the ability to propose a plan restructuring the term, interest rate and amortization schedule of its outstanding balance. If confirmed by the bankruptcy court, we could be bound by the new terms and prevented from foreclosing our lien on the property. If the sale-leaseback were re-characterized as a joint venture, our lessee and we could be treated as co-venturers with regard to the property. As a result, we could be held liable, under some circumstances, for debts incurred by the lessee relating to the property.
We are subject to tenant geographic concentrations that make us more susceptible to adverse events with respect to certain geographic areas.
We are subject to geographic concentrations, the most significant of which, as of December 31, 2013, on a pro forma basis (including the properties acquired in the Cole Merger and the acquisitions of the Fortress Portfolio and Inland Portfolio after December 31, 2013), are the following:
| • | $59.5 million, or 10.7%, of our annualized rental income came from properties located in Texas (1); |
| • | $35.1 million, or 6.3%, of our annualized rental income came from properties located in Illinois (1); |
| • | $34.8 million, or 6.3%, of our annualized rental income came from properties located in Pennsylvania (1); |
| • | $32.1 million, or 5.8%, of our annualized rental income came from properties located in Florida (1); and |
| • | $28.8 million, or 5.2%, of our annualized rental income came from properties located in California (1). |
| (1) | Figures were adjusted in order to apply the carryover basis of accounting to include the effects of the merger with ARCT IV, an entity previously deemed to be under common control with the Company, as if it had been completed at the beginning of the period presented. |
Any downturn of the economies in one or more of these states, or in any other state in which we, may have a significant credit concentration in the future, could result in a material reduction of our cash flows or material losses to us.
28
Table of Contents
Our net leases may require us to pay property-related expenses that are not the obligations of our tenants.
Under the terms of the majority of our net leases, in addition to satisfying their rent obligations, our tenants are responsible for the payment of real estate taxes, insurance and ordinary maintenance and repairs. However, under the provisions of certain leases and leases that we may enter into in the future with our tenants, including leases of multi-tenant properties acquired in the Cole Merger, we may be required to pay some expenses, such as the costs of environmental liabilities, roof and structural repairs, insurance, certain non-structural repairs and maintenance. If our properties incur significant expenses that must be paid by us under the terms of our leases, our business, financial condition and results of operations will be adversely affected and the amount of cash available to meet expenses and to make dividends to holders of our capital stock may be reduced.
Net leases may not result in fair market lease rates over time, which could negatively impact our income and reduce the amount of funds available to make distributions to stockholders.
The vast majority of our rental income comes from net leases, which generally provide the tenant greater discretion in using the leased property than ordinary property leases, such as the right to freely sublease the property, to make alterations in the leased premises and to terminate the lease prior to its expiration under specified circumstances. Furthermore, net leases typically have longer lease terms and, thus, there is an increased risk that contractual rental increases in future years will fail to result in fair market rental rates during those years. As a result, our income and distributions to our stockholders could be lower than they would otherwise be if we did not engage in net leases.
Long-term leases with tenants may not result in fair value over time.
Long-term leases do not allow for significant changes in rental payments and do not expire in the near term. If we do not accurately judge the potential for increases in market rental rates when negotiating these long-term leases, significant increases in future property operating costs, to the extent not covered under the net leases could result in us receiving less than fair value from these leases. These circumstances would adversely affect our revenues and funds available for distribution to our stockholders.
Any of our properties that incurs a vacancy could be difficult to sell or re-lease.
One or more of our properties may incur a vacancy either by the continued default of a tenant under its lease or the expiration of one of our leases. Certain of our properties may be specifically suited to the particular needs of a tenant (e.g., a retail bank branch or distribution warehouse) and major renovations and expenditures may be required in order for us to re-lease vacant space for other uses. We may have difficulty obtaining a new tenant for any vacant space we have in our properties, including our presently vacant property. If the vacancies continue for a long period of time, we may suffer reduced revenues, resulting in less cash available to be distributed to stockholders. In addition, the resale value of a property could be diminished because the market value of a particular property will depend principally upon the value of the leases of such property.
Our properties may be subject to impairment charges.
We periodically evaluate our real estate investments for impairment indicators. The judgment regarding the existence of impairment indicators is based on factors such as market conditions, tenant performance and legal structure. For example, the early termination of, or default under, a lease by a tenant may lead to an impairment charge. Since our investment focus is on properties net leased to a single tenant, the financial failure of, or other default in payment by, a single tenant under its lease may result in a significant impairment loss. If we determine that an impairment has occurred, we would be required to make an adjustment to the net carrying value of the property, which could have a material adverse effect on our results of operations in the period in which the impairment charge is recorded.
29
Table of Contents
Our real estate investments are relatively illiquid and therefore we may not be able to dispose of properties when appropriate or on favorable terms.
The real estate investments made, and to be made, by us are relatively difficult to sell quickly. Return of capital and realization of gains, if any, from an investment generally will occur upon disposition or refinancing of a property. In addition, the Code imposes restrictions on the ability of a REIT to dispose of properties that are not applicable to other types of real estate companies. We may be unable to realize our investment objectives by disposition or refinancing of a property at attractive prices within any given period of time or may otherwise be unable to complete any exit strategy. In particular, these risks could arise from weakness in or even the lack of an established market for a property, changes in the financial condition or prospects of prospective purchasers, changes in national or international economic conditions, and changes in laws, regulations or fiscal policies of jurisdictions in which the property is located.
Our investments in properties backed by below investment grade credits will have a greater risk of default.
As of December 31, 2013, on a pro forma basis (including the properties acquired in the Cole Merger and the acquisitions of the Fortress Portfolio and the Inland Portfolio after December 31, 2013), 40% of our annualized rental income is derived from tenants who do not have investment grade credit ratings from a major ratings agency or are not affiliates of companies having an investment grade credit rating. We also may invest in other properties in the future where the tenant is not rated or the tenant’s credit rating is below investment grade. These investments will have a greater risk of default and bankruptcy than investments in properties leased exclusively to investment grade tenants.
Our investments in properties where the underlying tenant does not have a publicly available credit rating will expose us to certain risks.
When we invest in properties where the underlying tenant does not have a publicly available credit rating, we will rely on our own estimates of the tenant’s credit rating. If our lender or a credit rating agency disagrees with our ratings estimates, or our ratings estimates are inaccurate, we may not be able to obtain our desired level of leverage or our financing costs may exceed those that we projected. This outcome could have an adverse impact on our returns on that asset and hence our operating results.
Dividends paid from sources other than our cash flow from operations, particularly from proceeds of financings, will result in us having fewer funds available for the acquisition of properties and other real estate-related investments and may dilute stockholders’ interests in us, which may adversely affect our ability to fund future dividends with cash flow from operations and may adversely affect stockholders’ overall return.
Our cash flows provided by operations were $11.9 million (as restated) for the year ended December 31, 2013. For the year ended December 31, 2013, our dividends paid of $234.9 million (as restated) were partially funded from cash flows from operations and through $4.3 billion (as restated) from proceeds of financing activities. Additionally, we may in the future pay dividends from sources other than from our cash flow from operations.
Even after our acquisition of properties during 2013 and the ARCT IV Merger, the Cole Merger and the acquisitions of the Fortress Portfolio and the Inland Portfolio, we may not generate sufficient cash flow from operations to pay dividends. Our inability to acquire additional properties or other real estate-related investments may result in a lower return on your investment than you expect. If we have not generated sufficient cash flow from our operations and other sources, such as from borrowings, and/or the sale of additional securities to fund distributions, we may use the proceeds from offerings of securities. Moreover, our board of directors may change our dividend distribution policy, in its sole discretion, at any time. Dividends made from offering proceeds are a return of capital to stockholders, from which we will have already paid offering expenses in connection with the applicable offering. We have not established any limit on the amount of proceeds from an offering that may be used to fund dividends, except that, in accordance with our organizational documents and Maryland law, we may not make dividend distributions that would: (1) cause us to be unable to pay our debts as they become due in the usual course of business; (2) cause our total assets to be less than the sum of our total liabilities plus senior liquidation preferences; or (3) jeopardize our ability to qualify as a REIT.
30
Table of Contents
If we fund dividends from the proceeds of offerings of securities, we will have less funds available for acquiring properties or other real estate-related investments. As a result, the return you realize on your investment may be reduced. Funding dividends from borrowings could restrict the amount we can borrow for investments, which may affect our profitability. Funding dividends with the sale of assets or the proceeds of offerings of securities may affect our ability to generate cash flows. Funding dividends from the sale of additional securities could dilute your interest in us if we sell shares of our common stock or securities convertible or exercisable into shares of our common stock to third party investors. Payment of dividends from the mentioned sources could restrict our ability to generate sufficient cash flow from operations, affect our profitability and/or affect the dividends payable to you upon a liquidity event, any or all of which may have an adverse effect on your investment.
We disclose FFO and adjusted funds from operations (“AFFO”), a non-GAAP financial measure, including in documents filed with the SEC; however, AFFO is not equivalent to our net income or loss as determined under GAAP, and you should consider GAAP measures to be more relevant to our operating performance.
We use and disclose to investors FFO and AFFO, which is a non-GAAP financial measure. See ’’Management’s Discussion and Analysis of Financial Condition and Results of Operations - Funds from Operations and Adjusted Funds from Operations.’’ FFO and AFFO are not equivalent to our net income or loss as determined in accordance with GAAP, and investors should consider GAAP measures to be more relevant to evaluating our operating performance. FFO and AFFO and GAAP net income differ because one or both FFO and AFFO exclude gains and losses from the sale of property, plus depreciation and amortization, merger related and other non-routine transaction costs, acquisition-related fees and expenses and other non cash charges.
Because of the differences between FFO and AFFO and GAAP net income or loss, FFO and AFFO may not be accurate indicators of our operating performance, especially during periods in which we are acquiring properties. In addition, AFFO is not necessarily indicative of cash flow available to fund cash needs and investors should not consider FFO and AFFO as alternatives to cash flows from operations, as an indication of our liquidity, or as indicative of funds available to fund our cash needs, including our ability to make distributions to our stockholders.
Neither the SEC nor any other regulatory body has passed judgment on the acceptability of the adjustments that we use to calculate FFO and AFFO. Also, because not all companies calculate FFO and AFFO the same way, comparisons with other companies may not be meaningful.
Operating expenses of our properties will reduce our cash flow and funds available for future distributions.
For certain of our properties, including multi-tenant properties acquired in the Cole Merger, we are responsible for some or all of the operating costs of the property. In some of these instances, our leases require the tenant to reimburse us for all or a portion of these costs, either in the form of an expense reimbursement or increased rent. Our reimbursement may be limited to a fixed amount or a specified percentage annually. To the extent operating costs exceed our reimbursement, our returns and net cash flows from the property and hence our overall operating results and cash flows could be materially adversely affected.
We would face potential adverse effects from tenant defaults, bankruptcies or insolvencies.
The bankruptcy of our tenants may adversely affect the income generated by our properties. If our tenant files for bankruptcy, we generally cannot evict the tenant solely because of such bankruptcy. In addition, a bankruptcy court could authorize a bankrupt tenant to reject and terminate its lease with us. In such a case, our claim against the tenant for unpaid and future rent would be subject to a statutory cap that might be substantially less than the remaining rent actually owed under the lease, and it is unlikely that a bankrupt tenant would pay in full amounts it owes us under the lease. Any shortfall resulting from the bankruptcy of one or more of our tenants could adversely affect our cash flow and results of operations.
31
Table of Contents
We have assumed, and expect in the future to continue to assume, liabilities in connection with our property acquisitions, including unknown liabilities.
We have assumed existing liabilities some of which may have been unknown or unquantifiable at the time of the transaction related to our formation transactions, our Recent Acquisitions and certain other property acquisitions, and expect in the future to continue to assume existing liabilities related to our property acquisitions. Unknown liabilities might include liabilities for cleanup or remediation of undisclosed environmental conditions, claims of tenants or other persons dealing with the sellers prior to our acquisition of the properties, tax liabilities, employment-related issues, and accrued but unpaid liabilities whether incurred in the ordinary course of business or otherwise. If the magnitude of such unknown liabilities is high, either singly or in the aggregate, they could adversely affect our business, financial condition, results of operations, cash flow, per share trading price of our common stock and ability to satisfy our debt service obligations and to make distributions to our stockholders.
We face intense competition, which may decrease or prevent increases in the occupancy and rental rates of our properties.
We compete with numerous developers, owners and operators of retail, industrial and office real estate, many of which own properties similar to ours in the same markets in which our properties are located. If one of our properties becomes vacant and our competitors (which would include funds sponsored by us) offer space at rental rates below current market rates, or below the rental rates we currently charge our tenants, we may lose existing or potential tenants and we may be pressured to reduce our rental rates below those we currently charge or to offer substantial rent abatements. As a result, our financial condition, results of operations, cash flow, per share trading price of our common stock and ability to satisfy our debt service obligations and to make dividends to our stockholders may be adversely affected.
Our operating performance and value are subject to risks associated with our real estate assets and with the real estate industry.
Our real estate investments are subject to various risks and fluctuations and cycles in value and demand, many of which are beyond our control. Certain events may decrease cash available for dividends, as well as the value of our properties. These events include, but are not limited to:
| • | adverse changes in international, national or local economic and demographic conditions such as the recent global economic downturn; |
| • | vacancies or our inability to rent space on favorable terms, including possible market pressures to offer tenants rent abatements, tenant improvements, early termination rights or tenant-favorable renewal options |
| • | adverse changes in financial conditions of buyers, sellers and tenants of properties; |
| • | inability to collect rent from tenants; |
| • | competition from other real estate investors with significant capital, including other real estate operating companies, REITs and institutional investment funds; |
| • | reductions in the level of demand for commercial space generally, and freestanding net leased properties specifically, and changes in the relative popularity of our properties; |
| • | increases in the supply of freestanding single-tenant properties; |
| • | fluctuations in interest rates, which could adversely affect our ability, or the ability of buyers and tenants of our properties, to obtain financing on favorable terms or at all; |
| • | increases in expenses, including, but not limited to, insurance costs, labor costs, energy prices, real estate assessments and other taxes and costs of compliance with laws, regulations and governmental policies, all of which have an adverse impact on the rent a tenant may be willing to pay us in order to lease one or more of our properties; and |
| • | changes in, and changes in enforcement of, laws, regulations and governmental policies, including, without limitation, health, safety, environmental, zoning and tax laws, governmental fiscal policies and the Americans with Disabilities Act of 1990. |
32
Table of Contents
In addition, periods of economic slowdown or recession, such as the recent global economic downturn, rising interest rates or declining demand for real estate, or the public perception that any of these events may occur, could result in a general decline in rents or an increased incidence of defaults under existing leases. If we cannot operate our properties to meet our financial expectations, our business, financial condition, results of operations, cash flow, market price of our common stock and ability to satisfy our debt service obligations and to pay dividends to our stockholders could be materially and adversely affected. We cannot assure you that we will achieve our return objectives.
A potential change in U.S. accounting standards regarding operating leases may make the leasing of our properties less attractive to our potential tenants, which could reduce overall demand for our leasing services.
Under current authoritative accounting guidance for leases, a lease is classified by a tenant as a capital lease if the significant risks and rewards of ownership are considered to reside with the tenant. Under capital lease accounting for a tenant, both the leased asset and liability are reflected on their balance sheet. If the lease does not meet any of the criteria for a capital lease, the lease is considered an operating lease by the tenant, and the obligation does not appear on the tenant’s balance sheet; rather, the contractual future minimum payment obligations are only disclosed in the footnotes thereto. Thus, entering into an operating lease can appear to enhance a tenant’s balance sheet in comparison to direct ownership. The Financial Accounting Standards Board (the “FASB”) and the International Accounting Standards Board (the “IASB”) conducted a joint project to re-evaluate lease accounting. In August 2010, the FASB and the IASB jointly released exposure drafts of a proposed accounting model that would significantly change lease accounting. Based on comments received, a revised exposure was released in May 2013. Changes to the accounting guidance could affect both our accounting for leases as well as that of our current and potential tenants. These changes may affect how our real estate leasing business is conducted. For example, if the accounting standards regarding the financial statement classification of operating leases are revised, then companies may be less willing to enter into leases with us in general or desire to enter into leases with us with shorter terms because the apparent benefits to their balance sheets could be reduced or eliminated. This in turn could make it more difficult for us to enter into leases on terms we find favorable.
We will rely on external sources of capital to fund future capital needs, and if we encounter difficulty in obtaining such capital, we may not be able to make future acquisitions necessary to grow our business or meet maturing obligations.
In order to qualify as a REIT under the Code, we will be required, among other things, to distribute annually to our stockholders at least 90% of our REIT taxable income (which does not equal net income as calculated in accordance with U.S. GAAP), determined without regard to the deduction for dividends paid and excluding any net capital gain. Because of this dividend requirement, we may not be able to fund, from cash retained from operations, all of our future capital needs, including capital needed to make investments and to satisfy or refinance maturing obligations.
We expect to rely on external sources of capital, including debt and equity financing, to fund future capital needs. However, the U.S. and global economic slowdown that commenced in 2008 has resulted in a capital environment characterized by limited availability, increasing costs and significant volatility. If we are unable to obtain needed capital on satisfactory terms or at all, we may not be able to make the investments needed to expand our business, or to meet our obligations and commitments as they mature.
Any additional debt we incur will increase our leverage. Our access to capital will depend upon a number of factors over which we have little or no control, including:
| • | general market conditions; |
| • | the market’s perception of our growth potential; |
| • | our current debt levels; |
| • | our current and expected future earnings; |
| • | our cash flow and cash dividends; and |
| • | the market price per share of our common stock. |
33
Table of Contents
We may not be in a position to take advantage of attractive investment opportunities for growth if we are unable to access the capital markets on a timely basis on favorable terms.
Our ability to sell equity to expand our business will depend, in part, on the market price of our common stock, and our failure to meet market expectations with respect to our business could negatively affect the market price of our common stock and limit our ability to sell equity.
The availability of equity capital to us will depend, in part, on the market price of our common stock, which, in turn, will depend upon various market conditions and other factors that may change from time to time, including:
| • | the extent of investor interest; |
| • | our ability to satisfy the dividend requirements applicable to REITs; |
| • | the general reputation of REITs and the attractiveness of their equity securities in comparison to other equity securities, including securities issued by other real estate-based companies; |
| • | our financial performance and that of our tenants; |
| • | analyst reports about us and the REIT industry; |
| • | general stock and bond market conditions, including changes in interest rates on fixed-income securities, which may lead prospective purchasers of our common stock to demand a higher annual yield from future dividends; |
| • | a failure to maintain or increase our dividend, which is dependent, to a large part, on FFO, which, in turn, depends upon increased revenue from additional acquisitions and rental increases; and |
| • | other factors such as governmental regulatory action and changes in REIT tax laws. |
Our failure to meet market expectations with regard to future earnings and cash dividends would likely adversely affect the market price of our common stock and, as a result, the availability of equity capital to us.
We have substantial amounts of indebtedness outstanding, which may affect our ability to make dividends, may expose us to interest rate fluctuation risk and may expose us to the risk of default under our debt obligations.
As of December 31, 2013, our aggregate indebtedness was approximately $4.3 billion (as restated). Subsequent to December 31, 2013, we incurred $2.6 billion of indebtedness pursuant to an offering of senior notes in February 2014. After giving effect to the financing and the use of proceeds therefrom, on a pro forma basis (including the properties acquired in the ARCT IV Merger, the Cole Merger and the acquisitions of the Fortress Portfolio and Inland Portfolio after December 31, 2013), our aggregate indebtedness was $10.3 billion. We may incur significant additional debt for various purposes including, without limitation, the funding of future acquisitions, capital improvements and leasing commissions in connection with the repositioning of a property.
We intend to incur additional indebtedness in the future, including borrowings under our existing $2.72 billion credit facility (as of December 31, 2013, under which we have undrawn commitments of $1.9 million (as restated) at February 26, 2014 and which contains an “accordion” feature to allow us, under certain circumstances, to increase the commitments thereunder by $280.0 million). At February 26, 2014, we had $0.8 billion (as restated) of outstanding borrowings under this credit facility.
Payments of principal and interest on borrowings may leave us with insufficient cash resources to make the dividends currently contemplated or necessary to maintain our REIT qualification. Our substantial outstanding indebtedness, and the limitations imposed on us by our debt agreements, could have other significant adverse consequences, including as follows:
| • | our cash flow may be insufficient to meet our required principal and interest payments; |
| • | we may be unable to borrow additional funds as needed or on satisfactory terms, which could, among other things, adversely affect our ability to capitalize upon emerging acquisition opportunities or meet needs to fund capital improvements and leasing commissions; |
| • | we may be unable to refinance our indebtedness at maturity or the refinancing terms may be less favorable than the terms of our original indebtedness; |
34
Table of Contents
| • | we may be forced to dispose of one or more of our properties, possibly on disadvantageous terms; |
| • | we may violate restrictive covenants in our loan documents, which would entitle the lenders to accelerate our debt obligations; |
| • | certain of the property subsidiaries’ loan documents may include restrictions on such subsidiary’s ability to make dividends to us; |
| • | we may be unable to hedge floating-rate debt, counterparties may fail to honor their obligations under our hedge agreements, these agreements may not effectively hedge interest rate fluctuation risk, and, upon the expiration of any hedge agreements, we would be exposed to then-existing market rates of interest and future interest rate volatility; |
| • | we may default on our obligations and the lenders or mortgagees may foreclose on our properties that secure their loans and receive an assignment of rents and leases; |
| • | increasing our vulnerability to general adverse economic and industry conditions; |
| • | limiting our ability to obtain additional financing to fund future working capital, capital expenditures and other general corporate requirements; |
| • | requiring the use of a substantial portion of our cash flow from operations for the payment of principal and interest on indebtedness, thereby reducing our ability to use our cash flow to fund working capital, acquisitions, capital expenditures and general corporate requirements; |
| • | limiting our flexibility in planning for, or reacting to, changes in our business and industry; and |
| • | putting us at a disadvantage compared to our competitors with less indebtedness. |
If we default under a loan or indenture (including any default in respect of the financial maintenance and negative covenants contained in our credit facility), we may automatically be in default under any other loan or indenture that has cross-default provisions (including our credit facility), and further borrowings under our credit facility will be prohibited, outstanding indebtedness under our credit facility, our indenture or such other loans may be accelerated, and to the extent our credit facility, our indenture or such other loans are secured, directly or indirectly by any properties or assets, lenders or trustees under our credit facility, our indenture or such other loans may foreclose on the collateral securing such indebtedness as a result. In addition, increases in interest rates may impede our operating performance and put us at a competitive disadvantage. Further, payments of required debt service or amounts due at maturity, or creation of additional reserves under loan agreements or indentures, could adversely affect our financial condition and operating results.
If any one of these events were to occur, our business, financial condition, results of operations, cash flow, per share trading price of our common stock and ability to satisfy our debt service obligations and to make dividends to our stockholders could be materially and adversely affected. In addition, any foreclosure on our properties could create taxable income without accompanying cash proceeds, which could adversely affect our ability to meet the REIT dividend requirements imposed by the Code. See also “Our inability to file and deliver our financial statements and certain other financial deliverables required under the terms of our Credit Agreement and the indentures governing our senior unsecured notes and convertible notes has adversely affected our overall borrowing flexibility, exposed us to actual and potential consequences of default and required us to pay certain additional expenses.”
Our existing loan agreements contain, and future financing arrangements will likely contain, restrictive covenants relating to our operations, which could limit our ability to make distributions to our stockholders. (As Restated)
We are subject to certain restrictions pursuant to the restrictive covenants of our outstanding indebtedness, which may affect our dividend and operating policies and our ability to incur additional debt. Indentures and loan documents evidencing our existing indebtedness contain, and loan documents entered into in the future will likely contain, certain operating covenants that limit our ability to further incur indebtedness or discontinue insurance coverage. In addition, future agreements may contain, and any future company credit facilities and indentures likely will contain, financial covenants, including certain coverage ratios, and negative covenants, including limitations on our ability to incur secured and unsecured debt, make dividends, sell all or substantially all of our assets, and engage in mergers and consolidations and certain acquisitions. Specifically, our ability to make distributions may be limited by our credit facility, pursuant to which our distributions may not exceed the greater of (i) 105% of our FFO, as adjusted for certain items, the most significant of which are acquisition and merger related expenses, in 2013, and 95% thereafter or (ii) the amount required for us to qualify and maintain our status as a REIT. Covenants under any future indebtedness may restrict our ability to pursue certain business initiatives or certain acquisition transactions. In addition, failure to meet any of these covenants, including the financial coverage ratios, could cause
35
Table of Contents
an event of default under or accelerate some or all of our indebtedness, which would have a material adverse effect on us. See “The Amended Credit Agreement currently prohibits us and the OP from making distributions in respect of our respective common equity and there can be no assurance as to if, when or at what rate we and the OP will resume common equity distributions” and Note 24 — Subsequent Events (As Restated) for further discussion.
The indenture governing our senior notes and the credit agreement governing our credit facility contain restrictive covenants that limit our operating flexibility.
The indenture governing our senior notes and the agreement governing our credit facility require us to meet specified financial and operating covenants, including financial maintenance covenants with respect to maximum consolidated leverage ratio, maximum secured recourse indebtedness, minimum fixed charge coverage, minimum borrowing base interest coverage, maximum secured leverage, minimum tangible net worth and maximum variable rate indebtedness and borrowing base asset value ratio. In addition, our credit facility contains certain customary negative covenants that restrict the ability of our OP to incur secured and unsecured indebtedness. These covenants may restrict our ability to expand or fully pursue our business strategies. Our ability to comply with these and other provisions of the indenture governing our senior notes and the credit agreement governing our credit facility may be affected by changes in our operating and financial performance, changes in general business and economic conditions, adverse regulatory developments or other events adversely impacting us. Any failure to comply with these financial maintenance covenants and negative covenants would constitute a default under our credit facility and/or senior note indenture, as applicable and would prevent further borrowings under our credit facility, and could cause those and other obligations to become due and payable. If any of our indebtedness is accelerated, we may not be able to repay it. See also “Our inability to file and deliver our financial statements and certain other financial deliverables required under the terms of our Credit Agreement and the indentures governing our senior unsecured notes and convertible notes has adversely affected our overall borrowing flexibility, exposed us to actual and potential consequences of default and required us to pay certain additional expenses.”
Our organizational documents have no limitation on the amount of indebtedness that we may incur. As a result, we may become highly leveraged in the future, which could adversely affect our financial condition.
Our business strategy contemplates the use of both secured and unsecured debt to finance long-term growth. While we intend to limit our indebtedness to maintain an overall net debt to gross asset value of approximately 45% to 55%, provided that we may exceed this amount for individual properties in select cases where attractive financing is available, our governing documents contain no limitations on the amount of debt that we may incur, and our board of directors may change our financing policy at any time without stockholder approval. As a result, we may be able to incur substantial additional debt, including secured debt, in the future, which could result in an increase in our debt service and harm our financial condition.
Increases in interest rates would increase our debt service costs, may adversely affect any future refinancing of our debt and our ability to incur additional debt, and could adversely affect our financial condition, cash flow and results of operations.
Certain of our borrowings bear interest at variable rates, and we may incur additional variable-rate debt in the future. Increases in interest rates would result in higher interest expenses on our existing unhedged variable rate debt, and increase the costs of refinancing existing debt or incurring new debt. Additionally, increases in interest rates may result in a decrease in the value of our real estate and decrease the market price of ARCP’s common stock and could accordingly adversely affect our financial condition, cash flow and results of operations.
36
Table of Contents
A downgrade in our credit ratings could materially adversely affect our business and financial condition.
We received credit ratings for our senior notes from Moody’s Investor Service, Inc. and Standard & Poor’s Rating Services. We plan to manage our operations to maintain these credit ratings with a capital structure consistent with or better than our current profile, but there can be no assurance that we will be able to maintain the current credit ratings. Any downgrades in terms of ratings or outlook by any of the noted rating agencies could have a material adverse impact on our cost and availability of capital, which could in turn have a material adverse impact on our financial condition, results of operations and liquidity and the trading price of the notes. Credit ratings are not recommendations to purchase, hold or sell the notes. Additionally, credit ratings may not reflect the potential effect of risks relating to the structure or marketing of the notes.
We may not be able to generate sufficient cash flow to meet our debt service obligations.
Our ability to make payments on and to refinance our indebtedness, and to fund our operations, working capital and capital expenditures, depends on our ability to generate cash in the future. To a certain extent, our cash flow is subject to general economic, industry, financial, competitive, operating, legislative, regulatory and other factors, many of which are beyond our control.
We cannot assure you that our business will generate sufficient cash flow from operations or that future sources of cash will be available to us in an amount sufficient to enable us to pay amounts due on our indebtedness or to fund our other liquidity needs.
Additionally, if we incur additional indebtedness in connection with future acquisitions or development projects or for any other purpose, our debt service obligations could increase. We may need to refinance all or a portion of our indebtedness or before maturity. Our ability to refinance our indebtedness or obtain additional financing will depend on, among other things:
| • | our financial condition and market conditions at the time; and |
| • | restrictions in the agreements governing our indebtedness. |
As a result, we may not be able to refinance any of our indebtedness on commercially reasonable terms, or at all. If we do not generate sufficient cash flow from operations, and additional borrowings or refinancings or proceeds of asset sales or other sources of cash are not available to us, we may not have sufficient cash to enable us to meet all of our obligations. Accordingly, if we cannot service our indebtedness, we may have to take actions such as seeking additional equity, or delaying strategic acquisitions and alliances or capital expenditures, any of which could have a material adverse effect on our operations. We cannot assure you that we will be able to effect any of these actions on commercially reasonable terms, or at all.
The continued recovery of real estate markets from the recent recession is dependent upon forecasted moderate economic growth which, if significantly slower than expected, could have a negative impact on the performance of our investment portfolio.
The U.S. economy is in its fourth year of recovery from a severe global recession and the commercial real estate markets stabilized and began to recover in 2011. Based on moderate economic growth in the future, and historically low levels of new supply in the commercial real estate pipeline, a stronger recovery is forecasted for all property sectors over the next two years. Nevertheless, this ongoing economic recovery remains fragile, and could be slowed or halted by significant external events. As a result, real estate markets could perform lower than expected as a result of reduced tenant demand. A severe weakening of the economy or a renewed recession could also lead to higher tenancy default and vacancy rates, which could create an oversupply of rentable space, increased property concessions and tenant improvement expenditures and reduced rental rates to maintain occupancies. There can be no assurance that our real estate investments will not be adversely impacted by a severe slowing of the economy or renewed recession. Tenant defaults, fluctuations in interest rates, limited availability of capital and other economic conditions beyond our control could negatively impact our portfolio and decrease the value of your investment.
37
Table of Contents
Uninsured losses or losses in excess of our insurance coverage could adversely affect our financial condition and cash flows, and there can be no assurance as to future costs and the scope of coverage that may be available under insurance policies.
We carry comprehensive liability, fire, extended coverage, business interruption and rental loss insurance covering all of the properties in our portfolio under a blanket insurance policy with policy specifications, limits and deductibles customarily carried for similar properties. In addition, we carry professional liability and directors’ and officers’ insurance. We have selected policy specifications and insured limits that we believe are appropriate and adequate given the relative risk of loss, the cost of the coverage and industry practice. We do not carry insurance for certain losses, including, but not limited to, losses caused by riots or war. Certain types of losses may be either uninsurable or not economically insurable, such as losses due to earthquakes, riots or acts of war. Should an uninsured loss occur, we could lose both our investment in and anticipated profits and cash flow from a property. If any such loss is insured, we may be required to pay a significant deductible on any claim for recovery of such a loss prior to our insurer being obligated to reimburse us for the loss, or the amount of the loss may exceed our coverage for the loss. In addition, future lenders may require such insurance, and our failure to obtain such insurance could constitute a default under our loan agreements. In addition, we may reduce or discontinue terrorism, earthquake, flood or other insurance on some or all of our properties in the future if the cost of premiums for any of these policies exceeds, in our judgment, the value of the coverage discounted for the risk of loss. Our title insurance policies may not insure for the current aggregate market value of our portfolio, and we do not intend to increase our title insurance coverage as the market value of our portfolio increases. As a result, our business, financial condition, results of operations, cash flow, per share trading price of our common stock and ability to satisfy our debt service obligations and to make dividends to our stockholders may be materially and adversely affected.
If we or one or more of our tenants experiences a loss that is uninsured or which exceeds policy limits, we could lose the capital invested in the damaged properties as well as the anticipated future cash flows from those properties. In addition, if the damaged properties are subject to recourse indebtedness, we would continue to be liable for the indebtedness, even if these properties were irreparably damaged.
If any of our insurance carriers becomes insolvent, we could be adversely affected.
We carry several different lines of insurance, placed with several large insurance carriers. If any one of these large insurance carriers were to become insolvent, we would be forced to replace the existing insurance coverage with another suitable carrier, and any outstanding claims would be at risk for collection. In such an event, we cannot be certain that we would be able to replace the coverage at similar or otherwise favorable terms. Replacing insurance coverage at unfavorable rates and the potential of uncollectible claims due to carrier insolvency could adversely affect our results of operations and cash flows.
Terrorism and other factors affecting demand for our properties could harm our operating results.
The strength and profitability of our business depends on demand for and the value of our properties. Future terrorist attacks in the United States, such as the attacks that occurred in New York and Washington, D.C. on September 11, 2001, and other acts of terrorism or war could have a negative impact on our operations. Such terrorist attacks could have an adverse impact on our business even if they are not directed at our properties. In addition, the terrorist attacks of September 11, 2001 have substantially affected the availability and price of insurance coverage for certain types of damages or occurrences, and our insurance policies for terrorism include large deductibles and co-payments. The lack of sufficient insurance for these types of acts could expose us to significant losses and could have a negative impact on our operations.
Cybersecurity risks and cyber incidents may adversely affect our business by causing a disruption to our operations, a compromise or corruption of our confidential information, and/or damage to our business relationships, all of which could negatively impact our financial results.
A cyber incident is considered to be any adverse event that threatens the confidentiality, integrity or availability of our information resources. These incidents may be an intentional attack or an unintentional event and could involve gaining unauthorized access to our information systems for purposes of misappropriating assets, stealing confidential information, corrupting data or causing operational disruption. The result of these incidents may include disrupted operations, misstated or
38
Table of Contents
unreliable financial data, liability for stolen assets or information, increased cybersecurity protection and insurance costs, litigation and damage to our tenant and investor relationships. As our reliance on technology has increased, so have the risks posed to our information systems, both internal and those we have outsourced. We have implemented processes, procedures and internal controls to help mitigate cybersecurity risks and cyber intrusions, but these measures, as well as our increased awareness of the nature and extent of a risk of a cyber incident, do not guarantee that our financial results, operations, business relationships or confidential information will not be negatively impacted by such an incident.
We may be required to make significant capital expenditures to improve our properties in order to retain and attract tenants, causing a decline in operating revenue and reducing cash available for debt service and distributions to stockholders.
Upon expiration of leases at our properties, we may be required to make rent or other concessions to tenants, or accommodate requests for renovations, build-to-suit remodeling and other improvements. As a result, we may have to make significant capital or other expenditures in order to retain tenants whose leases expire and to attract new tenants. Additionally, we may need to raise capital to make such expenditures. If we are unable to do so or capital is otherwise unavailable, we may be unable to make the required expenditures. This could result in non-renewals by tenants upon expiration of their leases, which would result in declines in revenue from operations and reduce cash available for debt service and dividends to stockholders.
Difficult conditions in the commercial real estate markets may cause us to experience market losses related to our holdings, and these conditions may not improve in the near future.
Our results of operations are materially affected by conditions in the real estate markets, the financial markets and the economy generally and may cause commercial real estate values, including the values of our properties, and market rental rates, including rental rates that we are able to charge, to decline significantly. Recent economic and credit market conditions have contributed to increased volatility and diminished expectations for real estate markets, as well as adversely impacted inflation, energy costs, geopolitical issues and the availability and cost of credit, and may continue to do so going forward. The further deterioration of the real estate market may cause us to record losses on our assets, reduce the proceeds we receive upon sale or refinance of our assets or adversely impact our ability to lease our properties. Declines in the market values of our properties may adversely affect our results of operations and credit availability, which may reduce earnings and, in turn, cash available for dividends to our stockholders. Economic and credit market conditions may also cause one or more of the tenants to whom we have exposure to fail or default in their payment obligations, which could cause us to record material losses or a material reduction in our cash flows.
Because we own real property, we are subject to extensive environmental regulation, which creates uncertainty regarding future environmental expenditures and liabilities.
Environmental laws regulate, and impose liability for, releases of hazardous or toxic substances into the environment. Under various provisions of these laws, an owner or operator of real estate, such as us, is or may be liable for costs related to soil or groundwater contamination on, in, or migrating to or from its property. In addition, persons who arrange for the disposal or treatment of hazardous or toxic substances may be liable for the costs of cleaning up contamination at the disposal site. Such laws often impose liability regardless of whether the person knew of, or was responsible for, the presence of the hazardous or toxic substances that caused the contamination. The presence of, or contamination resulting from, any of these substances, or the failure to properly remediate them, may adversely affect our ability to sell or lease our property or to borrow using such property as collateral. In addition, persons exposed to hazardous or toxic substances may sue us for personal injury damages. For example, certain laws impose liability for release of or exposure to asbestos-containing materials and contamination from past operations or from off-site sources. As a result, in connection with our current or former ownership, operation, management and development of real properties, we may be potentially liable for investigation and cleanup costs, penalties, and damages under environmental laws.
39
Table of Contents
Although all of our properties were, at the time they were acquired by our predecessor, subjected to preliminary environmental assessments, known as Phase I assessments, by independent environmental consultants that identify certain liabilities, Phase I assessments are limited in scope, and may not include or identify all potential environmental liabilities or risks associated with the property. Further, any environmental liabilities that arose since the date the studies were done would not be identified in the assessments. Unless required by applicable laws or regulations, we may not further investigate, remedy or ameliorate the liabilities disclosed in the Phase I assessments.
We cannot assure you that these or other environmental studies identified all potential environmental liabilities, or that we will not incur material environmental liabilities in the future. If we do incur material environmental liabilities in the future, we may face significant remediation costs, and we may find it difficult to sell any affected properties.
Our PCM business, which was acquired from Cole, is subject to risks that are particular to their role as sponsor and dealer manager for direct investment program offerings.
Our PCM business, including Cole Capital Corporation, which was Cole’s broker-dealer subsidiary and is a wholesale broker-dealer registered with the SEC and a member firm of FINRA, is subject to various risk and uncertainties that are common in the securities industry. Such risks and uncertainties include:
| • | the volatility of financial markets; |
| • | extensive governmental regulation; |
| • | litigation; and |
| • | intense competition. |
Our PCM business, which involves sponsoring and distributing interests in direct investment programs, will depend on a number of factors including our ability to enter into agreements with broker-dealers and independent investment advisors who will sell interests to their clients, our success in investing the proceeds of our offering, managing the properties acquired and generating cash flow to make distributions to investors in our direct investment programs and our success in entering into liquidity event for the direct investment programs. We are subject to competition from other sponsors and dealer-managers of direct investment programs and other investments, and there can be no assurance that this business will be successful.
Sponsorship of non-traded REITs also involves risks relating to the possibility that such programs will not receive capital at the levels and timing that are anticipated and that sufficient capital will not be raised to repay investments of cash in, and loans to, such non-traded REITs needed to meet up-front costs, the initial breaking of escrow and the acquisition of properties will not be made, as well as risks relating to competition from other sponsors of other similar programs.
In addition, our PCM business is subject to risks that are particular to its function as a wholesale broker-dealer and sponsoring non-traded REITs. For example, the broker-dealer provides substantial promotional support to broker-dealers selling a particular offering, including by providing sales literature, forums, webinars, press releases and other mass forms of communication. Due to our PCM business acting as a sponsor of non-traded REITs and the volume of materials that Cole Capital Corporation may provide throughout the course of an offering, much of which may be scrutinized by regulators. We and Cole Capital Corporation may be exposed to significant liability under federal and state securities laws. Additionally, Cole Capital Corporation may be subject to fines and suspension from the SEC and FINRA.
Failure to comply with the net capital requirements could subject us to sanctions imposed by the SEC or FINRA.
Our broker-dealer subsidiary is required to maintain certain levels of minimum net capital subject to the SEC’s net capital rule. The net capital rule is designed to measure the general financial integrity and liquidity of a broker-dealer. Compliance with the net capital rule limits those operations of broker-dealers that require the intensive use of their capital, such as underwriting commitments and principal trading activities. The rule also limits the ability of securities firms to pay dividends or make payments on certain indebtedness, such as subordinated debt, as it matures. FINRA may enter the offices of a broker-dealer at any time, without notice, and calculate the firm’s net capital. If the calculation reveals a deficiency in net capital, FINRA may immediately restrict or suspend certain or all the activities of a broker-dealer. Our broker-dealer subsidiary may not be able to maintain adequate net capital, or its net capital may fall below requirements established by the SEC, and it may be subject to disciplinary action in the form of fines, censure, suspension, expulsion or the termination of business altogether. In addition, if
40
Table of Contents
these net capital rules are changed or expanded, or if there is an unusually large charge against net capital, operations that require the intensive use of capital would be limited. A large operating loss or charge against net capital could adversely affect our broker-dealer’s ability to expand or even maintain its present levels of business, which could have a material adverse effect on its business of sponsoring and distributing interests in direct investment programs. In addition, our broker-dealer subsidiary may become subject to net capital requirements in other foreign jurisdictions in which it operates. We cannot predict its future capital needs or its ability to obtain additional financing.
Broker-dealers and other financial services firms are subject to extensive regulations and increased scrutiny.
The financial services industry is subject to extensive regulation by U.S. federal, state and international government agencies, as well as various self-regulatory agencies. Recent turmoil in the financial markets has contributed to significant rule changes, heightened scrutiny of the conduct of financial services firms and increasing penalties for rule violations. Our broker-dealer subsidiary may be adversely affected by new laws or rules or changes in the interpretation of existing rules or more rigorous enforcement. Significant new rules are developing under the Dodd-Frank Wall Street Reform and Consumer Protection Act of 2010. Some of these rules could impact our broker-dealer subsidiary’s business, including through the potential implementation of a more stringent fiduciary standard for brokers and enhanced regulatory oversight over incentive compensation.
Our broker-dealer subsidiary also may be adversely affected by other evolving regulatory standards, such as those relating to suitability and supervision. Legal claims or regulatory actions against our broker-dealer subsidiary also could have adverse financial effects on us or harm our reputation, which could harm our business prospects.
Our broker-dealer subsidiary, which is registered as a broker-dealer under the Exchange Act and is a member of FINRA, is subject to regulation, examination and supervision by the SEC, FINRA, other self-regulatory organizations and state securities regulators. Broker-dealers are subject to regulations that cover all aspects of the securities business, including sales practices, use and safekeeping of clients’ funds and securities’ capital adequacy, record-keeping and the conduct and qualification of officers, employees and independent contractors. Failure by our broker-dealers to comply with applicable laws or regulations could result in censures, penalties or fines, the issuance of cease and desist orders, the suspension or expulsion from the securities industry of any such broker-dealer, or its officers, employees or independent contractors or other similar adverse consequences. Additionally, the adverse publicity arising from the imposition of sanctions could harm our reputation and cause us to lose existing clients or fail to gain new clients.
Financial services firms are also subject to rules and regulations relating to the prevention and detection of money laundering. The USA PATRIOT Act of 2001 mandates that financial institutions, including broker-dealers and investment advisors, establish and implement anti-money laundering (“AML”) programs reasonably designed to achieve compliance with the Bank Secrecy Act of 1970 and the rules thereunder. Financial services firms must maintain AML policies, procedures and controls, designate an AML compliance officer to oversee the firm’s AML program, implement appropriate employee training and provide for annual independent testing of the program. Our broker-dealer subsidiary has established AML programs but there can be no assurance of the effectiveness of these programs. Failure to comply with AML requirements could subject our broker-dealer subsidiary to disciplinary sanctions and other penalties. Financial services firms must also comply with applicable privacy and data protection laws and regulations, including SEC Regulation S-P and applicable provisions of the 1999 Gramm-Leach-Bliley Act, the Fair Credit Reporting Act of 1970 and the 2003 Fair and Accurate Credit Transactions Act. Any violations of laws and regulations relating to the safeguarding of private information could subject our broker-dealer subsidiary to fines and penalties, as well as to civil action by affected parties.
41
Table of Contents
We are subject to risks relating to mortgage loans, bridge loans, mezzanine loans, CMBS and real estate-related securities.
In connection with the Cole and Caplease Mergers, we acquired interests in mortgage loans, bridge loans, mezzanine loans, CMBS and other types of real estate-related securities. In addition, we may continue to make similar investments, which will subject us to risks relating to these types of loans and securities.
We are subject to risks relating to mortgage, bridge or mezzanine loans.
Investing in mortgage, bridge or mezzanine loans involves risk of defaults on those loans caused by many conditions beyond our control, including local and other economic conditions affecting real estate values, interest rate changes, rezoning, and failure by the borrower to maintain the property. If there are defaults under these loans, we may not be able to repossess and sell quickly any properties securing such loans. An action to foreclose on a property securing a loan is regulated by state statutes and regulations and is subject to many of the delays and expenses of any lawsuit brought in connection with the foreclosure if the defendant raises defenses or counterclaims. In the event of default by a mortgagor, these restrictions, among other things, may impede our ability to foreclose on or sell the mortgaged property or to obtain proceeds sufficient to repay all amounts due to us on the loan, which could reduce the value of our investment in the defaulted loan. In addition, investments in mezzanine loans involve a higher degree of risk than long-term senior mortgage loans secured by income-producing real property because the investment may become unsecured as a result of foreclosure on the underlying real property by the senior lender.
We are subject to risks relating to real estate-related securities in general.
Investments in real estate-related securities involve special risks relating to the particular issuer of the securities, including the financial condition and business outlook of the issuer. Issuers of real estate-related equity securities generally invest in real estate or real estate-related assets and are subject to the inherent risks associated with real estate-related investments discussed herein, including risks relating to rising interest rates.
Real estate-related securities are often unsecured and also may be subordinated to other obligations of the issuer. As a result, investments in real estate-related securities are subject to risks of (1) limited liquidity in the secondary trading market in the case of unlisted or thinly traded securities, (2) substantial market price volatility resulting from changes in prevailing interest rates in the case of traded equity securities, (3) subordination to the prior claims of banks and other senior lenders to the issuer, (4) the operation of mandatory sinking fund or call/redemption provisions during periods of declining interest rates that could cause the issuer to reinvest redemption proceeds in lower yielding assets, (5) the possibility that earnings of the issuer may be insufficient to meet its debt service and distribution obligations and (6) the declining creditworthiness and potential for insolvency of the issuer during periods of rising interest rates and economic slowdown or downturn. These risks may adversely affect the value of outstanding real estate-related securities and the ability of the issuers thereof to repay principal and interest or make distribution payments.
We may not have the expertise necessary to maximize the return on our investment in real estate-related securities. If we determine that it is advantageous to us to make the types of investments in which we do not have experience, we intend to employ persons, engage consultants or partner with third parties that have, in our opinion, the relevant expertise necessary to assist us in evaluating, making and administering such investments.
42
Table of Contents
We are subject to risks relating to CMBS.
CMBS are securities that evidence interests in, or are secured by, a single commercial mortgage loan or a pool of commercial mortgage loans. Accordingly, these securities are subject to all of the risks of the underlying mortgage loans. In a rising interest rate environment, the value of CMBS may be adversely affected when payments on underlying mortgages do not occur as anticipated, resulting in the extension of the security’s effective maturity and the related increase in interest rate sensitivity of a longer-term instrument. The value of CMBS may also change due to shifts in the market’s perception of issuers and regulatory or tax changes adversely affecting the mortgage securities market as a whole. In addition, CMBS are subject to the credit risk associated with the performance of the underlying mortgage properties. CMBS are issued by investment banks, not financial institutions, and are not insured or guaranteed by the U.S. government.
CMBS are also subject to several risks created through the securitization process. Subordinate CMBS are paid interest only to the extent that there are funds available to make payments. To the extent the collateral pool includes delinquent loans, there is a risk that interest payments on subordinate CMBS will not be fully paid. Subordinate CMBS are also subject to greater credit risk than those CMBS that are more highly rated. In certain instances, third-party guarantees or other forms of credit support can reduce the credit risk.
The value of CMBS can be negatively impacted by any dislocation in the mortgage-backed securities market in general. Currently, the mortgage-backed securities market is suffering from a severe dislocation created by mortgage pools that include sub-prime mortgages secured by residential real estate. Sub-prime loans often have high interest rates and are often made to borrowers with credit scores that would not qualify them for prime conventional loans. In recent years, banks made a great number of the sub-prime residential mortgage loans with high interest rates, floating interest rates, interest rates that reset from time to time and/or interest-only payment features that expire over time. These terms, coupled with rising interest rates, have caused an increasing number of homeowners to default on their mortgages. Purchasers of mortgage-backed securities collateralized by mortgage pools that include risky sub-prime residential mortgages have experienced severe losses as a result of the defaults and such losses have had a negative impact on the CMBS market.
Our build-to-suit program is subject to additional risks related to properties under development.
The businesses we acquired in each of the Cole and CapLease Mergers engage in build-to-suit programs and acquisition of properties under development. In connection with these businesses, we enter into purchase and sale arrangements with sellers or developers of suitable properties under development or construction. In such cases, we are obligated to purchase the property at the completion of construction, provided that the construction conforms to definitive plans, specifications, and costs approved by us in advance. We may continue this business.
As a result, we are subject to potential development risks and construction delays and the resultant increased costs and risks. If we engage in development or construction projects, we will be subject to uncertainties associated with re-zoning for development, environmental concerns of governmental entities and/or community groups, and the builder’s ability to build in conformity with plans, specifications, budgeted costs and timetables. If a builder fails to perform, we may resort to legal action to rescind the purchase or the construction contract or to compel performance. A builder’s performance may also be affected or delayed by conditions beyond the builder’s control. Delays in completion of construction could also give tenants the right to terminate preconstruction leases. We may incur additional risks if we make periodic progress payments or other advances to builders before they complete construction. These and other such factors can result in increased project costs or loss of our investment. In addition, we will be subject to normal lease-up risks relating to newly constructed projects. We also will rely on rental income and expense projections and estimates of the fair market value of property upon completion of construction when agreeing upon a price at the time we acquire the property. If these projections are inaccurate, we may pay too much for a property and our return on our investment could suffer. If we contract with a development company for newly developed properties, we anticipate that it will be obligated to pay a substantial earnest money deposit at the time of contracting to acquire such properties. In the case of properties to be developed by a development company, we anticipate that it will be required to close the purchase of the property upon completion of the development of the property. At the time of contracting and the payment of the earnest money deposit, the development company typically will not have acquired title to any real property and there is a risk that its earnest money deposit made to the development company may not be fully refunded.
43
Table of Contents
Risks Related to Our Organization and Structure
The supermajority voting requirements applicable to our board of directors in connection with our consolidation, merger, sale of all or substantially all of our assets or our engaging in a share exchange will limit our independent directors’ ability to influence such corporate matters.
Our charter provides that we may not consolidate, merge, sell all or substantially all of our assets or engage in a share exchange, unless such actions are approved by the affirmative vote of at least two-thirds of our board of directors. This concentrated control limits the ability of our independent directors to influence such corporate matters and could delay, deter or prevent a change of control transaction that might otherwise involve a premium for our shares of common stock or otherwise be in the best interests of our stockholders. Additionally, the market price of our common stock could be adversely affected because of the imbalance of control.
Our charter, the partnership agreement of our operating partnership and Maryland law contain provisions that may delay or prevent a change of control transaction.
Our charter, subject to certain exceptions, limits any person to actual or constructive ownership of no more than 9.8% in value of the aggregate of our outstanding shares of stock and not more than 9.8% (in value or in number of shares, whichever is more restrictive) of any class or series of our shares of stock. Our board of directors, in its sole discretion and upon receipt of certain representations and undertakings, may exempt a person (prospectively or retroactively) from the ownership limits. However, our board of directors may not, among other limitations, grant an exemption from the ownership limits to any person whose ownership, direct or indirect, in excess of the 9.8% ownership limit would cause us to fail to qualify as a REIT. The ownership limits and the other restrictions on ownership and transfer of our stock contained in our charter may delay or prevent a transaction or a change of control that might involve a premium price for our common stock or otherwise be in the best interest of our stockholders.
Tax protection provisions on certain properties could limit our operating flexibility.
We have agreed with the Contributor, an affiliate of ARC, to indemnify it against adverse tax consequences if we were to sell, convey, transfer or otherwise dispose of all or any portion of the interests in the continuing properties acquired by us in the formation transactions, in a taxable transaction. However, we can sell these properties in a taxable transaction if we pay the Contributor cash in the amount of its tax liabilities arising from the transaction and tax payments. These tax protection provisions apply until September 6, 2021, which is the 10th anniversary of the closing of our IPO. Although it may be in our stockholders’ best interest that we sell a property, it may be economically disadvantageous for us to do so because of these obligations. We have also agreed to make debt available for the Contributor to guarantee. We agreed to these provisions in order to assist the Contributor in preserving its tax position after its contribution of its interests in our initial properties. As a result, we may be required to incur and maintain more debt than we would otherwise.
Tax consequences to holders of OP units upon a sale or refinancing of our properties may cause the interests of our principals to differ from the interests of our other stockholders.
As a result of the unrealized built-in gain that may be attributable to one or more of the contributed properties at the time of contribution in connection with the formation transactions, some holders of OP units, including the Contributor, an affiliate of ARC, may experience different tax consequences than holders of our capital stock upon the sale or refinancing of the properties owned by our operating partnership, including disproportionately greater allocations of items of taxable income and gain upon a realization event. As those holders will not receive a correspondingly greater distribution of cash proceeds, they may have different objectives regarding the appropriate pricing, timing and other material terms of any sale or refinancing of certain properties, or whether to sell or refinance such properties at all, than those that would be in the best interests of our stockholders taken as a whole.
We continue to rely on services provided by our Former Manager for certain administrative services.
While we have terminated our management agreement with our Former Manager, our Former Manager continues to provide us with certain administrative services, including transaction management services, under agreements which continue in effect following our transition to self-management. Affiliates of our Former Manager have not agreed to dedicate specific personnel to providing these services. Accordingly, we continue to rely on affiliates of the Former Manager for services required to execute our business plan.
44
Table of Contents
We are a holding company with no direct operations. As a result, we rely on funds received from our operating partnership to pay liabilities and dividends, our stockholders’ claims will be structurally subordinated to all liabilities of our operating partnership and our stockholders do not have any voting rights with respect to our operating partnership’s activities, including the issuance of additional OP units.
We are a holding company and conduct all of our operations through our operating partnership. We do not have, apart from our ownership of our operating partnership, any independent operations. As a result, we rely on distributions from our operating partnership to pay any dividends we might declare on shares of our common stock. We also rely on distributions from our operating partnership to meet any of our obligations, including tax liability on taxable income allocated to us from our operating partnership (which might make distributions to the company not equal to the tax on such allocated taxable income).
In addition, because we are a holding company, stockholders’ claims will be structurally subordinated to all existing and future liabilities and obligations (whether or not for borrowed money) of our operating partnership and its subsidiaries. Therefore, in the event of our bankruptcy, liquidation or reorganization, claims of our stockholders will be satisfied only after all of our and our operating partnership’s and its subsidiaries’ liabilities and obligations have been paid in full.
As of December 31, 2013, we owned approximately 96.1% of the OP units in our operating partnership. However, our operating partnership may issue additional OP units in the future. Such issuances could reduce our ownership percentage in our operating partnership. Because our stockholders will not directly own any OP units, they will not have any voting rights with respect to any such issuances or other partnership-level activities of our operating partnership.
Our board of directors may create and issue a class or series of common or preferred stock without stockholder approval.
Our board of directors is empowered under our charter to amend our charter from time to time to increase or decrease the aggregate number of shares of our stock or the number of shares of stock of any class or series that we have authority to issue, to designate and issue from time to time one or more classes or series of stock and to classify or reclassify any unissued shares of our common stock or preferred stock without stockholder approval. Our board of directors may determine the relative preferences, conversion or other rights, voting powers, restrictions, limitations as to dividends or other distributions, qualifications or terms or conditions of redemption of any class or series of stock issued. As a result, we may issue series or classes of stock with voting rights, rights to dividends or other rights, senior to the rights of holders of our capital stock. The issuance of any such stock could also have the effect of delaying or preventing a change of control transaction that might otherwise be in the best interests of our stockholders.
Certain provisions in the partnership agreement of our operating partnership may delay or prevent unsolicited acquisitions of us.
Provisions in the partnership agreement of our operating partnership may delay or make more difficult unsolicited acquisitions of us or changes in our control. These provisions could discourage third parties from making proposals involving an unsolicited acquisition of us or change of our control, although some stockholders might consider such proposals, if made, desirable. These provisions include, among others:
| • | redemption rights of qualifying parties; |
| • | transfer restrictions on the OP units; |
| • | the ability of the general partner in some cases to amend the partnership agreement without the consent of the limited partners; |
| • | the right of the limited partners to consent to transfers of the general partnership interest of the general partner and mergers or consolidations of our company under specified limited circumstances; and |
| • | restrictions relating to our qualification as a REIT under the Code. |
45
Table of Contents
Our charter and bylaws and the partnership agreement of our operating partnership also contain other provisions that may delay, defer or prevent a transaction or a change of control that might involve a premium price for our common stock or otherwise be in the best interest of our stockholders.
Certain rights which are reserved to our stockholders may allow third parties to enter into business combinations with us that are not in the best interest of the stockholders without negotiating with our board of directors.
Certain provisions of the Maryland General Corporation Law (the “MGCL”) may have the effect of requiring a third party seeking to acquire us to negotiate with our board of directors, including:
| • | “business combination” provisions that, subject to limitations, prohibit certain business combinations between us and an “interested stockholder” (defined generally as any person who beneficially owns 10% or more of the voting power of our outstanding voting stock or an affiliate or associate of our company who, at any time within the two-year period prior to the date in question, was the beneficial owner of 10% or more of the voting power of our then outstanding stock) or an affiliate of an interested stockholder for five years after the most recent date on which the stockholder becomes an interested stockholder, and thereafter imposes special appraisal rights and stockholder supermajority voting requirements on these combinations; and |
| • | “control share” provisions that provide that “control shares” of our company (defined as shares which, when aggregated with other shares controlled by the stockholder (except solely by virtue of a revocable proxy), entitle the stockholder to exercise one of three increasing ranges of voting power in electing directors) acquired in a “control share acquisition” (defined as the direct or indirect acquisition of ownership or control of issued and outstanding “control shares”) have no voting rights except to the extent approved by our stockholders by the affirmative vote of at least two-thirds of all the votes entitled to be cast on the matter, excluding all interested shares. |
As permitted by the MGCL, our board of directors has by resolution exempted business combinations (1) between us and any person, provided that such business combination is first approved by our board of directors (including a majority of directors who are not affiliates or associates of such person) and (2) between us and ARC, our Former Manager, our operating partnership or any of their respective affiliates. Consequently, the five-year prohibition and the supermajority vote requirements will not apply to such business combinations. As a result, any person described above may be able to enter into business combinations with us that may not be in the best interest of our stockholders without compliance by us with the supermajority vote requirements and other provisions of the statute. This resolution, however, may be altered or repealed in whole or in part at any time by our board of directors. If this resolution is repealed, or our board of directors does not otherwise approve a business combination with a person other than ARC, our Former Manager, our operating partnership or any of their respective affiliates, the statute may discourage others from trying to acquire control of us and increase the difficulty of consummating any offer.
Pursuant to a provision in our bylaws, we have opted out of the control share provisions of the MGCL. However, we may, by amendment to our bylaws, opt in to the control shares provisions of the MGCL in the future.
Additionally, Title 3, Subtitle 8 of the MGCL permits our board of directors, without stockholder approval and regardless of what is currently provided in our charter or bylaws, to implement certain takeover defenses, such as a classified board, some of which we do not yet have. These provisions may have the effect of inhibiting a third-party from making an acquisition proposal for us or of delaying, deferring or preventing a change in control of us under the circumstances that otherwise could provide our stockholders with the opportunity to realize a premium over the then current market price.
46
Table of Contents
Our fiduciary duties as sole general partner of our operating partnership could create conflicts of interest.
We are the sole general partner of our operating partnership, and, as such, will have fiduciary duties to our operating partnership and the limited partners in the operating partnership, the discharge of which may conflict with the interests of our stockholders. The limited partnership agreement of our operating partnership provides that, in the event of a conflict between the duties owed by our directors to our company and the duties that we owe, in our capacity as the sole general partner of our operating partnership, to such limited partners, our directors are under no obligation to give priority to the interests of such limited partners. In addition, those persons holding OP units will have the right to vote on certain amendments to the limited partnership agreement (which require approval by a majority in interest of the limited partners, including us) and individually to approve certain amendments that would adversely affect their rights, as well as the right to vote on mergers and consolidations of us in our capacity as sole general partner of the operating partnership in certain limited circumstances. These voting rights may be exercised in a manner that conflicts with the interests of our stockholders. For example, we cannot adversely affect the limited partners’ rights to receive distributions, as set forth in the limited partnership agreement, without their consent, even though modifying such rights might be in the best interest of our stockholders generally.
We had never operated as a REIT prior to making our initial REIT election for the year ended December 31, 2011 and have only recently begun operating as a public company and, therefore, we cannot assure you that we will successfully and profitably operate our business in compliance with the regulatory requirements applicable to REITs and to public companies.
We had never operated as a REIT prior to making our initial REIT election for the year ended December 31, 2011. Also, we have only operated as a public company beginning the date of the closing of our IPO on September 6, 2011. In addition, certain members of our board of directors and certain of our executive officers have no experience in operating a publicly traded REIT that is traded on a securities exchange other than in connection with our operations. We cannot assure you that we will be able to successfully operate our company as a REIT or a publicly traded company, including satisfying the requirements to timely meet disclosure requirements and complying with the Sarbanes-Oxley Act, including implementing effective internal controls. Failure to maintain our qualification as a REIT or comply with other regulatory requirements would have an adverse effect on our business, financial condition, results of operations, cash flow, per share trading price of our common stock and ability to satisfy our debt service obligations and to make distributions to our stockholders.
Our board of directors may change significant corporate policies without stockholder approval.
Our investment, financing, borrowing and dividend policies and our policies with respect to other activities, including growth, debt, capitalization and operations, will be determined by our board of directors. These policies may be amended or revised at any time and from time to time at the discretion of the board of directors without a vote of our stockholders. In addition, the board of directors may change our policies with respect to conflicts of interest provided that such changes are consistent with applicable legal requirements. A change in these policies could have an adverse effect on our business, financial condition, results of operations, cash flow, per share trading price of our common stock and ability to satisfy our debt service obligations and to make distributions to our stockholders.
47
Table of Contents
ARCP may incur adverse tax consequences if ARCT III , CapLease, ARCT IV or Cole has failed qualify as a REIT for U.S. federal income tax purposes.
If ARCT III, CapLease, ARCT IV or Cole has failed to qualify as a REIT for U.S. federal income tax purposes at any time prior to the ARCT III Merger, the CapLease Merger, the ARCT IV Merger and the Cole Merger, respectively, ARCP may inherit significant tax liabilities and could lose ARCP’s REIT status should disqualifying activities continue after the mergers.
We could incur liability as a result of a lawsuit to which Cole is subject in connection with the merger between Cole and Cole Holdings Corporation (“Cole Holdings”), pursuant to which Cole became a self-managed REIT.
Three outstanding putative class action and/or derivative lawsuits, which were filed earlier this year, assert claims for breach of fiduciary duty, abuse of control, corporate waste, unjust enrichment, aiding and abetting breach of fiduciary duty and other claims relating to the merger between a wholly owned subsidiary of Cole and Cole Holdings, pursuant to which Cole became a self-managed REIT. The Court in one of the lawsuits has granted defendants’ motion to dismiss with prejudice, but the plaintiffs have filed a notice of appeal of this dismissal. The other two lawsuits, which also purport to assert claims under the Securities Act, are pending in the United States District Court for the District of Arizona. Defendants filed a motion to dismiss both complaints on January 10, 2014.
Whether or not any plaintiffs’ claims are successful, this type of litigation is often expensive and diverts management’s attention and resources, which could adversely affect our operations.
We could incur liability as a result of an adverse judgment in litigation challenging one or more of our Recent Acquisitions, including the Cole Merger and the Caplease Merger and the ARCT III Merger.
Stockholders of Cole have filed lawsuits and may file additional lawsuits challenging the Cole Merger, which name and may name ARCP as a defendant. To date, eleven such lawsuits have been filed. Two putative class actions have been filed in in the U.S. District Court of Arizona, captioned as: (i) Wunsch v. Cole Real Estate Investment, Inc., et al.; and (ii) Sobon v. Cole Real Estate Investments, Inc., et al. Eight other putative stockholder class action lawsuits have been filed in the Circuit Court for Baltimore City, Maryland, captioned as: (i) Operman v. Cole Real Estate Investments, Inc., et al.; (ii) Branham v. Cole Real Estate Investments, Inc., et al.; (iii) Wilfong v. Cole Real Estate Investments, Inc., et al.; (iv) Polage v. Cole Real Estate Investments, Inc., et al.; (v) Flynn v. Cole Real Estate Investments, Inc., et al.; (vi) Corwin v. Cole Real Estate Investments, Inc., et al.; (vii) Green v. Cole Real Estate Investments, Inc., et al.; and (viii) Morgan v. Cole Real Estate Investments, Inc., et al. (collectively, the ‘‘Baltimore Actions’’). All of these lawsuits name ARCP, Cole and the Cole board of directors as defendants. All of the named plaintiffs claim to be Cole stockholders and purport to represent all holders of Cole’s stock. Each complaint generally alleges that the individual defendants breached fiduciary duties owed to plaintiff, the other public stockholders of Cole and to Cole, and that certain entity defendants aided and abetted those breaches. In addition, certain lawsuits claim that the individual defendants breached their duty of candor to our stockholders and the Branham, Polage and Flynn lawsuits assert claims derivatively against the individual defendants for their alleged breach of fiduciary duties owed to Cole. The Polage lawsuit also asserts derivative claims for waste of corporate assets and unjust enrichment. The eight Baltimore Actions were consolidated on December 12, 2013. The Wunsch and Sobon lawsuits, which were consolidated by court order on January 17, 2014, also allege that the joint proxy statement filed in relation to the Cole Merger contains materially incomplete and misleading disclosures in violation of Sections 14(a) and 20(a) of the Exchange Act. Among other remedies, the complaints seek money damages, costs and attorneys’ fees.
48
Table of Contents
On January 10, 2014, solely to avoid the costs, risks, and uncertainties inherent in litigation and without admitting any liability or wrongdoing, ARCP, Cole and the other named defendants in the Baltimore Actions entered into a memorandum of understanding with the plaintiffs in the Baltimore Actions to settle the cases. The memorandum of understanding contemplates that the parties will enter into a stipulation of settlement. The stipulation of settlement will be subject to customary conditions, including court approval following notice to ARCP’s and Cole’s stockholders. In the event that the parties enter into a stipulation of settlement, a hearing will be scheduled by the court to consider the fairness, reasonableness, and adequacy of the settlement. In the event the settlement is finally approved by the court, it will resolve and release all claims in all actions that were or could have been brought challenging any aspect of the Cole Merger, the Cole Merger Agreement and any disclosure made in connection therewith, among other claims, pursuant to terms that will be disclosed to stockholders prior to final approval of the settlement. In addition, in connection with the settlement, the parties contemplate that plaintiff’s counsel in the Baltimore Actions will file a petition in the court for an award of attorneys’ fees and expenses to be paid by ARCP, which the defendants may oppose. ARCP will pay or cause to be paid any attorneys’ fees and expenses awarded by the court. There can be no assurance that the parties will ultimately enter into a stipulation of settlement or that the court will approve the settlement even if the parties were to enter into such stipulation. In such event, the proposed settlement as contemplated by the memorandum of understanding may be terminated.
One additional putative class action has been filed in the Supreme Court of New York, captioned as: Realistic Partners v. Schorsch et al. (the ‘‘Realistic Partners Action’’). This lawsuit names ARCP, the ARCP board of directors and Cole as defendants. The named plaintiff claims to be an ARCP stockholder and purports to represent all holders of ARCP’s stock. The complaint generally alleges that ARCP and the individual defendants breached a fiduciary duty of candor allegedly owed to plaintiff and to the other public stockholders of ARCP, and that Cole aided and abetted those breaches. On January 17, 2014, solely to avoid the costs, risks, and uncertainties inherent in litigation and without admitting any liability or wrongdoing, ARCP, Cole and the other named defendants in the Realistic Partners Action entered into a memorandum of understanding with the plaintiff in the Realistic Partners Action to settle the case. The memorandum of understanding contemplates that the parties will enter into a stipulation of settlement. The stipulation of settlement will be subject to customary conditions, including court approval following notice to ARCP’s and Cole’s stockholders. In the event that the parties enter into a stipulation of settlement, a hearing will be scheduled by the court to consider the fairness, reasonableness, and adequacy of the settlement. In the event the settlement is finally approved by the court, it will resolve and release all claims in all actions that were or could have been brought challenging any aspect of the Cole Merger, the Cole Merger Agreement, and any disclosure made in connection therewith, among other claims, pursuant to terms that will be disclosed to stockholders prior to final approval of the settlement. In addition, in connection with the settlement, the parties contemplate that plaintiff’s counsel in the Realistic Partners Action will file a petition in the court for an award of attorneys’ fees and expenses to be paid by ARCP, which the defendants may oppose. ARCP will pay or cause to be paid any attorneys’ fees and expenses awarded by the court. There can be no assurance that the parties will ultimately enter into a stipulation of settlement or that the court will approve the settlement even if the parties were to enter into such stipulation. In such event, the proposed settlement as contemplated by the memorandum of understanding may be terminated.
A number of lawsuits by CapLease’s stockholders have been challenging the CapLease Merger, some of which name ARCP and the OP as defendants. Additionally, a lawsuit was commenced on behalf of holders of a series of CapLease’s preferred stock in connection with the CapLease Merger alleging that the conversion of such preferred stock pursuant to the terms of the CapLease Merger Agreement was prohibited by the Articles Supplementary classifying and designating such preferred stock.
49
Table of Contents
After the announcement of the ARCT III Merger Agreement, Randell Quaal filed a putative class action lawsuit on January 30, 2013 against the Company, the OP, ARCT III, ARCT III OP, the members of the board of directors of ARCT III and certain subsidiaries of the Company in the Supreme Court of the State of New York. In February 2013, the parties agreed to a memorandum of understanding regarding settlement of all claims asserted on behalf of the alleged class of ARCT III stockholders. In connection with the settlement contemplated by the memorandum of understanding, the class action and all claims asserted therein will be dismissed, subject to court approval. If the parties enter into a stipulation of settlement, a hearing will be scheduled at which the court will consider the fairness, reasonableness and adequacy of the settlement. There can be no assurance that the parties will ultimately enter into a stipulation of settlement, that the court will approve any proposed settlement, or that any eventual settlement will be under the same terms as those contemplated by the memorandum of understanding, therefore any losses that may be incurred to settle this matter are not determinable.
We cannot assure you as to the outcome of these lawsuits, including the costs associated with defending these claims or any other liabilities that may be incurred in connection with the litigation or settlement of these claims. Whether or not any plaintiffs’ claims are successful, this type of litigation is often expensive and diverts management’s attention and resources, which could adversely affect the operation of our business.
Our future results will suffer if we do not effectively manage our expanded portfolio and operations following the Recent Acquisitions.
Following the Recent Acquisitions, we have an expanded portfolio and operations and likely will continue to expand its operations through additional acquisitions and other strategic transactions, some of which may involve complex challenges. Our future success will depend, in part, upon our ability to manage our expansion opportunities, integrate new operations into our existing business in an efficient and timely manner, successfully monitor our operations, costs, regulatory compliance and service quality, and maintain other necessary internal controls. We cannot assure you that our expansion or acquisition opportunities will be successful, or that we will realize the expected operating efficiencies, cost savings, revenue enhancements, synergies or other benefits.
ARCP has a history of operating losses and cannot assure you that it will achieve profitability.
Since ARCP’s inception in 2010, ARCP has experienced net losses (calculated in accordance with GAAP) each fiscal year and, as of December 31, 2013, had an accumulated deficit of $878.0 million (as restated). The extent of ARCP’s future operating losses and the timing of when ARCP will achieve profitability are uncertain, and depends on the demand for, and value of, ARCP’s portfolio of properties and ARCP may never achieve or sustain profitability.
ARCP may be unable to integrate the recently acquired GE Capital, Fortress and Inland Portfolios into ARCP’s existing portfolio or CapLease’s, ARCT IV’s and Cole’s businesses with ARCP’s business successfully and realize the anticipated synergies and related benefits of the Mergers, and acquisition of the GE Capital Portfolio and other pending acquisitions or do so within the anticipated timeframe.
ARCP’s consummation of the CapLease Merger, the ARCT IV Merger and the Cole Merger, involves the combination of companies that, prior to the consummation thereof, operated as independent companies. Additionally, ARCP recently acquired the GE Capital, Fortress and Inland Portfolios. ARCP may be required to devote significant management attention and resources to integrating ARCP’s business practices and operations with those of CapLease, ARCT IV and Cole and the acquired GE Capital, Inland and Fortress Portfolios as well as the Inland Portfolio. Potential difficulties ARCP may encounter in the integration process include the following:
| • | the inability to successfully combine ARCP’s business with CapLease’s, ARCT IV’s or Cole’s business or the GE Capital, Inland and Fortress Portfolios into ARCP’s portfolio, in each case in a manner that permits the combined company to achieve the anticipated cost savings, which would result in the anticipated benefits of the mergers and the acquisition of the Inland and Fortress Portfolios not being realized in the timeframe anticipated or at all; |
| • | the complexities associated with managing the combined business out of several different locations and integrating personnel from the two companies; |
50
Table of Contents
| • | the additional complexities of combining companies with different histories, cultures, potential regulatory restrictions, markets and tenant bases; |
| • | the failure to retain ARCP’s key employees or those of any of ARCT IV, CapLease or Cole; |
| • | the inability to divest certain CapLease or Cole assets not fundamental to ARCP’s business; |
| • | potential unknown liabilities and unforeseen increased expenses, delays or regulatory conditions associated with the combinations; and |
| • | performance shortfalls as a result of the diversion of management’s attention caused by completing the Mergers and acquisition of the Inland and Fortress Portfolios and integrating operations. |
For all these reasons, our stockholders should be aware that it is possible that the integration process following the Recent Acquisitions could result in the distraction of our management, the disruption of our ongoing business or inconsistencies in our services, standards, controls, procedures and policies, any of which could adversely affect our ability to maintain relationships with tenants, vendors and employees or to achieve the anticipated benefits of such transactions, or could otherwise adversely affect the business and our financial results.
ARCP cannot assure our stockholders that it will be able to continue paying distributions at the same rate as in the past. (As Restated)
ARCP will reevaluate a reinstatement of the dividend on its common stock at a rate that is in line with its industry peers. ARCP’s stockholders may not receive the same distributions for various reasons, including the following:
| • | ARCP may determine to change its current dividend rate; |
| • | as a result of the mergers and the issuance of shares of ARCP’s common and preferred stock in connection with the mergers, the total amount of cash required for ARCP to pay distributions at its current rate will increase; |
| • | ARCP may not have enough cash to pay such distributions due to changes in ARCP’s cash requirements, capital spending plans, cash flow or financial position; |
| • | decisions on whether, when and in which amounts to make any future distributions will remain at all times entirely at the discretion of the ARCP Board, which reserves the right to change ARCP’s dividend practices at any time and for any reason; |
| • | ARCP may desire to retain cash to maintain or improve its credit ratings; |
| • | the amount of distributions that ARCP’s subsidiaries may distribute to ARCP may be subject to restrictions imposed by state law, restrictions that may be imposed by state regulators and restrictions imposed by the terms of any current or future indebtedness that these subsidiaries may incur; |
| • | ARCP is subject to certain restrictions on borrowing and on paying dividends on its common stock pursuant to the Amended Credit Agreement. |
ARCP’s stockholders have no contractual or other legal right to distributions or dividends that have not been declared.
Our net income per share and FFO per share in the near term may decrease as a result of us becoming self-managed.
We completed our transition to self-management in January 2014. While we will no longer bear the external costs of the various fees and expenses paid to our Former Manager, subsequent to becoming self-managed, net income per share and FFO per share in the near term may decrease as a result of us becoming self-managed, due to increased expenses related to being self-managed, including expenses for compensation and benefits of our officers and other employees, which previously were paid by our Former Manager. Therefore, the exact amount of savings to us, if any, from becoming self-managed cannot reasonably be estimated. If the expenses we assume as a result of us becoming self-managed are higher than we anticipate, our net income per share and FFO per share may be lower as a result of us becoming self-managed than we otherwise would have been, potentially causing our net income per share and FFO per share to decrease.
51
Table of Contents
In connection with us becoming self-managed, we may become exposed to risks to which we have not historically been exposed.
In connection with us becoming self-managed, we may be exposed to risks to which we have not historically been exposed. Excluding the effect of the eliminated asset management and other fees previously paid to our Former Manager and its affiliates, our direct overhead, on a consolidated basis, will increase as a result of us becoming self-managed. Prior to us becoming self-managed, the responsibility for such overhead was borne by our Former Manager.
Prior to us becoming self-managed, we did not have separate facilities, communications and information systems nor did we directly employ very many employees; our Former Manager formerly provided such amenities. As a result of us becoming self-managed, we now will lease office space, have our own communications and information systems and directly employ a staff. Any failure of our employees or infrastructure to provide these services after self-management could adversely affect our operations. Our business is highly dependent on communications and information systems. Any failure or interruption of our systems could have a material adverse effect on our financial condition and operating results. Additionally, as a direct employer, we will be subject to those potential liabilities that are commonly faced by employers, such as workers disability and compensation claims, potential labor disputes and other employee-related liabilities and grievances, and we will bear the costs of the establishment and maintenance of such plans.
Furthermore, pursuant to our Recent Acquisitions, we will also be combining the facilities and personnel of the companies acquired pursuant to our Recent Acquisitions. In particular, as a result of the Cole Merger, we will significantly increase the number of our employees, including the addition of employees who will become our senior officers, and significantly increase the facilities at which our business operates. We will face potential difficulties in effecting our self-management and integrating these businesses, including those described under “ –ARCP may be unable to integrate the recently acquired GE Capital, Fortress and Inland Portfolios into ARCP’s existing portfolio or CapLease’s, ARCT IV’s and Cole’s businesses with ARCP’s business successfully and realize the anticipated synergies and related benefits of the Mergers, and acquisition of the GE Capital Portfolio and other pending acquisitions or do so within the anticipated timeframe.”
U.S. Federal Income Tax Risks
Our failure to remain qualified as a REIT would subject us to U.S. federal income tax and potentially state and local tax, and would adversely affect our operations and the market price of our common stock.
We have qualified to be taxed as a REIT commencing with the taxable year ended December 31, 2011 and intend to operate in a manner that would allow us to continue to qualify as a REIT. However, we may terminate our REIT qualification if our board of directors determines that not qualifying as a REIT is in our best interests, or inadvertently. Our qualification as a REIT depends upon our satisfaction of certain asset, income, organizational, distribution, stockholder ownership and other requirements on a continuing basis. We structured our activities in a manner designed to satisfy all requirements for qualification as a REIT. However, the REIT qualification requirements are extremely complex and interpretation of the U.S. federal income tax laws governing qualification as a REIT is limited. Furthermore, any opinion of our counsel, including tax counsel, as to our eligibility to remain qualified as a REIT is not binding on the IRS and is not a guarantee that we will continue to qualify as a REIT. Accordingly, we cannot be certain that we will be successful in operating so we can remain qualified as a REIT. Our ability to satisfy the asset tests depends on our analysis of the characterization and fair market values of our assets, some of which are not susceptible to a precise determination, and for which we will not obtain independent appraisals. Our compliance with the REIT income or quarterly asset requirements also depends on our ability to successfully manage the composition of our income and assets on an ongoing basis. Accordingly, if certain of our operations were to be recharacterized by the IRS, such recharacterization would jeopardize our ability to satisfy all requirements for qualification as a REIT. Furthermore, future legislative, judicial or administrative changes to the U.S. federal income tax laws could be applied retroactively, which could result in our disqualification as a REIT.
52
Table of Contents
If we fail to continue to qualify as a REIT for any taxable year and we do not qualify for certain statutory relief provisions, we will be subject to U.S. federal income tax on our taxable income at corporate rates. In addition, we would generally be disqualified from treatment as a REIT for the four taxable years following the year of losing our REIT qualification. Losing our REIT qualification would reduce our net earnings available for investment or distribution to stockholders because of the additional tax liability. In addition, distributions to stockholders would no longer qualify for the dividends paid deduction, and we would no longer be required to make distributions. If this occurs, we might be required to borrow funds or liquidate some investments in order to pay the applicable tax.
Even with our REIT qualification, in certain circumstances, we may incur tax liabilities that would reduce our cash available for distribution to our stockholders.
Even with our REIT qualification, we may be subject to U.S. federal, state and local income taxes. For example, net income from the sale of properties that are “dealer” properties sold by a REIT (a “prohibited transaction” under the Code) will be subject to a 100% tax. We may not make sufficient dividends to avoid excise taxes applicable to REITs. Similarly, if we were to fail an income test (and did not lose our REIT status because such failure was due to reasonable cause and not willful neglect) we would be subject to tax on the income that does not meet the income test requirements. We also may decide to retain net capital gain we earn from the sale or other disposition of our property and pay U.S. federal income tax directly on such income. In that event, our stockholders would be treated as if they earned that income and paid the tax on it directly. However, stockholders that are tax-exempt, such as charities or qualified pension plans, would have no benefit from their deemed payment of such tax liability unless they file U.S. federal income tax returns and thereon seek a refund of such tax. We also will be subject to corporate tax on any undistributed REIT taxable income. We also may be subject to state and local taxes on our income or property, including franchise, payroll and transfer taxes, either directly or at the level of our operating partnership or at the level of the other companies through which we indirectly own our assets, such as TRSs, which are subject to full U.S. federal, state, local and foreign corporate-level income taxes. Any taxes we pay directly or indirectly will reduce our cash available for distribution to our stockholders.
To qualify as a REIT we must meet annual dividend requirements, which may force us to forgo otherwise attractive opportunities or borrow funds during unfavorable market conditions. This could delay or hinder our ability to meet our investment objectives and reduce our stockholders overall return.
In order to qualify as a REIT, we must distribute annually to our stockholders at least 90% of our REIT taxable income (which does not equal net income as calculated in accordance with GAAP), determined without regard to the deduction for dividends paid and excluding any net capital gain. We will be subject to U.S. federal income tax on our undistributed taxable income and net capital gain and to a 4% nondeductible excise tax on any amount by which dividends we pay with respect to any calendar year are less than the sum of (a) 85% of our ordinary income, (b) 95% of our capital gain net income and (c) 100% of our undistributed income from prior years. These requirements could cause us to distribute amounts that otherwise would be spent on investments in real estate assets and it is possible that we might be required to borrow funds, possibly at unfavorable rates, or sell assets to fund these dividends. Although we intend to make dividends sufficient to meet the annual dividend requirements and to avoid U.S. federal income and excise taxes on our earnings while we qualify as a REIT, it is possible that we might not always be able to do so.
53
Table of Contents
Certain of our business activities are potentially subject to the prohibited transaction tax, which could reduce the return on our stockholders’ investments.
For so long as we qualify as a REIT, our ability to dispose of property during the first few years following acquisition may be restricted to a substantial extent as a result of our REIT qualification. Under applicable provisions of the Code regarding prohibited transactions by REITs, while we qualify as a REIT, we will be subject to a 100% penalty tax on any gain recognized on the sale or other disposition of any property (other than foreclosure property) that we own, directly or through any subsidiary entity, including our operating partnership, but generally excluding our TRSs, that is deemed to be inventory or property held primarily for sale to customers in the ordinary course of a trade or business. Whether property is inventory or otherwise held primarily for sale to customers in the ordinary course of a trade or business depends on the particular facts and circumstances surrounding each property. While we qualify as a REIT, we intend to avoid the 100% prohibited transaction tax by (a) conducting activities that may otherwise be considered prohibited transactions through a TRS (but such TRS will incur corporate rate income taxes with respect to any income or gain recognized by it), (b) conducting our operations in such a manner so that no sale or other disposition of an asset we own, directly or through any subsidiary, will be treated as a prohibited transaction or (c) structuring certain dispositions of our properties to comply with the requirements of the prohibited transaction safe harbor available under the Code for properties that, among other requirements have been held for at least two years. However, despite our present intention, no assurance can be given that any particular property we own, directly or through any subsidiary entity, including our operating partnership, but generally excluding our TRSs, will not be treated as inventory or property held primarily for sale to customers in the ordinary course of a trade or business.
Our TRSs are subject to corporate-level taxes and our dealings with our TRSs may be subject to 100% excise tax.
A REIT may own up to 100% of the stock of one or more TRSs. Both the subsidiary and the REIT must jointly elect to treat the subsidiary as a TRS. A corporation of which a TRS directly or indirectly owns more than 35% of the voting power or value of the stock will automatically be treated as a TRS. Overall, no more than 25% of the value of a REIT’s assets may consist of stock or securities of one or more TRSs.
A TRS may hold assets and earn income that would not be qualifying assets or income if held or earned directly by a REIT, including gross income from operations pursuant to management contracts. We may use TRSs generally to hold properties for sale in the ordinary course of business or to hold assets or conduct activities that we cannot conduct directly as a REIT. Our TRSs will be subject to applicable U.S. federal, state, local and foreign income tax on its taxable income. In addition, the TRS rules limits the deductibility of interest paid or accrued by a TRS to its parent REIT to assure that the TRS is subject to an appropriate level of corporate taxation. The rules which are applicable to us as a REIT also impose a 100% excise tax on certain transactions between a TRS and its parent REIT that are not conducted on an arm’s-length basis.
If our operating partnership failed to qualify as a partnership or was not otherwise disregarded for U.S. federal income tax purposes, we would cease to qualify as a REIT.
We intend to maintain the status of our operating partnership as a partnership for U.S. federal income tax purposes. However, if the IRS were to successfully challenge the status of our operating partnership as a partnership for such purposes, it would be taxable as a corporation. In such event, this would reduce the amount of dividends that our operating partnership could make to us. This would also result in our failing to qualify as a REIT, and becoming subject to a corporate level tax on our income. This substantially would reduce our cash available to pay dividends and the yield on our stockholders’ investments. In addition, if any of the partnerships or limited liability companies through which our operating partnership owns its properties, in whole or in part, loses its characterization as a partnership and is otherwise not disregarded for U.S. federal income tax purposes, it would be subject to taxation as a corporation, thereby reducing dividends to the operating partnership. Such a recharacterization of an underlying property owner could also threaten our ability to maintain our REIT qualification.
We may choose to make distributions in our own stock, in which case stockholders may be required to pay U.S. federal income taxes in excess of the cash dividends stockholders receive.
In connection with our qualification as a REIT, we are required to distribute annually to our stockholders at least 90% of our REIT taxable income (which does not equal net income as calculated in accordance with U.S. GAAP), determined without regard to the deduction for dividends paid and excluding net capital gain. In order to satisfy this requirement, we may make
54
Table of Contents
distributions that are payable in cash and/or shares of our common stock (which could account for up to 80% of the aggregate amount of such distributions) at the election of each stockholder. Taxable stockholders receiving such distributions will be required to include the full amount of such distributions as ordinary dividend income to the extent of our current or accumulated earnings and profits, as determined for U.S. federal income tax purposes. As a result, U.S. stockholders may be required to pay U.S. federal income taxes with respect to such distributions in excess of the cash portion of the distribution received. Accordingly, U.S. stockholders receiving a distribution of our shares may be required to sell shares received in such distribution or may be required to sell other stock or assets owned by them, at a time that may be disadvantageous, in order to satisfy any tax imposed on such distribution. If a U.S. stockholder sells the stock that it receives as part of the distribution in order to pay this tax, the sales proceeds may be less than the amount included in income with respect to the distribution, depending on the market price of our stock at the time of the sale. Furthermore, with respect to certain non-U.S. stockholders, we may be required to withhold U.S. tax with respect to such distribution, including in respect of all or a portion of such distribution that is payable in stock, by withholding or disposing of part of the shares included in such distribution and using the proceeds of such disposition to satisfy the withholding tax imposed. In addition, if a significant number of our stockholders determine to sell shares of our common stock in order to pay taxes owed on dividend income, such sale may put downward pressure on the market price of our common stock.
Various tax aspects of such a taxable cash/stock distribution are uncertain and have not yet been addressed by the IRS. No assurance can be given that the IRS will not impose requirements in the future with respect to taxable cash/stock distributions, including on a retroactive basis, or assert that the requirements for such taxable cash/stock distributions have not been met.
The taxation of distributions to our stockholders can be complex; however, dividends that we make to our stockholders generally will be taxable as ordinary income.
Dividends that we make to our taxable stockholders out of current and accumulated earnings and profits (and not designated as capital gain dividends or qualified dividend income) generally will be taxable as ordinary income. However, a portion of our dividends may (1) be designated by us as capital gain dividends generally taxable as long-term capital gain to the extent that they are attributable to net capital gain recognized by us, (2) be designated by us as qualified dividend income generally to the extent they are attributable to dividends we receive from our TRSs, or (3) constitute a return of capital generally to the extent that they exceed our accumulated earnings and profits as determined for U.S. federal income tax purposes. A return of capital is not taxable, but has the effect of reducing the basis of a stockholder’s investment in our common stock.
Dividends payable by REITs generally do not qualify for the reduced tax rates available for some dividends.
Currently, the maximum tax rate applicable to qualified dividend income payable to U.S. stockholders that are individuals, trusts and estates is 20%. Dividends payable by REITs, however, generally are not eligible for this reduced rate. Although this does not adversely affect the taxation of REITs or dividends payable by REITs, the more favorable rates applicable to regular corporate qualified dividends could cause investors who are individuals, trusts and estates to perceive investments in REITs to be relatively less attractive than investments in the stocks of non-REIT corporations that pay dividends, which could adversely affect the value of the shares of REITs, including our common stock. Tax rates could be changed in future legislation.
If we were considered to actually or constructively pay a “preferential dividend” to certain of our stockholders, our status as a REIT could be adversely affected.
In order to qualify as a REIT, we must distribute annually to our stockholders at least 90% of our REIT taxable income (which does not equal net income as calculated in accordance with U.S. GAAP), determined without regard to the deduction for dividends paid and excluding net capital gain. In order for distributions to be counted as satisfying the annual distribution requirements for REITs, and to provide us with a REIT-level tax deduction, the distributions must not be “preferential dividends.” A dividend is not a preferential dividend if the distribution is pro rata among all outstanding shares of stock within a particular class, and in accordance with the preferences among different classes of stock as set forth in our organizational documents. Currently, there is uncertainty as to the IRS’s position regarding whether certain arrangements that REITs have with their stockholders could give rise to the inadvertent payment of a preferential dividend (e.g., the pricing methodology for stock purchased under a distribution reinvestment plan inadvertently causing a greater than 5% discount on the price of such stock
55
Table of Contents
purchased). While we believe that our operations have been structured in such a manner that we will not be treated as inadvertently paying preferential dividends, there is no de minimis exception with respect to preferential dividends. Therefore, if the IRS were to take the position that we inadvertently paid a preferential dividend, we may be deemed either to (a) have distributed less than 100% of our REIT taxable income and be subject to tax on the undistributed portion, or (b) have distributed less than 90% of our REIT taxable income and our status as a REIT could be terminated for the year in which such determination is made if we were unable to cure such failure.
Complying with REIT requirements may limit our ability to hedge our liabilities effectively and may cause us to incur tax liabilities.
The REIT provisions of the Code may limit our ability to hedge our liabilities. Any income from a hedging transaction we enter into to manage risk of interest rate changes, price changes or currency fluctuations with respect to borrowings made or to be made to acquire or carry real estate assets, if properly identified under applicable Treasury Regulations, does not constitute “gross income” for purposes of the 75% or 95% gross income tests. To the extent that we enter into other types of hedging transactions, the income from those transactions will likely be treated as non-qualifying income for purposes of both of the gross income tests. As a result of these rules, we may need to limit our use of advantageous hedging techniques or implement those hedges through a TRS. This could increase the cost of our hedging activities because our TRSs would be subject to tax on gains or expose us to greater risks associated with changes in interest rates than we would otherwise want to bear. In addition, losses in a TRS generally will not provide any tax benefit, except for being carried forward against future taxable income of such TRS.
Complying with REIT requirements may force us to forgo or liquidate otherwise attractive investment opportunities.
To qualify as a REIT, we must ensure that we meet the REIT gross income tests annually and that at the end of each calendar quarter, at least 75% of the value of our assets consists of cash, cash items, government securities and qualified REIT real estate assets, including certain mortgage loans and certain kinds of mortgage-related securities. The remainder of our investment in securities (other than government securities and qualified real estate assets) generally cannot include more than 10% of the outstanding voting securities of any one issuer or more than 10% of the total value of the outstanding securities of any one issuer. In addition, in general, no more than 5% of the value of our assets (other than government securities and qualified real estate assets) can consist of the securities of any one issuer, and no more than 25% of the value of our total assets can be represented by securities of one or more TRSs. If we fail to comply with these requirements at the end of any calendar quarter, we must correct the failure within 30 days after the end of the calendar quarter or qualify for certain statutory relief provisions to avoid losing our REIT qualification and suffering adverse tax consequences. As a result, we may be required to liquidate assets from our portfolio or not make otherwise attractive investments in order to maintain our qualification as a REIT. These actions could have the effect of reducing our income and amounts available for dividend to our stockholders.
The ability of our board of directors to revoke our REIT qualification without stockholder approval may subject us to U.S. federal income tax and reduce dividends to our stockholders.
Our charter provides that our board of directors may revoke or otherwise terminate our REIT election, without the approval of our stockholders, if it determines that it is no longer in our best interest to continue to qualify as a REIT. While we elected to be qualified to be taxed as a REIT, we may terminate our REIT election if we determine that qualifying as a REIT is no longer in the best interests of our stockholders. If we cease to be a REIT, we would become subject to U.S. federal income tax on our taxable income and would no longer be required to distribute most of our taxable income to our stockholders, which may have adverse consequences on our total return to our stockholders and on the market price of our common stock.
56
Table of Contents
We may be subject to adverse legislative or regulatory tax changes that could increase our tax liability, reduce our operating flexibility and reduce the market price of our common stock.
In recent years, numerous legislative, judicial and administrative changes have been made in the provisions of U.S. federal income tax laws applicable to investments similar to an investment in shares of our common stock. Additional changes to the tax laws are likely to continue to occur, and we cannot assure our stockholders that any such changes will not adversely affect the taxation of a stockholder. Any such changes could have an adverse effect on an investment in our shares or on the market value or the resale potential of our assets. Our stockholders are urged to consult with their tax advisor with respect to the impact of recent legislation on their investment in our shares and the status of legislative, regulatory or administrative developments and proposals and their potential effect on an investment in our shares. Our stockholders should also note that our counsel’s tax opinion is based upon existing law, applicable as of the date of its opinion, all of which will be subject to change, either prospectively or retroactively.
Although REITs generally receive better tax treatment than entities taxed as regular corporations, it is possible that future legislation would result in a REIT having fewer tax advantages, and it could become more advantageous for a company that invests in real estate to elect to be treated for U.S. federal income tax purposes as a corporation. As a result, our charter provides our board of directors with the power, under certain circumstances, to revoke or otherwise terminate our REIT election and cause us to be taxed as a regular corporation, without the vote of our stockholders. Our board of directors has fiduciary duties to us and our stockholders and could only cause such changes in our tax treatment if it determines in good faith that such changes are in the best interest of our stockholders.
The share ownership restrictions of the Code for REITs and the 9.8% share ownership limit in our charter may inhibit market activity in our shares of stock and restrict our business combination opportunities.
In order to qualify as a REIT, five or fewer individuals, as defined in the Code, may not own, actually or constructively, more than 50% in value of our issued and outstanding shares of stock at any time during the last half of each taxable year, other than the first year for which a REIT election is made. Attribution rules in the Code determine if any individual or entity actually or constructively owns our shares of stock under this requirement. Additionally, at least 100 persons must beneficially own our shares of stock during at least 335 days of a taxable year for each taxable year, other than the first year for which a REIT election is made. To help insure that we meet these tests, among other purposes, our charter restricts the acquisition and ownership of our shares of stock.
Our charter, with certain exceptions, authorizes our directors to take such actions as are necessary and desirable to preserve our qualification as a REIT while we so qualify. Unless exempted by our board of directors, for so long as we qualify as a REIT, our charter prohibits, among other limitations on ownership and transfer of shares of our stock, any person from beneficially or constructively owning (applying certain attribution rules under the Code) more than 9.8% in value of the aggregate of our outstanding shares of stock and more than 9.8% (in value or in number of shares, whichever is more restrictive) of any class or series of our shares of stock. Our board of directors may not grant an exemption from these restrictions to any proposed transferee whose ownership in excess of the 9.8% ownership limit would result in the termination of our qualification as a REIT. These restrictions on transferability and ownership will not apply, however, if our board of directors determines that it is no longer in our best interest to continue to qualify as a REIT or that compliance with the restrictions is no longer required in order for us to continue to so qualify as a REIT.
These ownership limits could delay or prevent a transaction or a change in control that might involve a premium price for our common stock or otherwise be in the best interest of the stockholders.
Non-U.S. stockholders will be subject to U.S. federal withholding tax and may be subject to U.S. federal income tax on dividends received from us and upon the disposition of our shares.
Subject to certain exceptions, dividends received from us will be treated as dividends of ordinary income to the extent of our current or accumulated earnings and profits. Such dividends ordinarily will be subject to U.S. withholding tax at a 30% rate, or such lower rate as may be specified by an applicable income tax treaty, unless the dividends are treated as “effectively connected” with the conduct by the non-U.S. stockholder of a U.S. trade or business. Pursuant to the Foreign Investment in Real Property Tax Act of 1980, or FIRPTA, capital gain dividends attributable to sales or exchanges of “U.S. real property
57
Table of Contents
interests,” or USRPIs, generally will be taxed to a non-U.S. stockholder as if such gain were effectively connected with a U.S. trade or business. However, a capital gain dividend will not be treated as effectively connected income if (a) the dividend is received with respect to a class of stock that is regularly traded on an established securities market located in the United States; and (b) the non-U.S. stockholder does not own more than 5% of the class of our stock at any time during the one year period ending on the date the dividend is received. We anticipate that our shares will be “regularly traded” on an established securities market for the foreseeable future, although, no assurance can be given that this will be the case.
Gain recognized by a non-U.S. stockholder upon the sale or exchange of our common stock generally will not be subject to U.S. federal income taxation unless such stock constitutes a USRPI under FIRPTA. Our common stock will not constitute a USRPI so long as we are a “domestically-controlled qualified investment entity.” A domestically-controlled qualified investment entity includes a REIT if at all times during a specified testing period, less than 50% in value of such REIT’s stock is held directly or indirectly by non-U.S. stockholders. We believe, but cannot assure our stockholders, that we will be a domestically-controlled qualified investment entity, and because our common stock will be publicly traded, no assurance can be given that we will be a domestically-controlled qualified investment entity.
Even if we do not qualify as a domestically-controlled qualified investment entity at the time a non-U.S. stockholder sells or exchanges our common stock, gain arising from such a sale or exchange would not be subject to U.S. taxation under FIRPTA as a sale of a USRPI if: (a) our common stock is “regularly traded,” as defined by applicable Treasury regulations, on an established securities market, and (b) such non-U.S. stockholder owned, actually and constructively, 5% or less of our common stock at any time during the five-year period ending on the date of the sale. We encourage our stockholders to consult their tax advisor to determine the tax consequences applicable to them if they are non-U.S. stockholders.
Potential characterization of dividends or gain on sale may be treated as unrelated business taxable income to tax-exempt investors.
If (a) we are a “pension-held REIT,” (b) a tax-exempt stockholder has incurred (or is deemed to have incurred) debt to purchase or hold our common stock, or (c) a holder of common stock is a certain type of tax-exempt stockholder, dividends on, and gains recognized on the sale of, common stock by such tax-exempt stockholder may be subject to U.S. federal income tax as unrelated business taxable income under the Code.
Item 1B. Unresolved Staff Comments
None.
General
As of December 31, 2013, after giving effect to the properties owned by ARCT IV which we acquired on January 3, 2014, we owned 2,559 properties, comprised of 43.8 million square feet and located in 49 states, the District of Columbia and Puerto Rico, excluding one vacant property classified as held for sale. Our properties were 99% occupied with a weighted-average remaining lease term of 9.4 years as of December 31, 2013.
58
Table of Contents
Industry Distribution (As Restated)
The following table details the industry distribution of our portfolio as of December 31, 2013 (dollars in thousands):
| Industry |
Number of Leases |
Square Feet | Square Feet as a % of Total Portfolio |
Annualized Rental Income |
Annualized Rental Income as a % of Total Portfolio |
|||||||||||||||
| Administrative & Support Services - Employment & Office Maintenance |
2 | 129,999 | 0.3 | % | $ | 504 | 0.1 | % | ||||||||||||
| Agricultural - Crop Farming |
1 | 107,520 | 0.3 | % | 770 | 0.1 | % | |||||||||||||
| Billboard |
5 | — | — | % | 46 | — | % | |||||||||||||
| Education - Other |
1 | 194,665 | 0.4 | % | 1,734 | 0.3 | % | |||||||||||||
| Entertainment & Recreation - Fitness |
1 | 45,906 | 0.1 | % | 1,319 | 0.2 | % | |||||||||||||
| Finance - Banking |
263 | 1,643,951 | 3.8 | % | 38,717 | 7.0 | % | |||||||||||||
| Finance - Credit Card & Consumer Lending |
6 | 350,948 | 0.8 | % | 5,424 | 1.0 | % | |||||||||||||
| Finance - Investment, Securities & Commodity |
6 | 555,860 | 1.3 | % | 9,927 | 1.8 | % | |||||||||||||
| Government & Public Services - Other |
21 | 663,031 | 1.5 | % | 18,544 | 3.3 | % | |||||||||||||
| Healthcare - Dental |
2 | 5,834 | — | % | 100 | — | % | |||||||||||||
| Healthcare - Emergency & Medical Centers |
38 | 496,645 | 1.1 | % | 9,091 | 1.6 | % | |||||||||||||
| Healthcare - Labratories & Diagnostics |
2 | 243,117 | 0.6 | % | 3,077 | 0.6 | % | |||||||||||||
| Healthcare - Medical |
1 | 22,708 | 0.1 | % | 506 | 0.1 | % | |||||||||||||
| Healthcare - Other |
1 | 227,467 | 0.5 | % | 3,347 | 0.6 | % | |||||||||||||
| Information & Communications - Telecommunications |
5 | 399,653 | 0.9 | % | 6,915 | 1.3 | % | |||||||||||||
| Insurance - Life |
3 | 131,113 | 0.3 | % | 2,215 | 0.4 | % | |||||||||||||
| Insurance - Medical |
1 | 100,352 | 0.2 | % | 4,233 | 0.8 | % | |||||||||||||
| Insurance - Property |
10 | 977,675 | 2.2 | % | 13,787 | 2.5 | % | |||||||||||||
| Logistics - Packaging |
1 | 221,035 | 0.5 | % | 1,480 | 0.3 | % | |||||||||||||
| Logistics - Postal & Delivery Services |
43 | 2,605,673 | 5.9 | % | 26,498 | 4.8 | % | |||||||||||||
| Manufacturing - Aircraft & Aerospace |
5 | 875,083 | 2.0 | % | 14,694 | 2.7 | % | |||||||||||||
| Manufacturing - Consumer Products |
10 | 4,440,909 | 10.1 | % | 13,755 | 2.5 | % | |||||||||||||
| Manufacturing - Food |
6 | 3,892,811 | 8.9 | % | 18,986 | 3.4 | % | |||||||||||||
| Manufacturing - Machinery & Heavy Equipment |
1 | 552,960 | 1.3 | % | 2,353 | 0.4 | % | |||||||||||||
| Manufacturing - Medical |
4 | 409,051 | 0.9 | % | 7,453 | 1.3 | % | |||||||||||||
| Manufacturing - Motor Vehicle |
2 | 957,042 | 2.2 | % | 3,828 | 0.7 | % | |||||||||||||
| Manufacturing - Other |
1 | 307,275 | 0.7 | % | 2,340 | 0.4 | % | |||||||||||||
| Mining & Natural Resources - Petroleum, Gas & Coal |
1 | 308,586 | 0.7 | % | 5,338 | 1.0 | % | |||||||||||||
| Other Services - Automotive |
2 | 11,518 | — | % | 234 | — | % | |||||||||||||
| Other Services - Beauty Salons & Spas |
1 | 1,288 | — | % | 21 | — | % | |||||||||||||
| Other Services - Non-Profit Organizations |
1 | 9,513 | — | % | 228 | — | % | |||||||||||||
| Other Services - Other |
1 | 150,000 | 0.3 | % | 1,056 | 0.2 | % | |||||||||||||
| Parking |
1 | 8,400 | — | % | 1 | — | % | |||||||||||||
| Professional Services - Administrative & Management Consulting |
6 | 1,458,581 | 3.3 | % | 20,638 | 3.7 | % | |||||||||||||
| Professional Services - Advertising |
16 | 558,036 | 1.3 | % | 6,236 | 1.1 | % | |||||||||||||
| Professional Services - Media |
2 | 216,285 | 0.5 | % | 2,817 | 0.5 | % | |||||||||||||
| Professional Services - Other |
1 | 16,352 | — | % | 313 | 0.1 | % | |||||||||||||
| Professional Services - Research & Development |
1 | 223,912 | 0.5 | % | 695 | 0.1 | % | |||||||||||||
| Restaurants - Casual Dining |
214 | 1,395,247 | 3.2 | % | 39,584 | 7.1 | % | |||||||||||||
59
Table of Contents
| Industry |
Number of Leases |
Square Feet | Square Feet as a % of Total Portfolio |
Annualized Rental Income |
Annualized Rental Income as a % of Total Portfolio |
|||||||||||||||
| Restaurants - Family Dining |
104 | 543,271 | 1.2 | % | 13,022 | 2.4 | % | |||||||||||||
| Restaurants - Premium Dining |
1 | 9,354 | — | % | 98 | — | % | |||||||||||||
| Restaurants - Quick Service Restaurant |
1,095 | 3,427,178 | 7.8 | % | 98,262 | 17.7 | % | |||||||||||||
| Retail - Apparel & Jewelry |
3 | 1,324,855 | 3.0 | % | 12,843 | 2.3 | % | |||||||||||||
| Retail - Automotive |
68 | 516,771 | 1.2 | % | 7,809 | 1.4 | % | |||||||||||||
| Retail - Department Stores |
1 | 88,408 | 0.2 | % | 858 | 0.2 | % | |||||||||||||
| Retail - Discount |
425 | 4,850,625 | 11.2 | % | 41,806 | 7.5 | % | |||||||||||||
| Retail - Gas & Convenience |
37 | 160,850 | 0.4 | % | 8,553 | 1.5 | % | |||||||||||||
| Retail - Grocery & Supermarket |
17 | 2,112,054 | 4.8 | % | 15,831 | 2.9 | % | |||||||||||||
| Retail - Home & Garden |
18 | 3,247,129 | 7.4 | % | 20,707 | 3.7 | % | |||||||||||||
| Retail - Home Furnishings |
22 | 136,396 | 0.3 | % | 3,896 | 0.7 | % | |||||||||||||
| Retail - Pharmacy |
109 | 1,457,596 | 3.3 | % | 36,000 | 6.5 | % | |||||||||||||
| Retail - Specialty (Other) |
2 | 315,230 | 0.7 | % | 1,920 | 0.4 | % | |||||||||||||
| Retail - Sporting Goods |
5 | 292,645 | 0.7 | % | 3,459 | 0.6 | % | |||||||||||||
| Retail - Warehouse Clubs |
1 | 108,532 | 0.3 | % | 883 | 0.2 | % | |||||||||||||
| Utilities - Power Generation |
1 | 9,353 | — | % | 239 | — | % | |||||||||||||
| Vacant |
— | 318,245 | 0.8 | % | — | — | % | |||||||||||||
|
|
|
|
|
|
|
|
|
|
|
|||||||||||
| 2,598 | 43,834,493 | 100.0 | % | $ | 554,990 | 100.0 | % | |||||||||||||
|
|
|
|
|
|
|
|
|
|
|
|||||||||||
Geographical Distribution
The following table details the geographic distribution of our portfolio as of December 31, 2013 (dollars in thousands):
| State/Possession |
Number of Properties |
Square Feet | Square Feet as a % of Total Portfolio |
Annualized Rental Income |
Annualized Rental Income as a % of Total Portfolio |
|||||||||||||||
| Alabama |
100 | 985,161 | 2.2 | % | $ | 20,873 | 3.8 | % | ||||||||||||
| Alaska |
1 | 2,805 | — | % | 121 | — | % | |||||||||||||
| Arizona |
30 | 196,128 | 0.4 | % | 4,481 | 0.8 | % | |||||||||||||
| Arkansas |
71 | 506,813 | 1.2 | % | 5,142 | 0.9 | % | |||||||||||||
| California |
37 | 2,931,471 | 6.7 | % | 28,769 | 5.2 | % | |||||||||||||
| Colorado |
29 | 738,801 | 1.7 | % | 13,923 | 2.5 | % | |||||||||||||
| Connecticut |
15 | 60,437 | 0.1 | % | 1,922 | 0.3 | % | |||||||||||||
| Delaware |
4 | 12,369 | — | % | 286 | 0.1 | % | |||||||||||||
| District of Columbia |
1 | 3,210 | — | % | 44 | — | % | |||||||||||||
| Florida |
149 | 2,209,983 | 5.0 | % | 32,125 | 5.8 | % | |||||||||||||
| Georgia |
133 | 980,469 | 2.2 | % | 17,263 | 3.1 | % | |||||||||||||
| Idaho |
14 | 101,853 | 0.2 | % | 3,429 | 0.6 | % | |||||||||||||
| Illinois |
100 | 2,285,588 | 5.2 | % | 35,092 | 6.3 | % | |||||||||||||
| Indiana |
69 | 3,994,003 | 9.1 | % | 24,799 | 4.5 | % | |||||||||||||
| Iowa |
32 | 824,716 | 1.9 | % | 6,278 | 1.1 | % | |||||||||||||
| Kansas |
34 | 1,654,772 | 3.8 | % | 11,094 | 2.0 | % | |||||||||||||
| Kentucky |
56 | 1,260,977 | 2.9 | % | 11,625 | 2.1 | % | |||||||||||||
| Louisiana |
60 | 492,457 | 1.1 | % | 9,507 | 1.7 | % | |||||||||||||
| Maine |
5 | 298,114 | 0.7 | % | 3,909 | 0.7 | % | |||||||||||||
| Maryland |
15 | 502,064 | 1.1 | % | 3,775 | 0.7 | % | |||||||||||||
| Massachusetts |
29 | 1,148,866 | 2.6 | % | 11,722 | 2.1 | % | |||||||||||||
60
Table of Contents
| State/Possession |
Number of Properties |
Square Feet | Square Feet as a % of Total Portfolio |
Annualized Rental Income |
Annualized Rental Income as a % of Total Portfolio |
|||||||||||||||
| Michigan |
121 | 1,100,961 | 2.5 | % | $ | 19,636 | 3.5 | % | ||||||||||||
| Minnesota |
24 | 300,507 | 0.7 | % | 2,643 | 0.5 | % | |||||||||||||
| Mississippi |
51 | 1,423,664 | 3.2 | % | 9,965 | 1.8 | % | |||||||||||||
| Missouri |
115 | 1,128,639 | 2.6 | % | 13,616 | 2.5 | % | |||||||||||||
| Montana |
5 | 55,377 | 0.1 | % | 795 | 0.1 | % | |||||||||||||
| Nebraska |
12 | 650,154 | 1.5 | % | 6,494 | 1.2 | % | |||||||||||||
| Nevada |
14 | 116,743 | 0.3 | % | 2,628 | 0.5 | % | |||||||||||||
| New Hampshire |
13 | 94,237 | 0.2 | % | 1,885 | 0.3 | % | |||||||||||||
| New Jersey |
14 | 615,352 | 1.4 | % | 12,653 | 2.3 | % | |||||||||||||
| New Mexico |
26 | 161,456 | 0.4 | % | 4,295 | 0.8 | % | |||||||||||||
| New York |
56 | 555,634 | 1.3 | % | 12,619 | 2.3 | % | |||||||||||||
| North Carolina |
110 | 1,616,820 | 3.7 | % | 20,004 | 3.6 | % | |||||||||||||
| North Dakota |
5 | 39,248 | 0.1 | % | 1,052 | 0.2 | % | |||||||||||||
| Ohio |
145 | 2,933,976 | 6.7 | % | 22,740 | 4.1 | % | |||||||||||||
| Oklahoma |
37 | 769,462 | 1.8 | % | 9,829 | 1.8 | % | |||||||||||||
| Oregon |
12 | 54,677 | 0.1 | % | 679 | 0.1 | % | |||||||||||||
| Pennsylvania |
111 | 3,098,552 | 7.1 | % | 34,789 | 6.3 | % | |||||||||||||
| Puerto Rico |
3 | 87,550 | 0.2 | % | 2,429 | 0.4 | % | |||||||||||||
| Rhode Island |
13 | 161,642 | 0.4 | % | 3,260 | 0.6 | % | |||||||||||||
| South Carolina |
78 | 812,541 | 1.9 | % | 10,749 | 1.9 | % | |||||||||||||
| South Dakota |
5 | 84,414 | 0.2 | % | 781 | 0.1 | % | |||||||||||||
| Tennessee |
95 | 787,940 | 1.8 | % | 13,933 | 2.5 | % | |||||||||||||
| Texas |
312 | 3,795,939 | 8.7 | % | 59,481 | 10.7 | % | |||||||||||||
| Utah |
6 | 23,527 | 0.1 | % | 692 | 0.1 | % | |||||||||||||
| Vermont |
4 | 15,432 | — | % | 336 | 0.1 | % | |||||||||||||
| Virginia |
73 | 1,011,320 | 2.3 | % | 18,842 | 3.4 | % | |||||||||||||
| Washington |
13 | 405,633 | 0.9 | % | 8,660 | 1.6 | % | |||||||||||||
| West Virginia |
33 | 167,244 | 0.4 | % | 3,440 | 0.6 | % | |||||||||||||
| Wisconsin |
60 | 516,631 | 1.2 | % | 8,735 | 1.6 | % | |||||||||||||
| Wyoming |
9 | 58,164 | 0.1 | % | 1,151 | 0.2 | % | |||||||||||||
|
|
|
|
|
|
|
|
|
|
|
|||||||||||
| 2,559 | 43,834,493 | 100.0 | % | $ | 554,990 | 100.0 | % | |||||||||||||
|
|
|
|
|
|
|
|
|
|
|
|||||||||||
Property Type
The following table details the property type of our portfolio as of December 31, 2013 (dollars in thousands):
| Property Type |
Number of Properties |
Square Feet | Square Feet as a % of Total Portfolio |
Annualized Rental Income |
Annualized Rental Income as a % of Total Portfolio |
|||||||||||||||
| Retail |
2,381 | 15,026,368 | 34.3 | % | $ | 301,524 | 54.3 | % | ||||||||||||
| Office |
102 | 9,006,915 | 20.6 | % | 145,060 | 26.1 | % | |||||||||||||
| Distribution |
66 | 19,561,645 | 44.6 | % | 106,830 | 19.3 | % | |||||||||||||
| Parking Lot |
1 | 8,400 | — | % | 1 | — | % | |||||||||||||
| Billboard |
5 | — | — | % | 48 | — | % | |||||||||||||
| Industrial |
4 | 231,165 | 0.5 | % | 1,527 | 0.3 | % | |||||||||||||
|
|
|
|
|
|
|
|
|
|
|
|||||||||||
| 2,559 | 43,834,493 | 100.0 | % | $ | 554,990 | 100.0 | % | |||||||||||||
|
|
|
|
|
|
|
|
|
|
|
|||||||||||
61
Table of Contents
Property Financing
Our mortgage notes payable consist of the following as of December 31, 2013 and 2012 (dollar amounts in thousands):
| Encumbered Properties | Outstanding Loan Amount | Weighted-Average Effective Interest Rate (1) |
Weighted-Average Maturity (2) |
|||||||||||||
| December 31, 2013 |
177 | $ | 1,258,661 | 3.42 | % | 3.41 | ||||||||||
| December 31, 2012 |
164 | $ | 265,118 | 4.28 | % | 5.51 | ||||||||||
| (1) | Mortgage notes payable have fixed rates or are fixed by way of interest rate swap arrangements. Effective interest rates range from 1.83% to 6.28% at December 31, 2013 and 3.32% to 6.13% at December 31, 2012. |
| (2) | Weighted-average remaining years until maturity as of December 31, 2013 and 2012, respectively. |
As part of the CapLease Merger, we assumed a secured credit facility with Wells Fargo, National Association (the “Secured Credit Facility”), which had commitments of up to $150.0 million at December 31, 2013. The Secured Credit Facility was fully drawn with $150.0 million outstanding at December 31, 2013.
The borrowings under the Secured Credit Facility bear interest at an annual rate of one-month LIBOR or LIBOR based on an interest period of one, three or six months, at our election, plus an applicable margin of 2.75%, payable quarterly in arrears. The Secured Credit Facility matures on December 31, 2014 and may be prepaid, in whole or in part, without premium or penalty, at our option, at any time.
In addition, we have financing, which is not secured by interests in real property, which is described under Item 7. Management’s Discussion and Analysis of Financial Condition and Results of Operations.
Future Minimum Lease Payments
The following table presents future minimum base rental cash payments due to us over the next 10 years. These amounts exclude contingent rent payments, as applicable, that may be collected from certain tenants based on provisions related to sales thresholds and increases in annual rent based on exceeding certain economic indexes among other items (amounts in thousands):
| Future Minimum Base Rent Payments |
||||
| 2014 |
$ | 527,965 | ||
| 2015 |
517,861 | |||
| 2016 |
501,637 | |||
| 2017 |
464,615 | |||
| 2018 |
428,389 | |||
| 2019 |
399,486 | |||
| 2020 |
378,893 | |||
| 2021 |
347,657 | |||
| 2022 |
318,967 | |||
| 2023 |
263,388 | |||
| Thereafter |
1,036,460 | |||
|
|
|
|||
| $ | 5,185,318 | |||
|
|
|
|||
62
Table of Contents
Future Lease Expirations
The following is a summary of lease expirations for the next 10 years at the properties we own as of December 31, 2013 (dollar amounts in thousands):
| Year of Expiration |
Number of Leases Expiring |
Square Feet | Square Feet as a % of Total Portfolio |
Annualized Rental Income Expiring |
Annualized Rental Income Expiring as a % of Total Portfolio |
|||||||||||||||
| 2014 |
95 | 1,312,901 | 3.00 | % | $ | 13,519 | 2.44 | % | ||||||||||||
| 2015 |
134 | 1,949,644 | 4.45 | % | 22,094 | 3.98 | % | |||||||||||||
| 2016 |
122 | 1,798,220 | 4.10 | % | 27,373 | 4.93 | % | |||||||||||||
| 2017 |
225 | 4,363,294 | 9.95 | % | 51,443 | 9.27 | % | |||||||||||||
| 2018 |
189 | 1,842,608 | 4.20 | % | 28,955 | 5.22 | % | |||||||||||||
| 2019 |
115 | 970,126 | 2.21 | % | 23,806 | 4.29 | % | |||||||||||||
| 2020 |
128 | 1,511,798 | 3.45 | % | 26,845 | 4.84 | % | |||||||||||||
| 2021 |
103 | 3,204,582 | 7.31 | % | 30,108 | 5.42 | % | |||||||||||||
| 2022 |
180 | 6,786,771 | 15.48 | % | 52,309 | 9.43 | % | |||||||||||||
| 2023 |
132 | 3,726,446 | 8.50 | % | 40,485 | 7.29 | % | |||||||||||||
|
|
|
|
|
|
|
|
|
|
|
|||||||||||
| 1,423 | 27,466,390 | 62.65 | % | $ | 316,937 | 57.11 | % | |||||||||||||
|
|
|
|
|
|
|
|
|
|
|
|||||||||||
Item 3. Legal Proceedings (As Restated)
The information contained in Note 16 – Commitments and Contingencies – “Litigation” of our notes to consolidated financial statements included in this Form 10-K/A is incorporated by reference into this Item 3. Also, refer to Note 24 – Subsequent Events (As Restated) included in this Form 10-K/A for further discussion on legal proceedings.
Item 4. Mine Safety Disclosures
Not applicable.
63
Table of Contents
Item 5. Market for Registrant’s Common Equity, Related Stockholder Matters and Issuer Purchases of Equity Securities. (As Restated)
Market Information
Our common stock is currently traded on the NASDAQ under the symbol “ARCP”. Set forth below is a line graph comparing the cumulative total stockholder return on our common stock, based on the market price of the common stock and assuming reinvestment of dividends, with the FTSE National Association of Real Estate Investment Trusts Equity Index (“NAREIT”) and the S&P 500 Index (“S&P 500”) for the period commencing September 6, 2011, the date of our IPO, and ending December 31, 2013. The graph assumes an investment of $100 on September 6, 2011.
Comparison to Cumulative Total Return
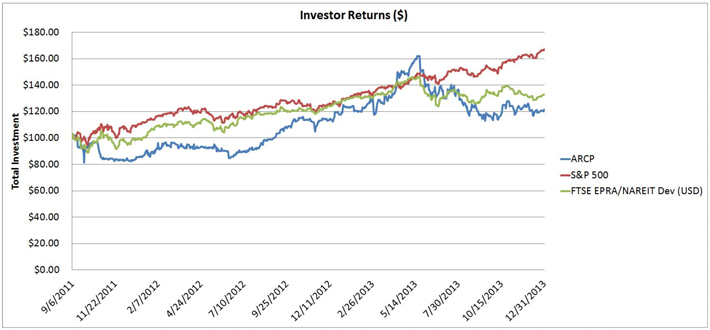
For each calendar quarter indicated, the following table reflects respective high, low and closing sales prices for the common stock as quoted by NASDAQ and the dividends paid per share in each such period:
| First Quarter 2012 |
Second Quarter 2012 |
Third Quarter 2012 |
Fourth Quarter 2012 |
First Quarter 2013 |
Second Quarter 2013 |
Third Quarter 2013 |
Fourth Quarter 2013 |
|||||||||||||||||||||||||
| High |
$ | 11.65 | $ | 11.34 | $ | 12.50 | $ | 13.48 | $ | 14.92 | $ | 18.05 | $ | 15.36 | $ | 13.94 | ||||||||||||||||
| Low |
$ | 10.39 | $ | 10.00 | $ | 10.43 | $ | 11.94 | $ | 12.45 | $ | 13.99 | $ | 12.13 | $ | 12.16 | ||||||||||||||||
| Close |
$ | 11.34 | $ | 10.40 | $ | 12.50 | $ | 13.24 | $ | 14.67 | $ | 15.26 | $ | 12.20 | $ | 12.85 | ||||||||||||||||
| Dividends paid per share |
$ | 0.219 | $ | 0.220 | $ | 0.222 | $ | 0.223 | $ | 0.225 | $ | 0.226 | $ | 0.228 | $ | 0.230 | ||||||||||||||||
Holders
As of February 25, 2014, we had 766,128,817 shares of common stock outstanding held by 9,449 stockholders of record.
Dividends
We have elected to qualify as a REIT for federal income tax purposes commencing with our taxable year ended December 31, 2011. As a REIT, we are required to distribute at least 90% of our REIT taxable income to our stockholders annually, computed without regard to the dividends paid deduction and excluding net capital gain. Our distributions are paid on a
64
Table of Contents
monthly basis as directed by our board of directors. Monthly cash distributions are paid based on daily record and distribution declaration dates so our investors will be entitled to be paid distributions beginning no more than a month from the day that they are admitted as stockholders. All distributions are recorded as a reduction of stockholders’ equity. From a tax perspective, 22.3% and 54.5% of the amounts distributed by us during the years ended December 31, 2013, and 2012, respectively, represented a return of capital, and 77.7% and 45.5% of our dividends represented ordinary income for the years ended December 31, 2013 and 2012, respectively. On a per share basis, dividends of $0.7045 and $0.2022 were a return of capital and ordinary income, respectively, for the year ended December 31, 2013. Dividends of $0.4820 and $0.4020 were a return of capital and ordinary income, respectively, for the year ended December 31, 2012. Distributions that are a return of capital are deferred for the purpose of being subject to income tax. During the years ended December 31, 2013 and 2012, monthly distributions totaled $231.4 and $73.0, respectively. As of December 31, 2013, cash used to pay our distributions is generated from cash received from operating activities and financing activities (as reported on a U.S. GAAP basis). The amount of dividends payable to our common stockholders is determined by our board of directors and is dependent on a number of factors, including funds available for dividends, financial condition, capital expenditure requirements, as applicable, and annual dividend requirements needed to qualify and maintain our status as a REIT under the Code. Operating cash flows are expected to increase as additional properties are acquired in our investment portfolio.
The following is a chart of quarterly distributions declared and paid in respect of our common stock during the years ended December 31, 2013 and 2012 and through the date of the Original Filing (in thousands):
| Total Distributions Paid | ||||
| 2014: |
||||
| January and February (1) |
$ | 101,450 | ||
| 2013: |
||||
| 1st Quarter |
40,485 | |||
| 2nd Quarter |
49,882 | |||
| 3rd Quarter |
66,674 | |||
| 4th Quarter |
74,311 | |||
|
|
|
|||
| Total 2013 |
$ | 231,352 | ||
|
|
|
|||
| 2012: |
||||
| 1st Quarter |
4,427 | |||
| 2nd Quarter |
12,110 | |||
| 3rd Quarter |
24,807 | |||
| 4th Quarter |
31,681 | |||
|
|
|
|||
| Total 2012 |
$ | 73,025 | ||
|
|
|
|||
| (1) | Pursuant to the Cole Merger Agreement, we paid a stub period dividend to our stockholders who were record holders on February 6, 2014 for the period since their most recent record date through the last business day prior to the closing of the Cole Merger. The amount paid for such stub period was $0.08113 per share and totaled $19.7 million, and is included above. |
65
Table of Contents
Our board of directors’ philosophy is that dividends should principally be derived from cash flows generated from real estate operations. In order to improve our operating cash flows and our ability to pay dividends from operating cash flows, we agreed to waive certain fees including asset management and incentive fees prior to our transition to self-management. Base management fees incurred during the year ended December 31, 2013 were $9.4 million while $6.0 million of such fees were waived by our Former Manager that were in excess of certain net income thresholds related to the Company’s operations. No incentive fees have been incurred or paid to the Former Manager since inception. The fees that were waived relating to the activity during 2013 are not deferrals and accordingly, will not be paid. Because the Former Manager waived certain fees that we owed, cash flow from operations that would have been used to pay such fees to the Former Manager was available to pay dividends to our stockholders. See Note 19 — Related Party Transactions and Arrangements (As Restated) for further information on fees paid to and forgiven by our Former Manager. Subsequent to December 31, 2013, we completed our transition to self-management and will no longer pay such fees to the Former Manager. See Note 24 — Subsequent Events (As Restated) for further discussion. The management agreement with the Former Manager was terminated effective January 8, 2014.
As our real estate portfolio matures, we expect cash flows from operations to cover our dividends.
Our board of directors authorized and we declared the following annualized dividends per share payable monthly, in cash, on the 15th day of each month to stockholders of record at the close of business on the eighth day of such month.
| Declaration date |
Annualized dividend per share |
Distribution date | Record date | |||||||||
| September 7, 2011 |
$ | 0.875 | 10/15/2011 | 10/8/2011 | ||||||||
| February 27, 2012 |
$ | 0.880 | 3/15/2012 | 3/8/2012 | ||||||||
| March 16, 2012 |
$ | 0.885 | 6/15/2012 | 6/8/2012 | ||||||||
| June 27, 2012 |
$ | 0.890 | 9/15/2012 | 9/8/2012 | ||||||||
| September 30, 2012 |
$ | 0.895 | 11/15/2012 | 11/8/2012 | ||||||||
| November 29, 2012 |
$ | 0.900 | 2/15/2013 | 2/8/2013 | ||||||||
| March 17, 2013 |
$ | 0.910 | 6/15/2013 | 6/8/2013 | ||||||||
| May 28, 2013 |
$ | 0.940 | 12/13/2013 | 12/6/2013 | ||||||||
| October 23, 2013 (1) |
$ | 1.000 | 2/15/2014 | 2/7/2014 | ||||||||
| (1) | The dividend increase was contingent upon, and became effective with, the close of the Cole merger, which was consummated on February 7, 2014. |
Our existing loan agreements contain, and future financing arrangements will likely contain, restrictive covenants that could limit our ability to make distributions to our stockholders. Specifically, our ability to make distributions may be limited by our Credit Facility, pursuant to which our distributions may not exceed the greater of (i) 105% of our FFO, as adjusted for certain items, the most significant of which are acquisition and merger related expenses, in 2013, and 95% thereafter (ii) the amount required for us to qualify and maintain our status as a REIT.
Distribution payments are dependent on the availability of funds. Our board of directors may reduce the amount of dividends paid or suspend dividend payments at any time and therefore dividend payments are not assured. The dividends paid in respect of our common stock for the year ended December 31, 2013 were $231.4 million.
66
Table of Contents
Share Based Compensation Plans
Equity Plan
We have adopted the American Realty Capital Properties, Inc. Equity Plan (the “Equity Plan”), which provides for the grant of stock options, restricted shares of common stock, restricted stock units, dividend equivalent rights and other equity-based awards to our and our affiliates’ non-executive directors, officers and other employees and advisors and consultants who are providing services to us or our affiliates.
We authorized and reserved a total number of shares equal to 10% of the total number of issued and outstanding shares of common stock (on a fully diluted basis assuming the redemption of all OP Units for shares of common stock) to be issued at any time under the Equity Plan for equity incentive awards.
Director Stock Plan
We have adopted the American Realty Capital Properties, Inc. Non-Executive Director Stock Plan (the “Director Stock Plan”), which provides for the grant of restricted shares of common stock to each of our independent directors, each of whom is a non-executive director. Awards of restricted stock will vest ratably over a five-year period following the date of grant in increments of 20% per annum, subject to the director’s continued service on the board of directors, and shall provide for “distribution equivalents” with respect to this restricted stock, whether or not vested, at the same time and in the same amounts as distributions are paid to the stockholders. At December 31, 2013, a total of 99,000 shares of common stock are reserved for issuance under the Director Stock Plan.
The fair value of restricted common stock awards under the Equity Plan and Director Stock Plan is determined on the grant date using the closing stock price on NASDAQ that day. The fair value of restricted common stock awarded to non-employees under the Equity Plan is measured based upon the fair value of goods or services received or the equity instruments granted, whichever is more reliably determinable.
ARCT III Restricted Share Plan
ARCT III had an employee and director incentive restricted share plan (the “RSP”), which provided for the automatic grant of 3,000 restricted shares of common stock to each of its independent directors, without any further action by ARCT III’s board of directors or its stockholders, on the date of initial election to the board of directors and on the date of each annual stockholder’s meeting thereafter. Restricted stock issued to independent directors vested over a five-year period following the date of grant in increments of 20% per annum. The RSP provided ARCT III with the ability to grant awards of restricted shares to its directors, officers and employees (if ARCT III ever had employees), employees of ARCT III’s Advisor and its affiliates, employees of entities that provided services to ARCT III, directors of the ARCT III Advisor or of entities that provided services to ARCT III, certain consultants to ARCT III and the ARCT III Advisor and its affiliates or to entities that provided services to ARCT III.
Immediately prior to the effective time of the ARCT III Merger, each then-outstanding share of ARCT III restricted stock fully vested. All shares of ARCT III common stock then-outstanding as a result of the full vesting of shares of ARCT III restricted stock, and the satisfaction of any applicable withholding taxes, had the right to receive a number of shares of our common stock based on the ARCT III Exchange Ratio.
67
Table of Contents
The following tables detail the restricted shares activity within the Equity Plan, Director Stock Plan and RSP during the years ended December 31, 2013, 2012 and 2011:
Restricted Share Awards
| Equity Plan | RSP & Director Stock Plan | |||||||||||||||
| Number of Restricted Common Shares |
Weighted-Average Issue Price |
Number of Restricted Common Shares |
Weighted-Average Issue Price |
|||||||||||||
| Awarded, January 1, 2011 |
— | $ | — | — | $ | — | ||||||||||
| Granted |
167,400 | 12.50 | 14,700 | 11.50 | ||||||||||||
|
|
|
|
|
|
|
|
|
|||||||||
| Awarded December 31, 2011 |
167,400 | 12.50 | 14,700 | 11.50 | ||||||||||||
| Granted |
93,683 | 10.65 | 30,634 | 10.45 | ||||||||||||
| Forfeited |
(1,174 | ) | 10.65 | (13,650 | ) | 11.54 | ||||||||||
|
|
|
|
|
|
|
|
|
|||||||||
| Awarded December 31, 2012 |
259,909 | 11.84 | 31,684 | 10.47 | ||||||||||||
| Granted |
932,527 | 13.82 | 20,768 | 14.58 | ||||||||||||
| Forfeited |
(1,085 | ) | 12.85 | (3,000 | ) | 12.99 | ||||||||||
|
|
|
|
|
|
|
|
|
|||||||||
| Awarded December 31, 2013 |
1,191,351 | $ | 13.39 | 49,452 | $ | 12.04 | ||||||||||
|
|
|
|
|
|
|
|
|
|||||||||
Unvested Restricted Shares
| Equity Plan | RSP & Director Stock Plan | |||||||||||||||
| Number of Restricted Common Shares |
Weighted-Average Issue Price |
Number of Restricted Common Shares |
Weighted-Average Issue Price |
|||||||||||||
| Unvested, January 1, 2011 |
— | $ | — | — | $ | — | ||||||||||
| Granted |
167,400 | 12.50 | 14,700 | 11.50 | ||||||||||||
| Vested |
(27,900 | ) | 12.50 | — | — | |||||||||||
|
|
|
|
|
|
|
|
|
|||||||||
| Unvested, December 31, 2011 |
139,500 | 12.50 | 14,700 | 11.50 | ||||||||||||
| Granted |
93,683 | 10.65 | 30,634 | 10.45 | ||||||||||||
| Vested |
(59,556 | ) | 12.38 | (2,370 | ) | 11.88 | ||||||||||
| Forfeited |
(1,174 | ) | 10.65 | (13,650 | ) | 11.54 | ||||||||||
|
|
|
|
|
|
|
|
|
|||||||||
| Unvested, December 31, 2012 |
172,453 | 11.55 | 29,314 | 10.35 | ||||||||||||
| Granted |
932,527 | 13.82 | 20,768 | 14.58 | ||||||||||||
| Vested |
(172,453 | ) | 11.55 | (28,207 | ) | 11.03 | ||||||||||
| Forfeited |
(1,085 | ) | 12.85 | (3,000 | ) | 12.99 | ||||||||||
|
|
|
|
|
|
|
|
|
|||||||||
| Unvested, December 31, 2013 |
931,442 | $ | 13.82 | 18,875 | $ | 13.52 | ||||||||||
|
|
|
|
|
|
|
|
|
|||||||||
68
Table of Contents
For the years ended December 31, 2013, 2012 and 2011, compensation expense for restricted shares under the above plans was $8.0 million, $1.2 million and $0.2 million, respectively. In addition, the Company recognized $2.7 million as a distribution to its Former Manager, which is included in consideration to Former Manager for internalization in the accompanying consolidated statements of changes in equity.
Multi-Year Outperformance Plan
Upon consummation of the ARCT III Merger, the Company entered into the 2013 Advisor Multi-Year Outperformance Agreement (the “OPP”) with its Former Manager, whereby its Former Manager was able to potentially earn compensation upon the attainment of stockholder value creation targets.
Under the OPP, the Company’s Former Manager was granted 8,241,101 long term incentive plan units (“LTIP Units”) of the OP, which are earned or forfeited based on the Company’s total return to stockholders (including both share price appreciation and common stock distributions) (“Total Return”), for the three-year period consisting of:
| • | Absolute Component: 4% of any excess Total Return attained above an absolute hurdle of 7% for each annual measurement period, non-compounded, 14% for the interim measurement period and 21% for the full performance period; and |
| • | Relative Component: 4% of any excess Total Return attained above the Total Return for the performance period of a peer group comprised of the following companies: CapLease, Inc.; EPR Properties; Getty Realty Corporation; Lexington Realty Trust; National Retail Properties, Inc.; and Realty Income Corporation. |
The award will be funded (“OPP Pool”) up to a maximum award opportunity equal to 5% of our equity market capitalization at the ARCT III Merger date of $2.1 billion (the “OPP Cap”). Awards under the OPP are dependent on achieving an annual hurdle that commenced December 11, 2012, an interim (two-year) hurdle and then the aforementioned three-year hurdle ending on December 31, 2015.
In order to further ensure that the interests of our Former Manager are aligned with our investors, the Relative Component is subject to a ratable sliding scale factor as follows:
| • | 100% will be earned if we attain a median Total Return of at least 6% for each annual measurement period, non-compounded, at least 12% for the interim measurement period, and at least 18% for the full performance period; |
| • | 50% will be earned if we attain a median Total Return of at least 0% for each measurement period; |
| • | 0% will be earned if we attain a median Total Return of less than 0% for each measurement period; and |
| • | a percentage from 50% to 100% calculated by linear interpolation will be earned if our median Total Return is between 0% and the percentage set for each measurement period. |
For each year during the performance period a portion of the OPP Cap equal to a maximum of up to 1.25% of the Company’s equity market capitalization of $2.1 billion will be “locked-in” based upon the attainment of the performance hurdles set forth above for each annual measurement period. In addition, a portion of the OPP Cap equal to a maximum of up to 3% of the Company’s equity market capitalization will be “locked-in” based upon the attainment of the performance hurdles set forth above for the interim measurement period, which if achieved, will supersede and negate any prior “locked-in” portion based upon annual performance through the first and second valuation dates on December 31, 2013 and 2014, respectively (i.e., a maximum award opportunity equal to a maximum of up to 3% of the Company’s equity market capitalization may be “locked-in” through December 31, 2014). Since certain awards under the OPP plan are dependent on the comparison of the Company’s current market capitalization to the Company’s market capitalization at the inception of plan, the issuance of additional common shares by the Company may result in higher awards.
Following the performance period, the Absolute Component and the Relative Component will be calculated separately and then added together to determine the aggregate award earned under the OPP, which in no event may exceed the OPP Cap. The OPP Pool will be used to determine the number of LTIP Units that vest. Any unvested LTIP Units will be immediately forfeited on December 31, 2015. At December 31, 2013, 100% of the OPP Pool has been allocated.
69
Table of Contents
Pursuant to previous authorization of the Company’s board of directors, as a result of the termination of the management agreement with the Former Manager, all 8,241,101 LTIP Units vested upon the consummation of the Company’s transition to self-management on January 8, 2014.
Our Former Manager is entitled to receive a tax gross-up in the event that any amounts paid to it under the OPP constitute “parachute payments” as defined in Section 280G of the Code.
During the year ended December 31, 2013,we recorded expenses of $92.3 million for the OPP, which is included in the general and administrative in the consolidated statements of operations. As of December 31, 2013, 2.3 million LTIP Units were earned and $32.7 million of the expense was locked-in and has been included in non-controlling interests on the consolidated balance sheets. The remaining $59.6 million expense has been accrued and is included in due to affiliates in the consolidated balance sheet as of December 31, 2013.
New Multi-Year Outperformance Plan
On October 21, 2013, the Company approved a multi-year outperformance plan (the “New OPP”), to be effective as of the Company’s transition to self-management, which occurred on January 8, 2014. Under the New OPP, individual agreements will be entered into between the Company and the participants selected by the Company’s board of directors (the “Participants”) that set forth the Participant’s participation percentage in the New OPP and the number of LTIP Units subject to the award (“OPP Agreements”). Under the OPP Agreements, the Participants will be eligible to earn performance-based bonus awards equal to the Participant’s participation percentage of a pool that will be funded up to a maximum award opportunity (the “New OPP Cap”) equal to approximately 5% of the Company’s equity market capitalization (“the Initial Market Cap”) on October 1, 2013. Subject to the New OPP Cap, the pool will equal an amount to be determined based on the Company’s achievement of total return to stockholders, including both share price appreciation and common stock distributions (“Total Return”), for a three-year performance period (the “Performance Period”); each 12-month period during the Performance Period (each an “Annual Period”) and the initial 24-month period of the Performance Period (the “Interim Period”), as follows:
| Performance Period |
Annual Period | Interim Period | ||||||
| Absolute Component: 4% of any excess Total Return attained above an absolute hurdle measured from the beginning of such period: |
21% | 7% | 14% | |||||
| Relative Component: 4% of any excess Total Return attained above the median Total Return for the performance period of the Peer Group(1), subject to a ratable sliding scale factor as follows based on achievement of cumulative Total Return measured from the beginning of such period: |
||||||||
| • |
100% will be earned if cumulative Total Return achieved is at least: | 18% | 6% | 12% | ||||
| • |
50% will be earned if a cumulative Total Return achieved is: | 0% | 0% | 0% | ||||
| • |
0% will be earned if cumulative Total Return achieved is less than: | 0% | 0% | 0% | ||||
| • |
a percentage from 50% to 100% calculated by linear interpolation will be earned if cumulative Total Return achieved is if between: | 0% - 18% | 0% - 6% | 0% - 12% | ||||
| (1) | The “Peer Group” is comprised of the following companies: EPR Properties; Getty Realty Corporation; Lexington Realty Trust; National Retail Properties, Inc.; Realty Income Corporation; and Spirit Realty Capital, Inc. |
The Participant’s will be entitled to receive a tax gross-up in the event that any amounts paid to the Participant under the New OPP constitute “parachute payments” as defined in Section 280G of the Code. The LTIP Units granted under the New OPP represent units of equity ownership in the OP that are structured as a profits interest therein. Subject to the Participant’s continued service through each vesting date, 1/3 of any earned LTIP Units will vest on each of the third, fourth and fifth anniversaries of October 1, 2013. The Participant will be entitled to receive distributions on their LTIP Units to the extent provided for in the limited partnership agreement of the OP, as amended from time to time.
Use of Proceeds from Sales of Registered Securities; Unregistered Sales of Equity Securities
On April 19, 2013, we issued approximately 38,300 shares of our common stock upon the conversion of limited partner interests in the OP (the “OP Unit Conversion”) at a purchase price of $16.23, for an aggregate purchase price of approximately $0.6 million.
70
Table of Contents
On June 7, 2013, we closed on a private placement transaction for the sale and issuance of approximately 29.4 million shares of our common stock, par value $0.01 per share, at a purchase price of $15.47 per share, for an aggregate purchase price of $455.0 million (the “Common Stock Transaction”).
Concurrently with the closing of the Common Stock Transaction, we closed on a private placement transaction for the sale of approximately 28.4 million shares of a 5.81% convertible preferred stock designated as Series C Convertible Preferred Stock, at a purchase price of $15.67 per share, for an aggregate purchase price of $445.0 million (the “Preferred Stock Transaction”). After deducting for fees and expenses, the aggregate net proceeds from (i) the Common Stock Transaction were approximately $453.0 million and (ii) the Preferred Stock Transaction were approximately $443.0 million, for aggregate net proceeds from both transactions of approximately $896.0 million.
The shares of common stock and Series C Convertible Preferred Stock offered and sold pursuant to the OP Unit Conversion, the Common Stock Transaction and the Preferred Stock Transaction were sold pursuant to an exemption from registration under Section 4(2) of the Securities Act and Rule 506 of Regulation D promulgated thereunder.
On June 11, 2013, we issued approximately 560,900 shares of our common stock upon the conversion of limited partner interests in the OP at a purchase price of $14.56, for an aggregate purchase price of approximately $5.4 million.
On August 5, 2013, we issued 546,611 shares of our common stock upon the conversion of 545,454 shares of Series A Preferred Stock. An additional 1,157 shares of common stock were issued in lieu of unpaid dividends.
On August 13, 2013, we issued 283,018 shares of our common stock upon the conversion of 283,018 shares of Series B Preferred Stock.
On September 15, 2013, we entered into definitive purchase agreements pursuant to which we agreed to issue Series D Preferred Stock, par value $0.01 per share, and common stock, par value $0.01 per share, to certain institutional holders promptly following the close of our merger with CapLease, via a private placement. Pursuant to the definitive purchase agreements, we issued approximately 21.7 million shares of Series D Preferred Stock and 15.1 million shares of common stock, for gross proceeds of $288.0 million and $186.0 million, respectively, on November 12, 2013. The Series D Preferred Stock has a 5.81% coupon on its liquidation preference of $13.59 per share (equivalent to $0.79 per share on an annualized basis).
All the net proceeds from our equity offerings were contributed to our OP in exchange for OP units. Our operating partnership has primarily used the net proceeds from our issuance of common and preferred stock to acquire single-tenant, freestanding commercial real estate primarily subject to net leases with high credit quality tenants. As of December 31, 2013, we have used the net proceeds from the issuance of common and preferred stock, revolving credit facility, and debt financings to purchase 1,329 properties with an aggregate purchase price of $5.2 billion. We did not use any proceeds from any registered offering during the fourth quarter of 2013.
Item 6. Selected Financial Data. (As Restated)
The following selected financial data should be read in conjunction with the accompanying consolidated financial statements and related notes thereto and “Item 7. Management’s Discussion and Analysis of Financial Condition and Results of Operations” below. The Company has restated its consolidated balance sheets as of December 31, 2013 and 2012 and its consolidated statements of operations, consolidated statements of comprehensive loss and consolidated statements of changes in equity for the years ended December 31, 2013 and 2012, along with certain related notes. In addition, the Company has restated its consolidated statement of cash flows for the year ended December 31, 2013. For discussion of the restatement adjustments, see Note 2 — Restatement of Previously Issued Financial Statements to the consolidated financial statements. In addition, on January 3, 2014, we acquired ARCT IV, and together, we were considered to be entities under common control because the entities’ advisors were wholly-owned subsidiaries of ARC. Accordingly, the financial statements have been recast in applying the carryover basis of accounting to include ARCT IV from the earliest period of common control. See Note 1 — Organization for further explanation.
71
Table of Contents
Balance sheet data (amounts in thousands):
| December 31, | ||||||||||||||||
| 2013 (As Restated) |
2012 (As Restated) |
2011 | 2010 | |||||||||||||
| Total real estate investments, at cost |
$ | 7,459,142 | $ | 1,875,615 | $ | 209,326 | $ | — | ||||||||
| Total assets |
$ | 7,809,083 | $ | 2,182,195 | $ | 221,578 | $ | 279 | ||||||||
| Mortgage notes payable, net |
$ | 1,301,114 | $ | 265,118 | $ | 35,320 | $ | — | ||||||||
| Senior secured revolving credit facility |
$ | — | $ | 124,604 | $ | 42,407 | $ | — | ||||||||
| Senior corporate credit facilities |
$ | 1,819,800 | $ | — | $ | — | ||||||||||
| Convertible debt, net |
$ | 972,490 | $ | — | $ | — | $ | — | ||||||||
| Other debt |
$ | 104,804 | $ | — | $ | — | ||||||||||
| Due to affiliates |
$ | 103,434 | $ | 1,522 | $ | — | $ | — | ||||||||
| Total liabilities |
$ | 5,310,556 | $ | 513,435 | $ | 80,790 | $ | 279 | ||||||||
| Total equity |
$ | 2,229,228 | $ | 1,668,760 | $ | 140,788 | $ | — | ||||||||
Operating data, cash flow data and per share data (amounts in thousands except share and per share data):
| Year ended December 31, | Period from December 2, 2010 (Date of Inception) to December 31, 2010 |
|||||||||||||||
| 2013 (As Restated) |
2012 (As Restated) |
2011 | ||||||||||||||
| Operating data: |
||||||||||||||||
| Total revenues |
$ | 329,323 | $ | 67,207 | $ | 3,970 | $ | — | ||||||||
| Acquisition related |
$ | 76,113 | $ | 45,070 | $ | 3,898 | $ | — | ||||||||
| Merger and other non-routine transactions |
$ | 210,543 | $ | 2,603 | $ | — | $ | — | ||||||||
| Property operating |
$ | 23,616 | $ | 3,522 | $ | 220 | $ | — | ||||||||
| Management fees to affiliates |
$ | 17,462 | $ | 212 | $ | — | $ | — | ||||||||
| General and administrative |
$ | 123,172 | $ | 5,458 | $ | 749 | $ | — | ||||||||
| Depreciation and amortization |
$ | 210,976 | $ | 40,957 | $ | 2,097 | $ | — | ||||||||
| Operating loss |
$ | (335,905 | ) | $ | (30,615 | ) | $ | (2,994 | ) | $ | — | |||||
| Interest expense |
$ | (105,548 | ) | $ | (11,856 | ) | $ | (960 | ) | $ | — | |||||
| Loss on derivative instruments, net |
$ | (67,946 | ) | $ | — | $ | (2 | ) | ||||||||
| Loss from continuing operations |
$ | (507,781 | ) | $ | (41,492 | ) | $ | (3,952 | ) | $ | — | |||||
| Net loss attributable to non-controlling interests |
$ | 16,316 | $ | 585 | $ | 105 | $ | — | ||||||||
| Net loss attributable to stockholders |
$ | (491,499 | ) | $ | (41,652 | ) | $ | (4,699 | ) | $ | — | |||||
| Cash flow data: (2) |
||||||||||||||||
| Net cash flows provided (used in) by operating activities |
$ | 11,918 | $ | 9,440 | $ | (257 | ) | $ | — | |||||||
| Net cash flows used in investing activities |
$ | (4,541,718 | ) | $ | (1,701,422 | ) | $ | (89,981 | ) | $ | — | |||||
| Net cash flows provided by financing activities |
$ | 4,289,950 | $ | 1,965,226 | $ | 109,569 | $ | — | ||||||||
| Per share data: |
||||||||||||||||
| Basic net income (loss) per share from continuing operations attributable to stockholders |
$ | (2.41 | ) | $ | (0.40 | ) | $ | (1.04 | ) | $ | — | |||||
| Diluted net income (loss) per share attributable to stockholders |
$ | (2.41 | ) | $ | (0.41 | ) | $ | (1.26 | ) | $ | — | |||||
| Annualized distributions declared per common share |
$ | 0.91 | $ | 0.89 | $ | 0.88 | $ | — | ||||||||
| Weighted-average number of common shares outstanding (1) |
205,341,431 | 103,306,366 | 3,720,351 | — | ||||||||||||
| (1) | For the years ended December 31, 2013, 2012, 2011 and the period ended December 31, 2010, the effect of certain OP Units outstanding, LTIP Units, unvested restricted shares and convertible preferred shares were excluded from the weighted-average share calculation as the effect would be anti-dilutive. |
| (2) | Cash Flow data has been restated for only the year ended December 31, 2013 |
72
Table of Contents
Item 7. Management’s Discussion and Analysis of Financial Condition and Results of Operations. (Certain Sections Restated or Corrected)
The following discussion and analysis should be read in conjunction with the accompanying financial statements of American Realty Capital Properties, Inc. (the “Company” or “ARCP”) and the notes thereto. As used herein, the terms “we,” “our” and “us” refer to American Realty Capital Properties, Inc., a Maryland corporation, and, as required by context, to ARC Properties Operating Partnership, L.P. (the “OP”), a Delaware limited partnership and its subsidiaries. As of December 31, 2013, ARCP was still externally managed by ARC Properties Advisors, LLC (our “Former Manager”), a Delaware limited liability company and a wholly owned subsidiary of AR Capital, LLC (“ARC”).
Restatement and Recast
As discussed in the Explanatory Note to this Form 10-K/A and Note 2 — Restatement of Previously Issued Financial Statements to the consolidated financial statements, we are restating our consolidated financial statements and related financial information for the years ended December 31, 2013 and 2012. In addition, on January 3, 2014, we acquired ARCT IV, and together we were considered to be entities under common control because the entities’ advisors were wholly-owned subsidiaries of ARC. Accordingly, the financial statements have been recast in applying the carryover basis of accounting to include ARCT IV. See Note 1 —Organization to the consolidated financial statements for further explanation. The following discussion and analysis of our financial condition and results of operations is based on the restated and recasted amounts. Further, certain events occurred subsequent to December 31, 2013 through the filing date of this Form 10-K/A. Refer to Note 24 — Subsequent Events (As Restated) to the consolidated financial statements for further explanation.
Overview
We were incorporated on December 2, 2010, as a Maryland corporation that qualified as a real estate investment trust (“REIT”) for U.S. federal income tax purposes beginning in the year ended December 31, 2011. On September 6, 2011, we completed our IPO and our shares of common stock began trading on the NASDAQ Global Select Market (“NASDAQ”) under the symbol “ARCP.”
We acquire, own and operate single-tenant, freestanding commercial real estate properties, primarily subject to net leases with high credit quality tenants. We focus on investing in properties that are net leased to (i) credit tenants, which are generally large public companies with investment-grade ratings and other creditworthy tenants and (ii) governmental, quasi-governmental and not-for-profit entities. Our long-term business strategy is to acquire a diverse portfolio consisting of approximately 70% long-term leases and 30% medium-term leases, with an average remaining lease term of 10 to 12 years. We expect this investment strategy to provide for stable income from credit tenants and to provide for growth opportunities from re-leasing of current below market leases.
We have advanced our investment objectives by growing our net lease portfolio through strategic mergers and acquisitions. See Note 3 — Mergers and Acquisitions to the consolidated financial statements for further discussion.
Substantially all of our business is conducted through our OP. We are the sole general partner and holder of 96.1% of the equity interest in the OP as of December 31, 2013. Certain affiliates of ours and certain unaffiliated investors are limited partners and owners of 3.3% and 0.6%, respectively, of the equity interest in our OP. After holding units of limited partner interests in our OP (“OP Units”) for a period of one year, holders of OP Units have the right to convert limited partner interests in the OP for the cash value of a corresponding number of shares of our common stock or, at the option of our OP, a corresponding number of shares of our common stock, as allowed by the limited partnership agreement of our OP. The remaining rights of the holders of OP Units are limited, however, and do not include the ability to replace the general partner or to approve the sale, purchase or refinancing of our OP’s assets.
73
Table of Contents
During the year ended December 31, 2013, we retained our Former Manager to manage our affairs on a day-to-day basis and, as a result, were generally externally managed, with the exception of certain acquisition, accounting and portfolio management services performed by our employees. In August 2013, our board of directors determined that it was in the best interests of us and our stockholders to become self-managed, and we completed our transition to self-management on January 8, 2014. In connection with becoming self-managed, we terminated the existing management agreement with our Former Manager and entered into employment and incentive compensation arrangements with our executives. The Former Manager agreed to sell us certain assets. See Note 19 — Related Party Transactions and Arrangements (As Restated) and Note 24 — Subsequent Events (As Restated) to the consolidated financial statements for further discussion.
As of December 31, 2013, excluding one vacant property classified as held for sale, we owned 2,559 properties consisting of 43.8 million square feet that were 99% leased with a weighted-average remaining lease term of 9.4 years. In constructing our portfolio, we are committed to diversification (industry, tenant and geography). As of December 31, 2013, rental revenues derived from investment grade tenants and tenants affiliated with investment grade entities, as determined by major credit rating agencies, approximated 60% (we have attributed the rating of each parent company to its wholly owned subsidiary for purposes of this disclosure). Our strategy encompasses receiving the majority of our revenue from investment grade tenants as we further acquire properties and enter into (or assume) lease arrangements.
Completed Mergers and Major Acquisitions
American Realty Capital Trust III, Inc. Merger
On December 14, 2012, we entered into the ARCT III Merger Agreement with ARCT III and certain subsidiaries of each company. The ARCT III Merger Agreement provided for the merger of ARCT III with and into a subsidiary of ours. The ARCT III Merger was consummated on February 28, 2013.
Pursuant to the terms and subject to the conditions set forth in the ARCT III Merger Agreement, each outstanding share of common stock of ARCT III, including restricted shares which became vested, was converted into the right to receive (i) 0.95 of a share of our common stock, or (ii) $12.00 in cash. In addition, each outstanding unit of equity ownership of the ARCT III OP was converted into the right to receive 0.95 of the same class of unit of equity ownership in our OP.
Upon the closing of the ARCT III Merger, on February 28, 2013, 29.2 million shares, or 16.5% of the then outstanding shares of ARCT III’s common stock were received in cash consideration at $12.00 per share, which is equivalent to 27.7 million shares of our common stock based on the ARCT III Exchange Ratio. In addition, 148.1 million shares of ARCT III’s common stock were converted to shares of our common stock at the Exchange Ratio, resulting in an additional 140.7 million shares of our common stock outstanding after the exchange.
Upon the consummation of the ARCT III Merger, American Realty Capital Trust III Special Limited Partner, LLC, the holder of the special limited partner interest in the ARCT III OP, was entitled to subordinated distributions of net sales proceeds from ARCT III OP which resulted in the issuance of units of limited partner interests in the ARCT III OP, when after applying the Exchange Ratio, resulted in the issuance of an additional 7.3 million OP Units to affiliates of our Former Manager. The parties had agreed that such OP Units would be subject to a minimum one-year holding period before being exchangeable into our common stock.
Also in connection with the ARCT III Merger, we entered into an agreement with ARC and its affiliates to internalize certain functions performed by them prior to the ARCT III Merger, reduce certain fees paid to affiliates, purchase certain corporate assets and pay certain merger related fees. See Note 19 — Related Party Transactions and Arrangements (As Restated).
74
Table of Contents
Accounting Treatment of the ARCT III Merger
We and ARCT III, from inception to the ARCT III Merger date, were considered to be entities under common control. Both entities’ advisors were wholly owned subsidiaries of ARC. ARC and its related parties had significant ownership interests in us and had significant ownership of ARCT III through the ownership of shares of common stock and other equity interests. In addition, the advisors of both entities were contractually eligible to charge potential fees for their services to both of the companies including asset management fees, incentive fees and other fees and continue to charge fees to us. Due to the significance of these fees, the advisors and ultimately ARC was determined to have a significant economic interest in both companies in addition to having the power to direct the significant activities of the companies through advisory/management agreements, which qualified them as affiliated companies under common control in accordance with U.S. GAAP. The acquisition of an entity under common control is accounted for on the carryover basis of accounting whereby the assets and liabilities of the companies are recorded upon the merger on the same basis as they were carried by the companies on the ARCT III Merger date. In addition, U.S. GAAP requires us to present historical financial information as if the merger had occurred as of the earliest period of common control. Therefore, the accompanying financial statements including the notes thereto are presented as if the ARCT III Merger had occurred at inception.
GE Capital Portfolio Acquisition
On June 27, 2013, we, through subsidiaries of the OP, acquired, from certain affiliates of GE Capital Corp., the equity interests in the entities that own a real estate portfolio comprised of 447 properties, (the “GE Capital Portfolio”) for a purchase price of $773.9 million exclusive of closing costs. The 447 properties are subject to 409 property operating leases, as well as 38 direct financing leases.
During the year ended December 31, 2013, ARCT IV acquired, from certain affiliates of GE Capital Corp., the equity interests in the entities that own a real estate portfolio comprised of 924 properties (the “ARCT IV GE Capital Portfolio”) for a purchase price of $1.4 billion, exclusive of closing costs, with no liabilities assumed. The 924 properties are subject to 912 property operating leases, as well as 12 direct financing leases.
CapLease, Inc. Merger
On May 28, 2013, we entered into an Agreement and Plan of Merger (the “CapLease Merger Agreement”) with CapLease and certain subsidiaries of each company. The CapLease Merger Agreement provided for the merger of CapLease with and into a subsidiary of ours.
On November 5, 2013, we completed the merger with CapLease based on the terms of the CapLease Merger Agreement. Pursuant to the terms set forth in the CapLease Merger Agreement, at the effective time of the CapLease Merger, each outstanding share of common stock of CapLease, other than shares owned by us, CapLease or any of their respective wholly owned subsidiaries, was converted into the right to receive $8.50. Each outstanding share of preferred stock of CapLease, other than shares owned by us, CapLease or any of their respective wholly owned subsidiaries, was converted into the right to receive an amount in cash, equal to the sum of $25.00 plus all accrued and unpaid dividends on such shares of preferred stock. In addition, in connection with the merger of CapLease, LP with and into the OP (the “CapLease Partnership Merger”), each outstanding unit of equity ownership of CapLease’s operating partnership other than units owned by CapLease or any wholly owned subsidiary of CapLease was converted into the right to receive $8.50. Shares of CapLease’s outstanding restricted stock were accelerated and became fully vested, and restricted stock and any outstanding performance shares were fully earned and received $8.50 per share. In total, cash consideration of $920.7 million was paid to the common and preferred stockholders of CapLease.
Accounting Treatment for the CapLease Merger
The CapLease Merger has been accounted for under the acquisition method of accounting under U.S. GAAP. Under the acquisition method of accounting, the assets acquired and liabilities assumed from CapLease have been recorded as of the acquisition date at their respective fair values. Any excess of purchase price over the fair values has been recorded as goodwill. Results of operations for CapLease will be included in our consolidated financial statements from the date of acquisition. See Note 6 — CapLease Acquisition (As Restated).
75
Table of Contents
American Realty Capital Trust IV, Inc. Merger
On July 1, 2013, we entered into ARCT IV Merger Agreement with ARCT IV and certain subsidiaries of each company. The ARCT IV Merger Agreement provided for the merger of ARCT IV with and into a subsidiary of the OP. We consummated the ARCT IV Merger on January 3, 2014.
Pursuant to the terms of the ARCT IV Merger Agreement, as amended, each outstanding share of common stock of ARCT IV, including unvested restricted shares that vested in conjunction with the ARCT IV Merger, was exchanged for (i) $9.00 in cash, (ii) 0.5190 of a share of the Company’s common stock (the “ARCT IV Exchange Ratio”) and (iii) 0.5937 of a share of a new series of preferred stock of the Company designated as the 6.70% Series F Cumulative Redeemable Preferred Stock (“Series F Preferred Stock”) and each outstanding unit of ARCT IV’s operating partnership (“ARCT IV OP Unit”), other than ARCT IV OP Units held by the American Realty Capital Trust IV Special Limited Partner, LLC, (the “ARCT IV Special Limited Partner”) and American Realty Capital Advisors IV, LLC (the “ARCT IV Advisor”) was exchanged for (i) $9.00 in cash, (ii) 0.5190 of an OP Unit and (iii) 0.5937 of a OP Unit designated as Series F Preferred Units (“Series F OP Units”). In total, the Company paid $651.4 million in cash, issued 36.9 million shares of common stock and 42.2 million shares of Series F Preferred Stock, and issued 0.7 million units of Series F OP units and 0.6 million OP Units to the former ARCT IV shareholders and ARCT IV OP Unit holders in connection with the consummation of the ARCT IV Merger. In addition, each outstanding ARCT IV Class B Unit (as defined below) and each outstanding ARCT IV OP Unit held by the ARCT IV Special Limited Partner and the ARCT IV Advisor was converted into 2.3961 OP Units, resulting in the Company issuing 1.2 million OP Units.
In connection with the ARCT IV Merger and pursuant to the terms of the agreement of limited partnership of ARCT IV’s operating partnership, ARCT IV’s external advisor received subordinated distributions of net sales proceeds in an approximate amount of $63.2 million. Such subordinated distributions of net sales proceeds were paid in the form of equity units of ARCT IV’s operating partnership that were automatically converted into 6.7 million OP Units. Upon the consummation of the ARCT IV Merger, the OP Units had a fair value of $78.2 million and are subject to a minimum two-year holding period from the date of issuance before being exchangeable into our common stock.
Accounting Treatment of the ARCT IV Merger
We and ARCT IV were considered to be entities under common control. Both entities’ advisors are wholly owned subsidiaries of ARC. ARC and its related parties had ownership interests in us and ARCT IV through the ownership of shares of common stock and other equity interests. In addition, the advisors of both entities were contractually eligible to charge potential fees for their services to both of the companies including asset management fees, incentive fees and other fees and will continue to charge fees to us following the ARCT IV Merger. Due to the significance of these fees, the advisors and ultimately ARC were determined to have a significant economic interest in both companies in addition to having the power to direct the activities of the companies through advisory/management agreements, which qualified them as affiliated companies under common control in accordance with U.S. GAAP. The acquisition of an entity under common control is accounted for on the carryover basis of accounting whereby the assets and liabilities of the companies are recorded upon the merger on the same basis as they were carried by the companies on the ARCT IV Merger date. In addition, U.S. GAAP requires us to present historical financial information as if the entities were combined as of the earliest period of common control. Therefore, the accompanying financial statements including the notes thereto are presented as if the ARCT IV Merger had occurred at inception.
76
Table of Contents
Fortress Portfolio Acquisition
On July 24, 2013, ARC and another related entity, on our behalf and certain other entities sponsored directly or indirectly by ARC, entered into a purchase and sale agreement with affiliates of funds managed by Fortress Investment Group LLC (“Fortress”) for the purchase and sale of 196 properties owned by Fortress for an aggregate contract purchase price of $972.5 million, subject to adjustments set forth in the purchase and sale agreement and exclusive of closing costs, which were allocated to us based on the pro rata fair value of the properties acquired by us relative to the fair value of all 196 properties to be acquired from Fortress. Of the 196 properties, 120 properties were allocated to us (the “Fortress Portfolio”). On October 1, 2013, we closed on 41 of the 120 properties with a total purchase price of $200.3 million, exclusive of closing costs. We closed the acquisition of the remaining 79 properties in the Fortress Portfolio on January 8, 2014, for an aggregate contract purchase price of $400.9 million, exclusive of closing costs. The total purchase price of the Fortress Portfolio was $601.2 million, exclusive of closing costs. During the year ended December 31, 2013, we deposited $72.2 million into escrow in relation to the Fortress Portfolio, which has been included in prepaid expenses and other assets in the consolidated balance sheet as of December 31, 2013.
Cole Real Estate Investments, Inc. Merger
On October 22, 2013, we entered into an agreement and plan of merger (the “Cole Merger Agreement”) with Cole Real Estate Investments, Inc. (“Cole”), a Maryland corporation, and a wholly owned subsidiary of ours. The Cole Merger Agreement provided for the merger of Cole with and into the wholly owned subsidiary (the “Cole Merger”). We consummated the Cole Merger on February 7, 2014 (the “Cole Acquisition Date”).
Pursuant to the terms of the Cole Merger Agreement, each share of common stock of Cole issued and outstanding immediately prior to the effectiveness of the Cole Merger, including unvested restricted stock units (“RSUs”) and performance stock units that vested in conjunction with the Cole Merger was converted into the right to receive either (i) 1.0929 shares of our common stock, par value $0.01 per share, (the “Stock Consideration”) or (ii) $13.82 in cash (the “Cash Consideration” and together with the Stock Consideration, the “Merger Consideration”). Approximately 98% of all outstanding Cole holders received Stock Consideration and approximately 2% of outstanding Cole shares elected to receive Cash Consideration, pursuant to the terms of the Cole Merger Agreement, resulting in the issuance of approximately 520.8 million shares of our common stock and paying $181.8 million to holders of Cole shares based on their elections.
In addition, the Company issued approximately 2.8 million shares of our common stock, in the aggregate, to certain executives of Cole pursuant to letter agreements entered into between us and such individuals concurrently with the execution of the Cole Merger Agreement, as previously disclosed. Additionally, effective as of the Cole Acquisition Date, we issued, but have not yet allocated, 0.4 million shares with dividend equivalent rights commensurate with the our common stock.
We are in the process of gathering certain additional information in order to finalize our assessment of the fair value of the consideration transferred; thus, the fair values of currently recorded assets and liabilities are subject to change. The estimated fair value of the consideration transferred at the Cole Acquisition Date totaled approximately $7.5 billion and consisted of the following (in thousands):
| As of Cole Acquisition Date (Preliminary) |
||||
| Estimated Fair Value of Consideration Transferred: |
||||
| Cash |
$ | 181,775 | ||
| Common stock |
7,285,868 | |||
|
|
|
|||
| Total consideration transferred |
$ | 7,467,643 | ||
|
|
|
|||
The fair value of the 520.8 million shares of common stock issued, excluding those common shares transferred to former Cole executives, was determined based on the closing market price of our common stock on the Cole Acquisition Date.
77
Table of Contents
Accounting Treatment for the Cole Merger
The Cole Merger will be accounted for under the acquisition method of accounting under U.S. GAAP. Under the acquisition method of accounting, the assets acquired and liabilities assumed from Cole will be recorded as of the acquisition date at their respective fair values. Any excess of purchase price over the fair values will be recorded as goodwill. Results of operations for Cole will be included in our consolidated financial statements from the date of acquisition.
Inland Portfolio Acquisition
On August 8, 2013, ARC entered into a purchase and sale agreement with Inland American Real Estate Trust, Inc. (“Inland”) for the purchase and sale of the equity interests of 67 companies owned by Inland for an aggregate contract purchase price of $2.3 billion, subject to adjustments set forth in the purchase and sale agreement and exclusive of closing costs. Of the 67 companies, the equity interests of 10 companies (the “Inland Portfolio”) will be acquired, in total, by us from Inland for a purchase price of $501.0 million, subject to adjustments set forth in the purchase and sale agreement and exclusive of closing costs, which was allocated to us based on the pro rata fair value of the Inland Portfolio relative to the fair value of all 67 companies to be acquired from Inland by us and the other entities sponsored directly or indirectly by ARC. The Inland Portfolio is comprised of 33 properties. As of December 31, 2013, we had closed on five of the 33 properties for a total purchase price of $56.4 million, exclusive of closing costs. We closed the acquisition of 27 additional properties in the Inland Portfolio subsequent to December 31, 2013. We do not consider it probable that we will close on the remaining property.
The operating results for the year ended December 31, 2013 do not include the impact of the Cole Merger and the acquisitions of the Fortress and Inland Portfolios, which closed after December 31, 2013, and do not include the other recent organic acquisitions that were acquired subsequent to December 31, 2013. Accordingly, the operating results in 2013 are not indicative of our future operating results.
Significant Accounting Estimates and Critical Accounting Policies
Set forth below is a summary of the significant accounting estimates and critical accounting policies that management believes are important to the preparation of our financial statements. Certain of our accounting estimates are particularly important for an understanding of our financial position and results of operations and require the application of significant judgment by our management. As a result, these estimates are subject to a degree of uncertainty. These significant accounting estimates include:
Revenue Recognition
Upon the acquisition of real estate, certain properties will have leases where minimum rent payments increase during the term of the lease. We will record rental revenue for the full term of each lease on a straight-line basis. When we acquire a property, the term of existing leases is considered to commence as of the acquisition date for the purposes of this calculation. Cost recoveries from tenants are included in tenant reimbursement income in the period the related costs are incurred, as applicable.
Our revenues, which are derived primarily from rental income, include rents that each tenant pays in accordance with the terms of each lease reported on a straight-line basis over the initial term of the lease. Since many of the leases provide for rental increases at specified intervals, straight-line basis accounting requires us to record a receivable, and include in revenues, unbilled rent receivables that we will only receive if the tenant makes all rent payments required through the expiration of the initial term of the lease. We defer the revenue related to lease payments received from tenants in advance of their due dates.
We continually review receivables related to rent and unbilled rent receivables and determine collectability by taking into consideration the tenant’s payment history, the financial condition of the tenant, business conditions in the industry in which the tenant operates and economic conditions in the area in which the property is located. In the event that the collectability of a receivable is in doubt, we will record an increase in the allowance for uncollectible accounts or record a direct write-off of the receivable in the consolidated statements of operations and comprehensive loss. As of December 31, 2013, we recorded an allowance for uncollectible accounts of $187,000. As of December 31, 2012, we determined that no allowance for uncollectible accounts was necessary.
78
Table of Contents
Real Estate Investments
We record acquired real estate at cost and make assessments as to the useful lives of depreciable assets. We consider the period of future benefit of the asset to determine the appropriate useful lives. Depreciation is computed using a straight-line method over the estimated useful life of 40 years for buildings, five to 15 years for building fixtures and improvements and the remaining lease term for acquired intangible lease assets.
Allocation of Purchase Price of Business Combinations and Acquired Assets
In accordance with the guidance for business combinations, we determine whether a transaction or other event is a business combination. If the transaction is determined to be a business combination, we determine if the transaction is considered to be between entities under common control. The acquisition of an entity under common control is accounted for on the carryover basis of accounting whereby the assets and liabilities of the companies are recorded upon the merger on the same basis as they were carried by the companies on the merger date. All other business combinations are accounted for by applying the acquisition method of accounting. Under the acquisition method, we recognize the identifiable assets acquired, the liabilities assumed and any non-controlling interest in the acquired entity. In addition, we evaluate the existence of goodwill or a gain from a bargain purchase. We will immediately expense acquisition-related costs and fees associated with business combinations and asset acquisitions.
We allocate the purchase price of acquired properties and business combinations accounted for under the acquisition method of accounting to tangible and identifiable intangible assets acquired based on their respective fair values to tangible and identifiable intangible assets acquired based on their respective fair values. Tangible assets include land, buildings, equipment and tenant improvements on an as-if vacant basis. We utilize various estimates, processes and information to determine the as-if vacant property value. Estimates of value are made using customary methods, including data from appraisals, comparable sales, discounted cash flow analysis and other methods. Identifiable intangible assets include amounts allocated to acquired leases for above-market and below-market lease rates and the value of in-place leases.
Amounts allocated to land, buildings, equipment and fixtures are based on cost segregation studies performed by independent third-parties or on our analysis of comparable properties in our portfolio.
The aggregate value of intangible assets related to in-place leases is primarily the difference between the property valued with existing in-place leases adjusted to market rental rates and the property valued as if vacant. Factors considered by us in our analysis of the in-place lease intangibles include an estimate of carrying costs during the expected lease-up period for each property, taking into account current market conditions and costs to execute similar leases. In estimating carrying costs, we include real estate taxes, insurance and other operating expenses and estimates of lost rentals at market rates during the expected lease-up period, which typically ranges from six to 18 months. We also estimate costs to execute similar leases including leasing commissions, legal and other related expenses.
Above-market and below-market in-place lease values for owned properties are recorded based on the present value (using an interest rate which reflects the risks associated with the leases acquired) of the difference between the contractual amounts to be paid pursuant to the in-place leases and management’s estimate of fair market lease rates for the corresponding in-place leases, measured over a period equal to the remaining non-cancelable term of the lease, including any bargain option renewal periods. The capitalized above-market lease intangibles are amortized as a decrease to rental income over the remaining term of the lease. The capitalized below-market lease values are amortized as an increase to rental income over the remaining term, including any bargain option renewal periods. In determining the amortization period for below-market lease intangibles, we initially will consider, and periodically evaluate on a quarterly basis, the likelihood that a lessee will execute the renewal option. The likelihood that a lessee will execute the renewal option is determined by taking into consideration the tenant’s payment history, the financial condition of the tenant, business conditions in the industry in which the tenant operates and economic conditions in the area in which the property is located.
The fair value of investments and debt are valued using techniques consistent with those disclosed in Note 10 — Fair Value of Financial Instruments (As Restated), depending on the nature of the investment or debt. The fair value of all other assumed assets and liabilities based on the best information available.
79
Table of Contents
The value of in-place leases is amortized to expense over the initial term of the respective leases, which range primarily from two to 20 years. If a tenant terminates its lease and the unamortized portion of the in-place lease value is charged to expense.
In making estimates of fair values for purposes of allocating purchase price, we utilize a number of sources, including independent appraisals that may be obtained in connection with the acquisition or financing of the respective property and other market data. We also consider information obtained about each property as a result of its pre-acquisition due diligence, as well as subsequent marketing and leasing activities, in estimating the fair value of the tangible and intangible assets acquired and intangible liabilities assumed.
Derivative Instruments
We may use derivative financial instruments to hedge all or a portion of the interest rate risk associated with our borrowings. Certain of the techniques used to hedge exposure to interest rate fluctuations may also be used to protect against declines in the market value of assets that result from general trends in debt markets. The principal objective of such agreements is to minimize the risks and/or costs associated with our operating and financial structure as well as to hedge specific anticipated transactions.
We record all derivatives on the balance sheet at fair value. The accounting for changes in the fair value of derivatives depends on the intended use of the derivative, whether we have elected to designate a derivative in a hedging relationship and apply hedge accounting and whether the hedging relationship has satisfied the criteria necessary to apply hedge accounting. Derivatives designated and qualifying as a hedge of the exposure to changes in the fair value of an asset, liability, or firm commitment attributable to a particular risk, such as interest rate risk, are considered fair value hedges. Derivatives designated and qualifying as a hedge of the exposure to variability in expected future cash flows, or other types of forecasted transactions, are considered cash flow hedges. Derivatives may also be designated as hedges of the foreign currency exposure of a net investment in a foreign operation. Hedge accounting generally provides for the matching of the timing of gain or loss recognition on the hedging instrument with the recognition of the changes in the fair value of the hedged asset or liability that are attributable to the hedged risk in a fair value hedge or the earnings effect of the hedged forecasted transactions in a cash flow hedge. We may enter into derivative contracts that are intended to economically hedge certain of our risk, even though hedge accounting does not apply or we elect not to apply hedge accounting.
The accounting for subsequent changes in the fair value of these derivatives depends on whether each has been designed and qualifies for hedge accounting treatment. If we elect not to apply hedge accounting treatment, any changes in the fair value of these derivative instruments is recognized immediately in gains (losses) on derivative instruments in the consolidated statements of operations and comprehensive loss. If the derivative is designated and qualifies for hedge accounting treatment the change in the estimated fair value of the derivative is recorded in other comprehensive income (loss) to the extent that it is effective. Any ineffective portion of a derivative’s change in fair value will be immediately recognized in earnings.
Recently Issued Accounting Pronouncements
Recently issued accounting pronouncements are described in Note 4 — Summary of Significant Accounting Policies (As Restated).
Results of Operations (As Restated)
As of December 31, 2013, we owned 2,559 properties with an aggregate original base purchase price of $7.4 billion, excluding one vacant property classified as held for sale. As of December 31, 2013, the 2,559 properties comprised 43.8 million square feet that were 99% leased. As of December 31, 2012, we owned 702 properties with an aggregate original base purchase price of $1.9 billion, excluding one vacant property classified as held for sale. As of December 31, 2012, the 702 properties comprised 15.8 million square feet that were 100% leased. Accordingly, our results of operations for the year ended December 31, 2013 as compared to the year ended December 31, 2012 reflect significant increases in most categories.
80
Table of Contents
Comparison of the Year Ended December 31, 2013 to the Year Ended December 31, 2012
Rental Income
Rental income increased $245.2 million to $310.5 million for the year ended December 31, 2013 compared to $65.3 million for the year ended December 31, 2012. Rental income was driven by our acquisition of 1,807 properties, which excludes 50 properties that are accounted for as direct financing leases, acquired during the year ended December 31, 2013 for an aggregate purchase price of $5.5 billion. The annualized rental income per square foot of the properties at December 31, 2013 was $12.66 with a weighted-average remaining lease term of 9.4 years, compared to $9.59 per square foot at December 31, 2012.
Our properties are generally leased from two to twenty years and 60% are leased to investment grade tenants and affiliates of investment grade tenants, as determined by major credit rating agencies. Cash same store rents on the 129 properties held for the full period in each of the years ended December 31, 2013 and 2012 increased $0.2 million, or 1.3%, to $16.2 million compared to $16.0 million for the years ended December 31, 2013 and 2012, respectively. Same store annualized average rental income per square foot was $11.37 at December 31, 2013 compared to $11.23 at December 31, 2012.
Direct Financing Lease Income
Direct financing lease income of $2.2 million was recognized for the year ended December 31, 2013. Direct financing lease income was primarily driven by our 2013 acquisition of 50 properties comprised of $66.1 million of net investments subject to direct financing leases during the year ended December 31, 2013.
Operating Expense Reimbursements
Operating expense reimbursements increased by $14.7 million to $16.6 million for the year ended December 31, 2013 compared to $1.9 million for the year ended December 31, 2012. Operating expense reimbursements represent reimbursements for taxes, property maintenance and other charges contractually due from tenants per their respective leases. Operating expense reimbursements were driven by our acquisition of 1,807 properties since December 31, 2012.
Acquisition Related Expenses
Acquisition related costs increased by $31.0 million to $76.1 million for the year ended December 31, 2013 compared to $45.1 million for the year ended December 31, 2012. Acquisition expenses mainly consisted of acquisition fees, legal costs, deed transfer costs and other costs related to real estate purchase transactions. The increase is driven by our acquisition of 1,807 properties during the year ended December 31, 2013 compared to 573 during the year ended December 31, 2012. This increase was offset by the agreement with our Former Manager in conjunction with the ARCT III Merger, where it was agreed that our Former Manager would no longer charge acquisition fees. Subsequent to December 31, 2013, the management agreement was terminated as a result of our transition to self-management. See Note 24 — Subsequent Events (As Restated) for further discussion.
Merger and Other Non-routine Transactions
Expenses related to various mergers, as well as other non-routine transaction expenses, increased by $207.9 million to $210.5 million for the year ended December 31, 2013 compared to $2.6 million for the year ended December 31, 2012. Upon the consummation of the ARCT III Merger, an affiliate of ARCT III received a subordinated incentive distribution upon the attainment of certain performance hurdles. For the year ended December 31, 2013, $98.4 million was recorded for this fee, which was settled in 7.3 million OP Units issued to the affiliate. During the year ended December 31, 2013, the Company incurred $62.3 million of strategic advisory services, $16.0 million of legal fees and $8.9 million of transfer taxes relating to the various mergers and acquisitions. In addition, merger and other non-routine transaction related expenses for the year ended December 31, 2013 included $24.9 million in post-transaction support fees, printing fees, proxy services and other costs associated with entering into and completing the various mergers and acquisitions. During the year ended December 31, 2012, the $2.6 million of merger and other non-routine transaction related expenses consisted of legal fees related to the merger with ARCT III announced in December 2012. See Note 4 — Summary of Significant Accounting Policies (As Restated) for a breakdown of costs.
81
Table of Contents
The Audit Committee’s investigation identified certain payments made by us to the Former Manager and its affiliates that were not sufficiently documented or that otherwise warrant scrutiny. The Company is considering whether it has a right to seek recovery for any other such payments and, if so, its alternatives for seeking recovery. No asset has been recognized in the financial statements related to any potential recovery. See Note 19 — Related Party Transactions and Arrangements (As Restated) for further discussion.
Property Operating Expenses
Property expenses increased by $20.1 million to $23.6 million for the year ended December 31, 2013 compared to $3.5 million for the year ended December 31, 2012. These costs relate to expenses associated with maintaining certain properties, including real estate taxes, ground lease rent, insurance and repairs and maintenance expenses. The increase in property expenses are primarily due to our acquisition of properties with modified gross leases subsequent to December 31, 2012, and an increased number of properties for which we pay expenses, which are reimbursed by the tenant.
Management Fees to Affiliates
Prior to the consummation of the ARCT III Merger, we paid our Former Manager an annual base management fee equal to 0.50% per annum of the average unadjusted book value of our real estate assets, calculated and payable monthly in advance, provided that the full amount of the distributions we have declared for the six immediately preceding months is equal to or greater than certain net income thresholds related to our operations. Subsequent to the consummation of the ARCT III Merger, we paid our Former Manager an annual base management fee equal to 0.50% per annum for up to $3.0 billion of unadjusted book value of assets and 0.40% of unadjusted book value of assets greater than $3.0 billion. For the years ended December 31, 2013 and 2012, our Former Manager waived base management fees earned of $6.1 million and $1.8 million, respectively.
We may have been required to pay our Former Manager a quarterly incentive fee, equal to the difference between (1) the product of (a) 20% and (b) the excess of our annualized core earnings (as defined in the management agreement with our Former Manager) over the product of (i) the weighted-average number of shares multiplied by the weighted-average issuance price per share of common stock (ii) 8% and (2) the sum of any incentive compensation paid to the our Former Manager with respect to the first three calendar quarters of the previous 12-month period. One half of each quarterly installment of the incentive fee may have been payable in shares of common stock. The remainder of the incentive fee may have been payable in cash. No incentive fees were earned for the years ended December 31, 2013 and 2012, respectively. Subsequent to December 31, 2013, the management agreement was terminated as a result of our transition to self-management. See Note 24 — Subsequent Events (As Restated) for further discussion.
Management fees to affiliates increased by $17.3 million to $17.5 million for the year ended December 31, 2013 compared to $0.2 million for the year ended December 31, 2012. Of the $17.3 million, $5.0 million related to base management fees, $11.7 million related to ARCT III asset management fees settled in OP Units upon the closing of the ARCT III Merger and for services performed during a 60-day period following the ARCT III Merger and $0.8 million related to property management services. For the year ended December 31, 2012, the Former Manager waived all but $0.2 million of base management fees.
General and Administrative Expenses
General and administrative expenses increased by $117.7 million to $123.2 million for the year ended December 31, 2013 compared to $5.5 million for the year ended December 31, 2012. General and administrative expenses increased as a result of higher professional fees, such as legal fees, accountant fees and financial printer services fees, insurance expense, salary-related expenses and board member compensation to support our increased real estate portfolio.
Also, included in general and administrative expenses is equity-based compensation expense, which increased by $99.1 million to $100.3 million for the year ended December 31, 2013 compared to $1.2 million for the year ended December 31, 2012. Equity-based compensation expenses for the current year primarily included expenses for the OPP, which was entered into upon consummation of the ARCT III Merger, as well as the amortization of restricted stock. During the year ended December 31, 2013, we recorded equity-based compensation of $92.3 million for the OPP, of which $59.6 million related to accelerating the vesting of OP units in relation to our transition to self-management and $32.7 million of the expense was locked in based on OPP provisions. During the year ended December 31, 2012, equity-based compensation expense related only to the amortization of restricted stock.
82
Table of Contents
Depreciation and Amortization Expense
Depreciation and amortization expense increased by $170.0 million to $211.0 million for the year ended December 31, 2013 compared to $41.0 million for the year ended December 31, 2012. The increase in depreciation and amortization expense was driven by our acquisition of 1,807 properties since December 31, 2012 for an aggregate purchase price of $3.5 billion.
Impairment of Real Estate
For the year ended December 31, 2013, we recorded an impairment loss of $3.3 million. No impairments were recorded for the year ended December 31, 2012. After reviewing our portfolio for impairment indicators, we performed a recoverability test as of the dates on which the indicators existed. Certain properties failed the recoverability test, as such a fair value analysis was performed to determine the amount of impairment. An impairment loss was calculated based on the difference between the carrying amount of each property and the estimated fair value of each property as of the respective measurement dates.
Interest Expense
Interest expense increased by $93.6 million to $105.5 million for the year ended December 31, 2013 compared to $11.9 million for the year ended December 31, 2012. The increase in interest expense was due to increases in debt balances used to fund portfolio acquisitions, partially offset by a decrease in the weighted-average annualized interest rate on borrowings. The weighted-average debt balances for the years ended December 31, 2013 and 2012 were $1.8 billion and $205.1 million, respectively. The weighted-average annualized interest rate on all debt, including the effect of derivative instruments used to hedge the effects of interest rate volatility but excluding amortization of deferred financing costs and non-usage fees, for the years ended December 31, 2013 and 2012 was 3.40% and 4.16%, respectively.
Our interest expense in future periods will vary based on our level of future borrowings, which will depend on the level of proceeds raised in offerings, our credit rating, the cost of borrowings, and the opportunity to acquire real estate assets which meet our investment objectives.
Other Income, Net
Other income increased by $2.8 million to $3.8 million for the year ended December 31, 2013 compared to other income of $1.0 million for the year ended December 31, 2012. The increase is primarily related to income earned on investments in redeemable preferred stock, senior notes and common stock, all of which were sold as of December 31, 2013, and investment income on certain assets acquired from CapLease during the fourth quarter of the year ended December 31, 2013.
Loss on Derivative Instruments, Net
Loss on the fair value of derivative instruments for the year ended December 31, 2013 was $67.9 million, which primarily consisted of a loss on contingent value rights. The loss pertains to the fair value of our obligation to pay certain preferred and common stockholders for the difference between the value of our shares on certain measurement dates and the value of the shares at the time of issuance as set forth by the contingent value rights agreement. The obligations were settled in full during the year ended December 31, 2013. The loss was partially offset by a gain on derivative instruments resulting from marking our derivative instruments to fair value. No gain or loss on derivative instruments was recorded during the year ended December 31, 2012.
Loss on Sale of Investment in Affiliates
Loss on sale of investment in affiliates for the year ended December 31, 2013 was $0.4 million resulting from the sale of our investment in a real estate fund sponsored by ARC purchased during the year ended December 31, 2013. No loss on the sale of investment in such funds was recorded during the year ended December 31, 2012.
83
Table of Contents
Loss on Sale of Investments
Loss on sale of investment securities, net for the year ended December 31, 2013 of $1.8 million primarily related to a $2.3 million loss on the sale of investments in redeemable preferred stock, senior notes and common stock, all of which were purchased in 2013 and sold as of December 31, 2013, partially offset by a $0.5 million gain on sale of investments in redeemable preferred stock, all of which were purchased in 2012 and sold as of December 31, 2013. The Company did not sell any investment securities during the year ended December 31, 2012.
Net Loss from Discontinued Operations
Net loss from discontinued operations decreased by $0.7 million to a net loss of approximately $34,000 for the year ended December 31, 2013 compared to a net loss of $0.7 million for the year ended December 31, 2012. As of December 31, 2013 and 2012, we classified one property as held for sale on the consolidated balance sheets and reported in discontinued operations on the consolidated statements of operations and comprehensive loss. The net losses from discontinued operations during each year were primarily due to impairment on the held for sale property representing the difference between the carrying value and estimated proceeds from the sale of the property less estimated selling costs.
Comparison of the Year Ended December 31, 2012 to Year Ended December 31, 2011
Rental Income
Rental income increased by $61.5 million to $65.3 million for the year ended December 31, 2012 compared to $3.8 million for the year ended December 31, 2011. Rental income was driven by our acquisition of 573 properties during the year ended December 31, 2012 for an aggregate purchase price of $1.7 billion, as well as revenue for a full year from the 129 properties held as of December 31, 2011. The annualized rental income per square foot of the properties at December 31, 2012 was $9.59 with a weighted-average remaining lease term of 10.4 years, compared to $11.59 per square foot at December 31, 2011. There were no properties held for sale for the full period in each of the years ended December 31, 2012 and 2011.
Operating Expense Reimbursements
Operating expense reimbursements increased by $1.7 million to $1.9 million for the year ended December 31, 2012 compared to $0.2 million for the year ended December 31, 2011. Operating expense reimbursements represent reimbursements for taxes, property maintenance and other charges contractually due from tenants per their respective leases. Operating expense reimbursements were driven by our acquisition of 573 properties during the year ended December 31, 2012 as well as reimbursements for a full year from the 129 properties held as of December 31, 2011.
Acquisition Related Expenses
Acquisition related expenses increased by $41.2 million to $45.1 million for the year ended December 31, 2012 compared to $3.9 million for the year ended December 31, 2011. The increase is driven by our acquisition of 573 properties during the year ended December 31, 2012 compared to 69 during the year ended December 31, 2011. Acquisition and related costs represent the costs related to the acquisition of properties. Acquisition costs mainly consisted of legal costs, deed transfer costs and other costs related to real estate purchase transactions.
Merger and Other Non-routine Transaction Expenses
During the year ended December 31, 2012, expenses related to the merger with ARCT III announced in December 2012 and other transaction costs were $2.6 million. These costs primarily consisted of legal fees, accountant fees and other costs associated with entering into the ARCT III merger agreement. There were no such merger expenses incurred during the year ended December 31, 2011.
Property Expenses
Property expenses increased by $3.3 million to $3.5 million for the year ended December 31, 2012 compared to $0.2 million for the year ended December 31, 2011. These expenses relate to costs associated with maintaining certain properties, including real estate taxes, ground lease rent, insurance and repairs and maintenance expenses. The increase in property expenses is mainly due to our acquisition of properties with modified gross leases during the year ended December 31, 2012 and an increased number of properties for which we pay expenses, which are reimbursed by the tenant.
84
Table of Contents
Management Fees to Affiliates
We paid our Former Manager an annual base management fee equal to 0.50% per annum of the average unadjusted book value of our real estate assets, calculated and payable monthly in advance, provided that the full amount of the distributions we have declared for the six immediately preceding months is equal to or greater than certain net income thresholds related to our operations. Our Former Manager waived such portion of its management fee in excess of such thresholds. For the years ended December 31, 2012 and 2011, our Former Manager waived base management fees earned of $1.8 million and $0.3 million, respectively.
We were required to pay our Former Manager a quarterly incentive fee, calculated based on 20% of the excess our annualized core earnings (as defined in the management agreement with our Former Manager) over the weighted-average number of shares multiplied by the weighted-average price per share of common stock. One half of each quarterly installment of the incentive fee would be payable in shares of common stock. The remainder of the incentive fee would be payable in cash. No incentive fees were earned for the years ended December 31, 2012 and 2011, respectively.
Management fees to affiliates were $0.2 million for the year ended December 31, 2012, compared to no such fees for the year ended December 31, 2011, which was the result of decisions by the Former Manager to not waive base management fees of $0.2 million in 2012 whereas the Former Manager waived all fees in 2011.
General and Administrative Expenses
General and administrative expenses increased by $4.8 million to $5.5 million for the year ended December 31, 2012 compared to $0.7 million for the year ended December 31, 2011. General and administrative expenses increased primarily as a result of higher professional fees, such as legal fees, accountant fees and financial printer services fees, insurance expense and board member compensation to support our increased real estate portfolio.
Depreciation and Amortization Expense
Depreciation and amortization expense increased by $38.9 million to $41.0 million for the year ended December 31, 2012 compared to $2.1 million for the year ended December 31, 2011. The increase in depreciation and amortization expense was driven by our acquisition of 573 properties during the year ended December 31, 2012 for an aggregate purchase price of $1.7 billion as well as depreciation and amortization expense for a full year from the 129 properties held as of December 31, 2011.
Interest Expense
Interest expense increased by $10.9 million to $11.9 million for the year ended December 31, 2012 compared to $1.0 million for the year ended December 31, 2011. The increase primarily related to the increase in debt balances used to fund portfolio acquisitions as the outstanding balance on our senior secured revolving credit facility increased by $82.2 million during the year ended December 31, 2012. Interest expense also related to outstanding mortgage notes payable, which increased $229.8 million during the year ended December 31, 2012, partially offset by a slightly lower weighted-average effective interest rate during 2012 as compared to 2011.
Our interest expense in future periods will vary based on our level of future borrowings, which will depend on the level of proceeds raised in offerings, our credit ratings, the cost of borrowings, and the opportunity to acquire real estate assets which meet our investment objectives.
Other Income, Net
Other income increased by $1.0 million to $1.0 million for the year ended December 31, 2012 compared to approximately $4,000 for the year ended December 31, 2011. The increase was primarily due to income on investment securities purchased during the year ended December 31, 2012.
85
Table of Contents
Net Loss from Discontinued Operations
Net loss from discontinued operations decreased by $0.2 million to $0.7 million for the year ended December 31, 2012 compared to $0.9 million for the year ended December 31, 2011. As of the year ended December 31, 2012 and 2011, we had one and two vacant properties, respectively, classified as held for sale on the consolidated balance sheets and reported in discontinued operations on the consolidated statements of operations and comprehensive loss. The net losses from discontinued operations during each year were primarily due to impairments on the held for sale properties representing the difference between the carrying value and estimated proceeds from the sale of the properties less estimated selling costs. On July 3, 2012, one of the properties was sold for $0.6 million of net proceeds.
Cash Flows for the Year Ended December 31, 2013 (As Restated)
During the year ended December 31, 2013, net cash provided by operating activities was $11.9 million. The level of cash flows used in or provided by operating activities is affected by acquisition and transaction costs, the timing of interest payments, as well as the receipt of scheduled rent payments. Cash flows provided by operating activities during the year ended December 31, 2013 included adjusted net loss of 43.9 million (net loss of $507.8 million adjusted for non-cash items, the most significant of which were depreciation and amortization expense, the issuance of operating partnership units, equity-based compensation, and the loss on extinguishment of Series C Stock, which totaled to $446.3 million, in the aggregate). In addition, we incurred a one-time expense related to the loss in the extinguishment of Series C Convertible Preferred Stock (“Series C Stock”) of $13.7 million. Cash inflows included an increase in accounts payable and accrued expenses of $20.8 million and an increase in deferred rent and other liabilities of $8.6 million, partially offset by an increase in prepaid and other assets of $19.9 million.
Net cash used in investing activities for the year ended December 31, 2013 of $4.5 billion primarily related to the investment in real estate assets and the CapLease Merger of $4.4 billion, deposits for real estate investments of $101.9 million, the purchase of investment securities of $81.6 million and investments in direct financing leases of $68.6 million, partially offset by the proceeds from the sales of investment securities of $119.5 million.
Net cash provided by financing activities was $4.3 billion during the year ended December 31, 2013. This was primarily driven by the issuance of stock and debt during the year, most notably $2.0 billion of proceeds net of offering-related costs from the issuance of common stock, $1.7 billion of proceeds, net of repayments, from our credit facilities, $967.8 million of proceeds from the issuance of convertible debt and $288.0 million of proceeds from the issuance of Series D Preferred Stock and $30.9 million of contributions from non-controlling interest holders. These inflows were partially offset by cash outflows, the most significant of which were common stock repurchases of $359.2 million, total distributions paid of $243.1 million, payments of deferred financing costs of $101.2 million and payments on mortgage notes and other debt of $15.1 million.
Cash Flows for the Year Ended December 31, 2012
During the year ended December 31, 2012, net cash provided by operating activities was $9.4 million. The level of cash flows used in or provided by operating activities is affected by acquisition and transaction costs, the timing of interest payments, as well as the receipt of scheduled rent payments. Cash flows provided by operating activities during the year ended December 31, 2012 was primarily due to an increase in adjusted net income of $2.7 million (net loss of $42.2 million adjusted for non-cash items, the most significant of which were depreciation and amortization expense and equity-based compensation, which totaled $44.4 million, in the aggregate). Cash inflows included an increase in accounts payable and accrued expenses of $8.3 million and in increase in deferred rent and other liabilities of $3.5 million, partially offset by an increase in prepaid and other assets of $5.1 million.
Net cash used in investing activities for the year ended December 31, 2012 was $1.7 billion, primarily related to an increase in investment in real estate assets paid for with cash of $1.7 billion and the purchase of investment securities of $41.7 million.
Net cash provided by financing activities of $2.0 billion during the year ended December 31, 2012 primarily related to cash inflows from the issuances of stock and debt, most notably $1.7 billion of proceeds net of offering-related costs from the issuance of common and preferred stock, $229.8 million of proceeds from mortgage notes payable and $82.2 million of proceeds from our senior secured revolving credit facility. These inflows were partially offset by cash outflows, most notably by total distributions paid of $38.3 million and payments related to deferred financing costs of $14.0 million.
86
Table of Contents
Liquidity and Capital Resources
In the normal course of business, our principal demands for funds will continue to be for property acquisitions, either directly or through investment interests, for the payment of operating expenses, distributions to our investors and for the payment of principal and interest on our outstanding indebtedness. We expect to meet our future short-term operating liquidity requirements through net cash provided by our current property operations. Management expects that our properties will generate sufficient cash flow to cover all operating expenses and the payment of a monthly distribution. The majority of our net leases contain contractual rent escalations during the primary term of the lease. Other potential future sources of capital include proceeds from secured or unsecured financings from banks or other lenders, proceeds from offerings, including our ATM program, proceeds from the sale of properties and undistributed funds from operations. With the stabilization of the investment portfolio, we expect to significantly increase the amount of cash flow generated from operating activities in future periods. Such increased cash flow will positively impact the amount of funds available for dividends.
As of December 31, 2013, we had $52.7 million of cash and cash equivalents.
Sources of Funds
Funds from Operations and Adjusted Funds from Operations (As Corrected)
Due to certain unique operating characteristics of real estate companies, as discussed below, the National Association of Real Estate Investment Trusts, Inc. (“NAREIT”), an industry trade group, has promulgated a measure known as funds from operations (“FFO”), which we believe to be an appropriate supplemental measure to reflect the operating performance of a REIT. The use of FFO is recommended by the REIT industry as a supplemental performance measure. FFO is not equivalent to our net income or loss as determined under U.S. GAAP.
We define FFO, a non-GAAP measure, consistent with the standards established by the White Paper on FFO approved by the Board of Governors of NAREIT, as revised in February 2004 (the “White Paper”). The White Paper defines FFO as net income or loss computed in accordance with U.S. GAAP, excluding gains or losses from sales of property, depreciation and amortization of real estate assets and impairment write-downs. These adjustments also include the Company’s pro rata share of unconsolidated partnerships and joint ventures. Our FFO calculation complies with NAREIT’s policy described above.
The historical accounting convention used for real estate assets requires straight-line depreciation of buildings and improvements, which implies that the value of real estate assets diminishes predictably over time, especially if such assets are not adequately maintained or repaired and renovated as required by relevant circumstances and/or is requested or required by lessees for operational purposes in order to maintain the value disclosed. We believe that, since real estate values historically rise and fall with market conditions, including inflation, interest rates, the business cycle, unemployment and consumer spending, presentations of operating results for a REIT using historical accounting for depreciation may be less informative. Historical accounting for real estate involves the use of U.S. GAAP. Any other method of accounting for real estate such as the fair value method cannot be construed to be any more accurate or relevant than the comparable methodologies of real estate valuation found in U.S. GAAP. Nevertheless, we believe that the use of FFO, which excludes the impact of real estate related depreciation and amortization, provides a more complete understanding of our performance to investors and to management, and when compared year over year, reflects the impact on our operations from trends in occupancy rates, rental rates, operating costs, general and administrative expenses, and interest costs, which may not be immediately apparent from net income. However, FFO and adjusted funds from operations (“AFFO”), as described below, should not be construed to be more relevant or accurate than the current U.S. GAAP methodology in calculating net income or in its applicability in evaluating our operating performance. The method utilized to evaluate the value and performance of real estate under U.S. GAAP should be construed as a more relevant measure of operational performance and considered more prominently than the non-GAAP FFO and AFFO measures and the adjustments to U.S. GAAP in calculating FFO and AFFO.
87
Table of Contents
We consider FFO and AFFO useful indicators of the performance of a REIT. Because FFO calculations exclude such factors as depreciation and amortization of real estate assets and gains or losses from sales of operating real estate assets (which can vary among owners of identical assets in similar conditions based on historical cost accounting and useful-life estimates), they facilitate comparisons of operating performance between periods and between other REITs in our peer group. Accounting for real estate assets in accordance with U.S. GAAP implicitly assumes that the value of real estate assets diminishes predictably over time. Since real estate values have historically risen or fallen with market conditions, many industry investors and analysts have considered the presentation of operating results for real estate companies that use historical cost accounting to be insufficient by themselves.
Changes in the accounting and reporting promulgations under GAAP (for acquisition fees and expenses from a capitalization/depreciation model to an expensed-as-incurred model) that were put into effect in 2009 and other changes to GAAP accounting for real estate subsequent to the establishment of NAREIT’s definition of FFO have prompted an increase in cash-settled expenses, specifically acquisition fees and expenses for all industries as items that are expensed under GAAP, that are typically accounted for as operating expenses. Management believes these fees and expenses do not affect our overall long-term operating performance. While certain companies may experience significant acquisition activity, other companies may not have significant acquisition activity and management believes that excluding costs such as merger and transaction costs and acquisition related costs from property operating results provides useful information to investors and provides information that improves the comparability of operating results with other companies who do not have significant merger or acquisition activities. AFFO is not equivalent to our net income or loss as determined under GAAP, and AFFO may not be a useful measure of the impact of long-term operating performance if we continue to have such activities in the future.
We exclude certain income or expense items from AFFO that we consider more reflective of investing activities, other non-cash income and expense items and the income and expense effects of other activities that are not a fundamental attribute of our business plan. These items include unrealized gains and losses, which may not ultimately be realized, such as gains or losses on derivative instruments, gains and losses on investments and early extinguishment of debt. In addition, by excluding non-cash income and expense items such as amortization of above and below market leases, amortization of deferred financing costs, straight-line rent, net direct financing lease adjustments and equity-based compensation from AFFO we believe we provide useful information regarding income and expense items which have no cash impact and do not provide us liquidity or require our capital resources. By providing AFFO, we believe we are presenting useful information that assists investors and analysts to better assess the sustainability of our ongoing operating performance without the impacts of transactions that are not related to the ongoing profitability of our portfolio of properties. We also believe that AFFO is a recognized measure of sustainable operating performance by the REIT industry. Further, we believe AFFO is useful in comparing the sustainability of our operating performance with the sustainability of the operating performance of other real estate companies that are not as involved in activities which are excluded from our calculation. Investors are cautioned that AFFO should only be used to assess the sustainability of our operating performance excluding these activities, as it excludes certain costs that have a negative effect on our operating performance during the periods in which these costs are incurred.
In addition, we exclude certain interest expenses related to securities that are convertible to common stock as the shares are assumed to have converted to common stock in our calculation of weighted-average common shares-fully diluted.
88
Table of Contents
In calculating AFFO, we exclude expenses, which under GAAP are characterized as operating expenses in determining operating net income. These expenses are paid in cash by us, and therefore such funds will not be available to distribute to investors. All paid and accrued merger and acquisition fees and certain other expenses negatively impact our operating performance during the period in which expenses are incurred or properties are acquired and will have negative effects on returns to investors, the potential for future distributions, and cash flows generated by us, unless earnings from operations or net sales proceeds from the disposition of other properties are generated to cover the purchase price of the property and certain other expenses. Therefore, AFFO may not be an accurate indicator of our operating performance, especially during periods in which mergers are being consummated or properties are being acquired or certain other expenses are being incurred. AFFO that excludes such costs and expenses would only be comparable to companies that did not have such activities. Further, under GAAP, certain contemplated non-cash fair value and other non-cash adjustments are considered operating non-cash adjustments to net income in determining cash flow from operating activities. In addition, we view fair value adjustments as items which are unrealized and may not ultimately be realized. We view both gains and losses from fair value adjustments as items which are not reflective of ongoing operations and are therefore typically adjusted for when assessing operating performance. Excluding income and expense items detailed above from our calculation of AFFO provides information consistent with management’s analysis of the operating performance of the properties. Additionally, fair value adjustments, which are based on the impact of current market fluctuations and underlying assessments of general market conditions, but can also result from operational factors such as rental and occupancy rates, may not be directly related or attributable to our current operating performance. By excluding such changes that may reflect anticipated and unrealized gains or losses, we believe AFFO provides useful supplemental information.
As a result, we believe that the use of FFO and AFFO, together with the required U.S. GAAP presentations, provide a more complete understanding of our performance relative to our peers and a more informed and appropriate basis on which to make decisions involving operating, financing, and investing activities.
FFO and AFFO are non-GAAP financial measures and do not represent net income as defined by U.S. GAAP. FFO and AFFO do not represent cash flows from operations as defined by U.S. GAAP, are not indicative of cash available to fund all cash flow needs and liquidity, including our ability to pay distributions and should not be considered as alternatives to net income, as determined in accordance with U.S. GAAP, for purposes of evaluating our operating performance. Other REITs may not define FFO in accordance with the current NAREIT definition (as we do) or may interpret the current NAREIT definition differently than we do and/or calculate AFFO differently than we do. Consequently, our presentation of FFO and AFFO may not be comparable to other similarly titled measures presented by other REITs.
As discussed in the Explanatory Note to this Form 10-K/A, the investigation conducted by the Audit Committee concluded that the Company erroneously calculated AFFO and/or AFFO per share for the years ended December 31, 2013, 2012 and 2011 due in part to errors in reflecting non-controlling interests. We are now presenting the restated FFO and AFFO using two methods: 1) we calculate FFO and AFFO on a gross basis, whereby we start with net income attributable to both the stockholders and the non-controlling interest holders, and then adjust net income by the gross reported amounts of the items being adjusted (“Gross Method”); and 2) we calculate FFO and AFFO on a net basis, whereby we start with net income attributable only to the stockholders, and adjust net income by only the stockholders’ portion of the applicable items (“Net Method”). For presentation of the Net Method, the company has included the gross amounts of each adjustment on their respective line items and adjusted for the proportionate share which is attributable to non-controlling interest on a separate line item within FFO and AFFO.
The calculation of AFFO per share follows the same logic. Under the Gross Method, AFFO is divided by a share number that takes into account the dilutive effect of units held by the non-controlling interest holders; under the Net Method, AFFO is divided by a share number that reflects only the dilutive effects of common shares. While the two methods generally result in the same per share value, the treatment of certain dilutive securities may result in different per share values under the respective methods.
89
Table of Contents
The tables below reflect the two methods of calculating FFO and AFFO for the years ended December 31, 2013, 2012 and 2011 (in thousands, except share and per share data).
Net Method
| Year Ended December 31, | ||||||||||||
| 2013 | 2012 | 2011 | ||||||||||
| (As Corrected) | (As Corrected) | (As Corrected) | ||||||||||
| Net loss attributable to stockholders |
$ | (491,499 | ) | $ | (41,652 | ) | $ | (4,699 | ) | |||
| Loss on disposition of properties a |
— | 600 | 815 | |||||||||
| Depreciation and amortization of real estate assets a |
210,976 | 40,957 | 2,097 | |||||||||
| Impairment of real estate a |
3,346 | — | — | |||||||||
| Proportionate share of adjustments for non-controlling interests (1) |
(7,899 | ) | (719 | ) | (64 | ) | ||||||
|
|
|
|
|
|
|
|||||||
| FFO attributable to stockholders |
(285,076 | ) | (814 | ) | (1,851 | ) | ||||||
| Acquisition related b |
76,113 | 45,070 | 3,898 | |||||||||
| Merger and other non-routine transactions b |
210,543 | 2,603 | — | |||||||||
| Loss on sale of investment securities b |
2,206 | — | — | |||||||||
| Loss on derivative instruments, net b |
67,946 | — | 2 | |||||||||
| Interest on convertible obligation to preferred investors b |
10,802 | — | — | |||||||||
| Interest premiums and discounts on debt, net and settlement of convertible obligation to preferred investors b |
12,072 | — | — | |||||||||
| Amortization of above- and below-market lease assets and liabilities b |
(178 | ) | 118 | — | ||||||||
| Net direct financing lease adjustments b |
496 | — | — | |||||||||
| Amortization and write off of deferred financing costs b |
29,161 | 1,985 | 186 | |||||||||
| Other amortization and non-cash charges b |
172 | 46 | 14 | |||||||||
| Straight-line rent b |
(15,272 | ) | (2,212 | ) | (240 | ) | ||||||
| Non-cash equity compensation expense b |
100,261 | 1,197 | 191 | |||||||||
| Proportionate share of adjustments for non-controlling interests (2) |
(16,830 | ) | (622 | ) | (89 | ) | ||||||
|
|
|
|
|
|
|
|||||||
| AFFO attributable to stockholders |
$ | 192,416 | $ | 47,371 | $ | 2,111 | ||||||
|
|
|
|
|
|
|
|||||||
| Weighted-average shares outstanding - basic (3) |
205,341,431 | 103,306,366 | 3,720,351 | |||||||||
| Effect of dilutive securities |
16,037,245 | 528,919 | 61,318 | |||||||||
|
|
|
|
|
|
|
|||||||
| Weighted-average shares outstanding - diluted (4) |
221,378,676 | 103,835,285 | 3,781,669 | |||||||||
| AFFO attributable to stockholders per diluted share |
$ | 0.87 | $ | 0.46 | $ | 0.56 | ||||||
| (1) | Includes proportionate share attributable to non-controlling interests of the adjustments denoted with “a”. |
| (2) | Includes proportionate share attributable to non-controlling interests of the adjustments denoted with “b”. |
| (3) | Weighted-average shares for the year ended December 31, 2013 are adjusted as if the acquisition of all outstanding shares of ARCT IV common stock for cash in conjunction with the ARCT IV Merger had been completed at inception. |
| (4) | Weighted-average shares for the year ended December 31, 2013 excludes the effect of the convertible debt as the effect would be antidilutive. |
90
Table of Contents
Gross Method
| Year Ended December 31, | ||||||||||||
| 2013 | 2012 | 2011 | ||||||||||
| (As Corrected) | (As Corrected) | (As Corrected) | ||||||||||
| Net loss (in accordance with U.S. GAAP) |
$ | (507,815 | ) | $ | (42,237 | ) | $ | (4,804 | ) | |||
| Loss on disposition of properties |
— | 600 | 815 | |||||||||
| Depreciation and amortization of real estate assets |
210,976 | 40,957 | 2,097 | |||||||||
| Impairment of real estate |
3,346 | — | — | |||||||||
|
|
|
|
|
|
|
|||||||
| FFO |
(293,493 | ) | (680 | ) | (1,892 | ) | ||||||
| Acquisition related |
76,113 | 45,070 | 3,898 | |||||||||
| Merger and other non-routine transactions |
210,543 | 2,603 | — | |||||||||
| Loss on sale of investment securities |
2,206 | — | — | |||||||||
| Loss on derivative instruments, net |
67,946 | — | 2 | |||||||||
| Interest on convertible obligation to preferred investors |
10,802 | — | — | |||||||||
| Interest premiums and discounts on debt, net and settlement of convertible obligation to preferred investors |
12,072 | — | — | |||||||||
| Amortization of above- and below-market lease assets and liabilities |
(178 | ) | 118 | — | ||||||||
| Net direct financing lease adjustments |
496 | — | — | |||||||||
| Amortization and write off of deferred financing costs |
29,161 | 1,985 | 186 | |||||||||
| Other amortization and non-cash charges |
172 | 46 | 14 | |||||||||
| Straight-line rent |
(15,272 | ) | (2,212 | ) | (240 | ) | ||||||
| Non-cash equity compensation expense |
100,261 | 1,197 | 191 | |||||||||
|
|
|
|
|
|
|
|||||||
| AFFO |
$ | 200,829 | $ | 48,127 | $ | 2,159 | ||||||
|
|
|
|
|
|
|
|||||||
| Weighted-average shares outstanding - basic (1) |
205,341,431 | 103,306,366 | 3,720,351 | |||||||||
| Dilutive effect of restricted share awards |
25,223,423 | 1,316,197 | 160,688 | |||||||||
|
|
|
|
|
|
|
|||||||
| Weighted-average shares outstanding - diluted (2) |
230,564,854 | 104,622,563 | 3,881,039 | |||||||||
| AFFO per share |
$ | 0.87 | $ | 0.46 | $ | 0.56 | ||||||
| (1) | Weighted-average shares for the year ended December 31, 2013 are adjusted as if the acquisition of all outstanding shares of ARCT IV common stock for cash in conjunction with the ARCT IV Merger had been completed at inception. |
| (2) | Weighted-average shares for the year ended December 31, 2013 excludes the effect of the convertible debt as the effect would be antidilutive. |
91
Table of Contents
The following tables present the combined impact of all changes to the applicable line items in the Company’s previously issued FFO and AFFO presentations using the Net Method for the years ended December 31, 2013, 2012 and 2011 (amounts in thousands):
Net Method
| Year Ended December 31, 2013 | ||||||||||||||||
| As Previously Reported (1) |
Methodology Adjustments (2) |
Error Corrections (3) |
As Corrected | |||||||||||||
| Net loss attributable to stockholders |
$ | (474,740 | ) | $ | — | $ | (16,759 | ) | $ | (491,499 | ) | |||||
| (Gain) loss on held for sale properties a |
(14 | ) | — | 14 | — | |||||||||||
| Depreciation and amortization a |
211,372 | (46 | ) (6) | (350 | ) | 210,976 | ||||||||||
| Impairment of real estate a |
— | — | 3,346 | 3,346 | ||||||||||||
| Proportionate share of adjustments for non-controlling interests (4) |
— | (7,789 | ) | (110 | ) | (7,899 | ) | |||||||||
|
|
|
|
|
|
|
|
|
|||||||||
| FFO attributable to stockholders |
(263,382 | ) | (7,835 | ) | (13,859 | ) | (285,076 | ) | ||||||||
| Acquisition related b |
76,136 | — | (23 | ) | 76,113 | |||||||||||
| Merger and other non-routine transactions b |
278,319 | — | (67,776 | ) | 210,543 | |||||||||||
| Loss on sale of investment securities b |
2,206 | — | — | 2,206 | ||||||||||||
| Loss on derivative instruments, net b |
67,946 | — | — | 67,946 | ||||||||||||
| Interest on convertible obligation to preferred investors b |
10,802 | — | — | 10,802 | ||||||||||||
| Interest premiums and discounts on debt, net and settlement of convertible obligations to preferred investors b |
12,072 | — | — | 12,072 | ||||||||||||
| Amortization of above- and below- market lease assets and liabilities b |
(178 | ) | — | — | (178 | ) | ||||||||||
| Net direct financing lease adjustments b |
— | 496 | (7) | — | 496 | |||||||||||
| Amortization and write off of deferred financing costs b |
26,895 | — | 2,266 | 29,161 | ||||||||||||
| Other amortization and non-cash charges b |
— | 172 | (6)(7) | — | 172 | |||||||||||
| Straight-line rent b |
(15,058 | ) | (214 | ) (8) | — | (15,272 | ) | |||||||||
| Non-cash equity compensation expense b |
34,962 | — | 65,299 | 100,261 | ||||||||||||
| Operating fees to affiliate b |
5,654 | (5,654 | ) (9) | — | — | |||||||||||
| Proportionate share of adjustments for non-controlling interests (5) |
— | (16,944 | ) | 114 | (16,830 | ) | ||||||||||
|
|
|
|
|
|
|
|
|
|||||||||
| AFFO attributable to stockholders |
$ | 236,374 | $ | (29,979 | ) | $ | (13,979 | ) | $ | 192,416 | ||||||
|
|
|
|
|
|
|
|
|
|||||||||
| Weighted-average shares outstanding — diluted |
221,378,676 | — | — | 221,378,676 | ||||||||||||
| AFFO attributable to the stockholders per share |
$ | 1.07 | (8) | $ | (0.14 | ) | $ | (0.06 | ) | $ | 0.87 | |||||
| (1) | The numbers in this column reflect the recasting of the Company’s historical financial statements to present the effects of the Company’s acquisition of ARCT IV, an entity previously deemed to be under common control with the Company, as if it had been completed at inception, as previously disclosed in the Company’s Current Report on Form 8-K, dated May 20, 2014. |
| (2) | The adjustments in this column reflect the “Net Method” for adjusting for non-controlling interests and certain other methodology adjustments. |
| (3) | The adjustments in this column reflect the restatement. See Note 2 — Restatement of Previously Issued Financial Statements to the consolidated financial statements for further explanation on adjustments. |
| (4) | Includes proportionate share attributable to non-controlling interests of the adjustments denoted with “a”. |
| (5) | Includes proportionate share attributable to non-controlling interests of the adjustments denoted with “b”. |
| (6) | Reclassification between line items to properly show non-real estate related amortization below in AFFO. |
| (7) | In reviewing its AFFO methodology, the Company has determined that it is appropriate to include certain adjustments that were not included in the previously reported AFFO calculation. These adjustments include $496,000 for net direct financing lease adjustments and $126,000 for straight line rent expense. |
| (8) | AFFO per share was not previously reported in the Original Filing although it was has been calculated utilizing the previously reported adjusted funds from operations and weighted average shares of 221,378,676. |
92
Table of Contents
| (8) | The original Filing presented this line item net of the proportionate share for non-controlling interest. A “gross up” adjustment has been made to include the amount attributable to non-controlling interest in order to show all proportionate adjustments for non-controlling interests on one line item called “Proportionate share of adjustments for non-controlling interest.” |
| (9) | In reviewing its AFFO methodology, the Company has determined that it was not appropriate to adjust for operating fees incurred to affiliates as these expenses represent operating expenses that are typical for the industry. |
| Year Ended December 31, 2012 | ||||||||||||||||
| As Previously Reported (1) |
Methodology Adjustments (2) |
Error Corrections (3) |
As Corrected | |||||||||||||
| Net loss attributable to stockholders |
$ | (41,936 | ) | $ | — | $ | 284 | $ | (41,652 | ) | ||||||
| Loss on held for sale properties a |
600 | — | — | 600 | ||||||||||||
| Depreciation and amortization a |
41,003 | (46 | ) (6) | — | 40,957 | |||||||||||
| Proportionate share of adjustments for non-controlling interests (4) |
— | (719 | ) | — | (719 | ) | ||||||||||
|
|
|
|
|
|
|
|
|
|||||||||
| FFO attributable to stockholders |
(333 | ) | (765 | ) | 284 | (814 | ) | |||||||||
| Acquisition related b |
45,070 | — | — | 45,070 | ||||||||||||
| Merger and other non-routine transactions b |
2,603 | — | — | 2,603 | ||||||||||||
| Amortization of above- and below- market lease assets and liabilities b |
110 | 8 | (7) | — | 118 | |||||||||||
| Amortization of deferred financing costs b |
1,985 | — | — | 1,985 | ||||||||||||
| Other amortization and non-cash charges b |
— | 46 | (6) | — | 46 | |||||||||||
| Straight-line rent b |
(2,165 | ) | (47 | ) (7) | — | (2,212 | ) | |||||||||
| Non-cash equity compensation expense b |
1,197 | — | — | 1,197 | ||||||||||||
| Operating fees to affiliate b |
212 | (212 | ) (8) | — | — | |||||||||||
| Proportionate share of adjustments for non-controlling interests (5) |
— | (622 | ) | — | (622 | ) | ||||||||||
|
|
|
|
|
|
|
|
|
|||||||||
| AFFO attributable to stockholders |
$ | 48,679 | $ | (1,592 | ) | $ | 284 | $ | 47,371 | |||||||
|
|
|
|
|
|
|
|
|
|||||||||
| (1) | The numbers in this column reflect the recasting of the Company’s historical financial statements to present the effects of the Company’s acquisition of ARCT IV, an entity previously deemed to be under common control with the Company, as if it had been completed at inception, as previously disclosed in the Company’s Current Report on Form 8-K, dated May 20, 2014. |
| (2) | The adjustments in this column reflect the “Net Method” for adjusting for non-controlling interests and certain other methodology adjustments. |
| (3) | The adjustments in this column reflect the restatement. See Note 2 — Restatement of Previously Issued Financial Statements to the consolidated financial statements for further explanation on adjustments. |
| (4) | Includes proportionate share attributable to non-controlling interests of the adjustments denoted with “a”. |
| (5) | Includes proportionate share attributable to non-controlling interests of the adjustments denoted with “b”. |
| (6) | Reclassification between line items to properly show non-real estate related amortization below in AFFO. |
| (7) | The previously reported AFFO calculation presented this line item net of the proportionate share for non-controlling interest. A “gross up” adjustment has been made to include the amount attributable to non-controlling interest in order to show all proportionate adjustments for non-controlling interests on one line item called “Proportionate share of adjustments for non-controlling interest.” |
| (8) | In reviewing its AFFO methodology, the Company has determined that it was not appropriate to adjust for operating fees incurred to affiliates as these expenses represent operating expenses that are typical for the industry. |
93
Table of Contents
| Year Ended December 31, 2011 | ||||||||||||
| As Previously Reported (1) |
Methodology Adjustments (2) |
As Corrected | ||||||||||
| Net loss attributable to stockholders |
$ | (4,699 | ) | $ | — | $ | (4,699 | ) | ||||
| Loss on held for sale properties a |
815 | — | 815 | |||||||||
| Depreciation and amortization a |
2,111 | (14 | ) (5) | 2,097 | ||||||||
| Proportionate share of adjustments for non-controlling interests (3) |
— | (64 | ) (2)(3) | (64 | ) | |||||||
|
|
|
|
|
|
|
|||||||
| FFO attributable to stockholders |
(1,773 | ) | (78 | ) | (1,851 | ) | ||||||
| Acquisition related b |
3,898 | — | 3,898 | |||||||||
| Loss on derivative instruments b |
2 | — | 2 | |||||||||
| Amortization of deferred financing costs b |
186 | — | 186 | |||||||||
| Other amortization and non-cash charges b |
— | 14 | (5) | 14 | ||||||||
| Straight-line rent b |
(229 | ) | (11 | ) (6) | (240 | ) | ||||||
| Non-cash equity compensation expense b |
191 | — | 191 | |||||||||
| Proportionate share of adjustments for non-controlling interests (4) |
— | (89 | ) (2)(4) | (89 | ) | |||||||
|
|
|
|
|
|
|
|||||||
| AFFO attributable to stockholders |
$ | 2,275 | $ | (164 | ) | $ | 2,111 | |||||
|
|
|
|
|
|
|
|||||||
| (1) | The numbers in this column reflect the recasting of the Company’s historical financial statements to present the effects of the Company’s acquisition of ARCT IV, an entity previously deemed to be under common control with the Company, as if it had been completed at inception, as previously disclosed in the Company’s Current Report on Form 8-K, dated May 20, 2014. |
| (2) | The adjustments in this column reflect the “Net Method” for adjusting for non-controlling interests and certain other methodology adjustments. |
| (3) | Includes proportionate share attributable to non-controlling interests of the adjustments denoted with “a”. |
| (4) | Includes proportionate share attributable to non-controlling interests of the adjustments denoted with “b”. |
| (5) | Reclassification between line items to properly show non-real estate related depreciation and amortization below FFO. |
| (6) | The previously reported AFFO calculation presented this line item net of the proportionate share for non-controlling interest. A “gross up” adjustment has been made to include the amount attributable to non-controlling interest in order to show all proportionate adjustments for non-controlling interests on one line item called “Proportionate share of adjustments for non-controlling interest.” |
94
Table of Contents
Capital Markets
The following are our equity offerings of common stock during the year ended December 31, 2013 (dollar amounts in millions):
| Type of offering |
Closing Date | Number of Shares (1) | Gross Proceeds | |||||||
| Registered follow-on offering |
January 29, 2013 | 2,070,000 | $ | 26.8 | ||||||
| ATM |
January 1 - April 17, 2013 | 553,300 | 8.9 | |||||||
| Private placement offering |
June 7, 2013 | 29,411,764 | 455.0 | |||||||
| Private placement offering |
November 12, 2013 | 15,126,498 | 186.0 | |||||||
|
|
|
|
|
|||||||
| Total - Year end December 31, 2013 |
47,161,562 | $ | 676.7 | |||||||
|
|
|
|
|
|||||||
| (1) | Excludes 140.7 million shares of common stock that were issued to the stockholders of ARCT III’s common stock in conjunction with the ARCT III Merger. |
On August 1, 2012, we filed a $500.0 million universal shelf registration statement and a resale registration statement with the SEC. Each registration statement became effective on August 17, 2012. As of December 31, 2013, we had issued 2.1 million shares of common stock through a registered follow on offering and an ATM offering under the $500.0 million universal shelf registration statement. No preferred stock, debt or equity-linked security had been issued under the universal shelf registration statement. The resale registration statement, as amended, registers the resale of up to 1,882,248 shares of common stock issued in connection with any future conversion of certain currently outstanding restricted shares, convertible preferred stock or limited partnership interests in the OP. As of December 31, 2013, no common stock had been issued under the resale registration statement.
On March 14, 2013, we filed a universal automatic shelf registration statement and achieved well-known seasoned issuer (“WKSI”) status. As a result of the delayed filing of certain of our periodic reports with the SEC, we are not currently eligible to use a shelf registration statement for the offer and sale of our securities.
In January 2013, we commenced an “at the market” equity offering program (“ATM”) in which we may from time to time offer and sell shares of our common stock having an aggregate offering proceeds of up to $60.0 million. The shares will be issued pursuant to our $500.0 million universal shelf registration statement.
In addition to our common stock offerings, on June 7, 2013, we issued 28.4 million shares convertible preferred stock (the “Series C Shares”) for gross proceeds of $445.0 million. On November 12, 2013, we converted all outstanding Series C Shares into our common stock. Pursuant to the Series C Articles Supplementary, the number of shares of common stock that could be issued upon conversion of Series C Shares was limited to an exchange cap. Therefore, we converted 1.1 million Series C Shares into 1.4 million shares of our common stock. With respect to the 27.3 million Series C Shares for which we could not issue shares of our common stock upon conversion due to the exchange cap, we paid holders of Series C Shares an aggregate cash amount equal to approximately $441.4 million in exchange for such Series C Shares. Based on our share price on the conversion date, the total settlement value was $458.8 million. See Note 12 — Other Debt in the consolidated financial statements for a description of the conversion features of the Series C Convertible Preferred Stock.
On September 15, 2013, we entered into definitive purchase agreements pursuant to which we agreed to issue Series D Preferred Stock, par value $0.01 per share, and common stock, par value $0.01 per share, to certain institutional holders promptly following the close of our merger with CapLease. Pursuant to the definitive purchase agreements, we issued approximately 21.7 million shares of Series D Preferred Stock and 15.1 million shares of common stock, for gross proceeds of $288.0 million and $186.0 million, respectively, on November 12, 2013.
Upon consummation of the ARCT IV merger on January 3, 2014, 42.2 million shares of Series F Preferred Stock were issued to ARCT IV stockholders. There were no shares issued and outstanding of Series F Preferred Stock as of December 31, 2013. See Note 17 — Preferred and Common Stock (As Restated) in the consolidated financial statements for a description of the Series D Preferred Stock and Series F Preferred Stock.
See Note 24 — Subsequent Events (As Restated) for significant subsequent events.
95
Table of Contents
Availability of Funds from Credit Facilities (As Restated)
We and our OP are parties to a credit facility with Wells Fargo, National Association , as administrative agent and other lenders party thereto (the “Credit Facility”).
At December 31, 2013, the Credit Facility has commitments of $2.4 billion. The Credit Facility has an accordion feature, which, if exercised in full, would allow us to increase borrowings under the Credit Facility to $3.0 billion, subject to additional lender commitments and borrowing base availability.
At December 31, 2013, the Credit Facility contains a $940.0 million term loan facility and a $1.5 billion revolving credit facility, of which $940.0 million and $119.8 million was outstanding, respectively. Loans under the Credit Facility are priced at the applicable rate (at our election, either a floating interest rate based on one month LIBOR, determined on a daily basis, or LIBOR for a period of one, three or six months), plus 2.25% to 3.00%, decreasing to 1.60% to 2.20% upon the satisfaction of certain conditions set forth in the credit agreement relating to the credit facility), based upon our current leverage. To the extent that we receive an investment grade credit rating as determined by a major credit rating agency, and upon the satisfaction of certain other conditions set forth in the credit agreement relating to the Credit Facility, at our election, advances under the revolving credit facility will be priced at the applicable rate plus 0.90% to 1.75% and term loans will be priced at the applicable rate plus 1.15% to 2.00%, in each case, based upon our then current investment grade credit rating.
The Credit Facility provides for monthly interest payments. Upon the occurrence of an event of default, the agent acting at the request or with the consent of lenders holding a majority of the loans and commitments under the Credit Facility, may declare the Credit Facility commitments to be terminated, and may accelerate the payment on any unpaid principal amount of all outstanding loans. We have guaranteed the obligations under the Credit Facility. The revolving credit facility will terminate on February 14, 2017 and the term loan facility will terminate on February 14, 2018, in each case, unless extended in accordance with the terms of the credit facility. At any time, upon timely notice by us, we may prepay borrowings under the credit facility. We incur an unused fee of 0.15% to 0.25% per annum on the unused amount of the revolving credit commitments, based on our usage of the revolving credit facility, which unused fee will decrease 0.12% to 0.35% per annum, based upon our then current investment grade credit rating, to the extent we have elected for the interest rate margin applicable to the outstanding advances under the credit facility to be governed by our credit rating as set forth above. To the extent that any delayed draw commitments remain undrawn, we will incur an unused fee of 0.25% per annum on the unused amount of such commitments. The Credit Facility also required us to maintain certain property available for collateral as a condition to funding, but this requirement was eliminated pursuant to an amendment effective February 7, 2014. See also “Our inability to file and deliver our financial statements and certain other financial deliverables required under the terms of our Credit Agreement and the indentures governing our senior unsecured notes has adversely affected our overall borrowing flexibility, exposed us to the possibility of default and required us to pay certain additional expenses,” for a description of certain provisions of our Amended Credit Agreement which have subsequently become effective. Refer to Note 24 – Subsequent Events (As Restated) included in this Amendment No. 2 to Annual Report on Form 10-K/A for further discussion on significant recent events.
Principal Use of Funds
Acquisitions
Generally, cash needs for property acquisitions will be met through proceeds from the public or private offerings of debt and equity and other financings. We may also from time to time enter into other agreements with third parties whereby third parties will make equity investments in specific properties or groups of properties that we acquire.
We evaluate potential acquisitions of real estate and real estate-related assets and engage in negotiations with sellers and borrowers. Investors and stockholders should be aware that after a purchase contract is executed that contains specific terms the property will not be purchased until the successful completion of due diligence and negotiation of final binding agreements. During this period, we may decide to temporarily invest any unused proceeds from equity offerings in certain investments that could yield lower returns than the properties. These lower returns may affect our ability to make distributions.
96
Table of Contents
We financed the aggregate purchase prices of the recent mergers and acquisitions discussed in Note 3 — Mergers and Acquisitions in part through the assumption of outstanding indebtedness, and expect to finance the balance of the aggregate purchase prices through a combination of available cash on hand from: (a) a portion of the $676.7 million in gross proceeds for the year ended December 31, 2013 from the sale of shares of ARCP common stock and convertible preferred stock in separate previously disclosed private placement transactions; (b) a portion of the $967.8 million in net proceeds from the sale of the Notes; (c) funds available from the issuance of common stock through our current ATM or any successor program thereto; (d) financing available under our credit facility; and (e) additional alternative financing arrangements, as needed, from the issuance of additional common stock, preferred securities or other debt, equity or equity-linked financings.
Dividends
The amount of dividends payable to our stockholders is determined by our board of directors and is dependent on a number of factors, including funds available for dividends, financial condition, capital expenditure requirements, as applicable, and annual dividend requirements needed to qualify and maintain our status as a REIT under the Internal Revenue Code of 1986, as amended (the “Code”). Operating cash flows are expected to increase as additional properties are acquired in our investment portfolio.
We and our board of directors share a similar philosophy with respect to paying our dividends. The dividends should principally be derived from cash flows generated from real estate operations. In order to improve our operating cash flows and our ability to pay dividends from operating cash flows, our Former Manager has in the past agreed to waive certain fees including management and incentive fees. The fees that were waived relating to the activity are not deferrals and accordingly, will not be paid. Because our Former Manager waived certain fees that we owed, cash flow from operations that would have been used to pay such fees to our Former Manager was available to pay dividends to our stockholders. See Note 19 — Related Party Transactions and Arrangements (As Restated) in the consolidated financial statements within this report for further information on fees paid to and forgiven by our Former Manager. Subsequent to December 31, 2013, we completed our transition to self-management and will no longer pay such fees to our Former Manager. See Note 24 — Subsequent Events (As Restated) for further discussion.
As our real estate portfolio matures, we expect cash flows from operations to cover our dividends.
The following table shows the sources for the payment of dividends to common stockholders for the year ended December 31, 2013 (dollars in thousands):
| Three Months Ended | ||||||||||||||||||||||||||||||||
| March 31, 2013 | June 30, 2013 | September 30, 2013 | December 31, 2013 | |||||||||||||||||||||||||||||
| Dividends | % of Dividends |
Dividends | % of Dividends |
Dividends | % of Dividends |
Dividends | % of Dividends |
|||||||||||||||||||||||||
| Dividends: |
||||||||||||||||||||||||||||||||
| Distributions paid in cash |
$ | 40,485 | $ | 49,882 | $ | 66,674 | $ | 74,311 | ||||||||||||||||||||||||
| Distributions reinvested |
7,498 | 13,121 | 4,949 | — | ||||||||||||||||||||||||||||
|
|
|
|
|
|
|
|
|
|||||||||||||||||||||||||
| $ | 47,983 | $ | 63,003 | $ | 71,623 | $ | 74,311 | |||||||||||||||||||||||||
|
|
|
|
|
|
|
|
|
|||||||||||||||||||||||||
| Sources of dividends: |
||||||||||||||||||||||||||||||||
| Cash flows provided by operations (1) |
$ | — | — | % | $ | 5,674 | 9.0 | % | $ | 16,976 | 23.7 | % | $ | 29,254 | 39.4 | % | ||||||||||||||||
| Proceeds from issuances of common stock |
3,185 | 6.6 | % | 12,794 | 20.3 | % | 23,938 | 33.4 | % | — | — | % | ||||||||||||||||||||
| Proceeds from financing activities |
37,300 | 77.8 | % | 31,414 | 49.9 | % | 25,760 | 36.0 | % | 45,057 | 60.6 | % | ||||||||||||||||||||
| Common stock issued under the DRIP |
7,498 | 15.6 | % | 13,121 | 20.8 | % | 4,949 | 6.9 | % | — | — | % | ||||||||||||||||||||
|
|
|
|
|
|
|
|
|
|
|
|
|
|
|
|
|
|||||||||||||||||
| Total sources of dividends |
$ | 47,983 | 100.0 | % | $ | 63,003 | 100.0 | % | $ | 71,623 | 100.0 | % | $ | 74,311 | 100.0 | % | ||||||||||||||||
|
|
|
|
|
|
|
|
|
|
|
|
|
|
|
|
|
|||||||||||||||||
| Net loss attributable to stockholders (in accordance with U.S. GAAP) |
$ | (143,880 | ) | $ | (69,603 | ) | $ | (80,201 | ) | $ | (197,815 | ) | ||||||||||||||||||||
|
|
|
|
|
|
|
|
|
|||||||||||||||||||||||||
| (1) | Dividends paid from cash provided by operations are derived from cash flows from operations (U.S. GAAP basis) for the year ended December 31, 2013. Cash flows provided by operations include $76.1 million (as restated) of acquisition related expenses and $210.5 million (as restated) of merger and other non-routine transaction related expenses incurred during the year ended December 31, 2013. If we had not incurred such acquisition and merger related costs, our cash flows from operations would have sourced all dividend payments during the year ended December 31, 2013. |
97
Table of Contents
Loan Obligations
At December 31, 2013, our leverage ratio (net debt, excluding debt convertible to common stock, divided by enterprise value) was 58.3%.
The payment terms of our loan obligations vary. In general, only interest amounts are payable monthly with all unpaid principal and interest due at maturity. Some of our loan agreements stipulate that we comply with specific reporting and financial covenants mainly related to debt coverage ratios and loan to value ratios. Each loan that has these requirements has specific ratio thresholds that must be met. As of December 31, 2013, we were in compliance with the debt covenants under our loan agreements.
As of December 31, 2013, we had non-recourse mortgage indebtedness of $1.3 billion which was collateralized by 177 properties. Our mortgage indebtedness bore interest at weighted-average rate of 3.42% per annum and had a weighted-average maturity of 3.41 years. We may in the future incur additional mortgage debt on the properties we currently own or use long-term non-recourse financing to acquire additional properties in the future.
As of December 31, 2013, there was $1.1 billion outstanding on the Credit Facility, of which $554.8 million bore a floating interest rate of 3.17%, and for $515.0 million of the Credit Facility’s floating base interest rate is fixed through the use of derivative instruments used to hedge interest rate volatility. Including the spread, which can vary based on our leverage, interest on this portion was 3.85% at December 31, 2013. At December 31, 2013, there was up to $1.9 billion available to us for future borrowings, subject to additional lender commitments and borrowing availability. In addition, we had $760.0 million outstanding under the Senior Secured Credit Facility.
Our loan obligations require the maintenance of financial covenants, as well as restrictions on corporate guarantees, the maintenance of certain financial ratios (such as specified debt to equity and debt service coverage ratios) as well as the maintenance of a minimum net worth. At December 31, 2013 and 2012, we were in compliance with the debt covenants under all of our loan obligations.
Convertible Senior Note Offering
On July 29, 2013, the Company issued $300.0 million of Convertible Senior Notes (the “2018 Notes”) and, pursuant to an over-allotment exercise by the underwriters of such 2018 Notes offering, issued an additional $10.0 million of its 2018 Notes on August 1, 2013. On December 10, 2013, the Company issued an additional $287.5 million of the 2018 Notes through a reopening of the 2018 Notes indenture agreement. Also on December 10, 2013, the Company issued $402.5 million of Convertible Senior Notes (the “2020 Notes,” collectively with the 2018 Notes, the “Convertible Notes”). The 2018 Notes mature August 1, 2018 and the 2020 Notes mature on December 15, 2020. The Convertible Notes are convertible to cash or shares of the Company’s common stock at the Company’s option. In accordance with U.S GAAP, the notes are accounted for as a liability with a separate equity component recorded for the conversion option. A liability was recorded for the Convertible Notes on the issuance date at fair value based on a discounted cash flow analysis using current market rates for debt instruments with similar terms. The difference between the initial proceeds from the Convertible Notes and the estimated fair value of the debt instruments resulted in a debt discount, with an offset recorded to additional paid-in capital representing the equity component. The debt discount is being amortized to interest expense over the expected lives of the Convertible Notes.
Refer to Note 24 – Subsequent Events (As Restated) included in this Amendment No. 2 to Annual Report on Form 10-K/A for further discussion on significant recent events.
Bond Offering
On February 6, 2014, the OP issued, in a private offering, $2.55 billion aggregate principal amount of senior unsecured notes consisting of $1.3 billion aggregate principal amount of 2.00% senior notes due 2017 (the “2017 Notes”), $750.0 million aggregate principal amount of 3.00% senior notes due 2019 (the “2019 Notes”) and $500.0 million aggregate principal amount of 4.60% senior notes due 2024 (the “2024 Notes,” and, together with the 2017 Notes and 2019 Notes, the “Notes”). The Notes are guaranteed by the Company. The Company used a portion of the net proceeds to partially fund the cash consideration, fees and expenses relating to Cole Merger and repayment of Cole’s credit facility. The Company used the remaining portion of the net proceeds from the offering to repay $900.0 million outstanding under the OP’s senior credit facility and for other general corporate purposes.
98
Table of Contents
Refer to Note 24 – Subsequent Events (As Restated) included in this Amendment No. 2 to Annual Report on Form 10-K/A for further discussion on significant recent events.
Contractual Obligations
The following is a summary of our contractual obligations, including contractual lease obligations, as of December 31, 2013 (in thousands):
| Total | 2014 | 2015 – 2016 | 2017 – 2018 | Thereafter | ||||||||||||||||
| Principal payments due on mortgage notes payable |
$ | 1,258,661 | $ | 86,933 | $ | 677,200 | $ | 293,869 | $ | 200,659 | ||||||||||
| Interest payments due on mortgage notes payable |
204,982 | 63,581 | 82,666 | 25,064 | 33,671 | |||||||||||||||
| Principal payments due on senior corporate credit facilities |
1,819,800 | — | — | 1,819,800 | — | |||||||||||||||
| Interest payments due on senior corporate credit facilities |
186,585 | 47,048 | 94,095 | 45,442 | — | |||||||||||||||
| Principal payments due on secured credit facility |
150,000 | 150,000 | — | — | — | |||||||||||||||
| Interest payments due on secured credit facility |
4,410 | 4,410 | — | — | — | |||||||||||||||
| Principal payments due on convertible debt |
1,000,000 | — | — | 597,500 | 402,500 | |||||||||||||||
| Interest payments due on convertible debt |
187,235 | 33,019 | 66,038 | 58,619 | 29,559 | |||||||||||||||
| Principal payments due on other debt |
108,316 | 12,851 | 24,378 | 40,157 | 30,930 | |||||||||||||||
| Interest payments due on other debt |
65,659 | 6,808 | 11,469 | 6,802 | 40,580 | |||||||||||||||
| Payments due on lease obligations |
84,441 | 4,541 | 8,657 | 7,456 | 63,787 | |||||||||||||||
|
|
|
|
|
|
|
|
|
|
|
|||||||||||
| Total |
$ | 5,070,089 | $ | 409,191 | $ | 964,503 | $ | 2,894,709 | $ | 801,686 | ||||||||||
|
|
|
|
|
|
|
|
|
|
|
|||||||||||
Contractual Lease Obligations
The following table reflects the minimum base rental cash payments due from the Company over the next five years and thereafter for certain ground and office lease obligations (amounts in thousands):
| Future Minimum Lease Payments |
||||
| 2014 |
$ | 4,541 | ||
| 2015 |
4,443 | |||
| 2016 |
4,214 | |||
| 2017 |
4,244 | |||
| 2018 |
3,212 | |||
| Thereafter |
63,787 | |||
|
|
|
|||
| $ | 84,441 | |||
|
|
|
|||
Election as a REIT
We elected to be taxed as a REIT under Sections 856 through 860 of the Code commencing with the taxable year ended December 31, 2011. If we continue to qualify for taxation as a REIT, we generally will not be subject to federal corporate income tax to the extent we distribute our REIT taxable income to our stockholders, and so long as we distribute at least 90% of our REIT taxable income, computed without regard to the dividends paid deduction and excluding net capital gain. REITs are subject to a number of other organizational and operational requirements. Even if we qualify for taxation as a REIT, we may be subject to certain state and local taxes on our income and property, and federal income and excise taxes on our undistributed income. We believe we are organized and operating in such a manner as to qualify to be taxed as a REIT for the taxable year ending December 31, 2013.
Inflation
We may be adversely impacted by inflation on any leases that do not contain indexed escalation provisions. In addition, our net leases may require the tenant to pay its allocable share of operating expenses, including common area maintenance costs, real estate taxes and insurance. This may reduce our exposure to increases in costs and operating expenses resulting from inflation.
99
Table of Contents
Related-Party Transactions and Agreements
We have entered into agreements with affiliates, whereby we pay or have paid in the past certain fees or reimbursements to ARC, our Former Manager or their affiliates for acquisition fees and expenses, organization and offering costs, asset management fees and reimbursement of operating costs and have in the past paid sales commissions and dealer manager fees. See Note 19 — Related Party Transactions and Arrangements (As Restated) in our financial statements included in this report for a discussion of the various related-party transactions, agreements and fees. In August 2013, our board of directors determined that it is in the best interests of us and our stockholders to become self-managed, and we completed our transition to self-management on January 8, 2014. See Note 24 — Subsequent Events (As Restated) to the consolidated financial statements for further discussion.
Off-Balance Sheet Arrangements
We have no off-balance sheet arrangements that have or are reasonably likely to have a current or future effect on our financial condition, changes in financial condition, revenues or expenses, results of operations, liquidity, capital expenditures or capital resources that are material to investors.
Item 7A. Quantitative and Qualitative Disclosures About Market Risk.
The market risk associated with financial instruments and derivative financial instruments is the risk of loss from adverse changes in market prices or interest rates. Our market risk arises primarily from interest rate risk relating to variable-rate borrowings. To meet our short and long-term liquidity requirements, we borrow funds at a combination of fixed and variable rates. Our interest rate risk management objectives are to limit the impact of interest rate changes in earnings and cash flows and to lower our overall borrowing costs. To achieve these objectives, from time to time, we may enter into interest rate hedge contracts such as swaps, collars and treasury lock agreements in order to mitigate our interest rate risk with respect to various debt instruments. We would not hold or issue these derivative contracts for trading or speculative purposes. We do not have any foreign operations and thus we are not exposed to foreign currency fluctuations.
As of December 31, 2013, our debt included fixed-rate debt, including debt that has interest rates that are fixed with the use of derivative instruments, with a carrying and fair value of $2.9 billion. Changes in market interest rates on our fixed rate debt impact fair value of the debt, but they have no impact on interest incurred or cash flow. For instance, if interest rates rise 100 basis points and our fixed rate debt balance remains constant, we expect the fair value of our debt to decrease, the same way the price of a bond declines as interest rates rise. The sensitivity analysis related to our fixed-rate debt assumes an immediate 100 basis point move in interest rates from their December 31, 2013 levels, with all other variables held constant. A 100 basis point increase in market interest rates would result in a decrease in the fair value of our fixed rate debt by approximately $102.8 million. A 100 basis point decrease in market interest rates would result in an increase in the fair value of our fixed-rate debt by $65.8 million.
As of December 31, 2013, our debt included variable-rate debt with a carrying and fair value of $1.5 billion. The sensitivity analysis related to our variable-rate debt assumes an immediate 100 basis point move in interest rates from their December 31, 2013 levels, with all other variables held constant. A 100 basis point increase or decrease in variable interest rates on our variable-rate notes payable would increase or decrease our interest expense by approximately $14.6 million annually.
As the information presented above includes only those exposures that existed as of December 31, 2013, it does not consider exposures or positions arising after that date. The information represented herein has limited predictive value. Future actual realized gains or losses with respect to interest rate fluctuations will depend on cumulative exposures, hedging strategies employed and the magnitude of the fluctuations.
These amounts were determined by considering the impact of hypothetical interest rate changes on our borrowing costs, and, assume no other changes in our capital structure.
Item 8. Financial Statements and Supplementary Data
The information required by Item 8 is hereby incorporated by reference to our Consolidated Financial Statements beginning on page F-1 of this document.
100
Table of Contents
Item 9. Changes in and Disagreements With Accountants on Accounting and Financial Disclosure.
None.
Item 9A. Controls and Procedures (As Restated)
Evaluation of Disclosure Controls and Procedures
The Company’s Annual Report on Form 10-K for the fiscal year ended December 31, 2013 filed with the SEC on February 27, 2014 disclosed that the Company’s former management, with the participation of its former Chief Executive Officer and former Chief Financial Officer, had evaluated the Company’s disclosure controls and procedures (as defined in Rule 13a-15(e) or 15d-15(e) under the Exchange Act) and, based on that evaluation, had concluded that the Company’s disclosure controls and procedures were effective as of December 31, 2013. In light of the findings of the Audit Committee investigation and a review made by the Company in connection with the preparation of the restatement presented in this Form 10-K/A, current management, under the supervision of our current Interim Chief Executive Officer and our current Chief Financial Officer, re-evaluated the Company’s disclosure controls and procedures and, based on that evaluation, concluded that the Company’s disclosure controls and procedures were not effective at December 31, 2013 as a result of the matters discussed under “Material Weaknesses” below.
Management’s Report on Internal Control over Financial Reporting
The Company’s Annual Report on Form 10-K for the fiscal year ended December 31, 2013 filed with the SEC on February 27, 2014 disclosed that the Company’s former management had assessed the Company’s internal control over financial reporting (excluding that relating to CapLease, Inc., which the Company acquired on November 5, 2013) under the criteria set forth by the Committee of Sponsoring Organizations of the Treadway Commission in the 1992 Internal Control-Integrated Framework (the “COSO Framework”), and believed that the Company’s internal control over financial reporting (as defined in Rule 13a-15(f) or 15d-15(f) under the Exchange Act) was effective as of December 31, 2013. In light of the findings of the Audit Committee investigation and a review made by the Company in connection with preparation of the restatement presented in this Form 10-K/A, current management performed a re-assessment of the Company’s internal control over financial reporting under the COSO Framework (excluding both CapLease, Inc. and ARCT IV, the latter of which the Company acquired on January 3, 2014 in a transaction accounted for on a carryover basis of accounting and recast in the Company’s historical financial statements) and concluded that the Company’s internal control over financial reporting was not effective as of December 31, 2013 as a result of the matters discussed under “Material Weaknesses in Internal Control over Financial Reporting” below.
Material Weaknesses
Material Weaknesses in Disclosure Controls and Procedures – The Company’s disclosure controls and procedures were not properly designed or implemented to ensure that the information contained in the Company’s periodic reports and other SEC filings correctly reflected the information contained in the Company’s accounting records and other supporting information and that AFFO per share (a non-GAAP measure that is an important industry metric) was correctly calculated. In addition, the Company did not have appropriate controls to ensure that its SEC filings were reviewed on a timely basis by senior management or that significant changes to amounts or other disclosures contained in a document that had previously been reviewed and approved by the Audit Committee were brought to the attention of the Audit Committee or its Chair for review and approval before the document was filed with the SEC. Finally, the Company did not have appropriate controls over the formulation of AFFO per share guidance or the periodic re-assessment of the Company’s ability to meet its guidance.
Material Weaknesses in Internal Control Over Financial Reporting – A material weakness is defined as a deficiency, or a combination of deficiencies, in internal control over financial reporting such that there is a reasonable possibility that a material misstatement of our annual or interim financial statements will not be prevented or detected on a timely basis.
During 2013, due in part to a number of large portfolio acquisitions, the Company experienced significant growth and increases in the complexity of its financial reporting and number of non-routine transactions. In late 2013, as a result of three impending transactions – the transition to self-management announced in August 2013 and effective on January 8, 2014, the acquisition of ARCT IV announced in July 2013 and completed on January 3, 2014 and the acquisition of Cole Real Estate Investments, Inc. announced in October 2013 and completed on February 7, 2014 – the complexity of the Company’s transactions and the need for accounting judgments and estimates became more prevalent and had a severe impact on the Company’s control environment. These changes in business conditions, combined with the pressure of market expectations inherent in announcing AFFO per share guidance for 2014, demanded an enhanced control environment.
101
Table of Contents
The control environment, as part of the internal control framework, sets the tone of an organization, influencing the control consciousness of its people and providing discipline and structure. Current management identified the following material weaknesses through its re-assessment of the Company’s internal control over financial reporting:
Related Party Transactions and Conflicts of Interest – The Company did not maintain the appropriate controls to assess, authorize and monitor related party transactions, validate the appropriateness of such transactions or manage the risks arising from contractual relationships with affiliates. Without the appropriate controls, the Company made certain payments to the Former Manager and its affiliates that were not sufficiently documented or that otherwise warrant scrutiny.
Equity-Based Compensation – The Company did not maintain appropriate controls over various grants of equity-based compensation. In the fourth quarter of 2013, in anticipation of the Company’s transition to self-management, the Company entered into employment agreements with the Company’s former Executive Chairman and Chief Executive Officer and its former Chief Financial Officer, and also approved the 2014 Outperformance Plan pursuant to which awards were made to them on January 8, 2014. Without the appropriate controls, these documents contained terms that were inconsistent with the terms authorized by the Compensation Committee. Additionally, the Company did not obtain copies of or administer the equity awards made by means of block grants allocated by the Former Manager and its affiliates, nor did the Company review the awards for consistency with the Compensation Committee’s authorization.
Aggregation of Significant Deficiencies Within Business Process-Level Control Activities and Financial Reporting Controls – The following significant deficiencies together constitute a material weakness:
| • | Accounting Close Process – The Company did not have consistent policies and procedures throughout its offices relating to purchase accounting, accounting for gain or loss on disposition and testing for impairment. In addition, senior management did not establish clear reporting lines and job responsibilities or promote accountability over business process control activities. |
| • | Critical Accounting Estimates and Non-Routine Transactions – The Company did not maintain effective controls or develop standardized policies and procedures for critical accounting estimates and non-routine transactions, including management review and approval of the accounting treatment of all critical and significant estimates on a periodic basis. |
Attestation Report of Our Independent Registered Public Accounting Firm
Grant Thornton LLP, our independent registered public accounting firm that audited the Company’s financial statements included in this Annual Report on Form 10-K/A, has issued an attestation report on the Company’s internal control over financial reporting, which appears on page 106 of this Annual Report on Form 10-K/A.
Remediation
As discussed below, the Company is actively engaged in improving its disclosure controls and procedures and internal control over financial reporting. The Company’s new senior management will report on a quarterly basis to the Audit Committee and, where applicable, to the other Committees of the Board of Directors as to the progress made in remediating the material weaknesses identified above.
Control Environment – During the fourth quarter of 2014, the Company underwent a change in senior leadership as a result of the resignations of the Company’s Executive Chairman of the Board, Chief Executive Officer and director, President and Chief Operating Officer, Chief Financial Officer and Chief Accounting Officer. The Audit Committee, the Board of Directors and new senior leadership are committed to establishing a culture of compliance, integrity and transparency and have begun communicating their commitment and expectations to all employees of the Company. This commitment will also be an important consideration in the Board of Directors’ selection of a new independent Chairman of the Board of Directors and a permanent Chief Executive Officer pursuant to its previously-announced search process.
The Board of Directors, with the assistance of outside counsel, has commenced a comprehensive review of its key practices and procedures. This review will include, among other things, the nature, transparency and timeliness of information provided to the Board of Directors by management, the agenda-setting process, the process by which the Board of Directors oversees the Company’s risk management functions and the roles and responsibilities, charters, key practices and procedures of the committees of the Board of Directors. As an outgrowth of this review, the Board of Directors has adopted a new related person transactions policy and assigned the administration of this policy to the Nominating and Corporate Governance Committee.
102
Table of Contents
Under the Audit Committee’s oversight, management has commenced a comprehensive review of corporate compliance policies and programs and is initiating periodic Company-wide training on ethics, reporting procedures and other key topics as well as a review of the Company’s whistleblower hotline policies and procedures.
The Company is also in the process of strengthening its controls in a number of areas highlighted by the Audit Committee investigation, as follows:
| • | Adding additional layers of review of the Company’s significant accounting policies and estimates, including the bonus accrual process; |
| • | Improving the controls around decisions whether or not to reflect certain accounting adjustments in the Company’s books and records and/or to report such adjustments within the financial statements, by revising its policies, implementing additional review and training all accounting personnel on the revised policies; |
| • | Adopting new accounting policies that incorporate technical accounting guidance as to when expenses may be appropriately classified as merger-related expenses, and conducting training on the implementation of this policy with relevant members of its accounting staff; and |
| • | Adopting new practices surrounding the calculation and presentation of AFFO and the formulation and review of AFFO guidance. |
Financial Reporting Disclosure Controls – Under the oversight of the Audit Committee, the Company is in the process of creating a chartered Disclosure Committee to be comprised of senior attorneys, accounting personnel and executives and heads of other pertinent firm-wide disciplines. The Chair of the Disclosure Committee will have ongoing dialogue with the Audit Committee and the Board of Directors on how the Disclosure Committee is fulfilling its mandate to ensure the timeliness, accuracy, completeness and quality of the Company’s SEC filings and other public disclosures. The Disclosure Committee will be responsible for establishing and administering a process by which certain personnel in relevant functions and areas will be required to provide sub-certifications in support of the certifications that the Company’s principal executive and principal financial officers are required to provide in connection with each periodic SEC report. Processes will be implemented to help plan appropriately for quarterly financial reporting as well as securities offerings.
Additionally, at the direction of the Audit Committee, the Company is enhancing and formalizing the procedures for the review and approval of annual and quarterly SEC reports (some of which were previously less formal) as follows:
| • | Drafts of reports will be circulated sufficiently in advance of Audit Committee meetings to permit adequate review; |
| • | Audit Committee meetings will be attended in person to the extent practicable and, in addition to Audit Committee members, required attendees will include the Chief Financial Officer, Chief Accounting Officer, General Counsel, Chair of the Disclosure Committee, head of Internal Audit, independent auditors and outside legal counsel as necessary; |
| • | At Audit Committee meetings, in addition to required communications from the independent auditors, reports will be made by the Chief Accounting Officer and the Chair of the Disclosure Committee on significant changes from prior filings, significant judgments reflected in the report and receipt of sub-certifications; |
| • | At Audit Committee meetings, separate executive sessions will be held with the independent auditor, head of Internal Audit, General Counsel and others as necessary; and |
| • | Any changes to a draft of a periodic report that has been approved by the Audit Committee must be submitted to and reviewed and approved by the Chair of the Audit Committee prior to filing. |
Related Party Transactions and Conflicts of Interest – The resignation of certain members of senior management affiliated with the Former Manager has eliminated certain conflicts of interest that existed prior to such resignations.
The Audit Committee’s investigation identified certain payments made by the Company to the Former Manager or its affiliates that were not sufficiently documented or otherwise warrant scrutiny. In November 2014, as a result of the Audit Committee investigation, the Company terminated a lease with an affiliate of the Former Manager for space in a building located in Newport, Rhode Island. The Company, which never occupied the building, was reimbursed for certain leasehold improvements and other costs by delivery of 916,423 OP Units valued at approximately $8.5 million, which were retired. The Company is considering whether it has a right to seek recovery for any other such payments and, if so, its alternatives for seeking recovery. No asset has been recognized in the financial statements related to any potential recovery.
103
Table of Contents
The Company is working closely with outside counsel to terminate its remaining relationships with affiliates of its Former Manager, including ARC Capital, LLC (“ARC”) and RCS Capital Corporation, and to disentangle its internal control framework from the affiliated entities. The Company is seeking to obtain copies of all of its books and records held by ARC and to eliminate all human resource, information technology and other overlapping departmental services.
The Company has also enhanced the procedures for review and approval of potential related party transactions with directors, director nominees, executive officers, 5% shareholders and their immediate family members through the adoption of a new related party transactions policy administered by the Nominating and Corporate Governance Committee.
Equity-Based Compensation – The Company has recently obtained copies from ARC of all equity awards made by means of block grants allocated by the Former Manager or its affiliates and will seek to assume administration of those awards that remain outstanding. In addition, the Company will review all awards for consistency with the Compensation Committee’s authorization.
Under the Compensation Committee’s oversight, the Company is implementing new governance processes for the authorization, documentation, issuance, administration and accounting for equity-based compensation. The Compensation Committee will approve each award, rather than delegating authority to management to allocate large tranches of awards. In-house counsel, accounting, tax, and human resources personnel will work together to oversee the issuance of equity compensation to directors, officers and employees. Equity compensation tracking and recordkeeping will be improved through the use of equity tracking software. All compensation matters within the Compensation Committee’s purview will be reviewed by the Compensation Committee Chair and in-house counsel against the Compensation Committee’s authorization to ensure consistency and appropriate documentation. In respect of all other employment matters, the human resources department will consult in-house counsel before making any offer of employment or any compensation adjustment that includes any equity award or otherwise raises equity compensation issues.
Aggregation of Significant Deficiencies Within Business Process-Level Control Activities and Financial Reporting Controls – The Company is taking following steps to remedy the underlying significant deficiencies comprising this material weakness:
| • | Accounting Close Process – The Company has begun to standardize its internal accounting close process and intends to complete the integration of its accounting and financial reporting processes among its various offices. Toward this end, the Company has documented, and intends to continue to document, its key and significant operational activities and accounting policies and procedures. In addition, the Company has designed and implemented internal controls within its accounting close process to ensure that closing activities, such as reconciliations, timely reviews, journal entry reviews and comprehensive financial analysis, are performed and reviewed. The Company intends to create a financial reporting sub- certification process and is defining key roles and responsibilities within the organizational structure. Lastly, the Company has conducted trainings, and will conduct additional trainings, for its accounting and other professionals to ensure the accounting close processes and entity level and company level controls and procedures are well defined, documented and implemented to support operational effectiveness. |
| • | Critical Accounting Estimates and Non-Routine Transactions – The Company has documented various critical accounting policies, and intends to continue to document new accounting policies and to update its existing documentation for any noted changes on a timely basis. New policies have been communicated to the relevant Company employees. The Company has also established a process under which senior management approves all critical accounting estimates and non-routine transactions on a periodic basis as part of the financial close and reporting processes. |
104
Table of Contents
Changes in Internal Control over Financial Reporting
During the fourth quarter of the fiscal year ended December 31, 2013, there were no changes in our internal control over financial reporting, as defined in Rule 13a-15(f) and 15d-15(f) of the Exchange Act that have materially affected, or were reasonably likely to materially affect, our internal control over financial reporting, other than the hiring of senior executive officers and financial reporting personnel in connection with the Company’s transition to self-management and entry into the Cole Real Estate Investments, Inc. merger agreement.
105
Table of Contents
REPORT OF INDEPENDENT REGISTERED PUBLIC ACCOUNTING FIRM
Board of Directors and Shareholders
American Realty Capital Properties, Inc.
We have audited the internal control over financial reporting of American Realty Capital Properties, Inc. (a Maryland corporation) and subsidiaries (the “Company”) as of December 31, 2013, based on criteria established in the 1992 Internal Control-Integrated Framework issued by the Committee of Sponsoring Organizations of the Treadway Commission (COSO). The Company’s management is responsible for maintaining effective internal control over financial reporting and for its assessment of the effectiveness of internal control over financial reporting, included in the accompanying “Management’s Report on Internal Control Over Financial Reporting” (“Management’s Report”) presented in Item 9A, “Controls and Procedures”. Our responsibility is to express an opinion on the Company’s internal control over financial reporting based on our audit. Our audit of, and opinion on, American Realty Capital Properties, Inc .’s internal control over financial reporting does not include internal control over financial reporting of CapLease, Inc. (“CapLease”), a wholly owned subsidiary, which was acquired by the Company on November 5, 2013 and whose financial statements reflect total assets and revenues constituting 26% and 9%, respectively, of the related consolidated financial statement amounts as of and for the year ended December 31, 2013. In addition, our audit of, and opinion on, American Realty Capital Properties, Inc .’s internal control over financial reporting does not include internal control over financial reporting of American Realty Capital Trust IV, Inc. (“ARCT IV”), an affiliated entity under common control with which the Company merged on January 4, 2014 in a merger accounted for as a reorganization of entities under common control and whose financial statements reflect total assets and revenues constituting 28% and 27%, respectively, of the related consolidated financial statement amounts as of and for the year ended December 31, 2013. As indicated in Management’s Report, management’s assertion of the effectiveness of American Realty Capital Properties, Inc.’s internal control over financial reporting excluded internal control over financial reporting of CapLease and ARCT IV.
We conducted our audit in accordance with the standards of the Public Company Accounting Oversight Board (United States). Those standards require that we plan and perform the audit to obtain reasonable assurance about whether effective internal control over financial reporting was maintained in all material respects. Our audit included obtaining an understanding of internal control over financial reporting, assessing the risk that a material weakness exists, testing and evaluating the design and operating effectiveness of internal control based on the assessed risk, and performing such other procedures as we considered necessary in the circumstances. We believe that our audit provides a reasonable basis for our opinion.
A company’s internal control over financial reporting is a process designed to provide reasonable assurance regarding the reliability of financial reporting and the preparation of financial statements for external purposes in accordance with generally accepted accounting principles. A company’s internal control over financial reporting includes those policies and procedures that (1) pertain to the maintenance of records that, in reasonable detail, accurately and fairly reflect the transactions and dispositions of the assets of the company; (2) provide reasonable assurance that transactions are recorded as necessary to permit preparation of financial statements in accordance with generally accepted accounting principles, and that receipts and expenditures of the company are being made only in accordance with authorizations of management and directors of the company; and (3) provide reasonable assurance regarding prevention or timely detection of unauthorized acquisition, use, or disposition of the company’s assets that could have a material effect on the financial statements.
Because of its inherent limitations, internal control over financial reporting may not prevent or detect misstatements. Also, projections of any evaluation of effectiveness to future periods are subject to the risk that controls may become inadequate because of changes in conditions, or that the degree of compliance with the policies or procedures may deteriorate.
A material weakness is a deficiency, or combination of control deficiencies, in internal control over financial reporting, such that there is a reasonable possibility that a material misstatement of the company’s annual or interim financial statements will not be prevented or detected on a timely basis. The following material weaknesses have been identified and included in management’s assessment. Management identified a material weakness related to the Company’s failure to maintain controls associated with related party transactions and risks arising from contractual arrangements with affiliates. A material weakness was identified by management related to the Company’s failure to maintain controls related to stock based compensation, including the administration of certain restricted stock awards. Additionally, a material weakness was identified by management as a result of the Company not maintaining and applying adequate policies and procedures, including those related to the accounting close process, critical accounting estimates and non-routine transactions,.
In our report dated February 27, 2014, we expressed an unqualified opinion on the Company’s internal control over financial reporting. The material weaknesses discussed above were subsequently identified in connection with the restatement of the Company’s previously issued financial statements. Accordingly, management has revised its assessment about the effectiveness of the Company’s internal control over financial reporting, and our present opinion on the effectiveness of the Company’s internal control over financial reporting as of December 31, 2013, as presented herein, is different from that expressed in our previous report. The
106
Table of Contents
material weaknesses were considered in connection with the aforementioned restatement, and this report does not affect our opinion on the Company’s 2013 financial statements.
In our opinion, because of the effect of the material weaknesses described above on the achievement of the objectives of the control criteria, the Company has not maintained effective internal control over financial reporting as of December 31, 2013, based on criteria established in the 1992 Internal Control-Integrated Framework issued by COSO.
We do not express an opinion or any other form of assurance on management’s statements referring to “Material Weaknesses in Disclosure Controls and Procedures” and “Remediation” included in Management’s Report.
We also have audited, in accordance with the standards of the Public Company Accounting Oversight Board (United States), the consolidated financial statements of the Company as of and for the year ended December 31, 2013. The material weaknesses identified above were considered in determining the nature, timing, and extent of audit tests applied in our audit of the 2013 consolidated financial statements, and this report does not affect our report dated March 2, 2015, which expressed an unqualified opinion on those financial statements.
/s/ GRANT THORNTON LLP
Phoenix, Arizona
March 2, 2015
107
Table of Contents
None.
108
Table of Contents
EXPLANATORY NOTE
As permitted by Instruction G.3 to Form 10-K, the Company incorporated by reference into Part III of the Original Filing, the information required by Items 10-14 of Form 10-K contained in its definitive proxy statement filed with the SEC on April 29, 2014 (the “Proxy Statement”). Based upon the Audit Committee’s investigation and additional work by the Company, the information incorporated by reference from the Proxy Statement into Part III of the Original Filing should be read in light of the following:
Item 11:
| • | In connection with Mr. Schorsch’s resignation from the Company effective December 12, 2014, Mr. Schorsch entered into a Reformation of Employment Agreement, a restricted share award agreement, and a Clarification of Award Agreement under the 2014 Multi-Year Outperformance Plan (the “2014 Outperformance Plan”). These documents were intended to reform his Employment Agreement and equity awards, as of January 8, 2014, to be consistent with vesting provisions authorized by the Compensation Committee of the Company’s Board (the “Compensation Committee”) and to make certain other corrections. Among other things, the reformed agreements provided that, upon a termination for Cause (as defined in his Employment Agreement) by the Company or a voluntary resignation by Mr. Schorsch without Good Reason (as defined in his Employment Agreement), Mr. Schorsch’s restricted share award and award under the 2014 Outperformance Plan would not accelerate and such awards would be forfeited immediately. |
| • | The maximum award opportunity under the 2014 Outperformance Plan was $120.0 million, not $222.1 million as stated in the Proxy Statement. The Compensation Committee approved an aggregate award pool to be measured by the Company’s market capitalization as of the date of such approval on October 3, 2013; however, as executed, the 2014 Outperformance Plan measured market capitalization on a pro forma basis as of the Company’s transition to self-management on January 8, 2014 (including the pro forma impact of various transactions expected to be consummated prior to the Company’s transition to self-management on January 8, 2014). See Note 18 – Equity-Based Compensation (As Restated) to the consolidated financial statements contained in this Form 10-K/A for further detail. |
| • | The vesting period for the restricted stock awards of 40,000 shares made to each non-executive director in connection with the Company’s transition to self-management on January 8, 2014 is five years, not three years as stated in the Proxy Statement. |
| • | Item 13: |
| • | The Company entered into transactions with related parties pertaining to the Audrain Building located in Newport, Rhode Island during 2013 and 2014, as described in Note 19 – Related Party Transactions and Arrangements (As Restated) to the consolidated financial statements contained in this Form 10-K/A. |
| • | The Company did not incur any fees pursuant to the Transition Services Agreement, dated October 21, 2013 (described in the Proxy Statement). |
| • | An $8.4 million disposition fee was paid to American Realty Capital Advisors IV, LLC in connection with the Company’s acquisition of American Realty Capital Trust IV, Inc. on January 3, 2014, as described in Note 19 – Related Party Transactions and Arrangements (As Restated) to our restated audited consolidated financial statements contained in this Form 10-K/A. |
| • | The Company’s payment of $2.9 million to RCS Advisory Services, LLC in respect of the Transaction Management Services Agreement, dated December 9, 2013, was made upon the Company’s transition to self-management on January 8, 2014, rather than on February 7, 2014, in connection with the closing of the Cole Merger. |
109
Table of Contents
Item 10. Directors, Executive Officers and Corporate Governance.
The information required by this Item is incorporated by reference to our Proxy Statement, subject to the following: the address to write to for a copy of our Code of Ethics, free of charge, is our new executive office – 2325 E. Camelback Road, Suite 1100, Phoenix, AZ 85016, Attention: Chief Financial Officer.
Item 11. Executive Compensation.
The information required by this Item is incorporated by reference to the Proxy Statement, subject to the information set forth under “Explanatory Note” above.
Item 12. Security Ownership of Certain Beneficial Owners and Management and Related Stockholder Matters.
The information required by this Item is incorporated by reference to the Proxy Statement.
Item 13. Certain Relationships and Related Transactions, and Director Independence.
The information required by this Item is incorporated by reference to the Proxy Statement, subject to the information set forth under “Explanatory Note” above.
Item 14. Principal Accounting Fees and Services.
The information required by this Item is incorporated by reference to the Proxy Statement.
110
Table of Contents
The following documents are filed as part of this Amendment No. 2 to its Annual Report on Form 10-K/A:
| Exhibit No. |
Description | |
| 1.1 (1) |
Equity Distribution Agreement between Registrant, ARC Properties Operating Partnership, L.P. and Merrill Lynch, Pierce, Fenner & Smith Incorporated, dated January 22, 2013. | |
| 1.2 (1) |
Equity Distribution Agreement between Registrant, ARC Properties Operating Partnership, L.P. and JMP Securities LLC, dated January 22, 2013. | |
| 1.3 (1) |
Equity Distribution Agreement between Registrant, ARC Properties Operating Partnership, L.P. and Ladenburg Thalmann & Co. Inc., dated January 22, 2013. | |
| 1.4 (1) |
Equity Distribution Agreement between Registrant, ARC Properties Operating Partnership, L.P. and RBS Securities Inc., dated January 22, 2013. | |
| 1.5 (1) |
Equity Distribution Agreement between Registrant, ARC Properties Operating Partnership, L.P. and Robert W. Baird & Co. Incorporated, dated January 22, 2013. | |
| 1.6 (14) |
Underwriting Agreement, dated July 23, 2013, by and among the Registrant, ARC Properties Operating Partnership, L.P. and J.P. Morgan Securities LLC and Citigroup Global Markets Inc., as representatives of the several Underwriters listed therein. | |
| 1.7 (25) |
Equity Distribution Agreement, dated November 25, 2013, between the Registrant, ARC Properties Operating Partnership, L.P., Barclays Capital Inc., Morgan Stanley & Co. LLC, Citigroup Global Markets Inc., Credit Suisse Securities (USA) LLC, Capital One Securities, Inc., Ladenburg Thalmann & Co. Inc. and JMP Securities, LLC. | |
| 1.8 (27) |
Underwriting Agreement, dated December 5, 2013, by and among the Registrant, ARC Properties Operating Partnership, L.P. and Barclays Capital Inc. and Citigroup Global Markets Inc., as representatives of the several Underwriters listed therein, with respect to the Registrant’s 3.00% Convertible Senior Notes due 2018. | |
| 1.9 (27) |
Underwriting Agreement, dated December 5, 2013, by and among the Registrant, ARC Properties Operating Partnership, L.P. and Barclays Capital Inc. and Citigroup Global Markets Inc., as representatives of the several Underwriters listed therein, with respect to the Registrant’s 3.75% Convertible Senior Notes due 2020. | |
| 2.1 (2) |
Agreement and Plan of Merger by and among Registrant, ARC Properties Operating Partnership, L.P., Tiger Acquisition LLC, American Realty Capital Trust III, Inc. and American Realty Capital Operating Partnership III, L.P.** | |
| 2.2 (10) |
Agreement and Plan of Merger, by and among, the Registrant, ARC Properties Operating Partnership, L.P., Safari Acquisition, LLC, CapLease, Inc., Caplease, LP and CLF OP General Partner LLC, dated as of May 28, 2013.** | |
| 2.3 (11) |
Purchase and Sale Agreement, by and among, CNL APF Partners, LP and Certain Affiliates as Seller Parties, and ARC Properties Operating Partnership, L.P., as Purchaser, dated May 31, 2013.** | |
| 2.4 (13) |
Agreement and Plan of Merger, dated as of July 1, 2013, among the Registrant, American Realty Capital Trust IV, Inc., Thunder Acquisition, LLC, ARC Properties Operating Partnership, L.P. and American Realty Capital Operating Partnership IV, L.P.** | |
| 2.4.1 (18) |
Amendment dated as of October 6, 2013 to the Agreement and Plan of Merger, dated as of July 1, 2013, by and among the Registrant, ARC Properties Operating Partnership, L.P., Thunder Acquisition, LLC, American Realty Capital Trust IV, Inc. and American Realty Capital Operating Partnership IV, L.P. | |
| 2.4.2 (26) |
Second Amendment dated as of October 11, 2013 to the Agreement and Plan of Merger, dated as of July 1, 2013, by and among the Registrant, ARC Properties Operating Partnership, L.P., Thunder Acquisition, LLC, American Realty Capital Trust IV, Inc. and American Realty Capital Operating Partnership IV, L.P. | |
| 2.5 (17) |
Equity Interest Purchase Agreement by and between Inland American Real Estate Trust, Inc. and AR Capital, LLC, dated as of August 8, 2013. ** | |
| 2.6 (19) |
Purchase and Sale Agreement by and among ARC PADRBPA001, LLC and AR Capital, LLC and the sellers described on schedules thereto, dated as of July 24, 2013. ** | |
| 2.7 (20) |
Agreement and Plan of Merger, dated as of October 22, 2013, by and among the Registrant, Cole Real Estate Investments, Inc. and Clark Acquisition, LLC.** | |
| 3.1 (3) |
Articles of Amendment and Restatement of the Registrant. | |
| 3.2 (4) |
Bylaws of the Registrant. | |
| 3.3 (5) |
Articles Supplementary Relating to the Series A Convertible Preferred Stock of the Registrant, dated May 10, 2012. | |
| 3.4 (6) |
Articles Supplementary Relating to the Series B Convertible Preferred Stock of the Registrant, dated July 24, 2012. | |
| 3.5 (12) |
Articles Supplementary for the Series C Convertible Preferred Stock of the Registrant, dated June 6, 2013. | |
| 3.6 (14) |
Articles of Amendment to Articles of Amendment and Restatement of the Registrant, effective July 2, 2013. | |
| 3.7 (24) |
Articles Supplementary for the Series D Cumulative Convertible Preferred Stock of the Registrant, filed November 8, 2013. | |
| 3.8 (28) |
Articles of Amendment to Articles of Amendment and Restatement of the Registrant, filed with the SDAT on December 9, 2013. | |
111
Table of Contents
| Exhibit No. |
Description | |
| 3.9 (29) |
Articles Supplementary to the Articles of Incorporation of the Registrant classifying and designating the 6.70% Series F Cumulative Redeemable Preferred Stock, dated January 2, 2014. | |
| 3.10 (31) |
Amendment to the Registrant’s bylaws, effective as of February 7, 2014. | |
| 4.1 * |
Third Amended and Restated Agreement of Limited Partnership of ARC Properties Operating Partnership, L.P., effective January 3, 2014. | |
| 4.2 (14) |
Indenture, dated as of July 29, 2013, between the Registrant and U.S. Bank National Association, as trustee. | |
| 4.3 (14) |
First Supplemental Indenture, dated as of July 29, 2013, between the Registrant and U.S. Bank National Association, as trustee. | |
| 4.4 (23) |
Form of 3.00% Convertible Senior Notes due 2018 (included in Exhibit 4.3). | |
| 4.5 (22) |
Indenture, dated as of October 9, 2007, by and among CapLease, Inc., Caplease, LP, Caplease Debt Funding, LP, Caplease Services Corp., Caplease Credit LLC and Deutsche Bank Trust Company Americas, as trustee. | |
| 4.6 (22) |
Supplemental Indenture, dated as of November 5, 2013, by and among the Registrant, ARC Properties Operating Partnership, L.P., CapLease, Inc., Caplease, LP and Deutsche Bank Trust Company Americas, as trustee. | |
| 4.7 (22) |
Junior Subordinated Indenture, dated as of December 13, 2005, by and between Caplease, LP and The Bank of New York Mellon, as trustee, as successor-in-trust to JPMorgan Chase Bank, National Association. | |
| 4.8 (22) |
Supplemental Indenture, dated November 5, 2013, by and among ARC Properties Operating Partnership, L.P., Caplease, LP and The Bank of New York Mellon, as trustee, as successor-in-trust to JPMorgan Chase Bank, National Association. | |
| 4.9 (27) |
Second Supplemental Indenture, dated as of December 10, 2013, between the Registrant and U.S. Bank National Association, as trustee. | |
| 4.10 (27) |
Form of 3.75% Convertible Senior Notes due 2020. | |
| 4.11 (31) |
Indenture, dated as of February 6, 2014, among ARC Properties Operating Partnership, L.P., Clark Acquisition, LLC, the guarantors named therein and U.S. Bank National Association, as trustee. | |
| 4.12 (31) |
Officers’ Certificate, dated as of February 6, 2014. | |
| 4.13 (31) |
Registration Rights Agreement, dated as of February 6, 2014, among ARC Properties Operating Partnership, L.P., Clark Acquisition, LLC, the guarantors named therein, Barclays Capital Inc. and Citigroup Global Markets Inc. | |
| 10.1 (34) |
Amendment and Acknowledgment of Termination of Amended and Restated Management Agreement, entered into as of January 8, 2014, by and among the Registrant and ARC Properties Advisors, LLC. | |
| 10.2 (4) |
Registrant’s Equity Plan. | |
| 10.3 (4) |
Registrant’s Director Stock Plan. | |
| 10.4 (4) |
Form of Restricted Stock Award Agreement for Non-Executive Directors. | |
| 10.5 (4) |
Form of Restricted Stock Award Agreement for ARC Properties Advisors, LLC. | |
| 10.6 (2) |
Letter by and between American Realty Capital Trust III, Inc., American Realty Capital Operating Partnership III, L.P., American Realty Capital Advisors III, LLC, American Realty Capital Trust III Special Limited Partner, LLC, American Realty Capital Properties III, LLC and Registrant, dated December 14, 2012. | |
| 10.7 (2) |
Asset Purchase and Sale Agreement, by and between ARC Properties Operating Partnership, L.P. and American Realty Capital Advisors III, LLC, dated December 14, 2012. | |
| 10.8 (32) |
Indemnity Agreement, by ARC Real Estate Partners, LLC, in favor of Registrant, dated December 28, 2012. | |
| 10.9 (32) |
Indemnity Agreement, by Indemnitors, in favor of ARC Real Estate Partners, LLC, dated December 28, 2012. | |
| 10.10 (32) |
Credit Agreement, dated as of February 14, 2013, among American Realty Capital Operating Partnership III, L.P., American Realty Capital Trust III, Inc., Wells Fargo Bank, National Association, RBS Citizens, N.A., and Regions Bank, Capital One, N.A. and JPMorgan Chase Bank, N.A. and the other lenders party hereto. | |
| 10.11 (8) |
Contribution and Exchange Agreement, dated February 28, 2013, among American Realty Capital Operating Partnership III, L.P., American Realty Capital Trust III Special Limited Partner, LLC and ARC Properties Operating Partnership, L.P. | |
| 10.12 (8) |
2013 Advisor Multi-Year Outperformance Agreement, made as of February 28, 2013, the Registrant, ARC Properties Operating Partnership, L.P. and ARC Properties Advisors, LLC. | |
| 10.13 (9) |
First Amendment to Credit Agreement, dated as of March 18, 2013, by and among ARC Properties Operating Partnership, L.P., Tiger Acquisition, LLC, the Registrant, the Lenders party thereto and Wells Fargo Bank, National Association. | |
| 10.14 (10) |
Voting Agreement, dated as of May 28, 2013, by and among the Registrant, Paul H. McDowell, William R. Pollert, Shawn P. Seale, Robert C. Blanz and Paul C. Hughes. | |
| 10.15 (10) |
Management Letter Agreement, dated as of May 28, 2013, among the Registrant, Paul H. McDowell, William R. Pollert, Shawn P. Seale, Robert C. Blanz, Michael J. Heneghan and Paul C. Hughes. | |
112
Table of Contents
| Exhibit No. |
Description | |
| 10.16 (13) |
Letter Agreement, dated as of July 1, 2013, among the Registrant, American Realty Capital Trust IV, Inc., American Realty Capital Operating Partnership IV, L.P., American Realty Capital Trust IV Special Limited Partner, LLC, American Realty Capital Advisors IV, LLC and American Realty Capital Properties IV, LLC. | |
| 10.17 (13) |
Asset Purchase and Sale Agreement, dated as of July 1, 2013, between ARC Properties Operating Partnership, L.P. and American Realty Capital Advisors IV, LLC. | |
| 10.18 (15) |
Augmenting Lender and Increasing Lender Supplement and Incremental Amendment, dated as of March 28, 2013, to the Credit Agreement, among ARC Properties Operating Partnership, L.P., Tiger Acquisition, LLC, the Registrant, the lenders party thereto and Wells Fargo Bank, National Association. | |
| 10.19 (15) |
Third Amendment to Credit Agreement, by and among ARC Properties Operating Partnership, L.P., Tiger Acquisition, LLC, the Registrant, the Lenders party thereto, and Wells Fargo Bank, National Association, dated as of May 28, 2013. | |
| 10.20 (15) |
Fourth Amendment to Credit Agreement, by and among ARC Properties Operating Partnership, L.P., Tiger Acquisition, LLC, the Registrant, the Lenders party thereto, and Wells Fargo Bank, National Association, dated as of July 22, 2013. | |
| 10.21 (15) |
Indemnity Agreement, by Indemnitors, in favor of ARC Real Estate Partners, LLC, dated December 28, 2012. | |
| 10.22 (16) |
Credit Agreement, dated as of February 14, 2013, among American Realty Capital Operating Partnership III, L.P., American Realty Capital Trust III, Inc., Wells Fargo Bank, National Association, RBS Citizens, N.A., Regions Bank, Capital One, N.A. and JPMorgan Chase Bank, N.A. and the other lenders party hereto. | |
| 10.23 (16) |
Common Stock Purchase Agreement, dated as of September 15, 2013, entered into by and between the Registrant and certain investors party thereto. | |
| 10.24 (22) |
Credit Agreement, dated June 29, 2012, by and among CapLease, Inc., Caplease, LP, certain subsidiaries of Caplease, LP party thereto and Wells Fargo Bank, National Association, as administrative agent and sole lender. | |
| 10.25 (22) |
First Amendment to Credit Agreement, dated April 16, 2013, by and among CapLease, Inc., Caplease, LP, certain subsidiaries of Caplease, LP party thereto and Wells Fargo Bank, National Association, as administrative agent and sole lender. | |
| 10.26 (22) |
Second Amendment to Credit Agreement, dated June 21, 2013, by and among CapLease, Inc., Caplease, LP, certain subsidiaries of Caplease, LP party thereto and Wells Fargo Bank, National Association, as administrative agent and sole lender. | |
| 10.27 (22) |
Third Amendment to Credit Agreement, dated November 5, 2013, by and among the Registrant, ARC Properties Operating Partnership, L.P., Safari Acquisition, LLC, certain subsidiaries of Safari Acquisition, LLC party thereto and Wells Fargo Bank, National Association, as administrative agent and sole lender. | |
| 10.28 (20) |
Voting Agreement, dated as of October 22, 2013, by and among the Registrant, Cole Real Estate Investments, Inc., Christopher H. Cole and Marc T. Nemer. | |
| 10.29 (20) |
Letter Agreement, dated as of October 22, 2013, by and among the Registrant, Cole Real Estate Investments, Inc. and Christopher H. Cole. | |
| 10.30 (20) |
Letter Agreement, dated as of October 22, 2013, by and among the Registrant, Cole Real Estate Investments, Inc. and Marc T. Nemer. | |
| 10.31 (21) |
Letter Agreement, dated as of October 22, 2013, between the Registrant and Kirk McAllaster. | |
| 10.32 (21) |
Letter Agreement, dated as of October 22, 2013, by and among the Registrant and Stephan Keller. | |
| 10.33 (21) |
Letter Agreement, dated as of October 22, 2013, by and among the Registrant and Jeffery Holland. | |
| 10.34 (23) |
First Amendment dated as of September 30, 2013 to the Purchase and Sale Agreement dated July 24, 2013, by and among ARC DB5PROP001, LLC, ARC DBPGDYR001, LLC, ARC DBPPROP001, LLC, ARC DB5SAAB001, LLC, ARC DBGWSDG001, LLC and ARC DBGESRG001, LLC and the sellers described on the schedules thereto. | |
| 10.35 (23) |
Second Amendment dated as October 1, 2013 to the Purchase and Sale Agreement dated July 24, 2013, by and among ARC DB5PROP001, LLC, ARC DBPGDYR001, LLC, ARC DBPPROP001, LLC, ARC DB5SAAB001, LLC, ARC DBGWSDG001, LLC and ARC DBGESRG001, LLC and the sellers described on the schedules thereto. | |
| 10.36 (23) |
Third Amendment dated as of October 30, 2013 to the Purchase and Sale Agreement dated July 24, 2013, by and among ARC DB5PROP001, LLC, ARC DBPGDYR001, LLC, ARC DBPPROP001, LLC, ARC DB5SAAB001, LLC, ARC DBGWSDG001, LLC and ARC DBGESRG001, LLC and the sellers described on the schedules thereto. | |
| 10.37 (23) |
Sixth Amendment to the Credit Agreement, by and among ARC Properties Operating Partnership, L.P., Tiger Acquisition, LLC, the Registrant, the Lenders party thereto, and Wells Fargo Bank, National Association, dated as of November 4, 2013. | |
| 10.38 (23) |
Employment Agreement, dated as of October 21, 2013, by and between the Registrant and Nicholas S. Schorsch. | |
| 10.39 (23) |
Employment Agreement, dated as of October 21, 2013, by and between the Registrant and Brian S. Block. | |
| 10.40 (23) |
Employment Agreement, dated as of October 21, 2013, by and between American Realty Capital Properties Operating Partnership, L.P. and Lisa Beeson. | |
| 10.41 (30) |
Contribution and Exchange Agreement, dated as of January 3, 2014, among ARC Properties Operating Partnership, L.P., American Realty Capital Trust IV Special Limited Partner, LLC, AREP and ARCT IV Operating Partnership. | |
113
Table of Contents
| Exhibit No. |
Description | |
| 10.42 (34) |
Asset Purchase and Sale Agreement, entered into as of January 8, 2014, by and among ARC Properties Operating Partnership, L.P. and ARC Properties Advisors, LLC. | |
| 10.43 (34) |
Employment Agreement, dated as of November 22, 2013, by and between American Realty Capital Properties Operating Partnership, L.P. and David S. Kay. | |
| 10.44 (34) |
Registrant’s 2014 Multi-Year Outperformance Plan. | |
| 10.45 (34) |
Form of Award Agreement Under the Registrant’s 2014 Multi-Year Outperformance Plan. | |
| 10.46 (34) |
Seventh Amendment to Credit Agreement, dated December 4, 2013, by and among, ARC Properties Operating Partnership, L.P., Tiger Acquisition, LLC, the Registrant, the lenders party thereto and Wells Fargo Bank, National Association, as administrative agent, issuing bank and swingline lender. | |
| 10.47 (34) |
Augmenting Lender and Increasing Lender Supplement, dated as of December 20, 2013, among ARC Properties Operating Partnership, L.P., Tiger Acquisition, LLC, the Registrant, the lenders party thereto and Wells Fargo Bank, National Association, as administrative agent, issuing bank and swingline lender. | |
| 10.48 (34) |
Augmenting Lender Supplement, dated as of January 17, 2014, among ARC Properties Operating Partnership, L.P., Tiger Acquisition, LLC, the Registrant, the lenders party thereto and Wells Fargo Bank, National Association, as administrative agent, issuing bank and swingline lender. | |
| 10.49 (34) |
Tenth Amendment to Credit Agreement, dated February 4, 2014, by and among, ARC Properties Operating Partnership, L.P., Tiger Acquisition, LLC, the Registrant, the lenders party thereto and Wells Fargo Bank, National Association, as administrative agent, issuing bank and swingline lender. | |
| 10.50 (34) |
Assignment and Assumption Agreement, dated January 8, 2014, by and between AR Capital, LLC and American Realty Capital Properties, Inc. | |
| 12.1 (33) |
Ratio of Earnings to Fixed Charges and Preferred Stock Dividends. | |
| 14 (7) |
Code of Ethics. | |
| 21 (34) |
List of Subsidiaries. | |
| 23.1 * |
Consent of Grant Thornton LLP. | |
| 31.1 * |
Certification of the Chief Executive Officer of the Company pursuant to Securities Exchange Act Rule 13a-14(a) or 15d-14(a), as adopted pursuant to Section 302 of the Sarbanes-Oxley Act of 2002. | |
| 31.2 * |
Certification of the Chief Financial Officer of the Company pursuant to Securities Exchange Act Rule 13a-14(a) or 15d-14(a), as adopted pursuant to Section 302 of the Sarbanes-Oxley Act of 2002. | |
| 32.1 * |
Written statements of the Chief Executive Officer of the Registrant pursuant to 18 U.S.C. Section 1350, as adopted pursuant to Section 906 of the Sarbanes-Oxley Act of 2002. | |
| 32.2 * |
Written statements of the Chief Financial Officer of the Registrant pursuant to 18 U.S.C. Section 1350, as adopted pursuant to Section 906 of the Sarbanes-Oxley Act of 2002. | |
| 101† |
XBRL (eXtensible Business Reporting Language). The following materials from Registrant’s Amended Annual Report on Form 10-K/A for the year ended December 31, 2013, formatted in XBRL: (i) the Consolidated Balance Sheets, (ii) the Consolidated Statements of Operations and Comprehensive Loss, (iii) the Consolidated Statements of Changes in Equity, (iv) the Consolidated Statements of Cash Flows and (v) the Notes to Consolidated Financial Statements. As provided in Rule 406T of Regulation S-T, this information is furnished and not filed for purpose of Sections 11 and 12 of the Securities Act of 1933 and Section 18 of the Securities Exchange Act of 1934. | |
| * | Filed herewith |
| ** | Schedules and applicable exhibits omitted pursuant to Item 601(b)(2) of Regulation S-K. The Registrant agrees to furnish a supplemental copy of any omitted schedule to the SEC upon request. |
| † | To be filed by amendment. |
| (1) | Previously filed with Registrant’s Current Report on Form 8-K filed with the Securities and Exchange Commission on January 22, 2013. |
| (2) | Previously filed with Registrant’s Current Report on Form 8-K filed with the Securities and Exchange Commission on December 17, 2012. |
| (3) | Previously filed with the Pre-Effective Amendment No. 5 to Form S-11 Registration Statement (Registration No. 333-172205) filed by the Registrant with the Securities and Exchange Commission on July 5, 2011. |
| (4) | Previously filed with the Pre-Effective Amendment No. 4 to Form S-11 Registration Statement (Registration No. 333-172205) filed by the Registrant with the Securities and Exchange Commission on June 13, 2011. |
| (5) | Previously filed with the Registrant’s Current Report on Form 8-K filed with the Securities and Exchange Commission on May 15, 2012. |
| (6) | Previously filed with the Registrant’s Current Report on Form 8-K filed with the Securities and Exchange Commission on July 30, 2012. |
| (7) | Previously filed with the Registrant’s Current Report on Form 8-K filed with the Securities and Exchange Commission on August 1, 2012. |
114
Table of Contents
| (8) | Previously filed with the Registrant’s Current Report on Form 8-K filed with the Securities and Exchange Commission on March 6, 2013. |
| (9) | Previously filed with the Registrant’s Quarterly Report on Form 10-Q for the quarter ended March 31, 2013 filed with the Securities and Exchange Commission on May 6, 2013. |
| (10) | Previously filed with the Registrant’s Current Report on Form 8-K filed with the Securities and Exchange Commission on May 28, 2013. |
| (11) | Previously filed with the Registrant’s Amended Current Report on Form 8-K/A filed with the Securities and Exchange Commission on June 7, 2013. |
| (12) | Previously filed with the Registrant’s Current Report on Form 8-K filed with the Securities and Exchange Commission on June 12, 2013. |
| (13) | Previously filed with the Registrant’s Current Report on Form 8-K filed with the Securities and Exchange Commission on July 2, 2013. |
| (14) | Previously filed with the Registrant’s Current Report on Form 8-K filed with the Securities and Exchange Commission on July 29, 2013. |
| (15) | Previously filed with the Registrant’s Quarterly Report on Form 10-Q for the quarter ended June 30, 2013 filed with the Securities and Exchange Commission on August 6, 2013. |
| (16) | Previously filed with the Registrant’s Amended Current Report on Form 8-K/A filed with the Securities and Exchange Commission on September 19, 2013. |
| (17) | Previously filed with the Registrant’s Amended Current Report on Form 8-K/A filed with the Securities and Exchange Commission on September 25, 2013. |
| (18) | Previously filed with the Registrant’s First Current Report on Form 8-K filed with the Securities and Exchange Commission on October 7, 2013. |
| (19) | Previously filed with the Registrant’s Second Current Report on Form 8-K filed with the Securities and Exchange Commission on October 7, 2013. |
| (20) | Previously filed with the Registrant’s Current Report on Form 8-K filed with the Securities and Exchange Commission on October 23, 2013. |
| (21) | Previously filed with the Registrant’s Amended Current Report on Form 8-K/A filed with the Securities and Exchange Commission on October 25, 2013. |
| (22) | Previously filed with the Registrant’s Current Report on Form 8-K filed with the Securities and Exchange Commission on November 5, 2013. |
| (23) | Previously filed with the Registrant’s Quarterly Report on Form 10-Q for the quarter ended September 30, 2013 filed with the Securities and Exchange Commission on November 7, 2013. |
| (24) | Previously filed with the Registrant’s Current Report on Form 8-K filed with the Securities and Exchange Commission on November 15, 2013. |
| (25) | Previously filed with the Registrant’s Current Report on Form 8-K filed with the Securities and Exchange Commission on November 26, 2013. |
| (26) | Previously filed as Annex E with the Registrant’s Final Prospectus Filed Pursuant to Rule 424(b)(3) with the Securities and Exchange Commission on December 4, 2013. |
| (27) | Previously filed with the Registrant’s Current Report on Form 8-K filed with the Securities and Exchange Commission on December 10, 2013. |
| (28) | Previously filed with the Registrant’s Amended Current Report on Form 8-K/A filed with the Securities and Exchange Commission on December 19, 2013. |
| (29) | Previously filed with the Registrant’s Registration Statement on Form 8-A filed with the Securities and Exchange Commission on January 3, 2014. |
| (30) | Previously filed with the Registrant’s Current Report on Form 8-K filed with the Securities and Exchange Commission on January 3, 2014. |
| (31) | Previously filed with the Registrant’s Current Report on Form 8-K filed with the Securities and Exchange Commission on February 7, 2014. |
| (32) | Previously filed with the Registrant’s Annual Report on Form 10-K for the year ended December 31, 2012 filed with the Securities and Exchange Commission on February 28, 2013. |
115
Table of Contents
| (33) | Previously filed with Pre-Effective Amendment No. 7 to the Registrant’s Registration Statement on Form S-4/A filed with the Securities and Exchange Commission on December 3, 2013. |
| (34) | Previously filed with the Registrant’s Annual Report on Form 10-K for the year ended December 31, 2013 filed with the Securities and Exchange Commission on February 27, 2014. |
116
Table of Contents
Pursuant to the requirements of the Securities Exchange Act of 1934, as amended, the registrant has duly caused this Amendment No. 2 to its Annual Report on Form 10-K/A to be signed on its behalf by the undersigned thereunto duly authorized on this 2nd day of March, 2015.
| AMERICAN REALTY CAPITAL PROPERTIES, INC. | ||||
| By: | /s/ Michael Sodo | |||
| Executive Vice President and Chief Financial Officer (Principal Financial Officer) | ||||
117
Table of Contents
INDEX TO CONSOLIDATED FINANCIAL STATEMENTS
| Page | ||||
| Financial Statements (As Restated) (1) |
||||
| F-2 | ||||
| Consolidated Balance Sheets as of December 31, 2013 and 2012 |
F-3 | |||
| F-4 | ||||
| Consolidated Statement of Changes in Equity for the Years Ended December 31, 2013, 2012 and 2011 |
F-6 | |||
| Consolidated Statements of Cash Flows for the Years Ended December 31, 2013, 2012 and 2011 |
F-8 | |||
| F-10 | ||||
| F-90 | ||||
| F-162 | ||||
| (1) | These financial statements are restated, as described in Note 2 — Restatement of Previously Issued Financial Statements and are those that reflect the recast in applying the carryover basis of accounting to include American Realty Capital Trust IV, Inc. (“ARCT IV”), as a result of American Realty Capital Properties, Inc.’s merger with ARCT IV, as discussed in Note 1 — Organization. |
F-1
Table of Contents
REPORT OF INDEPENDENT REGISTERED PUBLIC ACCOUNTING FIRM
Board of Directors and Shareholders
American Realty Capital Properties, Inc.
We have audited the accompanying consolidated balance sheets of American Realty Capital Properties, Inc. (a Maryland corporation) and subsidiaries (the “Company”) as of December 31, 2013 and 2012, and the related consolidated statements of operations and comprehensive loss, changes in equity, and cash flows for each of the three years in the period ended December 31, 2013. Our audits of the basic consolidated financial statements included the financial statement schedules listed in the index. These financial statements and financial statement schedules are the responsibility of the Company’s management. Our responsibility is to express an opinion on these financial statements and financial statement schedules based on our audits.
We conducted our audits in accordance with the standards of the Public Company Accounting Oversight Board (United States). Those standards require that we plan and perform the audit to obtain reasonable assurance about whether the financial statements are free of material misstatement. An audit includes examining, on a test basis, evidence supporting the amounts and disclosures in the financial statements. An audit also includes assessing the accounting principles used and significant estimates made by management, as well as evaluating the overall financial statement presentation. We believe that our audits provide a reasonable basis for our opinion.
In our opinion, the consolidated financial statements referred to above present fairly, in all material respects, the financial position of American Realty Capital Properties, Inc. and subsidiaries as of December 31, 2013 and 2012, and the results of their operations and their cash flows for each of the three years in the period ended December 31, 2013 in conformity with accounting principles generally accepted in the United States of America. Also in our opinion, the related financial statement schedules, when considered in relation to the basic consolidated financial statements taken as a whole, present fairly, in all material respects, the information set forth therein.
As described in Note 2 — Restatement of Previously Issued Financial Statements, the Company has restated its consolidated financial statements for 2013 and 2012.
We also have audited, in accordance with the standards of the Public Company Accounting Oversight Board (United States), the Company’s internal control over financial reporting as of December 31, 2013, based on criteria established in the 1992 Internal Control-Integrated Framework issued by the Committee of Sponsoring Organizations of the Treadway Commission (COSO), and our report dated March 2, 2015 expressed an adverse opinion.
/s/ GRANT THORNTON LLP
Phoenix, Arizona
March 2, 2015
F-2
Table of Contents
AMERICAN REALTY CAPITAL PROPERTIES, INC.
CONSOLIDATED BALANCE SHEETS (In thousands, except for share and per share data)
| December 31, | ||||||||
| 2013 (As Restated) (1) |
2012 (As Restated) (1) |
|||||||
| ASSETS | ||||||||
| Real estate investments, at cost: |
||||||||
| Land |
$ | 1,380,308 | $ | 262,906 | ||||
| Buildings, fixtures and improvements |
5,297,400 | 1,391,209 | ||||||
| Land and construction in progress |
21,839 | — | ||||||
| Acquired intangible lease assets |
759,595 | 221,500 | ||||||
|
|
|
|
|
|||||
| Total real estate investments, at cost |
7,459,142 | 1,875,615 | ||||||
| Less: accumulated depreciation and amortization |
(267,278 | ) | (56,524 | ) | ||||
|
|
|
|
|
|||||
| Total real estate investments, net |
7,191,864 | 1,819,091 | ||||||
| Cash and cash equivalents |
52,725 | 292,575 | ||||||
| Investment in direct financing leases, net |
66,112 | — | ||||||
| Investment securities, at fair value |
62,067 | 41,654 | ||||||
| Loans held for investment, net |
26,279 | — | ||||||
| Derivative assets, at fair value |
9,189 | — | ||||||
| Restricted cash |
35,921 | 1,108 | ||||||
| Prepaid expenses and other assets, net |
186,726 | 11,984 | ||||||
| Goodwill |
92,789 | — | ||||||
| Deferred costs, net |
84,746 | 15,118 | ||||||
| Assets held for sale |
665 | 665 | ||||||
|
|
|
|
|
|||||
| Total assets |
$ | 7,809,083 | $ | 2,182,195 | ||||
|
|
|
|
|
|||||
| LIABILITIES AND EQUITY | ||||||||
| Mortgage notes payable, net |
$ | 1,301,114 | $ | 265,118 | ||||
| Convertible debt, net |
972,490 | — | ||||||
| Senior secured revolving credit facility |
— | 124,604 | ||||||
| Senior corporate credit facilities |
1,819,800 | — | ||||||
| Secured credit facility |
150,000 | — | ||||||
| Other debt |
104,804 | — | ||||||
| Below-market lease liabilities, net |
77,169 | — | ||||||
| Derivative liabilities, at fair value |
18,455 | 3,830 | ||||||
| Accounts payable and accrued expenses |
730,571 | 102,740 | ||||||
| Deferred rent and other liabilities |
21,816 | 4,516 | ||||||
| Distributions payable |
10,903 | 11,105 | ||||||
| Due to affiliates |
103,434 | 1,522 | ||||||
|
|
|
|
|
|||||
| Total liabilities |
5,310,556 | 513,435 | ||||||
|
|
|
|
|
|||||
| Series D Preferred Stock, $0.01 par value, 21,735,008 shares (part of 100,000,000 aggregate preferred shares authorized) and zero shares authorized and 21,735,008 and zero shares issued and outstanding at December 31, 2013 and 2012, respectively |
269,299 | — | ||||||
| Preferred stock (excluding Series D Preferred Stock), $0.01 par value, 100,000,000 and 100,000,000 shares authorized and 42,199,547 and 6,990,328 shares issued and outstanding at December 31, 2013 and 2012, respectively |
422 | 70 | ||||||
| Common stock, $0.01 par value, 1,500,000,000 and 240,000,000 shares authorized and 239,234,725 and 184,553,676 issued and outstanding at December 31, 2013 and 2012, respectively |
2,392 | 1,846 | ||||||
| Additional paid-in capital |
2,940,907 | 1,778,883 | ||||||
| Accumulated other comprehensive income (loss) |
7,666 | (3,934 | ) | |||||
| Accumulated deficit |
(877,957 | ) | (124,286 | ) | ||||
|
|
|
|
|
|||||
| Total stockholders’ equity |
2,073,430 | 1,652,579 | ||||||
| Non-controlling interests |
155,798 | 16,181 | ||||||
|
|
|
|
|
|||||
| Total equity |
2,229,228 | 1,668,760 | ||||||
|
|
|
|
|
|||||
| Total liabilities and equity |
$ | 7,809,083 | $ | 2,182,195 | ||||
|
|
|
|
|
|||||
| (1) | For discussion on the restatement adjustments, see Note 2 — Restatement of Previously Issued Financial Statements. |
The accompanying notes are an integral part of these statements.
F-3
Table of Contents
AMERICAN REALTY CAPITAL PROPERTIES, INC.
CONSOLIDATED STATEMENTS OF OPERATIONS
(In thousands, except for per share data)
| Year Ended December 31, | ||||||||||||
| 2013 (As Restated) (1) |
2012 (As Restated) (1) |
2011 | ||||||||||
| Revenues: |
||||||||||||
| Rental income |
$ | 310,508 | $ | 65,262 | $ | 3,762 | ||||||
| Direct financing lease income |
2,244 | — | — | |||||||||
| Operating expense reimbursements |
16,571 | 1,945 | 208 | |||||||||
|
|
|
|
|
|
|
|||||||
| Total revenues |
329,323 | 67,207 | 3,970 | |||||||||
|
|
|
|
|
|
|
|||||||
| Operating expenses: |
||||||||||||
| Acquisition related (including $37,564, $28,656 and $1,692 to affiliates, respectively) |
76,113 | 45,070 | 3,898 | |||||||||
| Merger and other non-routine transactions (including $156,146, $0 and $0 to affiliates, respectively) |
210,543 | 2,603 | — | |||||||||
| Property operating |
23,616 | 3,522 | 220 | |||||||||
| Management fees to affiliates |
17,462 | 212 | — | |||||||||
| General and administrative (including $103,206, $826 and $168 to affiliates, respectively) |
123,172 | 5,458 | 749 | |||||||||
| Depreciation and amortization |
210,976 | 40,957 | 2,097 | |||||||||
| Impairment of real estate |
3,346 | — | — | |||||||||
|
|
|
|
|
|
|
|||||||
| Total operating expenses |
665,228 | 97,822 | 6,964 | |||||||||
|
|
|
|
|
|
|
|||||||
| Operating loss |
(335,905 | ) | (30,615 | ) | (2,994 | ) | ||||||
|
|
|
|
|
|
|
|||||||
| Other (expense) income: |
||||||||||||
| Interest expense |
(105,548 | ) | (11,856 | ) | (960 | ) | ||||||
| Other income, net |
3,824 | 979 | 4 | |||||||||
| Loss on derivative instruments, net |
(67,946 | ) | — | (2 | ) | |||||||
| Loss on sale of investments in affiliates |
(411 | ) | — | — | ||||||||
| Loss on sale of investments |
(1,795 | ) | — | — | ||||||||
|
|
|
|
|
|
|
|||||||
| Total other expenses, net |
(171,876 | ) | (10,877 | ) | (958 | ) | ||||||
|
|
|
|
|
|
|
|||||||
| Loss from continuing operations |
(507,781 | ) | (41,492 | ) | (3,952 | ) | ||||||
| Net loss from continuing operations attributable to non-controlling interests |
16,315 | 531 | 69 | |||||||||
|
|
|
|
|
|
|
|||||||
| Net loss from continuing operations attributable to stockholders |
(491,466 | ) | (40,961 | ) | (3,883 | ) | ||||||
|
|
|
|
|
|
|
|||||||
| Discontinued operations: |
||||||||||||
| Loss from operations of held for sale properties |
(34 | ) | (145 | ) | (37 | ) | ||||||
| Loss on held for sale properties |
— | (600 | ) | (815 | ) | |||||||
|
|
|
|
|
|
|
|||||||
| Net loss from discontinued operations |
(34 | ) | (745 | ) | (852 | ) | ||||||
| Net loss from discontinued operations attributable to non-controlling interest |
1 | 54 | 36 | |||||||||
|
|
|
|
|
|
|
|||||||
| Net loss from discontinued operations attributable to stockholders |
(33 | ) | (691 | ) | (816 | ) | ||||||
|
|
|
|
|
|
|
|||||||
| Net loss |
(507,815 | ) | (42,237 | ) | (4,804 | ) | ||||||
| Net loss attributable to non-controlling interests |
16,316 | 585 | 105 | |||||||||
|
|
|
|
|
|
|
|||||||
| Net loss attributable to stockholders |
$ | (491,499 | ) | $ | (41,652 | ) | $ | (4,699 | ) | |||
|
|
|
|
|
|
|
|||||||
| Basic and diluted net loss per share from continuing operations attributable to common stockholders |
$ | (2.41 | ) | $ | (0.40 | ) | $ | (1.04 | ) | |||
|
|
|
|
|
|
|
|||||||
| Basic and diluted net loss per share attributable to common stockholders |
$ | (2.41 | ) | $ | (0.41 | ) | $ | (1.26 | ) | |||
|
|
|
|
|
|
|
|||||||
| (1) | For discussion on the restatement adjustments, see Note 2 — Restatement of Previously Issued Financial Statements. |
The accompanying notes are an integral part of these statements.
F-4
Table of Contents
AMERICAN REALTY CAPITAL PROPERTIES, INC.
CONSOLIDATED STATEMENTS OF COMPREHENSIVE LOSS
(In thousands)
| Year Ended December 31, | ||||||||||||
| 2013 (As Restated) (1) |
2012 (As Restated) (1) |
2011 | ||||||||||
| Net loss |
$ | (507,815 | ) | $ | (42,237 | ) | $ | (4,804 | ) | |||
| Other comprehensive income (loss): |
||||||||||||
| Designated derivatives, fair value adjustments |
11,481 | (3,743 | ) | (98 | ) | |||||||
| Unrealized gain (loss) on investment securities |
119 | (93 | ) | — | ||||||||
|
|
|
|
|
|
|
|||||||
| Total other comprehensive income (loss) |
11,600 | (3,836 | ) | (98 | ) | |||||||
|
|
|
|
|
|
|
|||||||
| Total comprehensive loss |
(496,215 | ) | (46,073 | ) | (4,902 | ) | ||||||
| Comprehensive loss attributable to noncontrolling interests |
16,316 | 585 | 105 | |||||||||
|
|
|
|
|
|
|
|||||||
| Total comprehensive loss attributable to stockholders |
$ | (479,899 | ) | $ | (45,488 | ) | $ | (4,797 | ) | |||
|
|
|
|
|
|
|
|||||||
| (1) | For discussion on the restatement adjustments, see Note 2 — Restatement of Previously Issued Financial Statements. |
The accompanying notes are an integral part of these statements.
F-5
Table of Contents
AMERICAN REALTY CAPITAL PROPERTIES, INC.
CONSOLIDATED STATEMENTS OF CHANGES IN EQUITY
(In thousands, except for share data)
(As restated for the years ended December 31, 2013 and 2012) (1)
| Preferred Stock | Common Stock | |||||||||||||||||||||||||||||||||||||||
| Number of Shares |
Par Value |
Number of Shares |
Par Value |
Additional Paid-In Capital |
Accumulated Other Comprehensive Income (Loss) |
Accumulated Deficit |
Total Stockholders’ Equity |
Non-Controlling Interests |
Total Equity |
|||||||||||||||||||||||||||||||
| Balance, December 31, 2010 |
— | $ | — | 20,000 | $ | — | $ | 200 | $ | — | $ | — | $ | 200 | $ | — | $ | 200 | ||||||||||||||||||||||
| Issuance of common stock |
— | — | 16,929,184 | 170 | 185,957 | — | — | 186,127 | — | 186,127 | ||||||||||||||||||||||||||||||
| Offering costs, commissions and dealer manager fees (2) |
— | — | — | — | (21,752 | ) | — | — | (21,752 | ) | — | (21,752 | ) | |||||||||||||||||||||||||||
| Common stock issued through distribution reinvestment plan |
— | — | 27,169 | — | 271 | — | — | 271 | — | 271 | ||||||||||||||||||||||||||||||
| Equity-based compensation |
— | — | 185,663 | 2 | 223 | — | — | 225 | — | 225 | ||||||||||||||||||||||||||||||
| Distributions declared |
— | — | — | — | — | — | (2,519 | ) | (2,519 | ) | — | (2,519 | ) | |||||||||||||||||||||||||||
| Common stock repurchases |
— | — | — | — | (25 | ) | — | — | (25 | ) | — | (25 | ) | |||||||||||||||||||||||||||
| Contribution transactions |
— | — | — | — | (16,769 | ) | — | — | (16,769 | ) | — | (16,769 | ) | |||||||||||||||||||||||||||
| Contributions from non-controlling interest holders |
— | — | — | — | (3,875 | ) | — | — | (3,875 | ) | 3,875 | — | ||||||||||||||||||||||||||||
| Distributions to non-controlling interest holders |
— | — | — | — | — | — | — | — | (68 | ) | (68 | ) | ||||||||||||||||||||||||||||
| Net loss |
— | — | — | — | — | — | (4,699 | ) | (4,699 | ) | (105 | ) | (4,804 | ) | ||||||||||||||||||||||||||
| Other comprehensive loss |
— | — | — | — | — | (98 | ) | — | (98 | ) | — | (98 | ) | |||||||||||||||||||||||||||
|
|
|
|
|
|
|
|
|
|
|
|
|
|
|
|
|
|
|
|
|
|||||||||||||||||||||
| Balance, December 31, 2011 |
— | — | 17,162,016 | 172 | 144,230 | (98 | ) | (7,218 | ) | 137,086 | 3,702 | 140,788 | ||||||||||||||||||||||||||||
| Issuance of preferred stock |
6,990,328 | 70 | — | — | 8,992 | — | — | 9,062 | — | 9,062 | ||||||||||||||||||||||||||||||
| Issuance of common stock |
— | — | 164,775,688 | 1,648 | 1,911,126 | — | — | 1,912,774 | — | 1,912,774 | ||||||||||||||||||||||||||||||
| Excess of ARCT IV Merger considerations over historical cost |
— | — | — | — | (93,421 | ) | — | — | (93,421 | ) | — | (93,421 | ) | |||||||||||||||||||||||||||
| Offering costs, commissions and dealer manager fees (2) |
— | — | — | — | (218,431 | ) | — | — | (218,431 | ) | — | (218,431 | ) | |||||||||||||||||||||||||||
| Common stock issued through distribution reinvestment plan |
— | — | 2,686,141 | 27 | 27,109 | — | — | 27,136 | — | 27,136 | ||||||||||||||||||||||||||||||
| Equity based compensation |
— | — | 112,950 | 1 | 1,229 | — | — | 1,230 | — | 1,230 | ||||||||||||||||||||||||||||||
| Distributions declared |
— | — | — | — | — | — | (75,416 | ) | (75,416 | ) | — | (75,416 | ) | |||||||||||||||||||||||||||
| Common stock repurchases |
— | — | (183,119 | ) | (2 | ) | (1,951 | ) | — | — | (1,953 | ) | — | (1,953 | ) | |||||||||||||||||||||||||
| OP Units issued to acquire real estate investment |
— | — | — | — | — | — | — | — | 6,352 | 6,352 | ||||||||||||||||||||||||||||||
| Contributions from non-controlling interest holders |
— | — | — | — | — | — | — | — | 7,375 | 7,375 | ||||||||||||||||||||||||||||||
| Distributions to non-controlling interest holders |
— | — | — | — | — | — | — | — | (663 | ) | (663 | ) | ||||||||||||||||||||||||||||
| Net loss |
— | — | — | — | — | — | (41,652 | ) | (41,652 | ) | (585 | ) | (42,237 | ) | ||||||||||||||||||||||||||
| Other comprehensive loss |
— | — | — | — | — | (3,836 | ) | — | (3,836 | ) | — | (3,836 | ) | |||||||||||||||||||||||||||
|
|
|
|
|
|
|
|
|
|
|
|
|
|
|
|
|
|
|
|
|
|||||||||||||||||||||
| Balance, December 31, 2012 |
6,990,328 | $ | 70 | 184,553,676 | $ | 1,846 | 1,778,883 | $ | (3,934 | ) | $ | (124,286 | ) | $ | 1,652,579 | $ | 16,181 | $ | 1,668,760 | |||||||||||||||||||||
The consolidated statements of changes in equity continues onto the next page.
F-6
Table of Contents
AMERICAN REALTY CAPITAL PROPERTIES, INC.
CONSOLIDATED STATEMENTS OF CHANGES IN EQUITY – (Continued)
(In thousands, except for share data)
(As restated for the years ended December 31, 2013 and 2012) (1)
| Preferred Stock | Common Stock | |||||||||||||||||||||||||||||||||||||||
| Number of Shares |
Par Value |
Number of Shares |
Par Value |
Additional Paid-In Capital |
Accumulated Other Comprehensive Income (Loss) |
Accumulated Deficit |
Total Stockholders’ Equity |
Non-Controlling Interests |
Total Equity |
|||||||||||||||||||||||||||||||
| Issuances of preferred stock |
36,037,691 | $ | 360 | — | $ | — | $ | — | $ | — | $ | — | $ | 360 | $ | — | $ | 360 | ||||||||||||||||||||||
| Issuances of common stock |
— | — | 78,215,719 | 781 | 2,153,144 | — | — | 2,153,925 | — | 2,153,925 | ||||||||||||||||||||||||||||||
| Excess of ARCT IV Merger considerations over historical cost |
— | — | — | — | (558,089 | ) | — | — | (558,089 | ) | — | (558,089 | ) | |||||||||||||||||||||||||||
| Offering costs, commissions and dealer manager fees (2) |
— | — | — | — | (165,531 | ) | — | — | (165,531 | ) | — | (165,531 | ) | |||||||||||||||||||||||||||
| Common stock issued through dividend reinvestment plan |
— | — | 940,737 | 10 | 25,554 | — | — | 25,564 | — | 25,564 | ||||||||||||||||||||||||||||||
| Common stock repurchases |
— | — | (28,319,972 | ) | (283 | ) | (357,758 | ) | — | — | (358,041 | ) | — | (358,041 | ) | |||||||||||||||||||||||||
| Conversion of Convertible Preferred Stock Series A and B to common stock |
(828,472 | ) | (8 | ) | 829,629 | 8 | — | — | — | — | — | — | ||||||||||||||||||||||||||||
| Issuance of common stock in conversion of Convertible Preferred Stock Series C |
— | — | 1,411,030 | 14 | 17,382 | — | — | 17,396 | — | 17,396 | ||||||||||||||||||||||||||||||
| Conversion of OP Units to common stock |
— | — | 599,233 | 6 | 5,794 | — | — | 5,800 | (5,800 | ) | — | |||||||||||||||||||||||||||||
| Equity based compensation, including amortization of restricted shares |
— | — | 1,004,673 | 10 | 7,952 | — | — | 7,962 | 32,700 | 40,662 | ||||||||||||||||||||||||||||||
| Equity component of convertible debt |
— | — | — | — | 28,559 | — | — | 28,559 | — | 28,559 | ||||||||||||||||||||||||||||||
| Contribution from Former Manager |
— | — | — | — | 2,313 | — | — | 2,313 | — | 2,313 | ||||||||||||||||||||||||||||||
| Consideration to Former Manager for internalization |
— | — | — | — | 2,704 | — | (2,704 | ) | — | — | — | |||||||||||||||||||||||||||||
| Distributions declared |
— | — | — | — | — | — | (259,468 | ) | (259,468 | ) | — | (259,468 | ) | |||||||||||||||||||||||||||
| Issuance of OP Units to affiliate |
— | — | — | — | — | — | — | — | 107,771 | 107,771 | ||||||||||||||||||||||||||||||
| Contributions from non-controlling interest holders |
— | — | — | — | — | — | — | — | 30,861 | 30,861 | ||||||||||||||||||||||||||||||
| Distributions to non-controlling interest holders |
— | — | — | — | — | — | — | — | (9,014 | ) | (9,014 | ) | ||||||||||||||||||||||||||||
| Non-controlling interests retained in CapLease Merger |
— | — | — | — | — | — | — | — | 567 | 567 | ||||||||||||||||||||||||||||||
| Redemption of OP Units |
— | — | — | — | — | — | — | — | (1,152 | ) | (1,152 | ) | ||||||||||||||||||||||||||||
| Net loss |
— | — | — | — | — | (491,499 | ) | (491,499 | ) | (16,316 | ) | (507,815 | ) | |||||||||||||||||||||||||||
| Other comprehensive income |
— | — | — | — | — | 11,600 | — | 11,600 | — | 11,600 | ||||||||||||||||||||||||||||||
|
|
|
|
|
|
|
|
|
|
|
|
|
|
|
|
|
|
|
|
|
|||||||||||||||||||||
| Balance, December 31, 2013 |
42,199,547 | $ | 422 | 239,234,725 | $ | 2,392 | $ | 2,940,907 | $ | 7,666 | $ | (877,957 | ) | $ | 2,073,430 | $ | 155,798 | $ | 2,229,228 | |||||||||||||||||||||
|
|
|
|
|
|
|
|
|
|
|
|
|
|
|
|
|
|
|
|
|
|||||||||||||||||||||
| (1) | For discussion on the restatement adjustments, see Note 2 — Restatement of Previously Issued Financial Statements. |
| (2) | Includes $161.8 million, $211.4 million and $18.2 million to affiliates of the Former Manager (as defined in Note 1) for the years ended December 31, 2013, 2012 and 2011, respectively. |
The accompanying notes are an integral part of these statements.
F-7
Table of Contents
AMERICAN REALTY CAPITAL PROPERTIES, INC.
CONSOLIDATED STATEMENTS OF CASH FLOWS (In thousands)
| Year ended December 31, | ||||||||||||
| 2013 (As Restated) (1) |
2012 | 2011 | ||||||||||
| Cash flows from operating activities: |
||||||||||||
| Net loss |
$ | (507,815 | ) | $ | (42,237 | ) | $ | (4,804 | ) | |||
| Adjustments to reconcile net loss to net cash (used in) provided by operating activities: |
||||||||||||
| Issuance of OP Units for the ARCT III Merger |
107,771 | — | — | |||||||||
| Depreciation and amortization |
238,307 | 43,152 | 2,323 | |||||||||
| Loss on held for sale properties |
— | 600 | 815 | |||||||||
| Impairment of real estate |
3,346 | — | — | |||||||||
| Equity based compensation |
100,261 | 1,230 | 225 | |||||||||
| Unrealized gain on derivative instruments |
(1,739 | ) | — | — | ||||||||
| Loss on sale of investments, net |
2,206 | — | — | |||||||||
| Loss in extinguishment of Series C Stock |
13,749 | — | — | |||||||||
| Changes in assets and liabilities: |
||||||||||||
| Investment in direct financing leases |
2,505 | — | — | |||||||||
| Prepaid expenses and other assets |
(19,851 | ) | (5,089 | ) | (546 | ) | ||||||
| Accounts payable and accrued expenses |
20,789 | 8,277 | 843 | |||||||||
| Deferred rent and other liabilities |
8,555 | 3,507 | 887 | |||||||||
| Due to affiliates |
43,834 | — | — | |||||||||
|
|
|
|
|
|
|
|||||||
| Net cash provided by (used in) operating activities |
11,918 | 9,440 | (257 | ) | ||||||||
|
|
|
|
|
|
|
|||||||
| Cash flows from investing activities: |
||||||||||||
| Investments in real estate and other assets |
(3,520,412 | ) | (1,659,536 | ) | (89,981 | ) | ||||||
| Acquisition of a real estate business, net of cash acquired of $41,779 |
(878,898 | ) | — | — | ||||||||
| Investment in direct financing leases |
(68,617 | ) | — | — | ||||||||
| Capital expenditures |
(9,755 | ) | (54 | ) | — | |||||||
| Principal repayments received from borrowers |
442 | — | — | |||||||||
| Investment in other assets |
(543 | ) | — | — | ||||||||
| Proceeds from sale of property held for sale |
— | 553 | — | |||||||||
| Deposits for real estate investments |
(101,887 | ) | (638 | ) | — | |||||||
| Purchases of investment securities |
(81,590 | ) | (41,747 | ) | — | |||||||
| Proceeds from sale of investment securities |
119,542 | — | — | |||||||||
|
|
|
|
|
|
|
|||||||
| Net cash used in investing activities |
(4,541,718 | ) | (1,701,422 | ) | (89,981 | ) | ||||||
|
|
|
|
|
|
|
|||||||
| Cash flows from financing activities: |
||||||||||||
| Proceeds from mortgage notes payable |
6,924 | 229,798 | 21,470 | |||||||||
| Payments on mortgage notes payable |
(5,711 | ) | — | — | ||||||||
| Payments on other debt |
(9,368 | ) | — | — | ||||||||
| Proceeds from senior secured revolving credit facility |
— | 82,319 | 2,066 | |||||||||
| Payments on senior secured revolving credit facility |
(124,604 | ) | (122 | ) | (11,159 | ) | ||||||
| Proceeds from senior corporate credit facility |
1,889,800 | — | — | |||||||||
| Payments on senior corporate credit facility |
(830,000 | ) | — | — | ||||||||
| Proceeds from secured credit facility |
789,000 | — | — | |||||||||
| Payments of deferred financing costs |
(101,196 | ) | (13,974 | ) | (3,108 | ) | ||||||
| Proceeds from issuance of convertible debt |
967,786 | — | — | |||||||||
| Common stock repurchases |
(359,193 | ) | (1,534 | ) | — | |||||||
| Proceeds from issuances of preferred shares |
— | 9,000 | — | |||||||||
| Proceeds from issuance of Series C Stock |
445,000 | — | — | |||||||||
| Cash payment on settlement of Series C Stock |
(441,353 | ) | — | — | ||||||||
| Proceeds from issuance of Series D Preferred Stock |
287,991 | — | — | |||||||||
| Proceeds from issuance of common stock |
2,158,486 | 1,909,520 | 122,993 | |||||||||
| Payments of offering costs and fees related to stock issuances |
(165,327 | ) | (218,108 | ) | (20,884 | ) | ||||||
| Contributions from affiliate |
— | — | 2 | |||||||||
| Contributions from non-controlling interest holders |
30,861 | 7,375 | — | |||||||||
| Distributions to non-controlling interest holders |
(8,219 | ) | (663 | ) | (68 | ) | ||||||
| Distributions paid |
(234,897 | ) | (37,673 | ) | (1,743 | ) | ||||||
The consolidated statements of cash flows continue onto the next page.
F-8
Table of Contents
AMERICAN REALTY CAPITAL PROPERTIES, INC.
CONSOLIDATED STATEMENTS OF CASH FLOWS (In thousands) – (Continued)
| Year ended December 31, | ||||||||||||
| 2013 (As Restated) (1) |
2012 | 2011 | ||||||||||
| Advances from affiliates, net |
$ | (376 | ) | $ | 396 | $ | — | |||||
| Change in restricted cash |
(5,654 | ) | (1,108 | ) | — | |||||||
|
|
|
|
|
|
|
|||||||
| Net cash provided by financing activities |
4,289,950 | 1,965,226 | 109,569 | |||||||||
|
|
|
|
|
|
|
|||||||
| Net change in cash and cash equivalents |
(239,850 | ) | 273,244 | 19,331 | ||||||||
| Cash and cash equivalents, beginning of period |
292,575 | 19,331 | — | |||||||||
|
|
|
|
|
|
|
|||||||
| Cash and cash equivalents, end of period |
$ | 52,725 | $ | 292,575 | $ | 19,331 | ||||||
|
|
|
|
|
|
|
|||||||
| Supplemental Disclosures: |
||||||||||||
| Cash paid for interest |
$ | 49,549 | $ | 8,983 | $ | 622 | ||||||
| Cash paid for income taxes |
$ | 1,711 | $ | 173 | $ | — | ||||||
| Non-cash investing and financing activities: |
||||||||||||
| OP units issued to acquire real estate investments |
$ | — | $ | 6,352 | $ | — | ||||||
| Common stock issued through distribution reinvestment plan |
$ | 25,568 | $ | 27,136 | $ | 271 | ||||||
| Initial proceeds from credit facility used to pay down mortgages assumed at formation |
$ | — | $ | — | $ | 51,500 | ||||||
| Mortgage note payable contributed in formation |
$ | — | $ | — | $ | 13,850 | ||||||
| (1) | For discussion on the restatement adjustments, see Note 2 — Restatement of Previously Issued Financial Statements. |
The accompanying notes are an integral part of these statements.
F-9
Table of Contents
AMERICAN REALTY CAPITAL PROPERTIES, INC.
NOTES TO CONSOLIDATED FINANCIAL STATEMENTS
December 31, 2013
Note 1 — Organization
American Realty Capital Properties, Inc. (the “Company” or “ARCP”) is a Maryland corporation incorporated on December 2, 2010 that qualified as a real estate investment trust (“REIT”) for U.S. federal income tax purposes beginning in the taxable year ended December 31, 2011. On September 6, 2011, the Company completed its initial public offering (the “IPO”). The Company’s common stock trades on the NASDAQ Global Select Market (“NASDAQ”) under the symbol “ARCP.”
The Company is primarily in the business of acquiring, owning and operating single-tenant, freestanding commercial real estate properties. The Company focuses on investing in properties that are net leased to (i) credit tenants, which are generally large public companies with investment-grade ratings and other creditworthy tenants and (ii) governmental, quasi-governmental and not-for-profit entities. The Company’s long-term business strategy is to acquire a diverse portfolio consisting of approximately 70% long-term leases and 30% medium-term leases, with an average portfolio remaining lease term of approximately 10 to 12 years. The Company considers properties that are leased on a “medium-term” basis to mean properties originally leased long-term (10 years or longer) that currently have a primary remaining lease duration of generally three to eight years, on average. The Company expects this investment strategy to provide for stable income from credit tenants and to provide for growth opportunities from re-leasing of current below market leases.
The Company has advanced its investment objectives by not only growing its net lease portfolio through organic acquisitions but also through strategic mergers and acquisitions. See Note 3 — Mergers and Acquisitions (As Restated).
Substantially all of the Company’s business is conducted through ARC Properties Operating Partnership, L.P., a Delaware limited partnership (the “OP”). The Company is the sole general partner and holder of 96.1% of the equity interests in the OP as of December 31, 2013. As of December 31, 2013, certain affiliates of the Company and certain unaffiliated investors are limited partners and owners of 3.3% and 0.6%, respectively, of the equity interests in the OP. Under the limited partnership agreement of the OP, after holding units of limited partner interests in the OP (“OP Units”) for a period of one year, unless otherwise consented to by the Company, holders of OP Units have the right to redeem the OP Units for the cash value of a corresponding number of shares of the Company’s common stock or, at the option of the Company, as general partner of the OP, a corresponding number of shares of the Company’s common stock. The remaining rights of the holders of OP Units are limited and do not include the ability to replace the general partner or to approve the sale, purchase or refinancing of the OP’s assets.
During the year ended December 31, 2013, ARC Properties Advisors, LLC (the “Former Manager”), a wholly owned subsidiary of AR Capital, LLC (“ARC”), managed the Company’s affairs on a day to day basis and, as a result, the Company was generally externally managed, with the exception of certain acquisition, accounting and portfolio management services performed by employees of the Company. In August 2013, the Company’s board of directors determined that it was in the best interests of the Company and its stockholders to become self-managed, and the Company completed its transition to self-management on January 8, 2014. In connection with becoming self-managed, the Company terminated the management agreement with its Former Manager.
As discussed in Note 3 — Mergers and Acquisitions (As Restated), on January 3, 2014, the Company acquired American Realty Capital Trust IV, Inc. (“ARCT IV”). The Company and ARCT IV, from the date of the Company’s inception to January 3, 2014, were considered to be entities under common control because the entities’ advisors were wholly-owned subsidiaries of ARC. ARC and its related parties had ownership interests in the Company and ARCT IV through the ownership of shares of common stock and other equity interests. In addition, the advisors of the entities were contractually eligible to receive potential fees for their services from the companies, including asset management fees, incentive fees and other fees and had continued to receive fees from the Company prior to the Company’s transition to self-management, which was completed on January 8, 2014. Due to the significance of these fees, the entities’ advisors and ultimately ARC were determined to have a significant economic interest in both companies, in addition to having the power to direct the activities of the companies through advisory/management agreements, which qualified them as affiliated companies under common control in accordance with generally accepted accounting principles in the United States (“U.S. GAAP”). Accordingly, these financial statements have been recast in applying the carryover basis of accounting to include ARCT IV.
F-10
Table of Contents
AMERICAN REALTY CAPITAL PROPERTIES, INC.
NOTES TO CONSOLIDATED FINANCIAL STATEMENTS – (Continued)
December 31, 2013
See Note 24 — Subsequent Events (As Restated) for significant events that occurred subsequent to December 31, 2013.
Note 2 — Restatement of Previously Issued Financial Statements
The Company has restated its consolidated balance sheets as of December 31, 2013 and 2012 and its consolidated statements of operations, consolidated statements of comprehensive loss and consolidated statements of changes in equity for the years ended December 31, 2013 and 2012, along with certain related notes to such restated consolidated financial statements. In addition, the Company has restated its consolidated statement of cash flows for the year ended December 31, 2013. The financial statements, as disclosed in Note 1 — Organization, have also been recast in applying the carryover basis of accounting to include the effects of the Company’s merger with ARCT IV.
The Company determined that the restatement was necessary after an investigation was conducted by the Audit Committee of the Company’s Board of Directors (the “Audit Committee”) with the assistance of independent counsel and forensic accountants. The Audit Committee initiated the investigation in response to concerns regarding accounting practices and other matters that were first reported to it on September 7, 2014. The restatement corrects errors that were identified as a result of the investigation, as well as certain other errors that were identified by the Company. In addition, the restatement reflects corrections of certain immaterial errors and certain previously identified errors that were identified by the Company in the normal course of business and were determined to be immaterial, both individually and in the aggregate, when the consolidated financial statements for the year ended December 31, 2013 were originally issued. In connection with the restatement, the Company has determined that it would be appropriate to correct such errors.
Error Corrections
Merger and Other Non-routine Transaction Related
In light of the findings of the investigation conducted by the Audit Committee, the Company performed an internal review of all acquisition, merger and other non-routine transaction related expenses. The work resulted in the identification of the following errors:
| • | The Company improperly classified $75.7 million of expenses as “merger-related” for the year ended December 31, 2013. As restated, the amount has been reclassified from merger and other non-routine transaction related expenses to general and administrative expenses. The largest component of the misclassified amount was $59.6 million of equity-based compensation expense relating to the OPP (as defined in Note 18 — Equity-based Compensation (As Restated)). |
| • | The Company identified a net amount of $14.5 million of merger and other non-routine transaction related expenses that were incorrectly excluded in the year ended December 31, 2013. As such, the Company recorded additional merger and other non-routine transaction related expense for this amount. |
| • | The Company identified $13.0 million of management fees that were improperly classified as merger and other non-routine transaction related expenses. Such amounts have been properly classified as management fees to affiliates for the year ended December 31, 2013. |
| • | The Company identified $5.9 million of expenses that were improperly recorded as merger and other transaction related expenses that should have been capitalized as deferred financing costs and amortized accordingly. As such, an adjustment to properly record and amortize the deferred financing costs has been made for the year ended December 31, 2013. As a result of capitalizing these deferred financing costs, additional interest expense of $2.3 million was recorded for the year ended December 31, 2013. This resulted in a net adjustment of $3.6 million to deferred financing costs reported on the balance sheet. |
| • | Upon consummation of the ARCT III Merger (as defined in Note 3 — Mergers and Acquisitions (As Restated)), the OP entered into an agreement with an affiliate to acquire certain furniture, fixtures, equipment (“FF&E”) and other assets. The Company originally capitalized $4.1 million of FF&E costs and expensed $1.7 million of costs. The Company has concluded that there was no evidence of the receipt and it could not support the value of the FF&E. As such, the Company has |
F-11
Table of Contents
AMERICAN REALTY CAPITAL PROPERTIES, INC.
NOTES TO CONSOLIDATED FINANCIAL STATEMENTS – (Continued)
December 31, 2013
| expensed the amount originally capitalized and recognized the expense in merger and other non-routine transaction related expense for the year ended December 31, 2013. See Note 19 – Related Party Transactions and Arrangements (As Restated) for further discussion. |
| • | The Company has determined that it should have recorded a controlling interest transfer tax liability totaling $8.9 million upon consummation of the ARCT III Merger and CapLease Merger (each, as defined in Note 3 – Merger and Acquisitions (As Restated)). The accrual and corresponding merger and other non-routine transaction related expense are recorded for the year ended December 31, 2013. |
The Company has updated the caption from “merger and other transaction related” to “merger and other non-routine transactions” to appropriately include non-recurring costs that may not have been incurred solely for a merger transaction. See Note 4 – Summary of Significant Accounting Policies (As Restated) for a further breakout of the merger costs and other non-routine transactions.
Operating Fees to Affiliate
The Company identified $1.2 million of expenses that were incorrectly recorded as operating fees to affiliate. Therefore, the Company decreased operating fees to affiliate by this amount for the year ended December 31, 2013 and recorded the adjustment to the proper balance sheet account.
General and Administrative
The Company originally reported $35.0 million in equity-based compensation in its own line item, however it now reports such compensation as general and administrative expenses.
The Company identified $1.8 million in bonuses paid in 2014 that should have been, but were not, recorded as an accrued expense for the year ended December 31, 2013. As such, the Company has increased the 2013 bonus accrual and the corresponding general and administrative expense by this amount.
Impairment of Real Estate
The Company originally believed that the risk of impairment of its real estate and related assets was mitigated by the fact that substantially all of the Company’s real estate portfolio had been acquired in 2012 and 2013. As a result, the Company had failed to monitor events and changes in circumstances that could indicate that the carrying amount of its real estate and related assets may not be recoverable. The Company performed a detailed analysis of the portfolio in connection with the restatement and noted four properties with impairment indicators. The Company assessed the recoverability of the carrying amounts of such properties as of the date in which such indicators existed. Based on this assessment, the Company noted two properties with carrying amounts in excess of their expected undiscounted cash flows. As a result, the Company reduced the carrying amount of the real estate and related net assets to their estimated fair values by recognizing an impairment loss of $3.3 million for the year ended December 31, 2013.
Net Loss Attributable to Non-controlling Interests
The original calculation of the net loss attributable to non-controlling interest holders for the year ended December 31, 2013 and 2012 excluded expenses that were improperly recorded at the Company level. These expenses were incurred by the OP, and therefore should have been included in the Company’s determination of the net loss attributable to its non-controlling interest holders. In addition, the net loss attributable to the non-controlling interest holders has been adjusted to reflect the impact of the cumulative restatement adjustments discussed and presented herein. As a result, the 2013 and 2012 restated consolidated financial statements reflect an increase of $10.6 million and $0.3 million, respectively, for net loss attributable to non-controlling interest holders and corresponding decreases in net loss attributable to stockholders.
F-12
Table of Contents
AMERICAN REALTY CAPITAL PROPERTIES, INC.
NOTES TO CONSOLIDATED FINANCIAL STATEMENTS – (Continued)
December 31, 2013
Goodwill
Subsequent to the CapLease Merger, the Company disposed of certain properties acquired in that transaction. The disposition of such properties resulted in a net loss on disposition; however, the Company accounted for such losses by adjusting its purchase price allocation to increase the amount of goodwill and decrease the associated real estate investments recorded in connection with the CapLease Merger by $12.0 million when it reissued its recasted financial statements to reflect the common control merger with ARCT IV. The Company has determined that there was not sufficient evidence to support adjusting its goodwill as a measurement period adjustment. As a result, the Company has reversed the measurement period adjustments that were made to goodwill and related assets and liabilities acquired in the CapLease Merger and recognized a net loss on the dispositions in 2014 when the dispositions occurred. In addition, the Company has recorded a decrease to goodwill of $0.6 million for the year ended December 31, 2013 to reflect valid measurement period adjustments that were identified subsequent to the initial purchase price allocation. Additionally, the Company has identified certain liabilities assumed and subsequent payments of such liabilities by the former manager from the CapLease Merger that were not recorded properly. To correct the accounting, the Company has increased goodwill by $3.0 million, decreased merger and non-routine transaction related expenses by $0.7 million and increased the equity contributions by $2.3 million.
Due to Affiliates
Amounts due to affiliates of the Company of $103.4 million, previously reported in accounts payable and accrued expenses, are now reported on a separate line item on the consolidated restated balance sheet.
Other Changes
Along with restating the consolidated financial statements to correct the errors discussed above, the Company recorded adjustments for certain previously identified immaterial accounting errors related to the year ended December 31, 2013 that arose in the normal course of business. In connection with the original financial statement issuance, the Company assessed the impact of these immaterial errors and concluded that they were not material, individually or in the aggregate, to the consolidated financial statements for the year ended December 31, 2013 and each reported fiscal quarter within the year. However, in conjunction with the restatement, the Company determined that it would be appropriate to correct such errors.
The Company also recorded certain reclassifications to conform the presentation of its consolidated statement of operations for the year ended December 31, 2013 to the current period classification and maintain comparability.
In addition to the restatement of the consolidated financial statements, the Company has also restated the following notes for the years ended December 31, 2012 and December 31, 2013 to reflect the error corrections noted above.
| • | Note 3 – Mergers and Acquisitions |
| • | Note 4 – Summary of Significant Accounting Policies |
| • | Note 5 – Real Estate Investments |
| • | Note 6 – CapLease Acquisition |
| • | Note 8 – Prepaid Expenses and Other Assets |
| • | Note 10 – Fair Value of Financial Instruments |
| • | Note 14 – Accounts Payable and Accrued Expenses |
| • | Note 17 – Preferred and Common Stock |
| • | Note 18 – Equity-based Compensation |
| • | Note 19 – Related Party Transactions and Arrangements |
| • | Note 21 – Net Loss Per Share |
| • | Note 23 – Quarterly Results (Unaudited) |
| • | Note 24 – Subsequent Events |
F-13
Table of Contents
AMERICAN REALTY CAPITAL PROPERTIES, INC.
NOTES TO CONSOLIDATED FINANCIAL STATEMENTS – (Continued)
December 31, 2013
The following tables present the combined impact of all changes, as described above, to the applicable line items in the consolidated financial statements to the Company’s previously reported consolidated financial statements for the years ended December 31, 2012 and 2013 (in thousands, except share amounts):
2012 Restated Consolidated Balance Sheet (Adjusted Line Items)
| December 31, 2012 | ||||||||||||
| As Previously Reported (1) |
Restatement Adjustments |
As Restated | ||||||||||
| Accumulated deficit |
$ | (124,570 | ) | $ | 284 | $ | (124,286 | ) | ||||
| Total stockholders’ equity |
$ | 1,652,295 | $ | 284 | $ | 1,652,579 | ||||||
| Non-controlling interests |
16,465 | (284 | ) | 16,181 | ||||||||
|
|
|
|
|
|
|
|||||||
| Total equity |
$ | 1,668,760 | $ | — | $ | 1,668,760 | ||||||
|
|
|
|
|
|
|
|||||||
| (1) | These financial figures have been recast in applying the carryover basis of accounting to include the effects of the merger with ARCT IV. |
2012 Restated Consolidated Statement of Operations (Adjusted Line Items)
| Year Ended December 31, 2012 | ||||||||||||
| As Previously Reported (1) |
Restatement Adjustments |
As Restated | ||||||||||
| Loss from continuing operations |
$ | (41,492 | ) | $ | — | $ | (41,492 | ) | ||||
| Net loss from continuing operations attributable to non-controlling interests |
255 | 276 | 531 | |||||||||
|
|
|
|
|
|
|
|||||||
| Net loss from continuing operations attributable to stockholders |
$ | (41,237 | ) | $ | 276 | $ | (40,961 | ) | ||||
|
|
|
|
|
|
|
|||||||
| Net loss from discontinued operations |
$ | (745 | ) | $ | — | $ | (745 | ) | ||||
| Net loss from discontinued operations attributable to non-controlling interest |
46 | 8 | 54 | |||||||||
|
|
|
|
|
|
|
|||||||
| Net loss from discontinued operations attributable to stockholders |
$ | (699 | ) | $ | 8 | $ | (691 | ) | ||||
|
|
|
|
|
|
|
|||||||
| Net loss |
$ | (42,237 | ) | $ | — | $ | (42,237 | ) | ||||
| Net loss attributable to non-controlling interests |
301 | 284 | 585 | |||||||||
|
|
|
|
|
|
|
|||||||
| Net loss attributable to stockholders |
$ | (41,936 | ) | $ | 284 | $ | (41,652 | ) | ||||
|
|
|
|
|
|
|
|||||||
| (1) | These financial figures have been recast in applying the carryover basis of accounting to include the effects of the merger with ARCT IV. |
F-14
Table of Contents
AMERICAN REALTY CAPITAL PROPERTIES, INC.
NOTES TO CONSOLIDATED FINANCIAL STATEMENTS – (Continued)
December 31, 2013
2013 Restated Consolidated Balance Sheet
| December 31, 2013 | ||||||||||||||||
| As Previously Reported (1) |
Reclassifications | Restatement Adjustments |
As Restated | |||||||||||||
| ASSETS | ||||||||||||||||
| Real estate investments, at cost: |
||||||||||||||||
| Land |
$ | 1,379,453 | $ | — | $ | 855 | $ | 1,380,308 | ||||||||
| Buildings, fixtures and improvements |
5,291,031 | — | 6,369 | 5,297,400 | ||||||||||||
| Land and construction in progress |
21,839 | — | — | 21,839 | ||||||||||||
| Acquired intangible lease assets |
758,376 | 382 | 837 | 759,595 | ||||||||||||
|
|
|
|
|
|
|
|
|
|||||||||
| Total real estate investments, at cost |
7,450,699 | 382 | 8,061 | 7,459,142 | ||||||||||||
| Less: accumulated depreciation and amortization |
(267,352 | ) | (155 | ) | 229 | (267,278 | ) | |||||||||
|
|
|
|
|
|
|
|
|
|||||||||
| Total real estate investments, net |
7,183,347 | 227 | 8,290 | 7,191,864 | ||||||||||||
| Cash and cash equivalents |
52,725 | — | — | 52,725 | ||||||||||||
| Investment in direct financing leases, net |
66,112 | — | — | 66,112 | ||||||||||||
| Investment securities, at fair value |
62,067 | — | — | 62,067 | ||||||||||||
| Loans held for investment, net |
26,279 | — | — | 26,279 | ||||||||||||
| Derivative assets, at fair value |
9,189 | — | — | 9,189 | ||||||||||||
| Restricted cash |
35,921 | — | — | 35,921 | ||||||||||||
| Prepaid expenses and other assets (2) |
187,930 | — | (1,204 | ) | 186,726 | |||||||||||
| Goodwill |
102,419 | — | (9,630 | ) | 92,789 | |||||||||||
| Deferred costs, net |
81,311 | (227 | ) | 3,662 | 84,746 | |||||||||||
| Assets held for sale |
679 | — | (14 | ) | 665 | |||||||||||
|
|
|
|
|
|
|
|
|
|||||||||
| Total assets |
$ | 7,807,979 | $ | — | $ | 1,104 | $ | 7,809,083 | ||||||||
|
|
|
|
|
|
|
|
|
|||||||||
| LIABILITIES AND EQUITY | ||||||||||||||||
| Mortgage notes payable, net |
$ | 1,301,114 | $ | — | $ | — | $ | 1,301,114 | ||||||||
| Convertible debt, net |
972,490 | — | — | 972,490 | ||||||||||||
| Senior corporate credit facilities |
1,819,800 | — | — | 1,819,800 | ||||||||||||
| Secured credit facility |
150,000 | — | — | 150,000 | ||||||||||||
| Other debt |
104,804 | — | — | 104,804 | ||||||||||||
| Below-market lease liabilities, net |
77,789 | — | (620 | ) | 77,169 | |||||||||||
| Derivative liabilities, at fair value |
18,455 | — | — | 18,455 | ||||||||||||
| Accounts payable and accrued expenses |
808,900 | — | (78,329 | ) | 730,571 | |||||||||||
| Deferred rent and other liabilities |
21,816 | — | — | 21,816 | ||||||||||||
| Distributions payable |
10,278 | — | 625 | 10,903 | ||||||||||||
| Due to affiliates (3) |
— | — | 103,434 | 103,434 | ||||||||||||
|
|
|
|
|
|
|
|
|
|||||||||
| Total liabilities |
5,285,446 | — | 25,110 | 5,310,556 | ||||||||||||
|
|
|
|
|
|
|
|
|
|||||||||
| Series D Preferred Stock, $0.01 par value, 21,735,008 shares authorized (part of 100,000,000 aggregate preferred shares authorized) and 21,735,008 shares issued and outstanding at December 31, 2013 |
269,299 | — | — | 269,299 | ||||||||||||
| Preferred stock (excluding Series D Preferred Stock), $0.01 par value, 100,000,000 shares authorized and 42,199,547 shares issued and outstanding at December 31, 2013 |
422 | — | — | 422 | ||||||||||||
| Common stock, $0.01 par value, 1,500,000,000 shares authorized and 239,234,725 issued and outstanding at December 31, 2013 |
2,392 | — | — | 2,392 | ||||||||||||
| Additional paid-in capital |
2,939,287 | — | 1,620 | 2,940,907 | ||||||||||||
| Accumulated other comprehensive income (loss) |
7,666 | — | — | 7,666 | ||||||||||||
| Accumulated deficit |
(864,516 | ) | — | (13,441 | ) | (877,957 | ) | |||||||||
|
|
|
|
|
|
|
|
|
|||||||||
| Total stockholders’ equity |
2,085,251 | — | (11,821 | ) | 2,073,430 | |||||||||||
| Non-controlling interests |
167,983 | — | (12,185 | ) | 155,798 | |||||||||||
|
|
|
|
|
|
|
|
|
|||||||||
| Total equity |
2,253,234 | — | (24,006 | ) | 2,229,228 | |||||||||||
|
|
|
|
|
|
|
|
|
|||||||||
| Total liabilities and equity |
$ | 7,807,979 | $ | — | $ | 1,104 | $ | 7,809,083 | ||||||||
|
|
|
|
|
|
|
|
|
|||||||||
| (1) | These financial statements have been recast in applying the carryover basis of accounting to include the effects of the merger with ARCT IV. |
F-15
Table of Contents
AMERICAN REALTY CAPITAL PROPERTIES, INC.
NOTES TO CONSOLIDATED FINANCIAL STATEMENTS – (Continued)
December 31, 2013
| (2) | Certain line item captions have been updated since the recasted filing, which applied the carryover basis of accounting to include the effects of the merger with ARCT IV. This line item caption has been updated to prepaid expenses and other assets, net in the accompanying consolidated balance sheets. |
| (3) | This line item caption has been added and is included in the accompanying consolidated balance sheets. |
F-16
Table of Contents
AMERICAN REALTY CAPITAL PROPERTIES, INC.
NOTES TO CONSOLIDATED FINANCIAL STATEMENTS – (Continued)
December 31, 2013
2013 Restated Statement of Operations
| Year Ended December 31, 2013 | ||||||||||||||||
| As Previously Reported (1) |
Reclassifications | Restatement Adjustments |
As Restated | |||||||||||||
| Revenues: |
||||||||||||||||
| Rental income |
$ | 309,839 | $ | 669 | $ | — | $ | 310,508 | ||||||||
| Direct financing lease income |
2,244 | — | — | 2,244 | ||||||||||||
| Operating expense reimbursements |
17,795 | (669 | ) | (555 | ) | 16,571 | ||||||||||
|
|
|
|
|
|
|
|
|
|||||||||
| Total revenues |
329,878 | — | (555 | ) | 329,323 | |||||||||||
|
|
|
|
|
|
|
|
|
|||||||||
| Operating expenses: |
||||||||||||||||
| Acquisition related |
76,136 | — | (23 | ) | 76,113 | |||||||||||
| Merger and other transaction related (2) |
278,319 | — | (67,776 | ) | 210,543 | |||||||||||
| Property operating |
23,616 | — | — | 23,616 | ||||||||||||
| Operating fees to affiliate (3) |
5,654 | — | 11,808 | 17,462 | ||||||||||||
| General and administrative |
10,645 | 46 | 112,481 | 123,172 | ||||||||||||
| Equity-based compensation (4) |
34,962 | — | (34,962 | ) | — | |||||||||||
| Depreciation and amortization |
211,372 | (46 | ) | (350 | ) | 210,976 | ||||||||||
| Impairment of real estate (5) |
— | — | 3,346 | 3,346 | ||||||||||||
|
|
|
|
|
|
|
|
|
|||||||||
| Total operating expenses |
640,704 | — | 24,524 | 665,228 | ||||||||||||
|
|
|
|
|
|
|
|
|
|||||||||
| Operating loss |
(310,826 | ) | — | (25,079 | ) | (335,905 | ) | |||||||||
|
|
|
|
|
|
|
|
|
|||||||||
| Other (expense) income: |
||||||||||||||||
| Interest expense |
(102,305 | ) | (977 | ) | (2,266 | ) | (105,548 | ) | ||||||||
| Other income, net |
2,847 | 977 | — | 3,824 | ||||||||||||
| Loss on derivative instruments, net |
(67,946 | ) | — | — | (67,946 | ) | ||||||||||
| Loss on sale of investments in affiliates |
(411 | ) | — | — | (411 | ) | ||||||||||
| Loss on sale of investments |
(1,795 | ) | — | — | (1,795 | ) | ||||||||||
|
|
|
|
|
|
|
|
|
|||||||||
| Total other expenses, net |
(169,610 | ) | — | (2,266 | ) | (171,876 | ) | |||||||||
|
|
|
|
|
|
|
|
|
|||||||||
| Loss from continuing operations |
(480,436 | ) | — | (27,345 | ) | (507,781 | ) | |||||||||
| Net loss from continuing operations attributable to non-controlling interests |
5,715 | — | 10,600 | 16,315 | ||||||||||||
|
|
|
|
|
|
|
|
|
|||||||||
| Net loss from continuing operations attributable to stockholders |
(474,721 | ) | — | (16,745 | ) | (491,466 | ) | |||||||||
|
|
|
|
|
|
|
|
|
|||||||||
| Discontinued operations: |
||||||||||||||||
| Loss from operations of held for sale properties |
(34 | ) | — | — | (34 | ) | ||||||||||
| Gain (loss) on held for sale properties (6) |
14 | — | (14 | ) | — | |||||||||||
|
|
|
|
|
|
|
|
|
|||||||||
| Net loss from discontinued operations |
(20 | ) | — | (14 | ) | (34 | ) | |||||||||
| Net loss from discontinued operations attributable to non-controlling interest |
1 | — | — | 1 | ||||||||||||
|
|
|
|
|
|
|
|
|
|||||||||
| Net loss from discontinued operations attributable to stockholders |
(19 | ) | — | (14 | ) | (33 | ) | |||||||||
|
|
|
|
|
|
|
|
|
|||||||||
| Net loss |
(480,456 | ) | — | (27,359 | ) | (507,815 | ) | |||||||||
| Net loss attributable to non-controlling interests |
5,716 | — | 10,600 | 16,316 | ||||||||||||
|
|
|
|
|
|
|
|
|
|||||||||
| Net loss attributable to stockholders |
$ | (474,740 | ) | $ | — | $ | (16,759 | ) | $ | (491,499 | ) | |||||
|
|
|
|
|
|
|
|
|
|||||||||
| Basic and diluted net loss per share from continuing operations attributable to common stockholders |
$ | (2.33 | ) | $ | — | $ | (0.08 | ) | $ | (2.41 | ) | |||||
| Basic and diluted net loss per share from discontinued operations attributable to common shareholders |
$ | — | $ | — | $ | — | $ | — | ||||||||
| Basic and diluted net loss per share attributable to common stockholders |
$ | (2.33 | ) | $ | — | $ | (0.08 | ) | $ | (2.41 | ) | |||||
| (1) | These financial statements have been recast in applying the carryover basis of accounting to include the effects of the merger with ARCT IV. |
| (2) | This line item caption has been updated to merger and other non-routine transactions in the accompanying consolidated statements of operations. |
| (3) | This line item caption has been updated to management fees to affiliates in the accompanying consolidated statements of operations. |
| (4) | As disclosed above, this line item has been reclassified into general and administrative in the accompanying consolidated statements of operations. |
F-17
Table of Contents
AMERICAN REALTY CAPITAL PROPERTIES, INC.
NOTES TO CONSOLIDATED FINANCIAL STATEMENTS – (Continued)
December 31, 2013
| (5) | As disclosed above, this line item has been added and is included in the accompanying consolidated statements of operations. |
| (6) | This line item caption has been updated to loss on held for sale properties in the accompanying consolidated statements of operations. |
2013 Restated Statement of Comprehensive Loss (1)
| Year Ended December 31, 2013 | ||||||||||||
| As Previously Reported (2) |
Restatement Adjustments |
As Restated | ||||||||||
| Net loss (3) |
$ | (480,456 | ) | $ | (27,359 | ) | $ | (507,815 | ) | |||
| Other comprehensive income (loss): |
||||||||||||
| Designated derivatives, fair value adjustments |
11,480 | 1 | 11,481 | |||||||||
| Change in unrealized gain/loss on investment securities (4) |
119 | — | 119 | |||||||||
|
|
|
|
|
|
|
|||||||
| Total other comprehensive income (loss) (5) |
11,599 | 1 | 11,600 | |||||||||
|
|
|
|
|
|
|
|||||||
| Total comprehensive loss (6) |
(468,857 | ) | (27,358 | ) | (496,215 | ) | ||||||
| Comprehensive loss attributable to non-controlling interests |
5,716 | 10,600 | 16,316 | |||||||||
|
|
|
|
|
|
|
|||||||
| Total comprehensive loss attributable to stockholders |
$ | (463,141 | ) | $ | (16,758 | ) | $ | (479,899 | ) | |||
|
|
|
|
|
|
|
|||||||
| (1) | The statement of comprehensive loss was originally included within the consolidated statement of operations in the recasted filing, which applied the carryover basis of accounting to include the effects of the merger with ARCT IV; it is now presented as a standalone financial statement. |
| (2) | These financial statements have been recast in applying the carryover basis of accounting to include the effects of the merger with ARCT IV. |
| (3) | The statement of comprehensive loss previously began with net loss attributable to common stockholders . The statement has been updated to begin with net loss to properly show the total comprehensive loss. |
| (4) | This line item has been updated to unrealized gain (loss) on investment securities in the accompanying statements of comprehensive loss. |
| (5) | The total other comprehensive income (loss) line item has been added and included in the accompanying statements of comprehensive loss. |
| (6) | This line item caption has been updated to total comprehensive loss in the accompanying statements of comprehensive loss. |
F-18
Table of Contents
AMERICAN REALTY CAPITAL PROPERTIES, INC.
NOTES TO CONSOLIDATED FINANCIAL STATEMENTS – (Continued)
December 31, 2013
2013 Restated Statement of Cash Flows
| December 31, 2013 | ||||||||||||||||
| As Previously Reported (1) |
Reclassifications | Restatement Adjustments |
As Restated | |||||||||||||
| Cash flows from operating activities: |
||||||||||||||||
| Net loss |
$ | (480,456 | ) | $ | — | $ | (27,359 | ) | $ | (507,815 | ) | |||||
| Adjustments to reconcile net loss to net cash (used in) provided by operating activities: |
||||||||||||||||
| Issuance of OP Units for ARCT III Merger |
108,247 | — | (476 | ) | 107,771 | |||||||||||
| Depreciation (2) |
162,027 | 74,364 | 1,916 | 238,307 | ||||||||||||
| Amortization of intangible lease assets (2) |
49,345 | (49,345 | ) | — | — | |||||||||||
| Amortization of deferred costs (2) |
26,895 | (26,895 | ) | — | — | |||||||||||
| Amortization of above- and below-market lease asset (2) |
(176 | ) | 176 | — | — | |||||||||||
| Amortization of discounts and premiums (2) |
(1,700 | ) | 1,700 | — | — | |||||||||||
| Loss on held for sale properties (3) |
(14 | ) | — | 14 | — | |||||||||||
| Impairment of real estate (4) |
— | — | 3,346 | 3,346 | ||||||||||||
| Equity-based compensation |
43,565 | — | 56,696 | 100,261 | ||||||||||||
| Unrealized gain on derivative instruments |
(1,739 | ) | — | — | (1,739 | ) | ||||||||||
| Loss on sale of investments, net |
2,206 | — | — | 2,206 | ||||||||||||
| Loss in extinguishment of Series C Stock |
13,749 | — | — | 13,749 | ||||||||||||
| Changes in assets and liabilities: |
||||||||||||||||
| Investment in direct financing leases |
2,505 | — | — | 2,505 | ||||||||||||
| Prepaid expenses and other assets |
(20,406 | ) | — | 555 | (19,851 | ) | ||||||||||
| Accounts payable and accrued expenses |
100,166 | — | (79,377 | ) | 20,789 | |||||||||||
| Deferred rent and other liabilities |
8,555 | — | — | 8,555 | ||||||||||||
| Due to affiliates (5) |
— | — | 43,834 | 43,834 | ||||||||||||
|
|
|
|
|
|
|
|
|
|||||||||
| Net cash provided by operating activities |
12,769 | — | (851 | ) | 11,918 | |||||||||||
|
|
|
|
|
|
|
|
|
|||||||||
| Cash flows from investing activities: |
||||||||||||||||
| Investments in real estate and other assets |
(3,520,412 | ) | — | — | (3,520,412 | ) | ||||||||||
| Acquisition of a real estate business, net of cash acquired of $41,779 |
(878,898 | ) | — | — | (878,898 | ) | ||||||||||
| Investment in direct financing leases |
(68,617 | ) | — | — | (68,617 | ) | ||||||||||
| Capital expenditures |
(9,755 | ) | — | — | (9,755 | ) | ||||||||||
| Principal repayments received from borrowers |
442 | — | — | 442 | ||||||||||||
| Purchase of assets from Manager (6) |
(1,584 | ) | — | 1,041 | (543 | ) | ||||||||||
| Deposits for real estate investments |
(101,887 | ) | — | — | (101,887 | ) | ||||||||||
| Purchases of investment securities |
(81,590 | ) | — | — | (81,590 | ) | ||||||||||
| Proceeds from sale of investment securities |
119,542 | — | — | 119,542 | ||||||||||||
|
|
|
|
|
|
|
|
|
|||||||||
| Net cash used in investing activities |
(4,542,759 | ) | — | 1,041 | (4,541,718 | ) | ||||||||||
|
|
|
|
|
|
|
|
|
|||||||||
| Cash flows from financing activities: |
||||||||||||||||
| Proceeds from mortgage notes payable |
6,924 | — | — | 6,924 | ||||||||||||
| Payments on mortgage notes payable |
(5,711 | ) | — | — | (5,711 | ) | ||||||||||
| Payments on other debt |
(9,368 | ) | — | — | (9,368 | ) | ||||||||||
| Payments on senior secured revolving credit facility |
(124,604 | ) | — | — | (124,604 | ) | ||||||||||
| Proceeds from senior corporate credit facility |
1,889,800 | — | — | 1,889,800 | ||||||||||||
| Payments on senior corporate credit facility |
(830,000 | ) | — | — | (830,000 | ) | ||||||||||
| Proceeds from secured credit facility |
789,000 | — | — | 789,000 | ||||||||||||
The 2013 restated consolidated statement of cash flows continues onto the next page.
F-19
Table of Contents
AMERICAN REALTY CAPITAL PROPERTIES, INC.
NOTES TO CONSOLIDATED FINANCIAL STATEMENTS – (Continued)
December 31, 2013
| December 31, 2013 | ||||||||||||||||
| As Previously Reported (1) |
Reclassifications | Restatement Adjustments |
As Restated | |||||||||||||
| Payments of deferred financing costs |
$ | (95,268 | ) | $ | — | $ | (5,928 | ) | $ | (101,196 | ) | |||||
| Proceeds from issuance of convertible debt |
967,786 | — | — | 967,786 | ||||||||||||
| Common stock repurchases |
(359,193 | ) | — | — | (359,193 | ) | ||||||||||
| Proceeds from issuance of Series C Stock |
445,000 | — | — | 445,000 | ||||||||||||
| Cash payment on settlement of Series C Stock |
(441,353 | ) | — | — | (441,353 | ) | ||||||||||
| Proceeds from issuance of Series D Preferred Stock |
287,991 | — | — | 287,991 | ||||||||||||
| Proceeds from issuance of common stock |
2,158,486 | — | — | 2,158,486 | ||||||||||||
| Payments of offering costs and fees related to stock issuances |
(165,327 | ) | — | — | (165,327 | ) | ||||||||||
| Consideration to Former Manager for internalization |
(5,738 | ) | — | 5,738 | — | |||||||||||
| Contributions from non-controlling interest holders |
30,861 | — | — | 30,861 | ||||||||||||
| Distributions to non-controlling interest holders |
(8,219 | ) | — | — | (8,219 | ) | ||||||||||
| Distributions paid |
(234,897 | ) | — | — | (234,897 | ) | ||||||||||
| Advances from affiliates, net |
(376 | ) | — | — | (376 | ) | ||||||||||
| Change in restricted cash |
(5,654 | ) | — | — | (5,654 | ) | ||||||||||
|
|
|
|
|
|
|
|
|
|||||||||
| Net cash provided by financing activities |
4,290,140 | — | (190 | ) | 4,289,950 | |||||||||||
|
|
|
|
|
|
|
|
|
|||||||||
| Net change in cash and cash equivalents |
(239,850 | ) | — | — | (239,850 | ) | ||||||||||
| Cash and cash equivalents, beginning of period |
292,575 | — | — | 292,575 | ||||||||||||
|
|
|
|
|
|
|
|
|
|||||||||
| Cash and cash equivalents, end of period |
$ | 52,725 | $ | — | $ | — | $ | 52,725 | ||||||||
|
|
|
|
|
|
|
|
|
|||||||||
| (1) | These financial statements have been recast in applying the carryover basis of accounting to include the effects of the merger with ARCT IV. |
| (2) | These five depreciation and amortization line items have been consolidated into one line item named depreciation and amortization in the accompanying consolidated statements of cash flows. |
| (3) | This line item caption has been updated to loss on held for sale properties in the accompanying consolidated statements of cash flows. |
| (4) | As disclosed above, this line item has been added and is included in the accompanying consolidated statements of cash flows. |
| (5) | This line item caption has been added and is included in the accompanying consolidated statements of cash flows. |
| (6) | This line item caption has been updated to investments in other assets in the accompanying consolidated statements of cash flows. |
Note 3 — Mergers and Acquisitions (As Restated)
Completed Mergers and Significant Acquisitions
American Realty Capital Trust III, Inc. Merger
On December 14, 2012, the Company entered into an Agreement and Plan of Merger (the “ARCT III Merger Agreement”) with American Realty Capital Trust III, Inc. (“ARCT III”) and certain subsidiaries of each company. The ARCT III Merger Agreement provided for the merger of ARCT III with and into a subsidiary of the Company (the “ARCT III Merger”). The ARCT III Merger was consummated on February 28, 2013.
Pursuant to the terms and subject to the conditions set forth in the ARCT III Merger Agreement, each outstanding share of common stock of ARCT III, including restricted shares which became vested, was converted into the right to receive (i) 0.95 of a share of the Company’s common stock, (the “ARCT III Exchange Ratio”) or (ii) $12.00 in cash. In addition, each outstanding unit of equity ownership of the ARCT III Operating Partnership (“ARCT III OP”) was converted into the right to receive 0.95 of the same class of unit of equity ownership in the OP.
Upon the closing of the ARCT III Merger on February 28, 2013, the Company paid an aggregate of $350.4 million in cash for the 29.2 million shares, or 16.5% of the then outstanding shares of ARCT III’s common stock (which is equivalent to 27.7 million shares of the Company’s common stock based on the ARCT III Exchange Ratio). In addition, 140.7 million shares of the Company’s common stock were issued in exchange for 148.1 million shares of ARCT III’s common stock adjusted for the ARCT III Exchange Ratio.
F-20
Table of Contents
AMERICAN REALTY CAPITAL PROPERTIES, INC.
NOTES TO CONSOLIDATED FINANCIAL STATEMENTS – (Continued)
December 31, 2013
Upon the consummation of the ARCT III Merger, American Realty Capital Trust III Special Limited Partner, LLC (the “ARCT III Special Limited Partner”), the holder of the special limited partner interest in the ARCT III OP, was entitled to subordinated distributions of net sales proceeds from ARCT III OP which resulted in the issuance of units of limited partner interests in the ARCT III OP, when after applying the ARCT III Exchange Ratio, resulting in the issuance of an additional 7.3 million OP Units to affiliates of the Company’s Former Manager. The parties had agreed that such OP Units would be subject to a minimum one-year holding period from the date of issuance before being exchangeable into the Company’s common stock.
Also in connection with the ARCT III Merger, the Company entered into an agreement with ARC and its affiliates to internalize certain functions performed by them prior to the ARCT III Merger, reduce certain fees paid to affiliates and pay certain merger related fees. See Note 19 — Related Party Transactions and Arrangements (As Restated).
Accounting Treatment for the ARCT III Merger
The Company and ARCT III, from inception to the ARCT III Merger date, were considered to be entities under common control. Both entities’ advisors were wholly owned subsidiaries of ARC. ARC and its related parties had significant ownership interests in the Company and ARCT III through the ownership of shares of common stock and other equity interests. In addition, the advisors of both entities were contractually eligible to receive potential fees for their services to both of the companies including asset management fees, incentive fees and other fees and continued to receive fees from the Company prior to the Company’s transition to self-management. Due to the significance of these fees, the advisors, and ultimately ARC, were determined to have a significant economic interest in both companies in addition to having the power to direct the significant activities of the companies through advisory/management agreements, which qualified them as affiliated companies under common control in accordance with U.S. GAAP. The acquisition of an entity under common control is accounted for on the carryover basis of accounting, whereby the assets and liabilities of the companies are recorded upon the merger on the same basis as they were carried by the companies on the ARCT III Merger date. In addition, U.S. GAAP requires the Company to present historical financial information as if the merger had occurred as of the earliest period of common control. Therefore, the accompanying financial statements including the notes thereto are presented as if the ARCT III Merger had occurred at inception.
GE Capital Portfolio Acquisitions
On June 27, 2013, the Company acquired, through subsidiaries of the OP, from certain affiliates of GE Capital Corp., the equity interests in the entities that own a real estate portfolio comprised of 447 properties (the “GE Capital Portfolio”) for a purchase price of $773.9 million, exclusive of closing costs, with no liabilities assumed. The 447 properties are subject to 409 property operating leases, as well as 38 direct financing leases.
During the year ended December 31, 2013, ARCT IV acquired, from certain affiliates of GE Capital Corp., the equity interests in the entities that own a real estate portfolio comprised of 924 properties (the “ARCT IV GE Capital Portfolio”) for a purchase price of $1.4 billion, exclusive of closing costs, with no liabilities assumed. The 924 properties are subject to 912 property operating leases, as well as 12 direct financing leases.
CapLease, Inc. Merger
On May 28, 2013, the Company entered into an Agreement and Plan of Merger (the “CapLease Merger Agreement”) with CapLease Inc. (“CapLease”), and certain subsidiaries of each company. The CapLease Merger Agreement provided for the merger of CapLease with and into a subsidiary of the Company (the “CapLease Merger”).
F-21
Table of Contents
AMERICAN REALTY CAPITAL PROPERTIES, INC.
NOTES TO CONSOLIDATED FINANCIAL STATEMENTS – (Continued)
December 31, 2013
On November 5, 2013, the Company completed the merger with CapLease pursuant to the CapLease Merger Agreement. Pursuant to the terms of the CapLease Merger Agreement, each outstanding share of common stock of CapLease, other than shares owned by the Company, CapLease or any of their respective wholly owned subsidiaries, was converted into the right to receive $8.50. Each outstanding share of preferred stock of CapLease, other than shares owned by the Company, CapLease or any of their respective wholly owned subsidiaries, was converted into the right to receive an amount in cash equal to the sum of $25.00 plus all accrued and unpaid dividends on such shares of preferred stock. In addition, in connection with the merger of CapLease, LP with and into the OP (the “CapLease Partnership Merger”), each outstanding unit of equity ownership of CapLease’s operating partnership, other than units owned by CapLease or any wholly owned subsidiary of CapLease, was converted into the right to receive $8.50. Shares of CapLease’s outstanding restricted stock were accelerated and became fully vested, and restricted stock and any outstanding performance shares were fully earned and received $8.50 per share. In total, cash consideration of $920.7 million was paid to the common and preferred shareholders.
Accounting Treatment for the CapLease Merger
The CapLease Merger has been accounted for under the acquisition method of accounting under U.S. GAAP. Under the acquisition method of accounting, the assets acquired and liabilities assumed from CapLease have been recorded as of the acquisition date at their respective fair values. Any excess of purchase price over the fair values was recorded as goodwill. Results of operations for CapLease are included in the Company’s consolidated financial statements from the date of acquisition. See Note 6 — CapLease Acquisition (As Restated).
American Realty Capital Trust IV, Inc. Merger
On July 1, 2013, the Company entered into an Agreement and Plan of Merger, as amended on October 6, 2013 and October 11, 2013 (the “ARCT IV Merger Agreement”), with ARCT IV and certain subsidiaries of each company. The ARCT IV Merger Agreement provided for the merger of ARCT IV with and into a subsidiary of the OP (the “ARCT IV Merger”). The Company consummated the ARCT IV Merger on January 3, 2014.
Pursuant to the terms of the ARCT IV Merger Agreement, as amended, each outstanding share of common stock of ARCT IV, including unvested restricted shares that vested in conjunction with the ARCT IV Merger, was exchanged for (i) $9.00 in cash, (ii) 0.5190 of a share of the Company’s common stock (the “ARCT IV Exchange Ratio”) and (iii) 0.5937 of a share of a new series of preferred stock of the Company designated as the 6.70% Series F Cumulative Redeemable Preferred Stock (“Series F Preferred Stock”) and each outstanding unit of ARCT IV’s operating partnership (“ARCT IV OP Unit”), other than ARCT IV OP Units held by the American Realty Capital Trust IV Special Limited Partner, LLC, (the “ARCT IV Special Limited Partner”) and American Realty Capital Advisors IV, LLC (the “ARCT IV Advisor”) was exchanged for (i) $9.00 in cash, (ii) 0.5190 of an OP Unit and (iii) 0.5937 of an OP Unit designated as Series F Preferred Units (“Series F OP Units”). In total, the Company paid $651.4 million in cash, issued 36.9 million shares of common stock and 42.2 million shares of Series F Preferred Stock, and issued 0.7 million Series F OP Units and 0.6 million OP Units to the former ARCT IV shareholders and ARCT IV OP Unit holders in connection with the consummation of the ARCT IV Merger. In addition, each outstanding ARCT IV Class B Unit (as defined below) and each outstanding ARCT IV OP Unit held by the ARCT IV Special Limited Partner and the ARCT IV Advisor was converted into 2.3961 OP Units, resulting in the Company issuing 1.2 million OP Units.
On January 3, 2014, the OP entered into a Contribution and Exchange Agreement (the “ARCT IV Contribution and Exchange Agreement”) with the ARCT IV OP, ARCT IV Special Limited Partner and ARC Real Estate Partners, LLC (“ARC Real Estate”), an entity affiliated with the Former Manager. The ARCT IV Special Limited Partner was entitled to receive certain distributions from the ARCT IV OP, including the subordinated distribution of net sales proceeds resulting from an “investment liquidity event” (as defined in the agreement of limited partnership of the ARCT IV OP). The ARCT IV Merger constituted an “investment liquidity event,” as a result of which the ARCT IV Special Limited Partner, in connection with management’s successful attainment of the 6.0% performance hurdle and the return to ARCT IV’s stockholders of approximately $358.3 million in addition to their initial investment, was entitled to receive a subordinated distribution of net sales proceeds from the ARCT IV OP equal to approximately $63.2 million. Pursuant to the ARCT IV Contribution and Exchange Agreement, the ARCT IV Special Limited Partner contributed its interest in the ARCT IV OP, inclusive of the subordinated distribution proceeds received, to the ARCT IV OP in exchange for 2.8 million equity units of the ARCT IV OP,
F-22
Table of Contents
AMERICAN REALTY CAPITAL PROPERTIES, INC.
NOTES TO CONSOLIDATED FINANCIAL STATEMENTS – (Continued)
December 31, 2013
based on a price per share of $22.50. The fair value of these units at date of issuance was $78.2 million and has been included in merger and other non-routine transactions in the accompanying consolidated statement of operations. Upon consummation of the ARCT IV Merger, these equity units were immediately converted to 6.7 million OP Units after application of the exchange ratio of 2.3961 per share. In conjunction with the ARCT IV Merger Agreement, the ARCT IV Special Limited Partner agreed to a minimum two-year holding period for these OP Units before converting them to shares of Company common stock.
In addition, as part of the ARCT IV Contribution and Exchange Agreement, ARC Real Estate Partners, LLC, contributed $750,000 in cash to the ARCT IV OP, effective prior to the consummation of the ARCT IV Merger, in exchange for ARCT IV OP Units. Upon the consummation of the ARCT IV Merger, these equity units converted at an exchange ratio of 2.3961 OP Units per ARCT IV OP Unit, resulting in the Company issuing 0.1 million OP Units.
Accounting Treatment for the ARCT IV Merger
The Company and ARCT IV, from inception to the ARCT IV Merger date, were considered to be entities under common control. Both entities’ advisors were wholly owned subsidiaries of ARC. ARC and its related parties had ownership interests in the Company and ARCT IV through the ownership of shares of common stock and other equity interests. In addition, the advisors of both entities were contractually eligible to receive potential fees for their services to both of the companies including asset management fees, incentive fees and other fees and had continued to receive fees from the Company prior to the Company’s transition to self-management. Due to the significance of these fees, the advisors and ultimately ARC were determined to have a significant economic interest in both companies in addition to having the power to direct the activities of the companies through advisory/management agreements, which qualified them as affiliated companies under common control in accordance with U.S. GAAP. The acquisition of an entity under common control is accounted for on the carryover basis of accounting, whereby the assets and liabilities of the companies are recorded upon the merger on the same basis as they were carried by the companies on the ARCT IV Merger date. In addition, U.S. GAAP requires the Company to present historical financial information as if the entities were combined as of the earliest period of common control. Therefore, the accompanying financial statements including the notes thereto are presented as if the ARCT IV Merger, including the impact of the equity transactions entered to consummate the merger, had occurred at inception.
Fortress Portfolio Acquisition
On July 24, 2013, ARC and another related entity, on behalf of the Company and certain other entities sponsored directly or indirectly by ARC, entered into a purchase and sale agreement with affiliates of funds managed by Fortress Investment Group LLC (“Fortress”) for the purchase of 196 properties owned by Fortress, for an aggregate contract purchase price of $972.5 million, subject to adjustments set forth in the purchase and sale agreement and exclusive of closing costs, which were allocated to the Company based on the pro rata fair value of the properties acquired by the Company relative to the fair value of all 196 properties to be acquired from Fortress. Of the 196 properties, 120 properties were allocated to the Company (the “Fortress Portfolio”). On October 1, 2013, the Company closed on 41 of the 120 properties with a total purchase price of $200.3 million, exclusive of closing costs. The Company closed the acquisition of the remaining 79 properties in the Fortress Portfolio on January 8, 2014, for an aggregate contract purchase price of $400.9 million, exclusive of closing costs. The total purchase price of the Fortress Portfolio was $601.2 million, exclusive of closing costs. During the year ended December 31, 2013, the Company deposited $72.2 million into escrow in relation to the Fortress Portfolio, which has been included in prepaid expenses and other assets in the consolidated balance sheet as of December 31, 2013.
Cole Real Estate Investments, Inc. Merger
On October 22, 2013, the Company entered into an agreement and plan of merger (the “Cole Merger Agreement”) with Cole Real Estate Investments, Inc. (“Cole”), a Maryland corporation, and a wholly owned subsidiary of the Company. The Cole Merger Agreement provided for the merger of Cole with and into a wholly owned subsidiary of the Company (the “Cole Merger”). The Company consummated the Cole Merger on February 7, 2014 (the “Cole Acquisition Date”).
F-23
Table of Contents
AMERICAN REALTY CAPITAL PROPERTIES, INC.
NOTES TO CONSOLIDATED FINANCIAL STATEMENTS – (Continued)
December 31, 2013
Pursuant to the terms of the Cole Merger Agreement, each share of common stock of Cole issued and outstanding immediately prior to the effectiveness of the Cole Merger, including unvested restricted stock units (“RSUs”) and performance stock units that vested in conjunction with the Cole Merger, other than shares owned by the Company, any subsidiary of the Company or any wholly owned subsidiary of Cole, was converted into the right to receive either (i) 1.0929 shares of common stock, par value $0.01 per share, of the Company (the “Stock Consideration”) or (ii) $13.82 in cash (the “Cash Consideration” and together with the Stock Consideration, the “Merger Consideration”). Approximately 98% of all outstanding Cole holders received Stock Consideration and approximately 2% of outstanding Cole shares elected to receive Cash Consideration, pursuant to the terms of the Cole Merger Agreement, resulting in the Company issuing approximately 520.8 million shares of Company common stock and paying $181.8 million to holders of Cole shares based on their elections.
In addition, the Company issued approximately 2.8 million shares of Company common stock, in the aggregate, to certain executives of Cole pursuant to letter agreements entered into between the Company and such individuals concurrently with the execution of the Cole Merger Agreement, as previously disclosed by the Company. Additionally, effective as of the Cole Acquisition Date, the Company issued, but has not yet allocated, 0.4 million shares with dividend equivalent rights commensurate with the Company’s common stock.
The Company is in the process of gathering certain additional information in order to finalize its assessment of the fair value of the consideration transferred; thus, the fair values of currently recorded assets and liabilities are subject to change. The estimated fair value of the consideration transferred at the Cole Acquisition Date totaled approximately $7.5 billion and consisted of the following (in thousands):
| As of Cole Acquisition Date (Preliminary) (As Restated) |
||||
| Estimated fair value of consideration transferred: |
||||
| Cash |
$ | 181,775 | ||
| Common stock |
7,285,868 | |||
|
|
|
|||
| Total consideration transferred |
$ | 7,467,643 | ||
|
|
|
|||
The fair value of the 520.8 million shares of common stock issued, excluding those common shares transferred to former Cole executives, was determined based on the closing market price of the Company’s common stock on the Cole Acquisition Date.
Accounting Treatment for the Cole Merger
The Cole Merger will be accounted for under the acquisition method of accounting under U.S. GAAP. Under the acquisition method of accounting, the assets acquired and liabilities assumed from Cole will be recorded as of the acquisition date at their respective fair values. Any excess of purchase price over the fair values will be recorded as goodwill. Results of operations for Cole will be included in the Company’s consolidated financial statements subsequent to the Cole Acquisition Date. The initial accounting for the business combination has not been completed due to the significant judgments and time necessary to complete third-party valuation of real estate and other assets.
F-24
Table of Contents
AMERICAN REALTY CAPITAL PROPERTIES, INC.
NOTES TO CONSOLIDATED FINANCIAL STATEMENTS – (Continued)
December 31, 2013
Pending Significant Acquisition
Inland Portfolio Acquisition
On August 8, 2013, ARC and another related entity, on behalf of the Company and certain other entities sponsored directly or indirectly by ARC, entered into a purchase and sale agreement with Inland American Real Estate Trust, Inc. (“Inland”) for the purchase of the equity interests of 67 companies owned by Inland for an aggregate contract purchase price of approximately $2.3 billion, subject to adjustments set forth in the purchase and sale agreement and exclusive of closing costs. Of the 67 companies, the equity interests of 10 companies (the “Inland Portfolio”) will be acquired, in total, by the Company from Inland for a purchase price of approximately $501.0 million, subject to adjustments set forth in the purchase and sale agreement and exclusive of closing costs, which was allocated to the Company based on the pro rata fair value of the Inland Portfolio relative to the fair value of all 67 companies to be acquired from Inland by the Company and the other entities sponsored directly or indirectly by ARC. The Inland Portfolio is comprised of 33 properties. As of December 31, 2013, the Company has closed on five of the 33 properties for a total purchase price of $56.4 million, exclusive of closing costs. The Company closed the acquisition of 27 additional properties in the Inland Portfolio subsequent to December 31, 2013. The Company does not consider it probable that it will close on the remaining property. During the year ended December 31, 2013, the Company deposited $28.6 million into escrow in relation to the Inland Portfolio, which has been included in prepaid expenses and other assets in the consolidated balance sheets.
Note 4 — Summary of Significant Accounting Policies (As Restated)
Basis of Accounting
The accompanying consolidated financial statements are prepared on the accrual basis of accounting in accordance with U.S. GAAP.
Principles of Consolidation and Basis of Presentation
The consolidated financial statements include the accounts of the Company, its subsidiaries and consolidated joint venture arrangement . The portions of the consolidated joint venture arrangement not owned by the Company are presented as non-controlling interests. In addition, as described in Note 1 — Organization, certain affiliates and non-affiliated third parties have been issued OP Units. Holders of OP Units are considered to be non-controlling interest holders in the OP and their ownership interest is reflected as equity in the consolidated balance sheets. In addition, a portion of the earnings and losses of the OP are allocated to non-controlling interest holders based on their respective ownership percentages. Furthermore, upon conversion of OP Units to common stock, any difference between the fair value of common shares issued and the carrying value of the OP Units converted is recorded as a component of equity. As of December 31, 2013 and 2012, there were 9,591,173 and 1,621,349 OP Units outstanding, respectively. In addition, as discussed in Note 3 — Mergers and Acquisitions (As Restated), the historical information of ARCT III and ARCT IV has been presented from earliest date of common control for each merger.
All intercompany accounts and transactions have been eliminated in consolidation. In determining whether the Company has a controlling financial interest in a joint venture and the requirement to consolidate the accounts of that entity, management considers factors such as ownership interest, authority to make decisions and contractual and substantive participating rights of the other partners or members as well as whether the entity is a variable interest entity of which the Company is the primary beneficiary.
Reclassification
Certain reclassifications have been made to the previously issued historical financial statements of the Company to conform to this presentation.
F-25
Table of Contents
AMERICAN REALTY CAPITAL PROPERTIES, INC.
NOTES TO CONSOLIDATED FINANCIAL STATEMENTS – (Continued)
December 31, 2013
Use of Estimates
The preparation of financial statements in conformity with U.S. GAAP requires management to make estimates and assumptions that affect the reported amounts of assets and liabilities and disclosure of contingent assets and liabilities at the date of the financial statements and the reported amounts of revenues and expenses during the reporting period. Actual results could differ from those estimates. Management makes significant estimates regarding revenue recognition, investments in real estate, business combinations, and derivative financial instruments and hedging activities, as applicable.
Real Estate Investments
The Company records acquired real estate at cost and makes assessments as to the useful lives of depreciable assets. The Company considers the period of future benefit of the asset to determine the appropriate useful lives. Depreciation is computed using a straight-line method over the estimated useful life of 40 years for buildings, five to 15 years for building fixtures and improvements and the remaining lease term for acquired intangible lease assets.
Assets Held for Sale
The Company classifies real estate investments as held for sale when the Company has entered into a contract to sell the property, all material due diligence requirements have been satisfied, and the Company believes it is probable that the disposition will occur, or the Company is actively marketing the property and management has the intent to sell the property, among other conditions. Assets held for sale are recorded at the lower of carrying value or estimated fair value, less estimated cost to dispose of the asset. The results of operations and the related gain or loss on sale of properties that have been sold or that are classified as held for sale are included in discontinued operations in the consolidated statements of operations and comprehensive loss for all periods presented. At both December 31, 2013 and 2012, the Company had one property that was classified as held for sale. See Note 22 — Discontinued Operations and Properties Held for Sale.
If circumstances arise that the Company previously considered unlikely and, as a result, the Company decides not to sell a property previously classified as held for sale, the Company will reclassify the property as held and used. The Company measures and records a property that is reclassified as held and used at the lower of (i) its carrying amount before the property was classified as held for sale, adjusted for any depreciation expense that would have been recognized had the property been continuously classified as held and used or (ii) the estimated fair value at the date of the subsequent decision not to sell.
Development Activities
Project costs and expenses, which include interest expense, associated with the development, construction and lease-up of a real estate project are capitalized as construction in progress. Once the development and construction of the building is substantially completed, the amounts capitalized to construction in progress are transferred to (i) land and (ii) buildings and improvements. As required by U.S. GAAP, the Company computes interest expense on the full amount it has invested in the project, whether or not such investment is externally financed.
Impairment of Long Lived Assets
The Company continually monitors events and changes in circumstances that could indicate that the carrying amounts of its real estate and related assets may not be recoverable. Impairment indicators that the Company considers include, but are not limited to, bankruptcy or other credit concerns of a property’s major tenant, such as a history of late payments, rental concessions, and other factors, a significant decrease in a property’s revenues due to lease terminations, vacancies, co-tenancy clauses, reduced lease rates or other circumstances. When indicators of potential impairment are present, the Company assesses the recoverability of the assets by determining whether the carrying amount of the assets will be recovered through the undiscounted future cash flows expected from the use of the assets and their eventual disposition. In the event that such expected undiscounted future cash flows do not exceed the carrying amount, the Company will adjust the real estate and related assets to their respective fair values and recognize an impairment loss. Generally, the fair value estimates of real estate assets are primarily based upon an income approach utilizing a present value technique to discount the expected cash flows using market participant assumptions for market rent and terminal values or based upon recent comparable sales transactions.
F-26
Table of Contents
AMERICAN REALTY CAPITAL PROPERTIES, INC.
NOTES TO CONSOLIDATED FINANCIAL STATEMENTS – (Continued)
December 31, 2013
The Company recorded $3.3 million in impairment charges on real estate investments from continuing operations during the year ended December 31, 2013. The Company did not record any impairment on real estate investments from continuing operations during the years ended December 31, 2012 or 2011. The Company did not record any impairment charges on real estate investments from discontinued operations during the year ended December 31, 2013. For the years ended December 31, 2012 and 2011, the Company recorded $0.6 million and $0.8 million as impairment charges from discontinued operations.
Allocation of Purchase Price of Business Combinations including Acquired Properties
In accordance with the guidance for business combinations, the Company determines whether a transaction or other event is a business combination. If the transaction is determined to be a business combination, the Company determines if the transaction is considered to be between entities under common control. The acquisition of an entity under common control is accounted for on the carryover basis of accounting whereby the assets and liabilities of the acquired companies are recorded upon the merger on the same basis as they were carried by the acquired companies on the merger date. All other business combinations are accounted for by applying the acquisition method of accounting. Under the acquisition method, the Company recognizes the identifiable assets acquired, the liabilities assumed and any non-controlling interest in the acquired entity at fair value. In addition, the Company evaluates the existence of goodwill or a gain from a bargain purchase. The Company will immediately expense acquisition-related costs and fees associated with business combinations and asset acquisitions.
The Company allocates the purchase price of acquired properties and businesses accounted for under the acquisition method of accounting to tangible and identifiable intangible assets and liabilities acquired based on their respective fair values. Tangible assets include land, buildings, equipment and tenant improvements on an as-if vacant basis. The Company utilizes various estimates, processes and information to determine the as-if vacant property value. Estimates of value are made using customary methods, including data from appraisals, comparable sales, discounted cash flow analysis and other methods. Identifiable intangible assets and liabilities include amounts allocated to acquired leases for above-market and below-market lease rates and the value of in-place leases.
Amounts allocated to land, buildings, equipment and fixtures are based on cost segregation studies performed by independent third parties or on the Company’s analysis of comparable properties in its portfolio.
The aggregate value of intangible assets related to in-place leases is primarily the difference between the property valued with existing in-place leases adjusted to market rental rates and the property valued as if vacant. Factors considered by the Company in its analysis of the in-place lease intangibles include an estimate of carrying costs during the expected lease-up period for each property, taking into account current market conditions and costs to execute similar leases. In estimating carrying costs, the Company includes real estate taxes, insurance and other operating expenses and estimates of lost rentals at market rates during the expected lease-up period, which typically ranges from six to 18 months. The Company also estimates costs to execute similar leases including leasing commissions, legal and other related expenses.
Above-market and below-market in-place lease values for owned properties are recorded based on the present value (using an interest rate which reflects the risks associated with the leases acquired) of the difference between the contractual amounts to be paid pursuant to the in-place leases and management’s estimate of fair market lease rates for the corresponding in-place leases, measured over a period equal to the remaining non-cancelable term of the lease, including any bargain renewal periods. Above-market leases are amortized as a reduction to rental income over the remaining terms of the respective leases. Below-market leases are amortized as an increase to rental income over the remaining terms of the respective leases, including any bargain renewal periods.
The fair value of investments and debt are valued using techniques consistent with those disclosed in Note 10 — Fair Value of Financial Instruments (As Restated), depending on the nature of the investment or debt. The fair value of all other assumed assets and liabilities based on the best information available.
The value of in-place leases is amortized to expense over the initial term of the respective leases, which range primarily from two to 20 years. If a tenant terminates its lease and the unamortized portion of the in-place lease value is charged to expense.
F-27
Table of Contents
AMERICAN REALTY CAPITAL PROPERTIES, INC.
NOTES TO CONSOLIDATED FINANCIAL STATEMENTS – (Continued)
December 31, 2013
In making estimates of fair values for purposes of allocating purchase price, the Company utilizes a number of sources, including independent appraisals that may be obtained in connection with the acquisition or financing of the respective property and other market data. The Company also considers information obtained about each property as a result of its pre-acquisition due diligence, as well as subsequent marketing and leasing activities, in estimating the fair value of the tangible and intangible assets acquired and intangible liabilities assumed.
Intangible lease assets and liabilities of the Company consist of the following as of December 31, 2013 and 2012 (amounts in thousands):
| December 31, | ||||||||
| 2013 | 2012 | |||||||
| Intangible lease assets: |
||||||||
| In-place leases, gross |
$ | 749,862 | $ | 219,649 | ||||
| Accumulated amortization on in-place leases |
(60,753 | ) | (11,247 | ) | ||||
|
|
|
|
|
|||||
| In-place leases, net of accumulated amortization |
689,109 | 208,402 | ||||||
|
|
|
|
|
|||||
| Above-market leases, gross |
9,351 | 1,504 | ||||||
| Accumulated amortization on above market leases |
(658 | ) | (118 | ) | ||||
|
|
|
|
|
|||||
| Above-market leases, net of accumulated amortization |
8,693 | 1,386 | ||||||
| Leasing commissions |
382 | 347 | ||||||
| Accumulated amortization on leasing commissions |
(155 | ) | (109 | ) | ||||
|
|
|
|
|
|||||
| Leasing commissions, net of accumulated amortization |
227 | 238 | ||||||
|
|
|
|
|
|||||
| Total intangible lease assets, net |
$ | 698,029 | $ | 210,026 | ||||
|
|
|
|
|
|||||
| Intangible lease liabilities: |
||||||||
| Below-market leases, gross |
$ | 77,884 | $ | — | ||||
| Accumulated amortization on below market leases |
(715 | ) | — | |||||
|
|
|
|
|
|||||
| Below-market leases, net of accumulated amortization |
77,169 | — | ||||||
|
|
|
|
|
|||||
| Total intangible lease liabilities, net |
$ | 77,169 | $ | — | ||||
|
|
|
|
|
|||||
The following table provides the remaining weighted-average amortization period as of December 31, 2013 for intangible assets and liabilities, excluding the amortization of leasing commissions, and the projected amortization expense and adjustments to rental income for the next five years (amounts in thousands):
| Remaining Weighted-Average Amortization Period in Years |
2014 | 2015 | 2016 | 2017 | 2018 | |||||||||||||||||||
| In-place leases: |
||||||||||||||||||||||||
| Total to be included in amortization expense |
10.2 | $ | 81,139 | $ | 75,235 | $ | 69,915 | $ | 64,735 | $ | 62,560 | |||||||||||||
| Above-market lease assets: |
||||||||||||||||||||||||
| Total to be deducted from rental income |
11.9 | $ | 1,525 | $ | 1,525 | $ | 1,516 | $ | 1,388 | $ | 1,359 | |||||||||||||
| Below-market lease liabilities: |
||||||||||||||||||||||||
| Total to be included in rental income |
22.7 | $ | (4,173 | ) | $ | (4,169 | ) | $ | (4,151 | ) | $ | (4,151 | ) | $ | (4,144 | ) | ||||||||
Goodwill
In the case of a business combination, after identifying all tangible and intangible assets and liabilities, the excess consideration paid over the fair value of the assets and liabilities acquired and assumed, respectively, represents goodwill. Goodwill that arose as a result of the Company’s mergers and acquisitions was recorded in the Company’s consolidated financial statements.
In the event the Company disposes of a property that constitutes a business under U.S. GAAP from a reporting unit with goodwill, the Company will allocate a portion of the reporting unit’s goodwill to that business in determining the gain or loss on the disposal of the business. The amount of goodwill allocated to the business will be based on the relative fair value of the business to the fair value of the reporting unit. Goodwill acquired in the CapLease Merger comprises one reporting unit.
F-28
Table of Contents
AMERICAN REALTY CAPITAL PROPERTIES, INC.
NOTES TO CONSOLIDATED FINANCIAL STATEMENTS – (Continued)
December 31, 2013
The Company will evaluate goodwill for impairment annually or more frequently when an event occurs or circumstances change that indicate the carrying value, by reporting unit, may not be recoverable. The Company’s annual testing date is during the fourth quarter. The Company will test goodwill for impairment by first comparing the book value of net assets to the fair value of each reporting unit. If the fair value is determined to be less than the book value or if qualitative factors indicate that it is more likely than not that goodwill is impaired, a second step is performed to compute the amount of impairment as the difference between the estimated fair value of goodwill and the carrying value. The Company will estimate the fair value of the reporting units using discounted cash flows and relevant competitor multiples. The evaluation of goodwill for potential impairment requires the Company’s management to exercise significant judgment and to make certain assumptions. The use of different judgments and assumptions could result in different conclusions.
Cash and Cash Equivalents
Cash and cash equivalents include cash in bank accounts, as well as investments in highly-liquid money market funds with original maturities of three months or less.
The Company deposits cash with high quality financial institutions. These deposits are guaranteed by the Federal Deposit Insurance Company (“FDIC”) up to an insurance limit. At December 31, 2013 and 2012, the Company had deposits of $52.7 million and $292.6 million, respectively, of which $44.3 million and $288.9 million were in excess of the amount insured by the FDIC. Although the Company bears risk to amounts in excess of those insured by the FDIC, it does not anticipate any losses as a result due to the high quality of the institutions.
Restricted Cash
Restricted cash primarily consists of reserves related to lease expirations, as well as maintenance, structural and debt service reserves.
Investment in Direct Financing Leases
The Company has acquired certain properties that are subject to leases that qualify as direct financing leases in accordance with U.S. GAAP due to the significance of the lease payments from the inception of the leases compared to the fair value of the property. Investments in direct financing leases represent the fair value of the remaining lease payments on the leases and the estimated fair value of any expected residual property value at the end of the lease term. The fair value of the remaining lease payments is estimated using a discounted cash flow based on interest rates that would represent the Company’s incremental borrowing rate for similar types of debt. The expected residual property value at the end of the lease term is estimated using market data and assessments of the remaining useful lives of the properties at the end of the lease terms, among other factors. Income from direct financing leases is calculated using the effective interest method over the remaining term of the lease.
As part of the update to the provisional allocation of the purchase price for the GE Capital Portfolio during the measurement period, the Company reclassified approximately $9.9 million from investment in direct financing leases receivables to investments in real estate, at cost.
Loans Held for Investments
The Company classifies its loans as long-term investments, as the Company intends to hold the loans for the foreseeable future or until maturity. Loan investments are carried on the Company’s consolidated balance sheets at amortized cost (unpaid principal balance adjusted for unearned discount or premium and loan origination fees), net of any allowance for loan losses. Unearned discounts or premiums and loan origination fees are amortized as a component of interest income using the effective interest method over the life of the loan.
From time to time, the Company may determine to sell a loan in which case it must reclassify the asset as held for sale. Loans held for sale are carried at lower of cost or estimated fair value. From the period the Company acquired the loan investments through December 31, 2013, the Company has not sold or reclassified any loans as held for sale.
The Company evaluates its loan investments for possible impairment on a quarterly basis. Refer to Note 7 — Investment Securities, at Fair Value.
F-29
Table of Contents
AMERICAN REALTY CAPITAL PROPERTIES, INC.
NOTES TO CONSOLIDATED FINANCIAL STATEMENTS – (Continued)
December 31, 2013
Commercial Mortgage-Backed Securities
The Company classifies all of its commercial mortgage-backed securities (“CMBS”) as available for sale for financial accounting purposes. Under U.S. GAAP, securities classified as available for sale are carried on the consolidated balance sheet at fair value with the net unrealized gains or losses included in accumulated other comprehensive income (loss), a component of Stockholders’ Equity. Any premiums or discounts on securities are amortized as a component of interest income using the effective interest method.
The Company estimates fair value on all securities investments quarterly based on a variety of inputs. Under applicable accounting guidance, securities where the fair value is less than the Company’s cost are deemed impaired, and, therefore, must be measured for other-than-temporary impairment. If an impaired security (i.e., fair value below cost) is intended to be sold or required to be sold prior to expected recovery of the impairment loss, the full amount of the loss must be charged to earnings as other-than-temporary impairment. Otherwise, temporary impairment losses are charged to other comprehensive income (loss).
In estimating credit or other-than-temporary impairment losses, management considers a variety of factors including (1) the financial condition and near-term prospects of the credit, including credit rating of the security and the underlying tenant and an estimate of the likelihood, amount and expected timing of any default, (2) whether the Company expects to hold the investment for a period of time sufficient to allow for anticipated recovery in fair value, (3) the length of time and the extent to which the fair value has been below cost, (4) current market conditions, (5) expected cash flows from the underlying collateral and an estimate of underlying collateral values, and (6) subordination levels within the securitization pool. These estimates are highly subjective and could differ materially from actual results. From the period the Company acquired the CMBS through December 31, 2013, the Company had no other-than-temporary impairment losses.
Deferred Costs, Net
Deferred costs, net consists of deferred financing costs net of accumulated amortization, deferred leasing costs net of accumulated amortization and deferred offering costs.
Deferred financing costs represent commitment fees, legal fees and other costs associated with obtaining commitments for financing. These costs are amortized to interest expense over the terms of the respective financing agreements using the effective interest method. Unamortized deferred financing costs are expensed when the associated debt is refinanced or repaid before maturity. Costs incurred in seeking financial transactions that do not close are expensed in the period in which it is determined the financing will not close. At December 31, 2013 and 2012, the Company had $84.7 million and $15.1 million, respectively, of deferred financing costs net of accumulated amortization.
Deferred leasing costs, consisting primarily of lease commissions and payments made to assume existing leases, are deferred and amortized over the term of the lease. At December 31, 2013 and 2012, the Company had no deferred leasing costs.
Deferred offering costs represent professional fees, fees paid to various regulatory agencies, and other costs incurred in connection with registering to sell shares of the Company’s common stock. As of December 31, 2013 and 2012, the Company had no deferred offering costs.
Convertible Obligation to Series C Convertible Preferred Stockholders
On June 7, 2013, the Company issued, through a private placement, 28.4 million shares of Series C Convertible Preferred Stock (the “Series C Stock”) for gross proceeds of $445.0 million. Due to an unconditional obligation to either redeem or convert the Series C Stock into a variable number of shares of common stock that is predominantly based on a fixed monetary amount, the preferred securities were classified as an obligation under U.S. GAAP and were presented in the consolidated balance sheets as a liability prior to their settlement in November 2013. Promptly following the closing of the CapLease Merger, which, as discussed in Note 3 — Mergers and Acquisitions (As Restated), was consummated on November 5, 2013, the Company converted the Series C Stock, in accordance with the terms of the original agreement, into 1.4 million shares of common stock with the remaining balance of Series C Stock settled in cash consideration of $441.4 million.
F-30
Table of Contents
AMERICAN REALTY CAPITAL PROPERTIES, INC.
NOTES TO CONSOLIDATED FINANCIAL STATEMENTS – (Continued)
December 31, 2013
Contingent Valuation Rights
On June 7, 2013, the Company issued to certain common stock investors 29.4 million contingent value rights (“Common Stock CVRs”) and to the Series C Stock investors 28.4 million contingent value rights (“Preferred Stock CVRs”). In September 2013, certain investors holding the Common Stock CVRs received $20.4 million representing the maximum payment of $1.50 per share as defined in the agreement. The remaining Common Stock CVR holders received settlement of the amount owed to them of $23.8 million promptly following the CapLease Merger, which consummated on November 5, 2013, representing the maximum payment of $1.50 per share.
The Company elected to settle the Preferred Stock CVRs promptly following the closing of the CapLease Merger on November 5, 2013. The Company settled the Preferred Stock CVRs for $0.90 per Preferred Stock CVR for total cash consideration of $25.6 million.
Changes in the fair value of the contingent valuation rights obligation subsequent to issuance date were recorded in the consolidated statements of operations and comprehensive loss within gain/loss on derivatives, net in the period incurred. For the year ended December 31, 2013, the Company recorded a loss on the CVRs of $69.7 million, representing the settled value.
Convertible Debt
On July 29, 2013, the Company issued $300.0 million of Convertible Senior Notes due 2018 (the “2018 Notes”) and, pursuant to an over-allotment exercise by the underwriters of such 2018 Notes offering, issued an additional $10.0 million of its 2018 Notes on August 1, 2013. On December 10, 2013, the Company issued an additional $287.5 million of the 2018 Notes through a reopening of the “2018 Notes” indenture agreement. Also on December 10, 2013, the Company issued $402.5 million of Convertible Senior Notes due 2020 (the “2020 Notes”) (the 2020 Notes, collectively with the 2018 Notes, the “Convertible Notes”). The 2018 Notes mature August 1, 2018 and the 2020 Notes mature on December 15, 2020. The Convertible Notes are convertible to cash or shares of the Company’s common stock at the Company’s option. In accordance with U.S GAAP, the notes are accounted for as a liability with a separate equity component recorded for the conversion option. A liability was recorded for the Convertible Notes on the issuance date at fair value based on a discounted cash flow analysis using current market rates for debt instruments with similar terms. The difference between the initial proceeds from the Convertible Notes and the estimated fair value of the debt instruments resulted in a debt discount, with an offset recorded to additional paid-in capital representing the equity component. The debt discount is being amortized to interest expense over the expected lives of the Convertible Notes.
Derivative Instruments
The Company may use derivative financial instruments to hedge all or a portion of the interest rate risk associated with its borrowings. Certain of the techniques used to hedge exposure to interest rate fluctuations may also be used to protect against declines in the market value of assets that result from general trends in debt markets. The principal objective of such agreements is to minimize the risks and/or costs associated with the Company’s operating and financial structure as well as to hedge specific anticipated transactions.
The Company records all derivatives on the consolidated balance sheets at fair value. The accounting for changes in the fair value of derivatives depends on the intended use of the derivative, whether the Company has elected to designate a derivative in a hedging relationship and apply hedge accounting and whether the hedging relationship has satisfied the criteria necessary to apply hedge accounting. Derivatives designated and qualifying as a hedge of the exposure to changes in the fair value of an asset, liability, or firm commitment attributable to a particular risk, such as interest rate risk, are considered fair value hedges. Derivatives designated and qualifying as a hedge of the exposure to variability in expected future cash flows, or other types of forecasted transactions, are considered cash flow hedges. Derivatives may also be designated as hedges of the foreign currency exposure of a net investment in a foreign operation. Hedge accounting generally provides for the matching of the timing of gain or loss recognition on the hedging instrument with the recognition of the changes in the fair value of the hedged asset or liability that are attributable to the hedged risk in a fair value hedge or the earnings effect of the hedged forecasted transactions in a cash flow hedge. The Company may enter into derivative contracts that are intended to economically hedge certain of its risk, even though hedge accounting does not apply or the Company elects not to apply hedge accounting.
F-31
Table of Contents
AMERICAN REALTY CAPITAL PROPERTIES, INC.
NOTES TO CONSOLIDATED FINANCIAL STATEMENTS – (Continued)
December 31, 2013
The accounting for subsequent changes in the fair value of these derivatives depends on whether each has been designed and qualifies for hedge accounting treatment. If the Company elects not to apply hedge accounting treatment, any changes in the fair value of these derivative instruments is recognized immediately in gains (losses) on derivative instruments in the consolidated statements of operations and comprehensive loss. If the derivative is designated and qualifies for hedge accounting treatment the change in the estimated fair value of the derivative is recorded in other comprehensive income (loss) to the extent that it is effective. Any ineffective portion of a derivative’s change in fair value will be immediately recognized in earnings.
Share Repurchase Programs
ARCT III’s and ARCT IV’s boards of directors had adopted Share Repurchase Programs (the “ARCT III SRP” and the “ARCT IV SRP”, respectively, and collectively, the “SRPs”) that enabled stockholders to offer their shares to ARCT III and ARCT IV, respectively, for repurchase in limited circumstances. The SRPs permitted investors to sell their shares back to ARCT III or ARCT IV, as applicable, after they had held them for at least one year, subject to the significant conditions and limitations described below.
The purchase price per share of the ARCT III SRP depended on the length of time investors had held such shares as follows: after one year from the purchase date — the lower of $9.25 and 92.5% of the amount they actually paid for each share; after two years from the purchase date — the lower of $9.50 and 95.0% of the amount they actually paid for each share; after three years from the purchase date — the lower of $9.75 and 97.5% of the amount they actually paid for each share; and after four years from the purchase date — the lower of $10.00 and 100% of the amount they actually paid for each share.
The purchase price per share of the ARCT IV SRP depended on the length of time investors had held such shares as follows: after one year from the purchase date — the lower of $23.13 and 92.5% of the amount they actually paid for each share; after two years from the purchase date — the lower of $23.75 and 95.0% of the amount they actually paid for each share; after three years from the purchase date — the lower of $24.38 and 97.5% of the amount they actually paid for each share; and after four years from the purchase date — the lower of $25.00 and 100.0% of the amount they actually paid for each share.
Both ARCT III and ARCT IV were only authorized to repurchase shares pursuant to the SRPs up to the value of shares issued under their respective DRIP (as defined below) and limited the amount spent to repurchase shares in a given quarter to the value of the shares issued under the DRIP in that same quarter.
When a stockholder requested repurchases and the repurchases were approved by ARCT III’s or ARCT IV’s board of directors, as applicable, it reclassified such obligation from equity to a liability based on the settlement value of the obligation. The following table reflects the number of shares repurchased for the years ended December 31, 2013, 2012 and 2011.
| Number of Requests |
Number of Shares |
Average Price per Share |
||||||||||
| 2011 |
1 | 2,375 | $ | 10.00 | ||||||||
| 2012 |
75 | 180,744 | 10.07 | |||||||||
| 2013 |
11 | 4,956 | 24.98 | |||||||||
|
|
|
|
|
|
|
|||||||
| Cumulative repurchase requests as of December 31, 2013 |
87 | 188,075 | $ | 10.46 | ||||||||
|
|
|
|
|
|
|
|||||||
Upon the ARCT III Merger, the ARCT III SRP was terminated. Upon the ARCT IV Merger, the ARCT IV SRP was terminated.
Upon the closing of the ARCT III Merger on February 28, 2013, pursuant to the terms of the ARCT III Merger Agreement, 29.2 million shares, or 16.5% of the then outstanding shares of ARCT III’s common stock, were paid in cash at $12.00 per share, which is equivalent to 27.7 million shares of the Company’s common stock based on the ARCT III Exchange Ratio. See Note 3 —Mergers and Acquisitions.
On August 20, 2013, the Company’s board of directors reauthorized its $250 million share repurchase program which was originally authorized in February 2013. During the year ended December 31, 2013, the Company repurchased approximately 0.6 million shares at an average price of $13.07 per share or $7.5 million in total.
F-32
Table of Contents
AMERICAN REALTY CAPITAL PROPERTIES, INC.
NOTES TO CONSOLIDATED FINANCIAL STATEMENTS – (Continued)
December 31, 2013
Distribution Reinvestment Plans
Pursuant to the ARCT III distribution reinvestment plan (“ARCT III DRIP”), stockholders could have elected to reinvest distributions by purchasing shares of ARCT III common stock in lieu of receiving cash. No dealer manager fees or selling commissions were paid with respect to shares purchased pursuant to the ARCT III DRIP. Participants purchasing shares pursuant to the ARCT III DRIP had the same rights and were treated in the same manner as if such shares were issued pursuant to ARCT III’s initial public offering (the “ARCT III IPO”). Shares issued pursuant to the ARCT III DRIP were recorded within stockholders’ equity in the accompanying consolidated balance sheets in the period distributions were declared. During the years ended December 31, 2013, 2012 and 2011, ARCT III issued 0.5 million, 2.7 million and 27,169 shares of common stock, respectively, with a value of $4.9 million, $27.1 million and $0.3 million, respectively, in each case with a par value per share of $0.01, pursuant to the DRIP. Upon the closing of the ARCT III Merger, the DRIP was terminated.
Pursuant to the ARCT IV distribution reinvestment plan (“ARCT IV DRIP”), stockholders could have elected to reinvest distributions by purchasing shares of ARCT IV common stock in lieu of receiving cash. No dealer manager fees or selling commissions are paid with respect to shares purchased pursuant to the ARCT IV DRIP. Participants purchasing shares pursuant to the ARCT IV DRIP had the same rights and were treated in the same manner as if such shares were issued pursuant to ARCT IV’s initial public offering (the “ARCT IV IPO”). Shares issued pursuant to the ARCT III DRIP were recorded within stockholders’ equity in the accompanying consolidated balance sheet in the period distributions are declared. During the years ended December 31, 2013 and 2012, ARCT IV issued 0.5 million and 7,690 shares of common stock with a value of $20.7 million and $0.4 million, respectively, and a par value per share of $0.01 pursuant to the ARCT IV DRIP.
F-33
Table of Contents
AMERICAN REALTY CAPITAL PROPERTIES, INC.
NOTES TO CONSOLIDATED FINANCIAL STATEMENTS – (Continued)
December 31, 2013
Revenue Recognition
Upon the acquisition of real estate, certain properties will have leases where minimum rent payments change during the term of the lease. The Company will record rental revenue for the full term of each lease on a straight-line basis. When the Company acquires a property, the term of existing leases is considered to commence as of the acquisition date for the purposes of this calculation. Cost recoveries from tenants are included in tenant reimbursement income in the period the related costs are incurred, as applicable.
The Company’s revenues, which are derived primarily from rental income, include rents that each tenant pays in accordance with the terms of each lease reported on a straight-line basis over the initial term of the lease. Since many of the leases provide for rental increases at specified intervals, straight-line basis accounting requires the Company to record a receivable, and include in revenues, unbilled rent receivables that the Company will only receive if the tenant makes all rent payments required through the expiration of the initial term of the lease. Straight-line rent receivables are included in prepaid expenses and other assets on the consolidated balance sheets. See Note 8 — Prepaid Expenses and Other Assets (As Restated). The Company defers the revenue related to lease payments received from tenants in advance of their due dates. As of December 31, 2013 and 2012, the Company had $20.4 million and $4.4 million, respectively, of deferred rental income, which is included in deferred rent and other liabilities on the consolidated balance sheets.
The Company continually reviews receivables related to rent and unbilled rent receivables and determines collectability by taking into consideration the tenant’s payment history, the financial condition of the tenant, business conditions in the industry in which the tenant operates and economic conditions in the area in which the property is located. In the event that the collectability of a receivable is in doubt, the Company will record an increase in the allowance for uncollectible accounts or record a direct write-off of the receivable in the consolidated statements of operations and comprehensive loss. As of December 31, 2013, the Company recorded an allowance for uncollectible accounts of $187,000. As of December 31, 2012, the Company determined that no allowance for uncollectible accounts was necessary.
Contingent Rental Income
The Company owns certain properties that have associated leases that require the tenant to pay contingent rental income based on a percentage of the tenant’s sales after the achievement of certain sales thresholds, which may be monthly, quarterly or annual targets. As a lessor, the Company defers the recognition of contingent rental income until the specified target that triggered the contingent rental income is achieved, or until such sales upon which percentage rent is based are known.
Offering and Related Costs
Offering and related costs include costs incurred in connection with the Company’s issuance of common stock. These costs include, but are not limited to, (i) legal, accounting, printing, mailing and filing fees; (ii) escrow related fees and (iii) reimbursement to the dealer manager for amounts they paid to reimburse the bonified due diligence expenses of broker-dealers.
Acquisition Related Expenses and Merger and Other Non-routine Transaction Related Expenses
All direct costs incurred as a result of a business combination are classified as acquisition costs or merger and other non-routine transaction costs and expensed as incurred. In addition, indirect costs, such as internal salaries, that are tracked and documented in a manner that clearly indicate that the activities driving the cost directly relate to activities necessary to complete, or effect, a business combination are classified as acquisition related expenses. Similar costs incurred in relation to mergers with entities under common control (which are not accounted for as acquisitions) are included in the caption “merger and other non-routine transactions.” Acquisition related expenses include legal and other transaction related costs incurred in connection with self-originated acquisitions including purchases of portfolios. Other non-routine transaction costs are also presented within the line item merger and other non-routine transactions in the consolidated statements of operations and comprehensive loss.
F-34
Table of Contents
AMERICAN REALTY CAPITAL PROPERTIES, INC.
NOTES TO CONSOLIDATED FINANCIAL STATEMENTS – (Continued)
December 31, 2013
Merger and other non-routine transaction related expenses include the following costs (amounts in thousands):
| Year Ended December 31, | ||||||||||||
| 2013 (As Restated) |
2012 | 2011 | ||||||||||
| Merger related costs: |
||||||||||||
| Strategic advisory services |
$ | 62,332 | $ | — | $ | — | ||||||
| Transfer taxes |
8,931 | — | — | |||||||||
| Legal fees and expenses |
15,081 | 2,603 | — | |||||||||
| Personnel costs and other reimbursements |
3,612 | — | — | |||||||||
| Other fees and expenses |
8,450 | — | — | |||||||||
| Other non-routine costs: |
||||||||||||
| Post-transaction support services |
4,000 | — | — | |||||||||
| Subordinated distribution fee |
98,360 | — | — | |||||||||
| Furniture, fixtures and equipment |
5,800 | — | — | |||||||||
| Legal fees and expenses |
950 | — | — | |||||||||
| Personnel costs and other reimbursements |
2,546 | — | — | |||||||||
| Other fees and expenses |
481 | — | — | |||||||||
|
|
|
|
|
|
|
|||||||
| Total |
$ | 210,543 | $ | 2,603 | $ | — | ||||||
|
|
|
|
|
|
|
|||||||
Equity-based Compensation
The Company has an equity-based incentive award plan for its affiliated Manager, non-executive directors, officers, other employees and independent contractors who are providing services to the Company, as applicable, and a non-executive director restricted share plan, which are accounted for under the guidance for share-based payments. The expense for such awards is recognized over the vesting period or when the requirements for exercise of the award have been met. See Note 18 — Equity-based Compensation (As Restated) for additional information on these plans.
Per Share Data
Income (loss) per basic share of common stock is calculated by dividing net income (loss) less dividends on unvested restricted stock and dividends on preferred shares by the weighted-average number of shares of common stock issued and outstanding during such period. Diluted income (loss) per share of common stock considers the effect of potentially dilutive shares of common stock outstanding during the period. As the Company has the ability and intent to settle all outstanding convertible debt in cash, the Company has excluded the if-converted shares from its calculation of diluted shares.
Income Taxes
Each of the Company, ARCT IV and ARCT III qualified as REITs under Sections 856 through 860 of the Internal Revenue Code (the “Code”) commencing with the taxable year ended December 31, 2011. Being qualified for taxation as a REIT, each of the Company, ARCT III and ARCT IV generally will not be subject to federal corporate income tax to the extent it distributes its REIT taxable income to its stockholders, and so long as it distributes at least 90% of its REIT taxable income, computed without regard to the dividends paid deduction and excluding net capital gain. REITs are subject to a number of other organizational and operational requirements. Each of the Company, ARCT IV and ARCT III may still be subject to certain state and local taxes on its income and property, and federal income and excise taxes on its undistributed income.
As of December 31, 2013, the Company had no material uncertain income tax positions. The tax years subsequent to and including the fiscal year ended December 31, 2010 remain open to examination by the major taxing jurisdictions to which the Company is subject.
F-35
Table of Contents
AMERICAN REALTY CAPITAL PROPERTIES, INC.
NOTES TO CONSOLIDATED FINANCIAL STATEMENTS – (Continued)
December 31, 2013
Reportable Segments
The Company has determined that it has one reportable segment with activities related to investing in real estate and real estate-related assets. The Company’s investments in real estate generate rental revenue and other income through the leasing of properties, which comprised 100% of its total consolidated revenues. Although the Company’s investments in real estate will be geographically diversified throughout the United States, management evaluates operating performance on an individual property level. The Company’s properties have been aggregated into one reportable segment.
Recent Accounting Pronouncements
In December 2011, the U.S. Financial Accounting Standards Board’s (the “FASB”) issued guidance regarding disclosures about offsetting assets and liabilities, which requires entities to disclose information about offsetting and related arrangements to enable users of its financial statements to understand the effect of those arrangements on its financial position. The guidance was effective for fiscal years and interim periods beginning on or after January 1, 2013 with retrospective application for all comparative periods presented. The adoption of this guidance, which is related to disclosure only, did not have a material impact on the Company’s consolidated financial position, results of operations or cash flows. Refer to Note 15 — Derivatives and Hedging Activities for the Company’s disclosure of information about offsetting and related arrangements.
In July 2012, the FASB issued revised guidance intended to simplify how an entity tests indefinite-lived intangible assets for impairment. The amendments allow an entity to initially assess qualitative factors to determine whether it is necessary to perform a quantitative impairment test. An entity is no longer required to calculate the fair value of an indefinite-lived intangible asset and perform the quantitative test unless the entity determines, based on a qualitative assessment, that it is more likely than not that its fair value is less than its carrying amount. The amendments were effective for annual and interim indefinite-lived intangible asset impairment tests performed for fiscal years beginning after September 15, 2012. The adoption of this guidance did not have a material impact on the Company’s consolidated financial position, results of operations or cash flows.
In February 2013, the FASB issued guidance which requires an entity to provide information about the amounts reclassified out of accumulated other comprehensive income by component. The guidance was effective for annual and interim periods beginning after December 15, 2012. The adoption of this guidance, which is related to disclosure only, did not have a material impact on the Company’s consolidated financial position, results of operations or cash flows. Refer to Note 15 — Derivatives and Hedging Activities for the Company’s disclosure of the information about the amounts reclassified out of accumulated other comprehensive income by component.
In February 2013, the FASB issued new accounting guidance clarifying the accounting and disclosure requirements for obligations resulting from joint and several liability arrangements for which the total amount under the arrangement is fixed at the reporting date. The new guidance is effective for fiscal years, and interim periods within those fiscal years, beginning on or after December 15, 2013. The Company does not expect the adoption of this guidance to have a material impact on the Company’s consolidated financial position, results of operations or cash flows.
In April 2014, the FASB issued Accounting Standards Update, 2014-08 Presentation of Financial Statements (Topic 205) and Property, Plant, and Equipment (Topic 360): Reporting Discontinued Operations and Disclosures of Disposals of Components of an Entity (“ASU 2014-08”), which amends the reporting requirements for discontinued operations by updating the definition of a discontinued operation to be a component of an entity that represents a strategic shift that has (or will have) a major effect on an entity’s operations and financial results, resulting in fewer disposals that qualify for discontinued operations reporting yet the pronouncement also requires expanded disclosures for discontinued operations. The Company adopted ASU 2014-08 effective January 1, 2014. Starting with the first quarter of 2014, the results of operations for disposals and properties that were previously reported in discontinued operations but do not qualify under the new guidance will be presented within income from continuing operations on the accompanying consolidated statements of operations and comprehensive loss.
F-36
Table of Contents
AMERICAN REALTY CAPITAL PROPERTIES, INC.
NOTES TO CONSOLIDATED FINANCIAL STATEMENTS – (Continued)
December 31, 2013
Note 5 — Real Estate Investments (As Restated)
Excluding the CapLease Merger, the following table presents the allocation of the assets acquired and liabilities assumed during the periods presented (dollar amounts in thousands):
| Year Ended December 31, | ||||||||
| 2013 (1) | 2012 | |||||||
| Real estate investments, at cost: |
||||||||
| Land |
$ | 883,491 | $ | 237,282 | ||||
| Buildings, fixtures and improvements |
2,311,211 | 1,229,230 | ||||||
|
|
|
|
|
|||||
| Total tangible assets |
3,194,702 | 1,466,512 | ||||||
|
|
|
|
|
|||||
| Acquired intangible assets: |
||||||||
| In-place leases |
334,839 | 197,873 | ||||||
| Above market leases |
12,317 | 1,503 | ||||||
|
|
|
|
|
|||||
| Total assets acquired, net |
3,541,858 | 1,665,888 | ||||||
|
|
|
|
|
|||||
| Assumed intangible liabilities: |
||||||||
|
|
|
|
|
|||||
| Below market leases |
(21,446 | ) | — | |||||
|
|
|
|
|
|||||
| Total liabilities acquired, net |
(21,446 | ) | — | |||||
| OP Units issued to acquire real estate investments |
— | (6,352 | ) | |||||
|
|
|
|
|
|||||
| Cash paid for acquired real estate investments |
$ | 3,520,412 | $ | 1,659,536 | ||||
|
|
|
|
|
|||||
| Number of properties acquired |
1,739 | 573 | ||||||
|
|
|
|
|
|||||
| (1) | Excludes 50 properties comprised of $66.1 million of net investments subject to direct financing leases. |
The following table presents unaudited pro forma information as if the acquisitions, including the CapLease Merger discussed in Note 6 — CapLease Acquisition (As Restated), during the year ended December 31, 2013 had been consummated on January 1, 2012. These amounts have been calculated after applying the Company’s accounting policies and adjusting the results of acquisitions to reflect the additional depreciation and amortization and interest expense that would have been charged had the acquisitions occurred on January 1, 2012. Additionally, the unaudited pro forma net loss attributable to stockholders was adjusted to exclude acquisition related expenses of $76.1 million (as restated) and $45.1 million for the years ended December 31, 2013 and 2012, respectively, and merger and other non-routine transaction related expenses of $210.5 million (as restated) and $2.6 million for the years ended December 31, 2013 and 2012, respectively (amounts in thousands).
| Year Ended December 31, | ||||||||
| 2013 | 2012 | |||||||
| As Restated | As Restated | |||||||
| Pro forma revenues |
$ | 573,503 | $ | 467,434 | ||||
| Pro forma net loss attributable to stockholders |
$ | (91,891 | ) | $ | (15,424 | ) | ||
F-37
Table of Contents
AMERICAN REALTY CAPITAL PROPERTIES, INC.
NOTES TO CONSOLIDATED FINANCIAL STATEMENTS – (Continued)
December 31, 2013
Future Lease Payments
The following table presents future minimum base rental cash payments due to the Company over the next five years and thereafter. These amounts exclude contingent rent payments, as applicable, that may be collected from certain tenants based on provisions related to sales thresholds and increases in annual rent based on exceeding certain economic indexes among other items (amounts in thousands):
| Future Minimum Operating Lease Base Rent Payments |
Future Minimum Direct Financing Lease Payments (1) |
|||||||
| 2014 |
$ | 522,563 | $ | 5,402 | ||||
| 2015 |
512,833 | 5,028 | ||||||
| 2016 |
496,691 | 4,946 | ||||||
| 2017 |
460,070 | 4,545 | ||||||
| 2018 |
424,934 | 3,455 | ||||||
| Thereafter |
2,734,499 | 10,352 | ||||||
|
|
|
|
|
|||||
| Total |
$ | 5,151,590 | $ | 33,728 | ||||
|
|
|
|
|
|||||
| (1) | 50 properties are subject to direct financing leases and, therefore, revenue is recognized as direct financing lease income on the discounted cash flows of the lease payments. Amounts reflected are the cash rent on these respective properties. |
Net Investment in Direct Financing Leases
The components of the Company’s net investment in direct financing leases as of December 31, 2013 are as follows (amounts in thousands):
| December 31, 2013 | ||||
| Future minimum lease payments receivable |
$ | 33,729 | ||
| Unguaranteed residual value of property |
46,172 | |||
| Unearned income |
(13,789 | ) | ||
|
|
|
|||
| Net investment in direct financing leases |
$ | 66,112 | ||
|
|
|
|||
The Company had no investments in direct financing leases as of December 31, 2012.
Development Activities
Prior to the CapLease Acquisition Date (as defined below), Caplease entered into an agreement to construct a distribution warehouse in Columbia, South Carolina on a build-to-suit basis for a large private company tenant. The new build-to-suit project has an estimated total investment of $22.1 million. Construction activity and funding of the project commenced during June 2013.
Also prior to the CapLease Acquisition Date, CapLease entered into an agreement with a major Texas-based developer to develop a 150,000 square foot speculative office building in The Woodlands, Texas, adjacent to and part of the same development as an existing office building owned by CapLease and purchased in 2012. Costs of the project, which are budgeted to be $34.0 million, are scheduled to be funded by equity contributions from the Company and its developer partner, and $17.0 million of advances during the construction period under a development loan entered into with Amegy Bank. All equity contributions are scheduled to be borne as follows: the Company, 90%; and the developer, 10%; except for cost overruns, which will be borne 50% by each. Because the Company has a controlling financial interest in the investment, it consolidates the investment for financial accounting purposes. The Company has an option to purchase, and the developer the option to sell to the Company, in each case at fair market value, the developer’s interest in the project upon (i) substantial completion of the project and (ii) leases being entered into for 95% of the square footage of the project. Construction activity and funding of the project commenced during the quarter ended September 30, 2013.
F-38
Table of Contents
AMERICAN REALTY CAPITAL PROPERTIES, INC.
NOTES TO CONSOLIDATED FINANCIAL STATEMENTS – (Continued)
December 31, 2013
The table below details the Company’s investment in its pending development projects as of December 31, 2013. The information included in the table below represents management’s estimates and expectations at December 31, 2013 which are subject to change. The Company’s disclosures regarding certain projections or estimates of completion dates may not reflect actual results (dollar amounts in thousands).
| Location |
Tenant |
Property |
Approximate Square Feet |
Lease Term (years) |
Percent Owned |
Investment through 12/31/13 |
Estimated Remaining Investment |
Estimated Total Investment |
Estimated Completion Date | |||||||||||||||||||||
| Columbia, South Carolina |
Large private company |
Warehouse | 450,000 | 10.5 | (1) | 100 | % | $ | 14,745 | $ | 7,325 | $ | 22,070 | Q1 2014 | ||||||||||||||||
| The Woodlands, Texas |
N/A - speculative development |
Office building | 150,000 | N/A | 90 | % | $ | 7,257 | $ | 26,775 | $ | 34,032 | Q3 2014 | |||||||||||||||||
| (1) | The lease is in force and the 10.5 year lease term will commence upon substantial completion of the building. |
The amount of the “Investment” as of December 31, 2013 includes capitalized interest of approximately $37,000 for the Columbia, South Carolina project and approximately $45,000 for The Woodlands, Texas project. The amount of capitalized interest subsequent to the CapLease Acquisition Date through December 31, 2013 was not significant.
Tenant Concentration
The following table lists the tenants of the Company whose annualized rental income on a straight-line basis represented greater than 10% of consolidated annualized rental income on a straight-line basis as of December 31, 2013. Annualized rental income for net leases is rental income on a straight-line basis as of the period reported, which includes the effect of tenant concessions such as free rent, as applicable. There were no tenants exceeding 10% of consolidated annualized rental income on a straight-line basis at December 31, 2013.
| Year Ended December 31, | ||||||||
| 2013 | 2012 | |||||||
| Citizens Bank |
* | 13.8 | % | |||||
| Dollar General |
* | 12.3 | % | |||||
| FedEx |
* | 10.2 | % | |||||
| * | The tenants’ annualized rental income was not greater than 10% of total consolidated annualized rental income for all portfolio properties as of the period specified. |
No other tenant represents more than 10% of total consolidated annualized rental income on a straight-line basis for the periods presented.
Geographic Concentration
The following table lists the states where the Company has concentrations of properties where annual rental income on a straight-line basis represented greater than 10% of consolidated annualized rental income on a straight-line basis as of December 31, 2013 and 2012:
| Year Ended December 31, | ||||||||
| 2013 | 2012 | |||||||
| Texas |
10.7 | % | * | |||||
| Illinois |
* | 11.2 | % | |||||
| * | The geographical concentration’s annualized rental income was not greater than 10% of total consolidated annualized rental income for all portfolio properties as of the period specified. |
F-39
Table of Contents
AMERICAN REALTY CAPITAL PROPERTIES, INC.
NOTES TO CONSOLIDATED FINANCIAL STATEMENTS – (Continued)
December 31, 2013
Note 6 — CapLease Acquisition (As Restated)
On November 5, 2013 (the “CapLease Acquisition Date”), the Company completed its acquisition of CapLease, a real estate investment trust that primarily owned and managed a diversified portfolio of single tenant commercial real estate properties subject to long-term leases, the majority of which were net leases, to high credit quality tenants, by acquiring 100% of the outstanding common shares and voting interests of CapLease. The acquisition was accounted for using the acquisition method of accounting in accordance with ASC 805, Business Combinations. The Company’s consolidated financial statements include the results of operations of CapLease subsequent to the CapLease Acquisition Date.
The purchase price includes a cash payment of $920.7 million, which was funded by the Company through additional borrowings under its revolving credit facility and the credit facility assumed from CapLease, see Note 12 — Other Debt and Note 13 — Credit Facilities.
The purchase price allocation for the CapLease Merger is considered preliminary, and additional adjustments may be recorded during the measurement period in accordance with U.S. GAAP. The purchase price allocation will be finalized as the Company receives additional information relevant to the acquisition, including a final valuation of the assets purchased and liabilities assumed.
F-40
Table of Contents
AMERICAN REALTY CAPITAL PROPERTIES, INC.
NOTES TO CONSOLIDATED FINANCIAL STATEMENTS – (Continued)
December 31, 2013
The preliminary purchase price for the acquisition was allocated to assets acquired and liabilities assumed based on their estimated fair value and reflects the goodwill adjustment discussed in Note 2 — Restatement of Previously Issued Financial Statements. The following table presents the allocation of the purchase price to the estimated fair value of the assets acquired and liabilities assumed at the CapLease Acquisition Date (in thousands):
| As of CapLease Acquisition Date (As Restated) |
||||
| Fair value of consideration given |
$ | 920,697 | ||
|
|
|
|||
| Assets purchased, at fair value: |
||||
| Land |
$ | 235,843 | ||
| Buildings, fixtures and improvements |
1,596,481 | |||
| Land and construction in process |
12,352 | |||
| Acquired intangible lease assets |
191,964 | |||
|
|
|
|||
| Total real estate investments |
2,036,640 | |||
|
|
|
|||
| Cash and cash equivalents |
41,799 | |||
| Investment securities |
60,730 | |||
| Loans held for investment |
26,457 | |||
| Restricted cash |
29,119 | |||
| Prepaid expenses and other assets |
21,249 | |||
| Deferred costs |
325 | |||
|
|
|
|||
| Total identifiable assets purchased |
2,216,319 | |||
|
|
|
|||
| Liabilities assumed, at fair value: |
||||
| Mortgage notes payable |
1,037,510 | |||
| Secured credit facility |
121,000 | |||
| Other debt |
114,208 | |||
| Below-market leases |
57,058 | |||
| Derivative liabilities |
158 | |||
| Accounts payable and accrued expenses |
49,291 | |||
| Deferred rent and other liabilities |
8,619 | |||
|
|
|
|||
| Total liabilities assumed |
1,387,844 | |||
|
|
|
|||
|
|
|
|||
| Non-controlling interest retained by third party |
567 | |||
|
|
|
|||
|
|
|
|||
| Net identifiable assets acquired by Company |
827,908 | |||
|
|
|
|||
| Goodwill |
$ | 92,789 | ||
|
|
|
|||
Management is in the process of further evaluating the purchase price accounting. The fair value of real estate investments and below-market leases have been estimated by the Company with the assistance of third-party valuation firms. Based on analyses received to date, the estimated fair value of these assets and liabilities total $2.0 billion and $57.1 million, respectively. The recorded values represent the estimated fair values related to such assets and liabilities. Upon completion of the analyses, including a review of the appraisals and assessment of current market rates, changes to the estimated fair values may result.
The fair value of the non-controlling interest has been estimated based on the fair value of the percentage ownership of The Woodlands, Texas development activity not held by the Company. Refer to Note 5 — Real Estate Investments (As Restated).
The fair value of the remaining CapLease assets and liabilities have been calculated in accordance with the Company’s policy on purchase price allocation, as disclosed in Note 4 — Summary of Significant Accounting Policies (As Restated).
F-41
Table of Contents
AMERICAN REALTY CAPITAL PROPERTIES, INC.
NOTES TO CONSOLIDATED FINANCIAL STATEMENTS – (Continued)
December 31, 2013
The $92.8 million of goodwill is expected to be assigned to the real estate segment upon completion of the external valuation. The goodwill recognized is attributed to the enhancement of the Company’s year-round rental revenue stream, expected synergies, and the assembled work force at CapLease.
The amounts of revenue and net loss of CapLease included in the Company’s consolidated statements of operations and comprehensive loss from the CapLease Acquisition Date to the period ended December 31, 2013 was $29.5 million and $6.3 million, respectively.
The pro forma consolidated statement of operation as if CapLease had been included in the consolidated results of the Company for the entire years ended December 31, 2013 and 2012 have been reflected in Note 5 — Real Estate Investments (As Restated).
Note 7 — Investment Securities, at Fair Value
Investment securities are considered available-for-sale and, therefore, increases or decreases in the fair value of these investments are recorded in accumulated other comprehensive income (loss) as a component of equity on the consolidated balance sheets unless the securities are considered to be other than temporarily impaired at which time the losses are reclassified to expense.
The following table details the unrealized gains and losses on investment securities as of December 31, 2013 and 2012 (amounts in thousands):
| As of December 31, 2013 | Cost | Gross Unrealized Gains |
Gross Unrealized Losses |
Fair Value | ||||||||||||
| Investments in real estate fund |
$ | 1,589 | $ | — | $ | (105 | ) | $ | 1,484 | |||||||
| CMBS |
60,452 | 498 | (367 | ) | 60,583 | |||||||||||
|
|
|
|
|
|
|
|
|
|||||||||
| $ | 62,041 | $ | 498 | $ | (472 | ) | $ | 62,067 | ||||||||
|
|
|
|
|
|
|
|
|
|||||||||
| As of December 31, 2012 | ||||||||||||||||
| Preferred securities |
$ | 41,747 | $ | 223 | $ | (316 | ) | $ | 41,654 | |||||||
|
|
|
|
|
|
|
|
|
|||||||||
Investment in Real Estate Fund
On June 4, 2013, the Company invested $10.0 million in a real estate fund that is sponsored by an affiliate of the Former Manager and which invests primarily in equity securities of other publicly traded REITs. During the year-ended December 31, 2013, the Company reinvested distributions totaling $0.1 million into the real estate fund. During the fourth quarter of 2013, the Company sold investments with an original cost of $8.5 million for total proceeds of $8.1 million. The realized loss of $0.4 million has been recorded to losses on investments in affiliates within the consolidated statements of operations and comprehensive loss. Refer to Note 19 — Related Party Transactions and Arrangements (As Restated).
Commercial Mortgage-Backed Securities (“CMBS”)
In connection with the CapLease Merger, the Company acquired 10 commercial mortgage-backed securities, with a fair value of $60.7 million. At December 31, 2013, the commercial mortgage-backed securities had a carrying value of $60.6 million and carried interest rates ranging from 5.88% to 8.95%. The Company had no commercial mortgage-backed securities as of December 31, 2012.
As of December 31, 2013, the fair value of four commercial mortgage-backed securities was below its carrying value. The Company evaluated each of its securities for other-than-temporary impairment at December 31, 2013, and determined that no other-than-temporary impairment charges on its securities were appropriate. The Company believes that none of the unrealized losses on investment securities are other-than-temporary because management expects the Company will receive all contractual principal and interest related to these investments. In addition, the Company did not have the intent to sell the securities or believe it would be required to sell them as of December 31, 2013.
F-42
Table of Contents
AMERICAN REALTY CAPITAL PROPERTIES, INC.
NOTES TO CONSOLIDATED FINANCIAL STATEMENTS – (Continued)
December 31, 2013
Redeemable Preferred Stock, Senior Notes and Common Stock
At December 31, 2012, the Company had investments in redeemable preferred stock, accounted for as debt securities, with a fair value of $41.7 million. These investment securities were sold during the year ended December 31, 2013, resulting in a gain on sale of investments of $0.5 million.
During 2013, the Company acquired additional investments in redeemable preferred stock, as well as investments in senior notes and common stock, with an aggregate cost basis of $69.5 million. The Company sold all of these investment securities during 2013 for $67.2 million, resulting in a loss on sale of $2.3 million. As of December 31, 2013, the Company had no remaining investments in redeemable preferred stock, senior notes or common stock.
Note 8 — Prepaid Expenses and Other Assets (As Restated)
Prepaid expenses and other assets consisted of the following as of December 31, 2013 and 2012 (amounts in thousands):
| Year Ended December 31, | ||||||||
| 2013 (As Restated) |
2012 | |||||||
| Restricted escrow deposits |
$ | 101,813 | $ | 138 | ||||
| Accounts receivable (1) |
16,254 | 7,174 | ||||||
| Straight line rent receivable |
19,010 | 3,738 | ||||||
| Prepaid expenses |
43,801 | 905 | ||||||
| Other assets |
5,848 | 29 | ||||||
|
|
|
|
|
|||||
| $ | 186,726 | $ | 11,984 | |||||
|
|
|
|
|
|||||
| (1) | Allowance for doubtful accounts was $187,000 as of December 31, 2013. There was no allowance for doubtful accounts as of December 31, 2012. |
Note 9 — Loans Held for Investment
In connection with the CapLease Merger, the Company acquired 12 loans held for investment, which consist predominantly of mortgage loans on properties subject to leases to investment grade tenants, with a fair value of $26.5 million at the CapLease Merger Date. At December 31, 2013, the loans held for investment had a carrying value of $26.3 million and carried interest rates ranging from 5.28% to 7.24%. The fair value adjustment is being amortized to interest expense in the consolidated statements of operations and comprehensive loss over the life of the Secured Term. The Company had no loans held for investment as of December 31, 2012.
The Company’s loan portfolio is comprised primarily of fully amortizing or nearly fully amortizing first mortgage loans on commercial real estate leased to a single tenant. Payments of debt service on the Company’s loans is, in substantially all cases, funded directly by rent payments paid into a lockbox account by the underlying tenant. Therefore, the Company’s monitoring of the credit quality of its loans held for investment is focused primarily on an analysis of the tenant, including review of tenant credit ratings (including changes in ratings) and other measures of tenant credit quality, trends in the tenant’s industry and general economic conditions, and an analysis of measures of collateral coverage, such as an estimate of the loan’s loan-to-value (“LTV”) ratio (principal amount outstanding divided by estimated value of the property) and its remaining term until maturity. As of December 31, 2013, the Company did not record a reserve for loan loss.
Note 10 — Fair Value of Financial Instruments (As Restated)
The Company determines fair value based on quoted prices when available or through the use of alternative approaches, such as discounting the expected cash flows using market interest rates commensurate with the credit quality and duration of the investment. The guidance defines three levels of inputs that may be used to measure fair value:
Level 1 — Quoted prices in active markets for identical assets and liabilities that the reporting entity has the ability to access at the measurement date.
F-43
Table of Contents
AMERICAN REALTY CAPITAL PROPERTIES, INC.
NOTES TO CONSOLIDATED FINANCIAL STATEMENTS – (Continued)
December 31, 2013
Level 2 — Inputs other than quoted prices included within Level 1 that are observable for the asset and liability or can be corroborated with observable market data for substantially the entire contractual term of the asset or liability.
Level 3 — Unobservable inputs that reflect the entity’s own assumptions about the assumptions that market participants would use in the pricing of the asset or liability and are consequently not based on market activity, but rather through particular valuation techniques.
The determination of where an asset or liability falls in the hierarchy requires significant judgment and considers factors specific to the asset or liability. In instances where the determination of the fair value measurement is based on inputs from different levels of the fair value hierarchy, the level in the fair value hierarchy within which the entire fair value measurement falls is based on the lowest level input that is significant to the fair value measurement in its entirety. The Company evaluates its hierarchy disclosures each quarter and, depending on various factors, it is possible that an asset or liability may be classified differently from quarter to quarter. However, the Company expects that changes in classifications between levels will be rare.
Although the Company has determined that the majority of the inputs used to value its derivatives fall within Level 2 of the fair value hierarchy, the credit valuation adjustments associated with those derivatives utilize Level 3 inputs, such as estimates of current credit spreads to evaluate the likelihood of default by the Company and its counterparties. However, as of December 31, 2013, the Company has assessed the significance of the impact of the credit valuation adjustments on the overall valuation of its derivative positions and has determined that the credit valuation adjustments are not significant to the overall valuation of the Company’s derivatives. As a result, the Company has determined that its derivative valuations in their entirety are classified in Level 2 of the fair value hierarchy. As of December 31, 2013, the Company’s interest rate cap derivative measured at fair value on a recurring basis was zero and was classified in Level 2 of the fair value hierarchy.
In addition, during the year ended December 31, 2013, real estate assets with a carrying amounts of $4.5 million related to two properties were deemed to be impaired and their carrying amount was reduced to their estimated fair value, resulting in an impairment charge of $3.3 million, which is included in impairment of real estate on the consolidated statements of operations and comprehensive loss for the year ended December 31, 2013. The Company’s estimated fair values of its real estate assets were primarily based upon an income approach utilizing a present value technique to discount the expected cash flows using market participant assumptions for market rent and terminal values, which are considered to be Level 3 inputs, or based upon recent comparable sales transaction, which are considered to be Level 2 inputs. The aggregate fair value as of December 31, 2013 was $1.2 million. No impairments were noted during the year ended December 31, 2012.
The following table presents information about the Company’s assets and liabilities (including derivatives that are presented net) measured at fair value on a recurring basis as of December 31, 2013 and 2012, aggregated by the level in the fair value hierarchy within which those instruments fall (amounts in thousands):
| Quoted Prices in Active Markets Level 1 |
Significant Other Observable Inputs Level 2 |
Significant Unobservable Inputs Level 3 |
Total | |||||||||||||
| December 31, 2013 |
||||||||||||||||
| Investments in real estate fund |
$ | — | $ | 1,484 | $ | — | $ | 1,484 | ||||||||
| CMBS |
— | — | 60,583 | 60,583 | ||||||||||||
| Interest rate swap assets |
— | 9,189 | — | 9,189 | ||||||||||||
| Interest rate swap liabilities |
— | (1,719 | ) | — | (1,719 | ) | ||||||||||
| Series D Preferred Stock embedded derivative |
— | — | (16,736 | ) | (16,736 | ) | ||||||||||
|
|
|
|
|
|
|
|
|
|||||||||
| Total |
$ | — | $ | 8,954 | $ | 43,847 | $ | 52,801 | ||||||||
|
|
|
|
|
|
|
|
|
|||||||||
| December 31, 2012 |
||||||||||||||||
| Investment securities |
$ | 41,654 | $ | — | $ | — | $ | 41,654 | ||||||||
| Interest rate swaps |
— | (3,830 | ) | — | (3,830 | ) | ||||||||||
|
|
|
|
|
|
|
|
|
|||||||||
| Total |
$ | 41,654 | $ | (3,830 | ) | $ | — | $ | 37,824 | |||||||
|
|
|
|
|
|
|
|
|
|||||||||
Investment in real estate fund — The fair value of the Company’s investment in real estate fund is based on published pricing.
F-44
Table of Contents
AMERICAN REALTY CAPITAL PROPERTIES, INC.
NOTES TO CONSOLIDATED FINANCIAL STATEMENTS – (Continued)
December 31, 2013
Commercial mortgage-backed securities — The fair values of the Company’s CMBS are valued using broker quotations, collateral values, subordination levels, and liquidity of the individual securities.
Derivatives — The valuation of derivative instruments is determined using a discounted cash flow analysis on the expected cash flows of each derivative. This analysis reflects the contractual terms of the derivatives, including the period to maturity, as well as observable market-based inputs, including interest rate curves and implied volatilities. In addition, credit valuation adjustments are incorporated into the fair values to account for the Company’s potential nonperformance risk and the performance risk of the counterparties.
Series D Preferred Stock embedded derivative — The valuation of this derivative instrument is determined using a binomial option pricing model. Key inputs in the model include the expected term, risk-free interest rate, volatility, and dividend yield.
The fair value of short-term financial instruments such as cash and cash equivalents, restricted cash, due to affiliates and accounts payable approximate their carrying value on the accompanying consolidated balance sheets due to their short-term nature and are classified as Level 1 under the fair value hierarchy.
A review of the fair value hierarchy classification is conducted on a quarterly basis. Changes in the type of inputs may result in a reclassification for certain assets. There were no transfers between Level 1 and Level 2 or Level 3 of the fair value hierarchy during the year ended December 31, 2013.
The following is a reconciliation of the beginning and ending balance for the changes in instruments with Level 3 inputs in the fair value hierarchy for the year ended December 31, 2013 (amounts in thousands):
| CMBS | Series D Preferred Stock Embedded Derivative |
Total | ||||||||||
| Beginning balance |
$ | — | $ | — | $ | — | ||||||
| Fair value at purchase/issuance |
60,730 | (18,692 | ) | 42,038 | ||||||||
| Sales of CMBS |
(278 | ) | — | (278 | ) | |||||||
| Fair value adjustment (1) |
131 | 1,956 | 2,087 | |||||||||
|
|
|
|
|
|
|
|||||||
| Ending balance |
$ | 60,583 | $ | (16,736 | ) | $ | 43,847 | |||||
|
|
|
|
|
|
|
|||||||
| (1) | The change in fair value in the CMBS and Series D Preferred Stock embedded derivative is recorded in unrealized gain (loss) on investment securities, net and loss on derivative instruments, net, respectively, on the consolidated statement of operations and comprehensive loss. |
F-45
Table of Contents
AMERICAN REALTY CAPITAL PROPERTIES, INC.
NOTES TO CONSOLIDATED FINANCIAL STATEMENTS – (Continued)
December 31, 2013
The fair values of the Company’s financial instruments that are not reported at fair value on the consolidated balance sheets are reported below (amounts in thousands):
| Level | Carrying Amount at December 31, 2013 |
Fair Value at December 31, 2013 |
Carrying Amount at December 31, 2012 |
Fair Value at December 31, 2012 |
||||||||||||||||
| Assets: |
||||||||||||||||||||
| Loans held for investment |
3 | $ | 26,279 | $ | 26,435 | $ | — | $ | — | |||||||||||
|
|
|
|
|
|
|
|
|
|||||||||||||
| Liabilities: |
||||||||||||||||||||
| Convertible debt |
3 | $ | 972,490 | $ | 976,629 | $ | — | $ | — | |||||||||||
| Mortgage notes payable |
3 | 1,301,114 | 1,305,823 | 265,118 | 271,056 | |||||||||||||||
| Senior secured revolving credit facility |
3 | — | — | 124,604 | 124,604 | |||||||||||||||
| Senior corporate credit facilities |
3 | 1,819,800 | 1,819,800 | — | — | |||||||||||||||
| Secured credit facility |
3 | 150,000 | 150,000 | — | — | |||||||||||||||
| Trust preferred notes |
3 | 26,548 | 23,345 | — | — | |||||||||||||||
| Secured term loan |
3 | 58,979 | 59,049 | — | — | |||||||||||||||
| Other debt |
3 | 19,277 | 19,350 | — | — | |||||||||||||||
|
|
|
|
|
|
|
|
|
|||||||||||||
| Total liabilities |
$ | 4,348,208 | $ | 4,353,996 | $ | 389,722 | $ | 395,660 | ||||||||||||
|
|
|
|
|
|
|
|
|
|||||||||||||
Loans held for investment — The fair value of the Company’s fixed-rate loan portfolio is estimated with a discounted cash flow analysis, utilizing scheduled cash flows and discount rates estimated by management to approximate those that a willing buyer and seller might use.
Credit facilities — Management believes that the stated interest rates (which float based on short-term interest rates) approximates market rates. As such, the fair values of these obligations is estimated to be equal to the outstanding principal amounts.
Convertible debt, mortgage notes payable and secured term loan — The fair value of mortgages payable on real estate investments and the secured term loan is estimated using a discounted cash flow analysis, based on management’s estimates of market interest rates. For mortgages where the Company has an early prepayment right, management also considers the prepayment amount to evaluate the fair value.
Trust preferred notes — The fair value of the Company’s other long-term debt is estimated using a discounted cash flow analysis, based on management’s estimates of market interest rates.
Note 11 — Mortgage Notes Payable
The Company’s mortgage notes payable consist of the following as of December 31, 2013 and 2012 (dollar amounts in thousands):
| Encumbered Properties | Outstanding Loan Amount |
Weighted-Average Effective Interest Rate (1) |
Weighted-Average Maturity (2) |
|||||||||||||
| December 31, 2013 |
177 | $ | 1,258,661 | 3.42 | % | 3.41 | ||||||||||
| December 31, 2012 |
164 | $ | 265,118 | 4.28 | % | 5.51 | ||||||||||
| (1) | Mortgage notes payable have fixed rates or are fixed by way of interest rate swap arrangements. Effective interest rates range from 1.83% to 6.28% at December 31, 2013 and 3.32% to 6.13% at December 31, 2012. |
| (2) | Weighted-average remaining years until maturity as of December 31, 2013 and 2012, respectively. |
F-46
Table of Contents
AMERICAN REALTY CAPITAL PROPERTIES, INC.
NOTES TO CONSOLIDATED FINANCIAL STATEMENTS – (Continued)
December 31, 2013
In conjunction with the CapLease Merger, aggregate net premiums totaling $45.2 million were recorded upon assumption of the mortgages for above-market interest rates. Amortization of these net premiums is recorded as a reduction to interest expense over the remaining term of the respective mortgages using a method that approximates the effective-interest method. As of December 31, 2013, there was $42.5 million in unamortized net premiums included in mortgage notes payable, net on the consolidated balance sheets.
The following table summarizes the scheduled aggregate principal repayments subsequent to December 31, 2013 (amounts in thousands):
| Principal Repayment | ||||
| 2014 |
$ | 86,933 | ||
| 2015 |
381,574 | |||
| 2016 |
295,627 | |||
| 2017 |
257,658 | |||
| 2018 |
36,210 | |||
| Thereafter |
200,659 | |||
|
|
|
|||
| $ | 1,258,661 | |||
|
|
|
|||
The Company’s mortgage loan agreements generally require restrictions on corporate guarantees and the maintenance of financial covenants including maintenance of certain financial ratios (such as specified debt to equity and debt service coverage ratios). As of December 31, 2013, the Company was in compliance with the debt covenants under the mortgage loan agreements.
Note 12 — Other Debt
Convertible Obligation to Series C Convertible Preferred Stockholders
On June 7, 2013, the Company issued 28.4 million shares of Series C Stock through a private placement for gross proceeds of $445.0 million. Due to an unconditional obligation to either redeem or convert the Series C Stock into a variable number of shares of common stock that is predominantly based on a fixed monetary amount, the preferred securities were classified as an obligation under U.S. GAAP and were presented in the consolidated balance sheets as a liability prior to their conversion on November 12, 2013. On November 12, 2013, the Company converted all outstanding Series C Stock into common shares of the Company. Pursuant to the Series C Articles Supplementary, the number of common shares that could be issued upon conversion of Series C Stock was limited by the exchange cap. Therefore, the Company converted 1.1 million shares of Series C Stock into 1.4 million common shares of the Company. With respect to the 27.3 million shares of Series C Stock for which Common Shares could not be issued upon conversion due to the exchange cap, the Company paid holders of Series C Stock an aggregate cash amount equal to approximately $441.4 million in exchange for such Series C Stock. Based on the Company’s share price on the conversion date, the total settlement value was $458.8 million. Settlement of the Series C Stock resulted in a loss of $13.8 million, which is recorded as interest expense in the consolidated statements of operations and comprehensive loss.
F-47
Table of Contents
AMERICAN REALTY CAPITAL PROPERTIES, INC.
NOTES TO CONSOLIDATED FINANCIAL STATEMENTS – (Continued)
December 31, 2013
Convertible Senior Note Offering
On July 29, 2013, the Company issued $300.0 million of the 2018 Notes and, pursuant to an over-allotment exercise by the underwriters of such 2018 Notes offering, issued an additional $10.0 million of its 2018 Notes on August 1, 2013 (collectively, the “Original 2018 Notes”). On December 10, 2013, the Company issued an additional $287.5 million through a reopening of the 2018 Notes indenture agreement (the “Reopened 2018 Notes,” together with the Original 2018 Notes, the “2018 Notes”). The 2018 Notes mature on August 1, 2018. The fair value of the Original 2018 Notes and Reopened 2018 Notes was determined at issuance to be $299.6 million and $282.1 million, respectively, resulting in a debt discount of $10.4 million and $5.4 million, respectively, with an offset recorded to additional paid-in capital representing the equity component of the notes for the conversion options. The discount is being amortized to interest expense over the expected lives of the 2018 Notes. As of December 31, 2013, the carrying value of the Original 2018 Notes and Reopened 2018 Notes was $300.5 million and $282.1 million, respectively. The holders may elect to convert the 2018 Notes into cash, common stock of the Company or a combination thereof, at the Company’s option, in limited circumstances prior to February 1, 2018 and may convert the 2018 Notes at any time into such consideration on or after February 1, 2018. The initial conversion rate is 59.805 shares of the Company’s common stock per $1,000 principal amount of 2018 Notes.
On December 10, 2013, the Company issued $402.5 million of the 2020 Notes. The 2020 Notes mature on December 15, 2020. The fair value of the 2020 Notes was determined at issuance to be $389.7 million, resulting in a debt discount of $12.8 million with an offset recorded to additional paid-in capital representing the equity component of the notes for the conversion options. The discount is being amortized to interest expense over the expected life of the 2020 Notes. As of December 31, 2013, the carrying value of the 2020 Notes was $389.7 million. The holders may elect to convert the 2020 Notes into cash, common stock of the Company or a combination thereof, at the Company’s option, in limited circumstances prior to June 15, 2020 and may convert the 2020 Notes at any time into such consideration on or after June 15, 2020. The initial conversion rate is 66.0262 shares of ARCP’s common stock per $1,000 principal amount of 2020 Notes.
In connection with the 2018 Notes and 2020 Notes, the remaining unamortized discount totaled $27.5 million.
See Note 24 – Subsequent Events (As Restated) for further discussion.
Trust Preferred Notes
As part of the CapLease Merger, the Company assumed $30.9 million in aggregate principal amount of fixed/floating rate preferred notes with a fair value of $26.5 million at the CapLease Merger Date. The trust preferred securities represent an unsecured subordinated recourse debt obligation of the Company and require quarterly interest payments calculated at a fixed interest rate equal to 7.68% per annum through January 30, 2016, and subsequently at a variable interest rate equal to LIBOR plus 2.60% per annum. The notes must be redeemed on January 30, 2036, and may be redeemed, in whole or in part, at par, at the Company’s option, at any time. The discount recorded on the notes is being amortized to interest expense on the consolidated statements of operations and comprehensive loss over the life of the preferred notes. As of December 31, 2013, the carrying value of the preferred securities was $26.5 million.
Secured Term Loan
As part of the CapLease Merger, the Company assumed a secured term loan with KBC Bank, N.V. with a principal balance of $59.8 million and a fair value of $60.7 million at the CapLease Merger Date. The interest coupon on the loan is fixed at 5.81% annually until the loan matures in January 2018. The loan is non-recourse to the Company, subject to limited non-recourse exceptions. During the period between the CapLease Acquisition Date and December 31, 2013, the Company made principal payments of $1.7 million. The premium is being amortized to interest expense on the consolidated statements of operations and comprehensive loss over the life of the secured term loan. As of December 31, 2013, the carrying value of the secured term loan was $59.0 million.
F-48
Table of Contents
AMERICAN REALTY CAPITAL PROPERTIES, INC.
NOTES TO CONSOLIDATED FINANCIAL STATEMENTS – (Continued)
December 31, 2013
Amounts related to the secured term loan as of December 31, 2013 were as follows (amounts in thousands):
| Borrowings | Collateral Carrying Value |
|||||||
| Loans held for investment |
$ | 14,065 | $ | 22,496 | ||||
| Intercompany mortgage loans on CapLease properties |
9,195 | 21,114 | ||||||
| Commercial mortgage-backed securities |
34,915 | 46,054 | ||||||
|
|
|
|
|
|||||
| $ | 58,175 | $ | 89,664 | |||||
|
|
|
|
|
|||||
Other Debt
As part of the CapLease Merger, the Company assumed $19.2 million of senior notes (the “Senior Notes”) that bear interest at an annual interest rate of 7.50%, payable semi-annually on April 1 and October 1, with a fair value of $19.3 million at the CapLease Merger Date. The Senior Notes mature on October 1, 2027. The Company has the right to redeem the Senior Notes in whole or in part for cash at any time or from time to time at a redemption price equal to 100% of the principal amount of the Senior Notes to be redeemed, plus any accrued and unpaid interest. Holders of the Senior Notes may require the Company to repurchase their Senior Notes, in whole or in part, on October 1, 2017 and October 1, 2022, for a cash price equal to 100% of the principal amount of the Senior Notes to be repurchased, plus any accrued and unpaid interest. The discount is being amortized to interest expense on the consolidated statements of operations and comprehensive loss over the life of the Senior Notes. As of December 31, 2013, the carrying value of the Senior Notes was $19.3 million.
In conjunction with the CapLease Merger, aggregate net discounts totaling $3.5 million were recorded upon assumption of the trust preferred notes, secured term loan and senior notes. As of December 31, 2013, unamortized net discounts were $3.5 million in unamortized net discounts included in other debt on the consolidated balance sheets.
Future Minimum Repayments
The following table summarizes the scheduled aggregate principal repayments of our convertible debt, trust preferred notes, secured term loan and other debt subsequent to December 31, 2013 (amounts in thousands):
| Principal Repayment | ||||
| 2014 |
$ | 12,851 | ||
| 2015 |
11,862 | |||
| 2016 |
12,516 | |||
| 2017 |
26,890 | |||
| 2018 |
610,767 | |||
| Thereafter |
433,430 | |||
|
|
|
|||
| $ | 1,108,316 | |||
|
|
|
|||
F-49
Table of Contents
AMERICAN REALTY CAPITAL PROPERTIES, INC.
NOTES TO CONSOLIDATED FINANCIAL STATEMENTS – (Continued)
December 31, 2013
Barclay’s Facility
As of December 31, 2013, the Company had available commitments from Barclays Bank PLC, and other committed parties, for up to $2.1 billion in senior secured term loans (the “Barclays Facility”) in order to fund cash amounts payable in connection with the Cole Merger, which were subject to certain conditions, including the absence of a material adverse effect in respect of Cole, the negotiation of definitive documentation and pro forma compliance with financial covenants. Any other long-term debt obtained by the Company would have reduced the commitments under the Barclays Facility. The Barclays Facility contained an accordion feature to allow the Company, under certain circumstances, to increase commitments thereunder by up to $350.0 million.
The Company could have elected to use the Barclays Facility to fund a portion of the consideration to be paid pursuant to the Cole Merger, to refinance existing indebtedness of Cole and to pay related fees and expenses. The commitments received in the Barclays Facility were schedule to terminate upon the occurrence of certain customary events, and in any event on April 22, 2014, which date may be extended by an additional three months under certain circumstances. The Barclays Facility was terminated upon the issuance of the senior unsecured notes in February 2014, as discussed below.
Bond Offering
On February 6, 2014, the OP issued, in a private offering, $2.55 billion aggregate principal amount of senior unsecured notes consisting of $1.3 billion aggregate principal amount of 2.00% senior notes due 2017 (the “2017 Notes,” $750.0 million aggregate principal amount of 3.00% senior notes due 2019 (the “2019 Notes”) and $500.0 million aggregate principal amount of 4.60% senior notes due 2024 (the “2024 Notes,” and, together with the 2017 Notes and 2019 Notes, the “Notes”). The Notes are guaranteed by the Company. The OP may redeem all or a part of any series of the Notes at any time at its option at the redemption prices set forth in the indenture governing the Notes, plus accrued and unpaid interest on the principal amount of the Notes of such series being redeemed to, but excluding, the applicable redemption date. With respect to the 2019 Notes and the 2024 Notes, if such Notes are redeemed on or after January 6, 2019, with respect to the 2019 Notes, or November 6, 2023, with respect to the 2024 Notes, the redemption price will equal 100% of the principal amount of the Notes of the applicable series to be redeemed, plus accrued and unpaid interest on the amount being redeemed to, but excluding, the applicable redemption date.
See Note 24 – Subsequent Events (As Restated) for further discussion.
Note 13 — Credit Facilities
Senior Corporate Credit Facility
The Company and the OP are parties to a credit facility with Wells Fargo, National Association (the “Credit Facility”), as administrative agent and other lenders party thereto.
At December 31, 2013, the Credit Facility had commitments of $2.4 billion. The Credit Facility has an accordion feature, which, if exercised in full, would allow the Company to increase borrowings under the Credit Facility to $3.0 billion, subject to additional lender commitments, borrowing base availability and other conditions.
At December 31, 2013, the Credit Facility contained a $940.0 million term loan facility and a $1.5 billion revolving credit facility, of which $940.0 million and $119.8 million was outstanding, respectively. In November 2013, the Credit Facility was amended and certain modifications were made to the terms of the agreement. Loans under the Credit Facility are priced at the applicable rate (at the Company’s election, either a floating interest rate based on one month LIBOR, determined on a daily basis) plus 2.25% to 3.00%, or a prime-based interest rate, based upon the Company’s current leverage. From the amendment date until the first completed fiscal quarter, the applicable LIBOR rate is increased by 3.00%. To the extent that the Company receives an investment grade credit rating as determined by a major credit rating agency, at the Company’s election, advances under the revolving credit facility will be priced at their applicable rate plus 0.90% to 1.75% and term loans will be priced at a floating interest rate of LIBOR plus 1.15% to 2.00%, based upon the Company’s then current investment grade credit rating. The Company may also make fixed rate borrowings under the Credit Facility. At December 31, 2013, the Company had undrawn commitments of $1.4 billion under the Credit Facility.
F-50
Table of Contents
AMERICAN REALTY CAPITAL PROPERTIES, INC.
NOTES TO CONSOLIDATED FINANCIAL STATEMENTS – (Continued)
December 31, 2013
The Credit Facility provides for monthly interest payments. In event of a default, each lender has the right to terminate its obligations under the Credit Facility, and to accelerate the payment on any unpaid principal amount of all outstanding loans. The Company has guaranteed the obligations under the Credit Facility. The revolving credit facility will terminate on February 14, 2017, unless extended for an additional year pursuant to the terms of the agreement. The Company may prepay borrowings under the Credit Facility and the Company may incur an unused fee of 0.15% to 0.25% per annum on the unused amount depending on the unused balance as a percentage of the total facility and the type of funding. As of December 31, 2013, the Credit Facility also required the Company to maintain certain property available for collateral as a condition to funding.
As of December 31, 2013, the outstanding balance on the Credit Facility was $1.1 billion, of which $544.8 million bore interest at a floating rate of 3.17%. $515.0 million outstanding on the Credit Facility is fixed through the use of derivative instruments used to hedge interest rate volatility. Including the spread, which can vary based on the Company’s leverage, interest on this portion was 3.85% at December 31, 2013. At December 31, 2013, there was up to $1.9 billion available to the Company for future borrowings, subject to additional lender commitments and borrowing availability. The credit facility matures on June 30, 2018.
The Credit Facility requires restrictions on corporate guarantees as well as the maintenance of financial covenants including the maintenance of certain financial ratios (such as specified debt to equity and debt service coverage ratios) and the maintenance of a minimum net worth. At December 31, 2013, the Company was in compliance with the debt covenants under the Credit Facility.
See Note 24 — Subsequent Events (As Restated) for further discussion.
ARCT IV Senior Secured Credit Facility
On June 18, 2013, the Company obtained a credit agreement (the “Credit Agreement”) with Regions Bank, JPMorgan Chase Bank, N.A., Bank of America, N.A., Wells Fargo Bank, National Association and RBS Citizens, N.A (collectively, the “Lenders”) relating to a $750.0 million senior secured credit facility (the “Senior Secured Credit Facility”).
Initially, the Senior Secured Credit Facility contained a $300.0 million term loan facility and a $450.0 million revolving credit facility. The Senior Secured Credit Facility contained an “accordion” feature to allow the Company, under certain circumstances, to increase the aggregate commitments under the Senior Secured Credit Facility to up to $1.5 billion. On October 16, 2013, the Company entered into agreements that amended the Credit Agreement, increasing the maximum principal amount under the revolving credit facility to $500.0 million and the aggregate commitment under the Senior Secured Credit Facility to $800.0 million.
As of December 31, 2013, the Company had $760.0 million outstanding under the Credit Agreement. The effective annualized interest rate on the Credit Agreement was 1.71% as of December 31, 2013. The Company had $40.0 million of unused borrowing capacity under the Credit Agreement as of December 31, 2013.
The Senior Secured Credit Facility required the Company to meet certain financial covenants, including the maintenance of certain financial ratios (such as specified debt to equity and debt service coverage ratios) as well as the maintenance of a minimum net worth. As of December 31, 2013, the Company was in compliance with the financial covenants under the Credit Agreement.
In connection with the ARCT IV Merger, the Company notified the Administrative Agent in December 2013 and on January 3, 2014, prepaid all of its loans pursuant to, and terminated all commitments available under, the Credit Agreement.
Secured Credit Facility
As part of the CapLease Merger, the Company assumed a secured credit facility with Wells Fargo, National Association (the “Secured Credit Facility”), which had commitments of up to $150.0 million at December 31, 2013. The Secured Credit Facility was fully drawn with $150.0 million outstanding at December 31, 2013.
F-51
Table of Contents
AMERICAN REALTY CAPITAL PROPERTIES, INC.
NOTES TO CONSOLIDATED FINANCIAL STATEMENTS – (Continued)
December 31, 2013
The borrowings under the Secured Credit Facility bear interest at an annual rate of one-month LIBOR or LIBOR based on an interest period of one, three or six months, at the Company’s election, plus an applicable margin of 2.75%, payable quarterly in arrears. The Secured Credit Facility matures on December 31, 2014 and may be prepaid, in whole or in part, without premium or penalty, at the Company’s option, at any time.
The obligations under the Secured Credit Facility are secured by mortgages on certain real property assets acquired from CapLease comprising the borrowing base. The Secured Credit Facility includes affirmative and negative covenants and financial performance covenants. At December 31, 2013, the Company was in compliance with the debt covenants under the Secured Credit Facility.
Repayment of Previous Credit Facilities
On February 28, 2013, the Company repaid all of the outstanding borrowings under its previous senior secured revolving credit facility in the amount of $124.6 million, and the credit agreement for such facility was terminated. The average interest rate on the borrowings during the period the balance was outstanding was 3.11%. On February 14, 2013, simultaneous with entering into the Credit Facility, the Company terminated its secured credit facility agreement, which had been unused.
Note 14 — Accounts Payable and Accrued Expenses (As Restated)
Accounts payable and accrued expenses consisted of the following as of December 31, 2013 and 2012 (amounts in thousands):
| Year Ended December 31, | ||||||||
| 2013 (As Restated) |
2012 | |||||||
| Accounts payable |
$ | 5,887 | $ | 2,690 | ||||
| Accrued interest |
14,189 | (114 | ) | |||||
| Accrued real estate taxes |
24,658 | 919 | ||||||
| Accrued merger costs |
651,430 | — | ||||||
| Accrued other |
34,407 | 99,245 | ||||||
|
|
|
|
|
|||||
| $ | 730,571 | $ | 102,740 | |||||
|
|
|
|
|
|||||
Note 15 — Derivatives and Hedging Activities
Risk Management Objective of Using Derivatives
The Company may use derivative financial instruments, including interest rate swaps, caps, options, floors and other interest rate derivative contracts, to hedge all or a portion of the interest rate risk associated with its borrowings. The principal objective of such arrangements is to minimize the risks and/or costs associated with the Company’s operating and financial structure as well as to hedge specific anticipated transactions. The Company does not intend to utilize derivatives for speculative or other purposes other than interest rate risk management. The use of derivative financial instruments carries certain risks, including the risk that the counterparties to these contractual arrangements are not able to perform under the agreements. To mitigate this risk, the Company only enters into derivative financial instruments with counterparties with high credit ratings and with major financial institutions with which the Company and its affiliates may also have other financial relationships. The Company does not anticipate that any of the counterparties will fail to meet their obligations.
F-52
Table of Contents
AMERICAN REALTY CAPITAL PROPERTIES, INC.
NOTES TO CONSOLIDATED FINANCIAL STATEMENTS – (Continued)
December 31, 2013
Cash Flow Hedges of Interest Rate Risk
The Company’s objectives in using interest rate derivatives are to add stability to interest expense and to manage its exposure to interest rate movements. To accomplish this objective, the Company primarily uses interest rate swaps and collars as part of its interest rate risk management strategy. Interest rate swaps designated as cash flow hedges involve the receipt of variable-rate amounts from a counterparty in exchange for the Company making fixed-rate payments over the life of the agreements without exchange of the underlying notional amount. Interest rate collars designated as cash flow hedges involve the receipt of variable-rate amounts if interest rates rise above the cap strike rate on the contract and payments of variable-rate amounts if interest rates fall below the floor strike rate on the contract.
The effective portion of changes in the fair value of derivatives designated and that qualify as cash flow hedges is recorded in accumulated other comprehensive income and is subsequently reclassified into earnings in the period that the hedged forecasted transaction affects earnings. During 2013, such derivatives were used to hedge the variable cash flows associated with variable-rate debt. The ineffective portion of the change in fair value of the derivatives is recognized directly in earnings.
Amounts reported in accumulated other comprehensive income related to derivatives that will be reclassified to interest expense as interest payments are made on the Company’s variable-rate debt. During the next 12 months, the Company estimates that an additional $5.8 million will be reclassified from other comprehensive income as an increase to interest expense. During the year ended December 31, 2013, the Company accelerated the reclassification of amounts in other comprehensive income to earnings as a result of the hedged forecasted transactions becoming probable not to occur. The accelerated amounts were a loss of less than $27,000.
As of December 31, 2013, the Company had the following outstanding interest rate derivatives that were designated as cash flow hedges of interest rate risk (dollar amounts in thousands):
| Interest Rate Derivative |
Number of Instruments |
Notional Amount | ||||||
| Interest rate swaps |
16 | $ | 700,390 | |||||
The table below presents the fair value of the company’s derivative financial instruments as well as their classification on the consolidated balance sheets as of the years ended December 31, 2013 and 2012 (dollar amounts in thousands):
| Year Ended December 31, | ||||||||||
| Derivatives Designated as Hedging Instruments |
Balance Sheet Location |
2013 | 2012 | |||||||
| Interest rate products |
Derivative assets, at fair value | $ | 9,189 | $ | — | |||||
| Interest rate products |
Derivative liabilities, at fair value | $ | (1,719 | ) | $ | (3,830 | ) | |||
The table below details the location in the financial statements of the gain or loss recognized on interest rate derivatives designated as cash flow hedges for the years ended December 31, 2013 and 2012, respectively (amounts in thousands):
| Year Ended December 31, | ||||||||
| Derivatives in Cash Flow Hedging Relationships |
2013 | 2012 | ||||||
| Amount of gain (loss) recognized in accumulated other comprehensive income on interest rate derivatives (effective portion) |
$ | 6,946 | $ | (4,684 | ) | |||
|
|
|
|
|
|||||
| Amount of loss reclassified from accumulated other comprehensive income into income as interest expense (effective portion) |
$ | (4,535 | ) | $ | (941 | ) | ||
|
|
|
|
|
|||||
| Amount of loss recognized in income on derivative (ineffective portion, reclassifications of missed forecasted transactions and amounts excluded from effectiveness testing) |
$ | (79 | ) | $ | (1 | ) | ||
|
|
|
|
|
|||||
F-53
Table of Contents
AMERICAN REALTY CAPITAL PROPERTIES, INC.
NOTES TO CONSOLIDATED FINANCIAL STATEMENTS – (Continued)
December 31, 2013
Derivatives Not Designated as Hedging Instruments
Derivatives not designated as hedges are not speculative and are used to manage the Company’s exposure to interest rate movements and other identified risks but do not meet the strict hedge accounting requirements to be classified as hedging instruments. Changes in the fair value of derivatives not designated in hedging relationships are recorded directly in earnings and were approximately $19,000 for the year ended December 31, 2013. The company did not have any derivatives that were not designated as of December 31, 2012.
As of December 31, 2013, the Company had the following outstanding interest rate derivatives that were not designated as hedges of in qualifying hedging relationships (dollar amounts in thousands):
| Interest Rate Derivative |
Number of Instruments | Notional Amount | ||||||
| Interest Rate Cap |
1 | $ | 500,000 | |||||
The table below presents the fair value of the Company’s derivate financial instruments not designated as hedges as well as their classification as liabilities on the consolidated balance sheets as of December 31, 2013 and 2012. There were no derivatives classified as not hedging instruments as assets as of December 31, 2013 and 2012 (amounts in thousands):
| Year Ended December 31, | ||||||||||
| Derivatives Not Designated as Hedging Instruments |
Balance Sheet Location |
2013 | 2012 | |||||||
| Series D Preferred Stock embedded derivative |
Derivative liabilities, at fair value | $ | (16,736 | ) | $ | — | ||||
Refer to Note 17 — Preferred and Common Stock (As Restated) for additional information for the Series D Preferred Stock embedded derivative.
Tabular Disclosure Offsetting Derivatives
The table below presents a gross presentation, the effects of offsetting, and a net presentation of the Company’s derivatives as of December 31, 2013 and 2012. The net amounts of derivative assets or liabilities can be reconciled to the tabular disclosure of fair value. The tabular disclosure of fair value provides the location that derivative assets and liabilities are presented on the consolidated balance sheets (amounts in thousands).
| Offsetting of Derivative Assets and Liabilities |
||||||||||||||||||||||||||||||||
| Gross Amounts of Recognized Assets |
Gross Amounts of Recognized Liabilities |
Gross Amounts Offset in the Consolidated Balance Sheets |
Net Amounts of Assets Presented in the Consolidated Balance Sheets |
Net Amounts of Liabilities Presented in the Consolidated Balance Sheets |
Financial Instruments |
Cash Collateral Received |
Net Amount |
|||||||||||||||||||||||||
| December 31, 2013 |
$ | 9,189 | $ | (18,455 | ) | $ | — | $ | 9,189 | $ | (18,455 | ) | $ | — | $ | — | $ | (9,266 | ) | |||||||||||||
| December 31, 2012 |
$ | — | $ | (3,830 | ) | $ | — | $ | — | $ | (3,830 | ) | $ | — | $ | — | $ | (3,830 | ) | |||||||||||||
Credit-risk-related Contingent Features
The Company has agreements with each of its derivative counterparties that contain a provision where if the Company either defaults or is capable of being declared in default on any of its indebtedness, then the Company could also be declared in default on its derivative obligations.
As of December 31, 2013, the fair value of the interest rate derivatives in a net liability position, including accrued interest but excluding any adjustment for nonperformance risk related to these agreements, was $1.7 million. As of December 31, 2013, the Company has not posted any collateral related to these agreements and was not in breach of any agreement provisions. If the Company had breached any of these provisions, it could have been required to settle its obligations under the agreements at their aggregate termination value of $1.7 million at December 31, 2013.
F-54
Table of Contents
AMERICAN REALTY CAPITAL PROPERTIES, INC.
NOTES TO CONSOLIDATED FINANCIAL STATEMENTS – (Continued)
December 31, 2013
Note 16 — Commitments and Contingencies
Contractual Lease Obligations
The following table reflects the minimum base rental cash payments due from the Company over the next five years and thereafter for certain ground and office lease obligations (amounts in thousands):
| Future Minimum Lease Payments |
||||
| 2014 |
$ | 4,541 | ||
| 2015 |
4,443 | |||
| 2016 |
4,214 | |||
| 2017 |
4,244 | |||
| 2018 |
3,212 | |||
| Thereafter |
63,787 | |||
|
|
|
|||
| $ | 84,441 | |||
|
|
|
|||
Litigation
In the ordinary course of business, the Company may become subject to litigation or claims. There are no material legal proceedings pending or known to be contemplated against the Company, except as follows:
ARCT III Litigation Matters
After the announcement of the ARCT III Merger Agreement on December 17, 2012, Randell Quaal filed a putative class action lawsuit filed on January 30, 2013 against the Company, the OP, ARCT III, ARCT III OP, the members of the board of directors of ARCT III and certain subsidiaries of the Company in the Supreme Court of the State of New York. The plaintiff alleges, among other things, that the board of ARCT III breached its fiduciary duties in connection with the transactions contemplated under the ARCT III Merger Agreement. In February 2013, the parties agreed to a memorandum of understanding regarding settlement of all claims asserted on behalf of the alleged class of ARCT III stockholders. In connection with the settlement contemplated by that memorandum of understanding, the class action and all claims asserted therein will be dismissed, subject to court approval. The proposed settlement terms required ARCT III to make certain additional disclosures related to the ARCT III Merger, which were included in a Current Report on Form 8-K filed by ARCT III with the SEC on February 21, 2013. The memorandum of understanding also added that the parties will enter into a stipulation of settlement, which will be subject to customary conditions, including confirmatory discovery and court approval following notice to ARCT III’s stockholders. If the parties enter into a stipulation of settlement, a hearing will be scheduled at which the court will consider the fairness, reasonableness and adequacy of the settlement. There can be no assurance that the parties will ultimately enter into a stipulation of settlement, that the court will approve any proposed settlement, or that any eventual settlement will be under the same terms as those contemplated by the memorandum of understanding, therefore any losses that may be incurred to settle this matter are not determinable.
CapLease Litigation Matters
Since the announcement of the CapLease Merger Agreement on May 28, 2013, the following lawsuits have been filed:
On May 28, 2013, Jacquelyn Mizani filed a putative class action lawsuit in the Supreme Court for the State of New York against the Company, the OP, Safari Acquisition LLC, CapLease, CapLease LP, CLF OP General Partner, LLC and the members of the CapLease board of directors (the “Mizani Action”). The complaint alleges, among other things, that the merger agreement at issue was the product of breaches of fiduciary duty by the CapLease directors because the proposed merger transaction (the “CapLease Transaction”) purportedly does not provide for full and fair value for the CapLease shareholders, the CapLease Transaction allegedly was not the result of a competitive bidding process, the merger agreement allegedly contains coercive deal protection measures and the merger agreement and the CapLease Transaction purportedly were approved as a result of improper self-dealing by certain defendants who would receive certain alleged employment compensation benefits and continued employment pursuant to the merger agreement. The complaint also alleges that CapLease, the Company, the OP and Safari Acquisition LLC aided and abetted the CapLease directors’ alleged breaches of fiduciary duty.
F-55
Table of Contents
AMERICAN REALTY CAPITAL PROPERTIES, INC.
NOTES TO CONSOLIDATED FINANCIAL STATEMENTS – (Continued)
December 31, 2013
On July 3, 2013, Fred Carach filed a putative class action and derivative lawsuit in the Supreme Court for the State of New York against the Company, the OP, Safari Acquisition LLC, CapLease, CapLease LP, CLF OP General Partner, LLC and the members of the CapLease board of directors (the “Carach Action”). The complaint alleges, among other things, that the merger agreement was the product of breaches of fiduciary duty by the CapLease directors because the merger purportedly does not provide for full and fair value for the CapLease shareholders, the CapLease Transaction allegedly was not the result of a competitive bidding process, the merger agreement allegedly contains coercive deal protection measures and the merger agreement and the CapLease Transaction purportedly were approved as a result of improper self-dealing by certain defendants who would receive certain alleged employment compensation benefits and continued employment pursuant to the merger agreement. The complaint also alleges that with respect to the Registration Statement and draft joint proxy statement issued in connection with the proposed CapLease Transaction on July 2, 2013, that disclosures made therein were insufficient or otherwise improper. The complaint also alleges that CapLease, the Company, the OP and Safari Acquisition LLC aided and abetted the CapLease directors’ alleged breaches of fiduciary duty.
On June 25, 2013, Dewey Tarver filed a putative class action and derivative lawsuit in the Circuit Court for Baltimore City against the Company, the OP, Safari Acquisition LLC, CapLease, CapLease LP, CLF OP General Partner, LLC and the members of the CapLease board of directors (the “Tarver Action”). The complaint alleges, among other things, that the merger agreement was the product of breaches of fiduciary duty by the CapLease directors because the CapLease Transaction purportedly does not provide for full and fair value for the CapLease shareholders, the CapLease Transaction allegedly was not the result of a competitive bidding process, the merger agreement allegedly contains coercive deal protection measures and the merger agreement and the CapLease Transaction purportedly were approved as a result of improper self-dealing by certain defendants who would receive certain alleged employment compensation benefits and continued employment pursuant to the merger agreement. The complaint also alleges that CapLease, CapLease LP, CLF OP General Partner, LLC, the Company, the OP and Safari Acquisition, LLC aided and abetted the CapLease directors’ alleged breaches of fiduciary duty.
Counsel who filed each of these three cases reached an agreement with each other as to who will serve as lead plaintiff and lead plaintiffs’ counsel in the cases and where they will be prosecuted. Thus, on August 9, 2013, counsel in the Tarver Action filed a motion for stay in the Baltimore Court, informing the court that they had agreed to join and participate in the prosecution of the Mizani and Carach Actions in the New York Court. The Defendants consented to the stay of the Tarver Action in the Baltimore Court, and on September 5, 2013, Judge Pamela J. White issued an order granting that stay. Consequently, there has been no subsequent activity in the Baltimore Court in the Tarver Action. Also on August 9, 2013, all counsel involved in the Mizani and Carach Actions filed a joint stipulation in the New York Court, reflecting agreement among all parties that the Mizani and Carach Actions should be consolidated (jointly, “the Consolidated Actions”) and setting out a schedule for early motion practice in response to the complaints filed (the “Consolidation Stipulation”). Pursuant to the Consolidation Stipulation, an amended complaint was also filed in the New York court on August 9, 2013 and was designated as the operative complaint in the Consolidated Actions (“Operative Complaint”). Pursuant to the Consolidation Stipulation, all Defendants filed a motion to dismiss all claims asserted in the Operative Complaint on September 23, 2013. Plaintiffs’ response was due on or before November 7, 2013. On November 7, 2013, Plaintiffs filed a motion seeking leave to file a second amended complaint, which the Defendants have opposed. On March 24, 2014, Plaintiffs’ counsel in the Consolidated Actions dismissed those claims without prejudice. Consequently, only the Tarver Action currently remains pending among these cases, although it remains stayed.
On October 8, 2013, John Poling filed a putative class action lawsuit in the Circuit Court for Baltimore City against the Company, the OP, Safari Acquisition LLC, CapLease, CapLease LP, CLF OP General Partner, LLC and the members of the CapLease board of directors (the “Poling Action”). The complaint alleges that the merger agreement breaches the terms of the CapLease’ 8.375% Series B Cumulative Redeemable Preferred Stock (“Series B”) and the terms of the 7.25% Series C Cumulative Redeemable Preferred Stock (“Series C”) and is in violation of the Series B Articles Supplementary and the Series C Articles Supplementary. The Complaint alleges claims for breach of contract and breach of fiduciary duty against the CapLease entities and the CapLease board of directors. The complaint also alleges that the Company, the OP and Safari Acquisition, LLC aided and abetted CapLease and the CapLease directors’ alleged breach of contract and breach of fiduciary duty.
F-56
Table of Contents
AMERICAN REALTY CAPITAL PROPERTIES, INC.
NOTES TO CONSOLIDATED FINANCIAL STATEMENTS – (Continued)
December 31, 2013
On November 13, 2013, all counsel involved in the Poling Action filed a joint stipulation, reflecting agreement among all parties concerning a schedule for early motion practice in response to the complaint filed (the “Scheduling Stipulation”). Pursuant to the Scheduling Stipulation, all Defendants filed a motion to dismiss all claims asserted in the Operative Complaint on December 20, 2013. Plaintiffs’ counsel has opposed that the motion to dismiss, and a hearing on the motion is currently scheduled for May 15, 2014.
Cole Litigation Matters
Three putative class action and/or derivative lawsuits, which were filed earlier this year, assert claims for breach of fiduciary duty, abuse of control, corporate waste, unjust enrichment, aiding and abetting breach of fiduciary duty and other claims relating to the merger between a wholly owned subsidiary of Cole and Cole Holdings Corporation, pursuant to which Cole became a self-managed REIT. On October 22, 2013, the Circuit Court for Baltimore City granted all defendants’ motion to dismiss with prejudice the action pending before the court, but the plaintiffs have appealed that dismissal. The other two lawsuits, which also purport to assert shareholder class action claims under the Securities Act of 1933, as amended (the “Securities Act”), are pending in the United States District Court for the District of Arizona. Defendants filed a motion to dismiss both complaints on January 10, 2014. Subsequently, both of those lawsuits have been stayed by the Court pursuant to a joint request made by all parties pending final approval of the consolidated Baltimore Cole Merger Actions described below.
To date, eleven lawsuits have been filed in connection with the Cole Merger. Two of these suits — Wunsch v. Cole, et al (“Wunsch”), No. 13-CV-2186, and Sobon v. Cole, et al (“Sobon”) — were filed as putative class actions on October 25, 2013 and November 18, 2013, respectively, in the U.S. District Court for the District of Arizona. Between October 30, 2013 and November 14, 2013, eight other putative stockholder class action or derivative lawsuits were filed in the Circuit Court for Baltimore City, Maryland, captioned as: (i) Operman v. Cole, et al (“Operman”); (ii) Branham v. Cole, et al (“Branham”); (iii) Wilfong v. Cole, et al. (“Wilfong”); (iv) Polage v. Cole, et al. (“Polage”); (v) Corwin v. Cole, et al (“Corwin”); (vi) Green v. Cole, et al (“Green”); (vii) Flynn v. Cole, et al (“Flynn”) and (viii) Morgan v. Cole, et al. (“Morgan”). All of these lawsuits name the Company, Cole and Cole’s board of directors as defendants; Wunsch, Sobon, Branham, Wilfong, Flynn, Green, Morgan and Polage also name CREInvestments, LLC, a Maryland limited liability company and a wholly-owned subsidiary of the Cole, as a defendant. All of the named plaintiffs claim to be Cole stockholders and purport to represent all holders of Cole’s stock. Each complaint generally alleges that the individual defendants breached fiduciary duties owed to plaintiff and the other public stockholders of Cole in connection with the Cole Merger, and that certain entity defendants aided and abetted those breaches. The breach of fiduciary duty claims asserted include claims that the Cole Merger does not provide for full and fair value for the Cole shareholders, that the Cole Merger was the product of an “inadequate sale process,” that the Cole Merger Agreement contains coercive deal protection measures and the Cole Merger Agreement and that the Cole Merger were approved as a result of or in a manner which facilitates improper self-dealing by certain defendants. In addition, the Flynn, Corwin, Green, Wilfong, Polage and Branham lawsuits claim that the individual defendants breached their duty of candor to shareholders and the Branham and Polage lawsuits assert claims derivatively against the individual defendants for their alleged breach of fiduciary duties owed to Cole. The Polage lawsuit also asserts derivative claims for waste of corporate assets and unjust enrichment. The Wunsch and Sobon lawsuits also assert claims against Cole and the individual defendants under Section 14(a) of the Securities Exchange Act of 1934, as amended (the “Exchange Act”), based on allegations that the proxy materials omitted to disclose allegedly material information, and a claim against the individual defendants under Section 20(a) of the Exchange Act based on the same allegations. Among other remedies, the complaints seek unspecified money damages, costs and attorneys’ fees.
F-57
Table of Contents
AMERICAN REALTY CAPITAL PROPERTIES, INC.
NOTES TO CONSOLIDATED FINANCIAL STATEMENTS – (Continued)
December 31, 2013
In January 2014, the parties to the eight lawsuits filed in the Circuit Court for Baltimore City, Maryland (“the consolidated Baltimore Cole Merger Actions”) entered into a memorandum of understanding regarding settlement of all claims asserted on behalf of the alleged class of Cole stockholders. In connection with the settlement contemplated by that memorandum of understanding, the class action and all claims asserted therein will be dismissed, subject to court approval. The proposed settlement terms required Cole to make certain additional disclosures related to the Cole Merger, which were included in a Current Report on Form 8-K filed by Cole with the SEC on January 14, 2014. The memorandum of understanding also contemplated that the parties will enter into a stipulation of settlement, which will be subject to customary conditions, including confirmatory discovery and court approval following notice to Cole’s stockholders. If the parties enter into a stipulation of settlement, a hearing will be scheduled at which the court will consider the fairness, reasonableness and adequacy of the settlement. There can be no assurance that the parties will ultimately enter into a stipulation of settlement, that the court will approve any proposed settlement, or that any eventual settlement will be under the same terms as those contemplated by the memorandum of understanding, therefore any losses that may be incurred to settle this matter are not determinable.
The Sobon lawsuit was voluntarily dismissed on February 3, 2014. The Company believes that the Wunsch lawsuit in connection with the Cole Merger is without merit and that it has substantial meritorious defenses to the claims set forth in the complaint.
On December 27, 2013, Realistic Partners filed a putative class action lawsuit against the Company and the members of its board of directors in the Supreme Court for the State of New York. Cole was later added as a defendant also. The plaintiff alleges, among other things, that the board of the Company breached its fiduciary duties in connection with the transactions contemplated under the Cole Merger Agreement and that Cole aided and abetted those breaches. In January 2014, the parties entered into a memorandum of understanding regarding settlement of all claims asserted on behalf of the alleged class of the Company’s stockholders. In connection with the settlement contemplated by that memorandum of understanding, the class action and all claims asserted therein will be dismissed, subject to court approval. The proposed settlement terms required the Company to make certain additional disclosures related to the Cole Merger, which were included in a Current Report on Form 8-K filed by the Company with the SEC on January 17, 2014. The memorandum of understanding also contemplated that the parties will enter into a stipulation of settlement, which will be subject to customary conditions, including confirmatory discovery and court approval following notice to the Company’s stockholders. If the parties enter into a stipulation of settlement, a hearing will be scheduled at which the court will consider the fairness, reasonableness and adequacy of the settlement. There can be no assurance that the parties will ultimately enter into a stipulation of settlement, that the court will approve any proposed settlement, or that any eventual settlement will be under the same terms as those contemplated by the memorandum of understanding, therefore any losses that may be incurred to settle this matter are not determinable.
See Note 24 — Subsequent Events (As Restated) for significant litigation matters that occurred subsequent to December 31, 2013.
Environmental Matters
In connection with the ownership and operation of real estate, the Company may potentially be liable for costs and damages related to environmental matters. The Company has not been notified by any governmental authority of any non-compliance, liability or other claim, and is not aware of any other environmental condition, in each case, that it believes will have a material adverse effect on the results of operations.
Note 17 — Preferred and Common Stock (As Restated)
Series A and Series B Convertible Preferred Stock
During the year ended December 31, 2013, the Company converted all 545,454 outstanding shares of its Series A Convertible Preferred Stock and all 283,018 outstanding shares of Series B Convertible Preferred Stock into 829,629 shares of the Company’s common stock, which included dividends on the Series A Convertible Preferred Stock.
F-58
Table of Contents
AMERICAN REALTY CAPITAL PROPERTIES, INC.
NOTES TO CONSOLIDATED FINANCIAL STATEMENTS – (Continued)
December 31, 2013
Series D and Series E Preferred Stock
On September 12, 2013, the Company’s board of directors unanimously approved the issuance of Series D Cumulative Convertible Preferred Stock (“Series D Preferred Stock”) and the issuance of Series E Cumulative Preferred Stock (“Series E Preferred Stock”).
On September 15, 2013, the Company entered into definitive purchase agreements pursuant to which it agreed to issue Series D Preferred Stock, par value $0.01 per share, and common stock, par value $0.01 per share, to certain institutional holders promptly following the close of the Company’s merger with CapLease, via a private placement. Pursuant to the definitive purchase agreements, the Company issued approximately 21.7 million shares of Series D Preferred and 15.1 million shares of common stock, for gross proceeds of $288.0 million and $186.0 million, respectively, on November 12, 2013. The Series D Preferred Stock will pay dividends at the rate of 5.81% per annum on its face amount of $13.59 per share (equivalent to $0.79 per share on an annualized basis). The Series D Preferred Stock is redeemable by the Company on August 31, 2014 (the “Redemption Date”). Subsequent to that date, or in certain other circumstances, the Series D Preferred Stock is convertible into common stock or Series E Preferred Stock or redeemable into cash, at the discretion of the Company upon such request for conversion by the holders of Series D Preferred Stock.
In the event of a liquidation, the holders of Series D Preferred Stock are entitled to receive the greater of (a) $13.59 per share plus accrued and unpaid dividends (the “Liquidation Preference”) plus a 20% premium and (b) an amount the Preferred Shares holders would have received had they converted into shares of common stock immediately prior to the liquidation event.
If the Company elects to redeem the Series D Preferred Stock on the Redemption Date, the Company shall pay the greater of (a) the product of the number of Series D Preferred Stock and the 102% of the Liquidation Preference and (b) product of the number of common shares that would be issued if the Series D Preferred Stock converted immediately prior to the Redemption Date and 102% of the one-day VWAP.
At any time after the Redemption Date, the holders of Series D Preferred Stock may convert some or all of their outstanding Series D Preferred Stock into shares of common stock. Upon such an election to convert, the Company may elect the following settlement options (1) convert the shares of Series D Preferred Stock into the number of fully paid and non-assessable Common Shares obtained by dividing the aggregate Liquidation Preference of such Series D Preferred Stock by the Conversion Price, as defined below, (2) convert the shares of Series D Preferred Stock into an equal number shares of Series E Preferred Stock, additional shares of Series E Preferred Stock may be issued under certain circumstances, or (3) an amount equal to the product of the number of shares of Series D Preferred Stock and the Cash Conversion Price, as defined below.
The Conversion Price shall be the lowest of (i) a 2% discount to the VWAP of the common stock for the 10 Trading Days prior to the Conversion Election Date, (ii) a 2% discount to the closing price on the Conversion Election Date, and (iii) $13.59. The Cash Conversion Price shall be the greater of (i) 102% of the Liquidation Preference and (ii) the one day VWAP of the Common Shares on the date of the election.
The Company has concluded that the conversion option qualifies as a derivative and should be bifurcated from the host instrument. At issuance, the conversion option had a fair value of $18.7 million. As of December 31, 2013, the fair value of the conversion option had a fair value of $16.7 million. The Company recorded the change in fair value of $2.0 million in gain (loss) on derivative instruments in the consolidated statements of operations and comprehensive loss for the year ended December 31, 2013.
As the holders of Series D Preferred Stock are entitled to receive liquidation preferences that other equity holders are not entitled to, the Company determined the Series D Preferred Stock meets the definition of a deemed liquidation event and therefore should be classified as temporary equity under U.S. GAAP. At the date of issuance, the fair value of the Series D Preferred Stock was $269.3 million. As of December 31, 2013, the Company has determined that a liquidation event is not probable; therefore, the Company has concluded that the Series D Preferred Stock is not currently redeemable or likely to become redeemable. As such, the Company has not accreted the initial value of the Series D Preferred Stock.
As of December 31, 2013, there were 21,735,008 authorized and issued shares of Series D Preferred Stock and no authorized and issued shares of Series E Preferred Stock, respectively.
F-59
Table of Contents
AMERICAN REALTY CAPITAL PROPERTIES, INC.
NOTES TO CONSOLIDATED FINANCIAL STATEMENTS – (Continued)
December 31, 2013
Series F Preferred Stock
On October 6, 2013, in connection with the modification to the ARCT IV Merger, the Company’s board of directors unanimously approved the issuance of Series F Preferred Stock. Upon consummation of the ARCT IV Merger on January 3, 2014, 42.2 million shares of Series F Preferred Stock were issued to ARCT IV shareholders and 0.7 million units of Series F OP Units were issued to the ARCT IV OP Unit holders. To comply with the carryover basis of accounting required in relation to an acquisition of an entity under common control, the financial statements reflect the ARCT IV Merger as if it occurred at the beginning of the periods presented. As such, the accompanying consolidated balance sheet depicts that 42.2 million shares of Series F Preferred Stock were outstanding as of December 31, 2013.
The Series F Preferred Stock will pay cumulative cash dividends at the rate of 6.70% per annum on its liquidation preference of $25.00 per share (equivalent to $1.675 per share on an annual basis). The Series F Preferred Stock will not be redeemable by the Company before the fifth anniversary of the date on which such Series F Preferred Stock is issued (the “Initial Redemption Date”), except under circumstances intended to preserve the Company’s status as a real estate investment trust for federal and/or state income tax purposes and except upon the occurrence of a change of control. On and after the Initial Redemption Date, the Company may, at its option, redeem shares of the Series F Preferred Stock, in whole or from time to time in part, at a redemption price of $25.00 per share plus, subject to exceptions, any accrued and unpaid dividends thereon to the date fixed for redemption. The shares of Series F Preferred Stock have no stated maturity, are not subject to any sinking fund or mandatory redemption and will remain outstanding indefinitely unless the Company redeems or otherwise repurchases them or they become convertible and are converted into common stock (or, if applicable, alternative consideration). The Series F Preferred Stock trades on the NASDAQ under the symbol “ARCPP.”
Increases in Authorized Common Stock
On July 2, 2013, the Company filed articles of amendment to its charter to increase the number of authorized shares of common stock to 750,000,000 shares. On December 9, 2013, the Company filed articles of amendment to its charter to increase the number of authorized shares of common stock to 1.5 billion shares.
Offerings
On August 1, 2012, the Company filed a $500.0 million universal shelf registration statement and a resale registration statement with the SEC. Each registration statement became effective on August 17, 2012. As of December 31, 2013, the Company had issued 2.1 million shares of common stock under the $500.0 million universal shelf registration statement. No preferred stock, debt or equity-linked security had been issued under this $500.0 million universal shelf registration statement. The resale registration statement, as amended, registers the resale of up to 1,882,248 shares of common stock issued in connection with any future conversion of certain currently outstanding restricted shares, convertible preferred stock or limited partnership interests in the OP.
In January 2013, the Company commenced its “at the market” equity offering program (“ATM”) in which it may from time to time offer and sell shares of its common stock having an aggregate offering proceeds of up to $60.0 million. The shares will be issued pursuant to the Company’s $500.0 million universal shelf registration statement.
On March 14, 2013, the Company filed a universal automatic shelf registration statement that was automatically declared effective and achieved well-known seasoned issuer (“WKSI”) status. As a result of the delayed filing of certain of our periodic reports with the SEC, we are not currently eligible to use a shelf registration statement for the offer and sale of our securities.
F-60
Table of Contents
AMERICAN REALTY CAPITAL PROPERTIES, INC.
NOTES TO CONSOLIDATED FINANCIAL STATEMENTS – (Continued)
December 31, 2013
The following are the Company’s equity offerings of common stock and the gross proceeds of the equity offering for the years ended December 31, 2013, 2012 and 2011 (dollar amounts in millions):
| Type of offering |
Closing Date |
Number of Shares (1) | Gross Proceeds | |||||||
| IPO |
September 7, 2011 | 5,574,131 | $ | 67.4 | ||||||
| Follow-on offering |
November 2, 2011 | 1,497,924 | 15.8 | |||||||
| Underwriters’ over-allotment |
November 7, 2011 | 74,979 | 0.8 | |||||||
|
|
|
|
|
|||||||
| Total - Year end December 31, 2011 (2) |
7,147,034 | 84.0 | ||||||||
|
|
|
|
|
|||||||
| Follow-on offering |
June 18, 2012 | 3,250,000 | 30.3 | |||||||
| Underwriters’ over-allotment |
July 9, 2012 | 487,500 | 4.6 | |||||||
|
|
|
|
|
|||||||
| Total - Year end December 31, 2012 (3) |
3,737,500 | 34.9 | ||||||||
|
|
|
|
|
|||||||
| Registered follow-on offering |
January 29, 2013 | 2,070,000 | 26.8 | |||||||
| ATM |
January 1 -April 17, 2013 | 553,300 | 8.9 | |||||||
| Private placement offering |
June 7, 2013 | 29,411,764 | 455.0 | |||||||
| Private placement offering |
November 12, 2013 | 15,126,498 | 186.0 | |||||||
|
|
|
|
|
|||||||
| Total - Year end December 31, 2013 (4) |
47,161,562 | $ | 676.7 | |||||||
|
|
|
|
|
|||||||
| (1) | Excludes 140.7 million shares of common stock that were issued to the stockholders of ARCT III’s common stock in conjunction with the ARCT III Merger. |
| (2) | Excludes 9.8 million shares of common stock that were issued by ARCT III for gross proceeds of $102.2 million. |
| (3) | Excludes 155.7 million and 5.4 million shares of common stock that were issued by ARCT III and ARCT IV, respectively, for gross proceeds of $1.6 billion and $255.0 million, respectively. |
| (4) | Excludes 31.0 million shares of common stock that were issued by ARCT IV for gross proceeds of $1.5 billion. |
See Note 24 — Subsequent Events (As Restated) for significant subsequent events.
Dividends
In October 2011, the Company began paying dividends on the 15th day of each month to stockholders of record on the eighth day of such month. Since inception, the board of directors of the Company has authorized the following increases in the Company’s dividend.
| Dividend increase declaration date |
Annualized dividend per share |
Effective date | ||||
| September 7, 2011 |
$ | 0.875 | October 9, 2011 | |||
| February 27, 2012 |
$ | 0.880 | March 9, 2012 | |||
| March 16, 2012 |
$ | 0.885 | June 9, 2012 | |||
| June 27, 2012 |
$ | 0.890 | September 9, 2012 | |||
| September 30, 2012 |
$ | 0.895 | November 9, 2012 | |||
| November 29, 2012 |
$ | 0.900 | February 9, 2013 | |||
| March 17, 2013 |
$ | 0.910 | June 8, 2013 | |||
| May 28, 2013 |
$ | 0.940 | December 8, 2013 (1) | |||
| October 23, 2013 |
$ | 1.000 | February 7, 2014 (2) | |||
| (1) | The dividend increase became effective at the close of the CapLease Merger, which was consummated on November 5, 2013. |
| (2) | The dividend increase was contingent upon, and became effective with, the close of the Cole Merger, which was consummated on February 7, 2014. |
F-61
Table of Contents
AMERICAN REALTY CAPITAL PROPERTIES, INC.
NOTES TO CONSOLIDATED FINANCIAL STATEMENTS – (Continued)
December 31, 2013
The annualized dividend rate at December 31, 2013 was $0.940 per share.
Common Stock Repurchases
On August 20, 2013, the Company’s board of directors reauthorized its $250 million share repurchase program which was originally authorized in February 2013. During the year ended December 31, 2013, the Company repurchased approximately 0.6 million shares at an average price of $13.07 per share or $7.5 million in total.
Upon the closing of the ARCT III Merger, on February 28, 2013, $29.2 million shares, or 16.5% of the then outstanding shares of ARCT III’s common stock, were paid in cash at $12.00 per share, which is equivalent to 27.7 million shares of the Company’s common stock based on the Exchange Ratio. In addition, 148.1 million shares of ARCT III’s common stock were converted to shares of the Company’s common stock at the Exchange Ratio, resulting in an additional 140.7 million shares of the Company’s common stock outstanding after the exchange.
Note 18 — Equity-based Compensation (As Restated)
Equity Plan
The Company has adopted the American Realty Capital Properties, Inc. Equity Plan (the “Equity Plan”), which provides for the grant of stock options, restricted shares of common stock, restricted stock units, dividend equivalent rights and other equity-based awards to the Company’s and its affiliates’ non-executive directors, officers and other employees and advisors and consultants who are providing services to the Company or its affiliates.
The Company authorized and reserved a total number of shares equal to 10.0% of the total number of issued and outstanding shares of common stock (on a fully diluted basis assuming the redemption of all OP Units for shares of common stock) to be issued at any time under the Equity Plan for equity incentive awards excluding an initial grant of 167,400 shares to the Former Manager in connection with the IPO, all of which were vested as of December 31, 2013.
Director Stock Plan
The Company has adopted the American Realty Capital Properties, Inc. Non-Executive Director Stock Plan (the “Director Stock Plan”), which provides for the grant of restricted shares of common stock to each of the Company’s non-executive directors. Awards of restricted stock will vest in accordance with the award agreements, which generally provide for vesting ratably over a five-year period following the date of grant in increments of 20.0% per annum, subject to the director’s continued service on the board of directors, and shall provide for “distribution equivalents” with respect to this restricted stock, whether or not vested, at the same time and in the same amounts as distributions are paid to the stockholders. At December 31, 2013, a total of 99,000 shares of common stock are reserved for issuance under the Director Stock Plan.
The fair value of restricted common stock awards under the Equity Plan and Director Stock Plan is determined on the grant date using the closing stock price on NASDAQ that day and is expensed over the requisite service period. The fair value of restricted common stock awarded to non-employees under the Equity Plan is measured based upon the fair value of goods or services received or the equity instruments granted, whichever is more reliably determinable.
F-62
Table of Contents
AMERICAN REALTY CAPITAL PROPERTIES, INC.
NOTES TO CONSOLIDATED FINANCIAL STATEMENTS – (Continued)
December 31, 2013
ARCT III Restricted Share Plan
ARCT III had an employee and director incentive restricted share plan (the “ARCT III RSP”), which provided for the automatic grant of 3,000 restricted shares of common stock to each of its independent directors, without any further action by ARCT III’s board of directors or its stockholders, on the date of initial election to the board of directors and on the date of each annual stockholder’s meeting thereafter. Restricted stock issued to independent directors vested over a five-year period following the date of grant in increments of 20.0% per annum. The ARCT III RSP provided ARCT III with the ability to grant awards of restricted shares to its directors, officers and employees (if ARCT III ever had employees), employees of ARCT III’s advisor and its affiliates, employees of entities that provided services to ARCT III, directors of the ARCT III Advisor or of entities that provided services to ARCT III, certain consultants to ARCT III and the ARCT III Advisor and its affiliates or to entities that provided services to ARCT III.
Immediately prior to the effective time of the ARCT III Merger, each then-outstanding share of ARCT III restricted stock fully vested. All shares of ARCT III common stock then-outstanding as a result of the full vesting of shares of ARCT III restricted stock, and the satisfaction of any applicable withholding taxes, had the right to receive a number of shares of the Company’s common stock based on the ARCT III Exchange Ratio.
ARCT IV Restricted Share Plan
ARCT IV had an employee and director incentive restricted share plan (the “ARCT IV RSP” and together with the ARCT III RSP, the “RSP Plans”), which provided for the automatic grant of 1,333 restricted shares of common stock to each of its independent directors without any further action by ARCT IV’s board of directors or its stockholders on the date of initial election to the board of directors and on the date of each annual stockholder’s meeting thereafter. Restricted stock issued to independent directors vested over a five-year period following the date of grant in increments of 20% per annum. ARCT IV issued 5,333 and 2,667 restricted shares under the ARCT IV RSP during the years ended December 31, 2013 and 2012, respectively. All restricted shares issued under the ARCT IV RSP had an issue price of $22.50. The ARCT IV RSP provided ARCT IV with the ability to grant awards of restricted shares to its directors, officers and employees, employees of the ARCT IV Advisor and its affiliates, employees of entities that provided services to ARCT IV, directors of the ARCT IV Advisor or of entities that provided services to ARCT IV, certain consultants to ARCT IV and the ARCT IV Advisor and its affiliates or to entities that provided services to ARCT IV.
Immediately prior to the effective time of the ARCT IV Merger, each then-outstanding share of ARCT IV restricted stock fully vested. All shares of ARCT IV common stock then-outstanding as a result of the full vesting of shares of ARCT IV restricted stock, and the satisfaction of any applicable withholding taxes, received shares of the Company’s common stock based on the ARCT IV Exchange Ratio.
F-63
Table of Contents
AMERICAN REALTY CAPITAL PROPERTIES, INC.
NOTES TO CONSOLIDATED FINANCIAL STATEMENTS – (Continued)
December 31, 2013
The following tables detail the restricted shares activity within the Equity Plan, Director Stock Plan and RSP Plans during the years ended December 31, 2013, 2012 and 2011:
Restricted Share Awards:
| Equity Plan | RSP Plans & Director Stock Plan | |||||||||||||||
| Number of Restricted Common Shares |
Weighted-Average Issue Price |
Number of Restricted Common Shares |
Weighted-Average Issue Price |
|||||||||||||
| Awarded, January 1, 2011 |
— | $ | — | — | $ | — | ||||||||||
| Granted |
167,400 | 12.50 | 14,700 | 11.50 | ||||||||||||
|
|
|
|
|
|
|
|
|
|||||||||
| Awarded December 31, 2011 |
167,400 | 12.50 | 14,700 | 11.50 | ||||||||||||
| Granted |
93,683 | 10.65 | 30,634 | 10.45 | ||||||||||||
| Forfeited |
(1,174 | ) | 10.65 | (13,650 | ) | 11.54 | ||||||||||
|
|
|
|
|
|
|
|
|
|||||||||
| Awarded December 31, 2012 |
259,909 | 11.84 | 31,684 | 10.47 | ||||||||||||
| Granted |
932,527 | 13.82 | 20,768 | 14.58 | ||||||||||||
| Forfeited |
(1,085 | ) | 12.85 | (3,000 | ) | 12.99 | ||||||||||
|
|
|
|
|
|
|
|
|
|||||||||
| Awarded December 31, 2013 |
1,191,351 | $ | 13.39 | 49,452 | $ | 12.04 | ||||||||||
|
|
|
|
|
|
|
|
|
|||||||||
Unvested Restricted Share Awards:
| Equity Plan | RSP Plans & Director Stock Plan | |||||||||||||||
| Number of Restricted Common Shares |
Weighted-Average Issue Price |
Number of Restricted Common Shares |
Weighted-Average Issue Price |
|||||||||||||
| Unvested, January 1, 2011 |
— | $ | — | — | $ | — | ||||||||||
| Granted |
167,400 | 12.50 | 14,700 | 11.50 | ||||||||||||
| Vested |
(27,900 | ) | 12.50 | — | — | |||||||||||
|
|
|
|
|
|
|
|
|
|||||||||
| Unvested, December 31, 2011 |
139,500 | 12.50 | 14,700 | 11.50 | ||||||||||||
| Granted |
93,683 | 10.65 | 30,634 | 10.45 | ||||||||||||
| Vested |
(59,556 | ) | 12.38 | (2,370 | ) | 11.88 | ||||||||||
| Forfeited |
(1,174 | ) | 10.65 | (13,650 | ) | 11.54 | ||||||||||
|
|
|
|
|
|
|
|
|
|||||||||
| Unvested, December 31, 2012 |
172,453 | 11.55 | 29,314 | 10.35 | ||||||||||||
| Granted |
932,527 | 13.82 | 20,768 | 14.58 | ||||||||||||
| Vested |
(172,453 | ) | 11.55 | (28,207 | ) | 11.03 | ||||||||||
| Forfeited |
(1,085 | ) | 12.85 | (3,000 | ) | 12.99 | ||||||||||
|
|
|
|
|
|
|
|
|
|||||||||
| Unvested, December 31, 2013 |
931,442 | $ | 13.82 | 18,875 | $ | 13.52 | ||||||||||
|
|
|
|
|
|
|
|
|
|||||||||
For the years ended December 31, 2013, 2012 and 2011, compensation expense for restricted shares under the above plans was $8.0 million, $1.2 million and $0.2 million, respectively. In addition, the Company recognized $2.7 million as a distribution to the Former Manager, which is included in consideration to the Former Manager for internalization in the accompanying consolidated statements of changes in equity.
Multi-Year Outperformance Plan
Upon consummation of the ARCT III Merger, the Company entered into the 2013 Advisor Multi-Year Outperformance Agreement (the “OPP”) with the Former Manager, whereby the Former Manager was able to potentially earn compensation upon the attainment of stockholder value creation targets.
F-64
Table of Contents
AMERICAN REALTY CAPITAL PROPERTIES, INC.
NOTES TO CONSOLIDATED FINANCIAL STATEMENTS – (Continued)
December 31, 2013
Under the OPP, the Former Manager was granted 8,241,101 long term incentive plan units (“LTIP Units”) of the OP, which are earned or forfeited based on the Company’s total return to stockholders (including both share price appreciation and common stock distributions) (“Total Return”), for the three-year period consisting of:
| • | Absolute Component: 4% of any excess Total Return attained above an absolute hurdle of 7% for each annual measurement period, non-compounded, 14% for the interim measurement period and 21% for the full performance period; and |
| • | Relative Component: 4% of any excess Total Return attained above the Total Return for the performance period of a peer group comprised of the following companies: CapLease, Inc.; EPR Properties; Getty Realty Corporation; Lexington Realty Trust; National Retail Properties, Inc.; and Realty Income Corporation. |
The award will be funded (“OPP Pool”) up to a maximum award opportunity equal to 5% of our equity market capitalization at the ARCT III Merger date of $2.1 billion (the “OPP Cap”). Awards under the OPP are dependent on achieving an annual hurdle that commenced December 11, 2012, an interim (two-year) hurdle and then the aforementioned three-year hurdle ending on December 31, 2015.
In order to further ensure that the interests of the Former Manager are aligned with our investors, the Relative Component is subject to a ratable sliding scale factor as follows:
| • | 100% will be earned if we attain a median Total Return of at least 6% for each annual measurement period, non-compounded, at least 12% for the interim measurement period, and at least 18% for the full performance period; |
| • | 50% will be earned if we attain a median Total Return of at least 0% for each measurement period; |
| • | 0% will be earned if we attain a median Total Return of less than 0% for each measurement period; and |
| • | a percentage from 50% to 100% calculated by linear interpolation will be earned if the median Total Return is between 0% and the percentage set for each measurement period. |
For each year during the performance period a portion of the OPP Cap equal to a maximum of up to 1.25% of the Company’s equity market capitalization of $2.1 billion will be “locked-in” based upon the attainment of the performance hurdles set forth above for each annual measurement period. In addition, a portion of the OPP Cap equal to a maximum of up to 3% of the Company’s equity market capitalization will be “locked-in” based upon the attainment of the performance hurdles set forth above for the interim measurement period, which if achieved, will supersede and negate any prior “locked-in” portion based upon annual performance through the first and second valuation dates on December 31, 2013 and 2014, respectively (i.e., a maximum award opportunity equal to a maximum of up to 3% of the Company’s equity market capitalization may be “locked-in” through December 31, 2014). Since certain awards under the OPP are dependent on the comparison of the Company’s current market capitalization to the Company’s market capitalization at the inception of plan, the issuance of additional common shares by the Company may result in higher awards.
Following the performance period, the Absolute Component and the Relative Component will be calculated separately and then added together to determine the aggregate award earned under the OPP, which in no event may exceed the OPP Cap. The OPP Pool will be used to determine the number of LTIP Units that vest. Any unvested LTIP Units will be immediately forfeited on December 31, 2015. At December 31, 2013, 100% of the OPP Pool has been allocated.
Pursuant to previous authorization of the Company’s board of directors, as a result of the termination of the management agreement with the Former Manager, all 8,241,101 LTIP Units vested and were deemed earned upon the consummation of the Company’s transition to self-management on January 8, 2014 and were converted into OP Units on such date.
The Former Manager is entitled to receive a tax gross-up in the event that any amounts paid to it under the OPP constitute “parachute payments” as defined in Section 280G of the Code.
F-65
Table of Contents
AMERICAN REALTY CAPITAL PROPERTIES, INC.
NOTES TO CONSOLIDATED FINANCIAL STATEMENTS – (Continued)
December 31, 2013
During the year ended December 31, 2013, the Company recorded expenses of $92.3 million for the OPP, which is included in the general and administrative in the consolidated statements of operations and comprehensive loss. As of December 31, 2013, 2.3 million LTIP Units were earned and $32.7 million of the expense was locked-in and has been included in non-controlling interest on the consolidated balance sheets. The remaining $59.6 million expense has been accrued and is included in due to affiliates in the consolidated balance sheet as of December 31, 2013.
New Multi-Year Outperformance Plan
On October 3, 2013, the Company approved a multi-year outperformance plan (the “New OPP”), to be effective as of the Company’s transition to self-management, which occurred on January 8, 2014. Under the New OPP, individual agreements will be entered into between the Company and the participants selected by the Company’s board of directors (the “Participants”) that set forth the Participant’s participation percentage in the New OPP and the number of LTIP Units subject to the award (“OPP Agreements”). Under the OPP Agreements, the Participants will be eligible to earn performance-based bonus awards equal to the Participant’s participation percentage of a pool that will be funded up to a maximum award opportunity (the “New OPP Cap”) equal to approximately 5% of the Company’s equity market capitalization (“the Initial Market Cap”) on October 1, 2013. Subject to the New OPP Cap, the pool will equal an amount to be determined based on the Company’s achievement of total return to stockholders, including both share price appreciation and common stock distributions (“Total Return”), for a three-year performance period (the “Performance Period”); each 12-month period during the Performance Period (each an “Annual Period”) and the initial 24-month period of the Performance Period (the “Interim Period”), as follows:
| Performance Period |
Annual Period | Interim Period | ||||||||||
| Absolute Component: 4% of any excess Total Return attained above an absolute hurdle measured from the beginning of such period: |
21% | 7% | 14% | |||||||||
| Relative Component: 4% of any excess Total Return attained above the median Total Return for the performance period of the Peer Group (1), subject to a ratable sliding scale factor as follows based on achievement of cumulative Total Return measured from the beginning of such period: |
||||||||||||
| Ÿ |
100% will be earned if cumulative Total Return achieved is at least: | 18% | 6% | 12% | ||||||||
| Ÿ |
50% will be earned if a cumulative Total Return achieved is: | — % | — % | — % | ||||||||
| Ÿ |
0% will be earned if cumulative Total Return achieved is less than: | — % | — % | — % | ||||||||
| Ÿ |
a percentage from 50% to 100% calculated by linear interpolation will be earned if cumulative Total Return achieved is if between: | 0% - 18% | 0% - 6% | 0% - 12% | ||||||||
| (1) | The “Peer Group” is comprised of the following companies: EPR Properties; Getty Realty Corporation; Lexington Realty Trust; National Retail Properties, Inc.; Realty Income Corporation; and Spirit Realty Capital, Inc. |
The Participants will be entitled to receive a tax gross-up in the event that any amounts paid to the Participant under the OPP constitute “parachute payments” as defined in Section 280G of the Code. The LTIP Units granted under the New OPP represent units of equity ownership in the OP that are structured as a profits interest therein. Subject to the Participant’s continued service through each vesting date, 1/3 of any earned LTIP Units will vest on each of the third, fourth and fifth anniversaries of October 1, 2013. The Participant will be entitled to receive distributions on their LTIP Units to the extent provided for in the limited partnership agreement of the OP, as amended from time to time.
For the status of the New OPP, see Note 24 — Subsequent Events (As Restated).
Note 19 — Related Party Transactions and Arrangements (As Restated)
The Company, ARCT III and ARCT IV have incurred commissions, fees and expenses payable to the Former Manager and its affiliates including Realty Capital Securities, LLC (“RCS”), RCS Advisory Services, LLC (“RCS Advisory”), ARC, ARC Advisory Services, LLC (“ARC Advisory”), the ARCT III Advisor, the ARCT IV Advisor, American National Stock Transfer, LLC (“ANST”) and ARC Real Estate. References throughout this Note 19 — Related Party Transactions and Arrangements (As Restated) to expenses incurred by ARCT III or ARCT IV are to expenses incurred before their acquisitions by the Company on February 28, 2013 and January 3, 2014, respectively.
F-66
Table of Contents
AMERICAN REALTY CAPITAL PROPERTIES, INC.
NOTES TO CONSOLIDATED FINANCIAL STATEMENTS – (Continued)
December 31, 2013
The Audit Committee’s investigation identified certain payments made by the Company to the Former Manager and certain affiliates of the Former Manager that were not sufficiently documented or otherwise warrant scrutiny. As described below, the Company has recovered consideration valued at approximately $8.5 million in respect of certain such payments. The Company is considering whether it has a right to seek recovery for any other such payments and, if so, its alternatives for seeking recovery. No asset has been recognized in the financial statements related to any potential recovery.
The following table summarizes the related party fees and expenses incurred by the Company, ARCT III and ARCT IV by category and the aggregate amounts contained in such categories for the periods presented (in thousands):
| Year Ended December 31, | ||||||||||||
| 2013 | 2012 | 2011 | ||||||||||
| Related party transactions: |
||||||||||||
| Financing fees and reimbursements |
$ | 14,277 | $ | 3,350 | $ | 182 | ||||||
| Offering related costs |
161,796 | 211,391 | 18,218 | |||||||||
| Acquisition related expenses |
37,564 | 28,656 | 1,692 | |||||||||
| Merger and other non-routine transactions |
156,146 | — | — | |||||||||
| Management fees to affiliates |
17,462 | 212 | — | |||||||||
| General and administrative expenses |
103,206 | 826 | 168 | |||||||||
| Indirect affiliate expenses |
68 | — | — | |||||||||
|
|
|
|
|
|
|
|||||||
| Total |
$ | 490,519 | $ | 244,435 | $ | 20,260 | ||||||
|
|
|
|
|
|
|
|||||||
The following sections below further expand on the summarized related party transactions listed above.
Financing Fees and Reimbursements
The Company, ARCT III and ARCT IV paid the Former Manager, the ARCT III Advisor and the ARCT IV Advisor, respectively, a financing fee equal to 0.75% of the amount available under any secured mortgage financing or refinancing that the Company, ARCT III or ARCT IV obtained and used for the acquisition of properties that was arranged by the Former Manager, ARCT III Advisor or ARCT IV Advisor, respectively. The financing fee was payable in cash at the closing of each financing. In conjunction with the closing of the ARCT III Merger, it was agreed that these fees would no longer be paid by the Company to the Former Manager. These fees were paid by ARCT IV throughout 2013. Financing fees and reimbursements of $14.3 million, $3.4 million and $0.2 million as of December 31, 2013, 2012 and 2011, respectively, are included in deferred costs, net in the accompanying consolidated balance sheets.
Offering Related Costs
The Company, ARCT III and ARCT IV recorded commissions, fees and offering cost reimbursements as shown in the table below for services provided to the Company, ARCT III and ARCT IV, as applicable, by affiliates of the Former Manager during the periods indicated (in thousands):
| Year Ended December 31, | ||||||||||||
| 2013 | 2012 | 2011 | ||||||||||
| Offering related costs: |
| |||||||||||
| Commissions and fees |
$ | 148,232 | $ | 184,384 | $ | 13,835 | ||||||
| Offering costs and other reimbursements |
13,564 | 27,007 | 4,383 | |||||||||
|
|
|
|
|
|
|
|||||||
| Total |
$ | 161,796 | $ | 211,391 | $ | 18,218 | ||||||
|
|
|
|
|
|
|
|||||||
RCS served as the dealer manager of the ARCT III IPO and the ARCT IV IPO. RCS received fees and compensation in connection with the sale of ARCT III’s and ARCT IV’s common stock in the respective IPOs. RCS received a selling commission of 7% of gross offering proceeds before reallowance of commissions earned by participating broker-dealers in each of the IPOs. RCS received 3% of the gross proceeds from the sale of common stock, before reallowance to participating broker-dealers, as a dealer manager fee in each of the IPOs. In addition, ARCT III and ARCT IV reimbursed the ARCT III Advisor, the ARCT IV Advisor and RCS, as applicable, for services relating to the ARCT III IPO and the ARCT IV IPO. Offering related costs are included in offering costs, commissions and dealer manager fees in the accompanying consolidated statements of changes in equity.
F-67
Table of Contents
AMERICAN REALTY CAPITAL PROPERTIES, INC.
NOTES TO CONSOLIDATED FINANCIAL STATEMENTS – (Continued)
December 31, 2013
Acquisition Related Expenses
Separate from acquisition fees related to the acquisition of certain properties in the GE Capital Portfolio discussed below, the Company, ARCT III and ARCT IV paid acquisition fees to the Former Manager and its affiliates equal to 1.0% of the contract purchase price, inclusive of indebtedness, of each property acquired by the Company, ARCT III or ARCT IV, as applicable. The Company, ARCT III and ARCT IV additionally reimbursed certain expenses as permitted under the advisory agreements. These fees and reimbursements (as applicable), totaled $12.3 million, $28.7 million and $1.7 million during the years ended December 31, 2013, 2012 and 2011, respectively. The Company and ARCT III were no longer required to pay these fees as of the ARCT III Merger, except for those properties in the Company’s acquisition pipeline as of that date. ARCT IV incurred these fees throughout 2013 and 2012.
During the year ended December 31, 2013, the Company paid a fee of $1.9 million (equal to 0.25% of the contract purchase price) to RCS and reimbursed expenses of $6.1 million to the Former Manager and its affiliates related to its acquisition of certain properties in the GE Capital Portfolio.
During the year ended December 31, 2013, ARCT IV paid a fee of $3.5 million (equal to 0.25% of the contract purchase price) to RCS and also paid an acquisition fee of $13.8 million to the affiliates of the Former Manager related to its acquisition of certain properties in the GE Capital Portfolio.
Merger and Other Non-routine Transactions
The Company, ARCT III and ARCT IV incurred fees and expenses payable to the Former Manager and its affiliates for services related to mergers and other non-routine transactions, as discussed below. These fees are included in merger and other non-routine transactions in the accompanying consolidated statements of operations. The table below shows fees and expenses attributable to each merger and other non-routine transaction during the period indicated (in thousands):
| Year Ended December 31, 2013 | ||||||||||||||||||||||||
| ARCT III Merger |
ARCT IV Merger |
Cole Merger | CapLease Merger |
Other | Total | |||||||||||||||||||
| Merger related costs: |
||||||||||||||||||||||||
| Strategic advisory services |
$ | — | $ | 16,075 | $ | 14,215 | $ | 5,563 | $ | 243 | $ | 36,096 | ||||||||||||
| Legal fees and expenses |
126 | 500 | — | 3,000 | 40 | 3,666 | ||||||||||||||||||
| Personnel costs and other reimbursements |
522 | 2,137 | 169 | 567 | 178 | 3,573 | ||||||||||||||||||
| Other fees and expenses |
— | 640 | — | 250 | — | 890 | ||||||||||||||||||
| Other non-routine transactions: |
||||||||||||||||||||||||
| Subordinated distribution fee |
98,360 | — | — | — | — | 98,360 | ||||||||||||||||||
| Furniture, fixtures and equipment |
5,800 | — | — | — | — | 5,800 | ||||||||||||||||||
| Legal fees and expenses |
950 | — | — | — | — | 950 | ||||||||||||||||||
| Personnel costs and other reimbursements |
— | 1,107 | 1,463 | — | 109 | 2,679 | ||||||||||||||||||
| Post-transaction support services |
2,000 | 2,000 | — | — | — | 4,000 | ||||||||||||||||||
| Other fees and expenses |
— | — | — | 132 | — | 132 | ||||||||||||||||||
|
|
|
|
|
|
|
|
|
|
|
|
|
|||||||||||||
| Total |
$ | 107,758 | $ | 22,459 | $ | 15,847 | $ | 9,512 | $ | 570 | $ | 156,146 | ||||||||||||
|
|
|
|
|
|
|
|
|
|
|
|
|
|||||||||||||
No expenses payable to affiliates of the Former Manager relating to mergers or other non-routine transactions were incurred during the years ended December 31, 2012 and 2011.
F-68
Table of Contents
AMERICAN REALTY CAPITAL PROPERTIES, INC.
NOTES TO CONSOLIDATED FINANCIAL STATEMENTS – (Continued)
December 31, 2013
Merger Costs
Unless otherwise indicated, all of the fees and reimbursements discussed below were incurred and recognized during the year ended December 31, 2013.
ARCT III Merger
The Company and ARCT III incurred and paid $0.3 million to ARC Advisory and $0.4 million to RCS Advisory for expense reimbursements in connection with the ARCT III Merger.
ARCT IV Merger
The Company entered into an agreement with RCS under which RCS agreed to provide strategic and financial advisory services to the Company in connection with the ARCT IV Merger. The Company paid $7.7 million (equal to 0.25% of the transaction value) upon the consummation of the ARCT IV Merger and reimbursed out of pocket expenses of $0.6 million pursuant to this agreement.
The Company entered into an agreement with RCS, RCS Advisory and ANST under which they agreed to provide financial advisory and information agent services in connection with the ARCT IV Merger and the related proxy solicitation seeking approval from the Company’s stockholders in connection with such merger. The agreement provided that these services included facilitation of the preparation, distribution and accumulation of proxy materials, stockholder, analyst and financial advisor communications and consultation on materials and communications made to the public and regulatory agencies regarding the ARCT IV Merger. However, effective October 6, 2013 pursuant to the first amendment to the ARCT IV Merger Agreement, a vote by they Company’s stockholders was no longer required. The Company paid $0.6 million in fees pursuant to this agreement.
ARCT IV entered into an agreement with RCS under which RCS agreed to provide strategic and financial advisory services to assist ARCT IV with its alternatives for a potential liquidity event. ARCT IV paid $7.7 million (equal to 0.25% of the transaction value) upon the consummation of the ARCT IV Merger and reimbursed out of pocket expenses of $0.8 million.
ARCT IV entered into an agreement with ARC Advisory and RCS Advisory under which they agreed to provide legal support services up to the date that ARCT IV entered into the ARCT IV Merger Agreement. ARCT IV paid $0.5 million in fees pursuant to this agreement.
ARCT IV entered into an agreement with RCS, RCS Advisory, and ANST under which they agreed to provide advisory and information agent services in connection with the ARCT IV Merger and the related proxy solicitation seeking approval of such merger by ARCT IV’s stockholders. The agreement provided that these services included facilitation of the preparation, distribution and accumulation of proxy materials, stockholder, analyst and financial advisor communications and consultation on materials and communications made to the public and regulatory agencies regarding the ARCT IV Merger. ARCT IV paid $0.8 million in fees and reimbursed $0.2 million of expenses pursuant to this agreement.
The Company and ARCT IV incurred and paid $0.5 million to RCS Advisory for expense reimbursements in connection with the ARCT IV Merger.
Pursuant to ARCT IV’s advisory agreement with the ARCT IV Advisor, ARCT IV agreed to pay the ARCT IV Advisor a brokerage commission on the sale of property in connection with the ARCT IV Merger. No fees were incurred under this agreement during the year ended December 31, 2013. The Company incurred and paid $8.4 million as a brokerage commission, pursuant to the advisory agreement, in 2014.
F-69
Table of Contents
AMERICAN REALTY CAPITAL PROPERTIES, INC.
NOTES TO CONSOLIDATED FINANCIAL STATEMENTS – (Continued)
December 31, 2013
Cole Merger
The Company entered into an agreement with RCS under which RCS agreed to provide strategic and financial advisory services to the Company in connection with the Cole Merger. The Company paid a fee equal to 0.25% of the transaction value and reimbursed out of pocket expenses. The Company incurred and recognized $14.2 million in expense from this agreement in 2013. The amount recognized in 2013 constitutes one-half of the total fee of $28.4 million which was paid in 2014. The Company incurred and paid an additional $0.2 million to ARC Advisory for expense reimbursements in connection with the Cole Merger.
CapLease Merger
The Company entered into an agreement with RCS under which RCS agreed to provide strategic and financial advisory services to the Company in connection with the CapLease Merger. The Company paid a fee equal to 0.25% of the transaction value and reimbursed out of pocket expenses. The Company incurred and paid $5.6 million in fees pursuant to this agreement. The Company incurred and paid an additional $0.2 million to ARC Advisory and $3.6 million to RCS Advisory for expense reimbursements in connection with the CapLease Merger.
F-70
Table of Contents
AMERICAN REALTY CAPITAL PROPERTIES, INC.
NOTES TO CONSOLIDATED FINANCIAL STATEMENTS – (Continued)
December 31, 2013
Other Non-routine Transactions
ARCT III Merger Subordinated Distribution Fee
On February 28, 2013, the OP entered into a Contribution and Exchange Agreement (the “Contribution and Exchange Agreement”) with the ARCT III OP and the ARCT III Special Limited Partner, the holder of the special limited partner interest in the ARCT III OP. The ARCT III Special Limited Partner was entitled to receive certain distributions from the ARCT III OP, including a subordinated distribution of net sales proceeds resulting from an “investment liquidity event” (as defined in the agreement of limited partnership of the ARCT III OP). The ARCT III Merger constituted an “investment liquidity event,” due to the attainment of the 6.0% performance hurdle and the return to ARCT III’s stockholders in addition to their initial investment. Pursuant to the Contribution and Exchange Agreement, the ARCT III Special Limited Partner contributed its interest in the ARCT III OP, inclusive of the $98.4 million subordinated distribution proceeds received, to the ARCT III OP in exchange for 7.6 million ARCT III OP Units. Upon consummation of the ARCT III Merger, these ARCT III OP Units were immediately converted into 7.3 million OP Units after application of the ARCT III Exchange Ratio. The Company recorded an expense of $98.4 million in connection with this transaction. In conjunction with the ARCT III Merger Agreement, the ARCT III Special Limited Partner agreed to hold its OP Units for a minimum of one year before converting them into shares of Company common stock.
Furniture, Fixtures and Equipment and Other Assets
The Company entered into three agreements with affiliates of the Former Manager and the Former Manager (the “Sellers”), as applicable, pursuant to which, concurrently with the closing of the ARCT III Merger and ARCT IV Merger and the Company’s transition to self-management, the Sellers agreed to sell to the OP certain FF&E and other assets used by the Sellers in connection with managing the property level business and operations and accounting functions of the Company and the OP. During the year ended December 31, 2013, the Company expensed $5.8 million of costs associated with the acquisition of FF&E and other assets. In the first quarter of 2014, the Company expensed an additional $15.8 million of costs associated with the acquisition of FF&E and other assets.
Legal Fees and Expenses
On December 12, 2012, ARCT III and the OP entered into a legal services reimbursement agreement with ARC Advisory to provide legal support services through the date of the ARCT III Merger. ARCT III incurred expenses of $0.5 million in connection with this agreement in 2013. Additional expenses of $0.5 million were paid to ARC Advisory during 2013 as reimbursement for litigation services.
Post-Transaction Support Services
ARCT III entered into an agreement with ARC Advisory under which ARC Advisory agreed to provide support services including legal, accounting, marketing, human resources and information technology, among other services, until the earlier of the ARCT III Merger closing date or one year (and an agreed upon period of up to 60 days following the ARCT III Merger). ARCT III incurred $2.0 million in fees pursuant to this agreement.
ARCT IV entered into an agreement with ARC Advisory and RCS Advisory under which they agreed to provide support services including legal, accounting, marketing, human resources and information technology, among other services, until the earlier of the ARCT IV Merger closing date or one year (and an agreed upon period of up to 60 days following the ARCT IV Merger). ARCT IV incurred $2.0 million in expenses pursuant to this agreement.
Personnel Costs and Other Reimbursements
The Company, ARCT III and ARCT IV incurred expenses of and paid, $2.5 million to RCS Advisory and $0.2 million to ANST for personnel costs and reimbursements in connection with non-recurring transactions.
Management Fees to Affiliates
The Company, ARCT III and ARCT IV recorded fees and reimbursements as shown in the table below for services provided by the Former Manager and its affiliates related to the operations of the Company, ARCT III and ARCT IV during the periods indicated (in thousands):
| Year Ended December 31, | ||||||||||||
| 2013 | 2012 | 2011 | ||||||||||
| Management fees to affiliates: |
||||||||||||
| Base management fees |
$ | 4,969 | $ | 212 | $ | — | ||||||
| Asset management fees |
11,693 | — | — | |||||||||
| Property management fees |
800 | — | — | |||||||||
|
|
|
|
|
|
|
|||||||
| Total |
$ | 17,462 | $ | 212 | $ | — | ||||||
|
|
|
|
|
|
|
|||||||
F-71
Table of Contents
AMERICAN REALTY CAPITAL PROPERTIES, INC.
NOTES TO CONSOLIDATED FINANCIAL STATEMENTS – (Continued)
December 31, 2013
Base Management Fees
Prior to the termination of the amended and restated management agreement, the Company paid the Former Manager an annual base management fee equal to 0.50% per annum of the average unadjusted book value of the Company’s real estate assets, calculated and payable monthly in advance, for the value of assets up to $3.0 billion and 0.40% per annum for the unadjusted book value of assets over $3.0 billion. The management fee was generally payable in cash however in lieu of cash, on January 21, 2014, the Former Manager agreed to settle all outstanding balances in stock, resulting in the Company issuing 388,461 shares of common stock to the Former Manager. Prior to the ARCT III Merger, the Former Manager was entitled to an annual base management fee equal to 0.50% per annum for the unadjusted book value of assets with no asset threshold limitations. The Company incurred expenses of $5.0 million and $0.2 million that were not waived during the years ended December 31, 2013 and 2012, respectively. The Former Manager waived the portion of its management fee in excess of certain net income thresholds related to the Company’s operations during certain periods in 2013, 2012 and 2011. These waived fees totaled $6.1 million, $1.8 million and $0.3 million during the years ended December 31, 2013, 2012 and 2011, respectively.
Asset Management Fees
ARCT III
Until July 1, 2012, the ARCT III Advisor was entitled to an asset management fee of 0.75% per annum from ARCT III equal to the cost of its assets (cost includes the purchase price, acquisition expenses, capital expenditures and other customarily capitalized costs, but excludes acquisition fees) plus costs and expenses incurred by the ARCT III Advisor in providing asset management services. However, the asset management fee was to be reduced by any amounts payable to ARCT III’s property manager as an oversight fee, such that the aggregate of the asset management fee and the oversight fee did not exceed 0.75% per annum of the cost of ARCT III’s assets plus costs and expenses incurred by the ARCT III Advisor in providing asset management services. Prior to July 1, 2012, this fee was payable in monthly installments at the discretion of ARCT III’s board of directors in cash, common stock or restricted stock grants, or any combination thereof. Asset management fees for the year ended December 31, 2013 are included in management fees to affiliates in the accompanying consolidated statements of operations and comprehensive loss for the year ended December 31, 2013. These asset management fees for the years ended December 31, 2012 and 2011 were waived.
Effective July 1, 2012, the payment of asset management fees in monthly installments in cash, shares or restricted stock grants, or any combination thereof to the ARCT III Advisor was eliminated. Instead, ARCT III issued (subject to periodic approval by its board of directors) to the ARCT III Advisor performance-based restricted partnership units of the ARCT III OP designated as “ARCT III Class B units,” which were intended to be profits interests and to vest, and no longer be subject to forfeiture, at such time as: (x) the value of the ARCT III OP’s assets plus all distributions equaled or exceeded the total amount of capital contributed by investors plus a 6.0% cumulative, pre-tax, non-compounded annual return thereon (the “economic hurdle”); and (y) a liquidity event had occurred.
The ARCT III Advisor received distributions on unvested ARCT III Class B units equal to the distribution rate received on ARCT III common stock. These distributions were included in management fees to affiliates in the accompanying consolidated statements of operations and comprehensive loss until the performance condition was considered probable to occur. In 2012, the ARCT III board of directors approved the issuance of 145,022 ARCT III Class B units to the ARCT III Advisor for asset management services it provided. In 2013, the ARCT III board of directors approved issuance of an additional 603,599 ARCT III Class B units to the ARCT III Advisor for asset management services it provided. As of December 31, 2012, ARCT III did
F-72
Table of Contents
AMERICAN REALTY CAPITAL PROPERTIES, INC.
NOTES TO CONSOLIDATED FINANCIAL STATEMENTS – (Continued)
December 31, 2013
not consider achievement of the performance condition to be probable as the shareholder vote for the ARCT III Merger, which would allow vesting of these ARCT III Class B Units, was not completed. The performance condition related to these ARCT III Class B units was satisfied upon the completion of the ARCT III Merger and as a result a $9.4 million expense was recorded at that time. The 748,621 total ARCT III Class B units then converted into ARCT III OP Units which converted on a one-to-one basis into 711,190 OP Units after the application of the ARCT III Exchange Ratio.
In connection with a 60-day extension of the advisory agreement which was executed in order to facilitate the smooth transition of advisory services following the consummation of the ARCT III Merger, the Company incurred and paid additional asset management fees of $2.3 million during 2013.
ARCT IV
In connection with the asset management services provided by the ARCT IV Advisor, ARCT IV issued (subject to periodic approval by the ARCT IV board of directors) to the ARCT IV Advisor performance-based restricted partnership units of the ARCT IV OP designated as “ARCT IV Class B Units,” which were intended to be profits interests and to vest, and no longer be subject to forfeiture, at such time as: (x) the value of the ARCT IV OP’s assets plus all distributions that equaled or exceeded the total amount of capital contributed by investors plus a 6.0% cumulative, pre-tax, non-compounded annual return thereon (the “economic hurdle”); (y) any one of the following occurs: (1) the termination of the advisory agreement by an affirmative vote of a majority of ARCT IV’s independent directors without cause; (2) a listing; or (3) another liquidity event; and (z) the ARCT IV Advisor was still providing advisory services to ARCT IV.
The calculation of the ARCT IV asset management fees was equal to: (i) 0.1875% of the cost of ARCT IV’s assets; divided by (ii) the value of one share of ARCT IV common stock as of the last day of such calendar quarter. When approved by the ARCT IV board of directors, the ARCT IV Class B Units were issued to the ARCT IV Advisor quarterly in arrears pursuant to the terms of the ARCT IV OP agreement. During the year ended December 31, 2013, the ARCT IV board of directors approved the issuance of 492,483 ARCT IV Class B Units to the ARCT IV Advisor in connection with this arrangement. As of December 31, 2013, ARCT IV did not consider achievement of the performance condition to be probable and no expense was recorded at that time. The ARCT IV Advisor received distributions on unvested ARCT IV Class B Units equal to the distribution rate received on the ARCT IV common stock. The performance condition related to the 498,857 ARCT IV Class B Units, which includes units issued for the period of January 1, 2014 through the ARCT IV Merger Date, was satisfied upon the completion of the ARCT IV Merger. These ARCT IV Class B Units immediately converted into OP Units at the 2.3961 exchange ratio and the Company recorded an expense of $13.9 million based on the fair value of the ARCT IV Class B Units during 2014.
Property Management Fees
ARCT III also had agreed to pay an affiliate of ARC, unless it contracted with a third party, a property management fee of up to 2% of gross revenues from ARCT III’s stand-alone single-tenant net leased properties and 4% of gross revenues from its multi-tenant properties, plus, in each case, market-based leasing commissions applicable to the geographic location of the property. ARCT III also reimbursed the affiliate for property level expenses. If ARCT III contracted directly with third parties for such services, it paid them customary market fees and paid the affiliated property manager an oversight fee of up to 1% of the gross revenues of the property managed. The fees totaled $0.8 million during 2013.
Quarterly Incentive Fee
Prior to the termination of the amended and restated management agreement upon the transition to self-management, the Company was required to pay the Former Manager a quarterly incentive fee, calculated based on 20% of the excess of Company annualized core earnings (as defined in the management agreement with the Former Manager) over the weighted-average number of shares multiplied by the weighted-average price per share of common stock. One half of each quarterly installment of the incentive fee was payable in shares of common stock. The remainder of the incentive fee was payable in cash. No such incentive fees were incurred or paid to the Former Manager from inception through termination of the management agreement.
F-73
Table of Contents
AMERICAN REALTY CAPITAL PROPERTIES, INC.
NOTES TO CONSOLIDATED FINANCIAL STATEMENTS – (Continued)
December 31, 2013
General and Administrative Expenses
The Company, ARCT III and ARCT IV recorded general and administrative expenses as shown in the table below for services provided by the Former Manager and its affiliates related tot the operations of the Company during the periods indicated (in thousands):
| Year Ended December 31, | ||||||||||||
| 2013 | 2012 | 2011 | ||||||||||
| General and administrative expenses: |
||||||||||||
| Advisory fees and reimbursements |
$ | 5,602 | $ | 826 | $ | 168 | ||||||
| Equity awards |
97,604 | — | — | |||||||||
|
|
|
|
|
|
|
|||||||
| Total |
$ | 103,206 | $ | 826 | $ | 168 | ||||||
|
|
|
|
|
|
|
|||||||
Advisory Fees and Reimbursements
The Company, ARCT III and ARCT IV agreed to reimburse the Former Manager and its affiliates, as applicable, for their out-of-pocket costs incurred by those entities, including without limitation, legal fees and expenses, transfer agent fees, due diligence fees and expenses, other third party fees and expenses, costs of appraisals, travel expenses, nonrefundable option payments and deposits on properties not acquired, accounting fees and expenses, title insurance premiums and other closing costs, personnel costs and miscellaneous expenses relating to the selection, acquisition and due diligence of properties or general operation of the company.
Equity Awards
Upon consummation of the ARCT III Merger, the Company entered into the OPP with the Former Manager. The OPP gave the Former Manager the opportunity to earn compensation upon the attainment of certain stockholder value-creation targets. Pursuant to previous authorization of the Company’s board of directors, as a result of the termination of the management agreement with the Former Manager, all LTIP Units awarded under the OPP were deemed earned and vested upon the consummation of the Company’s transition to self-management on January 8, 2014 and were converted into OP Units on such date. The Company recorded an expense of $32.7 million for the valuation of the award through December 31, 2013 and an additional expense of $59.6 million due to the accelerated vesting of the OPP. This accelerated vesting was recorded in 2013 as the Company determined that the required service had been effectively complete as of December 31, 2013. See Note 18 – Equity-based Compensation (As Restated) for a more detailed description of this plan. This total expense of $92.3 million is included in general and administrative expenses in the accompanying consolidated statements of operations.
The Company granted 620,000 and 93,683 restricted share awards to employees of affiliates of the Former Manager during the years ended December 31, 2013 and 2012, respectively. These were three separate grants and the grant date fair values for these issuances were $1.0 million in June 2012, $4.5 million in February 2013 and $4.4 million in July 2013.
Separately, as a result of the ARCT III Merger and the termination of the Management Agreement with the Former Manager, certain restricted shares held by employees of affiliates of the Former Manager were fully vested. This aggregate expense of $5.3 million is included in general and administrative expense in the accompanying consolidated statements of operations.
Indirect Affiliate Expenses
During the year ended December 31, 2013, a wholly owned subsidiary of ARC Real Estate purchased a historic building in Newport, Rhode Island (“Audrain”) with plans to renovate the second floor to serve as offices for certain executives of the Company and affiliates of the Former Manager. ARC Real Estate requested that invoices relating to the second floor renovation and tenant improvements and all building operating expenses either be reimbursed by the Company to the affiliate of the Former Manager or be paid directly to the contractors and vendors. During the year ended December 31, 2013, the Company paid $27,000 for architectural costs relating to the renovation directly to a third party. Tenant improvement, furniture and operating expenses incurred during 2014 in respect of Audrain totaled $8.8 million.
F-74
Table of Contents
AMERICAN REALTY CAPITAL PROPERTIES, INC.
NOTES TO CONSOLIDATED FINANCIAL STATEMENTS – (Continued)
December 31, 2013
In addition in 2013, the Company entered into a lease agreement with the subsidiary of ARC Real Estate for a term of 15 years with base rent of $0.4 million due annually beginning October 2013. As there were tenants occupying the building when it was purchased, these tenants subleased their premises from the Company until their leases terminated. During the year ended December 31, 2013, the Company incurred and paid $96,000 for base rent, which was partially offset by $55,000 of rental revenue received from the subtenants. Net rent expense incurred during 2014 totaled $0.2 million.
In November 2014, as a result of findings of the investigation conducted by the Audit Committee, the Company terminated the lease agreement and was reimbursed for the tenant improvement and furniture costs incurred by the Company totaling approximately $8.5 million, including the architectural costs of $27,000 incurred by the Company in 2013. Reimbursement was made by delivery and retirement of 916,423 OP Units held by an affiliate of the Former Manager. The Company never moved into or occupied the building.
Additional Related Party Transactions
The following related party transactions were not included in the tables above.
Tax Protection Agreement
The Company is party to a tax protection agreement with ARC Real Estate, which contributed its 100% indirect ownership interests in 63 of the Company’s properties to the Operating Partnership in the formation transactions related to the Company’s IPO. Pursuant to the tax protection agreement, the Company has agreed to indemnify ARC Real Estate for its tax liabilities (plus an additional amount equal to the taxes incurred as a result of such indemnity payment) attributable to its built-in gain, as of the closing of the formation transactions, with respect to its interests in the contributed properties (other than two vacant properties contributed), if the Company sells, conveys, transfers or otherwise disposes of all or any portion of these interests in a taxable transaction on or prior to September 6, 2021. The tax protection agreement provides that the sole and exclusive rights and remedies of ARC Real Estate under the tax protection agreement will be a claim against the Operating Partnership for ARC Real Estate’s tax liabilities as calculated in the tax protection agreement, and ARC Real Estate shall not be entitled to pursue a claim for specific performance or bring a claim against any person that acquires a protected party from the Operating Partnership in violation of the tax protection agreement.
Investment from the ARCT III Special Limited Partner
In connection with the ARCT III Merger, the ARCT III Special Limited Partner invested $0.8 million in the ARCT III OP and was subsequently issued 56,797 OP Units in respect thereof upon the closing of the ARCT III Merger after giving effect to the ARCT III Exchange Ratio. This investment is included in non-controlling interests in the accompanying consolidated balance sheets.
Investment in an Affiliate of the Former Manager
During the year ended December 31, 2013, the Company invested $10.0 million in a real estate fund advised by an affiliate of the Former Manager, American Real Estate Income Fund, which invests primarily in equity securities of other publicly traded REITs, and subsequently reinvested dividends totaling $0.1 million in the fund. During the fourth quarter of 2013, the Company sold a portion of such investments with an original cost of $8.5 million at a loss of $0.4 million. The fair value of the investment at December 31, 2013 was $1.5 million.
Ownership by Affiliates of the Former Manager
Certain affiliates of the Former Manager own shares of the Company’s common stock, shares of unvested restricted common stock, OP Units and LTIP Units. As of December 31, 2013 and 2012, 4.37% and 1.35%, respectively, of the total equity units issued by the Company and the OP were owned by affiliates.
F-75
Table of Contents
AMERICAN REALTY CAPITAL PROPERTIES, INC.
NOTES TO CONSOLIDATED FINANCIAL STATEMENTS – (Continued)
December 31, 2013
Due to Affiliates
Due to affiliates, as reported in the accompanying consolidated balance sheets, is comprised of the following amounts discussed above (in thousands):
| December 31, | ||||||||
| 2013 | 2012 | |||||||
| Due to affiliates: |
||||||||
| Offering related costs |
$ | 220 | $ | 100 | ||||
| Merger and other non-routine transactions |
38,645 | 1,046 | ||||||
| Management fees to affiliates |
4,969 | — | ||||||
| General and administrative |
59,600 | 376 | ||||||
|
|
|
|
|
|||||
| Total |
$ | 103,434 | $ | 1,522 | ||||
|
|
|
|
|
|||||
See Note 24 — Subsequent Events (As Restated) for significant subsequent events.
Note 20 — Economic Dependency
Prior to transitioning to self-management on January 8, 2014, the Company engaged, under various agreements, its Former Manager and its affiliates to provide certain services that are essential to the Company, including asset management services and supervision of the management and leasing of properties owned by the Company, the sale of shares of the Company’s common stock, as well as other administrative responsibilities for the Company including information technology, legal services and investor relations. See Note 24 — Subsequent Events (As Restated) for additional information on the Company’s transition to self-management.
As a result of these relationships, the Company was dependent upon its Former Manager, the Sponsor and their affiliates. In the event that these companies were unable to provide the Company with the respective services, the Company would have been required to find alternative providers of these services. As a result of the ARCT III Merger, the Company internalized certain accounting and property acquisition services previously performed by its Former Manager and its affiliates. The Company may from time to time engage its Former Manager for legal, information technology or other support services for which it will pay a fee.
Note 21 — Net Loss Per Share (As Restated)
The following is a summary of the basic and diluted net loss per share computation for the years ended December 31, 2013, 2012 and 2011 (amounts in thousands, expect for shares and per share data):
| Year Ended December 31, | ||||||||||||
| 2013 | 2012 | 2011 | ||||||||||
| (As Restated) | (As Restated) |
|
||||||||||
| Net loss from continuing operations attributable to stockholders |
$ | (491,466 | ) | $ | (40,961 | ) | $ | (3,883 | ) | |||
| Net income (loss) from discontinued operations attributable to common stockholders |
(33 | ) | (691 | ) | (816 | ) | ||||||
|
|
|
|
|
|
|
|||||||
| Net loss attributable to common stockholders |
(491,499 | ) | (41,652 | ) | (4,699 | ) | ||||||
| Less: dividends declared on preferred shares and RSUs |
(3,631 | ) | (368 | ) | — | |||||||
|
|
|
|
|
|
|
|||||||
| Net loss attributable to common stockholders, net of dividends on preferred securities and RSUS |
$ | (495,130 | ) | $ | (42,020 | ) | $ | (4,699 | ) | |||
|
|
|
|
|
|
|
|||||||
| Weighted average common shares outstanding (1) |
205,341,431 | 103,306,366 | 3,720,351 | |||||||||
|
|
|
|
|
|
|
|||||||
| Basic and diluted net loss per share from attributable to common stockholders |
$ | (2.41 | ) | $ | (0.40 | ) | $ | (1.04 | ) | |||
|
|
|
|
|
|
|
|||||||
| Basic and diluted net loss per share from discontinued operations attributable to common stockholders |
(0.00 | ) | $ | (0.01 | ) | $ | (0.22 | ) | ||||
|
|
|
|
|
|
|
|||||||
| Basic and diluted net loss per share attributable to common stockholders |
$ | (2.41 | ) | $ | (0.41 | ) | $ | (1.26 | ) | |||
|
|
|
|
|
|
|
|||||||
| (1) | Weighted-average shares for the year ended December 31, 2013 are adjusted as if the acquisition of all outstanding shares of ARCT III common stock for cash in conjunction with the ARCT III Merger had been completed at inception. |
For the year ended December 31, 2013, the Company excluded 9,591,173 OP Units outstanding, which are convertible to an equal number of shares of the Company’s common stock, all LTIP Units,
F-76
Table of Contents
AMERICAN REALTY CAPITAL PROPERTIES, INC.
NOTES TO CONSOLIDATED FINANCIAL STATEMENTS – (Continued)
December 31, 2013
950,317 shares of unvested restricted stock outstanding and 21,735,008 shares of the Company’s Series D Convertible Preferred Stock outstanding as of December 31, 2013 from the calculation of diluted net loss per share as the effect would have been antidilutive.
Note 22 — Discontinued Operations and Properties Held for Sale
The Company separately classifies properties held for sale in the accompanying consolidated balance sheets and operating results for those properties as discontinued operations in the accompanying consolidated statements of operations and comprehensive loss. In the normal course of business, changes in the market or changes in credit risk of certain tenants, among other factors, may compel the Company to decide to classify a property as held for sale or reclassify a property that is designated as held for sale back to held for investment. In these situations, the property is transferred to held for sale or back to held for investment at the lesser of fair value or depreciated cost. As of both December 31, 2013 and 2012, the Company held one property as held for sale on the accompanying respective consolidated balance sheets.
On March 5, 2013, the Company executed a purchase and sale agreement to sell a Citizens Bank branch in Worth, IL classified as held for sale as of December 31, 2013. The sale price of the asset is $0.7 million in cash, which approximates the carrying value of the property.
Note 23 — Quarterly Results (Unaudited) (As Restated)
Presented below is a summary of the unaudited quarterly financial information for the year ended December 31, 2013 (in thousands, except share and per share amounts). See Note 2 — Restatement of Previously Issued Financial Statements in the Company’s Quarterly Reports on Forms 10-Q/A for the fiscal periods ended March 31, 2014 and June 30, 2014, respectively, and Form 10Q for the fiscal period ended September 30, 2014, for further discussion on the Quarterly Results as restated.
| Quarters Ended(1) | ||||||||||||||||
| March 31, 2013 |
June 30, 2013 |
September 30, 2013 |
December 31, 2013 |
|||||||||||||
| (As Restated) | (As Restated) | (As Restated) | (As Restated) | |||||||||||||
| Revenues |
$ | 42,897 | $ | 54,945 | $ | 95,255 | $ | 136,226 | ||||||||
| Net loss from continuing operations attributable to stockholders |
(143,864 | ) | (69,603 | ) | (80,170 | ) | (197,829 | ) | ||||||||
| Net loss from discontinued operations attributable to stockholders |
(16 | ) | — | (31 | ) | 14 | ||||||||||
|
|
|
|
|
|
|
|
|
|||||||||
| Net loss attributable to Stockholders |
(143,880 | ) | (69,603 | ) | (80,201 | ) | (197,815 | ) | ||||||||
|
|
|
|
|
|
|
|
|
|||||||||
| Less: dividends declared on preferred shares and RSUs |
(193 | ) | (233 | ) | (199 | ) | (3,006 | ) | ||||||||
|
|
|
|
|
|
|
|
|
|||||||||
| Net loss attributable to the common stockholders |
$ | (144,073 | ) | $ | (69,836 | ) | $ | (80,400 | ) | $ | (200,821 | ) | ||||
|
|
|
|
|
|
|
|
|
|||||||||
| Weighted-average shares outstanding |
167,847,516 | 198,956,355 | 221,707,920 | 231,969,433 | ||||||||||||
|
|
|
|
|
|
|
|
|
|||||||||
| Basic and diluted loss per share from continuing operations attributable to common stockholders (2) |
$ | (0.86 | ) | $ | (0.35 | ) | $ | (0.36 | ) | $ | (0.87 | ) | ||||
|
|
|
|
|
|
|
|
|
|||||||||
| Basic and diluted loss per share from discontinued operations attributable to common stockholders |
$ | — | $ | — | $ | — | $ | — | ||||||||
|
|
|
|
|
|
|
|
|
|||||||||
| Basic and diluted net loss per share attributable to common stockholders |
$ | (0.86 | ) | $ | (0.35 | ) | $ | (0.36 | ) | $ | (0.87 | ) | ||||
|
|
|
|
|
|
|
|
|
|||||||||
| (1) | The historical financial statements have been adjusted for discontinued operations and figures have been recast in applying the carryover basis of accounting to include the effects of the merger with ARCT IV. |
| (2) | For the year ended December 31, 2013, the total quarterly basic and diluted earnings per share were $0.03 lower than the annual basic and diluted earnings per share due to the effects of rounding. |
F-77
Table of Contents
AMERICAN REALTY CAPITAL PROPERTIES, INC.
NOTES TO CONSOLIDATED FINANCIAL STATEMENTS – (Continued)
December 31, 2013
The following tables present the combined impact of all changes to the applicable line items in the consolidated financial statements to the Company’s previously reported consolidated financial statements for each of the fiscal quarters in the year ended December 31, 2013, as disclosed in Note 2— Restatement of Previously Issued Financial Statements (in thousands, except share amounts):
| Three Months Ended March 31, 2013 | Three Months Ended June 30, 2013 | |||||||||||||||||||||||
| As Previously Reported (1) |
Restatement Adjustments (2) |
As Restated | As Previously Reported (1) |
Restatement Adjustments (2) |
As Restated | |||||||||||||||||||
| Revenues |
$ | 42,897 | $ | — | $ | 42,897 | $ | 54,945 | $ | 0 | $ | 54,945 | ||||||||||||
| Net loss from continuing operations attributable to stockholders |
(141,161 | ) | (2,703 | ) | (143,864 | ) | (71,992 | ) | 2,389 | (69,603 | ) | |||||||||||||
| Net loss from discontinued operations attributable to stockholders |
(2 | ) | (14 | ) | (16 | ) | 34 | (34 | ) | — | ||||||||||||||
|
|
|
|
|
|
|
|
|
|
|
|
|
|||||||||||||
| Net loss attributable to Stockholders |
(141,163 | ) | (2,717 | ) | (143,880 | ) | (71,958 | ) | 2,355 | (69,604 | ) | |||||||||||||
|
|
|
|
|
|
|
|
|
|
|
|
|
|||||||||||||
| Less: dividends declared on preferred shares and RSUs |
(193 | ) | — | (193 | ) | (233 | ) | — | (233 | ) | ||||||||||||||
|
|
|
|
|
|
|
|
|
|
|
|
|
|||||||||||||
| Net loss attributable to the common stockholders |
$ | (141,356 | ) | $ | (2,717 | ) | $ | (144,073 | ) | $ | (72,191 | ) | $ | 2,355 | $ | (69,836 | ) | |||||||
|
|
|
|
|
|
|
|
|
|
|
|
|
|||||||||||||
| Weighted-average shares outstanding |
167,847,516 | — | 167,847,516 | 198,956,355 | — | 198,956,355 | ||||||||||||||||||
|
|
|
|
|
|
|
|
|
|
|
|
|
|||||||||||||
| Basic and diluted loss per share from continuing operations attributable to common stockholders |
$ | (0.84 | ) | $ | (0.02 | ) | $ | (0.86 | ) | $ | (0.36 | ) | $ | 0.01 | $ | (0.35 | ) | |||||||
|
|
|
|
|
|
|
|
|
|
|
|
|
|||||||||||||
| Basic and diluted loss per share from discontinued operations attributable to common stockholders |
$ | — | $ | — | $ | — | $ | — | $ | — | $ | — | ||||||||||||
|
|
|
|
|
|
|
|
|
|
|
|
|
|||||||||||||
| Basic and diluted net loss per share attributable to common stockholders |
$ | (0.84 | ) | $ | (0.02 | ) | $ | (0.86 | ) | $ | (0.36 | ) | $ | 0.01 | $ | (0.35 | ) | |||||||
|
|
|
|
|
|
|
|
|
|
|
|
|
|||||||||||||
| (1) | These financial figures have been recast in applying the carryover basis of accounting to include the effects of the merger with ARCT IV. |
| (2) | See Note 2 – Restatement of Previously Issued Financial Statements in the Company’s Quarterly Reports on Forms 10-Q/A for the fiscal periods ended March 31, 2014 and June 30, 2014, respectively, for further discussion on the restatement adjustments. |
| Three Months Ended September 30, 2013 | Three Months Ended December 31, 2013 | |||||||||||||||||||||||
| As Previously Reported (1) |
Restatement Adjustments (2) |
As Restated | As Previously Reported (1) |
Restatement Adjustments |
As Restated | |||||||||||||||||||
| Revenues |
$ | 95,255 | $ | — | $ | 95,255 | $ | 136,781 | $ | (555 | ) | $ | 136,226 | |||||||||||
| Net loss from continuing operations attributable to stockholders |
(82,768 | ) | 2,598 | (80,170 | ) | (178,800 | ) | (19,029 | ) | (197,829 | ) | |||||||||||||
| Net loss from discontinued operations attributable to stockholders |
91 | (122 | ) | (31 | ) | (142 | ) | 156 | 14 | |||||||||||||||
|
|
|
|
|
|
|
|
|
|
|
|
|
|||||||||||||
| Net loss attributable to Stockholders |
(82,677 | ) | 2,476 | (80,201 | ) | (178,942 | ) | (18,873 | ) | (197,815 | ) | |||||||||||||
|
|
|
|
|
|
|
|
|
|
|
|
|
|||||||||||||
| Less: dividends declared on preferred shares and RSUs |
(199 | ) | — | (199 | ) | (3,006 | ) | — | (3,006 | ) | ||||||||||||||
|
|
|
|
|
|
|
|
|
|
|
|
|
|||||||||||||
| Net loss attributable to the common stockholders |
$ | (82,876 | ) | $ | 2,476 | $ | (80,400 | ) | $ | (181,948 | ) | $ | (18,873 | ) | $ | (200,821 | ) | |||||||
|
|
|
|
|
|
|
|
|
|
|
|
|
|||||||||||||
| Weighted-average shares outstanding |
221,707,934 | (14 | ) | 221,707,920 | 231,969,433 | — | 231,969,433 | |||||||||||||||||
|
|
|
|
|
|
|
|
|
|
|
|
|
|||||||||||||
| Basic and diluted loss per share from continuing operations attributable to common stockholders |
$ | (0.37 | ) | $ | 0.01 | $ | (0.36 | ) | $ | (0.77 | ) | $ | (0.10 | ) | $ | (0.87 | ) | |||||||
|
|
|
|
|
|
|
|
|
|
|
|
|
|||||||||||||
| Basic and diluted loss per share from discontinued operations attributable to common stockholders |
$ | — | $ | — | $ | — | $ | — | $ | — | $ | — | ||||||||||||
|
|
|
|
|
|
|
|
|
|
|
|
|
|||||||||||||
| Basic and diluted net loss per share attributable to common stockholders |
$ | (0.37 | ) | $ | 0.01 | $ | (0.36 | ) | $ | (0.78 | ) | $ | (0.09 | ) | $ | (0.87 | ) | |||||||
|
|
|
|
|
|
|
|
|
|
|
|
|
|||||||||||||
| (1) | These financial figures have been recast in applying the carryover basis of accounting to include the effects of the merger with ARCT IV. |
| (2) | See Note 2 – Restatement of Previously Issued Financial Statements in the Company’s Quarterly Report on Form 10-Q for the fiscal period ended September 30, 2014 for further discussion on the restatement adjustments. |
F-78
Table of Contents
AMERICAN REALTY CAPITAL PROPERTIES, INC.
NOTES TO CONSOLIDATED FINANCIAL STATEMENTS – (Continued)
December 31, 2013
Presented below is a summary of the unaudited quarterly financial information for each of the fiscal quarters in the year ended December 31, 2012 (in thousands, except share and per share amounts):
| Quarters Ended(1) | ||||||||||||||||
| March 31, 2012 |
June 30, 2012 |
September 30, 2012 |
December 31, 2012 (As Restated) |
|||||||||||||
| Revenues |
$ | 6,240 | $ | 11,534 | $ | 18,945 | $ | 30,488 | ||||||||
| Net loss from continuing operations attributable to stockholders |
(4,722 | ) | (7,012 | ) | (12,768 | ) | (16,459 | ) | ||||||||
| Net loss from discontinued operations attributable to stockholders |
(322 | ) | (77 | ) | (41 | ) | (251 | ) | ||||||||
|
|
|
|
|
|
|
|
|
|||||||||
| Net loss attributable to Stockholders |
(5,044 | ) | (7,089 | ) | (12,809 | ) | (16,710 | ) | ||||||||
|
|
|
|
|
|
|
|
|
|||||||||
| Less: dividends declared on preferred shares and RSUs |
— | (70 | ) | (140 | ) | (158 | ) | |||||||||
|
|
|
|
|
|
|
|
|
|||||||||
| Net loss attributable to the common stockholders |
$ | (5,044 | ) | $ | (7,159 | ) | $ | (12,949 | ) | $ | (16,868 | ) | ||||
|
|
|
|
|
|
|
|
|
|||||||||
| Weighted-average shares outstanding |
23,614,122 | 68,317,195 | 138,348,622 | 180,931,150 | ||||||||||||
|
|
|
|
|
|
|
|
|
|||||||||
| Basic and diluted loss per share from continuing operations attributable to common stockholders |
$ | (0.20 | ) | $ | (0.10 | ) | $ | (0.09 | ) | $ | (0.09 | ) | ||||
|
|
|
|
|
|
|
|
|
|||||||||
| Basic and diluted loss per share from discontinued operations attributable to common stockholders |
$ | (0.01 | ) | $ | — | $ | — | $ | — | |||||||
|
|
|
|
|
|
|
|
|
|||||||||
| Basic and diluted net loss per share from continuing operations attributable to common stockholders |
$ | (0.21 | ) | $ | (0.10 | ) | $ | (0.09 | ) | $ | (0.09 | ) | ||||
|
|
|
|
|
|
|
|
|
|||||||||
| (1) | Certain historical balances have been restated for discontinued operations. |
| (2) | For the year ended December 31, 2012, the total quarterly basic and diluted earnings per share were $0.07 higher than the annual basic and diluted earnings per share due to the effects of rounding. |
The following table presents the combined impact of all changes to the applicable line items in the consolidated financial statements to the Company’s previously issued consolidated financial statements for the quarter ended December 31, 2012, as disclosed in Note 2— Restatement of Previously Issued Financial Statements (in thousands, except share and per share amounts):
F-79
Table of Contents
AMERICAN REALTY CAPITAL PROPERTIES, INC.
NOTES TO CONSOLIDATED FINANCIAL STATEMENTS – (Continued)
December 31, 2013
| Three Months Ended December 31, 2012 | ||||||||||||
| As Previously Reported (1) |
Restatement Adjustments (2) |
As Restated | ||||||||||
| Revenues |
$ | 30,488 | $ | — | $ | 30,488 | ||||||
| Net loss from continuing operations attributable to stockholders |
(16,735 | ) | 276 | (16,459 | ) | |||||||
| Net loss from discontinued operations attributable to stockholders |
(259 | ) | 8 | (251 | ) | |||||||
|
|
|
|
|
|
|
|||||||
| Net loss attributable to stockholders |
(16,994 | ) | 284 | (16,710 | ) | |||||||
|
|
|
|
|
|
|
|||||||
| Less: dividends declared on preferred shares and RSUs |
(158 | ) | — | (158 | ) | |||||||
|
|
|
|
|
|
|
|||||||
| Net loss attributable to the common stockholders |
$ | (17,152 | ) | $ | 284 | $ | (16,868 | ) | ||||
|
|
|
|
|
|
|
|||||||
| Weighted-average shares outstanding |
180,931,150 | — | 180,931,150 | |||||||||
|
|
|
|
|
|
|
|||||||
| Basic and diluted loss per share from continuing operations attributable to common stockholders |
$ | (0.09 | ) | $ | — | $ | (0.09 | ) | ||||
|
|
|
|
|
|
|
|||||||
| Basic and diluted loss per share from discontinued operations attributable to common stockholders |
$ | — | $ | — | $ | — | ||||||
|
|
|
|
|
|
|
|||||||
| Basic and diluted net loss per share from continuing operations attributable to common stockholders |
$ | (0.09 | ) | $ | — | $ | (0.09 | ) | ||||
|
|
|
|
|
|
|
|||||||
| (1) | These financial figures have been recast in applying the carryover basis of accounting to include the effects of the merger with ARCT IV. |
| (2) | See Note 2 — Restatement of Previously Issued Financial Statements. |
Note 24 — Subsequent Events (As Restated)
The following significant events occurred subsequent to December 31, 2013:
Completion of Acquisition of Assets
The following table presents certain information about the properties that the Company acquired from January 1, 2014 to February 26, 2015 (dollar amounts in thousands):
| No. of Buildings | Square Feet | Base Purchase Price (1) | ||||||||||
| Total Portfolio – December 31, 2013 (2) |
2,559 | 43,834,493 | $ | 7,392,610 | ||||||||
| Acquisitions, net of disposals (3) (4) |
2,101 | 59,373,760 | 10,468,192 | |||||||||
|
|
|
|
|
|
|
|||||||
| Total Portfolio – February 26, 2015 (2) |
4,660 | 103,208,253 | $ | 17,860,802 | ||||||||
|
|
|
|
|
|
|
|||||||
| (1) | Contract purchase price, excluding acquisition and transaction related costs. |
| (2) | Total portfolio excludes one vacant property contributed in September 2011, which was classified as held for sale as of December 31, 2013. |
| (3) | As part of the Cole Merger, the Company acquired 1,053 properties in February 2014 for a base purchase price of $8.7 billion. |
| (4) | The Red Lobster portfolio, which consists of 542 properties, was purchased in July 2014 for a base purchase price of $1.7 billion. |
Transition to Self-Management
On January 8, 2014, the Company completed its transition to self-management. In connection with becoming self-managed, the Company terminated its management agreement with the Former Manager and certain former executives and employees of the Former Manager and its affiliates became employees of the Company.
F-80
Table of Contents
AMERICAN REALTY CAPITAL PROPERTIES, INC.
NOTES TO CONSOLIDATED FINANCIAL STATEMENTS – (Continued)
December 31, 2013
Termination of Management Agreement
In connection with the transition by the Company to self-management on January 8, 2014, the Company and the Former Manager entered into an Amendment and Acknowledgment of Termination of Amended and Restated Management Agreement (the “Termination Agreement”), dated January 8, 2014. The Termination Agreement provided for termination of the Amended and Restated Management Agreement, dated February 28, 2013, between the Company and the Former Manager, effective January 8, 2014. Pursuant to the Termination Agreement, the Former Manager agreed to continue to provide services previously provided under the Management Agreement, to the extent required by the Company, for a period of 60 days following January 8, 2014 and received a payment in the amount of $10.0 million for providing such services.
Pursuant to an Assignment and Assumption Agreement (the “Assignment”) dated January 8, 2014 between an affiliate of the Former Manager and RCS Advisory, ARC assigned to the Company, and the Company assumed, certain of the rights and obligations under that certain Services Agreement dated as of June 10, 2013 between ARC and RCS Advisory (the “Services Agreement”). Under the Services Agreement, RCS Advisory and its affiliates had been providing to the Company certain transaction management services and other services, employees and other resources. The Assignment enabled the Company to continue to receive the services and resources contemplated under the Services Agreement, at the Company’s discretion.
In addition, pursuant to a separate Transition Services Agreement (the “Transition Services Agreement”), dated October 21, 2013, affiliates of the Former Manager agreed to provide certain transition services, including accounting support, acquisition support, investor relations support, public relations support, human resources and administration, general human resources duties, payroll services, benefits services, insurance and risk management, information technology, telecommunications and internet and services relating to office supplies. The Transition Services Agreement was in effect for a 60-day term beginning on the date the Company became self-managed, and could have been extended by the Company at its discretion. To the extent the Company requested any services, the Company was required to pay a fee at an hourly rate or flat rate to be agreed on, not to exceed a market rate for the services to be provided pursuant to the Transition Services Agreement.
Furniture, Fixtures and Equipment
The Company entered into agreements with the Sellers, pursuant to which, as applicable, concurrently with the closing of the ARCT IV Merger and the Company’s transition to self-management, the Sellers agreed to sell to the OP certain FF&E and other assets used by the Sellers in connection with managing the property level business and operations and accounting functions of the Company and the OP. The Company incurred and recorded $15.8 million of expenses related to the FF&E in 2014. See Note 19 — Related Party Transactions and Arrangements (As Restated).
The Operating Partnership
Substantially all of the Company’s business is conducted through the OP. The actions of the OP and its relationship with the Company are governed by the Third Amended and Restated Agreement of Limited Partnership, as amended (the “LPA”), effective as of January 3, 2014. The Company does not have any significant assets other than its investment in the OP. Therefore, the assets and liabilities of the Company and the OP are substantially the same. Additionally, pursuant to the LPA, all administrative expenses and expenses associated with the formation and continuity of existence and operation of the Company incurred by the Company on the OP’s behalf shall be treated as expenses of the OP. Further, when the Company issues any equity instrument that has been approved by the Company’s board of directors to date, the LPA requires the OP to issue the Company equity instruments with substantially similar terms.
Executive Leadership Changes and Audit Committee Investigation
On September 30, 2014, the Company announced that, effective October 1, 2014, David S. Kay would become Chief Executive Officer of the Company and Lisa E. Beeson would become the Company’s President. Nicholas S. Schorsch, who had served as the Company’s Chief Executive Officer, would remain the Company’s Executive Chairman.
F-81
Table of Contents
AMERICAN REALTY CAPITAL PROPERTIES, INC.
NOTES TO CONSOLIDATED FINANCIAL STATEMENTS – (Continued)
December 31, 2013
On October 29, 2014, the Company filed a Current Report on Form 8-K with the SEC disclosing the Audit Committee’s conclusion that the previously issued audited consolidated financial statements contained in the Company’s Annual Report on Form 10-K for the fiscal year ended December 31, 2013 and Quarterly Reports on Form 10-Q for the fiscal periods ended March 31, 2014 and June 30, 2014, should no longer be relied upon. Results of the investigation are further discussed within Note 2 – Restatement of Previously Issued Financial Statements.
On October 28, 2014, Brian S. Block and Lisa Pavelka McAlister, the Company’s Executive Vice President, Chief Financial Officer, Treasurer and Secretary and Senior Vice President and Chief Accounting Officer, respectively, each resigned from the Company. The Company’s board of directors appointed Michael Sodo to serve as the Company’s Chief Financial Officer and Gavin Brandon to serve as the Company’s Chief Accounting Officer.
On December 12, 2014, Nicholas S. Schorsch resigned as Executive Chairman and a director of the Company. He also resigned from all other employment and board positions that he held at the Company and its subsidiaries and certain Company-related entities (including the non-traded real estate investment trusts sponsored or managed by the Company or its affiliates).
On December 15, 2014, David S. Kay resigned as Chief Executive Officer (“CEO”) and a director of the Company and as CEO of the OP. Lisa E. Beeson also resigned as President and Chief Operating Officer of the Company and OP. In addition, each of them resigned from any other employment or board positions held with the Company, its subsidiaries and certain Company-related entities (including the non-traded real estate investment trusts sponsored or managed by the Company or its affiliates).
In connection with their resignations, Messrs. Schorsch, Block and Kay and Ms. Beeson relinquished an aggregate of approximately 2.7 million shares of stock as well as all outstanding interests in the Company’s 2014 Out-performance Plan.
Effective December 15, 2014, William G. Stanley, who had been serving as the Company’s Lead Independent Director, became the Company’s Interim Chief Executive Officer and Interim Chairman of the Company’s board of directors, thus resigning from his role as Lead Independent Director, which was assumed by another independent director. Mr. Stanley will lead the Company until permanent replacements are named. The Compensation Committee of the Company’s board of directors has commenced a search for a new Chief Executive Officer and a new independent Chairman of the Company’s board of directors.
Unconsummated Sale of Cole Capital to RCAP
On October 1, 2014, the Company announced that it had entered into an equity purchase agreement (the “Agreement”), dated as of September 30, 2014, with RCS Capital Corporation (“RCAP”), pursuant to which RCAP would acquire Cole Capital, the Company’s private capital management business, for at least $700.0 million. As part of the transaction, the Company would be entitled to an earn-out of up to an additional $130.0 million based upon Cole Capital’s 2015 EBITDA.
On November 3, 2014, the Company received notice from RCAP purporting to terminate the Agreement.
On December 4, 2014, the Company issued a press release announcing that it had entered into a settlement agreement with RCAP that resolved their dispute relating to the Agreement. The settlement, in which the Company received $60.0 million, resolved litigation brought by the Company in the Delaware Court of Chancery to enforce its rights under the Agreement.
The settlement included: $42.7 million in cash paid by RCAP to the Company; a $15.3 million unsecured note issued by RCAP to the Company; and a release of the Company from its obligation to pay $2.0 million to RCAP or its affiliates relating to another matter described in the press release. The $42.7 million in cash included a $10.0 million payment already delivered to the Company by RCAP in connection with the Agreement. The two-year unsecured note bears interest at an 8.0% interest rate per annum. In addition, the Company and RCAP have agreed to terminate, unwind or otherwise discontinue all agreements, arrangements and understandings between the two parties and any of their respective subsidiaries.
Abandoned Spin-off of Multi-Tenant Shopping Center Portfolio
On March 13, 2014, the Company announced its intention to spin off its multi-tenant shopping center business into a publicly traded REIT, American Realty Capital Centers, Inc., which was expected to operate under the name “ARCenters” and to trade on the NASDAQ Global Market under the symbol “ARCM.” The OP was expected to retain 25% ownership of ARCM. The spin-off was expected to be effectuated through a pro rata taxable special distribution of one share of ARCM common stock for every 10 shares of the Company’s common stock and every 10 OP Units held by third parties in the OP. On April 4, 2014, ARCM filed a Registration Statement on Form 10 to register ARCM’s common stock, par value $0.01 per share, pursuant to Section 12(b) of the Exchange Act
F-82
Table of Contents
AMERICAN REALTY CAPITAL PROPERTIES, INC.
NOTES TO CONSOLIDATED FINANCIAL STATEMENTS – (Continued)
December 31, 2013
so that, upon consummation of the spin-off, shares of ARCM received by holders of the Company’s common stock, or OP Units, as applicable, could freely trade their newly received ARCM common stock. ARCM was expected to be externally managed by the Company. On May 21, 2014, the Company announced that it had reassessed its plans for the multi-tenant shopping center portfolio and entered into a letter of intent to sell such portfolio to Blackstone, expecting to finalize pertinent documentation related thereto within 30 days of such date. The properties included in such sale were the same properties that would have been spun off into ARCM and, consequently, the Company abandoned its proposed spin-off at such time. On June 11, 2014, indirect subsidiaries of the Company entered into an Agreement of Purchase and Sale with BRE DDR Retail Holdings III LLC, an entity indirectly jointly owned by affiliates of Blackstone Real Estate Partners VII L.P. and DDR Corp., pursuant to which the parties definitively documented the sale of the Company’s multi-tenant shopping center portfolio. Such sale was consummated on October 17, 2014, as described below. The Company expects to withdraw its filed Registration Statement on Form 10 intended to register shares of common stock of ARCM.
Multi-tenant Shopping Center Portfolio Sale
On October 17, 2014, the Company completed the sale of its multi-tenant shopping center portfolio for $1.9 billion to a joint venture (the “Joint Venture”) between affiliates of Blackstone Real Estate Partners VII (“Blackstone”) and DDR Corp (“DDR”). Additionally, the Company entered into a letter of intent with an unrelated third party to sell five multi-tenant properties for $52.3 million bringing total sale proceeds to $2.0 billion. The transaction aimed to simplify the Company’s business model, allowing it to focus solely on its single-tenant, net lease investments. The disposition to Blackstone and DDR provided $1.3 billion of net proceeds, of which $1.2 billion were used to reduce the Company’s leverage by paying down the Company’s line of credit, and a loss on sale of $261.1 million, which includes the write-off of $195.5 million of goodwill allocated to the cost basis of the Multi-Tenant Portfolio.
National Institute of Health
The Company acquired the National Institute of Health (“NIH”) office building in Bethesda, Maryland with a historical cost approximating $40.0 million on November 5, 2013 as part of the acquisition of CapLease, Inc. As of March 31, 2014, 9,133 of the 207,055 square feet (4.4%) were leased by certain divisions of the NIH, with the remainder of the building substantially vacated since November 1, 2013.
On June 12, 2014, the lender of the $65.2 million mortgage loan, with a current balance outstanding of $53.8 million, collateralized by the property located in Bethesda, Maryland placed our loan with them in default due to non-payment. The Company decided not to make the debt service payment since cash flows generated from the property were insufficient to fund debt service payments and capital improvements necessary to lease and operate the property. The Company was not prepared to fund any further cash shortfalls. We are currently accruing interest at the default interest rate of 5.32% per annum.
F-83
Table of Contents
AMERICAN REALTY CAPITAL PROPERTIES, INC.
NOTES TO CONSOLIDATED FINANCIAL STATEMENTS – (Continued)
December 31, 2013
Line of Credit, Agreements, and Waivers
The Company has substantial amounts of indebtedness outstanding upon which it relies for funding of future capital needs. As discussed within Note 13 — Credit Facilities, at December 31, 2013, the Credit Facility had commitments of $2.4 billion. The Credit Facility had an accordion feature, which, if exercised in full, would allow the Company to increase borrowings under the Credit Facility to $3.0 billion, subject to additional lender commitments, borrowing base availability and other conditions.
On June 30, 2014, the Company, as guarantor, and the OP, as borrower, entered into the Credit Agreement, which increased the available borrowings, extended the term and decreased the interest rates associated with the Credit Facility prior to the execution of the Credit Agreement. The Credit Agreement provided an accordion feature, which, if exercised in full, would allow the Company to increase the aggregate commitments under the Credit Facility to $6.0 billion, subject to the receipt of such additional commitments and the satisfaction of certain customary conditions. Subsequent to the execution of the Credit Agreement, the Company accepted an additional $50.0 million commitment on the revolving credit facility from one of the original 20 financial institutions, bringing the total Credit Facility commitments to $4.7 billion.
On November 12, 2014, the Company entered into a consent, waiver and amendment (“the Amendment”) with its lenders under its unsecured credit facility for an extension regarding the delivery of its third quarter 2014 financial statements and certain other financial deliverables until the earlier of five days following the date the Company files with the SEC its third quarter 2014 10-Q and January 5, 2015. The Amendment allowed the Company to remain compliant with its borrowing obligations under its Credit Facility as its external auditors completed their review of the Company’s previously filed 2013 and 2014 financial statements. As part of the Amendment, in order to better align the size of the facility with anticipated future usage, the Company elected to reduce the maximum amount of indebtedness from $4.65 billion to $4.0 billion. Additionally, until the 2013 and 2014 financial statements are filed with the SEC, the maximum principal amount of indebtedness outstanding under the Credit Facility was temporarily reduced thereunder to $3.6 billion.
On December 23, 2014, the Company and the OP, as the borrower, entered into a Consent and Waiver Agreement (the “Consent and Waiver”) with respect to the Credit Agreement, as amended. The Consent and Waiver, among other things, (i) provided for a further extension regarding the delivery of the Company’s third quarter 2014 financial statements and certain other financial deliverables that the Company agreed to provide under the Amendment, until the earlier of March 2, 2015 and 45 days following the receipt of a notice of breach or default from the applicable trustee or the requisite percentage of holders under the Company’s and the OP’s respective indentures, (ii) provided an extension from the lenders for the delivery of the Company’s full-year 2014 audited financial statements until the earlier of the fifth day after the date that the Company files its Annual Report on Form 10-K with the SEC for the fiscal year ended December 31, 2014 and March 31, 2015, (iii) permanently reduced the maximum amount of indebtedness under the Credit Agreement to $3.6 billion, including the reduction of commitments under the Company’s revolving facilities and the elimination of the $25 million swingline facility, (iv) provided that until the date that all required financial deliverables have been delivered, no further loans or letters of credit would be requested under the Credit Agreement, as amended, by the Company, other than in accordance with the cash flow forecast provided by the Company to the Lenders thereunder, and that neither the Company nor the OP would pay any dividends on, or make any other Restricted Payment (as defined in the Credit Agreement) on, its respective common equity and (v) provided that the Company would provide additional financial and other information to the Lenders from time to time. In connection with the Amendment and Consent and Waiver, the Company agreed to pay certain customary fees to the consenting Lenders and agreed to reimburse certain customary expenses of the arrangers. On February 20, 2015, we entered into a third consent (the “Third Consent”) to confirm that certain revisions to the required financial deliverables were agreed with the Lenders.
Agreement in Principle with Senior Noteholder Group; Convertible Notes
On January 22, 2015, the Company announced that it had entered into an agreement in principle with an ad hoc group of holders (the “Senior Noteholder Group”), which the Company had been advised then represented a majority of the aggregate principal amounts outstanding of each of the 2.000% senior notes due 2017, the 3.000% senior notes due 2019 and the 4.600% senior notes due 2024, which, in each case, were issued by the OP, of which the Company is the sole general partner, and guaranteed by us under an Indenture, dated February 6, 2014 (the “Indenture”), by and among the OP, U.S. Bank National
F-84
Table of Contents
AMERICAN REALTY CAPITAL PROPERTIES, INC.
NOTES TO CONSOLIDATED FINANCIAL STATEMENTS – (Continued)
December 31, 2013
Association, as trustee, and the guarantors named therein. Pursuant to such agreement, the Senior Noteholder Group agreed not to issue a notice of default, prior to March 3, 2015, for the Company’s failure to timely deliver its Third Quarter 10-Q containing financial information required to be included therein in respect of the OP, which is required to be delivered pursuant to the terms of the Indenture. In exchange, the Company agreed to sign a confidentiality agreement with the Senior Noteholder Group’s counsel and pay reasonable and documented fees and out-of-pocket expenses of such counsel up to $300,000. Furthermore, the parties agreed that in the event a notice of default related to our failure to timely deliver such Third Quarter 10-Q is issued by the senior noteholders on or after March 3, 2015, the 60-day cure period set forth in the Indenture will be reduced by one day for each day after January 19, 2015 that such notice of default is given. Such agreement was subsequently definitively documented and a supplement to the Indenture was entered into on February 9, 2015. The agreement was reached after the ad hoc group organized recently and directed counsel to the Senior Noteholder Group to engage in discussions with the Company regarding the terms of a possible resolution in response to our failure to timely deliver such third quarter 2014 financial information regarding the OP.
In addition, the Company announced on January 22, 2015 that it received at its Phoenix, Arizona corporate office notice (the “Notice”) from the trustee under the indentures (the “Convertible Indentures”) governing each of the 3.00% convertible senior notes due 2018 issued by us on July 29, 2013 and the 3.75% convertible senior notes due 2020 issued by the Company on December 10, 2013 (collectively, the “Convertible Notes”) of the Company’s failure to timely deliver our Third Quarter 10-Q, which was required to be delivered pursuant to the terms of the Convertible Indentures. Subsequent to the Company’s announcement, the Company learned that it also received the Notice on January 16, 2015, at an address in New York City that was formerly the Company’s principal place of business. Pursuant to the terms of the Convertible Indentures, the Company has 60 days following its receipt of a notice of default to deliver the required financial statements, after which such failure would become an event of default under each of the Convertible Indentures. Our Third Quarter 10-Q will be filed with the SEC concurrently with Amendment No. 2 to the Company’s Annual Report in Form 10-K/A for the year ended December 31, 2014.
Non-Compliance Associated with the Company’s Filings
The federal securities laws require companies subject to the Exchange Act to disclose information on an ongoing basis. These laws include deadlines for public companies based on the category of the filer as well as type of form filed.
The Company is classified as a Large Accelerated Filer. The deadlines associated with our filing category are as follows:
| • | The Company’s Annual Report on Form 10-K must be submitted within 60 days of the Company’s fiscal year end; and |
| • | The Company’s Quarterly Report on Form 10-Q must be submitted within 40 days of the Company’s fiscal quarter end. |
In light of the non-reliance on the Company’s financial statements and the Audit Committee investigation, such deadlines with the SEC were not met with respect to the Company’s Quarterly Report on Form 10-Q for the three months ended September 30, 2014.
F-85
Table of Contents
AMERICAN REALTY CAPITAL PROPERTIES, INC.
NOTES TO CONSOLIDATED FINANCIAL STATEMENTS – (Continued)
December 31, 2013
On November 12, 2014, the Company received a notification letter (the “Letter”) from the NASDAQ Listing Qualifications Department (“NASDAQ”) stating that because the Company had not yet filed its Quarterly Report on Form 10-Q for the period ended September 30, 2014 (the “Third Quarter 10-Q”) with the SEC, it was not in compliance with the continued listing requirements under NASDAQ Listing Rule 5250(c)(1). The Company also received, and has cooperated with, a letter (the “NASDAQ Information Request”) from NASDAQ requesting certain information relating to the matters described in the Current Report on Form 8-K filed October 29, 2014.
Pursuant to the Letter, we were required to submit a plan to NASDAQ to regain compliance with the applicable NASDAQ Listing Rule within 60 days of November 12, 2014. The Company complied with such obligation. After review of our plan for regaining compliance, NASDAQ granted us an extension until April 15, 2015 to file our Third Quarter 10-Q and any other delinquent filings to regain compliance with the listing rule.
Dividend Policy
As of December 24, 2014, the Company determined that, until it has delivered its 2013 financial statements, 2014 financial statements and related compliance certificates, neither it nor its subsidiary, the OP, will pay any dividends on, or make any other Restricted Payment (as defined in the Amended Credit Agreement) on, its respective common equity. Following the delivery of its financial statements, the Company will reevaluate a reinstatement of its dividend at a rate that is in line with its industry peers.
F-86
Table of Contents
AMERICAN REALTY CAPITAL PROPERTIES, INC.
NOTES TO CONSOLIDATED FINANCIAL STATEMENTS – (Continued)
December 31, 2013
Redemption of Series D Preferred Stock
As described in Note 19 — Related Party Transactions and Arrangements (As Restated), the Company issued 21.7 million shares of Series D Preferred Stock on November 12, 2013 to various holders pursuant to a private placement. The Articles Supplementary designating the terms of the Series D Preferred Stock provided that such shares were redeemable on the Redemption Date. If the Company did not choose to redeem the shares on the Redemption Date, the holders of Series D Preferred Stock were entitled to convert some or all of their outstanding shares of Series D Preferred Stock and the Company would then elect whether to (1) convert the shares of Series D Preferred Stock into the number of fully paid and non-assessable shares of common stock obtained by dividing the aggregate Liquidation Preference of such Series D Preferred Stock by the Conversion Price, (2) convert the shares of Series D Preferred Stock into an equal number of shares of Series E Preferred Stock (additional shares of Series E Preferred Stock could have been issued under certain circumstances) or (3) pay the holders a cash amount equal to the product of the number of shares of Series D Preferred Stock and the Cash Conversion Price. In advance of the Redemption Date, the Company sent the required notice to the holders of the Series D Preferred Stock indicating its intention to redeem all of the shares of Series D Preferred Stock on September 2, 2014. Upon settlement on the Redemption Date, the Company paid the holders of the Series D Preferred Stock the net amount due to them of $315.8 million and cancelled all outstanding shares of Series D Preferred Stock. As of the date of this filing, there are zero outstanding shares of Series D Preferred Stock.
CapLease and Cole Litigation Matters
On March 24, 2014, plaintiffs’ counsel in the Consolidated Actions brought by former CapLease stockholders concerning the CapLease Transaction dismissed those claims without prejudice. Consequently, the only litigation brought by former CapLease stockholders with respect to the CapLease Transaction that is still pending is the Tarver Action, which remains stayed.
On July 31, 2014, plaintiffs in the putative class action filed in the Circuit Court for Baltimore City challenging the merger between Cole and Cole Holdings, pursuant to which Cole became a self-managed REIT, dismissed their pending appeal based on an agreement by defendants to reimburse plaintiffs in the amount of $100,000. The other two lawsuits filed in connection with the Cole Holdings transaction have been stayed by the court pursuant to a joint request made by all parties pending final approval of the consolidated Baltimore Actions relating to the Cole Merger, described below.
On August 14, 2014, the parties in the consolidated Baltimore Actions, which were brought by Cole stockholders challenging the Cole Merger, executed a Stipulation and Release and Agreement of Compromise and Settlement (the “Settlement Stipulation”), and the parties in the consolidated Baltimore Actions submitted the Settlement Stipulation, along with related filings, for approval by the Maryland court on August 18, 2014. On August 25, 2014, the Baltimore Circuit Court entered an Order on Preliminary Approval of Derivative and Class Action Settlement and Class Action Certification (the “Preliminary Approval Order”). Pursuant to the Preliminary Approval Order, the defendants mailed the Notice of Pendency of Derivative and Class Action (the “Class Notice”) to the Cole shareholders on October 7, 2014. On December 3, 2014, the parties in the consolidated Baltimore Merger Actions executed an Amended Stipulation and Release and Agreement of Compromise and Settlement (the “Amended Stipulation”) modifying the Stipulation. A final settlement hearing in the consolidated Baltimore Actions was held on December 12, 2014, and on January 13, 2015, the Baltimore Circuit Court issued an order approving the settlement pursuant to the terms of the Amended Stipulation. Two objecting class members have since filed a notice of appeal of the settlement order. Following court approval of the settlement of the consolidated Baltimore Actions, the Wunsch case was dismissed voluntarily on January 21, 2015.
Regulatory Investigations and Litigation Relating to the Audit Committee Investigation
On October 29, 2014, the Company filed a Current Report on Form 8-K (the “October 29 8-K”) reporting that the Audit Committee had concluded that the previously-issued audited consolidated financial statements and other financial information contained in the original filing of the Company’s Annual Report on Form 10-K for the year ended December 31, 2013, the previously issued unaudited financial statements and other financial information contained in the Company’s Quarterly Reports on Form 10-Q for the fiscal periods ended March 31, 2014 and June 30, 2014, and the Company’s earnings releases and other financial communications for these periods should no longer be relied upon. Prior to that filing, the Audit Committee previewed for the SEC the information contained in that filing. Subsequent to the filing, the SEC provided notice that it had commenced a formal investigation and issued subpoenas calling for the production of documents. In addition, the United States Attorney’s Office for the Southern District of New York contacted counsel for the Audit Committee and counsel for the Company with respect to this matter, and the Secretary of the Commonwealth of Massachusetts issued a subpoena calling for the production of various documents. The Audit Committee and the Company are cooperating with these regulators in their investigations.
F-87
Table of Contents
AMERICAN REALTY CAPITAL PROPERTIES, INC.
NOTES TO CONSOLIDATED FINANCIAL STATEMENTS – (Continued)
December 31, 2013
As discussed below, the Company and certain of its current and former directors and officers have been named as defendants in a number of lawsuits filed in response to the October 29 8-K, including class actions, derivative actions, and individual actions under the federal securities laws and state common and corporate laws in both federal and state courts in New York and Maryland.
Between October 30, 2014 and January 20, 2015, the Company and its current and former officers and directors (in addition to underwriters for certain of the Company’s securities offerings) were named as defendants in ten putative securities class action complaints in the United States District Court for the Southern District of New York (the “SDNY Actions”): Ciraulu v. American Realty Capital, Inc., et al., No. 14-cv-8659 (AKH); Priever v. American Realty Capital Properties, Inc., et al., No. 14-cv-8668 (AKH); Rubinstein v. American Realty Capital Properties, Inc., et al., No. 14-cv-8669 (AKH); Patton v. American Realty Capital Properties, Inc., et al., No. 14-cv-8671 (AKH); Edwards v. American Realty Capital Properties, Inc., et al., No. 14-cv-8721 (AKH); Harris v. American Realty Capital Properties, Inc., et al., No. 14-cv-8740 (AKH); Abadi v. American Realty Capital Properties, Inc., et al., No. 14-cv-9006 (AKH); City of Tampa General Employees Retirement Fund v. American Realty Capital Properties, Inc., et al., No. 14-cv-10134 (AKH); Teachers Insurance and Annuity Association of America v. American Realty Capital Properties, Inc., et al., No. 15-cv-0421 (AKH); and New York City Employees Retirement System v. American Realty Capital Properties, Inc., et al., No. 15-cv-0422 (AKH). At a February 10, 2015 status conference, the court consolidated the SDNY Actions, appointed a lead plaintiff, and set a deadline of April 10, 2015 for the defendants to respond to the consolidated class action complaint, namely, the complaint filed in Teachers Insurance and Annuity Association of America v. American Realty Capital Properties, Inc., et al., No. 15-cv-0421 (AKH). The consolidated class action complaint asserts claims for violations of Sections 11, 12(a)(2) and 15 of the Securities Act of 1933 and Sections 10(b), 14(a) and 20(a) of the Securities Exchange Act of 1934 and Rules 10b-5 and 14a-9 promulgated thereunder, arising out of allegedly false and misleading statements in connection with the purchase or sale of the Company’s securities. The proposed class period runs from May 6, 2013 to October 29, 2014.
In addition, on November 25, 2014, the Company and certain of its current and former officers and directors were named as defendants in a putative securities class action filed in the Circuit Court for Baltimore County, Maryland, captioned Wunsch v. American Realty Capital Properties, Inc., et al., No. 03-C-14-012816 (the “Maryland Securities Action” and together with the SDNY Actions, the “Securities Actions”). On December 23, 2014, the Company removed the Maryland Securities Action to the United States District Court for the District of Maryland (Northern Division), under the caption Wunsch v. American Realty Capital Properties, Inc., et al., No. 14-cv-4007 (ELH), and to transfer the action to the United States District Court for the Southern District of New York. The Maryland Securities Action asserts claims for violations of Sections 11 and 15 of the Securities Act of 1933, arising out of allegedly false and misleading statements made in connection with the Company’s securities issued in connection with the Cole Merger. The Company is not yet required to respond to this complaint.
Between November 17, 2014 and February 2, 2015, six shareholder derivative actions, purportedly in the name and for the benefit of the Company, were filed against certain of the Company’s current and former officers and directors, amongst others, in the United States District Court for the Southern District of New York (the “SDNY Derivative Actions”): Michelle Graham Turner 1995 Revocable Trust v. Schorsch, et al., No. 14-cv-9140 (AKH); Froehner v. Schorsch, et al., No. 14-cv-9444 (AKH); Serafin v. Schorsch, et al., No. 14-cv-9672 (AKH); Hopkins v. Schorsch, et al., No. 15-cv-262 (AKH); Appolito v. Schorsch, et al., No. 15-cv-644 (AKH); and The Joel and Robin Staadecker Living Trust v. Schorsch, et al., No. 15-cv-768 (AKH). In addition, between December 30, 2014 and January 16, 2015, the Company and certain of its current and former officers and directors were named as defendants in two shareholder derivative actions filed in the Circuit Court for Baltimore City, Maryland (the “Maryland Derivative Actions”): Meloche v. Schorsch, et al., No. 24-C-14-008210 and Botifoll v. Schorsch, et al., No. 24-C-15-000245. In addition, on January 29, 2015, the Company and certain of its current directors, amongst others,
F-88
Table of Contents
AMERICAN REALTY CAPITAL PROPERTIES, INC.
NOTES TO CONSOLIDATED FINANCIAL STATEMENTS – (Continued)
December 31, 2013
were named as defendants in a shareholder derivative action filed in the Supreme Court of the State of New York, captioned Fran Kosky Roth IRA v. Rendell, et al., No. 15-650269 (the “New York Derivative Action,” and together with the SDNY Derivative Actions and the Maryland Derivative Actions, the “Derivative Actions”). On February 9, 2015 and February 20, 2015, three plaintiffs who filed SDNY Derivative Actions—Appolito, Hopkins and The Joel and Robin Staadecker Living Trust—voluntarily dismissed their actions without prejudice. The Derivative Actions seek money damages and other relief on behalf of the Company for, among other things, alleged breaches of fiduciary duty, abuse of control, gross mismanagement and unjust enrichment in connection with the alleged conduct underlying the claims asserted in the Securities Actions negligence and breach of contract. At a February 10, 2015 status conference, the court consolidated the SDNY Derivative Actions and directed the plaintiffs to file a consolidated amended complaint by March 10, 2015. The court set a deadline of April 3, 2015 for the defendants to respond to the consolidated complaint. On February 18, 2015, the parties to the New York Derivative Action entered into a stipulation setting a deadline of April 20, 2015 for the Company and defendants to respond to the complaint in that action. The Company and defendants are not yet required to respond to the complaints in the Maryland Derivative Actions.
On December 18, 2014, a former employee, Lisa McAlister, filed a defamation action against the Company and certain of its former officers and directors in the Supreme Court for the State of New York, captioned McAlister v. American Realty Capital Properties, Inc., et al., No. 14-162499. The complaint sought, among other things, compensatory and punitive damages and alleged that the October 29 8-K falsely blamed plaintiff for improper accounting and financial reporting practices. On January 26, 2015, the Company and the other defendants filed motions to dismiss plaintiff’s complaint. Subsequently, Ms. McAlister dismissed this action without prejudice.
On January 7, 2015, Ms. McAlister also filed a complaint, No. 2-4173-15-016, with the Occupational Safety and Health Administration of the United States Department of Labor. The complaint seeks, among other things, compensatory and punitive damages and asserts claims for wrongful termination of employment for allegedly reporting concerns relating to alleged improper accounting practices by the Company. Ms. McAlister has withdrawn the complaint without prejudice.
On January 15, 2015, the Company and certain of its former directors and officers were named as defendants in an individual securities fraud action filed in the United States District Court for the Southern District of New York, captioned Jet Capital Master Fund, L.P. v. American Realty Capital Properties, Inc., et al., No. 15-cv-307 (AKH) (the “Jet Capital Action”). The Jet Capital Action seeks money damages and asserts claims for alleged violations of Sections 10(b), 18 and 20(a) of the Securities Exchange Act of 1934 and Rule 10b-5 promulgated thereunder, as well as common law fraud under New York law in connection with the purchase of the Company’s securities. The court set a deadline of April 10 for the defendants to respond to the complaint.
On February 20, 2015, the Company, certain of its current and former directors and officers, and ARC Properties Operating Partnership L.P. (in addition to several other individuals and entities) were named as defendants in an individual securities fraud action filed in the United States District Court for the Southern District of New York, captioned Twin Securities, Inc. v. American Realty Capital Properties, Inc., et al., No. 15-cv-1291 (the “Twin Securities Action”). The Twin Securities Action seeks money damages and asserts claims for alleged violations of Sections 10(b), 14(a), 18, and 20(a) of the Securities Exchange Act of 1934 and Rules 10b-5 and 14a-9 promulgated thereunder, Sections 11, 12(a)(2), and 15 of the Securities Act of 1933, as well as common law fraud under New York law in connection with the purchase of the Company’s securities. The Company and defendants are not yet required to respond to the complaint in the Twin Securities Action.
F-89
Table of Contents
Real Estate and Accumulated Depreciation
Schedule III
December 31, 2013
(in thousands)
| Initial Costs | Costs Capitalized Subsequent to Acquisition |
Gross Amount Carried at December 31, 2013 (10) (11) |
||||||||||||||||||||||||||||||||
| Property |
City |
State |
Encumbrances at December 31, 2013 |
Land | Buildings, Fixtures and Improvements |
Accumulated Depreciation (12) (13) |
Date Acquired |
Date of Construction | ||||||||||||||||||||||||||
| 24 Hour Fitness |
Woodlands | TX | $ | — | (1) | $ | 2,690 | $ | 8,312 | $ | — | $ | 11,002 | $ | 135 | 9/24/2013 | 2001 | |||||||||||||||||
| 7-Eleven |
Sarasota | FL | — | (1) | 1,312 | 1,312 | — | 2,624 | 80 | 11/19/2012 | 2000 | |||||||||||||||||||||||
| 7-Eleven |
Gloucester | VA | — | (1) | 144 | 578 | — | 722 | 32 | 12/24/2012 | 1985 | |||||||||||||||||||||||
| 7-Eleven |
Hampton | VA | — | (1) | 69 | 624 | — | 693 | 35 | 12/24/2012 | 1986 | |||||||||||||||||||||||
| 7-Eleven |
Hampton | VA | — | (1) | 161 | 644 | — | 805 | 36 | 12/24/2012 | 1959 | |||||||||||||||||||||||
| Abbott Laboratories |
Waukegan | IL | 13,649 | 4,734 | 21,319 | — | 26,053 | 193 | 11/5/2013 | 2000 | ||||||||||||||||||||||||
| Abbott Laboratories |
Columbus | OH | — | (2) | 800 | 11,385 | — | 12,185 | 122 | 11/5/2013 | 2004 | |||||||||||||||||||||||
| Academy Sports |
Fayetteville | AR | — | 1,900 | 7,601 | — | 9,501 | 534 | 12/28/2012 | 2012 | ||||||||||||||||||||||||
| Academy Sports |
Dalton | GA | — | 998 | 5,656 | — | 6,654 | 331 | 2/20/2013 | 2012 | ||||||||||||||||||||||||
| Advance Auto |
Birmingham | AL | — | (1) | 330 | 494 | — | 824 | 23 | 2/28/2013 | 1999 | |||||||||||||||||||||||
| Advance Auto |
Birmingham | AL | — | (1) | 455 | 373 | — | 828 | 17 | 2/28/2013 | 1997 | |||||||||||||||||||||||
| Advance Auto |
Calera | AL | — | (1) | 723 | 723 | — | 1,446 | 41 | 12/27/2012 | 2008 | |||||||||||||||||||||||
| Advance Auto |
Dothan | AL | — | (1) | 326 | 326 | — | 652 | 18 | 12/31/2012 | 1997 | |||||||||||||||||||||||
| Advance Auto |
Enterprise | AL | — | (1) | 280 | 420 | — | 700 | 24 | 12/31/2012 | 1995 | |||||||||||||||||||||||
| Advance Auto |
Albany | GA | — | (1) | 210 | 629 | — | 839 | 35 | 12/31/2012 | 1995 | |||||||||||||||||||||||
| Advance Auto |
Cairo | GA | — | (1) | 140 | 326 | — | 466 | 18 | 12/31/2012 | 1993 | |||||||||||||||||||||||
| Advance Auto |
Hazlehurst | GA | — | (1) | 113 | 451 | — | 564 | 25 | 12/31/2012 | 1998 | |||||||||||||||||||||||
| Advance Auto |
Hinesville | GA | — | (1) | 352 | 430 | — | 782 | 24 | 12/31/2012 | 1994 | |||||||||||||||||||||||
| Advance Auto |
Perry | GA | — | (1) | 209 | 487 | — | 696 | 27 | 12/31/2012 | 1994 | |||||||||||||||||||||||
| Advance Auto |
Thomasville | GA | — | (1) | 251 | 377 | — | 628 | 21 | 12/31/2012 | 1997 | |||||||||||||||||||||||
| Advance Auto |
Auburn | IN | — | 337 | 1,347 | — | 1,684 | 132 | 3/29/2012 | 2007 | ||||||||||||||||||||||||
| Advance Auto |
Clinton | IN | — | (1) | 182 | 729 | — | 911 | 24 | 6/5/2013 | 2004 | |||||||||||||||||||||||
| Advance Auto |
Fort Wayne | IN | — | (1) | 193 | 450 | — | 643 | 21 | 2/28/2013 | 1998 | |||||||||||||||||||||||
| Advance Auto |
Fort Wayne | IN | — | (1) | 200 | 371 | — | 571 | 17 | 2/28/2013 | 1998 | |||||||||||||||||||||||
| Advance Auto |
Salina | KS | — | (1) | 195 | 782 | — | 977 | 29 | 4/30/2013 | 2006 | |||||||||||||||||||||||
| Advance Auto |
Barbournville | KY | — | (1) | 194 | 1,098 | — | 1,292 | 46 | 4/15/2013 | 2006 | |||||||||||||||||||||||
| Advance Auto |
Bardstown | KY | — | (1) | 272 | 1,090 | — | 1,362 | 66 | 12/10/2012 | 2005 | |||||||||||||||||||||||
| Advance Auto |
Brandenburg | KY | — | (1) | 186 | 742 | — | 928 | 45 | 12/10/2012 | 2005 | |||||||||||||||||||||||
F-90
Table of Contents
| Initial Costs | Costs Capitalized Subsequent to Acquisition |
Gross Amount Carried at December 31, 2013 (10) (11) |
||||||||||||||||||||||||||||||||
| Property |
City |
State |
Encumbrances at December 31, 2013 |
Land | Buildings, Fixtures and Improvements |
Accumulated Depreciation (12) (13) |
Date Acquired |
Date of Construction | ||||||||||||||||||||||||||
| Advance Auto |
Hardinsburg | KY | — | (1) | 94 | 845 | — | 939 | 51 | 12/10/2012 | 2007 | |||||||||||||||||||||||
| Advance Auto |
Inez | KY | — | (1) | 130 | 1,174 | — | 1,304 | 88 | 8/22/2012 | 2010 | |||||||||||||||||||||||
| Advance Auto |
Leitchfield | KY | — | (1) | 104 | 939 | — | 1,043 | 57 | 12/10/2012 | 2005 | |||||||||||||||||||||||
| Advance Auto |
West Liberty | KY | — | (1) | 249 | 996 | — | 1,245 | 42 | 4/15/2013 | 2006 | |||||||||||||||||||||||
| Advance Auto |
Rayne | LA | — | (1) | 122 | 490 | — | 612 | 16 | 5/21/2013 | 2000 | |||||||||||||||||||||||
| Advance Auto |
Caro | MI | — | (8) | 117 | 665 | — | 782 | 78 | 11/23/2011 | 2002 | |||||||||||||||||||||||
| Advance Auto |
Charlotte | MI | — | (8) | 123 | 697 | — | 820 | 82 | 11/23/2011 | 2002 | |||||||||||||||||||||||
| Advance Auto |
Flint | MI | — | (1) | 133 | 534 | — | 667 | 62 | 11/23/2011 | 2002 | |||||||||||||||||||||||
| Advance Auto |
Livonia | MI | — | (8) | 210 | 629 | 14 | 853 | 74 | 12/12/2011 | 2003 | |||||||||||||||||||||||
| Advance Auto |
Manistee | MI | — | (1) | 348 | 1,043 | — | 1,391 | 44 | 4/15/2013 | 2007 | |||||||||||||||||||||||
| Advance Auto |
Sault Ste. Marie | MI | — | (8) | 75 | 671 | — | 746 | 78 | 11/23/2011 | 2003 | |||||||||||||||||||||||
| Advance Auto |
Ypsilanti | MI | — | (1) | 85 | 483 | — | 568 | 57 | 11/23/2011 | 2002 | |||||||||||||||||||||||
| Advance Auto |
Eden | NC | — | (1) | 320 | 746 | — | 1,066 | 17 | 7/16/2013 | 2004 | |||||||||||||||||||||||
| Advance Auto |
Granite Falls | NC | — | (1) | 251 | 1,005 | — | 1,256 | 80 | 8/9/2012 | 2010 | |||||||||||||||||||||||
| Advance Auto |
Lakewood | NJ | — | (1) | 750 | 1,750 | — | 2,500 | 131 | 8/22/2012 | 2010 | |||||||||||||||||||||||
| Advance Auto |
Woodbury | NJ | — | (1) | 446 | 1,784 | — | 2,230 | 150 | 6/20/2012 | 2007 | |||||||||||||||||||||||
| Advance Auto |
Eaton | OH | — | (1) | 157 | 471 | — | 628 | 15 | 6/13/2013 | 1987 | |||||||||||||||||||||||
| Advance Auto |
Franklin | OH | — | (1) | 218 | 873 | — | 1,091 | 69 | 8/9/2012 | 1984 | |||||||||||||||||||||||
| Advance Auto |
Springfield | OH | — | (1) | 461 | 1,075 | — | 1,536 | 60 | 12/31/2012 | 2005 | |||||||||||||||||||||||
| Advance Auto |
Van Wert | OH | — | (1) | 33 | 630 | — | 663 | 21 | 6/13/2013 | 1998 | |||||||||||||||||||||||
| Advance Auto |
Warren | OH | — | 83 | 745 | — | 828 | 73 | 4/12/2012 | 2003 | ||||||||||||||||||||||||
| Advance Auto |
Oklahoma City | OK | — | (1) | 208 | 1,178 | — | 1,386 | 94 | 8/9/2012 | 2007 | |||||||||||||||||||||||
| Advance Auto |
Chambersburg | PA | — | (1) | 553 | 830 | — | 1,383 | 39 | 2/28/2013 | 1997 | |||||||||||||||||||||||
| Advance Auto |
Selinsgrove | PA | — | (1) | 99 | 891 | — | 990 | 29 | 6/3/2013 | 2003 | |||||||||||||||||||||||
| Advance Auto |
Titusville | PA | — | (1) | 207 | 1,172 | — | 1,379 | 71 | 12/12/2012 | 2010 | |||||||||||||||||||||||
| Advance Auto |
Chapin | SC | — | (1) | 395 | 922 | — | 1,317 | 78 | 6/20/2012 | 2007 | |||||||||||||||||||||||
| Advance Auto |
Chesterfield | SC | — | (1) | 131 | 745 | — | 876 | 63 | 6/27/2012 | 2008 | |||||||||||||||||||||||
| Advance Auto |
Greenwood | SC | — | 210 | 630 | — | 840 | 65 | 3/9/2012 | 1995 | ||||||||||||||||||||||||
| Advance Auto |
Sweetwater | TN | — | (1) | 360 | 839 | — | 1,199 | 51 | 11/29/2012 | 2006 | |||||||||||||||||||||||
| Advance Auto |
Alton | TX | — | (1) | 169 | 958 | — | 1,127 | 63 | 10/18/2012 | 2006 | |||||||||||||||||||||||
| Advance Auto |
Houston | TX | — | (3) | 248 | 991 | — | 1,239 | 125 | 9/30/2011 | 2006 | |||||||||||||||||||||||
| Advance Auto |
Houston | TX | — | (3) | 343 | 1,029 | — | 1,372 | 130 | 9/30/2011 | 2006 | |||||||||||||||||||||||
| Advance Auto |
Houston | TX | — | (1) | 837 | 685 | — | 1,522 | 51 | 8/21/2012 | 2007 | |||||||||||||||||||||||
| Advance Auto |
Pasadena | TX | — | (1) | 382 | 1,146 | — | 1,528 | 97 | 7/6/2012 | 2008 | |||||||||||||||||||||||
F-91
Table of Contents
| Initial Costs | Costs Capitalized Subsequent to Acquisition |
Gross Amount Carried at December 31, 2013 (10) (11) |
||||||||||||||||||||||||||||||||
| Property |
City |
State |
Encumbrances at December 31, 2013 |
Land | Buildings, Fixtures and Improvements |
Accumulated Depreciation (12) (13) |
Date Acquired |
Date of Construction | ||||||||||||||||||||||||||
| Advance Auto |
Fort Atkinson | WI | — | (1) | 353 | 824 | — | 1,177 | 15 | 8/26/2013 | 2004 | |||||||||||||||||||||||
| Advance Auto |
Kenosha | WI | — | (1) | 569 | 465 | — | 1,034 | 22 | 3/13/2013 | 2004 | |||||||||||||||||||||||
| Advance Auto |
St. Marys | WY | — | (1) | 309 | 928 | — | 1,237 | 52 | 12/28/2012 | 2007 | |||||||||||||||||||||||
| Aetna Life Insurance Company |
Fresno | CA | 16,043 | 3,405 | 22,343 | — | 25,748 | 207 | 11/5/2013 | 2008 | ||||||||||||||||||||||||
| Ale House |
Orlando | FL | — | (1) | 290 | 3,647 | — | 3,937 | 105 | 6/27/2013 | 1994 | |||||||||||||||||||||||
| Ale House |
Orlando | FL | — | (1) | 270 | 3,668 | — | 3,938 | 105 | 6/27/2013 | 1993 | |||||||||||||||||||||||
| Ale House |
Saint Petersburg | FL | — | 930 | 3,116 | — | 4,046 | 89 | 6/27/2013 | 1998 | ||||||||||||||||||||||||
| Allstate Insurance Company |
Charlotte | NC | 18,846 | 8,320 | 23,409 | — | 31,729 | 265 | 11/5/2013 | 1990 | ||||||||||||||||||||||||
| Allstate Insurance Company |
Roanoke | VA | 20,064 | 6,176 | 27,085 | — | 33,261 | 281 | 11/5/2013 | 1981 | ||||||||||||||||||||||||
| AMCOR |
Alhambra | MI | — | (1) | 7,143 | 8,730 | — | 15,873 | 488 | 1/24/2013 | 1966 | |||||||||||||||||||||||
| AMEC plc |
Houston | TX | 15,765 | 2,524 | 30,398 | — | 32,922 | 255 | 11/5/2013 | 2003 | ||||||||||||||||||||||||
| Ameriprise |
Ashwaubenon | WI | — | 751 | 14,260 | — | 15,011 | 631 | 1/25/2013 | 2000 | ||||||||||||||||||||||||
| AON Corporation |
Lincolnshire | IL | — | 5,337 | 124,776 | — | 130,113 | 7,297 | 11/16/2012 | 1998 | ||||||||||||||||||||||||
| Applebee’s |
Clinton | IA | — | (1) | 490 | 1,184 | — | 1,674 | 34 | 6/27/2013 | 1997 | |||||||||||||||||||||||
| Applebee’s |
Fort Dodge | IA | — | (1) | — | 1,363 | — | 1,363 | 39 | 6/27/2013 | 1997 | |||||||||||||||||||||||
| Applebee’s |
Marshalltown | IA | — | (1) | 660 | 1,175 | — | 1,835 | 34 | 6/27/2013 | 1997 | |||||||||||||||||||||||
| Applebee’s |
Mason City | IA | — | (1) | 340 | 1,495 | — | 1,835 | 43 | 6/27/2013 | 1997 | |||||||||||||||||||||||
| Applebee’s |
Muscatine | IA | — | (1) | 330 | 1,266 | — | 1,596 | 36 | 6/27/2013 | 1996 | |||||||||||||||||||||||
| Applebee’s |
Sterling | IL | — | (1) | 390 | 1,291 | — | 1,681 | 37 | 6/27/2013 | 1996 | |||||||||||||||||||||||
| Applebee’s |
Hopkinsville | KY | — | (1) | 460 | 1,265 | — | 1,725 | 36 | 6/27/2013 | 1997 | |||||||||||||||||||||||
| Applebee’s |
Greenville | SC | — | (1) | 600 | 2,166 | — | 2,766 | 62 | 6/27/2013 | 1999 | |||||||||||||||||||||||
| Applebee’s |
Antioch | TN | — | (1) | 470 | 878 | — | 1,348 | 25 | 6/27/2013 | 1991 | |||||||||||||||||||||||
| Applebee’s |
Clarksville | TN | — | (1) | 570 | 1,729 | — | 2,299 | 50 | 6/27/2013 | 1995 | |||||||||||||||||||||||
| Applebee’s |
Columbia | TN | — | (1) | 590 | 1,823 | — | 2,413 | 52 | 6/27/2013 | 1996 | |||||||||||||||||||||||
| Applebee’s |
Cookeville | TN | — | (1) | 410 | 1,128 | — | 1,538 | 32 | 6/27/2013 | 1993 | |||||||||||||||||||||||
| Applebee’s |
Hermitage | TN | — | (1) | 530 | 1,491 | — | 2,021 | 43 | 6/27/2013 | 1992 | |||||||||||||||||||||||
| Applebee’s |
Lebanon | TN | — | (1) | 460 | 1,120 | — | 1,580 | 32 | 6/27/2013 | 1998 | |||||||||||||||||||||||
| Applebee’s |
Madison | TN | — | (1) | 460 | 772 | — | 1,232 | 22 | 6/27/2013 | 1995 | |||||||||||||||||||||||
F-92
Table of Contents
| Initial Costs | Costs Capitalized Subsequent to Acquisition |
Gross Amount Carried at December 31, 2013 (10) (11) |
||||||||||||||||||||||||||||||||
| Property |
City |
State |
Encumbrances at December 31, 2013 |
Land | Buildings, Fixtures and Improvements |
Accumulated Depreciation (12) (13) |
Date Acquired |
Date of Construction | ||||||||||||||||||||||||||
| Arby’s |
Arab | AL | — | (1) | 40 | 887 | — | 927 | 25 | 6/27/2013 | 1988 | |||||||||||||||||||||||
| Arby’s |
Hampton Cove | AL | — | (1) | 310 | 986 | — | 1,296 | 27 | 6/27/2013 | 2007 | |||||||||||||||||||||||
| Arby’s |
Sacramento | CA | — | (1) | 520 | 195 | — | 715 | 5 | 6/27/2013 | 1981 | |||||||||||||||||||||||
| Arby’s |
Arvada | CO | — | (1) | 190 | 1,465 | — | 1,655 | 41 | 6/27/2013 | 1994 | |||||||||||||||||||||||
| Arby’s |
Orange Park | FL | — | (1) | 420 | 1,256 | — | 1,676 | 35 | 6/27/2013 | 1998 | |||||||||||||||||||||||
| Arby’s |
Canton | GA | — | (1) | 370 | 1,200 | — | 1,570 | 33 | 6/27/2013 | 1998 | |||||||||||||||||||||||
| Arby’s |
Douglasville | GA | — | (1) | 370 | 1,692 | — | 2,062 | 47 | 6/27/2013 | 1999 | |||||||||||||||||||||||
| Arby’s |
Suwanee | GA | — | (1) | 370 | 1,561 | — | 1,931 | 43 | 6/27/2013 | 1998 | |||||||||||||||||||||||
| Arby’s |
Avon | IN | — | (1) | 500 | 812 | — | 1,312 | 22 | 6/27/2013 | 1996 | |||||||||||||||||||||||
| Arby’s |
Indianapolis | IN | — | (1) | 530 | 1,236 | — | 1,766 | 34 | 6/27/2013 | 2000 | |||||||||||||||||||||||
| Arby’s |
Indianapolis | IN | — | (1) | 370 | 1,130 | — | 1,500 | 31 | 6/27/2013 | 1978 | |||||||||||||||||||||||
| Arby’s |
Kansas City | KS | — | (1) | 280 | 364 | — | 644 | 10 | 6/27/2013 | 1970 | |||||||||||||||||||||||
| Arby’s |
Salina | KS | — | (1) | 540 | 300 | — | 840 | 8 | 6/27/2013 | 1980 | |||||||||||||||||||||||
| Arby’s |
Topeka | KS | — | (1) | 240 | 291 | — | 531 | 8 | 6/27/2013 | 1979 | |||||||||||||||||||||||
| Arby’s |
Topeka | KS | — | (1) | 270 | 433 | — | 703 | 12 | 6/27/2013 | 1979 | |||||||||||||||||||||||
| Arby’s |
Alma | MI | — | (1) | 380 | 408 | — | 788 | 11 | 6/27/2013 | 1994 | |||||||||||||||||||||||
| Arby’s |
Chesterfield | MI | — | (1) | 210 | 841 | — | 1,051 | 23 | 6/27/2013 | 1990 | |||||||||||||||||||||||
| Arby’s |
Davison | MI | — | (1) | 420 | 631 | — | 1,051 | 17 | 6/27/2013 | 1980 | |||||||||||||||||||||||
| Arby’s |
Flint | MI | — | (1) | 110 | 1,422 | — | 1,532 | 39 | 6/27/2013 | 1979 | |||||||||||||||||||||||
| Arby’s |
Flint | MI | — | (1) | 230 | 1,428 | — | 1,658 | 40 | 6/27/2013 | 1962 | |||||||||||||||||||||||
| Arby’s |
Midland | MI | — | (1) | 340 | 753 | — | 1,093 | 21 | 6/27/2013 | 1994 | |||||||||||||||||||||||
| Arby’s |
Pontiac | MI | — | (1) | 180 | 962 | — | 1,142 | 27 | 6/27/2013 | 1968 | |||||||||||||||||||||||
| Arby’s |
Port Huron | MI | — | (1) | 210 | 868 | — | 1,078 | 24 | 6/27/2013 | 1975 | |||||||||||||||||||||||
| Arby’s |
Saginaw | MI | — | (1) | 310 | 1,110 | — | 1,420 | 31 | 6/27/2013 | 1970 | |||||||||||||||||||||||
| Arby’s |
South Haven | MI | — | (1) | 260 | 573 | — | 833 | 16 | 6/27/2013 | 1988 | |||||||||||||||||||||||
| Arby’s |
Walker | MI | — | (1) | 360 | 1,002 | — | 1,362 | 28 | 6/27/2013 | 1999 | |||||||||||||||||||||||
| Arby’s |
Fayetteville | NC | — | (1) | 420 | 2,001 | — | 2,421 | 55 | 6/27/2013 | 2006 | |||||||||||||||||||||||
| Arby’s |
Greensboro | NC | — | (1) | 300 | 906 | — | 1,206 | 25 | 6/27/2013 | 1990 | |||||||||||||||||||||||
| Arby’s |
Greenville | NC | — | (1) | 310 | 681 | — | 991 | 19 | 6/27/2013 | 1995 | |||||||||||||||||||||||
| Arby’s |
Jonesville | NC | — | (1) | 350 | 908 | — | 1,258 | 25 | 6/27/2013 | 1995 | |||||||||||||||||||||||
| Arby’s |
Kernersville | NC | — | (1) | 280 | 774 | — | 1,054 | 21 | 6/27/2013 | 1994 | |||||||||||||||||||||||
| Arby’s |
Kinston | NC | — | (1) | 350 | 832 | — | 1,182 | 23 | 6/27/2013 | 1995 | |||||||||||||||||||||||
F-93
Table of Contents
| Initial Costs | Costs Capitalized Subsequent to Acquisition |
Gross Amount Carried at December 31, 2013 (10) (11) |
||||||||||||||||||||||||||||||||
| Property |
City |
State |
Encumbrances at December 31, 2013 |
Land | Buildings, Fixtures and Improvements |
Accumulated Depreciation (12) (13) |
Date Acquired |
Date of Construction | ||||||||||||||||||||||||||
| Arby’s |
Lexington | NC | — | (1) | 360 | 873 | — | 1,233 | 24 | 6/27/2013 | 1992 | |||||||||||||||||||||||
| Arby’s |
Columbus | OH | — | (1) | 400 | 1,155 | — | 1,555 | 32 | 6/27/2013 | 1999 | |||||||||||||||||||||||
| Arby’s |
Reynoldsburg | OH | — | (1) | 370 | 945 | — | 1,315 | 26 | 6/27/2013 | 1998 | |||||||||||||||||||||||
| Arby’s |
Willard | OH | — | (1) | 230 | 599 | — | 829 | 17 | 6/27/2013 | 2005 | |||||||||||||||||||||||
| Arby’s |
Allentown | PA | — | (1) | 600 | 1,652 | — | 2,252 | 46 | 6/27/2013 | 1978 | |||||||||||||||||||||||
| Arby’s |
Carlisle | PA | — | (1) | 200 | 472 | — | 672 | 13 | 6/27/2013 | 1992 | |||||||||||||||||||||||
| Arby’s |
Hanover | PA | — | (1) | 400 | 921 | — | 1,321 | 26 | 6/27/2013 | 1994 | |||||||||||||||||||||||
| Arby’s |
Myrtle Beach | SC | — | (1) | 370 | 1,132 | — | 1,502 | 31 | 6/27/2013 | 1999 | |||||||||||||||||||||||
| Arby’s |
Amarillo | TX | — | (1) | 260 | 627 | — | 887 | 17 | 6/27/2013 | 1992 | |||||||||||||||||||||||
| AT&T |
Richardson | TX | 20,224 | 1,891 | 31,118 | — | 33,009 | 262 | 11/5/2013 | 1987 | ||||||||||||||||||||||||
| Auto Zone |
Chicago | IL | — | (1) | 698 | 1,047 | — | 1,745 | 39 | 4/30/2013 | 2007 | |||||||||||||||||||||||
| Bandana’s Bar-B-Q Restaurant |
Collinsville | IL | — | (1) | 340 | 627 | — | 967 | 18 | 6/27/2013 | 1987 | |||||||||||||||||||||||
| Bandana’s Bar-B-Q Restaurant |
Arnold | MO | — | (1) | 460 | 433 | — | 893 | 12 | 6/27/2013 | 1999 | |||||||||||||||||||||||
| Baxter International, Inc. |
Bloomington | IN | — | (2) | 1,310 | 8,216 | — | 9,526 | 84 | 11/5/2013 | 2004 | |||||||||||||||||||||||
| Bed Bath & Beyond |
Stockton | CA | — | 2,761 | 52,454 | — | 55,215 | 4,266 | 8/17/2012 | 2003 | ||||||||||||||||||||||||
| Big O Tires |
Los Lunas | NM | — | (1) | 316 | 1,265 | — | 1,581 | 116 | 6/1/2012 | 2006 | |||||||||||||||||||||||
| BJ’s Wholesale Club |
Canton | OH | — | 456 | 8,668 | — | 9,124 | 507 | 2/20/2013 | 1998 | ||||||||||||||||||||||||
| Black Angus |
Dublin | CA | — | (1) | 620 | 2,467 | — | 3,087 | 71 | 6/27/2013 | 1999 | |||||||||||||||||||||||
| Bojangles |
Winder | GA | — | (1) | 645 | 1,198 | — | 1,843 | 120 | 7/30/2012 | 2011 | |||||||||||||||||||||||
| Bojangles |
Biscoe | NC | — | (1) | 247 | 986 | — | 1,233 | 75 | 11/29/2012 | 2010 | |||||||||||||||||||||||
| Bojangles |
Boone | NC | — | (1) | 278 | 833 | — | 1,111 | 83 | 7/27/2012 | 1980 | |||||||||||||||||||||||
| Bojangles |
Dobson | NC | — | (1) | 251 | 1,004 | — | 1,255 | 100 | 7/30/2012 | 2010 | |||||||||||||||||||||||
| Bojangles |
Indian Trail | NC | — | (1) | 655 | 1,217 | — | 1,872 | 121 | 7/27/2012 | 2011 | |||||||||||||||||||||||
| Bojangles |
Morganton | NC | — | 566 | 1,321 | — | 1,887 | 132 | 7/27/2012 | 2010 | ||||||||||||||||||||||||
| Bojangles |
Roanoke Rapids | NC | — | (1) | 442 | 1,032 | — | 1,474 | 103 | 7/27/2012 | 2011 | |||||||||||||||||||||||
| Bojangles |
Southport | NC | — | (1) | 505 | 1,179 | — | 1,684 | 118 | 7/30/2012 | 2011 | |||||||||||||||||||||||
| Bojangles |
Chapin | SC | — | (1) | 577 | 1,071 | — | 1,648 | 107 | 8/9/2012 | 2009 | |||||||||||||||||||||||
| Bojangles |
Clinton | SC | — | (1) | 397 | 926 | — | 1,323 | 92 | 7/27/2012 | 2009 | |||||||||||||||||||||||
| Bojangles |
Greenwood | SC | — | (1) | 440 | 1,320 | — | 1,760 | 77 | 2/28/2013 | 2011 | |||||||||||||||||||||||
| Bojangles |
Moncks Corner | SC | — | (1) | 505 | 1,179 | — | 1,684 | 90 | 11/29/2012 | 2010 | |||||||||||||||||||||||
| Bojangles |
Walterboro | SC | — | (1) | 454 | 1,363 | — | 1,817 | 104 | 11/29/2012 | 2010 | |||||||||||||||||||||||
F-94
Table of Contents
| Initial Costs | Costs Capitalized Subsequent to Acquisition |
Gross Amount Carried at December 31, 2013 (10) (11) |
||||||||||||||||||||||||||||||||
| Property |
City |
State |
Encumbrances at December 31, 2013 |
Land | Buildings, Fixtures and Improvements |
Accumulated Depreciation (12) (13) |
Date Acquired |
Date of Construction | ||||||||||||||||||||||||||
| Boston Market |
Indianapolis | IN | — | (1) | 930 | — | — | 930 | — | 6/27/2013 | 1997 | |||||||||||||||||||||||
| Boston Market |
Indianapolis | IN | — | (1) | 410 | 1,070 | — | 1,480 | 30 | 6/27/2013 | 1997 | |||||||||||||||||||||||
| Boston Market |
Fayetteville | NC | — | (1) | 460 | 1,520 | — | 1,980 | 42 | 6/27/2013 | 1996 | |||||||||||||||||||||||
| Boston Market |
Raleigh | NC | — | (1) | 280 | 1,015 | — | 1,295 | 28 | 6/27/2013 | 1994 | |||||||||||||||||||||||
| Brangus Steakhouse |
Jasper | AL | — | (1) | 140 | 219 | — | 359 | 6 | 6/27/2013 | 1986 | |||||||||||||||||||||||
| Bruegger’s Bagels |
Iowa City | IA | — | (1) | 40 | 379 | — | 419 | 10 | 6/27/2013 | 2013 | |||||||||||||||||||||||
| Bruegger’s Bagels |
Raleigh | NC | — | (1) | 230 | 654 | — | 884 | 18 | 6/27/2013 | 1997 | |||||||||||||||||||||||
| Buca di Beppo Italian |
Wheeling | IL | — | (1) | 450 | 1,272 | — | 1,722 | 36 | 6/27/2013 | 1975 | |||||||||||||||||||||||
| Buca di Beppo Italian |
Westlake | OH | — | (1) | 370 | 887 | — | 1,257 | 25 | 6/27/2013 | 1900 | |||||||||||||||||||||||
| Bunge North America, Inc. |
Fort Worth | TX | 6,262 | 1,100 | 8,433 | — | 9,533 | 76 | 11/5/2013 | 2005 | ||||||||||||||||||||||||
| Burger King |
Tucson | AZ | — | (1) | 300 | 1,307 | — | 1,607 | 36 | 6/27/2013 | 1980 | |||||||||||||||||||||||
| Burger King |
Atlanta | GA | — | (1) | 380 | 499 | — | 879 | 14 | 6/27/2013 | 1984 | |||||||||||||||||||||||
| Burger King |
Fort Oglethorpe | GA | — | (1) | 170 | 2,175 | — | 2,345 | 60 | 6/27/2013 | 1979 | |||||||||||||||||||||||
| Burger King |
Marietta | GA | — | (1) | 350 | 916 | — | 1,266 | 25 | 6/27/2013 | 1983 | |||||||||||||||||||||||
| Burger King |
Chicago | IL | — | (1) | 580 | 1,413 | — | 1,993 | 39 | 6/27/2013 | 1996 | |||||||||||||||||||||||
| Burger King |
Highland | IN | — | (1) | 410 | 992 | — | 1,402 | 27 | 6/27/2013 | 1996 | |||||||||||||||||||||||
| Burger King |
Madisonville | KY | — | (1) | 550 | 1,067 | — | 1,617 | 30 | 6/27/2013 | 1980 | |||||||||||||||||||||||
| Burger King |
Caribou | ME | — | (1) | 770 | 440 | — | 1,210 | 12 | 6/27/2013 | 1978 | |||||||||||||||||||||||
| Burger King |
Grand Rapids | MI | — | (1) | 490 | 545 | — | 1,035 | 15 | 6/27/2013 | 1968 | |||||||||||||||||||||||
| Burger King |
Grand Rapids | MI | — | (1) | 260 | 780 | — | 1,040 | 22 | 6/27/2013 | 1993 | |||||||||||||||||||||||
| Burger King |
Holland | MI | — | (1) | 420 | 707 | — | 1,127 | 20 | 6/27/2013 | 1978 | |||||||||||||||||||||||
| Burger King |
Sparta | MI | — | (1) | 640 | 570 | — | 1,210 | 16 | 6/27/2013 | 1992 | |||||||||||||||||||||||
| Burger King |
Walled Lake | MI | — | (1) | 470 | 433 | — | 903 | 12 | 6/27/2013 | 1982 | |||||||||||||||||||||||
| Burger King |
Durham | NC | — | (1) | 170 | 352 | — | 522 | 10 | 6/27/2013 | 1990 | |||||||||||||||||||||||
F-95
Table of Contents
| Initial Costs | Costs Capitalized Subsequent to Acquisition |
Gross Amount Carried at December 31, 2013 (10) (11) |
||||||||||||||||||||||||||||||||
| Property |
City |
State |
Encumbrances at December 31, 2013 |
Land | Buildings, Fixtures and Improvements |
Accumulated Depreciation (12) (13) |
Date Acquired |
Date of Construction | ||||||||||||||||||||||||||
| Burger King |
Rockingham | NC | — | 430 | 1,171 | — | 1,601 | 32 | 6/27/2013 | 1980 | ||||||||||||||||||||||||
| Burger King |
Edison | NJ | — | (1) | 480 | 1,075 | — | 1,555 | 30 | 6/27/2013 | 1985 | |||||||||||||||||||||||
| Burger King |
Manahawkin | NJ | — | (1) | 310 | 748 | — | 1,058 | 21 | 6/27/2013 | 1980 | |||||||||||||||||||||||
| Burger King |
Elko | NV | — | (1) | 260 | 1,001 | — | 1,261 | 28 | 6/27/2013 | 1982 | |||||||||||||||||||||||
| Burger King |
Albany | NY | — | (1) | 330 | 850 | — | 1,180 | 24 | 6/27/2013 | 1980 | |||||||||||||||||||||||
| Burger King |
Central Square | NY | — | (1) | 500 | 1,189 | — | 1,689 | 33 | 6/27/2013 | 1992 | |||||||||||||||||||||||
| Burger King |
Cohoes | NY | — | (1) | 270 | 563 | — | 833 | 16 | 6/27/2013 | 1989 | |||||||||||||||||||||||
| Burger King |
Montgomery | NY | — | (1) | 480 | 1,042 | — | 1,522 | 29 | 6/27/2013 | 1981 | |||||||||||||||||||||||
| Burger King |
Schenectady | NY | — | (1) | 380 | 936 | — | 1,316 | 26 | 6/27/2013 | 1984 | |||||||||||||||||||||||
| Burger King |
Willoughby | OH | — | (1) | 410 | 1,005 | — | 1,415 | 28 | 6/27/2013 | 1980 | |||||||||||||||||||||||
| Burger King |
Ardmore | OK | — | (1) | 270 | 1,023 | — | 1,293 | 28 | 6/27/2013 | 1979 | |||||||||||||||||||||||
| Burger King |
Corvallis | OR | — | (1) | 170 | 195 | — | 365 | 5 | 6/27/2013 | 1977 | |||||||||||||||||||||||
| Burger King |
Roseburg | OR | — | (1) | 350 | 886 | — | 1,236 | 25 | 6/27/2013 | 1981 | |||||||||||||||||||||||
| Burger King |
Old Forge | PA | — | (1) | 390 | 905 | — | 1,295 | 25 | 6/27/2013 | 1977 | |||||||||||||||||||||||
| Burger King |
Gaffney | SC | — | (1) | 370 | 880 | — | 1,250 | 24 | 6/27/2013 | 1979 | |||||||||||||||||||||||
| Burger King |
Greenville | SC | — | (1) | 420 | 571 | — | 991 | 16 | 6/27/2013 | 1982 | |||||||||||||||||||||||
| Burger King |
Chattanooga | TN | — | (1) | 740 | 1,591 | — | 2,331 | 44 | 6/27/2013 | 1997 | |||||||||||||||||||||||
| Burger King |
Cleburne | TX | — | (1) | 300 | 603 | — | 903 | 17 | 6/27/2013 | 1985 | |||||||||||||||||||||||
| Burger King |
Bluefield | WV | — | (1) | 210 | 1,163 | — | 1,373 | 32 | 6/27/2013 | 1982 | |||||||||||||||||||||||
| Cadbury Holdings Limited |
Whippany | NJ | 31,793 | 2,767 | 38,018 | — | 40,785 | 304 | 11/5/2013 | 2005 | ||||||||||||||||||||||||
| Capital One Financial Corporation |
Plano | TX | — | (2) | 8,440 | 23,212 | 191 | 31,843 | 298 | 11/5/2013 | 2005 | |||||||||||||||||||||||
| Captain D’s |
Statesboro | GA | — | (1) | 350 | 401 | — | 751 | 11 | 6/27/2013 | 1974 | |||||||||||||||||||||||
| Captain D’s |
Southaven | MS | — | (1) | 270 | 564 | — | 834 | 16 | 6/27/2013 | 1992 | |||||||||||||||||||||||
| Captain D’s |
Memphis | TN | — | (1) | 230 | 338 | — | 568 | 9 | 6/27/2013 | 2000 | |||||||||||||||||||||||
| Captain D’s |
Dallas | TX | — | (1) | 160 | 535 | — | 695 | 15 | 6/27/2013 | 1979 | |||||||||||||||||||||||
| Captain D’s |
Grand Prairie | TX | — | (1) | 260 | 338 | — | 598 | 9 | 6/27/2013 | 1987 | |||||||||||||||||||||||
| Caribou Coffee |
Grosse Pointe Woods | MI | — | (1) | 140 | 1,046 | — | 1,186 | 29 | 6/27/2013 | 1982 | |||||||||||||||||||||||
| Carlos O’Kelly’s |
Mason City | IA | — | (1) | 290 | 1,255 | — | 1,545 | 36 | 6/27/2013 | 1955 | |||||||||||||||||||||||
| Carlos O’Kelly’s |
Bloomington | IL | — | (1) | 270 | 1,375 | — | 1,645 | 39 | 6/27/2013 | 1990 | |||||||||||||||||||||||
| Carlos O’Kelly’s |
Springfield | MO | — | (1) | 840 | 730 | — | 1,570 | 21 | 6/27/2013 | 1992 | |||||||||||||||||||||||
| Charleston’s |
Carmel | IN | — | (1) | 140 | 3,016 | — | 3,156 | 86 | 6/27/2013 | 1999 | |||||||||||||||||||||||
| Check City |
Taylorsville | UT | — | (1) | 180 | 953 | — | 1,133 | 27 | 6/27/2013 | 1997 | |||||||||||||||||||||||
F-96
Table of Contents
| Initial Costs | Costs Capitalized Subsequent to Acquisition |
Gross Amount Carried at December 31, 2013 (10) (11) |
||||||||||||||||||||||||||||||||
| Property |
City |
State |
Encumbrances at December 31, 2013 |
Land | Buildings, Fixtures and Improvements |
Accumulated Depreciation (12) (13) |
Date Acquired |
Date of Construction | ||||||||||||||||||||||||||
| Checkers |
Huntsville | AL | — | (1) | 689 | — | — | 689 | — | 6/27/2013 | 1993 | |||||||||||||||||||||||
| Checkers |
Hollywood | FL | — | (1) | 160 | 2,220 | — | 2,380 | 64 | 6/27/2013 | 1993 | |||||||||||||||||||||||
| Checkers |
Lauderhill | FL | — | (1) | 280 | 1,951 | — | 2,231 | 56 | 6/27/2013 | 1996 | |||||||||||||||||||||||
| Checkers |
Plantation | FL | — | (1) | 220 | 1,461 | — | 1,681 | 42 | 6/27/2013 | 1994 | |||||||||||||||||||||||
| Checkers |
Fayetteville | GA | — | (1) | 681 | — | — | 681 | — | 6/27/2013 | 1992 | |||||||||||||||||||||||
| Chevys |
Greenbelt | MD | — | (1) | 530 | 2,399 | — | 2,929 | 69 | 6/27/2013 | 1994 | |||||||||||||||||||||||
| Chevys |
Lake Oswego | OR | — | (1) | 590 | 1,693 | — | 2,283 | 49 | 6/27/2013 | 1995 | |||||||||||||||||||||||
| Chili’s |
Fayetteville | AR | — | (1) | 1,370 | 1,714 | — | 3,084 | 49 | 6/27/2013 | 1991 | |||||||||||||||||||||||
| Chili’s |
Boise | ID | — | (1) | 400 | 751 | — | 1,151 | 22 | 6/27/2013 | 1992 | |||||||||||||||||||||||
| Chili’s |
Riverdale | UT | — | (1) | 800 | 899 | — | 1,699 | 26 | 6/27/2013 | 1993 | |||||||||||||||||||||||
| Chili’s |
Cheyenne | WY | — | (1) | 270 | 815 | — | 1,085 | 23 | 6/27/2013 | 1994 | |||||||||||||||||||||||
| Chipper’s Grill |
Streator | IL | — | (1) | 190 | 255 | — | 445 | 7 | 6/27/2013 | 1988 | |||||||||||||||||||||||
| Cimarex Energy Company |
Tulsa | OK | 30,676 | 2,802 | 68,732 | — | 71,534 | 550 | 11/5/2013 | In process | ||||||||||||||||||||||||
| Circle K |
Phoenix | AZ | — | (1) | 344 | 1,377 | — | 1,721 | 129 | 5/4/2012 | 1986 | |||||||||||||||||||||||
| Circle K |
Martinez | GA | — | (1) | 348 | 813 | — | 1,161 | 61 | 8/28/2012 | 2003 | |||||||||||||||||||||||
| Circle K |
Akron | OH | — | (1) | 675 | 1,254 | — | 1,929 | 88 | 9/27/2012 | 1996 | |||||||||||||||||||||||
| Citizens Bank |
Colchester | CT | — | (1) | 185 | 1,049 | — | 1,234 | 70 | 9/26/2012 | 1981 | |||||||||||||||||||||||
| Citizens Bank |
Deep River | CT | — | (1) | 453 | 1,812 | — | 2,265 | 121 | 9/26/2012 | 1851 | |||||||||||||||||||||||
| Citizens Bank |
East Hampton | CT | — | (7) | 312 | 935 | — | 1,247 | 84 | 4/26/2012 | 1984 | |||||||||||||||||||||||
| Citizens Bank |
East Lyme | CT | — | (1) | 258 | 1,032 | — | 1,290 | 69 | 9/26/2012 | 1972 | |||||||||||||||||||||||
| Citizens Bank |
Hamden | CT | — | (1) | 581 | 475 | — | 1,056 | 32 | 9/26/2012 | 1893 | |||||||||||||||||||||||
| Citizens Bank |
Higganum | CT | — | (9) | 171 | 971 | — | 1,142 | 219 | 10/1/2008 | 1983 | |||||||||||||||||||||||
| Citizens Bank |
Montville | CT | — | (1) | 413 | 2,342 | — | 2,755 | 157 | 9/26/2012 | 1984 | |||||||||||||||||||||||
| Citizens Bank |
New London | CT | — | (1) | 94 | 534 | — | 628 | 121 | 10/1/2008 | 1900 | |||||||||||||||||||||||
| Citizens Bank |
Stonington | CT | — | (1) | 104 | 937 | — | 1,041 | 54 | 12/14/2012 | 1982 | |||||||||||||||||||||||
| Citizens Bank |
Stonington | CT | — | (1) | 190 | 1,079 | — | 1,269 | 72 | 9/26/2012 | 1960 | |||||||||||||||||||||||
| Citizens Bank |
Lewes | DE | — | (1) | 102 | 916 | — | 1,018 | 41 | 2/22/2013 | 1968 | |||||||||||||||||||||||
| Citizens Bank |
Smyrna | DE | — | (9) | 183 | 1,036 | — | 1,219 | 215 | 3/1/2009 | 1940 | |||||||||||||||||||||||
| Citizens Bank |
Wilmington | DE | — | (7) | 250 | 464 | — | 714 | 41 | 4/26/2012 | 1950 | |||||||||||||||||||||||
| Citizens Bank |
Wilmington | DE | — | (7) | 299 | 299 | — | 598 | 27 | 4/26/2012 | 1981 | |||||||||||||||||||||||
| Citizens Bank |
Alsip | IL | — | (1) | 226 | 1,280 | — | 1,506 | 289 | 10/1/2008 | 1981 | |||||||||||||||||||||||
| Citizens Bank |
Calumet City | IL | — | (7) | 168 | 393 | — | 561 | 35 | 4/26/2012 | 1975 | |||||||||||||||||||||||
F-97
Table of Contents
| Initial Costs | Costs Capitalized Subsequent to Acquisition |
Gross Amount Carried at December 31, 2013 (10) (11) |
||||||||||||||||||||||||||||||||
| Property |
City |
State |
Encumbrances at December 31, 2013 |
Land | Buildings, Fixtures and Improvements |
Accumulated Depreciation (12) (13) |
Date Acquired |
Date of Construction | ||||||||||||||||||||||||||
| Citizens Bank |
Chicago | IL | — | (7) | 189 | 81 | — | 270 | 7 | 4/26/2012 | 1990 | |||||||||||||||||||||||
| Citizens Bank |
Chicago | IL | — | (1) | 267 | 1,511 | — | 1,778 | 341 | 10/1/2008 | 1923 | |||||||||||||||||||||||
| Citizens Bank |
Chicago | IL | — | (1) | 191 | 1,082 | — | 1,273 | 244 | 10/1/2008 | 1979 | |||||||||||||||||||||||
| Citizens Bank |
Elmwood Park | IL | — | (1) | 431 | 2,441 | — | 2,872 | 481 | 6/1/2009 | 1977 | |||||||||||||||||||||||
| Citizens Bank |
Evergreen Park | IL | — | (1) | 167 | 944 | — | 1,111 | 213 | 10/1/2008 | 1982 | |||||||||||||||||||||||
| Citizens Bank |
Lyons | IL | — | (1) | 214 | 1,212 | — | 1,426 | 274 | 10/1/2008 | 1957 | |||||||||||||||||||||||
| Citizens Bank |
Olympia Fields | IL | — | (7) | 426 | 1,704 | — | 2,130 | 152 | 4/26/2012 | 1974 | |||||||||||||||||||||||
| Citizens Bank |
Wilmington | IL | — | (1) | 330 | 1,872 | — | 2,202 | 349 | 9/1/2009 | 1964 | |||||||||||||||||||||||
| Citizens Bank |
Dorchester | MA | — | 386 | 386 | — | 772 | 34 | 4/26/2012 | 1960 | ||||||||||||||||||||||||
| Citizens Bank |
Ludlow | MA | — | (1) | 810 | 540 | — | 1,350 | 36 | 9/26/2012 | 1948 | |||||||||||||||||||||||
| Citizens Bank |
Malden | MA | — | (1) | 488 | 596 | — | 1,084 | 40 | 9/26/2012 | 1920 | |||||||||||||||||||||||
| Citizens Bank |
Malden | MA | — | 484 | 1,935 | — | 2,419 | 130 | 9/26/2012 | 1988 | ||||||||||||||||||||||||
| Citizens Bank |
Medford | MA | — | 589 | 1,094 | — | 1,683 | 73 | 9/26/2012 | 1938 | ||||||||||||||||||||||||
| Citizens Bank |
New Bedford | MA | — | (1) | 297 | 694 | — | 991 | 46 | 9/26/2012 | 1983 | |||||||||||||||||||||||
| Citizens Bank |
Randolph | MA | — | 480 | 1,439 | — | 1,919 | 96 | 9/26/2012 | 1979 | ||||||||||||||||||||||||
| Citizens Bank |
Somerville | MA | — | (1) | 561 | 561 | — | 1,122 | 38 | 9/26/2012 | 1940 | |||||||||||||||||||||||
| Citizens Bank |
South Dennis | MA | — | (1) | — | 1,294 | — | 1,294 | 75 | 12/14/2012 | 1986 | |||||||||||||||||||||||
| Citizens Bank |
Springfield | MA | — | (1) | 187 | 747 | — | 934 | 27 | 5/10/2013 | 1975 | |||||||||||||||||||||||
| Citizens Bank |
Tewksbury | MA | — | (7) | 266 | 1,063 | — | 1,329 | 95 | 4/26/2012 | 1998 | |||||||||||||||||||||||
| Citizens Bank |
Watertown | MA | — | (1) | 443 | 542 | — | 985 | 36 | 9/26/2012 | 1950 | |||||||||||||||||||||||
| Citizens Bank |
Wilbraham | MA | — | (7) | 148 | 591 | — | 739 | 53 | 4/26/2012 | 1967 | |||||||||||||||||||||||
| Citizens Bank |
Winthrop | MA | — | (1) | 390 | 724 | — | 1,114 | 48 | 9/26/2012 | 1974 | |||||||||||||||||||||||
| Citizens Bank |
Woburn | MA | — | (1) | 350 | 816 | — | 1,166 | 47 | 12/14/2012 | 1991 | |||||||||||||||||||||||
F-98
Table of Contents
| Initial Costs | Costs Capitalized Subsequent to Acquisition |
Gross Amount Carried at December 31, 2013 (10) (11) |
||||||||||||||||||||||||||||||||
| Property |
City |
State |
Encumbrances at December 31, 2013 |
Land | Buildings, Fixtures and Improvements |
Accumulated Depreciation (12) (13) |
Date Acquired |
Date of Construction | ||||||||||||||||||||||||||
| Citizens Bank |
Clinton Township | MI | — | (1) | 574 | 3,250 | — | 3,824 | 746 | 9/1/2008 | 1970 | |||||||||||||||||||||||
| Citizens Bank |
Dearborn | MI | — | (1) | 434 | 2,461 | — | 2,895 | 459 | 9/1/2009 | 1977 | |||||||||||||||||||||||
| Citizens Bank |
Dearborn | MI | — | (1) | 385 | 2,184 | — | 2,569 | 407 | 9/1/2009 | 1974 | |||||||||||||||||||||||
| Citizens Bank |
Detroit | MI | — | (1) | 112 | 636 | — | 748 | 148 | 8/1/2008 | 1958 | |||||||||||||||||||||||
| Citizens Bank |
Detroit | MI | — | (1) | 204 | 1,159 | — | 1,363 | 270 | 8/1/2008 | 1956 | |||||||||||||||||||||||
| Citizens Bank |
Grosse Pointe | MI | — | (1) | 410 | 2,322 | — | 2,732 | 508 | 12/1/2008 | 1975 | |||||||||||||||||||||||
| Citizens Bank |
Harper Woods | MI | — | (1) | 207 | 1,171 | — | 1,378 | 273 | 8/1/2008 | 1983 | |||||||||||||||||||||||
| Citizens Bank |
Highland Park | MI | — | (1) | 150 | 848 | — | 998 | 198 | 8/1/2008 | 1967 | |||||||||||||||||||||||
| Citizens Bank |
Lathrup Village | MI | — | (1) | 283 | 1,602 | — | 1,885 | 362 | 10/1/2008 | 1980 | |||||||||||||||||||||||
| Citizens Bank |
Livonia | MI | — | (1) | 261 | 1,476 | — | 1,737 | 344 | 8/1/2008 | 1959 | |||||||||||||||||||||||
| Citizens Bank |
Richmond | MI | — | (1) | 168 | 951 | — | 1,119 | 222 | 8/1/2008 | 1980 | |||||||||||||||||||||||
| Citizens Bank |
Southfield | MI | — | (1) | 283 | 1,605 | — | 1,888 | 368 | 9/1/2008 | 1975 | |||||||||||||||||||||||
| Citizens Bank |
St. Clair Shores | MI | — | (1) | 309 | 1,748 | — | 2,057 | 407 | 8/1/2008 | 1961 | |||||||||||||||||||||||
| Citizens Bank |
Utica | MI | — | (1) | 376 | 2,133 | — | 2,509 | 466 | 12/1/2008 | 1982 | |||||||||||||||||||||||
| Citizens Bank |
Warren | MI | — | (1) | 178 | 1,009 | — | 1,187 | 228 | 10/1/2008 | 1963 | |||||||||||||||||||||||
| Citizens Bank |
Keene | NH | — | 132 | 2,511 | — | 2,643 | 146 | 12/14/2012 | 1900 | ||||||||||||||||||||||||
| Citizens Bank |
Manchester | NH | — | (1) | — | 1,568 | — | 1,568 | 91 | 12/14/2012 | 1985 | |||||||||||||||||||||||
| Citizens Bank |
Manchester | NH | — | (1) | 640 | 782 | — | 1,422 | 52 | 9/26/2012 | 1941 | |||||||||||||||||||||||
| Citizens Bank |
Ossipee | NH | — | (7) | 176 | 264 | — | 440 | 24 | 4/26/2012 | 1980 | |||||||||||||||||||||||
| Citizens Bank |
Pelham | NH | — | (7) | 113 | 340 | — | 453 | 30 | 4/26/2012 | 1983 | |||||||||||||||||||||||
| Citizens Bank |
Pittsfield | NH | — | (1) | 160 | 908 | — | 1,068 | 205 | 10/1/2008 | 1976 | |||||||||||||||||||||||
| Citizens Bank |
Rollinsford | NH | — | (1) | 78 | 444 | — | 522 | 100 | 10/1/2008 | 1977 | |||||||||||||||||||||||
| Citizens Bank |
Salem | NH | — | (1) | 328 | 1,312 | — | 1,640 | 76 | 12/14/2012 | 1980 | |||||||||||||||||||||||
| Citizens Bank |
Haddon Heights | NJ | — | (1) | 316 | 948 | — | 1,264 | 21 | 7/23/2013 | 1960 | |||||||||||||||||||||||
| Citizens Bank |
Marlton | NJ | — | (7) | 444 | 825 | — | 1,269 | 74 | 4/26/2012 | 1988 | |||||||||||||||||||||||
| Citizens Bank |
Albany | NY | — | (9) | 232 | 1,315 | — | 1,547 | 245 | 9/1/2009 | 1994 | |||||||||||||||||||||||
| Citizens Bank |
Amherst (Buffalo) | NY | — | (9) | 238 | 1,348 | — | 1,586 | 266 | 6/1/2009 | 1995 | |||||||||||||||||||||||
| Citizens Bank |
East Aurora | NY | — | (9) | 162 | 919 | — | 1,081 | 181 | 6/1/2009 | 1996 | |||||||||||||||||||||||
| Citizens Bank |
Greene | NY | — | (9) | 216 | 1,227 | — | 1,443 | 229 | 9/1/2009 | 1994 | |||||||||||||||||||||||
| Citizens Bank |
Johnstown | NY | — | (9) | 163 | 923 | — | 1,086 | 172 | 9/1/2009 | 1994 | |||||||||||||||||||||||
| Citizens Bank |
Port Jervis | NY | — | (9) | 143 | 811 | — | 954 | 169 | 3/1/2009 | 1964 | |||||||||||||||||||||||
| Citizens Bank |
Rochester | NY | — | (9) | 166 | 943 | — | 1,109 | 186 | 6/1/2009 | 1962 | |||||||||||||||||||||||
F-99
Table of Contents
| Initial Costs | Costs Capitalized Subsequent to Acquisition |
Gross Amount Carried at December 31, 2013 (10) (11) |
||||||||||||||||||||||||||||||||
| Property |
City |
State |
Encumbrances at December 31, 2013 |
Land | Buildings, Fixtures and Improvements |
Accumulated Depreciation (12) (13) |
Date Acquired |
Date of Construction | ||||||||||||||||||||||||||
| Citizens Bank |
Schenectady | NY | — | (9) | 292 | 1,655 | — | 1,947 | 309 | 9/1/2009 | 1994 | |||||||||||||||||||||||
| Citizens Bank |
Vails Gate | NY | — | (9) | 284 | 1,610 | — | 1,894 | 300 | 9/1/2009 | 1968 | |||||||||||||||||||||||
| Citizens Bank |
Whitesboro | NY | — | (9) | 130 | 739 | — | 869 | 138 | 9/1/2009 | 1994 | |||||||||||||||||||||||
| Citizens Bank |
Alliance | OH | — | (1) | 204 | 1,156 | — | 1,360 | 274 | 7/1/2008 | 1972 | |||||||||||||||||||||||
| Citizens Bank |
Bedford | OH | — | (7) | 175 | 699 | — | 874 | 62 | 4/26/2012 | 2005 | |||||||||||||||||||||||
| Citizens Bank |
Boardman | OH | — | (1) | 280 | 1,589 | — | 1,869 | 376 | 7/1/2008 | 1984 | |||||||||||||||||||||||
| Citizens Bank |
Broadview Heights | OH | — | (1) | 201 | 1,140 | — | 1,341 | 237 | 3/1/2009 | 2000 | |||||||||||||||||||||||
| Citizens Bank |
Brunswick | OH | — | (1) | 186 | 1,057 | — | 1,243 | 250 | 7/1/2008 | 2004 | |||||||||||||||||||||||
| Citizens Bank |
Cleveland | OH | — | (1) | 239 | 1,357 | — | 1,596 | 321 | 7/1/2008 | 2003 | |||||||||||||||||||||||
| Citizens Bank |
Cleveland | OH | — | (1) | 210 | 1,190 | — | 1,400 | 282 | 7/1/2008 | 1950 | |||||||||||||||||||||||
| Citizens Bank |
Cleveland | OH | — | (1) | 182 | 1,031 | — | 1,213 | 244 | 7/1/2008 | 1960 | |||||||||||||||||||||||
| Citizens Bank |
Fairlawn | OH | — | 511 | 2,045 | — | 2,556 | 119 | 12/14/2012 | 1979 | ||||||||||||||||||||||||
| Citizens Bank |
Lakewood | OH | — | (1) | 196 | 1,111 | — | 1,307 | 207 | 9/1/2009 | 1965 | |||||||||||||||||||||||
| Citizens Bank |
Louisville | OH | — | (1) | 191 | 1,080 | — | 1,271 | 255 | 7/1/2008 | 1960 | |||||||||||||||||||||||
| Citizens Bank |
Massillon | OH | — | (1) | 287 | 1,624 | — | 1,911 | 384 | 7/1/2008 | 1976 | |||||||||||||||||||||||
| Citizens Bank |
Massillon | OH | — | (1) | 212 | 1,202 | — | 1,414 | 284 | 7/1/2008 | 1958 | |||||||||||||||||||||||
| Citizens Bank |
Mentor | OH | — | (1) | 178 | 1,011 | — | 1,189 | 228 | 10/1/2008 | 1976 | |||||||||||||||||||||||
| Citizens Bank |
Northfield | OH | — | (1) | 317 | 1,797 | — | 2,114 | 406 | 10/1/2008 | 1960 | |||||||||||||||||||||||
| Citizens Bank |
Parma | OH | — | (7) | 248 | 744 | — | 992 | 66 | 4/26/2012 | 1972 | |||||||||||||||||||||||
| Citizens Bank |
Parma | OH | — | (1) | 475 | 581 | — | 1,056 | 34 | 12/14/2012 | 1971 | |||||||||||||||||||||||
| Citizens Bank |
Rocky River | OH | — | (1) | 283 | 1,602 | — | 1,885 | 299 | 9/1/2009 | 1965 | |||||||||||||||||||||||
| Citizens Bank |
South Russell | OH | — | (1) | 106 | 957 | — | 1,063 | 56 | 12/14/2012 | 1981 | |||||||||||||||||||||||
| Citizens Bank |
Wadsworth | OH | — | (1) | 158 | 893 | — | 1,051 | 211 | 7/1/2008 | 1994 | |||||||||||||||||||||||
| Citizens Bank |
Willoughby | OH | — | (1) | 395 | 2,239 | — | 2,634 | 506 | 10/1/2008 | 1920 | |||||||||||||||||||||||
| Citizens Bank |
Allison Park | PA | — | (1) | 314 | 733 | — | 1,047 | 49 | 9/26/2012 | 1972 | |||||||||||||||||||||||
| Citizens Bank |
Altoona | PA | — | (1) | 153 | 459 | — | 612 | 27 | 12/14/2012 | 1971 | |||||||||||||||||||||||
| Citizens Bank |
Ambridge | PA | — | (9) | 215 | 1,217 | — | 1,432 | 227 | 9/1/2009 | 1925 | |||||||||||||||||||||||
| Citizens Bank |
Ashley | PA | — | (1) | 225 | 675 | — | 900 | 39 | 12/14/2012 | 1928 | |||||||||||||||||||||||
| Citizens Bank |
Beaver Falls | PA | — | (1) | 138 | 553 | — | 691 | 37 | 9/26/2012 | 1968 | |||||||||||||||||||||||
| Citizens Bank |
Carlisle | PA | — | (7) | 234 | 546 | — | 780 | 49 | 4/26/2012 | 1960+ | |||||||||||||||||||||||
| Citizens Bank |
Dallas | PA | — | (1) | 213 | 1,205 | — | 1,418 | 81 | 9/26/2012 | 1949 | |||||||||||||||||||||||
| Citizens Bank |
Dillsburg | PA | — | (1) | 232 | 926 | — | 1,158 | 54 | 12/14/2012 | 1935 | |||||||||||||||||||||||
F-100
Table of Contents
| Initial Costs | Costs Capitalized Subsequent to Acquisition |
Gross Amount Carried at December 31, 2013 (10) (11) |
||||||||||||||||||||||||||||||||
| Property |
City |
State |
Encumbrances at December 31, 2013 |
Land | Buildings, Fixtures and Improvements |
Accumulated Depreciation (12) (13) |
Date Acquired |
Date of Construction | ||||||||||||||||||||||||||
| Citizens Bank |
Drexel Hill | PA | — | (1) | 266 | 1,064 | — | 1,330 | 62 | 12/14/2012 | 1950 | |||||||||||||||||||||||
| Citizens Bank |
Erie | PA | — | (1) | 168 | 671 | — | 839 | 39 | 12/14/2012 | 1954 | |||||||||||||||||||||||
| Citizens Bank |
Glenside | PA | — | 343 | 1,370 | — | 1,713 | 43 | 5/22/2013 | 1958 | ||||||||||||||||||||||||
| Citizens Bank |
Grove City | PA | — | (7) | 292 | 239 | — | 531 | 21 | 4/26/2012 | 1977 | |||||||||||||||||||||||
| Citizens Bank |
Grove City | PA | — | (7) | 41 | 782 | — | 823 | 70 | 4/26/2012 | 1920 | |||||||||||||||||||||||
| Citizens Bank |
Harrisburg | PA | — | (7) | 512 | 419 | — | 931 | 37 | 4/26/2012 | 1967 | |||||||||||||||||||||||
| Citizens Bank |
Havertown | PA | — | (1) | 219 | 875 | — | 1,094 | 59 | 9/26/2012 | 2003 | |||||||||||||||||||||||
| Citizens Bank |
Homestead | PA | — | (1) | 202 | 807 | — | 1,009 | 54 | 9/26/2012 | 1960 | |||||||||||||||||||||||
| Citizens Bank |
Kingston | PA | — | (1) | 404 | 943 | — | 1,347 | 55 | 12/14/2012 | 1977 | |||||||||||||||||||||||
| Citizens Bank |
Kutztown | PA | — | (7) | 81 | 725 | — | 806 | 65 | 5/11/2012 | 1974 | |||||||||||||||||||||||
| Citizens Bank |
Lancaster | PA | — | (7) | 368 | 552 | — | 920 | 49 | 4/26/2012 | 1965 | |||||||||||||||||||||||
| Citizens Bank |
Lancaster | PA | — | (1) | 383 | 468 | — | 851 | 31 | 9/26/2012 | 1967 | |||||||||||||||||||||||
| Citizens Bank |
Latrobe | PA | — | (1) | 148 | 591 | — | 739 | 34 | 12/14/2012 | 1969 | |||||||||||||||||||||||
| Citizens Bank |
Lititz | PA | — | (7) | 37 | 708 | — | 745 | 63 | 4/26/2012 | 1964 | |||||||||||||||||||||||
| Citizens Bank |
Lower Burrell | PA | — | (1) | 180 | 722 | — | 902 | 42 | 12/14/2012 | 1980 | |||||||||||||||||||||||
| Citizens Bank |
Mechanicsburg | PA | — | 288 | 2,590 | — | 2,878 | 174 | 9/26/2012 | 1900 | ||||||||||||||||||||||||
| Citizens Bank |
Mercer | PA | — | (1) | 105 | 314 | — | 419 | 18 | 12/14/2012 | 1964 | |||||||||||||||||||||||
| Citizens Bank |
Metamoras | PA | — | (1) | 509 | 946 | — | 1,455 | 55 | 12/14/2012 | 1920 | |||||||||||||||||||||||
| Citizens Bank |
Milford | PA | — | (1) | 513 | 769 | — | 1,282 | 45 | 12/14/2012 | 1981 | |||||||||||||||||||||||
| Citizens Bank |
Monesson | PA | — | (9) | 198 | 1,123 | — | 1,321 | 209 | 9/1/2009 | 1930 | |||||||||||||||||||||||
| Citizens Bank |
Mount Lebanon | PA | — | 215 | 1,939 | — | 2,154 | 130 | 9/26/2012 | 1960 | ||||||||||||||||||||||||
| Citizens Bank |
Mountain Top | PA | — | (1) | 111 | 631 | — | 742 | 37 | 12/14/2012 | 1980 | |||||||||||||||||||||||
| Citizens Bank |
Munhall | PA | — | (7) | 191 | 191 | — | 382 | 17 | 4/26/2012 | 1973 | |||||||||||||||||||||||
| Citizens Bank |
Narberth | PA | — | (9) | 420 | 2,381 | — | 2,801 | 548 | 9/1/2009 | 1935 | |||||||||||||||||||||||
| Citizens Bank |
New Stanton | PA | — | (7) | 330 | 612 | — | 942 | 55 | 4/26/2012 | 1975 | |||||||||||||||||||||||
| Citizens Bank |
Oakmont | PA | — | (1) | 199 | 1,127 | — | 1,326 | 65 | 12/14/2012 | 1967 | |||||||||||||||||||||||
| Citizens Bank |
Philadelphia | PA | — | (7) | 184 | 735 | — | 919 | 66 | 4/26/2012 | 1904 | |||||||||||||||||||||||
F-101
Table of Contents
| Initial Costs | Costs Capitalized Subsequent to Acquisition |
Gross Amount Carried at December 31, 2013 (10) (11) |
||||||||||||||||||||||||||||||||
| Property |
City |
State |
Encumbrances at December 31, 2013 |
Land | Buildings, Fixtures and Improvements |
Accumulated Depreciation (12) (13) |
Date Acquired |
Date of Construction | ||||||||||||||||||||||||||
| Citizens Bank |
Philadelphia | PA | — | (1) | 127 | 722 | — | 849 | 42 | 12/14/2012 | 1920 | |||||||||||||||||||||||
| Citizens Bank |
Pittsburgh | PA | — | (1) | 185 | 1,051 | — | 1,236 | 61 | 12/14/2012 | 1960 | |||||||||||||||||||||||
| Citizens Bank |
Pittsburgh | PA | — | (1) | 389 | 1,168 | — | 1,557 | 68 | 12/14/2012 | 1940 | |||||||||||||||||||||||
| Citizens Bank |
Pittsburgh | PA | — | (1) | 146 | 2,770 | — | 2,916 | 161 | 12/14/2012 | 1900 | |||||||||||||||||||||||
| Citizens Bank |
Pittsburgh | PA | — | 470 | 2,661 | — | 3,131 | 154 | 12/14/2012 | 1980 | ||||||||||||||||||||||||
| Citizens Bank |
Pittsburgh | PA | — | (1) | 215 | 1,219 | — | 1,434 | 82 | 9/26/2012 | 1970 | |||||||||||||||||||||||
| Citizens Bank |
Pittsburgh | PA | — | (1) | 256 | 767 | — | 1,023 | 51 | 9/26/2012 | 1970 | |||||||||||||||||||||||
| Citizens Bank |
Shippensburg | PA | — | (7) | 143 | 429 | — | 572 | 38 | 4/26/2012 | 1985 | |||||||||||||||||||||||
| Citizens Bank |
Slovan | PA | — | (7) | 217 | 117 | — | 334 | 10 | 4/26/2012 | 1975 | |||||||||||||||||||||||
| Citizens Bank |
State College | PA | — | (7) | 256 | 475 | — | 731 | 42 | 4/26/2012 | 1966 | |||||||||||||||||||||||
| Citizens Bank |
Temple | PA | — | (1) | 268 | 626 | — | 894 | 42 | 9/26/2012 | 1936 | |||||||||||||||||||||||
| Citizens Bank |
Turtle Creek | PA | — | (1) | 308 | 923 | — | 1,231 | 62 | 9/26/2012 | 1970 | |||||||||||||||||||||||
| Citizens Bank |
Tyrone | PA | — | (1) | 146 | 583 | — | 729 | 34 | 12/14/2012 | 1967 | |||||||||||||||||||||||
| Citizens Bank |
Upper Darby | PA | — | (1) | 411 | 617 | — | 1,028 | 36 | 12/14/2012 | 1966 | |||||||||||||||||||||||
| Citizens Bank |
Verona | PA | — | (7) | 264 | 616 | — | 880 | 55 | 4/26/2012 | 1972 | |||||||||||||||||||||||
| Citizens Bank |
West Grove | PA | — | (7) | 181 | 725 | — | 906 | 65 | 4/26/2012 | 1980 | |||||||||||||||||||||||
| Citizens Bank |
West Hazelton | PA | — | (1) | 279 | 2,509 | — | 2,788 | 168 | 9/26/2012 | 1900 | |||||||||||||||||||||||
| Citizens Bank |
York | PA | — | (7) | 337 | 626 | — | 963 | 56 | 4/26/2012 | 1955 | |||||||||||||||||||||||
| Citizens Bank |
Coventry | RI | — | (1) | 559 | 559 | — | 1,118 | 37 | 9/26/2012 | 1968 | |||||||||||||||||||||||
| Citizens Bank |
Johnston | RI | — | (1) | 343 | 1,030 | — | 1,373 | 69 | 9/26/2012 | 1972 | |||||||||||||||||||||||
| Citizens Bank |
North Providence | RI | — | 200 | 1,800 | — | 2,000 | 96 | 12/31/2012 | 1971 | ||||||||||||||||||||||||
| Citizens Bank |
Wakefield | RI | — | (1) | 517 | 959 | — | 1,476 | 64 | 9/26/2012 | 1976 | |||||||||||||||||||||||
| Citizens Bank |
Warren | RI | — | (1) | 328 | 609 | — | 937 | 41 | 9/26/2012 | 1980 | |||||||||||||||||||||||
| Citizens Bank |
Warwick | RI | — | (1) | 1,570 | 5,544 | — | 7,114 | 58 | 9/24/2013 | 1996 | |||||||||||||||||||||||
| Citizens Bank |
Warwick | RI | — | (1) | 1,870 | 9,662 | — | 11,532 | 102 | 9/24/2013 | 1995 | |||||||||||||||||||||||
| Citizens Bank |
Middlebury | VT | — | (1) | 363 | 544 | — | 907 | 32 | 12/14/2012 | 1969 | |||||||||||||||||||||||
| Citizens Bank |
Poultney | VT | — | (1) | 149 | 847 | — | 996 | 176 | 3/1/2009 | 1860 | |||||||||||||||||||||||
| Citizens Bank |
St. Albans | VT | — | (1) | 141 | 798 | — | 939 | 166 | 3/1/2009 | 1989 | |||||||||||||||||||||||
| Citizens Bank |
White River Junction | VT | — | (1) | 183 | 1,039 | — | 1,222 | 216 | 3/1/2009 | 1975 | |||||||||||||||||||||||
| Comcast Corporation |
Englewood | CO | — | 1,490 | 5,060 | — | 6,550 | 45 | 11/5/2013 | 2011 | ||||||||||||||||||||||||
| Community Bank |
Whitehall | NY | — | (9) | 106 | 600 | — | 706 | 112 | 9/1/2009 | 1950 | |||||||||||||||||||||||
| Community National Bank |
Lake Mary | FL | — | 1,230 | 1,504 | — | 2,734 | 18 | 10/1/2013 | 1990 | ||||||||||||||||||||||||
F-102
Table of Contents
| Initial Costs | Costs Capitalized Subsequent to Acquisition |
Gross Amount Carried at December 31, 2013 (10) (11) |
||||||||||||||||||||||||||||||||
| Property |
City |
State |
Encumbrances at December 31, 2013 |
Land | Buildings, Fixtures and Improvements |
Accumulated Depreciation (12) (13) |
Date Acquired |
Date of Construction | ||||||||||||||||||||||||||
| Cooper Tire & Rubber Company |
Franklin | IN | 16,998 | 4,438 | 33,994 | — | 38,432 | 346 | 11/5/2013 | 2009 | ||||||||||||||||||||||||
| County of Yolo, California |
Woodland | CA | 10,332 | 2,640 | 13,681 | — | 16,321 | 108 | 11/5/2013 | 2001 | ||||||||||||||||||||||||
| Cracker Barrel |
Braselton | GA | — | 1,294 | 2,403 | — | 3,697 | 197 | 11/13/2012 | 2005 | ||||||||||||||||||||||||
| Cracker Barrel |
Bremen | GA | — | 1,012 | 2,361 | — | 3,373 | 194 | 11/13/2012 | 2006 | ||||||||||||||||||||||||
| Cracker Barrel |
Mebane | NC | — | 1,106 | 2,054 | — | 3,160 | 169 | 11/13/2012 | 2004 | ||||||||||||||||||||||||
| Cracker Barrel |
Emporia | VA | — | 972 | 2,267 | — | 3,239 | 186 | 11/13/2012 | 2004 | ||||||||||||||||||||||||
| Cracker Barrel |
Woodstock | VA | — | 928 | 2,164 | — | 3,092 | 178 | 11/13/2012 | 2005 | ||||||||||||||||||||||||
| Crozer-Keystone Health System |
Ridley Park | PA | 2,332 | — | 6,114 | — | 6,114 | 51 | 11/5/2013 | 2004 | ||||||||||||||||||||||||
| CVS |
Phoenix | AZ | — | 1,511 | 4,533 | — | 6,044 | 62 | 10/1/2013 | 2012 | ||||||||||||||||||||||||
| CVS |
Phoenix | AZ | — | 901 | 2,704 | — | 3,605 | 37 | 10/1/2013 | 2012 | ||||||||||||||||||||||||
| CVS |
Fresno | CA | — | 1,890 | 4,409 | — | 6,299 | 60 | 10/1/2013 | 2012 | ||||||||||||||||||||||||
| CVS |
Palmdale | CA | — | 2,493 | 4,630 | — | 7,123 | 63 | 10/1/2013 | 2012 | ||||||||||||||||||||||||
| CVS |
Sacramento | CA | — | 2,163 | 4,016 | — | 6,179 | 55 | 10/1/2013 | 2012 | ||||||||||||||||||||||||
| CVS |
Norwich | CT | — | 1,998 | 5,995 | — | 7,993 | 82 | 10/1/2013 | 2011 | ||||||||||||||||||||||||
| CVS |
Lakeland | FL | — | 587 | 2,347 | — | 2,934 | 32 | 10/1/2013 | 2012 | ||||||||||||||||||||||||
| CVS |
St. Cloud | FL | — | 1,534 | 1,875 | — | 3,409 | 84 | 4/12/2013 | 2002 | ||||||||||||||||||||||||
| CVS |
Alpharetta | GA | — | (1) | 572 | 858 | — | 1,430 | 64 | 9/28/2012 | 1994 | |||||||||||||||||||||||
| CVS |
Stockbridge | GA | — | (1) | 855 | 1,283 | — | 2,138 | 64 | 2/28/2013 | 1998 | |||||||||||||||||||||||
| CVS |
Vidalia | GA | — | (1) | 368 | 1,105 | — | 1,473 | 83 | 9/28/2012 | 2000 | |||||||||||||||||||||||
| CVS |
Franklin | IN | — | (1) | 310 | 2,787 | — | 3,097 | 293 | 3/29/2012 | 1999 | |||||||||||||||||||||||
| CVS |
Mandeville | LA | — | 2,385 | 2,915 | — | 5,300 | 40 | 10/1/2013 | 2012 | ||||||||||||||||||||||||
| CVS |
Metairie | LA | — | 1,895 | 3,519 | — | 5,414 | 48 | 10/1/2013 | 2012 | ||||||||||||||||||||||||
| CVS |
New Orleans | LA | — | 2,439 | 2,439 | — | 4,878 | 34 | 10/1/2013 | 2012 | ||||||||||||||||||||||||
| CVS |
Slidell | LA | — | 1,142 | 4,568 | — | 5,710 | 63 | 10/1/2013 | 2012 | ||||||||||||||||||||||||
| CVS |
Hingham | MA | — | 1,873 | 5,619 | — | 7,492 | 76 | 10/1/2013 | 2012 | ||||||||||||||||||||||||
| CVS |
Malden | MA | — | 1,757 | 5,271 | — | 7,028 | 72 | 10/1/2013 | 2012 | ||||||||||||||||||||||||
| CVS |
Detroit | MI | — | (1) | 270 | 2,427 | — | 2,697 | 121 | 2/28/2013 | 1999 | |||||||||||||||||||||||
| CVS |
Harper Woods | MI | — | (1) | 499 | 2,829 | — | 3,328 | 141 | 2/28/2013 | 1999 | |||||||||||||||||||||||
| CVS |
St. Joseph | MO | — | 1,022 | 3,067 | — | 4,089 | 42 | 10/1/2013 | 2012 | ||||||||||||||||||||||||
| CVS |
Beaufort | NC | — | 378 | 3,404 | — | 3,782 | 46 | 10/1/2013 | 2011 | ||||||||||||||||||||||||
| CVS |
Albuquerque | NM | — | 975 | 3,899 | — | 4,874 | 53 | 10/1/2013 | 2011 | ||||||||||||||||||||||||
F-103
Table of Contents
| Initial Costs | Costs Capitalized Subsequent to Acquisition |
Gross Amount Carried at December 31, 2013 (10) (11) |
||||||||||||||||||||||||||||||||
| Property |
City |
State |
Encumbrances at December 31, 2013 |
Land | Buildings, Fixtures and Improvements |
Accumulated Depreciation (12) (13) |
Date Acquired |
Date of Construction | ||||||||||||||||||||||||||
| CVS |
Albuquerque | NM | — | 1,029 | 4,118 | — | 5,147 | 57 | 10/1/2013 | 2011 | ||||||||||||||||||||||||
| CVS |
Las Cruces | NM | — | 1,295 | 5,178 | — | 6,473 | 71 | 10/1/2013 | 2012 | ||||||||||||||||||||||||
| CVS |
Las Vegas | NV | — | 1,374 | 3,207 | — | 4,581 | 257 | 8/22/2012 | 2004 | ||||||||||||||||||||||||
| CVS |
Rochester | NY | — | (1) | 965 | 1,180 | — | 2,145 | 83 | 11/8/2012 | 1997 | |||||||||||||||||||||||
| CVS |
Tulsa | OK | — | 950 | 2,216 | — | 3,166 | 30 | 10/1/2013 | 2010 | ||||||||||||||||||||||||
| CVS |
Freeland | PA | — | 122 | 1,096 | — | 1,218 | 93 | 8/8/2012 | 2004 | ||||||||||||||||||||||||
| CVS |
Mechanicsburg | PA | — | 1,155 | 3,465 | — | 4,620 | 225 | 11/29/2012 | 2008 | ||||||||||||||||||||||||
| CVS |
Shippensburg | PA | — | 351 | 1,988 | — | 2,339 | 109 | 2/8/2013 | 2002 | ||||||||||||||||||||||||
| CVS |
Greenville | SC | — | (1) | 169 | 1,520 | — | 1,689 | 76 | 2/28/2013 | 1997 | |||||||||||||||||||||||
| CVS |
Jackson | TN | — | 1,209 | 2,822 | — | 4,031 | 38 | 10/1/2013 | 2012 | ||||||||||||||||||||||||
| CVS |
Knoxville | TN | — | 1,190 | 2,210 | — | 3,400 | 30 | 10/1/2013 | 2011 | ||||||||||||||||||||||||
| CVS |
Nashville | TN | — | (1) | 203 | 1,148 | — | 1,351 | 86 | 9/28/2012 | 1996 | |||||||||||||||||||||||
| CVS |
Converse | TX | — | 1,390 | 3,243 | — | 4,633 | 45 | 10/1/2013 | 2011 | ||||||||||||||||||||||||
| CVS |
Dumas | TX | — | 846 | 2,537 | — | 3,383 | 35 | 10/1/2013 | 2011 | ||||||||||||||||||||||||
| CVS |
Elsa | TX | — | 915 | 2,744 | — | 3,659 | 37 | 10/1/2013 | 2011 | ||||||||||||||||||||||||
| CVS |
Fort Worth | TX | — | 2,453 | 3,679 | — | 6,132 | 50 | 10/1/2013 | 2011 | ||||||||||||||||||||||||
| CVS |
San Antonio | TX | — | 1,996 | 2,993 | — | 4,989 | 41 | 10/1/2013 | 2011 | ||||||||||||||||||||||||
| CVS |
San Antonio | TX | — | 2,034 | 3,778 | — | 5,812 | 52 | 10/1/2013 | 2011 | ||||||||||||||||||||||||
| CVS |
San Antonio | TX | — | 868 | 2,605 | — | 3,473 | 36 | 10/1/2013 | 2012 | ||||||||||||||||||||||||
| CVS |
San Juan | TX | — | 610 | 2,441 | — | 3,051 | 34 | 10/1/2013 | 2012 | ||||||||||||||||||||||||
| CVS |
Norfolk | VA | — | 697 | 2,789 | — | 3,486 | 38 | 10/1/2013 | 2011 | ||||||||||||||||||||||||
| CVS |
Portsmouth | VA | — | 1,230 | 3,690 | — | 4,920 | 50 | 10/1/2013 | 2012 | ||||||||||||||||||||||||
| CVS |
Roanoke | VA | — | 825 | 2,474 | — | 3,299 | 34 | 10/1/2013 | 2011 | ||||||||||||||||||||||||
| CVS |
Virginia Beach | VA | — | 683 | 3,868 | — | 4,551 | 53 | 10/1/2013 | 2012 | ||||||||||||||||||||||||
| CVS |
Williamsburg | VA | — | 907 | 5,137 | — | 6,044 | 70 | 10/1/2013 | 2011 | ||||||||||||||||||||||||
| Dairy Queen |
Mauldin | SC | — | (1) | 133 | — | — | 133 | — | 6/27/2013 | 1979 | |||||||||||||||||||||||
| Dairy Queen |
Alto | TX | — | (1) | 50 | 110 | — | 160 | 3 | 6/27/2013 | 1972 | |||||||||||||||||||||||
F-104
Table of Contents
| Initial Costs | Costs Capitalized Subsequent to Acquisition |
Gross Amount Carried at December 31, 2013 (10) (11) |
||||||||||||||||||||||||||||||||
| Property |
City |
State |
Encumbrances at December 31, 2013 |
Land | Buildings, Fixtures and Improvements |
Accumulated Depreciation (12)(13) |
Date Acquired |
Date of Construction | ||||||||||||||||||||||||||
| Dairy Queen |
Pineland | TX | — | (1) | 40 | 120 | — | 160 | 3 | 6/27/2013 | 1989 | |||||||||||||||||||||||
| Dairy Queen |
Silsbee | TX | — | (1) | 60 | 100 | — | 160 | 3 | 6/27/2013 | 1988 | |||||||||||||||||||||||
| DaVita Dialysis |
Osceola | AR | — | (1) | 137 | 1,232 | — | 1,369 | 43 | 3/28/2013 | 2009 | |||||||||||||||||||||||
| DaVita Dialysis |
Allen Park | MI | — | (1) | 209 | 1,885 | — | 2,094 | 102 | 12/31/2012 | 1955 | |||||||||||||||||||||||
| DaVita Dialysis |
St. Pauls | NC | — | (1) | 138 | 1,246 | — | 1,384 | 24 | 8/2/2013 | 2006 | |||||||||||||||||||||||
| DaVita Dialysis |
Beeville | TX | — | (1) | 99 | 1,879 | — | 1,978 | 102 | 12/31/2012 | 2002 | |||||||||||||||||||||||
| DaVita Dialysis |
Federal Way | WA | — | 1,929 | 22,357 | — | 24,286 | 1,509 | 11/21/2012 | 2000 | ||||||||||||||||||||||||
| DC Sports Bar & Steakhouse |
Eunice | LA | — | (1) | 500 | 262 | — | 762 | 8 | 6/27/2013 | 1987 | |||||||||||||||||||||||
| Del Monte Corporation |
Lathrop | CA | 32,694 | — | 41,318 | — | 41,318 | 420 | 11/5/2013 | 1994 | ||||||||||||||||||||||||
| Denny’s |
Winter Springs | FL | — | (1) | 550 | 1,668 | — | 2,218 | 48 | 6/27/2013 | 1994 | |||||||||||||||||||||||
| Denny’s |
Merriam | KS | — | (1) | 390 | 1,150 | — | 1,540 | 33 | 6/27/2013 | 1981 | |||||||||||||||||||||||
| Denny’s |
Topeka | KS | — | (1) | 630 | 446 | — | 1,076 | 13 | 6/27/2013 | 1989 | |||||||||||||||||||||||
| Denny’s |
Branson | MO | — | (1) | 620 | 2,209 | — | 2,829 | 63 | 6/27/2013 | 1995 | |||||||||||||||||||||||
| Denny’s |
Kansas City | MO | — | (1) | 750 | 686 | — | 1,436 | 20 | 6/27/2013 | 1997 | |||||||||||||||||||||||
| Denny’s |
North Kansas City | MO | — | (1) | 630 | 937 | — | 1,567 | 27 | 6/27/2013 | 1979 | |||||||||||||||||||||||
| Denny’s |
Sedalia | MO | — | (1) | 500 | 783 | — | 1,283 | 22 | 6/27/2013 | 1985 | |||||||||||||||||||||||
| Denny’s |
Black Mountain | NC | — | (1) | 210 | 505 | — | 715 | 14 | 6/27/2013 | 1992 | |||||||||||||||||||||||
| Denny’s |
Mooresville | NC | — | (1) | 250 | 841 | — | 1,091 | 24 | 6/27/2013 | 1992 | |||||||||||||||||||||||
| Denny’s |
Watertown | NY | — | (1) | 330 | 1,107 | — | 1,437 | 32 | 6/27/2013 | 1987 | |||||||||||||||||||||||
| Denny’s |
Fremont | OH | — | (1) | 320 | 975 | — | 1,295 | 28 | 6/27/2013 | 1992 | |||||||||||||||||||||||
| Denny’s |
Ontario | OR | — | (1) | 240 | 1,067 | — | 1,307 | 31 | 6/27/2013 | 1978 | |||||||||||||||||||||||
| Denny’s |
Columbia | SC | — | (1) | 490 | 1,115 | — | 1,605 | 32 | 6/27/2013 | 1998 | |||||||||||||||||||||||
| Denny’s |
Greenville | SC | — | (1) | 570 | 554 | — | 1,124 | 16 | 6/27/2013 | 1985 | |||||||||||||||||||||||
| Denny’s |
Pasadena | TX | — | (1) | 500 | 1,316 | — | 1,816 | 38 | 6/27/2013 | 1981 | |||||||||||||||||||||||
| Dollar General |
Birmingham | AL | — | (1) | 156 | 882 | — | 1,038 | 78 | 6/6/2012 | 2012 | |||||||||||||||||||||||
| Dollar General |
Chunchula | AL | — | (1) | 174 | 697 | — | 871 | 65 | 4/25/2012 | 2012 | |||||||||||||||||||||||
| Dollar General |
Moulton | AL | — | (1) | 517 | 1,207 | — | 1,724 | 113 | 4/26/2012 | 2012 | |||||||||||||||||||||||
| Dollar General |
Gardendale | AL | — | (1) | 142 | 805 | — | 947 | 64 | 8/9/2012 | 2012 | |||||||||||||||||||||||
| Dollar General |
Red Level | AL | — | 120 | 680 | — | 800 | 83 | 10/31/2011 | 2010 | ||||||||||||||||||||||||
| Dollar General |
Tarrant | AL | — | (5) | 217 | 869 | — | 1,086 | 102 | 12/12/2011 | 2011 | |||||||||||||||||||||||
| Dollar General |
Tuscaloosa | AL | — | 133 | 756 | — | 889 | 85 | 12/30/2011 | 2011 | ||||||||||||||||||||||||
| Dollar General |
Ash Flat | AR | — | (1) | 44 | 132 | — | 176 | 11 | 6/19/2012 | 1997 | |||||||||||||||||||||||
F-105
Table of Contents
| Initial Costs | Costs Capitalized Subsequent to Acquisition |
Gross Amount Carried at December 31, 2013 (10) (11) |
||||||||||||||||||||||||||||||||
| Property |
City |
State |
Encumbrances at December 31, 2013 |
Land | Buildings, Fixtures and Improvements |
Accumulated Depreciation (12)(13) |
Date Acquired |
Date of Construction | ||||||||||||||||||||||||||
| Dollar General |
Batesville | AR | — | (1) | 32 | 285 | — | 317 | 7 | 7/25/2013 | 1998 | |||||||||||||||||||||||
| Dollar General |
Batesville | AR | — | (1) | 42 | 374 | — | 416 | 9 | 7/25/2013 | 1999 | |||||||||||||||||||||||
| Dollar General |
Beebe | AR | — | (1) | 51 | 458 | — | 509 | 11 | 7/25/2013 | 1999 | |||||||||||||||||||||||
| Dollar General |
Bella Vista | AR | — | (1) | 129 | 302 | — | 431 | 37 | 11/10/2011 | 2005 | |||||||||||||||||||||||
| Dollar General |
Bergman | AR | — | (1) | 113 | 639 | — | 752 | 54 | 7/2/2012 | 2011 | |||||||||||||||||||||||
| Dollar General |
Blytheville | AR | — | (1) | 30 | 274 | — | 304 | 6 | 7/25/2013 | 2000 | |||||||||||||||||||||||
| Dollar General |
Carlisle | AR | — | (1) | 13 | 245 | — | 258 | 30 | 11/10/2011 | 2005 | |||||||||||||||||||||||
| Dollar General |
Des Arc | AR | — | (1) | 56 | 508 | — | 564 | 12 | 7/25/2013 | 1999 | |||||||||||||||||||||||
| Dollar General |
Dumas | AR | — | (1) | 46 | 412 | — | 458 | 10 | 7/25/2013 | 1998 | |||||||||||||||||||||||
| Dollar General |
Flippin | AR | — | (1) | 53 | 64 | — | 117 | 5 | 6/19/2012 | 1994 | |||||||||||||||||||||||
| Dollar General |
Gassville | AR | — | (1) | 54 | 305 | — | 359 | 7 | 7/25/2013 | 1999 | |||||||||||||||||||||||
| Dollar General |
Green Forest | AR | — | (1) | 52 | 293 | — | 345 | 36 | 11/10/2011 | 2005 | |||||||||||||||||||||||
| Dollar General |
Higdon | AR | — | (1) | 52 | 469 | — | 521 | 11 | 7/25/2013 | 1999 | |||||||||||||||||||||||
| Dollar General |
Lake Village | AR | — | (1) | 64 | 362 | — | 426 | 8 | 7/25/2013 | 1998 | |||||||||||||||||||||||
| Dollar General |
Lepanto | AR | — | (1) | 43 | 389 | — | 432 | 9 | 7/25/2013 | 1998 | |||||||||||||||||||||||
| Dollar General |
Little Rock | AR | — | (1) | 73 | 412 | — | 485 | 10 | 7/25/2013 | 1999 | |||||||||||||||||||||||
| Dollar General |
Marvell | AR | — | (1) | 40 | 358 | — | 398 | 8 | 7/25/2013 | 1999 | |||||||||||||||||||||||
| Dollar General |
Maynard | AR | — | (1) | 73 | 654 | — | 727 | 40 | 12/4/2012 | 2011 | |||||||||||||||||||||||
| Dollar General |
McGehee | AR | — | (1) | 25 | 228 | — | 253 | 5 | 7/25/2013 | 1998 | |||||||||||||||||||||||
| Dollar General |
Quitman | AR | — | (1) | 45 | 405 | — | 450 | 9 | 7/25/2013 | 2001 | |||||||||||||||||||||||
| Dollar General |
Searcy | AR | — | (1) | 29 | 263 | — | 292 | 6 | 7/25/2013 | 1998 | |||||||||||||||||||||||
| Dollar General |
Tuckerman | AR | — | (1) | 49 | 280 | — | 329 | 7 | 7/25/2013 | 1999 | |||||||||||||||||||||||
| Dollar General |
Whitehall | AR | — | (1) | 43 | 388 | — | 431 | 9 | 7/25/2013 | 1999 | |||||||||||||||||||||||
| Dollar General |
Wooster | AR | — | (1) | 74 | 664 | — | 738 | 40 | 12/4/2012 | 2011 | |||||||||||||||||||||||
| Dollar General |
Grand Ridge | FL | — | 76 | 684 | — | 760 | 77 | 12/30/2011 | 2010 | ||||||||||||||||||||||||
| Dollar General |
Molina | FL | — | 178 | 1,007 | — | 1,185 | 123 | 10/31/2011 | 2010 | ||||||||||||||||||||||||
| Dollar General |
Panama City | FL | — | (1) | 139 | 312 | — | 451 | 23 | 6/19/2012 | 1987 | |||||||||||||||||||||||
| Dollar General |
Chariton | IA | — | (1) | 165 | 934 | — | 1,099 | 70 | 8/31/2012 | 2012 | |||||||||||||||||||||||
| Dollar General |
Estherville | IA | — | (1) | 226 | 903 | — | 1,129 | 59 | 10/25/2012 | 2012 | |||||||||||||||||||||||
| Dollar General |
Hampton | IA | — | (5) | 188 | 751 | — | 939 | 81 | 2/1/2012 | 2012 | |||||||||||||||||||||||
| Dollar General |
Lake Milles | IA | — | (5) | 81 | 728 | — | 809 | 78 | 2/1/2012 | 2012 | |||||||||||||||||||||||
| Dollar General |
Nashua | IA | — | (1) | 136 | 768 | — | 904 | 58 | 9/6/2012 | 2012 | |||||||||||||||||||||||
F-106
Table of Contents
| Initial Costs | Costs Capitalized Subsequent to Acquisition |
Gross Amount Carried at December 31, 2013 (10) (11) |
||||||||||||||||||||||||||||||||
| Property |
City |
State |
Encumbrances at December 31, 2013 |
Land | Buildings, Fixtures and Improvements |
Accumulated Depreciation (12)(13) |
Date Acquired |
Date of Construction | ||||||||||||||||||||||||||
| Dollar General |
Ottumwa | IA | — | (1) | 143 | 812 | — | 955 | 42 | 1/31/2013 | 2012 | |||||||||||||||||||||||
| Dollar General |
Altamont | IL | — | (6) | 211 | 844 | — | 1,055 | 87 | 3/9/2012 | 2012 | |||||||||||||||||||||||
| Dollar General |
Carthage | IL | — | (1) | 48 | 908 | — | 956 | 68 | 8/31/2012 | 2012 | |||||||||||||||||||||||
| Dollar General |
Jacksonville | IL | — | (1) | 145 | 823 | — | 968 | 62 | 8/31/2012 | 2012 | |||||||||||||||||||||||
| Dollar General |
Jonesboro | IL | — | (1) | 77 | 309 | — | 386 | 38 | 11/10/2011 | 2007 | |||||||||||||||||||||||
| Dollar General |
Lexington | IL | — | (1) | 100 | 899 | — | 999 | 63 | 9/21/2012 | 2012 | |||||||||||||||||||||||
| Dollar General |
Marion | IL | — | (1) | 153 | 867 | — | 1,020 | 61 | 9/24/2012 | 2012 | |||||||||||||||||||||||
| Dollar General |
Mt Morris | IL | — | (1) | 97 | 877 | — | 974 | 49 | 12/17/2012 | 2012 | |||||||||||||||||||||||
| Dollar General |
Monroeville | IN | — | (5) | 112 | 636 | — | 748 | 71 | 12/22/2011 | 2011 | |||||||||||||||||||||||
| Dollar General |
Auburn | KS | — | (1) | 42 | 801 | — | 843 | 60 | 8/31/2012 | 2009 | |||||||||||||||||||||||
| Dollar General |
Caney | KS | — | (1) | 31 | 178 | — | 209 | 15 | 6/19/2012 | 2002 | |||||||||||||||||||||||
| Dollar General |
Cottonwood Falls | KS | — | (1) | 89 | 802 | — | 891 | 60 | 8/31/2012 | 2009 | |||||||||||||||||||||||
| Dollar General |
Erie | KS | — | (1) | 42 | 790 | — | 832 | 59 | 8/31/2012 | 2009 | |||||||||||||||||||||||
| Dollar General |
Garden City | KS | — | (1) | 136 | 771 | — | 907 | 58 | 8/31/2012 | 2010 | |||||||||||||||||||||||
| Dollar General |
Harper | KS | — | (1) | 91 | 818 | — | 909 | 61 | 8/31/2012 | 2009 | |||||||||||||||||||||||
| Dollar General |
Humboldt | KS | — | (1) | 44 | 828 | — | 872 | 62 | 8/31/2012 | 2009 | |||||||||||||||||||||||
| Dollar General |
Kingman | KS | — | (1) | 142 | 804 | — | 946 | 60 | 8/31/2012 | 2010 | |||||||||||||||||||||||
| Dollar General |
Medicine Lodge | KS | — | (1) | 40 | 765 | — | 805 | 57 | 8/31/2012 | 2010 | |||||||||||||||||||||||
| Dollar General |
Minneapolis | KS | — | (1) | 43 | 816 | — | 859 | 61 | 8/31/2012 | 2010 | |||||||||||||||||||||||
| Dollar General |
Pomona | KS | — | (1) | 42 | 796 | — | 838 | 60 | 8/31/2012 | 2009 | |||||||||||||||||||||||
| Dollar General |
Sedan | KS | — | (1) | 42 | 792 | — | 834 | 59 | 8/31/2012 | 2009 | |||||||||||||||||||||||
| Dollar General |
Syracuse | KS | — | (1) | 43 | 817 | — | 860 | 61 | 8/31/2012 | 2010 | |||||||||||||||||||||||
| Dollar General |
Nancy | KY | — | (1) | 81 | 733 | — | 814 | 69 | 4/26/2012 | 2011 | |||||||||||||||||||||||
F-107
Table of Contents
| Initial Costs | Costs Capitalized Subsequent to Acquisition |
Gross Amount Carried at December 31, 2013 (10) (11) |
||||||||||||||||||||||||||||||||
| Property |
City |
State |
Encumbrances at December 31, 2013 |
Land | Buildings, Fixtures and Improvements |
Accumulated Depreciation (12)(13) |
Date Acquired |
Date of Construction | ||||||||||||||||||||||||||
| Dollar General |
Choudrant | LA | — | 83 | 745 | — | 828 | 80 | 2/6/2012 | 2011 | ||||||||||||||||||||||||
| Dollar General |
Converse | LA | — | (1) | 84 | 756 | — | 840 | 53 | 9/26/2012 | 2012 | |||||||||||||||||||||||
| Dollar General |
Doyline | LA | — | (1) | 88 | 793 | — | 881 | 48 | 11/27/2012 | 2012 | |||||||||||||||||||||||
| Dollar General |
Gardner | LA | — | (6) | 138 | 784 | — | 922 | 81 | 3/8/2012 | 2012 | |||||||||||||||||||||||
| Dollar General |
Jonesville | LA | — | (1) | 103 | 929 | — | 1,032 | 65 | 9/27/2012 | 2012 | |||||||||||||||||||||||
| Dollar General |
Keithville | LA | — | (1) | 83 | 750 | — | 833 | 60 | 7/26/2012 | 2012 | |||||||||||||||||||||||
| Dollar General |
Lake Charles | LA | — | 102 | 919 | — | 1,021 | 95 | 2/29/2012 | 2012 | ||||||||||||||||||||||||
| Dollar General |
Mangham | LA | — | 40 | 759 | — | 799 | 82 | 2/6/2012 | 2011 | ||||||||||||||||||||||||
| Dollar General |
Mt. Hermon | LA | — | (1) | 94 | 842 | — | 936 | 91 | 2/6/2012 | 2011 | |||||||||||||||||||||||
| Dollar General |
New Iberia | LA | — | (1) | 315 | 736 | — | 1,051 | 69 | 4/26/2012 | 2011 | |||||||||||||||||||||||
| Dollar General |
Patterson | LA | — | 259 | 1,035 | — | 1,294 | 97 | 4/26/2012 | 2011 | ||||||||||||||||||||||||
| Dollar General |
Richwood | LA | — | (1) | 97 | 869 | — | 966 | 94 | 2/6/2012 | 2011 | |||||||||||||||||||||||
| Dollar General |
Sarepta | LA | — | (1) | 131 | 743 | — | 874 | 59 | 8/9/2012 | 2011 | |||||||||||||||||||||||
| Dollar General |
West Monroe | LA | — | (1) | 153 | 869 | — | 1,022 | 89 | 3/9/2012 | 2012 | |||||||||||||||||||||||
| Dollar General |
Zachary | LA | — | (1) | 248 | 743 | — | 991 | 70 | 4/26/2012 | 2011 | |||||||||||||||||||||||
| Dollar General |
Bangor | MI | — | (1) | 173 | 691 | — | 864 | 58 | 7/10/2012 | 2012 | |||||||||||||||||||||||
| Dollar General |
Cadillac | MI | — | (6) | 187 | 747 | — | 934 | 73 | 3/16/2012 | 2012 | |||||||||||||||||||||||
| Dollar General |
Carleton | MI | — | (6) | 222 | 666 | — | 888 | 65 | 3/16/2012 | 2011 | |||||||||||||||||||||||
| Dollar General |
Covert | MI | — | (1) | 37 | 704 | — | 741 | 53 | 8/30/2012 | 2012 | |||||||||||||||||||||||
| Dollar General |
Durand | MI | — | (1) | 181 | 726 | — | 907 | 65 | 5/18/2012 | 2012 | |||||||||||||||||||||||
| Dollar General |
East Jordan | MI | — | (1) | 125 | 709 | — | 834 | 60 | 7/10/2012 | 2012 | |||||||||||||||||||||||
| Dollar General |
Flint | MI | — | (6) | 83 | 743 | — | 826 | 66 | 5/18/2012 | 2012 | |||||||||||||||||||||||
| Dollar General |
Flint | MI | — | (1) | 91 | 820 | — | 911 | 54 | 10/31/2012 | 2012 | |||||||||||||||||||||||
| Dollar General |
Gaylord | MI | — | (1) | 172 | 687 | — | 859 | 58 | 7/10/2012 | 2012 | |||||||||||||||||||||||
| Dollar General |
Iron River | MI | — | (1) | 86 | 777 | — | 863 | 58 | 8/30/2012 | 2012 | |||||||||||||||||||||||
| Dollar General |
Melvindale | MI | — | (1) | 242 | 967 | — | 1,209 | 81 | 6/26/2012 | 2012 | |||||||||||||||||||||||
| Dollar General |
Negaunee | MI | — | (1) | 87 | 779 | — | 866 | 58 | 8/30/2012 | 2012 | |||||||||||||||||||||||
| Dollar General |
Roscommon | MI | — | (1) | 87 | 781 | — | 868 | 58 | 8/30/2012 | 2012 | |||||||||||||||||||||||
| Dollar General |
Melrose | MN | — | (1) | 96 | 863 | — | 959 | 48 | 12/17/2012 | 2012 | |||||||||||||||||||||||
| Dollar General |
Montgomery | MN | — | (1) | 87 | 783 | — | 870 | 44 | 12/17/2012 | 2012 | |||||||||||||||||||||||
| Dollar General |
Olivia | MN | — | (1) | 98 | 884 | — | 982 | 46 | 1/31/2013 | 2012 | |||||||||||||||||||||||
| Dollar General |
Rush City | MN | — | (1) | 126 | 716 | — | 842 | 57 | 7/25/2012 | 2012 | |||||||||||||||||||||||
F-108
Table of Contents
| Initial Costs | Costs Capitalized Subsequent to Acquisition |
Gross Amount Carried at December 31, 2013 (10) (11) |
||||||||||||||||||||||||||||||||
| Property |
City |
State |
Encumbrances at December 31, 2013 |
Land | Buildings, Fixtures and Improvements |
Accumulated Depreciation (12)(13) |
Date Acquired |
Date of Construction | ||||||||||||||||||||||||||
| Dollar General |
Springfield | MN | — | (1) | 88 | 795 | — | 883 | 45 | 12/26/2012 | 2012 | |||||||||||||||||||||||
| Dollar General |
Virginia | MN | — | (1) | 147 | 831 | — | 978 | 47 | 1/14/2013 | 2012 | |||||||||||||||||||||||
| Dollar General |
Appleton City | MO | — | (1) | 22 | 124 | — | 146 | 15 | 11/10/2011 | 2004 | |||||||||||||||||||||||
| Dollar General |
Ash Grove | MO | — | (1) | 35 | 315 | — | 350 | 38 | 11/10/2011 | 2006 | |||||||||||||||||||||||
| Dollar General |
Ashland | MO | — | (1) | 70 | 398 | — | 468 | 48 | 11/10/2011 | 2006 | |||||||||||||||||||||||
| Dollar General |
Auxvasse | MO | — | (2) | 72 | 650 | — | 722 | 76 | 11/22/2011 | 2011 | |||||||||||||||||||||||
| Dollar General |
Belton | MO | — | (1) | 105 | 948 | — | 1,053 | 75 | 8/3/2012 | 2012 | |||||||||||||||||||||||
| Dollar General |
Berkeley | MO | — | (1) | 132 | 748 | — | 880 | 53 | 10/9/2012 | 2012 | |||||||||||||||||||||||
| Dollar General |
Bernie | MO | — | (1) | 35 | 314 | — | 349 | 38 | 11/10/2011 | 2007 | |||||||||||||||||||||||
| Dollar General |
Bloomfield | MO | — | (1) | 23 | 209 | — | 232 | 25 | 11/10/2011 | 2005 | |||||||||||||||||||||||
| Dollar General |
Cardwell | MO | — | (1) | 89 | 805 | — | 894 | 60 | 8/24/2012 | 2012 | |||||||||||||||||||||||
| Dollar General |
Carterville | MO | — | (8) | 10 | 192 | — | 202 | 23 | 11/10/2011 | 2004 | |||||||||||||||||||||||
| Dollar General |
Caruthersville | MO | — | (1) | 98 | 878 | — | 976 | 62 | 9/27/2012 | 2012 | |||||||||||||||||||||||
| Dollar General |
Clarkton | MO | — | (1) | 19 | 354 | — | 373 | 43 | 11/10/2011 | 2007 | |||||||||||||||||||||||
| Dollar General |
Clever | MO | — | (1) | 136 | 542 | — | 678 | 46 | 6/19/2012 | 2010 | |||||||||||||||||||||||
| Dollar General |
Concordia | MO | — | (1) | 40 | 161 | — | 201 | 14 | 6/19/2012 | 1998 | |||||||||||||||||||||||
| Dollar General |
Conway | MO | — | (2) | 37 | 694 | — | 731 | 81 | 11/22/2011 | 2011 | |||||||||||||||||||||||
| Dollar General |
Diamond | MO | — | (1) | 44 | 175 | — | 219 | 21 | 11/10/2011 | 2005 | |||||||||||||||||||||||
| Dollar General |
Edina | MO | — | (1) | 127 | 722 | — | 849 | 54 | 9/13/2012 | 2012 | |||||||||||||||||||||||
| Dollar General |
Ellsinore | MO | — | (8) | 30 | 579 | — | 609 | 70 | 11/10/2011 | 2010 | |||||||||||||||||||||||
| Dollar General |
Gower | MO | — | (1) | 118 | 668 | — | 786 | 50 | 8/31/2012 | 2012 | |||||||||||||||||||||||
| Dollar General |
Greenfield | MO | — | (1) | 42 | 378 | — | 420 | 32 | 6/19/2012 | 2000 | |||||||||||||||||||||||
| Dollar General |
Hallsville | MO | — | (8) | 29 | 263 | — | 292 | 32 | 11/10/2011 | 2004 | |||||||||||||||||||||||
| Dollar General |
Hawk Point | MO | — | (1) | 177 | 709 | — | 886 | 53 | 8/24/2012 | 2012 | |||||||||||||||||||||||
| Dollar General |
Humansville | MO | — | (1) | 69 | 277 | — | 346 | 23 | 6/19/2012 | 2007 | |||||||||||||||||||||||
| Dollar General |
Jennings | MO | — | (1) | 445 | 826 | — | 1,271 | 70 | 7/13/2012 | 2012 | |||||||||||||||||||||||
| Dollar General |
Kansas City | MO | — | (1) | 313 | 731 | — | 1,044 | 51 | 9/21/2012 | 2012 | |||||||||||||||||||||||
| Dollar General |
King City | MO | — | (2) | 33 | 625 | — | 658 | 73 | 11/22/2011 | 2010 | |||||||||||||||||||||||
| Dollar General |
Lawson | MO | — | (1) | 29 | 162 | — | 191 | 20 | 11/10/2011 | 2003 | |||||||||||||||||||||||
| Dollar General |
Lebanon | MO | — | (1) | 278 | 835 | — | 1,113 | 59 | 9/26/2012 | 2012 | |||||||||||||||||||||||
| Dollar General |
Lebanon | MO | — | (1) | 177 | 708 | — | 885 | 50 | 9/24/2012 | 2012 | |||||||||||||||||||||||
| Dollar General |
Licking | MO | — | (2) | 76 | 688 | — | 764 | 80 | 11/22/2011 | 2010 | |||||||||||||||||||||||
F-109
Table of Contents
| Initial Costs | Costs Capitalized Subsequent to Acquisition |
Gross Amount Carried at December 31, 2013 (10) (11) |
||||||||||||||||||||||||||||||||
| Property |
City |
State |
Encumbrances at December 31, 2013 |
Land | Buildings, Fixtures and Improvements |
Accumulated Depreciation (12)(13) |
Date Acquired |
Date of Construction | ||||||||||||||||||||||||||
| Dollar General |
Lilbourne | MO | — | (8) | 62 | 554 | — | 616 | 67 | 11/10/2011 | 2010 | |||||||||||||||||||||||
| Dollar General |
Marble Hill | MO | — | (1) | 104 | 935 | — | 1,039 | 70 | 9/11/2012 | 2012 | |||||||||||||||||||||||
| Dollar General |
Marionville | MO | — | (1) | 89 | 797 | — | 886 | 52 | 10/31/2012 | 2012 | |||||||||||||||||||||||
| Dollar General |
Marthasville | MO | — | 41 | 782 | — | 823 | 84 | 2/1/2012 | 2011 | ||||||||||||||||||||||||
| Dollar General |
Maysville | MO | — | (2) | 107 | 607 | — | 714 | 74 | 10/31/2011 | 2010 | |||||||||||||||||||||||
| Dollar General |
Morehouse | MO | — | (1) | 87 | 783 | — | 870 | 59 | 9/7/2012 | 2012 | |||||||||||||||||||||||
| Dollar General |
New Haven | MO | — | (1) | 176 | 702 | — | 878 | 66 | 4/27/2012 | 2012 | |||||||||||||||||||||||
| Dollar General |
Oak Grove | MO | — | (1) | 27 | 106 | — | 133 | 9 | 6/19/2012 | 1999 | |||||||||||||||||||||||
| Dollar General |
Oran | MO | — | (6) | 83 | 747 | — | 830 | 73 | 3/30/2012 | 2012 | |||||||||||||||||||||||
| Dollar General |
Osceola | MO | — | (1) | 93 | 835 | — | 928 | 39 | 2/19/2013 | 2012 | |||||||||||||||||||||||
| Dollar General |
Ozark | MO | — | (6) | 190 | 758 | — | 948 | 71 | 4/27/2012 | 2012 | |||||||||||||||||||||||
| Dollar General |
Ozark | MO | — | (1) | 149 | 842 | — | 991 | 59 | 9/24/2012 | 2012 | |||||||||||||||||||||||
| Dollar General |
Pacific | MO | — | (1) | 151 | 853 | — | 1,004 | 76 | 6/6/2012 | 2012 | |||||||||||||||||||||||
| Dollar General |
Palmyra | MO | — | (1) | 40 | 225 | — | 265 | 19 | 6/19/2012 | 2003 | |||||||||||||||||||||||
| Dollar General |
Plattsburg | MO | — | (1) | 44 | 843 | — | 887 | 67 | 8/9/2012 | 2012 | |||||||||||||||||||||||
| Dollar General |
Qulin | MO | — | (8) | 30 | 573 | — | 603 | 70 | 11/10/2011 | 2009 | |||||||||||||||||||||||
| Dollar General |
Robertsville | MO | — | (1) | 131 | 744 | — | 875 | 56 | 8/24/2012 | 2011 | |||||||||||||||||||||||
| Dollar General |
Rocky Mount | MO | — | (1) | 88 | 789 | — | 877 | 59 | 8/31/2012 | 2012 | |||||||||||||||||||||||
| Dollar General |
Sedalia | MO | — | (1) | 273 | 637 | — | 910 | 48 | 9/7/2012 | 2012 | |||||||||||||||||||||||
| Dollar General |
Senath | MO | — | (1) | 61 | 552 | — | 613 | 47 | 6/19/2012 | 2010 | |||||||||||||||||||||||
| Dollar General |
Seneca | MO | — | (1) | 47 | 189 | — | 236 | 16 | 6/19/2012 | 1962 | |||||||||||||||||||||||
| Dollar General |
Sikeston | MO | — | (6) | 56 | 1,056 | — | 1,112 | 109 | 2/24/2012 | 2011 | |||||||||||||||||||||||
| Dollar General |
Sikeston | MO | — | (1) | 144 | 819 | — | 963 | 61 | 8/24/2012 | 2012 | |||||||||||||||||||||||
| Dollar General |
Springfield | MO | — | (1) | 378 | 702 | — | 1,080 | 62 | 6/14/2012 | 2012 | |||||||||||||||||||||||
| Dollar General |
St James | MO | — | (1) | 81 | 244 | — | 325 | 21 | 6/19/2012 | 1999 | |||||||||||||||||||||||
| Dollar General |
St. Clair | MO | — | 220 | 879 | — | 1,099 | 99 | 12/30/2011 | 2011 | ||||||||||||||||||||||||
F-110
Table of Contents
| Initial Costs | Costs Capitalized Subsequent to Acquisition |
Gross Amount Carried at December 31, 2013 (10) (11) |
||||||||||||||||||||||||||||||||
| Property |
City |
State |
Encumbrances at December 31, 2013 |
Land | Buildings, Fixtures and Improvements |
Accumulated Depreciation (12)(13) |
Date Acquired |
Date of Construction | ||||||||||||||||||||||||||
| Dollar General |
St. Louis | MO | — | (1) | 372 | 692 | — | 1,064 | 52 | 8/31/2012 | 2012 | |||||||||||||||||||||||
| Dollar General |
St. Louis | MO | — | (1) | 260 | 606 | — | 866 | 43 | 9/26/2012 | 2012 | |||||||||||||||||||||||
| Dollar General |
Stanberry | MO | — | (3) | 111 | 629 | — | 740 | 74 | 11/22/2011 | 2010 | |||||||||||||||||||||||
| Dollar General |
Steele | MO | — | (8) | 31 | 598 | — | 629 | 73 | 11/10/2011 | 2009 | |||||||||||||||||||||||
| Dollar General |
Strafford | MO | — | (8) | 51 | 461 | 10 | 522 | 56 | 11/10/2011 | 2009 | |||||||||||||||||||||||
| Dollar General |
Vienna | MO | — | (6) | 78 | 704 | — | 782 | 72 | 2/24/2012 | 2011 | |||||||||||||||||||||||
| Dollar General |
Willow Springs | MO | — | (1) | 24 | 213 | — | 237 | 18 | 6/19/2012 | 2002 | |||||||||||||||||||||||
| Dollar General |
Winona | MO | — | (1) | 52 | 155 | — | 207 | 13 | 6/19/2012 | 2001 | |||||||||||||||||||||||
| Dollar General |
Edwards | MS | — | 75 | 671 | — | 746 | 75 | 12/30/2011 | 2011 | ||||||||||||||||||||||||
| Dollar General |
Greensville | MS | — | 82 | 739 | — | 821 | 83 | 12/30/2011 | 2011 | ||||||||||||||||||||||||
| Dollar General |
Hickory | MS | — | (1) | 77 | 692 | — | 769 | 58 | 7/2/2012 | 2011 | |||||||||||||||||||||||
| Dollar General |
Jackson | MS | — | (1) | 198 | 793 | — | 991 | 56 | 9/27/2012 | 2011 | |||||||||||||||||||||||
| Dollar General |
Meridian | MS | — | (1) | 178 | 713 | — | 891 | 53 | 9/13/2012 | 2011 | |||||||||||||||||||||||
| Dollar General |
Meridian | MS | — | (1) | 40 | 754 | — | 794 | 56 | 9/13/2012 | 2011 | |||||||||||||||||||||||
| Dollar General |
Moorhead | MS | — | (6) | 107 | 606 | — | 713 | 57 | 5/1/2012 | 2011 | |||||||||||||||||||||||
| Dollar General |
Natchez | MS | — | (1) | 166 | 664 | — | 830 | 59 | 6/11/2012 | 2012 | |||||||||||||||||||||||
| Dollar General |
Soso | MS | — | (6) | 116 | 658 | — | 774 | 65 | 4/12/2012 | 2011 | |||||||||||||||||||||||
| Dollar General |
Stonewall | MS | — | (1) | 116 | 655 | — | 771 | 55 | 7/2/2012 | 2011 | |||||||||||||||||||||||
| Dollar General |
Stringer | MS | — | (1) | 116 | 655 | — | 771 | 55 | 7/2/2012 | 2011 | |||||||||||||||||||||||
| Dollar General |
Walmut Grove | MS | — | 71 | 641 | — | 712 | 72 | 12/30/2011 | 2011 | ||||||||||||||||||||||||
| Dollar General |
Fayetteville | NC | — | 216 | 647 | — | 863 | 70 | 2/6/2012 | 2011 | ||||||||||||||||||||||||
| Dollar General |
Hickory | NC | — | (1) | 89 | 804 | — | 893 | 64 | 8/13/2012 | 2012 | |||||||||||||||||||||||
| Dollar General |
Ocean Isle Beach | NC | — | 341 | 633 | — | 974 | 68 | 2/6/2012 | 2011 | ||||||||||||||||||||||||
| Dollar General |
Tryon | NC | — | (1) | 139 | 789 | — | 928 | 63 | 8/13/2012 | 2012 | |||||||||||||||||||||||
| Dollar General |
Vass | NC | — | 226 | 528 | — | 754 | 57 | 2/6/2012 | 2011 | ||||||||||||||||||||||||
| Dollar General |
Farmington | NM | — | (1) | 269 | 807 | — | 1,076 | 60 | 9/6/2012 | 2012 | |||||||||||||||||||||||
| Dollar General |
Forest | OH | — | 76 | 681 | — | 757 | 83 | 10/31/2011 | 2010 | ||||||||||||||||||||||||
| Dollar General |
Greenfield | OH | — | 110 | 986 | — | 1,096 | 102 | 2/23/2012 | 2011 | ||||||||||||||||||||||||
| Dollar General |
Loudonville | OH | — | (1) | 236 | 945 | — | 1,181 | 84 | 6/6/2012 | 2012 | |||||||||||||||||||||||
| Dollar General |
Lucasville | OH | — | (1) | 223 | 893 | — | 1,116 | 79 | 5/16/2012 | 2012 | |||||||||||||||||||||||
| Dollar General |
New Carlisle | OH | — | (1) | 215 | 860 | — | 1,075 | 72 | 7/10/2012 | 2012 | |||||||||||||||||||||||
| Dollar General |
New Matamoras | OH | — | 123 | 696 | — | 819 | 85 | 10/31/2011 | 2010 | ||||||||||||||||||||||||
F-111
Table of Contents
| Initial Costs | Costs Capitalized Subsequent to Acquisition |
Gross Amount Carried at December 31, 2013 (10) (11) |
||||||||||||||||||||||||||||||||
| Property |
City |
State |
Encumbrances at December 31, 2013 |
Land | Buildings, Fixtures and Improvements |
Accumulated Depreciation (12)(13) |
Date Acquired |
Date of Construction | ||||||||||||||||||||||||||
| Dollar General |
Payne | OH | — | (3) | 81 | 729 | — | 810 | 89 | 10/31/2011 | 2010 | |||||||||||||||||||||||
| Dollar General |
Pleasant City | OH | — | (3) | 131 | 740 | — | 871 | 90 | 10/31/2011 | 2010 | |||||||||||||||||||||||
| Dollar General |
Calera | OK | — | (1) | 136 | 770 | — | 906 | 58 | 8/31/2012 | 2010 | |||||||||||||||||||||||
| Dollar General |
Commerce | OK | — | (1) | 38 | 341 | — | 379 | 41 | 11/10/2011 | 2006 | |||||||||||||||||||||||
| Dollar General |
Hartshorne | OK | — | (1) | 100 | 898 | — | 998 | 67 | 8/31/2012 | 2010 | |||||||||||||||||||||||
| Dollar General |
Lexington | OK | — | (1) | 85 | 761 | — | 846 | 57 | 8/31/2012 | 2010 | |||||||||||||||||||||||
| Dollar General |
Maud | OK | — | (1) | 76 | 688 | — | 764 | 51 | 8/31/2012 | 2010 | |||||||||||||||||||||||
| Dollar General |
Maysville | OK | — | (1) | 41 | 785 | — | 826 | 59 | 8/31/2012 | 2010 | |||||||||||||||||||||||
| Dollar General |
Nowata | OK | — | (1) | 43 | 128 | — | 171 | 11 | 6/19/2012 | 1998 | |||||||||||||||||||||||
| Dollar General |
Rush Spring | OK | — | (1) | 87 | 779 | — | 866 | 58 | 8/31/2012 | 2010 | |||||||||||||||||||||||
| Dollar General |
Doyle | TN | — | (1) | 75 | 679 | — | 754 | 51 | 8/22/2012 | 2012 | |||||||||||||||||||||||
| Dollar General |
Manchester | TN | — | (1) | 114 | 646 | — | 760 | 51 | 7/26/2012 | 2012 | |||||||||||||||||||||||
| Dollar General |
McMinnville | TN | — | (1) | 120 | 679 | — | 799 | 57 | 7/12/2012 | 2012 | |||||||||||||||||||||||
| Dollar General |
Pleasant Hill | TN | — | 39 | 747 | — | 786 | 84 | 12/30/2011 | 2011 | ||||||||||||||||||||||||
| Dollar General |
Academy | TX | — | (1) | 122 | 693 | — | 815 | 65 | 4/27/2012 | 2012 | |||||||||||||||||||||||
| Dollar General |
Alto Bonito | TX | — | (5) | 163 | 652 | — | 815 | 70 | 2/1/2012 | 2011 | |||||||||||||||||||||||
| Dollar General |
Blessing | TX | — | (1) | 83 | 745 | — | 828 | 42 | 12/18/2012 | 2012 | |||||||||||||||||||||||
| Dollar General |
Bryan | TX | — | (1) | 148 | 840 | — | 988 | 63 | 9/14/2012 | 2012 | |||||||||||||||||||||||
| Dollar General |
Bryan | TX | — | (1) | 193 | 772 | — | 965 | 58 | 9/14/2012 | 2012 | |||||||||||||||||||||||
| Dollar General |
Bryan | TX | — | (1) | 185 | 740 | — | 925 | 55 | 8/31/2012 | 2009 | |||||||||||||||||||||||
| Dollar General |
Canyon Lake | TX | — | (1) | 149 | 843 | — | 992 | 59 | 10/12/2012 | 2012 | |||||||||||||||||||||||
| Dollar General |
Como | TX | — | (6) | 76 | 683 | — | 759 | 64 | 4/20/2012 | 2012 | |||||||||||||||||||||||
| Dollar General |
Corpus Christi | TX | — | (1) | 270 | 809 | — | 1,079 | 45 | 12/26/2012 | 2012 | |||||||||||||||||||||||
| Dollar General |
Dickinson | TX | — | (1) | 87 | 786 | — | 873 | 55 | 9/25/2012 | 2012 | |||||||||||||||||||||||
| Dollar General |
Donna | TX | — | (1) | 136 | 768 | — | 904 | 58 | 9/11/2012 | 2012 | |||||||||||||||||||||||
| Dollar General |
Donna | TX | — | (1) | 200 | 799 | — | 999 | 56 | 10/12/2012 | 2012 | |||||||||||||||||||||||
| Dollar General |
Donna | TX | — | (1) | 145 | 820 | — | 965 | 42 | 1/31/2013 | 2012 | |||||||||||||||||||||||
| Dollar General |
Edinburg | TX | — | (1) | 136 | 769 | — | 905 | 58 | 9/7/2012 | 2012 | |||||||||||||||||||||||
| Dollar General |
Elemdorf | TX | — | (1) | 94 | 847 | — | 941 | 56 | 10/23/2012 | 2012 | |||||||||||||||||||||||
| Dollar General |
Gladewater | TX | — | (1) | 184 | 736 | — | 920 | 55 | 8/31/2012 | 2009 | |||||||||||||||||||||||
| Dollar General |
Gordonville | TX | — | (6) | 38 | 717 | — | 755 | 67 | 4/20/2012 | 2012 | |||||||||||||||||||||||
| Dollar General |
Kyle | TX | — | (1) | 132 | 747 | — | 879 | 52 | 9/26/2012 | 2012 | |||||||||||||||||||||||
F-112
Table of Contents
| Initial Costs | Costs Capitalized Subsequent to Acquisition |
Gross Amount Carried at December 31, 2013 (10) (11) |
||||||||||||||||||||||||||||||||
| Property |
City |
State |
Encumbrances at December 31, 2013 |
Land | Buildings, Fixtures and Improvements |
Accumulated Depreciation (12)(13) |
Date Acquired |
Date of Construction | ||||||||||||||||||||||||||
| Dollar General |
LaMarque | TX | — | (1) | 102 | 917 | — | 1,019 | 69 | 8/31/2012 | 2010 | |||||||||||||||||||||||
| Dollar General |
Laredo | TX | — | (1) | 253 | 758 | — | 1,011 | 60 | 7/31/2012 | 2012 | |||||||||||||||||||||||
| Dollar General |
Lubbock | TX | — | (1) | 267 | 801 | — | 1,068 | 60 | 8/31/2012 | 2010 | |||||||||||||||||||||||
| Dollar General |
Lyford | TX | — | 80 | 724 | — | 804 | 81 | 12/30/2011 | 2010 | ||||||||||||||||||||||||
| Dollar General |
Morgans Point | TX | — | (1) | 145 | 821 | — | 966 | 61 | 9/13/2012 | 2012 | |||||||||||||||||||||||
| Dollar General |
Mount Pleasant | TX | — | (1) | 214 | 858 | — | 1,072 | 64 | 8/31/2012 | 2010 | |||||||||||||||||||||||
| Dollar General |
New Braunfels | TX | — | (1) | 205 | 818 | — | 1,023 | 61 | 8/31/2012 | 2012 | |||||||||||||||||||||||
| Dollar General |
Poteet | TX | — | (3) | 96 | 864 | — | 960 | 105 | 10/31/2011 | 2010 | |||||||||||||||||||||||
| Dollar General |
Progreso | TX | — | (3) | 169 | 957 | — | 1,126 | 116 | 10/31/2011 | 2009 | |||||||||||||||||||||||
| Dollar General |
Rio Grande City | TX | — | (3) | 137 | 779 | — | 916 | 95 | 10/31/2011 | 2010 | |||||||||||||||||||||||
| Dollar General |
Roma | TX | — | (3) | 253 | 1,010 | — | 1,263 | 123 | 10/31/2011 | 2010 | |||||||||||||||||||||||
| Dollar General |
San Antonio | TX | — | (1) | 252 | 756 | — | 1,008 | 50 | 10/22/2012 | 2012 | |||||||||||||||||||||||
| Dollar General |
San Antonio | TX | — | (1) | 222 | 888 | — | 1,110 | 58 | 10/22/2012 | 2012 | |||||||||||||||||||||||
| Dollar General |
Silsbee | TX | — | (1) | 43 | 810 | — | 853 | 68 | 7/6/2012 | 2012 | |||||||||||||||||||||||
| Dollar General |
Troy | TX | — | (1) | 93 | 841 | — | 934 | 63 | 9/12/2012 | 2012 | |||||||||||||||||||||||
| Dollar General |
Tyler | TX | — | (1) | 219 | 875 | — | 1,094 | 66 | 8/31/2012 | 2010 | |||||||||||||||||||||||
| Dollar General |
Victoria | TX | — | (1) | 91 | 817 | — | 908 | 42 | 1/31/2013 | 2013 | |||||||||||||||||||||||
| Dollar General |
Waco | TX | — | (1) | 192 | 767 | — | 959 | 57 | 8/31/2012 | 2012 | |||||||||||||||||||||||
| Dollar General |
Weslaco | TX | — | (1) | 215 | 862 | — | 1,077 | 61 | 9/24/2012 | 2012 | |||||||||||||||||||||||
| Dollar General |
Burkeville | VA | — | (1) | 160 | 906 | — | 1,066 | 85 | 5/8/2012 | 2012 | |||||||||||||||||||||||
| Dollar General |
Chesterfield | VA | — | 242 | 726 | — | 968 | 78 | 2/6/2012 | 2011 | ||||||||||||||||||||||||
| Dollar General |
Danville | VA | — | 155 | 621 | — | 776 | 67 | 2/6/2012 | 2011 | ||||||||||||||||||||||||
| Dollar General |
Hopewell | VA | — | 584 | 713 | — | 1,297 | 77 | 2/6/2012 | 2011 | ||||||||||||||||||||||||
| Dollar General |
Hot Springs | VA | — | 283 | 661 | — | 944 | 71 | 2/6/2012 | 2011 | ||||||||||||||||||||||||
| Dollar General |
Mellen | WI | — | 79 | 711 | — | 790 | 80 | 12/30/2011 | 2011 | ||||||||||||||||||||||||
| Dollar General |
Minong | WI | — | 38 | 727 | — | 765 | 82 | 12/30/2011 | 2011 | ||||||||||||||||||||||||
F-113
Table of Contents
| Initial Costs | Costs Capitalized Subsequent to Acquisition |
Gross Amount Carried at December 31, 2013 (10) (11) |
||||||||||||||||||||||||||||||||
| Property |
City |
State |
Encumbrances at December 31, 2013 |
Land | Buildings, Fixtures and Improvements |
Accumulated Depreciation (12)(13) |
Date Acquired |
Date of Construction | ||||||||||||||||||||||||||
| Dollar General |
Solon Springs | WI | — | 76 | 685 | — | 761 | 77 | 12/30/2011 | 2011 | ||||||||||||||||||||||||
| Dunkin’ Donuts/Baskin-Robbins |
Dearborn Heights | MI | — | (1) | 230 | 846 | — | 1,076 | 23 | 6/27/2013 | 1998 | |||||||||||||||||||||||
| Einstein Bros. Bagels |
Dearborn | MI | — | (1) | 190 | 724 | — | 914 | 20 | 6/27/2013 | 1997 | |||||||||||||||||||||||
| Exelis |
Herndon | VA | 39,519 | 1,384 | 53,584 | — | 54,968 | 434 | 11/5/2013 | 2006 | ||||||||||||||||||||||||
| Express Scripts |
St. Louis | MO | — | (4) | 5,706 | 32,333 | — | 38,039 | 3,661 | 1/25/2012 | 2011 | |||||||||||||||||||||||
| Family Dollar |
Rangeley | CO | — | (6) | 66 | 593 | — | 659 | 56 | 5/4/2012 | 2010 | |||||||||||||||||||||||
| Family Dollar |
Middleburg | FL | — | (1) | 274 | 822 | — | 1,096 | 27 | 6/4/2013 | 2008 | |||||||||||||||||||||||
| Family Dollar |
Ormond Beach | FL | — | 573 | 860 | — | 1,433 | 28 | 6/4/2013 | 2008 | ||||||||||||||||||||||||
| Family Dollar |
Lenox | GA | — | (1) | 90 | 809 | — | 899 | 53 | 11/9/2012 | 2012 | |||||||||||||||||||||||
| Family Dollar |
Arco | ID | — | (1) | 76 | 684 | — | 760 | 48 | 9/18/2012 | 2012 | |||||||||||||||||||||||
| Family Dollar |
Kimberly | ID | — | (1) | 219 | 657 | — | 876 | 28 | 4/10/2013 | 2013 | |||||||||||||||||||||||
| Family Dollar |
Brookston | IN | — | (1) | 126 | 715 | — | 841 | 50 | 10/1/2012 | 2012 | |||||||||||||||||||||||
| Family Dollar |
Greensburg | KS | — | (1) | 80 | 718 | — | 798 | 13 | 9/9/2013 | 2012 | |||||||||||||||||||||||
| Family Dollar |
Chalmette | LA | — | (1) | 751 | 615 | — | 1,366 | 58 | 5/3/2012 | 2011 | |||||||||||||||||||||||
| Family Dollar |
Tickfaw | LA | — | (1) | 181 | 543 | — | 724 | 53 | 3/30/2012 | 2011 | |||||||||||||||||||||||
| Family Dollar |
Detroit | MI | — | (1) | 130 | 1,169 | — | 1,299 | 71 | 11/27/2012 | 2011 | |||||||||||||||||||||||
| Family Dollar |
Detroit | MI | — | (1) | 106 | 956 | — | 1,062 | 36 | 5/2/2013 | 1964 | |||||||||||||||||||||||
| Family Dollar |
Jackson | MI | — | (1) | 93 | 525 | — | 618 | 10 | 9/12/2013 | 2007 | |||||||||||||||||||||||
| Family Dollar |
St Louis | MO | — | (1) | 445 | 1,038 | — | 1,483 | 68 | 12/14/2012 | 2012 | |||||||||||||||||||||||
| Family Dollar |
St. Louis | MO | — | (1) | 168 | 671 | — | 839 | 66 | 4/2/2012 | 2006 | |||||||||||||||||||||||
| Family Dollar |
St. Louis | MO | — | (1) | 445 | 1,039 | — | 1,484 | 63 | 10/23/2012 | 2012 | |||||||||||||||||||||||
| Family Dollar |
St. Louis | MO | — | (1) | 215 | 1,219 | — | 1,434 | 46 | 4/30/2013 | 2013 | |||||||||||||||||||||||
| Family Dollar |
Biloxi | MS | — | (6) | 310 | 575 | — | 885 | 57 | 3/30/2012 | 2012 | |||||||||||||||||||||||
| Family Dollar |
Carriere | MS | — | (6) | 200 | 599 | — | 799 | 59 | 3/30/2012 | 2012 | |||||||||||||||||||||||
| Family Dollar |
D’Iberville | MS | — | (1) | 241 | 561 | — | 802 | 50 | 5/21/2012 | 2011 | |||||||||||||||||||||||
| Family Dollar |
Gulfport | MS | — | (6) | 209 | 626 | — | 835 | 56 | 5/21/2012 | 2012 | |||||||||||||||||||||||
| Family Dollar |
Gulfport | MS | — | (1) | 270 | 629 | — | 899 | 44 | 9/20/2012 | 2012 | |||||||||||||||||||||||
| Family Dollar |
Gulfport | MS | — | (1) | 218 | 654 | — | 872 | 43 | 11/15/2012 | 2012 | |||||||||||||||||||||||
| Family Dollar |
Hattiesburg | MS | — | (1) | 225 | 674 | — | 899 | 35 | 1/30/2013 | 2012 | |||||||||||||||||||||||
| Family Dollar |
Horn Lake | MS | — | (1) | 225 | 676 | — | 901 | 51 | 8/22/2012 | 2012 | |||||||||||||||||||||||
| Family Dollar |
Kiln | MS | — | (1) | 106 | 650 | — | 756 | 43 | 11/14/2012 | 2012 | |||||||||||||||||||||||
| Family Dollar |
Okolona | MS | — | (1) | 64 | 578 | — | 642 | 46 | 7/31/2012 | 2012 | |||||||||||||||||||||||
F-114
Table of Contents
| Initial Costs | Costs Capitalized Subsequent to Acquisition |
Gross Amount Carried at December 31, 2013 (10) (11) |
||||||||||||||||||||||||||||||||
| Property |
City |
State |
Encumbrances at December 31, 2013 |
Land | Buildings, Fixtures and Improvements |
Accumulated Depreciation (12)(13) |
Date Acquired |
Date of Construction | ||||||||||||||||||||||||||
| Family Dollar |
Winona | MS | — | (1) | 146 | 585 | — | 731 | 47 | 7/31/2012 | 2012 | |||||||||||||||||||||||
| Family Dollar |
Lumberton | NC | — | 151 | 603 | — | 754 | 11 | 9/11/2013 | 2006 | ||||||||||||||||||||||||
| Family Dollar |
Fort Yates | ND | — | (5) | 126 | 715 | — | 841 | 77 | 1/31/2012 | 2010 | |||||||||||||||||||||||
| Family Dollar |
New Town | ND | — | (5) | 105 | 942 | — | 1,047 | 101 | 1/31/2012 | 2011 | |||||||||||||||||||||||
| Family Dollar |
Rolla | ND | — | (5) | 83 | 749 | — | 832 | 81 | 1/31/2012 | 2010 | |||||||||||||||||||||||
| Family Dollar |
Madison | NE | — | (5) | 37 | 703 | — | 740 | 79 | 12/30/2011 | 2011 | |||||||||||||||||||||||
| Family Dollar |
Chimayo | NM | — | (1) | 158 | 632 | — | 790 | 33 | 1/30/2013 | 2009 | |||||||||||||||||||||||
| Family Dollar |
Mountainair | NM | — | (1) | 84 | 752 | — | 836 | 63 | 7/6/2012 | 2011 | |||||||||||||||||||||||
| Family Dollar |
Hawthorne | NV | — | (6) | 191 | 764 | — | 955 | 68 | 6/1/2012 | 2012 | |||||||||||||||||||||||
| Family Dollar |
Lovelock | NV | — | (6) | 185 | 742 | — | 927 | 69 | 5/4/2012 | 2012 | |||||||||||||||||||||||
| Family Dollar |
Silver Spring | NV | — | (1) | 202 | 808 | — | 1,010 | 57 | 9/21/2012 | 2012 | |||||||||||||||||||||||
| Family Dollar |
Wells | NV | — | (6) | 84 | 755 | — | 839 | 71 | 5/11/2012 | 2011 | |||||||||||||||||||||||
| Family Dollar |
Toledo | OH | — | (1) | 306 | 917 | — | 1,223 | 43 | 2/25/2013 | 2012 | |||||||||||||||||||||||
| Family Dollar |
Warren | OH | — | (1) | 170 | 681 | — | 851 | 51 | 9/11/2012 | 2012 | |||||||||||||||||||||||
| Family Dollar |
Stillwell | OK | — | (5) | 40 | 768 | — | 808 | 86 | 1/6/2012 | 2011 | |||||||||||||||||||||||
| Family Dollar |
Tulsa | OK | — | (6) | 220 | 878 | — | 1,098 | 70 | 7/30/2012 | 2012 | |||||||||||||||||||||||
| Family Dollar |
Martin | SD | — | (5) | 85 | 764 | — | 849 | 82 | 1/31/2012 | 2009 | |||||||||||||||||||||||
| Family Dollar |
Harrison | TN | — | (1) | 74 | 420 | — | 494 | 10 | 7/23/2013 | 2006 | |||||||||||||||||||||||
| Family Dollar |
Avinger | TX | — | (1) | 40 | 761 | — | 801 | 50 | 10/22/2012 | 2012 | |||||||||||||||||||||||
| Family Dollar |
Caldwell | TX | — | (1) | 138 | 552 | — | 690 | 49 | 5/29/2012 | 2012 | |||||||||||||||||||||||
| Family Dollar |
Chireno | TX | — | (1) | 50 | 943 | — | 993 | 57 | 12/10/2012 | 2012 | |||||||||||||||||||||||
| Family Dollar |
Eagle Lake | TX | — | (1) | 100 | 566 | — | 666 | 48 | 7/6/2012 | 2012 | |||||||||||||||||||||||
| Family Dollar |
Floydada | TX | — | (5) | 36 | 681 | — | 717 | 77 | 12/30/2011 | 2010 | |||||||||||||||||||||||
| Family Dollar |
Kerens | TX | — | (6) | 73 | 658 | — | 731 | 68 | 2/29/2012 | 2011 | |||||||||||||||||||||||
| Family Dollar |
Oakhurst | TX | — | (1) | 36 | 683 | — | 719 | 42 | 12/12/2012 | 2012 | |||||||||||||||||||||||
| Family Dollar |
Plano | TX | — | (1) | 468 | 869 | — | 1,337 | 20 | 8/1/2013 | 2013 | |||||||||||||||||||||||
| Family Dollar |
Kemmerer | WY | — | (1) | 45 | 853 | — | 898 | 40 | 2/22/2013 | 2013 | |||||||||||||||||||||||
| Famous Dave’s |
Independence | MO | — | (1) | 620 | 422 | — | 1,042 | 12 | 6/27/2013 | 1999 | |||||||||||||||||||||||
| Farmers Group, Inc. |
Simi Valley | CA | 25,620 | 11,851 | 31,096 | — | 42,947 | 314 | 11/5/2013 | 1982 | ||||||||||||||||||||||||
| Farmers New World Life Insurance Company |
Mercer Island | WA | 29,161 | 24,287 | 28,210 | — | 52,497 | 231 | 11/5/2013 | 1982 | ||||||||||||||||||||||||
| FedEx |
Lowell | AR | — | (1) | 396 | 7,521 | — | 7,917 | 382 | 3/15/2013 | 2012 | |||||||||||||||||||||||
| FedEx |
Yuma | AZ | — | — | 2,076 | — | 2,076 | 148 | 10/17/2012 | 2011 | ||||||||||||||||||||||||
F-115
Table of Contents
| Initial Costs | Costs Capitalized Subsequent to Acquisition |
Gross Amount Carried at December 31, 2013 (10) (11) |
||||||||||||||||||||||||||||||||
| Property |
City |
State |
Encumbrances at December 31, 2013 |
Land | Buildings, Fixtures and Improvements |
Accumulated Depreciation (12)(13) |
Date Acquired |
Date of Construction | ||||||||||||||||||||||||||
| FedEx |
Chico | CA | — | (1) | 308 | 2,776 | — | 3,084 | 198 | 11/9/2012 | 2006 | |||||||||||||||||||||||
| FedEx |
Commerce City | CO | — | (4) | 6,556 | 26,224 | — | 32,780 | 2,799 | 3/20/2012 | 2007 | |||||||||||||||||||||||
| FedEx |
Melbourne | FL | — | (1) | 159 | 1,433 | — | 1,592 | 36 | 7/26/2013 | 1989 | |||||||||||||||||||||||
| FedEx |
Kankakee | IL | — | (1) | 195 | 1,103 | — | 1,298 | 107 | 5/31/2012 | 2003 | |||||||||||||||||||||||
| FedEx |
Mt. Vernon | IL | — | (1) | 222 | 1,259 | — | 1,481 | 122 | 5/31/2012 | 2009 | |||||||||||||||||||||||
| FedEx |
Quincy | IL | — | 371 | 2,101 | — | 2,472 | 160 | 9/28/2012 | 2012 | ||||||||||||||||||||||||
| FedEx |
Evansville | IN | — | (1) | 665 | 2,661 | — | 3,326 | 257 | 5/31/2012 | 2003 | |||||||||||||||||||||||
| FedEx |
Kokomo | IN | — | 186 | 3,541 | — | 3,727 | 378 | 3/16/2012 | 2012 | ||||||||||||||||||||||||
| FedEx |
Hazard | KY | — | 215 | 4,085 | — | 4,300 | 312 | 9/28/2012 | 2012 | ||||||||||||||||||||||||
| FedEx |
London | KY | — | (1) | 191 | 1,081 | — | 1,272 | 104 | 5/31/2012 | 2000 | |||||||||||||||||||||||
| FedEx |
Grand Rapids | MI | 4,800 | 1,797 | 7,189 | — | 8,986 | 694 | 6/14/2012 | 2012 | ||||||||||||||||||||||||
| FedEx |
Port Huron | MI | — | (1) | 125 | 1,121 | — | 1,246 | 40 | 5/31/2013 | 2003 | |||||||||||||||||||||||
| FedEx |
Roseville | MN | — | 1,462 | 8,282 | — | 9,744 | 547 | 11/30/2012 | 2012 | ||||||||||||||||||||||||
| FedEx |
Butte | MT | 5,060 | 403 | 7,653 | — | 8,056 | 1,050 | 9/27/2011 | 2011 | ||||||||||||||||||||||||
| FedEx |
Belmont | NH | — | (4) | 265 | 2,386 | — | 2,651 | 291 | 12/29/2011 | 2011 | |||||||||||||||||||||||
| FedEx |
Wendover | NV | — | (1) | 262 | 1,483 | — | 1,745 | 75 | 2/25/2013 | 2012 | |||||||||||||||||||||||
| FedEx |
Winnemucca | NV | — | (1) | 280 | 1,585 | — | 1,865 | 81 | 2/25/2013 | 2012 | |||||||||||||||||||||||
| FedEx |
Blauvelt | NY | — | 14,420 | 26,779 | — | 41,199 | 2,859 | 4/5/2012 | 2012 | ||||||||||||||||||||||||
| FedEx |
Chillicothe | OH | — | (1) | 143 | 1,284 | — | 1,427 | 124 | 5/31/2012 | 2000 | |||||||||||||||||||||||
| FedEx |
Mt. Pleasant | PA | — | (1) | 454 | 1,814 | 98 | 2,366 | 179 | 5/31/2012 | 2001 | |||||||||||||||||||||||
| FedEx |
Blountville | TN | — | (4) | 562 | 5,056 | — | 5,618 | 591 | 2/3/2012 | 2009 | |||||||||||||||||||||||
| FedEx |
Humboldt | TN | — | 239 | 4,543 | — | 4,782 | 416 | 7/11/2012 | 2008 | ||||||||||||||||||||||||
| FedEx |
Bryan | TX | — | (1) | 1,422 | 3,318 | — | 4,740 | 320 | 6/15/2012 | 2011 | |||||||||||||||||||||||
| FedEx |
Omak | WA | — | 252 | 1,425 | — | 1,677 | 109 | 9/27/2012 | 2012 | ||||||||||||||||||||||||
| FedEx |
Wenatchee | WA | — | 266 | 2,393 | — | 2,659 | 183 | 9/28/2012 | 2012 | ||||||||||||||||||||||||
| FedEx |
Parkersburg | WV | — | 193 | 3,671 | — | 3,864 | 280 | 9/20/2012 | 2012 | ||||||||||||||||||||||||
| FedEx Ground |
Greenville | NC | — | (5) | 363 | 6,903 | — | 7,266 | 772 | 2/22/2012 | 2011 | |||||||||||||||||||||||
F-116
Table of Contents
| Initial Costs | Costs Capitalized Subsequent to Acquisition |
Gross Amount Carried at December 31, 2013 (10) (11) |
||||||||||||||||||||||||||||||||
| Property |
City |
State |
Encumbrances at December 31, 2013 |
Land | Buildings, Fixtures and Improvements |
Accumulated Depreciation (12)(13) |
Date Acquired |
Date of Construction | ||||||||||||||||||||||||||
| FedEx Ground |
Tulsa | OK | — | (5) | 458 | 8,695 | — | 9,153 | 972 | 2/22/2012 | 2011 | |||||||||||||||||||||||
| First Bank |
Pinellas Park | FL | — | 630 | 1,470 | — | 2,100 | 18 | 10/1/2013 | 1981 | ||||||||||||||||||||||||
| Fresenius |
Aurora | IL | — | 287 | 2,584 | — | 2,871 | 182 | 7/13/2012 | 2009 | ||||||||||||||||||||||||
| Fresenius |
Chicago | IL | — | 588 | 1,764 | — | 2,352 | 117 | 7/31/2012 | 2009 | ||||||||||||||||||||||||
| Fresenius |
Waukegan | IL | — | 94 | 1,792 | — | 1,886 | 119 | 7/31/2012 | 2011 | ||||||||||||||||||||||||
| Fresenius |
Peru | IN | — | 69 | 1,305 | — | 1,374 | 92 | 6/27/2012 | 1982 | ||||||||||||||||||||||||
| Fresenius |
Bossier City | LA | — | (1) | 120 | 682 | — | 802 | 29 | 1/30/2013 | 2008 | |||||||||||||||||||||||
| Fresenius |
Caro | MI | — | (1) | 92 | 1,744 | — | 1,836 | 130 | 6/5/2012 | 2009 | |||||||||||||||||||||||
| Fresenius |
Jackson | MI | — | 137 | 2,603 | — | 2,740 | 194 | 6/5/2012 | 2008 | ||||||||||||||||||||||||
| Fresenius |
Albermarle | NC | — | (1) | 139 | 1,253 | — | 1,392 | 39 | 4/30/2013 | 2008 | |||||||||||||||||||||||
| Fresenius |
Angier | NC | — | (1) | 203 | 1,152 | — | 1,355 | 36 | 4/30/2013 | 2012 | |||||||||||||||||||||||
| Fresenius |
Asheboro | NC | — | 323 | 2,903 | — | 3,226 | 91 | 4/30/2013 | 2012 | ||||||||||||||||||||||||
| Fresenius |
Taylorsville | NC | — | (1) | 275 | 1,099 | — | 1,374 | 34 | 4/30/2013 | 2011 | |||||||||||||||||||||||
| Fresenius |
Warsaw | NC | — | (1) | 75 | 1,428 | — | 1,503 | 78 | 11/13/2012 | 2003 | |||||||||||||||||||||||
| Fresenius |
Kings Mills | OH | — | (1) | 399 | 598 | — | 997 | 45 | 6/5/2012 | 2007 | |||||||||||||||||||||||
| Fresenius |
Dallas | TX | — | (1) | 377 | 1,132 | — | 1,509 | 44 | 2/28/2013 | 1958 | |||||||||||||||||||||||
| GE Aviation |
Auburn | AL | — | 1,627 | 30,920 | — | 32,547 | 1,767 | 11/21/2012 | 2012 | ||||||||||||||||||||||||
| General Mills |
Geneva | IL | 16,555 | 7,457 | 22,371 | — | 29,828 | 2,161 | 5/23/2012 | 1998 | ||||||||||||||||||||||||
| General Mills |
Fort Wayne | IN | — | (1) | 2,533 | 48,130 | — | 50,663 | 3,425 | 10/18/2012 | 2012 | |||||||||||||||||||||||
| General Motors Financial Company |
Arlington | TX | 25,552 | 7,901 | 35,553 | — | 43,454 | 328 | 11/5/2013 | 1999 | ||||||||||||||||||||||||
| Golden Corral |
Albany | GA | — | (1) | 460 | 1,863 | — | 2,323 | 53 | 6/27/2013 | 1998 | |||||||||||||||||||||||
| Golden Corral |
Brunswick | GA | — | (1) | 390 | 2,093 | — | 2,483 | 60 | 6/27/2013 | 1998 | |||||||||||||||||||||||
| Golden Corral |
McDonough | GA | — | (1) | 930 | 3,936 | — | 4,866 | 113 | 6/27/2013 | 2004 | |||||||||||||||||||||||
| Golden Corral |
Council Bluffs | IA | — | (1) | 1,140 | 1,460 | — | 2,600 | 42 | 6/27/2013 | 1998 | |||||||||||||||||||||||
| Golden Corral |
Evansville | IN | — | (1) | 670 | 2,707 | — | 3,377 | 78 | 6/27/2013 | 1999 | |||||||||||||||||||||||
| Golden Corral |
Evansville | IN | — | (1) | 640 | 944 | — | 1,584 | 27 | 6/27/2013 | 1999 | |||||||||||||||||||||||
| Golden Corral |
Fort Wayne | IN | — | (1) | 820 | 1,935 | — | 2,755 | 55 | 6/27/2013 | 1999 | |||||||||||||||||||||||
| Golden Corral |
Kokomo | IN | — | (1) | 780 | 2,107 | — | 2,887 | 60 | 6/27/2013 | 2000 | |||||||||||||||||||||||
| Golden Corral |
Elizabethtown | KY | — | (1) | 760 | 2,753 | — | 3,513 | 79 | 6/27/2013 | 1997 | |||||||||||||||||||||||
| Golden Corral |
Henderson | KY | — | (1) | 600 | 1,586 | — | 2,186 | 45 | 6/27/2013 | 1999 | |||||||||||||||||||||||
| Golden Corral |
Blue Springs | MO | — | (1) | 810 | 1,346 | — | 2,156 | 39 | 6/27/2013 | 2000 | |||||||||||||||||||||||
| Golden Corral |
Flowood | MS | — | (1) | 680 | 2,730 | — | 3,410 | 78 | 6/27/2013 | 1999 | |||||||||||||||||||||||
F-117
Table of Contents
| Initial Costs | Costs Capitalized Subsequent to Acquisition |
Gross Amount Carried at December 31, 2013 (10) (11) |
||||||||||||||||||||||||||||||||
| Property |
City |
State |
Encumbrances at December 31, 2013 |
Land | Buildings, Fixtures and Improvements |
Accumulated Depreciation (12)(13) |
Date Acquired |
Date of Construction | ||||||||||||||||||||||||||
| Golden Corral |
Aberdeen | NC | — | (1) | 690 | 1,566 | — | 2,256 | 45 | 6/27/2013 | 1994 | |||||||||||||||||||||||
| Golden Corral |
Burlington | NC | — | (1) | 840 | 2,319 | — | 3,159 | 66 | 6/27/2013 | 1993 | |||||||||||||||||||||||
| Golden Corral |
Hickory | NC | — | (1) | 260 | 2,658 | — | 2,918 | 76 | 6/27/2013 | 1994 | |||||||||||||||||||||||
| Golden Corral |
Bellevue | NE | — | (1) | 520 | 1,433 | — | 1,953 | 41 | 6/27/2013 | 1999 | |||||||||||||||||||||||
| Golden Corral |
Lincoln | NE | — | (1) | 300 | 2,930 | — | 3,230 | 84 | 6/27/2013 | 2000 | |||||||||||||||||||||||
| Golden Corral |
Farmington | NM | — | (1) | 270 | 3,174 | — | 3,444 | 91 | 6/27/2013 | 1996 | |||||||||||||||||||||||
| Golden Corral |
Columbus | OH | — | (1) | 770 | 2,476 | — | 3,246 | 71 | 6/27/2013 | 1995 | |||||||||||||||||||||||
| Golden Corral |
Tulsa | OK | — | (1) | 280 | 3,890 | — | 4,170 | 112 | 6/27/2013 | 1999 | |||||||||||||||||||||||
| Golden Corral |
Rock Hill | SC | — | (1) | 320 | 2,130 | — | 2,450 | 61 | 6/27/2013 | 1999 | |||||||||||||||||||||||
| Golden Corral |
Cookeville | TN | — | (1) | 800 | 1,937 | — | 2,737 | 56 | 6/27/2013 | 1999 | |||||||||||||||||||||||
| Golden Corral |
Bristol | VA | — | (1) | 750 | 2,276 | — | 3,026 | 65 | 6/27/2013 | 2000 | |||||||||||||||||||||||
| Goodfire BBQ |
San Antonio | TX | — | (1) | 350 | 341 | — | 691 | 10 | 6/27/2013 | 1983 | |||||||||||||||||||||||
| Grandy’s |
Hobbs | NM | — | (1) | 815 | — | — | 815 | — | 6/27/2013 | 1984 | |||||||||||||||||||||||
| Grandy’s |
Ardmore | OK | — | (1) | 454 | — | — | 454 | — | 6/27/2013 | 1983 | |||||||||||||||||||||||
| Grandy’s |
Moore | OK | — | (1) | 320 | 428 | — | 748 | 12 | 6/27/2013 | 1987 | |||||||||||||||||||||||
| Grandy’s |
Oklahoma City | OK | — | (1) | 260 | 380 | — | 640 | 11 | 6/27/2013 | 1985 | |||||||||||||||||||||||
| Grandy’s |
Oklahoma City | OK | — | (1) | 320 | 289 | — | 609 | 8 | 6/27/2013 | 1984 | |||||||||||||||||||||||
| GSA |
Birmingham | AL | 10,568 | 1,400 | 8,830 | — | 10,230 | 84 | 11/5/2013 | 2005 | ||||||||||||||||||||||||
| GSA |
Mobile | AL | — | (1) | 268 | 5,095 | — | 5,363 | 420 | 6/19/2012 | 1995 | |||||||||||||||||||||||
| GSA |
Birmingham | AL | 17,640 | 2,982 | 19,982 | — | 22,964 | 193 | 11/5/2013 | 2007 | ||||||||||||||||||||||||
| GSA |
Springerville | AZ | — | (1) | 148 | 2,810 | — | 2,958 | 232 | 7/2/2012 | 2006 | |||||||||||||||||||||||
| GSA |
Craig | CO | — | (5) | 129 | 1,159 | — | 1,288 | 128 | 12/30/2011 | 2011 | |||||||||||||||||||||||
| GSA |
Cocoa | FL | — | 253 | 1,435 | — | 1,688 | 164 | 12/13/2011 | 2009 | ||||||||||||||||||||||||
| GSA |
Stuart | FL | — | (1) | 900 | 3,600 | — | 4,500 | 363 | 3/5/2012 | 2011 | |||||||||||||||||||||||
| GSA |
Grangeville | ID | — | 317 | 6,023 | — | 6,340 | 607 | 3/5/2012 | 2007 | ||||||||||||||||||||||||
| GSA |
Kansas City | KS | 16,872 | 4,264 | 29,678 | — | 33,942 | 276 | 11/5/2013 | 2003 | ||||||||||||||||||||||||
| GSA |
Springfield | MO | — | (1) | 131 | 2,489 | — | 2,620 | 228 | 5/15/2012 | 2011 | |||||||||||||||||||||||
| GSA |
Albany | NY | 10,137 | 2,470 | 11,836 | — | 14,306 | 124 | 11/5/2013 | 2008 | ||||||||||||||||||||||||
| GSA |
Freeport | NY | — | (1) | 843 | 3,372 | — | 4,215 | 371 | 1/10/2012 | 1960 | |||||||||||||||||||||||
| GSA |
Plattsburg | NY | — | (1) | 508 | 4,572 | — | 5,080 | 377 | 6/19/2012 | 2008 | |||||||||||||||||||||||
| GSA |
Warren | PA | — | (1) | 341 | 3,114 | — | 3,455 | 268 | 6/19/2012 | 2008 | |||||||||||||||||||||||
| GSA |
Ponce | PR | — | 1,780 | 9,297 | — | 11,077 | 128 | 11/5/2013 | 2000 | ||||||||||||||||||||||||
F-118
Table of Contents
| Initial Costs | Costs Capitalized Subsequent to Acquisition |
Gross Amount Carried at December 31, 2013 (10) (11) |
||||||||||||||||||||||||||||||||
| Property |
City |
State |
Encumbrances at December 31, 2013 |
Land | Buildings, Fixtures and Improvements |
Accumulated Depreciation (12)(13) |
Date Acquired |
Date of Construction | ||||||||||||||||||||||||||
| GSA |
Austin | TX | 5,046 | 1,570 | 3,057 | — | 4,627 | 37 | 11/5/2013 | 2005 | ||||||||||||||||||||||||
| GSA |
Fort Worth | TX | — | (1) | 477 | 4,290 | — | 4,767 | 393 | 5/9/2012 | 2010 | |||||||||||||||||||||||
| GSA |
Gloucester | VA | — | (1) | 287 | 1,628 | — | 1,915 | 134 | 6/19/2012 | 1997 | |||||||||||||||||||||||
| Habanero’s Mexican Grill |
Hueytown | AL | — | (1) | 60 | 639 | — | 699 | 18 | 6/27/2013 | 1987 | |||||||||||||||||||||||
| Hanesbrands |
Rural Hall | NC | — | 1,082 | 22,565 | — | 23,647 | 1,426 | 12/21/2012 | 1989 | ||||||||||||||||||||||||
| Hardee’s |
Alma | GA | — | (1) | 80 | 502 | — | 582 | 14 | 6/27/2013 | 1992 | |||||||||||||||||||||||
| Hardee’s |
Brunswick | GA | — | (1) | 200 | 494 | — | 694 | 14 | 6/27/2013 | 1992 | |||||||||||||||||||||||
| Hardee’s |
Claxton | GA | — | (1) | 170 | 469 | — | 639 | 13 | 6/27/2013 | 1986 | |||||||||||||||||||||||
| Hardee’s |
Glennville | GA | — | (1) | 170 | 450 | — | 620 | 12 | 6/27/2013 | 1986 | |||||||||||||||||||||||
| Hardee’s |
Hazlehurst | GA | — | (1) | 300 | 263 | — | 563 | 7 | 6/27/2013 | 1982 | |||||||||||||||||||||||
| Hardee’s |
Metter | GA | — | (1) | 230 | 369 | — | 599 | 10 | 6/27/2013 | 1984 | |||||||||||||||||||||||
| Hardee’s |
Richmond Hill | GA | — | (1) | 390 | 149 | — | 539 | 4 | 6/27/2013 | 1990 | |||||||||||||||||||||||
| Hardee’s |
Savannah | GA | — | (1) | 130 | 456 | — | 586 | 13 | 6/27/2013 | 1987 | |||||||||||||||||||||||
| Hardee’s |
Swainsboro | GA | — | (1) | 470 | 107 | — | 577 | 3 | 6/27/2013 | 1992 | |||||||||||||||||||||||
| Hardee’s |
Vidalia | GA | — | (1) | 220 | 377 | — | 597 | 10 | 6/27/2013 | 1990 | |||||||||||||||||||||||
| Hardee’s |
Old Fort | NC | — | (1) | 300 | 904 | — | 1,204 | 25 | 6/27/2013 | 1992 | |||||||||||||||||||||||
| Hardee’s |
Aiken | SC | — | (1) | 220 | 450 | — | 670 | 12 | 6/27/2013 | 1977 | |||||||||||||||||||||||
| Hardee’s |
Chapin | SC | — | (1) | 380 | 741 | — | 1,121 | 21 | 6/27/2013 | 1993 | |||||||||||||||||||||||
| Hardee’s |
Bloomingdale | TN | — | (1) | 270 | 844 | — | 1,114 | 23 | 6/27/2013 | 1992 | |||||||||||||||||||||||
| Hardee’s |
Clinton | TN | — | (1) | 390 | 893 | — | 1,283 | 25 | 6/27/2013 | 1992 | |||||||||||||||||||||||
| Hardee’s |
Crossville | TN | — | (1) | 300 | 689 | — | 989 | 19 | 6/27/2013 | 1992 | |||||||||||||||||||||||
| Hardee’s Red Burrito |
Attalla | AL | — | (1) | 220 | 896 | — | 1,116 | 25 | 6/27/2013 | 1993 | |||||||||||||||||||||||
| Hash House A-Go-Go Restaurant |
Las Vegas | NV | — | (1) | 580 | 1,347 | — | 1,927 | 39 | 6/27/2013 | 1997 | |||||||||||||||||||||||
| Home Depot |
Columbia | SC | 13,776 | 2,911 | 15,463 | — | 18,374 | 2,748 | 11/1/2009 | 2009 | ||||||||||||||||||||||||
| Houlihan’s |
Plymouth Meeting | PA | — | (1) | 870 | 2,015 | — | 2,885 | 58 | 6/27/2013 | 1974 | |||||||||||||||||||||||
| Huntington National Bank |
Conneaut | OH | — | 205 | 477 | — | 682 | 5 | 10/1/2013 | 1971 | ||||||||||||||||||||||||
| Huntington National Bank |
Jefferson | OH | — | 255 | 765 | — | 1,020 | 9 | 10/1/2013 | 1963 | ||||||||||||||||||||||||
F-119
Table of Contents
| Initial Costs | Costs Capitalized Subsequent to Acquisition |
Gross Amount Carried at December 31, 2013 (10) (11) |
||||||||||||||||||||||||||||||||
| Property |
City |
State |
Encumbrances at December 31, 2013 |
Land | Buildings, Fixtures and Improvements |
Accumulated Depreciation (12)(13) |
Date Acquired |
Date of Construction | ||||||||||||||||||||||||||
| Hy-Vee |
Vermillion | SD | — | 409 | 3,684 | — | 4,093 | 194 | 4/8/2013 | 2003 | ||||||||||||||||||||||||
| IHOP |
Homewood | AL | — | (1) | 610 | 1,762 | — | 2,372 | 50 | 6/27/2013 | 1996 | |||||||||||||||||||||||
| IHOP |
Castle Rock | CO | — | (1) | 320 | 2,334 | — | 2,654 | 67 | 6/27/2013 | 1999 | |||||||||||||||||||||||
| IHOP |
Greeley | CO | — | (1) | 120 | 1,538 | — | 1,658 | 44 | 6/27/2013 | 1998 | |||||||||||||||||||||||
| IHOP |
Pueblo | CO | — | (1) | 330 | 1,589 | — | 1,919 | 46 | 6/27/2013 | 1997 | |||||||||||||||||||||||
| IHOP |
Stockbridge | GA | — | (1) | 580 | 2,091 | — | 2,671 | 60 | 6/27/2013 | 1997 | |||||||||||||||||||||||
| IHOP |
Natchitoches | LA | — | 750 | 89 | — | 839 | 3 | 6/27/2013 | 1990 | ||||||||||||||||||||||||
| IHOP |
Roseville | MI | — | (1) | 340 | 1,071 | — | 1,411 | 31 | 6/27/2013 | 1997 | |||||||||||||||||||||||
| IHOP |
Kansas City | MO | — | (1) | 630 | 1,002 | — | 1,632 | 29 | 6/27/2013 | 1998 | |||||||||||||||||||||||
| IHOP |
Southaven | MS | — | (1) | 350 | 2,108 | — | 2,458 | 60 | 6/27/2013 | 1997 | |||||||||||||||||||||||
| IHOP |
Poughkeepsie | NY | — | (1) | 430 | 1,129 | — | 1,559 | 32 | 6/27/2013 | 1996 | |||||||||||||||||||||||
| IHOP |
Greenville | SC | — | (1) | 610 | 1,551 | — | 2,161 | 44 | 6/27/2013 | 1998 | |||||||||||||||||||||||
| IHOP |
Clarksville | TN | — | (1) | 530 | 1,346 | — | 1,876 | 39 | 6/27/2013 | 1997 | |||||||||||||||||||||||
| IHOP |
Memphis | TN | — | (1) | 750 | 2,009 | — | 2,759 | 58 | 6/27/2013 | 1997 | |||||||||||||||||||||||
| IHOP |
Murfreesboro | TN | — | (1) | 600 | 1,687 | — | 2,287 | 48 | 6/27/2013 | 1998 | |||||||||||||||||||||||
| IHOP |
Fort Worth | TX | — | (1) | 560 | 1,879 | — | 2,439 | 54 | 6/27/2013 | 1994 | |||||||||||||||||||||||
| IHOP |
Houston | TX | — | (1) | 760 | 2,462 | — | 3,222 | 71 | 6/27/2013 | 1996 | |||||||||||||||||||||||
| IHOP |
Killeen | TX | — | (1) | 380 | 1,028 | — | 1,408 | 29 | 6/27/2013 | 1997 | |||||||||||||||||||||||
| IHOP |
Lake Jackson | TX | — | (1) | 370 | 2,018 | — | 2,388 | 58 | 6/27/2013 | 1997 | |||||||||||||||||||||||
| IHOP |
Leon Valley | TX | — | (1) | 650 | 2,055 | — | 2,705 | 59 | 6/27/2013 | 1997 | |||||||||||||||||||||||
| IHOP |
Auburn | WA | — | (1) | 780 | 1,878 | — | 2,658 | 54 | 6/27/2013 | 1997 | |||||||||||||||||||||||
| Invesco Holding Co. Ltd. |
Denver | CO | 43,700 | 12,650 | 66,398 | — | 79,048 | 607 | 11/5/2013 | 2008 | ||||||||||||||||||||||||
| Iron Mountain |
Columbus | OH | — | (1) | 405 | 3,642 | — | 4,047 | 278 | 9/28/2012 | 1954 | |||||||||||||||||||||||
| Jack in the Box |
Avondale | AZ | — | (1) | 110 | 2,237 | — | 2,347 | 62 | 6/27/2013 | 1998 | |||||||||||||||||||||||
| Jack in the Box |
Chandler | AZ | — | (1) | 450 | 1,447 | — | 1,897 | 40 | 6/27/2013 | 1998 | |||||||||||||||||||||||
| Jack in the Box |
Folsom | CA | — | (1) | 280 | 2,423 | — | 2,703 | 67 | 6/27/2013 | 1997 | |||||||||||||||||||||||
| Jack in the Box |
Fresno | CA | — | (1) | 190 | 1,810 | — | 2,000 | 50 | 6/27/2013 | 1997 | |||||||||||||||||||||||
| Jack in the Box |
West Sacramento | CA | — | (1) | 590 | 1,710 | — | 2,300 | 47 | 6/27/2013 | 1997 | |||||||||||||||||||||||
| Jack in the Box |
Burley | ID | — | (1) | 240 | 1,430 | — | 1,670 | 40 | 6/27/2013 | 2000 | |||||||||||||||||||||||
| Jack in the Box |
Moscow | ID | — | (1) | 350 | 1,110 | — | 1,460 | 31 | 6/27/2013 | 1992 | |||||||||||||||||||||||
| Jack in the Box |
Belleville | IL | — | (1) | 200 | 966 | — | 1,166 | 27 | 6/27/2013 | 1987 | |||||||||||||||||||||||
| Jack in the Box |
Florissant | MO | — | (1) | 502 | 1,515 | — | 2,017 | 42 | 6/27/2013 | 1997 | |||||||||||||||||||||||
F-120
Table of Contents
| Initial Costs | Costs Capitalized Subsequent to Acquisition |
Gross Amount Carried at December 31, 2013 (10) (11) |
||||||||||||||||||||||||||||||||
| Property |
City |
State |
Encumbrances at December 31, 2013 |
Land | Buildings, Fixtures and Improvements |
Accumulated Depreciation (12)(13) |
Date Acquired |
Date of Construction | ||||||||||||||||||||||||||
| Jack in the Box |
St. Louis | MO | — | (1) | 420 | 1,494 | — | 1,914 | 41 | 6/27/2013 | 1998 | |||||||||||||||||||||||
| Jack in the Box |
Las Vegas | NV | — | (1) | 680 | 1,533 | — | 2,213 | 42 | 6/27/2013 | 1997 | |||||||||||||||||||||||
| Jack in the Box |
Salem | OR | — | (1) | 580 | 1,301 | — | 1,881 | 36 | 6/27/2013 | 1999 | |||||||||||||||||||||||
| Jack in the Box |
Tigard | OR | — | (1) | 620 | 1,361 | — | 1,981 | 38 | 6/27/2013 | 1999 | |||||||||||||||||||||||
| Jack in the Box |
Arlington | TX | — | (1) | 420 | 1,325 | — | 1,745 | 37 | 6/27/2013 | 1993 | |||||||||||||||||||||||
| Jack in the Box |
Arlington | TX | — | (1) | 420 | 1,365 | — | 1,785 | 38 | 6/27/2013 | 1995 | |||||||||||||||||||||||
| Jack in the Box |
Corinth | TX | — | (1) | 400 | 1,416 | — | 1,816 | 39 | 6/27/2013 | 1997 | |||||||||||||||||||||||
| Jack in the Box |
Farmers Branch | TX | — | (1) | 460 | 1,640 | — | 2,100 | 45 | 6/27/2013 | 1988 | |||||||||||||||||||||||
| Jack in the Box |
Fort Worth | TX | — | (1) | 490 | 1,702 | — | 2,192 | 47 | 6/27/2013 | 1991 | |||||||||||||||||||||||
| Jack in the Box |
Georgetown | TX | — | (1) | 600 | 1,508 | — | 2,108 | 42 | 6/27/2013 | 1999 | |||||||||||||||||||||||
| Jack in the Box |
Granbury | TX | — | (1) | 380 | 1,449 | — | 1,829 | 40 | 6/27/2013 | 1999 | |||||||||||||||||||||||
| Jack in the Box |
Grand Prairie | TX | — | (1) | 600 | 1,856 | — | 2,456 | 51 | 6/27/2013 | 1995 | |||||||||||||||||||||||
| Jack in the Box |
Grapevine | TX | — | (1) | 470 | 1,344 | — | 1,814 | 37 | 6/27/2013 | 1992 | |||||||||||||||||||||||
| Jack in the Box |
Gun Barrel City | TX | — | (1) | 300 | 961 | — | 1,261 | 27 | 6/27/2013 | 1998 | |||||||||||||||||||||||
| Jack in the Box |
Houston | TX | — | (1) | 460 | 1,437 | — | 1,897 | 40 | 6/27/2013 | 1993 | |||||||||||||||||||||||
| Jack in the Box |
Houston | TX | — | (1) | 390 | 1,172 | — | 1,562 | 32 | 6/27/2013 | 1993 | |||||||||||||||||||||||
| Jack in the Box |
Houston | TX | — | (1) | 330 | 1,845 | — | 2,175 | 51 | 6/27/2013 | 1996 | |||||||||||||||||||||||
| Jack in the Box |
Houston | TX | — | (1) | 410 | 1,621 | — | 2,031 | 45 | 6/27/2013 | 1992 | |||||||||||||||||||||||
| Jack in the Box |
Houston | TX | — | (1) | 450 | 1,396 | — | 1,846 | 39 | 6/27/2013 | 1992 | |||||||||||||||||||||||
| Jack in the Box |
Hutchins | TX | — | (1) | 330 | 1,363 | — | 1,693 | 38 | 6/27/2013 | 1998 | |||||||||||||||||||||||
| Jack in the Box |
Kingswood | TX | — | (1) | 430 | 955 | — | 1,385 | 26 | 6/27/2013 | 1992 | |||||||||||||||||||||||
| Jack in the Box |
Lufkin | TX | — | (1) | 440 | 1,544 | — | 1,984 | 43 | 6/27/2013 | 1999 | |||||||||||||||||||||||
| Jack in the Box |
Lufkin | TX | — | (1) | 450 | 1,563 | — | 2,013 | 43 | 6/27/2013 | 1998 | |||||||||||||||||||||||
| Jack in the Box |
Mesquite | TX | — | (1) | 560 | 1,652 | — | 2,212 | 46 | 6/27/2013 | 1992 | |||||||||||||||||||||||
| Jack in the Box |
Nacogdoches | TX | — | (1) | 340 | 1,320 | — | 1,660 | 37 | 6/27/2013 | 1998 | |||||||||||||||||||||||
| Jack in the Box |
Orange | TX | — | (1) | 270 | 1,661 | — | 1,931 | 46 | 6/27/2013 | 1999 | |||||||||||||||||||||||
| Jack in the Box |
Port Arthur | TX | — | (1) | 460 | 1,405 | — | 1,865 | 39 | 6/27/2013 | 1994 | |||||||||||||||||||||||
| Jack in the Box |
Rockwall | TX | — | (1) | 450 | 1,275 | — | 1,725 | 35 | 6/27/2013 | 1992 | |||||||||||||||||||||||
| Jack in the Box |
San Antonio | TX | — | (1) | 400 | 1,244 | — | 1,644 | 34 | 6/27/2013 | 1999 | |||||||||||||||||||||||
| Jack in the Box |
San Antonio | TX | — | (1) | 470 | 1,256 | — | 1,726 | 35 | 6/27/2013 | 1999 | |||||||||||||||||||||||
| Jack in the Box |
San Antonio | TX | — | (1) | 350 | 1,249 | — | 1,599 | 35 | 6/27/2013 | 1992 | |||||||||||||||||||||||
| Jack in the Box |
Spring | TX | — | (1) | 450 | 1,487 | — | 1,937 | 41 | 6/27/2013 | 1993 | |||||||||||||||||||||||
F-121
Table of Contents
| Initial Costs | Costs Capitalized Subsequent to Acquisition |
Gross Amount Carried at December 31, 2013 (10) (11) |
||||||||||||||||||||||||||||||||
| Property |
City |
State |
Encumbrances at December 31, 2013 |
Land | Buildings, Fixtures and Improvements |
Accumulated Depreciation (12)(13) |
Date Acquired |
Date of Construction | ||||||||||||||||||||||||||
| Jack in the Box |
Spring | TX | — | (1) | 570 | 1,340 | — | 1,910 | 37 | 6/27/2013 | 1999 | |||||||||||||||||||||||
| Jack in the Box |
Tyler | TX | — | (1) | 450 | 1,025 | — | 1,475 | 28 | 6/27/2013 | 1999 | |||||||||||||||||||||||
| Jack in the Box |
Weatherford | TX | — | (1) | 480 | 1,329 | — | 1,809 | 37 | 6/27/2013 | 1999 | |||||||||||||||||||||||
| Jack in the Box |
Enumclaw | WA | — | (1) | 380 | 1,238 | — | 1,618 | 34 | 6/27/2013 | 1997 | |||||||||||||||||||||||
| Joe’s Crab Shack |
Lilburn | GA | — | (1) | 800 | 1,917 | — | 2,717 | 55 | 6/27/2013 | 1999 | |||||||||||||||||||||||
| Joe’s Crab Shack |
Houston | TX | — | (1) | 900 | 1,749 | — | 2,649 | 50 | 6/27/2013 | 1994 | |||||||||||||||||||||||
| John Deere |
Davenport | IA | — | (1) | 1,161 | 22,052 | — | 23,213 | 2,130 | 5/31/2012 | 2003 | |||||||||||||||||||||||
| Johnson Controls, Inc. |
Pinellas Park | FL | 16,200 | 4,538 | 23,842 | — | 28,380 | 242 | 11/5/2013 | 2001 | ||||||||||||||||||||||||
| Kaiser Foundation |
Cupertino | CA | — | (1) | 14,236 | 42,708 | — | 56,944 | 1,848 | 2/20/2013 | 2005 | |||||||||||||||||||||||
| Ker’s WingHouse Bar and Grill |
Brandon | FL | — | (1) | 340 | 654 | — | 994 | 19 | 6/27/2013 | 1999 | |||||||||||||||||||||||
| Ker’s WingHouse Bar and Grill |
Clearwater | FL | — | (1) | 550 | 627 | — | 1,177 | 18 | 6/27/2013 | 1979 | |||||||||||||||||||||||
| Key Bank |
Spencerport | NY | — | (1) | 59 | 1,112 | — | 1,171 | 35 | 6/5/2013 | 1960 | |||||||||||||||||||||||
| Key Bank |
Berea | OH | — | 234 | 1,326 | — | 1,560 | 16 | 10/1/2013 | 1958 | ||||||||||||||||||||||||
| KFC |
Deming | NM | — | (1) | 220 | 691 | — | 911 | 19 | 6/27/2013 | 1992 | |||||||||||||||||||||||
| KFC |
Las Cruces | NM | — | (1) | 270 | 498 | — | 768 | 14 | 6/27/2013 | 1990 | |||||||||||||||||||||||
| KFC |
Appleton | WI | — | (1) | 350 | 874 | — | 1,224 | 24 | 6/27/2013 | 1988 | |||||||||||||||||||||||
| Kohl’s |
Howell | MI | — | 547 | 10,399 | — | 10,946 | 548 | 3/28/2013 | 2003 | ||||||||||||||||||||||||
| Koninklijke Ahold, N.V. |
Levittown | PA | 13,340 | 4,716 | 9,955 | — | 14,671 | 83 | 11/5/2013 | 2006 | ||||||||||||||||||||||||
| Krystal |
Greenville | AL | — | (1) | 195 | 1,147 | — | 1,342 | 32 | 6/27/2013 | 2000 | |||||||||||||||||||||||
| Krystal |
Montgomery | AL | — | (1) | 259 | 1,036 | — | 1,295 | 91 | 9/21/2012 | 1964 | |||||||||||||||||||||||
| Krystal |
Montgomery | AL | — | (1) | 560 | 829 | — | 1,389 | 23 | 6/27/2013 | 2000 | |||||||||||||||||||||||
| Krystal |
Phoenix City | AL | — | (1) | 366 | 1,465 | — | 1,831 | 129 | 9/21/2012 | 1980 | |||||||||||||||||||||||
| Krystal |
Scottsboro | AL | — | (1) | 20 | 1,157 | — | 1,177 | 32 | 6/27/2013 | 1999 | |||||||||||||||||||||||
| Krystal |
Tuscaloosa | AL | — | (1) | 206 | 1,165 | — | 1,371 | 103 | 9/21/2012 | 1976 | |||||||||||||||||||||||
| Krystal |
Jacksonville | FL | — | (1) | 574 | 574 | — | 1,148 | 51 | 9/21/2012 | 1990 | |||||||||||||||||||||||
| Krystal |
Orlando | FL | — | (1) | 372 | 372 | — | 744 | 33 | 9/21/2012 | 1994 | |||||||||||||||||||||||
F-122
Table of Contents
| Initial Costs | Costs Capitalized Subsequent to Acquisition |
Gross Amount Carried at December 31, 2013 (10) (11) |
||||||||||||||||||||||||||||||||
| Property |
City |
State |
Encumbrances at December 31, 2013 |
Land | Buildings, Fixtures and Improvements |
Accumulated Depreciation (12)(13) |
Date Acquired |
Date of Construction | ||||||||||||||||||||||||||
| Krystal |
Orlando | FL | — | (1) | 669 | 446 | — | 1,115 | 39 | 9/21/2012 | 1995 | |||||||||||||||||||||||
| Krystal |
Plant City | FL | — | (1) | 355 | 533 | — | 888 | 47 | 9/21/2012 | 2012 | |||||||||||||||||||||||
| Krystal |
St. Augustine | FL | — | (1) | 411 | 411 | — | 822 | 36 | 9/21/2012 | 2012 | |||||||||||||||||||||||
| Krystal |
Albany | GA | — | (1) | 309 | 721 | — | 1,030 | 63 | 9/21/2012 | 1962 | |||||||||||||||||||||||
| Krystal |
Atlanta | GA | — | (1) | 166 | 664 | — | 830 | 58 | 9/21/2012 | 1973 | |||||||||||||||||||||||
| Krystal |
Augusta | GA | — | (1) | 365 | 851 | — | 1,216 | 75 | 9/21/2012 | 1979 | |||||||||||||||||||||||
| Krystal |
Columbus | GA | — | (1) | 622 | 934 | — | 1,556 | 82 | 9/21/2012 | 1977 | |||||||||||||||||||||||
| Krystal |
Decatur | GA | — | (1) | 94 | 533 | — | 627 | 47 | 9/21/2012 | 1965 | |||||||||||||||||||||||
| Krystal |
East Point | GA | — | (1) | 221 | 664 | — | 885 | 55 | 10/26/2012 | 1984 | |||||||||||||||||||||||
| Krystal |
Macon | GA | — | (1) | 325 | 759 | — | 1,084 | 67 | 9/21/2012 | 1962 | |||||||||||||||||||||||
| Krystal |
Milledgeville | GA | — | (1) | 261 | 609 | — | 870 | 54 | 9/21/2012 | 2011 | |||||||||||||||||||||||
| Krystal |
Snellville | GA | — | (1) | 466 | 466 | — | 932 | 41 | 9/21/2012 | 1981 | |||||||||||||||||||||||
| Krystal |
Gulfport | MS | — | (1) | 215 | 861 | — | 1,076 | 76 | 9/21/2012 | 2011 | |||||||||||||||||||||||
| Krystal |
Jackson | MS | — | (1) | 285 | 1,140 | — | 1,425 | 100 | 9/21/2012 | 1978 | |||||||||||||||||||||||
| Krystal |
Jackson | MS | — | (1) | 198 | 1,120 | — | 1,318 | 99 | 9/21/2012 | 1983 | |||||||||||||||||||||||
| Krystal |
Pearl | MS | — | (1) | 426 | 638 | — | 1,064 | 56 | 9/21/2012 | 1976 | |||||||||||||||||||||||
| Krystal |
Chattanooga | TN | — | (1) | 336 | 784 | — | 1,120 | 69 | 9/21/2012 | 2010 | |||||||||||||||||||||||
| Krystal |
Chattanooga | TN | — | (1) | 500 | 947 | — | 1,447 | 26 | 6/27/2013 | 1994 | |||||||||||||||||||||||
| Krystal |
Knoxville | TN | — | (1) | 369 | 246 | — | 615 | 22 | 9/21/2012 | 1970 | |||||||||||||||||||||||
| Kum & Go |
Bentonville | AR | — | (1) | 587 | 1,370 | — | 1,957 | 83 | 11/20/2012 | 2009 | |||||||||||||||||||||||
| Kum & Go |
Lowell | AR | — | (1) | 774 | 1,437 | — | 2,211 | 87 | 11/20/2012 | 2009 | |||||||||||||||||||||||
| Kum & Go |
Paragould | AR | — | (1) | 708 | 2,123 | — | 2,831 | 149 | 9/28/2012 | 2012 | |||||||||||||||||||||||
| Kum & Go |
Rogers | AR | — | (1) | 668 | 1,559 | — | 2,227 | 95 | 11/20/2012 | 2008 | |||||||||||||||||||||||
| Kum & Go |
Sherwood | AR | — | (1) | 866 | 1,609 | — | 2,475 | 113 | 9/28/2012 | 2012 | |||||||||||||||||||||||
| Kum & Go |
Fountain | CO | — | (1) | 1,131 | 1,696 | — | 2,827 | 95 | 12/24/2012 | 2012 | |||||||||||||||||||||||
| Kum & Go |
Monument | CO | — | (1) | 1,192 | 1,457 | — | 2,649 | 82 | 12/24/2012 | 2012 | |||||||||||||||||||||||
| Kum & Go |
Muscatine | IA | — | (1) | 794 | 1,853 | — | 2,647 | 104 | 12/31/2012 | 2012 | |||||||||||||||||||||||
| Kum & Go |
Ottumwa | IA | — | (1) | 586 | 1,368 | — | 1,954 | 83 | 11/20/2012 | 1998 | |||||||||||||||||||||||
| Kum & Go |
Waukee | IA | — | (1) | 1,280 | 1,280 | — | 2,560 | 54 | 3/28/2013 | 2012 | |||||||||||||||||||||||
| Kum & Go |
Tioga | ND | — | (1) | 318 | 2,863 | — | 3,181 | 188 | 11/8/2012 | 2012 | |||||||||||||||||||||||
| Kum & Go |
Muskogee | OK | — | (1) | 423 | 1,691 | — | 2,114 | 40 | 7/22/2013 | 2013 | |||||||||||||||||||||||
| Kum & Go |
Cheyenne | WY | — | (1) | 411 | 2,327 | — | 2,738 | 131 | 12/27/2012 | 2012 | |||||||||||||||||||||||
F-123
Table of Contents
| Initial Costs | Costs Capitalized Subsequent to Acquisition |
Gross Amount Carried at December 31, 2013 (10) (11) |
||||||||||||||||||||||||||||||||
| Property |
City |
State |
Encumbrances at December 31, 2013 |
Land | Buildings, Fixtures and Improvements |
Accumulated Depreciation (12)(13) |
Date Acquired |
Date of Construction | ||||||||||||||||||||||||||
| Leeann Chin |
Blaine | MN | — | (1) | 480 | 528 | — | 1,008 | 15 | 6/27/2013 | 1996 | |||||||||||||||||||||||
| Leeann Chin |
Chanhassen | MN | — | (1) | 450 | 763 | — | 1,213 | 21 | 6/27/2013 | 1995 | |||||||||||||||||||||||
| Leeann Chin |
Golden Valley | MN | — | (1) | 270 | 776 | — | 1,046 | 21 | 6/27/2013 | 1996 | |||||||||||||||||||||||
| Logan’s Roadhouse |
Huntsville | AL | — | (1) | 520 | 4,797 | — | 5,317 | 138 | 6/27/2013 | 2003 | |||||||||||||||||||||||
| Logan’s Roadhouse |
Fayetteville | AR | — | (1) | 1,570 | 2,182 | — | 3,752 | 63 | 6/27/2013 | 2004 | |||||||||||||||||||||||
| Logan’s Roadhouse |
Hattiesburg | MS | — | (1) | 890 | 4,012 | — | 4,902 | 115 | 6/27/2013 | 2006 | |||||||||||||||||||||||
| Logan’s Roadhouse |
Clarksville | TN | — | (1) | 1,010 | 4,424 | — | 5,434 | 127 | 6/27/2013 | 1994 | |||||||||||||||||||||||
| Logan’s Roadhouse |
Cleveland | TN | — | (1) | 890 | 3,902 | — | 4,792 | 112 | 6/27/2013 | 2003 | |||||||||||||||||||||||
| Logan’s Roadhouse |
El Paso | TX | — | (1) | 320 | 4,731 | — | 5,051 | 136 | 6/27/2013 | 1999 | |||||||||||||||||||||||
| Long John Silver’s |
Alamogordo | NM | — | (1) | 160 | 574 | — | 734 | 16 | 6/27/2013 | 1977 | |||||||||||||||||||||||
| LongHorn Steakhouse |
Tampa | FL | — | (1) | 370 | 1,852 | — | 2,222 | 53 | 6/27/2013 | 1999 | |||||||||||||||||||||||
| Lowe’s |
New Orleans | LA | 15,643 | 10,317 | 20,728 | — | 31,045 | 172 | 11/5/2013 | 2005 | ||||||||||||||||||||||||
| Mattress Firm |
Boise | ID | — | (1) | 335 | 1,339 | — | 1,674 | 63 | 2/22/2013 | 2013 | |||||||||||||||||||||||
| Mattress Firm |
Columbus | IN | — | (1) | 157 | 891 | — | 1,048 | 58 | 11/6/2012 | 2012 | |||||||||||||||||||||||
| Mattress Firm |
Raleigh | NC | — | (1) | 1,091 | 1,091 | — | 2,182 | 77 | 9/28/2012 | 2012 | |||||||||||||||||||||||
| Mattress Firm |
Wilson | NC | — | (1) | 373 | 692 | — | 1,065 | 49 | 9/28/2012 | 2012 | |||||||||||||||||||||||
| Mattress Firm |
Florence | SC | — | (1) | 398 | 929 | — | 1,327 | 57 | 12/7/2012 | 2012 | |||||||||||||||||||||||
| Mattress Firm |
Rock Hill | SC | — | (1) | 385 | 898 | — | 1,283 | 17 | 8/21/2013 | 2008 | |||||||||||||||||||||||
| Mattress Firm |
Nederland | TX | — | (1) | 311 | 1,245 | — | 1,556 | 87 | 9/26/2012 | 2012 | |||||||||||||||||||||||
| McAlister’s |
Murfreesboro | TN | — | (1) | 310 | 720 | — | 1,030 | 21 | 6/27/2013 | 1985 | |||||||||||||||||||||||
| MetroPCS Wireless |
Richardson | TX | — | 1,292 | 19,606 | — | 20,898 | 168 | 11/5/2013 | 1987 | ||||||||||||||||||||||||
| Michelin North America |
Louisville | KY | — | (2) | 1,120 | 7,763 | — | 8,883 | 79 | 11/5/2013 | 2011 | |||||||||||||||||||||||
| Monro Muffler |
Waukesha | WI | — | (1) | 228 | 684 | — | 912 | 17 | 7/23/2013 | 2002 | |||||||||||||||||||||||
| Morgan’s Food’s |
Pittsburgh | PA | — | 180 | 269 | — | 449 | 4 | 10/1/2013 | 1985 | ||||||||||||||||||||||||
| Morgan’s Food’s |
Benwood | WV | — | 123 | 287 | — | 410 | 4 | 10/1/2013 | 2006 | ||||||||||||||||||||||||
| Mo’s Irish Pub Restaurant |
Wauwatosa | WI | — | (1) | 550 | 818 | — | 1,368 | 23 | 6/27/2013 | 1977 | |||||||||||||||||||||||
| Mrs Baird’s |
Dallas | TX | — | (1) | 453 | 4,077 | — | 4,530 | 373 | 7/11/2012 | 2002 | |||||||||||||||||||||||
| Multi tenant (1000 Milwaukee Avenue) |
Glenview | IL | 55,523 | 14,016 | 73,313 | — | 87,329 | 665 | 11/5/2013 | 2001 | ||||||||||||||||||||||||
| Multi tenant (15721 Park Row Boulevard) |
Houston | TX | 19,525 | 2,356 | 36,347 | — | 38,703 | 295 | 11/5/2013 | 2009 | ||||||||||||||||||||||||
| Multi tenant (1585 Sawdust Road) |
The Woodlands | TX | 22,440 | 4,724 | 40,332 | — | 45,056 | 321 | 11/5/2013 | 2009 | ||||||||||||||||||||||||
F-124
Table of Contents
| Initial Costs | Costs Capitalized Subsequent to Acquisition |
Gross Amount Carried at December 31, 2013 (10) (11) |
||||||||||||||||||||||||||||||||
| Property |
City |
State |
Encumbrances at December 31, 2013 |
Land | Buildings, Fixtures and Improvements |
Accumulated Depreciation (12)(13) |
Date Acquired |
Date of Construction | ||||||||||||||||||||||||||
| Multi tenant (2211 Old Earhart Road) |
AnnArbor | MI | 29,356 | 3,520 | 39,594 | — | 43,114 | 314 | 11/5/2013 | 2013 | ||||||||||||||||||||||||
| Multi tenant (26501 Aliso Creek Road) |
Aliso Viejo | CA | 40,024 | 18,726 | 31,970 | — | 50,696 | 266 | 11/5/2013 | 2005 | ||||||||||||||||||||||||
| Multi tenant (5859 Farinon Drive) |
San Antonio | TX | 10,000 | 1,666 | 19,092 | — | 20,758 | 155 | 11/5/2013 | 2008 | ||||||||||||||||||||||||
| Multi tenant (Columbia Pike) |
Silver Spring | MD | — | 2,190 | 26,635 | 1,023 | 29,848 | 203 | 11/5/2013 | 1986 | ||||||||||||||||||||||||
| Multi tenant (Dodge Building) |
Omaha | NE | — | (2) | — | 7,358 | — | 7,358 | 112 | 11/5/2013 | 2011 | |||||||||||||||||||||||
| Multi tenant (Landmark Building) |
Omaha | NE | — | (2) | — | 10,156 | 4 | 10,160 | 253 | 11/5/2013 | 1991 | |||||||||||||||||||||||
| My Dentist |
Chickasha | OK | — | (1) | 100 | 186 | — | 286 | 6 | 6/27/2013 | 2001 | |||||||||||||||||||||||
| National Tire & Battery |
Morrow | GA | — | (1) | 397 | 1,586 | — | 1,983 | 146 | 6/5/2012 | 1992 | |||||||||||||||||||||||
| National Tire & Battery |
St. Louis | MO | — | (1) | 756 | 924 | — | 1,680 | 63 | 10/31/2012 | 1998 | |||||||||||||||||||||||
| Nestle Holdings |
Breinigsville | PA | 46,494 | — | 66,948 | — | 66,948 | 681 | 11/5/2013 | 1994 | ||||||||||||||||||||||||
| O’Reilly Auto Parts |
Oneonta | AL | — | (1) | 81 | 460 | — | 541 | 37 | 8/2/2012 | 2000 | |||||||||||||||||||||||
| O’Reilly Auto Parts |
Laramie | WY | — | (1) | 144 | 1,297 | — | 1,441 | 91 | 10/12/2012 | 1999 | |||||||||||||||||||||||
| Pearson |
Lawrence | KS | 15,177 | 2,548 | 18,057 | — | 20,605 | 156 | 11/5/2013 | 1997 | ||||||||||||||||||||||||
| Pilot Flying J |
Carnesville | GA | — | (1) | 1,867 | 7,466 | — | 9,333 | 494 | 1/31/2013 | 2000 | |||||||||||||||||||||||
| Pizza Hut |
Cooper City | FL | — | (1) | 320 | 466 | — | 786 | 13 | 6/27/2013 | 1998 | |||||||||||||||||||||||
| Pizza Hut |
Marathon | FL | — | (1) | 530 | 187 | — | 717 | 5 | 6/27/2013 | 1980 | |||||||||||||||||||||||
| Pizza Hut |
Bozeman | MT | — | (1) | 150 | 343 | — | 493 | 10 | 6/27/2013 | 1976 | |||||||||||||||||||||||
| Pizza Hut |
Glasgow | MT | — | (1) | 120 | 217 | — | 337 | 6 | 6/27/2013 | 1985 | |||||||||||||||||||||||
| Pizza Hut |
Laurel | MT | — | (1) | 170 | 621 | — | 791 | 18 | 6/27/2013 | 1985 | |||||||||||||||||||||||
| Pizza Hut |
Livingston | MT | — | (1) | 130 | 245 | — | 375 | 7 | 6/27/2013 | 1979 | |||||||||||||||||||||||
| Pizza Hut |
Knoxville | TN | — | (1) | 300 | 546 | — | 846 | 16 | 6/27/2013 | 1992 | |||||||||||||||||||||||
| Pollo Tropical |
Davie | FL | — | (1) | 280 | 1,490 | — | 1,770 | 41 | 6/27/2013 | 1993 | |||||||||||||||||||||||
| Pollo Tropical |
Fort Lauderdale | FL | — | (1) | 190 | 1,242 | — | 1,432 | 34 | 6/27/2013 | 1996 | |||||||||||||||||||||||
| Pollo Tropical |
Lake Worth | FL | — | (1) | 280 | 1,182 | — | 1,462 | 33 | 6/27/2013 | 1994 | |||||||||||||||||||||||
| Popeyes |
Starke | FL | — | (1) | 380 | — | — | 380 | — | 6/27/2013 | 1997 | |||||||||||||||||||||||
| Popeyes |
Thomasville | GA | — | (1) | 110 | 705 | — | 815 | 20 | 6/27/2013 | 1998 | |||||||||||||||||||||||
| Popeyes |
Valdosta | GA | — | (1) | 240 | 599 | — | 839 | 17 | 6/27/2013 | 1998 | |||||||||||||||||||||||
| Popeyes |
New Orleans | LA | — | (1) | 60 | 390 | — | 450 | 11 | 6/27/2013 | 1975 | |||||||||||||||||||||||
F-125
Table of Contents
| Initial Costs | Costs Capitalized Subsequent to Acquisition |
Gross Amount Carried at December 31, 2013 (10) (11) |
||||||||||||||||||||||||||||||||
| Property |
City |
State |
Encumbrances at December 31, 2013 |
Land | Buildings, Fixtures and Improvements |
Accumulated Depreciation (12)(13) |
Date Acquired |
Date of Construction | ||||||||||||||||||||||||||
| Popeyes |
Channelview | TX | — | (1) | 220 | 401 | — | 621 | 11 | 6/27/2013 | 1980 | |||||||||||||||||||||||
| Popeyes |
Houston | TX | — | (1) | 300 | 244 | — | 544 | 7 | 6/27/2013 | 1978 | |||||||||||||||||||||||
| Popeyes |
Houston | TX | — | (1) | 190 | 452 | — | 642 | 13 | 6/27/2013 | 1978 | |||||||||||||||||||||||
| PriceRite |
Rochester | NY | — | 569 | 3,222 | — | 3,791 | 285 | 9/27/2012 | 2007 | ||||||||||||||||||||||||
| Pulte Mortgage LLC |
Englewood | CO | — | 2,563 | 22,026 | — | 24,589 | 185 | 11/5/2013 | 2009 | ||||||||||||||||||||||||
| Qdoba |
Flint | MI | — | (1) | 110 | 990 | — | 1,100 | 52 | 3/29/2013 | 2006 | |||||||||||||||||||||||
| Qdoba |
Grand Blanc | MI | — | (1) | 165 | 935 | — | 1,100 | 49 | 3/29/2013 | 2006 | |||||||||||||||||||||||
| Rally’s |
Indianapolis | IN | — | (1) | 210 | 1,514 | — | 1,724 | 42 | 6/27/2013 | 1990 | |||||||||||||||||||||||
| Rally’s |
Kokomo | IN | — | (1) | 290 | 548 | — | 838 | 15 | 6/27/2013 | 1989 | |||||||||||||||||||||||
| Rally’s |
Muncie | IN | — | (1) | 310 | 1,196 | — | 1,506 | 33 | 6/27/2013 | 1989 | |||||||||||||||||||||||
| Rally’s |
Harvey | LA | — | (1) | 420 | 870 | — | 1,290 | 24 | 6/27/2013 | 2004 | |||||||||||||||||||||||
| Rally’s |
New Orleans | LA | — | (1) | 450 | 1,691 | — | 2,141 | 47 | 6/27/2013 | 1990 | |||||||||||||||||||||||
| Rally’s |
New Orleans | LA | — | (1) | 220 | 1,018 | — | 1,238 | 28 | 6/27/2013 | 2004 | |||||||||||||||||||||||
| Rally’s |
Hamtramck | MI | — | (1) | 230 | 1,020 | — | 1,250 | 28 | 6/27/2013 | 1993 | |||||||||||||||||||||||
| Razzoos |
Lewisville | TX | — | (1) | 780 | 1,503 | — | 2,283 | 43 | 6/27/2013 | 1997 | |||||||||||||||||||||||
| Reckitt Benckiser |
Chester | NJ | 5,500 | 886 | 7,972 | — | 8,858 | 513 | 8/16/2012 | 2006 | ||||||||||||||||||||||||
| Rite Aid |
Jeffersonville | IN | — | (1) | 824 | 2,472 | — | 3,296 | 161 | 11/30/2012 | 2008 | |||||||||||||||||||||||
| Rite Aid |
Lawrenceburg | KY | — | (1) | 567 | 2,267 | — | 2,834 | 147 | 11/30/2012 | 2008 | |||||||||||||||||||||||
| Rite Aid |
Lexington | KY | — | (1) | — | 1,943 | — | 1,943 | 126 | 11/30/2012 | 2007 | |||||||||||||||||||||||
| Rite Aid |
Paris | KY | — | (1) | 743 | 2,228 | — | 2,971 | 145 | 11/30/2012 | 2008 | |||||||||||||||||||||||
| Rite Aid |
Scottsville | KY | — | (1) | 153 | 2,904 | — | 3,057 | 189 | 11/30/2012 | 2007 | |||||||||||||||||||||||
| Rite Aid |
Stanford | KY | — | (1) | 152 | 2,886 | — | 3,038 | 188 | 11/30/2012 | 2009 | |||||||||||||||||||||||
| Rite Aid |
Lima | OH | — | (1) | 576 | 2,304 | — | 2,880 | 161 | 11/13/2012 | 2006 | |||||||||||||||||||||||
| Rite Aid |
Louisville | OH | — | (1) | 576 | 3,266 | — | 3,842 | 229 | 10/31/2012 | 2008 | |||||||||||||||||||||||
| Rite Aid |
Marion | OH | — | (1) | 508 | 2,877 | — | 3,385 | 201 | 11/13/2012 | 2006 | |||||||||||||||||||||||
| Rite Aid |
Huntington | WV | — | (1) | 964 | 2,250 | — | 3,214 | 146 | 11/30/2012 | 2008 | |||||||||||||||||||||||
| Rubbermaid |
Winfield | KS | 12,725 | 1,056 | 20,060 | — | 21,116 | 2,039 | 4/25/2012 | 2008 | ||||||||||||||||||||||||
| Rubbermaid |
Winfield | KS | — | (1) | 819 | 15,555 | — | 16,374 | 1,028 | 11/28/2012 | 2012 | |||||||||||||||||||||||
| Ruby Tuesday |
Colorado Springs | CO | — | (1) | 480 | 809 | — | 1,289 | 23 | 6/27/2013 | 1999 | |||||||||||||||||||||||
| Ruby Tuesday |
Dillon | CO | — | (1) | 400 | 1,628 | — | 2,028 | 47 | 6/27/2013 | 1999 | |||||||||||||||||||||||
| Ruby Tuesday |
Bartow | FL | — | (1) | 270 | 1,916 | — | 2,186 | 55 | 6/27/2013 | 1999 | |||||||||||||||||||||||
| Ruby Tuesday |
London | KY | — | (1) | 370 | 1,493 | — | 1,863 | 43 | 6/27/2013 | 1997 | |||||||||||||||||||||||
F-126
Table of Contents
| Initial Costs | Costs Capitalized Subsequent to Acquisition |
Gross Amount Carried at December 31, 2013 (10) (11) |
||||||||||||||||||||||||||||||||
| Property |
City |
State |
Encumbrances at December 31, 2013 |
Land | Buildings, Fixtures and Improvements |
Accumulated Depreciation (12)(13) |
Date Acquired |
Date of Construction | ||||||||||||||||||||||||||
| Ruby Tuesday |
Somerset | KY | — | (1) | 480 | 1,120 | — | 1,600 | 32 | 6/27/2013 | 1998 | |||||||||||||||||||||||
| Sakura Tepanyaki Steakhouse |
Orem | UT | — | (1) | 340 | 658 | — | 998 | 19 | 6/27/2013 | 1999 | |||||||||||||||||||||||
| Sam’s Southern Eatery |
Kennesaw | GA | — | (1) | 210 | 46 | — | 256 | 1 | 6/27/2013 | 1976 | |||||||||||||||||||||||
| Scotts Company |
Orrville | OH | — | (1) | 611 | 1,134 | — | 1,745 | 98 | 7/30/2012 | 2008 | |||||||||||||||||||||||
| Scotts Company |
Orrville | OH | — | (1) | 609 | 11,576 | — | 12,185 | 1,000 | 7/30/2012 | 2008 | |||||||||||||||||||||||
| Scotts Company |
Orrville | OH | — | (1) | 278 | 2,502 | — | 2,780 | 191 | 9/28/2012 | 2008 | |||||||||||||||||||||||
| Shaw’s Supermarkets |
Plymouth | MA | — | (1) | 1,440 | 3,361 | — | 4,801 | 394 | 4/18/2012 | 2000 | |||||||||||||||||||||||
| Shoney’s |
Athens | AL | — | 560 | 110 | — | 670 | 3 | 6/27/2013 | 1982 | ||||||||||||||||||||||||
| Shoney’s |
Florence | AL | — | 100 | 484 | — | 584 | 14 | 6/27/2013 | 1966 | ||||||||||||||||||||||||
| Shoney’s |
Gadsden | AL | — | (1) | 220 | 707 | — | 927 | 20 | 6/27/2013 | 1982 | |||||||||||||||||||||||
| Shoney’s |
Oxford | AL | — | (1) | 670 | 25 | — | 695 | 1 | 6/27/2013 | 1977 | |||||||||||||||||||||||
| Shoney’s |
Valdosta | GA | — | 420 | 440 | — | 860 | 13 | 6/27/2013 | 2000 | ||||||||||||||||||||||||
| Shoney’s |
Elizabethtown | KY | — | (1) | 450 | 465 | — | 915 | 13 | 6/27/2013 | 1986 | |||||||||||||||||||||||
| Shoney’s |
Grayson | KY | — | (1) | 420 | 406 | — | 826 | 12 | 6/27/2013 | 1994 | |||||||||||||||||||||||
| Shoney’s |
Owensboro | KY | — | 390 | 129 | — | 519 | 4 | 6/27/2013 | 1988 | ||||||||||||||||||||||||
| Shoney’s |
Lafayette | LA | — | 530 | 138 | — | 668 | 4 | 6/27/2013 | 1989 | ||||||||||||||||||||||||
| Shoney’s |
Osage Beach | MO | — | 453 | 113 | — | 566 | 3 | 6/27/2013 | 1992 | ||||||||||||||||||||||||
| Shoney’s |
Hattiesburg | MS | — | (1) | 730 | 618 | — | 1,348 | 18 | 6/27/2013 | 1989 | |||||||||||||||||||||||
| Shoney’s |
Jackson | MS | — | (1) | 360 | 572 | — | 932 | 16 | 6/27/2013 | 1989 | |||||||||||||||||||||||
| Shoney’s |
Summerville | SC | — | (1) | 350 | 800 | — | 1,150 | 23 | 6/27/2013 | 1995 | |||||||||||||||||||||||
| Shoney’s |
Cookeville | TN | — | (1) | 510 | 760 | — | 1,270 | 22 | 6/27/2013 | 1995 | |||||||||||||||||||||||
| Shoney’s |
Lawrenceburg | TN | — | (1) | 330 | 873 | — | 1,203 | 25 | 6/27/2013 | 1983 | |||||||||||||||||||||||
| Shoney’s |
Charleston | WV | — | (1) | 190 | 543 | — | 733 | 16 | 6/27/2013 | 1981 | |||||||||||||||||||||||
| Shoney’s |
Lewisburg | WV | — | (1) | 110 | 642 | — | 752 | 18 | 6/27/2013 | 1981 | |||||||||||||||||||||||
| Shoney’s |
Princeton | WV | — | (1) | 90 | 593 | — | 683 | 17 | 6/27/2013 | 1975 | |||||||||||||||||||||||
| Shoney’s |
Ripley | WV | — | (1) | 200 | 599 | — | 799 | 17 | 6/27/2013 | 1981 | |||||||||||||||||||||||
| Smokey Bones BBQ |
Morrow | GA | — | 390 | 2,184 | — | 2,574 | 63 | 6/27/2013 | 1999 | ||||||||||||||||||||||||
| Sonny’s Real Pit Bar-B-Q |
Athens | GA | — | (1) | 460 | 1,280 | — | 1,740 | 37 | 6/27/2013 | 1981 | |||||||||||||||||||||||
| Sonny’s Real Pit Bar-B-Q |
Conyers | GA | — | (1) | 450 | 663 | — | 1,113 | 19 | 6/27/2013 | 1994 | |||||||||||||||||||||||
| Sonny’s Real Pit Bar-B-Q |
Marietta | GA | — | (1) | 290 | 1,772 | — | 2,062 | 51 | 6/27/2013 | 1988 | |||||||||||||||||||||||
| Spaghetti Warehouse |
Marietta | GA | — | (1) | 800 | 276 | — | 1,076 | 8 | 6/27/2013 | 1986 | |||||||||||||||||||||||
| Spaghetti Warehouse |
Aurora | IL | — | (1) | 480 | 805 | — | 1,285 | 23 | 6/27/2013 | 1993 | |||||||||||||||||||||||
F-127
Table of Contents
| Initial Costs | Costs Capitalized Subsequent to Acquisition |
Gross Amount Carried at December 31, 2013 (10) (11) |
||||||||||||||||||||||||||||||||
| Property |
City |
State |
Encumbrances at December 31, 2013 |
Land | Buildings, Fixtures and Improvements |
Accumulated Depreciation (12)(13) |
Date Acquired |
Date of Construction | ||||||||||||||||||||||||||
| Spaghetti Warehouse |
Elk Grove Village | IL | — | (1) | 550 | 299 | — | 849 | 9 | 6/27/2013 | 1995 | |||||||||||||||||||||||
| Spaghetti Warehouse |
Oklahoma City | OK | — | (1) | 570 | 1,193 | — | 1,763 | 34 | 6/27/2013 | 1905 | |||||||||||||||||||||||
| Spaghetti Warehouse |
Tulsa | OK | — | (1) | 530 | 1,174 | — | 1,704 | 34 | 6/27/2013 | 1917 | |||||||||||||||||||||||
| Spaghetti Warehouse |
Memphis | TN | — | (1) | 100 | 283 | — | 383 | 8 | 6/27/2013 | 1905 | |||||||||||||||||||||||
| Spaghetti Warehouse |
Arlington | TX | — | (1) | 630 | 1,400 | — | 2,030 | 40 | 6/27/2013 | 1994 | |||||||||||||||||||||||
| Spaghetti Warehouse |
Dallas | TX | — | (1) | 810 | 1,656 | — | 2,466 | 47 | 6/27/2013 | 1990 | |||||||||||||||||||||||
| Spaghetti Warehouse |
Houston | TX | — | (1) | 980 | 2,284 | — | 3,264 | 65 | 6/27/2013 | 1906 | |||||||||||||||||||||||
| Spaghetti Warehouse |
Plano | TX | — | (1) | 540 | 1,060 | — | 1,600 | 30 | 6/27/2013 | 1993 | |||||||||||||||||||||||
| Spaghetti Warehouse |
San Antonio | TX | — | (1) | 1,140 | 1,434 | — | 2,574 | 41 | 6/27/2013 | 1907 | |||||||||||||||||||||||
| Subway |
Knoxville | TN | — | (1) | 160 | 349 | — | 509 | 10 | 6/27/2013 | 1990 | |||||||||||||||||||||||
| Sweet Tomatoes |
Coral Springs | FL | — | (1) | 790 | 1,625 | — | 2,415 | 47 | 6/27/2013 | 1997 | |||||||||||||||||||||||
| Synovus Bank |
Tampa | FL | — | (1) | 985 | 2,298 | — | 3,283 | 123 | 12/31/2012 | 1959 | |||||||||||||||||||||||
| T.G.I. Friday’s |
Homestead | PA | — | (1) | 970 | 3,455 | — | 4,425 | 99 | 6/27/2013 | 2000 | |||||||||||||||||||||||
| Taco Bell |
Daphne | AL | — | (1) | 180 | 1,278 | — | 1,458 | 35 | 6/27/2013 | 1984 | |||||||||||||||||||||||
| Taco Bell |
Foley | AL | — | (1) | 360 | 1,460 | — | 1,820 | 40 | 6/27/2013 | 1992 | |||||||||||||||||||||||
| Taco Bell |
Mobile | AL | — | (1) | 160 | 1,973 | — | 2,133 | 55 | 6/27/2013 | 1994 | |||||||||||||||||||||||
| Taco Bell |
SaraLand | AL | — | (1) | 150 | 1,063 | — | 1,213 | 29 | 6/27/2013 | 1991 | |||||||||||||||||||||||
| Taco Bell |
Jacksonville | FL | — | (1) | 440 | 1,167 | — | 1,607 | 32 | 6/27/2013 | 1985 | |||||||||||||||||||||||
| Taco Bell |
Jacksonville | FL | — | (1) | 340 | 1,383 | — | 1,723 | 38 | 6/27/2013 | 1991 | |||||||||||||||||||||||
| Taco Bell |
Pensacola | FL | — | (1) | 140 | 1,897 | — | 2,037 | 53 | 6/27/2013 | 1986 | |||||||||||||||||||||||
| Taco Bell |
Augusta | GA | — | (1) | 220 | 1,292 | — | 1,512 | 36 | 6/27/2013 | 1979 | |||||||||||||||||||||||
| Taco Bell |
Hephzibah | GA | — | (1) | 330 | 930 | — | 1,260 | 26 | 6/27/2013 | 1998 | |||||||||||||||||||||||
| Taco Bell |
Jesup | GA | — | (1) | 230 | 715 | — | 945 | 20 | 6/27/2013 | 1998 | |||||||||||||||||||||||
| Taco Bell |
Waycross | GA | — | (1) | 170 | 1,115 | — | 1,285 | 31 | 6/27/2013 | 1994 | |||||||||||||||||||||||
| Taco Bell |
St. Louis | MO | — | (1) | 190 | 1,951 | — | 2,141 | 44 | 6/27/2013 | 1991 | |||||||||||||||||||||||
| Taco Bell |
Wentzville | MO | — | (1) | 410 | 1,168 | — | 1,578 | 32 | 6/27/2013 | 2000 | |||||||||||||||||||||||
F-128
Table of Contents
| Initial Costs | Costs Capitalized Subsequent to Acquisition |
Gross Amount Carried at December 31, 2013 (10) (11) |
||||||||||||||||||||||||||||||||
| Property |
City |
State |
Encumbrances at December 31, 2013 |
Land | Buildings, Fixtures and Improvements |
Accumulated Depreciation (12)(13) |
Date Acquired |
Date of Construction | ||||||||||||||||||||||||||
| Taco Bell |
Brunswick | OH | — | (1) | 400 | 1,267 | — | 1,667 | 35 | 6/27/2013 | 1992 | |||||||||||||||||||||||
| Taco Bell |
North Olmstead | OH | — | (1) | 390 | 904 | — | 1,294 | 25 | 6/27/2013 | 1979 | |||||||||||||||||||||||
| Taco Bell |
Kingston | TN | — | (1) | 280 | 714 | — | 994 | 20 | 6/27/2013 | 1997 | |||||||||||||||||||||||
| Taco Bell |
Dallas | TX | — | (1) | 400 | 1,225 | — | 1,625 | 34 | 6/27/2013 | 1997 | |||||||||||||||||||||||
| Taco Bell |
Colonial Heights | VA | — | (1) | 450 | 1,144 | — | 1,594 | 32 | 6/27/2013 | 1994 | |||||||||||||||||||||||
| Taco Bell |
Hayes | VA | — | (1) | 350 | — | — | 350 | — | 6/27/2013 | 1994 | |||||||||||||||||||||||
| Taco Bell |
Portsmouth | VA | — | 350 | — | — | 350 | — | 6/27/2013 | 1997 | ||||||||||||||||||||||||
| Taco Bell |
Richmond | VA | — | (1) | 500 | 1,061 | — | 1,561 | 29 | 6/27/2013 | 1994 | |||||||||||||||||||||||
| Taco Bell |
Richmond | VA | — | (1) | 510 | 1,321 | — | 1,831 | 37 | 6/27/2013 | 1994 | |||||||||||||||||||||||
| Taco Bell/Long John Silvers |
Ashtabula | OH | — | (1) | 440 | 1,640 | — | 2,080 | 45 | 6/27/2013 | 2004 | |||||||||||||||||||||||
| Taco Bell/Pizza Hut |
Dallas | TX | — | (1) | 420 | 1,582 | — | 2,002 | 44 | 6/27/2013 | 2000 | |||||||||||||||||||||||
| Taco Cabana |
Austin | TX | — | (1) | 700 | 2,105 | — | 2,805 | 58 | 6/27/2013 | 1980 | |||||||||||||||||||||||
| Taco Cabana |
Pasadena | TX | — | (1) | 420 | 1,420 | — | 1,840 | 39 | 6/27/2013 | 1994 | |||||||||||||||||||||||
| Taco Cabana |
San Antonio | TX | — | (1) | 600 | 1,955 | — | 2,555 | 54 | 6/27/2013 | 1994 | |||||||||||||||||||||||
| Taco Cabana |
San Antonio | TX | — | (1) | 500 | 1,740 | — | 2,240 | 48 | 6/27/2013 | 1985 | |||||||||||||||||||||||
| Taco Cabana |
San Antonio | TX | — | (1) | 280 | 1,695 | — | 1,975 | 47 | 6/27/2013 | 1986 | |||||||||||||||||||||||
| Taco Cabana |
San Antonio | TX | — | (1) | 500 | 1,766 | — | 2,266 | 49 | 6/27/2013 | 1984 | |||||||||||||||||||||||
| Taco Cabana |
Schertz | TX | — | (1) | 520 | 1,408 | — | 1,928 | 39 | 6/27/2013 | 1998 | |||||||||||||||||||||||
| Talbots HQ |
Hingham | MA | — | 3,009 | 27,080 | — | 30,089 | 762 | 5/24/2013 | 1980 | ||||||||||||||||||||||||
| TCF National Bank |
Crystal | MN | — | (1) | 640 | 642 | — | 1,282 | 17 | 6/27/2013 | 1981 | |||||||||||||||||||||||
| TD Bank |
Falmouth | ME | — | 4,057 | 23,489 | — | 27,546 | 864 | 3/18/2013 | 2002 | ||||||||||||||||||||||||
| Teva Pharmaceuticals Industries Limited |
Malvern | PA | — | (2) | 2,666 | 40,981 | — | 43,647 | 326 | 11/5/2013 | 2013 | |||||||||||||||||||||||
| Texas Roadhouse |
Cedar Rapids | IA | — | (1) | 430 | 2,194 | — | 2,624 | 63 | 6/27/2013 | 2000 | |||||||||||||||||||||||
| Texas Roadhouse |
Ammon | ID | — | (1) | 490 | 1,206 | — | 1,696 | 35 | 6/27/2013 | 1999 | |||||||||||||||||||||||
| Texas Roadhouse |
Shively | KY | — | (1) | 540 | 2,055 | — | 2,595 | 59 | 6/27/2013 | 1998 | |||||||||||||||||||||||
| Texas Roadhouse |
Concord | NC | — | (1) | 650 | 2,130 | — | 2,780 | 61 | 6/27/2013 | 2000 | |||||||||||||||||||||||
| Texas Roadhouse |
Gastonia | NC | — | (1) | 570 | 1,544 | — | 2,114 | 44 | 6/27/2013 | 1999 | |||||||||||||||||||||||
| Texas Roadhouse |
Hickory | NC | — | (1) | 580 | 1,831 | — | 2,411 | 53 | 6/27/2013 | 1999 | |||||||||||||||||||||||
| Texas Roadhouse |
Dickson City | PA | — | (1) | 640 | 1,897 | — | 2,537 | 54 | 6/27/2013 | 2000 | |||||||||||||||||||||||
| Texas Roadhouse |
College Station | TX | — | (1) | 670 | 2,299 | — | 2,969 | 66 | 6/27/2013 | 2000 | |||||||||||||||||||||||
| Texas Roadhouse |
Grand Prairie | TX | — | (1) | 780 | 1,867 | — | 2,647 | 54 | 6/27/2013 | 1997 | |||||||||||||||||||||||
F-129
Table of Contents
| Initial Costs | Costs Capitalized Subsequent to Acquisition |
Gross Amount Carried at December 31, 2013 (10) (11) |
||||||||||||||||||||||||||||||||
| Property |
City |
State |
Encumbrances at December 31, 2013 |
Land | Buildings, Fixtures and Improvements |
Accumulated Depreciation (12)(13) |
Date Acquired |
Date of Construction | ||||||||||||||||||||||||||
| The Kroger Co. |
Calhoun | GA | — | (2) | — | 6,279 | — | 6,279 | 52 | 11/5/2013 | 1996 | |||||||||||||||||||||||
| The Kroger Co. |
Lithonia | GA | — | (2) | — | 6,250 | — | 6,250 | 52 | 11/5/2013 | 1996 | |||||||||||||||||||||||
| The Kroger Co. |
Suwanee | GA | — | (2) | — | 7,574 | — | 7,574 | 63 | 11/5/2013 | 1996 | |||||||||||||||||||||||
| The Kroger Co. |
Suwanee | GA | — | (2) | — | 7,691 | — | 7,691 | 64 | 11/5/2013 | 1996 | |||||||||||||||||||||||
| The Kroger Co. |
Frankfort | KY | — | (2) | — | 5,794 | — | 5,794 | 48 | 11/5/2013 | 1996 | |||||||||||||||||||||||
| The Kroger Co. |
Georgetown | KY | — | (2) | — | 6,742 | — | 6,742 | 56 | 11/5/2013 | 1996 | |||||||||||||||||||||||
| The Kroger Co. |
Madisonville | KY | — | (2) | — | 5,715 | — | 5,715 | 48 | 11/5/2013 | 1996 | |||||||||||||||||||||||
| The Kroger Co. |
Murray | KY | — | (2) | — | 6,165 | — | 6,165 | 51 | 11/5/2013 | 1996 | |||||||||||||||||||||||
| The Kroger Co. |
Owensboro | KY | — | (2) | — | 6,073 | — | 6,073 | 51 | 11/5/2013 | 1996 | |||||||||||||||||||||||
| The Kroger Co. |
Franklin | TN | — | (2) | — | 7,782 | — | 7,782 | 65 | 11/5/2013 | 1996 | |||||||||||||||||||||||
| The Kroger Co. |
Knoxville | TN | — | (2) | — | 7,642 | — | 7,642 | 64 | 11/5/2013 | 1996 | |||||||||||||||||||||||
| The Pantry, Inc. |
Montgomery | AL | — | (1) | 526 | 1,228 | — | 1,754 | 69 | 12/31/2012 | 1998 | |||||||||||||||||||||||
| The Pantry, Inc. |
Charlotte | NC | — | (1) | 1,332 | 1,332 | — | 2,664 | 75 | 12/31/2012 | 2004 | |||||||||||||||||||||||
| The Pantry, Inc. |
Charlotte | NC | — | (1) | 1,667 | 417 | — | 2,084 | 23 | 12/31/2012 | 1982 | |||||||||||||||||||||||
| The Pantry, Inc. |
Charlotte | NC | — | (1) | 1,191 | 1,787 | — | 2,978 | 100 | 12/31/2012 | 1987 | |||||||||||||||||||||||
| The Pantry, Inc. |
Charlotte | NC | — | (1) | 1,070 | 1,308 | — | 2,378 | 73 | 12/31/2012 | 1997 | |||||||||||||||||||||||
| The Pantry, Inc. |
Conover | NC | — | (1) | 1,144 | 936 | — | 2,080 | 53 | 12/31/2012 | 1998 | |||||||||||||||||||||||
| The Pantry, Inc. |
Cornelius | NC | — | (1) | 1,847 | 2,258 | — | 4,105 | 127 | 12/31/2012 | 1999 | |||||||||||||||||||||||
| The Pantry, Inc. |
Lincolnton | NC | — | (1) | 1,766 | 2,159 | — | 3,925 | 121 | 12/31/2012 | 2000 | |||||||||||||||||||||||
| The Pantry, Inc. |
Matthews | NC | — | (1) | 980 | 1,819 | — | 2,799 | 102 | 12/31/2012 | 1987 | |||||||||||||||||||||||
| The Pantry, Inc. |
Thomasville | NC | — | (1) | 1,175 | 1,436 | — | 2,611 | 81 | 12/31/2012 | 2000 | |||||||||||||||||||||||
| The Pantry, Inc. |
Fort Mill | SC | — | (1) | 1,311 | 1,967 | — | 3,278 | 110 | 12/31/2012 | 1988 | |||||||||||||||||||||||
| The Procter & Gamble Co. |
FortWayne | IN | 25,904 | — | 26,400 | — | 26,400 | 268 | 11/5/2013 | 1994 | ||||||||||||||||||||||||
| Thermo Process Systems |
Sugarland | TX | — | (1) | 1,680 | 7,778 | — | 9,458 | 82 | 9/24/2013 | 2005 | |||||||||||||||||||||||
| Tiffany & Co. |
Parsippany | NJ | 55,773 | 2,248 | 81,083 | — | 83,331 | 824 | 11/5/2013 | 2002 | ||||||||||||||||||||||||
| Tilted Kilt |
Hendersonville | TN | — | (1) | 310 | 763 | — | 1,073 | 22 | 6/27/2013 | 1994 | |||||||||||||||||||||||
| Time Warner Cable |
Milwaukee | WI | 20,570 | 3,081 | 22,512 | — | 25,593 | 217 | 11/5/2013 | 2001 | ||||||||||||||||||||||||
| Tire Kingdom |
Dublin | OH | — | (6) | 373 | 1,119 | — | 1,492 | 108 | 4/27/2012 | 2003 | |||||||||||||||||||||||
| TJX Companies, Inc. |
Philadelphia | PA | 67,335 | 9,890 | 84,955 | — | 94,845 | 864 | 11/5/2013 | 2001 | ||||||||||||||||||||||||
| T-Mobile USA, Inc. |
Nashville | TN | 10,295 | 1,190 | 15,847 | — | 17,037 | 140 | 11/5/2013 | 2002 | ||||||||||||||||||||||||
| Tractor Supply |
Oneonta | AL | — | (1) | 359 | 1,438 | — | 1,797 | 46 | 4/18/2013 | 2012 | |||||||||||||||||||||||
| Tractor Supply |
Gray | LA | — | 550 | 2,202 | — | 2,752 | 149 | 8/7/2012 | 2011 | ||||||||||||||||||||||||
F-130
Table of Contents
| Initial Costs | Costs Capitalized Subsequent to Acquisition |
Gross Amount Carried at December 31, 2013 (10) (11) |
||||||||||||||||||||||||||||||||
| Property |
City |
State |
Encumbrances at December 31, 2013 |
Land | Buildings, Fixtures and Improvements |
Accumulated Depreciation (12)(13) |
Date Acquired |
Date of Construction | ||||||||||||||||||||||||||
| Tractor Supply |
Negaunee | MI | — | (1) | 488 | 1,953 | — | 2,441 | 147 | 6/12/2012 | 2010 | |||||||||||||||||||||||
| Tractor Supply |
Plymouth | NH | — | 424 | 2,402 | — | 2,826 | 124 | 11/29/2012 | 2011 | ||||||||||||||||||||||||
| Tractor Supply |
Allentown | NJ | — | (5) | 697 | 3,949 | — | 4,646 | 361 | 1/27/2012 | 2011 | |||||||||||||||||||||||
| Tractor Supply |
Rio Grande City | TX | — | (1) | 469 | 1,095 | — | 1,564 | 78 | 6/19/2012 | 2008 | |||||||||||||||||||||||
| UPS e-Logistics |
Elizabethtown | KY | — | (1) | 1,460 | 10,923 | — | 12,383 | 155 | 9/24/2013 | 2001 | |||||||||||||||||||||||
| Bob’s Stores |
Randolph | MA | 6,929 | 2,840 | 6,826 | — | 9,666 | 68 | 11/5/2013 | 1993 | ||||||||||||||||||||||||
| Vacant |
Bethesda | MD | 54,554 | 8,538 | 31,879 | — | 40,417 | 292 | 11/5/2013 | 2012 | ||||||||||||||||||||||||
| Vacant |
Irving | TX | — | 2,610 | 4,470 | — | 7,080 | 34 | 11/5/2013 | 1997 | ||||||||||||||||||||||||
| Vacant (Development property) |
Columbia | SC | — | — | 6,941 | 7,006 | 13,947 | — | 11/5/2013 | in progress | ||||||||||||||||||||||||
| Vacant (Development property) |
The Woodlands | TX | — | — | 5,411 | 1,266 | 6,677 | — | 11/5/2013 | in progress | ||||||||||||||||||||||||
| Vitamin Shoppe |
Evergreen Park | IL | — | (1) | 476 | 1,427 | — | 1,903 | 53 | 4/19/2013 | 2012 | |||||||||||||||||||||||
| Vitamin Shoppe |
Ashland | VA | — | 2,400 | 19,663 | — | 22,063 | 200 | 11/5/2013 | 2013 | ||||||||||||||||||||||||
| Walgreens |
Wetumpka | AL | — | (5) | 547 | 3,102 | — | 3,649 | 341 | 2/22/2012 | 2007 | |||||||||||||||||||||||
| Walgreens |
Peoria | AZ | — | (1) | 837 | 1,953 | — | 2,790 | 98 | 2/28/2013 | 1996 | |||||||||||||||||||||||
| Walgreens |
Phoenix | AZ | — | (1) | 1,037 | 1,927 | — | 2,964 | 87 | 3/26/2013 | 1999 | |||||||||||||||||||||||
| Walgreens |
Coalings | CA | — | (3) | 396 | 3,568 | — | 3,964 | 482 | 10/11/2011 | 2008 | |||||||||||||||||||||||
| Walgreens |
Acworth | GA | — | (1) | 1,583 | 2,940 | — | 4,523 | 162 | 1/25/2013 | 2012 | |||||||||||||||||||||||
| Walgreens |
Chicago | IL | — | (1) | 1,212 | 2,829 | — | 4,041 | 156 | 1/30/2013 | 1999 | |||||||||||||||||||||||
| Walgreens |
Chicago | IL | — | (1) | 1,617 | 3,003 | — | 4,620 | 165 | 1/30/2013 | 2007 | |||||||||||||||||||||||
| Walgreens |
Anderson | IN | — | 807 | 3,227 | — | 4,034 | 274 | 7/31/2012 | 2001 | ||||||||||||||||||||||||
| Walgreens |
Orlando | FL | — | (1) | 1,007 | 1,869 | — | 2,876 | 28 | 9/30/2013 | 1996 | |||||||||||||||||||||||
| Walgreens |
Olathe | KS | — | (1) | 1,258 | 3,774 | — | 5,032 | 94 | 7/25/2013 | 2002 | |||||||||||||||||||||||
| Walgreens |
Frankfort | KY | — | (5) | 911 | 3,643 | — | 4,554 | 419 | 2/8/2012 | 2006 | |||||||||||||||||||||||
| Walgreens |
Shreveport | LA | — | (5) | 619 | 3,509 | — | 4,128 | 386 | 2/22/2012 | 2003 | |||||||||||||||||||||||
| Walgreens |
Baltimore | MD | — | (1) | 1,185 | 2,764 | — | 3,949 | 69 | 8/6/2013 | 2000 | |||||||||||||||||||||||
| Walgreens |
Clinton | MI | — | (1) | 1,463 | 3,413 | — | 4,876 | 239 | 11/13/2012 | 2002 | |||||||||||||||||||||||
| Walgreens |
Dearborn | MI | — | (1) | 190 | 3,605 | — | 3,795 | 162 | 4/1/2013 | 1998 | |||||||||||||||||||||||
F-131
Table of Contents
| Initial Costs | Costs Capitalized Subsequent to Acquisition |
Gross Amount Carried at December 31, 2013 (10) (11) |
||||||||||||||||||||||||||||||||
| Property |
City |
State |
Encumbrances at December 31, 2013 |
Land | Buildings, Fixtures and Improvements |
Accumulated Depreciation (12)(13) |
Date Acquired |
Date of Construction | ||||||||||||||||||||||||||
| Walgreens |
Eastpointe | MI | — | (1) | 668 | 2,672 | — | 3,340 | 307 | 1/19/2012 | 1998 | |||||||||||||||||||||||
| Walgreens |
Lincoln Park | MI | — | 1,041 | 5,896 | — | 6,937 | 501 | 7/31/2012 | 2007 | ||||||||||||||||||||||||
| Walgreens |
Livonia | MI | — | (1) | 261 | 2,350 | — | 2,611 | 106 | 4/1/2013 | 1998 | |||||||||||||||||||||||
| Walgreens |
Stevensville | MI | — | (3) | 855 | 3,420 | — | 4,275 | 428 | 11/28/2011 | 2007 | |||||||||||||||||||||||
| Walgreens |
Troy | MI | — | (1) | — | 1,896 | — | 1,896 | 123 | 12/12/2012 | 2000 | |||||||||||||||||||||||
| Walgreens |
Warren | MI | — | (1) | 748 | 2,991 | — | 3,739 | 194 | 11/21/2012 | 1999 | |||||||||||||||||||||||
| Walgreens |
Columbia | MS | — | 452 | 4,072 | — | 4,524 | 244 | 12/21/2012 | 2011 | ||||||||||||||||||||||||
| Walgreens |
Greenwood | MS | — | (5) | 561 | 3,181 | — | 3,742 | 350 | 2/22/2012 | 2007 | |||||||||||||||||||||||
| Walgreens |
Maplewood | NJ | — | (3) | 1,071 | 6,071 | — | 7,142 | 759 | 11/18/2011 | 2011 | |||||||||||||||||||||||
| Walgreens |
Las Vegas | NV | — | 1,528 | 6,114 | — | 7,642 | 581 | 5/30/2012 | 2009 | ||||||||||||||||||||||||
| Walgreens |
Las Vegas | NV | — | (1) | 700 | 2,801 | — | 3,501 | 112 | 4/30/2013 | 2001 | |||||||||||||||||||||||
| Walgreens |
Staten Island | NY | — | — | 3,984 | — | 3,984 | 538 | 10/5/2011 | 2007 | ||||||||||||||||||||||||
| Walgreens |
Akron | OH | — | 664 | 1,548 | — | 2,212 | 54 | 5/31/2013 | 1994 | ||||||||||||||||||||||||
| Walgreens |
Bryan | OH | — | (5) | 219 | 4,154 | — | 4,373 | 457 | 2/22/2012 | 2007 | |||||||||||||||||||||||
| Walgreens |
Eaton | OH | — | 398 | 3,586 | — | 3,984 | 323 | 6/27/2012 | 2008 | ||||||||||||||||||||||||
| Walgreens |
Tahlequah | OK | — | 647 | 3,664 | — | 4,311 | 220 | 1/2/2013 | 2008 | ||||||||||||||||||||||||
| Walgreens |
Aibonito Pueblo | PR | — | 1,855 | 5,566 | — | 7,421 | 278 | 3/5/2013 | 2012 | ||||||||||||||||||||||||
| Walgreens |
Las Piedras | PR | — | 1,726 | 5,179 | — | 6,905 | 233 | 4/3/2013 | 2012 | ||||||||||||||||||||||||
| Walgreens |
Anderson | SC | — | (5) | 835 | 3,342 | — | 4,177 | 384 | 2/8/2012 | 2006 | |||||||||||||||||||||||
| Walgreens |
Easley | SC | — | 1,206 | 3,617 | — | 4,823 | 326 | 6/27/2012 | 2007 | ||||||||||||||||||||||||
| Walgreens |
Greenville | SC | — | 1,313 | 3,940 | — | 5,253 | 355 | 6/27/2012 | 2006 | ||||||||||||||||||||||||
| Walgreens |
Myrtle Beach | SC | — | (1) | — | 2,077 | — | 2,077 | 249 | 12/29/2011 | 2001 | |||||||||||||||||||||||
| Walgreens |
North Charleston | SC | — | 1,320 | 3,081 | — | 4,401 | 277 | 6/27/2012 | 2008 | ||||||||||||||||||||||||
| Walgreens |
Cordova | TN | — | 1,005 | 2,345 | — | 3,350 | 164 | 11/9/2012 | 2002 | ||||||||||||||||||||||||
| Walgreens |
Memphis | TN | — | 896 | 2,687 | — | 3,583 | 201 | 10/2/2012 | 2003 | ||||||||||||||||||||||||
| Walgreens |
Portsmouth | VA | 2,118 | 730 | 3,311 | — | 4,041 | 33 | 11/5/2013 | 1998 | ||||||||||||||||||||||||
| Wendy’s |
Atascadero | CA | — | (1) | 230 | 1,009 | — | 1,239 | 28 | 6/27/2013 | 2000 | |||||||||||||||||||||||
| Wendy’s |
Camarillo | CA | — | (1) | 320 | 2,253 | — | 2,573 | 62 | 6/27/2013 | 1996 | |||||||||||||||||||||||
| Wendy’s |
Paso Robles | CA | — | (1) | 150 | 1,603 | — | 1,753 | 44 | 6/27/2013 | 1999 | |||||||||||||||||||||||
| Wendy’s |
Worcester | MA | — | (1) | 370 | 1,288 | — | 1,658 | 36 | 6/27/2013 | 1996 | |||||||||||||||||||||||
| Wendy’s |
Salisbury | MD | — | (1) | 370 | 1,299 | — | 1,669 | 36 | 6/27/2013 | 1993 | |||||||||||||||||||||||
| Wendy’s |
Swanton | OH | — | (1) | 430 | 1,233 | — | 1,663 | 34 | 6/27/2013 | 1999 | |||||||||||||||||||||||
| Wendy’s |
Sylvania | OH | — | (1) | 300 | 799 | — | 1,099 | 22 | 6/27/2013 | 1999 | |||||||||||||||||||||||
| Wendy’s |
Knoxville | TN | — | (1) | 330 | 1,161 | — | 1,491 | 32 | 6/27/2013 | 1998 | |||||||||||||||||||||||
| Wendy’s |
Knoxville | TN | — | (1) | 330 | 1,132 | — | 1,462 | 31 | 6/27/2013 | 1996 | |||||||||||||||||||||||
| Wendy’s |
Millington | TN | — | (1) | 380 | 1,208 | — | 1,588 | 33 | 6/27/2013 | 1976 | |||||||||||||||||||||||
| Wendy’s |
Bluefield | VA | — | (1) | 450 | 1,927 | — | 2,377 | 53 | 6/27/2013 | 1992 | |||||||||||||||||||||||
| Wendy’s |
Midlothian | VA | — | (1) | 230 | 1,300 | — | 1,530 | 36 | 6/27/2013 | 1991 | |||||||||||||||||||||||
| Wendy’s |
Beaver | WV | — | (1) | 290 | 1,156 | — | 1,446 | 32 | 6/27/2013 | 1982 | |||||||||||||||||||||||
| West Marine |
Deltaville | VA | — | (1) | 425 | 2,409 | — | 2,834 | 192 | 7/31/2012 | 2012 | |||||||||||||||||||||||
| Williams Sonoma |
Olive Branch | MS | 28,350 | 2,330 | 44,266 | — | 46,596 | 3,825 | 8/10/2012 | 2001 | ||||||||||||||||||||||||
| Abuelo’s |
Rogers | AR | — | (14) | 825 | 2,296 | — | 3,121 | 66 | 6/27/2013 | 2003 | |||||||||||||||||||||||
| Academy Sports |
Smyrna | TN | — | 2,109 | 8,434 | — | 10,543 | 68 | 11/1/2013 | 2012 | ||||||||||||||||||||||||
F-132
Table of Contents
| Initial Costs | Costs Capitalized Subsequent to Acquisition |
Gross Amount Carried at December 31, 2013 (10) (11) |
||||||||||||||||||||||||||||||||
| Property |
City |
State |
Encumbrances at December 31, 2013 |
Land | Buildings, Fixtures and Improvements |
Accumulated Depreciation (12)(13) |
Date Acquired |
Date of Construction | ||||||||||||||||||||||||||
| Academy Sports |
Mobile | AL | — | 1,311 | 7,431 | — | 8,742 | 60 | 11/1/2013 | 2012 | ||||||||||||||||||||||||
| Advance Auto |
Opelika | AL | — | (14) | 289 | 1,156 | — | 1,445 | 43 | 4/24/2013 | 2013 | |||||||||||||||||||||||
| Aliberto’s Mexican Food |
Holbrook | AZ | — | (14) | 32 | 96 | — | 128 | 3 | 6/27/2013 | 1981 | |||||||||||||||||||||||
| Applebee’s |
Davenport | FL | — | (14) | 1,506 | 4,517 | — | 6,023 | 112 | 7/31/2013 | 2007 | |||||||||||||||||||||||
| Applebee’s |
Bradenton | FL | — | (14) | 2,475 | 3,713 | — | 6,188 | 92 | 7/31/2013 | 1994 | |||||||||||||||||||||||
| Applebee’s |
Rio Rancho | NM | — | (14) | 645 | 3,654 | — | 4,299 | 91 | 7/31/2013 | 1995 | |||||||||||||||||||||||
| Applebee’s |
Brandon | FL | — | (14) | 2,453 | 3,647 | — | 6,100 | 105 | 6/27/2013 | 1997 | |||||||||||||||||||||||
| Applebee’s |
Lakeland | FL | — | (14) | 1,959 | 3,638 | — | 5,597 | 90 | 7/31/2013 | 2000 | |||||||||||||||||||||||
| Applebee’s |
Temple Terrace | FL | — | (14) | 2,396 | 3,594 | — | 5,990 | 89 | 7/31/2013 | 1993 | |||||||||||||||||||||||
| Applebee’s |
Largo | FL | — | (14) | 2,334 | 3,501 | — | 5,835 | 87 | 7/31/2013 | 1995 | |||||||||||||||||||||||
| Applebee’s |
St. Petersburg | FL | — | (14) | 2,329 | 3,493 | — | 5,822 | 87 | 7/31/2013 | 1994 | |||||||||||||||||||||||
| Applebee’s |
Riverview | FL | — | (14) | 1,849 | 3,434 | — | 5,283 | 85 | 7/31/2013 | 2006 | |||||||||||||||||||||||
| Applebee’s |
Hobbs | NM | — | (14) | 600 | 3,401 | — | 4,001 | 84 | 7/31/2013 | 2002 | |||||||||||||||||||||||
| Applebee’s |
Valrico | FL | — | (14) | 1,202 | 3,274 | — | 4,476 | 94 | 6/27/2013 | 1998 | |||||||||||||||||||||||
| Applebee’s |
Wesley Chapel | FL | — | (14) | 3,272 | 3,272 | — | 6,544 | 81 | 7/31/2013 | 2000 | |||||||||||||||||||||||
| Applebee’s |
New Port Richey | FL | — | (14) | 1,695 | 3,147 | — | 4,842 | 78 | 7/31/2013 | 1998 | |||||||||||||||||||||||
| Applebee’s |
Inverness | FL | — | (14) | 1,977 | 2,965 | — | 4,942 | 74 | 7/31/2013 | 2000 | |||||||||||||||||||||||
| Applebee’s |
Corpus Christi | TX | — | (14) | 563 | 2,926 | — | 3,489 | 84 | 6/27/2013 | 2000 | |||||||||||||||||||||||
| Applebee’s |
Nampa | ID | — | (14) | 729 | 2,915 | — | 3,644 | 72 | 7/31/2013 | 2000 | |||||||||||||||||||||||
| Applebee’s |
Pueblo | CO | — | (14) | 960 | 2,879 | — | 3,839 | 71 | 7/31/2013 | 1998 | |||||||||||||||||||||||
| Applebee’s |
Plant City | FL | — | (14) | 2,079 | 2,869 | — | 4,948 | 82 | 6/27/2013 | 2001 | |||||||||||||||||||||||
| Applebee’s |
Evans | GA | — | (14) | 1,426 | 2,649 | — | 4,075 | 66 | 7/31/2013 | 2004 | |||||||||||||||||||||||
| Applebee’s |
Winter Haven | FL | — | (14) | 2,130 | 2,603 | — | 4,733 | 65 | 7/31/2013 | 1999 | |||||||||||||||||||||||
| Applebee’s |
Gresham | OR | — | 853 | 2,560 | — | 3,413 | 49 | 8/30/2013 | 2004 | ||||||||||||||||||||||||
| Applebee’s |
Garden City | ID | — | 628 | 2,512 | — | 3,140 | 48 | 8/30/2013 | 2003 | ||||||||||||||||||||||||
| Applebee’s |
Savannah | GA | — | (14) | 1,329 | 2,468 | — | 3,797 | 61 | 7/31/2013 | 1994 | |||||||||||||||||||||||
| Applebee’s |
Crystal River | FL | — | (14) | 1,328 | 2,467 | — | 3,795 | 61 | 7/31/2013 | 2001 | |||||||||||||||||||||||
| Applebee’s |
Alamogordo | NM | — | 271 | 2,438 | — | 2,709 | 47 | 8/30/2013 | 2000 | ||||||||||||||||||||||||
| Applebee’s |
Lakeland | FL | — | (14) | 1,283 | 2,383 | — | 3,666 | 59 | 7/31/2013 | 1997 | |||||||||||||||||||||||
| Applebee’s |
Augusta | GA | — | (14) | 1,254 | 2,329 | — | 3,583 | 58 | 7/31/2013 | 1987 | |||||||||||||||||||||||
| Applebee’s |
Roswell | NM | — | (14) | 405 | 2,295 | — | 2,700 | 57 | 7/31/2013 | 1998 | |||||||||||||||||||||||
| Applebee’s |
Pueblo | CO | — | 752 | 2,257 | — | 3,009 | 43 | 8/30/2013 | 1998 | ||||||||||||||||||||||||
| Applebee’s |
Greeley | CO | — | (14) | 559 | 2,235 | — | 2,794 | 55 | 7/31/2013 | 1995 | |||||||||||||||||||||||
| Applebee’s |
Phenix City | AL | — | (14) | 1,488 | 2,232 | — | 3,720 | 55 | 7/31/2013 | 1999 | |||||||||||||||||||||||
| Applebee’s |
Oxford | AL | — | 1,162 | 2,157 | — | 3,319 | 41 | 8/30/2013 | 1995 | ||||||||||||||||||||||||
| Applebee’s |
Clackamas | OR | — | (14) | 901 | 2,103 | — | 3,004 | 52 | 7/31/2013 | 1997 | |||||||||||||||||||||||
| Applebee’s |
Tualatin | OR | — | (14) | 1,116 | 2,072 | — | 3,188 | 51 | 7/31/2013 | 2002 | |||||||||||||||||||||||
| Applebee’s |
Richland | WA | — | (14) | 1,112 | 2,064 | — | 3,176 | 51 | 7/31/2013 | 2003 | |||||||||||||||||||||||
| Applebee’s |
Edinburg | TX | — | (14) | 898 | 2,058 | — | 2,956 | 59 | 6/27/2013 | 2006 | |||||||||||||||||||||||
| Applebee’s |
Thornton | CO | — | 681 | 2,043 | — | 2,724 | 39 | 8/30/2013 | 1994 | ||||||||||||||||||||||||
| Applebee’s |
Colorado Springs | CO | — | (14) | 499 | 1,996 | — | 2,495 | 49 | 7/31/2013 | 1995 | |||||||||||||||||||||||
| Applebee’s |
McAllen | TX | — | (14) | 1,114 | 1,988 | — | 3,102 | 57 | 6/27/2013 | 1993 | |||||||||||||||||||||||
| Applebee’s |
Brighton | CO | — | (14) | 657 | 1,972 | — | 2,629 | 49 | 7/31/2013 | 1998 | |||||||||||||||||||||||
F-133
Table of Contents
| Initial Costs | Costs Capitalized Subsequent to Acquisition |
Gross Amount Carried at December 31, 2013 (10) (11) |
||||||||||||||||||||||||||||||||
| Property |
City |
State |
Encumbrances at December 31, 2013 |
Land | Buildings, Fixtures and Improvements |
Accumulated Depreciation (12)(13) |
Date Acquired |
Date of Construction | ||||||||||||||||||||||||||
| Applebee’s |
Colorado Springs | CO | — | (14) | 629 | 1,888 | — | 2,517 | 47 | 7/31/2013 | 1994 | |||||||||||||||||||||||
| Applebee’s |
Vancouver | WA | — | 791 | 1,846 | — | 2,637 | 35 | 8/30/2013 | 2001 | ||||||||||||||||||||||||
| Applebee’s |
Pocatello | ID | — | (14) | 612 | 1,837 | — | 2,449 | 46 | 7/31/2013 | 1998 | |||||||||||||||||||||||
| Applebee’s |
San Antonio | TX | — | (14) | 732 | 1,796 | — | 2,528 | 51 | 6/27/2013 | 2003 | |||||||||||||||||||||||
| Applebee’s |
Milledgeville | GA | — | (14) | 1,174 | 1,761 | — | 2,935 | 44 | 7/31/2013 | 1999 | |||||||||||||||||||||||
| Applebee’s |
Boise | ID | — | (14) | 948 | 1,761 | — | 2,709 | 44 | 7/31/2013 | 1998 | |||||||||||||||||||||||
| Applebee’s |
Arvada | CO | — | (14) | 754 | 1,760 | — | 2,514 | 44 | 7/31/2013 | 1996 | |||||||||||||||||||||||
| Applebee’s |
Crestview | FL | — | (14) | 943 | 1,752 | — | 2,695 | 43 | 7/31/2013 | 2000 | |||||||||||||||||||||||
| Applebee’s |
Northglenn | CO | — | (14) | 578 | 1,734 | — | 2,312 | 43 | 7/31/2013 | 1993 | |||||||||||||||||||||||
| Applebee’s |
Auburn | AL | — | (14) | 1,155 | 1,732 | — | 2,887 | 43 | 7/31/2013 | 1993 | |||||||||||||||||||||||
| Applebee’s |
Ocean Springs | MS | — | (14) | 673 | 1,708 | — | 2,381 | 49 | 6/27/2013 | 2000 | |||||||||||||||||||||||
| Applebee’s |
Vancouver | WA | — | (14) | 718 | 1,675 | — | 2,393 | 42 | 7/31/2013 | 2001 | |||||||||||||||||||||||
| Applebee’s |
Roseburg | OR | — | 717 | 1,673 | — | 2,390 | 32 | 8/30/2013 | 2000 | ||||||||||||||||||||||||
| Applebee’s |
Lake Oswego | OR | — | (14) | 1,352 | 1,652 | — | 3,004 | 41 | 7/31/2013 | 1993 | |||||||||||||||||||||||
| Applebee’s |
Newton | KS | — | (14) | 504 | 1,569 | — | 2,073 | 45 | 6/27/2013 | 1998 | |||||||||||||||||||||||
| Applebee’s |
Fall River | MA | — | 275 | 1,558 | — | 1,833 | 39 | 7/31/2013 | 1994 | ||||||||||||||||||||||||
| Applebee’s |
New Braunfels | TX | — | (14) | 566 | 1,486 | — | 2,052 | 43 | 6/27/2013 | 1995 | |||||||||||||||||||||||
| Applebee’s |
Dublin | GA | — | (14) | 1,171 | 1,431 | — | 2,602 | 35 | 7/31/2013 | 1998 | |||||||||||||||||||||||
| Applebee’s |
North Canton | OH | — | 152 | 838 | — | 990 | 24 | 6/27/2013 | 1992 | ||||||||||||||||||||||||
| Arby’s |
Atlanta | GA | — | (14) | 1,207 | 987 | — | 2,194 | 22 | 7/31/2013 | 1984 | |||||||||||||||||||||||
| Arby’s |
Kennesaw | GA | — | (14) | 583 | 840 | — | 1,423 | 23 | 6/27/2013 | 1984 | |||||||||||||||||||||||
| Arby’s |
Memphis | TN | — | (14) | 449 | 835 | — | 1,284 | 18 | 7/31/2013 | 1998 | |||||||||||||||||||||||
| Arby’s |
Mount Vernon | IL | — | (14) | 911 | 764 | — | 1,675 | 21 | 6/27/2013 | 1999 | |||||||||||||||||||||||
| Arby’s |
Richmond Hill | GA | — | (14) | 430 | 755 | — | 1,185 | 21 | 6/27/2013 | 1984 | |||||||||||||||||||||||
| Arby’s |
Grandville | MI | — | (14) | 1,133 | 755 | — | 1,888 | 17 | 7/31/2013 | 1982 | |||||||||||||||||||||||
| Arby’s |
Prescott | AZ | — | 404 | 750 | — | 1,154 | 16 | 7/31/2013 | 1986 | ||||||||||||||||||||||||
| Arby’s |
Schertz | TX | — | 499 | 748 | — | 1,247 | 16 | 7/31/2013 | 1996 | ||||||||||||||||||||||||
| Arby’s |
Apopka | FL | — | (14) | 464 | 697 | — | 1,161 | 15 | 7/31/2013 | 1985 | |||||||||||||||||||||||
| Arby’s |
Mobile | AL | — | 460 | 685 | — | 1,145 | 19 | 6/27/2013 | 1986 | ||||||||||||||||||||||||
| Arby’s |
Wyoming | MI | — | (14) | 1,513 | 648 | — | 2,161 | 14 | 7/31/2013 | 1970 | |||||||||||||||||||||||
| Arby’s |
Fort Wayne | IN | — | 529 | 647 | — | 1,176 | 14 | 7/31/2013 | 1987 | ||||||||||||||||||||||||
| Arby’s |
Louisville | KY | — | 336 | 625 | — | 961 | 26 | 5/30/2013 | 1979 | ||||||||||||||||||||||||
| Arby’s |
Phoenix | AZ | — | 559 | 618 | — | 1,177 | 17 | 6/27/2013 | 1995 | ||||||||||||||||||||||||
| Arby’s |
Fountain Hills | AZ | — | 241 | 597 | — | 838 | 17 | 6/27/2013 | 1994 | ||||||||||||||||||||||||
| Arby’s |
Orlando | FL | — | 251 | 585 | — | 836 | 13 | 7/31/2013 | 1985 | ||||||||||||||||||||||||
| Arby’s |
Rockledge | FL | — | 381 | 571 | — | 952 | 13 | 7/31/2013 | 1984 | ||||||||||||||||||||||||
| Arby’s |
Erie | PA | — | 188 | 552 | — | 740 | 15 | 6/27/2013 | 1966 | ||||||||||||||||||||||||
| Arby’s |
Merritt Island | FL | — | 297 | 552 | — | 849 | 12 | 7/31/2013 | 1984 | ||||||||||||||||||||||||
| Arby’s |
Hopkinsville | KY | — | (14) | 432 | 528 | — | 960 | 12 | 7/31/2013 | 1994 | |||||||||||||||||||||||
| Arby’s |
Clovis | NM | — | 91 | 518 | — | 609 | 14 | 6/27/2013 | 1982 | ||||||||||||||||||||||||
| Arby’s |
Winchester | IN | — | 341 | 511 | — | 852 | 11 | 7/31/2013 | 1988 | ||||||||||||||||||||||||
| Arby’s |
Lexington | NC | — | 484 | 504 | — | 988 | 14 | 6/27/2013 | 1987 | ||||||||||||||||||||||||
| Arby’s |
Guntersville | AL | — | 142 | 503 | — | 645 | 14 | 6/27/2013 | 1986 | ||||||||||||||||||||||||
F-134
Table of Contents
| Initial Costs | Costs Capitalized Subsequent to Acquisition |
Gross Amount Carried at December 31, 2013 (10) (11) |
||||||||||||||||||||||||||||||||
| Property |
City |
State |
Encumbrances at December 31, 2013 |
Land | Buildings, Fixtures and Improvements |
Accumulated Depreciation (12)(13) |
Date Acquired |
Date of Construction | ||||||||||||||||||||||||||
| Arby’s |
New Albany | IN | — | (14) | 456 | 470 | — | 926 | 13 | 6/27/2013 | 2005 | |||||||||||||||||||||||
| Arby’s |
Chattanooga | TN | — | (14) | 201 | 469 | — | 670 | 10 | 7/31/2013 | 1998 | |||||||||||||||||||||||
| Arby’s |
New Albany | IN | — | (14) | 325 | 465 | — | 790 | 13 | 6/27/2013 | 1995 | |||||||||||||||||||||||
| Arby’s |
Scottsburg | IN | — | (14) | 526 | 445 | — | 971 | 12 | 6/27/2013 | 1989 | |||||||||||||||||||||||
| Arby’s |
Corinth | MS | — | (14) | 753 | 429 | — | 1,182 | 12 | 6/27/2013 | 1984 | |||||||||||||||||||||||
| Arby’s |
Alexander City | AL | — | (14) | 527 | 401 | — | 928 | 11 | 6/27/2013 | 1999 | |||||||||||||||||||||||
| Arby’s |
Middlefield | OH | — | 379 | 388 | — | 767 | 11 | 6/27/2013 | 1988 | ||||||||||||||||||||||||
| Arby’s |
Rochester | NY | — | 128 | 384 | — | 512 | 8 | 7/31/2013 | 1985 | ||||||||||||||||||||||||
| Arby’s |
Savannah | GA | — | 293 | 293 | — | 586 | 6 | 7/31/2013 | 1985 | ||||||||||||||||||||||||
| Arby’s |
Albuquerque | NM | — | 217 | 246 | — | 463 | 7 | 6/27/2013 | 1987 | ||||||||||||||||||||||||
| Arby’s |
Alexandria | LA | — | 82 | 245 | — | 327 | 5 | 7/31/2013 | 1985 | ||||||||||||||||||||||||
| Arby’s |
Las Vegas | NM | — | 236 | 236 | — | 472 | 5 | 7/31/2013 | 1985 | ||||||||||||||||||||||||
| Arby’s |
Toccoa | GA | — | 185 | 227 | — | 412 | 5 | 7/31/2013 | 1998 | ||||||||||||||||||||||||
| Arby’s |
Bullhead City | AZ | — | 550 | — | — | 550 | — | 6/27/2013 | 1999 | ||||||||||||||||||||||||
| Arby’s |
Omaha | NE | — | 359 | — | — | 359 | — | 7/31/2013 | 1984 | ||||||||||||||||||||||||
| Auto Pawn |
Columbus | GA | — | 170 | — | — | 170 | — | 6/27/2013 | 1987 | ||||||||||||||||||||||||
| Bandana’s Bar-B-Q Restaurant |
Fenton | MO | — | 470 | 314 | — | 784 | 6 | 8/30/2013 | 1986 | ||||||||||||||||||||||||
| Billboard |
Memphis | TN | — | 33 | — | — | 33 | — | 7/31/2013 | N/A | ||||||||||||||||||||||||
| Billboard |
Memphis | TN | — | 63 | — | — | 63 | — | 7/31/2013 | N/A | ||||||||||||||||||||||||
| Billboard |
Memphis | TN | — | 73 | — | — | 73 | — | 7/31/2013 | N/A | ||||||||||||||||||||||||
| Billboard |
Memphis | TN | — | 90 | — | — | 90 | — | 7/31/2013 | N/A | ||||||||||||||||||||||||
| Billboard |
Memphis | TN | — | 69 | — | — | 69 | — | 7/31/2013 | N/A | ||||||||||||||||||||||||
| Black Meg 43 |
Copperas Cove | TX | — | (14) | 151 | 151 | — | 302 | 4 | 6/27/2013 | 1969 | |||||||||||||||||||||||
| Bojangles |
Statesville | NC | — | (14) | 646 | 1,937 | — | 2,583 | 43 | 7/31/2013 | 1988 | |||||||||||||||||||||||
| Bojangles |
Denver | NC | — | (14) | 1,013 | 1,881 | — | 2,894 | 41 | 7/31/2013 | 1997 | |||||||||||||||||||||||
| Bojangles |
Hickory | NC | — | (14) | 749 | 1,789 | — | 2,538 | 50 | 6/27/2013 | 1973 | |||||||||||||||||||||||
| Bojangles |
Fountain Inn | SC | — | 287 | 1,150 | — | 1,437 | 20 | 10/10/2013 | 2012 | ||||||||||||||||||||||||
| Bojangles |
Taylorsville | NC | — | (14) | 436 | 1,108 | — | 1,544 | 31 | 6/27/2013 | 1987 | |||||||||||||||||||||||
| Bojangles |
Troutman | NC | — | 718 | 1,077 | — | 1,795 | 19 | 10/10/2013 | 2012 | ||||||||||||||||||||||||
| Bridgestone Firestone |
Kansas City | MO | — | (14) | 651 | 1,954 | — | 2,605 | 66 | 5/31/2013 | 2008 | |||||||||||||||||||||||
| Bruegger’s Bagels |
Durham | NC | — | (14) | 312 | 728 | — | 1,040 | 16 | 7/31/2013 | 1926 | |||||||||||||||||||||||
| Bucho’s Mexican Food |
Bolingbrook | IL | — | (14) | 470 | 137 | — | 607 | 4 | 6/27/2013 | 1992 | |||||||||||||||||||||||
| Buffalo Wild Wings |
Langhorne | PA | — | (14) | 815 | 815 | — | 1,630 | 20 | 7/31/2013 | 1999 | |||||||||||||||||||||||
| Burger King |
Augusta | GA | — | (14) | 693 | 2,080 | — | 2,773 | 46 | 7/31/2013 | 1986 | |||||||||||||||||||||||
| Burger King |
Spanaway | WA | — | 509 | 1,628 | — | 2,137 | 45 | 6/27/2013 | 1997 | ||||||||||||||||||||||||
| Burger King |
Cleveland | MS | — | (14) | 688 | 1,606 | — | 2,294 | 35 | 7/31/2013 | 1985 | |||||||||||||||||||||||
| Burger King |
Brandon | MS | — | (14) | 649 | 1,513 | — | 2,162 | 42 | 6/27/2013 | 1981 | |||||||||||||||||||||||
| Burger King |
North Augusta | SC | — | (14) | 256 | 1,451 | — | 1,707 | 32 | 7/31/2013 | 1985 | |||||||||||||||||||||||
| Burger King |
Troy | AL | — | (14) | 461 | 1,383 | — | 1,844 | 30 | 7/31/2013 | 1984 | |||||||||||||||||||||||
| Burger King |
Charlotte | NC | — | 1,105 | 1,372 | — | 2,477 | 38 | 6/27/2013 | 1997 | ||||||||||||||||||||||||
| Burger King |
Martinez | GA | — | (14) | 909 | 1,350 | — | 2,259 | 37 | 6/27/2013 | 1998 | |||||||||||||||||||||||
| Burger King |
Greenville | MS | — | (14) | 573 | 1,337 | — | 1,910 | 29 | 7/31/2013 | 2004 | |||||||||||||||||||||||
| Burger King |
Germantown | WI | — | (14) | 644 | 1,300 | — | 1,944 | 36 | 6/27/2013 | 1986 | |||||||||||||||||||||||
| Burger King |
Denver | CO | — | (14) | 872 | 1,242 | — | 2,114 | 34 | 6/27/2013 | 1994 | |||||||||||||||||||||||
F-135
Table of Contents
| Initial Costs | Costs Capitalized Subsequent to Acquisition |
Gross Amount Carried at December 31, 2013 (10) (11) |
||||||||||||||||||||||||||||||||
| Property |
City |
State |
Encumbrances at December 31, 2013 |
Land | Buildings, Fixtures and Improvements |
Accumulated Depreciation (12)(13) |
Date Acquired |
Date of Construction | ||||||||||||||||||||||||||
| Burger King |
Alpharetta | GA | — | (14) | 501 | 1,219 | — | 1,720 | 34 | 6/27/2013 | 2001 | |||||||||||||||||||||||
| Burger King |
Amesbury | MA | — | (14) | 835 | 1,217 | — | 2,052 | 34 | 6/27/2013 | 1977 | |||||||||||||||||||||||
| Burger King |
Dothan | AL | — | (14) | 628 | 1,167 | — | 1,795 | 26 | 7/31/2013 | 1983 | |||||||||||||||||||||||
| Burger King |
Roswell | GA | — | (14) | 495 | 1,156 | — | 1,651 | 25 | 7/31/2013 | 1998 | |||||||||||||||||||||||
| Burger King |
Wahoo | NE | — | (14) | 196 | 1,109 | — | 1,305 | 24 | 7/31/2013 | 1990 | |||||||||||||||||||||||
| Burger King |
Dothan | AL | — | (14) | 594 | 1,104 | — | 1,698 | 24 | 7/31/2013 | 1999 | |||||||||||||||||||||||
| Burger King |
Cut Off | LA | — | 726 | 1,088 | — | 1,814 | 24 | 7/31/2013 | 1990 | ||||||||||||||||||||||||
| Burger King |
Defuniak Springs | FL | — | (14) | 362 | 1,087 | — | 1,449 | 24 | 7/31/2013 | 1989 | |||||||||||||||||||||||
| Burger King |
Blair | NE | — | (14) | 272 | 1,087 | — | 1,359 | 24 | 7/31/2013 | 1987 | |||||||||||||||||||||||
| Burger King |
Maywood | IL | — | (14) | 860 | 1,051 | — | 1,911 | 23 | 7/31/2013 | 2003 | |||||||||||||||||||||||
| Burger King |
North Augusta | SC | — | (14) | 450 | 1,050 | — | 1,500 | 23 | 7/31/2013 | 1985 | |||||||||||||||||||||||
| Burger King |
Bainbridge | GA | — | (14) | 347 | 1,042 | — | 1,389 | 23 | 7/31/2013 | 1998 | |||||||||||||||||||||||
| Burger King |
Sierra Vista | AZ | — | 260 | 1,041 | — | 1,301 | 23 | 7/31/2013 | 1994 | ||||||||||||||||||||||||
| Burger King |
Greenwood | MS | — | (14) | 692 | 1,038 | — | 1,730 | 23 | 7/31/2013 | 1988 | |||||||||||||||||||||||
| Burger King |
Kansas CIty | MO | — | 444 | 1,036 | — | 1,480 | 23 | 7/31/2013 | 1984 | ||||||||||||||||||||||||
| Burger King |
Laredo | TX | — | (14) | 684 | 1,026 | — | 1,710 | 23 | 7/31/2013 | 2002 | |||||||||||||||||||||||
| Burger King |
Andalusia | AL | — | (14) | 181 | 1,025 | — | 1,206 | 23 | 7/31/2013 | 2000 | |||||||||||||||||||||||
| Burger King |
Kingsford | MI | — | (14) | 53 | 1,015 | — | 1,068 | 22 | 7/31/2013 | 1983 | |||||||||||||||||||||||
| Burger King |
Red Oak | IA | — | (14) | 334 | 1,002 | — | 1,336 | 22 | 7/31/2013 | 1988 | |||||||||||||||||||||||
| Burger King |
Austin | TX | — | (14) | 666 | 999 | — | 1,665 | 28 | 6/27/2013 | 1998 | |||||||||||||||||||||||
| Burger King |
Cairo | GA | — | (14) | 245 | 981 | — | 1,226 | 22 | 7/31/2013 | 1997 | |||||||||||||||||||||||
| Burger King |
Alpharetta | GA | — | (14) | 1,128 | 977 | — | 2,105 | 27 | 6/27/2013 | 1993 | |||||||||||||||||||||||
| Burger King |
Springfield | FL | — | (14) | 324 | 971 | — | 1,295 | 21 | 7/31/2013 | 1999 | |||||||||||||||||||||||
| Burger King |
Opelousas | LA | — | 964 | 964 | — | 1,928 | 21 | 7/31/2013 | 1998 | ||||||||||||||||||||||||
| Burger King |
Panama City | FL | — | (14) | 319 | 956 | — | 1,275 | 21 | 7/31/2013 | 1998 | |||||||||||||||||||||||
| Burger King |
Chattanooga | TN | — | (14) | 637 | 955 | — | 1,592 | 21 | 7/31/2013 | 1985 | |||||||||||||||||||||||
| Burger King |
Dover | NH | — | (14) | 1,159 | 952 | — | 2,111 | 26 | 6/27/2013 | 1970 | |||||||||||||||||||||||
| Burger King |
Des Moines | IA | — | (14) | 1,160 | 949 | — | 2,109 | 21 | 7/31/2013 | 1987 | |||||||||||||||||||||||
| Burger King |
Alpharetta | GA | — | (14) | 795 | 943 | — | 1,738 | 26 | 6/27/2013 | 1997 | |||||||||||||||||||||||
| Burger King |
Philadelphia | MS | — | (14) | 402 | 939 | — | 1,341 | 21 | 7/31/2013 | 1993 | |||||||||||||||||||||||
| Burger King |
Brewton | AL | — | (14) | 307 | 920 | — | 1,227 | 20 | 7/31/2013 | 1993 | |||||||||||||||||||||||
| Burger King |
Stuart | IA | — | (14) | 607 | 911 | — | 1,518 | 20 | 7/31/2013 | 1997 | |||||||||||||||||||||||
| Burger King |
Yazoo City | MS | — | (14) | 489 | 909 | — | 1,398 | 20 | 7/31/2013 | 1993 | |||||||||||||||||||||||
| Burger King |
Marshfield | WI | — | (14) | 232 | 885 | — | 1,117 | 25 | 6/27/2013 | 1986 | |||||||||||||||||||||||
| Burger King |
Thomson | GA | — | (14) | 748 | 876 | — | 1,624 | 24 | 6/27/2013 | 1988 | |||||||||||||||||||||||
| Burger King |
Wilmington | NC | — | (14) | 573 | 870 | — | 1,443 | 24 | 6/27/2013 | 1999 | |||||||||||||||||||||||
| Burger King |
Alpharetta | GA | — | (14) | 635 | 865 | — | 1,500 | 24 | 6/27/2013 | 1998 | |||||||||||||||||||||||
| Burger King |
Clarksdale | MS | — | (14) | 865 | 865 | — | 1,730 | 19 | 7/31/2013 | 1988 | |||||||||||||||||||||||
| Burger King |
Opp | AL | — | (14) | 214 | 857 | — | 1,071 | 19 | 7/31/2013 | 1994 | |||||||||||||||||||||||
| Burger King |
Cincinnati | OH | — | 353 | 824 | — | 1,177 | 18 | 7/31/2013 | 1974 | ||||||||||||||||||||||||
| Burger King |
Greenville | MS | — | (14) | 351 | 820 | — | 1,171 | 18 | 7/31/2013 | 1993 | |||||||||||||||||||||||
| Burger King |
Grand Rapids | MI | — | (14) | 346 | 807 | — | 1,153 | 18 | 7/31/2013 | 1985 | |||||||||||||||||||||||
| Burger King |
Grenada | MS | — | (14) | 536 | 805 | — | 1,341 | 18 | 7/31/2013 | 1989 | |||||||||||||||||||||||
F-136
Table of Contents
| Initial Costs | Costs Capitalized Subsequent to Acquisition |
Gross Amount Carried at December 31, 2013 (10) (11) |
||||||||||||||||||||||||||||||||
| Property |
City |
State |
Encumbrances at December 31, 2013 |
Land | Buildings, Fixtures and Improvements |
Accumulated Depreciation (12)(13) |
Date Acquired |
Date of Construction | ||||||||||||||||||||||||||
| Burger King |
Clinton | NC | — | (14) | 494 | 801 | — | 1,295 | 22 | 6/27/2013 | 1999 | |||||||||||||||||||||||
| Burger King |
Chadbourn | NC | — | (14) | 353 | 797 | — | 1,150 | 22 | 6/27/2013 | 1999 | |||||||||||||||||||||||
| Burger King |
Texas City | TX | — | (14) | 421 | 782 | — | 1,203 | 17 | 7/31/2013 | 1984 | |||||||||||||||||||||||
| Burger King |
New Philadelphia | OH | — | 419 | 779 | — | 1,198 | 17 | 7/31/2013 | 1986 | ||||||||||||||||||||||||
| Burger King |
Mansfield | OH | — | 191 | 766 | — | 957 | 17 | 7/31/2013 | 1985 | ||||||||||||||||||||||||
| Burger King |
Lake Charles | LA | — | 610 | 746 | — | 1,356 | 16 | 7/31/2013 | 1990 | ||||||||||||||||||||||||
| Burger King |
Warren | MI | — | 248 | 745 | — | 993 | 16 | 7/31/2013 | 1987 | ||||||||||||||||||||||||
| Burger King |
Atmore | AL | — | (14) | 181 | 723 | — | 904 | 16 | 7/31/2013 | 2000 | |||||||||||||||||||||||
| Burger King |
Tallahassee | FL | — | (14) | 720 | 720 | — | 1,440 | 16 | 7/31/2013 | 1998 | |||||||||||||||||||||||
| Burger King |
Weston | WI | — | (14) | 329 | 718 | — | 1,047 | 20 | 6/27/2013 | 1987 | |||||||||||||||||||||||
| Burger King |
Walker | MI | — | (14) | 305 | 711 | — | 1,016 | 16 | 7/31/2013 | 1975 | |||||||||||||||||||||||
| Burger King |
Evergreen | AL | — | (14) | 172 | 689 | — | 861 | 15 | 7/31/2013 | 1997 | |||||||||||||||||||||||
| Burger King |
Chicago Ridge | IL | — | (14) | 431 | 684 | — | 1,115 | 19 | 6/27/2013 | 1998 | |||||||||||||||||||||||
| Burger King |
Perry | IA | — | (14) | 557 | 680 | — | 1,237 | 15 | 7/31/2013 | 1997 | |||||||||||||||||||||||
| Burger King |
Springfield | IL | — | (14) | 354 | 677 | — | 1,031 | 19 | 6/27/2013 | 1995 | |||||||||||||||||||||||
| Burger King |
Hudsonville | MI | — | (14) | 451 | 676 | — | 1,127 | 15 | 7/31/2013 | 1988 | |||||||||||||||||||||||
| Burger King |
Natchez | MS | — | 225 | 674 | — | 899 | 15 | 7/31/2013 | 1973 | ||||||||||||||||||||||||
| Burger King |
Irondequoit | NY | — | 988 | 659 | — | 1,647 | 14 | 7/31/2013 | 1980 | ||||||||||||||||||||||||
| Burger King |
Enterprise | AL | — | (14) | 437 | 655 | — | 1,092 | 14 | 7/31/2013 | 1985 | |||||||||||||||||||||||
| Burger King |
Nashua | NH | — | (14) | 655 | 655 | — | 1,310 | 14 | 7/31/2013 | 2008 | |||||||||||||||||||||||
| Burger King |
Claremont | NC | — | (14) | 646 | 646 | — | 1,292 | 18 | 6/27/2013 | 2000 | |||||||||||||||||||||||
| Burger King |
Pontiac | IL | — | 151 | 616 | — | 767 | 17 | 6/27/2013 | 1991 | ||||||||||||||||||||||||
| Burger King |
L’Anse | MI | — | (14) | 32 | 616 | — | 648 | 14 | 7/31/2013 | 1999 | |||||||||||||||||||||||
| Burger King |
Hastings | MN | — | (14) | 328 | 608 | — | 936 | 13 | 7/31/2013 | 1990 | |||||||||||||||||||||||
| Burger King |
Gary | IN | — | (14) | 544 | 606 | — | 1,150 | 17 | 6/27/2013 | 1987 | |||||||||||||||||||||||
| Burger King |
Syracuse | NY | — | 606 | 606 | — | 1,212 | 13 | 7/31/2013 | 1986 | ||||||||||||||||||||||||
| Burger King |
Rhinelander | WI | — | (14) | 260 | 606 | — | 866 | 13 | 7/31/2013 | 1986 | |||||||||||||||||||||||
| Burger King |
Monroeville | AL | — | (14) | 325 | 604 | — | 929 | 13 | 7/31/2013 | 1997 | |||||||||||||||||||||||
| Burger King |
Menominee | MI | — | (14) | 494 | 604 | — | 1,098 | 13 | 7/31/2013 | 1986 | |||||||||||||||||||||||
| Burger King |
Asheville | NC | — | 728 | 595 | — | 1,323 | 13 | 7/31/2013 | 1982 | ||||||||||||||||||||||||
| Burger King |
Clearwater | FL | — | (14) | 981 | 591 | — | 1,572 | 16 | 6/27/2013 | 1980 | |||||||||||||||||||||||
| Burger King |
Shenandoah | IA | — | (14) | 313 | 582 | — | 895 | 13 | 7/31/2013 | 1988 | |||||||||||||||||||||||
| Burger King |
Raceland | LA | — | 356 | 533 | — | 889 | 12 | 7/31/2013 | 1991 | ||||||||||||||||||||||||
| Burger King |
Springfield | MA | — | 983 | 516 | — | 1,499 | 14 | 6/27/2013 | 1974 | ||||||||||||||||||||||||
| Burger King |
Spring Lake | MI | — | 341 | 512 | — | 853 | 11 | 7/31/2013 | 1995 | ||||||||||||||||||||||||
| Burger King |
Harvey | IL | — | 403 | 507 | — | 910 | 14 | 6/27/2013 | 1997 | ||||||||||||||||||||||||
| Burger King |
Anchorage | AK | — | 427 | 489 | — | 916 | 14 | 6/27/2013 | 1982 | ||||||||||||||||||||||||
| Burger King |
Dayton | OH | — | (14) | 569 | 466 | — | 1,035 | 10 | 7/31/2013 | 1990 | |||||||||||||||||||||||
| Burger King |
Gonzales | LA | — | 380 | 465 | — | 845 | 10 | 7/31/2013 | 1990 | ||||||||||||||||||||||||
| Burger King |
Gallatin | TN | — | (14) | 199 | 463 | — | 662 | 10 | 7/31/2013 | 1984 | |||||||||||||||||||||||
| Burger King |
Lake Charles | LA | — | 456 | 456 | — | 912 | 10 | 7/31/2013 | 1985 | ||||||||||||||||||||||||
| Burger King |
Tallahassee | FL | — | (14) | 843 | 454 | — | 1,297 | 10 | 7/31/2013 | 1980 | |||||||||||||||||||||||
F-137
Table of Contents
| Initial Costs | Costs Capitalized Subsequent to Acquisition |
Gross Amount Carried at December 31, 2013 (10) (11) |
||||||||||||||||||||||||||||||||
| Property |
City |
State |
Encumbrances at December 31, 2013 |
Land | Buildings, Fixtures and Improvements |
Accumulated Depreciation (12)(13) |
Date Acquired |
Date of Construction | ||||||||||||||||||||||||||
| Burger King |
Palatine | IL | — | 352 | 426 | — | 778 | 12 | 6/27/2013 | 1995 | ||||||||||||||||||||||||
| Burger King |
Largo | FL | — | 683 | 412 | — | 1,095 | 11 | 6/27/2013 | 1984 | ||||||||||||||||||||||||
| Burger King |
Harrisburg | PA | — | (14) | 619 | 412 | — | 1,031 | 9 | 7/31/2013 | 1985 | |||||||||||||||||||||||
| Burger King |
Belding | MI | — | 221 | 411 | — | 632 | 9 | 7/31/2013 | 1994 | ||||||||||||||||||||||||
| Burger King |
Niceville | FL | — | (14) | 598 | 399 | — | 997 | 9 | 7/31/2013 | 1994 | |||||||||||||||||||||||
| Burger King |
Metairie | LA | — | 728 | 392 | — | 1,120 | 9 | 7/31/2013 | 1992 | ||||||||||||||||||||||||
| Burger King |
Hamburg | NY | — | (14) | 403 | 383 | — | 786 | 11 | 6/27/2013 | 1974 | |||||||||||||||||||||||
| Burger King |
Valdosta | GA | — | (14) | 564 | 376 | — | 940 | 8 | 7/31/2013 | 1987 | |||||||||||||||||||||||
| Burger King |
Cedar Lake | IN | — | 327 | 374 | — | 701 | 10 | 6/27/2013 | 1986 | ||||||||||||||||||||||||
| Burger King |
Jenison | MI | — | 233 | 349 | — | 582 | 8 | 7/31/2013 | 1994 | ||||||||||||||||||||||||
| Burger King |
Detroit | MI | — | (14) | 614 | 331 | — | 945 | 7 | 7/31/2013 | 1988 | |||||||||||||||||||||||
| Burger King |
Apex | NC | — | 366 | 324 | — | 690 | 9 | 6/27/2013 | 1992 | ||||||||||||||||||||||||
| Burger King |
East Greenbush | NY | — | 404 | 269 | — | 673 | 7 | 6/27/2013 | 1980 | ||||||||||||||||||||||||
| Burger King |
Dunn | NC | — | 328 | 268 | — | 596 | 6 | 7/31/2013 | 1989 | ||||||||||||||||||||||||
| Burnie Bistro’s |
Clearwater | FL | — | (14) | 25 | 14 | — | 39 | — | 7/31/2013 | 1987 | |||||||||||||||||||||||
| Captain D’s |
Florence | KY | — | (14) | 248 | 325 | — | 573 | 9 | 6/27/2013 | 1981 | |||||||||||||||||||||||
| Captain D’s |
Duncanville | TX | — | 295 | 246 | — | 541 | 7 | 6/27/2013 | 1982 | ||||||||||||||||||||||||
| Carl’s Jr. |
Purcell | OK | — | (14) | 77 | 513 | — | 590 | 14 | 6/27/2013 | 1980 | |||||||||||||||||||||||
| Casa Del Rio |
Wadsworth | OH | — | 130 | 389 | — | 519 | 10 | 7/31/2013 | 1971 | ||||||||||||||||||||||||
| Cashland |
Celina | OH | — | 108 | 132 | — | 240 | 3 | 7/31/2013 | 1995 | ||||||||||||||||||||||||
| Castle Dental |
Murfreesboro | TN | — | (14) | 256 | 256 | — | 512 | 6 | 7/31/2013 | 1996 | |||||||||||||||||||||||
| Chappala Mexican Restaurant |
Nampa | ID | — | 473 | 692 | — | 1,165 | 20 | 6/27/2013 | 1998 | ||||||||||||||||||||||||
| Checkers |
Jacksonville | FL | — | (14) | 731 | 1,096 | — | 1,827 | 24 | 7/31/2013 | 1993 | |||||||||||||||||||||||
| Checkers |
Tampa | FL | — | 736 | — | — | 736 | — | 6/27/2013 | N/A | ||||||||||||||||||||||||
| Checkers |
Miami | FL | — | 621 | — | — | 621 | — | 7/31/2013 | 1993 | ||||||||||||||||||||||||
| Checkers |
Orlando | FL | — | 1,033 | — | — | 1,033 | — | 7/31/2013 | N/A | ||||||||||||||||||||||||
| Checkers |
Winter Springs | FL | — | 734 | — | — | 734 | — | 7/31/2013 | N/A | ||||||||||||||||||||||||
| Cheddar’s Casual Cafe’ |
Brandon | FL | — | (14) | 860 | 3,071 | — | 3,931 | 88 | 6/27/2013 | 2003 | |||||||||||||||||||||||
| Cheddar’s Casual Cafe’ |
Lubbock | TX | — | (14) | 1,053 | 2,345 | — | 3,398 | 67 | 6/27/2013 | 1997 | |||||||||||||||||||||||
| Cheddar’s Casual Cafe’ |
Bolingbrook | IL | — | (14) | 1,344 | 1,760 | — | 3,104 | 50 | 6/27/2013 | 1997 | |||||||||||||||||||||||
| Chevys Fresh Mex |
Miami | FL | — | (14) | 1,455 | 783 | — | 2,238 | 19 | 7/31/2013 | 1995 | |||||||||||||||||||||||
| Chicago Steak & Lemonade |
Louisville | KY | — | 195 | 18 | — | 213 | 1 | 6/27/2013 | 1980 | ||||||||||||||||||||||||
| Chicago Style Gyros |
Nashville | TN | — | 201 | 134 | — | 335 | 3 | 7/31/2013 | 1986 | ||||||||||||||||||||||||
| Chili’s |
East Peoria | IL | — | (14) | 1,023 | 2,347 | — | 3,370 | 67 | 6/27/2013 | 2003 | |||||||||||||||||||||||
| Chili’s |
Amarillo | TX | — | 811 | 1,893 | — | 2,704 | 47 | 7/31/2013 | 1984 | ||||||||||||||||||||||||
| China Buffet |
Alvin | TX | — | (14) | 110 | 299 | — | 409 | 9 | 6/27/2013 | 1982 | |||||||||||||||||||||||
| China Buffet |
Angleton | TX | — | (14) | 127 | 272 | — | 399 | 8 | 6/27/2013 | 1982 | |||||||||||||||||||||||
| China King |
Belen | NM | — | (14) | 94 | 94 | — | 188 | 3 | 6/27/2013 | 1980 | |||||||||||||||||||||||
| China One |
Bay City | TX | — | (14) | 229 | 124 | — | 353 | 3 | 7/31/2013 | 1985 | |||||||||||||||||||||||
| Church’s Chicken |
Bay Minette | AL | — | (14) | 134 | 757 | — | 891 | 17 | 7/31/2013 | 2003 | |||||||||||||||||||||||
| Church’s Chicken |
Jackson | AL | — | (14) | 127 | 719 | — | 846 | 16 | 7/31/2013 | 1982 | |||||||||||||||||||||||
| Church’s Chicken |
Augusta | GA | — | (14) | 256 | 597 | — | 853 | 13 | 7/31/2013 | 1976 | |||||||||||||||||||||||
F-138
Table of Contents
| Initial Costs | Costs Capitalized Subsequent to Acquisition |
Gross Amount Carried at December 31, 2013 (10) (11) |
||||||||||||||||||||||||||||||||
| Property |
City |
State |
Encumbrances at December 31, 2013 |
Land | Buildings, Fixtures and Improvements |
Accumulated Depreciation (12)(13) |
Date Acquired |
Date of Construction | ||||||||||||||||||||||||||
| Church’s Chicken |
Atmore | AL | — | (14) | 144 | 574 | — | 718 | 13 | 7/31/2013 | 1976 | |||||||||||||||||||||||
| Church’s Chicken |
Augusta | GA | — | (14) | 178 | 533 | — | 711 | 12 | 7/31/2013 | 1981 | |||||||||||||||||||||||
| Church’s Chicken |
Spartanburg | SC | — | (14) | 350 | 525 | — | 875 | 12 | 7/31/2013 | 1972 | |||||||||||||||||||||||
| Church’s Chicken |
Flomaton | AL | — | (14) | 173 | 518 | — | 691 | 11 | 7/31/2013 | 1981 | |||||||||||||||||||||||
| Church’s Chicken |
Greenville | SC | — | (14) | 325 | 487 | — | 812 | 11 | 7/31/2013 | 1984 | |||||||||||||||||||||||
| Church’s Chicken |
Greenville | SC | — | (14) | 254 | 472 | — | 726 | 10 | 7/31/2013 | 2009 | |||||||||||||||||||||||
| Church’s Chicken |
Augusta | GA | — | (14) | 196 | 458 | — | 654 | 10 | 7/31/2013 | 1984 | |||||||||||||||||||||||
| Church’s Chicken |
Columbia | SC | — | (14) | 437 | 437 | — | 874 | 10 | 7/31/2013 | 1978 | |||||||||||||||||||||||
| Church’s Chicken |
Columbia | SC | — | (14) | 231 | 428 | — | 659 | 9 | 7/31/2013 | 1977 | |||||||||||||||||||||||
| Church’s Chicken |
Augusta | GA | — | (14) | 178 | 414 | — | 592 | 9 | 7/31/2013 | 1978 | |||||||||||||||||||||||
| Church’s Chicken |
North Charleston | SC | — | (14) | 407 | 407 | — | 814 | 9 | 7/31/2013 | 1977 | |||||||||||||||||||||||
| Church’s Chicken |
Orlando | FL | — | (14) | 254 | 380 | — | 634 | 8 | 7/31/2013 | 1984 | |||||||||||||||||||||||
| Church’s Chicken |
Greenwood | SC | — | (14) | 188 | 349 | — | 537 | 8 | 7/31/2013 | 2002 | |||||||||||||||||||||||
| Church’s Chicken |
Charleston | SC | — | (14) | 421 | 344 | — | 765 | 8 | 7/31/2013 | 1973 | |||||||||||||||||||||||
| Church’s Chicken |
Greenville | SC | — | (14) | 280 | 342 | — | 622 | 8 | 7/31/2013 | 1970 | |||||||||||||||||||||||
| Church’s Chicken |
North Charleston | SC | — | (14) | 302 | 302 | — | 604 | 7 | 7/31/2013 | 1976 | |||||||||||||||||||||||
| Church’s Chicken |
Anderson | SC | — | (14) | 647 | 277 | — | 924 | 6 | 7/31/2013 | 1981 | |||||||||||||||||||||||
| Church’s Chicken |
Spartanburg | SC | — | (14) | 411 | 274 | — | 685 | 6 | 7/31/2013 | 1978 | |||||||||||||||||||||||
| Church’s Chicken |
Orangeburg | SC | — | (14) | 407 | 271 | — | 678 | 6 | 7/31/2013 | 1985 | |||||||||||||||||||||||
| Church’s Chicken |
Nashville | TN | — | (14) | 186 | 186 | — | 372 | 4 | 7/31/2013 | 1980 | |||||||||||||||||||||||
| Church’s Chicken |
Charleston | SC | — | (14) | 500 | 167 | — | 667 | 4 | 7/31/2013 | 1979 | |||||||||||||||||||||||
| Church’s Chicken |
Bowling Green | KY | — | (14) | 100 | 156 | — | 256 | 4 | 6/27/2013 | 1984 | |||||||||||||||||||||||
| Citizens Bank |
Milton | MA | — | (14) | 619 | 2,476 | — | 3,095 | 144 | 12/14/2012 | 1968 | |||||||||||||||||||||||
| Citizens Bank |
Pittsburgh | PA | — | (14) | 268 | 2,413 | — | 2,681 | 140 | 12/14/2012 | 1970 | |||||||||||||||||||||||
| Citizens Bank |
Orland Hills | IL | — | (14) | 1,253 | 2,327 | — | 3,580 | 135 | 12/14/2012 | 1988 | |||||||||||||||||||||||
| Citizens Bank |
Pittsburgh | PA | — | (14) | 206 | 1,852 | — | 2,058 | 107 | 12/14/2012 | 1923 | |||||||||||||||||||||||
| Citizens Bank |
Chicago Heights | IL | — | (14) | 182 | 1,637 | — | 1,819 | 80 | 1/24/2013 | 1996 | |||||||||||||||||||||||
| Citizens Bank |
Reading | PA | — | (14) | 269 | 1,524 | — | 1,793 | 61 | 4/12/2013 | 1919 | |||||||||||||||||||||||
| Citizens Bank |
Carnegie | PA | — | (14) | 73 | 1,396 | — | 1,469 | 81 | 12/14/2012 | 1920 | |||||||||||||||||||||||
| Citizens Bank |
Cranston | RI | — | (14) | 411 | 1,234 | — | 1,645 | 72 | 12/14/2012 | 1967 | |||||||||||||||||||||||
| Citizens Bank |
Pittsburgh | PA | — | (14) | 516 | 1,204 | — | 1,720 | 70 | 12/14/2012 | 1970 | |||||||||||||||||||||||
| Citizens Bank |
Butler | PA | — | (14) | 286 | 1,144 | — | 1,430 | 66 | 12/14/2012 | 1966 | |||||||||||||||||||||||
| Citizens Bank |
Pittsburgh | PA | — | (14) | 196 | 1,110 | — | 1,306 | 64 | 12/14/2012 | 1980 | |||||||||||||||||||||||
| Citizens Bank |
Philadelphia | PA | — | (14) | 266 | 1,065 | — | 1,331 | 62 | 12/14/2012 | 1971 | |||||||||||||||||||||||
| Citizens Bank |
Kittanning | PA | — | (14) | 56 | 1,060 | — | 1,116 | 62 | 12/14/2012 | 1889 | |||||||||||||||||||||||
| Citizens Bank |
Pittsburgh | PA | — | (14) | 255 | 1,019 | — | 1,274 | 59 | 12/14/2012 | 1970 | |||||||||||||||||||||||
| Citizens Bank |
Troy | MI | — | (14) | 312 | 935 | — | 1,247 | 54 | 12/14/2012 | 1980 | |||||||||||||||||||||||
| Citizens Bank |
Warrendale | PA | — | (14) | 611 | 916 | — | 1,527 | 53 | 12/14/2012 | 1981 | |||||||||||||||||||||||
| Citizens Bank |
Providence | RI | — | (14) | 300 | 899 | — | 1,199 | 52 | 12/14/2012 | 1960 | |||||||||||||||||||||||
| Citizens Bank |
N. Providence | RI | — | (14) | 223 | 892 | — | 1,115 | 52 | 12/14/2012 | 1971 | |||||||||||||||||||||||
| Citizens Bank |
Pitcairn | PA | — | (14) | 46 | 867 | — | 913 | 50 | 12/14/2012 | 1985 | |||||||||||||||||||||||
| Citizens Bank |
Greensburg | PA | — | (14) | 45 | 861 | — | 906 | 50 | 12/14/2012 | 1957 | |||||||||||||||||||||||
| Citizens Bank |
Westchester | IL | — | (14) | 366 | 853 | — | 1,219 | 38 | 2/22/2013 | 1986 | |||||||||||||||||||||||
139
Table of Contents
| Initial Costs | Costs Capitalized Subsequent to Acquisition |
Gross Amount Carried at December 31, 2013 (10) (11) |
||||||||||||||||||||||||||||||||
| Property |
City |
State |
Encumbrances at December 31, 2013 |
Land | Buildings, Fixtures and Improvements |
Accumulated Depreciation (12)(13) |
Date Acquired |
Date of Construction | ||||||||||||||||||||||||||
| Citizens Bank |
Ford City | PA | — | (14) | 89 | 802 | — | 891 | 47 | 12/14/2012 | 1975 | |||||||||||||||||||||||
| Citizens Bank |
Reading | PA | — | (14) | 267 | 802 | — | 1,069 | 47 | 12/14/2012 | 1970 | |||||||||||||||||||||||
| Citizens Bank |
Aliquippa | PA | — | (14) | 138 | 782 | — | 920 | 45 | 12/14/2012 | 1953 | |||||||||||||||||||||||
| Citizens Bank |
Wexford | PA | — | (14) | 180 | 719 | — | 899 | 42 | 12/14/2012 | 1975 | |||||||||||||||||||||||
| Citizens Bank |
Farmington | MI | — | (14) | 303 | 707 | — | 1,010 | 41 | 12/14/2012 | 1962 | |||||||||||||||||||||||
| Citizens Bank |
East Greenwich | RI | — | (14) | 227 | 680 | — | 907 | 39 | 12/14/2012 | 1959 | |||||||||||||||||||||||
| Citizens Bank |
Rumford | RI | — | (14) | 352 | 654 | — | 1,006 | 38 | 12/14/2012 | 1977 | |||||||||||||||||||||||
| Citizens Bank |
Highspire | PA | — | (14) | 216 | 649 | — | 865 | 38 | 12/14/2012 | 1974 | |||||||||||||||||||||||
| Citizens Bank |
Camp Hill | PA | — | (14) | 430 | 645 | — | 1,075 | 37 | 12/14/2012 | 1971 | |||||||||||||||||||||||
| Citizens Bank |
Parma Heights | OH | — | (14) | 426 | 638 | — | 1,064 | 37 | 12/14/2012 | 1957 | |||||||||||||||||||||||
| Citizens Bank |
Oil City | PA | — | (14) | 110 | 623 | — | 733 | 36 | 12/14/2012 | 1965 | |||||||||||||||||||||||
| City Buffet |
Alexander City | AL | — | (14) | 292 | 301 | — | 593 | 9 | 6/27/2013 | 1988 | |||||||||||||||||||||||
| Cowboy’s Express |
Monticello | AR | — | (14) | 43 | 36 | — | 79 | 1 | 6/27/2013 | 1982 | |||||||||||||||||||||||
| Cuco Mexican |
Circleville | OH | — | 149 | 164 | — | 313 | 5 | 6/27/2013 | 1986 | ||||||||||||||||||||||||
| CVS |
Hoover | AL | — | (14) | 1,239 | 2,890 | — | 4,129 | 101 | 5/31/2013 | 2003 | |||||||||||||||||||||||
| CVS |
Columbia | SC | — | — | 2,811 | — | 2,811 | 84 | 7/2/2013 | 2006 | ||||||||||||||||||||||||
| CVS |
New Castle | PA | 1,562 | 412 | 2,337 | — | 2,749 | 164 | 10/31/2012 | 1999 | ||||||||||||||||||||||||
| CVS |
Hardy | VA | — | (14) | 686 | 2,059 | — | 2,745 | 72 | 5/16/2013 | 2005 | |||||||||||||||||||||||
| CVS |
Towanda | PA | — | (14) | — | 877 | — | 877 | 35 | 4/24/2013 | 2003 | |||||||||||||||||||||||
| Dairy Queen |
Woodville | TX | — | (14) | 98 | 65 | — | 163 | 1 | 7/31/2013 | 1980 | |||||||||||||||||||||||
| DaVita Dialysis |
Hiawatha | KS | — | (14) | 69 | 1,302 | — | 1,371 | 36 | 5/30/2013 | 2012 | |||||||||||||||||||||||
| DaVita Dialysis |
Palatka | FL | — | 207 | 1,173 | — | 1,380 | 32 | 6/5/2013 | 2013 | ||||||||||||||||||||||||
| DaVita Dialysis |
Hartsville | SC | — | (14) | 126 | 1,136 | — | 1,262 | 31 | 5/30/2013 | 2013 | |||||||||||||||||||||||
| DaVita Dialysis |
Cincinnati | OH | — | (14) | 219 | 878 | — | 1,097 | 31 | 3/28/2013 | 2008 | |||||||||||||||||||||||
| DaVita Dialysis |
Georgetown | OH | — | (14) | 125 | 706 | — | 831 | 25 | 3/28/2013 | 2009 | |||||||||||||||||||||||
| Denny’s |
Tempe | AZ | — | 1,960 | 1,273 | (2,610 | ) | 623 | 36 | 6/27/2013 | 1980 | |||||||||||||||||||||||
| Denny’s |
Phoenix | AZ | — | 825 | 1,237 | — | 2,062 | 31 | 7/31/2013 | 2005 | ||||||||||||||||||||||||
| Denny’s |
Idaho Falls | ID | — | 538 | 1,183 | (1,093 | ) | 628 | 34 | 6/27/2013 | 1995 | |||||||||||||||||||||||
| Denny’s |
Mesa | AZ | — | 1,089 | 891 | — | 1,980 | 22 | 7/31/2013 | 1994 | ||||||||||||||||||||||||
| Denny’s |
Tempe | AZ | — | 1,567 | 844 | — | 2,411 | 21 | 7/31/2013 | 1994 | ||||||||||||||||||||||||
| Denny’s |
Scottsdale | AZ | — | (14) | 736 | 491 | — | 1,227 | 12 | 7/31/2013 | 1985 | |||||||||||||||||||||||
| Denny’s |
Peoria | AZ | — | 310 | 457 | — | 767 | 13 | 6/27/2013 | 1987 | ||||||||||||||||||||||||
| Denny’s |
Marion | OH | — | (14) | 115 | 390 | — | 505 | 11 | 6/27/2013 | 1989 | |||||||||||||||||||||||
| Denny’s |
Spartanburg | SC | — | 656 | 353 | — | 1,009 | 9 | 7/31/2013 | 1991 | ||||||||||||||||||||||||
| Denny’s |
Henrietta | NY | — | 361 | 241 | — | 602 | 6 | 7/31/2013 | 1970 | ||||||||||||||||||||||||
| Denny’s |
Bloomington | MN | — | 1,184 | — | — | 1,184 | — | 7/31/2013 | N/A | ||||||||||||||||||||||||
| Dollar General |
Holly Hill | SC | — | (14) | 259 | 2,333 | — | 2,592 | 109 | 3/6/2013 | 2013 | |||||||||||||||||||||||
| Dollar General |
Presidio | TX | — | (14) | 72 | 1,370 | — | 1,442 | 58 | 3/28/2013 | 2013 | |||||||||||||||||||||||
| Dollar General |
Savanna | IL | — | (14) | 273 | 1,093 | — | 1,366 | 61 | 12/31/2012 | 2012 | |||||||||||||||||||||||
| Dollar General |
Chelyan | WV | — | 273 | 1,092 | — | 1,365 | 15 | 9/27/2013 | 2013 | ||||||||||||||||||||||||
| Dollar General |
Adams | MA | — | 254 | 1,016 | — | 1,270 | 14 | 10/10/2013 | 2012 | ||||||||||||||||||||||||
| Dollar General |
Modena | NY | — | 249 | 996 | — | 1,245 | 14 | 10/10/2013 | 2012 | ||||||||||||||||||||||||
| Dollar General |
Mount Morris | MI | — | (14) | 110 | 988 | — | 1,098 | 46 | 2/27/2013 | 2012 | |||||||||||||||||||||||
| Dollar General |
Eldon | MO | — | (14) | 52 | 986 | — | 1,038 | 51 | 2/14/2013 | 2013 | |||||||||||||||||||||||
F-140
Table of Contents
| Initial Costs | Costs Capitalized Subsequent to Acquisition |
Gross Amount Carried at December 31, 2013 (10) (11) |
||||||||||||||||||||||||||||||||
| Property |
City |
State |
Encumbrances at December 31, 2013 |
Land | Buildings, Fixtures and Improvements |
Accumulated Depreciation (12)(13) |
Date Acquired |
Date of Construction | ||||||||||||||||||||||||||
| Dollar General |
Malden | MO | — | 108 | 974 | — | 1,082 | 23 | 8/2/2013 | 2013 | ||||||||||||||||||||||||
| Dollar General |
Lytle | TX | — | 243 | 971 | — | 1,214 | 9 | 10/30/2013 | 2013 | ||||||||||||||||||||||||
| Dollar General |
San Antonio | TX | — | (14) | 239 | 956 | — | 1,195 | 45 | 3/11/2013 | 2013 | |||||||||||||||||||||||
| Dollar General |
San Juan | TX | — | 169 | 956 | — | 1,125 | 9 | 11/15/2013 | 2013 | ||||||||||||||||||||||||
| Dollar General |
Henry | IL | — | (14) | 104 | 934 | — | 1,038 | 31 | 5/23/2013 | 2013 | |||||||||||||||||||||||
| Dollar General |
South Pekin | IL | — | 104 | 933 | — | 1,037 | 22 | 8/14/2013 | 2013 | ||||||||||||||||||||||||
| Dollar General |
San Antonio | TX | — | (14) | 163 | 926 | — | 1,089 | 48 | 2/14/2013 | 2012 | |||||||||||||||||||||||
| Dollar General |
Laurie | MO | — | 102 | 918 | — | 1,020 | 9 | 11/15/2013 | 2013 | ||||||||||||||||||||||||
| Dollar General |
Milaca | MN | — | 102 | 916 | — | 1,018 | 13 | 9/24/2013 | 2013 | ||||||||||||||||||||||||
| Dollar General |
Edinburg | TX | — | 102 | 914 | — | 1,016 | 21 | 7/16/2013 | 2013 | ||||||||||||||||||||||||
| Dollar General |
De Soto | MO | — | (14) | 101 | 912 | — | 1,013 | 47 | 2/14/2013 | 2013 | |||||||||||||||||||||||
| Dollar General |
Shelbina | MO | — | (14) | 101 | 911 | — | 1,012 | 30 | 5/22/2013 | 2013 | |||||||||||||||||||||||
| Dollar General |
Kyle | TX | — | 101 | 910 | — | 1,011 | 4 | 12/6/2013 | 2013 | ||||||||||||||||||||||||
| Dollar General |
Eagle Grove | IA | — | 100 | 902 | — | 1,002 | 25 | 7/9/2013 | 2013 | ||||||||||||||||||||||||
| Dollar General |
Farmington | NM | — | 224 | 898 | — | 1,122 | 25 | 7/11/2013 | 2013 | ||||||||||||||||||||||||
| Dollar General |
Mission | TX | — | (14) | 158 | 894 | — | 1,052 | 38 | 3/27/2013 | 2013 | |||||||||||||||||||||||
| Dollar General |
Adkins | TX | — | (14) | 157 | 889 | — | 1,046 | 50 | 12/31/2012 | 2012 | |||||||||||||||||||||||
| Dollar General |
New Braunfels | TX | — | 156 | 883 | — | 1,039 | 8 | 10/30/2013 | 2013 | ||||||||||||||||||||||||
| Dollar General |
Aurora | MO | — | (14) | 98 | 881 | — | 979 | 41 | 2/28/2013 | 2013 | |||||||||||||||||||||||
| Dollar General |
Millwood | WV | — | 98 | 881 | — | 979 | 25 | 7/2/2013 | 2013 | ||||||||||||||||||||||||
| Dollar General |
San Antonio | TX | — | 220 | 880 | — | 1,100 | 25 | 7/9/2013 | 2013 | ||||||||||||||||||||||||
| Dollar General |
Pequot Lakes | MN | — | 155 | 880 | — | 1,035 | 16 | 8/22/2013 | 2013 | ||||||||||||||||||||||||
| Dollar General |
Amarillo | TX | — | 97 | 877 | — | 974 | 21 | 8/13/2013 | 2013 | ||||||||||||||||||||||||
| Dollar General |
Mahomet | IL | — | 292 | 877 | — | 1,169 | 16 | 8/22/2013 | 2013 | ||||||||||||||||||||||||
| Dollar General |
Manistique | MI | — | (14) | 155 | 876 | — | 1,031 | 41 | 2/27/2013 | 2012 | |||||||||||||||||||||||
| Dollar General |
West Union | SC | — | 46 | 868 | — | 914 | 24 | 7/3/2013 | 2011 | ||||||||||||||||||||||||
| Dollar General |
Fairbury | IL | — | 96 | 867 | — | 963 | 28 | 6/7/2013 | 2013 | ||||||||||||||||||||||||
| Dollar General |
Amarillo | TX | — | 153 | 866 | — | 1,019 | 20 | 8/2/2013 | 2013 | ||||||||||||||||||||||||
| Dollar General |
Cedar Falls | IA | — | 96 | 862 | — | 958 | 16 | 8/28/2013 | 2013 | ||||||||||||||||||||||||
| Dollar General |
Mercedes | TX | — | 215 | 859 | — | 1,074 | 20 | 8/2/2013 | 2013 | ||||||||||||||||||||||||
| Dollar General |
Ganado | TX | — | 95 | 857 | — | 952 | 20 | 8/13/2013 | 2013 | ||||||||||||||||||||||||
| Dollar General |
New Braunfels | TX | — | (14) | 95 | 855 | — | 950 | 44 | 2/14/2013 | 2013 | |||||||||||||||||||||||
| Dollar General |
Manchester | MI | — | (14) | 213 | 853 | — | 1,066 | 40 | 2/27/2013 | 2013 | |||||||||||||||||||||||
| Dollar General |
Guyton | GA | — | (14) | 213 | 852 | — | 1,065 | 28 | 6/3/2013 | 2011 | |||||||||||||||||||||||
| Dollar General |
Annandale | MN | — | 212 | 848 | — | 1,060 | 20 | 8/2/2013 | 2013 | ||||||||||||||||||||||||
| Dollar General |
Staples | MN | — | 150 | 848 | — | 998 | 16 | 9/4/2013 | 2013 | ||||||||||||||||||||||||
| Dollar General |
Lexington | MO | — | 149 | 846 | — | 995 | 16 | 9/13/2013 | 2013 | ||||||||||||||||||||||||
| Dollar General |
Whitesburg | KY | — | (14) | 211 | 845 | — | 1,056 | 28 | 5/30/2013 | 2012 | |||||||||||||||||||||||
| Dollar General |
Lubbock | TX | — | (14) | 148 | 841 | — | 989 | 28 | 5/16/2013 | 2013 | |||||||||||||||||||||||
| Dollar General |
Brookeland | TX | — | 93 | 840 | — | 933 | 20 | 8/15/2013 | 2013 | ||||||||||||||||||||||||
| Dollar General |
Bastrop | LA | — | 148 | 838 | — | 986 | 24 | 7/1/2013 | 2013 | ||||||||||||||||||||||||
| Dollar General |
Rolla | MO | — | 209 | 835 | — | 1,044 | 16 | 8/21/2013 | 2013 | ||||||||||||||||||||||||
| Dollar General |
Lonedell | MO | — | (14) | 208 | 833 | — | 1,041 | 31 | 4/26/2013 | 2013 | |||||||||||||||||||||||
F-141
Table of Contents
| Initial Costs | Costs Capitalized Subsequent to Acquisition |
Gross Amount Carried at December 31, 2013 (10) (11) |
||||||||||||||||||||||||||||||||
| Property |
City |
State |
Encumbrances at December 31, 2013 |
Land | Buildings, Fixtures and Improvements |
Accumulated Depreciation (12)(13) |
Date Acquired |
Date of Construction | ||||||||||||||||||||||||||
| Dollar General |
Boling | TX | — | 92 | 831 | — | 923 | 19 | 8/13/2013 | 2013 | ||||||||||||||||||||||||
| Dollar General |
Avinger | TX | — | 44 | 830 | — | 874 | 19 | 8/8/2013 | 2013 | ||||||||||||||||||||||||
| Dollar General |
Roodhouse | IL | — | (14) | 207 | 829 | — | 1,036 | 47 | 12/31/2012 | 2012 | |||||||||||||||||||||||
| Dollar General |
Lacy Lakeview | TX | — | (14) | 146 | 826 | — | 972 | 50 | 11/16/2012 | 2012 | |||||||||||||||||||||||
| Dollar General |
Elkview | WV | — | 274 | 823 | — | 1,097 | 19 | 8/2/2013 | 2013 | ||||||||||||||||||||||||
| Dollar General |
Weslaco | TX | — | 205 | 822 | — | 1,027 | 8 | 10/16/2013 | 2013 | ||||||||||||||||||||||||
| Dollar General |
Buchanan Dam | TX | 562 | 145 | 820 | — | 965 | 58 | 9/28/2012 | 2012 | ||||||||||||||||||||||||
| Dollar General |
McMechen | WV | — | (14) | 91 | 819 | — | 910 | 46 | 1/9/2013 | 2012 | |||||||||||||||||||||||
| Dollar General |
Sand Springs | OK | — | 43 | 819 | — | 862 | 15 | 9/3/2013 | 2013 | ||||||||||||||||||||||||
| Dollar General |
Joplin | MO | — | 144 | 816 | — | 960 | 8 | 11/12/2013 | 2013 | ||||||||||||||||||||||||
| Dollar General |
San Antonio | TX | — | (14) | 271 | 812 | — | 1,083 | 27 | 5/23/2013 | 2013 | |||||||||||||||||||||||
| Dollar General |
Skidmore | TX | — | (14) | 90 | 811 | — | 901 | 42 | 2/14/2013 | 2013 | |||||||||||||||||||||||
| Dollar General |
Savannah | MO | — | 270 | 811 | — | 1,081 | 15 | 8/23/2013 | 2013 | ||||||||||||||||||||||||
| Dollar General |
Sand Springs | OK | — | 143 | 811 | — | 954 | 15 | 9/3/2013 | 2013 | ||||||||||||||||||||||||
| Dollar General |
Beeville | TX | — | (14) | 90 | 810 | — | 900 | 49 | 11/19/2012 | 2012 | |||||||||||||||||||||||
| Dollar General |
Roseau | MN | — | 143 | 808 | — | 951 | 8 | 10/30/2013 | 2013 | ||||||||||||||||||||||||
| Dollar General |
San Benito | TX | — | 202 | 807 | — | 1,009 | 15 | 8/23/2013 | 2013 | ||||||||||||||||||||||||
| Dollar General |
Belton | TX | — | (14) | 89 | 804 | — | 893 | 38 | 2/28/2013 | 2013 | |||||||||||||||||||||||
| Dollar General |
Hawley | MN | — | 89 | 803 | — | 892 | 8 | 10/16/2013 | 2013 | ||||||||||||||||||||||||
| Dollar General |
East Bernstadt | KY | — | (14) | 141 | 799 | — | 940 | 26 | 5/30/2013 | 2012 | |||||||||||||||||||||||
| Dollar General |
Lubbock | TX | — | 199 | 796 | — | 995 | 15 | 8/28/2013 | 2013 | ||||||||||||||||||||||||
| Dollar General |
Wakefield | MI | — | (14) | 88 | 794 | — | 882 | 45 | 12/19/2012 | 2012 | |||||||||||||||||||||||
| Dollar General |
Romulus | MI | — | (14) | 199 | 794 | — | 993 | 37 | 2/27/2013 | 2011 | |||||||||||||||||||||||
| Dollar General |
Amarillo | TX | — | 198 | 794 | — | 992 | 22 | 7/11/2013 | 2013 | ||||||||||||||||||||||||
| Dollar General |
Sand Springs | OK | — | 198 | 791 | — | 989 | 15 | 9/3/2013 | 2012 | ||||||||||||||||||||||||
| Dollar General |
Billings | MO | — | 139 | 790 | — | 929 | 7 | 10/17/2013 | 2013 | ||||||||||||||||||||||||
| Dollar General |
Caulfield | MO | — | (14) | 139 | 789 | — | 928 | 44 | 12/31/2012 | 2012 | |||||||||||||||||||||||
| Dollar General |
DeSoto | IL | — | (14) | 138 | 784 | — | 922 | 33 | 3/26/2013 | 2013 | |||||||||||||||||||||||
| Dollar General |
Powhatan Point | WV | — | 138 | 784 | — | 922 | 22 | 7/2/2013 | 2013 | ||||||||||||||||||||||||
| Dollar General |
Cowen | WV | — | (14) | 196 | 783 | — | 979 | 40 | 1/16/2013 | 2012 | |||||||||||||||||||||||
| Dollar General |
Camden | MI | — | (14) | 138 | 781 | — | 919 | 37 | 2/27/2013 | 2013 | |||||||||||||||||||||||
| Dollar General |
Berea | KY | — | (14) | 138 | 781 | — | 919 | 26 | 5/30/2013 | 2012 | |||||||||||||||||||||||
| Dollar General |
Moody | TX | — | 41 | 781 | — | 822 | 26 | 6/11/2013 | 2013 | ||||||||||||||||||||||||
| Dollar General |
Doolittle | MO | — | 137 | 778 | — | 915 | 18 | 8/2/2013 | 2013 | ||||||||||||||||||||||||
| Dollar General |
San Antonio | TX | — | 333 | 776 | — | 1,109 | 18 | 8/13/2013 | 2013 | ||||||||||||||||||||||||
| Dollar General |
Eubank | KY | — | (14) | 137 | 775 | — | 912 | 25 | 5/30/2013 | 2013 | |||||||||||||||||||||||
| Dollar General |
Center Point | IA | — | (14) | 136 | 772 | — | 908 | 43 | 12/31/2012 | 2012 | |||||||||||||||||||||||
| Dollar General |
Texarkana | TX | — | 136 | 772 | — | 908 | 7 | 10/25/2013 | 2013 | ||||||||||||||||||||||||
| Dollar General |
Coldiron | KY | — | (14) | 187 | 747 | — | 934 | 24 | 5/30/2013 | 2013 | |||||||||||||||||||||||
| Dollar General |
Diana | TX | — | 186 | 743 | — | 929 | 14 | 8/27/2013 | 2013 | ||||||||||||||||||||||||
| Dollar General |
Rapid City | MI | — | (14) | 179 | 716 | — | 895 | 34 | 2/27/2013 | 2012 | |||||||||||||||||||||||
| Dollar General |
Cedar Creek | TX | — | (14) | 291 | 680 | — | 971 | 41 | 11/16/2012 | 2012 | |||||||||||||||||||||||
| Dragon China Buffet |
Carlsbad | NM | — | (14) | 208 | 104 | — | 312 | 3 | 6/27/2013 | 1995 | |||||||||||||||||||||||
F-142
Table of Contents
| Initial Costs | Costs Capitalized Subsequent to Acquisition |
Gross Amount Carried at December 31, 2013 (10) (11) |
||||||||||||||||||||||||||||||||
| Property |
City |
State |
Encumbrances at December 31, 2013 |
Land | Buildings, Fixtures and Improvements |
Accumulated Depreciation (12)(13) |
Date Acquired |
Date of Construction | ||||||||||||||||||||||||||
| East Supreme Buffet |
Whitehall | PA | — | (14) | 492 | 505 | — | 997 | 14 | 6/27/2013 | 1997 | |||||||||||||||||||||||
| Eegee’s |
Tucson | AZ | — | 357 | 436 | — | 793 | 10 | 7/31/2013 | 1990 | ||||||||||||||||||||||||
| El Chico |
Killeen | TX | — | 534 | 992 | — | 1,526 | 25 | 7/31/2013 | 1993 | ||||||||||||||||||||||||
| El Tapatio Mexican Restaurant |
Page | AZ | — | (14) | 170 | 133 | — | 303 | 4 | 6/27/2013 | 1988 | |||||||||||||||||||||||
| Family Dollar |
Mount Vernon | IL | — | 117 | 1,050 | — | 1,167 | 30 | 7/11/2013 | 2012 | ||||||||||||||||||||||||
| Family Dollar |
Crosby | MN | — | 49 | 928 | — | 977 | 26 | 7/11/2013 | 1985 | ||||||||||||||||||||||||
| Family Dollar |
Toledo | OH | — | 226 | 905 | — | 1,131 | 25 | 7/11/2013 | 1942 | ||||||||||||||||||||||||
| Family Dollar |
Carlin | NV | — | 99 | 895 | — | 994 | 17 | 9/13/2013 | 2012 | ||||||||||||||||||||||||
| Family Dollar |
Cold Springs | NV | — | 217 | 869 | — | 1,086 | 16 | 9/13/2013 | 2013 | ||||||||||||||||||||||||
| Family Dollar |
Des Moines | IA | — | 152 | 863 | — | 1,015 | 16 | 8/30/2013 | 2013 | ||||||||||||||||||||||||
| Family Dollar |
Cincinnatus | NY | — | 287 | 862 | — | 1,149 | — | 12/30/2013 | 2013 | ||||||||||||||||||||||||
| Family Dollar |
Etoile | TX | — | 45 | 850 | — | 895 | 20 | 8/6/2013 | 2013 | ||||||||||||||||||||||||
| Family Dollar |
Mountain View | WY | — | 44 | 838 | — | 882 | 16 | 9/13/2013 | 2013 | ||||||||||||||||||||||||
| Family Dollar |
Markesan | WI | — | 92 | 831 | — | 923 | 4 | 12/12/2013 | 2013 | ||||||||||||||||||||||||
| Family Dollar |
Thorp | WI | — | 90 | 810 | — | 900 | 15 | 8/30/2013 | 2013 | ||||||||||||||||||||||||
| Family Dollar |
Webster | WI | — | 43 | 808 | — | 851 | 23 | 7/11/2013 | 2013 | ||||||||||||||||||||||||
| Family Dollar |
Oakwood | TX | — | 133 | 752 | — | 885 | 4 | 11/20/2013 | 2013 | ||||||||||||||||||||||||
| Family Dollar |
Clarendon | TX | — | 83 | 749 | — | 832 | 11 | 9/17/2013 | 2013 | ||||||||||||||||||||||||
| Family Dollar |
Gretna | VA | — | 131 | 744 | — | 875 | 21 | 7/2/2013 | 2012 | ||||||||||||||||||||||||
| Family Dollar |
Somerville | TX | — | (14) | 131 | 743 | — | 874 | 42 | 12/31/2012 | 2012 | |||||||||||||||||||||||
| Family Dollar |
Lovelady | TX | — | (14) | 82 | 740 | — | 822 | 31 | 3/27/2013 | 2012 | |||||||||||||||||||||||
| Family Dollar |
Birch Run | MI | — | 81 | 729 | — | 810 | 20 | 7/11/2013 | 1950 | ||||||||||||||||||||||||
| Family Dollar |
Hoosick Falls | NY | — | (14) | 181 | 724 | — | 905 | 27 | 4/26/2013 | 2013 | |||||||||||||||||||||||
| Family Dollar |
Marble Hill | MO | — | 38 | 719 | — | 757 | 13 | 8/29/2013 | 2013 | ||||||||||||||||||||||||
| Family Dollar |
Houston | TX | — | (14) | 174 | 696 | — | 870 | 26 | 4/26/2013 | 1985 | |||||||||||||||||||||||
| Family Dollar |
University Park | IL | — | 295 | 688 | — | 983 | 6 | 10/29/2013 | 2013 | ||||||||||||||||||||||||
| Family Dollar |
Centerville | TX | — | 226 | 679 | — | 905 | 13 | 9/10/2013 | 2013 | ||||||||||||||||||||||||
| Family Dollar |
Alderson | WV | — | 166 | 663 | — | 829 | 19 | 7/11/2013 | 2012 | ||||||||||||||||||||||||
| Family Dollar |
Torrington | WY | — | (14) | 72 | 645 | — | 717 | 24 | 5/9/2013 | 2007 | |||||||||||||||||||||||
| Family Dollar |
Tustin | MI | — | (14) | 33 | 633 | — | 666 | 36 | 12/18/2012 | 2012 | |||||||||||||||||||||||
| Family Dollar |
Custer | SD | — | 32 | 617 | — | 649 | 20 | 6/14/2013 | 2006 | ||||||||||||||||||||||||
| Family Dollar |
International Falls | MN | — | 32 | 608 | — | 640 | 9 | 9/30/2013 | 1966 | ||||||||||||||||||||||||
| Family Dollar |
Barryton | MI | — | (14) | 32 | 599 | — | 631 | 34 | 12/18/2012 | 2012 | |||||||||||||||||||||||
| Family Dollar |
Pulaski | IL | — | (14) | 31 | 588 | — | 619 | 33 | 12/31/2012 | 2012 | |||||||||||||||||||||||
| Family Dollar |
Lombard | IL | — | 1,008 | 543 | — | 1,551 | 3 | 12/12/2013 | 2013 | ||||||||||||||||||||||||
| Family Dollar |
Rushville | NE | — | (14) | 125 | 499 | — | 624 | 19 | 4/26/2013 | 2007 | |||||||||||||||||||||||
| Famous Dave’s |
Eden Prairie | MN | — | (14) | 824 | 549 | — | 1,373 | 14 | 7/31/2013 | 1995 | |||||||||||||||||||||||
| Fazoli’s |
Carmel | IN | — | (14) | 427 | 522 | — | 949 | 11 | 7/31/2013 | 1986 | |||||||||||||||||||||||
| Fazoli’s |
Appleton | WI | — | 705 | — | — | 705 | — | 7/31/2013 | N/A | ||||||||||||||||||||||||
| FedEx |
Tinicum | PA | — | — | 32,170 | — | 32,170 | 818 | 8/15/2013 | 2013 | ||||||||||||||||||||||||
| FedEx |
Lebanon | OH | — | 1,492 | 8,452 | — | 9,944 | 172 | 8/26/2013 | 2013 | ||||||||||||||||||||||||
| FedEx |
Albany | GA | — | 195 | 3,711 | — | 3,906 | 57 | 10/11/2013 | 2013 | ||||||||||||||||||||||||
| FedEx |
London | KY | — | 350 | 3,151 | — | 3,501 | 48 | 10/11/2013 | 2013 | ||||||||||||||||||||||||
F-143
Table of Contents
| Initial Costs | Costs Capitalized Subsequent to Acquisition |
Gross Amount Carried at December 31, 2013 (10) (11) |
||||||||||||||||||||||||||||||||
| Property |
City |
State |
Encumbrances at December 31, 2013 |
Land | Buildings, Fixtures and Improvements |
Accumulated Depreciation (12)(13) |
Date Acquired |
Date of Construction | ||||||||||||||||||||||||||
| FedEx |
Waterloo | IA | — | (14) | 152 | 2,882 | — | 3,034 | 132 | 3/22/2013 | 2012 | |||||||||||||||||||||||
| FedEx |
Rapid City | SD | — | (14) | 305 | 2,741 | — | 3,046 | 167 | 12/21/2012 | 2012 | |||||||||||||||||||||||
| FedEx |
Ottumwa | IA | — | (14) | 134 | 2,552 | — | 2,686 | 182 | 10/30/2012 | 2012 | |||||||||||||||||||||||
| FedEx |
Independence | KS | — | (14) | 114 | 2,166 | — | 2,280 | 154 | 10/30/2012 | 2012 | |||||||||||||||||||||||
| FedEx |
Des Moines | IA | — | (14) | 733 | 1,361 | — | 2,094 | 55 | 4/18/2013 | 1986 | |||||||||||||||||||||||
| FedEx |
Riverton | WY | — | 431 | 1,006 | — | 1,437 | 10 | 10/23/2013 | 2013 | ||||||||||||||||||||||||
| FedEx |
Homewood | AL | — | 522 | 779 | — | 1,301 | 22 | 6/27/2013 | 2000 | ||||||||||||||||||||||||
| Flip It Bakery & Deli |
Washington | DC | — | (14) | 338 | 84 | — | 422 | 2 | 7/31/2013 | 1985 | |||||||||||||||||||||||
| Fresenius |
Fayetteville | NC | — | 178 | 3,379 | — | 3,557 | 79 | 6/28/2013 | 1999 | ||||||||||||||||||||||||
| Fresenius |
Clinton | NC | — | 139 | 2,647 | — | 2,786 | 62 | 6/28/2013 | 2003 | ||||||||||||||||||||||||
| Fresenius |
Foley | AL | — | 287 | 2,580 | — | 2,867 | 61 | 7/8/2013 | 2009 | ||||||||||||||||||||||||
| Fresenius |
Fayetteville | NC | — | 134 | 2,551 | — | 2,685 | 60 | 6/28/2013 | 2004 | ||||||||||||||||||||||||
| Fresenius |
Mobile | AL | — | 278 | 2,505 | — | 2,783 | 59 | 7/8/2013 | 1987 | ||||||||||||||||||||||||
| Fresenius |
Fayetteville | NC | — | 420 | 2,379 | — | 2,799 | 56 | 6/28/2013 | 1998 | ||||||||||||||||||||||||
| Fresenius |
Lumberton | NC | — | 117 | 2,216 | — | 2,333 | 52 | 6/28/2013 | 1986 | ||||||||||||||||||||||||
| Fresenius |
DeFuniak Springs | FL | — | 115 | 2,180 | — | 2,295 | 51 | 7/8/2013 | 2008 | ||||||||||||||||||||||||
| Fresenius |
Fairhope | AL | — | — | 2,035 | — | 2,035 | 48 | 7/8/2013 | 2006 | ||||||||||||||||||||||||
| Fresenius |
Red Springs | NC | — | 101 | 1,913 | — | 2,014 | 45 | 6/28/2013 | 2000 | ||||||||||||||||||||||||
| Fresenius |
Fairmont | NC | — | 201 | 1,812 | — | 2,013 | 43 | 6/28/2013 | 2002 | ||||||||||||||||||||||||
| Fresenius |
Pembroke | NC | — | 81 | 1,547 | — | 1,628 | 36 | 6/28/2013 | 2009 | ||||||||||||||||||||||||
| Fresenius |
Roseboro | NC | — | 74 | 1,404 | — | 1,478 | 33 | 6/28/2013 | 2011 | ||||||||||||||||||||||||
| Fresenius |
St. Pauls | NC | — | 73 | 1,389 | — | 1,462 | 33 | 6/28/2013 | 2008 | ||||||||||||||||||||||||
| Furr’s |
Garland | TX | — | (14) | 1,529 | 3,715 | — | 5,244 | 107 | 6/27/2013 | 2008 | |||||||||||||||||||||||
| Golden Corral |
Surprise | AZ | — | (14) | 1,258 | 4,068 | — | 5,326 | 117 | 6/27/2013 | 2007 | |||||||||||||||||||||||
| Golden Corral |
Harlingen | TX | — | 832 | 3,037 | — | 3,869 | 87 | 6/27/2013 | 1990 | ||||||||||||||||||||||||
| Golden Corral |
Texarkana | TX | — | 758 | 3,031 | — | 3,789 | 67 | 7/31/2013 | 2001 | ||||||||||||||||||||||||
| Golden Corral |
Gilbert | AZ | — | (14) | 871 | 2,910 | — | 3,781 | 83 | 6/27/2013 | 2006 | |||||||||||||||||||||||
| Golden Corral |
Jacksonville | FL | — | 1,721 | 2,629 | — | 4,350 | 75 | 6/27/2013 | 1999 | ||||||||||||||||||||||||
| Golden Corral |
Houston | TX | — | 1,147 | 2,447 | — | 3,594 | 70 | 6/27/2013 | 1995 | ||||||||||||||||||||||||
| Golden Corral |
Stockbridge | GA | — | 422 | 2,391 | — | 2,813 | 53 | 7/31/2013 | 1987 | ||||||||||||||||||||||||
| Golden Corral |
Brownsville | TX | — | 604 | 2,302 | — | 2,906 | 66 | 6/27/2013 | 1990 | ||||||||||||||||||||||||
| Golden Corral |
Norman | OK | — | 345 | 2,107 | — | 2,452 | 60 | 6/27/2013 | 1994 | ||||||||||||||||||||||||
| Golden Corral |
Zanesville | OH | — | (14) | 487 | 2,030 | — | 2,517 | 58 | 6/27/2013 | 2002 | |||||||||||||||||||||||
| Golden Corral |
Goodyear | AZ | — | (14) | 686 | 1,939 | — | 2,625 | 56 | 6/27/2013 | 2006 | |||||||||||||||||||||||
| Golden Corral |
Baytown | TX | — | (14) | 596 | 1,788 | — | 2,384 | 39 | 7/31/2013 | 1995 | |||||||||||||||||||||||
| Golden Corral |
College Station | TX | — | 1,265 | 1,718 | — | 2,983 | 49 | 6/27/2013 | 1990 | ||||||||||||||||||||||||
| Golden Corral |
Midwest City | OK | — | 1,175 | 1,708 | — | 2,883 | 49 | 6/27/2013 | 1991 | ||||||||||||||||||||||||
| Golden Corral |
Wichita | KS | — | (14) | 560 | 1,306 | — | 1,866 | 29 | 7/31/2013 | 2000 | |||||||||||||||||||||||
| Golden Corral |
Jacksonville | FL | — | 1,033 | 1,084 | — | 2,117 | 31 | 6/27/2013 | 1997 | ||||||||||||||||||||||||
| Golden Corral |
Palatka | FL | — | (14) | 853 | 1,048 | — | 1,901 | 30 | 6/27/2013 | 1997 | |||||||||||||||||||||||
| Golden Corral |
Emporia | KS | — | (14) | 403 | 941 | — | 1,344 | 21 | 7/31/2013 | 1997 | |||||||||||||||||||||||
| Golden Corral |
Roswell | NM | — | 203 | 600 | — | 803 | 17 | 6/27/2013 | 2000 | ||||||||||||||||||||||||
| Golden Corral |
Rock Springs | WY | — | (14) | 354 | 90 | — | 444 | 3 | 6/27/2013 | 1986 | |||||||||||||||||||||||
| Grandy’s |
Abilene | TX | — | 803 | — | — | 803 | — | 6/27/2013 | N/A | ||||||||||||||||||||||||
| Grandy’s |
Arlington | TX | — | 734 | — | — | 734 | — | 6/27/2013 | N/A | ||||||||||||||||||||||||
| Grandy’s |
Carrollton | TX | — | 773 | — | — | 773 | — | 6/27/2013 | N/A | ||||||||||||||||||||||||
| Grandy’s |
Carrollton | TX | — | 847 | — | — | 847 | — | 6/27/2013 | N/A | ||||||||||||||||||||||||
| Grandy’s |
Fort Worth | TX | — | 777 | — | — | 777 | — | 6/27/2013 | N/A | ||||||||||||||||||||||||
| Grandy’s |
Fort Worth | TX | — | 811 | — | — | 811 | — | 6/27/2013 | N/A | ||||||||||||||||||||||||
| Grandy’s |
Garland | TX | — | 623 | — | — | 623 | — | 6/27/2013 | N/A | ||||||||||||||||||||||||
| Grandy’s |
Garland | TX | — | 859 | — | — | 859 | — | 6/27/2013 | N/A | ||||||||||||||||||||||||
| Grandy’s |
Grapevine | TX | — | 618 | — | — | 618 | — | 6/27/2013 | 1988 | ||||||||||||||||||||||||
| Grandy’s |
Irving | TX | — | 871 | — | — | 871 | — | 6/27/2013 | N/A | ||||||||||||||||||||||||
F-144
Table of Contents
| Initial Costs | Costs Capitalized Subsequent to Acquisition |
Gross Amount Carried at December 31, 2013 (10) (11) |
||||||||||||||||||||||||||||||||
| Property |
City |
State |
Encumbrances at December 31, 2013 |
Land | Buildings, Fixtures and Improvements |
Accumulated Depreciation (12)(13) |
Date Acquired |
Date of Construction | ||||||||||||||||||||||||||
| Grandy’s |
Lancaster | TX | — | 780 | — | — | 780 | — | 6/27/2013 | N/A | ||||||||||||||||||||||||
| Grandy’s |
Lubbock | TX | — | 694 | — | — | 694 | — | 6/27/2013 | 1979 | ||||||||||||||||||||||||
| Grandy’s |
Mesquite | TX | — | 871 | — | — | 871 | — | 6/27/2013 | N/A | ||||||||||||||||||||||||
| Grandy’s |
Plano | TX | — | 871 | — | — | 871 | — | 6/27/2013 | N/A | ||||||||||||||||||||||||
| Grandy’s |
Dallas | TX | — | 725 | — | — | 725 | — | 7/31/2013 | N/A | ||||||||||||||||||||||||
| Grandy’s |
Dallas | TX | — | 357 | — | — | 357 | — | 7/31/2013 | N/A | ||||||||||||||||||||||||
| Grandy’s |
Greenville | TX | — | 847 | — | — | 847 | — | 7/31/2013 | N/A | ||||||||||||||||||||||||
| Great Clips |
Lombard | IL | — | 84 | 100 | — | 184 | 3 | 6/27/2013 | 1973 | ||||||||||||||||||||||||
| Hardee’s |
Jacksonville | FL | — | 875 | 583 | — | 1,458 | 13 | 7/31/2013 | 1993 | ||||||||||||||||||||||||
| Hardee’s |
Williston | FL | — | (14) | 395 | 553 | — | 948 | 15 | 6/27/2013 | 1992 | |||||||||||||||||||||||
| Hardee’s |
Canton | GA | — | 488 | 539 | — | 1,027 | 15 | 6/27/2013 | 1983 | ||||||||||||||||||||||||
| Hardee’s |
Bremen | GA | — | (14) | 129 | 518 | — | 647 | 11 | 7/31/2013 | 1980 | |||||||||||||||||||||||
| Hardee’s |
Springfield | TN | — | (14) | 343 | 515 | — | 858 | 11 | 7/31/2013 | 1990 | |||||||||||||||||||||||
| Hardee’s |
Akron | OH | — | (14) | 207 | 483 | — | 690 | 11 | 7/31/2013 | 1990 | |||||||||||||||||||||||
| Hardee’s |
Mount Vernon | IA | — | 320 | 480 | — | 800 | 13 | 6/27/2013 | 1987 | ||||||||||||||||||||||||
| Hardee’s |
Belleville | IL | — | 269 | 467 | — | 736 | 13 | 6/27/2013 | 1987 | ||||||||||||||||||||||||
| Hardee’s |
Seville | OH | — | (14) | 151 | 454 | — | 605 | 10 | 7/31/2013 | 1989 | |||||||||||||||||||||||
| Hardee’s |
Pace | FL | — | (14) | 419 | 435 | — | 854 | 12 | 6/27/2013 | 1991 | |||||||||||||||||||||||
| Hardee’s |
Morristown | TN | — | (14) | 353 | 431 | — | 784 | 9 | 7/31/2013 | 1991 | |||||||||||||||||||||||
| Hardee’s |
Erwin | TN | — | (14) | 346 | 406 | — | 752 | 11 | 6/27/2013 | 1982 | |||||||||||||||||||||||
| Hardee’s |
Jefferson | OH | — | (14) | 242 | 363 | — | 605 | 8 | 7/31/2013 | 1989 | |||||||||||||||||||||||
| Hardee’s |
Sparta | NC | — | (14) | 372 | 346 | — | 718 | 10 | 6/27/2013 | 1983 | |||||||||||||||||||||||
| Hardee’s |
Minerva | OH | — | (14) | 214 | 321 | — | 535 | 7 | 7/31/2013 | 1990 | |||||||||||||||||||||||
| Hardee’s |
Beaver | WV | — | 217 | 318 | — | 535 | 9 | 6/27/2013 | 1983 | ||||||||||||||||||||||||
| Harley Davidson |
Round Rock | TX | — | (14) | 1,688 | 9,563 | — | 11,251 | 237 | 7/31/2013 | 2008 | |||||||||||||||||||||||
| Harvey’s Grill & Bar |
Saginaw | MI | — | (14) | 230 | 647 | — | 877 | 19 | 6/27/2013 | 1997 | |||||||||||||||||||||||
| Hayden’s Grill & Bar |
Canton | MI | — | (14) | 160 | 693 | — | 853 | 20 | 6/27/2013 | 1995 | |||||||||||||||||||||||
| Hooley House Sports Pub & Grille |
Brooklyn | OH | — | (14) | 291 | 321 | — | 612 | 9 | 6/27/2013 | 2000 | |||||||||||||||||||||||
| IHOP |
Bossier City | LA | — | (14) | 541 | 1,342 | — | 1,883 | 38 | 6/27/2013 | 1998 | |||||||||||||||||||||||
| IHOP |
Baytown | TX | — | (14) | 698 | 1,297 | — | 1,995 | 29 | 7/31/2013 | 1998 | |||||||||||||||||||||||
| IHOP |
Auburn | AL | — | (14) | 1,111 | 933 | — | 2,044 | 27 | 6/27/2013 | 1998 | |||||||||||||||||||||||
| IHOP |
Warren | MI | — | (14) | 605 | 830 | — | 1,435 | 24 | 6/27/2013 | 1996 | |||||||||||||||||||||||
| IHOP |
Corpus Christi | TX | — | 1,176 | — | — | 1,176 | — | 7/31/2013 | N/A | ||||||||||||||||||||||||
| Indi’s Fast Food |
Louisville | KY | — | 292 | 157 | — | 449 | 3 | 7/31/2013 | 1972 | ||||||||||||||||||||||||
| Iron Chef Super Buffet |
Kissimmee | FL | — | (14) | 297 | 127 | — | 424 | 3 | 7/31/2013 | 1989 | |||||||||||||||||||||||
| Italian Villa, The |
Grand Island | NY | — | (14) | 38 | 101 | — | 139 | 3 | 6/27/2013 | 1979 | |||||||||||||||||||||||
| Jack in the Box |
Cleburne | TX | — | (14) | 291 | 1,647 | — | 1,938 | 36 | 7/31/2013 | 2000 | |||||||||||||||||||||||
| Jack in the Box |
Walker | LA | — | (14) | 543 | 1,196 | — | 1,739 | 33 | 6/27/2013 | 2001 | |||||||||||||||||||||||
| Jack in the Box |
Sacramento | CA | — | 476 | 1,110 | — | 1,586 | 24 | 7/31/2013 | 1991 | ||||||||||||||||||||||||
| Jack in the Box |
Texas City | TX | — | 454 | 844 | — | 1,298 | 23 | 6/27/2013 | 1991 | ||||||||||||||||||||||||
| Jack in the Box |
Missouri City | TX | — | (14) | 451 | 837 | — | 1,288 | 18 | 7/31/2013 | 1991 | |||||||||||||||||||||||
| Johnny Carino’s |
Houston | TX | — | (14) | 1,328 | 2,656 | — | 3,984 | 76 | 6/27/2013 | 2002 | |||||||||||||||||||||||
| Johnny Carino’s |
Rogers | AR | — | (14) | 997 | 2,540 | — | 3,537 | 73 | 6/27/2013 | 2001 | |||||||||||||||||||||||
| Johnny Carino’s |
Midland | TX | — | (14) | 998 | 2,329 | — | 3,327 | 58 | 7/31/2013 | 2000 | |||||||||||||||||||||||
| Johnny Carino’s |
Grand Prairie | TX | — | (14) | 997 | 2,327 | — | 3,324 | 58 | 7/31/2013 | 2001 | |||||||||||||||||||||||
F-145
Table of Contents
| Initial Costs | Costs Capitalized Subsequent to Acquisition |
Gross Amount Carried at December 31, 2013 (10) (11) |
||||||||||||||||||||||||||||||||
| Property |
City |
State |
Encumbrances at December 31, 2013 |
Land | Buildings, Fixtures and Improvements |
Accumulated Depreciation (12)(13) |
Date Acquired |
Date of Construction | ||||||||||||||||||||||||||
| Johnny Carino’s |
Amarillo | TX | — | (14) | 993 | 2,317 | — | 3,310 | 57 | 7/31/2013 | 2001 | |||||||||||||||||||||||
| Johnny Carino’s |
San Angelo | TX | — | (14) | 769 | 2,306 | — | 3,075 | 57 | 7/31/2013 | 2005 | |||||||||||||||||||||||
| Johnny Carino’s |
Muncie | IN | — | 540 | 2,160 | — | 2,700 | 41 | 8/30/2013 | 2003 | ||||||||||||||||||||||||
| Johnny Carino’s |
Columbus | IN | — | 809 | 1,888 | — | 2,697 | 36 | 8/30/2013 | 2004 | ||||||||||||||||||||||||
| Kentucky Fried Chicken |
Matteson | IL | — | (14) | 399 | 2,259 | — | 2,658 | 50 | 7/31/2013 | 1973 | |||||||||||||||||||||||
| Kentucky Fried Chicken |
Decatur | IL | — | (14) | 276 | 1,619 | — | 1,895 | 45 | 6/27/2013 | 2001 | |||||||||||||||||||||||
| Kentucky Fried Chicken |
Homewood | IL | — | (14) | 660 | 1,541 | — | 2,201 | 34 | 7/31/2013 | 1992 | |||||||||||||||||||||||
| Kentucky Fried Chicken |
Bloomington | IL | — | (14) | 576 | 1,466 | — | 2,042 | 41 | 6/27/2013 | 2004 | |||||||||||||||||||||||
| Kentucky Fried Chicken |
Greenwood | IN | — | (14) | 339 | 1,405 | — | 1,744 | 39 | 6/27/2013 | 1976 | |||||||||||||||||||||||
| Kentucky Fried Chicken |
Hazel Crest | IL | — | (14) | 153 | 1,376 | — | 1,529 | 30 | 7/31/2013 | 1982 | |||||||||||||||||||||||
| Kentucky Fried Chicken |
Franklin | IN | — | (14) | 205 | 1,375 | — | 1,580 | 38 | 6/27/2013 | 1976 | |||||||||||||||||||||||
| Kentucky Fried Chicken |
Lebanon | IN | — | (14) | 337 | 1,348 | — | 1,685 | 30 | 7/31/2013 | 1983 | |||||||||||||||||||||||
| Kentucky Fried Chicken |
Springfield | IL | — | (14) | 212 | 1,203 | — | 1,415 | 26 | 7/31/2013 | 1987 | |||||||||||||||||||||||
| Kentucky Fried Chicken |
Rockford | IL | — | (14) | 201 | 1,142 | — | 1,343 | 25 | 7/31/2013 | 1995 | |||||||||||||||||||||||
| Kentucky Fried Chicken |
New Boston | TX | — | (14) | 125 | 1,127 | — | 1,252 | 25 | 7/31/2013 | 1995 | |||||||||||||||||||||||
| Kentucky Fried Chicken |
Granite City | IL | — | (14) | 102 | 1,083 | — | 1,185 | 30 | 6/27/2013 | 1987 | |||||||||||||||||||||||
| Kentucky Fried Chicken |
Crawfordsville | IN | — | (14) | 159 | 1,068 | — | 1,227 | 30 | 6/27/2013 | 1979 | |||||||||||||||||||||||
| Kentucky Fried Chicken |
Springfield | IL | — | (14) | 267 | 1,068 | — | 1,335 | 23 | 7/31/2013 | 1987 | |||||||||||||||||||||||
| Kentucky Fried Chicken |
Oak Forest | IL | — | (14) | 185 | 1,047 | — | 1,232 | 23 | 7/31/2013 | 1955 | |||||||||||||||||||||||
| Kentucky Fried Chicken |
Green Bay | WI | — | (14) | 208 | 1,022 | — | 1,230 | 28 | 6/27/2013 | 1986 | |||||||||||||||||||||||
| Kentucky Fried Chicken |
Mattoon | IL | — | (14) | 113 | 1,019 | — | 1,132 | 22 | 7/31/2013 | 1990 | |||||||||||||||||||||||
| Kentucky Fried Chicken |
Milwaukee | WI | — | (14) | 197 | 975 | — | 1,172 | 27 | 6/27/2013 | 1991 | |||||||||||||||||||||||
| Kentucky Fried Chicken |
Elmhurst | IL | — | (14) | 242 | 969 | — | 1,211 | 21 | 7/31/2013 | 1990 | |||||||||||||||||||||||
| Kentucky Fried Chicken |
Westchester | IL | — | (14) | 238 | 952 | — | 1,190 | 21 | 7/31/2013 | 1973 | |||||||||||||||||||||||
| Kentucky Fried Chicken |
Mount Pleasant | TX | — | (14) | 106 | 952 | — | 1,058 | 21 | 7/31/2013 | 1992 | |||||||||||||||||||||||
| Kentucky Fried Chicken |
Dolton | IL | — | (14) | 167 | 946 | — | 1,113 | 21 | 7/31/2013 | 1975 | |||||||||||||||||||||||
| Kentucky Fried Chicken |
Tipton | IN | — | (14) | 104 | 936 | — | 1,040 | 21 | 7/31/2013 | 1998 | |||||||||||||||||||||||
| Kentucky Fried Chicken |
Crawfordsville | IN | — | (14) | 234 | 934 | — | 1,168 | 21 | 7/31/2013 | 1991 | |||||||||||||||||||||||
| Kentucky Fried Chicken |
Milwaukee | WI | — | (14) | 138 | 924 | — | 1,062 | 26 | 6/27/2013 | 1992 | |||||||||||||||||||||||
| Kentucky Fried Chicken |
Germantown | WI | — | (14) | 368 | 913 | — | 1,281 | 25 | 6/27/2013 | 1992 | |||||||||||||||||||||||
| Kentucky Fried Chicken |
Lafayette | IN | — | (14) | 304 | 912 | — | 1,216 | 20 | 7/31/2013 | 1990 | |||||||||||||||||||||||
F-146
Table of Contents
| Initial Costs | Costs Capitalized Subsequent to Acquisition |
Gross Amount Carried at December 31, 2013 (10) (11) |
||||||||||||||||||||||||||||||||
| Property |
City |
State |
Encumbrances at December 31, 2013 |
Land | Buildings, Fixtures and Improvements |
Accumulated Depreciation (12)(13) |
Date Acquired |
Date of Construction | ||||||||||||||||||||||||||
| Kentucky Fried Chicken |
Frankfort | IN | — | (14) | 99 | 893 | — | 992 | 20 | 7/31/2013 | 1985 | |||||||||||||||||||||||
| Kentucky Fried Chicken |
Hartford City | IN | — | (14) | 99 | 889 | — | 988 | 20 | 7/31/2013 | 1978 | |||||||||||||||||||||||
| Kentucky Fried Chicken |
Kokomo | IN | — | (14) | 199 | 798 | — | 997 | 18 | 7/31/2013 | 1993 | |||||||||||||||||||||||
| Kentucky Fried Chicken |
Milwaukee | WI | — | (14) | 281 | 795 | — | 1,076 | 22 | 6/27/2013 | 1992 | |||||||||||||||||||||||
| Kentucky Fried Chicken |
Milwaukee | WI | — | (14) | 396 | 773 | — | 1,169 | 21 | 6/27/2013 | 1991 | |||||||||||||||||||||||
| Kentucky Fried Chicken |
Shreveport | LA | — | (14) | 616 | 753 | — | 1,369 | 17 | 7/31/2013 | 1995 | |||||||||||||||||||||||
| Kentucky Fried Chicken |
Milwaukee | WI | — | (14) | 89 | 750 | — | 839 | 21 | 6/27/2013 | 1989 | |||||||||||||||||||||||
| Kentucky Fried Chicken |
West Bend | WI | — | (14) | 185 | 705 | — | 890 | 20 | 6/27/2013 | 1972 | |||||||||||||||||||||||
| Kentucky Fried Chicken |
South Milwaukee | WI | — | (14) | 197 | 695 | — | 892 | 19 | 6/27/2013 | 1993 | |||||||||||||||||||||||
| Kentucky Fried Chicken |
Allison Park | PA | — | (14) | 246 | 683 | — | 929 | 19 | 6/27/2013 | 1978 | |||||||||||||||||||||||
| Kentucky Fried Chicken |
Warren | OH | — | (14) | 426 | 640 | — | 1,066 | 14 | 7/31/2013 | 1987 | |||||||||||||||||||||||
| Kentucky Fried Chicken |
Minden | LA | — | (14) | 274 | 639 | — | 913 | 14 | 7/31/2013 | 1995 | |||||||||||||||||||||||
| Kentucky Fried Chicken |
Texarkana | AR | — | (14) | 111 | 630 | — | 741 | 14 | 7/31/2013 | 1980 | |||||||||||||||||||||||
| Kentucky Fried Chicken |
Wauwatosa | WI | — | (14) | 135 | 615 | — | 750 | 17 | 6/27/2013 | 1992 | |||||||||||||||||||||||
| Kentucky Fried Chicken |
Greenville | TX | — | 119 | 585 | — | 704 | 16 | 6/27/2013 | 1988 | ||||||||||||||||||||||||
| Kentucky Fried Chicken |
Green Bay | WI | — | (14) | 470 | 574 | — | 1,044 | 13 | 7/31/2013 | 1986 | |||||||||||||||||||||||
| Kentucky Fried Chicken |
Noblesville | IN | — | (14) | 363 | 545 | — | 908 | 12 | 7/31/2013 | 2005 | |||||||||||||||||||||||
| Kentucky Fried Chicken |
Shreveport | LA | — | (14) | 352 | 528 | — | 880 | 12 | 7/31/2013 | 1998 | |||||||||||||||||||||||
| Kentucky Fried Chicken |
Shreveport | LA | — | (14) | 427 | 522 | — | 949 | 11 | 7/31/2013 | 1997 | |||||||||||||||||||||||
| Kentucky Fried Chicken |
Shreveport | LA | — | (14) | 343 | 514 | — | 857 | 11 | 7/31/2013 | 1995 | |||||||||||||||||||||||
| Kentucky Fried Chicken |
New Kensington | PA | — | (14) | 324 | 487 | — | 811 | 11 | 7/31/2013 | 1967 | |||||||||||||||||||||||
| Kentucky Fried Chicken |
Burnsville | MN | — | 267 | 267 | — | 534 | 6 | 7/31/2013 | 1988 | ||||||||||||||||||||||||
| Kentucky Fried Chicken / A&W |
Charleston | IL | — | (14) | 282 | 1,514 | — | 1,796 | 42 | 6/27/2013 | 2003 | |||||||||||||||||||||||
| Kentucky Fried Chicken / Taco Bell |
Canonsburg | PA | — | (14) | 176 | 1,586 | — | 1,762 | 35 | 7/31/2013 | 1996 | |||||||||||||||||||||||
| Kentucky Fried Chicken / Taco Bell |
Dunkirk | NY | — | (14) | 800 | 978 | — | 1,778 | 21 | 7/31/2013 | 2000 | |||||||||||||||||||||||
| Kentucky Fried Chicken / Taco Bell |
Geneva | NY | — | (14) | 569 | 695 | — | 1,264 | 15 | 7/31/2013 | 1999 | |||||||||||||||||||||||
| Kettle Restaurant |
College Station | TX | — | 225 | 249 | — | 474 | 7 | 6/27/2013 | 1981 | ||||||||||||||||||||||||
| Kettle Restaurant |
San Antonio | TX | — | 168 | 206 | — | 374 | 5 | 7/31/2013 | 1965 | ||||||||||||||||||||||||
| Krystal |
Memphis | TN | — | (14) | 257 | 1,029 | — | 1,286 | 48 | 4/23/2013 | 1975 | |||||||||||||||||||||||
| Krystal |
Huntsville | AL | — | (14) | 348 | 811 | — | 1,159 | 38 | 4/23/2013 | 1960 | |||||||||||||||||||||||
| Krystal |
Memphis | TN | — | (14) | 181 | 723 | — | 904 | 34 | 4/23/2013 | 1972 | |||||||||||||||||||||||
| Krystal |
Huntsville | AL | — | 305 | 712 | — | 1,017 | 29 | 6/10/2013 | 1985 | ||||||||||||||||||||||||
| Krystal |
Lawrenceburg | TN | — | (14) | 304 | 709 | — | 1,013 | 33 | 4/23/2013 | 1980 | |||||||||||||||||||||||
| Krystal |
Murfreesboro | TN | — | (14) | 465 | 698 | — | 1,163 | 33 | 4/23/2013 | 2008 | |||||||||||||||||||||||
| Krystal |
Valley | AL | — | (14) | 297 | 694 | — | 991 | 33 | 4/23/2013 | 1979 | |||||||||||||||||||||||
| Krystal |
Chattanooga | TN | — | (14) | 440 | 659 | — | 1,099 | 31 | 4/23/2013 | 1983 | |||||||||||||||||||||||
| Krystal |
Huntsville | AL | — | (14) | 352 | 654 | — | 1,006 | 31 | 4/23/2013 | 1971 | |||||||||||||||||||||||
| Krystal |
Corinth | MS | — | (14) | 279 | 652 | — | 931 | 31 | 4/23/2013 | 2007 | |||||||||||||||||||||||
| Krystal |
Montgomery | AL | — | (14) | 502 | 613 | — | 1,115 | 29 | 4/23/2013 | 1962 | |||||||||||||||||||||||
| Krystal |
Montgomery | AL | — | (14) | 303 | 562 | — | 865 | 26 | 4/23/2013 | 1962 | |||||||||||||||||||||||
| Krystal |
Vestavia Hills | AL | — | (14) | 342 | 513 | — | 855 | 24 | 4/23/2013 | 1979 | |||||||||||||||||||||||
| Kum & Go |
Gillette | WY | — | 878 | 2,048 | — | 2,926 | 58 | 6/28/2013 | 2013 | ||||||||||||||||||||||||
F-147
Table of Contents
| Initial Costs | Costs Capitalized Subsequent to Acquisition |
Gross Amount Carried at December 31, 2013 (10) (11) |
||||||||||||||||||||||||||||||||
| Property |
City |
State |
Encumbrances at December 31, 2013 |
Land | Buildings, Fixtures and Improvements |
Accumulated Depreciation (12)(13) |
Date Acquired |
Date of Construction | ||||||||||||||||||||||||||
| Lee’s Famous Recipe Chicken |
Saint Louis | MO | — | 107 | 874 | — | 981 | 24 | 6/27/2013 | 1984 | ||||||||||||||||||||||||
| Lee’s Famous Recipe Chicken |
Saint Ann | MO | — | 187 | 571 | — | 758 | 16 | 6/27/2013 | 1984 | ||||||||||||||||||||||||
| Lee’s Famous Recipe Chicken |
Florissant | MO | — | 306 | 560 | — | 866 | 16 | 6/27/2013 | 1984 | ||||||||||||||||||||||||
| Logan’s Roadhouse |
Mt. Juliet | TN | — | (14) | 1,366 | 2,538 | — | 3,904 | 63 | 7/31/2013 | 2006 | |||||||||||||||||||||||
| Logan’s Roadhouse |
Owasso | OK | — | (14) | 1,449 | 2,173 | — | 3,622 | 54 | 7/31/2013 | 2006 | |||||||||||||||||||||||
| Long John Silver’s |
Marion | IL | — | (14) | 305 | 1,059 | — | 1,364 | 29 | 6/27/2013 | 1983 | |||||||||||||||||||||||
| Long John Silver’s |
Litchfield | IL | — | (14) | 194 | 996 | — | 1,190 | 28 | 6/27/2013 | 1986 | |||||||||||||||||||||||
| Long John Silver’s |
West Frankfort | IL | — | (14) | 244 | 996 | — | 1,240 | 28 | 6/27/2013 | 1976 | |||||||||||||||||||||||
| Long John Silver’s |
Collinsville | IL | — | (14) | 220 | 940 | — | 1,160 | 26 | 6/27/2013 | 2006 | |||||||||||||||||||||||
| Long John Silver’s |
Merced | CA | — | (14) | 174 | 695 | — | 869 | 15 | 7/31/2013 | 1982 | |||||||||||||||||||||||
| Long John Silver’s |
Asheville | NC | — | (14) | 586 | 693 | — | 1,279 | 19 | 6/27/2013 | 1992 | |||||||||||||||||||||||
| Long John Silver’s |
Albuquerque | NM | — | 227 | 680 | — | 907 | 15 | 7/31/2013 | 1975 | ||||||||||||||||||||||||
| Long John Silver’s |
Penn Hills | PA | — | 438 | 656 | — | 1,094 | 14 | 7/31/2013 | 1993 | ||||||||||||||||||||||||
| Long John Silver’s |
Hays | KS | — | (14) | 160 | 624 | — | 784 | 17 | 6/27/2013 | 1994 | |||||||||||||||||||||||
| Long John Silver’s |
Las Cruces | NM | — | (14) | 242 | 565 | — | 807 | 12 | 7/31/2013 | 1975 | |||||||||||||||||||||||
| Long John Silver’s |
Arlington | TX | — | 365 | 537 | — | 902 | 15 | 6/27/2013 | 1993 | ||||||||||||||||||||||||
| Long John Silver’s |
Garden City | KS | — | (14) | 120 | 530 | — | 650 | 15 | 6/27/2013 | 1978 | |||||||||||||||||||||||
| Long John Silver’s |
Fairview Heights | IL | — | (14) | 258 | 525 | — | 783 | 15 | 6/27/2013 | 1976 | |||||||||||||||||||||||
| Long John Silver’s |
Mount Carmel | IL | — | (14) | 105 | 484 | — | 589 | 13 | 6/27/2013 | 1977 | |||||||||||||||||||||||
| Long John Silver’s |
Vandalia | IL | — | (14) | 101 | 484 | — | 585 | 13 | 6/27/2013 | 1976 | |||||||||||||||||||||||
| Long John Silver’s |
Jacksonville | IL | — | (14) | 171 | 431 | — | 602 | 12 | 6/27/2013 | 1978 | |||||||||||||||||||||||
| Long John Silver’s |
Cleburne | TX | — | 205 | 380 | — | 585 | 8 | 7/31/2013 | 1986 | ||||||||||||||||||||||||
| Long John Silver’s |
Clarksville | TN | — | 339 | 339 | — | 678 | 7 | 7/31/2013 | 1993 | ||||||||||||||||||||||||
| Long John Silver’s |
Jackson | TN | — | (14) | 264 | 323 | — | 587 | 7 | 7/31/2013 | 1995 | |||||||||||||||||||||||
| Long John Silver’s |
Wood River | IL | — | (14) | 251 | 314 | — | 565 | 9 | 6/27/2013 | 1975 | |||||||||||||||||||||||
| Long John Silver’s |
Fairborn | OH | — | (14) | 103 | 300 | — | 403 | 8 | 6/27/2013 | 1976 | |||||||||||||||||||||||
| Long John Silver’s |
Englewood | OH | — | (14) | 547 | — | — | 547 | — | 6/27/2013 | 1974 | |||||||||||||||||||||||
| Long John Silver’s / A&W |
Kansas City | MO | — | 389 | 722 | — | 1,111 | 16 | 7/31/2013 | 1995 | ||||||||||||||||||||||||
| Long John Silver’s / A&W |
Houston | TX | — | 480 | 495 | — | 975 | 14 | 6/27/2013 | 1993 | ||||||||||||||||||||||||
| Long John Silver’s / A&W |
Austin | TX | — | (14) | 459 | 477 | — | 936 | 13 | 6/27/2013 | 1993 | |||||||||||||||||||||||
| Long John Silver’s / A&W |
Murfreesboro | TN | — | 219 | 219 | — | 438 | 5 | 7/31/2013 | 1985 | ||||||||||||||||||||||||
| Long John Silver’s / KFC |
Green Bay | WI | — | (14) | 748 | 563 | — | 1,311 | 16 | 6/27/2013 | 1978 | |||||||||||||||||||||||
| Los Tios Mexican Restaurant |
Dalton | OH | — | (14) | 18 | 30 | — | 48 | 1 | 6/27/2013 | 1990 | |||||||||||||||||||||||
| Lowe’s |
Windham | ME | — | (14) | 12,640 | — | — | 12,640 | — | 6/3/2013 | 2006 | |||||||||||||||||||||||
| Mattress Firm |
Evansville | IN | — | (14) | 117 | 2,227 | — | 2,344 | 115 | 2/11/2013 | 2012 | |||||||||||||||||||||||
| Mattress Firm |
Spokane | WA | — | (14) | 409 | 1,685 | — | 2,094 | 72 | 4/4/2013 | 2013 | |||||||||||||||||||||||
| Mattress Firm |
Spokane | WA | — | (14) | 511 | 1,582 | — | 2,093 | 68 | 3/28/2013 | 2013 | |||||||||||||||||||||||
| Mattress Firm |
Mishawaka | IN | — | 375 | 1,500 | — | 1,875 | 35 | 7/30/2013 | 2013 | ||||||||||||||||||||||||
| Mattress Firm |
Tallahassee | FL | — | (14) | 924 | 1,386 | — | 2,310 | 52 | 5/14/2013 | 2013 | |||||||||||||||||||||||
F-148
Table of Contents
| Initial Costs | Costs Capitalized Subsequent to Acquisition |
Gross Amount Carried at December 31, 2013 (10) (11) |
||||||||||||||||||||||||||||||||
| Property |
City |
State |
Encumbrances at December 31, 2013 |
Land | Buildings, Fixtures and Improvements |
Accumulated Depreciation (12)(13) |
Date Acquired |
Date of Construction | ||||||||||||||||||||||||||
| Mattress Firm |
Bountiful | UT | — | (14) | 736 | 1,367 | — | 2,103 | 77 | 12/31/2012 | 2012 | |||||||||||||||||||||||
| Mattress Firm |
Destin | FL | — | 693 | 1,287 | — | 1,980 | 42 | 6/5/2013 | 2013 | ||||||||||||||||||||||||
| Mattress Firm |
Rogers | AR | — | (14) | 321 | 1,284 | — | 1,605 | 66 | 2/6/2013 | 2012 | |||||||||||||||||||||||
| Mattress Firm |
Wilmington | NC | — | 412 | 1,257 | — | 1,669 | 53 | 3/29/2013 | 2013 | ||||||||||||||||||||||||
| Mattress Firm |
Lafayette | LA | — | (14) | — | 1,251 | — | 1,251 | 47 | 5/2/2013 | 2013 | |||||||||||||||||||||||
| Mattress Firm |
Daphne | AL | — | 528 | 1,233 | — | 1,761 | 17 | 10/1/2013 | 2013 | ||||||||||||||||||||||||
| Mattress Firm |
Dothan | AL | — | (14) | 406 | 1,217 | — | 1,623 | 46 | 5/14/2013 | 2013 | |||||||||||||||||||||||
| Mattress Firm |
Knoxville | TN | — | (14) | 586 | 1,088 | — | 1,674 | 46 | 3/19/2013 | 2012 | |||||||||||||||||||||||
| Mattress Firm |
Greenville | NC | — | (14) | 1,085 | 1,085 | — | 2,170 | 66 | 12/12/2012 | 2012 | |||||||||||||||||||||||
| Mattress Firm |
Bowling Green | KY | — | (14) | 648 | 973 | — | 1,621 | 36 | 4/25/2013 | 2012 | |||||||||||||||||||||||
| McDonald’s |
Scotland Neck | NC | — | (14) | 320 | — | — | 320 | — | 6/27/2013 | N/A | |||||||||||||||||||||||
| Mezcal Mexican Restaurant |
Grafton | OH | — | 64 | 191 | — | 255 | 5 | 7/31/2013 | 1990 | ||||||||||||||||||||||||
| Monro Muffler |
Lewiston | ME | — | (14) | 279 | 1,115 | — | 1,394 | 43 | 5/10/2013 | 1976 | |||||||||||||||||||||||
| Monterey’s Tex Mex |
Tulsa | OK | — | 135 | 406 | — | 541 | 10 | 7/31/2013 | 2001 | ||||||||||||||||||||||||
| Native New Yorker |
Glendale | AZ | — | (14) | 254 | 420 | — | 674 | 12 | 6/27/2013 | 1998 | |||||||||||||||||||||||
| O’Charley’s |
Dalton | GA | — | (14) | 406 | 1,817 | — | 2,223 | 52 | 6/27/2013 | 1993 | |||||||||||||||||||||||
| O’Charley’s |
Tucker | GA | — | (14) | 1,037 | 866 | — | 1,903 | 25 | 6/27/2013 | 1993 | |||||||||||||||||||||||
| Parking Lot |
Kingston | PA | — | (14) | 29 | — | — | 29 | — | 6/27/2013 | N/A | |||||||||||||||||||||||
| Pizza Hut |
Chester | VA | — | (14) | 473 | 1,104 | — | 1,577 | 24 | 7/31/2013 | 1983 | |||||||||||||||||||||||
| Pizza Hut |
Ashland | VA | — | (14) | 589 | 1,093 | — | 1,682 | 24 | 7/31/2013 | 1989 | |||||||||||||||||||||||
| Pizza Hut |
Amarillo | TX | — | (14) | 339 | 1,016 | — | 1,355 | 22 | 7/31/2013 | 1976 | |||||||||||||||||||||||
| Pizza Hut |
Amarillo | TX | — | (14) | 254 | 1,015 | — | 1,269 | 22 | 7/31/2013 | 1980 | |||||||||||||||||||||||
| Pizza Hut |
Fort Stockton | TX | — | (14) | 252 | 1,007 | — | 1,259 | 22 | 7/31/2013 | 2008 | |||||||||||||||||||||||
| Pizza Hut |
Christiansburg | VA | — | (14) | 494 | 918 | — | 1,412 | 20 | 7/31/2013 | 1982 | |||||||||||||||||||||||
| Pizza Hut |
Odessa | TX | — | (14) | 588 | 882 | — | 1,470 | 19 | 7/31/2013 | 1972 | |||||||||||||||||||||||
| Pizza Hut |
Hopewell | VA | — | (14) | 707 | 864 | — | 1,571 | 19 | 7/31/2013 | 1985 | |||||||||||||||||||||||
| Pizza Hut |
Clifton Forge | VA | — | (14) | 287 | 861 | — | 1,148 | 19 | 7/31/2013 | 1978 | |||||||||||||||||||||||
| Pizza Hut |
Odessa | TX | — | (14) | 456 | 847 | — | 1,303 | 19 | 7/31/2013 | 1976 | |||||||||||||||||||||||
| Pizza Hut |
Richmond | VA | — | (14) | 666 | 814 | — | 1,480 | 18 | 7/31/2013 | 1978 | |||||||||||||||||||||||
| Pizza Hut |
Odessa | TX | — | (14) | 627 | 766 | — | 1,393 | 17 | 7/31/2013 | 1979 | |||||||||||||||||||||||
| Pizza Hut |
JACKSON | GA | — | (14) | 673 | 735 | — | 1,408 | 20 | 6/27/2013 | 1987 | |||||||||||||||||||||||
| Pizza Hut |
Salisbury | MD | — | (14) | 245 | 734 | — | 979 | 16 | 7/31/2013 | 1983 | |||||||||||||||||||||||
| Pizza Hut |
Delaware | OH | — | (14) | 270 | 721 | — | 991 | 20 | 6/27/2013 | 1975 | |||||||||||||||||||||||
| Pizza Hut |
Pecos | TX | — | (14) | 387 | 719 | — | 1,106 | 16 | 7/31/2013 | 1974 | |||||||||||||||||||||||
| Pizza Hut |
Petersburg | VA | — | (14) | 378 | 701 | — | 1,079 | 15 | 7/31/2013 | 1979 | |||||||||||||||||||||||
| Pizza Hut |
Odessa | TX | — | (14) | 457 | 685 | — | 1,142 | 15 | 7/31/2013 | 1976 | |||||||||||||||||||||||
| Pizza Hut |
Monahans | TX | — | (14) | 361 | 671 | — | 1,032 | 15 | 7/31/2013 | 1979 | |||||||||||||||||||||||
| Pizza Hut |
Bedford | VA | — | (14) | 548 | 670 | — | 1,218 | 15 | 7/31/2013 | 1977 | |||||||||||||||||||||||
| Pizza Hut |
San Angelo | TX | — | (14) | 214 | 641 | — | 855 | 14 | 7/31/2013 | 1977 | |||||||||||||||||||||||
| Pizza Hut |
San Angelo | TX | — | (14) | 268 | 624 | — | 892 | 14 | 7/31/2013 | 1980 | |||||||||||||||||||||||
| Pizza Hut |
Midland | TX | — | (14) | 506 | 619 | — | 1,125 | 14 | 7/31/2013 | 1978 | |||||||||||||||||||||||
| Pizza Hut |
Downers Grove | IL | — | 504 | 616 | — | 1,120 | 14 | 7/31/2013 | 1985 | ||||||||||||||||||||||||
| Pizza Hut |
Detroit | MI | — | 501 | 612 | — | 1,113 | 13 | 7/31/2013 | 1984 | ||||||||||||||||||||||||
| Pizza Hut |
Newport News | VA | — | (14) | 394 | 591 | — | 985 | 13 | 7/31/2013 | 1969 | |||||||||||||||||||||||
| Pizza Hut |
Newport News | VA | — | (14) | 394 | 591 | — | 985 | 13 | 7/31/2013 | 1970 | |||||||||||||||||||||||
| Pizza Hut |
Columbia | SC | — | (14) | 881 | 588 | — | 1,469 | 13 | 7/31/2013 | 1977 | |||||||||||||||||||||||
| Pizza Hut |
Odessa | TX | — | (14) | 572 | 572 | — | 1,144 | 13 | 7/31/2013 | 1976 | |||||||||||||||||||||||
| Pizza Hut |
Tyler | TX | — | 238 | 555 | — | 793 | 15 | 6/27/2013 | 1981 | ||||||||||||||||||||||||
F-149
Table of Contents
| Initial Costs | Costs Capitalized Subsequent to Acquisition |
Gross Amount Carried at December 31, 2013 (10) (11) |
||||||||||||||||||||||||||||||||
| Property |
City |
State |
Encumbrances at December 31, 2013 |
Land | Buildings, Fixtures and Improvements |
Accumulated Depreciation (12)(13) |
Date Acquired |
Date of Construction | ||||||||||||||||||||||||||
| Pizza Hut |
San Angelo | TX | — | (14) | 237 | 552 | — | 789 | 12 | 7/31/2013 | 1975 | |||||||||||||||||||||||
| Pizza Hut |
Dearborn | MI | — | 284 | 528 | — | 812 | 12 | 7/31/2013 | 1977 | ||||||||||||||||||||||||
| Pizza Hut |
Aurora | IL | — | (14) | 281 | 522 | — | 803 | 11 | 7/31/2013 | 1986 | |||||||||||||||||||||||
| Pizza Hut |
Cheraw | SC | — | (14) | 415 | 507 | — | 922 | 11 | 7/31/2013 | 1984 | |||||||||||||||||||||||
| Pizza Hut |
Midland | TX | — | (14) | 414 | 506 | — | 920 | 11 | 7/31/2013 | 1975 | |||||||||||||||||||||||
| Pizza Hut |
Louisville | KY | — | (14) | 539 | 499 | — | 1,038 | 14 | 6/27/2013 | 1975 | |||||||||||||||||||||||
| Pizza Hut |
Batesburg | SC | — | (14) | 261 | 484 | — | 745 | 11 | 7/31/2013 | 1987 | |||||||||||||||||||||||
| Pizza Hut |
Greensboro | GA | — | (14) | 569 | 465 | — | 1,034 | 10 | 7/31/2013 | 1989 | |||||||||||||||||||||||
| Pizza Hut |
Crystal City | TX | — | (14) | 148 | 453 | — | 601 | 13 | 6/27/2013 | 1981 | |||||||||||||||||||||||
| Pizza Hut |
Abilene | TX | — | (14) | 549 | 449 | — | 998 | 10 | 7/31/2013 | 1980 | |||||||||||||||||||||||
| Pizza Hut |
Sweetwater | TX | — | 77 | 435 | — | 512 | 10 | 7/31/2013 | 1975 | ||||||||||||||||||||||||
| Pizza Hut |
Detroit | MI | — | 105 | 421 | — | 526 | 9 | 7/31/2013 | 1986 | ||||||||||||||||||||||||
| Pizza Hut |
Pageland | SC | — | (14) | 344 | 420 | — | 764 | 9 | 7/31/2013 | 1999 | |||||||||||||||||||||||
| Pizza Hut |
West Columbia | SC | — | (14) | 507 | 415 | — | 922 | 9 | 7/31/2013 | 1980 | |||||||||||||||||||||||
| Pizza Hut |
Edgefield | SC | — | (14) | 221 | 410 | — | 631 | 9 | 7/31/2013 | 1986 | |||||||||||||||||||||||
| Pizza Hut |
Coleman | TX | — | 69 | 391 | — | 460 | 9 | 7/31/2013 | 1975 | ||||||||||||||||||||||||
| Pizza Hut |
Stevens Point | WI | — | 130 | 390 | — | 520 | 9 | 7/31/2013 | 1989 | ||||||||||||||||||||||||
| Pizza Hut |
Laurens | SC | — | (14) | 454 | 371 | — | 825 | 8 | 7/31/2013 | 1989 | |||||||||||||||||||||||
| Pizza Hut |
Elmira | NY | — | 199 | 370 | — | 569 | 8 | 7/31/2013 | 1975 | ||||||||||||||||||||||||
| Pizza Hut |
Wellsville | NY | — | 123 | 368 | — | 491 | 8 | 7/31/2013 | 1978 | ||||||||||||||||||||||||
| Pizza Hut |
Ann Arbor | MI | — | 119 | 367 | — | 486 | 10 | 6/27/2013 | 1991 | ||||||||||||||||||||||||
| Pizza Hut |
Bishopville | SC | — | (14) | 365 | 365 | — | 730 | 8 | 7/31/2013 | 1987 | |||||||||||||||||||||||
| Pizza Hut |
Cedar City | UT | — | 52 | 361 | — | 413 | 10 | 6/27/2013 | 1978 | ||||||||||||||||||||||||
| Pizza Hut |
Eatonton | GA | — | (14) | 353 | 353 | — | 706 | 8 | 7/31/2013 | 1988 | |||||||||||||||||||||||
| Pizza Hut |
Saluda | SC | — | (14) | 346 | 346 | — | 692 | 8 | 7/31/2013 | 1995 | |||||||||||||||||||||||
| Pizza Hut |
Hampton | VA | — | (14) | 641 | 345 | — | 986 | 8 | 7/31/2013 | 1977 | |||||||||||||||||||||||
| Pizza Hut |
Merrill | WI | — | 83 | 331 | — | 414 | 7 | 7/31/2013 | 1980 | ||||||||||||||||||||||||
| Pizza Hut |
Red Bank | TN | — | (14) | 215 | 323 | — | 538 | 7 | 7/31/2013 | 1975 | |||||||||||||||||||||||
| Pizza Hut |
Colonial Heights | VA | — | (14) | 311 | 311 | — | 622 | 7 | 7/31/2013 | 1991 | |||||||||||||||||||||||
| Pizza Hut |
Richmond | VA | — | (14) | 311 | 311 | — | 622 | 7 | 7/31/2013 | 1991 | |||||||||||||||||||||||
| Pizza Hut |
Seminole | TX | — | 53 | 301 | — | 354 | 7 | 7/31/2013 | 1977 | ||||||||||||||||||||||||
| Pizza Hut |
Tucker | GA | — | 192 | 288 | — | 480 | 6 | 7/31/2013 | 1974 | ||||||||||||||||||||||||
| Pizza Hut |
Front Royal | VA | — | (14) | 191 | 287 | — | 478 | 6 | 7/31/2013 | 1973 | |||||||||||||||||||||||
| Pizza Hut |
Mobile | AL | — | 127 | 276 | — | 403 | 8 | 6/27/2013 | 1974 | ||||||||||||||||||||||||
| Pizza Hut |
Dawson | GA | — | 131 | 274 | — | 405 | 8 | 6/27/2013 | 1987 | ||||||||||||||||||||||||
| Pizza Hut |
Lafayette | LA | — | 68 | 271 | — | 339 | 8 | 6/27/2013 | 1990 | ||||||||||||||||||||||||
| Pizza Hut |
Oklahoma City | OK | — | (14) | 268 | 268 | — | 536 | 6 | 7/31/2013 | 1984 | |||||||||||||||||||||||
| Pizza Hut |
Page | AZ | — | 66 | 263 | — | 329 | 6 | 7/31/2013 | 1977 | ||||||||||||||||||||||||
| Pizza Hut |
Bowling Green | OH | — | 141 | 262 | — | 403 | 6 | 7/31/2013 | 1979 | ||||||||||||||||||||||||
| Pizza Hut |
Antigo | WI | — | 45 | 252 | — | 297 | 6 | 7/31/2013 | 1997 | ||||||||||||||||||||||||
| Pizza Hut |
Santee | SC | — | (14) | 371 | 248 | — | 619 | 5 | 7/31/2013 | 1972 | |||||||||||||||||||||||
| Pizza Hut |
Saint George | SC | — | (14) | 367 | 245 | — | 612 | 5 | 7/31/2013 | 1980 | |||||||||||||||||||||||
| Pizza Hut |
Ashburn | GA | — | 102 | 233 | — | 335 | 6 | 6/27/2013 | 1988 | ||||||||||||||||||||||||
F-150
Table of Contents
| Initial Costs | Costs Capitalized Subsequent to Acquisition |
Gross Amount Carried at December 31, 2013 (10) (11) |
||||||||||||||||||||||||||||||||
| Property |
City |
State |
Encumbrances at December 31, 2013 |
Land | Buildings, Fixtures and Improvements |
Accumulated Depreciation (12)(13) |
Date Acquired |
Date of Construction | ||||||||||||||||||||||||||
| Pizza Hut |
Box Elder | SD | — | (14) | 68 | 217 | — | 285 | 6 | 6/27/2013 | 1985 | |||||||||||||||||||||||
| Pizza Hut |
Shamokin | PA | — | 54 | 217 | — | 271 | 5 | 7/31/2013 | 1976 | ||||||||||||||||||||||||
| Pizza Hut |
Kanab | UT | — | 52 | 210 | — | 262 | 5 | 7/31/2013 | 1989 | ||||||||||||||||||||||||
| Pizza Hut |
Hayward | WI | — | 51 | 205 | — | 256 | 5 | 7/31/2013 | 1993 | ||||||||||||||||||||||||
| Pizza Hut |
Plover | WI | — | 85 | 199 | — | 284 | 4 | 7/31/2013 | 1994 | ||||||||||||||||||||||||
| Pizza Hut |
Defiance | OH | — | 114 | 197 | — | 311 | 5 | 6/27/2013 | 1977 | ||||||||||||||||||||||||
| Pizza Hut |
Schofield | WI | — | 106 | 196 | — | 302 | 4 | 7/31/2013 | 1987 | ||||||||||||||||||||||||
| Pizza Hut |
Monticello | FL | — | 115 | 195 | — | 310 | 5 | 6/27/2013 | 1987 | ||||||||||||||||||||||||
| Pizza Hut |
Abbotsford | WI | — | 159 | 195 | — | 354 | 4 | 7/31/2013 | 1980 | ||||||||||||||||||||||||
| Pizza Hut |
Marietta | OH | — | 104 | 193 | — | 297 | 4 | 7/31/2013 | 1986 | ||||||||||||||||||||||||
| Pizza Hut |
Hurricane | WV | — | 126 | 188 | — | 314 | 4 | 7/31/2013 | 1978 | ||||||||||||||||||||||||
| Pizza Hut |
East Syracuse | NY | — | 137 | 185 | — | 322 | 5 | 6/27/2013 | 1978 | ||||||||||||||||||||||||
| Pizza Hut |
Cleveland | OH | — | 87 | 175 | — | 262 | 5 | 6/27/2013 | 1985 | ||||||||||||||||||||||||
| Pizza Hut |
Toledo | OH | — | 58 | 173 | — | 231 | 5 | 6/27/2013 | 1978 | ||||||||||||||||||||||||
| Pizza Hut |
Sandusky | OH | — | 140 | 171 | — | 311 | 4 | 7/31/2013 | 1982 | ||||||||||||||||||||||||
| Pizza Hut |
Abilene | TX | — | (14) | 397 | 170 | — | 567 | 4 | 7/31/2013 | 1976 | |||||||||||||||||||||||
| Pizza Hut |
Ronceverte | WV | — | 66 | 162 | — | 228 | 4 | 6/27/2013 | 1978 | ||||||||||||||||||||||||
| Pizza Hut |
Eagle River | WI | — | 28 | 159 | — | 187 | 3 | 7/31/2013 | 1991 | ||||||||||||||||||||||||
| Pizza Hut |
Middleburg Heights | OH | — | 128 | 156 | — | 284 | 3 | 7/31/2013 | 1985 | ||||||||||||||||||||||||
| Pizza Hut |
North Olmsted | OH | — | 122 | 153 | — | 275 | 4 | 6/27/2013 | 1977 | ||||||||||||||||||||||||
| Pizza Hut |
Cross Lanes | WV | — | 122 | 149 | — | 271 | 3 | 7/31/2013 | 1977 | ||||||||||||||||||||||||
| Pizza Hut |
Beckley | WV | — | 160 | 131 | — | 291 | 3 | 7/31/2013 | 1977 | ||||||||||||||||||||||||
| Pizza Hut |
Stamford | TX | — | 38 | 115 | — | 153 | 3 | 7/31/2013 | 1970 | ||||||||||||||||||||||||
| Pizza Hut |
Norwalk | OH | — | (14) | 77 | 115 | — | 192 | 3 | 7/31/2013 | 1977 | |||||||||||||||||||||||
| Pizza Hut |
Ballinger | TX | — | 34 | 109 | — | 143 | 3 | 6/27/2013 | 1978 | ||||||||||||||||||||||||
| Pizza Hut |
Strongsville | OH | — | 74 | 108 | — | 182 | 3 | 6/27/2013 | 1977 | ||||||||||||||||||||||||
| Pizza Hut |
Neillsville | WI | — | 35 | 106 | — | 141 | 2 | 7/31/2013 | 1995 | ||||||||||||||||||||||||
| Pizza Hut |
Milton | WV | — | 24 | 96 | — | 120 | 2 | 7/31/2013 | 1978 | ||||||||||||||||||||||||
| Pizza Hut |
Waupaca | WI | — | 61 | 91 | — | 152 | 2 | 7/31/2013 | 1991 | ||||||||||||||||||||||||
| Pizza Hut |
Tomahawk | WI | — | 35 | 81 | — | 116 | 2 | 7/31/2013 | 1986 | ||||||||||||||||||||||||
| Pizza Hut |
Nedrow | NY | — | 55 | 80 | — | 135 | 2 | 6/27/2013 | 1979 | ||||||||||||||||||||||||
| Pizza Hut |
Clintonville | WI | — | 208 | 69 | — | 277 | 2 | 7/31/2013 | 1978 | ||||||||||||||||||||||||
| Pizza Hut |
Rochester | NY | — | 62 | 62 | — | 124 | 1 | 7/31/2013 | 1989 | ||||||||||||||||||||||||
| Pizza Hut |
Lambertville | MI | — | 110 | 6 | — | 116 | — | 7/31/2013 | 1995 | ||||||||||||||||||||||||
| Pizza Hut |
Huntington | WV | — | 190 | 4 | — | 194 | — | 7/31/2013 | 1979 | ||||||||||||||||||||||||
| Pizza Hut |
Adrian | MI | — | 265 | — | — | 265 | — | 6/27/2013 | N/A | ||||||||||||||||||||||||
| Pizza Hut |
Monroe | MI | — | 220 | — | — | 220 | — | 6/27/2013 | 1977 | ||||||||||||||||||||||||
| Pizza Hut |
Bedford | OH | — | 183 | — | — | 183 | — | 6/27/2013 | N/A | ||||||||||||||||||||||||
| Ponderosa |
Indiana | PA | — | 676 | 1,255 | — | 1,931 | 31 | 7/31/2013 | 2000 | ||||||||||||||||||||||||
| Ponderosa |
Massena | NY | — | 190 | 570 | — | 760 | 14 | 7/31/2013 | 1988 | ||||||||||||||||||||||||
| Ponderosa |
Scottsburg | IN | — | (14) | 430 | 141 | — | 571 | 4 | 6/27/2013 | 1985 | |||||||||||||||||||||||
| Popeyes |
Marksville | LA | — | (14) | 487 | 1,129 | — | 1,616 | 31 | 6/27/2013 | 1987 | |||||||||||||||||||||||
| Popeyes |
Tampa | FL | — | (14) | 673 | 1,065 | — | 1,738 | 30 | 6/27/2013 | 2000 | |||||||||||||||||||||||
F-151
Table of Contents
| Initial Costs | Costs Capitalized Subsequent to Acquisition |
Gross Amount Carried at December 31, 2013 (10) (11) |
||||||||||||||||||||||||||||||||
| Property |
City |
State |
Encumbrances at December 31, 2013 |
Land | Buildings, Fixtures and Improvements |
Accumulated Depreciation (12)(13) |
Date Acquired |
Date of Construction | ||||||||||||||||||||||||||
| Popeyes |
Winter Haven | FL | — | (14) | 484 | 1,001 | — | 1,485 | 28 | 6/27/2013 | 1976 | |||||||||||||||||||||||
| Popeyes |
Greenville | MS | — | (14) | 513 | 977 | — | 1,490 | 27 | 6/27/2013 | 1984 | |||||||||||||||||||||||
| Popeyes |
Brandon | FL | — | (14) | 776 | 961 | — | 1,737 | 27 | 6/27/2013 | 1978 | |||||||||||||||||||||||
| Popeyes |
Jacksonville | FL | — | (14) | 781 | 955 | — | 1,736 | 21 | 7/31/2013 | 1955 | |||||||||||||||||||||||
| Popeyes |
Orlando | FL | — | (14) | 782 | 955 | — | 1,737 | 21 | 7/31/2013 | 2004 | |||||||||||||||||||||||
| Popeyes |
Lafayette | LA | — | (14) | 473 | 901 | — | 1,374 | 25 | 6/27/2013 | 1996 | |||||||||||||||||||||||
| Popeyes |
Lafayette | LA | — | (14) | 434 | 899 | — | 1,333 | 25 | 6/27/2013 | 1993 | |||||||||||||||||||||||
| Popeyes |
Eunice | LA | — | (14) | 382 | 891 | — | 1,273 | 20 | 7/31/2013 | 1986 | |||||||||||||||||||||||
| Popeyes |
Orange | TX | — | (14) | 456 | 847 | — | 1,303 | 19 | 7/31/2013 | 2004 | |||||||||||||||||||||||
| Popeyes |
Lakeland | FL | — | (14) | 830 | 830 | — | 1,660 | 18 | 7/31/2013 | 1999 | |||||||||||||||||||||||
| Popeyes |
Bayou Vista | LA | — | (14) | 375 | 709 | — | 1,084 | 20 | 6/27/2013 | 1985 | |||||||||||||||||||||||
| Popeyes |
Nederland | TX | — | (14) | 445 | 668 | — | 1,113 | 15 | 7/31/2013 | 1988 | |||||||||||||||||||||||
| Popeyes |
Omaha | NE | — | (14) | 264 | 615 | — | 879 | 14 | 7/31/2013 | 1985 | |||||||||||||||||||||||
| Popeyes |
Port Arthur | TX | — | (14) | 408 | 589 | — | 997 | 16 | 6/27/2013 | 1984 | |||||||||||||||||||||||
| Popeyes |
Franklin | LA | — | (14) | 283 | 538 | — | 821 | 15 | 6/27/2013 | 1985 | |||||||||||||||||||||||
| Popeyes |
Austin | TX | — | 1,216 | 533 | — | 1,749 | 15 | 6/27/2013 | 1996 | ||||||||||||||||||||||||
| Popeyes |
Omaha | NE | — | (14) | 343 | 515 | — | 858 | 11 | 7/31/2013 | 1996 | |||||||||||||||||||||||
| Popeyes |
Saint Louis | MO | — | (14) | 248 | 460 | — | 708 | 13 | 6/27/2013 | 1959 | |||||||||||||||||||||||
| Popeyes |
Saint Louis | MO | — | (14) | 288 | 431 | — | 719 | 9 | 7/31/2013 | 1978 | |||||||||||||||||||||||
| Popeyes |
Baton Rouge | LA | — | (14) | 323 | 394 | — | 717 | 9 | 7/31/2013 | 1999 | |||||||||||||||||||||||
| Popeyes |
Ferguson | MO | — | (14) | 128 | 383 | — | 511 | 8 | 7/31/2013 | 1984 | |||||||||||||||||||||||
| Popeyes |
Miami | FL | — | 220 | 330 | — | 550 | 7 | 7/31/2013 | 1962 | ||||||||||||||||||||||||
| Popeyes |
Houston | TX | — | 295 | 241 | — | 536 | 5 | 7/31/2013 | 1976 | ||||||||||||||||||||||||
| Popeyes |
Portsmouth | VA | — | (14) | 369 | 230 | — | 599 | 6 | 6/27/2013 | 2002 | |||||||||||||||||||||||
| Popeyes |
Houston | TX | — | 278 | 227 | — | 505 | 5 | 7/31/2013 | 1978 | ||||||||||||||||||||||||
| Popeyes |
Newport News | VA | — | (14) | 381 | 217 | — | 598 | 6 | 6/27/2013 | 2002 | |||||||||||||||||||||||
| Popeyes |
Houston | TX | — | 111 | 166 | — | 277 | 4 | 7/31/2013 | 1976 | ||||||||||||||||||||||||
| Quincy’s Family Steakhouse |
Monroe | NC | — | 560 | 458 | — | 1,018 | 11 | 7/31/2013 | 1978 | ||||||||||||||||||||||||
| Rally’s |
Indianapolis | IN | — | (14) | 1,168 | — | — | 1,168 | — | 7/31/2013 | N/A | |||||||||||||||||||||||
| Rally’s |
Indianapolis | IN | — | (14) | 1,168 | — | — | 1,168 | — | 7/31/2013 | N/A | |||||||||||||||||||||||
| Rancho Grande Grill |
Andalusia | AL | — | 94 | 251 | — | 345 | 7 | 6/27/2013 | 2004 | ||||||||||||||||||||||||
| Rite Aid |
Burton | MI | — | 128 | 2,541 | — | 2,669 | 63 | 7/26/2013 | 1999 | ||||||||||||||||||||||||
| Rite Aid |
Wilson | NC | — | 573 | 1,337 | — | 1,910 | 33 | 7/30/2013 | 2002 | ||||||||||||||||||||||||
| Rite Aid |
Adams | MA | — | 300 | 1,200 | — | 1,500 | 30 | 7/30/2013 | 2000 | ||||||||||||||||||||||||
| Rolls-Royce Corporation |
Indianapolis | IN | — | (14) | 5,770 | 64,063 | — | 69,833 | 2,100 | 5/9/2013 | 2000 | |||||||||||||||||||||||
| Rubbermaid |
Brimfield | OH | — | (14) | 1,552 | 29,485 | — | 31,037 | 1,650 | 1/31/2013 | 2012 | |||||||||||||||||||||||
| Rubbermaid |
Bowling Green | OH | — | 714 | 13,560 | — | 14,274 | 345 | 7/29/2013 | 2013 | ||||||||||||||||||||||||
| Saltwater Willy’s |
Grapevine | TX | — | (14) | 572 | 868 | — | 1,440 | 25 | 6/27/2013 | 1999 | |||||||||||||||||||||||
| Schlotzsky’s Deli |
Colorado Springs | CO | — | (14) | 530 | 530 | — | 1,060 | 15 | 6/27/2013 | 1997 | |||||||||||||||||||||||
| Schlotzsky’s Deli |
Louisville | KY | — | (14) | 321 | 342 | — | 663 | 9 | 6/27/2013 | 1998 | |||||||||||||||||||||||
| Senor Panchos |
Orrville | OH | — | (14) | 99 | 176 | — | 275 | 5 | 6/27/2013 | 1990 | |||||||||||||||||||||||
| Shoney’s |
Grenada | MS | — | 270 | 809 | — | 1,079 | 18 | 7/31/2013 | 1991 | ||||||||||||||||||||||||
| Shoney’s |
Columbia | SC | — | (14) | 446 | 545 | — | 991 | 12 | 7/31/2013 | 1985 | |||||||||||||||||||||||
F-152
Table of Contents
| Initial Costs | Costs Capitalized Subsequent to Acquisition |
Gross Amount Carried at December 31, 2013 (10) (11) |
||||||||||||||||||||||||||||||||
| Property |
City |
State |
Encumbrances at December 31, 2013 |
Land | Buildings, Fixtures and Improvements |
Accumulated Depreciation (12)(13) |
Date Acquired |
Date of Construction | ||||||||||||||||||||||||||
| Shoney’s |
West Columbia | SC | — | (14) | 392 | 262 | — | 654 | 6 | 7/31/2013 | 1977 | |||||||||||||||||||||||
| Snowflake Donut Shop |
Gun Barrel City | TX | — | 241 | 383 | — | 624 | 11 | 6/27/2013 | 2008 | ||||||||||||||||||||||||
| Sonic Drive-In |
Crystal River | FL | — | (14) | 107 | 322 | — | 429 | 7 | 7/31/2013 | 2008 | |||||||||||||||||||||||
| Sonic Drive-In |
Mulberry | FL | — | (14) | 165 | 298 | — | 463 | 8 | 6/27/2013 | 2004 | |||||||||||||||||||||||
| Sonic Drive-In |
Wadesboro | NC | — | (14) | 137 | 266 | — | 403 | 7 | 6/27/2013 | 2007 | |||||||||||||||||||||||
| Sonic Drive-In |
Spring Hill | FL | — | (14) | 79 | 252 | — | 331 | 7 | 6/27/2013 | 2003 | |||||||||||||||||||||||
| Sonny’s BBQ |
Venice | FL | — | (14) | 338 | 507 | — | 845 | 13 | 7/31/2013 | 1978 | |||||||||||||||||||||||
| Sports Wings |
Sumter | SC | — | (14) | 73 | 109 | — | 182 | 2 | 7/31/2013 | 1988 | |||||||||||||||||||||||
| Stripes Gas & Convenience |
Rio Hondo | TX | — | (14) | 293 | 2,640 | — | 2,933 | 136 | 2/15/2013 | 2008 | |||||||||||||||||||||||
| Stripes Gas & Convenience |
Pharr | TX | — | (14) | 281 | 2,531 | — | 2,812 | 130 | 2/15/2013 | 1995 | |||||||||||||||||||||||
| Stripes Gas & Convenience |
Andrews | TX | — | (14) | 406 | 2,302 | — | 2,708 | 119 | 2/15/2013 | 2008 | |||||||||||||||||||||||
| Stripes Gas & Convenience |
La Feria | TX | — | (14) | 219 | 1,970 | — | 2,189 | 101 | 2/15/2013 | 2008 | |||||||||||||||||||||||
| Sun Trust Bank |
Waldorf | MD | — | (14) | 523 | 2,962 | — | 3,485 | 119 | 3/22/2013 | 1964 | |||||||||||||||||||||||
| Sun Trust Bank |
Mocksville | NC | — | (14) | 978 | 2,933 | — | 3,911 | 118 | 3/22/2013 | 2000 | |||||||||||||||||||||||
| Sun Trust Bank |
Annapolis | MD | — | 2,653 | 2,170 | — | 4,823 | 48 | 7/23/2013 | 1976 | ||||||||||||||||||||||||
| Sun Trust Bank |
Richmond | VA | — | (14) | 224 | 2,012 | — | 2,236 | 81 | 4/12/2013 | 1909 | |||||||||||||||||||||||
| Sun Trust Bank |
Tallahassee | FL | — | (14) | 828 | 1,933 | — | 2,761 | 78 | 4/12/2013 | 1991 | |||||||||||||||||||||||
| Sun Trust Bank |
Dunedin | FL | — | (14) | 479 | 1,917 | — | 2,396 | 77 | 3/22/2013 | 1995 | |||||||||||||||||||||||
| Sun Trust Bank |
Monroe | NC | — | (14) | 204 | 1,837 | — | 2,041 | 74 | 4/12/2013 | 1920 | |||||||||||||||||||||||
| Sun Trust Bank |
Plant City | FL | — | (14) | 751 | 1,753 | — | 2,504 | 70 | 3/22/2013 | 2000 | |||||||||||||||||||||||
| Sun Trust Bank |
Destin | FL | — | (14) | 572 | 1,717 | — | 2,289 | 69 | 4/12/2013 | 1998 | |||||||||||||||||||||||
| Sun Trust Bank |
Jesup | GA | — | (14) | 184 | 1,657 | — | 1,841 | 67 | 3/22/2013 | 1964 | |||||||||||||||||||||||
| Sun Trust Bank |
Atlanta | GA | — | (14) | 1,018 | 1,527 | — | 2,545 | 61 | 4/12/2013 | 1965 | |||||||||||||||||||||||
| Sun Trust Bank |
Coral Springs | FL | — | (14) | 654 | 1,525 | — | 2,179 | 61 | 4/12/2013 | 1996 | |||||||||||||||||||||||
| Sun Trust Bank |
Rocky Mount | VA | — | (14) | 265 | 1,504 | — | 1,769 | 47 | 5/22/2013 | 1961 | |||||||||||||||||||||||
| Sun Trust Bank |
Dunwoody | GA | — | (14) | 1,784 | 1,460 | — | 3,244 | 59 | 3/22/2013 | 1972 | |||||||||||||||||||||||
| Sun Trust Bank |
Melbourne | FL | — | (14) | 464 | 1,392 | — | 1,856 | 56 | 4/12/2013 | 1987 | |||||||||||||||||||||||
| Sun Trust Bank |
Durham | NC | — | (14) | 747 | 1,388 | — | 2,135 | 56 | 4/12/2013 | 1973 | |||||||||||||||||||||||
| Sun Trust Bank |
North Port | FL | — | (14) | 460 | 1,381 | — | 1,841 | 55 | 3/22/2013 | 1982 | |||||||||||||||||||||||
| Sun Trust Bank |
Hudson | FL | — | (14) | 448 | 1,345 | — | 1,793 | 54 | 3/22/2013 | 1979 | |||||||||||||||||||||||
| Sun Trust Bank |
Port Orange | FL | — | (14) | 563 | 1,314 | — | 1,877 | 53 | 3/22/2013 | 1982 | |||||||||||||||||||||||
| Sun Trust Bank |
Nashville | TN | — | (14) | 1,598 | 1,308 | — | 2,906 | 53 | 4/12/2013 | 1992 | |||||||||||||||||||||||
| Sun Trust Bank |
Chattanooga | TN | — | (14) | 223 | 1,263 | — | 1,486 | 51 | 3/22/2013 | 1953 | |||||||||||||||||||||||
| Sun Trust Bank |
Palm Harbor | FL | — | (14) | 535 | 1,249 | — | 1,784 | 50 | 4/12/2013 | 1994 | |||||||||||||||||||||||
| Sun Trust Bank |
Bowdon | GA | — | (14) | 416 | 1,247 | — | 1,663 | 50 | 3/22/2013 | 1900 | |||||||||||||||||||||||
| Sun Trust Bank |
Orlando | FL | — | (14) | 805 | 1,208 | — | 2,013 | 49 | 4/12/2013 | 1988 | |||||||||||||||||||||||
| Sun Trust Bank |
Madison | TN | — | (14) | 286 | 1,143 | — | 1,429 | 46 | 3/22/2013 | 1953 | |||||||||||||||||||||||
| Sun Trust Bank |
Miami | FL | — | (14) | 1,393 | 1,140 | — | 2,533 | 46 | 4/12/2013 | 1982 | |||||||||||||||||||||||
| Sun Trust Bank |
Lakeland | FL | — | (14) | 598 | 1,110 | — | 1,708 | 45 | 4/12/2013 | 1988 | |||||||||||||||||||||||
| Sun Trust Bank |
South Daytona Beach | FL | — | (14) | 592 | 1,099 | — | 1,691 | 44 | 4/12/2013 | 1985 | |||||||||||||||||||||||
| Sun Trust Bank |
Port Orange | FL | — | (14) | 590 | 1,095 | — | 1,685 | 44 | 3/22/2013 | 1989 | |||||||||||||||||||||||
| Sun Trust Bank |
Anderson | SC | — | (14) | 574 | 1,065 | — | 1,639 | 43 | 3/22/2013 | 1998 | |||||||||||||||||||||||
| Sun Trust Bank |
West Palm Beach | FL | — | (14) | 1,026 | 1,026 | — | 2,052 | 41 | 3/22/2013 | 1981 | |||||||||||||||||||||||
F-153
Table of Contents
| Initial Costs | Costs Capitalized Subsequent to Acquisition |
Gross Amount Carried at December 31, 2013 (10) (11) |
||||||||||||||||||||||||||||||||
| Property |
City |
State |
Encumbrances at December 31, 2013 |
Land | Buildings, Fixtures and Improvements |
Accumulated Depreciation (12)(13) |
Date Acquired |
Date of Construction | ||||||||||||||||||||||||||
| Sun Trust Bank |
Frederick | MD | — | (14) | 991 | 991 | — | 1,982 | 35 | 4/26/2013 | 1880 | |||||||||||||||||||||||
| Sun Trust Bank |
Roswell | GA | — | (14) | 1,425 | 950 | — | 2,375 | 38 | 4/12/2013 | 1988 | |||||||||||||||||||||||
| Sun Trust Bank |
Ellicott City | MD | — | (14) | 1,728 | 931 | — | 2,659 | 37 | 3/22/2013 | 1975 | |||||||||||||||||||||||
| Sun Trust Bank |
Belmont | NC | — | (14) | 616 | 924 | — | 1,540 | 37 | 3/22/2013 | 1970 | |||||||||||||||||||||||
| Sun Trust Bank |
Lexington | NC | — | (14) | 447 | 831 | — | 1,278 | 33 | 4/12/2013 | 2001 | |||||||||||||||||||||||
| Sun Trust Bank |
Kissimmee | FL | — | (14) | 1,167 | 778 | — | 1,945 | 31 | 4/12/2013 | 1981 | |||||||||||||||||||||||
| Sun Trust Bank |
Greensboro | NC | — | (14) | 403 | 748 | — | 1,151 | 30 | 4/12/2013 | 1962 | |||||||||||||||||||||||
| Sun Trust Bank |
Travelers Rest | SC | — | (14) | 746 | 746 | — | 1,492 | 30 | 4/12/2013 | 1995 | |||||||||||||||||||||||
| Sun Trust Bank |
St. Simons Island | GA | — | (14) | 1,363 | 734 | — | 2,097 | 29 | 3/22/2013 | 1975 | |||||||||||||||||||||||
| Sun Trust Bank |
Pensacola | FL | — | (14) | 886 | 725 | — | 1,611 | 29 | 4/12/2013 | 1979 | |||||||||||||||||||||||
| Sun Trust Bank |
Concord | NC | — | (14) | 707 | 707 | — | 1,414 | 28 | 4/12/2013 | 1988 | |||||||||||||||||||||||
| Sun Trust Bank |
Lake Wales | FL | — | (14) | 671 | 671 | — | 1,342 | 27 | 3/22/2013 | 1988 | |||||||||||||||||||||||
| Sun Trust Bank |
Raleigh | NC | — | (14) | 658 | 658 | — | 1,316 | 26 | 3/22/2013 | 1997 | |||||||||||||||||||||||
| Sun Trust Bank |
Zebulon | NC | — | (14) | 515 | 630 | — | 1,145 | 25 | 3/22/2013 | 1972 | |||||||||||||||||||||||
| Sun Trust Bank |
Nashville | TN | — | (14) | 613 | 613 | — | 1,226 | 25 | 4/12/2013 | 1970 | |||||||||||||||||||||||
| Sun Trust Bank |
Belton | SC | — | (14) | 473 | 578 | — | 1,051 | 23 | 4/12/2013 | 1967 | |||||||||||||||||||||||
| Sun Trust Bank |
Burlington | NC | — | (14) | 446 | 545 | — | 991 | 22 | 4/12/2013 | 1995 | |||||||||||||||||||||||
| Sun Trust Bank |
Oakboro | NC | — | 360 | 540 | — | 900 | 12 | 7/23/2013 | 1970 | ||||||||||||||||||||||||
| Sun Trust Bank |
Carrboro | NC | — | (14) | 512 | 512 | — | 1,024 | 21 | 4/12/2013 | 1980 | |||||||||||||||||||||||
| Sun Trust Bank |
Cheriton | VA | — | (14) | 90 | 510 | — | 600 | 21 | 3/22/2013 | 1975 | |||||||||||||||||||||||
| Sun Trust Bank |
Atlanta | GA | — | (14) | 1,435 | 478 | — | 1,913 | 19 | 4/12/2013 | 1970 | |||||||||||||||||||||||
| Sun Trust Bank |
Lynchburg | VA | — | (14) | 251 | 466 | — | 717 | 19 | 3/22/2013 | 1973 | |||||||||||||||||||||||
| Sun Trust Bank |
Dunnellon | FL | — | (14) | 82 | 463 | — | 545 | 19 | 3/22/2013 | 1980 | |||||||||||||||||||||||
| Sun Trust Bank |
Norfolk | VA | — | (14) | 656 | 437 | — | 1,093 | 18 | 4/12/2013 | 1990 | |||||||||||||||||||||||
| Sun Trust Bank |
Richmond | VA | — | (14) | 277 | 416 | — | 693 | 17 | 3/22/2013 | 1959 | |||||||||||||||||||||||
| Sun Trust Bank |
Matthews | NC | — | (14) | 382 | 382 | — | 764 | 15 | 3/22/2013 | 1971 | |||||||||||||||||||||||
| Sun Trust Bank |
Yadkinville | NC | — | (14) | 200 | 371 | — | 571 | 15 | 4/12/2013 | 1975 | |||||||||||||||||||||||
| Sun Trust Bank |
Petersburg | VA | — | (14) | 102 | 306 | — | 408 | 12 | 4/12/2013 | 1975 | |||||||||||||||||||||||
| Sun Trust Bank |
Nashville | TN | — | 567 | 305 | — | 872 | 7 | 7/23/2013 | 1954 | ||||||||||||||||||||||||
| Sun Trust Bank |
La Vergne | TN | — | (14) | 171 | 209 | — | 380 | 8 | 3/22/2013 | 1985 | |||||||||||||||||||||||
| T.G.I. Friday’s |
Warwick | RI | — | 1,228 | 2,775 | — | 4,003 | 80 | 6/27/2013 | 1983 | ||||||||||||||||||||||||
| T.G.I. Friday’s |
Kentwood | MI | — | (14) | 281 | 2,533 | — | 2,814 | 63 | 7/31/2013 | 1983 | |||||||||||||||||||||||
| T.G.I. Friday’s |
Bismarck | ND | — | (14) | 1,038 | 1,928 | — | 2,966 | 48 | 7/31/2013 | 2000 | |||||||||||||||||||||||
| T.G.I. Friday’s |
Blasdell | NY | — | (14) | 1,215 | 1,913 | — | 3,128 | 55 | 6/27/2013 | 2000 | |||||||||||||||||||||||
| T.G.I. Friday’s |
Ann Arbor | MI | — | (14) | 547 | 1,640 | — | 2,187 | 41 | 7/31/2013 | 1998 | |||||||||||||||||||||||
| T.G.I. Friday’s |
Royal Palm Beach | FL | — | (14) | 1,530 | 1,530 | — | 3,060 | 38 | 7/31/2013 | 2001 | |||||||||||||||||||||||
| T.G.I. Friday’s |
Rochester | MN | — | (14) | 1,347 | 1,102 | — | 2,449 | 27 | 7/31/2013 | 1993 | |||||||||||||||||||||||
| T.G.I. Friday’s |
Novi | MI | — | (14) | 1,042 | 1,042 | — | 2,084 | 26 | 7/31/2013 | 1994 | |||||||||||||||||||||||
| Taco Bell |
Vacaville | CA | — | (14) | 522 | 1,513 | — | 2,035 | 42 | 6/27/2013 | 1985 | |||||||||||||||||||||||
| Taco Bell |
Suisun City | CA | — | (14) | 355 | 1,419 | — | 1,774 | 31 | 7/31/2013 | 1986 | |||||||||||||||||||||||
| Taco Bell |
Vacaville | CA | — | (14) | 1,184 | 1,375 | — | 2,559 | 38 | 6/27/2013 | 1994 | |||||||||||||||||||||||
| Taco Bell |
Fairfield | CA | — | (14) | 500 | 1,327 | — | 1,827 | 37 | 6/27/2013 | 1985 | |||||||||||||||||||||||
| Taco Bell |
Rancho Cucamonga | CA | — | (14) | 415 | 1,210 | — | 1,625 | 34 | 6/27/2013 | 1992 | |||||||||||||||||||||||
F-154
Table of Contents
| Initial Costs | Costs Capitalized Subsequent to Acquisition |
Gross Amount Carried at December 31, 2013 (10) (11) |
||||||||||||||||||||||||||||||||
| Property |
City |
State |
Encumbrances at December 31, 2013 |
Land | Buildings, Fixtures and Improvements |
Accumulated Depreciation (12)(13) |
Date Acquired |
Date of Construction | ||||||||||||||||||||||||||
| Taco Bell |
Corona | CA | — | (14) | 306 | 1,138 | — | 1,444 | 32 | 6/27/2013 | 1990 | |||||||||||||||||||||||
| Taco Bell |
North Corbin | KY | — | (14) | 139 | 1,082 | — | 1,221 | 30 | 6/27/2013 | 1986 | |||||||||||||||||||||||
| Taco Bell |
Cullman | AL | — | (14) | 375 | 1,053 | — | 1,428 | 29 | 6/27/2013 | 1988 | |||||||||||||||||||||||
| Taco Bell |
Fontana | CA | — | (14) | 524 | 1,016 | — | 1,540 | 28 | 6/27/2013 | 1992 | |||||||||||||||||||||||
| Taco Bell |
Moreno Valley | CA | — | (14) | 367 | 998 | — | 1,365 | 28 | 6/27/2013 | 1988 | |||||||||||||||||||||||
| Taco Bell |
Marion | IN | — | (14) | 496 | 921 | — | 1,417 | 20 | 7/31/2013 | 1994 | |||||||||||||||||||||||
| Taco Bell |
Winfield | AL | — | (14) | 278 | 834 | — | 1,112 | 18 | 7/31/2013 | 2008 | |||||||||||||||||||||||
| Taco Bell |
Westerville | OH | — | (14) | 354 | 827 | — | 1,181 | 18 | 7/31/2013 | 1992 | |||||||||||||||||||||||
| Taco Bell |
Jasper | AL | — | (14) | 445 | 814 | — | 1,259 | 23 | 6/27/2013 | 1987 | |||||||||||||||||||||||
| Taco Bell |
Dora | AL | — | (14) | 348 | 813 | — | 1,161 | 18 | 7/31/2013 | 1995 | |||||||||||||||||||||||
| Taco Bell |
Hilliard | OH | — | (14) | 424 | 787 | — | 1,211 | 17 | 7/31/2013 | 1991 | |||||||||||||||||||||||
| Taco Bell |
Hartselle | AL | — | (14) | 378 | 781 | — | 1,159 | 22 | 6/27/2013 | 1996 | |||||||||||||||||||||||
| Taco Bell |
Albertville | AL | — | (14) | 419 | 778 | — | 1,197 | 17 | 7/31/2013 | 2000 | |||||||||||||||||||||||
| Taco Bell |
Dayton | OH | — | (14) | 129 | 732 | — | 861 | 16 | 7/31/2013 | 1995 | |||||||||||||||||||||||
| Taco Bell |
Pickerington | OH | — | (14) | 470 | 705 | — | 1,175 | 15 | 7/31/2013 | 1991 | |||||||||||||||||||||||
| Taco Bell |
Detroit | MI | — | 124 | 704 | — | 828 | 15 | 7/31/2013 | 1989 | ||||||||||||||||||||||||
| Taco Bell |
Warrior | AL | — | (14) | 364 | 675 | — | 1,039 | 15 | 7/31/2013 | 1996 | |||||||||||||||||||||||
| Taco Bell |
Marysville | OH | — | (14) | 412 | 618 | — | 1,030 | 14 | 7/31/2013 | 1992 | |||||||||||||||||||||||
| Taco Bell |
Anniston | AL | — | 80 | 609 | — | 689 | 17 | 6/27/2013 | 2000 | ||||||||||||||||||||||||
| Taco Bell |
Kennesaw | GA | — | (14) | 162 | 601 | — | 763 | 17 | 6/27/2013 | 1984 | |||||||||||||||||||||||
| Taco Bell |
Moraine | OH | — | 280 | 505 | — | 785 | 14 | 6/27/2013 | 1985 | ||||||||||||||||||||||||
| Taco Bell / KFC |
Milwaukee | WI | — | (14) | 533 | 1,055 | — | 1,588 | 29 | 6/27/2013 | 1978 | |||||||||||||||||||||||
| Taco Bell / Pizza Hut |
Rubidoux | CA | — | (14) | 415 | 1,223 | — | 1,638 | 34 | 6/27/2013 | 1992 | |||||||||||||||||||||||
| Taco Bell / Pizza Hut |
Montclair | CA | — | (14) | 322 | 900 | — | 1,222 | 25 | 6/27/2013 | 1996 | |||||||||||||||||||||||
| Taco Bueno |
Arlington | TX | — | (14) | 597 | 895 | — | 1,492 | 20 | 7/31/2013 | 2000 | |||||||||||||||||||||||
| Taco Bueno |
Waco | TX | — | (14) | 595 | 893 | — | 1,488 | 20 | 7/31/2013 | 2000 | |||||||||||||||||||||||
| Taco Bueno |
Waco | TX | — | (14) | 595 | 892 | — | 1,487 | 20 | 7/31/2013 | 2000 | |||||||||||||||||||||||
| Taco Bueno |
Hutchinson | KS | — | (14) | 561 | 841 | — | 1,402 | 18 | 7/31/2013 | 2000 | |||||||||||||||||||||||
| Taco Bueno |
Springfield | MO | — | (14) | 753 | 753 | — | 1,506 | 17 | 7/31/2013 | 2006 | |||||||||||||||||||||||
| Taco Bueno |
Belton | MO | — | (14) | 476 | 701 | — | 1,177 | 19 | 6/27/2013 | 2006 | |||||||||||||||||||||||
| Taco Bueno |
Frisco | TX | — | (14) | 601 | 577 | — | 1,178 | 16 | 6/27/2013 | 2000 | |||||||||||||||||||||||
| Taco Bueno |
North Richland Hills | TX | — | (14) | 423 | 567 | — | 990 | 16 | 6/27/2013 | 2000 | |||||||||||||||||||||||
| Taco Bueno |
Lubbock | TX | — | (14) | 228 | 561 | — | 789 | 16 | 6/27/2013 | 2000 | |||||||||||||||||||||||
| Talbots |
Lakeville | MA | — | (14) | 6,302 | 25,199 | — | 31,501 | 897 | 5/17/2013 | 1987 | |||||||||||||||||||||||
| Texas Roadhouse |
Kenosha | WI | — | (14) | 1,061 | 1,835 | — | 2,896 | 53 | 6/27/2013 | 2001 | |||||||||||||||||||||||
| Tire Warehouse |
Bangor | ME | — | (14) | 289 | 1,400 | — | 1,689 | 39 | 6/27/2013 | 1977 | |||||||||||||||||||||||
| Tire Warehouse |
Fitchburg | MA | — | (14) | 203 | 704 | — | 907 | 20 | 6/27/2013 | 1982 | |||||||||||||||||||||||
| TitleMax |
Gainesville | GA | — | (14) | 221 | 270 | — | 491 | 7 | 7/31/2013 | 2007 | |||||||||||||||||||||||
| Tommy Addison’s |
Edgewood | FL | — | (14) | 366 | 447 | — | 813 | 11 | 7/31/2013 | 2003 | |||||||||||||||||||||||
| Tractor Supply |
Los Banos | CA | — | (14) | 1,213 | 3,638 | — | 4,851 | 145 | 2/28/2013 | 2009 | |||||||||||||||||||||||
| Tractor Supply |
Mims | FL | — | 310 | 2,787 | — | 3,097 | 33 | 10/10/2013 | 2012 | ||||||||||||||||||||||||
| Tractor Supply |
Plaistow | NH | — | 638 | 2,552 | — | 3,190 | 30 | 10/10/2013 | 2012 | ||||||||||||||||||||||||
| Tracy’s Seafood |
Port Arthur | TX | — | 43 | 72 | — | 115 | 2 | 6/27/2013 | 1998 | ||||||||||||||||||||||||
F-155
Table of Contents
| Initial Costs | Costs Capitalized Subsequent to Acquisition |
Gross Amount Carried at December 31, 2013 (10) (11) |
||||||||||||||||||||||||||||||||
| Property |
City |
State |
Encumbrances at December 31, 2013 |
Land | Buildings, Fixtures and Improvements |
Accumulated Depreciation (12)(13) |
Date Acquired |
Date of Construction | ||||||||||||||||||||||||||
| Tumbleweed |
Zanesville | OH | — | (14) | 639 | 1,491 | — | 2,130 | 37 | 7/31/2013 | 1998 | |||||||||||||||||||||||
| Tumbleweed |
Owensboro | KY | — | (14) | 355 | 1,420 | — | 1,775 | 35 | 7/31/2013 | 1997 | |||||||||||||||||||||||
| Tumbleweed |
Louisville | KY | — | (14) | 468 | 1,404 | — | 1,872 | 35 | 7/31/2013 | 2001 | |||||||||||||||||||||||
| Tumbleweed |
Terre Haute | IN | — | (14) | 434 | 1,303 | — | 1,737 | 32 | 7/31/2013 | 1997 | |||||||||||||||||||||||
| Tumbleweed |
Springfield | OH | — | (14) | 549 | 1,280 | — | 1,829 | 32 | 7/31/2013 | 1998 | |||||||||||||||||||||||
| Tumbleweed |
Bellefontaine | OH | — | (14) | 234 | 938 | — | 1,172 | 23 | 7/31/2013 | 1999 | |||||||||||||||||||||||
| Tumbleweed |
Mayesville | KY | — | (14) | 353 | 823 | — | 1,176 | 20 | 7/31/2013 | 2000 | |||||||||||||||||||||||
| Tumbleweed |
Wooster | OH | — | (14) | 342 | 799 | — | 1,141 | 20 | 7/31/2013 | 1997 | |||||||||||||||||||||||
| Vacant |
Albemarle | NC | — | 483 | 457 | — | 940 | 13 | 6/27/2013 | 1992 | ||||||||||||||||||||||||
| Velox Insurance |
Woodstock | GA | — | 155 | 127 | — | 282 | 3 | 7/31/2013 | 1988 | ||||||||||||||||||||||||
| Verizon Wireless |
Statesville | NC | — | 207 | 459 | — | 666 | 13 | 6/27/2013 | 1993 | ||||||||||||||||||||||||
| Waffle House |
Roanoke | VA | — | 176 | 327 | — | 503 | 7 | 7/31/2013 | 1987 | ||||||||||||||||||||||||
| Waffle House |
Cocoa | FL | — | 150 | 279 | — | 429 | 6 | 7/31/2013 | 1986 | ||||||||||||||||||||||||
| Walgreens |
Denver | CO | — | — | 4,050 | — | 4,050 | 122 | 7/2/2013 | 2008 | ||||||||||||||||||||||||
| Walgreens |
Castle Rock | CO | — | 1,581 | 3,689 | — | 5,270 | 111 | 7/11/2013 | 2002 | ||||||||||||||||||||||||
| Wendy’s |
Columbus | GA | — | (14) | 478 | 2,209 | — | 2,687 | 61 | 6/27/2013 | 2003 | |||||||||||||||||||||||
| Wendy’s |
Owego | NY | — | (14) | 101 | 1,915 | — | 2,016 | 42 | 7/31/2013 | 1989 | |||||||||||||||||||||||
| Wendy’s |
Pasadena | MD | — | (14) | 1,049 | 1,902 | — | 2,951 | 53 | 6/27/2013 | 1997 | |||||||||||||||||||||||
| Wendy’s |
El Paso | TX | — | (14) | 630 | 1,889 | — | 2,519 | 42 | 7/31/2013 | 1996 | |||||||||||||||||||||||
| Wendy’s |
Hamilton | OH | — | (14) | 655 | 1,848 | — | 2,503 | 51 | 6/27/2013 | 2001 | |||||||||||||||||||||||
| Wendy’s |
Columbus | GA | — | (14) | 701 | 1,787 | — | 2,488 | 50 | 6/27/2013 | 1999 | |||||||||||||||||||||||
| Wendy’s |
Kingwood | TX | — | (14) | 304 | 1,724 | — | 2,028 | 38 | 7/31/2013 | 2001 | |||||||||||||||||||||||
| Wendy’s |
Corning | NY | — | (14) | 191 | 1,717 | — | 1,908 | 38 | 7/31/2013 | 1996 | |||||||||||||||||||||||
| Wendy’s |
Richmond | IN | — | (14) | 735 | 1,716 | — | 2,451 | 38 | 7/31/2013 | 1989 | |||||||||||||||||||||||
| Wendy’s |
Albany | GA | — | (14) | 414 | 1,656 | — | 2,070 | 36 | 7/31/2013 | 2000 | |||||||||||||||||||||||
| Wendy’s |
Orange | CT | — | (14) | 1,343 | 1,641 | — | 2,984 | 36 | 7/31/2013 | 2003 | |||||||||||||||||||||||
| Wendy’s |
Woodbridge | VA | — | (14) | 1,193 | 1,598 | — | 2,791 | 44 | 6/27/2013 | 1996 | |||||||||||||||||||||||
| Wendy’s |
Arlington | TX | — | (14) | 1,322 | 1,546 | — | 2,868 | 43 | 6/27/2013 | 1994 | |||||||||||||||||||||||
| Wendy’s |
Middletown | OH | — | (14) | 494 | 1,481 | — | 1,975 | 33 | 7/31/2013 | 1977 | |||||||||||||||||||||||
| Wendy’s |
Fairborn | OH | — | (14) | 629 | 1,468 | — | 2,097 | 32 | 7/31/2013 | 1999 | |||||||||||||||||||||||
| Wendy’s |
Lake Wales | FL | — | (14) | 975 | 1,462 | — | 2,437 | 32 | 7/31/2013 | 1999 | |||||||||||||||||||||||
| Wendy’s |
Wintersville | OH | — | (14) | 621 | 1,450 | — | 2,071 | 32 | 7/31/2013 | 1977 | |||||||||||||||||||||||
| Wendy’s |
Kenosha | WI | — | (14) | 965 | 1,447 | — | 2,412 | 32 | 7/31/2013 | 1986 | |||||||||||||||||||||||
| Wendy’s |
Mcminnville | TN | — | (14) | 255 | 1,443 | — | 1,698 | 32 | 7/31/2013 | 1984 | |||||||||||||||||||||||
| Wendy’s |
Centerville | OH | — | (14) | 615 | 1,434 | — | 2,049 | 32 | 7/31/2013 | 1997 | |||||||||||||||||||||||
| Wendy’s |
Emporia | VA | — | (14) | 631 | 1,424 | — | 2,055 | 39 | 6/27/2013 | 1994 | |||||||||||||||||||||||
| Wendy’s |
Louisville | KY | — | (14) | 857 | 1,421 | — | 2,278 | 39 | 6/27/2013 | 2000 | |||||||||||||||||||||||
| Wendy’s |
Kankakee | IL | — | (14) | 250 | 1,419 | — | 1,669 | 31 | 7/31/2013 | 2005 | |||||||||||||||||||||||
| Wendy’s |
Hillsboro | OH | — | (14) | 291 | 1,408 | — | 1,699 | 39 | 6/27/2013 | 1985 | |||||||||||||||||||||||
| Wendy’s |
Cincinnati | OH | — | (14) | 939 | 1,408 | — | 2,347 | 31 | 7/31/2013 | 1980 | |||||||||||||||||||||||
| Wendy’s |
Fairborn | OH | — | (14) | 604 | 1,408 | — | 2,012 | 31 | 7/31/2013 | 1992 | |||||||||||||||||||||||
| Wendy’s |
Pounding Mill | VA | — | (14) | 296 | 1,404 | — | 1,700 | 39 | 6/27/2013 | 2004 | |||||||||||||||||||||||
| Wendy’s |
Dublin | VA | — | (14) | 384 | 1,402 | — | 1,786 | 39 | 6/27/2013 | 1993 | |||||||||||||||||||||||
F-156
Table of Contents
| Initial Costs | Costs Capitalized Subsequent to Acquisition |
Gross Amount Carried at December 31, 2013 (10) (11) |
||||||||||||||||||||||||||||||||
| Property |
City |
State |
Encumbrances at December 31, 2013 |
Land | Buildings, Fixtures and Improvements |
Accumulated Depreciation (12)(13) |
Date Acquired |
Date of Construction | ||||||||||||||||||||||||||
| Wendy’s |
Manchester | TN | — | (14) | 245 | 1,390 | — | 1,635 | 31 | 7/31/2013 | 1984 | |||||||||||||||||||||||
| Wendy’s |
Louisville | KY | — | (14) | 834 | 1,379 | — | 2,213 | 38 | 6/27/2013 | 2001 | |||||||||||||||||||||||
| Wendy’s |
Horseheads | NY | — | (14) | 72 | 1,369 | — | 1,441 | 30 | 7/31/2013 | 1982 | |||||||||||||||||||||||
| Wendy’s |
Hamilton | OH | — | (14) | 908 | 1,362 | — | 2,270 | 30 | 7/31/2013 | 2002 | |||||||||||||||||||||||
| Wendy’s |
Madison | WI | — | (14) | 454 | 1,362 | — | 1,816 | 30 | 7/31/2013 | 1998 | |||||||||||||||||||||||
| Wendy’s |
Hogansville | GA | — | (14) | 240 | 1,359 | — | 1,599 | 30 | 7/31/2013 | 1985 | |||||||||||||||||||||||
| Wendy’s |
Brentwood | TN | — | (14) | 339 | 1,356 | — | 1,695 | 30 | 7/31/2013 | 1982 | |||||||||||||||||||||||
| Wendy’s |
Milwaukee | WI | — | (14) | 338 | 1,351 | — | 1,689 | 30 | 7/31/2013 | 1985 | |||||||||||||||||||||||
| Wendy’s |
Oak Creek | WI | — | (14) | 577 | 1,347 | — | 1,924 | 30 | 7/31/2013 | 1999 | |||||||||||||||||||||||
| Wendy’s |
Dayton | OH | — | (14) | 723 | 1,343 | — | 2,066 | 30 | 7/31/2013 | 1977 | |||||||||||||||||||||||
| Wendy’s |
Springboro | OH | — | (14) | 891 | 1,336 | — | 2,227 | 29 | 7/31/2013 | 1979 | |||||||||||||||||||||||
| Wendy’s |
Auburn | AL | — | (14) | 718 | 1,334 | — | 2,052 | 29 | 7/31/2013 | 2000 | |||||||||||||||||||||||
| Wendy’s |
Saint Marys | WV | — | (14) | 70 | 1,322 | — | 1,392 | 29 | 7/31/2013 | 2001 | |||||||||||||||||||||||
| Wendy’s |
Fairburn | GA | — | (14) | 1,076 | 1,316 | — | 2,392 | 29 | 7/31/2013 | 2002 | |||||||||||||||||||||||
| Wendy’s |
Nashville | TN | — | (14) | 328 | 1,313 | — | 1,641 | 29 | 7/31/2013 | 1983 | |||||||||||||||||||||||
| Wendy’s |
Sharpsburg | GA | — | (14) | 649 | 1,299 | — | 1,948 | 36 | 6/27/2013 | 2002 | |||||||||||||||||||||||
| Wendy’s |
Connersville | IN | — | (14) | 324 | 1,298 | — | 1,622 | 29 | 7/31/2013 | 1989 | |||||||||||||||||||||||
| Wendy’s |
Hamilton | OH | — | (14) | 697 | 1,295 | — | 1,992 | 28 | 7/31/2013 | 1974 | |||||||||||||||||||||||
| Wendy’s |
Kenosha | WI | — | (14) | 322 | 1,290 | — | 1,612 | 28 | 7/31/2013 | 1984 | |||||||||||||||||||||||
| Wendy’s |
Germantown | WI | — | (14) | 419 | 1,257 | — | 1,676 | 28 | 7/31/2013 | 1989 | |||||||||||||||||||||||
| Wendy’s |
Endicott | NY | — | (14) | 313 | 1,253 | — | 1,566 | 28 | 7/31/2013 | 1987 | |||||||||||||||||||||||
| Wendy’s |
Parkersburg | WV | — | (14) | 311 | 1,243 | — | 1,554 | 27 | 7/31/2013 | 1977 | |||||||||||||||||||||||
| Wendy’s |
Fitchburg | WI | — | (14) | 662 | 1,230 | — | 1,892 | 27 | 7/31/2013 | 2003 | |||||||||||||||||||||||
| Wendy’s |
Louisville | KY | — | (14) | 532 | 1,221 | — | 1,753 | 34 | 6/27/2013 | 1998 | |||||||||||||||||||||||
| Wendy’s |
Corpus Christi | TX | — | (14) | 646 | 1,199 | — | 1,845 | 26 | 7/31/2013 | 1987 | |||||||||||||||||||||||
| Wendy’s |
Fort Smith | AR | — | 195 | 1,186 | — | 1,381 | 33 | 6/27/2013 | 1995 | ||||||||||||||||||||||||
| Wendy’s |
Columbus | GA | — | (14) | 743 | 1,185 | — | 1,928 | 33 | 6/27/2013 | 1988 | |||||||||||||||||||||||
| Wendy’s |
Phenix City | AL | — | (14) | 529 | 1,178 | — | 1,707 | 33 | 6/27/2013 | 2005 | |||||||||||||||||||||||
| Wendy’s |
Millville | NJ | — | 373 | 1,169 | — | 1,542 | 32 | 6/27/2013 | 1994 | ||||||||||||||||||||||||
| Wendy’s |
El Dorado | AR | — | 413 | 1,151 | — | 1,564 | 32 | 6/27/2013 | 1975 | ||||||||||||||||||||||||
| Wendy’s |
Greenfield | WI | — | (14) | 487 | 1,137 | — | 1,624 | 25 | 7/31/2013 | 2001 | |||||||||||||||||||||||
| Wendy’s |
Middletown | OH | — | (14) | 755 | 1,133 | — | 1,888 | 25 | 7/31/2013 | 1976 | |||||||||||||||||||||||
| Wendy’s |
Fairmont | WV | — | (14) | 224 | 1,119 | — | 1,343 | 31 | 6/27/2013 | 1983 | |||||||||||||||||||||||
| Wendy’s |
Sayre | PA | — | (14) | 372 | 1,115 | — | 1,487 | 25 | 7/31/2013 | 1994 | |||||||||||||||||||||||
| Wendy’s |
Nashville | TN | — | (14) | 592 | 1,100 | — | 1,692 | 24 | 7/31/2013 | 1983 | |||||||||||||||||||||||
| Wendy’s |
Murfreesboro | TN | — | (14) | 586 | 1,088 | — | 1,674 | 24 | 7/31/2013 | 1983 | |||||||||||||||||||||||
| Wendy’s |
Miamisburg | OH | — | (14) | 888 | 1,086 | — | 1,974 | 24 | 7/31/2013 | 1995 | |||||||||||||||||||||||
| Wendy’s |
Auburn | NY | — | (14) | 465 | 1,085 | — | 1,550 | 24 | 7/31/2013 | 1977 | |||||||||||||||||||||||
| Wendy’s |
West Allis | WI | — | (14) | 583 | 1,083 | — | 1,666 | 24 | 7/31/2013 | 1984 | |||||||||||||||||||||||
| Wendy’s |
Bourbonnais | IL | — | (14) | 346 | 1,039 | — | 1,385 | 23 | 7/31/2013 | 1993 | |||||||||||||||||||||||
| Wendy’s |
Stuttgart | AR | — | (14) | 67 | 1,038 | — | 1,105 | 29 | 6/27/2013 | 2001 | |||||||||||||||||||||||
| Wendy’s |
Baltimore | MD | — | (14) | 904 | 1,036 | — | 1,940 | 29 | 6/27/2013 | 1986 | |||||||||||||||||||||||
| Wendy’s |
Lancaster | OH | — | (14) | 552 | 1,025 | — | 1,577 | 23 | 7/31/2013 | 1984 | |||||||||||||||||||||||
F-157
Table of Contents
| Initial Costs | Costs Capitalized Subsequent to Acquisition |
Gross Amount Carried at December 31, 2013 (10) (11) |
||||||||||||||||||||||||||||||||
| Property |
City |
State |
Encumbrances at December 31, 2013 |
Land | Buildings, Fixtures and Improvements |
Accumulated Depreciation (12)(13) |
Date Acquired |
Date of Construction | ||||||||||||||||||||||||||
| Wendy’s |
Pine Bluff | AR | — | (14) | 221 | 1,022 | — | 1,243 | 28 | 6/27/2013 | 1989 | |||||||||||||||||||||||
| Wendy’s |
Benton | AR | — | 478 | 1,018 | — | 1,496 | 28 | 6/27/2013 | 1993 | ||||||||||||||||||||||||
| Wendy’s |
Fort Smith | AR | — | 63 | 1,016 | — | 1,079 | 28 | 6/27/2013 | 1995 | ||||||||||||||||||||||||
| Wendy’s |
Milwaukee | WI | — | (14) | 436 | 1,016 | — | 1,452 | 22 | 7/31/2013 | 1983 | |||||||||||||||||||||||
| Wendy’s |
Sheboygan | WI | — | (14) | 676 | 1,014 | — | 1,690 | 22 | 7/31/2013 | 1995 | |||||||||||||||||||||||
| Wendy’s |
Saint Bernard | OH | — | (14) | 432 | 1,009 | — | 1,441 | 22 | 7/31/2013 | 1985 | |||||||||||||||||||||||
| Wendy’s |
Lebanon | VA | — | (14) | 431 | 1,006 | — | 1,437 | 22 | 7/31/2013 | 1983 | |||||||||||||||||||||||
| Wendy’s |
Mokena | IL | — | (14) | 665 | 997 | — | 1,662 | 22 | 7/31/2013 | 1992 | |||||||||||||||||||||||
| Wendy’s |
Richmond | IN | — | (14) | 661 | 992 | — | 1,653 | 22 | 7/31/2013 | 1989 | |||||||||||||||||||||||
| Wendy’s |
Birmingham | AL | — | (14) | 562 | 990 | — | 1,552 | 27 | 6/27/2013 | 2005 | |||||||||||||||||||||||
| Wendy’s |
Ponca City | OK | — | (14) | 529 | 983 | — | 1,512 | 22 | 7/31/2013 | 1979 | |||||||||||||||||||||||
| Wendy’s |
South Hill | VA | — | 313 | 976 | — | 1,289 | 27 | 6/27/2013 | 1984 | ||||||||||||||||||||||||
| Wendy’s |
Hillsville | VA | — | (14) | 324 | 973 | — | 1,297 | 21 | 7/31/2013 | 2001 | |||||||||||||||||||||||
| Wendy’s |
Fairfield | OH | — | (14) | 794 | 971 | — | 1,765 | 21 | 7/31/2013 | 1981 | |||||||||||||||||||||||
| Wendy’s |
Janesville | WI | — | (14) | 647 | 971 | — | 1,618 | 21 | 7/31/2013 | 1991 | |||||||||||||||||||||||
| Wendy’s |
Parkersburg | WV | — | (14) | 241 | 964 | — | 1,205 | 21 | 7/31/2013 | 1996 | |||||||||||||||||||||||
| Wendy’s |
Joliet | IL | — | (14) | 642 | 963 | — | 1,605 | 21 | 7/31/2013 | 1977 | |||||||||||||||||||||||
| Wendy’s |
Cortland | NY | — | (14) | 635 | 952 | — | 1,587 | 21 | 7/31/2013 | 1984 | |||||||||||||||||||||||
| Wendy’s |
Norwich | CT | — | 703 | 937 | — | 1,640 | 26 | 6/27/2013 | 1980 | ||||||||||||||||||||||||
| Wendy’s |
Minden | LA | — | (14) | 182 | 936 | — | 1,118 | 26 | 6/27/2013 | 2001 | |||||||||||||||||||||||
| Wendy’s |
Bowling Green | OH | — | 502 | 932 | — | 1,434 | 20 | 7/31/2013 | 1994 | ||||||||||||||||||||||||
| Wendy’s |
Beloit | WI | — | (14) | 1,138 | 931 | — | 2,069 | 20 | 7/31/2013 | 2002 | |||||||||||||||||||||||
| Wendy’s |
West Chester | OH | — | (14) | 616 | 924 | — | 1,540 | 20 | 7/31/2013 | 2005 | |||||||||||||||||||||||
| Wendy’s |
Morrow | GA | — | (14) | 755 | 922 | — | 1,677 | 20 | 7/31/2013 | 1990 | |||||||||||||||||||||||
| Wendy’s |
Middletown | OH | — | (14) | 752 | 920 | — | 1,672 | 20 | 7/31/2013 | 1994 | |||||||||||||||||||||||
| Wendy’s |
Rogers | AR | — | 579 | 912 | — | 1,491 | 25 | 6/27/2013 | 1995 | ||||||||||||||||||||||||
| Wendy’s |
Searcy | AR | — | 247 | 905 | — | 1,152 | 25 | 6/27/2013 | 1978 | ||||||||||||||||||||||||
| Wendy’s |
Groton | CT | — | 1,099 | 900 | — | 1,999 | 20 | 7/31/2013 | 1978 | ||||||||||||||||||||||||
| Wendy’s |
Anderson | SC | — | 734 | 897 | — | 1,631 | 20 | 7/31/2013 | 1979 | ||||||||||||||||||||||||
| Wendy’s |
Wytheville | VA | — | (14) | 598 | 897 | — | 1,495 | 20 | 7/31/2013 | 2003 | |||||||||||||||||||||||
| Wendy’s |
Springdale | AR | — | 323 | 896 | — | 1,219 | 25 | 6/27/2013 | 1994 | ||||||||||||||||||||||||
| Wendy’s |
Pendleton | IN | — | (14) | 448 | 895 | — | 1,343 | 25 | 6/27/2013 | 2005 | |||||||||||||||||||||||
| Wendy’s |
Enid | OK | — | (14) | 158 | 893 | — | 1,051 | 20 | 7/31/2013 | 2003 | |||||||||||||||||||||||
| Wendy’s |
Buckhannon | WV | — | (14) | 157 | 890 | — | 1,047 | 20 | 7/31/2013 | 1987 | |||||||||||||||||||||||
| Wendy’s |
Parkersburg | WV | — | (14) | 295 | 885 | — | 1,180 | 19 | 7/31/2013 | 1979 | |||||||||||||||||||||||
| Wendy’s |
Binghamton | NY | — | (14) | 293 | 879 | — | 1,172 | 19 | 7/31/2013 | 1978 | |||||||||||||||||||||||
| Wendy’s |
Little Rock | AR | — | 278 | 878 | — | 1,156 | 24 | 6/27/2013 | 1976 | ||||||||||||||||||||||||
| Wendy’s |
Batesville | AR | — | 155 | 878 | — | 1,033 | 19 | 7/31/2013 | 1995 | ||||||||||||||||||||||||
| Wendy’s |
Buckeye Lake | OH | — | (14) | 864 | 877 | — | 1,741 | 24 | 6/27/2013 | 2000 | |||||||||||||||||||||||
| Wendy’s |
Ripley | WV | — | (14) | 273 | 871 | — | 1,144 | 24 | 6/27/2013 | 1984 | |||||||||||||||||||||||
| Wendy’s |
West Carrollton | OH | — | (14) | 708 | 865 | — | 1,573 | 19 | 7/31/2013 | 1979 | |||||||||||||||||||||||
| Wendy’s |
Whitehall | OH | — | (14) | 716 | 863 | — | 1,579 | 24 | 6/27/2013 | 1983 | |||||||||||||||||||||||
| Wendy’s |
North Myrtle Beach | SC | — | 464 | 861 | — | 1,325 | 19 | 7/31/2013 | 1983 | ||||||||||||||||||||||||
F-158
Table of Contents
| Initial Costs | Costs Capitalized Subsequent to Acquisition |
Gross Amount Carried at December 31, 2013 (10) (11) |
||||||||||||||||||||||||||||||||
| Property |
City |
State |
Encumbrances at December 31, 2013 |
Land | Buildings, Fixtures and Improvements |
Accumulated Depreciation (12)(13) |
Date Acquired |
Date of Construction | ||||||||||||||||||||||||||
| Wendy’s |
Hayes | VA | — | (14) | 304 | 859 | — | 1,163 | 24 | 6/27/2013 | 1992 | |||||||||||||||||||||||
| Wendy’s |
Lynn Haven | FL | — | (14) | 446 | 852 | — | 1,298 | 24 | 6/27/2013 | 2005 | |||||||||||||||||||||||
| Wendy’s |
Panama City | FL | — | (14) | 445 | 837 | — | 1,282 | 23 | 6/27/2013 | 1987 | |||||||||||||||||||||||
| Wendy’s |
Conway | AR | — | 482 | 833 | — | 1,315 | 23 | 6/27/2013 | 1994 | ||||||||||||||||||||||||
| Wendy’s |
Fayetteville | AR | — | 408 | 830 | — | 1,238 | 23 | 6/27/2013 | 1994 | ||||||||||||||||||||||||
| Wendy’s |
Payson | AZ | — | 679 | 829 | — | 1,508 | 18 | 7/31/2013 | 1986 | ||||||||||||||||||||||||
| Wendy’s |
Springdale | AR | — | 410 | 821 | — | 1,231 | 23 | 6/27/2013 | 1995 | ||||||||||||||||||||||||
| Wendy’s |
Bridgeport | WV | — | (14) | 273 | 818 | — | 1,091 | 18 | 7/31/2013 | 1984 | |||||||||||||||||||||||
| Wendy’s |
Milwaukee | WI | — | (14) | 810 | 810 | — | 1,620 | 18 | 7/31/2013 | 1979 | |||||||||||||||||||||||
| Wendy’s |
Burlington | WA | — | 425 | 806 | — | 1,231 | 22 | 6/27/2013 | 1994 | ||||||||||||||||||||||||
| Wendy’s |
Baltimore | MD | — | (14) | 760 | 802 | — | 1,562 | 22 | 6/27/2013 | 1995 | |||||||||||||||||||||||
| Wendy’s |
The Dalles | OR | — | 201 | 802 | — | 1,003 | 18 | 7/31/2013 | 1994 | ||||||||||||||||||||||||
| Wendy’s |
Eatontown | NJ | — | (14) | 651 | 796 | — | 1,447 | 17 | 7/31/2013 | 1987 | |||||||||||||||||||||||
| Wendy’s |
Baton Rouge | LA | — | 316 | 782 | — | 1,098 | 22 | 6/27/2013 | 1998 | ||||||||||||||||||||||||
| Wendy’s |
Douglasville | GA | — | 605 | 776 | — | 1,381 | 21 | 6/27/2013 | 1993 | ||||||||||||||||||||||||
| Wendy’s |
Lithia Springs | GA | — | (14) | 668 | 774 | — | 1,442 | 21 | 6/27/2013 | 1998 | |||||||||||||||||||||||
| Wendy’s |
Little Rock | AR | — | 773 | 773 | — | 1,546 | 17 | 7/31/2013 | 1994 | ||||||||||||||||||||||||
| Wendy’s |
West Chester | OH | — | (14) | 944 | 772 | — | 1,716 | 17 | 7/31/2013 | 1982 | |||||||||||||||||||||||
| Wendy’s |
Titusville | FL | — | 414 | 770 | — | 1,184 | 17 | 7/31/2013 | 1996 | ||||||||||||||||||||||||
| Wendy’s |
Titusville | FL | — | (14) | 415 | 761 | — | 1,176 | 21 | 6/27/2013 | 1984 | |||||||||||||||||||||||
| Wendy’s |
Crossville | TN | — | (14) | 190 | 760 | — | 950 | 17 | 7/31/2013 | 1978 | |||||||||||||||||||||||
| Wendy’s |
Anderson | IN | — | (14) | 505 | 757 | — | 1,262 | 17 | 7/31/2013 | 1995 | |||||||||||||||||||||||
| Wendy’s |
Van Buren | AR | — | 197 | 748 | — | 945 | 21 | 6/27/2013 | 1994 | ||||||||||||||||||||||||
| Wendy’s |
New Berlin | WI | — | (14) | 903 | 739 | — | 1,642 | 16 | 7/31/2013 | 1983 | |||||||||||||||||||||||
| Wendy’s |
Anderson | IN | — | (14) | 872 | 736 | — | 1,608 | 20 | 6/27/2013 | 1978 | |||||||||||||||||||||||
| Wendy’s |
Madison Heights | MI | — | (14) | 198 | 725 | — | 923 | 20 | 6/27/2013 | 1998 | |||||||||||||||||||||||
| Wendy’s |
Savannah | GA | — | (14) | 720 | 720 | — | 1,440 | 16 | 7/31/2013 | 2001 | |||||||||||||||||||||||
| Wendy’s |
Anderson | IN | — | (14) | 584 | 713 | — | 1,297 | 16 | 7/31/2013 | 1976 | |||||||||||||||||||||||
| Wendy’s |
Bentonville | AR | — | 648 | 708 | — | 1,356 | 20 | 6/27/2013 | 1993 | ||||||||||||||||||||||||
| Wendy’s |
Anderson | IN | — | (14) | 859 | 708 | — | 1,567 | 20 | 6/27/2013 | 1978 | |||||||||||||||||||||||
| Wendy’s |
Cabot | AR | — | 524 | 707 | — | 1,231 | 20 | 6/27/2013 | 1991 | ||||||||||||||||||||||||
| Wendy’s |
Mechanicsville | VA | — | (14) | 521 | 704 | — | 1,225 | 20 | 6/27/2013 | 1988 | |||||||||||||||||||||||
| Wendy’s |
Vienna | WV | — | (14) | 301 | 702 | — | 1,003 | 15 | 7/31/2013 | 1976 | |||||||||||||||||||||||
| Wendy’s |
Melbourne | FL | — | (14) | 550 | 681 | — | 1,231 | 19 | 6/27/2013 | 1993 | |||||||||||||||||||||||
| Wendy’s |
Tinton Falls | NJ | — | 874 | 671 | — | 1,545 | 19 | 6/27/2013 | 1977 | ||||||||||||||||||||||||
| Wendy’s |
Creedmoor | NC | — | 533 | 663 | — | 1,196 | 18 | 6/27/2013 | 1986 | ||||||||||||||||||||||||
| Wendy’s |
Little Rock | AR | — | (14) | 532 | 650 | — | 1,182 | 14 | 7/31/2013 | 1978 | |||||||||||||||||||||||
| Wendy’s |
Russellville | AR | — | 356 | 638 | — | 994 | 18 | 6/27/2013 | 1985 | ||||||||||||||||||||||||
| Wendy’s |
Arkadelphia | AR | — | 225 | 633 | — | 858 | 18 | 6/27/2013 | 1990 | ||||||||||||||||||||||||
| Wendy’s |
Greenville | SC | — | 516 | 631 | — | 1,147 | 14 | 7/31/2013 | 1975 | ||||||||||||||||||||||||
| Wendy’s |
San Antonio | TX | — | 268 | 630 | — | 898 | 17 | 6/27/2013 | 1985 | ||||||||||||||||||||||||
| Wendy’s |
Christiansburg | VA | — | (14) | 416 | 624 | — | 1,040 | 14 | 7/31/2013 | 1980 | |||||||||||||||||||||||
| Wendy’s |
Little Rock | AR | — | 990 | 623 | — | 1,613 | 17 | 6/27/2013 | 1982 | ||||||||||||||||||||||||
F-159
Table of Contents
| Initial Costs | Costs Capitalized Subsequent to Acquisition |
Gross Amount Carried at December 31, 2013 (10) (11) |
||||||||||||||||||||||||||||||||
| Property |
City |
State |
Encumbrances at December 31, 2013 |
Land | Buildings, Fixtures and Improvements |
Accumulated Depreciation (12)(13) |
Date Acquired |
Date of Construction | ||||||||||||||||||||||||||
| Wendy’s |
Woodbridge | VA | — | (14) | 521 | 615 | — | 1,136 | 17 | 6/27/2013 | 1978 | |||||||||||||||||||||||
| Wendy’s |
Indialantic | FL | — | (14) | 592 | 614 | — | 1,206 | 17 | 6/27/2013 | 1985 | |||||||||||||||||||||||
| Wendy’s |
North Haven | CT | — | 729 | 610 | — | 1,339 | 17 | 6/27/2013 | 1980 | ||||||||||||||||||||||||
| Wendy’s |
Conway | AR | — | 478 | 594 | — | 1,072 | 16 | 6/27/2013 | 1985 | ||||||||||||||||||||||||
| Wendy’s |
Anniston | AL | — | (14) | 454 | 591 | — | 1,045 | 16 | 6/27/2013 | 1976 | |||||||||||||||||||||||
| Wendy’s |
Merritt Island | FL | — | 720 | 589 | — | 1,309 | 13 | 7/31/2013 | 1990 | ||||||||||||||||||||||||
| Wendy’s |
Bryant | AR | — | 529 | 575 | — | 1,104 | 16 | 6/27/2013 | 1995 | ||||||||||||||||||||||||
| Wendy’s |
Spartanburg | SC | — | 699 | 572 | — | 1,271 | 13 | 7/31/2013 | 1977 | ||||||||||||||||||||||||
| Wendy’s |
Port Orange | FL | — | (14) | 695 | 569 | — | 1,264 | 13 | 7/31/2013 | 1996 | |||||||||||||||||||||||
| Wendy’s |
Cocoa | FL | — | (14) | 249 | 567 | — | 816 | 16 | 6/27/2013 | 1979 | |||||||||||||||||||||||
| Wendy’s |
Ormond Beach | FL | — | (14) | 626 | 561 | — | 1,187 | 16 | 6/27/2013 | 1994 | |||||||||||||||||||||||
| Wendy’s |
North Tazewell | VA | — | 124 | 560 | — | 684 | 16 | 6/27/2013 | 1980 | ||||||||||||||||||||||||
| Wendy’s |
Stockbridge | GA | — | 480 | 558 | — | 1,038 | 15 | 6/27/2013 | 1897 | ||||||||||||||||||||||||
| Wendy’s |
North Little Rock | AR | — | 420 | 551 | — | 971 | 15 | 6/27/2013 | 1978 | ||||||||||||||||||||||||
| Wendy’s |
Memphis | TN | — | 227 | 530 | — | 757 | 12 | 7/31/2013 | 1980 | ||||||||||||||||||||||||
| Wendy’s |
Panama City | FL | — | (14) | 461 | 529 | — | 990 | 15 | 6/27/2013 | 1984 | |||||||||||||||||||||||
| Wendy’s |
Tallahassee | FL | — | (14) | 952 | 514 | — | 1,466 | 14 | 6/27/2013 | 1986 | |||||||||||||||||||||||
| Wendy’s |
Austell | GA | — | (14) | 383 | 506 | — | 889 | 14 | 6/27/2013 | 1994 | |||||||||||||||||||||||
| Wendy’s |
Indianapolis | IN | — | 214 | 505 | — | 719 | 14 | 6/27/2013 | 1985 | ||||||||||||||||||||||||
| Wendy’s |
Tallahassee | FL | — | (14) | 855 | 505 | — | 1,360 | 14 | 6/27/2013 | 1986 | |||||||||||||||||||||||
| Wendy’s |
Ormond Beach | FL | — | (14) | 503 | 503 | — | 1,006 | 11 | 7/31/2013 | 1984 | |||||||||||||||||||||||
| Wendy’s |
Little Rock | AR | — | 501 | 501 | — | 1,002 | 11 | 7/31/2013 | 1983 | ||||||||||||||||||||||||
| Wendy’s |
Bellevue | NE | — | (14) | 338 | 484 | — | 822 | 13 | 6/27/2013 | 1981 | |||||||||||||||||||||||
| Wendy’s |
Eastman | GA | — | (14) | 258 | 473 | — | 731 | 13 | 6/27/2013 | 1996 | |||||||||||||||||||||||
| Wendy’s |
Little Rock | AR | — | 605 | 463 | — | 1,068 | 13 | 6/27/2013 | 1987 | ||||||||||||||||||||||||
| Wendy’s |
Fayetteville | AR | — | (14) | 463 | 463 | — | 926 | 10 | 7/31/2013 | 1989 | |||||||||||||||||||||||
| Wendy’s |
San Antonio | TX | — | 410 | 451 | — | 861 | 13 | 6/27/2013 | 1987 | ||||||||||||||||||||||||
| Wendy’s |
Columbia | SC | — | 425 | 438 | — | 863 | 12 | 6/27/2013 | 1993 | ||||||||||||||||||||||||
| Wendy’s |
Brunswick | GA | — | (14) | 306 | 435 | — | 741 | 12 | 6/27/2013 | 1985 | |||||||||||||||||||||||
| Wendy’s |
Pine Bluff | AR | — | 105 | 433 | — | 538 | 12 | 6/27/2013 | 1978 | ||||||||||||||||||||||||
| Wendy’s |
South Daytona | FL | — | (14) | 531 | 432 | — | 963 | 12 | 6/27/2013 | 1980 | |||||||||||||||||||||||
| Wendy’s |
Starke | FL | — | 383 | 419 | — | 802 | 12 | 6/27/2013 | 1979 | ||||||||||||||||||||||||
| Wendy’s |
Smyrna | GA | — | 693 | 416 | — | 1,109 | 12 | 6/27/2013 | 1990 | ||||||||||||||||||||||||
| Wendy’s |
Hot Springs | AR | — | 593 | 395 | — | 988 | 9 | 7/31/2013 | 1974 | ||||||||||||||||||||||||
| Wendy’s |
New Smyrna Beach | FL | — | (14) | 476 | 394 | — | 870 | 11 | 6/27/2013 | 1982 | |||||||||||||||||||||||
| Wendy’s |
San Antonio | TX | — | 320 | 320 | — | 640 | 9 | 6/27/2013 | 1985 | ||||||||||||||||||||||||
| Wendy’s |
Suitland | MD | — | (14) | 332 | 275 | — | 607 | 8 | 6/27/2013 | 1979 | |||||||||||||||||||||||
| Wendy’s |
Landover | MD | — | (14) | 340 | 267 | — | 607 | 7 | 6/27/2013 | 1978 | |||||||||||||||||||||||
| Wendy’s |
Springs | TX | — | 217 | 266 | — | 483 | 6 | 7/31/2013 | 1987 | ||||||||||||||||||||||||
| Wendy’s |
Little Rock | AR | — | 762 | 258 | — | 1,020 | 7 | 6/27/2013 | 1977 | ||||||||||||||||||||||||
| Wendy’s |
Titusville | FL | — | (14) | 528 | 239 | — | 767 | 7 | 6/27/2013 | 1978 | |||||||||||||||||||||||
| Wendy’s |
Homewood | AL | — | 995 | — | — | 995 | — | 6/27/2013 | N/A | ||||||||||||||||||||||||
| Wendy’s |
Columbia | SC | — | 1,368 | — | — | 1,368 | — | 6/27/2013 | N/A | ||||||||||||||||||||||||
F-160
Table of Contents
| Initial Costs | Costs Capitalized Subsequent to Acquisition |
Gross Amount Carried at December 31, 2013 (10) (11) |
||||||||||||||||||||||||||||||||
| Property |
City |
State |
Encumbrances at December 31, 2013 |
Land | Buildings, Fixtures and Improvements |
Accumulated Depreciation (12)(13) |
Date Acquired |
Date of Construction | ||||||||||||||||||||||||||
| Wendy’s |
Edmond | OK | — | 791 | — | — | 791 | — | 7/31/2013 | 1979 | ||||||||||||||||||||||||
| West Fork Roadhouse |
Youngstown | OH | — | 139 | 232 | — | 371 | 7 | 6/27/2013 | 1976 | ||||||||||||||||||||||||
| Whataburger |
El Campo | TX | — | 693 | 1,013 | — | 1,706 | 28 | 6/27/2013 | 1986 | ||||||||||||||||||||||||
| Whataburger |
Edna | TX | — | (14) | 290 | 869 | — | 1,159 | 19 | 7/31/2013 | 1986 | |||||||||||||||||||||||
| Whataburger |
Lubbock | TX | — | (14) | 432 | 647 | — | 1,079 | 14 | 7/31/2013 | 1992 | |||||||||||||||||||||||
| Whataburger |
Ingleside | TX | — | 1,106 | 474 | — | 1,580 | 10 | 7/31/2013 | 1986 | ||||||||||||||||||||||||
| Williams Fried Chicken |
Garland | TX | — | 265 | 137 | — | 402 | 4 | 6/27/2013 | 1983 | ||||||||||||||||||||||||
| Winn Dixie |
Jacksonville | FL | — | (14) | 4,360 | 82,825 | — | 87,185 | 2,736 | 4/24/2013 | 2000 | |||||||||||||||||||||||
| Zebb’s |
Amherst | NY | — | (14) | 150 | 1,347 | — | 1,497 | 33 | 7/31/2013 | 1994 | |||||||||||||||||||||||
| Zebb’s |
Orchard Park | NY | — | (14) | 69 | 1,320 | — | 1,389 | 33 | 7/31/2013 | 2000 | |||||||||||||||||||||||
| Zebb’s |
Rochester | NY | — | (14) | 126 | 1,137 | — | 1,263 | 28 | 7/31/2013 | 1990 | |||||||||||||||||||||||
| Zebb’s |
New Hartford | NY | — | (14) | 122 | 1,095 | — | 1,217 | 27 | 7/31/2013 | 1970 | |||||||||||||||||||||||
| Z’Tejas Grill |
Austin | TX | — | (14) | 837 | 1,797 | — | 2,634 | 52 | 6/27/2013 | 2007 | |||||||||||||||||||||||
| Capitalized land value on DFLs |
— | 6,932 | — | — | 6,932 | — | ||||||||||||||||||||||||||||
| Encumbrances allocated based on notes below |
2,152,878 | |||||||||||||||||||||||||||||||||
|
|
|
|
|
|
|
|
|
|
|
|
|
|||||||||||||||||||||||
| Total |
$ | 3,228,461 | $ | 1,382,232 | $ | 5,311,406 | $ | 5,909 | $ | 6,699,547 | $ | 205,712 | ||||||||||||||||||||||
|
|
|
|
|
|
|
|
|
|
|
|
|
|||||||||||||||||||||||
| (1) | These properties collateralize a senior corporate credit facility of up to $2.42 billion, which had $1.06 billion outstanding as of December 31, 2013. |
| (2) | These properties collateralize a $150.0 million secured credit facility, which had $150.0 million outstanding as of December 31, 2013. |
| (3) | These properties collateralize a $54.3 million mortgage note payable of which $54.3 million was outstanding as of December 31, 2013. |
| (4) | These properties collateralize a $48.5 million mortgage note payable of which $48.5 million was outstanding as of December 31, 2013. |
| (5) | These properties collateralize a $36.6 million mortgage note payable of which $36.6 million was outstanding as of December 31, 2013. |
| (6) | These properties collateralize a $12.3 million mortgage note payable of which $12.3 million was outstanding as of December 31, 2013. |
| (7) | These properties collateralize a $15.0 million mortgage note payable of which $15.0 million was outstanding as of December 31, 2013. |
| (8) | These properties collateralize a $4.5 million mortgage note payable of which $4.5 million was outstanding as of December 31, 2013. |
| (9) | These properties collateralize a $11.9 million mortgage note payable of which $11.9 million was outstanding as of December 31, 2013. |
| (10) | Acquired intangible lease assets allocated to individual properties in the amount of $759.6 million are not reflected in the table above. |
| (11) | The tax basis of aggregate land, buildings and improvements as of December 31, 2013 was $5.1 million. |
| (12) | The accumulated depreciation column excludes $48.1 million of amortization associated with acquired intangible lease assets. |
| (13) | Depreciation is computed using the straight-line method over the estimated useful lives of up to forty years for buildings, five to fifteen years for building fixtures and improvements. |
| (14) | These properties collateralize a senior corporate facility of up to $800.0 million, which had $760.0 million outstanding as of December 31, 2013. |
A summary of activity for real estate and accumulated depreciation for the year ended December 31, 2013 (amounts in thousands):
| Year ended December 31, 2013 | ||||
| Real estate investments, at cost: |
||||
| Balance at beginning of year |
$ | 1,684,115 | ||
| Additions - acquisitions and improvements |
5,019,135 | |||
| Deductions - impairments |
(3,703 | ) | ||
|
|
|
|||
| Balance at end of the year |
$ | 6,699,547 | ||
|
|
|
|||
| Accumulated depreciation: |
||||
| Balance at beginning of year |
$ | 45,050 | ||
| Depreciation expense |
160,662 | |||
|
|
|
|||
| Balance at end of the year |
$ | 205,712 | ||
|
|
|
|||
F-161
Table of Contents
AMERICAN REALTY CAPITAL PROPERTIES, INC.
SCHEDULE IV
December 31, 2013
(In thousands)
| Description |
Location |
Interest Rate |
Final Maturity Date |
Periodic Payment Terms |
Prior Liens |
Face Amount of Mortgages |
Carrying Amount of Mortgages |
Principal Amount of Loans Subject to Delinquent Principal or Interest |
||||||||||||||||
| Long-Term Mortgage Loans |
||||||||||||||||||||||||
| Bank Of America, N.A. |
Mt. Airy, MD | 6.42 | % | Dec 2026 | Principal and interest are payable monthly at a varying amount over the life to maturity |
$ | 2,973 | $ | 3,329 | $ | — | |||||||||||||
| CVS Caremark Corporation |
Evansville, IN | 6.22 | % | Jan 2033 | Principal and interest are payable monthly at a level amount over the life to maturity |
2,932 | 3,268 | — | ||||||||||||||||
| CVS Caremark Corporation |
Greensboro, GA | 6.52 | % | Jan 2030 | Principal and interest are payable monthly at a level amount over the life to maturity |
1,133 | 1,289 | — | ||||||||||||||||
| CVS Caremark Corporation |
Shelby Twp., MI | 5.98 | % | Jan 2031 | Principal and interest are payable monthly at a varying amount over the life to maturity |
2,237 | 2,443 | — | ||||||||||||||||
| Koninklijke Ahold, N.V. |
Bensalem, PA | 7.24 | % | May 2020 | Principal and interest are payable monthly at a varying amount over the life to maturity |
2,083 | 2,384 | — | ||||||||||||||||
| Lowes Companies, Inc. |
Framingham, MA | N/A | Sep 2031 | Principal and interest are payable monthly at a varying amount over the life to maturity |
5,692 | 1,399 | — | |||||||||||||||||
| Walgreen Co. |
Dallas, TX | 6.46 | % | Dec 2029 | Principal and interest are payable monthly at a level amount over the life to maturity |
2,851 | 3,231 | — | ||||||||||||||||
| Walgreen Co. |
Nacogdoches, TX | 6.8 | % | Sep 2030 | Principal and interest are payable monthly at a level amount over the life to maturity |
3,084 | 3,561 | — | ||||||||||||||||
| Walgreen Co. |
Rosemead, CA | 6.26 | % | Dec 2029 | Principal and interest are payable monthly at a level amount over the life to maturity |
4,369 | 4,888 | — | ||||||||||||||||
|
|
|
|
|
|
|
|||||||||||||||||||
| $ | 27,354 | $ | 25,792 | $ | — | |||||||||||||||||||
| Corporate Credit Notes |
||||||||||||||||||||||||
| Federal Express Corporation |
Bellingham, WA | 5.78 | % | Mar 2015 | Principal and interest are payable monthly at a level amount over the life to maturity |
$ | 81 | $ | 83 | $ | — | |||||||||||||
| Lowes Companies, Inc. |
N. Windham, ME | 5.28 | % | Sep 2015 | Principal and interest are payable monthly at a level amount over the life to maturity |
256 | 261 | — | ||||||||||||||||
| Walgreen Co. |
Jefferson City, TN | 5.49 | % | May 2015 | Principal and interest are payable monthly at a level amount over the life to maturity |
140 | 143 | — | ||||||||||||||||
|
|
|
|
|
|
|
|||||||||||||||||||
| $ | 477 | $ | 487 | $ | — | |||||||||||||||||||
|
|
|
|
|
|
|
|||||||||||||||||||
| Total |
$ | 27,831 | $ | 26,279 | $ | — | ||||||||||||||||||
|
|
|
|
|
|
|
|||||||||||||||||||
| Carrying Amount of Mortgages |
||||
| Balance - November 5, 2013 |
$ | 26,457 | ||
| Additions during the year: |
||||
| New Loan Investments |
— | |||
| Deductions during the year: |
||||
| Principal received |
(164 | ) | ||
| Allowance for loan losses |
— | |||
| Amortization of unearned discounts and premiums |
(14 | ) | ||
|
|
|
|||
| Balance - December 31, 2013 |
$ | 26,279 | ||
|
|
|
|||
F-162