Attached files
| file | filename |
|---|---|
| EXCEL - IDEA: XBRL DOCUMENT - TOOTSIE ROLL INDUSTRIES INC | Financial_Report.xls |
| EX-32 - EX-32 - TOOTSIE ROLL INDUSTRIES INC | tr-20141231xex32.htm |
| EX-31.1 - EX-31.1 - TOOTSIE ROLL INDUSTRIES INC | tr-20141231ex3110a9ab5.htm |
| EX-21 - EX-21 - TOOTSIE ROLL INDUSTRIES INC | tr-20141231ex21b4c3d45.htm |
| EX-31.2 - EX-31.2 - TOOTSIE ROLL INDUSTRIES INC | tr-20141231ex31293eddf.htm |
| 10-K - 10-K - TOOTSIE ROLL INDUSTRIES INC | tr-20141231x10k.htm |

Melvin J. Gordon
1919 - 2015
On January 20, 2015, Melvin J. Gordon, Chairman of the Board of Directors and Chief Executive Officer of Tootsie Roll Industries, passed away at the age of 95 after a brief illness. Mr. Gordon joined the board of what was then Sweets Company of America in 1952 and was elevated to the roles of Chairman and CEO in 1962. Sales at that time were $25 million, profits were $1 million and our product line primarily consisted of Tootsie Rolls and Tootsie Pops.
Mr. Gordon, a man of great vision and drive, reshaped the Company over his long tenure. Early on, he changed the Company's name to Tootsie Roll Industries in recognition of the flagship brand and relocated the Company to a large, centrally located facility in Chicago which remains the Company's headquarters and its largest plant. He expanded operations into Mexico and led the Company through a series of complementary acquisitions which added Dots, Crows, Cella's, Charms, Blow Pop, Junior Mints, Charleston Chew, Sugar Daddy, Sugar Babies, Fluffy Stuff, Andes, Dubble Bubble, Cry Baby and Nik-L-Nip to our portfolio of well-known brands.
Mr. Gordon embraced change and was quick to adopt rapidly evolving technological developments in manufacturing, material handling and information technology. He also directed the development of new products and package configurations to meet changing consumer preferences and evolving trade channels. Throughout his many years as Chairman, the Company saw great growth and success. Today Tootsie Roll is a leading confectioner with a diverse portfolio of well-known brands, seven plants across the United States, Canada and Mexico, and sales in many countries throughout the world.
Mr. Gordon's life represented the very highest values in business, wisdom, generosity, and integrity. His dedication to Tootsie Roll for over fifty years as Board Chair, his creativity, his optimism and his relentless determination to succeed were an inspiration to all who knew him.
1
Corporate Principles
We believe that the differences among companies are attributable to the caliber of their people, and therefore we strive to attract and retain superior people for each job.
We believe that an open family atmosphere at work combined with professional management fosters cooperation and enables each individual to maximize his or her contribution to the Company and realize the corresponding rewards.
We do not jeopardize long-term growth for immediate, short-term results.
We maintain a conservative financial posture in the deployment and management of our assets.
We run a trim operation and continually strive to eliminate waste, minimize cost and implement performance improvements.
We invest in the latest and most productive equipment to deliver the best quality product to our customers at the lowest cost.
We seek to outsource functions where appropriate and to vertically integrate operations where it is financially advantageous to do so.
We view our well known brands as prized assets to be aggressively advertised and promoted to each new generation of consumers.
We conduct business with the highest ethical standards and integrity which are codified in the Company's "Code of Business Conduct and Ethics."
Corporate Profile
Tootsie Roll Industries, Inc. has been engaged in the manufacture and sale of confectionery products for 118 years. Our products are primarily sold under the familiar brand names: Tootsie Roll, Tootsie Roll Pops, Caramel Apple Pops, Child's Play, Charms, Blow Pop, Blue Razz, Cella's chocolate covered cherries, Tootsie Dots, Tootsie Crows, Junior Mints, Junior Caramels, Charleston Chew, Sugar Daddy, Sugar Babies, Andes, Fluffy Stuff cotton candy, Dubble Bubble, Razzles, Cry Baby, Nik-L-Nip and EI Bubble.

Financial Highlights
|
|
|
December 31, |
|
||||
|
|
|
2014 |
|
2013 |
|
||
|
|
|
(in thousands except per share data) |
|
||||
|
Net Product Sales |
|
$ |
539,895 |
|
$ |
539,627 |
|
|
Net Earnings Attributable to Tootsie Roll Industries, Inc. |
|
|
63,298 |
|
|
60,849 |
|
|
Working Capital |
|
|
200,162 |
|
|
179,990 |
|
|
Net Property, Plant and Equipment |
|
|
190,081 |
|
|
196,916 |
|
|
Shareholders' Equity |
|
|
690,809 |
|
|
680,305 |
|
|
Average Shares Outstanding* |
|
|
60,562 |
|
|
61,399 |
|
|
Per Share Items* |
|
|
|
|
|
|
|
|
Net Earnings Attributable to Tootsie Roll Industries, Inc. |
|
$ |
1.05 |
|
$ |
0.99 |
|
|
Cash Dividends Paid |
|
|
0.32 |
|
|
0.24 |
|
*Adjusted for stock dividends.
2
To Our Shareholders

Ellen R. Gordon, Chairman and Chief Executive Officer
Net product sales in 2014 were $539.9 million, as compared to 2013 net product sales of $539.6 million. Most of our core brands posted solid results, and Halloween was once again our largest selling season of the year.
Net earnings grew to $63.3 million in 2014 from $60.8 million in 2013. Earnings per share were $1.05 in 2014, up from $0.99 in the 2013, due to the combination of higher earnings and fewer shares outstanding in 2014.
The increase in earnings was attributable to margin improvements stemming from lower input costs in 2014. We are pleased that we are making progress on restoring our margins to their historical levels before the increases in commodity and other input costs in past years. In order to achieve our profit goals and still deliver maximum value to our consumers, we are challenged to look for every feasible way to keep our operations lean and costs in check.
As a value oriented confectioner, we deem it essential to be a low cost producer. We actively pursue investments in the latest technology to keep us so. We take a long-term view of our business and enact only those measures that improve our operating results without jeopardizing the long-term strength of the Company and its well-known brands.
In this regard, capital expenditures were $10.7 million in 2014. In addition to new state of the art material handling and packaging equipment at a number of our plants, a portion of this figure was directed toward a significant information technology project. We remain committed to enhance productivity through the deployment of leading edge business software.
During 2014, we paid cash dividends of 32 cents per share and again distributed a 3% stock dividend. This was the seventy-second consecutive year the Company has paid cash dividends and the fiftieth consecutive year that a stock dividend was distributed. We also repurchased shares of common stock on the open market.
We ended 2014 with $224.0 million in cash and investments net of interest bearing debt and investments that hedge deferred compensation liabilities. We remain poised to continue investing in our business, improving manufacturing productivity and quality, supporting our brands, paying dividends and repurchasing common stock. We also continue to seek appropriate complementary business acquisitions.
3
Sales and Marketing
Our diverse and highly recognizable brand portfolio is popular across all trade channels. We have a range of offerings suitable for virtually every major consumer group and retail format. During 2014, we again used carefully executed and channel-specific promotions to drive sales. These targeted initiatives, directed both to the trade and to consumers, help to move our products into distribution and subsequently to move them off the retail shelf. We find that emphasizing high sell-through and attractive profit margins to the trade and a high quality, attractive value to the consumer is a winning strategy.
Halloween has long been our largest selling period, with third quarter sales nearly double those of any other quarter in the year. We posted strong results last Halloween in all major trade classes including grocery, mass merchandisers, warehouse clubs, dollar stores and drug chains. Especially popular are our large bags of Child's Play and other mixed candy assortments, which are offered in a variety of pack sizes and merchandising presentations including pallet packs, off-shelf displays and display ready cases.
The candy marketplace is highly competitive and we are vigilant in keeping our products contemporary even as they remain iconic. Our product line undergoes continual refinement in order to retain its appeal to ever-evolving preferences and life styles.
Building on the success of our Caramel Apple Pops, our Blow Pop line was expanded with the addition of Caramel Apple Blow Pops. With a candy shell of luscious caramel entwined with tart green apple hard candy and its emblematic bubble gum center, this unique new confection is really three treats in one!

Caramel Apple Blow Pops
4
The selling power of floor stand displays is well established, but some smaller retail venues may lack the floor space or sales volume to support a traditionally sized display. To meet this need, we introduced a new one-eighth size pallet of Tootsie Rolls and Tootsie Pops in bonus bags. This display has the dual attributes of increasing sales velocity for the retailer and attractive feature pricing for the consumer.
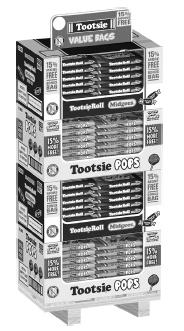
1/8 Pallet Display
The addition of a new floor display also contributed added sales in our penny goods line. The half pallet Frootie shipper consists of 192 bags of the most popular flavors, Blue Razz, Fruit Punch, Green Apple and Strawberry, and was well received in the Cash and Carry class of trade. The Frootie line was further expanded with the addition of tart new Lemon-Lime Frooties.
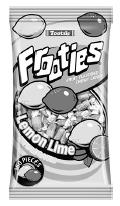
Lemon Lime Frooties
5
For Dots lovers, the next big thing is here—the BIG BOX! Featuring 20.5 ounces of delicious fruit flavored Dots in a reclosable box, this eye-catching pack promises lots of Dots for the whole family to share!
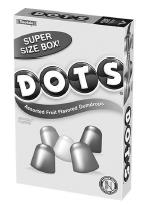
Dots BIG BOX
We put some fizz in gumball fun with the introduction of Dubble Bubble Fizzers. Pop one of five fizzy soda flavors in your mouth and bite down for a unique effervescent experience of bubble-blowing fun!

Dubble Bubble Fizzers
6
Consumers have become increasingly concerned with protecting the environment, and manufacturers are seeking innovative ways to minimize packaging. One such solution that we implemented in 2014 was in our gumball machine refill packs. By replacing bulky, rigid plastic jars with lightweight resealable flexible pouches, packaging weight was reduced considerably without compromising product freshness.

Gumball refill pouch
Our Andes Crème de Menthe thins have a strong selling history during the Thanksgiving and Christmas Holiday seasons. Andes has also had great success selling outside the candy aisle with Andes Crème de Menthe Baking Chips, which have become the top selling mint baking chip. In 2014, we promoted the minty merriment of baking with Andes Recipe Contest. Visit www.tootsie.com to check out the winning entries and other delicious Andes recipes!
Advertising and Public Relations
During 2014, we continued our initiative of engaging with consumers through social media. Numerous game experiences, banner ads and prize contest entries on Facebook, Twitter, Instagram and Pinterest build and strengthen connections to our brands and also provide a venue for consumer feedback.
Mr. Owl and the long-standing "How Many Licks" Tootsie Pop message are prominently featured in our social media program and in our television advertising campaigns. This renowned theme has become part of Americana, ranging from crossword puzzles to scientific studies.
Most recently a group of NYU graduate students developed a model to analyze how fluids dissolve various materials, and applied it to the Tootsie Pop. Their algorithm concluded that it would take precisely one thousand licks to get to the chewy Tootsie Roll center. We will add this data point to the thousands of estimates we have received over the many years. Nonetheless, we can only conclude that the answer to this riddle remains "the world may never know!"
Purchasing
Cost decreases in sugar, corn syrup, cocoa powder, edible oils and packaging were partially offset by increases in coatings, dairy products and gum base components. In packaging the decrease was primarily due to lower corrugated prices.
Though the cost of many of the commodities we use is lower than recent record highs, some remain well above their historical levels and restoring margins continues to be one of our objectives. Competitive bidding, selective hedging and leveraging our high volume of purchases are some of the means we use to mitigate input costs to the greatest extent feasible.
Supply Chain
We continue to invest capital and resources in projects that keep our production and distribution facilities as efficient as possible, support evolving distribution patterns, improve quality and support growing product lines. Much of this investment is driven by continuing advancements in automation technology that we can incorporate on the shop floor.
7
Considerable effort is made in designing new installations to maximize their flexibility so that we can respond to evolving package configurations or product assortments demanded by the market. Incorporating such flexibility can add significant up-front costs. We are fortunate to have sufficient financial resources and are able to make these necessary investments.
International
In Mexico we manufacture and sell products primarily under the trademark Tutsi. Most of our domestic brands are also sold in Canada, though for certain items they are offered in different package configurations and at different price points which are tailored to that market.
We also export our products to many countries in Europe, Asia, and South and Central America. During 2014, we increased our ownership percentage in Fleer Espanola, a Spanish manufacturer of sugared and sugar free gum. We are currently rebranding a number of their sugared offerings under the Dubble Bubble umbrella and hope to expand our presence in Europe and the Middle East.
In Appreciation
We wish to express our appreciation to our many loyal employees, customers, suppliers, sales brokers and distributors throughout the world for their support in 2014. We also thank our fellow shareholders as we remain committed to the pursuit of excellence in every aspect of our operations and face the increasing challenges of today's business environment.

Ellen R. Gordon
Chairman of the Board and
Chief Executive Officer
8
Management’s Discussion and Analysis of Financial Condition and Results of Operations
(in thousands except per share, percentage and ratio figures)
FINANCIAL REVIEW
This financial review discusses the Company’s financial condition, results of operations, liquidity and capital resources, significant accounting policies and estimates, new accounting pronouncements, market risks and other matters. It should be read in conjunction with the Consolidated Financial Statements and related footnotes that follow this discussion.
FINANCIAL CONDITION
The Company’s overall financial position remains very strong as a result of its improving 2014 gross profit margins, higher net earnings and strong cash flows provided by operating activities. Cash flows from 2014 operating activities totaled $88,769 and were used to pay cash dividends of $19,241, purchase and retire $25,020 of its outstanding shares, make capital expenditures of $10,704, and add to our marketable securities investments.
The Company’s net working capital was $200,162 at December 31, 2014 compared to $179,990 at December 31, 2013 which generally reflects higher cash and cash equivalents and short-term investments. As of December 31, 2014, the Company’s aggregate cash, cash equivalents and investments, including all long-term investments in marketable securities, was $303,137 compared to $270,387 at December 31, 2013, an increase of $32,750. The aforementioned includes $71,682 and $63,215 in trading securities as of December 31, 2014 and 2013, respectively. The Company invests in trading securities to provide an economic hedge for its deferred compensation liabilities, as further discussed herein and in Note 7 to the Consolidated Financial Statements.
Shareholders’ equity increased from $680,305 at December 31, 2013 to $690,809 as of December 31, 2014, principally reflecting 2014 net earnings of $63,298, less cash dividends of $19,241, share repurchases of $25,020, and an increase in accumulated other comprehensive loss during 2014.
The Company has a relatively straight-forward financial structure and has historically maintained a conservative financial position. Except for an immaterial amount of operating leases, the Company has no special financing arrangements or “off-balance sheet” special purpose entities. Cash flows from operations plus maturities of short-term investments are expected to be adequate to meet the Company’s overall financing needs, including capital expenditures, in 2015. Periodically, the Company considers possible acquisitions, and if the Company were to pursue and complete such an acquisition, that could result in bank borrowings or other financing.
Results of Operations
2014 vs. 2013
Net product sales in fourth quarter 2014 increased by 1.8% to $137,929, and twelve months net product sales increased by $268 or 0.1% to $539,895 in 2014. Our sales results in the United States reflect the challenges of certain of our retail customers regarding consumer sales and consumer spending. Overall, 2014 sales volumes in the United States were relatively even with 2013, and there were no significant changes in selling prices and price realization, or product mix. Lower sales in Mexico and Canada, including the effects of a weaker Mexican peso and Canadian dollar, respectively, also adversely affected our reported sales during these same comparative periods.
Product cost of goods sold were $340,933 in 2014 compared to $350,960 in 2013, a decrease of $10,027 or 2.9%. Product cost of goods sold includes $1,140 and $2,457 in certain deferred compensation expenses in 2014 and 2013, respectively. These deferred compensation expenses principally result from changes in the market value of investments and investment income from trading securities relating to compensation deferred in previous years and are not reflective of current operating results. Adjusting for the aforementioned, product cost of goods sold decreased from $348,503 in 2013 to $339,793 in 2014, a decrease of $8,710 or 2.5%. As a percent of net product sales, these adjusted costs decreased from 64.6% in 2013 to 62.9% in 2014, a favorable decrease of 1.7% as a percent of net product sales. Although our overall comparative ingredient costs are more favorable this year, certain key ingredient costs were higher in 2014 compared to 2013. We are continuing our focus on cost reductions and savings, including capital investments to achieve
9
manufacturing efficiencies, and are making progress on restoring our margins to their historical levels before the increases in commodity and other input costs in past years.
Selling, marketing and administrative expenses were $117,722 in 2014 compared to $119,113 in 2013, a decrease of $1,391 or 1.2%. Selling, marketing and administrative expenses include $3,761 and $8,131 in certain deferred compensation expenses in 2014 and 2013, respectively. These deferred compensation expenses principally result from changes in the market value of investments and investment income from trading securities relating to compensation deferred in previous years and are not reflective of current operating results. Adjusting for the aforementioned, selling, marketing and administrative expenses increased from $111,002 in 2013 to $113,961 in 2014, an increase of $2,959 or 2.7%. As a percent of net product sales, these adjusted expenses increased slightly from 20.6% of net product sales in 2013 to 21.1% of net product sales in 2014. Selling, marketing and administrative expenses include $46,525 and $45,367 of freight, delivery and warehousing expenses in 2014 and 2013, respectively, which increased slightly from 8.4% of net product sales in 2013 to 8.6% of net product sales in 2014.
The Company believes that the carrying values of its goodwill and trademarks have indefinite lives as they are expected to generate cash flows indefinitely. In accordance with current accounting guidance, these indefinite-lived intangible assets are assessed at least annually for impairment as of December 31 or whenever events or circumstances indicate that the carrying values may not be recoverable from future cash flows. No impairments were recorded in 2014 or 2013. The fair values of trademarks are assessed each year using the present value of estimated future cash flows and estimated royalties. Based on the Company’s estimate at December 31, 2014, the individual fair values of the indefinite lived intangible assets exceed the net book value by more than 10%. For certain trademarks, holding all other assumptions constant at the test date, a 100 basis point increase in the discount rate or a 100 basis point decrease in the royalty rate would reduce the fair value of certain trademarks by approximately 15% and 11%, respectively. Individually, a 100 basis point increase in the discount rate would indicate a potential impairment of approximately $2,000 as of December 31, 2014. However, if the royalty rate were decreased by 100 basis points no impairment would be indicated as of December 31, 2014.
Earnings from operations were $83,923 in 2014 compared to $72,353 in 2013, an increase of $11,570. Earnings from operations include $4,901 and $10,588 in certain deferred compensation expense in 2014 and 2013, respectively, which are discussed above. Adjusting for these deferred compensation expenses, earnings from operations increased from $82,941 in 2013 to $88,824 in 2014, an increase of $5,883 or 7.1%. This increase in 2014 earnings from operations principally reflects more favorable ingredient costs, plant efficiencies driven by capital investments, and on-going cost control programs.
Management believes the comparisons presented in the preceding paragraphs, after adjusting for changes in deferred compensation, are more reflective of the underlying operations of the Company.
Other income, net was $7,371 in 2014 compared to $12,130 in 2013, a decrease of $4,759. Other income, net principally reflects $4,901 and $10,588 of aggregate net gains and investment income on trading securities in 2014 and 2013, respectively. These trading securities provide an economic hedge of the Company’s deferred compensation liabilities; and the related net gains and investment income were offset by a like amount of expense in aggregate product cost of goods sold and selling, marketing, and administrative expenses in the respective years as discussed above. Other income, net also includes foreign exchange losses of $861 and $790 in 2014 and 2013, respectively.
During fourth quarter 2013, the Company sold its investment in Jefferson County Alabama Sewer Revenue Refunding Warrants for $10,840. This was an auction rate security (ARS) originally purchased for $13,550 in 2008 with an insurance-backed AAA rating. Because the Company recorded an other-than-temporary pre-tax impairment of $5,140 in 2008 on this ARS investment which resulted in a carrying value of $8,410 at that time, a net gain of $2,430 was recorded on this sale in fourth quarter 2013. Since recording this initial impairment in 2008, the Company carried this ARS investment at its estimated fair value utilizing a valuation model with Level 3 inputs, as defined by guidance, and resulting changes in the market value from the date of the original impairment charge in 2008 to its sale in fourth quarter 2013 have been recorded as changes to accumulated other comprehensive income (loss) each year.
10
The consolidated effective tax rate was 31.1% and 28.0% in 2014 and 2013, respectively. This higher effective tax rate in 2014 reflects an additional deferred income tax expense of $2,350 relating the Company’s step acquisition of its Spanish subsidiaries which is discussed below. A reconciliation of the differences between the U.S. statutory rate and these effective tax rates is provided in Note 4 to the Consolidated Financial Statements. At December 31, 2014, the Company’s deferred tax assets include $10,880 of income tax benefits relating to its Canadian subsidiary tax loss carry-forwards which the Company expects to realize before their expiration dates (2027 through 2031). The Company utilized approximately $600 and $400 of these tax carry-forward benefits in 2014 and 2013, respectively. The Company has concluded that it is more-likely-than-not that it would realize these deferred tax assets relating to its Canadian tax operating loss carry-forwards because it is expected that sufficient levels of taxable income will be generated during the carry-forward periods. The Company has provided a full valuation allowance on its Spanish subsidiaries’ tax loss carry-forward benefits of approximately $2,092 as of December 31, 2014 because the Company has concluded that it is not more-likely-than-not that these losses will be utilized before their expiration dates. The Spanish subsidiaries have a history of net operating losses and it is not known when and if they will generate taxable income in the future. The Company has not provided for U.S. federal or foreign withholding taxes on approximately $5,400 and $11,000 of foreign subsidiaries’ undistributed earnings as of December 31, 2014 and December 31, 2013, respectively, because such earnings are considered to be permanently reinvested. The Company estimates that the federal income tax liability on such undistributed earnings would approximate 30% of these amounts.
Net earnings attributable to Tootsie Roll Industries, Inc. were $63,298 in 2014 compared to $60,849 in 2013, and earnings per share were $1.05 and $0.99 in 2014 and 2013, respectively, an increase of $0.06 or 6.1%. Net earnings principally benefited from improved gross profit margins which are discussed above. Net earnings for the prior year 2013 benefited from a lower effective income tax rate and a capital gain on the sale of an investment security (Jefferson County Warrants discussed above), both of which adversely affects the comparison of 2014 net earnings to those in 2013. Earnings per share in 2014 benefited from the reduction in average shares outstanding resulting from purchases of the Company’s common stock in the open market by the Company. Average shares outstanding decreased from 61,399 in 2013 to 60,562 in 2014.
During first quarter 2014, the Company gained operating control of its two 50% owned Spanish companies when Company employee representatives assumed all positions on their boards of directors. This was considered a step acquisition, whereby the Company remeasured the previously held investment to fair value in first quarter 2014. As a result, the Company’s first quarter 2014 net earnings include a net loss of $529, including an additional income tax provision of $2,350 relating to deferred income taxes. During 2014, the Company further increased its control and ownership to 83% by purchasing and subscribing to additional common shares of its Spanish subsidiaries for approximately $1,400 ($1,200 was paid in 2014, and the balance will be paid in 2015). These Spanish companies had operating losses for each of the years 2008 through 2014. Company management has restructured the Spanish operations and made other changes to its business plan, and management believes that they should be nearing break-even cash flows from operating activities going forward. Management believes that the business, competitive and economic challenges in Spain are likely to continue, and therefore, additional cash financing of these Spanish companies may be required in the future. Other income, net in prior year 2013 includes the results of the Company’s 50% share of two Spanish companies which were accounted for using the equity investment method in 2013. Equity method losses were $967 for 2013. In addition, a pre-tax impairment charge of $975 was recorded in 2013 to write-down the Company’s carrying value of this equity investment to estimated fair value.
Beginning in 2012, the Company received notices from the Bakery, Confectionery, Tobacco Workers and Grain Millers International Union (BC&T) Pension Plan (Plan), a multi-employer defined benefit pension plan for certain Company union employees. The notices indicated that the Plan’s actuary certified the Plan to be in critical status, the “Red Zone”, as defined by the Pension Protection Act (PPA) and the Pension Benefit Guaranty Corporation (PBGC), and that a plan of rehabilitation was adopted by the trustees of the Plan in fourth quarter 2012. The rehabilitation plan, which continues, requires that employer contributions include 5% compounded annual surcharge increases each year for an unspecified period of time beginning January 2013 (in addition to the 5% interim surcharge initiated in June 2012) as well as certain plan benefit reductions. Under the plan of rehabilitation, the Plan is projected to emerge from critical status sometime beyond a 30 year projection period. In the event that a plan does not have the financial resources to ultimately pay benefits at a level specified by law, then it must apply to the PBGC for government financial assistance. The Trustees have advised that neither the PPA nor regulatory guidance currently defines the rehabilitation standards for a plan that is
11
not designed to emerge from critical status within the prescribed 10-year rehabilitation period. Recently enacted legislation (Multiemployer Pension Reform Act of 2014) may also affect the future of this Plan.
The Company was previously advised by the Plan that if the Company had withdrawn from the Plan during 2012 its estimated withdrawal liability would have been $37,200. The Company was recently advised by the Plan that its withdrawal liability would have been $56,400 if it had withdrawn from the Plan during 2014. The increase from 2012 to 2014 principally reflects changes in key actuarial assumptions, principally the effects of a lower interest rates proscribed by PBGC which were partially used to determine the present value of vested benefits, and a change to a more conservative mortality table. Based on the Company’s actuarial study and certain provisions in ERISA relating to withdrawal liability payments, management believes that the Company’s liability would be limited to twenty annual payments of $2,999 which have a present value of $35,193 based on the minimum funding interest rate of 6.5% used by the Plan. Should the Company actually withdraw from the Plan at a future date, a withdrawal liability, which could be higher than the above discussed amounts, could be payable to the Plan.
The Company’s existing labor contract with its BC&T local union commits the Company’s participation in this Plan through third quarter 2017. Pension expense, including surcharges, for the BC&T Plan for 2014 and 2013 was $2,588 and $2,231, respectively. The aforementioned expense includes surcharge increases of $342 and $242 in 2014 and 2013, respectively, related to the contribution increases required under the plan of rehabilitation. The Company is currently unable to determine the ultimate outcome of the above discussed matter and therefore, is unable to determine the effects on its consolidated financial statements, but, the ultimate outcome could be material to its consolidated results of operations in one or more future periods.
2013 vs. 2012
Net product sales were $539,627 in 2013 compared to $545,985 in 2012, a decrease of $6,358 or 1.2%. The decline in 2013 sales reflects some special promotional sales in 2012 that were not repeated in 2013.
Product cost of goods sold were $350,960 in 2013 compared to $365,573 in 2012, a decrease of $14,613 or 4.0%. Product cost of goods sold includes $2,457 and $1,034 in certain deferred compensation expenses in 2013 and 2012, respectively. These deferred compensation expenses principally result from changes in the market value of investments and investment income from trading securities relating to compensation deferred in previous years and are not reflective of current operating results. Adjusting for the aforementioned, product cost of goods sold decreased from $364,539 in 2012 to $348,503 in 2013, a decrease of $16,036 or 4.4%. As a percent of net product sales, these adjusted costs decreased from 66.8% in 2012 to 64.6% in 2013, a favorable decrease of 2.2% as a percent of net product sales. Although certain key ingredient costs were higher in 2013, our overall comparative ingredient costs are more favorable this year; however, our packaging materials and manufacturing plant operating costs did increase in 2013 compared to 2012.
Selling, marketing and administrative expenses were $119,133 in 2013 compared to $113,842 in 2012, an increase of $5,291 or 4.6%. Selling, marketing and administrative expenses include $8,131 and $3,582 in certain deferred compensation expenses in 2013 and 2012, respectively. These deferred compensation expenses principally result from changes in the market value of investments and investment income from trading securities relating to compensation deferred in previous years and are not reflective of current operating results. Adjusting for the aforementioned, selling, marketing and administrative expenses increased from $110,260 in 2012 to $111,002 in 2013, an increase of $742 or 0.7%. As a percent of net product sales, these adjusted expenses increased slightly from 20.2% of net product sales in 2012 to 20.6% of net product sales in 2013. Selling, marketing and administrative expenses include $45,367 and $45,072 of freight, delivery and warehousing expenses in 2013 and 2012, respectively, which increased slightly from 8.3% of net product sales in 2012 to 8.4% of net product sales in 2013.
Earnings from operations were $72,353 in 2013 compared to $69,479 in 2012, an increase of $2,874. Earnings from operations include $10,588 and $4,616 in certain deferred compensation expense in 2013 and 2012, respectively, which are discussed above. Adjusting for these deferred compensation expenses, earnings from operations were $82,941 and $74,095 in 2013 and 2012, respectively, an increase of $8,846 or 11.9%. This increase in 2013 earnings from operations principally reflects more favorable ingredient costs, plant efficiencies driven by capital investments, and on-going cost control programs.
12
Management believes the comparisons presented in the preceding paragraphs after adjusting for changes in deferred compensation are more reflective of the underlying operations of the Company.
Other income, net was $12,130 in 2013 compared to $4,685 in 2012, an increase of $7,445. Other income, net principally reflects $10,588 and $4,616 of aggregate net gains and investment income on trading securities in 2013 and 2012, respectively. These net gains and investment income were offset by a like amount of expense in aggregate product cost of goods sold and selling, marketing, and administrative expenses in the respective years as discussed above. Other income, net also includes foreign exchange gains (losses) of $(790) and $442 in 2013 and 2012, respectively, and a net gain of $2,430 on the sale of its investment in Jefferson County Alabama Warrants as discussed above.
Other income, net includes the results of the Company’s 50% share of two Spanish companies which were accounted for using the equity method. These equity method losses were $967 and $1,019 for 2013 and 2012, respectively. In addition, pre-tax impairment charges of $975 and $850 were recorded in 2013 and 2012, respectively, to write-down the Company’s carrying value to estimated fair value.
The consolidated effective tax rate was 28.0% and 29.9% in 2013 and 2012, respectively; a reconciliation of the differences between the U.S. statutory rate and these effective tax rates is provided in Note 4 to the Consolidated Financial Statements. At December 31, 2013, the Company’s deferred tax assets include $12,512 of income tax benefits relating to its Canadian subsidiary tax loss carry-forwards which the Company expects to realize before their expiration dates (2026 through 2031). The Company utilized approximately $400 and $3,000 of these carry-forward tax loss benefits in 2013 and 2012, respectively.
Net earnings were $60,849 in 2013 compared to $52,004 in 2012, and earnings per share were $0.99 and $0.84 in 2013 and 2012, respectively, an increase of $0.15 or 17.9%. Net earnings benefited from improved gross profit margins, as well as a gain on the sale of its Jefferson County warrants, as discussed above, and a lower effective tax rate, all of which are discussed above. Earnings per share benefited from the reduction in average shares outstanding resulting from purchases of the Company’s common stock in the open market by the Company. Average shares outstanding decreased from 62,248 in 2012 to 61,399 in 2013.
LIQUIDITY AND CAPITAL RESOURCES
Cash flows from operating activities were $88,769, $109,823 and $101,418 in 2014, 2013 and 2012, respectively. The $21,054 decrease in cash flows from operating activities from 2013 to 2014 primarily reflects increases in inventories and accounts receivable in 2014, and changes in prepaid expenses and other assets in the respective years. The aforementioned increases in inventories and accounts receivable principally reflect the timing of fourth quarter sales and manufacturing planning for inventories. The increase in cash flows from 2012 to 2013 primarily reflects the 2012 increase in net earnings, as well as changes in inventories and prepaid expenses and other assets in the comparative years.
During fourth quarter 2014 and 2013, the Company contributed $1,000 and $15,000 to a VEBA trust, managed and controlled by the Company, to fund the estimated future costs of certain employee health, welfare and other benefits. The Company is using these funds to pay the actual cost of such benefits through 2017. At December 31, 2014 and 2013, the VEBA trust held $10,845 and $13,991, respectively, of aggregate cash and cash equivalents. This asset value is included in prepaid expenses and long-term other assets in the Company’s Consolidated Statement of Financial Position. These assets are categorized as Level 1 within the fair value hierarchy.
During fourth quarter 2013, the Company restructured and amended its post-retirement health benefits plan provided to corporate office and management employees. These changes resulted in a negative plan amendment, as defined by accounting guidance, resulting in a $10,425 reduction in the Company’s benefit obligation as of December 31, 2013. The plan changes generally limited future annual cost increases in health benefits to 3%, restricted this benefit to current employees with long-term service with the Company, required retirees to pay the full cost of life insurance, and eliminated all post-retirement benefits for future employees effective April 1, 2014. Post-retirement benefits liabilities (as amended) were $12,300 and 8,857 at December 31, 2014 and 2013, respectively. The aforementioned increase reflects actuarial losses relating to an 86 basis point decrease in the discount rate (3.83% discount rate used at December
13
31, 2014) and an update of the mortality table based on the Society of Actuaries’ research that indicates that retirees are living longer.
Cash flows from investing activities reflect capital expenditures of $10,704, $15,752, and $8,886 in 2014, 2013 and 2012, respectively. The changes in amounts each year principally reflects the timing of expenditures relating to plant manufacturing projects. These capital expenditures include $1,676, $1,775 and $830 relating to computer systems and software and implementations in 2014, 2013 and 2012, respectively. Capital expenditures for 2015 are expected to be in line with historical annual spending but actual expenditures can vary due to the timing of larger projects and payments. They are to be funded from the Company’s cash flow from operations and internal sources.
Other than the bank loans and the related restricted cash of the Company’s Spanish subsidiaries which are discussed in Note 1 to the consolidated financial statements, the Company had no bank borrowings or repayments in 2012, 2013, or 2014, and had no outstanding bank borrowings as of December 31, 2012 or 2013. Nonetheless, the Company would consider bank borrowing or other financing in the event that a business acquisition is completed.
Financing activities include Company common stock purchases and retirements of $25,020, $23,143, and $23,803 in 2014, 2013 and 2012, respectively. Cash dividends of $19,241, $14,282, and $52,431 (includes a special one-time dividend of $29,138 in 2012) were paid in 2014, 2013 and 2012, respectively. The fourth quarter 2012 included a special $0.50 per share cash dividend as well as an accelerated payment of the regular quarterly dividend of $0.08 per share which has historically been paid during the first week in January. Both were in response to the uncertainty surrounding the future federal tax treatment of dividends at that time after giving consideration to the Company’s cash and investment position.
SIGNIFICANT ACCOUNTING POLICIES AND ESTIMATES
Preparation of the Company’s financial statements involves judgments and estimates due to uncertainties affecting the application of accounting policies, and the likelihood that different amounts would be reported under different conditions or using different assumptions. The Company bases its estimates on historical experience and other assumptions, as discussed herein, that it believes are reasonable. If actual amounts are ultimately different from previous estimates, the revisions are included in the Company’s results of operations for the period in which the actual amounts become known. The Company’s significant accounting policies are discussed in Note 1 to the Consolidated Financial Statements.
Following is a summary and discussion of the more significant accounting policies which management believes to have a significant impact on the Company’s operating results, financial position, cash flows and footnote disclosure.
Revenue recognition
Revenue, net of applicable provisions for discounts, returns, allowances and certain advertising and promotional costs, is recognized when products are delivered to customers based on a customer purchase order, and collectability is reasonably assured. The accounting for promotional costs is discussed under “Customer incentive programs, advertising and marketing” below.
Provisions for bad debts are recorded as selling, marketing and administrative expenses. Write-offs of bad debts did not exceed 0.1% of net product sales in each of 2014, 2013 and 2012, and accordingly, have not been significant to the Company’s financial position or results of operations.
Intangible assets
The Company’s intangible assets consist primarily of goodwill and acquired trademarks. All trademarks have been assessed by management to have indefinite lives because they are expected to generate cash flows indefinitely. In accordance with accounting guidance, goodwill and other indefinite-lived assets are not amortized, but are instead subjected to annual testing for impairment unless certain triggering events or circumstances are noted. The Company performs its annual impairment testing as of December 31. The Company may utilize third-party professional valuation firms to assist in the determination of valuation of certain trademarks.
With respect to impairment testing of goodwill, the first step compares the reporting unit’s estimated fair value with its carrying value. We estimate a reporting unit’s fair value using projected discounted cash flows. If the carrying value of a
14
reporting unit’s net assets exceeds its fair value, the second step is applied to measure the difference between the carrying value and implied fair value of goodwill. If the carrying value of goodwill exceeds its implied fair value, the goodwill is considered impaired and reduced to its implied fair value.
We test non-amortizable intangible assets, trademarks, for impairment by comparing the fair value of each trademark with its carrying value. We determine fair value of trademarks using discounted cash flows and estimates of royalty rates. If the carrying value exceeds fair value, the trademark is considered impaired and is reduced to fair value.
The cash flow projections discussed above requires us to make assumptions and estimates regarding our future plans, including sales projections and profit margins, market based discount rates, competitive factors, and economic conditions; and our actual results and conditions may differ over time. A change in the assumptions relating to the impairment analysis of goodwill and trademarks, including but not limited to a reduction in projected cash flows, the use of a different discount rate to discount future cash flows or a different royalty rate applied to the Company’s trademarks, could cause impairment in the future.
Customer incentive programs, advertising and marketing
Advertising and marketing costs are recorded in the period to which such costs relate. The Company does not defer the recognition of any amounts on its consolidated balance sheet with respect to such costs. Customer incentives and other promotional costs are recorded at the time of sale based upon incentive program terms and historical utilization statistics, which are generally consistent from year to year.
The liabilities associated with these programs are reviewed quarterly and adjusted if utilization rates differ from management’s original estimates. Such adjustments have not historically been material to the Company’s operating results.
Split dollar officer life insurance
The Company provides split dollar life insurance benefits to certain executive officers and records an asset principally equal to the cumulative premiums paid. The Company will fully recover these premiums in future years under the terms of the plan. The Company retains a collateral assignment of the cash surrender values and policy death benefits payable to insure recovery of these premiums.
Valuation of long-lived assets
Long-lived assets, primarily property, plant and equipment are reviewed for impairment as events or changes in business circumstances occur indicating that the carrying value of the asset may not be recoverable. The estimated cash flows produced by assets or asset groups, are compared to the asset carrying value to determine whether impairment exists. Such estimates involve considerable management judgment and are based upon assumptions about expected future operating performance. As a result, actual cash flows could differ from management’s estimates due to changes in business conditions, operating performance, and economic and competitive conditions.
Income taxes
Deferred income taxes are recognized for future tax effects of temporary differences between financial and income tax reporting using tax rates in effect for the years in which the differences are expected to reverse. The Company records valuation allowances in situations where the realization of deferred tax assets, including those relating to net operating tax losses, is not more-likely-than-not; and the Company adjusts and releases such valuation allowances when realization becomes more-likely-than-not as defined by accounting guidance. The Company periodically reviews assumptions and estimates of the Company’s probable tax obligations and effects on its liability for uncertain tax positions, using informed judgment which may include the use of third-party consultants, advisors and legal counsel, and historical experience.
15
Valuation of investments
Investments, primarily municipal bonds, mutual funds and equity method investments are reviewed for impairment at each reporting period by comparing the carrying value or amortized cost to the fair market value. The Company may utilize third-party professional valuation firms as necessary to assist in the determination of the value of investments that utilize Level 3 inputs as defined by guidance. In the event that an investment security’s fair value is below carrying value or amortized cost, the Company will record an other-than-temporary impairment or a temporary impairment based on accounting guidance.
Other matters
In the opinion of management, other than contracts for foreign currency forwards and raw materials, including currency and commodity hedges and outstanding purchase orders for packaging, ingredients, supplies, and operational services, all entered into in the ordinary course of business, the Company does not have any significant contractual obligations or future commitments. The Company’s outstanding contractual commitments as of December 31, 2014, all of which are generally normal and recurring in nature, are summarized in the chart on page 12, which is incorporated by reference herein.
RECENT ACCOUNTING PRONOUNCEMENTS
See Note 1 of the Company’s Note to Consolidated Financial Statements.
MARKET RISKS
The Company is exposed to market risks related to commodity prices, interest rates, investments in marketable securities, equity price and foreign exchange.
The Company’s ability to forecast the direction and scope of changes to its major input costs is impacted by significant volatility in crude oil, sugar, corn, soybean and edible oils, cocoa and dairy products markets. The prices of these commodities are influenced by changes in global demand, changes in weather and crop yields, including the effects of climate change, changes in governments’ farm policies, including mandates for ethanol and bio-fuels, environmental matters, and fluctuations in the U.S. dollar relative to dollar-denominated commodities in world markets. The Company believes that its competitors face the same or similar challenges.
In order to address the impact of rising input and other costs, the Company periodically reviews each item in its product portfolio to ascertain if price realization adjustments or other actions should be taken. These reviews include an evaluation of the risk factors relating to market place acceptance of such changes and their potential effect on future sales volumes. In addition, the estimated cost of packaging modifications associated with weight changes is evaluated. The Company also maintains ongoing cost reduction and productivity improvement programs under which cost savings initiatives are encouraged and progress monitored. The Company is not able to accurately predict the outcome of these cost savings initiatives and their effects on its future results.
Commodity future and foreign currency forward contracts
Commodity price risks relate to ingredients, primarily sugar, cocoa, chocolate, corn syrup, dextrose, soybean and edible oils, milk, whey and gum base ingredients. The Company believes its competitors face similar risks, and the industry has historically adjusted prices to compensate for adverse fluctuations in commodity costs. The Company, as well as competitors in the confectionery industry, has historically taken actions, including higher price realization to mitigate rising input costs for ingredients, energy, freight and delivery. Although management seeks to substantially recover cost increases over the long-term, there is risk that higher price realization cannot be fully passed on to customers and, to the extent they are passed on, they could adversely affect customer and consumer acceptance and resulting sales volume.
The Company utilizes commodity futures contracts and commodity options contracts, as well as annual supply agreements, to hedge and plan for anticipated purchases of certain ingredients, including sugar, in order to mitigate commodity cost fluctuation. The Company also may purchase forward foreign exchange contracts to hedge its costs of
16
manufacturing certain products in Canada for sale and distribution in the United States, and periodically does so for purchases of equipment or raw materials from foreign suppliers. Such commodity futures, commodity options and currency forward contracts are cash flow hedges and are effective as hedges as defined by accounting guidance. The unrealized gains and losses on such contracts are deferred as a component of accumulated other comprehensive loss (or gain) and are recognized as a component of product cost of goods sold when the related inventory is sold.
The potential change in fair value of commodity and foreign currency derivative instruments held by the Company at December 31, 2014, assuming a 10% change in the underlying contract price, was $3,303. The analysis only includes commodity and foreign currency derivative instruments and, therefore, does not consider the offsetting effect of changes in the price of the underlying commodity or foreign currency. This amount is not significant compared with the net earnings and shareholders’ equity of the Company.
Interest rates
Interest rate risks primarily relate to the Company’s investments in tax exempt marketable securities with maturities or auction dates of generally up to three years.
The majority of the Company’s investments, which are classified as available for sale, have historically been held until they mature, which limits the Company’s exposure to interest rate fluctuations. The accompanying chart summarizes the maturities of the Company’s investments in debt securities at December 31, 2014.
|
|
|
|
|
|
|
Less than 1 year |
|
$ |
39,436 |
|
|
1 – 2 years |
|
|
42,491 |
|
|
2 – 3 years |
|
|
48,691 |
|
|
Over 3 years |
|
|
714 |
|
|
Total |
|
$ |
131,332 |
|
The Company’s outstanding debt at December 31, 2014 and 2013 was $7,500 in an industrial revenue bond in which interest rates reset each week based on the current market rate. Therefore, the Company does not believe that it has significant interest rate risk with respect to its interest bearing debt.
Investment in marketable securities
As stated above, the Company invests primarily in tax exempt marketable securities with maturities or auction dates generally up to three years. The Company utilizes professional money managers and maintains investment policy guidelines which emphasize quality and liquidity in order to minimize the potential loss exposures that could result in the event of a default or other adverse event, including failed auctions. The Company continues to monitor these investments and markets, as well as its investment policies, however, the financial markets could experience unanticipated or unprecedented events as it did beginning in 2008, and future outcomes may be less predictable than in the past.
Equity price
Equity price risk relates to the Company’s investments in mutual funds which are principally used to fund and hedge the Company’s deferred compensation liabilities. At December 31, 2014, the Company has investments in mutual funds, classified as trading securities, of $71,682. Any change in the fair value of these trading securities is completely offset by a corresponding change in the respective hedged deferred compensation liability.
Foreign currency
Foreign currency risk principally relates to the Company’s foreign operations in Canada, Mexico and Spain, as well as periodic purchase commitments of machinery and equipment from foreign sources.
Certain of the Company’s Canadian manufacturing costs, including local payroll and plant operations, and a portion of its packaging and ingredients are sourced in Canadian dollars. The Company may purchase Canadian forward contracts
17
to receive Canadian dollars at a specified date in the future and uses its Canadian dollar collections on Canadian sales as a partial hedge of its overall Canadian manufacturing obligations sourced in Canadian dollars. The Company also periodically purchases and holds Canadian dollars to facilitate the risk management of these currency changes.
From time to time, the Company may use foreign exchange forward contracts and derivative instruments to mitigate its exposure to foreign exchange risks, as well as those related to firm commitments to purchase equipment from foreign vendors. See Note 10, Fair Value Measurements, for outstanding foreign exchange forward contracts as of December 31, 2014.
RISK FACTORS
The Company’s operations and financial results are subject to a number of risks and uncertainties that could adversely affect the Company’s operating results and financial condition. Significant risk factors, without limitation, that could impact the Company, are the following: (i) significant competitive activity, including advertising, promotional and price competition, and changes in consumer demand for the Company’s products; (ii) fluctuations in the cost and availability of commodities and ingredients, including the effects adverse weather and climate change, and disease in west Africa which could affect cocoa supplies; and the ability to recover cost increases through product sales price increases; (iii) inherent risks in the marketplace, including uncertainties about trade and consumer acceptance of product pricing changes and seasonal events such as Halloween, the Company’s largest sales season; (iv) the effect of acquisitions on the Company’s results of operations and financial condition; (v) the effect of changes in foreign currencies on the Company’s foreign subsidiaries operating results, and the effect of the fluctuation of the Canadian dollar on products manufactured in Canada and marketed and sold in the United States in U.S. dollars; (vi) the Company’s reliance on third party vendors for various goods and services, including commodities used for ingredients that are primarily grown or sourced from foreign locations; (vii) the Company’s ability to successfully implement new production processes and manufacturing automation and computer systems without disruption or quality problems; (viii) the effect of changes in assumptions, including discount rates, sales growth and profit margins, which could affect the Company’s impairment testing and analysis of its goodwill and trademarks; (ix) changes in the confectionery marketplace including actions taken by major retailers and customers; (x) customer, consumer and competitor response to marketing programs and price and product weight adjustments, and new products; (xi) dependence on significant customers, including the volume and timing of their purchases, availability of shelf space, and competitive products; (xii) increases in energy costs, including freight and delivery, that cannot be passed along to customers through increased price realization due to competitive reasons; (xiii) any significant labor stoppages, strikes or production interruptions; (xiv) changes in governmental laws or regulations that affect ingredients used in products, or taxes, tariffs or other government restrictions on products sold; (xv) the adverse effects should the Company either voluntarily or involuntarily recall its product(s) from the marketplace; (xvi) the risk that the market value of Company’s investments could decline including being classified as “other-than-temporary” as defined; (xvii) the Company’s dependence on its enterprise resource planning computer system to manage its supply chain and customer deliveries, and the risk that the Company’s information technology systems fail to perform adequately; (xviii) the adverse effects if the Company is unable to protect such information technology systems against data corruption, cyber-based attacks or network security breaches; (xix) the potential adverse effects on the Company as to changes to improve the funding status of the Bakery and Confectionery Union and Industry Pension Plan, a multi-employer plan which covers certain Company union employees; (xx) the adverse effects if restructuring efforts and changes in business plans with respect to the Company’s Spanish subsidiaries are not fully successful; and (xxi) the potential effects of current and future macroeconomic conditions and geopolitical events.
Forward-looking statements
This discussion and certain other sections contain forward-looking statements that are based largely on the Company’s current expectations and are made pursuant to the safe harbor provision of the Private Securities Litigation Reform Act of 1995. Forward-looking statements can be identified by the use of words such as “anticipated,” “believe,” “expect,” “intend,” “estimate,” “project,” and other words of similar meaning in connection with a discussion of future operating or financial performance and are subject to certain factors, risks, trends and uncertainties that could cause actual results and achievements to differ materially from those expressed in the forward-looking statements. Such factors, risks, trends and uncertainties which in some instances are beyond the Company’s control, include the overall competitive
18
environment in the Company’s industry, changes in assumptions and judgments discussed above under the heading “Significant Accounting Policies and Estimates”, and factors identified and referred to above under the heading “Risk Factors.”
The risk factors identified and referred to above are believed to be significant factors, but not necessarily all of the significant factors that could cause actual results to differ from those expressed in any forward-looking statement. Readers are cautioned not to place undue reliance on such forward-looking statements, which are made only as of the date of this report. The Company undertakes no obligation to update such forward-looking statements.
Open Contractual Commitments as of December 31, 2014
|
|
|
|
|
|
|
|
|
|
|
|
|
|
|
|
|
|
|
|
|
|
|
|
Less than |
|
1 to 3 |
|
3 to 5 |
|
More than |
|
||||
|
Payable in |
|
Total |
|
1 Year |
|
Years |
|
Years |
|
5 Years |
|
|||||
|
Commodity hedges |
|
$ |
5,422 |
|
$ |
5,422 |
|
$ |
— |
|
$ |
— |
|
$ |
— |
|
|
Foreign currency hedges |
|
|
27,604 |
|
|
16,641 |
|
|
10,963 |
|
|
— |
|
|
— |
|
|
Purchase obligations |
|
|
8,406 |
|
|
8,406 |
|
|
— |
|
|
— |
|
|
— |
|
|
Interest bearing debt |
|
|
7,500 |
|
|
— |
|
|
— |
|
|
— |
|
|
7,500 |
|
|
Operating leases |
|
|
1,428 |
|
|
978 |
|
|
449 |
|
|
1 |
|
|
— |
|
|
Total |
|
$ |
50,360 |
|
$ |
31,447 |
|
$ |
11,412 |
|
$ |
1 |
|
$ |
7,500 |
|
Note: Commodity hedges and foreign currency hedges reflect the amounts at which the Company will settle the related contracts. The above amounts exclude deferred income tax liabilities of $47,356, liabilities for uncertain tax positions of $8,584, postretirement health care benefits of $11,983 and deferred compensation and other liabilities of $78,674 because the timing of payments relating to these items cannot be reasonably determined.
19
CONSOLIDATED STATEMENTS OF
Earnings and Retained Earnings
|
TOOTSIE ROLL INDUSTRIES, INC. AND SUBSIDIARIES |
(in thousands except per share data) |
|
|
|
|
|
|
|
|
|
|
|
|
|
|
|
For the year ended December 31, |
|
|||||||
|
|
|
2014 |
|
2013 |
|
2012 |
|
|||
|
Net product sales |
|
$ |
539,895 |
|
$ |
539,627 |
|
$ |
545,985 |
|
|
Rental and royalty revenue |
|
|
3,630 |
|
|
3,756 |
|
|
3,885 |
|
|
Total revenue |
|
|
543,525 |
|
|
543,383 |
|
|
549,870 |
|
|
Product cost of goods sold |
|
|
340,933 |
|
|
350,960 |
|
|
365,573 |
|
|
Rental and royalty cost |
|
|
947 |
|
|
937 |
|
|
976 |
|
|
Total costs |
|
|
341,880 |
|
|
351,897 |
|
|
366,549 |
|
|
Product gross margin |
|
|
198,962 |
|
|
188,667 |
|
|
180,412 |
|
|
Rental and royalty gross margin |
|
|
2,683 |
|
|
2,819 |
|
|
2,909 |
|
|
Total gross margin |
|
|
201,645 |
|
|
191,486 |
|
|
183,321 |
|
|
Selling, marketing and administrative expenses |
|
|
117,722 |
|
|
119,133 |
|
|
113,842 |
|
|
Earnings from operations |
|
|
83,923 |
|
|
72,353 |
|
|
69,479 |
|
|
Other income, net |
|
|
7,371 |
|
|
12,130 |
|
|
4,685 |
|
|
Earnings before income taxes |
|
|
91,294 |
|
|
84,483 |
|
|
74,164 |
|
|
Provision for income taxes |
|
|
28,434 |
|
|
23,634 |
|
|
22,160 |
|
|
Net earnings |
|
|
62,860 |
|
|
60,849 |
|
|
52,004 |
|
|
Less: Net loss attributable to noncontrolling interests |
|
|
438 |
|
|
— |
|
|
— |
|
|
Net earnings attributable to Tootsie Roll Industries, Inc. |
|
$ |
63,298 |
|
$ |
60,849 |
|
$ |
52,004 |
|
|
|
|
|
|
|
|
|
|
|
|
|
|
Net earnings attributable to Tootsie Roll Industries, Inc. per share |
|
$ |
1.05 |
|
$ |
0.99 |
|
$ |
0.84 |
|
|
Average number of shares outstanding |
|
|
60,562 |
|
|
61,399 |
|
|
62,248 |
|
|
|
|
|
|
|
|
|
|
|
|
|
|
Retained earnings at beginning of period |
|
$ |
73,109 |
|
$ |
80,210 |
|
$ |
114,269 |
|
|
Net earnings attributable to Tootsie Roll Industries, Inc. |
|
|
63,298 |
|
|
60,849 |
|
|
52,004 |
|
|
Cash dividends |
|
|
(19,199) |
|
|
(18,922) |
|
|
(47,729) |
|
|
Stock dividends |
|
|
(52,281) |
|
|
(49,028) |
|
|
(38,334) |
|
|
Retained earnings at end of period |
|
$ |
64,927 |
|
$ |
73,109 |
|
$ |
80,210 |
|
(The accompanying notes are an integral part of these statements.)
20
CONSOLIDATED STATEMENTS OF
Comprehensive Earnings
|
TOOTSIE ROLL INDUSTRIES, INC. AND SUBSIDIARIES |
(in thousands except per share data) |
|
|
|
|
|
|
|
|
|
|
|
|
|
|
|
For the year ended December 31, |
|
|||||||
|
|
|
2014 |
|
2013 |
|
2012 |
|
|||
|
Net earnings |
|
$ |
62,860 |
|
$ |
60,849 |
|
$ |
52,004 |
|
|
|
|
|
|
|
|
|
|
|
|
|
|
Other comprehensive income (loss), before tax: |
|
|
|
|
|
|
|
|
|
|
|
Foreign currency translation adjustments |
|
|
(4,453) |
|
|
(102) |
|
|
1,303 |
|
|
|
|
|
|
|
|
|
|
|
|
|
|
Pension and postretirement reclassification adjustment: |
|
|
|
|
|
|
|
|
|
|
|
Unrealized gains (losses) for the period on postretirement and pension benefits |
|
|
(2,746) |
|
|
20,037 |
|
|
1,066 |
|
|
Less: reclassification adjustment for (gains) losses to net earnings |
|
|
(1,804) |
|
|
671 |
|
|
1,036 |
|
|
Unrealized gains (losses) on postretirement and pension benefits |
|
|
(4,550) |
|
|
20,708 |
|
|
2,102 |
|
|
|
|
|
|
|
|
|
|
|
|
|
|
Investments: |
|
|
|
|
|
|
|
|
|
|
|
Unrealized gains (losses) for the period on investments |
|
|
(606) |
|
|
1,091 |
|
|
1,980 |
|
|
Less: reclassification adjustment for (gains) losses to net earnings |
|
|
— |
|
|
(2,430) |
|
|
— |
|
|
Unrealized gains (losses) on investments |
|
|
(606) |
|
|
(1,339) |
|
|
1,980 |
|
|
|
|
|
|
|
|
|
|
|
|
|
|
Derivatives: |
|
|
|
|
|
|
|
|
|
|
|
Unrealized gains (losses) for the period on derivatives |
|
|
(3,137) |
|
|
(2,107) |
|
|
(339) |
|
|
Less: reclassification adjustment for (gains) losses to net earnings |
|
|
1,295 |
|
|
1,446 |
|
|
(243) |
|
|
Unrealized gains (losses) on derivatives |
|
|
(1,842) |
|
|
(661) |
|
|
(582) |
|
|
|
|
|
|
|
|
|
|
|
|
|
|
Total other comprehensive income (loss), before tax |
|
|
(11,451) |
|
|
18,606 |
|
|
4,803 |
|
|
Income tax benefit (expense) related to items of other comprehensive income |
|
|
2,991 |
|
|
(6,797) |
|
|
(1,297) |
|
|
Total comprehensive earnings |
|
|
54,400 |
|
|
72,658 |
|
|
55,510 |
|
|
Comprehensive earnings attributable to noncontrolling interests |
|
|
438 |
|
|
— |
|
|
— |
|
|
Total comprehensive earnings attributable to Tootsie Roll Industries, Inc. |
|
$ |
54,838 |
|
$ |
72,658 |
|
$ |
55,510 |
|
21
|
CONSOLIDATED STATEMENTS OF |
|
|
Financial Position |
|
|
TOOTSIE ROLL INDUSTRIES, INC. AND SUBSIDIARIES |
(in thousands) |
Assets
|
|
|
|
|
|
|
|
|
|
|
|
December 31, |
|
||||
|
|
|
2014 |
|
2013 |
|
||
|
CURRENT ASSETS: |
|
|
|
|
|
|
|
|
Cash and cash equivalents |
|
$ |
100,108 |
|
$ |
88,283 |
|
|
Investments |
|
|
39,450 |
|
|
33,572 |
|
|
Accounts receivable trade, less allowances of $1,968 and $2,042 |
|
|
43,253 |
|
|
40,721 |
|
|
Other receivables |
|
|
3,577 |
|
|
4,616 |
|
|
Inventories: |
|
|
|
|
|
|
|
|
Finished goods and work-in-process |
|
|
44,549 |
|
|
37,012 |
|
|
Raw materials and supplies |
|
|
25,830 |
|
|
24,844 |
|
|
Prepaid expenses |
|
|
6,060 |
|
|
5,581 |
|
|
Deferred income taxes |
|
|
1,794 |
|
|
5,482 |
|
|
Total current assets |
|
|
264,621 |
|
|
240,111 |
|
|
PROPERTY, PLANT AND EQUIPMENT, at cost: |
|
|
|
|
|
|
|
|
Land |
|
|
22,360 |
|
|
21,683 |
|
|
Buildings |
|
|
113,279 |
|
|
111,044 |
|
|
Machinery and equipment |
|
|
350,929 |
|
|
340,405 |
|
|
Construction in progress |
|
|
1,641 |
|
|
3,403 |
|
|
|
|
|
488,209 |
|
|
476,535 |
|
|
Less—Accumulated depreciation |
|
|
298,128 |
|
|
279,619 |
|
|
Net property, plant and equipment |
|
|
190,081 |
|
|
196,916 |
|
|
OTHER ASSETS: |
|
|
|
|
|
|
|
|
Goodwill |
|
|
73,237 |
|
|
73,237 |
|
|
Trademarks |
|
|
175,024 |
|
|
175,024 |
|
|
Investments |
|
|
163,579 |
|
|
148,532 |
|
|
Split dollar officer life insurance |
|
|
33,632 |
|
|
40,296 |
|
|
Prepaid expenses |
|
|
6,927 |
|
|
10,260 |
|
|
Restricted cash |
|
|
1,589 |
|
|
— |
|
|
Deferred income taxes |
|
|
1,696 |
|
|
4,033 |
|
|
Total other assets |
|
|
455,684 |
|
|
451,382 |
|
|
Total assets |
|
$ |
910,386 |
|
$ |
888,409 |
|
(The accompanying notes are an integral part of these statements.)
22
(in thousands except per share data)
Liabilities and Shareholders’ Equity
|
|
|
|
|
|
|
|
|
|
|
|
December 31, |
|
||||
|
|
|
2014 |
|
2013 |
|
||
|
CURRENT LIABILITIES: |
|
|
|
|
|
|
|
|
Accounts payable |
|
$ |
11,641 |
|
$ |
9,153 |
|
|
Bank loans |
|
|
124 |
|
|
— |
|
|
Dividends payable |
|
|
4,814 |
|
|
4,742 |
|
|
Accrued liabilities |
|
|
46,482 |
|
|
45,580 |
|
|
Postretirement health care benefits |
|
|
328 |
|
|
319 |
|
|
Income taxes payable |
|
|
1,070 |
|
|
327 |
|
|
Total current liabilities |
|
|
64,459 |
|
|
60,121 |
|
|
NONCURRENT LIABILITIES: |
|
|
|
|
|
|
|
|
Deferred income taxes |
|
|
47,356 |
|
|
54,939 |
|
|
Bank loans |
|
|
694 |
|
|
— |
|
|
Postretirement health care benefits |
|
|
11,983 |
|
|
8,857 |
|
|
Industrial development bonds |
|
|
7,500 |
|
|
7,500 |
|
|
Liability for uncertain tax positions |
|
|
8,584 |
|
|
7,167 |
|
|
Deferred compensation and other liabilities |
|
|
78,674 |
|
|
69,520 |
|
|
Total noncurrent liabilities |
|
|
154,791 |
|
|
147,983 |
|
|
TOOTSIE ROLL INDUSTRIES, INC. SHAREHOLDERS’ EQUITY: |
|
|
|
|
|
|
|
|
Common stock, $.69-4/9 par value— 120,000 shares authorized— 37,285 and 37,011, respectively, issued |
|
|
25,892 |
|
|
25,702 |
|
|
Class B common stock, $.69-4/9 par value— 40,000 shares authorized— 22,887 and 22,256, respectively, issued |
|
|
15,894 |
|
|
15,455 |
|
|
Capital in excess of par value |
|
|
599,186 |
|
|
572,669 |
|
|
Retained earnings |
|
|
64,927 |
|
|
73,109 |
|
|
Accumulated other comprehensive loss |
|
|
(13,098) |
|
|
(4,638) |
|
|
Treasury stock (at cost)— 78 shares and 76 shares, respectively |
|
|
(1,992) |
|
|
(1,992) |
|
|
Total Tootsie Roll Industries, Inc. shareholders’ equity |
|
|
690,809 |
|
|
680,305 |
|
|
Noncontrolling interests |
|
|
327 |
|
|
— |
|
|
Total equity |
|
|
691,136 |
|
|
680,305 |
|
|
Total liabilities and shareholders’ equity |
|
$ |
910,386 |
|
$ |
888,409 |
|
23
|
CONSOLIDATED STATEMENTS OF |
|
||||||||||
|
Cash Flows |
|
||||||||||
|
TOOTSIE ROLL INDUSTRIES, INC. AND SUBSIDIARIES |
(in thousands) |
||||||||||
|
|
|
|
|
|
|
|
|
|
|
|
|
|
|
For the year ended December 31, |
|
|||||||
|
|
|
2014 |
|
2013 |
|
2012 |
|
|||
|
CASH FLOWS FROM OPERATING ACTIVITIES: |
|
|
|
|
|
|
|
|
|
|
|
Net earnings |
|
$ |
62,860 |
|
$ |
60,849 |
|
$ |
52,004 |
|
|
Adjustments to reconcile net earnings to net cash provided by operating activities: |
|
|
|
|
|
|
|
|
|
|
|
Depreciation |
|
|
20,758 |
|
|
20,050 |
|
|
19,925 |
|
|
Net loss on step acquisition |
|
|
529 |
|
|
— |
|
|
— |
|
|
Impairment of equity method investment |
|
|
— |
|
|
975 |
|
|
850 |
|
|
Loss from equity method investment |
|
|
— |
|
|
967 |
|
|
1,019 |
|
|
Amortization of marketable security premiums |
|
|
3,261 |
|
|
3,035 |
|
|
1,770 |
|
|
Changes in operating assets and liabilities: |
|
|
|
|
|
|
|
|
|
|
|
Accounts receivable |
|
|
(2,007) |
|
|
1,330 |
|
|
272 |
|
|
Other receivables |
|
|
1,289 |
|
|
253 |
|
|
(2,720) |
|
|
Inventories |
|
|
(7,329) |
|
|
503 |
|
|
9,588 |
|
|
Prepaid expenses and other assets |
|
|
9,524 |
|
|
14,922 |
|
|
11,295 |
|
|
Accounts payable and accrued liabilities |
|
|
(1,268) |
|
|
418 |
|
|
199 |
|
|
Income taxes payable and deferred |
|
|
(1,024) |
|
|
68 |
|
|
1,369 |
|
|
Postretirement health care benefits |
|
|
(1,289) |
|
|
2,861 |
|
|
2,829 |
|
|
Deferred compensation and other liabilities |
|
|
3,465 |
|
|
3,592 |
|
|
3,018 |
|
|
Net cash provided by operating activities |
|
|
88,769 |
|
|
109,823 |
|
|
101,418 |
|
|
CASH FLOWS FROM INVESTING ACTIVITIES: |
|
|
|
|
|
|
|
|
|
|
|
Net cash acquired in step acquisition |
|
|
161 |
|
|
— |
|
|
— |
|
|
Change in restricted cash |
|
|
224 |
|
|
— |
|
|
— |
|
|
Capital expenditures |
|
|
(10,704) |
|
|
(15,752) |
|
|
(8,886) |
|
|
Net sales (purchases) of trading securities |
|
|
(3,567) |
|
|
(5,500) |
|
|
(2,994) |
|
|
Purchase of available for sale securities |
|
|
(54,882) |
|
|
(66,324) |
|
|
(39,016) |
|
|
Sale and maturity of available for sale securities |
|
|
38,309 |
|
|
39,613 |
|
|
10,461 |
|
|
Net cash used in investing activities |
|
|
(30,459) |
|
|
(47,963) |
|
|
(40,435) |
|
|
CASH FLOWS FROM FINANCING ACTIVITIES: |
|
|
|
|
|
|
|
|
|
|
|
Shares purchased and retired |
|
|
(25,020) |
|
|
(23,143) |
|
|
(23,803) |
|
|
Dividends paid in cash |
|
|
(19,241) |
|
|
(14,282) |
|
|
(52,431) |
|
|
Repayment of bank loans |
|
|
(403) |
|
|
— |
|
|
— |
|
|
Net cash used in financing activities |
|
|
(44,664) |
|
|
(37,425) |
|
|
(76,234) |
|
|
|
|
|
|
|
|
|
|
|
|
|
|
Effect of exchange rate changes on cash |
|
|
(1,821) |
|
|
(14) |
|
|
501 |
|
|
|
|
|
|
|
|
|
|
|
|
|
|
Increase (decrease) in cash and cash equivalents |
|
|
11,825 |
|
|
24,421 |
|
|
(14,750) |
|
|
Cash and cash equivalents at beginning of year |
|
|
88,283 |
|
|
63,862 |
|
|
78,612 |
|
|
Cash and cash equivalents at end of year |
|
$ |
100,108 |
|
$ |
88,283 |
|
$ |
63,862 |
|
|
|
|
|
|
|
|
|
|
|
|
|
|
Supplemental cash flow information: |
|
|
|
|
|
|
|
|
|
|
|
Income taxes paid |
|
$ |
26,599 |
|
$ |
24,225 |
|
$ |
21,312 |
|
|
Interest paid |
|
$ |
34 |
|
$ |
21 |
|
$ |
31 |
|
|
Stock dividend issued |
|
$ |
52,165 |
|
$ |
48,925 |
|
$ |
38,236 |
|
(The accompanying notes are an integral part of these statements.)
24
Notes to Consolidated Financial Statements ($ in thousands except per share data)
TOOTSIE ROLL INDUSTRIES, INC. AND SUBSIDIARIES
NOTE 1—SIGNIFICANT ACCOUNTING POLICIES:
Basis of consolidation:
The consolidated financial statements include the accounts of Tootsie Roll Industries, Inc. and its wholly-owned and majority-owned subsidiaries (the Company), which are primarily engaged in the manufacture and sales of candy products. Non-controlling interests relating to majority-owned subsidiaries are reflected in the consolidated financial statements and all significant intercompany transactions have been eliminated.
The preparation of financial statements in conformity with generally accepted accounting principles in the United States of America requires management to make estimates and assumptions that affect the reported amounts of assets and liabilities and disclosure of contingent assets and liabilities at the date of the financial statements and the reported amounts of revenues and expenses during the reporting period. Actual results could differ from those estimates.
Revenue recognition:
Products are sold to customers based on accepted purchase orders which include quantity, sales price and other relevant terms of sale. Revenue, net of applicable provisions for discounts, returns, allowances and certain advertising and promotional costs, is recognized when products are delivered to customers and collectability is reasonably assured. Shipping and handling costs of $46,525, $45,367, and $45,072 in 2014, 2013 and 2012, respectively, are included in selling, marketing and administrative expenses. Accounts receivable are unsecured.
Cash and cash equivalents:
The Company considers temporary cash investments with an original maturity of three months or less to be cash equivalents.
Investments:
Investments consist of various marketable securities with maturities of generally up to three years. The Company classifies debt and equity securities as either available for sale or trading. Available for sale securities are not actively traded by the Company and are carried at fair value. The Company follows current fair value measurement guidance and unrealized gains and losses on these securities are excluded from earnings and are reported as a separate component of shareholders’ equity, net of applicable taxes, until realized or other-than-temporarily impaired. Trading securities relate to deferred compensation arrangements and are carried at fair value with gains or losses included in other income, net. The Company invests in trading securities to economically hedge changes in its deferred compensation liabilities.
The Company regularly reviews its investments to determine whether a decline in fair value below the cost basis is other-than-temporary. If the decline in fair value is judged to be other-than-temporary, the cost basis of the security is written down to fair value and the amount of the write-down is included in other income, net. Further information regarding the fair value of the Company’s investments is included in Note 10 to the Consolidated Financial Statements.
Derivative instruments and hedging activities:
Authoritative guidance requires qualitative disclosures about objectives and strategies for using derivatives, quantitative disclosures about fair value amounts of derivative instruments and related gains and losses, and disclosures about credit-risk-related contingent features in derivative agreements.
From time to time, the Company enters into commodity futures, commodity options contracts and foreign currency forward contracts. Commodity futures and options are intended and are effective as hedges of market price risks associated with the anticipated purchase of certain raw materials (primarily sugar). Foreign currency forward contracts
25
are intended and are effective as hedges of the Company’s exposure to the variability of cash flows, primarily related to the foreign exchange rate changes of products manufactured in Canada and sold in the United States, and periodic equipment purchases from foreign suppliers denominated in a foreign currency. The Company does not engage in trading or other speculative use of derivative instruments. Further information regarding derivative instruments and hedging activities is included in Note 11 to the Consolidated Financial Statements.
Inventories:
Inventories are stated at cost, not to exceed market. The cost of substantially all of the Company’s inventories ($65,545 and $58,038 at December 31, 2014 and 2013, respectively) has been determined by the last-in, first-out (LIFO) method. The excess of current cost over LIFO cost of inventories approximates $18,117 and $20,926 at December 31, 2014 and 2013, respectively. The cost of certain foreign inventories ($4,834 and $3,818 at December 31, 2014 and 2013, respectively) has been determined by the first-in, first-out (FIFO) method. Rebates, discounts and other cash consideration received from vendors related to inventory purchases is reflected as a reduction in the cost of the related inventory item, and is therefore reflected in cost of sales when the related inventory item is sold.
Property, plant and equipment:
Depreciation is computed for financial reporting purposes by use of the straight-line method based on useful lives of 20 to 35 years for buildings and 5 to 20 years for machinery and equipment. Depreciation expense was $20,758, $20,050 and $19,925 in 2014, 2013 and 2012, respectively.
Carrying value of long-lived assets:
The Company reviews long-lived assets to determine if there are events or circumstances indicating that the amount of the asset reflected in the Company’s balance sheet may not be recoverable. When such indicators are present, the Company compares the carrying value of the long-lived asset, or asset group, to the future undiscounted cash flows of the underlying assets to determine if impairment exists. If applicable, an impairment charge would be recorded to write down the carrying value to its fair value. The determination of fair value involves the use of estimates of future cash flows that involve considerable management judgment and are based upon assumptions about expected future operating performance. The actual cash flows could differ from management’s estimates due to changes in business conditions, operating performance, and economic conditions. No impairment charges of long-lived assets were recorded by the Company during 2014, 2013 and 2012.
Postretirement health care benefits:
The Company provides certain postretirement health care benefits to corporate office and management employees. The cost of these postretirement benefits is accrued during employees’ working careers. See Note 7 for changes to these benefits and the resulting effects of the negative amendment, as defined by guidance. The Company also provides split dollar life benefits to certain executive officers. The Company records an asset equal to the cumulative insurance premiums paid that will be recovered upon the death of covered employees or earlier under the terms of the plan. No premiums were paid in 2014, 2013 and 2012. Certain split dollar agreements were terminated during 2014 and 2013 which resulted in the full repayment to the Company of all of the cumulative premiums previously paid on these policies. During 2014 and 2013, the Company received $6,496 and $26,477, respectively, of such repayments which were recorded as a reduction in the carrying value of Split Dollar Officer Life Insurance.
Goodwill and indefinite-lived intangible assets:
In accordance with authoritative guidance, goodwill and intangible assets with indefinite lives are not amortized, but rather tested for impairment at least annually unless certain interim triggering events or circumstances require more frequent testing. All trademarks have been assessed by management to have indefinite lives because they are expected to generate cash flows indefinitely. Management believes that all assumptions used for the impairment tests are consistent with those utilized by market participants performing similar valuations The Company has completed its annual
26
impairment testing of its goodwill and trademarks at December 31 of each of the years presented. No impairments of intangibles, including goodwill were recorded in 2014, 2013 and 2012.
With respect to impairment testing of goodwill, the first step compares the reporting unit’s estimated fair value with its carrying value. Projected discounted cash flows are used to determine the fair value of the reporting unit. If the carrying value of a reporting unit’s net assets exceeds its fair value, the second step is applied to measure the difference between the carrying value and implied fair value of goodwill. If the carrying value of goodwill exceeds its implied fair value, the goodwill is considered impaired and reduced to its implied fair value. Non-amortizable intangible assets, trademarks, are tested for impairment by comparing the fair value of each trademark with its carrying value. The fair value of trademarks is determined using discounted cash flows and estimates of royalty rates. If the carrying value exceeds fair value, the trademark is considered impaired and is reduced to fair value.
Income taxes:
Deferred income taxes are recorded and recognized for future tax effects of temporary differences between financial and income tax reporting. The Company records valuation allowances in situations where the realization of deferred tax assets is not more-likely-than-not. Federal income taxes are provided on the portion of income of foreign subsidiaries that is expected to be remitted to the U.S. and become taxable, but not on the portion that is considered to be permanently reinvested in the foreign subsidiary.
Foreign currency translation:
The U.S. dollar is used as the functional currency where a substantial portion of the subsidiary’s business is indexed to the U.S. dollar or where its manufactured products are principally sold in the U.S. All other foreign subsidiaries use the local currency as their functional currency. Where the U.S. dollar is used as the functional currency, foreign currency remeasurements are recorded as a charge or credit to other income, net in the statement of earnings. Where the foreign local currency is used as the functional currency, translation adjustments are recorded as a separate component of accumulated other comprehensive income (loss).
Equity method investment and majority-owned subsidiaries:
The 2013 and 2012 financial results include the Company’s 50% interest in two Spanish companies that was accounted for using the equity method. The Company recorded an increase in its investment to the extent of its share of earnings, and reduced its investment to the extent of losses and dividends received. No dividends were paid in 2013 and 2012.
As of December 31, 2013 and 2012, management determined that the carrying value of this equity method investment was impaired as a result of accumulated losses from operations and review of future expectations. The Company recorded a pre-tax impairment charge of $975 and $850 in 2013 and 2012, respectively. The fair value was assessed primarily using the discounted cash flow method and liquidation valuation. The key inputs to this method include projections of future cash flows, determinations of appropriate discount rates, and other assumptions of the equity method investee which are considered reasonable and inherent in the discounted cash flow analysis. The Company’s carrying value of this investment at December 31, 2013 was not significant.
During first quarter 2014, the Company gained operating control of its two 50% owned Spanish companies when Company employee representatives assumed all positions on their boards of directors. This was considered a step acquisition, whereby the Company remeasured the previously held investment to fair value in first quarter 2014. As a result, the Company’s first quarter 2014 net earnings include a net loss of $529, including an additional income tax provision of $2,350 relating to deferred income taxes. During 2014, the Company further increased its control and ownership to 83% by subscribing to additional common shares of these Spanish subsidiaries for approximately $1,400 ($1,200 was paid in 2014, and the balance will be paid in 2015). The accompanying consolidated financial statements for the year ended December 31, 2014 include these Spanish companies and related minority interests. These Spanish subsidiaries are not material to the Company’s consolidated financial statements.
27
Restricted cash:
Restricted cash comprises certain cash deposits of the Company’s majority-owned Spanish subsidiaries with international banks that are pledged as collateral for letters of credit and bank borrowings.
VEBA trust:
During fourth quarter 2014 and 2013, the Company contributed $1,000 and $15,000 to a VEBA trust, managed and controlled by the Company, to fund the estimated future costs of certain employee health, welfare and other benefits. The Company is using these funds to pay the actual cost of such benefits through 2017. At December 31, 2014 and 2013, the VEBA trust held $10,845 and $13,991, respectively, of aggregate cash and cash equivalents. This asset value is included in prepaid expenses and long-term other assets in the Company’s Consolidated Statement of Financial Position. These assets are categorized as Level 1 within the fair value hierarchy.
Bank loans:
Long term bank loans comprise borrowings by the Company’s majority-owned Spanish subsidiaries which are held by international banks. The average weighted interest rate in 2014 was of 3.0% and maturity dates range from 1 to 4 years. Short term bank loans also relate to the Company’s majority-owned Spanish subsidiaries.
Comprehensive earnings:
Comprehensive earnings includes net earnings, foreign currency translation adjustments and unrealized gains/losses on commodity and/or foreign currency hedging contracts, available for sale securities and certain postretirement benefit obligations.
Earnings per share:
A dual presentation of basic and diluted earnings per share is not required due to the lack of potentially dilutive securities under the Company’s simple capital structure. Therefore, all earnings per share amounts represent basic earnings per share.
The Class B Common Stock has essentially the same rights as Common Stock, except that each share of Class B Common Stock has ten votes per share (compared to one vote per share of Common Stock), is not traded on any exchange, is restricted as to transfer and is convertible on a share-for-share basis, at any time and at no cost to the holders, into shares of Common Stock which are traded on the New York Stock Exchange.
Use of estimates:
The preparation of consolidated financial statements in conformity with accounting principles generally accepted in the U.S. requires management to make estimates and assumptions that affect the amounts reported. Estimates are used when accounting for sales discounts, allowances and incentives, product liabilities, assets recorded at fair value, income taxes, depreciation, amortization, employee benefits, contingencies and intangible asset and liability valuations. Actual results may or may not differ from those estimates.
Recent accounting pronouncements:
In August 2014, the FASB issued ASU 2014-15 which provides guidance about management's responsibility to evaluate whether there is substantial doubt about an entity's ability to continue as a going concern and to provide related footnote disclosures. This guidance will be effective for the annual period ending after December 15, 2016, and for annual periods and interim periods thereafter. We do not expect the adoption of this guidance to have a significant impact on our condensed consolidated financial statements.
28
In May 2014, the Financial Accounting Standards Board ("FASB") issued Accounting Standards Update ("ASU") 2014-09 that introduces a new five-step revenue recognition model in which an entity should recognize revenue to depict the transfer of promised goods or services to customers in an amount that reflects the consideration to which the entity expects to be entitled in exchange for those goods or services. This ASU also requires disclosures sufficient to enable users to understand the nature, amount, timing, and uncertainty of revenue and cash flows arising from contracts with customers, including qualitative and quantitative disclosures about contracts with customers, significant judgments and changes in judgments, and assets recognized from the costs to obtain or fulfill a contract. This standard is effective for fiscal years beginning after December 15, 2016, including interim periods within that reporting period. The Company is currently evaluating the new guidance to determine the impact it may have on the condensed consolidated financial statements.
In April 2014, the FASB issued ASU 2014-08, which includes amendments that change the requirements for reporting discontinued operations. The new guidance requires that the disposal of a component of an entity be reported as discontinued operations only if the action represents a strategic shift that will have a major effect on an entity’s operations and financial results, and would require expanded disclosures. This guidance will be effective beginning in the first quarter 2015. We do not expect the adoption of this guidance to have a significant impact on the condensed consolidated financial statements.
NOTE 2—ACCRUED LIABILITIES:
Accrued liabilities are comprised of the following:
|
|
|
|
|
|
|
|
|
|
|
|
December 31, |
|
||||
|
|
|
2014 |
|
2013 |
|
||
|
Compensation |
|
$ |
9,788 |
|
$ |
9,445 |
|
|
Other employee benefits |
|
|
7,185 |
|
|
7,825 |
|
|
Taxes, other than income |
|
|
3,284 |
|
|
2,776 |
|
|
Advertising and promotions |
|
|
19,805 |
|
|
19,133 |
|
|
Other |
|
|
6,420 |
|
|
6,401 |
|
|
|
|
$ |
46,482 |
|
$ |
45,580 |
|
NOTE 3—INDUSTRIAL DEVELOPMENT BONDS:
Industrial development bonds are due in 2027. The average floating interest rate, which is reset weekly, was 0.1% and 0.2% in 2014 and 2013, respectively. See Note 10 to the Consolidated Financial Statements for fair value disclosures.
NOTE 4—INCOME TAXES:
The domestic and foreign components of pretax income are as follows:
|
|
|
|
|
|
|
|
|
|
|
|
|
|
|
2014 |
|
2013 |
|
2012 |
|
|||
|
Domestic |
|
$ |
81,255 |
|
$ |
73,362 |
|
$ |
64,173 |
|
|
Foreign |
|
|
10,039 |
|
|
11,121 |
|
|
9,991 |
|
|
|
|
$ |
91,294 |
|
$ |
84,483 |
|
$ |
74,164 |
|
29
The provision for income taxes is comprised of the following:
|
|
|
|
|
|
|
|
|
|
|
|
|
|
|
2014 |
|
2013 |
|
2012 |
|
|||
|
Current: |
|
|
|
|
|
|
|
|
|
|
|
Federal |
|
$ |
25,173 |
|
$ |
16,192 |
|
$ |
24,312 |
|
|
Foreign |
|
|
549 |
|
|
219 |
|
|
231 |
|
|
State |
|
|
1,538 |
|
|
891 |
|
|
1,914 |
|
|
|
|
|
27,260 |
|
|
17,302 |
|
|
26,457 |
|
|
Deferred: |
|
|
|
|
|
|
|
|
|
|
|
Federal |
|
|
(172) |
|
|
4,286 |
|
|
(6,857) |
|
|
Foreign |
|
|
2,032 |
|
|
1,823 |
|
|
1,710 |
|
|
State |
|
|
(686) |
|
|
223 |
|
|
850 |
|
|
|
|
|
1,174 |
|
|
6,332 |
|
|
(4,297) |
|
|
|
|
$ |
28,434 |
|
$ |
23,634 |
|
$ |
22,160 |
|
Significant components of the Company’s net deferred tax liability at year end were as follows:
|
|
|
|
|
|
|
|
|
|
|
|
December 31, |
|
||||
|
|
|
2014 |
|
2013 |
|
||
|
Deferred tax assets: |
|
|
|
|
|
|
|
|
Accrued customer promotions |
|
$ |
3,219 |
|
$ |
3,156 |
|
|
Deferred compensation |
|
|
28,099 |
|
|
25,103 |
|
|
Postretirement benefits |
|
|
4,895 |
|
|
3,847 |
|
|
Other accrued expenses |
|
|
7,660 |
|
|
6,158 |
|
|
Foreign subsidiary tax loss carry forward |
|
|
12,972 |
|
|
12,512 |
|
|
Tax credit carry forward |
|
|
1,530 |
|
|
1,243 |
|
|
Realized capital losses |
|
|
— |
|
|
581 |
|
|
Unrealized capital loss |
|
|
— |
|
|
— |
|
|
|
|
|
58,375 |
|
|
52,600 |
|
|
Valuation allowance |
|
|
(2,478) |
|
|
(957) |
|
|
Total deferred tax assets |
|
$ |
55,897 |
|
$ |
51,643 |
|
|
Deferred tax liabilities: |
|
|
|
|
|
|
|
|
Depreciation |
|
$ |
31,520 |
|
$ |
33,129 |
|
|
Deductible goodwill and trademarks |
|
|
43,960 |
|
|
42,073 |
|
|
Accrued export company commissions |
|
|
5,555 |
|
|
5,391 |
|
|
Employee benefit plans |
|
|
3,907 |
|
|
5,100 |
|
|
Inventory reserves |
|
|
3,422 |
|
|
1,646 |
|
|
Prepaid insurance |
|
|
867 |
|
|
785 |
|
|
Unrealized capital gain |
|
|
2,364 |
|
|
709 |
|
|
Deferred gain on sale of real estate |
|
|
8,168 |
|
|
8,234 |
|
|
Total deferred tax liabilities |
|
$ |
99,763 |
|
$ |
97,067 |
|
|
Net deferred tax liability |
|
$ |
43,866 |
|
$ |
45,424 |
|
At December 31, 2014, the Company has recognized $386 of benefits related to its Mexican subsidiary tax credit carry-forwards. The carry-forward credits expire in 2017. A valuation allowance has been established for the carry-forward losses to reduce the future income tax benefits to amounts expected to be realized. The Company has also recognized $1,144 of benefits related to state tax credit carry-forwards. The state credit carry-forward expires in 2021. The Company expects that these state credit carry-forwards will be utilized before their expiration.
At December 31, 2014, the tax benefits of the Company’s Canadian subsidiary tax loss carry-forwards expiring by year are as follows: $289 in 2027, $5,767 in 2028, $4,104 in 2029 and $720 in 2031. The Company expects that these carry-forwards will be realized before their expiration.
30
At December 31, 2014, the amounts of the Company’s Spanish subsidiary loss carry-forwards expiring by year are as follows: $304 in 2026, $64 in 2027, $223 in 2028, $110 in 2029, $341 in 2030, $445 in 2031 and $605 in 2032. A full valuation allowance has been provided for these Spanish loss carry-forwards as the Company expects that the losses will not be utilized before their expiration.
The effective income tax rate differs from the statutory rate as follows:
|
|
|
|
|
|
|
|
|
|
|
|
2014 |
|
2013 |
|
2012 |
|
|
U.S. statutory rate |
|
35.0 |
% |
35.0 |
% |
35.0 |
% |
|
State income taxes, net |
|
1.0 |
|
1.0 |
|
1.1 |
|
|
Exempt municipal bond interest |
|
(0.5) |
|
(0.4) |
|
(0.5) |
|
|
Foreign tax rates |
|
(1.5) |
|
(2.0) |
|
(1.6) |
|
|
Qualified domestic production activities deduction |
|
(2.8) |
|
(2.2) |
|
(3.1) |
|
|
Tax credits receivable |
|
(0.6) |
|
(0.9) |
|
(0.9) |
|
|
Adjustment of deferred tax balances |
|
1.9 |
|
(1.1) |
|
(0.5) |
|
|
Reserve for uncertain tax benefits |
|
— |
|
(0.7) |
|
(0.3) |
|
|
Other, net |
|
(1.4) |
|
(0.7) |
|
0.7 |
|
|
Effective income tax rate |
|
31.1 |
% |
28.0 |
% |
29.9 |
% |
The Company has not provided for U.S. federal or foreign withholding taxes on $5,393 and $10,988 of foreign subsidiaries’ undistributed earnings as of December 31, 2014 and December 31, 2013, respectively, because such earnings are considered to be permanently reinvested. The Company estimates that the federal income tax liability on such remittances would approximate 30%. This foreign subsidiary holds $15,986 and $11,674 of cash and short term investments as of December 31, 2014 and 2013, respectively.
At December 31, 2014 and 2013, the Company had unrecognized tax benefits of $6,993 and $6,010, respectively. Included in this balance is $4,805 and $3,539, respectively, of unrecognized tax benefits that, if recognized, would favorably affect the annual effective income tax rate. As of December 31, 2014 and 2013, $1,591 and $1,157, respectively, of interest and penalties were included in the liability for uncertain tax positions.
A reconciliation of the beginning and ending balances of the total amounts of unrecognized tax benefits is as follows:
|
|
|
|
|
|
|
|
|
|
|
|
|
|
|
2014 |
|
2013 |
|
2012 |
|
|||
|
Unrecognized tax benefits at January 1 |
|
$ |
6,010 |
|
$ |
6,677 |
|
$ |
6,804 |
|
|
Increases in tax positions for the current year |
|
|
1,827 |
|
|
1,163 |
|
|
727 |
|
|
Increases in tax positions for new uncertain tax position |
|
|
609 |
|
|
— |
|
|
— |
|
|
Reductions in tax positions for lapse of statute of limitations |
|
|
(1,050) |
|
|
(867) |
|
|
(854) |
|
|
Reductions in tax positions relating to settlements with taxing authorities |
|
|
(403) |
|
|
(140) |
|
|
— |
|
|
Reductions in tax positions for effective settlements |
|
|
— |
|
|
(823) |
|
|
— |
|
|
Unrecognized tax benefits at December 31 |
|
$ |
6,993 |
|
$ |
6,010 |
|
$ |
6,677 |
|
The Company recognizes interest and penalties related to unrecognized tax benefits in the provision for income taxes on the Consolidated Statements of Earnings and Retained Earnings.
The Company is subject to taxation in the U.S. and various state and foreign jurisdictions. The Company remains subject to examination by U.S. federal and state and foreign tax authorities for the years 2011 through 2013. With few exceptions, the Company is no longer subject to examinations by tax authorities for the years 2010 and prior.
The Company is currently subject to a federal income tax examination of tax years 2011 and 2012. The Company’s Canadian subsidiary is currently subject to examination by the Canada Revenue Agency for tax years 2005 and 2007. The Company’s Spanish subsidiaries are currently subject to a court hearing relating to a tax examination by the Spanish tax authorities. In addition, the Company is currently subject to various state tax examinations. Although the Company is
31
unable to determine the ultimate outcome of the ongoing examinations and court hearing, the Company believes that its liability for uncertain tax positions relating to these jurisdictions for such years is adequate.
NOTE 5—SHARE CAPITAL AND CAPITAL IN EXCESS OF PAR VALUE:
|
|
|
|
|
|
|
|
|
|
|
|
|
|
|
|
|
|
|
|
|
|
|
|
|
|
|
|
|
|
|
|
|
|
|
|
|
|
|
Capital in |
|
|
|
|
|
|
|
|
|
|
Class B |
|
|
|
|
|
|
Excess |
|
||||
|
|
|
Common Stock |
|
Common Stock |
|
Treasury Stock |
|
of Par |
|
||||||||||
|
|
|
Shares |
|
Amount |
|
Shares |
|
Amount |
|
Shares |
|
Amount |
|
Value |
|
||||
|
|
|
(000’s) |
|
|
|
|
(000’s) |
|
|
|
|
(000’s) |
|
|
|
|
|
|
|
|
Balance at January 1, 2012 |
|
36,479 |
|
$ |
25,333 |
|
21,025 |
|
$ |
14,601 |
|
71 |
|
$ |
(1,992) |
|
$ |
533,677 |
|
|
Issuance of 3% stock dividend |
|
1,085 |
|
|
753 |
|
631 |
|
|
437 |
|
2 |
|
|
— |
|
|
37,046 |
|
|
Conversion of Class B common shares to common shares |
|
29 |
|
|
20 |
|
(29) |
|
|
(20) |
|
— |
|
|
— |
|
|
— |
|
|
Purchase and retirement of common shares |
|
(944) |
|
|
(656) |
|
— |
|
|
— |
|
— |
|
|
— |
|
|
(23,147) |
|
|
Balance at December 31, 2012 |
|
36,649 |
|
|
25,450 |
|
21,627 |
|
|
15,018 |
|
73 |
|
|
(1,992) |
|
|
547,576 |
|
|
Issuance of 3% stock dividend |
|
1,095 |
|
|
761 |
|
648 |
|
|
450 |
|
3 |
|
|
— |
|
|
47,714 |
|
|
Conversion of Class B common shares to common shares |
|
19 |
|
|
13 |
|
(19) |
|
|
(13) |
|
— |
|
|
— |
|
|
— |
|
|
Purchase and retirement of common shares |
|
(752) |
|
|
(522) |
|
— |
|
|
— |
|
— |
|
|
— |
|
|
(22,621) |
|
|
Balance at December 31, 2013 |
|
37,011 |
|
|
25,702 |
|
22,256 |
|
|
15,455 |
|
76 |
|
|
(1,992) |
|
|
572,669 |
|
|
Issuance of 3% stock dividend |
|
1,099 |
|
|
763 |
|
667 |
|
|
464 |
|
2 |
|
|
— |
|
|
50,939 |
|
|
Conversion of Class B common shares to common shares |
|
36 |
|
|
25 |
|
(36) |
|
|
(25) |
|
— |
|
|
— |
|
|
— |
|
|
Purchase and retirement of common shares |
|
(861) |
|
|
(598) |
|
— |
|
|
— |
|
— |
|
|
— |
|
|
(24,422) |
|
|
Balance at December 31, 2014 |
|
37,285 |
|
$ |
25,892 |
|
22,887 |
|
$ |
15,894 |
|
78 |
|
$ |
(1,992) |
|
$ |
599,186 |
|
Average shares outstanding and all per share amounts included in the financial statements and notes thereto have been adjusted retroactively to reflect annual three percent stock dividends.
While the Company does not have a formal or publicly announced Company Common Stock purchase program, the Company’s board of directors periodically authorizes a dollar amount for such share purchases.
Based upon this policy, shares were purchased and retired as follows:
|
|
|
|
|
|
|
|
|
|
|
Total Number of Shares |
|
|
|
|
|
Year |
|
Purchased (000’s) |
|
Average Price Paid Per Share |
|
|
|
2014 |
|
861 |
|
$ |
29.02 |
|
|
2013 |
|
752 |
|
$ |
30.73 |
|
|
2012 |
|
944 |
|
$ |
25.16 |
|
32
NOTE 6—OTHER INCOME, NET:
Other income, net is comprised of the following:
|
|
|
|
|
|
|
|
|
|
|
|
|
|
|
2014 |
|
2013 |
|
2012 |
|
|||
|
Interest and dividend income |
|
$ |
1,582 |
|
$ |
1,445 |
|
$ |
1,369 |
|
|
Gains on trading securities relating to deferred compensation plans |
|
|
4,901 |
|
|
10,588 |
|
|
4,616 |
|
|
Interest expense |
|
|
(99) |
|
|
(92) |
|
|
(137) |
|
|
Pretax gain on step acquisition |
|
|
1,821 |
|
|
— |
|
|
— |
|
|
Impairment of equity investment |
|
|
— |
|
|
(975) |
|
|
(850) |
|
|
Equity method investment loss |
|
|
— |
|
|
(967) |
|
|
(1,019) |
|
|
Foreign exchange gains (losses) |
|
|
(861) |
|
|
(790) |
|
|
442 |
|
|
Capital gains (losses) |
|
|
(219) |
|
|
2,576 |
|
|
(59) |
|
|
Miscellaneous, net |
|
|
246 |
|
|
345 |
|
|
323 |
|
|
|
|
$ |
7,371 |
|
$ |
12,130 |
|
$ |
4,685 |
|
NOTE 7—EMPLOYEE BENEFIT PLANS:
Pension plans:
The Company sponsors defined contribution pension plans covering certain non-union employees with over one year of credited service. The Company’s policy is to fund pension costs accrued based on compensation levels. Total pension expense for 2014, 2013 and 2012 approximated $4,391, $4,437 and $4,327, respectively. The Company also maintains certain profit sharing and retirement savings-investment plans. Company contributions in 2014, 2013 and 2012 to these plans were $1,117, $1,121 and $1,107, respectively.
The Company also contributes to a multi-employer defined benefit pension plan for certain of its union employees under a collective bargaining agreement which is currently under negotiation, as follows:
Plan name: Bakery and Confectionery Union and Industry International Pension Fund
Employer Identification Number and plan number: 52-6118572, plan number 001
Funded Status as of the most recent year available: 66.41% funded as of January 1, 2013
The Company’s contributions to such plan: $2,588, $2,231 and $2,131 in 2014, 2013 and 2012, respectively
Plan status: Critical as of December 31, 2013
Beginning in 2012, the Company received notices from the Bakery, Confectionery, Tobacco Workers and Grain Millers International Union (BC&T) Pension Plan (Plan), a multi-employer defined benefit pension plan for certain Company union employees. The notices indicated that the Plan’s actuary certified the Plan to be in critical status, the “Red Zone”, as defined by the Pension Protection Act (PPA) and the Pension Benefit Guaranty Corporation (PBGC), and that a plan of rehabilitation was adopted by the trustees of the Plan in fourth quarter 2012. The rehabilitation plan, which continues, requires that employer contributions include 5% compounded annual surcharge increases each year for an unspecified period of time beginning January 2013 (in addition to the 5% interim surcharge initiated in June 2012) as well as certain plan benefit reductions. Under the plan of rehabilitation, the Plan is projected to emerge from critical status sometime beyond a 30 year projection period. In the event that a plan does not have the financial resources to ultimately pay benefits at a level specified by law, then it must apply to the PBGC for government financial assistance. The Trustees have advised that neither the PPA nor regulatory guidance currently defines the rehabilitation standards for a plan that is not designed to emerge from critical status within the prescribed 10-year rehabilitation period. Recently enacted legislation (Multiemployer Pension Reform Act of 2014) may also affect the future of this Plan.
33
The Company was previously advised by the Plan that if the Company had withdrawn from the Plan during 2012 its estimated withdrawal liability would have been $37,200. The Company was recently advised by the Plan that its withdrawal liability would have been $56,400 if it had withdrawn from the Plan during 2014. The increase from 2012 to 2014 principally reflects changes in key actuarial assumptions, principally the effects of a lower interest rates proscribed by PBGC which were partially used to determine the present value of vested benefits, and a change to a more conservative mortality table. Should the Company actually withdraw from the Plan at a future date, a withdrawal liability, which could be higher than the above discussed amounts, could be payable to the Plan.
The Company’s existing labor contract with its BC&T local union commits the Company’s participation in this Plan through third quarter 2017. Pension expense, including surcharges, for the BC&T Plan for 2014 and 2013 was $2,588 and $2,231, respectively. The aforementioned expense includes surcharge increases of $342 and $242 in 2014 and 2013, respectively, related to the contribution increases required under the plan of rehabilitation. The Company is currently unable to determine the ultimate outcome of the above discussed matter and therefore, is unable to determine the effects on its consolidated financial statements, but, the ultimate outcome could be material to its consolidated results of operations in one or more future periods.
Deferred compensation:
The Company sponsors three deferred compensation plans for selected executives and other employees: (i) the Excess Benefit Plan, which restores retirement benefits lost due to IRS limitations on contributions to tax-qualified plans, (ii) the Supplemental Plan, which allows eligible employees to defer the receipt of eligible compensation until designated future dates and (iii) the Career Achievement Plan, which provides a deferred annual incentive award to selected executives. Participants in these plans earn a return on amounts due them based on several investment options, which mirror returns on underlying investments (primarily mutual funds). The Company economically hedges its obligations under the plans by investing in the actual underlying investments. These investments are classified as trading securities and are carried at fair value. At December 31, 2014 and 2013, these investments totaled $71,682 and $63,215, respectively. All gains and losses and related investment income from these investments, which are recorded in other income, net, are equally offset by corresponding increases and decreases in the Company’s deferred compensation liabilities.
Postretirement health care benefit plans:
During fourth quarter 2013, the Company restructured and amended its post-retirement health benefits plan provided to corporate office and management employees. These changes resulted in a negative plan amendment, as defined by accounting guidance, resulting in a $10,425 reduction in the Company’s benefit obligation as of December 31, 2013. The plan changes generally limited future annual cost increases in health benefits to 3%, restricted this benefit to current employees with long-term service with the Company, eliminated the Company provided life insurance benefit and required retirees to pay the full cost of life insurance, and eliminated all post-retirement benefits for future employees effective April 1, 2014. Post-retirement benefits liabilities (as amended) were $12,311 and $9,176 at December 31, 2014 and 2013, respectively. The aforementioned increase reflects actuarial losses relating to an 86 basis point decrease in the discount rate (3.83% discount rate used at December 31, 2014) which generally reflects lower market interest rates, and an update of the mortality table based on the Society of Actuaries’ research that indicates that retirees are living longer.
Amounts recognized in accumulated other comprehensive loss (pre-tax) at December 31, 2014 are as follows:
|
|
|
|
|
|
|
Prior service credit |
|
$ |
(9,449) |
|
|
Net actuarial loss |
|
|
(892) |
|
|
Net amount recognized in accumulated other comprehensive (gain) loss |
|
$ |
(10,341) |
|
The estimated actuarial loss (gain) and prior service credit (gain) to be amortized from accumulated other comprehensive loss (gain) into net periodic benefit cost during 2015 are $(101) and $(1,352), respectively.
34
The changes in the accumulated postretirement benefit obligation at December 31, 2014 and 2013 consist of the following:
|
|
|
December 31, |
|
||||
|
|
|
2014 |
|
2013 |
|
||
|
Benefit obligation, beginning of year |
|
$ |
9,176 |
|
$ |
27,381 |
|
|
Service cost |
|
|
342 |
|
|
1,036 |
|
|
Interest cost |
|
|
423 |
|
|
1,060 |
|
|
Plan amendments |
|
|
— |
|
|
(10,425) |
|
|
Actuarial (gain)/loss |
|
|
2,611 |
|
|
(9,734) |
|
|
Benefits paid |
|
|
(241) |
|
|
(142) |
|
|
Benefit obligation, end of year |
|
$ |
12,311 |
|
$ |
9,176 |
|
Net periodic postretirement benefit cost included the following components:
|
|
|
|
|
|
|
|
|
|
|
|
|
|
|
2014 |
|
2013 |
|
2012 |
|
|||
|
Service cost—benefits attributed to service during the period |
|
$ |
342 |
|
$ |
1,036 |
|
$ |
1,034 |
|
|
Interest cost on the accumulated postretirement benefit obligation |
|
|
423 |
|
|
1,060 |
|
|
1,113 |
|
|
Net amortization |
|
|
(1,804) |
|
|
671 |
|
|
1,036 |
|
|
Net periodic postretirement benefit cost (income) |
|
$ |
(1,039) |
|
$ |
2,767 |
|
$ |
3,183 |
|
The Company estimates future benefit payments will be $328, $367, $412, $451 and $501 in 2015 through 2019, respectively, and a total of $3,119 in 2020 through 2024. As a result of the plan changes, the Company will no longer qualify for the Medicare Part D retiree drugs subsidy which have historically not been significant.
NOTE 8—COMMITMENTS:
Rental expense aggregated $749, $793 and $967 in 2014, 2013 and 2012, respectively.
Future operating lease commitments are not significant.
NOTE 9—SEGMENT AND GEOGRAPHIC INFORMATION:
The Company operates as a single reportable segment encompassing the manufacture and sale of confectionery products. Its principal manufacturing operations are located in the United States and Canada, and its principal market is the United States. The Company also manufactures and sells confectionery products in Mexico, and exports products to Canada and other countries worldwide.
The following geographic data includes net product sales summarized on the basis of the customer location and long-lived assets based on their physical location:
|
|
|
|
|
|
|
|
|
|
|
|
|
|
|
2014 |
|
2013 |
|
2012 |
|
|||
|
Net product sales: |
|
|
|
|
|
|
|
|
|
|
|
United States |
|
$ |
488,795 |
|
$ |
495,082 |
|
$ |
499,660 |
|
|
Canada and Other |
|
|
51,100 |
|
|
44,545 |
|
|
46,325 |
|
|
|
|
$ |
539,895 |
|
$ |
539,627 |
|
$ |
545,985 |
|
|
Long-lived assets: |
|
|
|
|
|
|
|
|
|
|
|
United States |
|
$ |
153,444 |
|
$ |
160,099 |
|
$ |
161,504 |
|
|
Canada and Other |
|
|
36,637 |
|
|
36,817 |
|
|
39,786 |
|
|
|
|
$ |
190,081 |
|
$ |
196,916 |
|
$ |
201,290 |
|
Sales revenues from Wal-Mart Stores, Inc. aggregated approximately 23.7%, 23.8%, and 23.5% of net product sales during the years ended December 31, 2014, 2013 and 2012, respectively. Some of the aforementioned sales to Wal-Mart
35
are sold to McLane Company, a large national grocery wholesaler, which services and delivers certain of the Company products to Wal-Mart and other retailers in the U.S.A. Net product sales revenues from McLane, which includes these Wal-Mart sales as well as sales and deliveries to other Company customers, were 15.3% in 2014 and 15.1% in 2013; such revenues from McLane were less than 10% in 2012.
NOTE 10—FAIR VALUE MEASUREMENTS:
Current accounting guidance defines fair value as the price that would be received in the sale of an asset or paid to transfer a liability in an orderly transaction between market participants at the measurement date. Guidance requires disclosure of the extent to which fair value is used to measure financial assets and liabilities, the inputs utilized in calculating valuation measurements, and the effect of the measurement of significant unobservable inputs on earnings, or changes in net assets, as of the measurement date. Guidance establishes a three-level valuation hierarchy based upon the transparency of inputs utilized in the measurement and valuation of financial assets or liabilities as of the measurement date. Level 1 inputs include quoted prices for identical instruments and are the most observable. Level 2 inputs include quoted prices for similar assets and observable inputs such as interest rates, foreign currency exchange rates, commodity rates and yield curves. Level 3 inputs are not observable in the market and include management’s own judgments about the assumptions market participants would use in pricing the asset or liability. The use of observable and unobservable inputs is reflected in the hierarchy assessment disclosed in the table below.
As of December 31, 2014 and 2013, the Company held certain financial assets that are required to be measured at fair value on a recurring basis. These include derivative hedging instruments related to the foreign currency forward contracts and purchase of certain raw materials, investments in trading securities and available for sale securities. The Company’s available for sale and trading securities principally consist of municipal bonds and mutual funds that are publicly traded.
The following tables present information about the Company’s financial assets and liabilities measured at fair value as of December 31, 2014 and 2013, and indicate the fair value hierarchy and the valuation techniques utilized by the Company to determine such fair value:
|
|
|
|
|
|
|
|
|
|
|
|
|
|
|
|
|
|
Estimated Fair Value December 31, 2014 |
|
||||||||||
|
|
|
Total |
|
Input Levels Used |
|
||||||||
|
|
|
Fair Value |
|
Level 1 |
|
Level 2 |
|
Level 3 |
|
||||
|
Cash and equivalents |
|
$ |
100,108 |
|
$ |
100,108 |
|
$ |
— |
|
$ |
— |
|
|
Available for sale securities |
|
|
131,347 |
|
|
2,446 |
|
|
128,901 |
|
|
— |
|
|
Foreign currency forward contracts |
|
|
(1,939) |
|
|
— |
|
|
(1,939) |
|
|
— |
|
|
Commodity futures contracts, net |
|
|
(737) |
|
|
(737) |
|
|
— |
|
|
— |
|
|
Trading securities |
|
|
71,682 |
|
|
71,682 |
|
|
— |
|
|
— |
|
|
Total assets measured at fair value |
|
$ |
300,461 |
|
$ |
173,499 |
|
$ |
126,962 |
|
$ |
— |
|
|
|
|
|
|
|
|
|
|
|
|
|
|
|
|
|
|
|
Estimated Fair Value December 31, 2013 |
|
||||||||||
|
|
|
Total |
|
Input Levels Used |
|
||||||||
|
|
|
Fair Value |
|
Level 1 |
|
Level 2 |
|
Level 3 |
|
||||
|
Cash and equivalents |
|
$ |
88,283 |
|
$ |
88,283 |
|
$ |
— |
|
$ |
— |
|
|
Available for sale securities |
|
|
118,647 |
|
|
— |
|
|
118,647 |
|
|
— |
|
|
Foreign currency forward contracts |
|
|
(684) |
|
|
— |
|
|
(684) |
|
|
— |
|
|
Commodity futures contracts, net |
|
|
(130) |
|
|
(130) |
|
|
— |
|
|
— |
|
|
Trading securities |
|
|
63,215 |
|
|
63,215 |
|
|
— |
|
|
— |
|
|
Total assets measured at fair value |
|
$ |
269,331 |
|
$ |
151,368 |
|
$ |
117,963 |
|
$ |
— |
|
Available for sale securities which utilize Level 2 inputs consist primarily of municipal and corporate bonds, which are valued based on quoted market prices or alternative pricing sources with reasonable levels of price transparency.
36
A summary of the aggregate fair value, gross unrealized gains, gross unrealized losses, realized losses and amortized cost basis of the Company’s investment portfolio by major security type is as follows:
|
|
|
|
|
|
|
|
|
|
|
|
|
|
|
|
|
|
|
|
|
December 31, 2014 |
|
|||||||||||||
|
|
|
Amortized |
|
Fair |
|
Unrealized |
|
Realized |
|
|||||||
|
Available for Sale: |
|
Cost |
|
Value |
|
Gains |
|
Losses |
|
Losses |
|
|||||
|
Municipal bonds |
|
$ |
51,797 |
|
$ |
51,804 |
|
$ |
7 |
|
$ |
— |
|
$ |
— |
|
|
Corporate bonds |
|
|
72,587 |
|
|
72,075 |
|
|
— |
|
|
(512) |
|
|
— |
|
|
Government securities |
|
|
2,450 |
|
|
2,446 |
|
|
|
|
|
(4) |
|
|
|
|
|
Certificates of deposit |
|
|
5,014 |
|
|
5,007 |
|
|
|
|
|
(7) |
|
|
|
|
|
Mutual funds |
|
|
20 |
|
|
15 |
|
|
— |
|
|
(5) |
|
|
— |
|
|
|
|
$ |
131,868 |
|
$ |
131,347 |
|
$ |
7 |
|
$ |
(528) |
|
$ |
— |
|
|
|
|
|
|
|
|
|
|
|
|
|
|
|
|
|
|
|
|
|
|
December 31, 2013 |
|
|||||||||||||
|
|
|
Amortized |
|
Fair |
|
Unrealized |
|
Realized |
|
|||||||
|
Available for Sale: |
|
Cost |
|
Value |
|
Gains |
|
Losses |
|
Losses |
|
|||||
|
Municipal bonds |
|
$ |
75,488 |
|
$ |
75,622 |
|
$ |
134 |
|
$ |
— |
|
$ |
— |
|
|
Corporate bonds |
|
|
37,258 |
|
|
37,214 |
|
|
— |
|
|
(44) |
|
|
— |
|
|
Certificates of deposit |
|
|
5,796 |
|
|
5,794 |
|
|
|
|
|
(2) |
|
|
|
|
|
Mutual funds |
|
|
20 |
|
|
17 |
|
|
— |
|
|
(3) |
|
|
— |
|
|
|
|
$ |
118,562 |
|
$ |
118,647 |
|
$ |
134 |
|
$ |
(49) |
|
$ |
— |
|
During the fourth quarter 2013, the Company sold its investment in Jefferson County Alabama Sewer Revenue Refunding Warrants for $10,840. This was an auction rate security (ARS) originally purchased for $13,550 in 2008 with an insurance-backed AAA rating. Because the Company recorded an other-than-temporary pre-tax impairment of $5,140 in 2008 on this ARS investment which resulted in a carrying value of $8,410 at that time, a net gain of $2,430 was recorded on this sale in fourth quarter 2013. Since recording this initial impairment in 2008, the Company has carried this ARS investment at its estimated fair value utilizing a valuation model with Level 3 inputs, as defined by guidance, and resulting changes in the market value since the original impairment charge in 2008 have been recorded as changes to accumulated other comprehensive income (loss) each year.
The fair value of the Company’s industrial revenue development bonds at December 31, 2014 and 2013 were valued using Level 2 inputs which approximates the carrying value of $7,500 for both periods. Interest rates on these bonds reset weekly based on current market conditions.
NOTE 11—DERIVATIVE INSTRUMENTS AND HEDGING ACTIVITIES:
From time to time, the Company uses derivative instruments, including foreign currency forward contracts, commodity futures contracts and commodity option contracts, to manage its exposures to foreign exchange and commodity prices. Commodity futures contracts and most commodity option contracts are intended and effective as hedges of market price risks associated with the anticipated purchase of certain raw materials (primarily sugar). Foreign currency forward contracts are intended and effective as hedges of the Company’s exposure to the variability of cash flows, primarily related to the foreign exchange rate changes of products manufactured in Canada and sold in the United States, and periodic equipment purchases from foreign suppliers denominated in a foreign currency. The Company does not engage in trading or other speculative use of derivative instruments.
The Company recognizes all derivative instruments as either assets or liabilities at fair value in the Consolidated Statements of Financial Position. Derivative assets are recorded in other receivables and derivative liabilities are recorded in accrued liabilities. The Company uses either hedge accounting or mark-to-market accounting for its derivative instruments. Derivatives that qualify for hedge accounting are designated as cash flow hedges by formally documenting the hedge relationships, including identification of the hedging instruments, the hedged items and other critical terms, as well as the Company’s risk management objectives and strategies for undertaking the hedge transaction.
37
Changes in the fair value of the Company’s cash flow hedges are recorded in accumulated other comprehensive loss, net of tax, and are reclassified to earnings in the periods in which earnings are affected by the hedged item. Substantially all amounts reported in accumulated other comprehensive loss for commodity derivatives are expected to be reclassified to cost of goods sold. Substantially all amounts reported in accumulated other comprehensive loss for foreign currency derivatives are expected to be reclassified to other income, net.
The following table summarizes the Company’s outstanding derivative contracts and their effects on its Consolidated Statements of Financial Position at December 31, 2014 and 2013:
|
|
|
|
|
|
|
|
|
|
|
|
|
|
|
December 31, 2014 |
|
|||||||
|
|
|
Notional |
|
|
|
|
|
|
|
|
|
|
|
Amounts |
|
Assets |
|
Liabilities |
|
|||
|
Derivatives designated as hedging instruments: |
|
|
|
|
|
|
|
|
|
|
|
Foreign currency forward contracts |
|
$ |
27,603 |
|
$ |
— |
|
$ |
(1,939) |
|
|
Commodity futures contracts |
|
|
5,422 |
|
|
23 |
|
|
(760) |
|
|
Total derivatives designated as hedging instruments: |
|
|
|
|
|
23 |
|
|
(2,699) |
|
|
Derivatives not designated as hedging instruments: |
|
|
|
|
|
|
|
|
|
|
|
Commodity futures contracts |
|
|
|
|
|
— |
|
|
— |
|
|
Total derivatives not designated as hedging instruments: |
|
|
|
|
|
— |
|
|
— |
|
|
Total derivatives |
|
|
|
|
$ |
23 |
|
$ |
(2,699) |
|
|
|
|
|
|
|
|
|
|
|
|
|
|
|
|
December 31, 2013 |
|
|||||||
|
|
|
Notional |
|
|
|
|
|
|
|
|
|
|
|
Amounts |
|
Assets |
|
Liabilities |
|
|||
|
Derivatives designated as hedging instruments: |
|
|
|
|
|
|
|
|
|
|
|
Foreign currency forward contracts |
|
$ |
34,244 |
|
$ |
— |
|
$ |
(684) |
|
|
Commodity futures contracts |
|
|
5,601 |
|
|
41 |
|
|
(191) |
|
|
Total derivatives designated as hedging instruments: |
|
|
|
|
|
41 |
|
|
(875) |
|
|
Derivatives not designated as hedging instruments: |
|
|
|
|
|
|
|
|
|
|
|
Commodity futures contracts |
|
|
321 |
|
|
20 |
|
|
— |
|
|
Total derivatives not designated as hedging instruments: |
|
|
|
|
|
20 |
|
|
— |
|
|
Total derivatives |
|
|
|
|
$ |
61 |
|
$ |
(875) |
|
The effects of derivative instruments on the Company’s Consolidated Statement of Earnings, Comprehensive Earnings and Retained Earnings for years ended December 31, 2014 and 2013 are as follows:
|
|
|
|
|
|
|
|
|
|
|
|
|
|
|
For Year Ended December 31, 2014 |
|
|||||||
|
|
|
|
|
|
|
|
|
Gain (Loss) |
|
|
|
|
|
|
|
|
Gain (Loss) |
|
on Amount Excluded |
|
||
|
|
|
Gain (Loss) |
|
Reclassified from |
|
from Effectiveness |
|
|||
|
|
|
Recognized |
|
Accumulated OCI |
|
Testing Recognized |
|
|||
|
|
|
in OCI |
|
into Earnings |
|
in Earnings |
|
|||
|
Foreign currency forward contracts |
|
$ |
(2,256) |
|
$ |
(1,001) |
|
$ |
— |
|
|
Commodity futures contracts |
|
|
(881) |
|
|
(294) |
|
|
— |
|
|
Total |
|
$ |
(3,137) |
|
$ |
(1,295) |
|
$ |
— |
|
38
|
|
|
|
|
|
|
|
|
|
|
|
|
|
|
For Year Ended December 31, 2013 |
|
|||||||
|
|
|
|
|
|
|
|
|
Gain (Loss) |
|
|
|
|
|
|
|
|
Gain (Loss) |
|
on Amount Excluded |
|
||
|
|
|
Gain (Loss) |
|
Reclassified from |
|
from Effectiveness |
|
|||
|
|
|
Recognized |
|
Accumulated OCI |
|
Testing Recognized |
|
|||
|
|
|
in OCI |
|
into Earnings |
|
in Earnings |
|
|||
|
Foreign currency forward contracts |
|
$ |
(1,144) |
|
$ |
(460) |
|
$ |
— |
|
|
Commodity futures contracts |
|
|
(963) |
|
|
(986) |
|
|
— |
|
|
Total |
|
$ |
(2,107) |
|
$ |
(1,446) |
|
$ |
— |
|
For the years ended December 31, 2014 and 2013, the Company recognized a gain (loss) of $0 and $(42) in earnings, respectively, related to mark-to-market accounting for certain commodity futures contracts that did not receive hedge accounting.
NOTE 12—COMPREHENSIVE EARNINGS (LOSS):
The following table sets forth information with respect to accumulated other comprehensive earnings (loss):
|
|
|
|
|
|
|
|
|
|
|
|
|
|
|
|
|
|
|
|
|
|
|
|
|
|
|
|
|
|
|
|
|
|
|
|
|
|
|
Accumulated |
|
|
|
|
|
Foreign |
|
|
|
Foreign |
|
|
|
Postretirement |
|
Other |
|
||||||
|
|
|
Currency |
|
|
|
Currency |
|
Commodity |
|
and Pension |
|
Comprehensive |
|
||||||
|
|
|
Translation |
|
Investments |
|
Derivatives |
|
Derivatives |
|
Benefits |
|
Earnings (Loss) |
|
||||||
|
Balance at December 31, 2012 |
|
$ |
(13,406) |
|
$ |
908 |
|
$ |
- |
|
$ |
(111) |
|
$ |
(3,838) |
|
$ |
(16,447) |
|
|
Other comprehensive earnings (loss) before reclassifications |
|
|
(121) |
|
|
(854) |
|
|
(730) |
|
|
(614) |
|
|
12,777 |
|
|
10,458 |
|
|
Reclassifications from accumulated other comprehensive loss |
|
|
- |
|
|
- |
|
|
294 |
|
|
629 |
|
|
428 |
|
|
1,351 |
|
|
Other comprehensive earnings (loss) net of tax |
|
|
(121) |
|
|
(854) |
|
|
(436) |
|
|
15 |
|
|
13,205 |
|
|
11,809 |
|
|
Balance at December 31, 2013 |
|
$ |
(13,527) |
|
$ |
54 |
|
$ |
(436) |
|
$ |
(96) |
|
$ |
9,367 |
|
$ |
(4,638) |
|
|
|
|
|
|
|
|
|
|
|
|
|
|
|
|
|
|
|
|
|
|
|
|
|
|
|
|
|
|
|
|
|
|
|
|
|
|
|
|
Accumulated |
|
|
|
|
|
Foreign |
|
|
|
Foreign |
|
|
|
Postretirement |
|
Other |
|
||||||
|
|
|
Currency |
|
|
|
Currency |
|
Commodity |
|
and Pension |
|
Comprehensive |
|
||||||
|
|
|
Translation |
|
Investments |
|
Derivatives |
|
Derivatives |
|
Benefits |
|
Earnings (Loss) |
|
||||||
|
Balance at December 31, 2013 |
|
$ |
(13,527) |
|
$ |
54 |
|
$ |
(436) |
|
$ |
(96) |
|
$ |
9,367 |
|
$ |
(4,638) |
|
|
Other comprehensive earnings (loss) before reclassifications |
|
|
(3,155) |
|
|
(386) |
|
|
(1,439) |
|
|
(562) |
|
|
(1,776) |
|
|
(7,318) |
|
|
Reclassifications from accumulated other comprehensive loss |
|
|
(817) |
|
|
- |
|
|
639 |
|
|
188 |
|
|
(1,152) |
|
|
(1,142) |
|
|
Other comprehensive earnings (loss) net of tax |
|
|
(3,972) |
|
|
(386) |
|
|
(800) |
|
|
(374) |
|
|
(2,928) |
|
|
(8,460) |
|
|
Balance at December 31, 2014 |
|
$ |
(17,499) |
|
$ |
(332) |
|
$ |
(1,236) |
|
$ |
(470) |
|
$ |
6,439 |
|
$ |
(13,098) |
|
39
The amounts reclassified from accumulated other comprehensive income (loss) consisted of the following:
|
|
|
|
|
|
|
|
|
|
|
|
Details about Accumulated Other |
|
Year to Date Ended |
|
|
|
||||
|
Comprehensive Income Components |
|
December 31, 2014 |
|
December 31, 2013 |
|
Location of (Gain) Loss Recognized in Earnings |
|
||
|
Foreign currency derivatives |
|
$ |
1,001 |
|
$ |
459 |
|
Other income, net |
|
|
Commodity derivatives |
|
|
294 |
|
|
987 |
|
Product cost of goods sold |
|
|
Foreign currency translation |
|
|
(1,298) |
|
|
- |
|
Other income, net |
|
|
Postretirement and pension benefits |
|
|
(992) |
|
|
342 |
|
Selling, marketing and administrative expenses |
|
|
Postretirement and pension benefits |
|
|
(812) |
|
|
329 |
|
Product cost of goods sold |
|
|
Total before tax |
|
|
(1,807) |
|
|
2,117 |
|
|
|
|
Tax expense (benefit) |
|
|
665 |
|
|
(766) |
|
|
|
|
Net of tax |
|
$ |
(1,142) |
|
$ |
1,351 |
|
|
|
NOTE 13—GOODWILL AND INTANGIBLE ASSETS:
All of the Company’s intangible indefinite-lived assets are trademarks.
The changes in the carrying amount of trademarks for 2014 and 2013 were as follows:
|
|
|
|
|
|
|
|
|
|
|
|
2014 |
|
2013 |
|
||
|
Original cost |
|
$ |
193,767 |
|
$ |
193,767 |
|
|
Accumulated impairment losses as of January 1 |
|
|
(18,743) |
|
|
(18,743) |
|
|
Balance at January 1 |
|
$ |
175,024 |
|
$ |
175,024 |
|
|
Current year impairment losses |
|
|
— |
|
|
— |
|
|
Balance at December 31 |
|
$ |
175,024 |
|
$ |
175,024 |
|
|
Accumulated impairment losses as of December 31 |
|
$ |
(18,743) |
|
$ |
(18,743) |
|
The fair value of indefinite-lived intangible assets was primarily assessed using the present value of estimated future cash flows and relief-from-royalty method.
The Company has no accumulated impairment losses of goodwill.
40
Report of Independent Registered Public Accounting Firm
To the Board of Directors and Shareholders of Tootsie Roll Industries, Inc.:
In our opinion, the accompanying consolidated statements of financial position and the related consolidated statements of earnings, comprehensive earnings and retained earnings, and of cash flows present fairly, in all material respects, the financial position of Tootsie Roll Industries, Inc. and its subsidiaries at December 31, 2014 and December 31, 2013, and the results of their operations and their cash flows for each of the three years in the period ended December 31, 2014 in conformity with accounting principles generally accepted in the United States of America. Also in our opinion, the Company maintained, in all material respects, effective internal control over financial reporting as of December 31, 2014, based on criteria established in Internal Control—Integrated Framework (2013) issued by the Committee of Sponsoring Organizations of the Treadway Commission (COSO). The Company’s management is responsible for these financial statements, for maintaining effective internal control over financial reporting and for its assessment of the effectiveness of internal control over financial reporting, included in Management’s Report on Internal Control over Financial Reporting on page 27 of the 2014 Annual Report to Shareholders. Our responsibility is to express opinions on these financial statements and on the Company’s internal control over financial reporting based on our integrated audits. We conducted our audits in accordance with the standards of the Public Company Accounting Oversight Board (United States). Those standards require that we plan and perform the audits to obtain reasonable assurance about whether the financial statements are free of material misstatement and whether effective internal control over financial reporting was maintained in all material respects. Our audits of the financial statements included examining, on a test basis, evidence supporting the amounts and disclosures in the financial statements, assessing the accounting principles used and significant estimates made by management, and evaluating the overall financial statement presentation. Our audit of internal control over financial reporting included obtaining an understanding of internal control over financial reporting, assessing the risk that a material weakness exists, and testing and evaluating the design and operating effectiveness of internal control based on the assessed risk. Our audits also included performing such other procedures as we considered necessary in the circumstances. We believe that our audits provide a reasonable basis for our opinions.
A company’s internal control over financial reporting is a process designed to provide reasonable assurance regarding the reliability of financial reporting and the preparation of financial statements for external purposes in accordance with generally accepted accounting principles. A company’s internal control over financial reporting includes those policies and procedures that (i) pertain to the maintenance of records that, in reasonable detail, accurately and fairly reflect the transactions and dispositions of the assets of the company; (ii) provide reasonable assurance that transactions are recorded as necessary to permit preparation of financial statements in accordance with generally accepted accounting principles, and that receipts and expenditures of the company are being made only in accordance with authorizations of management and directors of the company; and (iii) provide reasonable assurance regarding prevention or timely detection of unauthorized acquisition, use, or disposition of the company’s assets that could have a material effect on the financial statements.
Because of its inherent limitations, internal control over financial reporting may not prevent or detect misstatements. Also, projections of any evaluation of effectiveness to future periods are subject to the risk that controls may become inadequate because of changes in conditions, or that the degree of compliance with the policies or procedures may deteriorate.

Chicago, IL
February 27, 2015
41
Performance Graph
The following performance graph compares the cumulative total shareholder return on the Company’s Common Stock for a five-year period (December 31, 2009 to December 31, 2014) with the cumulative total return of Standard & Poor’s 500 Stock Index (“S&P 500”) and the Dow Jones Industry Food Index (“Peer Group,” which includes the Company), assuming (i) $100 invested on December 31 of the first year of the chart in each of the Company’s Common Stock, S&P 500 and the Dow Jones Industry Food Index and (ii) the reinvestment of dividends.
Management’s Report on Internal Control Over Financial Reporting
The management of Tootsie Roll Industries, Inc. is responsible for establishing and maintaining adequate internal control over financial reporting, as such term is defined in the Securities Exchange Act of 1934 (SEC) Rule 13a-15(f). Our management conducted an evaluation of the effectiveness of the Company’s internal control over financial reporting as of December 31, 2014 as required by SEC Rule 13a-15(c). In making this assessment, we used the criteria established in Internal Control—Integrated Framework (2013) issued by the Committee of Sponsoring Organizations of the Treadway Commission (the COSO criteria). Based on our evaluation under the COSO criteria, our management concluded that our internal control over financial reporting was effective as of December 31, 2014.
42
The effectiveness of the Company’s internal control over financial reporting as of December 31, 2014 has been audited by PricewaterhouseCoopers LLP, an independent registered public accounting firm, as stated in their report which appears on page 26.
Tootsie Roll Industries, Inc.
Chicago, Illinois
February 27, 2015
Quarterly Financial Data (Unaudited)
TOOTSIE ROLL INDUSTRIES, INC. AND SUBSIDIARIES
|
|
|
|
|
|
|
|
|
|
|
|
|
|
|
|
|
|
|
|
|
(Thousands of dollars except per share data) |
|
|||||||||||||
|
|
|
First |
|
Second |
|
Third |
|
Fourth |
|
Year |
|
|||||
|
2014 |
|
|
|
|
|
|
|
|
|
|
|
|
|
|
|
|
|
Net product sales |
|
$ |
106,812 |
|
$ |
104,061 |
|
$ |
191,093 |
|
$ |
137,929 |
|
$ |
539,895 |
|
|
Product gross margin |
|
|
39,947 |
|
|
37,879 |
|
|
67,929 |
|
|
53,207 |
|
|
198,962 |
|
|
Net earnings attributable to Tootsie Roll Industries, Inc. |
|
|
9,581 |
|
|
9,026 |
|
|
26,668 |
|
|
18,023 |
|
|
63,298 |
|
|
Net earnings attributable to Tootsie Roll Industries, Inc. per share |
|
|
0.16 |
|
|
0.15 |
|
|
0.44 |
|
|
0.30 |
|
|
1.05 |
|
|
|
|
|
|
|
|
|
|
|
|
|
|
|
|
|
|
|
|
2013 |
|
|
|
|
|
|
|
|
|
|
|
|
|
|
|
|
|
Net product sales |
|
$ |
110,279 |
|
$ |
101,988 |
|
$ |
191,807 |
|
$ |
135,553 |
|
$ |
539,627 |
|
|
Product gross margin |
|
|
38,110 |
|
|
35,016 |
|
|
65,974 |
|
|
49,567 |
|
|
188,667 |
|
|
Net earnings attributable to Tootsie Roll Industries, Inc. |
|
|
9,069 |
|
|
8,369 |
|
|
26,043 |
|
|
17,368 |
|
|
60,849 |
|
|
Net earnings attributable to Tootsie Roll Industries, Inc. per share |
|
|
0.15 |
|
|
0.14 |
|
|
0.42 |
|
|
0.28 |
|
|
0.99 |
|
Net earnings per share is based upon average outstanding shares as adjusted for 3% stock dividends issued during the second quarter of each year as discussed above. The sum of the quarterly per share amounts may not equal annual amounts due to rounding.
2014-2013 QUARTERLY SUMMARY OF TOOTSIE ROLL INDUSTRIES, INC. STOCK PRICES AND DIVIDENDS PER SHARE
STOCK PRICES*
|
|
|
|
|
|
|
|
|
|
|
|
|
|
|
|
|
|
2014 |
|
2013 |
|
||||||||
|
|
|
High |
|
Low |
|
High |
|
Low |
|
||||
|
1st Qtr |
|
$ |
32.42 |
|
$ |
28.80 |
|
$ |
30.00 |
|
$ |
26.09 |
|
|
2nd Qtr |
|
$ |
30.11 |
|
$ |
27.40 |
|
$ |
32.81 |
|
$ |
29.30 |
|
|
3rd Qtr |
|
$ |
30.12 |
|
$ |
26.15 |
|
$ |
35.12 |
|
$ |
29.50 |
|
|
4th Qtr |
|
$ |
30.99 |
|
$ |
27.98 |
|
$ |
33.40 |
|
$ |
29.36 |
|
*NYSE - Closing Price
|
|
|
|
|
|
Estimated number of shareholders at February 2015: |
|
|
|
|
Common Stock |
|
11,800 |
|
|
Class B Common Stock |
|
4,300 |
|
43
DIVIDENDS DECLARED
|
|
|
|
|
|
|
|
|
|
|
|
2014 |
|
2013 |
|
||
|
1st Qtr |
|
$ |
0.08 |
|
$ |
0.08 |
|
|
2nd Qtr |
|
$ |
0.08 |
|
$ |
0.08 |
|
|
3rd Qtr |
|
$ |
0.08 |
|
$ |
0.08 |
|
|
4th Qtr |
|
$ |
0.08 |
|
$ |
0.08 |
|
NOTE: In addition to the above cash dividends, a 3% stock dividend was issued on April 4, 2014 and April 5, 2013. Cash dividends are restated to reflect 3% stock dividends.
Five Year Summary of Earnings and Financial Highlights
TOOTSIE ROLL INDUSTRIES, INC. AND SUBSIDIARIES
(Thousands of dollars except per share, percentage and ratio figures)
|
|
|
|
|
|
|
|
|
|
|
|
|
|
|
|
|
|
|
(See management’s comments starting on page 4) |
|
2014 |
|
2013 |
|
2012 |
|
2011 |
|
2010 |
|
|||||
|
Sales and Earnings Data (2) |
|
|
|
|
|
|
|
|
|
|
|
|
|
|
|
|
|
Net product sales |
|
$ |
539,895 |
|
$ |
539,627 |
|
$ |
545,985 |
|
$ |
528,369 |
|
$ |
517,149 |
|
|
Product gross margin |
|
|
198,962 |
|
|
188,667 |
|
|
180,412 |
|
|
163,144 |
|
|
167,815 |
|
|
Interest expense |
|
|
99 |
|
|
92 |
|
|
137 |
|
|
121 |
|
|
142 |
|
|
Provision for income taxes |
|
|
28,434 |
|
|
23,634 |
|
|
22,160 |
|
|
16,974 |
|
|
20,005 |
|
|
Net earnings attributable to Tootsie Roll Industries, Inc. |
|
|
63,298 |
|
|
60,849 |
|
|
52,004 |
|
|
43,938 |
|
|
53,063 |
|
|
% of net product sales |
|
|
11.7 |
% |
|
11.3 |
% |
|
9.5 |
% |
|
8.3 |
% |
|
10.3 |
% |
|
% of shareholders’ equity |
|
|
9.2 |
% |
|
8.9 |
% |
|
8.0 |
% |
|
6.6 |
% |
|
8.0 |
% |
|
Per Common Share Data (1)(3) |
|
|
|
|
|
|
|
|
|
|
|
|
|
|
|
|
|
Net earnings attributable to Tootsie Roll Industries, Inc. |
|
$ |
1.05 |
|
$ |
0.99 |
|
$ |
0.84 |
|
$ |
0.70 |
|
$ |
0.83 |
|
|
Cash dividends declared |
|
|
0.32 |
|
|
0.32 |
|
|
0.82 |
|
|
0.32 |
|
|
0.32 |
|
|
Stock dividends |
|
|
3 |
% |
|
3 |
% |
|
3 |
% |
|
3 |
% |
|
3 |
% |
|
Additional Financial Data (1)(2) |
|
|
|
|
|
|
|
|
|
|
|
|
|
|
|
|
|
Working capital |
|
$ |
200,162 |
|
$ |
179,990 |
|
$ |
136,476 |
|
$ |
153,272 |
|
$ |
176,662 |
|
|
Net cash provided by operating activities |
|
|
88,769 |
|
|
109,823 |
|
|
101,418 |
|
|
51,098 |
|
|
82,495 |
|
|
Net cash provided by (used in) investing activities |
|
|
(30,459) |
|
|
(47,963) |
|
|
(40,435) |
|
|
(51,157) |
|
|
(16,808) |
|
|
Net cash used in financing activities |
|
|
(44,664) |
|
|
(37,425) |
|
|
(76,234) |
|
|
(36,597) |
|
|
(41,011) |
|
|
Property, plant & equipment additions |
|
|
10,704 |
|
|
15,752 |
|
|
8,886 |
|
|
16,351 |
|
|
12,813 |
|
|
Net property, plant & equipment |
|
|
190,081 |
|
|
196,916 |
|
|
201,290 |
|
|
212,162 |
|
|
215,492 |
|
|
Total assets |
|
|
910,386 |
|
|
888,409 |
|
|
846,737 |
|
|
857,856 |
|
|
857,959 |
|
|
Long-term debt |
|
|
7,500 |
|
|
7,500 |
|
|
7,500 |
|
|
7,500 |
|
|
7,500 |
|
|
Total Tootsie Roll Industries, Inc. shareholders’ equity |
|
|
690,809 |
|
|
680,305 |
|
|
649,815 |
|
|
665,935 |
|
|
667,408 |
|
|
Average shares outstanding |
|
|
60,562 |
|
|
61,399 |
|
|
62,248 |
|
|
63,111 |
|
|
63,904 |
|
|
(1) |
Per Common share data and average shares outstanding adjusted for annual 3% stock dividends. |
|
(2) |
Certain reclassifications have been made to prior year numbers to conform to current year presentation. |
|
(3) |
The fourth quarter 2012 includes a $0.50 special dividend. |
44
Corporate Profile
Tootsie Roll Industries, Inc. has been engaged in the manufacture and sale of confectionery products for 118 years. Our products are primarily sold under the familiar brand names: Tootsie Roll, Tootsie Roll Pops, Caramel Apple Pops, Child’s Play, Charms, Blow Pop, Blue Razz, Cella’s chocolate covered cherries, Tootsie Dots, Tootsie Crows, Junior Mints, Junior Caramels, Charleston Chew, Sugar Daddy, Sugar Babies, Andes, Fluffy Stuff cotton candy, Dubble Bubble, Razzles, Cry Baby, Nik-L-Nip and EI Bubble.
Board of Directors
|
Ellen R. Gordon(1) |
Chairman of the Board and Chief Executive Officer |
|
Richard P. Bergeman(2)(3) |
Retired Senior Vice President, Bestfoods |
|
Lana Jane Lewis-Brent(2)(3) |
President, Paul Brent Designer, Inc., an art publishing, design and licensing company |
|
Barre A. Seibert(2)(3) |
Retired First Vice President, Washington Mutual Bank |
|
(1) |
Executive Committee (2) Audit Committee (3) Compensation Committee |
Officers
|
Ellen R. Gordon |
Chairman of the Board and Chief Executive Officer |
|
G. Howard Ember, Jr. |
Vice President, Finance & Chief Financial Officer |
|
John W. Newlin, Jr. |
Vice President, Manufacturing |
|
Thomas E. Corr |
Vice President, Marketing & Sales |
|
John P. Majors |
Vice President, Physical Distribution |
|
Barry P. Bowen |
Treasurer & Assistant Secretary |
|
Richard F. Berezewski |
Controller |
Offices, Plants
|
Executive Offices |
7401 S. Cicero Ave. |
|
|
Chicago, Illinois 60629 |
|
|
www.tootsie.com |
|
Plants/Warehouses |
Illinois |
|
|
Tennessee |
|
|
Massachusetts |
|
|
Pennsylvania |
|
|
Wisconsin |
|
|
Ontario, Canada |
|
|
Mexico City, Mexico |
|
|
Barcelona, Spain |
|
Foreign Sales Offices |
Mexico City, Mexico |
|
|
Ontario, Canada |
|
|
Barcelona, Spain |
45
Other Information
|
Stock Exchange |
New York Stock Exchange, Inc. |
|
Stock Identification |
Ticker Symbol: TR |
|
Stock Transfer Agent and Stock Registrar |
American Stock Transfer |
|
Independent Registered Public Accounting Firm |
PricewaterhouseCoopers LLP |
|
General Counsel |
Aronberg Goldgehn Davis & Garmisa |
|
Annual Meeting |
May 4, 2015 |
 Printed on recycled paper.

46