UNITED STATES
SECURITIES AND EXCHANGE COMMISSION
Washington, D.C. 20549
FORM 10-K
| x |
ANNUAL REPORT PURSUANT TO SECTION 13 OR 15(d) OF THE SECURITIES EXCHANGE ACT OF 1934 |
For the fiscal year ended December 31, 2014
OR
| ¨ |
TRANSITION REPORT PURSUANT TO SECTION 13 OR 15(d) OF THE SECURITIES EXCHANGE ACT OF 1934 |
For the transition period from to
Commission File Number 1-34004
SCRIPPS NETWORKS INTERACTIVE, INC.
(Exact name of registrant as specified in its charter)
|
|
|
| Ohio |
|
61-1551890 |
| (State or other jurisdiction of |
|
(IRS Employer |
| incorporation or organization) |
|
Identification Number) |
|
|
| 9721 Sherrill Boulevard |
|
|
| Knoxville, Tennessee |
|
37932 |
| (Address of principal executive offices) |
|
(Zip Code) |
Registrant’s telephone number, including area code: (865) 694-2700
|
|
|
| Title of each class |
|
Name of each exchange on which registered |
| Securities registered pursuant to Section 12(b) of the Act: |
|
New York Stock Exchange |
| Class A Common shares, $.01 par value |
|
|
Securities registered pursuant to Section 12(g) of the Act:
Not applicable
Indicate
by check mark if the registrant is a well-known seasoned issuer, as defined in Rule 405 of the Securities Act. Yes x No ¨
Indicate by check mark if the registrant is not required to file reports pursuant to
Section 13 of Section 15(d) of the Act. Yes ¨ No x
Indicate by check mark whether the registrant (1) has filed all reports required to be filed by Section 13 or 15(d) of the Securities Exchange
Act of 1934 during the preceding 12 months (or for such shorter period that the registrant was required to file such reports), and (2) has been subject to such filing requirements for the past 90 days. Yes x No ¨
Indicate by
check mark whether the registrant has submitted electronically and posted on its corporate website, if any, every Interactive Data File required to be submitted and posted pursuant to Rule 405 of Regulation S-T (§232.405 of this
chapter) during the preceding 12 months (or for such shorter period that the registrant was required to submit and post such
files). Yes x No ¨
Indicate by check mark if disclosure of delinquent filers pursuant to Item 405 of Regulation S-K is not contained herein, and will not be contained, to the best of the registrant’s knowledge, in
definitive proxy or information statements incorporated by reference in Part III of this Form 10-K or any amendment to this Form 10-K. x
Indicate by check mark whether the registrant is a large accelerated filer, an accelerated filer, non-accelerated filer, or a smaller reporting company
(as defined in Rule 12b-2 of the Exchange Act).
|
|
|
|
|
|
|
| Large accelerated filer |
|
x |
|
Accelerated filer |
|
¨ |
|
|
|
|
| Non-accelerated filer |
|
¨ |
|
Smaller reporting company |
|
¨ |
Indicate by check mark whether the registrant is a shell company (as defined in Rule 12b-2 of the
Act). Yes ¨ No x
The aggregate market value of Class A Common shares of the registrant held by non-affiliates of the registrant on June 30, 2014, was approximately $6,720,000,000. All Class A Common shares
beneficially held by executives and directors of the registrant and signatories to the Scripps Family Agreement have been deemed, solely for the purpose of the foregoing calculation, to be held by affiliates of the registrant. There is no active
market for our Common Voting shares.
As of January 31, 2015, there were 97,345,917 of the registrant’s Class A Common shares,
$.01 par value per share, outstanding and 34,317,171 of the registrant’s Common Voting shares, $.01 par value per share, outstanding.
Certain information required for Part III of this report is incorporated herein by reference to the proxy statement for the 2015 annual meeting of
shareholders.
INDEX TO SCRIPPS NETWORKS INTERACTIVE, INC. ANNUAL REPORT ON FORM 10-K FOR THE YEAR ENDED
DECEMBER 31, 2014
2
As used in this Annual Report on Form 10-K, the terms “SNI,” “the Company,”
“we,” “our” or “us” may, depending on the context, refer to Scripps Networks Interactive, Inc. (“SNI”), to one or more of its consolidated subsidiary companies, or to all of them taken as a whole.
AVAILABLE INFORMATION
Our Company website is www.scrippsnetworksinteractive.com. Copies of all of our filings with the U. S. Securities and Exchange Commission (the
“SEC”) are available free of charge on our website as soon as reasonably practicable after such material is filed with, or furnished to, the SEC. Our website also includes copies of the charters for our Compensation,
Nominating & Governance and Audit Committees, our Corporate Governance Principles, our Insider Trading Policy, our Ethics Policy and our Code of Business Conduct and Ethics for the Chief Executive Officer and Senior Financial Officers.
All of these documents are also available to shareholders in print upon request.
FORWARD-LOOKING STATEMENTS
Our Annual Report on Form 10-K contains certain forward-looking statements related to our businesses that are
based on our current expectations. Forward-looking statements are subject to certain risks, trends and uncertainties that could cause actual results to differ materially from the expectations expressed in the forward-looking statements. Such risks,
trends and uncertainties, which, in most instances, are beyond our control, include changes in advertising demand and other economic conditions; consumers’ tastes; program costs; labor relations; technological developments; competitive
pressures; interest rates; regulatory rulings; and reliance on third-party vendors for various products and services. The words “believe,” “expect,” “anticipate,” “estimate,” “intend” and similar
expressions identify forward-looking statements. All forward-looking statements, which are as of the date of this filing, should be evaluated with the understanding of their inherent uncertainty. We undertake no obligation to publicly update any
forward-looking statements to reflect events or circumstances after the date the statement is made.
3
PART I
ITEM 1. BUSINESS
BUSINESS OVERVIEW
SNI is one of the leading developers of lifestyle-oriented content for linear
and interactive video platforms including television and the internet, with respected, high-profile brands. Our businesses engage audiences and efficiently serve advertisers by delivering entertaining and highly useful content that focuses on
specifically defined topics of interest.
We manage our operations through our reportable segment, lifestyle media.
Lifestyle media includes our six national television networks, HGTV, Food Network, Travel Channel, DIY Network, Cooking Channel and Great American Country. Lifestyle media also includes websites that are associated with the aforementioned television
brands and other internet-based businesses serving home, food and travel related categories.
We also have established lifestyle media brands internationally. Our lifestyle-oriented channels are available in the United Kingdom (“UK”), other European markets, the Middle East and Africa
(“EMEA”), Asia-Pacific (“APAC”) and Latin America. The results for our international businesses are not separately identified as a reportable segment and are included within our corporate and other segment caption.
Our businesses earn revenue from advertising sales, affiliate fees and ancillary sales, including the sale and licensing of content and
consumer products. Programming expenses, employee costs and sales and marketing expenses are our primary operating costs.
We seek to engage audiences that are highly desirable to advertisers with entertaining and informative lifestyle content that is
produced for television, the internet and any other media platforms consumers choose. We intend to expand and enhance our lifestyle brands through creating popular new programming and content, distributing on various platforms, such as mobile
phones, tablets and video-on-demand, licensing of content and branded consumer products and increasing our international footprint.
BUSINESS SEGMENTS
Lifestyle Media
Our lifestyle media segment includes our six national television networks
and our portfolio of related interactive lifestyle brands. The segment generates revenue principally from the sale of advertising time on national television networks and interactive media platforms and from affiliate fees paid by service providers
that distribute our programming content. In 2014, revenues from advertising sales and affiliate fees approximated 69 percent and 29 percent, respectively, of total revenue for the lifestyle media segment. Our lifestyle media segment also earns
revenue from the licensing of content to third parties and brands for consumer products, such as videos, books, kitchenware and tools.
Advertising revenue generated by our national television networks depends on viewership ratings, as determined by Nielsen Media Research and other third-party research companies, and advertising rates
paid by advertisers for delivery of advertisements to certain viewer demographics. Revenue from advertising is subject to seasonality, market-based variations and general economic conditions. Advertising revenue is typically highest in the second
and fourth quarters and can fluctuate relative to the popularity of specific programs, blocks of programming during defined periods of the day and seasonal demand of advertisers. Revenues from affiliates are negotiated with individual multichannel
service providers. The negotiations typically result in multi-year carriage agreements that contain scheduled rate increases. The affiliate fees we receive are determined by the number of subscribers with access to the programming of our various
networks.
Programming expenses, employee costs and sales and marketing expenses are the primary operating costs of our
lifestyle media segment. Program amortization represented 46 percent of lifestyle media expenses in 2014, reflecting our continued investment in the improved quality and variety of programming on our networks. We incur sales and marketing expenses
to support brand-building initiatives at all of our television networks.
4
Our lifestyle-oriented interactive businesses are focused on the internal development and
acquisition of interactive media that is intended to diversify sources of revenue and enhance our competitive advantage as a leading provider of home, food, travel and lifestyle content. Revenue generated by our lifestyle interactive businesses is
derived primarily from the sale of display, banner and video advertising.
The lifestyle-oriented interactive businesses
consist of multiple websites, including, but not limited to, our six network-branded websites, HGTV.com, Foodnetwork.com, Travelchannel.com, DIYNetwork.com, Cookingchanneltv.com and GACTV.com. In addition to serving as home websites for the
television programming networks, the websites provide informational and instructional content on specific topics within their respective lifestyle content categories. The Company also operates uLive.com, a digital platform launched in 2013 that
distributes video programming and expands our lifestyle content into new categories, such as parenting, beauty and wellness. uLive.com presents both original video, as well as content aggregated from numerous partners, and generates revenue by
delivering advertising to users of the site. All of the interactive businesses benefit from archived television network programming, of which approximately 94 percent on a dollar basis, is owned by us. Our ownership of programming enables us to
efficiently and economically repurpose it for use on the internet and other interactive distribution channels, including video-on-demand and streaming services.
The lifestyle websites accounted for about 5 percent of the lifestyle media segment’s total revenue in 2014. The
strategic focus of the lifestyle interactive businesses is to grow advertising revenues by increasing views and video plays and attracting more unique visitors to our websites through site enhancements and additional video. Our strategy also
includes attracting a broader audience through placing our video programming on national video streaming sites, developing new sources of revenue that capitalize on traffic growth at our websites and capitalizing on the movement of advertising
dollars to mobile platforms.
We also have 50 percent ownership interests in HGTV Magazine JV and Food Network Magazine JV
and a 7.25 percent ownership interest in Fox-BRV
Southern Sports Holdings LLC, which comprises the Sports South and Fox Sports Net South regional television networks.
HGTV
HGTV reaches approximately 96 million domestic television households and is
simulcast in high definition (“HD”). HGTV programming content commands an audience interested specifically in home-related topics. HGTV is television’s only network dedicated solely to such topics as decorating, interior design, home
remodeling, landscape design and real estate. HGTV strives to engage audiences by creating original programming that is entertaining, instructional and informative. HGTV appeals more strongly to female viewers with higher incomes in the 18 to 49 age
range and 25 to 54 age range.
Programming on HGTV includes House Hunters, House Hunters International, Rehab
Addict, Fixer Upper, The Property Brothers and Flip or Flop. The network also has developed successful programming events, including the HGTV Dream Home Giveaway, HGTV Smart Home Giveaway, HGTV Urban Oasis Giveaway
and annual live coverage of the Tournament of Roses Parade. Many of the programs on HGTV feature, or are hosted by, high-profile television personalities such as Drew and Jonathan Scott; Nicole Curtis; Chip and Joanna Gaines; Tarek
and Christina El Moussa and cousins Anthony Carrino and John Colaneri.
Food Network
Food Network is available in approximately 97 million U.S. television households and is simulcast in HD. We currently own approximately 69 percent of
the Food Network, and we are the managing partner. The Tribune Media Company (“Tribune”) has a noncontrolling interest of approximately 31 percent in Food Network.
Food Network programming content attracts audiences interested in food-related topics such as food preparation, dining out,
entertaining, food manufacturing, nutrition and healthy eating. Food Network engages audiences by creating original programming that is entertaining, instructional and informative. Food Network appeals more strongly to female viewers with higher
incomes in the 18 to 49 age range and 25 to 54 age range.
5
Programming on Food Network includes primetime series Beat Bobby Flay, Chopped,
Cutthroat Kitchen, Diners, Drive-ins and Dives, Food Network Star; Guy’s Grocery Games and Restaurant Impossible, as well as daytime series Giada at Home, The Kitchen, Pioneer Woman and
Trisha’s Southern Kitchen. Food Network hosts include high-profile television personalities such as Anne Burrell, Alex Guarnaschelli, Alton Brown, Bobby Flay, Giada De Laurentiis, Guy Fieri, Rachael Ray, Ree Drummond, Robert Irvine and
Trisha Yearwood.
Travel Channel
Travel Channel is available in about 92 million domestic television households and is simulcast in HD. We currently own 65 percent of the Travel Channel. Cox Communications, Inc. has a noncontrolling
interest of 35 percent in Travel Channel.
Travel Channel programming content attracts travel enthusiasts and is a
leading travel multi-media brand offering quality television, video and mobile entertainment and information. Travel Channel programming appeals to viewers who are more affluent than the average cable viewer and skews slightly toward adult men in
the 18 to 49 age range.
Programming on Travel Channel includes Hotel Impossible, Mysteries at the
Museum, Bizarre Foods, Trip Flip, Booze Traveler, Expedition Unknown and Ghost Adventures. Many of the programs on Travel Channel feature, or are hosted by, high-profile television personalities such
as Andrew Zimmern, Samantha Brown, Don Wildman, Anthony Melchiorri, Bert Kreischer, Jack Maxwell, Josh Gates and Zak Bagans.
DIY Network
DIY Network is available in approximately 58 million U.S. television households and is simulcast in HD. DIY Network programming
provides entertaining and informational content across a broad range of do-it-yourself categories including home building, home improvement, crafts, gardening and landscaping. DIY Network appeals more strongly to male viewers with higher incomes in
the 18 to 49 age range and 25 to 54 age range.
Programming on DIY Networks includes Vanilla Ice Project,
Vanilla Ice Goes Amish,
Sledgehammer and the Crashers series. Many of the programs on DIY Network feature, or are hosted by, television personalities such as Jason Cameron, Alison Victoria,
Matt Muenster and Chris Lambton.
Cooking Channel
Cooking Channel is available in about 62 million domestic households and is simulcast in HD. We currently own approximately 69 percent of this network, which represents a controlling interest.
Tribune has a noncontrolling interest of approximately 31 percent in Cooking Channel.
Cooking Channel programming caters to
avid food lovers by focusing on food information and instructional cooking and delivers content focused on baking, ethnic cuisine, wine and spirits, healthy and vegetarian cooking and kids’ foods. The Cooking Channel appeals more strongly to
female viewers with higher incomes in the 18 to 49 age range and 25 to 54 age range.
Programming on Cooking Channel
includes Brunch @ Bobby’s, Emeril’s Florida, Extra Virgin, Man Fire Food, My Grandmother’s Ravioli and Rev Run’s Sunday Suppers. Cooking Channel hosts include notable television personalities such as
Debi Mazar and Gabriele Corcos, Emeril Lagasse, Haylie Duff, Mo Rocca, Rev Run and Justine Simmons.
Great American Country
Great American Country reaches about 60 million U.S. television households and is simulcast in HD. Great American Country provides its viewers with
programming that celebrates the country lifestyle and includes the country music experience, music performance specials, live concerts and country music videos.
Content on Great American Country includes Farm Kings, Kimberly’s Simply Southern, Celebrity Motor Homes and the Top 20 Country Countdown.
International
As a producer of
lifestyle content throughout the world, SNI is gaining scale through a concerted international growth strategy. As of December 31, 2014, the Company distributed six lifestyle brands via 20 unique distribution feeds, including HGTV,
6
DIY Network, Food Network, Asian Food Channel (“AFC”), Fine Living, and Travel Channel, reaching over 130 million subscribers. Content is distributed in 29 languages with channel
feeds customized according to language in more than 160 countries and territories across Europe, Middle East, Africa, Asia Pacific, Latin America and the Caribbean.
Internationally, we also have joint-venture partnerships with BBC Worldwide for UKTV and its suite of 10 general entertainment and lifestyle networks in the UK, and Shaw Media for HGTV, DIY Network and
Food Network in Canada. Programming content is made available through licensing and distribution to more than 220 countries and territories around the world.
In 2009, the Company launched its first international pay television channel through Food Network in the UK. The channel first launched on pay television, then expanded its distribution in 2011 to
free-to-air on Freeview, initially in primetime and then as a full 24-hour broadcast channel in 2012. Currently, Food Network is the top lifestyle channel and the third most viewed non-scripted factual channel in the UK. Food Network is also
available across EMEA, APAC and Latin America, where it most recently launched in Brazil.
In 2013, the Company acquired
AFC, a complementary channel brand to Food Network, in Asia. AFC, which is based in Singapore, broadcasts 24 hours a day, seven days a week and reaches about 8 million subscribers in 11 markets.
Travel Channel International Ltd. (“TCI”) was acquired in 2012 along with its base of operations in London. TCI is broadcast
in 21 languages across a wide network of affiliates throughout EMEA and APAC. In 2013, TCI also became available on Freeview in primetime in the UK.
In early 2014, we launched the Fine Living Network in Italy on the digital terrestrial television. Since its launch, over 40 percent of Italy’s television population has tuned into the channel. In
late 2014, we launched HGTV in Singapore, which is the first channel dedicated to the home and lifestyle category across Asia Pacific.
Our international businesses earn revenues from advertising sales, affiliate fees and the licensing of
programming to third parties. Satellite transmission fees, programming expenses, employee costs and sales and marketing expenses are the primary operating costs of our international
businesses.
Competition
Cable, satellite and telecommunications network programming is a highly competitive business in the U.S. and worldwide. Our television networks and websites generally compete for advertising revenue with
other cable and broadcast television networks, online and mobile outlets, radio programming and print media. Our television networks and websites also compete for their target audiences with all forms of programming and other media provided to
viewers, including broadcast networks, local over-the-air television stations, competitors’ pay and basic cable television networks, pay-per-view and video-on-demand services, streaming services, online activities and other forms of news,
information and entertainment. Additionally, our networks compete with other television networks for affiliate fees derived from distribution agreements with cable television and satellite operators, telecommunication service providers and other
distributors.
Intellectual Property
Our intellectual property (“IP”) assets include copyrights in television content, trademarks in brands, names and logos, websites, and licenses from third parties. To defend these assets, we
rely upon a combination of common law, statutory and contractual legal protections. There can be no assurance, however, of the degree to which these measures will be successful. Moreover, effective IP protection may be either unavailable or limited
in certain foreign territories. Policing unauthorized use of our products and services and related IP is difficult and costly. Third parties may challenge the validity or scope of our IP from time to time, and the success of any such challenges
could result in the limitation or loss of IP rights. Irrespective of their validity, such claims may result in substantial costs and diversion of resources which could have an adverse effect on our operations. In addition, piracy, which encompasses
the theft of our signal and unauthorized use of our content in the digital environment, continues to present a threat to revenues.
7
Regulatory Matters
The Company is subject to and affected by laws and regulations of U.S. federal, state and local governmental authorities as well as to the laws and regulations of international countries and bodies,
such as the European Union (the “EU”). These laws and regulations are subject to change. Additionally, the Federal Communications Commission (the “FCC”) regulates cable television and satellite operators and telecommunication
providers, which could affect our networks indirectly.
Closed Captioning
All of our cable networks must provide closed-captioning programming for the hearing impaired. The 21st Century Communications and Video Accessibility Act of 2010 also
requires us to provide closed captioning on certain video programming that we offer on the internet.
CALM Act
FCC rules require multichannel video programming distributors to ensure that all commercials comply with specified volume standards. Our affiliation
agreements generally require us to certify compliance with such standards.
“Must-Carry” Requirements
The FCC’s implementation of the statutory “must-carry” obligations requires cable operators and multichannel video programming distributors
to give broadcasters preferential access to channel space. In contrast, programming television networks, such as ours, have no guaranteed right of carriage on these systems. This may reduce the amount of channel space that is available for carriage
of our television networks by these systems.
Regulation of the Internet and Mobile Applications
We operate numerous websites and make available mobile applications (“apps”) which we use to distribute information about our programs and to
engage more deeply with our viewers. The operation of these websites and distribution of these apps are subject to a range of federal, state and local laws, such as privacy and consumer protection regulations.
Employees
As of December 31, 2014, we had approximately 2,100 full-time equivalent employees.
Executive Officers of the Company
Our
executive officers as of February 27, 2015 were as follows:
|
|
|
|
|
| Name |
|
Age |
|
Position |
| Kenneth W. Lowe |
|
64 |
|
Chairman, President and Chief Executive Officer (since July 2008); President, Chief Executive Officer and Director, The E. W. Scripps Company (2000 to 2008) |
|
|
|
| Joseph G. NeCastro |
|
58 |
|
Chief Development Officer (since February 2015); Chief Financial & Administrative Officer (2010 to 2015); Executive Vice President and Chief Financial Officer (2008 to 2010);
Executive Vice President and Chief Financial Officer, The E. W. Scripps Company (2006 to 2008) |
|
|
|
| Burton Jablin |
|
54 |
|
President, Scripps Networks (since October 2013); President, Home Category (2010 to 2013), President, HGTV (2008 to 2010); President HGTV, The E. W. Scripps Company (2001 to
2008) |
|
|
|
| Cynthia L. Gibson |
|
50 |
|
Executive Vice President, Chief Legal Officer and Corporate Secretary (since December 2012); Executive Vice President, Legal Affairs (2009 to
2012) |
8
|
|
|
|
|
| Name |
|
Age |
|
Position |
|
|
|
| Mark S. Hale |
|
56 |
|
Executive Vice President, Global Operations and Chief Technology Officer (since February 2010); Senior Vice President, Technology Operations and Chief Technology Officer (2008 to
2010); Senior Vice President/Technology Operations, The E. W. Scripps Company (2006 to 2008) |
|
|
|
| Lori A. Hickok |
|
51 |
|
Executive Vice President, Chief Financial Officer (since February 2015); Executive Vice President, Finance (2010 to 2015); Senior Vice
President, Finance (2008 to 2010); Vice President and Controller, The E. W. Scripps Company (2002 to 2008) |
|
|
|
| Nello-John Pesci Jr. |
|
52 |
|
Executive Vice President, Chief Human Resources Officer (since February 2015); Executive Vice President, Human Resources (2014 to 2015); Senior Vice President, Human Resources (2010
to 2014); Global Human Resources Leader, Procter & Gamble Company (1991 to 2010) |
ITEM 1A. RISK FACTORS
A number of significant risk factors could materially affect our specific business operations and cause our performance to differ materially from any future results projected or implied by our prior
statements. Based on the information currently known to us, we believe that the following information identifies the most significant risk factors affecting our company. The risks and uncertainties our Company faces, however, are not limited to
those set forth in the risk factors described below. Additional risks and uncertainties not presently known to us or that we currently believe to be immaterial may also adversely affect our business.
In addition, past financial performance may not be a reliable indicator of future performance, and historical trends should not be used
to anticipate results or trends in future periods.
If any of the following risks or uncertainties develops into actual events, these events
could have a material effect on our business, financial condition or results of operations. In such case, the trading price of our common shares could decline.
Changes in public and consumer tastes and preferences could reduce demand for our services and reduce profitability of our businesses.
Each of our networks provides content and services whose success is primarily dependent upon acceptance by the public. We must consistently create and
distribute offerings that appeal to the prevailing consumer tastes at any point in time. Audience preferences change frequently, and it is a challenge to anticipate what content will be successful at any point. Other factors, including the
availability of alternative forms of entertainment and leisure time activities, general economic conditions and the growing competition for consumer discretionary spending may also affect the audience for our content and services. If our networks do
not achieve sufficient consumer acceptance, revenues may decline and adversely affect our profitability.
If we are unable to maintain
distribution agreements with cable and satellite distributors and telecommunications service providers (“Distributors”) at acceptable rates and terms, our revenues and profitability could be negatively affected.
We enter into multi-year contracts for our national television networks with Distributors. Our long-term distribution arrangements enable us to reach a
large percentage of cable households across the United States. As these contracts expire, we must renew or renegotiate them. If we are unable to renew them on acceptable terms or at rates similar to those in other affiliate contracts, we may lose
distribution rights and/or affiliate fee revenues.
These distribution agreements may also include “most favored
nation” (“MFN”) clauses. Such clauses typically provide that, in the event we enter into an agreement with another Distributor on more favorable terms, those terms must be offered to the Distributor holding the MFN right, subject to
certain exceptions and conditions. The MFN clauses within our distribution agreements are generally complex. Parties may interpret them differently and reach a
9
conflicting view of compliance of that held by the Company, which, if proven correct, could have an adverse effect on our financial condition or results of operations.
The loss of a significant affiliate arrangement on basic programming tiers could reduce distribution of our networks, thereby adversely
affecting affiliate fee revenue, subjecting certain of our intangible assets to possible impairments and potentially impacting our ability to sell advertising or the rates we charge for such advertising.
Three of our networks that are carried on digital tiers are dependent upon the willingness of consumers to pay for such tiers, as well
as our ability to negotiate favorable carriage agreements on widely accepted digital tiers.
Further consolidation among
cable and satellite distributors and telecommunications service providers could adversely affect our revenues, profitability and financial condition of our businesses. Consolidation among Distributors has given the largest cable and satellite
television systems considerable leverage in their relationship with programmers. The two largest cable television system operators provide service to approximately 35 percent of households receiving cable or satellite television service today, while
the two largest satellite television operators provide service to an additional 34 percent of such households.
Continued
consolidation within the industry could reduce the number of Distributors available to carry our programming, subject our affiliate fee revenue to greater volume discounts and further increase the negotiating leverage of the cable and satellite
television system operators, which could have an adverse effect on our financial condition or results of operations.
Our networks face
significant competitive pressures related to attracting consumers and advertisers. Failure by us to maintain our competitive advantage may affect the profitability of our networks.
We face substantial competition from alternative providers of similar services. Our national television networks compete for viewers with other broadcast and national television networks and with home
video products and internet usage, as well as with other programming providers for carriage of programming. Additionally, our national television networks compete for advertising revenues with a
variety of other media alternatives, including other broadcast and national television networks, the internet, newspapers, radio stations and print media. Our websites compete for visitors and advertising dollars with other forms of media aimed at
attracting similar audiences and, therefore, must provide popular content in order to maintain and increase site traffic. Competition may divert consumers from our services, which could reduce the profitability of our networks.
Changes in consumer behavior resulting from new technologies and distribution platforms may impact the performance of our networks.
We must adapt to advances in technologies and distribution platforms related to content transfer to ensure that our content remains
desirable and widely available to our audiences. The ability to anticipate and take advantage of new and future sources of revenue from technological developments will affect our ability to continue to increase our revenue and expand our business.
Additionally, we must adapt to the changing consumer behavior driven by advances in technology, such as video-on-demand, and devices, such as tablets and mobile, providing consumers the ability to view content from remote locations and enabling
general preferences for user-generated and interactive content. Changes of these types may impact our traditional distribution methods for our content. If we cannot ensure that our distribution methods and content allow us to reach our target
audiences, there could be a negative effect on our business.
Our lifestyle media business is subject to risks of adverse changes in
laws and regulations, which could result in reduced distribution of certain of our national television networks.
Our programming
services and the distributors of our programming, including cable and satellite operators, telecommunication providers and internet companies, are regulated by U.S. federal laws and regulations issued and administered by various federal
agencies, including the FCC, as well as by state and local governments. The U.S. Congress and the FCC currently have under consideration, and may in the
10
future adopt, new laws, regulations and policies regarding a wide variety of matters that could, directly or indirectly, affect our operations. For example, legislators and regulators continue to
consider rules that would effectively require cable television operators to offer all programming on an à la carte basis, which would allow viewers to subscribe to individual networks rather than a package of channels, and/or require
programmers to sell channels to Distributors on an à la carte basis. Certain cable television operators and other Distributors have already introduced tiers, or more targeted channel packages, to their customers that may or may not include
some or all of our networks. The unbundling of programming could reduce distribution of certain of our networks, thereby leading to reduced viewership and increased marketing expenses and affect our ability to compete for or attract the same level
of advertising dollars or distribution fees.
Changes in economic conditions in the United States, the regional economies in which we
operate or in specific industry sectors could adversely affect the profitability of our businesses.
Approximately 70 percent of
our consolidated revenues in 2014 were derived from marketing and advertising spending by businesses operating in the United States. Advertising and marketing spending is sensitive to economic conditions and tends to decline in recessionary periods.
An economic decline could reduce advertising prices and volume, resulting in a decrease in our advertising revenues.
The loss of key
talent could disrupt our business and adversely affect the profitability of our businesses.
Our business depends upon the continued
efforts, abilities and expertise of our corporate and divisional executive teams and entertainment personalities. We employ or contract with entertainment personalities who may have loyal audiences. These individuals are important to audience
endorsement of our programs and other content. There can be no assurance that these individuals will remain with us or retain their current audiences. If we fail to retain key individuals or if our entertainment personalities lose their current
audience base, our operations could be adversely affected.
The financial performance of our equity method investments could adversely impact our results of
operations.
We have investments in businesses that we account for under the equity method of accounting. We do not control the day to
day operations of our equity method investments, and thus the management of these businesses by our partners could impact their performance. Additionally, these businesses are subject to laws, regulations or market conditions, or have risks inherent
in their operations, similar to the businesses we operate. Any of these factors could adversely impact our results of operations and the value of our investment.
We are subject to risks related to our international operations.
We have operations
and investments in a number of foreign jurisdictions. The inherent economic risks of doing business in international markets include, among other things, changes in the economic environment, exchange controls, tariffs and other trade barriers,
foreign taxation, corruption and, in some markets, increased risk of political instability. Additionally, the local currencies in which our international operations conduct their business could change in value relative to the U.S. dollar, exposing
our results to exchange rate fluctuations.
We may not be able to protect IP rights upon which our business relies. If we lose IP
protection, we may lose valuable assets.
Our business depends on our IP. We attempt to protect these IP rights through a combination
of copyright, trade secret, patent and trademark law and contractual restrictions, such as confidentiality agreements. We also depend on our trade names and domain names. We file applications for patents, trademarks and other IP registrations, but
we may not be granted such IP protections. In addition, even if such registrations are issued, they may not fully protect all important aspects of our business, and there is no guarantee that our business does not, or will not, infringe upon IP
rights of others. Furthermore, IP laws vary from country to country, and it may be more difficult to protect and enforce our IP rights in some foreign jurisdictions. In the future, we may need to litigate in the United States or elsewhere to enforce
our IP rights or determine the
11
validity and scope of the proprietary rights of others. This litigation could potentially be expensive and possibly divert the attention of our management. Despite our efforts to protect our
proprietary rights, unauthorized parties may attempt to copy or otherwise obtain and use our service, technology and other IP, and we cannot be certain that the steps we have taken will prevent any misappropriation or confusion among consumers and
merchants or unauthorized use of these rights. If we are unable to protect and enforce our IP rights, then we may not realize the full value of these assets, and our business may suffer.
We face cybersecurity and similar risks, which could result in the disclosure of confidential information, disruption of our programming services, damage to our brands and reputation, legal exposure
and financial losses
Our online, mobile and app offerings, as well as our internal systems, involve the storage and transmission of
our and our users’ proprietary information, and we and our partners rely on various technology systems in connection with the production and distribution of our programming. Although we monitor our security measures regularly, they may be
breached due to employee error, computer malware, viruses, hacking and phishing attacks or otherwise. Additionally, outside parties may attempt to fraudulently induce employees or users to disclose sensitive or confidential information in order to
gain access to our data or our users’ data. Because the techniques used to obtain unauthorized access, disable or degrade service or sabotage systems change frequently and often are not recognized until launched against a target, we may be
unable to anticipate these techniques or to implement adequate preventative measures. Any such breach or unauthorized access could result in a loss of our or our users’ proprietary information, a disruption of our services or a reduction of the
revenues we are able to generate from such services, damage to our brands and reputation, a loss of confidence in the security of our offerings and services and significant legal and financial exposure, each of which could potentially have an
adverse effect on our business.
We may be subject to claims of infringement of third-party IP rights, which could harm our business.
From time to time, third parties may assert against us or our customers alleged patent, copyright, trademark or other IP rights to
technologies that are important to our business. We may be subject to IP infringement claims from certain individuals and companies who have acquired patent portfolios for the sole purpose of asserting such claims against other companies. Any claims
that our products or processes infringe the IP rights of others, regardless of the merit or resolution of such claims, could cause us to incur significant costs in responding to, defending and resolving such claims, and may divert the efforts and
attention of our management and technical personnel away from our business for a period of time. In addition, if we are unable to continue use of certain IP rights, our revenue could be negatively impacted.
If we are unable to successfully integrate key acquisitions our business results could be negatively impacted.
We may grow through acquisitions in certain markets. Acquisitions involve risks, including difficulties in integrating acquired operations, diversions of
management resources, debt incurred in financing such acquisitions and other unanticipated problems and liabilities. If we are unable to mitigate these risks, the integration and operations of an acquired business could be adversely impacted.
Similarly, declines in business performance and the related effect on the fair values of goodwill and other intangible assets could trigger impairment charges, which could materially affect our reported net earnings.
Financial market conditions may impede access to or increase the cost of financing our operations and investments.
The ongoing changes in U.S. and global credit and equity markets may make it more difficult for many businesses to obtain financing on acceptable terms.
In addition, our borrowing costs can be affected by short and long-term debt ratings assigned by independent rating agencies which are based, in significant part, on our performance as measured by credit metrics such as interest coverage and
leverage
12
ratios. A decrease in these ratings could increase our cost of borrowing or make it more difficult for us to obtain future financing.
The concentrated ownership of our Common Voting Shares limits the ability of the holders of our Class A Common Shares to influence corporate matters.
We have two classes of shares: Common Voting Shares and Class A Common Shares. Holders of Class A Common Shares are entitled to elect one-third
of the Board of Directors (the “Board”), but are not permitted to vote on any other matters except as required by Ohio law. Holders of Common Voting Shares are entitled to elect the remainder of the Board and to vote on all other matters.
Approximately 92 percent of the Common Voting Shares are subject to the Scripps Family Agreement. The provisions of the Scripps Family Agreement fully govern the transfer and voting of Common Voting Shares subject to the agreement. As a result, the
holders of the Common Voting Shares subject to the Scripps Family agreement have the ability to elect two-thirds of the Board and to direct the outcome of any matter that does not require a vote of the Class A Common Shares. This concentrated
control limits the ability of our Class A Common shareholders to influence corporate matters and could potentially enable the Company to take actions that these shareholders would not view as beneficial. As a result, the market price of our
Class A Common Shares could be adversely affected.
ITEM 1B. UNRESOLVED STAFF COMMENTS
None.
ITEM 2.
PROPERTIES
We operate primarily from an owned office facility in Knoxville, TN, and leased facilities in New York,
NY, Washington, DC., Miami, FL, London and Singapore. Additionally, we lease other facilities that employ a smaller portion of our workforce.
Management believes its properties are adequate to support the business efficiently and that the properties and equipment have been
well maintained.
ITEM 3. LEGAL PROCEEDINGS
From time to time, the Company receives notices from third parties claiming that it infringes their IP rights. Claims of IP infringement could require us to enter into royalty or licensing agreements on
unfavorable terms, incur substantial monetary liability or be enjoined preliminarily or permanently from further use of the IP in question. In addition, certain agreements entered into by the Company may require the Company to indemnify the other
party for certain third-party IP infringement claims, which could increase the Company’s damages and its costs of defending against such claims. Even if the claims are without merit, defending against the claims can be time-consuming and
costly.
The costs and other effects of pending or future litigation, governmental investigations, legal and administrative
cases and proceedings (whether civil or criminal), settlements, judgments and investigations, claims and changes in those matters (including those matters described above) and developments or assertions by or against the Company relating to IP
rights and IP licenses, could have a material effect on the Company’s business, financial condition and operating results. No current legal matters are expected to result in any material loss.
ITEM 4. MINE SAFETY DISCLOSURES
Not applicable.
13
PART II
ITEM 5. MARKET FOR REGISTRANT’S COMMON EQUITY, RELATED STOCKHOLDER
MATTERS AND ISSUER PURCHASES OF EQUITY SECURITIES
Our Class A Common Shares are traded on the New York Stock Exchange (“NYSE”)
under the ticker symbol SNI. As of December 31, 2014, there were approximately 51,000 owners of our Class A Common Shares based on security position listings, and 69 owners of our Common Voting Shares, which do not have a public market.
The following table reflects the range of high and low selling prices of our common stock
by quarterly period.
|
|
|
|
|
|
|
|
|
| |
|
High |
|
|
Low |
|
| 2014 |
|
|
|
|
|
|
|
|
| First quarter |
|
$ |
86.62 |
|
|
$ |
71.33 |
|
| Second quarter |
|
$ |
82.37 |
|
|
$ |
72.13 |
|
| Third quarter |
|
$ |
86.48 |
|
|
$ |
76.13 |
|
| Fourth quarter |
|
$ |
82.78 |
|
|
$ |
71.06 |
|
| 2013 |
|
|
|
|
|
|
|
|
| First quarter |
|
$ |
65.81 |
|
|
$ |
57.32 |
|
| Second quarter |
|
$ |
71.05 |
|
|
$ |
63.53 |
|
| Third quarter |
|
$ |
79.13 |
|
|
$ |
66.83 |
|
| Fourth quarter |
|
$ |
86.41 |
|
|
$ |
72.30 |
|
The following table
provides information about the Company purchases of equity securities that are registered by the Company pursuant to section 12 of the Exchange Act during the quarter ended December 31, 2014:
|
|
|
|
|
|
|
|
|
|
|
|
|
|
|
|
|
| Period |
|
Total Number of
Shares Purchased |
|
|
Average Price Paid per
Share |
|
|
Total Number of
Shares Purchased as
Part of Publicly
Announced Plans
or
Programs |
|
|
Maximum Dollar Value
of Shares that May Yet
Be Purchased Under
the Plans or
Programs |
|
| 10/1/14 — 10/31/14 |
|
|
|
|
|
|
|
|
|
|
|
|
|
$ |
845,855,310 |
|
| 11/1/14 — 11/30/14 |
|
|
463,232 |
|
|
$ |
77.69 |
|
|
|
463,232 |
|
|
|
809,858,138 |
|
| 12/1/14 — 12/31/14 |
|
|
4,681,717 |
|
|
|
77.50 |
|
|
|
4,681,717 |
|
|
|
447,501,680 |
|
|
|
|
|
|
|
|
|
|
|
|
|
|
|
|
|
|
| Total |
|
|
5,144,949 |
|
|
$ |
77.52 |
|
|
|
5,144,949 |
|
|
$ |
447,501,680 |
|
|
|
|
|
|
|
|
|
|
|
|
|
|
|
|
|
|
Under a share repurchase program (the “repurchase program”) authorized by the
Board, the Company is permitted to acquire $2 billion of Class A Common Shares.
On February 19, 2015, the Board
authorized an additional $1 billion for the repurchase program. Following the February 19, 2015 authorization, $1.4 billion remains available for repurchase under the repurchase program. There is no expiration date for the repurchase program,
and we are under no commitment or obligation to repurchase any particular amount of Class A Common Shares under this repurchase program.
There were no sales of unregistered equity securities during the quarter for which this
report is filed.
Dividends — The Company paid a quarterly cash dividend of 20 cents per share and 15 cents per share in
2014 and 2013, respectively. The declaration and payment of dividends is evaluated by the Company’s Board. Future dividends are subject to our earnings, financial condition and capital requirements.
14
Performance Graph — The following graph compares the cumulative total stockholder return
on our Class A Common Shares with the comparable cumulative return of the S&P 500 index and an index based on a peer group of media companies for the five years ended December 31, 2014. The performance graph assumes that
the value of the investment in our common shares, the S&P 500 index and peer group of media companies was $100 on December 31, 2009, and that all dividends were reinvested.
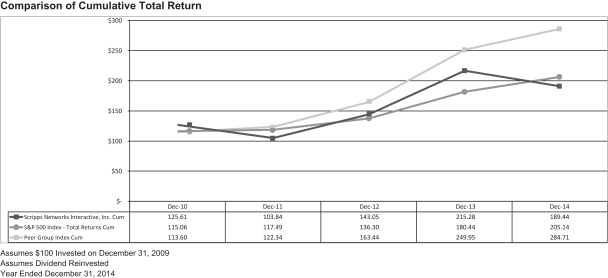
The companies that comprise our peer group include AMC Networks, Inc., Discovery Communications, Inc., The Walt Disney
Company, Time Warner, Inc., Twenty-First Century Fox, Inc. and Viacom, Inc.
The peer group index is weighted based on market
capitalization.
ITEM 6. SELECTED FINANCIAL DATA
The Selected Financial Data required by this item is filed as part of this Form 10-K. See Index to Consolidated Financial Statement Information at page
F-1 of this Form 10-K.
ITEM 7. MANAGEMENT’S DISCUSSION AND ANALYSIS OF FINANCIAL CONDITION AND RESULTS OF
OPERATIONS
Management’s Discussion and Analysis of Financial Condition and Results of Operations required by this item is filed as part
of this Form 10-K. See Index to Consolidated Financial Statement Information at page F-1 of this Form 10-K.
ITEM 7A. QUANTITATIVE AND QUALITATIVE DISCLOSURES ABOUT MARKET RISK
The market risk information required by this item is filed as part of this Form 10-K. See Index to Consolidated Financial Statement Information at page
F-1 of this Form 10-K.
ITEM 8. FINANCIAL STATEMENTS AND SUPPLEMENTARY DATA
The Financial Statements and Supplementary Data required by this item are filed as part of this Form 10-K. See
Index to Consolidated Financial Statement Information at page F-1 of this Form 10-K.
ITEM 9. CHANGES IN AND
DISAGREEMENTS WITH ACCOUNTANTS ON ACCOUNTING AND FINANCIAL DISCLOSURE
None.
ITEM 9A. CONTROLS AND PROCEDURES
The Controls and Procedures
required by this item are filed as part of this Form 10-K. See Index to Consolidated Financial Statement Information at page F-1 of this Form 10-K.
ITEM 9B. OTHER INFORMATION
None.
15
PART III
ITEM 10. DIRECTORS, EXECUTIVE OFFICERS AND CORPORATE GOVERNANCE
Information regarding executive officers is included in Part I of this Form 10-K as permitted by General Instruction G(3).
Information required by Item 10 of Form 10-K relating to directors is incorporated by reference to the material captioned
“Election of Directors” in our definitive proxy statement for the Annual Meeting of Shareholders (“Proxy Statement”). Information regarding Section 16(a) compliance is incorporated by reference to the material captioned
“Section 16(a) Beneficial Ownership Compliance” in the Proxy Statement.
We have adopted a code of ethics that
applies to all employees, officers and directors of SNI. We also have a code of ethics for the CEO and Senior Financial Officers. This code of ethics meets the requirements defined by Item 406 of Regulation S-K and the requirement of a code of
business conduct and ethics under NYSE listing standards. Copies of our codes of ethics are posted on our website at www.scrippsnetworksinteractive.com.
Information regarding our audit committee financial expert is incorporated by reference to the material captioned “Corporate Governance” in the Proxy Statement.
The Proxy Statement will be filed with the SEC in connection with our 2015 Annual Meeting of Stockholders.
ITEM 11. EXECUTIVE COMPENSATION
The information required by Item 11 of Form 10-K is incorporated by reference to the materials captioned “Compensation Discussion and
Analysis” and “Executive Compensation Tables” in the Proxy Statement.
ITEM 12. SECURITY
OWNERSHIP OF CERTAIN BENEFICIAL OWNERS AND MANAGEMENT AND RELATED STOCKHOLDER MATTERS
The information required by Item 12 of Form 10-K is
incorporated by reference to the materials captioned “Report on the Security Ownership of Certain Beneficial Owners” and “Equity Compensation Plan Information” in the Proxy Statement.
ITEM 13. CERTAIN RELATIONSHIPS AND RELATED TRANSACTIONS, AND DIRECTOR INDEPENDENCE
The information required by Item 13 of Form 10-K is incorporated by reference to the materials captioned “Corporate Governance” and
“Report on Related Party Transactions” in the Proxy Statement.
ITEM 14. PRINCIPAL ACCOUNTING FEES
AND SERVICES
The information required by Item 14 of Form 10-K is incorporated by reference to the material captioned “Independent
Auditors” in the Proxy Statement.
16
PART IV
ITEM 15. EXHIBITS AND FINANCIAL STATEMENT SCHEDULE
Financial Statements and Supplemental
Schedule
(a) The consolidated financial statements of SNI are filed as part of this Form 10-K. See Index to Consolidated
Financial Statement Information at page F-1.
The reports of Deloitte & Touche LLP, an Independent Registered
Public Accounting Firm, dated February 27, 2015, are filed as part of this Form 10-K. See Index to Consolidated Financial Statement Information at page F-1.
(b) The Company’s consolidated supplemental schedule is filed as part of this Form 10-K. See Index to Consolidated Financial
Statement Schedules at page S-1.
Exhibits
The information required by this item appears at page E-1 of this Form 10-K.
17
SIGNATURES
Pursuant to the requirements of Section 13 or 15(d) of the Securities Exchange Act of 1934, the registrant has duly caused this report to be signed on its behalf by the undersigned, thereunto duly
authorized.
|
|
|
|
|
|
|
|
|
|
|
SCRIPPS NETWORKS INTERACTIVE, INC. |
|
|
|
|
| Dated: February 27, 2015 |
|
|
|
By: |
|
/s/ Kenneth W. Lowe |
| Kenneth W. Lowe |
|
|
|
|
|
|
| Chairman, President and Chief Executive Officer |
|
|
|
|
|
|
Pursuant to the requirements of the Securities Exchange Act of 1934, this report has been signed below by the following
persons on behalf of the registrant in the capacities indicated, on February 27, 2015.
|
|
|
|
|
| Signature |
|
|
|
Title |
|
|
|
| /s/ Kenneth W. Lowe Kenneth W. Lowe |
|
|
|
Chairman, President and Chief Executive Officer (Principal Executive Officer) |
|
|
|
| /s/ Lori A. Hickok Lori A. Hickok |
|
|
|
Executive Vice President, Chief Financial Officer (Principal Financial and Accounting Officer) |
|
|
|
| /s/ Gina L. Bianchini Gina L. Bianchini |
|
|
|
Director |
|
|
|
| /s/ Michael R. Costa Michael R. Costa |
|
|
|
Director |
|
|
|
| /s/ David A. Galloway David A. Galloway |
|
|
|
Director |
|
|
|
| /s/ Jarl Mohn Jarl Mohn |
|
|
|
Director |
|
|
|
| /s/ Richelle P. Parham Richelle P. Parham |
|
|
|
Director |
|
|
|
| /s/ Nicholas B. Paumgarten Nicholas B. Paumgarten |
|
|
|
Director |
|
|
|
| /s/ Mary Peirce Mary Peirce |
|
|
|
Director |
|
|
|
| /s/ Jeffrey Sagansky Jeffrey Sagansky |
|
|
|
Director |
|
|
|
| /s/ Nackey E. Scagliotti Nackey E. Scagliotti |
|
|
|
Director |
|
|
|
| /s/ Wesley W. Scripps Wesley W. Scripps |
|
|
|
Director |
|
|
|
| /s/ Ronald W. Tysoe Ronald W. Tysoe |
|
|
|
Director |
18
SCRIPPS NETWORKS INTERACTIVE, INC. INDEX TO CONSOLIDATED FINANCIAL STATEMENT INFORMATION
F-1
Selected Financial Data
Five-Year Financial Highlights
|
|
|
|
|
|
|
|
|
|
|
|
|
|
|
|
|
|
|
|
|
| (in millions, except per share data) |
|
2014 |
|
|
2013 |
|
|
2012 |
|
|
2011 |
|
|
2010 |
|
| Summary of Operations |
|
|
|
|
|
|
|
|
|
|
|
|
|
|
|
|
|
|
|
|
| Operating revenues (1)(3): |
|
|
|
|
|
|
|
|
|
|
|
|
|
|
|
|
|
|
|
|
| Lifestyle media |
|
$ |
2,575 |
|
|
$ |
2,456 |
|
|
$ |
2,253 |
|
|
$ |
2,041 |
|
|
$ |
1,864 |
|
| Corporate and other |
|
|
90 |
|
|
|
76 |
|
|
|
54 |
|
|
|
31 |
|
|
|
19 |
|
| Intersegment eliminations |
|
|
|
|
|
|
(1 |
) |
|
|
|
|
|
|
|
|
|
|
|
|
|
|
|
|
|
|
|
|
|
|
|
|
|
|
|
|
|
|
|
|
|
| Total operating revenues |
|
$ |
2,665 |
|
|
$ |
2,531 |
|
|
$ |
2,307 |
|
|
$ |
2,072 |
|
|
$ |
1,883 |
|
|
|
|
|
|
|
|
|
|
|
|
|
|
|
|
|
|
|
|
|
|
| Segment profit (loss) (1)(2)(3): |
|
|
|
|
|
|
|
|
|
|
|
|
|
|
|
|
|
|
|
|
| Lifestyle media |
|
$ |
1,255 |
|
|
$ |
1,202 |
|
|
$ |
1,124 |
|
|
$ |
1,046 |
|
|
$ |
901 |
|
| Corporate and other |
|
|
(134 |
) |
|
|
(100 |
) |
|
|
(83 |
) |
|
|
(69 |
) |
|
|
(66 |
) |
|
|
|
|
|
|
|
|
|
|
|
|
|
|
|
|
|
|
|
|
|
| Total segment profit |
|
$ |
1,122 |
|
|
$ |
1,102 |
|
|
$ |
1,041 |
|
|
$ |
977 |
|
|
$ |
835 |
|
|
|
|
|
|
|
|
|
|
|
|
|
|
|
|
|
|
|
|
|
|
| Income from continuing operations attributable to SNI common shareholders (4) |
|
$ |
545 |
|
|
$ |
505 |
|
|
$ |
681 |
|
|
$ |
473 |
|
|
$ |
398 |
|
|
|
|
|
|
|
|
|
|
|
|
|
|
|
|
|
|
|
|
|
|
| Per Share Data |
|
|
|
|
|
|
|
|
|
|
|
|
|
|
|
|
|
|
|
|
| Income from continuing operations attributable to SNI common shareholders per basic share of common stock (4) |
|
$ |
3.86 |
|
|
$ |
3.43 |
|
|
$ |
4.48 |
|
|
$ |
2.87 |
|
|
$ |
2.39 |
|
|
|
|
|
|
|
|
|
|
|
|
|
|
|
|
|
|
|
|
|
|
| Income from continuing operations attributable to SNI common shareholders per diluted share of common stock (4) |
|
$ |
3.83 |
|
|
$ |
3.40 |
|
|
$ |
4.44 |
|
|
$ |
2.86 |
|
|
$ |
2.37 |
|
|
|
|
|
|
|
|
|
|
|
|
|
|
|
|
|
|
|
|
|
|
| Cash dividends declared |
|
|
.80 |
|
|
|
.60 |
|
|
|
.48 |
|
|
|
.38 |
|
|
|
.30 |
|
|
|
|
|
|
|
|
|
|
|
|
|
|
|
|
|
|
|
|
|
|
| Balance Sheet Data |
|
|
|
|
|
|
|
|
|
|
|
|
|
|
|
|
|
|
|
|
| Total assets |
|
$ |
4,668 |
|
|
$ |
4,438 |
|
|
$ |
4,139 |
|
|
$ |
3,962 |
|
|
$ |
3,388 |
|
| Debt (5)(6)(7) |
|
$ |
2,379 |
|
|
$ |
1,384 |
|
|
$ |
1,384 |
|
|
$ |
1,384 |
|
|
$ |
884 |
|
|
|
|
|
|
|
|
|
|
|
|
|
|
|
|
|
|
|
|
|
|
Certain amounts may not foot since each is rounded independently.
Notes to Selected Financial Data
| (1) |
Operating revenues and segment profit (loss) represent the measures used to evaluate the operating performance of our business segments in accordance with financial
accounting standards for disclosures about segments of an enterprise and related information. See page F-8. |
| (2) |
Segment profit is a supplemental non-GAAP financial measure. “GAAP” is defined as generally accepted accounting principles in the United States. Our chief
operating decision maker evaluates the operating performance of our business segments and makes decisions about the allocation of resources to our reportable segments using a measure we call segment profit. Segment profit excludes interest, income
taxes, depreciation and amortization, divested operating units, investment results and certain other items that are included in net income determined in accordance with GAAP. For a reconciliation of this financial measure to operating income see the
table on page F-9. |
| (3) |
In 2014, we made changes to our management reporting structure related to operating results from our uLive business and our businesses located in the Caribbean. In
conjunction with these changes in our reporting structure, we now report the results of uLive within the lifestyle media segment, rather than the corporate and other caption. The results of the Caribbean businesses are now reported within
international operations, included within the corporate and other caption for segment reporting purposes, rather than the lifestyle media segment. For comparability purposes, prior year segment results have also been reclassified to reflect the
impact of these management reporting changes. These reclassifications only affect our segment reporting and do not change our consolidated operating revenues, operating income or net income. |
F-2
| (4) |
Our income tax provision in 2012 reflects an income tax benefit of $213 million arising from the reversal of valuation allowances on deferred tax assets related to
capital loss carry forwards. Previously, the Company had estimated that it would be unable to use any of the capital loss carry forwards generated from the sale of our Shopzilla and uSwitch businesses. As a consequence of a restructuring that was
completed to achieve a more efficient tax structure, the Company recognized a $574 million capital gain that utilized substantially all of its capital loss carry forwards. This income tax benefit was partially offset by $23.1 million of state income
tax expenses recognized on the capital gain that utilized these capital loss carry forwards. |
| (5) |
On December 15, 2009, we acquired a 65 percent controlling interest in the Travel Channel. In connection with this acquisition, a majority-owned subsidiary of SNI
completed a private placement of $885 million aggregate principal Senior Notes that mature in 2015 |
| (6) |
In 2011, we completed the sale of $500 million aggregate principal Senior Notes that mature in 2016. |
| (7) |
In 2014, we completed the sale of $500 million aggregate principal Senior Notes that mature in 2019 and $500 million aggregate principal Senior Notes that mature in
2024. |
F-3
MANAGEMENT’S DISCUSSION AND ANALYSIS OF FINANCIAL CONDITION AND RESULTS OF
OPERATIONS
This discussion and analysis of financial condition and results of operations is based upon the consolidated financial statements
and the notes thereto. You should read this discussion in conjunction with those financial statements.
Forward-Looking Statements
This discussion and the information contained in the notes to the consolidated financial statements contain certain forward-looking statements that are based on our
current expectations. Forward-looking statements are subject to certain risks, trends and uncertainties that could cause actual results to differ materially from the expectations expressed in the forward-looking statements. Such risks, trends and
uncertainties, which, in most instances, are beyond our control, include changes in advertising demand and other economic conditions; consumers’ tastes; program costs; labor relations; technological developments; competitive pressures; interest
rates; regulatory rulings; and reliance on third-party vendors for various products and services. The words “believe,” “expect,” “anticipate,” “estimate,” “intend” and similar expressions identify
forward-looking statements. All forward-looking statements, which are as of the date of this filing, should be evaluated with the understanding of their inherent uncertainty. We undertake no obligation to publicly update any forward-looking
statement to reflect events or circumstances after the date the statement is made.
Overview
SNI is one of the leading developers of lifestyle-oriented content for linear and interactive video platforms including television and the internet, with
respected, high-profile brands. We seek to engage audiences that are highly desirable to advertisers with entertaining and informative lifestyle content that is produced for television, the internet and any other media platforms consumers choose. We
intend to expand and enhance our lifestyle brands through creating popular new programming and content, distributing on various platforms, such as mobile phones, tablets and video-on-demand, licensing of content and branded consumer products and
increasing our international footprint.
We manage our operations through our reportable segment, lifestyle media. Lifestyle media
includes our national television networks, HGTV, Food Network, Travel Channel, DIY Network, Cooking Channel and Great American Country. Lifestyle media also includes websites that are associated with the aforementioned television brands and other internet-based businesses serving home, food and travel related categories.
Lifestyle media
generated revenues of approximately $2.6 billion during 2014, which represented 97 percent of our consolidated revenues, compared with $2.5 billion and 97 percent in 2013 and $2.3 billion and 98 percent in 2012. Lifestyle media generates revenue
principally from the sale of advertising time on national television networks and interactive media platforms and from affiliate fees paid by cable and television systems, telecommunication service providers and other distributors that carry our
network programming. Advertising revenues for lifestyle media may be affected by the strength of advertising markets and general economic conditions and may also fluctuate depending on the success of our programming, as measured by viewership at any
given time, and by seasonality. In 2014, lifestyle media revenues from advertising sales and affiliate fees were approximately 69 percent and 29 percent, respectively, of total revenue for the segment. Lifestyle media also earns revenue from the
licensing of content to third parties and brands for consumer products, such as videos, books, kitchenware and tools.
Programming expenses, employee costs and sales and marketing expenses are the primary operating costs of our lifestyle media. Program
amortization represented 46 percent of lifestyle media expenses in 2014, reflecting our continued investment in the improved quality and variety of programming on our networks. We incur sales and marketing expenses to support brand-building
initiatives at all of our television networks.
We also have established lifestyle media brands internationally. We currently
broadcast 20 channels reaching approximately 130 million subscribers under the HGTV, DIY, Food Network, AFC, Fine Living and Travel Channel brands. Our broadcast channels are distributed in 29 languages with channel feeds customized according
to language in more than 160 countries and territories across Europe, Middle
F-4
East, Africa, Asia Pacific, Latin America and the Caribbean. In addition to the broadcast networks, we also license a portion of our programming to other broadcasters that can be seen in over 220
countries and territories. Operating results for our international businesses are reported within our corporate and other segment caption.
Our international businesses generated revenues of approximately $90.2 million during 2014, which represented 3 percent of our consolidated revenues compared with $75.7 million and 3 percent in 2013 and
$54.5 million and 2 percent in 2012. These businesses earn revenues from advertising sales, affiliate fees and the licensing of programming to third parties. In 2014, revenues from advertising sales, affiliate fees and program licensing were
approximately 32 percent, 48 percent and 20 percent, respectively, of total revenue for our international businesses. Satellite transmission fees, programming expenses, employee costs and sales and marketing expenses are the primary operating costs
for our international businesses.
The growth of our international business, both organically and through acquisitions and
joint ventures, has been, and continues to be, a strategic priority of the Company. In the fourth quarter of 2014, we launched HGTV in Singapore, which is the first channel dedicated to the home and lifestyle category across Asia Pacific. In the
third quarter of 2014, we announced the launch of Food Network in Brazil. In the first quarter of 2014, we launched the Fine Living Network in Italy on digital terrestrial television. Since its launch, over 40 percent of Italy’s television
population has tuned into the channel. In the second quarter of 2013, we completed our acquisition of AFC. AFC, which is based in Singapore, reaches about 8 million subscribers in 11 markets. In the second quarter of 2012, we completed our
acquisition of TCI. TCI is broadcast in 21 languages across a wide network of affiliates throughout EMEA and APAC.
Results
of Operations
The competitive landscape in our business is affected by multiple media platforms competing for consumers and advertising
dollars. We strive to create popular programming that resonates with viewers across a variety of demographic groups, develop brands and create new media platforms through which we can capitalize on the audiences we aggregate.
Consolidated Results of Operations — Results of operations were as follows:
|
|
|
|
|
|
|
|
|
|
|
|
|
|
|
|
|
|
|
|
|
| (in thousands) |
|
For the years ended December 31, |
|
| |
2014 |
|
|
Change |
|
|
2013 |
|
|
Change |
|
|
2012 |
|
| Operating revenues |
|
$ |
2,665,456 |
|
|
|
5.3 |
% |
|
$ |
2,530,809 |
|
|
|
9.7 |
% |
|
$ |
2,307,182 |
|
| Cost of services, excluding depreciation and amortization of intangible assets |
|
|
(778,896 |
) |
|
|
11.4 |
% |
|
|
(699,294 |
) |
|
|
14.5 |
% |
|
|
(610,836 |
) |
| Selling, general and administrative |
|
|
(764,799 |
) |
|
|
4.9 |
% |
|
|
(729,055 |
) |
|
|
11.2 |
% |
|
|
(655,473 |
) |
| Depreciation and amortization of intangible assets |
|
|
(128,582 |
) |
|
|
9.4 |
% |
|
|
(117,580 |
) |
|
|
9.3 |
% |
|
|
(107,591 |
) |
| Write-down of goodwill |
|
|
|
|
|
|
|
|
|
|
(24,723 |
) |
|
|
|
|
|
|
(19,663 |
) |
| (Losses) Gains on disposal of property and equipment |
|
|
(870 |
) |
|
|
|
|
|
|
(1,681 |
) |
|
|
|
|
|
|
754 |
|
|
|
|
|
|
|
|
|
|
|
|
|
|
|
|
|
|
|
|
|
|
| Operating income |
|
|
992,309 |
|
|
|
3.5 |
% |
|
|
958,476 |
|
|
|
4.8 |
% |
|
|
914,373 |
|
| Interest expense |
|
|
(52,687 |
) |
|
|
8.2 |
% |
|
|
(48,710 |
) |
|
|
(4.1 |
)% |
|
|
(50,814 |
) |
| Equity in earnings of affiliates |
|
|
85,631 |
|
|
|
7.5 |
% |
|
|
79,644 |
|
|
|
30.9 |
% |
|
|
60,864 |
|
| Miscellaneous, net |
|
|
2,598 |
|
|
|
|
|
|
|
1,241 |
|
|
|
|
|
|
|
13,340 |
|
|
|
|
|
|
|
|
|
|
|
|
|
|
|
|
|
|
|
|
|
|
| Income from operations before income taxes |
|
|
1,027,851 |
|
|
|
3.8 |
% |
|
|
990,651 |
|
|
|
5.6 |
% |
|
|
937,763 |
|
| Provision for income taxes |
|
|
(301,043 |
) |
|
|
(2.1 |
)% |
|
|
(307,623 |
) |
|
|
|
|
|
|
(88,107 |
) |
|
|
|
|
|
|
|
|
|
|
|
|
|
|
|
|
|
|
|
|
|
| Net income |
|
|
726,808 |
|
|
|
6.4 |
% |
|
|
683,028 |
|
|
|
(19.6 |
)% |
|
|
849,656 |
|
| Net income attributable to noncontrolling interests |
|
|
(181,533 |
) |
|
|
2.0 |
% |
|
|
(177,958 |
) |
|
|
5.8 |
% |
|
|
(168,178 |
) |
|
|
|
|
|
|
|
|
|
|
|
|
|
|
|
|
|
|
|
|
|
| Net income attributable to SNI |
|
$ |
545,275 |
|
|
|
8.0 |
% |
|
$ |
505,070 |
|
|
|
(25.9 |
)% |
|
$ |
681,478 |
|
|
|
|
|
|
|
|
|
|
|
|
|
|
|
|
|
|
|
|
|
|
F-5
2014 Compared with 2013
The increase in operating revenues in 2014 compared with 2013 was primarily attributed to continued growth in advertising sales and affiliate fee revenues
from our national television networks. Advertising revenues at our national networks increased $90.5 million, or 5.3 percent, in 2014 compared with 2013. The increase in advertising revenues was primarily attributed to higher pricing from our
advertising units sold. Affiliate fee revenues at our national television networks increased $35.4 million, or 4.9 percent, in 2014 compared with 2013. The increase in affiliate fee revenues was primarily due to contractual rate increases. Revenues
from our international businesses also increased $14.5 million in 2014 compared with 2013, reflecting the impact of the April 2013 AFC acquisition.
Cost of services, which consists of program amortization and costs associated with distributing our content, increased 11 percent in 2014 compared with 2013. Program amortization attributed to our
continued investment in improved quality and variety of programming at our networks represents the largest expense and is the primary driver of fluctuations in costs of services. Program amortization increased $64.5 million in 2014 compared with
2013. Additionally, we initiated programs to eliminate certain positions within the Company during the fourth quarter of 2014. Costs of services in 2014 includes a $3.9 million charge for severance, retention and related retirement benefit costs
that were incurred following the initiation of these programs.
Selling, general and administrative expenses, which primarily
consists of sales, marketing and advertising expenses, research costs, administrative costs and costs of facilities, increased 4.9 percent in 2014 compared with 2013. Increases in marketing and promotion costs and $9.7 million of contract
termination costs incurred in 2014 contributed to the increase in selling, general and administrative expenses in 2014 compared with 2013. Selling, general and administrative expenses in 2014 also includes $10.5 million of costs incurred for the
previously mentioned employee reduction programs.
The increase in depreciation and amortization of intangible assets reflects
the impact of the 2013 AFC acquisition and depreciation incurred on capitalized software and website development costs.
In 2013, we recorded a $24.7 million non-cash charge to write-down the goodwill associated
with TCI.
Interest expense primarily reflects the interest incurred on our outstanding borrowings. For 2014 and 2013, our
outstanding borrowings included $885 million 3.55% Senior Notes and $500 million 2.70% Senior Notes. In November 2014, we issued $500 million aggregate principal amount Senior Notes outstanding that bear interest at 2.75% and mature on
November 15, 2019 and $500 million aggregate principal amount Senior Notes outstanding that bear interest at 3.90% and mature on November 15, 2024. Interest expense increased in 2014 compared with 2013 due to higher average debt levels.
Equity in earnings of affiliates represents the proportionate share of net income or loss from each of our equity method
investments. Included in equity in earnings of affiliates is our proportionate 50% share of results from UKTV. Amortization expense attributed to intangible assets recognized upon acquiring our interest in UKTV reduces equity in earnings we
recognize from the UKTV investment. Accordingly, equity in earnings of affiliates includes our $44.5 million proportionate share of UKTV’s results in 2014 and $36.8 million for our proportionate share of UKTV’s results in 2013, which were
reduced by amortization of $19.0 million in 2014 and $18.0 million in 2013.
We recognized foreign exchange gains of $0.6
million during 2014 and $1.8 million of foreign exchange losses during 2013. These gains and losses, reported within the miscellaneous, net caption in our consolidated statements of operations, relate to realized and unrealized foreign exchange on
the Company’s foreign denominated asset and liability balances. Miscellaneous, net also includes interest income of $6.7 million in 2014 and $6.2 million in 2013. Interest income includes interest earned on the note acquired from Virgin Media,
Inc. during the UKTV transaction.
Our effective tax rate was 29.3 percent in 2014 and 31.1 percent in 2013. The
effective tax rate in 2013 was impacted by the impairment charge recorded for the write-down of TCI’s goodwill, which was not deductible for income tax purposes.
F-6
Noncontrolling owners hold a 31 percent interest in the Food Network Partnership and a 35
percent interest in the Travel Channel. The noncontrolling owners’ proportionate share of these businesses’ results are captured in the net income attributable to noncontrolling interests caption within the consolidated statements of
operations and represents the continued profitability of both the Food Network Partnership and Travel Channel.
2013 Compared with 2012
The increase in operating revenues in 2013 compared with 2012 was primarily attributed to solid growth in advertising sales and affiliate fee revenues from our national television networks. Advertising
revenues at our national networks increased $143 million, or 9.2 percent, in 2013 compared with 2012. The increase in advertising revenues was primarily attributed to higher pricing from our advertising units sold. Affiliate fee revenues at our
national television networks increased $57.7 million, or 8.7 percent, in 2013 compared with 2012. The increase in affiliate fee revenues was primarily due to contractual rate increases as well as reduced launch incentive amortization in the current
year. Revenues from our international businesses also increased $21.3 million in 2013 compared with 2012, reflecting the impacts of both the April 2013 AFC and April 2012 TCI acquisitions.
Cost of services, which consists of program amortization and costs associated with distributing our content, increased 15 percent in 2013
compared with 2012. Program amortization attributed to our continued investment in improved quality and variety of programming at our networks represents the largest expense and is the primary driver of fluctuations in costs of services. Program
amortization increased $69.6 million in 2013 compared with 2012.
Selling, general and administrative expenses, primarily
consists of sales, marketing and advertising expenses, research costs, administrative costs and costs of facilities, increased 11 percent in 2013 compared with 2012. The hiring of additional employees to support the growth of our businesses and the
costs associated with both international expansion initiatives and other interactive and digital business initiatives contributed to the increase in selling, general and administrative expenses.
The increase in depreciation and amortization of intangible assets reflects the impact of the 2013 AFC
acquisition and depreciation incurred on capitalized software and website development costs.
In 2013, we recorded a $24.7 million non-cash charge to write-down the goodwill associated with TCI. In 2012, we recorded a $19.7 million non-cash charge to write-down the goodwill associated with
RealGravity to fair value.
Interest expense primarily reflects the interest incurred on our outstanding borrowings. Our
outstanding borrowings include $885 million aggregate principal amount Senior Notes that bear interest at 3.55% and mature on January 15, 2015. We also have $500 million aggregate principal amount Senior Notes outstanding that bear interest at
2.70% and mature on December 15, 2016.
Equity in earnings of affiliates represents the proportionate share of net income
or loss from each of our equity method investments. Included in equity in earnings of affiliates is our proportionate 50% share of results from UKTV. Amortization expense attributed to intangible assets recognized upon acquiring our interest in UKTV
reduces equity in earnings we recognize from the UKTV investment. Accordingly, equity in earnings of affiliates includes our $36.8 million proportionate share of UKTV’s results in 2013 and $39.8 million for our proportionate share of
UKTV’s results in 2012 which were reduced by amortization of $18.0 million in 2013 and $18.2 million in 2012. Increased contributions from our investments in HGTV Canada and Food Network Canada and the improved performance from HGTV and Food
Network Magazines contributed to the increase in equity in earnings of affiliates. Equity in earnings of affiliates in 2012 also reflects a $5.9 million write-down to reduce the carrying value of our investments to their estimated fair value.
We recognized foreign exchange losses of $1.8 million during 2013 and $11.6 million of foreign exchange gains during 2012.
These gains and losses, reported within the miscellaneous, net caption in our consolidated statements of operations, relate to realized and unrealized foreign exchange on the Company’s foreign denominated asset and liability balances.
Miscellaneous, net also includes interest income of $6.2 million in 2013 and $8.4 million in 2012. Interest income includes interest earned on the note acquired from Virgin Media, Inc. during the UKTV transaction.
F-7
Our effective tax rate was 31.1 percent in 2013 and 9.4 percent in 2012. Our
income tax provision in 2012 reflects an income tax benefit of $213 million arising from the reversal of valuation allowances on deferred tax assets related to capital loss carry forwards. Previously, the Company had estimated that it would be
unable to use any of the capital loss carry forwards generated from the sales of the Shopzilla and uSwitch businesses. As a consequence of a restructuring that was completed to achieve a more efficient tax structure, the Company recognized a $574
million capital gain that utilized substantially all of its capital loss carry forwards. As the capital losses are not available in states in which the Company does not file unitary income tax returns, state tax expenses totaling $23.1 million were
also recognized.
Net income attributable to noncontrolling interests increased due to the growing profitability of both the
Food Network Partnership and Travel Channel.
Business Segment Results
As discussed in Note 19-Segment Information to the consolidated financial statements, our chief operating decision maker evaluates the
operating performance of our business segments using a performance measure we call segment profit. Segment profit excludes interest, income taxes, depreciation and amortization, divested operating units, investment results and certain other items
that are included in net income determined in accordance with GAAP.
Items excluded from segment profit generally result from decisions made in prior periods
or by corporate executives rather than the managers of the business segments. Depreciation and amortization charges are the result of decisions made in prior periods regarding the allocation of resources and are, therefore, excluded from the
measure. Financing, tax structure and divestiture decisions are generally made by corporate executives. Excluding these items from our business segment performance measure enables us to evaluate business segment operating performance based upon
current economic conditions and decisions made by the managers of the business segments in the current period.
In 2014, we
made changes to our management reporting structure related to operating results from our uLive business and our businesses located in the Caribbean. In conjunction with these changes in our reporting structure, we now report the results of uLive
within the lifestyle media segment, rather than the corporate and other caption. The results of the Caribbean businesses are now reported within international operations, included within the corporate and other caption for segment reporting
purposes, rather than the lifestyle media segment. For comparability purposes, prior year segment results have also been reclassified to reflect the impact of these management reporting changes. These reclassifications only affect our segment
reporting and do not change our consolidated operating revenues, operating income or net income.
F-8
Information regarding the operating performance of our business segments and a
reconciliation of such information to the consolidated financial statements is as follows:
|
|
|
|
|
|
|
|
|
|
|
|
|
|
|
|
|
|
|
|
|
| (in thousands) |
|
For the years ended December 31, |
|
| |
2014 |
|
|
Change |
|
|
2013 |
|
|
Change |
|
|
2012 |
|
| Segment operating revenues: |
|
|
|
|
|
|
|
|
|
|
|
|
|
|
|
|
|
|
|
|
| Lifestyle media |
|
$ |
2,575,376 |
|
|
|
4.9 |
% |
|
$ |
2,455,650 |
|
|
|
9.0 |
% |
|
$ |
2,252,690 |
|
| Corporate and other |
|
|
90,290 |
|
|
|
19.1 |
% |
|
|
75,798 |
|
|
|
39.1 |
% |
|
|
54,492 |
|
| Intersegment eliminations |
|
|
(210 |
) |
|
|
|
|
|
|
(639 |
) |
|
|
|
|
|
|
|
|
|
|
|
|
|
|
|
|
|
|
|
|
|
|
|
|
|
|
|
|
|
| Total operating revenues |
|
$ |
2,665,456 |
|
|
|
5.3 |
% |
|
$ |
2,530,809 |
|
|
|
9.7 |
% |
|
$ |
2,307,182 |
|
|
|
|
|
|
|
|
|
|
|
|
|
|
|
|
|
|
|
|
|
|
| Segment profit (loss): |
|
|
|
|
|
|
|
|
|
|
|
|
|
|
|
|
|
|
|
|
| Lifestyle media |
|
$ |
1,255,437 |
|
|
|
4.4 |
% |
|
$ |
1,202,356 |
|
|
|
7.0 |
% |
|
$ |
1,123,704 |
|
| Corporate and other |
|
|
(133,676 |
) |
|
|
33.8 |
% |
|
|
(99,896 |
) |
|
|
20.6 |
% |
|
|
(82,831 |
) |
|
|
|
|
|
|
|
|
|
|
|
|
|
|
|
|
|
|
|
|
|
| Total segment profit |
|
|
1,121,761 |
|
|
|
1.8 |
% |
|
|
1,102,460 |
|
|
|
5.9 |
% |
|
|
1,040,873 |
|
| Depreciation and amortization of intangible assets |
|
|
(128,582 |
) |
|
|
|
|
|
|
(117,580 |
) |
|
|
|
|
|
|
(107,591 |
) |
| Write-down of goodwill |
|
|
|
|
|
|
|
|
|
|
(24,723 |
) |
|
|
|
|
|
|
(19,663 |
) |
| (Losses) Gains on disposal of property and equipment |
|
|
(870 |
) |
|
|
|
|
|
|
(1,681 |
) |
|
|
|
|
|
|
754 |
|
| Interest expense |
|
|
(52,687 |
) |
|
|
|
|
|
|
(48,710 |
) |
|
|
|
|
|
|
(50,814 |
) |
| Equity in earnings of affiliates |
|
|
85,631 |
|
|
|
|
|
|
|
79,644 |
|
|
|
|
|
|
|
60,864 |
|
| Miscellaneous, net |
|
|
2,598 |
|
|
|
|
|
|
|
1,241 |
|
|
|
|
|
|
|
13,340 |
|
|
|
|
|
|
|
|
|
|
|
|
|
|
|
|
|
|
|
|
|
|
| Income from operations before income taxes |
|
$ |
1,027,851 |
|
|
|
|
|
|
$ |
990,651 |
|
|
|
|
|
|
$ |
937,763 |
|
|
|
|
|
|
|
|
|
|
|
|
|
|
|
|
|
|
|
|
|
|
Corporate and other includes the results of the lifestyle-oriented channels we operate in EMEA, APAC, and
Latin America, operating results from the international licensing of our national networks’ programming and other interactive and digital business initiatives that are not associated with our lifestyle media or international businesses.
Corporate and other includes segment losses of $39.2 million in 2014, $22.9 million in 2013 and $6.9 million in 2012 from our international operations and other interactive and digital business initiatives. The corporate and other segment loss
amounts in 2014 also include $9.7 million of costs incurred for the early termination of service agreements provided for our Food Network and Fine Living operations in EMEA. In conjunction with the termination of these agreements, we also entered
into an arrangement that establishes a transition plan for us to assume the activities with these provided services.
A
reconciliation of segment profit to operating income determined in accordance with GAAP for each business segment was as follows:
|
|
|
|
|
|
|
|
|
|
|
|
|
| (in thousands) |
|
For the years ended December 31, |
|
| |
2014 |
|
|
2013 |
|
|
2012 |
|
| Operating income |
|
$ |
992,309 |
|
|
$ |
958,476 |
|
|
$ |
914,373 |
|
| Depreciation and amortization of intangible assets: |
|
|
|
|
|
|
|
|
|
|
|
|
| Lifestyle media |
|
|
111,497 |
|
|
|
104,214 |
|
|
|
101,360 |
|
| Corporate and other |
|
|
17,085 |
|
|
|
13,366 |
|
|
|
6,231 |
|
| Write-down of goodwill |
|
|
|
|
|
|
24,723 |
|
|
|
19,663 |
|
| Losses (gains) on disposal of property and equipment: |
|
|
|
|
|
|
|
|
|
|
|
|
| Lifestyle media |
|
|
1,311 |
|
|
|
1,606 |
|
|
|
637 |
|
| Corporate and other |
|
|
(441 |
) |
|
|
75 |
|
|
|
(1,391 |
) |
|
|
|
|
|
|
|
|
|
|
|
|
|
| Total segment profit |
|
$ |
1,121,761 |
|
|
$ |
1,102,460 |
|
|
$ |
1,040,873 |
|
|
|
|
|
|
|
|
|
|
|
|
|
|
F-9
Lifestyle Media
Lifestyle media includes our six national television networks, HGTV, Food Network, Travel Channel, DIY Network, Cooking Channel and Great American Country. Lifestyle media also includes websites that are
associated with the aforementioned television brands and other internet-based businesses serving home, food, and travel related categories. The Food Network and Cooking Channel are included in the Food Network Partnership, for which we own
approximately 69 percent. We also own 65 percent of Travel Channel.
Operating results for lifestyle media were as follows:
|
|
|
|
|
|
|
|
|
|
|
|
|
|
|
|
|
|
|
|
|
| (in thousands) |
|
For the years ended December 31, |
|
| |
2014 |
|
|
Change |
|
|
2013 |
|
|
Change |
|
|
2012 |
|
| Segment operating revenues: |
|
|
|
|
|
|
|
|
|
|
|
|
|
|
|
|
|
|
|
|
| Advertising |
|
$ |
1,787,647 |
|
|
|
5.3 |
% |
|
$ |
1,697,170 |
|
|
|
9.2 |
% |
|
$ |
1,554,462 |
|
| Network affiliate fees, net |
|
|
755,950 |
|
|
|
4.9 |
% |
|
|
720,547 |
|
|
|
8.7 |
% |
|
|
662,815 |
|
| Other |
|
|
31,779 |
|
|
|
(16.2 |
)% |
|
|
37,933 |
|
|
|
7.1 |
% |
|
|
35,413 |
|
|
|
|
|
|
|
|
|
|
|
|
|
|
|
|
|
|
|
|
|
|
| Total segment operating revenues |
|
|
2,575,376 |
|
|
|
4.9 |
% |
|
|
2,455,650 |
|
|
|
9.0 |
% |
|
|
2,252,690 |
|
|
|
|
|
|
|
|
|
|
|
|
|
|
|
|
|
|
|
|
|
|
| Segment costs and expenses: |
|
|
|
|
|
|
|
|
|
|
|
|
|
|
|
|
|
|
|
|
| Cost of services, excluding depreciation and amortization of intangible assets |
|
|
717,867 |
|
|
|
9.6 |
% |
|
|
655,087 |
|
|
|
12.3 |
% |
|
|
583,162 |
|
| Selling, general and administrative |
|
|
602,072 |
|
|
|
0.6 |
% |
|
|
598,207 |
|
|
|
9.6 |
% |
|
|
545,824 |
|
|
|
|
|
|
|
|
|
|
|
|
|
|
|
|
|
|
|
|
|
|
| Total segment costs and expenses |
|
|
1,319,939 |
|
|
|
5.3 |
% |
|
|
1,253,294 |
|
|
|
11.0 |
% |
|
|
1,128,986 |
|
|
|
|
|
|
|
|
|
|
|
|
|
|
|
|
|
|
|
|
|
|
| Segment profit |
|
$ |
1,255,437 |
|
|
|
4.4 |
% |
|
$ |
1,202,356 |
|
|
|
7.0 |
% |
|
$ |
1,123,704 |
|
|
|
|
|
|
|
|
|
|
|
|
|
|
|
|
|
|
|
|
|
|
| Supplemental Information: |
|
|
|
|
|
|
|
|
|
|
|
|
|
|
|
|
|
|
|
|
| Program amortization |
|
$ |
606,690 |
|
|
|
|
|
|
$ |
546,133 |
|
|
|
|
|
|
$ |
481,157 |
|
| Program payments |
|
|
705,817 |
|
|
|
|
|
|
|
613,574 |
|
|
|
|
|
|
|
616,492 |
|
| Depreciation and amortization |
|
|
111,497 |
|
|
|
|
|
|
|
104,214 |
|
|
|
|
|
|
|
101,360 |
|
| Capital expenditures |
|
|
50,042 |
|
|
|
|
|
|
|
66,026 |
|
|
|
|
|
|
|
52,672 |
|
|
|
|
|
|
|
|
|
|
|
|
|
|
|
|
|
|
|
|
|
|
The amount of advertising revenue we earn is a function of the pricing negotiated with
advertisers, the number of advertising spots sold and audience impressions delivered. Mid-single digit pricing growth was the primary contributor of our advertising revenue growth in 2014 compared with 2013, while high single digit pricing growth
was the primary contributor of our advertising revenue growth in 2013 compared with 2012.
Distribution agreements with
cable and satellite television systems and telecommunication service providers require distributors to pay SNI fees over the terms of the agreements in exchange for certain rights to distribute our content. The amount of revenue earned from our
distribution agreements is dependent on the rates negotiated in the agreements and the number of subscribers that receive our networks. The increase in network affiliate fees over each of the last three years was primarily attributed to scheduled
rate increases. Lower launch incentive amortization in 2013 also contributed to the increase
in network affiliate fees compared with 2012. The total number of subscribers receiving our networks from cable and satellite television operators, telecommunication providers, digital
distributors and other distribution platforms decreased slightly in 2014 compared with 2013 and in 2013 compared with 2012.
The increase in cost of services reflects our continued investment in the improved quality and variety of programming at our networks.
Program amortization increased $60.6 million in 2014 compared with 2013 and increased $65.0 million in 2013 compared with 2012. The year-over-year fluctuation in program amortization is also impacted by program asset impairments that totaled $38.4
million in 2014, $32.0 million in 2013 and $17.2 million in 2012. Costs of services in 2014 also includes a $3.9 million charge for severance, retention and related retirement benefit costs incurred from the employee reduction programs that were
initiated by the Company in the fourth quarter of 2014.
F-10
Selling, general and administrative expenses in 2014 includes $8.2 million of costs
incurred for the previously mentioned employee reduction programs. The increase in selling, general and administrative
expenses in 2013 compared with 2012 reflects an increase in employee compensation and benefits from the hiring of additional employees to support the growth of lifestyle media.
Supplemental
financial information for lifestyle media included the following:
|
|
|
|
|
|
|
|
|
|
|
|
|
|
|
|
|
|
|
|
|
| (in thousands) |
|
For the years ended December 31, |
|
| |
2014 |
|
|
Change |
|
|
2013 |
|
|
Change |
|
|
2012 |
|
| Operating revenues by brand: |
|
|
|
|
|
|
|
|
|
|
|
|
|
|
|
|
|
|
|
|
| HGTV |
|
$ |
938,475 |
|
|
|
7.1 |
% |
|
$ |
876,051 |
|
|
|
11.7 |
% |
|
$ |
784,127 |
|
| Food Network |
|
|
888,533 |
|
|
|
3.9 |
% |
|
|
854,936 |
|
|
|
3.2 |
% |
|
|
828,620 |
|
| Travel Channel |
|
|
314,199 |
|
|
|
(0.5 |
)% |
|
|
315,773 |
|
|
|
12.6 |
% |
|
|
280,381 |
|
| DIY Network |
|
|
152,094 |
|
|
|
9.7 |
% |
|
|
138,663 |
|
|
|
14.3 |
% |
|
|
121,282 |
|
| Cooking Channel |
|
|
120,835 |
|
|
|
9.6 |
% |
|
|
110,244 |
|
|
|
25.0 |
% |
|
|
88,225 |
|
| Great American Country |
|
|
30,154 |
|
|
|
8.8 |
% |
|
|
27,717 |
|
|
|
12.9 |
% |
|
|
24,549 |
|
| Digital Businesses |
|
|
122,062 |
|
|
|
1.3 |
% |
|
|
120,510 |
|
|
|
8.0 |
% |
|
|
111,629 |
|
| Other |
|
|
14,566 |
|
|
|
0.8 |
% |
|
|
14,454 |
|
|
|
1.4 |
% |
|
|
14,254 |
|
| Intrasegment eliminations |
|
|
(5,542 |
) |
|
|
|
|
|
|
(2,698 |
) |
|
|
|
|
|
|
(377 |
) |
|
|
|
|
|
|
|
|
|
|
|
|
|
|
|
|
|
|
|
|
|
| Total segment operating revenues |
|
$ |
2,575,376 |
|
|
|
4.9 |
% |
|
$ |
2,455,650 |
|
|
|
9.0 |
% |
|
$ |
2,252,690 |
|
|
|
|
|
|
|
|
|
|
|
|
|
|
|
|
|
|
|
|
|
|
| Subscribers by brand (1): |
|
|
|
|
|
|
|
|
|
|
|
|
|
|
|
|
|
|
|
|
| Food Network |
|
|
97,000 |
|
|
|
(1.6 |
)% |
|
|
98,600 |
|
|
|
(1.1 |
)% |
|
|
99,700 |
|
| HGTV |
|
|
95,700 |
|
|
|
(1.7 |
)% |
|
|
97,400 |
|
|
|
(1.4 |
)% |
|
|
98,800 |
|
| Travel Channel |
|
|
91,500 |
|
|
|
(2.5 |
)% |
|
|
93,800 |
|
|
|
(1.0 |
)% |
|
|
94,700 |
|
| DIY Network |
|
|
58,400 |
|
|
|
1.0 |
% |
|
|
57,800 |
|
|
|
(1.0 |
)% |
|
|
58,400 |
|
| Cooking Channel |
|
|
62,000 |
|
|
|
1.8 |
% |
|
|
60,900 |
|
|
|
1.3 |
% |
|
|
60,100 |
|
| Great American Country |
|
|
59,600 |
|
|
|
(4.9 |
)% |
|
|
62,700 |
|
|
|
|
|
|
|
62,700 |
|
|
|
|
|
|
|
|
|
|
|
|
|
|
|
|
|
|
|
|
|
|
| (1) |
Subscriber counts are according to the Nielsen Homevideo Index of homes that receive cable networks. |
Liquidity and Capital Resources
Liquidity
Our primary sources of
liquidity are cash and cash equivalents on hand, cash flows from operations, available borrowing capacity under our revolving credit facility and access to capital markets. Advertising provides approximately 70 percent of total operating revenues,
so cash flow from operating activities can be adversely affected during recessionary periods. Our cash and cash equivalents totaled $878 million at December 31, 2014 and $686 million at December 31, 2013. We have a Competitive Advance and
Revolving Credit Facility (the “Facility”) that permits $650 million in aggregate borrowings and expires in March 2019. There were no outstanding borrowings under the Facility at December 31, 2014. In the fourth quarter of 2014, we
issued $1 billion aggregate principal amount Senior Notes whose funds were primarily used to repay the $885 million Senior Notes that matured on January 15, 2015.
Our cash flow has been used primarily to fund acquisitions and investments, develop new
businesses, acquire shares of our common stock under the repurchase program, pay dividends on our common stock and repay debt. We expect cash flow from operating activities in 2015 will provide sufficient liquidity to fund our operations.
Cash Flows
Cash and cash
equivalents increased $192 million in 2014 and $249 million in 2013 and decreased $323 million in 2012. Components of these changes are discussed below in more detail.
Operating Activities
Cash provided by operating activities totaled $778 million in 2014,
$877 million in 2013 and $615 million in 2012. Segment profit generated from our business segments totaled $1.1 billion in 2014, $1.1
F-11
billion in 2013 and $1.0 billion in 2012. Growth in operating revenues at our lifestyle media segment of 4.9 percent in 2014 compared with 2013 and 9.0 percent in 2013 compared with 2012,
contributed to the year-over-year increases in segment profit. Program payments exceeded the program amortization recognized in our consolidated statements of operations by $104 million in 2014, $70.9 million in 2013 and $136 million in 2012,
reducing cash provided by operating activities for those respective periods. Cash provided by operating activities was also reduced for income taxes and interest payments, totaling $355 million in 2014, $275 million in 2013 and $395 million in 2012
and was increased for dividends received from equity investments, totaling $104 million in 2014, $83.9 million in 2013 and $61.9 million in 2012.
Investing Activities
Cash used in investing activities totaled $78.3 million in
2014, $168 million in 2013 and $225 million in 2012. Capital expenditures totaled $53.8 million in 2014, $73.0 million in 2013, and $63.4 million in 2012.
In April 2013, we acquired AFC for net consideration of approximately $64.4 million.
In April 2012, we acquired TCI for net consideration of approximately $107 million.
In January 2012, we acquired RealGravity, Inc. for net cash consideration of approximately $19.6 million.
A noncontrolling owner holds a 35% residual interest in the Travel Channel. The noncontrolling owner of that interest has a put option right requiring us to repurchase their interest, and we have a call
option right to acquire their outstanding interest.
The put option became exercisable beginning August 17, 2014, and our
call option will become exercisable beginning August 17, 2015. The noncontrolling interest holder will receive appraised fair value for their interest following the exercise of the put or call options. As of December 31, 2014, we valued
the noncontrolling interest in the Travel Channel at $96.3 million.
Financing Activities
Cash used in financing activities totaled $505 million in 2014, $461 million in 2013 and $711 million in 2012.
Under the repurchase program approved by the Board, we are permitted to acquire $2 billion
of Class A Common Shares. During 2014, we repurchased 15.4 million shares for approximately $1.2 billion, including repurchasing 4.5 million shares from Scripps family members at a total cost of $339 million. We repurchased
3.9 million shares for approximately $253 million in 2013 and 11.8 million shares for approximately $600 million in 2012.
On February 19, 2015, the Board authorized an additional $1 billion for the Company’s repurchase program. Following the February 19, 2015 authorization, $1.4 billion remained available for
repurchase under our repurchase program. There is no expiration date for the repurchase program, and we are under no commitment or obligation to repurchase any particular amount of Class A Common Shares under the repurchase program.
In November 2014, we issued $1 billion aggregate principal amount of Senior Notes consisting of $500 million of 2.75% Senior Notes due in
2019 at a price equal to 99.645% of the principal amount and $500 million of 3.90% Senior Notes due in 2024 at a price equal to 99.266% of the principal amount. Net proceeds from the Senior Notes are to be utilized for general corporate purposes
including, but not limited to, the payoff of our $885 million 3.55% Senior Notes that matured and were paid on January 15, 2015.
We also have $500 million aggregate principal amount Senior Notes that mature on December 15, 2016 and bear interest at 2.70%.
Pursuant to the terms of the Food Network general partnership (“Partnership”) agreement, the Partnership is required to
distribute available cash to the general partners. After providing distributions to the partners for respective tax liabilities, available cash is then applied against any capital contributions made by partners prior to distributions based upon each
partners’ ownership interest in the Partnership. During 2012, remaining outstanding capital contributions were returned to the respective partners. Cash distributions to Food Network’s noncontrolling interest partner were $189 million in
2014, $154 million in 2013 and $114 million in 2012. Cash distributions to Travel Channel’s noncontrolling interest partner were $27.6 million in 2014, $6.4 million in 2013 and $52.5 million in 2012.
F-12
We have paid quarterly dividends since our inception as a public company on July 1,
2008. Total dividend payments to shareholders of our common stock were $113 million in 2014, $88.4 million in 2013 and $73.1 million in 2012. During the first quarter of 2015, the Board approved an increase in the quarterly dividend rate to $.23 per
share. We currently expect that quarterly cash dividends will continue to be paid in the future. Future dividends are, however, subject to our earnings, financial condition and capital requirements.
Off-Balance Sheet Arrangements and Contractual Obligations
Off-Balance Sheet Arrangements
Off-balance sheet arrangements include the following
four categories: obligations under certain guarantees or contracts; retained or contingent interests in assets transferred to an unconsolidated entity or similar arrangements; obligations under certain derivative instruments; and obligations under
material variable interests.
We may use operational and economic hedges, as well as currency exchange rate and
interest rate derivative instruments, to manage the impact of currency exchange rate changes on earnings and cash flows. In order to minimize earnings and cash flow volatility resulting from currency exchange rate changes, we may enter into
derivative instruments, principally forward currency exchange rate contracts. These contracts are designed to hedge anticipated foreign currency transactions and changes in the value of specific assets, liabilities and probable commitments. The
currency of the derivative instruments is the British pound.
We do not enter currency exchange rate derivative instruments
for speculative purposes.
We have not entered into arrangements that fall under any of the four categories noted above and that would be
reasonably likely to have a current or future material effect on our results of operations, liquidity or financial condition.
Our contractual obligations under certain contracts are included in the following table.
Contractual Obligations
A summary of our contractual cash commitments, as of December 31, 2014, were as follows:
|
|
|
|
|
|
|
|
|
|
|
|
|
|
|
|
|
|
|
|
|
| (in thousands) |
|
Less than 1
Year |
|
|
Years
2 & 3 |
|
|
Years
4 & 5 |
|
|
Over
5 Years |
|
|
Total |
|
| Debt: |
|
|
|
|
|
|
|
|
|
|
|
|
|
|
|
|
|
|
|
|
| Principal amounts |
|
$ |
885,000 |
|
|
$ |
500,000 |
|
|
$ |
500,000 |
|
|
$ |
500,000 |
|
|
$ |
2,385,000 |
|
| Interest on debt |
|
|
48,059 |
|
|
|
79,438 |
|
|
|
64,781 |
|
|
|
95,063 |
|
|
|
287,341 |
|
| Programming: |
|
|
|
|
|
|
|
|
|
|
|
|
|
|
|
|
|
|
|
|
| Available for broadcast |
|
|
36,138 |
|
|
|
|
|
|
|
|
|
|
|
|
|
|
|
36,138 |
|
| Not yet available for broadcast |
|
|
237,457 |
|
|
|
2,667 |
|
|
|
|
|
|
|
|
|
|
|
240,124 |
|
| Talent contracts |
|
|
19,447 |
|
|
|
4,230 |
|
|
|
|
|
|
|
|
|
|
|
23,677 |
|
| Employee compensation and benefits: |
|
|
|
|
|
|
|
|
|
|
|
|
|
|
|
|
|
|
|
|
| Deferred compensation and benefits |
|
|
1,677 |
|
|
|
1,416 |
|
|
|
1,416 |
|
|
|
38,264 |
|
|
|
42,773 |
|
| Employment contracts |
|
|
18,421 |
|
|
|
15,211 |
|
|
|
809 |
|
|
|
|
|
|
|
34,441 |
|
| Operating leases: |
|
|
|
|
|
|
|
|
|
|
|
|
|
|
|
|
|
|
|
|
| Noncancelable |
|
|
21,670 |
|
|
|
53,901 |
|
|
|
46,842 |
|
|
|
37,468 |
|
|
|
159,881 |
|
| Cancelable |
|
|
1,665 |
|
|
|
2,863 |
|
|
|
2,729 |
|
|
|
1,436 |
|
|
|
8,693 |
|
| Pension obligations- |
|
|
|
|
|
|
|
|
|
|
|
|
|
|
|
|
|
|
|
|
| Minimum pension funding |
|
|
4,650 |
|
|
|
21,432 |
|
|
|
4,529 |
|
|
|
13,214 |
|
|
|
43,825 |
|
| Other commitments: |
|
|
|
|
|
|
|
|
|
|
|
|
|
|
|
|
|
|
|
|
| Satellite transmission |
|
|
25,870 |
|
|
|
44,471 |
|
|
|
15,026 |
|
|
|
3,322 |
|
|
|
88,689 |
|
| Noncancelable purchase and service commitments |
|
|
17,780 |
|
|
|
61,148 |
|
|
|
18,284 |
|
|
|
6,053 |
|
|
|
103,265 |
|
| Other purchase and service commitments |
|
|
68,269 |
|
|
|
17,613 |
|
|
|
791 |
|
|
|
|
|
|
|
86,673 |
|
|
|
|
|
|
|
|
|
|
|
|
|
|
|
|
|
|
|
|
|
|
| Total contractual cash obligations |
|
$ |
1,386,103 |
|
|
$ |
804,390 |
|
|
$ |
655,207 |
|
|
$ |
694,820 |
|
|
$ |
3,540,520 |
|
|
|
|
|
|
|
|
|
|
|
|
|
|
|
|
|
|
|
|
|
|
F-13
In the ordinary course of business, we enter into multi-year contracts to obtain distribution of our
networks, license or produce programming, secure on-air talent, lease office space and equipment, obtain satellite transmission services and purchase other goods and services.
Debt — Principal payments on long-term debt reflect the repayment of our various fixed-rate notes assuming repayment will occur upon the expiration of the fixed-rate notes in January
2015, December 2016, November 2019 and November 2024.
Interest payments on our fixed-rate notes are
projected based on the notes’ contractual rate and maturity.
Programming — Program licenses generally require
payments over the terms of the licenses. Licensed programming includes both programs that have been delivered and are available for telecast and programs that have not yet been produced. If the programs are not produced, our commitments would
generally expire without obligation.
We also enter into contracts with certain independent producers for the
production of programming that airs on our national television networks. Production contracts generally require us to purchase a specified number of episodes of the program.
We expect to enter into additional program licenses and production contracts to meet our future programming needs.
Talent Contracts — We secure on-air talent for our national television networks through multi-year talent agreements. Certain agreements may be terminated under certain circumstances or
at certain dates prior to expiration. We expect our employment and talent contracts will be renewed or replaced with similar agreements upon their expiration. Amounts due under the contracts, assuming the contracts are not terminated prior to their
expiration, are included in the contractual commitments table.
Operating Leases — We obtain certain office
space under multi-year lease agreements. Leases for office space are generally not cancelable prior to their expiration.
Leases for operating and office equipment are generally cancelable by either party on 30 to
90 day notice; however, we expect such contracts will remain in force throughout the terms of the leases. The amounts included in the table above represent the amounts due under the agreements assuming the agreements are not canceled prior to their
expiration.
Generally, we expect our operating leases will be renewed or replaced with similar agreements upon their
expiration.
Pension Obligations — We sponsor a qualified defined benefit pension plan (“Pension Plan”) that
covers substantially all employees. We also have a non-qualified Supplemental Executive Retirement Plan (“SERP”).
Contractual commitments summarized in the contractual obligations table include payments to meet minimum funding requirements of our
Pension Plan in 2015 and estimated benefit payments for our unfunded non-qualified SERP. Estimated payments for the SERP have been estimated over a ten-year period. Accordingly, the amounts in the over 5 years column include estimated payments for
the 2020-2024 periods. While benefit payments under these plans are expected to continue beyond 2024, we believe it is not practicable to estimate payments beyond this period.
Income Tax Obligations — The contractual obligations table does not include any amounts for income taxes due to the fact that we are unable to reasonably predict the ultimate amount or
timing of settlement of our reserves for income taxes. As of December 31, 2014, our reserves for income taxes totaled $69.9 million and is reflected in other liabilities on our consolidated balance sheets. See Note
6-Income Taxes to the consolidated financial statements for additional information on income taxes.
Other Purchase Commitments — We obtain satellite transmission, audience ratings, market research and certain other services under multi-year agreements. These agreements are generally
not cancelable prior to expiration of the service agreement. We expect such agreements will be renewed or replaced with similar agreements upon their expiration.
F-14
We may also enter into contracts with certain vendors and suppliers. These contracts
typically do not require the purchase of fixed or minimum quantities and generally may be terminated at any time without penalty. Included in the table of contractual obligations are purchase orders placed as of December 31, 2014. Purchase
orders placed with vendors, including those with whom we maintain contractual relationships, are generally cancelable prior to shipment. While these vendor agreements do not require us to purchase a minimum quantity of goods or services, and we may
generally cancel orders prior to shipment, we expect expenditures for goods and services in future periods will approximate those in prior years.
Redemption of Noncontrolling Interests in Subsidiary Companies — The noncontrolling interest holder of Travel Channel has the right to require us to repurchase their respective
interest, and we have a call option right to acquire their outstanding interest. The put option became exercisable beginning August 17, 2014, and our call option will become exercisable beginning August 17, 2015. The noncontrolling
interest holder will receive appraised fair value for their interest following the exercise of the put or call options. The table of contractual obligations does not include amounts for the repurchase of noncontrolling interests.
The Food Network is operated and organized under the terms of the Partnership. SNI and a noncontrolling owner hold interests in the
Partnership. During the fourth quarter of 2014, the Food Network Partnership agreement was extended and specifies a dissolution date of December 31, 2016. If the term of the Partnership is not extended prior to that date, the Partnership
agreement permits the Company, as a holder of approximately 80% of the applicable votes, to reconstitute the Partnership and continue its business. If for some reason the Partnership is not continued, it will be required to limit its activities to
winding up, settling debts, liquidating assets and distributing proceeds to the partners in proportion to their partnership interests.
Critical Accounting Policies and Estimates
The preparation of financial statements in accordance with GAAP requires us to make a
variety of decisions that affect reported amounts and related disclosures, including the selection of appropriate
accounting principles and the assumptions on which to base accounting estimates. In reaching such decisions, we apply judgment based on our understanding and analysis of the relevant
circumstances, including our historical experience, actuarial studies and other assumptions. We are committed to incorporating accounting principles, assumptions and estimates that promote the representational faithfulness, verifiability, neutrality
and transparency of the accounting information included in the consolidated financial statements.
Note 2-Summary of
Significant Accounting Policies to the consolidated financial statements describes the significant accounting policies we have selected for use in the preparation of our consolidated financial statements and related disclosures. We believe the
following to be the most critical accounting policies, estimates and assumptions affecting our reported amounts and related disclosures.
Programs and Program Licenses — Production costs for programs produced by us or for us are capitalized as program assets. Such
costs include capitalizable direct costs, production overhead, development costs and acquired production costs. Program licenses, which represent approximately 6 percent of our program assets, generally have fixed terms and require payments
over the terms of the licenses. Licensed program assets and liabilities are recorded when programs become available for broadcast. Program assets are amortized to expense over the estimated useful lives of the programs based upon future cash flows.
The amortization of program assets generally results in an accelerated method over the estimated useful lives.
Estimated future cash flows can change based upon market acceptance, advertising and network affiliate fee rates, the number of
subscribers receiving our networks and program usage. Accordingly, we periodically review revenue estimates and planned usage and revise our assumptions if necessary. If actual demand or market conditions are less favorable than projected, a
write-down to fair value may be required. Development costs for programs that we have determined will not be produced are written off.
Revenue Recognition — Revenue is recognized when persuasive evidence of a sales arrangement
F-15
exists, delivery occurs or services are rendered, the sales price is fixed or determinable and collectability is reasonably assured.
See Note 2 — Summary of Significant Accounting Policies to the consolidated financial statements for a summary of
revenue recognition policies.
Acquisitions — Assets acquired and liabilities assumed in a business combination are
recorded at fair value. We generally determine fair values using comparisons to market transactions and discounted cash flow analyses. The use of a discounted cash flow analysis requires significant judgment for estimating future cash flows of the
asset and expected period of time over which those cash flows will occur and an appropriate discount rate. Changes in such estimates could affect the amounts allocated to individual identifiable assets. While we believe our assumptions are
reasonable, if different assumptions were made, the amounts allocated to finite-lived and indefinite-lived intangible assets could differ substantially from the reported amounts and the associated amortization charge, if required, could also differ.
Goodwill — Goodwill for each reporting unit is tested for impairment on an annual basis, at a minimum, or when events
occur or circumstances change that would indicate the fair value of a reporting unit may be below its carrying value. As of December 31, 2014, our reporting units for purposes of performing the impairment test for goodwill are lifestyle media,
our international businesses conducting business in EMEA and our international businesses conducting business in APAC. If the fair value of a reporting unit is less than its carrying value, an impairment loss is recorded to the extent that the fair
value of the goodwill within the reporting unit is less than its carrying value.
To determine the fair value of a reporting
unit, we generally use market data, appraised values and discounted cash flow analyses. The use of a discounted cash flow analysis requires significant judgment to estimate the future cash flows derived from the asset or business, the expected
period of time over which those cash flows will occur and the determination of an appropriate discount rate. Changes in our estimates and projections or changes in our established reporting units could materially affect the determination of fair
value for each reporting unit.
As of December 31, 2014, the fair value of our lifestyle media reporting unit
substantially exceeded its carrying value. A significant portion of net assets in our EMEA and APAC reporting units is comprised of the assets acquired in the recent TCI and AFC business acquisitions, respectively. We completed the TCI acquisition
in 2012 and recorded a partial goodwill write-down of $24.7 million in 2013 and completed the AFC acquisition in 2013. Accordingly, the fair value of these reporting units approximate the reporting units’ carrying values and no goodwill
impairment was recorded in 2014.
In 2013, we determined that the goodwill recorded for TCI was impaired primarily due to
delayed expansion into some of the growth markets identified for the business at acquisition.
Finite-Lived Intangible
Assets — Finite-lived intangible assets (e.g., network distribution relationships, customer lists, trade names and other acquired rights) are tested for impairment when a triggering event occurs. Such triggering events include the
significant disposal of a portion of such assets or the occurrence of an adverse change in the market involving the business employing the related asset. Once a triggering event has occurred, the impairment test employed is based on whether the
intent is to hold the asset for continued use or to hold the asset for sale. If the intent is to hold the asset for continued use, the impairment test first requires a comparison of undiscounted future cash flows against the carrying value of the
asset. If the carrying value of such asset exceeds the undiscounted cash flows, the asset would be deemed to be impaired. Impairment would then be measured as the difference between the fair value of the asset and its carrying value. Fair value is
generally determined by discounting the future cash flows associated with that asset. If the intent is to hold the asset for sale and certain other criteria are met (e.g., the asset can be disposed of currently, appropriate levels of authority have
approved the sale or there is an actively pursuing buyer), the impairment test involves comparing the asset’s carrying value to its fair value. To the extent the carrying value is greater than the asset’s fair value, an impairment loss is
recognized for the difference.
F-16
Significant judgments in this area involve determining whether a triggering event has
occurred, estimating future cash flows of the assets involved and selecting the discount rate to be applied in determining fair value.
Income Taxes — The application of income tax law is inherently complex. As such, we are required to make many assumptions and
judgments regarding our income tax positions and the likelihood of whether such tax positions would be sustained if challenged. Interpretations and guidance surrounding income tax laws and regulations change over time. As such, changes in our
assumptions and judgments can materially affect amounts recognized in the consolidated financial statements.
We have deferred tax assets and record valuation allowances to reduce such deferred tax assets to the amount that is more likely than
not to be realized. We consider ongoing prudent and feasible tax planning strategies in assessing the need for a valuation allowance. In the event we determine that the deferred tax asset we would realize would be greater or less than the net amount
recorded, an adjustment is made to the tax provision in that period.
New Accounting Standards
A discussion of recently issued accounting pronouncements is described in Note 3-Accounting Standards Updates and Recently Issued Accounting
Standards Updates of the notes to consolidated financial statements.
QUANTITATIVE AND QUALITATIVE DISCLOSURES ABOUT MARKET RISK
We are exposed to market risk related to interest rates and foreign currency exchange rates. We use, or expect to use, derivative financial instruments to
modify exposure to risks from fluctuations in interest rates and foreign currency exchange rates. In accordance with our policy, we do not use derivative instruments unless there is an underlying exposure, and we do not hold or enter into financial
instruments for speculative trading purposes.
Our objectives in managing interest rate risk are to limit the impact of
interest rate changes on our earnings and cash flows, and to reduce overall borrowing costs.
We are subject to interest
rate risk associated with our credit facility, as borrowings bear interest at Libor plus a spread that is determined relative to our Company’s debt rating. Accordingly, the interest we pay on our borrowings is dependent on interest rate
conditions and the timing of our financing needs. The Company issued $1 billion of Senior Notes in November 2014, issued $500 million of Senior Notes in December 2011 and a majority-owned subsidiary of SNI issued $885 million of Senior Notes in
conjunction with our acquisition of a controlling interest in the Travel Channel in December 2009. A 100 basis point increase or decrease in the level of interest rates, respectively, would decrease or increase the total aggregate fair value of the
Senior Notes by approximately $70.8 million and $65.4 million, respectively.
The following table
presents additional information about market-risk-sensitive financial instruments:
|
|
|
|
|
|
|
|
|
|
|
|
|
|
|
|
|
| (in thousands) |
|
As of December 31, 2014 |
|
|
As of December 31, 2013 |
|
| |
Cost
Basis |
|
|
Fair
Value |
|
|
Cost
Basis |
|
|
Fair
Value |
|
| Financial instruments subject to interest rate risk: |
|
|
|
|
|
|
|
|
|
|
|
|
|
|
|
|
| 3.55% senior notes due in 2015 |
|
$ |
884,994 |
|
|
$ |
885,358 |
|
|
$ |
884,844 |
|
|
$ |
910,411 |
|
| 2.70% senior notes due in 2016 |
|
|
499,766 |
|
|
|
514,897 |
|
|
|
499,644 |
|
|
|
519,510 |
|
| 2.75% senior notes due in 2019 |
|
|
498,269 |
|
|
|
501,792 |
|
|
|
|
|
|
|
|
|
| 3.90% senior notes due in 2024 |
|
|
496,376 |
|
|
|
507,948 |
|
|
|
|
|
|
|
|
|
|
|
|
|
|
|
|
|
|
|
|
|
|
|
|
|
|
| Total debt |
|
$ |
2,379,405 |
|
|
$ |
2,409,995 |
|
|
$ |
1,384,488 |
|
|
$ |
1,429,921 |
|
|
|
|
|
|
|
|
|
|
|
|
|
|
|
|
|
|
F-17
We are also subject to interest rate risk associated with the notes receivable acquired in the UKTV
transaction. The notes, totaling $116 million at December 31, 2014 and $122 million at December 31, 2013, effectively act as a revolving credit facility for UKTV. The notes accrue interest at variable rates related to either the spread
over LIBOR or other identified market indices. Because the notes receivable are variable rate, the carrying amount of such note receivable is believed to approximate fair value.
We conduct business in various countries outside the United States, resulting in exposure to movements in foreign exchange rates when
translating from the foreign local currency to the U.S. Dollar. Our primary exposures to foreign currencies are the exchange rates between the U.S. dollar and the Canadian dollar, the U.S. dollar and the British pound and the U.S. dollar and the
Euro. Reported earnings and assets may be reduced in periods in which the U.S. dollar increases in value relative to these currencies.
Our objective in managing exposure to foreign currency fluctuations is to reduce volatility of earnings and cash flow. Accordingly, we may enter into foreign currency derivative instruments that change in
value as foreign exchange rates change, such as foreign currency forward contracts. The change in fair value of non-designated contracts is included within the miscellaneous, net caption in our consolidated statements of operations. The gross
notional value of foreign exchange rate derivative contracts were $124 million at December 31, 2014
and $236 million at December 31, 2013. A sensitivity analysis of changes in the fair value of all foreign exchange rate derivative contracts at December 31, 2014 indicates that if
the U.S. dollar strengthened/weakened by 10 percent against the British pound, the fair value of these contracts would increase/decrease by approximately $12.4 million, respectively. Any gains and losses on the fair value of derivative contracts
would be largely offset by gains and losses on the underlying assets being hedged. These offsetting gains and losses are not reflected in the above analysis.
CONTROLS AND PROCEDURES
Evaluation of Disclosure Controls and
Procedures
The effectiveness of the design and operation of our disclosure controls and procedures (as defined in Rule 13a-15(e) under the
Securities Exchange Act of 1934) was evaluated as of the date of the financial statements. This evaluation was carried out under the supervision of and with the participation of management, including the Chief Executive Officer and the Chief
Financial Officer. Based upon that evaluation, the Chief Executive Officer and the Chief Financial Officer concluded that the design and operation of these disclosure controls and procedures are effective. There were no changes to the Company’s
internal controls over financial reporting (as defined in Exchange Act Rule 13a-15(f)) during the fourth quarter covered by this report that have materially affected, or are reasonably likely to materially affect, the Company’s internal control
over financial reporting.
F-18
MANAGEMENT’S REPORT ON INTERNAL CONTROL OVER FINANCIAL REPORTING
SNI’s management is responsible for establishing and maintaining adequate internal controls designed to provide reasonable assurance regarding the
reliability of financial reporting and the preparation of financial statements for external purposes in accordance with accounting principles generally accepted in the United States of America (“GAAP”). The Company’s internal control
over financial reporting includes those policies and procedures that:
| |
1. |
pertain to the maintenance of records that, in reasonable detail, accurately and fairly reflect the transactions and dispositions of the assets of the Company;
|
| |
2. |
provide reasonable assurance that transactions are recorded as necessary to permit preparation of financial statements in accordance with GAAP and that receipts and
expenditures of the Company are being made only in accordance with authorizations of management and the directors of the Company; and |
| |
3. |
provide reasonable assurance regarding prevention or timely detection of unauthorized acquisition, use or disposition of the Company’s assets that could have a
material effect on the financial statements. |
All internal control systems, no matter how well designed, have
inherent limitations, including the possibility of human error, collusion and the improper overriding of controls by management. Accordingly, even effective internal control can only provide reasonable but not absolute assurance with respect to
financial statement preparation. Further, because of changes in conditions, the effectiveness of internal control may vary over time.
As required by Section 404 of the Sarbanes Oxley Act of 2002, management assessed the effectiveness of Scripps Networks Interactive and subsidiaries’ (the “Company”) internal
control over financial reporting as of December 31, 2014. Management’s assessment is based on the criteria established in the Internal Control — Integrated Framework (2013) issued by the Committee of Sponsoring
Organizations of the Treadway Commission. Based upon our assessment, management believes that the Company maintained effective internal control over financial reporting as of December 31, 2014.
The Company’s independent registered public accounting firm has issued an attestation report on our internal control over financial
reporting as of December 31, 2014.
Date: February 27, 2015
|
| BY: |
|
| /s/ Kenneth W. Lowe |
| Kenneth W. Lowe |
| Chairman, President and Chief Executive Officer |
|
| /s/ Lori A. Hickok |
| Lori A. Hickok |
| Executive Vice President, Chief Financial Officer |
F-19
REPORT OF INDEPENDENT REGISTERED PUBLIC ACCOUNTING FIRM
To the Board of Directors and Shareholders of
Scripps Networks Interactive, Inc.
Knoxville,
Tennessee
We have audited the internal control over financial reporting of Scripps Networks Interactive, Inc. and subsidiaries (the
“Company”) as of December 31, 2014, based on criteria established in Internal Control — Integrated Framework (2013) issued by the Committee of Sponsoring Organizations of the Treadway Commission. The Company’s
management is responsible for maintaining effective internal control over financial reporting and for its assessment of the effectiveness of internal control over financial reporting, included in the accompanying Management’s Report on Internal
Control over Financial Reporting. Our responsibility is to express an opinion on the Company’s internal control over financial reporting based on our audit.
We conducted our audit in accordance with the standards of the Public Company Accounting Oversight Board (United States). Those standards require that we plan and perform the audit to obtain reasonable
assurance about whether effective internal control over financial reporting was maintained in all material respects. Our audit included obtaining an understanding of internal control over financial reporting, assessing the risk that a material
weakness exists, testing and evaluating the design and operating effectiveness of internal control based on the assessed risk, and performing such other procedures as we considered necessary in the circumstances. We believe that our audit provides a
reasonable basis for our opinion.
A company’s internal control over financial reporting is a process designed by, or under the
supervision of, the company’s principal executive and principal financial officers, or persons performing similar functions, and effected by the company’s board of directors, management, and other personnel to provide reasonable assurance
regarding the reliability of financial reporting and the preparation of financial statements for external purposes in accordance with generally accepted accounting principles. A company’s internal control over financial reporting includes those
policies and procedures that (1) pertain to the maintenance of records that, in reasonable detail, accurately and fairly reflect the transactions and dispositions of the assets of the company; (2) provide reasonable assurance that
transactions are recorded as necessary to permit preparation of financial statements in accordance with generally accepted accounting principles, and that receipts and expenditures of the company are being made only in accordance with authorizations
of management and directors of the company; and (3) provide reasonable assurance regarding prevention or timely detection of unauthorized acquisition, use, or disposition of the company’s assets that could have a material effect on the
financial statements.
Because of the inherent limitations of internal control over financial reporting, including the possibility of
collusion or improper management override of controls, material misstatements due to error or fraud may not be prevented or detected on a timely basis. Also, projections of any evaluation of the effectiveness of the internal control over financial
reporting to future periods are subject to the risk that the controls may become inadequate because of changes in conditions, or that the degree of compliance with the policies or procedures may deteriorate.
In our opinion, the Company maintained, in all material respects, effective internal control over financial reporting as of December 31, 2014, based
on the criteria established in Internal Control — Integrated Framework (2013) issued by the Committee of Sponsoring Organizations of the Treadway Commission.
We have audited, in accordance with the standards of the Public Company Accounting Oversight Board (United States), the consolidated financial statements and financial statement schedule of the Company as
of and for the year ended December 31, 2014 and our report dated February 27, 2015 expressed an unqualified opinion on those financial statements and financial statement schedule.
/s/ Deloitte & Touche LLP
Cincinnati, Ohio
February 27, 2015
F-20
REPORT OF INDEPENDENT REGISTERED PUBLIC ACCOUNTING FIRM
To the Board of Directors and Shareholders of
Scripps Networks Interactive, Inc.
Knoxville,
Tennessee
We have audited the accompanying consolidated balance sheets of Scripps Networks Interactive, Inc. and subsidiaries (the
“Company”) as of December 31, 2014 and 2013, and the related consolidated statements of operations, comprehensive income, shareholders’ equity, and cash flows for each of the three years in the period ended December 31,
2014. Our audits also included the financial statement schedule at Page S-2. These financial statements and financial statement schedule are the responsibility of the Company’s management. Our responsibility is to express an opinion on the
financial statements and financial statement schedule based on our audits.
We conducted our audits in accordance with the standards of the
Public Company Accounting Oversight Board (United States). Those standards require that we plan and perform the audit to obtain reasonable assurance about whether the financial statements are free of material misstatement. An audit includes
examining, on a test basis, evidence supporting the amounts and disclosures in the financial statements. An audit also includes assessing the accounting principles used and significant estimates made by management, as well as evaluating the overall
financial statement presentation. We believe that our audits provide a reasonable basis for our opinion.
In our opinion, such consolidated
financial statements present fairly, in all material respects, the financial position of Scripps Networks Interactive, Inc. and subsidiaries as of December 31, 2014 and 2013, and the results of their operations and their cash flows for each of
the three years in the period ended December 31, 2014, in conformity with accounting principles generally accepted in the United States of America. Also, in our opinion, such financial statement schedule, when considered in relation to the
basic consolidated financial statements taken as a whole, presents fairly, in all material respects, the information set forth therein.
We
have also audited, in accordance with the standards of the Public Company Accounting Oversight Board (United States), the Company’s internal control over financial reporting as of December 31, 2014, based on the criteria established in
Internal Control — Integrated Framework (2013) issued by the Committee of Sponsoring Organizations of the Treadway Commission and our report dated February 27, 2015 expressed an unqualified opinion on the Company’s internal
control over financial reporting.
/s/ Deloitte & Touche LLP
Cincinnati, Ohio
February 27, 2015
F-21
Scripps Networks Interactive, Inc.
Consolidated Balance Sheets
|
|
|
|
|
|
|
|
|
| |
|
As of December 31, |
|
| (in thousands, except share and par value amounts) |
|
2014 |
|
|
2013 |
|
| ASSETS |
|
|
|
|
|
|
|
|
| Current assets: |
|
|
|
|
|
|
|
|
| Cash and cash equivalents |
|
$ |
878,164 |
|
|
$ |
686,371 |
|
| Accounts receivable (less allowances: 2014 — $7,889; 2013 — $6,853) |
|
|
629,775 |
|
|
|
619,619 |
|
| Programs and program licenses |
|
|
477,575 |
|
|
|
423,949 |
|
| Deferred income taxes |
|
|
41,831 |
|
|
|
41,140 |
|
| Other current assets |
|
|
110,816 |
|
|
|
90,231 |
|
|
|
|
|
|
|
|
|
|
| Total current assets |
|
|
2,138,161 |
|
|
|
1,861,310 |
|
| Investments |
|
|
463,344 |
|
|
|
488,198 |
|
| Property and equipment, net |
|
|
226,246 |
|
|
|
246,350 |
|
| Goodwill and other intangible assets: |
|
|
|
|
|
|
|
|
| Goodwill |
|
|
573,119 |
|
|
|
574,582 |
|
| Other intangible assets, net |
|
|
595,881 |
|
|
|
655,009 |
|
|
|
|
|
|
|
|
|
|
| Total goodwill and other intangible assets, net |
|
|
1,169,000 |
|
|
|
1,229,591 |
|
|
|
|
|
|
|
|
|
|
| Other assets: |
|
|
|
|
|
|
|
|
| Programs and program licenses (less current portion) |
|
|
469,083 |
|
|
|
413,057 |
|
| Deferred income taxes |
|
|
37,265 |
|
|
|
39,075 |
|
| Other non-current assets |
|
|
164,533 |
|
|
|
160,866 |
|
|
|
|
|
|
|
|
|
|
| Total other assets |
|
|
670,881 |
|
|
|
612,998 |
|
|
|
|
|
|
|
|
|
|
| Total Assets |
|
$ |
4,667,632 |
|
|
$ |
4,438,447 |
|
|
|
|
|
|
|
|
|
|
| LIABILITIES AND EQUITY |
|
|
|
|
|
|
|
|
| Current liabilities: |
|
|
|
|
|
|
|
|
| Accounts payable |
|
$ |
21,499 |
|
|
$ |
18,278 |
|
| Current portion of debt |
|
|
884,994 |
|
|
|
|
|
| Program rights payable |
|
|
36,138 |
|
|
|
30,412 |
|
| Customer deposits and unearned revenue |
|
|
47,929 |
|
|
|
70,427 |
|
| Accrued liabilities: |
|
|
|
|
|
|
|
|
| Employee compensation and benefits |
|
|
73,185 |
|
|
|
67,188 |
|
| Accrued marketing and advertising costs |
|
|
3,765 |
|
|
|
11,053 |
|
| Other accrued liabilities |
|
|
90,444 |
|
|
|
81,341 |
|
|
|
|
|
|
|
|
|
|
| Total current liabilities |
|
|
1,157,954 |
|
|
|
278,699 |
|
| Debt (less current portion) |
|
|
1,494,411 |
|
|
|
1,384,488 |
|
| Other liabilities (less current portion) |
|
|
234,429 |
|
|
|
223,368 |
|
|
|
|
|
|
|
|
|
|
| Total liabilities |
|
|
2,886,794 |
|
|
|
1,886,555 |
|
|
|
|
|
|
|
|
|
|
| Commitments and contingencies (Note 20) |
|
|
|
|
|
|
|
|
|
|
|
|
|
|
|
|
|
| Redeemable noncontrolling interest (Note 16) |
|
|
96,251 |
|
|
|
133,000 |
|
|
|
|
|
|
|
|
|
|
| Equity: |
|
|
|
|
|
|
|
|
| SNI shareholders’ equity: |
|
|
|
|
|
|
|
|
| Preferred stock, $.01 par — authorized: 25,000,000 shares; none outstanding
Common stock, $.01 par: |
|
|
|
|
|
|
|
|
| Class A — authorized: 240,000,000 shares; issued and outstanding: 2014 — 97,789,910 shares; 2013 —
111,891,667 shares |
|
|
978 |
|
|
|
1,119 |
|
| Voting — authorized: 60,000,000 shares; issued and outstanding: 2014 — 34,317,171 shares; 2013 — 34,317,171
shares |
|
|
343 |
|
|
|
343 |
|
|
|
|
|
|
|
|
|
|
| Total |
|
|
1,321 |
|
|
|
1,462 |
|
| Additional paid-in capital |
|
|
1,359,023 |
|
|
|
1,447,496 |
|
| Retained earnings |
|
|
79,994 |
|
|
|
662,574 |
|
| Accumulated other comprehensive loss |
|
|
(57,891 |
) |
|
|
(12,529 |
) |
|
|
|
|
|
|
|
|
|
| Total SNI shareholders’ equity |
|
|
1,382,447 |
|
|
|
2,099,003 |
|
|
|
|
|
|
|
|
|
|
| Noncontrolling interest (Note 16) |
|
|
302,140 |
|
|
|
319,889 |
|
|
|
|
|
|
|
|
|
|
| Total equity |
|
|
1,684,587 |
|
|
|
2,418,892 |
|
|
|
|
|
|
|
|
|
|
| Total Liabilities and Equity |
|
$ |
4,667,632 |
|
|
$ |
4,438,447 |
|
|
|
|
|
|
|
|
|
|
See notes to consolidated financial statements.
F-22
Scripps Networks Interactive, Inc.
Consolidated Statements of Operations
|
|
|
|
|
|
|
|
|
|
|
|
|
| |
|
For the years ended December 31, |
|
| (in thousands, except per share data) |
|
2014 |
|
|
2013 |
|
|
2012 |
|
| Operating Revenues: |
|
|
|
|
|
|
|
|
|
|
|
|
| Advertising |
|
$ |
1,816,388 |
|
|
$ |
1,717,734 |
|
|
$ |
1,564,503 |
|
| Network affiliate fees, net |
|
|
799,178 |
|
|
|
758,220 |
|
|
|
688,440 |
|
| Other |
|
|
49,890 |
|
|
|
54,855 |
|
|
|
54,239 |
|
|
|
|
|
|
|
|
|
|
|
|
|
|
| Total operating revenues |
|
|
2,665,456 |
|
|
|
2,530,809 |
|
|
|
2,307,182 |
|
|
|
|
|
|
|
|
|
|
|
|
|
|
| Cost of services, excluding depreciation and amortization of intangible assets |
|
|
778,896 |
|
|
|
699,294 |
|
|
|
610,836 |
|
| Selling, general and administrative |
|
|
764,799 |
|
|
|
729,055 |
|
|
|
655,473 |
|
| Depreciation |
|
|
72,979 |
|
|
|
63,010 |
|
|
|
58,242 |
|
| Amortization of intangible assets |
|
|
55,603 |
|
|
|
54,570 |
|
|
|
49,349 |
|
| Write-down of goodwill |
|
|
|
|
|
|
24,723 |
|
|
|
19,663 |
|
| Losses (gains) on disposal of property and equipment |
|
|
870 |
|
|
|
1,681 |
|
|
|
(754 |
) |
|
|
|
|
|
|
|
|
|
|
|
|
|
| Total operating expenses |
|
|
1,673,147 |
|
|
|
1,572,333 |
|
|
|
1,392,809 |
|
|
|
|
|
|
|
|
|
|
|
|
|
|
| Operating income |
|
|
992,309 |
|
|
|
958,476 |
|
|
|
914,373 |
|
| Interest expense |
|
|
(52,687 |
) |
|
|
(48,710 |
) |
|
|
(50,814 |
) |
| Equity in earnings of affiliates |
|
|
85,631 |
|
|
|
79,644 |
|
|
|
60,864 |
|
| Miscellaneous, net |
|
|
2,598 |
|
|
|
1,241 |
|
|
|
13,340 |
|
|
|
|
|
|
|
|
|
|
|
|
|
|
| Income from operations before income taxes |
|
|
1,027,851 |
|
|
|
990,651 |
|
|
|
937,763 |
|
| Provision for income taxes |
|
|
301,043 |
|
|
|
307,623 |
|
|
|
88,107 |
|
|
|
|
|
|
|
|
|
|
|
|
|
|
| Net income |
|
|
726,808 |
|
|
|
683,028 |
|
|
|
849,656 |
|
| Less: net income attributable to noncontrolling interests |
|
|
181,533 |
|
|
|
177,958 |
|
|
|
168,178 |
|
|
|
|
|
|
|
|
|
|
|
|
|
|
| Net income attributable to SNI |
|
$ |
545,275 |
|
|
$ |
505,070 |
|
|
$ |
681,478 |
|
|
|
|
|
|
|
|
|
|
|
|
|
|
| Net income attributable to SNI common shareholders per share of common stock: |
|
|
|
|
|
|
|
|
|
|
|
|
| Net income attributable to SNI common shareholders per basic share of common stock |
|
$ |
3.86 |
|
|
$ |
3.43 |
|
|
$ |
4.48 |
|
| Net income attributable to SNI common shareholders per diluted share of common stock |
|
$ |
3.83 |
|
|
$ |
3.40 |
|
|
$ |
4.44 |
|
|
|
|
|
|
|
|
|
|
|
|
|
|
| Weighted average shares outstanding: |
|
|
|
|
|
|
|
|
|
|
|
|
| Weighted average basic shares outstanding |
|
|
141,297 |
|
|
|
147,326 |
|
|
|
152,180 |
|
| Weighted average diluted shares outstanding |
|
|
142,193 |
|
|
|
148,502 |
|
|
|
153,327 |
|
|
|
|
|
|
|
|
|
|
|
|
|
|
See notes to consolidated financial statements.
F-23
Scripps Networks Interactive, Inc.
Consolidated Statements of Comprehensive Income
|
|
|
|
|
|
|
|
|
|
|
|
|
| |
|
For the years ended December 31, |
|
| (in thousands) |
|
2014 |
|
|
2013 |
|
|
2012 |
|
| Net income |
|
$ |
726,808 |
|
|
$ |
683,028 |
|
|
$ |
849,656 |
|
| Other comprehensive (loss) income, net of tax: |
|
|
|
|
|
|
|
|
|
|
|
|
| Foreign currency translation adjustments, net of tax — 2014, $1,273; 2013, $1,117; 2012, ($270) |
|
|
(37,877 |
) |
|
|
6,534 |
|
|
|
5,341 |
|
| Pension liability adjustments, net of tax — 2014, $4,783; 2013, ($11,991); 2012, $6,330 |
|
|
(7,791 |
) |
|
|
19,529 |
|
|
|
(10,780 |
) |
|
|
|
|
|
|
|
|
|
|
|
|
|
| Comprehensive income |
|
|
681,140 |
|
|
|
709,091 |
|
|
|
844,217 |
|
| Less: comprehensive income attributable to noncontrolling interests |
|
|
181,227 |
|
|
|
177,688 |
|
|
|
168,254 |
|
|
|
|
|
|
|
|
|
|
|
|
|
|
| Comprehensive income attributable to SNI |
|
$ |
499,913 |
|
|
$ |
531,403 |
|
|
$ |
675,963 |
|
|
|
|
|
|
|
|
|
|
|
|
|
|
See notes to consolidated financial statements.
F-24
Scripps Networks Interactive, Inc.
Consolidated Statements of Cash Flows
|
|
|
|
|
|
|
|
|
|
|
|
|
| |
|
For the years ended December 31, |
|
| (in thousands) |
|
2014 |
|
|
2013 |
|
|
2012 |
|
| Cash Flows from Operating Activities: |
|
|
|
|
|
|
|
|
|
|
|
|
| Net income |
|
$ |
726,808 |
|
|
$ |
683,028 |
|
|
$ |
849,656 |
|
| Depreciation and amortization of intangible assets |
|
|
128,582 |
|
|
|
117,580 |
|
|
|
107,591 |
|
| Write-down of goodwill |
|
|
|
|
|
|
24,723 |
|
|
|
19,663 |
|
| Amortization of network distribution costs |
|
|
7,004 |
|
|
|
7,024 |
|
|
|
23,687 |
|
| Program amortization |
|
|
621,210 |
|
|
|
556,694 |
|
|
|
487,138 |
|
| Equity in earnings of affiliates |
|
|
(85,631 |
) |
|
|
(79,644 |
) |
|
|
(60,864 |
) |
| Program payments |
|
|
(725,582 |
) |
|
|
(627,591 |
) |
|
|
(623,484 |
) |
| Dividends received from equity investments |
|
|
104,185 |
|
|
|
83,912 |
|
|
|
61,896 |
|
| Deferred income taxes |
|
|
7,175 |
|
|
|
79,336 |
|
|
|
(284,271 |
) |
| Stock and deferred compensation plans |
|
|
39,375 |
|
|
|
46,810 |
|
|
|
39,492 |
|
| Changes in working capital accounts (excluding the effects of acquisition): |
|
|
|
|
|
|
|
|
|
|
|
|
| Accounts receivable |
|
|
(10,932 |
) |
|
|
(52,691 |
) |
|
|
(4,461 |
) |
| Other assets |
|
|
(2,188 |
) |
|
|
1,255 |
|
|
|
(7,228 |
) |
| Accounts payable |
|
|
3,593 |
|
|
|
5,001 |
|
|
|
(2,157 |
) |
| Accrued employee compensation and benefits |
|
|
6,848 |
|
|
|
9,709 |
|
|
|
10,249 |
|
| Accrued / refundable income taxes |
|
|
(18,947 |
) |
|
|
(31,573 |
) |
|
|
(2,365 |
) |
| Other liabilities |
|
|
(16,558 |
) |
|
|
35,303 |
|
|
|
(5,688 |
) |
| Other, net |
|
|
(7,368 |
) |
|
|
18,318 |
|
|
|
5,829 |
|
|
|
|
|
|
|
|
|
|
|
|
|
|
| Cash provided by operating activities |
|
|
777,574 |
|
|
|
877,194 |
|
|
|
614,683 |
|
|
|
|
|
|
|
|
|
|
|
|
|
|
| Cash Flows from Investing Activities: |
|
|
|
|
|
|
|
|
|
|
|
|
| Additions to property and equipment |
|
|
(53,775 |
) |
|
|
(72,990 |
) |
|
|
(63,416 |
) |
| Purchases of long-term investments |
|
|
(17,042 |
) |
|
|
|
|
|
|
(17,089 |
) |
| Collections (funds advanced) on note receivable |
|
|
4,481 |
|
|
|
12,939 |
|
|
|
12,264 |
|
| Purchases of subsidiary companies, net of cash acquired |
|
|
|
|
|
|
(64,412 |
) |
|
|
(119,036 |
) |
| Other, net |
|
|
(12,001 |
) |
|
|
(43,510 |
) |
|
|
(48,003 |
) |
|
|
|
|
|
|
|
|
|
|
|
|
|
| Cash used in continuing investing activities |
|
|
(78,337 |
) |
|
|
(167,973 |
) |
|
|
(235,280 |
) |
| Cash provided by discontinued investing activities |
|
|
|
|
|
|
|
|
|
|
10,000 |
|
|
|
|
|
|
|
|
|
|
|
|
|
|
| Cash used in investing activities |
|
|
(78,337 |
) |
|
|
(167,973 |
) |
|
|
(225,280 |
) |
|
|
|
|
|
|
|
|
|
|
|
|
|
| Cash Flows from Financing Activities: |
|
|
|
|
|
|
|
|
|
|
|
|
| Proceeds from debt |
|
|
1,189,555 |
|
|
|
|
|
|
|
|
|
| Payments on debt |
|
|
(195,000 |
) |
|
|
|
|
|
|
|
|
| Dividends paid |
|
|
(112,943 |
) |
|
|
(88,400 |
) |
|
|
(73,109 |
) |
| Dividends paid to noncontrolling interests |
|
|
(216,860 |
) |
|
|
(160,493 |
) |
|
|
(166,351 |
) |
| Repurchase of Class A common stock |
|
|
(1,198,962 |
) |
|
|
(253,203 |
) |
|
|
(600,285 |
) |
| Proceeds from stock options |
|
|
39,605 |
|
|
|
42,976 |
|
|
|
121,665 |
|
| Deferred loan costs |
|
|
(9,026 |
) |
|
|
|
|
|
|
|
|
| Other, net |
|
|
(1,361 |
) |
|
|
(1,762 |
) |
|
|
6,675 |
|
|
|
|
|
|
|
|
|
|
|
|
|
|
| Cash used in financing activities |
|
|
(504,992 |
) |
|
|
(460,882 |
) |
|
|
(711,405 |
) |
|
|
|
|
|
|
|
|
|
|
|
|
|
| Effect of exchange rate changes on cash and cash equivalents |
|
|
(2,452 |
) |
|
|
507 |
|
|
|
(565 |
) |
|
|
|
|
|
|
|
|
|
|
|
|
|
| Increase (decrease) in cash and cash equivalents |
|
|
191,793 |
|
|
|
248,846 |
|
|
|
(322,567 |
) |
| Cash and cash equivalents: |
|
|
|
|
|
|
|
|
|
|
|
|
| Beginning of year |
|
|
686,371 |
|
|
|
437,525 |
|
|
|
760,092 |
|
|
|
|
|
|
|
|
|
|
|
|
|
|
| End of year |
|
$ |
878,164 |
|
|
$ |
686,371 |
|
|
$ |
437,525 |
|
|
|
|
|
|
|
|
|
|
|
|
|
|
| Supplemental Cash Flow Disclosures: |
|
|
|
|
|
|
|
|
|
|
|
|
| Interest paid, excluding amounts capitalized |
|
$ |
45,917 |
|
|
$ |
45,436 |
|
|
$ |
46,682 |
|
| Income taxes paid |
|
|
309,519 |
|
|
|
229,966 |
|
|
|
348,158 |
|
|
|
|
|
|
|
|
|
|
|
|
|
|
| Non-Cash Transactions: |
|
|
|
|
|
|
|
|
|
|
|
|
| Obligations incurred for purchase of intangible assets |
|
|
|
|
|
|
|
|
|
$ |
74,254 |
|
| Contingent consideration liability |
|
|
|
|
|
|
|
|
|
|
8,323 |
|
|
|
|
|
|
|
|
|
|
|
|
|
|
See notes to consolidated financial statements.
F-25
Scripps Networks Interactive, Inc.
Consolidated Statements of Shareholders’ Equity
|
|
|
|
|
|
|
|
|
|
|
|
|
|
|
|
|
|
|
|
|
|
|
|
|
|
|
|
|
| (in thousands, except share data) |
|
Common
Stock |
|
|
Additional
Paid-in
Capital |
|
|
Retained
Earnings |
|
|
Accumulated
Other
Comprehensive
Loss |
|
|
Noncontrolling
Interest |
|
|
Total
Equity |
|
|
Redeemable
Noncontrolling
Interests
(Temporary
Equity) |
|
| As of December 31, 2011 |
|
$ |
1,571 |
|
|
$ |
1,346,429 |
|
|
$ |
364,073 |
|
|
$ |
(33,347 |
) |
|
$ |
254,919 |
|
|
$ |
1,933,645 |
|
|
$ |
162,750 |
|
| Comprehensive income (loss) |
|
|
|
|
|
|
|
|
|
|
681,478 |
|
|
|
(5,515 |
) |
|
|
166,059 |
|
|
|
842,022 |
|
|
|
2,195 |
|
| Redeemable noncontrolling interest fair value adjustments |
|
|
|
|
|
|
|
|
|
|
(24,055 |
) |
|
|
|
|
|
|
|
|
|
|
(24,055 |
) |
|
|
24,055 |
|
| Dividends paid to noncontrolling interests |
|
|
|
|
|
|
|
|
|
|
|
|
|
|
|
|
|
|
(113,851 |
) |
|
|
(113,851 |
) |
|
|
(52,500 |
) |
| Dividends: declared and paid — $.48 per share |
|
|
|
|
|
|
|
|
|
|
(73,109 |
) |
|
|
|
|
|
|
|
|
|
|
(73,109 |
) |
|
|
|
|
| Repurchases of 11,841.108 Class A Common Shares |
|
|
(118 |
) |
|
|
(104,378 |
) |
|
|
(495,789 |
) |
|
|
|
|
|
|
|
|
|
|
(600,285 |
) |
|
|
|
|
| Stock-based compensation expense |
|
|
|
|
|
|
32,130 |
|
|
|
|
|
|
|
|
|
|
|
|
|
|
|
32,130 |
|
|
|
|
|
| Exercise of employee stock options: 3,317,088 shares issued |
|
|
33 |
|
|
|
121,632 |
|
|
|
|
|
|
|
|
|
|
|
|
|
|
|
121,665 |
|
|
|
|
|
| Other stock-based compensation, net: 376,169 shares issued; 110,176 shares repurchased |
|
|
3 |
|
|
|
(2,940 |
) |
|
|
|
|
|
|
|
|
|
|
|
|
|
|
(2,937 |
) |
|
|
|
|
| Tax benefits of compensation plans |
|
|
|
|
|
|
12,826 |
|
|
|
|
|
|
|
|
|
|
|
|
|
|
|
12,826 |
|
|
|
|
|
|
|
|
|
|
|
|
|
|
|
|
|
|
|
|
|
|
|
|
|
|
|
|
|
|
|
|
|
|
| As of December 31, 2012 |
|
|
1,489 |
|
|
|
1,405,699 |
|
|
|
452,598 |
|
|
|
(38,862 |
) |
|
|
307,127 |
|
|
|
2,128,051 |
|
|
|
136,500 |
|
| Comprehensive income (loss) |
|
|
|
|
|
|
|
|
|
|
505,070 |
|
|
|
26,333 |
|
|
|
166,885 |
|
|
|
698,288 |
|
|
|
10,803 |
|
| Redeemable noncontrolling interest fair value adjustments |
|
|
|
|
|
|
|
|
|
|
7,933 |
|
|
|
|
|
|
|
|
|
|
|
7,933 |
|
|
|
(7,933 |
) |
| Dividends paid to noncontrolling interests |
|
|
|
|
|
|
|
|
|
|
|
|
|
|
|
|
|
|
(154,123 |
) |
|
|
(154,123 |
) |
|
|
(6,370 |
) |
| Dividends: declared and paid — $.60 per share |
|
|
|
|
|
|
|
|
|
|
(88,400 |
) |
|
|
|
|
|
|
|
|
|
|
(88,400 |
) |
|
|
|
|
| Convert 2 Voting Shares to Class A Common Shares |
|
|
|
|
|
|
|
|
|
|
|
|
|
|
|
|
|
|
|
|
|
|
|
|
|
|
|
|
| Repurchases of 3,917,471 Class A Common Shares |
|
|
(39 |
) |
|
|
(38,537 |
) |
|
|
(214,627 |
) |
|
|
|
|
|
|
|
|
|
|
(253,203 |
) |
|
|
|
|
| Stock-based compensation expense |
|
|
|
|
|
|
36,845 |
|
|
|
|
|
|
|
|
|
|
|
|
|
|
|
36,845 |
|
|
|
|
|
| Exercise of employee stock options: 990,383 shares issued |
|
|
9 |
|
|
|
42,967 |
|
|
|
|
|
|
|
|
|
|
|
|
|
|
|
42,976 |
|
|
|
|
|
| Other stock-based compensation, net: 352,599 shares issued; 104,178 shares repurchased |
|
|
3 |
|
|
|
(4,367 |
) |
|
|
|
|
|
|
|
|
|
|
|
|
|
|
(4,364 |
) |
|
|
|
|
| Tax benefits of compensation plans |
|
|
|
|
|
|
4,889 |
|
|
|
|
|
|
|
|
|
|
|
|
|
|
|
4,889 |
|
|
|
|
|
|
|
|
|
|
|
|
|
|
|
|
|
|
|
|
|
|
|
|
|
|
|
|
|
|
|
|
|
|
| As of December 31, 2013 |
|
|
1,462 |
|
|
|
1,447,496 |
|
|
|
662,574 |
|
|
|
(12,529 |
) |
|
|
319,889 |
|
|
|
2,418,892 |
|
|
|
133,000 |
|
| Comprehensive income (loss) |
|
|
|
|
|
|
|
|
|
|
545,275 |
|
|
|
(45,362 |
) |
|
|
171,548 |
|
|
|
671,461 |
|
|
|
9,679 |
|
| Redeemable noncontrolling interest fair value adjustments |
|
|
|
|
|
|
|
|
|
|
18,865 |
|
|
|
|
|
|
|
|
|
|
|
18,865 |
|
|
|
(18,865 |
) |
| Dividends paid to noncontrolling interests |
|
|
|
|
|
|
|
|
|
|
|
|
|
|
|
|
|
|
(189,297 |
) |
|
|
(189,297 |
) |
|
|
(27,563 |
) |
| Dividends: declared and paid — $.80 per share |
|
|
|
|
|
|
|
|
|
|
(112,943 |
) |
|
|
|
|
|
|
|
|
|
|
(112,943 |
) |
|
|
|
|
| Repurchases of 15,447,884 Class A Common Shares |
|
|
(154 |
) |
|
|
(165,031 |
) |
|
|
(1,033,777 |
) |
|
|
|
|
|
|
|
|
|
|
(1,198,962 |
) |
|
|
|
|
| Stock-based compensation expense |
|
|
|
|
|
|
35,474 |
|
|
|
|
|
|
|
|
|
|
|
|
|
|
|
35,474 |
|
|
|
|
|
| Exercise of employee stock options: 1,007,676 shares issued |
|
|
10 |
|
|
|
39,595 |
|
|
|
|
|
|
|
|
|
|
|
|
|
|
|
39,605 |
|
|
|
|
|
| Other stock-based compensation, net: 513,690 shares issued; 175,239 shares repurchased |
|
|
3 |
|
|
|
(10,850 |
) |
|
|
|
|
|
|
|
|
|
|
|
|
|
|
(10,847 |
) |
|
|
|
|
| Tax benefits of compensation plans |
|
|
|
|
|
|
12,339 |
|
|
|
|
|
|
|
|
|
|
|
|
|
|
|
12,339 |
|
|
|
|
|
|
|
|
|
|
|
|
|
|
|
|
|
|
|
|
|
|
|
|
|
|
|
|
|
|
|
|
|
|
| As of December 31, 2014 |
|
$ |
1,321 |
|
|
$ |
1,359,023 |
|
|
$ |
79,994 |
|
|
$ |
(57,891 |
) |
|
$ |
302,140 |
|
|
$ |
1,684,587 |
|
|
$ |
96,251 |
|
|
|
|
|
|
|
|
|
|
|
|
|
|
|
|
|
|
|
|
|
|
|
|
|
|
|
|
|
|
See notes to consolidated financial statements.
F-26
Notes to Consolidated Financial Statements
1. DESCRIPTION OF BUSINESS AND BASIS OF PRESENTATION
As used in the Notes to the Consolidated Financial Statements, the terms “we”, “our”, “us” or “the Company” may,
depending on the context, refer to Scripps Networks Interactive, Inc. (“SNI”), to one or more of its consolidated subsidiary companies or to all of them taken as a whole.
Description of Business — The Company operates in the media industry and has interests in national television networks and internet based media outlets. The Company’s reportable
segment is lifestyle media. The lifestyle media segment includes our six national television networks, HGTV, Food Network, Travel Channel, DIY Network, Cooking Channel and Great American Country. Lifestyle media also includes websites that are
associated with the aforementioned television brands and other Internet-based businesses serving home, food and travel related categories.
We also have established lifestyle media brands internationally. Our lifestyle-oriented channels are available in the United Kingdom (“UK”), other European markets, the Middle East and Africa
(“EMEA”), Asia-Pacific (“APAC”) and Latin America.
See Note 19 — Segment Information
for additional information about the Company’s segments.
Basis of Presentation
Principles of Consolidation — The consolidated financial statements include the accounts of SNI and its majority-owned subsidiary
companies after elimination of intercompany accounts and transactions. Consolidated subsidiary companies include general partnerships and limited liability companies in which more than a 50% residual interest is owned. Investments in 20% to 50%
owned companies and partnerships or companies and partnerships in which we exercise significant influence over the operating and financial policies are accounted for using the equity method. The results of companies acquired or disposed of are
included in the consolidated financial statements from the effective date of acquisition or up to the date of disposal.
Use of Estimates — The preparation of financial statements in accordance with accounting
principles generally accepted in the United States of America (“GAAP”) requires us to make a variety of decisions that affect reported amounts and the related disclosures, including the selection of appropriate accounting principles that
reflect the economic substance of the underlying transactions and the assumptions on which to base accounting estimates. In reaching such decisions, we apply judgment based on our understanding and analysis of the relevant circumstances, including
our historical experience, actuarial studies and other assumptions.
Our consolidated financial statements include
estimates, judgment, and assumptions used in accounting for business acquisitions and dispositions, asset impairments, equity method investments, revenue recognition, program assets, depreciation and amortization, pension plans, share-based
compensation, income taxes, redeemable noncontrolling interests in subsidiaries, fair value measurements and contingencies.
While we re-evaluate our estimates and assumptions on an ongoing basis, actual results could differ from those estimated at the time
consolidated financial statements were prepared.
Concentration Risks — Approximately 70% of our operating revenues are
derived from advertising. Operating results can be affected by changes in the demand for such services both nationally and in individual markets.
The six largest cable television systems and the two largest satellite television systems provide service to more than 88% of homes receiving HGTV, Food Network and Travel Channel. The loss of
distribution of our networks by any of these cable or satellite television systems could adversely affect our business.
Foreign
Currency Translation — Substantially all of our international subsidiaries use the local currency of their respective country as their functional currency. Assets and liabilities of such international subsidiaries are translated using
end-of-period exchange rates while results of operations are translated based on the average exchange rates
F-27
throughout the year. Equity is translated at historical exchange rates, with the resulting cumulative translation adjustment included as a component of accumulated other comprehensive (loss)
income in shareholders’ equity, net of applicable taxes.
Monetary assets and liabilities denominated in currencies other
than the functional currency are remeasured into the functional currency using end-of-period exchange rates. Gains or losses resulting from such remeasurement are
recorded in income. Foreign exchange gains and losses are included within miscellaneous, net in the consolidated statements of operations.
2. SUMMARY OF SIGNIFICANT ACCOUNTING POLICIES
Cash and Cash Equivalents — Cash and cash equivalents consist of cash on hand and marketable securities with an original maturity of less than three months. Cash equivalents, which
primarily consist of money market funds, are carried at cost plus accrued income, which approximates fair value.
Accounts
Receivable — We extend credit to customers based upon our assessment of the customer’s financial condition. Collateral is generally not required from customers. Allowances for credit losses are generally based upon trends, economic
conditions, review of aging categories, specific identification of customers at risk of default and historical experience.
Investments — We have investments that are accounted for using both the equity method and cost method of accounting. We use the equity
method to account for our investments in equity securities if our investment gives us the ability to exercise significant influence over operating and financial policies of the investee. Under this method of accounting, investments in equity
securities are initially recorded at cost and subsequently increased or decreased to reflect our proportionate share of net earnings or losses of the equity method investees. Cash payments to equity method investees, such as additional investments,
loans, advances and expenses incurred on behalf of investees, as well as dividends from equity method investees, are recorded as adjustments to the investment balances. Goodwill and other intangible assets arising from the acquisition of an
investment in equity method investees are included in the carrying value of the investment. As goodwill is
not reported separately, it is not separately tested for impairment. Instead, the entire equity method investment is tested for impairment whenever events or changes in circumstances indicate
that the carrying amounts of such investments may not be recoverable.
We utilize the cost method of accounting for
investments that we do not have the ability to exercise significant influence over operating and financial policies of the investee. Our cost method investments, which are all in private companies, are recorded at cost.
We regularly review our investments to determine if there has been any other-than-temporary decline in values. These reviews require
management judgments that often include estimating the outcome of future events and determining whether factors exist that indicate impairment has occurred. We evaluate, among other factors, the extent to which the investments carrying value exceeds
fair value, the duration of the decline in fair value below carrying value and the current cash position, earnings and cash forecasts and near term prospects of the investee. The carrying value of an investment is adjusted when a decline in fair
value below cost is determined to be other-than-temporary.
Property and Equipment — Property and equipment, which includes
internal use software, is carried at historical cost less accumulated depreciation and impairments. Costs incurred in the preliminary project stage to develop or acquire internal use software or websites are expensed as incurred. Upon completion of
the preliminary project stage and management authorization of the project, costs to acquire or develop internal use software, which primarily include coding, designing and developing system interfaces, installation and testing, are capitalized if it
is probable the project will be completed and the software will be used for its intended function. Costs incurred after implementation, such as maintenance and training, are expensed as incurred.
Depreciation is computed using the straight-line method over estimated useful lives as follows:
|
|
|
| Buildings and improvements |
|
35 to 45 years |
| Leasehold improvements |
|
Term of lease or useful life |
| Program production equipment |
|
3 to 15 years |
| Office and other equipment |
|
3 to 10 years |
| Computer hardware and software |
|
3 to 5 years |
F-28
Programs and Program Licenses — Programming is either produced by us or for us by
independent production companies or licensed under agreements with independent producers.
Costs of programs produced include
capitalizable direct costs, production overhead, development costs and acquired production costs. Production costs for programs produced are capitalized. Costs to produce live programming that are not expected to be rebroadcast are expensed as
incurred. Program licenses generally have fixed terms, limit the number of times we can air the programs and require payments over the terms of the licenses. Licensed program assets and liabilities are recorded when programs become available for
broadcast. Program licenses are not discounted for imputed interest. Program assets are amortized over the estimated useful lives of the programs based upon future cash flows and are included within cost of services in the consolidated statements of
operations. The amortization of program assets generally results in an accelerated method over the estimated useful lives.
Estimated future cash flows can change based upon market acceptance, advertising and network affiliate fee rates, the number of
subscribers receiving our networks and program usage. Accordingly, we periodically review revenue estimates and planned usage and revise our assumptions if necessary. If actual demand or market conditions are less favorable than projected, a
write-down to fair value may be required. Development costs for programs that we have determined will not be produced are written off.
The portion of the unamortized balance expected to be amortized within one year is classified as a current asset within programs and program licenses on the consolidated balance sheets.
Program rights liabilities payable within the next twelve months are classified as a current liability within program rights payable on
the consolidated balance sheets. Noncurrent program rights liabilities are included within other noncurrent liabilities on the consolidated balance sheets. The carrying value of our program rights liabilities approximate fair value.
Goodwill — Goodwill represents the cost of acquisitions in excess of the fair value of the acquired businesses’ tangible assets
and separately identifiable intangible assets acquired. Goodwill is not amortized
but is reviewed for impairment at least annually at the reporting unit level. We perform our annual impairment review during the fourth quarter. A reporting unit is defined as operating segments
or groupings of businesses one level below the operating segment level. As of December 31, 2014, our reporting units for purposes of performing the impairment test for goodwill are lifestyle media, our international businesses conducting
business in EMEA, and our international businesses conducting business in APAC.
Finite-Lived Intangible Assets —
Finite-lived intangible assets consist mainly of the value assigned to acquired network distribution relationships, customer lists trade names and other acquired rights.
Network distribution intangible assets represent the value assigned to acquired programming services’ relationships with cable and satellite television systems and telecommunication service providers
that distribute its programs. These relationships and distribution provide the opportunity to deliver advertising to viewers. We amortize these contractual relationships on a straight-line basis over the terms of the distribution contracts and
expected renewal periods, which approximate 20 years.
Customer lists, trade names and other intangible assets are
amortized in relation to their expected future cash flows over estimated useful lives of up to 20 years.
Impairment of Long-Lived
Assets — Long-lived assets, primarily property and equipment and finite-lived intangible assets, are reviewed for impairment whenever events or circumstances indicate the carrying amounts of the assets may not be recoverable.
Recoverability for long-lived assets is determined by comparing the forecasted undiscounted cash flows of the operation to which the assets relate to the carrying amount of the assets. If the undiscounted cash flows are less than the carrying amount
of the assets, then we write down the carrying value of the assets to estimated fair values, which are primarily based upon forecasted discounted cash flows. Fair value of long-lived assets is determined based on a combination of discounted cash
flows and market multiples.
Income Taxes — Some of our consolidated subsidiary companies are general partnerships and
F-29
limited liability companies, which are treated as partnerships for tax purposes. Income taxes on partnership income and losses accrue to the individual partners. Accordingly, our consolidated
financial statements do not include a provision for income taxes on the noncontrolling partners’ share of those consolidated subsidiary companies’ income.
No provision has been made for U.S. or foreign income taxes that could result from future remittances of undistributed earnings of our foreign subsidiaries that management intends to indefinitely reinvest
outside the United States.
Deferred income taxes are provided for temporary differences between the tax basis and reported
amounts of assets and liabilities that will result in taxable or deductible amounts in future years. Our temporary differences primarily result from accelerated depreciation and amortization for tax purposes, investment gains and losses not yet
recognized for tax purposes and accrued expenses not deductible for tax purposes until paid. A valuation allowance is provided if it is more likely than not that some or all of the deferred tax assets will not be realized.
We report a liability for unrecognized tax benefits resulting from uncertain tax positions taken, or expected to be taken, on a tax
return. Interest and penalties associated with such tax positions are included in the tax provision. The liability for additional taxes and interest is included within other liabilities on the consolidated balance sheets.
Revenue Recognition — Revenue is recognized when persuasive evidence of a sales arrangement exists, delivery occurs or services are
rendered, the sales price is fixed or determinable and collectability is reasonably assured. Revenue is reported net of our remittance of sales taxes, value added taxes and other taxes collected from our customers.
Our primary sources of revenue are from:
| |
• |
|
The sale of television and internet advertising. |
| |
• |
|
Fees for programming services (“network affiliate fees”). |
Revenue recognition policies for each source of revenue are described below.
Advertising — Advertising revenue is recognized, net of agency commissions, when
advertisements are displayed. Internet advertising includes (i) fixed duration campaigns whereby a banner, text or other advertisement appears for a specified period of time for a fee; (ii) impression-based campaigns where the fee is based
upon the number of times an advertisement appears in web pages viewed by a user; and (iii) click-through based campaigns where the fee is based upon the number of users who click on an advertisement and are directed to the advertiser’s
website. Advertising revenue from fixed duration campaigns are recognized over the period in which the advertising appears. Internet advertising revenue that is based upon the number of impressions delivered or the number of click-throughs achieved
is recognized as impressions are delivered or click-throughs occur.
Advertising contracts may guarantee the advertiser a
minimum audience for the programs in which their advertisements are broadcast over the term of the advertising contracts. We provide the advertiser with additional advertising time if we do not deliver the guaranteed audience size. If we determine
we have not delivered the guaranteed audience, an accrual for “make-good” advertisements is recorded as a reduction of revenue. The estimated make-good accrual is adjusted throughout the term of the advertising contracts.
Network Affiliate Fees — Cable and satellite television systems and telecommunication service providers generally pay a per-subscriber
fee (“network affiliate fees”) for the right to distribute our programming under the terms of multi-year distribution contracts. Network affiliate fees are reported net of volume discounts earned by the distributors and incentive costs
offered to system operators in exchange for initial multi-year distribution contracts. We recognize network affiliate fees as revenue over the term of the contracts, including any free periods. Network launch incentives are capitalized as assets
upon launch of our programming on the cable or satellite television system and amortized against network affiliate fees based upon the ratio of each period’s revenue to expected total revenue over the term of the contracts.
Network affiliate fees due to us, net of applicable discounts, are reported to us by cable and satellite television systems. Such
information is generally not received until after the close of the
F-30
reporting period. Therefore, reported network affiliate fee revenues are based upon our estimates of the number of subscribers receiving our programming and the amount of volume-based discounts
each cable and satellite television provider and telecommunication provider is entitled to receive. We subsequently adjust these estimated amounts based upon the actual amounts of network affiliate fees received. Such adjustments have not been
significant.
Revenues associated with digital distribution arrangements are recognized when we transfer control and the
rights to distribute the content to a customer.
Costs of Services — Cost of services reflects the cost of providing our
broadcast signal, programming and other content to respective distribution platforms. The costs captured within the cost of services caption include programming, satellite transmission fees, production and operations and other direct costs.
Marketing and Advertising Costs — Marketing and advertising costs, which totaled $160 million in 2014, $144 million in
2013 and $143 million in 2012 and are reported within the selling, general and administrative caption in the consolidated statements of operations, include costs incurred to promote our businesses and to attract traffic to our websites. Advertising
production costs are deferred and expensed the first time the advertisement is shown. Other marketing and advertising costs are expensed as incurred.
Stock-Based Compensation — We have a Long-Term Incentive Plan (the “LTI Plan”) which is described more fully in Note 21 -Capital Stock and Stock Compensation Plans. The LTI
Plan provides for long-term performance compensation for key employees and members of the Board of Directors (the “Board”). A variety of discretionary awards for employees and non-employee directors are authorized under the LTI Plan,
including incentive or non-qualified stock options, stock appreciation rights, restricted or nonrestricted stock units and performance awards.
Compensation cost is based on the grant-date fair value of the award. The fair value of awards that grant the employee the right to the appreciation of the underlying shares, such as stock options, are
measured using a binomial lattice model. A Monte Carlo simulation model is used to determine the fair
value of awards with market conditions. The fair value of awards that grant the employee the underlying shares are measured by the fair value of a Class A Common share.
Certain awards of Class A Common shares have performance and service conditions under which the number of shares granted is
determined by the extent to which such conditions are met (“Performance Shares”). Compensation costs for such awards are measured by the grant-date fair value of a Class A Common share and the number of shares earned. In periods prior
to completion of the performance period, compensation costs are based upon estimates of the number of shares that will be earned. Compensation costs related to Performance Shares with a market-based condition are recognized regardless of whether the
market condition is satisfied, provided the requisite service has been provided.
Compensation costs attributed to
nonqualified stock options, net of estimated forfeitures due to termination of employment, are recognized on a straight-line basis over the requisite service period of the award. The requisite service period is generally the vesting period stated in
the award. Compensation costs attributed to stock units, net of estimated forfeitures due to termination of employment or failure to meet performance targets, are recognized according to the graded vesting over the requisite service period. A
significant portion of our stock-based grants also vest upon the retirement of the employee. For these awards, grants to retirement-eligible employees are expensed immediately and grants to employees who will become retirement eligible prior to the
end of the stated vesting period are expensed over such shorter period.
Net Income Per Share — The computation of basic
earnings per share (“EPS”) is calculated by dividing earnings available to common shareholders by the weighted average number of common shares outstanding, including participating securities outstanding. Diluted EPS is similar to basic
EPS, but adjusts for the effect of the potential issuance of common shares. We include all unvested stock awards that contain non-forfeitable rights to dividends or dividend equivalents, whether paid or unpaid, in the number of shares outstanding in
our basic and diluted EPS.
F-31
The following table presents information about basic and diluted weighted average shares outstanding:
|
|
|
|
|
|
|
|
|
|
|
|
|
| |
|
For the years ended
December 31, |
|
| (in thousands) |
|
2014 |
|
|
2013 |
|
|
2012 |
|
| Basic weighted average shares outstanding |
|
|
141,297 |
|
|
|
147,326 |
|
|
|
152,180 |
|
| Effect of dilutive securities: |
|
|
|
|
|
|
|
|
|
|
|
|
| Unvested performance share awards and share units held by employees |
|
|
228 |
|
|
|
274 |
|
|
|
145 |
|
| Stock options held by employees and directors |
|
|
668 |
|
|
|
902 |
|
|
|
1,002 |
|
|
|
|
|
|
|
|
|
|
|
|
|
|
| Diluted weighted average shares outstanding |
|
|
142,193 |
|
|
|
148,502 |
|
|
|
153,327 |
|
|
|
|
|
|
|
|
|
|
|
|
|
|
| Anti-dilutive share awards |
|
|
298 |
|
|
|
129 |
|
|
|
618 |
|
|
|
|
|
|
|
|
|
|
|
|
|
|
3. ACCOUNTING STANDARDS UPDATES AND RECENTLY ISSUED ACCOUNTING STANDARDS UPDATES
In May 2014, the FASB issued ASC 606, Revenue from Contracts with Customers, which requires an entity to recognize the amount of revenue to which
it expects to be entitled for the transfer of promised goods or services to customers. The ASC will replace most existing revenue recognition guidance in U.S. GAAP when it becomes effective. The new ASC is effective for us on January 1, 2017.
Early application is not permitted. The ASC permits the use of either the retrospective or cumulative effect transition method. We are currently evaluating the new guidance to determine the impact it will have on our consolidated financial
statements and related disclosures.
4. ACQUISITIONS
Asian Food Channel — On April 12, 2013, we acquired the Asian Food Channel (“AFC”) for consideration of approximately $66 million. Assets acquired in the transaction
included approximately $1.2 million of cash. AFC, which is based in Singapore, is an independent company which broadcasts 24 hours a day, seven days a week and reaches about 8 million subscribers in 11 markets.
Travel Channel International — On April 30, 2012, we acquired Travel Channel International, Ltd. (“TCI”) for
consideration of approximately $115
million, including approximately $7.6 million released from escrow in 2013. Assets acquired in the transaction included approximately $7.6 million of cash. TCI is an independent company
headquartered in the UK that is broadcast in 21 languages across EMEA and APAC.
The following table summarizes the fair value
of the assets acquired and liabilities assumed as of the dates of the AFC and TCI acquisitions. The allocation of the purchase price for the AFC and TCI acquisitions reflect final values assigned and may differ from preliminary values reported in
the consolidated financial statements for prior periods.
|
|
|
|
|
|
|
|
|
| (in thousands) |
|
AFC |
|
|
TCI |
|
| Accounts receivable |
|
$ |
1,960 |
|
|
$ |
6,545 |
|
| Other current assets |
|
|
271 |
|
|
|
1,406 |
|
| Programs and program licenses |
|
|
4,794 |
|
|
|
9,164 |
|
| Property and equipment |
|
|
399 |
|
|
|
475 |
|
| Amortizable intangible assets |
|
|
24,600 |
|
|
|
59,977 |
|
| Other assets |
|
|
160 |
|
|
|
|
|
| Current liabilities |
|
|
(1,941 |
) |
|
|
(4,456 |
) |
| Deferred income taxes |
|
|
(4,413 |
) |
|
|
(15,243 |
) |
|
|
|
|
|
|
|
|
|
| Total identifiable net assets |
|
$ |
25,830 |
|
|
$ |
57,868 |
|
| Goodwill |
|
|
38,582 |
|
|
|
49,173 |
|
|
|
|
|
|
|
|
|
|
| Net purchase price |
|
$ |
64,412 |
|
|
$ |
107,041 |
|
|
|
|
|
|
|
|
|
|
The goodwill arising from the AFC and TCI acquisitions reflect the economic potential of the markets in
which the acquired companies operate as well as the synergies and economies of scale expected from operating both businesses as part of SNI. The goodwill recorded as part of these acquisitions is not amortizable for tax purposes.
AFC contributed operating revenues of $6.8 million and a net loss of $5.6 million to SNI’s operating results in 2013. TCI
contributed operating revenues of $16.7 million and net income of $1.3 million to SNI’s operating results in 2012.
RealGravity, Inc. — In January 2012, we acquired RealGravity, Inc. RealGravity is a California-based company that
specializes in online video publishing technologies. The purchase price, which comprised both cash of $20 million and contingent consideration, was allocated based upon
F-32
the fair values of assets acquired and liabilities assumed as of the date of acquisition. We allocated $19.7 million of the purchase price to goodwill. The contingent consideration payable was
estimated using probability-weighted discounted cash flow models and was valued at $8.3 million on the date of acquisition.
Pro forma results are not presented for these acquisitions completed during 2013 or 2012 because the consolidated results of operations
would not be significantly different from reported amounts. Financial information for the AFC and TCI businesses are reported within our corporate and other segment caption, and RealGravity is reported within the lifestyle media segment.
5. EMPLOYEE AND CONTRACT TERMINATION COSTS
Voluntary Early Retirement Program and Employee Termination Costs — During the fourth quarter of 2014, we provided qualified employees with voluntary early retirement packages and notified
employees of the elimination of certain positions within the Company. We also announced that the Company will be closing its Cincinnati, OH office location later in 2015 and will be relocating certain employees to our Knoxville, TN headquarters. Our
2014 operating results include a $14.4 million charge for severance, retention and related retirement benefit costs that were incurred as a result of these programs, and net income attributable to SNI was reduced by $8.9 million.
A summary of these 2014 charges by segment were as follows:
|
|
|
|
|
|
|
|
|
|
|
|
|
| (in thousands) |
|
Lifestyle
media |
|
|
Corporate
and other |
|
|
Total |
|
| Costs of services, excluding depreciation and amortization of intangible assets |
|
$ |
3,872 |
|
|
|
|
|
|
$ |
3,872 |
|
| Selling, general and administrative |
|
|
8,169 |
|
|
$ |
2,311 |
|
|
|
10,480 |
|
|
|
|
|
|
|
|
|
|
|
|
|
|
| Total |
|
$ |
12,041 |
|
|
$ |
2,311 |
|
|
$ |
14,352 |
|
|
|
|
|
|
|
|
|
|
|
|
|
|
At December 31, 2014, our consolidated balance sheets include accrued liabilities of $14.1 million
related to the costs incurred for these programs.
Contract Termination Costs — During the second quarter of 2014, we reached an agreement to
terminate the master services agreement and sales agency agreement related to services provided for our Food Network and Fine Living operations in EMEA. We also entered into an arrangement that establishes a transition plan for us to assume the
activities associated with these provided services. Selling, general and administrative expenses include a $9.7 million charge for the early termination of these agreements.
6. INCOME TAXES
We file a consolidated U.S. federal income tax return, unitary tax returns
in certain states and separate income tax returns for certain of our subsidiary companies in other states as well as foreign jurisdictions. Included in our federal and state income tax returns is our proportionate share of the taxable income or loss
of partnerships and limited liability companies that are treated as partnerships for tax purposes (“pass-through entities”). Our consolidated financial statements do not include any provision for income taxes on the income of pass-through
entities attributed to the noncontrolling interests.
Food Network and Cooking Channel are operated under the terms of a
general partnership (“Partnership”) agreement. The Travel Channel is a limited liability company and treated as a partnership for tax purposes.
F-33
The provision for income taxes consisted of the following:
|
|
|
|
|
|
|
|
|
|
|
|
|
| (in thousands) |
|
For the years ended
December 31, |
|
| |
2014 |
|
|
2013 |
|
|
2012 |
|
| Current: |
|
|
|
|
|
|
|
|
|
|
|
|
| Federal |
|
$ |
257,939 |
|
|
$ |
177,150 |
|
|
$ |
302,425 |
|
| Tax benefits from NOLs |
|
|
(245 |
) |
|
|
(245 |
) |
|
|
(224 |
) |
|
|
|
|
|
|
|
|
|
|
|
|
|
| Federal, net |
|
|
257,694 |
|
|
|
176,905 |
|
|
|
302,201 |
|
|
|
|
|
|
|
|
|
|
|
|
|
|
| State and local |
|
|
30,526 |
|
|
|
37,272 |
|
|
|
54,371 |
|
| Tax benefits from NOLs |
|
|
(357 |
) |
|
|
(8 |
) |
|
|
(155 |
) |
|
|
|
|
|
|
|
|
|
|
|
|
|
| State and local, net |
|
|
30,169 |
|
|
|
37,264 |
|
|
|
54,216 |
|
|
|
|
|
|
|
|
|
|
|
|
|
|
| Foreign |
|
|
2,038 |
|
|
|
517 |
|
|
|
3,135 |
|
|
|
|
|
|
|
|
|
|
|
|
|
|
| Total |
|
|
289,901 |
|
|
|
214,686 |
|
|
|
359,552 |
|
| Tax benefits of compensation plans allocated to additional paid-in capital |
|
|
12,339 |
|
|
|
4,889 |
|
|
|
12,826 |
|
|
|
|
|
|
|
|
|
|
|
|
|
|
| Total current income tax provision |
|
|
302,240 |
|
|
|
219,575 |
|
|
|
372,378 |
|
|
|
|
|
|
|
|
|
|
|
|
|
|
| Deferred: |
|
|
|
|
|
|
|
|
|
|
|
|
| Federal |
|
|
(4,617 |
) |
|
|
94,041 |
|
|
|
(272,023 |
) |
| Other |
|
|
(2,636 |
) |
|
|
4,881 |
|
|
|
(18,308 |
) |
|
|
|
|
|
|
|
|
|
|
|
|
|
| Total |
|
|
(7,253 |
) |
|
|
98,922 |
|
|
|
(290,331 |
) |
| Deferred tax allocated to other comprehensive income |
|
|
6,056 |
|
|
|
(10,874 |
) |
|
|
6,060 |
|
|
|
|
|
|
|
|
|
|
|
|
|
|
| Total deferred income tax (benefit) provision |
|
|
(1,197 |
) |
|
|
88,048 |
|
|
|
(284,271 |
) |
|
|
|
|
|
|
|
|
|
|
|
|
|
| Provision for income taxes |
|
$ |
301,043 |
|
|
$ |
307,623 |
|
|
$ |
88,107 |
|
|
|
|
|
|
|
|
|
|
|
|
|
|
Our tax provision in the fourth quarter of 2012 reflects an income tax benefit of $213 million arising
from the reversal of valuation allowances on deferred tax assets related to capital loss carry forwards. Previously, the Company had estimated that it would be unable to use any of the capital loss carry forwards generated from the sales of the
Shopzilla and uSwitch businesses. As a consequence of a restructuring that was completed to achieve a more efficient tax structure, the Company recognized a $574 million capital gain that utilized substantially all of its capital loss carry
forwards. As the capital losses are not available in states in which the Company does not file unitary income tax returns, state tax expenses totaling $23.1 million were also recognized.
The difference between the statutory rate for federal income tax and the effective income
tax rate was as follows:
|
|
|
|
|
|
|
|
|
|
|
|
|
| |
|
For the years ended
December 31, |
|
| |
|
2014 |
|
|
2013 |
|
|
2012 |
|
| U.S. federal statutory income tax rate |
|
|
35.0 |
% |
|
|
35.0 |
% |
|
|
35.0 |
% |
| Effect of: |
|
|
|
|
|
|
|
|
|
|
|
|
| U.S. state and local income taxes, net of federal income tax benefit |
|
|
2.2 |
|
|
|
2.2 |
|
|
|
3.3 |
|
| Income of pass-through entities allocated to noncontrolling interests |
|
|
(6.2 |
) |
|
|
(6.3 |
) |
|
|
(6.1 |
) |
| Section 199 — Domestic Production Activities deduction |
|
|
(2.3 |
) |
|
|
(2.4 |
) |
|
|
(2.8 |
) |
| Release of valuation allowance |
|
|
(0.2 |
) |
|
|
|
|
|
|
(22.7 |
) |
| Miscellaneous |
|
|
0.8 |
|
|
|
2.6 |
|
|
|
2.7 |
|
|
|
|
|
|
|
|
|
|
|
|
|
|
| Effective income tax rate |
|
|
29.3 |
% |
|
|
31.1 |
% |
|
|
9.4 |
% |
|
|
|
|
|
|
|
|
|
|
|
|
|
F-34
The approximate effect of the temporary differences giving rise to deferred income tax (assets) liabilities
were as follows:
|
|
|
|
|
|
|
|
|
| |
|
As of December 31, |
|
| (in thousands) |
|
2014 |
|
|
2013 |
|
| Deferred tax assets: |
|
|
|
|
|
|
|
|
| Accrued expenses not deductible until paid |
|
$ |
(13,200 |
) |
|
$ |
(13,625 |
) |
| Deferred compensation and retiree benefits not deductible until paid |
|
|
(73,150 |
) |
|
|
(63,305 |
) |
| Tax basis capital loss and credit carryforwards |
|
|
(6,867 |
) |
|
|
(9,331 |
) |
| State and foreign net operating loss carryforwards |
|
|
(33,745 |
) |
|
|
(23,345 |
) |
| Investments, primarily gains and losses not yet recognized for tax purposes |
|
|
(96,387 |
) |
|
|
(114,347 |
) |
| Other temporary differences, net |
|
|
(10,110 |
) |
|
|
(7,054 |
) |
|
|
|
|
|
|
|
|
|
|
|
|
(233,459 |
) |
|
|
(231,007 |
) |
|
|
|
|
|
|
|
|
|
| Deferred tax liabilities: |
|
|
|
|
|
|
|
|
| Property and equipment, and intangible assets |
|
|
48,922 |
|
|
|
53,244 |
|
| Programs and program licenses |
|
|
64,765 |
|
|
|
66,776 |
|
|
|
|
|
|
|
|
|
|
|
|
|
113,687 |
|
|
|
120,020 |
|
|
|
|
|
|
|
|
|
|
| Valuation allowance for deferred tax assets |
|
|
40,676 |
|
|
|
30,772 |
|
|
|
|
|
|
|
|
|
|
| Net deferred tax asset |
|
$ |
(79,096 |
) |
|
$ |
(80,215 |
) |
|
|
|
|
|
|
|
|
|
As of December 31, 2014, there were $174.8 million of net operating loss carry forwards in various
state and foreign jurisdictions. The foreign losses have an indefinite carry forward period and the state loss carry forwards expire between 2016 and 2034. Substantially all of the deferred tax assets for the foreign and state loss carry forwards
have been reduced by a valuation allowance of $33.8 million, as it is more likely than not that these loss carry forwards will not be realized.
At December 31, 2014, capital losses available to the Company totaled $18.8 million. Substantially all of these capital losses expire in 2016, and
the Company does not anticipate any capital gains in the remaining carry forward periods. Accordingly, a valuation allowance of $6.9 million has been recorded on the deferred tax asset for the losses, as it is more likely than not that the capital
losses will not be utilized.
No provision has been made for United States federal and state income taxes or
international income taxes that may result from future remittances of the undistributed earnings of foreign subsidiaries that are determined to be indefinitely reinvested ($75.2 million at December 31, 2014). Determination of the amount of any
unrecognized deferred income tax liability on these is not practicable.
A reconciliation of the beginning and ending balances
of the total amounts of gross unrecognized tax benefits is as follows:
|
|
|
|
|
|
|
|
|
|
|
|
|
| (in thousands) |
|
2014 |
|
|
2013 |
|
|
2012 |
|
| Gross unrecognized tax benefits — beginning of year |
|
$ |
109,462 |
|
|
$ |
94,219 |
|
|
$ |
69,396 |
|
| Increases in tax positions for prior years |
|
|
2,169 |
|
|
|
20,931 |
|
|
|
627 |
|
| Decreases in tax positions for prior years |
|
|
(11,254 |
) |
|
|
(6,020 |
) |
|
|
(4,340 |
) |
| Increases in tax positions for current year |
|
|
15,149 |
|
|
|
13,709 |
|
|
|
42,881 |
|
| Lapse in statute of limitations |
|
|
(19,360 |
) |
|
|
(13,377 |
) |
|
|
(14,345 |
) |
|
|
|
|
|
|
|
|
|
|
|
|
|
| Gross unrecognized tax benefits — end of year |
|
$ |
96,166 |
|
|
$ |
109,462 |
|
|
$ |
94,219 |
|
|
|
|
|
|
|
|
|
|
|
|
|
|
The total amount of net unrecognized tax benefits, that if recognized, would affect the effective tax rate, totaled $62.8
million at December 31, 2014, $65.4 million at December 31, 2013 and $59.3 million at December 31, 2012. We accrue interest and penalties related to unrecognized tax benefits in our provision for income taxes. Related to the
amounts above, we recognized interest expense of $0.5 million in 2014, $2.8 million in 2013 and $0.3 million in 2012. Included in the balance of unrecognized tax benefits at December 31, 2014, December 31, 2013 and December 31,
2012, respectively, was $10.9 million, $10.2 million and $5.9 million of liabilities for interest.
We file income tax returns
in the U.S. and in various state, local and foreign jurisdictions. We are routinely examined by tax authorities in these jurisdictions. As of December 31, 2014, we had been examined by the Internal Revenue Service (“IRS”) through
calendar year 2012. In addition, there are state examinations currently in progress. It is possible that these examinations may be resolved within
F-35
twelve months. Due to the potential for resolution of these examinations and the expiration of various statutes of limitation, it is reasonably possible that our gross unrecognized tax benefits
balance may decrease within the next twelve months by a range of zero to $21.4 million.
Our tax years for 2010 and forward
are subject to examination by state, local or foreign tax authorities. With a few exceptions, the Company is no longer subject to examinations by these tax authorities for years prior to 2010.
7. INVESTMENTS
Investments consisted of
the following:
|
|
|
|
|
|
|
|
|
| |
|
As of December 31, |
|
| (in thousands) |
|
2014 |
|
|
2013 |
|
| Equity-method investments |
|
$ |
431,612 |
|
|
$ |
473,018 |
|
| Cost-method investments |
|
|
31,732 |
|
|
|
15,180 |
|
|
|
|
|
|
|
|
|
|
| Total investments |
|
$ |
463,344 |
|
|
$ |
488,198 |
|
|
|
|
|
|
|
|
|
|
Equity-Method Investments — At December 31, 2014, investments accounted for using the equity
method included the Company’s investments in UKTV (50% owned), HGTV Canada (33% owned), Food Canada (29% owned), Fox-BRV Southern Sports Holdings (7.25% owned), Food Network Magazine JV (50% owned) and HGTV Magazine JV (50% owned).
UKTV receives financing through loans provided by us. These loans, totaling $116 million at December 31, 2014 and $122 million at
December 31, 2013 and reported within other non-current assets on our consolidated balance sheets, effectively act as a revolving credit facility for UKTV. As a result of this financing arrangement and the level of equity investment at risk, we
have determined that UKTV is a variable interest entity (“VIE”). SNI and its partner in the venture share equally in the profits of the entity, have equal representation on UKTV’s board of directors and share voting control in such
matters as approving annual budgets, initiating financing arrangements and changing the scope of the business. However, our partner maintains control over certain operational aspects of the business related to programming content, scheduling and the
editorial and creative
development of UKTV. Additionally, certain key management personnel of UKTV are employees of our partner. Since we do not control these activities that are critical to UKTV’s operating
performance, we have determined that we are not the primary beneficiary of the entity and account for the investment under the equity method of accounting. As of December 31, 2014 and December 31, 2013, the Company’s investment in
UKTV was $377 million and $413 million, respectively.
Aggregated statements of operations data for investments accounted for
using the equity method of accounting is as follows:
|
|
|
|
|
|
|
|
|
|
|
|
|
| (in thousands) |
|
For the years ended December 31, |
|
| |
|
2014 |
|
|
2013 |
|
|
2012 |
|
| Operating revenues |
|
$ |
1,333,239 |
|
|
$ |
1,263,231 |
|
|
$ |
1,160,391 |
|
| Operating income |
|
|
708,958 |
|
|
|
666,227 |
|
|
|
587,787 |
|
| Net income |
|
|
522,435 |
|
|
|
483,143 |
|
|
|
427,445 |
|
|
|
|
|
|
|
|
|
|
|
|
|
|
A portion of the purchase price from our 50% investment in UKTV was attributed to amortizable intangible assets, which
are included in the carrying value of our UKTV investment. Amortization recorded on these intangibles assets reduces our equity in earnings recognized from the UKTV investment. Estimated amortization that will reduce UKTV’s equity in earnings
for each of the next five years is expected to be approximately $17.6 million in 2015 and $15.3 million in 2016, 2017, 2018 and 2019.
Aggregated balance sheet information for investments accounted for using the equity method of accounting is as follows:
|
|
|
|
|
|
|
|
|
| |
|
As of December 31, |
|
| (in thousands) |
|
2014 |
|
|
2013 |
|
| Current assets |
|
$ |
586,287 |
|
|
$ |
608,690 |
|
| Non-current assets |
|
|
105,630 |
|
|
|
108,795 |
|
|
|
|
|
|
|
|
|
|
| Total Assets |
|
$ |
691,917 |
|
|
$ |
717,485 |
|
|
|
|
|
|
|
|
|
|
| Current liabilities |
|
$ |
224,459 |
|
|
$ |
165,430 |
|
| Non-current liabilities |
|
|
136,321 |
|
|
|
210,057 |
|
| Equity |
|
|
331,137 |
|
|
|
341,998 |
|
|
|
|
|
|
|
|
|
|
| Total Liabilities and Equity |
|
$ |
691,917 |
|
|
$ |
717,485 |
|
|
|
|
|
|
|
|
|
|
F-36
Investment Writedowns — We regularly review our investments to determine if there have
been any other-than-temporary declines in value. These reviews require management judgments that often include estimating the outcome of future events and determining whether factors exist that indicate impairment has occurred. We evaluate, among
other factors, the extent to which the investment’s carrying value exceeds fair value, the duration of the decline in fair value below carrying value and the current cash position, earnings and cash forecasts and near term prospects of the
investee. No writedowns were recognized on our investments in 2014 or 2013. During 2012, we recorded a $5.9 million write-down to reduce the carrying value of an investment to its estimated fair value.
8. FAIR VALUE MEASUREMENT
Fair value is
an exit price, representing the amount that would be received to sell an asset or paid to transfer a liability in an orderly transaction between market participants at the measurement date. Financial assets and liabilities carried at fair value are
classified in one of the three categories which are described below:
| |
• |
|
Level 1 — Quoted prices in active markets for identical assets or liabilities. |
| |
• |
|
Level 2 — Inputs, other than quoted market prices in active markets, that are observable either directly or indirectly.
|
| |
• |
|
Level 3 — Unobservable inputs based on our own assumptions. |
There have been no transfers of assets or liabilities between the fair value measurement classifications during the year ended
December 31, 2014. The following table sets forth our assets and liabilities that are measured at fair value on a recurring basis at December 31, 2014:
|
|
|
|
|
|
|
|
|
|
|
|
|
|
|
|
|
| (in thousands) |
|
Total |
|
|
Level 1 |
|
|
Level 2 |
|
|
Level 3 |
|
| Assets: |
|
|
|
|
|
|
|
|
|
|
|
|
|
|
|
|
| Cash equivalents |
|
$ |
738,090 |
|
|
$ |
738,090 |
|
|
|
|
|
|
|
|
|
| Derivative asset |
|
|
86 |
|
|
|
|
|
|
$ |
86 |
|
|
|
|
|
|
|
|
|
|
|
|
|
|
|
|
|
|
|
|
|
|
| Total assets |
|
$ |
738,176 |
|
|
$ |
738,090 |
|
|
$ |
86 |
|
|
|
|
|
|
|
|
|
|
|
|
|
|
|
|
|
|
|
|
|
|
| Temporary equity- |
|
|
|
|
|
|
|
|
|
|
|
|
|
|
|
|
| Redeemable noncontrolling interest |
|
$ |
96,251 |
|
|
$ |
|
|
|
$ |
|
|
|
$ |
96,251 |
|
|
|
|
|
|
|
|
|
|
|
|
|
|
|
|
|
|
The following table sets forth our assets and liabilities that are measured at fair value on a recurring
basis at December 31, 2013:
|
|
|
|
|
|
|
|
|
|
|
|
|
|
|
|
|
| (in thousands) |
|
Total |
|
|
Level 1 |
|
|
Level 2 |
|
|
Level 3 |
|
| Assets: |
|
|
|
|
|
|
|
|
|
|
|
|
|
|
|
|
| Cash equivalents |
|
$ |
408,142 |
|
|
$ |
408,142 |
|
|
|
|
|
|
|
|
|
| Derivative asset |
|
|
252 |
|
|
|
|
|
|
$ |
252 |
|
|
|
|
|
|
|
|
|
|
|
|
|
|
|
|
|
|
|
|
|
|
| Total assets |
|
$ |
408,394 |
|
|
$ |
408,142 |
|
|
$ |
252 |
|
|
|
|
|
|
|
|
|
|
|
|
|
|
|
|
|
|
|
|
|
|
| Temporary equity- |
|
|
|
|
|
|
|
|
|
|
|
|
|
|
|
|
| Redeemable noncontrolling interest |
|
$ |
133,000 |
|
|
$ |
|
|
|
$ |
|
|
|
$ |
133,000 |
|
|
|
|
|
|
|
|
|
|
|
|
|
|
|
|
|
|
Derivatives include freestanding derivative forward contracts which are marked to market at each reporting period. We
classify our foreign currency forward contracts within Level 2 as the valuation inputs are based on quoted prices and market observable data of similar instruments.
We determine the fair value of the redeemable noncontrolling interest using a combination of a discounted cash flow valuation model and a market approach that applies revenues and EBITDA estimates against
the calculated multiples of comparable companies. Operating revenues and EBITDA are key assumptions utilized in both the discounted cash flow and market approach methods. The selected discount rate of approximately 11% is also a key assumption in
our discounted cash flow valuation model (refer to Note 16 — Redeemable Noncontrolling Interest and Noncontrolling Interest for additional information).
The following table summarizes the activity for account balances whose fair value measurements are estimated utilizing level 3 inputs:
|
|
|
|
|
|
|
|
|
| |
|
Redeemable
Noncontrolling Interest |
|
| |
|
As of December 31, |
|
| (in thousands) |
|
2014 |
|
|
2013 |
|
| Beginning period balance |
|
$ |
133,000 |
|
|
$ |
136,500 |
|
| Dividends paid to noncontrolling interest |
|
|
(27,563 |
) |
|
|
(6,370 |
) |
| Net income |
|
|
9,679 |
|
|
|
10,803 |
|
| Fair value adjustment |
|
|
(18,865 |
) |
|
|
(7,933 |
) |
|
|
|
|
|
|
|
|
|
| Ending period balance |
|
$ |
96,251 |
|
|
$ |
133,000 |
|
|
|
|
|
|
|
|
|
|
The net income amounts reflected in the table above are reported within net income attributable to noncontrolling
interests in our consolidated statements of operations.
F-37
Other Financial Instruments — The carrying values of our financial instruments do not
materially differ from their estimated fair values as of December 31, 2014 and December 31, 2013 except for debt, which is disclosed in Note 13 – Debt.
Non-Recurring Measurements — The majority of the Company’s non-financial instruments, which include goodwill and other intangible assets and property and equipment, are not
required to be carried at fair value on a recurring basis. However, if certain triggering events occur (or at least annually for goodwill) such that a non-financial instrument is required to be evaluated for impairment, a resulting asset impairment
would require that the nonfinancial instrument be recorded at the lower of cost or its fair value.
9. PROPERTY AND EQUIPMENT
Property and equipment consisted of the following:
|
|
|
|
|
|
|
|
|
| |
|
As of December 31, |
|
| (in thousands) |
|
2014 |
|
|
2013 |
|
| Land and improvements |
|
$ |
12,857 |
|
|
$ |
12,809 |
|
| Buildings and improvements |
|
|
155,736 |
|
|
|
156,899 |
|
| Equipment |
|
|
127,221 |
|
|
|
117,109 |
|
| Computer software |
|
|
208,984 |
|
|
|
206,295 |
|
|
|
|
|
|
|
|
|
|
| Total |
|
|
504,798 |
|
|
|
493,112 |
|
| Accumulated depreciation |
|
|
278,552 |
|
|
|
246,762 |
|
|
|
|
|
|
|
|
|
|
| Property and equipment |
|
$ |
226,246 |
|
|
$ |
246,350 |
|
|
|
|
|
|
|
|
|
|
10. GOODWILL AND OTHER INTANGIBLE ASSETS
Goodwill and other intangible assets consisted of the following:
|
|
|
|
|
|
|
|
|
| |
|
As of December 31, |
|
| (in thousands) |
|
2014 |
|
|
2013 |
|
| Goodwill |
|
$ |
617,505 |
|
|
$ |
618,968 |
|
| Accumulated impairments |
|
|
(44,386 |
) |
|
|
(44,386 |
) |
|
|
|
|
|
|
|
|
|
| Goodwill, net |
|
|
573,119 |
|
|
|
574,582 |
|
|
|
|
|
|
|
|
|
|
| Other intangible assets: |
|
|
|
|
|
|
|
|
| Amortizable intangible assets: |
|
|
|
|
|
|
|
|
| Carrying amount: |
|
|
|
|
|
|
|
|
| Acquired network distribution rights |
|
|
586,687 |
|
|
|
590,460 |
|
| Customer lists |
|
|
94,669 |
|
|
|
94,868 |
|
| Copyrights and other trade names |
|
|
66,782 |
|
|
|
67,037 |
|
| Acquired rights and other |
|
|
120,227 |
|
|
|
120,227 |
|
|
|
|
|
|
|
|
|
|
| Total carrying amount |
|
|
868,365 |
|
|
|
872,592 |
|
|
|
|
|
|
|
|
|
|
| Accumulated amortization: |
|
|
|
|
|
|
|
|
| Acquired network distribution rights |
|
|
(157,847 |
) |
|
|
(128,038 |
) |
| Customer lists |
|
|
(71,870 |
) |
|
|
(57,281 |
) |
| Copyrights and other trade names |
|
|
(20,046 |
) |
|
|
(16,241 |
) |
| Acquired rights and other |
|
|
(22,721 |
) |
|
|
(16,023 |
) |
|
|
|
|
|
|
|
|
|
| Total accumulated amortization |
|
|
(272,484 |
) |
|
|
(217,583 |
) |
|
|
|
|
|
|
|
|
|
| Total other intangible assets, net |
|
|
595,881 |
|
|
|
655,009 |
|
|
|
|
|
|
|
|
|
|
| Total goodwill and other intangible assets, net |
|
$ |
1,169,000 |
|
|
$ |
1,229,591 |
|
|
|
|
|
|
|
|
|
|
F-38
Activity related to goodwill and amortizable intangible assets by segment was as follows:
|
|
|
|
|
|
|
|
|
|
|
|
|
| (in thousands) |
|
Lifestyle
media |
|
|
Corporate
and other |
|
|
Total |
|
| Goodwill: |
|
|
|
|
|
|
|
|
|
|
|
|
| Balance as of December 31, 2012 |
|
$ |
510,484 |
|
|
$ |
41,337 |
|
|
$ |
551,821 |
|
|
|
|
|
|
|
|
|
|
|
|
|
|
| Additions — business acquisitions |
|
|
|
|
|
|
46,156 |
|
|
|
46,156 |
|
| Impairment |
|
|
|
|
|
|
(24,723 |
) |
|
|
(24,723 |
) |
| Foreign currency translation adjustment |
|
|
|
|
|
|
1,328 |
|
|
|
1,328 |
|
|
|
|
|
|
|
|
|
|
|
|
|
|
| Balance as of December 31, 2013 |
|
|
510,484 |
|
|
|
64,098 |
|
|
|
574,582 |
|
| Foreign currency translation adjustment |
|
|
|
|
|
|
(1,463 |
) |
|
|
(1,463 |
) |
|
|
|
|
|
|
|
|
|
|
|
|
|
| Balance as of December 31, 2014 |
|
$ |
510,484 |
|
|
$ |
62,635 |
|
|
$ |
573,119 |
|
|
|
|
|
|
|
|
|
|
|
|
|
|
| Amortizable intangible assets: |
|
|
|
|
|
|
|
|
|
|
|
|
| Balance as of December 31, 2012 |
|
$ |
621,700 |
|
|
$ |
56,800 |
|
|
$ |
678,500 |
|
| Additions — business acquisitions |
|
|
|
|
|
|
24,600 |
|
|
|
24,600 |
|
| Addition of acquired network distribution rights |
|
|
|
|
|
|
5,516 |
|
|
|
5,516 |
|
| Addition of acquired rights and other |
|
|
|
|
|
|
37 |
|
|
|
37 |
|
| Foreign currency translation adjustment |
|
|
|
|
|
|
926 |
|
|
|
926 |
|
| Amortization |
|
|
(48,655 |
) |
|
|
(5,915 |
) |
|
|
(54,570 |
) |
|
|
|
|
|
|
|
|
|
|
|
|
|
| Balance as of December 31, 2013 |
|
|
573,045 |
|
|
|
81,964 |
|
|
|
655,009 |
|
| Foreign currency translation adjustment |
|
|
|
|
|
|
(3,525 |
) |
|
|
(3,525 |
) |
| Amortization |
|
|
(48,318 |
) |
|
|
(7,285 |
) |
|
|
(55,603 |
) |
|
|
|
|
|
|
|
|
|
|
|
|
|
| Balance as of December 31, 2014 |
|
$ |
524,727 |
|
|
$ |
71,154 |
|
|
$ |
595,881 |
|
|
|
|
|
|
|
|
|
|
|
|
|
|
Separately acquired intangible assets reflect the acquisition of certain rights that will expand our opportunity to earn
future revenues. Cash payments for these acquired rights totaled $10.9 million, $31.3 million and $38.0 million in 2014, 2013 and 2012, respectively, and are reported as an investing activity in other, net within our consolidated statements of cash
flows.
To determine the fair value of our reporting units, we used market data and discounted cash flow analyses. As the
primary determination of fair value is determined using a discounted cash flow model, the resulting fair value is considered a Level 3 measurement. As a result of our goodwill analysis in 2014, no impairment charges were recorded. In 2013, we
determined that the goodwill of TCI was impaired
and recorded a $24.7 million charge to write-down the goodwill to fair value, driven by delayed expansion into some of the growth markets identified for the business at acquisition. In 2012, we
recorded a $19.7 million goodwill impairment charge on our RealGravity business that was reflective of changes to RealGravity’s business model and the corresponding valuation impact that resulted from the business generating lower near term
operating results.
Amortization expense associated with intangible assets for each of the next five years is expected to be
$46.6 million in 2015, $45.5 million in 2016, $44.2 million in 2017, $44.2 million in 2018, $43.2 million in 2019 and $372.2 million in later years.
11. PROGRAMS AND PROGRAM LICENSES
Programs and program licenses consisted of the
following:
|
|
|
|
|
|
|
|
|
| |
|
As of December 31, |
|
| (in thousands) |
|
2014 |
|
|
2013 |
|
| Cost of programs available for broadcast |
|
$ |
2,253,574 |
|
|
$ |
2,006,419 |
|
| Accumulated amortization |
|
|
1,564,008 |
|
|
|
1,392,159 |
|
|
|
|
|
|
|
|
|
|
| Total |
|
|
689,566 |
|
|
|
614,260 |
|
| Progress payments on programs not yet available for broadcast |
|
|
257,092 |
|
|
|
222,746 |
|
|
|
|
|
|
|
|
|
|
| Total programs and program licenses |
|
$ |
946,658 |
|
|
$ |
837,006 |
|
|
|
|
|
|
|
|
|
|
In addition to the programs owned or licensed by us included in the table above, we have commitments to license certain
programming that is not yet available for broadcast. Such program licenses are recorded as assets when the programming is delivered to us and is available for broadcast. These contracts may require progress payments or deposits prior to the program
becoming available for broadcast. Remaining obligations under contracts to purchase or license programs not yet available for broadcast totaled approximately $244 million at December 31, 2014. If the programs are not produced, our commitment to
license the programs would generally expire without obligation.
F-39
Program and program license expense, which consists of program amortization and program
impairments, is included within cost of services in our consolidated statements of operations. Program impairments totaled $38.4 million in 2014, $32.0 million in 2013 and $17.2 million in 2012.
Estimated amortization of recorded program assets and program commitments for each of the next five years is as follows:
|
|
|
|
|
|
|
|
|
|
|
|
|
| (in thousands) |
|
Programs
Available for
Broadcast |
|
|
Programs Not
Yet Available
for Broadcast |
|
|
Total |
|
| 2015 |
|
$ |
390,034 |
|
|
$ |
174,327 |
|
|
$ |
564,361 |
|
| 2016 |
|
|
190,351 |
|
|
|
166,205 |
|
|
|
356,556 |
|
| 2017 |
|
|
85,071 |
|
|
|
88,753 |
|
|
|
173,824 |
|
| 2018 |
|
|
23,646 |
|
|
|
53,562 |
|
|
|
77,208 |
|
| 2019 |
|
|
464 |
|
|
|
17,572 |
|
|
|
18,036 |
|
| Later years |
|
|
|
|
|
|
367 |
|
|
|
367 |
|
|
|
|
|
|
|
|
|
|
|
|
|
|
| Total |
|
$ |
689,566 |
|
|
$ |
500,786 |
|
|
$ |
1,190,352 |
|
|
|
|
|
|
|
|
|
|
|
|
|
|
Actual amortization in each of the next five years will exceed the amounts presented above as our national television
networks will continue to produce and license additional programs.
12. OTHER ACCRUED CURRENT LIABILITIES
Other accrued current liabilities consisted of the following:
|
|
|
|
|
|
|
|
|
| |
|
As of December 31, |
|
| (in thousands) |
|
2014 |
|
|
2013 |
|
| Accrued rent |
|
$ |
18,290 |
|
|
$ |
17,584 |
|
| Accrued interest |
|
|
22,742 |
|
|
|
19,325 |
|
| Accrued expenses |
|
|
49,412 |
|
|
|
44,432 |
|
|
|
|
|
|
|
|
|
|
| Total |
|
$ |
90,444 |
|
|
$ |
81,341 |
|
|
|
|
|
|
|
|
|
|
The accrued expenses caption in the table above for 2014 and 2013 includes $11.0 million and $12.0 million, respectively,
of obligations recognized for the purchase of intangible assets.
13. DEBT
Debt consisted of the following:
|
|
|
|
|
|
|
|
|
| |
|
As of December 31, |
|
| (in thousands) |
|
2014 |
|
|
2013 |
|
| 3.55% senior notes due in 2015 |
|
$ |
884,994 |
|
|
$ |
884,844 |
|
| 2.70% senior notes due in 2016 |
|
|
499,766 |
|
|
|
499,644 |
|
| 2.75% senior notes due in 2019 |
|
|
498,269 |
|
|
|
|
|
| 3.90% senior notes due in 2024 |
|
|
496,376 |
|
|
|
|
|
|
|
|
|
|
|
|
|
|
| Total debt |
|
$ |
2,379,405 |
|
|
$ |
1,384,488 |
|
| Current portion of debt |
|
|
(884,994 |
) |
|
|
|
|
|
|
|
|
|
|
|
|
|
| Debt (less current portion) |
|
$ |
1,494,411 |
|
|
$ |
1,384,488 |
|
|
|
|
|
|
|
|
|
|
| Fair value of long-term debt* |
|
$ |
2,409,995 |
|
|
$ |
1,429,921 |
|
|
|
|
|
|
|
|
|
|
| * |
The fair value of the senior notes were estimated using level 2 inputs comprised of quoted prices in active markets, market indices and interest rate measurements for
debt with similar remaining maturity. |
In November 2014, we completed the sale of $500 million aggregate
principal amount of 2.75% Senior Notes due November 15, 2019 (the “2019 Notes”) and $500 million aggregate principal amount of 3.90% Senior Notes due November 15, 2024 (the “2024 Notes”). Interest is paid on the 2019
Notes and 2024 Notes on May 15th and November 15th each year.
The $885 million aggregate
principal amount of 3.55% Senior Notes due January 15, 2015 (the “2015 Notes”) were issued by a majority-owned subsidiary of SNI through a private placement. Interest on the 2015 Notes is due on January 15th and July 15th of each year. The 2015 Notes are guaranteed by SNI. Cox TMI, Inc., a
wholly-owned subsidiary of Cox Communications, Inc. and 35% owner in the Travel Channel has agreed to indemnify SNI for payments made in respect to SNI’s guarantee. Subsequent to year-end, we repaid the 2015 Notes.
Our $500 million aggregate principal amount Senior Notes mature on December 15, 2016 (the “2016
Notes”) bearing interest at 2.70%. Interest is paid on the 2016 Notes on June 15th and December 15th each year.
F-40
On March 31, 2014, we entered into a five year Competitive Advance and Revolving
Credit Facility (the “Facility”) that permits $650 million in aggregate borrowings and expires in March 2019. The Facility replaced our existing Competitive Advance and Revolving Credit Facility (“Previous Facility”) that
collectively permitted aggregate borrowings up to $550 million and was due to expire on June 30, 2014. The Facility bears interest based on the Company’s credit ratings, with drawn amounts bearing interest at Libor plus 90 basis points and
undrawn amounts bearing interest at 10 basis points as of December 31, 2014. There were no outstanding borrowings under the Facility at December 31, 2014 or under the Previous Facility at December 31, 2013.
The Facility and all of our Senior Notes include certain affirmative and negative covenants, including the incurrence of additional
indebtedness and maintenance of a maximum leverage ratio.
14. OTHER LIABILITIES
Other liabilities consisted of the following:
|
|
|
|
|
|
|
|
|
| |
|
As of December 31, |
|
| (in thousands) |
|
2014 |
|
|
2013 |
|
| Pension and post employment benefits |
|
$ |
81,012 |
|
|
$ |
64,952 |
|
| Deferred compensation |
|
|
41,096 |
|
|
|
36,667 |
|
| Uncertain tax positions |
|
|
69,898 |
|
|
|
80,898 |
|
| Other |
|
|
42,423 |
|
|
|
40,851 |
|
|
|
|
|
|
|
|
|
|
| Other liabilities (less current portion) |
|
$ |
234,429 |
|
|
$ |
223,368 |
|
|
|
|
|
|
|
|
|
|
The other caption in the table above for 2014 and 2013 includes $21.8 million and $31.4 million, respectively, of
obligations recognized for the purchase of intangible assets. The other caption also includes the RealGravity contingent consideration liability that totaled $10.3 million at December 31, 2014 and $8.3 million at December 31, 2013.
15. FOREIGN EXCHANGE RISK MANAGEMENT
In order to minimize earnings and cash flow volatility resulting from currency exchange rate changes, we may enter into derivative instruments, principally forward currency exchange rate contracts. These
contracts are designed to hedge anticipated foreign
currency transactions and changes in the value of specific assets, liabilities and probable commitments. All of our forward contracts are designated as freestanding derivatives and are designed
to minimize foreign currency exposures between the U.S. Dollar and British Pound. We do not enter into currency exchange rate derivative instruments for speculative purposes.
The freestanding derivative forward contracts are used to offset our exposure to the change in value of specific foreign currency
denominated assets and liabilities. These derivatives are not designated as hedges, and therefore, changes in the value of these forward contracts are recognized currently in earnings, thereby offsetting the current earnings effect of the related
change in U.S. dollar value of foreign currency denominated assets and liabilities. The cash flows from these contracts are reported as operating activities in the consolidated statements of cash flows. The gross notional amount of these contracts
outstanding was $124 million, $236 million and $233 million at December 31, 2014, December 31, 2013 and December 31, 2012, respectively.
We recognized $4.8 million of gains in 2014, $4.6 million of losses in 2013 and $9.5 million of losses in 2012 from these forward contracts which are reported within the miscellaneous, net caption in the
consolidated statements of operations. The gains and losses from these forward contracts are offset by foreign exchange transaction losses of $4.2 million that were recognized in 2014, $2.8 million of gains that were recognized in 2013 and $21.1
million of gains that were recognized in 2012. Foreign exchange transaction gains and losses are also recorded within the miscellaneous, net caption in our consolidated statements of operations.
16. REDEEMABLE NONCONTROLLING INTEREST AND NONCONTROLLING INTEREST
Redeemable Noncontrolling Interest
A noncontrolling interest holds a 35% residual interest
in the Travel Channel. The noncontrolling owner of that interest has a put option requiring us to repurchase their interest, and we have a call option to acquire their outstanding interest. The noncontrolling interest holder will receive appraised
fair value for their interest at the time either option is exercised. The put option on the noncontrolling interest in the Travel Channel became exercisable on August 17, 2014, and our call option becomes exercisable beginning August 17, 2015.
F-41
Noncontrolling Interest
The Food Network is operated and organized under the terms of the Partnership. SNI and a noncontrolling owner hold interests in the Partnership. During the fourth quarter of 2014, the Food Network
Partnership agreement was extended and specifies a dissolution date of December 31, 2016. If the term of the Partnership is not extended prior to that date, the Partnership agreement permits the Company, as a holder of approximately 80% of the
applicable votes, to reconstitute the Partnership and continue its business. If for some reason the Partnership is not continued, it will be required to limit its activities to winding up, settling debts, liquidating assets and distributing proceeds
to the partners in proportion to their partnership interests.
17. EMPLOYEE BENEFIT PLANS
Defined Benefit Plans
We sponsor a
defined benefit pension plan (“Pension Plan”) covering a majority of our employees. Expense recognized in relation to the Pension Plan is based upon actuarial valuations. Inherent in those valuations are key assumptions including discount
rates and, where applicable, expected returns on assets and projected future salary rates. The discount rates used in the valuation of our Pension Plan are evaluated annually based on current market conditions. Benefits are generally based upon the
employee’s compensation and years of service.
We also have a nonqualified supplemental executive retirement plan (“SERP”). The
SERP, which is unfunded, provides defined pension benefits in addition to what is provided under the Pension Plan to eligible executives based on average earnings, years of service and age at retirement.
In 2009, we amended the Pension Plan. In accordance with the provisions of the Pension Plan amendment, no additional service benefits
will be earned by participants in the Pension Plan after December 31, 2009. The amount of eligible compensation that is used to calculate a plan participant’s pension benefit will continue to include any compensation earned by the employee
through December 31, 2019. After December 31, 2019, all plan participants will have a frozen pension benefit.
F-42
The measurement date used for the Pension Plan and SERP retirement plans is
December 31. The components of the expense consisted of the following:
|
|
|
|
|
|
|
|
|
|
|
|
|
|
|
|
|
|
|
|
|
|
|
|
|
| |
|
For the years ended December 31, |
|
| |
|
Pension Plan |
|
|
SERP |
|
| (in thousands) |
|
2014 |
|
|
2013 |
|
|
2012 |
|
|
2014 |
|
|
2013 |
|
|
2012 |
|
| Interest cost |
|
$ |
3,279 |
|
|
$ |
3,642 |
|
|
$ |
3,226 |
|
|
$ |
1,685 |
|
|
$ |
1,637 |
|
|
$ |
1,490 |
|
| Expected return on plan assets, net of expenses |
|
|
(4,571 |
) |
|
|
(4,396 |
) |
|
|
(3,742 |
) |
|
|
|
|
|
|
|
|
|
|
|
|
| Special termination benefits |
|
|
1,838 |
|
|
|
|
|
|
|
|
|
|
|
365 |
|
|
|
|
|
|
|
|
|
| Settlement charges |
|
|
2,021 |
|
|
|
2,302 |
|
|
|
|
|
|
|
2,279 |
|
|
|
1,083 |
|
|
|
|
|
| Amortization of net loss |
|
|
1,239 |
|
|
|
2,918 |
|
|
|
2,052 |
|
|
|
2,188 |
|
|
|
2,844 |
|
|
|
2,200 |
|
|
|
|
|
|
|
|
|
|
|
|
|
|
|
|
|
|
|
|
|
|
|
|
|
|
| Total for defined benefit plans |
|
$ |
3,806 |
|
|
$ |
4,466 |
|
|
$ |
1,536 |
|
|
$ |
6,517 |
|
|
$ |
5,564 |
|
|
$ |
3,690 |
|
|
|
|
|
|
|
|
|
|
|
|
|
|
|
|
|
|
|
|
|
|
|
|
|
|
In the fourth quarter of 2014, we provided qualified employees with voluntary early retirement packages. The voluntary
early retirement program provided each employee the benefit of an additional three years of credited service related to the applicable Pension Plan and SERP for which they qualify. The special termination charge represents the cost of providing
these additional benefits to the employees retiring under the terms of the early retirement program.
During 2014 and 2013, we
recognized $4.3 million and $3.4 million, respectively, of settlement charges related to lump-sum distributions from our Pension Plan and SERP. Settlement charges are recorded when total lump sum distributions for a plan’s year exceed the total
projected service cost and interest cost for that plan year.
Assumptions used in determining the annual retirement plans
expense were as follows:
|
|
|
|
|
|
|
|
|
|
|
|
|
|
|
|
|
|
|
|
|
|
|
|
|
| |
|
Pension Plan |
|
|
SERP |
|
| |
|
2014 |
|
|
2013 |
|
|
2012 |
|
|
2014 |
|
|
2013 |
|
|
2012 |
|
| Discount rate |
|
|
4.30 |
% |
|
|
3.30 |
% |
|
|
3.90 |
% |
|
|
3.60 |
% |
|
|
2.80 |
% |
|
|
3.60 |
% |
| Long-term rate of return on plan assets |
|
|
7.50 |
% |
|
|
7.50 |
% |
|
|
7.50 |
% |
|
|
N/A |
|
|
|
N/A |
|
|
|
N/A |
|
| Increase in compensation levels |
|
|
5.00 |
% |
|
|
5.40 |
% |
|
|
5.10 |
% |
|
|
4.80 |
% |
|
|
5.00 |
% |
|
|
4.60 |
% |
The discount rate used to determine our future pension obligations is based on a bond portfolio approach that includes
securities rated Aa or better with maturities matching our expected benefit payments from the plans. The increase in compensation levels assumption is based on actual past experience and the near-term outlook.
The expected long-term rate of return on plan assets is based upon the weighted-average expected rate of return and capital market
forecasts for each asset class employed. Our expected rate of return on plan assets also considers our historical compounded return on plan assets for 10 and 15 year periods.
F-43
Obligations and Funded Status — Defined benefit plans pension obligations and funded
status are actuarially valued as of the end of each fiscal year. The following table presents information about our plan assets and obligations:
|
|
|
|
|
|
|
|
|
|
|
|
|
|
|
|
|
| |
|
For the years ended December 31, |
|
| |
|
Pension Plan |
|
|
SERP |
|
| (in thousands) |
|
2014 |
|
|
2013 |
|
|
2014 |
|
|
2013 |
|
| Accumulated benefit obligation |
|
$ |
85,279 |
|
|
$ |
73,470 |
|
|
$ |
45,617 |
|
|
$ |
41,319 |
|
|
|
|
|
|
|
|
|
|
|
|
|
|
|
|
|
|
| Change in projected benefit obligation: |
|
|
|
|
|
|
|
|
|
|
|
|
|
|
|
|
| Projected benefit obligation at beginning of year |
|
$ |
82,151 |
|
|
$ |
103,386 |
|
|
$ |
48,572 |
|
|
$ |
52,707 |
|
| Interest cost |
|
|
3,279 |
|
|
|
3,642 |
|
|
|
1,685 |
|
|
|
1,637 |
|
| Benefits paid |
|
|
(407 |
) |
|
|
(351 |
) |
|
|
(253 |
) |
|
|
(238 |
) |
| Actuarial losses (gains) |
|
|
14,344 |
|
|
|
(16,183 |
) |
|
|
6,650 |
|
|
|
(3,537 |
) |
| Curtailments |
|
|
(1,097 |
) |
|
|
|
|
|
|
(53 |
) |
|
|
|
|
| Special termination benefits |
|
|
1,838 |
|
|
|
|
|
|
|
365 |
|
|
|
|
|
| Settlement charges |
|
|
(7,724 |
) |
|
|
(8,343 |
) |
|
|
(4,592 |
) |
|
|
(1,997 |
) |
|
|
|
|
|
|
|
|
|
|
|
|
|
|
|
|
|
| Projected benefit obligation at end of year |
|
|
92,384 |
|
|
|
82,151 |
|
|
|
52,374 |
|
|
|
48,572 |
|
|
|
|
|
|
|
|
|
|
|
|
|
|
|
|
|
|
| Plan assets: |
|
|
|
|
|
|
|
|
|
|
|
|
|
|
|
|
| Fair value at beginning of year |
|
|
63,113 |
|
|
|
60,758 |
|
|
|
|
|
|
|
|
|
| Actual return on plan assets |
|
|
4,114 |
|
|
|
7,049 |
|
|
|
|
|
|
|
|
|
| Company contributions |
|
|
|
|
|
|
4,000 |
|
|
|
4,845 |
|
|
|
2,235 |
|
| Benefits paid |
|
|
(407 |
) |
|
|
(351 |
) |
|
|
(253 |
) |
|
|
(238 |
) |
| Settlement charges |
|
|
(7,724 |
) |
|
|
(8,343 |
) |
|
|
(4,592 |
) |
|
|
(1,997 |
) |
|
|
|
|
|
|
|
|
|
|
|
|
|
|
|
|
|
| Fair value at end of year |
|
|
59,096 |
|
|
|
63,113 |
|
|
|
|
|
|
|
|
|
|
|
|
|
|
|
|
|
|
|
|
|
|
|
|
|
|
| Under funded status |
|
$ |
(33,288 |
) |
|
$ |
(19,038 |
) |
|
$ |
(52,374 |
) |
|
$ |
(48,572 |
) |
|
|
|
|
|
|
|
|
|
|
|
|
|
|
|
|
|
| Amounts recognized as assets and liabilities in the consolidated balance sheets: |
|
|
|
|
|
|
|
|
|
|
|
|
|
|
|
|
| Current liabilities |
|
|
|
|
|
|
|
|
|
$ |
(4,650 |
) |
|
$ |
(2,658 |
) |
| Non-current liabilities |
|
$ |
(33,288 |
) |
|
$ |
(19,038 |
) |
|
|
(47,724 |
) |
|
|
(45,914 |
) |
|
|
|
|
|
|
|
|
|
|
|
|
|
|
|
|
|
| Total |
|
$ |
(33,288 |
) |
|
$ |
(19,038 |
) |
|
$ |
(52,374 |
) |
|
$ |
(48,572 |
) |
|
|
|
|
|
|
|
|
|
|
|
|
|
|
|
|
|
| Amounts recognized in accumulated other comprehensive loss consist of: |
|
|
|
|
|
|
|
|
|
|
|
|
|
|
|
|
| Net loss |
|
$ |
27,247 |
|
|
$ |
16,803 |
|
|
$ |
25,640 |
|
|
$ |
23,510 |
|
|
|
|
|
|
|
|
|
|
|
|
|
|
|
|
|
|
Other changes in plan assets and benefit obligations recognized in net periodic benefit cost and other comprehensive loss
(income) consist of:
|
|
|
|
|
|
|
|
|
|
|
|
|
|
|
|
|
| |
|
For the years ended December 31, |
|
| |
|
Pension Plan |
|
|
SERP |
|
| (in thousands) |
|
2014 |
|
|
2013 |
|
|
2014 |
|
|
2013 |
|
| Net actuarial loss (gain) |
|
$ |
14,801 |
|
|
$ |
(18,836 |
) |
|
$ |
6,650 |
|
|
$ |
(3,537 |
) |
| Amortization of net loss |
|
|
(1,239 |
) |
|
|
(2,918 |
) |
|
|
(2,188 |
) |
|
|
(2,844 |
) |
| Curtailment charges |
|
|
(1,097 |
) |
|
|
|
|
|
|
(53 |
) |
|
|
|
|
| Settlement charges |
|
|
(2,021 |
) |
|
|
(2,302 |
) |
|
|
(2,279 |
) |
|
|
(1,083 |
) |
|
|
|
|
|
|
|
|
|
|
|
|
|
|
|
|
|
| Total recognized in other comprehensive loss (income) |
|
|
10,444 |
|
|
|
(24,056 |
) |
|
|
2,130 |
|
|
|
(7,464 |
) |
| Net periodic benefit cost |
|
|
3,806 |
|
|
|
4,466 |
|
|
|
6,517 |
|
|
|
5,564 |
|
|
|
|
|
|
|
|
|
|
|
|
|
|
|
|
|
|
| Total recognized in net periodic benefit cost and other comprehensive loss (income) |
|
$ |
14,250 |
|
|
$ |
(19,590 |
) |
|
$ |
8,647 |
|
|
$ |
(1,900 |
) |
|
|
|
|
|
|
|
|
|
|
|
|
|
|
|
|
|
F-44
We expect to recognize amortization from accumulated other comprehensive income into net periodic benefit
costs of $2.3 million and $2.4 million for the net actuarial loss during 2015 related to our Pension Plan and non-qualified SERP, respectively.
Information for defined benefit plans with an accumulated benefit obligation in excess of plan assets was as follows:
|
|
|
|
|
|
|
|
|
|
|
|
|
|
|
|
|
| |
|
For the years ended December 31, |
|
| |
|
Pension Plan |
|
|
SERP |
|
| (in thousands) |
|
2014 |
|
|
2013 |
|
|
2014 |
|
|
2013 |
|
| Accumulated benefit obligation |
|
$ |
85,279 |
|
|
$ |
73,470 |
|
|
$ |
45,617 |
|
|
$ |
41,319 |
|
| Fair value of plan assets |
|
|
59,096 |
|
|
|
63,113 |
|
|
|
|
|
|
|
|
|
|
|
|
|
|
|
|
|
|
|
|
|
|
|
|
|
|
Information for defined benefit plans with a projected benefit obligation in excess of plan assets was as follows:
|
|
|
|
|
|
|
|
|
|
|
|
|
|
|
|
|
| |
|
For the years ended December 31, |
|
| |
|
Pension Plan |
|
|
SERP |
|
| (in thousands) |
|
2014 |
|
|
2013 |
|
|
2014 |
|
|
2013 |
|
| Projected benefit obligation |
|
$ |
92,384 |
|
|
$ |
82,151 |
|
|
$ |
52,374 |
|
|
$ |
48,572 |
|
| Fair value of plan assets |
|
|
59,096 |
|
|
|
63,113 |
|
|
|
|
|
|
|
|
|
|
|
|
|
|
|
|
|
|
|
|
|
|
|
|
|
|
Assumptions used to determine benefit obligations for the defined plans were as follows:
|
|
|
|
|
|
|
|
|
|
|
|
|
|
|
|
|
| |
|
For the years ended December 31, |
|
| |
|
Pension Plan |
|
|
SERP |
|
| |
|
2014 |
|
|
2013 |
|
|
2014 |
|
|
2013 |
|
| Discount rate |
|
|
3.50 |
% |
|
|
4.30 |
% |
|
|
3.10 |
% |
|
|
3.60 |
% |
| Rate of compensation increases |
|
|
4.50 |
% |
|
|
5.10 |
% |
|
|
4.40 |
% |
|
|
4.90 |
% |
|
|
|
|
|
|
|
|
|
|
|
|
|
|
|
|
|
Plan Assets — Our investment policy is to maximize the total rate of return on plan
assets to meet the long-term funding obligations of the plan. Plan assets are invested using a combination of active management and passive investment strategies. Risk is controlled through diversification among multiple asset classes, managers,
styles and securities. Risk is further controlled both at the manager and asset class level by assigning return targets and evaluating performance against these targets. Information related to our pension plan asset allocations by asset category
were as follows:
|
|
|
|
|
|
|
|
|
|
|
|
|
| |
|
Target
Allocations
for
2015 |
|
|
Percentage of
Plan Assets as of
December 31, |
|
| |
|
2014 |
|
|
2013 |
|
| US equity securities |
|
|
27 |
% |
|
|
30 |
% |
|
|
33 |
% |
| Non-US equity securities |
|
|
39 |
|
|
|
36 |
|
|
|
33 |
|
| Fixed-income securities |
|
|
30 |
|
|
|
28 |
|
|
|
29 |
|
|
|
|
|
|
|
|
|
|
|
|
|
|
| Other (real estate) |
|
|
4 |
|
|
|
6 |
|
|
|
5 |
|
|
|
|
|
|
|
|
|
|
|
|
|
|
| Total |
|
|
100 |
% |
|
|
100 |
% |
|
|
100 |
% |
|
|
|
|
|
|
|
|
|
|
|
|
|
U.S. equity securities include common stocks of large, medium and small companies, which are predominantly
U.S. based. Non-U.S. equity securities include companies domiciled outside the U.S. which are in various industries and countries and through a range of market capitalizations. Fixed-income securities include securities issued or guaranteed by the
U.S. government and corporate debt obligations, as well as investments in hedge fund products. Real estate investments include, but are not limited to, investments in office, retail, apartment and industrial properties.
Fair Value Measurements — Fair value is an exit price, representing the amount that would be received to sell an asset or paid to
transfer a liability in an orderly transaction between market participants at the measurement date.
F-45
The following table sets forth our plan asset categories that are measured at fair value as of
December 31, 2014 and the level of inputs utilized for fair value.
|
|
|
|
|
|
|
|
|
|
|
|
|
| |
|
As of December 31, 2014 |
| (in thousands) |
|
Total |
|
|
Level 1 |
|
|
Level 2 |
|
Level 3 |
| US equity securities |
|
|
|
|
|
|
|
|
|
|
|
|
| Mutual funds |
|
$ |
17,650 |
|
|
$ |
17,650 |
|
|
|
|
|
| Non-US equity securities |
|
|
|
|
|
|
|
|
|
|
|
|
| Mutual funds |
|
|
21,264 |
|
|
|
21,264 |
|
|
|
|
|
| Fixed income securities |
|
|
|
|
|
|
|
|
|
|
|
|
| Mutual funds |
|
|
16,758 |
|
|
|
16,758 |
|
|
|
|
|
| Other |
|
|
|
|
|
|
|
|
|
|
|
|
| Mutual funds |
|
|
3,369 |
|
|
|
3,369 |
|
|
|
|
|
|
|
|
|
|
|
|
|
|
|
|
|
|
| Subtotal |
|
$ |
59,041 |
|
|
$ |
59,041 |
|
|
|
|
|
| Cash |
|
|
55 |
|
|
|
55 |
|
|
|
|
|
|
|
|
|
|
|
|
|
|
|
|
|
|
| Total |
|
$ |
59,096 |
|
|
$ |
59,096 |
|
|
|
|
|
|
|
|
|
|
|
|
|
|
|
|
|
|
The following table sets forth our plan asset categories that are measured at fair value as of December 31, 2013 and
the level of inputs utilized for fair value.
|
|
|
|
|
|
|
|
|
|
|
|
|
| |
|
As of December 31, 2013 |
| (in thousands) |
|
Total |
|
|
Level 1 |
|
|
Level 2 |
|
Level 3 |
| US equity securities |
|
|
|
|
|
|
|
|
|
|
|
|
| Mutual funds |
|
$ |
20,755 |
|
|
$ |
20,755 |
|
|
|
|
|
| Non-US equity securities |
|
|
|
|
|
|
|
|
|
|
|
|
| Mutual funds |
|
|
20,823 |
|
|
|
20,823 |
|
|
|
|
|
| Fixed income securities |
|
|
|
|
|
|
|
|
|
|
|
|
| Mutual funds |
|
|
18,419 |
|
|
|
18,419 |
|
|
|
|
|
| Other |
|
|
|
|
|
|
|
|
|
|
|
|
| Mutual funds |
|
|
3,087 |
|
|
|
3,087 |
|
|
|
|
|
|
|
|
|
|
|
|
|
|
|
|
|
|
| Subtotal |
|
$ |
63,084 |
|
|
$ |
63,084 |
|
|
|
|
|
| Cash |
|
|
29 |
|
|
|
29 |
|
|
|
|
|
|
|
|
|
|
|
|
|
|
|
|
|
|
| Total |
|
$ |
63,113 |
|
|
$ |
63,113 |
|
|
|
|
|
|
|
|
|
|
|
|
|
|
|
|
|
|
F-46
Cash Flows — We anticipate contributing $4.7 million to fund current benefit payments
for the non-qualified SERP in 2015.
The estimated future benefit payments expected to be paid out of the plans for the next
ten years are as follows:
|
|
|
|
|
|
|
|
|
| (in thousands) |
|
Pension Plan |
|
|
SERP |
|
| 2015 |
|
$ |
17,046 |
|
|
$ |
4,650 |
|
| 2016 |
|
|
4,553 |
|
|
|
19,776 |
|
| 2017 |
|
|
4,053 |
|
|
|
1,656 |
|
| 2018 |
|
|
4,322 |
|
|
|
2,244 |
|
| 2019 |
|
|
4,036 |
|
|
|
2,285 |
|
| 2020 - 2024 |
|
|
24,584 |
|
|
|
13,214 |
|
Defined Contribution Retirement Plan — Substantially all employees of the Company are covered by a
company-sponsored defined contribution plan (“DC Plan”). The Company matches a portion of employees’ voluntary contribution to this plan and makes additional contributions to eligible employee’s 401K accounts in accordance with
enhanced provisions to the DC Plan. The amount contributed to each employee’s account is a percentage of the employee’s total eligible compensation based upon their age and service with the Company as of the first day of each year. Expense
related to our DC plan was $17.5 million in 2014, $16.4 million in 2013 and $14.8 million in 2012.
Executive Deferred Compensation Plan — We have an unqualified executive deferred
compensation plan (“Deferred Compensation Plan”) that is available to certain management level employees and directors of the Company. Under the Deferred Compensation Plan, participants may elect to defer receipt of a portion of their base
pay and bonus. The Deferred Compensation Plan is intended to be an unfunded plan maintained primarily for the purpose of providing deferred compensation benefits. We may use corporate owned life insurance contracts held in a rabbi trust to support
the plan. We have invested $41.5 million within this rabbi trust since 2012 and purchased $19.2 million of corporate owned life insurance contracts with these assets. The cash surrender value of the company owned life insurance contracts
totaled $20.7 million at December 31, 2014 and $13.8 million at December 31, 2013 and is included within other assets on our consolidated balance sheets. Gains or losses related to the insurance contracts are included within
miscellaneous, net in our consolidated statements of operations. The unsecured obligation to pay the deferred compensation, adjusted to reflect the positive or negative performance of investment measurement options selected by each participant,
totaled $42.8 million at December 31, 2014 and $38.9 million at December 31, 2013, and are included within other liabilities on our consolidated balance sheets.
18. COMPREHENSIVE INCOME
Changes in the accumulated other comprehensive income or loss (“AOCI”) balance by component consisted of the following for the
respective years:
|
|
|
|
|
|
|
|
|
|
|
|
|
|
|
|
|
|
|
|
|
|
|
|
|
| |
|
2014 |
|
|
2013 |
|
|
2012 |
|
| (in thousands) |
|
Currency
Translation
Adjustments |
|
|
Pension
Liability
Adjustments |
|
|
Currency
Translation
Adjustments |
|
|
Pension
Liability
Adjustments |
|
|
Currency
Translation
Adjustments |
|
|
Pension
Liability
Adjustments |
|
| AOCI beginning period balance |
|
$ |
12,449 |
|
|
$ |
(24,978 |
) |
|
$ |
5,645 |
|
|
$ |
(44,507 |
) |
|
$ |
380 |
|
|
$ |
(33,727 |
) |
|
|
|
|
|
|
|
|
|
|
|
|
|
|
|
|
|
|
|
|
|
|
|
|
|
| Other comprehensive income (loss) before reclassifications |
|
|
(37,571 |
) |
|
|
(13,291 |
) |
|
|
6,804 |
|
|
|
13,862 |
|
|
|
5,265 |
|
|
|
(13,459 |
) |
| Amounts reclassified from AOCI |
|
|
|
|
|
|
5,500 |
|
|
|
|
|
|
|
5,667 |
|
|
|
|
|
|
|
2,679 |
|
|
|
|
|
|
|
|
|
|
|
|
|
|
|
|
|
|
|
|
|
|
|
|
|
|
| Net current-period other comprehensive income (loss) |
|
|
(37,571 |
) |
|
|
(7,791 |
) |
|
|
6,804 |
|
|
|
19,529 |
|
|
|
5,265 |
|
|
|
(10,780 |
) |
|
|
|
|
|
|
|
|
|
|
|
|
|
|
|
|
|
|
|
|
|
|
|
|
|
| AOCI end of period balance |
|
$ |
(25,122 |
) |
|
$ |
(32,769 |
) |
|
$ |
12,449 |
|
|
$ |
(24,978 |
) |
|
$ |
5,645 |
|
|
$ |
(44,507 |
) |
|
|
|
|
|
|
|
|
|
|
|
|
|
|
|
|
|
|
|
|
|
|
|
|
|
Amounts reported in the table above are net of income tax.
Amounts reclassified to net earnings for pension liability adjustments relate to the amortization of actuarial losses and settlement
charges. These amounts are included within selling, general and administrative in our consolidated statements of operations (see Note 17 — Employee Benefit Plans for additional information).
F-47
19. SEGMENT INFORMATION
The Company determines its business segments based upon our management and internal reporting structure. We manage our operations through one reportable operating segment, lifestyle media.
Lifestyle media includes our six national television networks, HGTV, Food Network, Travel Channel, DIY Network, Cooking Channel and
Great American Country. Lifestyle media also includes websites that are associated with the aforementioned television brands and other internet-based businesses serving home, food and travel related categories. The Food Network and Cooking Channel
are included in the Food Network Partnership, for which we own approximately 69%. We also own 65% of Travel Channel. Each of our networks is distributed by cable and satellite distributors and telecommunication service providers. Lifestyle media
earns revenue primarily from the sale of advertising time and from affiliate fees paid by distributors of our content.
The
results of businesses not separately identified as reportable segments are included within our corporate and other caption. Corporate and other includes the results of the lifestyle-oriented channels we operate in EMEA, APAC, and Latin America,
operating results from the international licensing of our national networks’ programming and other interactive and digital business initiatives that are not associated with our lifestyle media or international businesses.
The accounting policies of each of our business segments are those described in Note 2—Summary of Significant Accounting
Policies.
In 2014, we made changes to our management reporting structure related to operating results from our uLive
business and our businesses located in the
Caribbean. In conjunction with these changes in our reporting structure, we now report the results of uLive within the lifestyle media reportable segment, rather than our corporate and other
caption. The results of the Caribbean businesses are now reported within international operations, included within our corporate and other caption for segment reporting purposes, rather than the lifestyle media segment. For comparability purposes,
prior year segment results have also been reclassified to reflect the impact of these management reporting changes. These reclassifications only affect our segment reporting and do not change our consolidated operating revenues, operating income or
net income.
Each of our businesses may provide advertising, programming or other services to one another. In addition,
certain corporate costs and expenses, including information technology, pensions and other employee benefits and other shared services, are allocated to our businesses. The allocations are generally amounts agreed upon by management, which may
differ from amounts that would be incurred if such services were purchased separately by the business.
Our chief operating
decision maker evaluates the operating performance of our businesses and makes decisions about the allocation of resources to the businesses using a measure we call segment profit. Segment profit excludes interest, income taxes, depreciation and
amortization, divested operating units, investment results and certain other items that are included in net income determined in accordance with GAAP.
F-48
Information regarding our segments is as follows:
|
|
|
|
|
|
|
|
|
|
|
|
|
| |
|
For the years ended December 31, |
|
| (in thousands) |
|
2014 |
|
|
2013 |
|
|
2012 |
|
| Segment operating revenues: |
|
|
|
|
|
|
|
|
|
|
|
|
| Lifestyle media |
|
$ |
2,575,376 |
|
|
$ |
2,455,650 |
|
|
$ |
2,252,690 |
|
| Corporate and other |
|
|
90,290 |
|
|
|
75,798 |
|
|
|
54,492 |
|
| Intersegment eliminations |
|
|
(210 |
) |
|
|
(639 |
) |
|
|
|
|
|
|
|
|
|
|
|
|
|
|
|
|
|
| Total operating revenues |
|
$ |
2,665,456 |
|
|
$ |
2,530,809 |
|
|
$ |
2,307,182 |
|
|
|
|
|
|
|
|
|
|
|
|
|
|
| Segment profit (loss): |
|
|
|
|
|
|
|
|
|
|
|
|
| Lifestyle media |
|
$ |
1,255,437 |
|
|
$ |
1,202,356 |
|
|
$ |
1,123,704 |
|
| Corporate and other |
|
|
(133,676 |
) |
|
|
(99,896 |
) |
|
|
(82,831 |
) |
|
|
|
|
|
|
|
|
|
|
|
|
|
| Total segment profit |
|
|
1,121,761 |
|
|
|
1,102,460 |
|
|
|
1,040,873 |
|
| Depreciation and amortization of intangible assets |
|
|
(128,582 |
) |
|
|
(117,580 |
) |
|
|
(107,591 |
) |
| Write-down of goodwill |
|
|
|
|
|
|
(24,723 |
) |
|
|
(19,663 |
) |
| (Losses) Gains on disposal of property and equipment |
|
|
(870 |
) |
|
|
(1,681 |
) |
|
|
754 |
|
| Interest expense |
|
|
(52,687 |
) |
|
|
(48,710 |
) |
|
|
(50,814 |
) |
| Equity in earnings of affiliates |
|
|
85,631 |
|
|
|
79,644 |
|
|
|
60,864 |
|
| Miscellaneous, net |
|
|
2,598 |
|
|
|
1,241 |
|
|
|
13,340 |
|
|
|
|
|
|
|
|
|
|
|
|
|
|
| Income from operations before income taxes |
|
$ |
1,027,851 |
|
|
$ |
990,651 |
|
|
$ |
937,763 |
|
|
|
|
|
|
|
|
|
|
|
|
|
|
| Depreciation: |
|
|
|
|
|
|
|
|
|
|
|
|
| Lifestyle media |
|
$ |
63,179 |
|
|
$ |
55,559 |
|
|
$ |
54,820 |
|
| Corporate and other |
|
|
9,800 |
|
|
|
7,451 |
|
|
|
3,422 |
|
|
|
|
|
|
|
|
|
|
|
|
|
|
| Total depreciation |
|
$ |
72,979 |
|
|
$ |
63,010 |
|
|
$ |
58,242 |
|
|
|
|
|
|
|
|
|
|
|
|
|
|
| Amortization of intangible assets: |
|
|
|
|
|
|
|
|
|
|
|
|
| Lifestyle media |
|
$ |
48,318 |
|
|
$ |
48,655 |
|
|
$ |
46,540 |
|
| Corporate and other |
|
|
7,285 |
|
|
|
5,915 |
|
|
|
2,809 |
|
|
|
|
|
|
|
|
|
|
|
|
|
|
| Total amortization of intangible assets |
|
$ |
55,603 |
|
|
$ |
54,570 |
|
|
$ |
49,349 |
|
|
|
|
|
|
|
|
|
|
|
|
|
|
No single customer provides more than 10% of our revenue.
|
|
|
|
|
|
|
|
|
|
|
|
|
| |
|
2014 |
|
|
2013 |
|
|
2012 |
|
| Additions to property and equipment: |
|
|
|
|
|
|
|
|
|
|
|
|
| Lifestyle media |
|
$ |
50,042 |
|
|
$ |
66,026 |
|
|
$ |
52,672 |
|
| Corporate and other |
|
|
8,752 |
|
|
|
7,061 |
|
|
|
12,139 |
|
|
|
|
|
|
|
|
|
|
|
|
|
|
| Total additions to property and equipment |
|
$ |
58,794 |
|
|
$ |
73,087 |
|
|
$ |
64,811 |
|
|
|
|
|
|
|
|
|
|
|
|
|
|
| Business acquisitions and other additions to long-lived assets: |
|
|
|
|
|
|
|
|
|
|
|
|
| Lifestyle media |
|
$ |
712,130 |
|
|
$ |
607,067 |
|
|
$ |
716,661 |
|
| Corporate and other |
|
|
36,220 |
|
|
|
84,665 |
|
|
|
141,031 |
|
|
|
|
|
|
|
|
|
|
|
|
|
|
| Total |
|
$ |
748,350 |
|
|
$ |
691,732 |
|
|
$ |
857,692 |
|
|
|
|
|
|
|
|
|
|
|
|
|
|
| Assets: |
|
|
|
|
|
|
|
|
|
|
|
|
| Lifestyle media |
|
$ |
2,864,089 |
|
|
$ |
2,850,809 |
|
|
$ |
2,882,913 |
|
| Corporate and other |
|
|
1,803,543 |
|
|
|
1,587,638 |
|
|
|
1,255,885 |
|
|
|
|
|
|
|
|
|
|
|
|
|
|
| Total assets |
|
$ |
4,667,632 |
|
|
$ |
4,438,447 |
|
|
$ |
4,138,798 |
|
|
|
|
|
|
|
|
|
|
|
|
|
|
Other additions to long-lived assets include investments, capitalized intangible assets and capitalized
programs.
As of December 31, assets held by our businesses outside of the United States totaled $590 million for 2014,
$627 million for 2013, and $575 million for 2012.
F-49
20. COMMITMENTS AND CONTINGENCIES
We are involved in litigation arising in the ordinary course of business, none of which is expected to result in material loss.
Minimum payments on noncancelable leases at December 31, 2014 were $21.7 million in 2015, $26.9 million in 2016, $27.0 million in 2017, $25.9 million in 2018, $20.9 million in 2019, and $37.5
million in later years. We expect that the majority of our operating leases will be replaced with leases for similar facilities upon their expiration. Rental expense for cancelable and noncancelable leases was $29.2 million in 2014, $26.6 million in
2013 and $25.4 million in 2012.
In the ordinary course of business, we enter into long-term service contracts to obtain
satellite transmission services or to obtain other services. Liabilities for such commitments are recorded when the related services are rendered. Minimum payments on such contractual commitments at December 31, 2014 were $81.5 million in
2015, $77.4 million in 2016, $47.7 million in 2017, $23.7 million in 2018, $10.4 million in 2019 and $9.4 million in later years. We expect these contracts will be replaced with similar contracts upon their expiration.
21. CAPITAL STOCK AND STOCK COMPENSATION PLANS
Capital Stock — SNI’s capital structure includes Common Voting Shares and Class A Common Shares. The articles of incorporation provide that the holders of Class A Common
Shares, who are not entitled to vote on any other matters except as required by Ohio law, are entitled to elect the greater of three or one-third of the directors. The Common Voting Shares and Class A Common Shares have equal dividend
distribution rights.
Incentive Plans — The LTI Plan has reserved 19,000,000 common shares available for issuance. The LTI
Plan provides for long-term performance
compensation for key employees and members of the Board. A variety of discretionary awards for employees and non-employee directors are authorized under the LTI Plan, including incentive or
non-qualified stock options, stock appreciation rights, restricted or nonrestricted stock units and performance awards. The vesting of such awards may be conditioned upon either a specified period of time or the attainment of specific performance
goals as determined by the administrator of the plan. The option price and term are also subject to determination by the administrator with respect to each grant. Option prices are generally expected to be set at the market price of our common stock
at date of grant and option terms are not expected to exceed ten years. The LTI Plan expires in 2018, except for options then outstanding. The LTI Plan is administered by the Board.
We satisfy stock option exercises and vested stock awards with newly issued shares. Shares available for future stock compensation
grants totaled 3.6 million at December 31, 2014.
Stock Options — Stock options grant the recipient the right to
purchase Class A Common Shares at not less than 100% of the fair market value on the date the option is granted. Stock options granted to employees generally vest ratably over a three year period, conditioned upon the individual’s
continued employment through that period. Stock options also generally vest immediately upon the retirement, death or disability of the employee, or upon a change in control of the Company or in the business in which the individual is employed.
Unvested awards are forfeited if employment is terminated for other reasons. Options granted to employees generally have eight year terms. Stock options granted to non-employee directors generally vest over a one year period and have a ten year term
for options granted prior to 2010. Options granted 2010 and later have eight year terms. Substantially all options granted prior to 2012 are exercisable.
F-50
Options generally become exercisable over a three year period. Information about options
outstanding and options exercisable is as follows:
|
|
|
|
|
|
|
|
|
|
|
|
|
|
|
|
|
(shares in
thousands) |
|
Number
of Shares |
|
|
Weighted-
Average
Exercise Price |
|
|
Weighted-
Average
Remaining
Term (in
years) |
|
|
Aggregate
Intrisic
Value |
|
| Outstanding at December 31, 2013 |
|
|
2,878 |
|
|
$ |
44.95 |
|
|
|
|
|
|
|
|
|
|
|
|
|
|
|
|
|
|
|
|
|
|
|
|
|
|
| Granted in 2014 |
|
|
383 |
|
|
$ |
80.40 |
|
|
|
|
|
|
|
|
|
| Exercised in 2014 |
|
|
(1,008 |
) |
|
$ |
39.29 |
|
|
|
|
|
|
|
|
|
| Forfeited in 2014 |
|
|
(30 |
) |
|
$ |
61.08 |
|
|
|
|
|
|
|
|
|
|
|
|
|
|
|
|
|
|
|
|
|
|
|
|
|
|
| Outstanding at December 31, 2014 |
|
|
2,223 |
|
|
$ |
52.81 |
|
|
|
3.4 |
|
|
$ |
53,901 |
|
|
|
|
|
|
|
|
|
|
|
|
|
|
|
|
|
|
| Options exercisable at December 31, 2014 |
|
|
1,542 |
|
|
$ |
46.22 |
|
|
|
3.6 |
|
|
$ |
46,626 |
|
|
|
|
|
|
|
|
|
|
|
|
|
|
|
|
|
|
The following table presents additional information on exercises of stock options:
|
|
|
|
|
|
|
|
|
|
|
|
|
| |
|
For the years ended
December 31, |
|
| (in thousands) |
|
2014 |
|
|
2013 |
|
|
2012 |
|
| Cash received upon exercise |
|
$ |
39,605 |
|
|
$ |
42,976 |
|
|
$ |
121,665 |
|
| Intrinsic value (market value on date of exercise less exercise price) |
|
|
40,961 |
|
|
|
25,552 |
|
|
|
59,985 |
|
Restricted Stock Units — Awards of restricted stock units (“RSUs”) are converted into equal
number of Class A Common Shares at the vesting date. The fair value of RSUs is based on the closing price of the common stock on the date of grant. RSUs vest over a range of three to five years, conditioned upon the continued employment through
that period. RSUs also generally vest immediately upon the retirement, death or disability of the employee or upon a change in control of the Company or in the business in which the individual is employed.
The following table presents additional information about RSUs:
|
|
|
|
|
|
|
|
|
| |
|
|
|
|
Grant Date Fair Value |
|
| (shares in thousands) |
|
Units |
|
|
Weighted Average |
|
| Unvested units at December 31, 2013 |
|
|
707 |
|
|
$ |
58.02 |
|
| Units awarded in 2014 |
|
|
391 |
|
|
$ |
79.70 |
|
| Units converted in 2014 |
|
|
(471 |
) |
|
$ |
58.06 |
|
| Units forfeited in 2014 |
|
|
(13 |
) |
|
$ |
68.92 |
|
|
|
|
|
|
|
|
|
|
| Unvested units at December 31, 2014 |
|
|
614 |
|
|
$ |
67.68 |
|
|
|
|
|
|
|
|
|
|
In addition, performance based RSUs (“PBRSUs”) that have been awarded represent the right to receive a grant of
RSUs if certain performance measures are met. Each award specifies a target number of shares to be issued and the specific performance criteria that must be met. The number of shares that an employee receives may be less or more than the target
number of shares depending on the extent to which the specified performance measures are attained. The shares earned are issued as RSUs following the performance period and vest over a three-year service period from the date of issuance. During
2014, PBRSUs with a target of 60,310 Class A Common Shares were granted with a weighted-average grant date fair value of $85.10. The PBRSUs will have a two year performance period based on the Company’s total shareholder return.
Stock-Based Compensation — In accordance with share-based payment accounting guidance, compensation cost is based on the
grant-date fair value of the award. The fair value of awards that grant the employee the right to the appreciation of the underlying shares, such as stock options, is measured using a binomial lattice model. A Monte Carlo simulation model is used to
determine the fair value of awards with market conditions. The fair value of awards that grant the employee the underlying shares is measured by the fair value of a Class A Common Share.
F-51
Compensation costs, net of estimated forfeitures due to termination of employment or
failure to meet performance targets, are recognized on a straight-line basis over the requisite service period of the award. The requisite service period is generally the vesting period stated in the award. However, because our stock-based grants
generally vest upon the retirement of the employee, grants to retirement-eligible employees are expensed immediately and grants to employees who will become retirement eligible prior to the end of the stated vesting period are expensed over such
shorter period.
Compensation costs of stock options are estimated on the date of grant using a binomial lattice model. The
weighted-average assumptions SNI used in the model for 2014, 2013 and 2012 are as follows:
|
|
|
|
|
|
|
|
|
|
|
|
|
| |
|
2014 |
|
|
2013 |
|
|
2012 |
|
| Weighted-average fair value of stock options granted |
|
$ |
19.20 |
|
|
$ |
18.94 |
|
|
$ |
14.26 |
|
| Assumptions used to determine fair value: |
|
|
|
|
|
|
|
|
|
|
|
|
| Dividend yield |
|
|
0.99 |
% |
|
|
0.95 |
% |
|
|
0.93 |
% |
| Risk-free rate of return |
|
|
1.53 |
% |
|
|
0.84 |
% |
|
|
0.86 |
% |
| Expected life of options (years) |
|
|
5.0 |
|
|
|
5.0 |
|
|
|
4.9 |
|
| Expected volatility |
|
|
27.2 |
% |
|
|
36.3 |
% |
|
|
39.1 |
% |
Dividend yield considers our historical dividend yield paid and expected dividend yield over the life of the options. The
risk-free rate is based on the U.S. Treasury yield curve in effect at the time of grant. The expected life of employee stock options represents the weighted-average period the stock options are expected to remain outstanding and is a derived output
of the valuation model. Expected volatility is based on a combination of historical share price volatility for a longer period and the implied volatility of exchange-traded options on our Class A Common Shares.
A summary of stock-based compensation costs is as follows:
|
|
|
|
|
|
|
|
|
|
|
|
|
| |
|
For the years ended
December 31, |
|
| (in thousands) |
|
2014 |
|
|
2013 |
|
|
2012 |
|
| Total stock-based compensation costs |
|
$ |
35,474 |
|
|
$ |
36,845 |
|
|
$ |
32,130 |
|
|
|
|
|
|
|
|
|
|
|
|
|
|
As of December 31, 2014, $2.8 million of total unrecognized stock-based compensation cost related to stock options
is expected to be recognized over a weighted-average period of 1.3 years. In addition, $23.6 million of total unrecognized stock-based compensation cost related to restricted stock units, including RSUs and PBRSUs, is expected to be recognized over
a weighted-average period of 1.2 years.
Share Repurchase Program — Under a share repurchase program (“repurchase
program”) authorized by the Board, we were permitted to acquire $2 billion of Class A Common Shares. All shares repurchased under the repurchase program are constructively retired and returned to unissued shares. During 2014, we
repurchased 15.4 million shares for approximately $1.2 billion, including repurchasing 4.5 million shares for approximately $339 million from Scripps family members. During 2013, we repurchased 3.9 million shares for approximately
$253 million.
On February 19, 2015, the Board authorized an additional $1 billion for the Company’s repurchase
program. Following the February 19, 2015 authorization, $1.4 billion remained available for repurchase under the repurchase program. There is no expiration date for the repurchase program, and we are under no commitment or obligation to
repurchase any particular amount of Class A Common Shares under the repurchase program.
F-52
22. SUMMARIZED QUARTERLY FINANCIAL INFORMATION (UNAUDITED)
Summarized financial information is as follows:
|
|
|
|
|
|
|
|
|
|
|
|
|
|
|
|
|
|
|
|
|
| (in thousands, except per share data) |
|
1st
Quarter |
|
|
2nd
Quarter |
|
|
3rd
Quarter |
|
|
4th
Quarter |
|
|
Total |
|
| 2014 |
|
|
|
|
|
|
|
|
|
|
|
|
|
|
|
|
|
|
|
|
| Operating revenues |
|
$ |
643,749 |
|
|
$ |
708,132 |
|
|
$ |
644,423 |
|
|
$ |
669,152 |
|
|
$ |
2,665,456 |
|
| Cost of services, excluding depreciation and amortization of intangible assets |
|
|
(181,138 |
) |
|
|
(190,181 |
) |
|
|
(207,099 |
) |
|
|
(200,478 |
) |
|
|
(778,896 |
) |
| Selling, general and administrative |
|
|
(191,877 |
) |
|
|
(198,666 |
) |
|
|
(167,361 |
) |
|
|
(206,895 |
) |
|
|
(764,799 |
) |
| Depreciation and amortization of intangible assets |
|
|
(31,294 |
) |
|
|
(34,173 |
) |
|
|
(31,617 |
) |
|
|
(31,498 |
) |
|
|
(128,582 |
) |
| (Losses) gains on disposal of property and equipment |
|
|
152 |
|
|
|
(1,647 |
) |
|
|
448 |
|
|
|
177 |
|
|
|
(870 |
) |
|
|
|
|
|
|
|
|
|
|
|
|
|
|
|
|
|
|
|
|
|
| Operating income |
|
|
239,592 |
|
|
|
283,465 |
|
|
|
238,794 |
|
|
|
230,458 |
|
|
|
992,309 |
|
| Interest expense |
|
|
(12,431 |
) |
|
|
(12,232 |
) |
|
|
(12,235 |
) |
|
|
(15,789 |
) |
|
|
(52,687 |
) |
| Equity in earnings of affiliates |
|
|
22,261 |
|
|
|
27,263 |
|
|
|
17,586 |
|
|
|
18,521 |
|
|
|
85,631 |
|
| Miscellaneous, net |
|
|
273 |
|
|
|
(468 |
) |
|
|
2,066 |
|
|
|
727 |
|
|
|
2,598 |
|
| Provision for income taxes |
|
|
(76,906 |
) |
|
|
(92,359 |
) |
|
|
(75,910 |
) |
|
|
(55,868 |
) |
|
|
(301,043 |
) |
|
|
|
|
|
|
|
|
|
|
|
|
|
|
|
|
|
|
|
|
|
| Net income |
|
|
172,789 |
|
|
|
205,669 |
|
|
|
170,301 |
|
|
|
178,049 |
|
|
|
726,808 |
|
| Net income attributable to noncontrolling interests |
|
|
(44,493 |
) |
|
|
(51,875 |
) |
|
|
(38,962 |
) |
|
|
(46,203 |
) |
|
|
(181,533 |
) |
|
|
|
|
|
|
|
|
|
|
|
|
|
|
|
|
|
|
|
|
|
| Net income attributable to SNI |
|
$ |
128,296 |
|
|
$ |
153,794 |
|
|
$ |
131,339 |
|
|
$ |
131,846 |
|
|
$ |
545,275 |
|
|
|
|
|
|
|
|
|
|
|
|
|
|
|
|
|
|
|
|
|
|
| Basic net income per share: |
|
|
|
|
|
|
|
|
|
|
|
|
|
|
|
|
|
|
|
|
| Net income attributable to SNI common shareholders |
|
$ |
.88 |
|
|
$ |
1.08 |
|
|
$ |
.93 |
|
|
$ |
.96 |
|
|
$ |
3.86 |
|
|
|
|
|
|
|
|
|
|
|
|
|
|
|
|
|
|
|
|
|
|
| Diluted net income per share: |
|
|
|
|
|
|
|
|
|
|
|
|
|
|
|
|
|
|
|
|
| Net income attributable to SNI common shareholders |
|
$ |
.87 |
|
|
$ |
1.07 |
|
|
$ |
.93 |
|
|
$ |
.96 |
|
|
$ |
3.83 |
|
|
|
|
|
|
|
|
|
|
|
|
|
|
|
|
|
|
|
|
|
|
| Weighted average shares outstanding: |
|
|
|
|
|
|
|
|
|
|
|
|
|
|
|
|
|
|
|
|
| Basic |
|
|
146,322 |
|
|
|
142,342 |
|
|
|
140,738 |
|
|
|
136,876 |
|
|
|
141,297 |
|
| Diluted |
|
|
147,440 |
|
|
|
143,224 |
|
|
|
141,628 |
|
|
|
137,708 |
|
|
|
142,193 |
|
|
|
|
|
|
|
|
|
|
|
|
|
|
|
|
|
|
|
|
|
|
| Cash dividends per share of common stock |
|
$ |
.20 |
|
|
$ |
.20 |
|
|
$ |
.20 |
|
|
$ |
.20 |
|
|
$ |
.80 |
|
|
|
|
|
|
|
|
|
|
|
|
|
|
|
|
|
|
|
|
|
|
|
|
|
|
|
|
| |
|
1st
Quarter |
|
|
2nd
Quarter |
|
|
3rd
Quarter |
|
|
4th
Quarter |
|
|
Total |
|
| 2013 |
|
|
|
|
|
|
|
|
|
|
|
|
|
|
|
|
|
|
|
|
| Operating revenues |
|
$ |
594,385 |
|
|
$ |
665,128 |
|
|
$ |
616,901 |
|
|
$ |
654,395 |
|
|
$ |
2,530,809 |
|
| Cost of services, excluding depreciation and amortization of intangible assets |
|
|
(163,751 |
) |
|
|
(168,677 |
) |
|
|
(178,221 |
) |
|
|
(188,645 |
) |
|
|
(699,294 |
) |
| Selling, general and administrative |
|
|
(183,160 |
) |
|
|
(176,770 |
) |
|
|
(176,644 |
) |
|
|
(192,481 |
) |
|
|
(729,055 |
) |
| Depreciation and amortization of intangible assets |
|
|
(26,700 |
) |
|
|
(29,554 |
) |
|
|
(29,514 |
) |
|
|
(31,812 |
) |
|
|
(117,580 |
) |
| Write-down of goodwill |
|
|
|
|
|
|
|
|
|
|
|
|
|
|
(24,723 |
) |
|
|
(24,723 |
) |
| Losses on disposal of property and equipment |
|
|
(976 |
) |
|
|
(499 |
) |
|
|
(95 |
) |
|
|
(111 |
) |
|
|
(1,681 |
) |
|
|
|
|
|
|
|
|
|
|
|
|
|
|
|
|
|
|
|
|
|
| Operating income |
|
|
219,798 |
|
|
|
289,628 |
|
|
|
232,427 |
|
|
|
216,623 |
|
|
|
958,476 |
|
| Interest expense |
|
|
(12,145 |
) |
|
|
(12,197 |
) |
|
|
(12,337 |
) |
|
|
(12,031 |
) |
|
|
(48,710 |
) |
| Equity in earnings of affiliates |
|
|
20,582 |
|
|
|
25,410 |
|
|
|
15,180 |
|
|
|
18,472 |
|
|
|
79,644 |
|
| Miscellaneous, net |
|
|
(3,361 |
) |
|
|
3,643 |
|
|
|
(626 |
) |
|
|
1,585 |
|
|
|
1,241 |
|
| Provision for income taxes |
|
|
(73,687 |
) |
|
|
(96,141 |
) |
|
|
(64,174 |
) |
|
|
(73,621 |
) |
|
|
(307,623 |
) |
|
|
|
|
|
|
|
|
|
|
|
|
|
|
|
|
|
|
|
|
|
| Net income |
|
|
151,187 |
|
|
|
210,343 |
|
|
|
170,470 |
|
|
|
151,028 |
|
|
|
683,028 |
|
| Net income attributable to noncontrolling interests |
|
|
(43,368 |
) |
|
|
(50,614 |
) |
|
|
(41,467 |
) |
|
|
(42,509 |
) |
|
|
(177,958 |
) |
|
|
|
|
|
|
|
|
|
|
|
|
|
|
|
|
|
|
|
|
|
| Net income attributable to SNI |
|
$ |
107,819 |
|
|
$ |
159,729 |
|
|
$ |
129,003 |
|
|
$ |
108,519 |
|
|
$ |
505,070 |
|
|
|
|
|
|
|
|
|
|
|
|
|
|
|
|
|
|
|
|
|
|
| Basic net income per share: |
|
|
|
|
|
|
|
|
|
|
|
|
|
|
|
|
|
|
|
|
| Net income attributable to SNI common shareholders |
|
$ |
.72 |
|
|
$ |
1.09 |
|
|
$ |
.88 |
|
|
$ |
.74 |
|
|
$ |
3.43 |
|
|
|
|
|
|
|
|
|
|
|
|
|
|
|
|
|
|
|
|
|
|
| Diluted net income per share: |
|
|
|
|
|
|
|
|
|
|
|
|
|
|
|
|
|
|
|
|
| Net income attributable to SNI common shareholders |
|
$ |
.72 |
|
|
$ |
1.08 |
|
|
$ |
.87 |
|
|
$ |
.73 |
|
|
$ |
3.40 |
|
|
|
|
|
|
|
|
|
|
|
|
|
|
|
|
|
|
|
|
|
|
| Weighted average shares outstanding: |
|
|
|
|
|
|
|
|
|
|
|
|
|
|
|
|
|
|
|
|
| Basic |
|
|
148,813 |
|
|
|
147,132 |
|
|
|
146,578 |
|
|
|
146,813 |
|
|
|
147,326 |
|
| Diluted |
|
|
149,901 |
|
|
|
148,259 |
|
|
|
147,802 |
|
|
|
148,076 |
|
|
|
148,502 |
|
|
|
|
|
|
|
|
|
|
|
|
|
|
|
|
|
|
|
|
|
|
| Cash dividends per share of common stock |
|
$ |
.15 |
|
|
$ |
.15 |
|
|
$ |
.15 |
|
|
$ |
.15 |
|
|
$ |
.60 |
|
|
|
|
|
|
|
|
|
|
|
|
|
|
|
|
|
|
|
|
|
|
The sum of the quarterly net income per share amounts may not equal the reported annual amount because each is computed
independently based upon the weighted-average number of shares outstanding for the period.
F-53
SCRIPPS NETWORKS INTERACTIVE, INC.
INDEX TO CONSOLIDATED FINANCIAL STATEMENT SCHEDULES
|
|
|
|
|
| Valuation and Qualifying Accounts |
|
|
S-2 |
|
S-1
Valuation and Qualifying Accounts
|
|
|
|
|
| for the Years Ended December 31, 2014, 2013 and 2012 |
|
|
Schedule II |
|
|
|
|
|
|
|
|
|
|
|
|
|
|
|
|
|
|
|
|
| Column A |
|
Column B |
|
|
Column C |
|
|
Column D |
|
|
Column E |
|
Column F |
|
| (in thousands) |
|
|
|
|
|
|
|
|
|
|
Increase |
|
|
|
| Classification |
|
Balance
Beginning
of Period |
|
|
Additions
Charged to
Revenues,
Costs, Expenses |
|
|
Deductions
Amounts
Charged
Off-Net |
|
|
(Decrease)
Recorded
Acquisitions
(Divestitures) |
|
Balance
End of
Period |
|
| Allowance for Doubtful Accounts Receivable Year Ended December 31: |
|
|
|
|
|
|
|
|
|
|
|
|
|
|
|
|
|
|
| 2014 |
|
$ |
6,853 |
|
|
$ |
2,400 |
|
|
$ |
1,364 |
|
|
|
|
$ |
7,889 |
|
|
|
|
|
|
|
|
|
|
|
|
|
|
|
|
|
|
|
|
| 2013 |
|
|
5,514 |
|
|
|
2,678 |
|
|
|
1,339 |
|
|
|
|
|
6,853 |
|
|
|
|
|
|
|
|
|
|
|
|
|
|
|
|
|
|
|
|
| 2012 |
|
|
5,000 |
|
|
|
677 |
|
|
|
163 |
|
|
|
|
|
5,514 |
|
|
|
|
|
|
|
|
|
|
|
|
|
|
|
|
|
|
|
|
S-2
SCRIPPS NETWORKS INTERACTIVE, INC. INDEX TO EXHIBITS
|
|
|
|
|
|
|
|
|
|
|
Exhibit
Number |
|
Description of Item |
|
Footnote |
|
|
Exhibit No.
Incorporated |
|
| 2.1 |
|
Separation and Distribution Agreement between Scripps Networks Interactive, Inc. and The E. W. Scripps Company |
|
|
(1 |
) |
|
|
2.01 |
|
|
|
|
|
| 2.2 |
|
Contribution Agreement among TCM Parent, LLC, TCM Sub, LLC, Gulliver Media Holdings, LLC, Scripps Networks Interactive, Inc., Cox TMI, Inc., and Cox Communications, Inc. |
|
|
(5 |
) |
|
|
2.1 |
|
|
|
|
|
| 2.3 |
|
Agreement among Flextech Broadband Limited, Virgin Media Investment Holdings Limited, Southbank Media Ltd, and Scripps Networks Interactive, Inc. |
|
|
(12 |
) |
|
|
2.3 |
|
|
|
|
|
| 3.1 |
|
Amended and Restated Articles of Incorporation of Scripps Networks Interactive, Inc. |
|
|
(4 |
) |
|
|
3.1 |
|
|
|
|
|
| 3.2 |
|
Amended and Restated Code of Regulations of Scripps Networks Interactive, Inc. |
|
|
(4 |
) |
|
|
3.2 |
|
|
|
|
|
| 4.1 |
|
Specimen Certificate of Class A Common Shares of Scripps Networks Interactive, Inc. |
|
|
(3 |
) |
|
|
4.1 |
|
|
|
|
|
| 4.10 |
|
Indenture (3.55% Senior Notes Due 2015) Among TCM Sub LLC and Scripps Networks Interactive, Inc., as guarantor |
|
|
(6 |
) |
|
|
4.1 |
|
|
|
|
|
| 4.20 |
|
First Supplemental Indenture (2.70% Senior Notes Due 2016) Among Scripps Networks Interactive, Inc. and U.S. Bank National Association, as trustee |
|
|
(13 |
) |
|
|
4.2 |
|
|
|
|
|
| 4.20.B |
|
Second Supplemental Indenture (2.75% Senior Notes Due 2019 and 3.90% Senior Notes Due 2024) Among Scripps Networks Interactive, Inc. and U.S. Bank National Association, as
trustee |
|
|
(23 |
) |
|
|
4.1 |
|
|
|
|
|
| 4.21 |
|
Form of Global Note Representing the 2016 Notes |
|
|
(13 |
) |
|
|
4.3 |
|
|
|
|
|
| 4.21.B |
|
Form of Global Note Representing the 2019 Notes |
|
|
(23 |
) |
|
|
4.2 |
|
|
|
|
|
| 4.21.C |
|
Form of Global Note Representing the 2024 Notes |
|
|
(23 |
) |
|
|
4.3 |
|
|
|
|
|
| 10.2 |
|
Tax Allocation Agreement between Scripps Networks Interactive, Inc. and The E. W. Scripps Company |
|
|
(2 |
) |
|
|
10.13 |
|
|
|
|
|
| 10.3 |
|
Employee Matters Agreement between Scripps Networks Interactive, Inc. and The E. W. Scripps Company |
|
|
(2 |
) |
|
|
10.12 |
|
|
|
|
|
| 10.4 |
|
2008 Long-Term Incentive Plan (as amended and restated on May 19, 2011) |
|
|
(14 |
) |
|
|
10.4 |
|
|
|
|
|
| 10.5 |
|
Form of Nonqualified Stock Option Agreement |
|
|
(11 |
) |
|
|
10.5 |
|
|
|
|
|
|
|
|
|
|
|
|
Exhibit
Number |
|
Description of Item |
|
Footnote |
|
|
Exhibit No.
Incorporated |
|
| 10.6 |
|
Form of Performance-Based Restricted Share Award Agreement |
|
|
(3 |
) |
|
|
10.6 |
|
|
|
|
|
| 10.7 |
|
Form of Restricted Share Award Agreement |
|
|
(3 |
) |
|
|
10.7 |
|
|
|
|
|
| 10.8 |
|
Form of Performance-Based Restricted Share Unit Agreement |
|
|
(11 |
) |
|
|
10.8 |
|
|
|
|
|
| 10.8.B |
|
Form of Restricted Share Unit Agreement |
|
|
(11 |
) |
|
|
10.8.B |
|
|
|
|
|
| 10.9 |
|
Executive Annual Incentive Plan (as amended and restated) |
|
|
(8 |
) |
|
|
10.9 |
|
|
|
|
|
| 10.10 |
|
Executive Deferred Compensation Plan (amended and restated effective January 1, 2011) |
|
|
(17 |
) |
|
|
10.10 |
|
|
|
|
|
| 10.11 |
|
2008 Deferred Compensation and Stock Plan for Directors |
|
|
(3 |
) |
|
|
10.11 |
|
|
|
|
|
| 10.12 |
|
Executive Change in Control Plan (as amended and restated on November 16, 2012) |
|
|
|
|
|
|
|
|
|
|
|
|
| 10.13 |
|
2012 Executive Change in Control Plan |
|
|
|
|
|
|
|
|
|
|
|
|
| 10.14 |
|
Executive Severance Plan (as amended and restated effective October 6, 2014) |
|
|
|
|
|
|
|
|
|
|
|
|
| 10.20 |
|
Supplemental Executive Retirement Plan. |
|
|
(3 |
) |
|
|
10.20 |
|
|
|
|
|
| 10.20.B |
|
Amendment to Supplemental Executive Retirement Plan |
|
|
(7 |
) |
|
|
10.20.B |
|
|
|
|
|
| 10.21 |
|
Employee Stock Purchase Plan. |
|
|
(3 |
) |
|
|
10.21 |
|
|
|
|
|
| 10.22 |
|
Scripps Family Agreement. |
|
|
(3 |
) |
|
|
10.22 |
|
|
|
|
|
| 10.23 |
|
Amendment to Scripps Family Agreement. |
|
|
|
|
|
|
|
|
|
|
|
|
| 10.30 |
|
Employment Agreement between the Company and Kenneth W. Lowe |
|
|
(9 |
) |
|
|
10.1 |
|
|
|
|
|
| 10.30.B |
|
Amendment to Employment Agreement between the Company and Kenneth W. Lowe |
|
|
(10 |
) |
|
|
10.2 |
|
|
|
|
|
| 10.30.C |
|
Amendment No. 2 to Employment Agreement between the Company and Kenneth W. Lowe |
|
|
(15 |
) |
|
|
10.3 |
|
|
|
|
|
| 10.30.D |
|
Amendment No. 3 to Employment Agreement between the Company and Kenneth W. Lowe |
|
|
(20 |
) |
|
|
10.4 |
|
|
|
|
|
| 10.31 |
|
Employment Agreement between the Company and Burton Jablin |
|
|
(18 |
) |
|
|
10.31 |
|
|
|
|
|
| 10.32 |
|
Employment Agreement between the Company and Joseph G. NeCastro |
|
|
(9 |
) |
|
|
10.2 |
|
|
|
|
|
| 10.32.B |
|
Amendment to Employment Agreement between the Company and Joseph G. NeCastro |
|
|
(16 |
) |
|
|
10.1 |
|
E-1
|
|
|
|
|
|
|
|
|
|
|
Exhibit
Number |
|
Description of Item |
|
Footnote |
|
|
Exhibit No.
Incorporated |
|
| 10.32.C |
|
Amendment No. 2 to Employment Agreement between the Company and Joseph G. NeCastro |
|
|
(19 |
) |
|
|
10.1 |
|
|
|
|
|
| 10.33 |
|
Employment Agreement between the Company and Mark S. Hale |
|
|
(22 |
) |
|
|
10.33 |
|
|
|
|
|
| 10.35 |
|
Employment Agreement between the Company and Cynthia L. Gibson |
|
|
(17 |
) |
|
|
10.35 |
|
|
|
|
|
| 10.40 |
|
Five-Year Competitive Advance and Revolving Credit Facility Agreement |
|
|
(21 |
) |
|
|
10.40 |
|
|
|
|
|
| 14 |
|
Code of Ethics for CEO and Senior Financial Officers |
|
|
(3 |
) |
|
|
14 |
|
|
|
|
|
| 21 |
|
Material Subsidiaries of the Company |
|
|
|
|
|
|
|
|
|
|
|
|
| 23 |
|
Consent of Independent Registered Public Accounting Firm |
|
|
|
|
|
|
|
|
|
|
|
|
| 31(a) |
|
Section 302 Certifications |
|
|
|
|
|
|
|
|
|
|
|
|
| 31(b) |
|
Section 302 Certifications |
|
|
|
|
|
|
|
|
|
|
|
|
| 32(a) |
|
Section 906 Certifications |
|
|
|
|
|
|
|
|
|
|
|
|
| 32(b) |
|
Section 906 Certifications |
|
|
|
|
|
|
|
|
|
|
|
|
| 101.INS |
|
XBRL Instance Document |
|
|
|
|
|
|
|
|
|
|
|
|
| 101.SCH |
|
XBRL Taxonomy Extension Schema Document |
|
|
|
|
|
|
|
|
|
|
|
|
| 101.CAL |
|
XBRL Taxonomy Extension Calculation Linkbase Document |
|
|
|
|
|
|
|
|
|
|
|
|
| 101.DEF |
|
XBRL Taxonomy Extension Definition Linkbase Document |
|
|
|
|
|
|
|
|
|
|
|
|
| 101.LAB |
|
XBRL Taxonomy Extension Label Linkbase Document |
|
|
|
|
|
|
|
|
|
|
|
|
| 101.PRE |
|
XBRL Taxonomy Extension Presentation Linkbase Document |
|
|
|
|
|
|
|
|
| (1) |
Incorporated by reference to the Scripps Networks Interactive, Inc. Current Report on Form 8-K dated June 12, 2008. |
| (2) |
Incorporated by reference to the Scripps Networks Interactive, Inc. Current Report on Form 8-K dated June 30, 2008. |
| (3) |
Incorporated by reference to Registration Statement on Form 10 dated June 11, 2008. |
| (4) |
Incorporated by reference to the Scripps Networks Interactive, Inc. Report on Form 10-K for the year ended December 31, 2008. |
| (5) |
Incorporated by reference to the Scripps Networks Interactive, Inc. Current Report on Form 8-K dated November 10, 2009. |
| (6) |
Incorporated by reference to the Scripps Networks Interactive, Inc. Current Report on Form 8-K dated December 21, 2009. |
| (7) |
Incorporated by reference to the Scripps Networks Interactive, Inc. Report on Form 10-K for the year ended December 31, 2009. |
| (8) |
Incorporated by reference to the Scripps Networks Interactive, Inc. 2010 Proxy Statement dated March 15, 2010. |
| (9) |
Incorporated by reference to the Scripps Networks Interactive, Inc. Current Report on Form 8-K dated March 29, 2010. |
| (10) |
Incorporated by reference to the Scripps Networks Interactive, Inc. Current Report on Form 8-K dated October 6, 2010. |
| (11) |
Incorporated by reference to the Scripps Networks Interactive, Inc. Report on Form 10-K for the year ended December 31, 2010. |
| (12) |
Incorporated by reference to the Scripps Networks Interactive, Inc. Quarterly Report on Form 10-Q for the quarterly period ended September 30, 2011.
|
| (13) |
Incorporated by reference to the Scripps Networks Interactive, Inc. Current Report on Form 8-K dated December 1, 2011. |
| (14) |
Incorporated by reference to the Scripps Networks Interactive, Inc. Report on Form 10-K for the year ended December 31, 2011. |
| (15) |
Incorporated by reference to the Scripps Networks Interactive, Inc. Current Report on Form 8-K dated August 1, 2012. |
| (16) |
Incorporated by reference to the Scripps Networks Interactive, Inc. Current Report on Form 8-K dated November 14, 2012. |
| (17) |
Incorporated by reference to the Scripps Networks Interactive, Inc. Report on Form 10-K for the year ended December 31, 2012. |
| (18) |
Incorporated by reference to the Scripps Networks Interactive, Inc. Quarterly Report on Form 10-Q for the quarterly period ended September 30, 2013
|
| (19) |
Incorporated by reference to the Scripps Networks Interactive, Inc. Current Report on Form 8-K dated November 13, 2013 |
| (20) |
Incorporated by reference to the Scripps Networks Interactive, Inc. Current Report on Form 8-K dated March 3, 2014 |
| (21) |
Incorporated by reference to the Scripps Networks Interactive, Inc. Current Report on Form 8-K dated March 31, 2014 |
| (22) |
Incorporated by reference to the Scripps Networks Interactive, Inc. Quarterly Report on Form 10-Q for the quarterly period ended September 30, 2014
|
| (23) |
Incorporated by reference to the Scripps Networks Interactive, Inc. Current Report on Form 8-K dated November 24, 2014
|
E-2