Attached files
| file | filename |
|---|---|
| EXCEL - IDEA: XBRL DOCUMENT - SKECHERS USA INC | Financial_Report.xls |
| EX-31.1 - EX-31.1 - SKECHERS USA INC | d846076dex311.htm |
| EX-31.2 - EX-31.2 - SKECHERS USA INC | d846076dex312.htm |
| EX-21.1 - EX-21.1 - SKECHERS USA INC | d846076dex211.htm |
| EX-23.1 - EX-23.1 - SKECHERS USA INC | d846076dex231.htm |
| EX-32.1 - EX-32.1 - SKECHERS USA INC | d846076dex321.htm |
Table of Contents
UNITED STATES
SECURITIES AND EXCHANGE COMMISSION
WASHINGTON, D.C. 20549
FORM 10-K
(Mark One)
| x | ANNUAL REPORT PURSUANT TO SECTION 13 OR 15(d) OF THE SECURITIES EXCHANGE ACT OF 1934 |
For the fiscal year ended December 31, 2014
OR
| ¨ | TRANSITION REPORT PURSUANT TO SECTION 13 OR 15(d) OF THE SECURITIES AND EXCHANGE ACT OF 1934 |
For the transition period from to
Commission File Number 001-14429
SKECHERS U.S.A., INC.
(Exact Name of Registrant as Specified in Its Charter)
| Delaware | 95-4376145 | |
| (State or Other Jurisdiction of Incorporation or Organization) |
(I.R.S. Employer Identification No.) |
| 228 Manhattan Beach Blvd., Manhattan Beach, California | 90266 | |
| (Address of Principal Executive Offices) | (Zip Code) |
Registrant’s telephone number, including area code: (310) 318-3100
Securities registered pursuant to Section 12(b) of the Act:
| Title of Each Class |
Name of Each Exchange on Which Registered | |
| Class A Common Stock, $0.001 par value | New York Stock Exchange |
Securities registered pursuant to Section 12(g) of the Act:
None
(Title of Class)
Indicate by check mark if the Registrant is a well-known seasoned issuer, as defined in Rule 405 of the Securities Act. Yes x No ¨
Indicate by check mark if the Registrant is not required to file reports pursuant to Section 13 or Section 15(d) of the Act. Yes ¨ No x
Indicate by check mark whether the Registrant: (1) has filed all reports required to be filed by Section 13 or 15(d) of the Securities Exchange Act of 1934 during the preceding 12 months (or for such shorter period that the registrant was required to file such reports), and (2) has been subject to such filing requirements for the past 90 days. Yes x No ¨
Indicate by check mark whether the registrant has submitted electronically and posted on its corporate Website, if any, every interactive Data File required to be submitted and posted pursuant to Rule 405 of Regulation S-T(§232.405 of this chapter) during the preceding 12 months (or for such shorter period that the registrant was required to submit and post such files). Yes x No ¨
Indicate by check mark if disclosure of delinquent filers pursuant to Item 405 of Regulation S-K(§229.405) is not contained herein, and will not be contained, to the best of registrant’s knowledge, in definitive proxy or information statements incorporated by reference in Part III of this Form 10-K or any amendment to this Form 10-K. x
Indicate by check mark whether the Registrant is a large accelerated filer, an accelerated filer, a non-accelerated filer, or a smaller reporting company. See definitions of “large accelerated filer”, “accelerated filer” and “smaller reporting company” in Rule 12b-2 of the Exchange Act.
| Large accelerated filer | x | Accelerated filer | ¨ | |||
| Non-accelerated filer | ¨ | Smaller reporting company | ¨ | |||
Indicate by check mark whether the Registrant is a shell company (as defined in Rule 12b-2 of the Exchange Act). Yes ¨ No x
As of June 30, 2014, the aggregate market value of the voting and non-voting Class A and Class B Common Stock held by non-affiliates of the Registrant was approximately $1.831 billion based upon the closing price of $45.70 of the Class A Common Stock on the New York Stock Exchange on such date.
The number of shares of Class A Common Stock outstanding as of February 17, 2015: 41,551,376.
The number of shares of Class B Common Stock outstanding as of February 17, 2015: 10,469,918.
DOCUMENTS INCORPORATED BY REFERENCE
Portions of the Registrant’s Definitive Proxy Statement issued in connection with the 2015 Annual Meeting of the Stockholders of the Registrant are incorporated by reference into Part III.
Table of Contents
SKECHERS U.S.A., INC. AND SUBSIDIARIES
TABLE OF CONTENTS TO ANNUAL REPORT ON FORM 10-K
FOR THE YEAR ENDED DECEMBER 31, 2014
| PART I | ||||||
| ITEM 1. |
2 | |||||
| ITEM 1A. |
17 | |||||
| ITEM 1B. |
24 | |||||
| ITEM 2. |
24 | |||||
| ITEM 3. |
25 | |||||
| ITEM 4. |
29 | |||||
| PART II | ||||||
| ITEM 5. |
30 | |||||
| ITEM 6. |
32 | |||||
| ITEM 7. |
MANAGEMENT’S DISCUSSION AND ANALYSIS OF FINANCIAL CONDITION AND RESULTS OF OPERATIONS |
33 | ||||
| ITEM 7A. |
46 | |||||
| ITEM 8. |
48 | |||||
| ITEM 9. |
CHANGES IN AND DISAGREEMENTS WITH ACCOUNTANTS ON ACCOUNTING AND FINANCIAL DISCLOSURE |
73 | ||||
| ITEM 9A. |
73 | |||||
| ITEM 9B. |
76 | |||||
| PART III | ||||||
| ITEM 10. |
76 | |||||
| ITEM 11. |
76 | |||||
| ITEM 12. |
SECURITY OWNERSHIP OF CERTAIN BENEFICIAL OWNERS AND MANAGEMENT AND RELATED STOCKHOLDER MATTERS |
76 | ||||
| ITEM 13. |
CERTAIN RELATIONSHIPS AND RELATED TRANSACTIONS, AND DIRECTOR INDEPENDENCE |
76 | ||||
| ITEM 14. |
76 | |||||
| PART IV | ||||||
| ITEM 15. |
76 | |||||
This annual report includes our trademarks, including Skechers®, Skechers Performance™, Skechers GOrun®, Skechers
GOwalk®,
 ®,
®,
 ®, Skechers Cali™, Relaxed Fit®, Skechers Memory Foam™, Skech-Air®, BOBS®, Hot Lights®, Twinkle Toes®, each of which is our property. This report contains additional trademarks of other
companies. We do not intend our use or display of other companies’ trade names or trademarks to imply an endorsement or sponsorship of us by such companies, or any relationship with any of these companies.
®, Skechers Cali™, Relaxed Fit®, Skechers Memory Foam™, Skech-Air®, BOBS®, Hot Lights®, Twinkle Toes®, each of which is our property. This report contains additional trademarks of other
companies. We do not intend our use or display of other companies’ trade names or trademarks to imply an endorsement or sponsorship of us by such companies, or any relationship with any of these companies.
i
Table of Contents
SPECIAL NOTE ON FORWARD-LOOKING STATEMENTS
This annual report on Form 10-K contains forward-looking statements that are made pursuant to the safe harbor provisions of the Private Securities Litigation Reform Act of 1995, including statements with regards to future revenue, projected 2015 results, earnings, spending, margins, cash flow, orders, expected timing of shipment of products, inventory levels, future growth or success in specific countries, categories or market sectors, continued or expected distribution to specific retailers, liquidity, capital resources and market risk, strategies and objectives. Forward-looking statements include, without limitation, any statement that may predict, forecast, indicate or simply state future results, performance or achievements, and can be identified by the use of forward-looking language such as “believe,” “anticipate,” “expect,” “estimate,” “intend,” “plan,” “project,” “will be,” “will continue,” “will result,” “could,” “may,” “might,” or any variations of such words with similar meanings. These forward-looking statements involve risks and uncertainties that could cause actual results to differ materially from those projected in forward-looking statements, and reported results shall not be considered an indication of our company’s future performance. Factors that might cause or contribute to such differences include:
| • | international economic, political and market conditions including the uncertainty of sustained recovery in our European markets; |
| • | our ability to maintain our brand image and to anticipate, forecast, identify, and respond to changes in fashion trends, consumer demand for the products and other market factors; |
| • | our ability to remain competitive among sellers of footwear for consumers, including in the highly competitive performance footwear market; |
| • | our ability to sustain, manage and forecast our costs and proper inventory levels; |
| • | the loss of any significant customers, decreased demand by industry retailers and the cancellation of order commitments; |
| • | our ability to continue to manufacture and ship our products that are sourced in China, which could be adversely affected by various economic, political or trade conditions, or a natural disaster in China; |
| • | our ability to predict our revenues, which have varied significantly in the past and can be expected to fluctuate in the future due to a number of reasons, many of which are beyond our control; and |
| • | sales levels during the spring, back-to-school and holiday selling seasons. |
The risks included here are not exhaustive. Other sections of this report may include additional factors that could adversely impact our business, financial condition and results of operations. Moreover, we operate in a very competitive and rapidly changing environment and new risk factors emerge from time to time. We cannot predict all such risk factors, nor can we assess the impact of all such risk factors on our business or the extent to which any factor or combination of factors may cause actual results to differ materially from those contained in any forward-looking statements. Given these inherent and changing risks and uncertainties, investors should not place undue reliance on forward-looking statements, which reflect our opinions only as of the date of this annual report, as a prediction of actual results. We undertake no obligation to publicly release any revisions to the forward-looking statements after the date of this document, except as otherwise required by reporting requirements of applicable federal and states securities laws.
1
Table of Contents
| ITEM 1. | BUSINESS |
We were incorporated in California in 1992 and reincorporated in Delaware in 1999. Throughout this annual report, we refer to Skechers U.S.A., Inc., a Delaware corporation, its consolidated subsidiaries and certain variable interest entities (“VIE’s”) of which it is the primary beneficiary, as “we,” “us,” “our,” “our Company” and “Skechers” unless otherwise indicated. Our Internet address is www.skechers.com. Our annual report on Form 10-K, quarterly reports on Form 10-Q, current reports on Form 8-K, Form 3’s, 4’s and 5’s filed on behalf of directors, officers and 10% stockholders, and any amendments to those reports filed or furnished pursuant to Section 13(a) or 15(d) of the Securities Exchange Act of 1934 are available free of charge on our corporate website, www.skx.com, as soon as reasonably practicable after we electronically file such material with, or furnish it to, the U.S. Securities and Exchange Commission (“SEC”). You can learn more about us by reviewing such filings at www.skx.com or at the SEC’s website at www.sec.gov.
GENERAL
We design and market Skechers-branded lifestyle footwear for men, women and children, and performance footwear for men and women under the Skechers GO brand name. Our footwear reflects a combination of style, quality and value that appeals to a broad range of consumers. Our brands are sold through department and specialty stores, athletic and independent retailers, boutiques and internet retailers. In addition to wholesale distribution, our footwear is available at our e-commerce websites and our own retail stores. As of February 15, 2015, we owned and operated 119 concept stores, 146 factory outlet stores and 98 warehouse outlet stores in the United States, and 51 concept stores, 33 factory outlet stores, and three warehouse outlet stores internationally. Our objective is to profitably grow our operations worldwide while leveraging our recognizable Skechers brand through our strong product lines, innovative advertising and diversified distribution channels.
We seek to offer consumers a vast array of fashionable footwear that satisfies their active, casual, dress casual and athletic footwear needs. Our core consumers are style-conscious men and women attracted to our youthful brand image and fashion-forward designs, as well as athletes and fitness enthusiasts attracted to our performance footwear. Many of our best-selling and core styles are also developed for children with colors and materials that reflect a playful image appropriate for this demographic.
We believe that brand recognition is an important element for success in the footwear business. We have aggressively marketed our brands through comprehensive marketing campaigns for men, women and children. During 2014, our Skechers brand was supported by print, television and outdoor campaigns for men and women; animated kids’ television campaigns featuring our own action heroes and characters; marathons and other events for our Skechers Performance Division; donation events surrounding our BOBS from Skechers charitable footwear program; and print, television, online and outdoor campaigns featuring our Skechers Performance and Skechers lifestyle endorsees. These endorsees included television personality multi-platinum recording artist Demi Lovato, baseball legend Pete Rose, Brooke Burke-Charvet, Hall of Fame quarterbacks Joe Montana and Joe Namath, Dallas Mavericks owner Mark Cuban, Dodgers baseball legend Tommy Lasorda, Olympians Kara Goucher and Meb Keflezighi, and legendary drummer and recording artist Ringo Starr.
Since 1992, when we introduced our first line, Skechers USA Sport Utility Footwear, we have expanded our product offering and grown our net sales while substantially increasing the breadth and penetration of our account base. Our men’s, women’s and children’s Skechers-branded product lines benefit from the Skechers reputation for contemporary and progressive styling, quality, comfort and affordability. Our Performance lines benefit from our marketing, product development and manufacturing support, and management expertise. To promote innovation and brand relevance, we manage our product lines separately by utilizing dedicated sales and design teams. Our product lines share back office services in order to limit our operating expenses and fully utilize our management’s vast experience in the footwear industry.
SKECHERS LINES
We offer a wide array of Skechers-branded product lines for men, women, and children. Within these product lines, we also have numerous categories, many of which have developed into well-known names. Most of these categories are marketed and packaged with unique shoe boxes, hangtags and in-store support. Management evaluates segment performance based primarily on net sales and gross margins; however, sales and costs are not allocated to specific product lines.
2
Table of Contents
Lifestyle Brands
Skechers USA. Our Skechers USA category for men and women includes: (i) Casuals, (ii) Dress Casuals, (iii) Relaxed Fit from Skechers, (iv) Casual Fusion, and (v) seasonal sandals and boots. This category is generally sold through mid-tier retailers, department stores and some footwear specialty shops.
| • | The Casuals line for men and women is defined by lugged outsoles and utilizes value-oriented and leather materials in the uppers. For men, the Casuals category includes “black and brown” boots, shoes and sandals that generally have a rugged urban design — some with industrial-inspired fashion features. For women, the Casuals category includes basic “black and brown” oxfords and slip-ons, lug outsole and fashion boots, and casual sandals. We design and price both the men’s and women’s categories to appeal primarily to younger consumers with broad acceptance across age groups. |
| • | The Dress Casuals category for men is comprised of basic “black and brown” men’s shoes that feature shiny leathers and dress details, but may utilize traditional or lugged outsoles as well as value-oriented materials. The Dress Casual line for women is comprised of trend-influenced stylized boots and shoes, which may include leather uppers, shearling or faux fur lining or trim, and water-resistant materials. |
| • | Relaxed Fit from Skechers is a line of trend-right casuals with a wider toe box for men and women who want all-day comfort without compromising style. Characteristics of the product line include comfortable outsoles, Skechers Memory Foam insoles and quality leather uppers. We market and package Relaxed Fit from Skechers styles in a unique shoe box that is distinct from other categories in the Skechers USA line of footwear. |
| • | Our Casual Fusion line is comprised of low-profile, sport-influenced Euro casuals targeted to trend-conscious young men and women. The outsoles are primarily rubber and adopted from our men’s Sport and women’s Active lines. This collection features leather or nubuck uppers, but may also include mesh. |
| • | Our seasonal sandals and boots for men and women are designed with many of our existing and proven outsoles for our Casuals, Dress Casuals and Casual Fusion lines, stylized with basic or core uppers as well as fresh looks. These styles are generally made with quality leather uppers, but may also be in canvas or fabric for sandals, and water-resistant materials and faux fur and Sherpa linings for boots. |
Skechers Sport. Our Skechers Sport footwear collection for men and women includes: (i) Skechers Memory Foam styles, (ii) lightweight performance-inspired athletics, (iii) classic athletic-inspired styles and (iv) sport sandals and boots. Our Skechers Sport category is distinguished by its technical performance-inspired looks; however, we generally do not promote the technical performance features of these shoes. Skechers Sport is typically sold through specialty shoe stores, department stores and athletic footwear retailers.
| • | Skechers Memory Foam styles are designed with a high-volume memory foam insole that will contour to your foot and provide greater comfort. The lightweight and ultra-soft looks also feature a flexible outsole and soft uppers, some of which feature bio-engineered mesh, soft knit fabrics, and stretchable woven materials. This category features bright, multi-colored and solid basic-colored uppers. |
| • | Our lightweight performance-inspired athletics are designed with comfort and flexibility in mind. Careful attention is devoted to the cushioning, weight, materials, design and construction of the outsoles. Designed as a versatile, trend-right athletic shoe suitable for all-day wear, the product line features leather and trubuck uppers in both bright and classic athletic colors. |
| • | Classic athletic-inspired styles are core proven looks that continue to be strong performers. With all-day comfort and durable rubber tread, these shoes are intended to be a mainstay of any footwear collection. Many of the designs are in white, black and natural shades, with some athletic accents. The uppers are designed in leather, suede and nubuck. |
| • | Our sport sandals and boots are primarily designed from existing Skechers Sport outsoles and may include many of the same sport features as our sneakers with the addition of new technologies geared toward making a comfortable sport sandal. Sport sandals and boots are designed as seasonal footwear for the consumer who already wears our Skechers Sport sneakers. |
3
Table of Contents
Skechers Active and Skechers Sport Active. A natural companion to Skechers Sport, Skechers Active and Skechers Sport Active have grown from a casual everyday line into two complete lines of sneakers and casual sneakers for active females of all ages. The Skechers Active line, with lace-up, Mary Janes, sandals and open back styles, is available in a multitude of colors as well as solid white or black, in fabrics, leathers and meshes, and with various closures – traditional laces, zig-zag and cross straps, among others. The Skechers Sport Active line includes low-profile, lightweight, flexible and sporty styles, many of which have Skechers Memory Foam. Skechers Active and Skechers Sport Active shoes are typically available through specialty casual shoe stores and department stores.
BOBS from Skechers. The BOBS from Skechers line has grown into a year-round product offering with the addition of vulcanized looks and an “at Home” line. Primarily marketed to young women, the BOBS collection also includes footwear for kids, and men to a smaller degree. BOBS are available at department stores, specialty shoe stores and online retailers.
| • | The BOBS classic espadrille collection is designed in basic colors with canvas, tweed, crochet and boiled wool uppers, suede, and patterned fabrics. Many styles now include Skechers Memory Foam. |
| • | BOBS vulcanized looks have a very youthful and California lifestyle appeal. Primarily designed with canvas uppers but also jersey fabrics, the line features both classic retro looks and fresh colors and materials for a relevant style. Many styles now include Skechers Memory Foam. |
| • | The BOBS at Home collection for women is designed with our flexible rubber Keepsakes outsole, and features faux fur linings for the ultimate dorm or winter shoe. The uppers are primarily designed with tweeds, knits or suede. |
| • | The BOBS for Kids line is inspired by the successful women’s styles, designed with bright and patterned fabrics and embellished uppers for girls. |
| • | BOBS for men features basic slip-on and lace-up canvas styles as well as vulcanized designs. Some styles include Skechers Memory Foam. |
Skechers donates new shoes to children in need when consumers purchase BOBS. By the end of 2014, we had donated over 10 million pairs primarily to SolesforSouls and Fashion Delivers, our charity donation partners, who in turn donate the shoes to various reputable charity organizations in the United States and around the world.
Performance Brands
Skechers Performance. Skechers Performance is a collection of technical footwear designed with a focus on a specific activity to maximize performance and promote natural motion. Developed by the Skechers Performance Design Team, the footwear utilizes the latest advancements in materials and innovative design, including an ultra-lightweight Resalyte compound for the midsole and GOimpulse sensors for responsive feedback. Limited edition packs with Skechers GOdri all-weather protection or Skechers Nite Owl glow-in-the-dark technology are featured across multiple product lines. The footwear is available at athletic footwear retailers, department stores and specialty running stores.
| • | Skechers GOrun. Skechers GOrun 4 and Skechers GOrun 3 are the latest in a collection of lightweight, flexible running shoes that features a midfoot strike design for efficient running. Skechers GOrun Ride 4 and Skechers GOrun Ride 3 feature similar designs as its GOrun counterpart with enhanced cushioning for elevated comfort and support. Skechers GOrun Ultra offers maximum cushioning with the most support making it perfect for distance or recovery runs. Skechers GOmeb Speed 3 is the high-performance racing shoe worn by elite marathon runner Meb. These flagship lines as well as other Skechers GOrun products are marketed to serious runners and recreational runners alike. |
| • | Skechers GOwalk. Skechers GOwalk is designed for walking and casual wear, and offers performance features in a comfortable casual slip-on. The product line features a lightweight and flexible design to promote natural foot movement when walking. Skechers GOwalk 3 incorporates more advanced performance technologies including a high-rebound GOga Mat insole, adaptive GO Pillars on the outsole and Memory Form Fit for a custom-fit experience. Skechers GOwalk 2 incorporates more performance technologies with a unique V-Stride outsole designed specifically to promote a natural walking stride. Skechers on-the-GO footwear fuses iconic designs and premium materials with Skechers Performance technologies for comfort and style. |
4
Table of Contents
| • | Skechers GObionic. Designed for trail running, Skechers GObionic is engineered with 18 fully articulated bio-responsive zones that offer flexibility, feel and ground conformity. A proprietary Resagrip outsole increases the durability to handle wear-and-tear from tougher terrain. |
| • | Skechers GOtrain. Skechers GOtrain is designed for the gym and features a wider forefoot and extended outriggers for maximum stability and control at lateral and medial strike points. This shoe is an all-encompassing trainer that meets the need of intense and rigorous workouts. |
| • | Skechers GOgolf. Skechers GOgolf is designed for the golf course and offers a zero heel drop design, which keeps feet in a neutral position that is low to the ground to promote a solid foundation while playing golf. A Resagrip outsole helps with traction control and a soft Resamax cushioned insole delivers comfort. |
Skechers Kids
The Skechers Kids line includes: (i) Skechers Kids, which is a range of infants’, toddlers’, boys’ and girls’ boots, shoes and sneakers, (ii) Skechers Lightweight Sport, (iii) Skechers GOrun and Skechers GOwalk, (iv) S-Lights, Hot Lights by Skechers and Luminators by Skechers, (v) Skechers Cali for Girls, (vi) Airators by Skechers, (vii) Skechers Super Z-Strap, (viii) Elastika by Skechers, (ix) Bella Ballerina by Skechers, (x) Twinkle Toes by Skechers, (xi) Air-Mazing by Skechers, and (xii) Foamies by Skechers.
| • | The Skechers Kids line includes embellishments or adornments such as fresh colors and fabrics from our Skechers adult shoes. Some of these styles are also adapted for toddlers with softer, more pliable outsoles and for infants with soft, leather-sole crib shoes. |
| • | Skechers Lightweight Sport styles with Skechers Memory Foam are sneakers designed with many of the same meshes, knits and weaves as the adult Skechers Sport styles in bright colors and patterns. The collection is designed to appeal both to younger kids as well as tweens transitioning to adult shoes. |
| • | Skechers GOrun and Skechers GOwalk for boys and girls are casual adaptations of our popular Skechers Performance styles for the kids’ market, designed in bright and bold colors for daily play. The collection is designed to appeal both to younger kids as well as tweens transitioning to adult shoes. |
| • | S-Lights, Hot Lights by Skechers and Luminators by Skechers are lighted sneakers and sandals for boys and girls. The S-Lights combine patterns of lights on the outsoles and sides of the shoes while Hot Lights feature lights on the front of the toe to simulate headlights as well as on other areas of the shoes. Luminators by Skechers feature glowing green lights and a marketing campaign with the Luminators character. |
| • | Skechers Cali for Girls is a line of sandals inspired by our women’s line of the same name with bright colors, textiles and adornments. |
| • | Airators by Skechers is a line of boys’ sneakers with a foot-cooling system designed to pump air from the heel through to the toes. The product line is marketed with the character, Kewl Breeze. |
| • | Skechers Super Z-Strap is a line of athletic-styled sneakers with an easy “z” shaped closure system. The product line is marketed with the character, Z-Strap. |
| • | Elastika by Skechers is a line of girls’ sneakers with bungee closures. The product line is marketed with the character, Elastika. |
| • | Bella Ballerina by Skechers is a line of girls’ shoes with a disc that spins on the outsole, allowing girls to twirl like a ballerina. |
| • | Twinkle Toes by Skechers is a line of girls’ sneakers and boots that feature bejeweled toe caps and brightly designed uppers. Some styles also include lights. The product line is marketed with the character, Twinkle Toes. |
| • | Air-Mazing by Skechers is a lightweight line of colorful sneakers designed for older boys. The product line is marketed with the character, Air-Mazing Kid, who performs air tricks in his sneakers. |
5
Table of Contents
| • | Foamies by Skechers is a colorful line of lightweight, flexible boys’ and girls’ sneakers constructed with Skechers Memory Foam that can easily be washed in a washing machine. |
Skechers Kids, Skechers Kids Memory Foam, Skechers GO for kids, and Skechers Cali for Girls are comprised primarily of shoes that are designed as “takedowns” of their adult counterparts, allowing the younger consumers the opportunity to wear the same popular styles as their older siblings and schoolmates. This “takedown” strategy maintains the product’s integrity by offering premium leathers, hardware and outsoles without the costs involved in designing and developing new products. In addition, we adapt current fashions from our men’s and women’s lines by modifying designs and choosing colors and materials that are more suitable for the playful image that we have established in the children’s footwear market. Each Skechers Kids line is marketed and packaged separately with a distinct shoe box. Skechers Kids shoes are available at department stores and specialty and athletic retailers.
Skechers Work
Skechers Work offers a complete line of men’s and women’s casuals such as field boots, hikers and athletic shoes, many of which may also include Skechers Memory Foam. The Skechers Work line includes athletic-inspired, casual safety toe and non-slip safety toe categories that may feature lightweight aluminum safety toe, electrical hazard and slip-resistant technologies, as well as breathable, seam-sealed waterproof membranes. Designed for men and women working in jobs with certain safety requirements, these durable styles are constructed on high-abrasion, long-wearing soles, and feature breathable lining, oil- and abrasion-resistant outsoles offering all-day comfort and prolonged durability. The Skechers Work line incorporates design elements from other Skechers men’s and women’s lines. The uppers are comprised of high-quality leather, nubuck, trubuck and durabuck. Our safety toe athletic sneakers, boots, hikers and casuals are ideal for environments requiring safety footwear and offer comfort and safety in dry or wet conditions. Our slip-resistant boots, hikers, athletics, casuals and clogs are ideal for the service industry. Our safety toe products have been independently tested and certified to meet ASTM standards, and our slip-resistant soles have been tested pursuant to the Mark II testing method for slip-resistance. Skechers Work is typically sold through department stores, athletic footwear retailers and specialty shoe stores, as well as marketed directly to consumers through business-to-business channels.
PRODUCT DESIGN AND DEVELOPMENT
Our principal goal in product design is to generate new and exciting footwear in all of our product lines with contemporary and progressive styles and comfort-enhancing performance features. Targeted to the active, youthful and style-savvy, we design our lifestyle line to be fashionable and marketable to the 12- to 24-year-old consumer, while substantially all of our lines appeal to the broader range of 5- to 50-year olds, with an exclusive selection for infants and toddlers. Designed by the Skechers Performance Division, our performance products are for professional and recreational athletes who want a technical fitness shoe.
We believe that our products’ success is related to our ability to recognize trends in the footwear markets and to design products that anticipate and accommodate consumers’ ever-evolving preferences. We are able to quickly translate the latest fashion trends into stylish, quality footwear at a reasonable price by analyzing and interpreting current and emerging lifestyle trends. Lifestyle trend information is compiled and analyzed by our designers from various sources, including the review and analysis of modern music, television, cinema, clothing, and other trend-setting media; traveling to domestic and international fashion markets to identify and confirm current trends; consulting with our retail and e-commerce customers for information on current retail selling trends; participating in major footwear trade shows to stay abreast of popular brands, fashions and styles; and subscribing to various fashion and color information services. In addition, a key component of our design philosophy is to continually reinterpret and develop our successful styles in our brands’ images.
The footwear design process typically begins about nine months before the start of a season. Our products are designed and developed primarily by our in-house design staff. To promote innovation and brand relevance, we utilize dedicated design teams, who report to our senior design executives and focus on each of the men’s, women’s and children’s categories. In addition, we utilize outside design firms on an item-specific basis to supplement our internal design efforts. The design process is extremely collaborative, as members of the design staff frequently meet with the heads of retail, merchandising, sales, production and sourcing to further refine our products to meet the particular needs of the target market.
After a design team arrives at a consensus regarding the fashion themes for the coming season, the designers then translate these themes into our products. These interpretations include variations in product color, material structure and embellishments, which are arrived at after close consultation with our production department. Prototype blueprints and specifications are created and forwarded to our manufacturers for a design prototype. The design prototypes are then sent back to our design teams. Our major retail customers
6
Table of Contents
may also review these new design concepts. Customer input not only allows us to measure consumer reaction to the latest designs, but also affords us an opportunity to foster deeper and more collaborative relationships with our customers. We also occasionally order limited production runs that may initially be tested in our concept stores. By working closely with store personnel, we obtain customer feedback that often influences product design and development. Our design teams can easily and quickly modify and refine a design based on customer input. Generally, the production process can take six to nine months from design concept to commercialization.
For disclosure of product design and development costs during the last three fiscal years, see Note 1 — The Company and Summary of Significant Accounting Policies in the consolidated financial statements included in this annual report.
SOURCING
Factories. Our products are produced by independent contract manufacturers located primarily in China and Vietnam. We do not own or operate any manufacturing facilities. We believe that the use of independent manufacturers substantially increases our production flexibility and capacity, while reducing capital expenditures and avoiding the costs of managing a large production work force. For disclosure of information regarding the risks associated with having our manufacturing operations abroad and relying on independent contract manufacturers, see the relevant risk factors under Item 1A of this annual report.
When possible, we seek to use manufacturers that have previously produced our footwear, which we believe enhances continuity and quality while controlling production costs. We source product for styles that account for a significant percentage of our net sales from at least five different manufacturers. During 2014, five of our contract manufacturers accounted for approximately 58.9% of total purchases. One manufacturer accounted for 37.5%, and another accounted for 6.1% of our total purchases. To date, we have not experienced difficulty in obtaining manufacturing services or with the availability of raw materials.
We finance our production activities in part through the use of interest-bearing open purchase arrangements with certain of our Asian manufacturers. These facilities currently bear interest at a rate between 0% and 0.5% for 30- to 60-day financing, depending on the factory. We believe that the use of these arrangements affords us additional liquidity and flexibility. We do not have any long-term contracts with any of our manufacturers; however, we have long-standing relationships with many of our manufacturers and believe our relationships to be good.
We closely monitor sales activity after initial introduction of a product in our concept stores to determine whether there is substantial demand for a style, thereby aiding us in our sourcing decisions. Styles that have substantial consumer appeal are highlighted in upcoming collections or offered as part of our periodic style offerings, while less popular styles can be discontinued after a limited production run. We believe that sales in our concept stores can also help forecast sales in national retail stores, and we share this sales information with our wholesale customers. Sales, merchandising, production and allocations management analyze historical and current sales, and market data from our wholesale account base and our own retail stores to develop an internal product quantity forecast that allows us to better manage our future production and inventory levels. For those styles with high sell-through percentages, we maintain an in-stock position to minimize the time necessary to fill customer orders by placing orders with our manufacturers prior to the time we receive customers’ orders for such footwear.
Production Oversight. To safeguard product quality and consistency, we oversee the key aspects of production from initial prototype manufacture through initial production runs to final manufacture. Monitoring of all production is performed in the United States by our in-house production department and in Asia through an approximately 230-person staff working from our offices in China. We believe that our Asian presence allows us to negotiate supplier and manufacturer arrangements more effectively, decrease product turnaround time and ensure timely delivery of finished footwear. In addition, we require our manufacturers to certify that neither convicted, forced nor indentured labor (as defined under U.S. law), nor child labor (as defined by law in the manufacturer’s country) is used in the production process, that compensation will be paid according to local law, and that the factory is in compliance with local safety regulations.
Quality Control. We believe that quality control is an important and effective means of maintaining the quality and reputation of our products. Our quality control program is designed to ensure that not only finished goods meet our established design specifications, but also that all goods bearing our trademarks meet our standards for quality. Our quality control personnel located in China perform an array of inspection procedures at various stages of the production process, including examination and testing of prototypes of key raw materials prior to manufacture, samples and materials at various stages of production and final products prior to shipment. Our employees are on site at each of our major manufacturers to oversee production. For some of our lower volume manufacturers, our staff is on site during significant production runs or we will perform unannounced visits to their manufacturing sites to further monitor compliance with our manufacturing specifications.
7
Table of Contents
ADVERTISING AND MARKETING
With a marketing philosophy of “Unseen, Untold, Unsold,” we take a targeted approach to marketing to drive traffic, build brand recognition and properly position our diverse lines within the marketplace. Senior management is directly involved in shaping our image and the conception, development and implementation of our advertising and marketing activities. The focus of our marketing plan is print and television advertising, which is supported by online, outdoor, trend-influenced marketing, public relations, social media, promotions, events and in-store support. In addition, we utilize celebrity endorsers in some of our advertisements. We also believe our websites and trade shows are effective marketing tools to both consumers and wholesale accounts. We have historically budgeted advertising as a percentage of projected net sales.
The majority of our advertising is conceptualized by our in-house design team. We believe that our advertising strategies, methods and creative campaigns are directly related to our success. Through our lifestyle, performance-inspired and image-driven advertising, we generally seek to build and increase brand awareness by linking the Skechers brand to youthful attitudes for our lifestyle lines, and technology with runners and athletes for our performance lines. Our ads are designed to provide merchandise flexibility and to facilitate the Skechers brand’s direction.
To further build brand awareness and influence consumer spending, we have selectively signed endorsement agreements with celebrities whom we believe will reach new markets. Our Skechers lifestyle endorsees Demi Lovato, Brooke Burke-Charvet, Mark Cuban, Joe Montana, Joe Namath, Pete Rose and Tommy Lasorda all appeared in advertising campaigns in 2014. Additionally, we signed Mariano Riviera and Ringo Starr, who are set to appear in campaigns in 2015. Our Skechers Performance Division endorsees are elite runner and Olympic medalist Meb and elite runner Kara Goucher, who both appeared in marketing campaigns during 2014. Competing in Skechers GO speed footwear, Meb won the Boston Marathon in 2014. To launch our Skechers GO golf line, we signed leading golfer Matt Kuchar, who has and will continue to appear in marketing campaigns in 2015. From time to time, we may sign other celebrities to endorse our brand name and image in order to strategically market our products among specific consumer groups in the future.
With a targeted approach, our print ads appear regularly in popular fashion, lifestyle and pop culture publications, including Runner’s World, Shape, Seventeen, Men’s Fitness, Women’s Fitness, Women’s Health, People, Us Weekly, and OK!, among others. Our advertisements also appear in international magazines around the world.
Our television commercials are produced both in-house and through producers that we have utilized in the past who are familiar with our brands. In 2014, we developed commercials for men, women and children for our Skechers brands, including our animated spots for kids featuring our own action heroes. We also have many commercials for our performance lines that feature elite athletes and for our lifestyle lines that feature retired athletes, musicians, and actors. We have found these to be a cost-effective way to advertise on key national and cable programming during high selling seasons. In 2014, many of our television commercials were translated into multiple languages and aired in Brazil, Canada, the United Kingdom, France, the Benelux Region, Germany, Spain, Italy, Chile, Japan, Austria, Switzerland, China and Mexico, among other countries.
Outdoor. In an effort to reach consumers where they shop and in high-traffic areas as they travel to and from work, we continued our outdoor campaign that included mall and telephone kiosks, billboards, and transportation systems in the Americas, Asia, the Middle East and across Europe. In addition, we advertised on perimeter boards at soccer matches in several European countries. We believe these are effective and efficient ways to reach a broad range of consumers and leave a lasting impression for our brands.
Trend-Influenced Marketing/Public Relations. Our public relations objectives are to secure product placement in key fashion and lifestyle magazines and television shows, place our footwear on the feet of trend-setting celebrities and their children, and gain positive and accurate press about our brands, our Company and our products. We have amassed an array of prominent product placements in magazines including OK!, Us Weekly, Runner’s World and Competitor, and have been featured on leading business shows with interviews of our executives providing exposure of our brand to consumers who might not be familiar with our products. In addition, our brands have been associated with cutting edge events and various celebrities.
Social Media. With the goal of engaging with consumers, showcasing our product in relatable settings, and relaying the latest news, we have built communities on Facebook, Twitter, and Instagram in the United States and in many countries around the world. The social platforms are divided into Skechers and Skechers Performance sites as well as a BOBS page to feature our charitable footwear line. The online communities also connect consumers around the world, allowing an easy glimpse into trends and events in other countries.
8
Table of Contents
Promotions and Events. By applying creative sales techniques via a broad spectrum of media, our marketing team seeks to build brand recognition and drive traffic to Skechers’ retail stores, websites and our retail partners’ locations. Skechers’ promotional strategies have encompassed in-store specials, charity events, product tie-ins and giveaways, and collaborations with national retailers and radio stations. In 2014, we appeared at walks and at numerous marathons in Boston, New York, London, Paris, Santiago and other cities with Skechers Performance branded booths to allow runners the ability to try on and often buy our products. In 2014, the Skechers Performance Division became the footwear and apparel sponsor for the Houston Marathon. Our products were made available to consumers directly or through key accounts at many of these events. In addition, we partnered with many key accounts for BOBS donation events in cities throughout the United States, Puerto Rico and Spain, building both our relationships with these accounts, as well as with the community as we donated footwear to children in need.
Visual Merchandising. Our in-house visual merchandising department supports wholesale customers, distributors and our retail stores by developing displays that effectively leverage our products at the point of sale. Our point-of-purchase display items include signage, graphics, displays, counter cards, banners and other merchandising items for each of our brands. These materials mirror the look and feel of each brand and reinforce the image as well as draw consumers into stores.
Our visual merchandising coordinators (“VMC’s”) work with our sales force and directly with our customers to ensure better sell-through at the retail level by generating greater consumer awareness through Skechers brand displays. Our VMC’s communicate with and visit our wholesale customers on a regular basis to aid in proper display of our merchandise. They also run in-store promotions to enhance the sale of Skechers footwear and create excitement surrounding the Skechers brand. We believe that these efforts help stimulate impulse sales and repeat purchases.
Trade Shows. To better showcase our diverse products to footwear buyers in the United States and Europe and to distributors around the world, we regularly exhibit at leading trade shows. Along with specialty trade shows, we exhibit at WSA’s The Shoe Show, FFANY, ASR, MAGIC and Outdoor Retailer in the United States; GDS, MICAM, ISPO, Mess Around and Who’s Next in Europe; and Couromoda and Francal in Brazil. Our dynamic, state-of-the-art trade show exhibits showcase our latest product offerings in a setting reflective of each of our brands. By investing in innovative displays and individual rooms showcasing each line, our sales force can present a sales plan for each line and buyers are able to truly understand the breadth and depth of our offerings, thereby optimizing commitments and sales at the retail level.
Internet. We promote and sell our brands through our domestic website, www.skechers.com, as well as our foreign e-commerce sites, which enables fans and customers to shop, browse, find store locations, socially interact, post a shoe review, photo, video, or question and immerse themselves in our brands. Our website is a venue for dialog and feedback from customers about our products which enhances the Skechers brand experience while driving sales through all our retail channels.
PRODUCT DISTRIBUTION CHANNELS
We have four reportable segments — domestic wholesale sales, international wholesale sales, retail sales and e-commerce sales. In the United States, our products are available through a network of wholesale customers comprised of department, athletic and specialty stores and online retailers. Internationally, our products are available through wholesale customers in more than 160 countries and territories via our global network of distributors in addition to our subsidiaries in Asia, Europe, Canada and South America. Skechers owns and operates retail stores both domestically and internationally through three integrated retail formats — concept, factory outlet and warehouse outlet stores. Each of these channels serves an integral function in the global distribution of our products. Twenty-three distributors and 15 licensees have opened 374 distributor-owned or -licensed Skechers retail stores and 118 licensee-owned Skechers retail stores, respectively, in over 60 countries as of December 31, 2014.
Domestic Wholesale. We distribute our footwear through the following domestic wholesale distribution channels: department stores, specialty stores, athletic specialty shoe stores and independent retailers, and internet retailers. While department stores and specialty retailers are the largest distribution channels, we believe that we appeal to a variety of wholesale customers, many of whom may operate stores within the same retail location due to our distinct product lines, variety of styles and the price criteria of their specific customers. Management has a clearly defined growth strategy for each of our channels of distribution. An integral component of our strategy is to offer our accounts the highest level of customer service so that our products will be fully represented in existing retail locations and new locations of each customer.
In an effort to provide knowledgeable and personalized service to our wholesale customers, the sales force is segregated by product line, each of which is headed by a vice president or national sales manager. Reporting to each sales manager are
9
Table of Contents
knowledgeable account executives and territory managers. The vice presidents and national sales managers report to our senior vice president of sales. All of our vice presidents and national sales managers are compensated on a salary basis, while our account executives and territory managers are compensated on a commission basis. None of our domestic sales personnel sells competing products.
We believe that we have developed a loyal customer base through exceptional customer service. We believe that our close relationships with these accounts help us to maximize their retail sell-throughs. Our marketing teams work with our wholesale customers to ensure that our merchandise and marketing materials are properly presented. Sales executives and merchandise personnel work closely with accounts to ensure that appropriate styles are purchased for specific accounts and for specific stores within those accounts as well as to ensure that appropriate inventory levels are carried at each store. Such information is then utilized to help develop sales projections and determine the product needs of our wholesale customers. The value-added services we provide our wholesale customers help us maintain strong relationships with our existing wholesale customers and attract potential new wholesale customers.
Retail Stores. We pursue our retail store strategy through our three integrated retail formats: the concept store, the factory outlet store and the warehouse outlet store. Our three store formats enable us to promote the full Skechers product offering in an attractive environment that appeals to a broad group of consumers. In addition, most of our retail stores are profitable and have a positive effect on our operating results. In 2014, we upgraded the technologies in many of our stores, which provides visibility to our merchandise in other stores and at our distribution center in order to better serve our customers with an omnichannel approach to sales. We periodically review all of our stores for impairment. We prepare a summary of cash flows for each of our retail stores to assess potential impairment of the fixed assets and leasehold improvements. If the assets are considered to be impaired, the impairment we recognize is the amount by which the carrying value of the assets exceeds the fair value of the assets. In addition, we base the useful lives and related amortization or depreciation expense on our estimate of the period that the assets will generate revenues or otherwise be used by us. As of February 15, 2015, we owned and operated 119 concept stores, 146 factory outlet stores and 98 warehouse outlet stores in the United States, and 51 concept stores, 33 factory outlet stores, and three warehouse outlet stores internationally. During 2015, we plan to open 50 to 60 new stores.
| • | Concept Stores |
Our concept stores are located at marquee street locations, major tourist areas or in key shopping malls in metropolitan cities. Our concept stores have a threefold purpose in our operating strategy. First, concept stores serve as a showcase for a wide range of our product offering for the current season, as we estimate that our average wholesale customer carries no more than 5% of the complete Skechers line in any one location. Our concept stores showcase our products in an attractive, easy-to-shop open-floor setting, providing the customer with the complete Skechers story. Second, retail locations are generally chosen to generate maximum marketing value for the Skechers brand name through signage, store front presentation and interior design. Domestic locations include concept stores at Times Square, Union Square and 34th Street in New York, Powell Street in San Francisco, Hollywood and Highland in Hollywood, Santa Monica’s Third Street Promenade, Ala Moana Center in Hawaii and Las Vegas’ Fashion Show Mall. International locations include Westfield London and Westfield Stratford in London, Buchanan Street in Glasgow, Toronto’s Eaton Centre, Vancouver’s Pacific Centre, and Kalverstraat Street in Amsterdam. The stores are typically designed to create a distinctive Skechers look and feel, and enhance customer association of the Skechers brand name with current youthful lifestyle trends and styles. Third, the concept stores serve as marketing and product testing venues. We believe that product sell-through information and rapid customer feedback derived from our concept stores enables our design, sales, merchandising and production staff to respond to market changes and new product introductions. Such responses serve to augment sales and limit our inventory markdowns and customer returns and allowances.
The typical Skechers concept store is approximately 2,500 square feet, although in certain markets we have opened concept stores as large as 7,800 square feet or as small as 800 square feet. When deciding where to open concept stores, we identify top geographic markets in the larger metropolitan cities in North America, Europe, South America and Asia. When selecting a specific site, we evaluate the proposed sites’ traffic pattern, co-tenancies, sales volume of neighboring concept stores, lease economics and other factors considered important within the specific location. If we are considering opening a concept store in a shopping mall, our strategy is to obtain space as centrally located as possible in the mall where we expect foot traffic to be most concentrated. We believe that the strength of the Skechers brand name has enabled us to negotiate more favorable terms with shopping malls that want us to open up concept stores to attract customer traffic to their venues.
10
Table of Contents
| • | Factory Outlet Stores |
Our factory outlet stores are generally located in manufacturers’ direct outlet centers throughout the United States. In addition, we have 33 international factory outlet stores – seven each in England and Canada, four in Spain, three each in Chile and Japan, two each in Germany and Italy, and one each in Austria, the Netherlands, Portugal, Wales and Scotland. Our factory outlet stores provide opportunities for us to sell discontinued and excess merchandise, thereby reducing the need to sell such merchandise to discounters at excessively low prices and potentially compromise the Skechers brand image. Skechers’ factory outlet stores range in size from approximately 1,400 to 9,000 square feet. Unlike our warehouse outlet stores, inventory in these stores is supplemented by certain first-line styles sold at full retail price points.
| • | Warehouse Outlet Stores |
Our free-standing warehouse outlet stores, which are primarily located throughout the United States, enable us to liquidate excess merchandise, discontinued lines and odd-size inventory in a cost-efficient manner. Skechers’ warehouse outlet stores are typically larger than our factory outlet stores and typically range in size from approximately 5,000 to 24,000 square feet. Our warehouse outlet stores enable us to sell discontinued and excess merchandise that would otherwise typically be sold to discounters at excessively low prices, which could otherwise compromise the Skechers brand image. We seek to open our warehouse outlet stores in areas that are in close proximity to our concept stores to facilitate the timely transfer of inventory that we want to liquidate as soon as practicable.
Store count, openings and closings for our domestic, international and joint venture stores are as follows:
| December 31, 2013 | December 31, 2014 | |||||||||||||||
| Number of Store Locations |
Opened during 2014 | Closed during 2014 | Number of Store Locations |
|||||||||||||
| Domestic stores |
||||||||||||||||
| Concept |
123 | 2 | (5 | ) | 120 | |||||||||||
| Factory Outlet |
130 | 17 | (1 | ) | 146 | |||||||||||
| Warehouse Outlet |
68 | 29 | (1 | ) | 96 | |||||||||||
|
|
|
|
|
|
|
|
|
|||||||||
| Domestic stores total |
321 | 48 | (7 | ) | 362 | |||||||||||
|
|
|
|
|
|
|
|
|
|||||||||
| International stores |
||||||||||||||||
| Concept |
43 | 9 | (1 | ) | 51 | |||||||||||
| Factory Outlet |
26 | 7 | — | 33 | ||||||||||||
| Warehouse Outlet |
— | 3 | — | 3 | ||||||||||||
|
|
|
|
|
|
|
|
|
|||||||||
| International stores total |
69 | 19 | (1 | ) | 87 | |||||||||||
|
|
|
|
|
|
|
|
|
|||||||||
| Joint venture stores |
||||||||||||||||
| China Concept |
18 | 9 | (3 | ) | 24 | |||||||||||
| China Factory Outlet |
17 | 7 | (3 | ) | 21 | |||||||||||
| Hong Kong Concept |
20 | 3 | — | 23 | ||||||||||||
| South East Asia Concept |
19 | — | — | 19 | ||||||||||||
|
|
|
|
|
|
|
|
|
|||||||||
| Joint venture stores total |
74 | 19 | (6 | ) | 87 | |||||||||||
|
|
|
|
|
|
|
|
|
|||||||||
| Joint venture shop-in-shops |
||||||||||||||||
| China |
135 | 80 | — | 215 | ||||||||||||
| Hong Kong |
12 | — | (1 | ) | 11 | |||||||||||
| South East Asia |
72 | 15 | (6 | ) | 81 | |||||||||||
|
|
|
|
|
|
|
|
|
|||||||||
| Joint venture shop-in-shops total |
219 | 95 | (7 | ) | 307 | |||||||||||
|
|
|
|
|
|
|
|
|
|||||||||
| Total domestic, international and joint venture stores and shop-in-shops |
683 | 181 | (21 | ) | 843 | |||||||||||
|
|
|
|
|
|
|
|
|
|||||||||
11
Table of Contents
International Wholesale. Our products are sold in more than 160 countries and territories throughout the world. We generate revenues from outside the United States from three principal sources: (i) direct sales to department stores and specialty retail stores in Canada, France, Germany, Spain, Portugal, Italy, Switzerland, Austria, Malaysia, Thailand, Singapore, Hong Kong, China, Japan, India, the Benelux Region, the United Kingdom, Brazil and Chile through our subsidiaries and joint ventures; (ii) sales to foreign distributors who distribute our footwear to department stores and specialty retail stores in countries and territories across Eastern Europe, Asia, Central America, South America, Africa, the Middle East and Australia; and (iii) to a lesser extent, royalties from licensees who manufacture and distribute our non-footwear products outside the United States.
We believe that international distribution of our products represents a significant opportunity to increase net sales and profits. We intend to further increase our share of the international footwear market by heightening our marketing in those countries in which we currently have a presence through our international advertising campaigns, which are designed to establish Skechers as a global brand synonymous with trend-right casual shoes.
| • | International Subsidiaries |
Europe
We currently distribute product in most of Western Europe through the following subsidiaries: Skechers USA Ltd., with its offices and showrooms in London, England; Skechers S.a.r.l., with its offices in Lausanne, Switzerland; Skechers USA France S.A.S., with its offices and showrooms in Paris, France; Skechers USA Deutschland GmbH, with its offices and showrooms in Dietzenbach, Germany; Skechers USA Iberia, S.L., with its offices and showrooms in Madrid, Spain; Skechers USA Benelux B.V., with its offices and showrooms in Waalwijk, the Netherlands; and Skechers USA Italia S.r.l., with its offices and showrooms in Milan, Italy. Skechers-owned retail stores in Europe include 12 concept stores and 20 factory outlet stores located in 10 countries.
To accommodate our European subsidiaries’ operations, we operate an approximately 490,000 square-foot distribution center in Liege, Belgium. During 2014, we completed the initial phase of automation upgrades of our European Distribution Center equipment, allowing us to more efficiently receive and ship product to our subsidiaries and retail stores throughout Europe. Also in 2014, we agreed to lease an additional 290,000 square foot adjoining facility which we expect to occupy by the end of 2015. This additional space will consolidate off-site storage facilities into a single on-site location that will further increase efficiencies and offer storage capacity of up to four million pairs of shoes.
Canada
Merchandising and marketing of our product in Canada is managed by our wholly-owned subsidiary, Skechers USA Canada, Inc. with its offices and showrooms outside Toronto in Mississauga, Ontario. Product sold in Canada is primarily sourced from our U.S. distribution center in Rancho Belago, California. In 2014, we transitioned three licensed stores to company-owned locations. We have 12 concept stores, seven factory outlet stores, and three warehouse outlet stores.
Brazil
Merchandising and marketing of our product in Brazil is managed by our wholly-owned subsidiary, Skechers Do Brasil Calcados LTDA, with its offices located in Sao Paulo, Brazil. Product sold in Brazil is primarily shipped directly from our contract manufacturers’ factories in Vietnam and occasionally from China.
Chile
Our wholly-owned subsidiary, Comercializadora Skechers Chile Limitada, with its offices and showrooms located in Santiago, Chile supports our 29 retail stores and wholesale accounts in Chile. Product sold in Chile is primarily shipped directly from our contract manufacturers’ factories in China and occasionally from Vietnam.
12
Table of Contents
Japan
Merchandising and marketing of our product in Japan is managed by our wholly-owned subsidiary, Skechers Japan GK, with its offices and showrooms located in Tokyo, Japan. Product sold in Japan is primarily shipped directly from our contract manufacturers’ factories in China. We have one concept store in Osaka and three factory outlet stores, one each in Osaka, Narita and Toki.
China and Hong Kong
We have a 50% interest in a joint venture in China and a minority interest in a joint venture in Hong Kong that generate net sales in those countries. Under the joint venture agreements, the joint venture partners contribute capital in proportion to their respective ownership interests. Our retail stores are in key locations in Shanghai, Beijing, Guangzhou, Xiamen, Hong Kong, Macau, and other cities. These joint ventures are included in our consolidated financial statements.
Malaysia and Singapore
We have a 50% interest in a joint venture in Malaysia and Singapore that generate net sales in those countries. Under the joint venture agreement, the joint venture partners contribute capital in proportion to their respective ownership interests. Our retail stores are in key locations in Singapore, Kuala Lumpur, Penang and other cities. These joint ventures are included in our consolidated financial statements.
India
We have a 51% interest in Skechers South Asia Private Limited and a 49% interest in Skechers Retail India Private Limited, which are both joint ventures, that generate net sales in India. Under the joint venture agreements, the joint venture partners contribute capital in proportion to their respective ownership interests. Our retail stores are in key locations in Mumbai, New Delhi, and Pune. These joint ventures are included in our consolidated financial statements.
13
Table of Contents
| • | Distributors and Licensees |
Where we do not sell directly through our international subsidiaries and joint ventures, our footwear is distributed through an extensive network of more than 30 distributors who sell our products to department, athletic and specialty stores in more than 160 countries around the world. As of December 31, 2014, we also had agreements with 23 of these distributors and 15 licensees regarding 374 distributor-owned or -licensed Skechers retail stores and 118 licensee-owned Skechers retail stores, respectively, that are open in over 60 countries. Our distributors and licensees own and operate the following retail stores:
| December 31, 2013 | December 31, 2014 | |||||||||||||||
| Number of Store Locations |
Opened during 2014 | Closed during 2014 | Number of Store Locations |
|||||||||||||
| Distributor and licensee stores |
||||||||||||||||
| North America Concept |
36 | 12 | (4 | ) | 44 | |||||||||||
| North America Factory Outlet |
8 | 5 | (2 | ) | 11 | |||||||||||
| Central America Concept |
8 | 2 | — | 10 | ||||||||||||
| Central America Factory Outlet |
1 | — | — | 1 | ||||||||||||
| South America Concept |
39 | 2 | (15 | ) | 26 | |||||||||||
| South America Factory Outlet |
1 | — | — | 1 | ||||||||||||
| Africa Concept |
15 | 11 | — | 26 | ||||||||||||
| Asia Concept |
169 | 50 | (5 | ) | 214 | |||||||||||
| Asia Factory Outlet |
16 | 4 | (2 | ) | 18 | |||||||||||
| Australia/New Zealand Concept |
11 | 10 | — | 21 | ||||||||||||
| Australia/New Zealand Factory Outlet |
11 | 1 | (1 | ) | 11 | |||||||||||
| Europe Concept |
33 | 28 | (1 | ) | 60 | |||||||||||
| Europe Factory Outlet |
3 | 2 | (1 | ) | 4 | |||||||||||
| Middle East Concept |
36 | 11 | (4 | ) | 43 | |||||||||||
| Middle East Factory Outlet |
1 | 1 | — | 2 | ||||||||||||
|
|
|
|
|
|
|
|
|
|||||||||
| Total distributor and licensee stores |
388 | 139 | (35 | ) | 492 | |||||||||||
| Distributor and licensee shop-in-shops |
||||||||||||||||
| International shop-in-shops |
2,258 | — | (366 | ) | 1,892 | |||||||||||
|
|
|
|
|
|
|
|
|
|||||||||
| Total Distributor and licensee stores and shop-in-shops |
2,646 | 139 | (401 | ) | 2,384 | |||||||||||
|
|
|
|
|
|
|
|
|
|||||||||
Distributors and licensees are responsible for their respective stores’ operations, have ownership of their respective stores’ assets, and select the broad collection of our products to sell to consumers in their regions. In order to maintain a globally consistent image, we provide architectural, graphic and visual guidance and materials for the design of the stores, and we train the local staff on our products and corporate culture. We intend to expand our international presence and global recognition of the Skechers brand name by continuing to sell our footwear to foreign distributors and by opening flagship retail stores with distributors that have local market expertise.
Electronic Commerce. Our domestic website, www.skechers.com, as well as our foreign e-commerce sites, are virtual storefronts that promote the Skechers brands. Our websites are designed to provide a positive shopping and brand experience, showcasing our products in an easy-to-navigate format, allowing consumers to browse our selections and purchase our footwear. These virtual stores provide a convenient, alternative shopping environment and brand experience. These websites are an additional efficient and effective retail distribution channel, and has improved our customer service.
14
Table of Contents
For disclosure of financial information about geographic areas and segment information for our four reportable segments – domestic wholesale sales, international wholesale sales, retail sales and e-commerce sales — see Note 13 — Segment Information in the consolidated financial statements included in this annual report.
LICENSING
We believe that selective licensing of the Skechers brand name and our product line names to manufacturers may broaden and enhance the individual brands without requiring significant capital investments or additional incremental operating expenses. Our multiple product lines plus additional subcategories present many potential licensing opportunities on terms with licensees that we believe will provide more effective manufacturing, distribution or marketing of non-footwear products. We also believe that the reputation of Skechers and its history in launching brands has also enabled us to partner with reputable non-footwear brands to design and market their footwear.
As of January 31, 2015, we had 25 active domestic and international licensing agreements in which we are the licensor. These include Skechers branded bags, backpacks and lunch boxes, belts, wallets and headwear, socks, eyewear and watches, Skechers Performance sport apparel, socks and wearable technology, BOBS from Skechers apparel, and Twinkle Toes apparel, dolls, toys, and fashion accessories. We have international licensing agreements for the design and distribution of men’s and women’s apparel in Chile, Israel, the Philippines, the United Kingdom, and South Korea; bags, backpacks and luggage in Mexico; and watches in the Philippines.
DISTRIBUTION FACILITIES AND OPERATIONS
We believe that strong distribution support is a critical factor in our operations. Once manufactured, our products are packaged in shoe boxes bearing bar codes that are shipped either: (i) to our approximate 1.8 million square-foot distribution center located in Rancho Belago, California, (ii) to our approximately 490,000 square-foot European Distribution Center (“EDC”) located in Liege, Belgium, (iii) our company operated distribution centers or third-party distribution centers in South America and Asia or (vi) directly from third-party manufacturers to our other international customers and other international third-party distribution centers. Upon receipt at either of the distribution centers, merchandise is inspected and recorded in our management information system and packaged according to customers’ orders for delivery. Merchandise is shipped to customers by whatever means each customer requests, which is usually by common carrier. The distribution centers have multi-access docks, enabling us to receive and ship simultaneously, and to pack separate trailers for shipments to different customers at the same time. We have an electronic data interchange system, or EDI system, to which some of our larger customers are linked. This system allows these customers to automatically place orders with us, thereby eliminating the time involved in transmitting and inputting orders, and it includes direct billing and shipping information.
BACKLOG
As of December 31, 2014, our backlog was $988.7 million, compared to $616.1 million as of December 31, 2013. Backlog orders are subject to cancellation by customers, as evidenced by order cancellations that we have experienced in the past, due to the weakened U.S. economy and shifting footwear trends. For a variety of reasons, including changes in the economy, customer demand for our products, the timing of shipments, product mix of customer orders, the amount of in-season orders and a shift towards tighter shipment lead times, our backlog may not be a reliable measure of future sales for any succeeding period.
INTELLECTUAL PROPERTY RIGHTS
We own and utilize a variety of trademarks, including the Skechers trademark. We have a significant number of both registrations and pending applications for our trademarks in the United States. In addition, we have trademark registrations and trademark applications in approximately 124 foreign countries. We also have design patents and pending design and utility patent applications in both the United States and approximately 21 foreign countries. We continuously look to increase the number of our patents and trademarks both domestically and internationally where necessary to protect valuable intellectual property. We regard our trademarks and other intellectual property as valuable assets and believe that they have significant value in the marketing of our products. We vigorously protect our trademarks against infringement, including through the use of cease and desist letters, administrative proceedings and lawsuits.
We rely on trademark, patent, copyright and trade secret protection, non-disclosure agreements and licensing arrangements to establish, protect and enforce intellectual property rights in our logos, trade names and in the design of our products. In particular, we
15
Table of Contents
believe that our future success will largely depend on our ability to maintain and protect the Skechers trademark and other key trademarks. Despite our efforts to safeguard and maintain our intellectual property rights, we cannot be certain that we will be successful in this regard. Furthermore, we cannot be certain that our trademarks, products and promotional materials or other intellectual property rights do not, or will not, violate the intellectual property rights of others, that our intellectual property would be upheld if challenged, or that we would, in such an event, not be prevented from using our trademarks or other intellectual property rights. Such claims, if proven, could materially and adversely affect our business, financial condition and results of operations. In addition, although any such claims may ultimately prove to be without merit, the necessary management attention to and legal costs associated with litigation or other resolution of future claims concerning trademarks and other intellectual property rights could materially and adversely affect our business, financial condition and results of operations. We have sued and have been sued by third parties for infringement of intellectual property. It is our opinion that none of these claims has materially impaired our ability to utilize our intellectual property rights.
The laws of certain foreign countries do not protect intellectual property rights to the same extent, or in the same manner, as do the laws of the United States. Although we continue to implement protective measures and intend to defend our intellectual property rights vigorously, these efforts may not be successful or the costs associated with protecting our rights in certain jurisdictions may be prohibitive. From time to time we discover products in the marketplace that are counterfeit reproductions of our products or that otherwise infringe upon intellectual property rights held by us. Actions taken by us to establish and protect our trademarks and other intellectual property rights may not be adequate to prevent imitation of our products by others or to prevent others from seeking to block sales of our products as violating trademarks and intellectual property rights. If we are unsuccessful in challenging a third party’s products on the basis of infringement of our intellectual property rights, continued sales of such products by that or any other third party could adversely impact the Skechers brand, result in the shift of consumer preferences away from our products and generally have a material adverse effect on our business, financial condition and results of operations.
COMPETITION
The footwear industry is a competitive business. Although we believe that we do not compete directly with any single company with respect to its entire range of products, our products compete with other branded products within their product category as well as with private label products sold by retailers, including some of our customers. Our casual shoes and utility footwear compete with footwear offered by companies such as Columbia Sportswear Company, Converse by Nike, Inc., Deckers Outdoor Corporation, Kenneth Cole Productions Inc., Steven Madden, Ltd., The Timberland Company, V.F. Corporation and Wolverine World Wide, Inc. Our athletic lifestyle and performance shoes compete with footwear offered by companies such as Nike, Inc., adidas AG, Reebok International Ltd., Puma AG, ASICS America Corporation, New Balance Athletic Shoe, Inc. and Under Armour, Inc. The intense competition among these companies and the rapid changes in technology and consumer preferences in the markets for performance footwear, including the walking fitness category, constitute significant risk factors in our operations. Our children’s shoes compete with footwear offered by these companies and others including Payless Holdings, and with other brands such as Stride Rite by Wolverine World Wide, Inc. In varying degrees, depending on the product category involved, we compete on the basis of style, price, quality, comfort and brand name prestige and recognition, among other considerations. These and other competitors pose challenges to our market share in our major domestic markets and may make it more difficult to establish our products in Europe, Asia and other international regions. We also compete with numerous manufacturers, importers and distributors of footwear for the limited shelf space available for the display of such products to the consumer. Moreover, the general availability of contract manufacturing capacity allows ease of access by new market entrants. Many of our competitors are larger, have been in existence for a longer period of time, have achieved greater recognition for their brand names, have captured greater market share and/or have substantially greater financial, distribution, marketing and other resources than we do. We cannot be certain that we will be able to compete successfully against present or future competitors, or that competitive pressures will not have a material adverse effect on our business, financial condition and results of operations.
EMPLOYEES
As of January 31, 2015, we employed 7,772 persons, 2,944 of whom were employed on a full-time basis and 4,828 of whom were employed on a part-time basis, primarily in our retail stores. None of our employees are subject to a collective bargaining agreement. We believe that our relations with our employees are satisfactory.
16
Table of Contents
| ITEM 1A. | RISK FACTORS |
In addition to the other information in this annual report, the following factors should be considered in evaluating us and our business.
Our Future Success Depends On Our Ability To Maintain Our Brand Name And Image With Consumers.
Our success to date has in large part been due to the strength of the Skechers brand. Maintaining, promoting and growing our brand name and image depends on sustained effort and commitment to, and significant investment in, both the successful development of high-quality, innovative, fashion forward products, and fresh and relevant marketing and advertising campaigns. Even if we are able to timely and appropriately respond to changing consumer preferences and trends with new high-quality products, our marketing and advertising campaigns may not resonate with consumers, or consumers may consider our brand to be outdated or associated with footwear styles that are no longer popular or relevant. Our brand name and image with consumers could also be negatively impacted if we or any of our products were to receive negative publicity, whether related to our products or otherwise. If we are unable to maintain, promote and grow our brand image, then our business, financial condition and results of operations could be materially and adversely affected.
Our Future Success Also Depends On Our Ability To Respond To Changing Consumer Preferences, Identify And Interpret Consumer Trends, And Successfully Market New Products.
The footwear industry is subject to rapidly changing consumer preferences. The continued popularity of our footwear and the development of new lines and styles of footwear with widespread consumer appeal, including consumer acceptance of our performance footwear, requires us to accurately identify and interpret changing consumer trends and preferences, and to correctly respond in a timely manner. Continuing demand and market acceptance for both existing and new products are uncertain and depend on the following factors:
| • | substantial investment in product innovation, design and development; |
| • | commitment to product quality; and |
| • | significant and sustained marketing efforts and expenditures, including with respect to the monitoring of consumer trends in footwear specifically, and in fashion and lifestyle categories generally. |
In assessing our response to anticipated changing consumer preferences and trends, we frequently must make decisions about product designs and marketing expenditures several months in advance of the time when actual consumer acceptance can be determined. As a result, we may not be successful in responding to shifting consumer preferences and trends with new products that achieve market acceptance. Because of the ever changing nature of consumer preferences and market trends, a number of companies in the footwear industry, including ours, experience periods of both rapid growth, followed by declines, in revenue and earnings. If we fail to identify and interpret changing consumer preferences and trends, or are not successful in responding to these changes with the timely development of products that achieve market acceptance, we could experience excess inventories, higher than normal markdowns, returns, order cancellations or an inability to profitably sell our products, and our business, financial condition and results of operations could be materially and adversely affected.
Our Business Could Be Harmed If We Fail To Maintain Proper Inventory Levels.
We place orders with our manufacturers for some of our products prior to the time we receive all of our customers’ orders. We do this to minimize purchasing costs, the time necessary to fill customer orders and the risk of non-delivery. We also maintain an inventory of certain products that we anticipate will be in greater demand. Any unanticipated decline in the popularity of Skechers footwear or other unforeseen circumstances may make it difficult for us and our customers to accurately forecast product demand trends, and we may be unable to sell the products we have ordered in advance from manufacturers or that we have in our inventory. Inventory levels in excess of customer demand may result in inventory write-downs and the sale of excess inventory at discounted prices, which could significantly impair our brand image and have a material adverse effect on our operating results and financial condition. Conversely, if we underestimate consumer demand for our products or if our manufacturers fail to supply the quality products that we require at the time we need them, we may experience inventory shortages. Inventory shortages might delay shipments to customers, negatively impact retailer and distributor relationships, and diminish brand loyalty.
17
Table of Contents
We Face Intense Competition, Including Competition From Companies With Significantly Greater Resources Than Ours, And If We Are Unable To Compete Effectively With These Companies, Our Market Share May Decline And Our Business Could Be Harmed.
We face intense competition in the footwear industry from other established companies. Our competitors’ product offerings, pricing, costs of production, and advertising and marketing expenditures are highly competitive areas in our business. If we do not adequately and timely anticipate and respond to our competitors, consumer demand for our products may decline significantly. In addition, a number of our competitors have significantly greater financial, technological, engineering, manufacturing, marketing and distribution resources than we do. Their greater capabilities in these areas may enable them to better withstand periodic downturns in the footwear industry, compete more effectively on the basis of price and production, and more quickly develop new products. New companies may also enter the markets in which we compete, further increasing competition in the footwear industry. We may not be able to compete successfully in the future, and increased competition may result in price reductions, cost increases, reduced profit margins, loss of market share and an inability to generate cash flows that are sufficient to maintain or expand our development and marketing of new products, which would materially adversely impact our business, results of operations and financial condition.
We Continue To Face Many New Challenges In The Highly Competitive Performance Footwear Market.
Although the design and aesthetics of our products have traditionally been the most important factors in consumer acceptance of our footwear, we began incorporating technical innovations into certain of our product offerings in late 2008 and since then have continued to develop and introduce new performance footwear. The performance footwear market is keenly competitive in the United States and worldwide, and the newer entrants in that market including our company face many challenges. Negative consumer perceptions of our performance features due to our historical reputation as a fashion and lifestyle footwear company, product offerings and technologies from our competitors, and failure to keep up with rapid changes in footwear technology and consumer preferences may constitute significant risk factors in our strategy and may negatively impact our business.
Our Operating Results Could Be Negatively Impacted If Our Sales Are Concentrated In Any One Style Or Group Of Styles.
If any single style or group of similar styles of our footwear were to represent a substantial portion of our net sales, we could be exposed to risk should consumer demand for such style or group of styles decrease in subsequent periods. We attempt to mitigate this risk by offering a broad range of products, and no style comprised over 5% of our gross wholesale sales during 2014 or 2013. However, this may change in the future and fluctuations in sales of any given style that represents a significant portion of our future net sales could have a negative impact on our operating results.
The Uncertainty Of Global Market Conditions May Continue To Have A Negative Impact On Our Business, Results Of Operations Or Financial Condition.
While global economic conditions have recently improved slightly, its uncertain state continues to negatively impact our business, which depends on the general economic environment and levels of consumers’ discretionary spending that affect not only the ultimate consumer, but also retailers, who are our primary direct customers. If the current economic situation does not improve or if it weakens, we may not be able to maintain or increase our sales to existing customers, make sales to new customers, open and operate new retail stores, maintain sales levels at our existing stores, maintain or increase our international operations on a profitable basis, or maintain or improve our earnings from operations as a percentage of net sales. Additionally, if there is an unexpected decline in sales, our results of operations will depend on our ability to implement a corresponding and timely reduction in our costs and manage other aspects of our operations. These challenges include (i) managing our infrastructure, (ii) hiring and maintaining, as required, the appropriate number of qualified employees, (iii) managing inventory levels and (iv) controlling other expenses. If the uncertain global market conditions continue for a significant period of time or worsen, our results of operations, financial condition, and cash flows could be materially adversely affected.
Our Business Could Be Adversely Affected By Changes In The Business Or Financial Condition Of Significant Customers Due To Global Economic Conditions.
The global financial crisis affected the banking system and financial markets and resulted in a tightening in the credit markets, more stringent lending standards and terms, and higher volatility in fixed income, credit, currency and equity markets. There could be a number of follow-on effects from the credit crisis on our business, including insolvency of certain of our key distributors, which could impair our distribution channels, or our significant customers, including our distributors, may experience diminished liquidity or an inability to obtain credit to finance purchases of our product. Our customers may also experience weak demand for our products or
18
Table of Contents
other difficulties in their businesses. If conditions in the global financial markets deteriorate in the future, demand may be lower than forecasted and insufficient to achieve our anticipated financial results. Any of these events would likely harm our business, results of operations and financial condition.
We Depend Upon A Relatively Small Group Of Customers For A Large Portion Of Our Sales.
During 2014, 2013 and 2012, our net sales to our five largest customers accounted for approximately 15.7%, 18.1% and 18.1% of total net sales, respectively. No customer accounted for more than 10.0% of our net sales during 2014, 2013 and 2012. No customer accounted for more than 10.0% of net trade receivables at December 31, 2014 and 2013. Although we have long-term relationships with many of our customers, our customers do not have a contractual obligation to purchase our products and we cannot be certain that we will be able to retain our existing major customers. Furthermore, the retail industry regularly experiences consolidation, contractions and closings which may result in our loss of customers or our inability to collect accounts receivable of major customers. If we lose a major customer, experience a significant decrease in sales to a major customer or are unable to collect the accounts receivable of a major customer, our business could be harmed.
Our Quarterly Revenues And Operating Results Fluctuate As A Result Of A Variety Of Factors, Including Seasonal Fluctuations In Demand For Footwear, Delivery Date Delays And Potential Fluctuations In Our Estimated Annualized Tax Rate, Which May Result In Volatility Of Our Stock Price.
Our quarterly revenues and operating results have varied significantly in the past and can be expected to fluctuate in the future due to a number of factors, many of which are beyond our control. Our major customers have no obligation to purchase forecasted amounts, may and have canceled orders, and may change delivery schedules or change the mix of products ordered with minimal notice and without penalty. As a result, we may not be able to accurately predict our quarterly sales. In addition, sales of footwear products have historically been somewhat seasonal in nature with the strongest sales generally occurring in our second and third quarters for the back-to-school selling season. Back-to-school sales typically ship in June, July and August, and delays in the timing, cancellation, or rescheduling of these customer orders and shipments by our wholesale customers could negatively impact our net sales and results of operations for our second or third quarters. More specifically, the timing of when products are shipped is determined by the delivery schedules set by our wholesale customers, which could cause sales to shift between our second and third quarters. Because our expense levels are partially based on our expectations of future net sales, our expenses may be disproportionately large relative to our revenues, and we may be unable to adjust spending in a timely manner to compensate for any unexpected revenue shifts, which could have a material adverse effect on our operating results.
Our annualized tax rate is based on projections of our domestic and international operating results for the year, which we review and revise as necessary at the end of each quarter, and it is highly sensitive to fluctuations in projected international earnings. Any quarterly fluctuations in our annualized tax rate that may occur could have a material impact on our quarterly operating results. As a result of these specific and other general factors, our operating results will likely vary from quarter to quarter and the results for any particular quarter may not be necessarily indicative of results for the full year. Any shortfall in revenues or net earnings from levels expected by securities analysts and investors could cause a decrease in the trading price of our Class A Common Stock.
Our Business Could Be Adversely Affected By A Labor Dispute At Ports In Los Angeles And Long Beach.
The International Longshoremen and Warehouse Union’s labor agreement with the Pacific Maritime Association regarding the dockworkers at 29 West Coast ports, including Los Angeles and Long Beach, expired on June 30, 2014. The parties were engaged in a long-running dispute while the dockworkers were working without an agreement until a tentative agreement following mediation was reached on February 20, 2015. However, as of February 27, 2015, the new five-year agreement had not been officially ratified by both parties. All product that is sent from third-party manufacturers to our domestic distribution center in Rancho Belago, California arrives via cargo ship at the ports in Los Angeles and Long Beach. If the new agreement is not officially ratified by the parties and a slow-down, strike or other disruption occurs that interrupts operations at the ports in Los Angeles and Long Beach, shipping container charges on cargo shipped from Asia to these ports can be expected to increase. If operations at the ports are interrupted for an extended period of time, we would also be forced to consider more costly shipping alternatives such as air transportation or shipping to ports located outside of the Los Angeles area, in which case we would have to incur additional trucking charges to transport product over longer distances from those ports to our domestic distribution center. Extended delays at the Los Angeles and Long Beach ports could also lead to backlogs at other ports, which could slow the delivery of our product. While we are currently only 7-10 days behind in the receipt of incoming product from overseas, any extended delays could result in missed sales due to a potential backlog of product for the back-to-school selling season that typically starts in June. If the parties fail to officially ratify the new agreement, any subsequent slow-downs, strikes or other disruptions at these ports, especially for an extended period of time, may have a material adverse effect on our business, relationships with our customers and results of operations.
Our International Sales And Manufacturing Operations Are Subject To The Risks Of Doing Business Abroad, Particularly In China, Which Could Affect Our Ability To Sell Or Manufacture Our Products In International Markets, Obtain Products From Foreign Suppliers Or Control The Costs Of Our Products.
Substantially all of our net sales during the year ended December 31, 2014 were derived from sales of footwear manufactured in foreign countries, with most manufactured in China and Vietnam. We also sell our footwear in several foreign countries and plan to increase our international sales efforts as part of our growth strategy. Foreign manufacturing and sales are subject to a number of risks, including the following: political and social unrest, including terrorism; changing economic conditions, including higher labor costs; increased costs of raw materials; currency exchange rate fluctuations; labor shortages and work stoppages; electrical shortages; transportation delays; loss or damage to products in transit; expropriation; nationalization; the adjustment, elimination or imposition of domestic and international duties, tariffs, quotas, import and export controls and other non-tariff barriers; exposure to different legal standards (particularly with respect to intellectual property); compliance with foreign laws; and changes in domestic and foreign governmental policies. We have not, to date, been materially affected by any such risks, but we cannot predict the likelihood of such developments occurring or the resulting long-term adverse impact on our business, results of operations or financial condition.
In particular, because most of our products are manufactured in China, the possibility of adverse changes in trade or political relations with China, political instability in China, increases in labor costs, the occurrence of prolonged adverse weather conditions or
19
Table of Contents
a natural disaster such as an earthquake or typhoon in China, or the outbreak of a pandemic disease in China could severely interfere with the manufacturing and/or shipment of our products and would have a material adverse effect on our operations. In addition, electrical shortages, labor shortages or work stoppages may extend the production time necessary to produce our orders, and there may be circumstances in the future where we may have to incur premium freight charges to expedite the delivery of product to our customers. If we incur a significant amount of premium charges to airfreight product for our customers, our gross profit will be negatively affected if we are unable to collect those charges.
The Potential Imposition Of Additional Duties, Quotas, Tariffs And Other Trade Restrictions Could Have An Adverse Impact On Our Sales And Profitability.
All of our products manufactured overseas and imported into the United States, the European Union (“EU”) and other countries are subject to customs duties collected by customs authorities. Customs information submitted by us is routinely subject to review by customs authorities. We are unable to predict whether additional customs duties, quotas, tariffs, anti-dumping duties, safeguard measures, cargo restrictions to prevent terrorism or other trade restrictions may be imposed on the importation of our products in the future. Such actions could result in increases in the cost of our products generally and might adversely affect the sales and profitability of Skechers and the imported footwear industry as a whole.
Many Of Our Retail Stores Depend Heavily On The Customer Traffic Generated By Shopping And Factory Outlet Malls Or By Tourism.
Many of our concept stores are located in shopping malls and some of our factory outlet stores are located in manufacturers’ outlet malls where we depend on obtaining prominent locations and the overall success of the malls to generate customer traffic. We cannot control the success of individual malls, and an increase in store closures by other retailers may lead to mall vacancies and reduced foot traffic. Some of our concept stores occupy street locations that are heavily dependent on customer traffic generated by tourism. Any substantial decrease in tourism resulting from an economic slowdown, political, social or military events or otherwise, is likely to adversely affect sales in our existing stores, particularly those with street locations. The effects of these factors could reduce sales of particular existing stores or hinder our ability to open retail stores in new markets, which could negatively affect our operating results.
We Rely On Independent Contract Manufacturers And, As A Result, Are Exposed To Potential Disruptions In Product Supply.
Our footwear products are currently manufactured by independent contract manufacturers. During 2014 and 2013, the top five manufacturers of our products produced approximately 58.9% and 59.9% of our total purchases, respectively. One manufacturer accounted for 37.5% and 37.8% of total purchases during 2014 and 2013, respectively. One other manufacturer accounted for 6.1% and 7.1% of our total purchases during 2014 and 2013, respectively. We do not have long-term contracts with manufacturers and we compete with other footwear companies for production facilities. We could experience difficulties with these manufacturers, including reductions in the availability of production capacity, failure to meet our quality control standards, failure to meet production deadlines or increased manufacturing costs. This could result in our customers canceling orders, refusing to accept deliveries or demanding reductions in purchase prices, any of which could have a negative impact on our cash flow and harm our business.
If our current manufacturers cease doing business with us, we could experience an interruption in the manufacture of our products. Although we believe that we could find alternative manufacturers, we may be unable to establish relationships with alternative manufacturers that will be as favorable as the relationships we have now. For example, new manufacturers may have higher prices, less favorable payment terms, lower manufacturing capacity, lower quality standards or higher lead times for delivery. If we are unable to provide products consistent with our standards or the manufacture of our footwear is delayed or becomes more expensive, our business would be harmed.
Our Business Could Be Harmed If Our Contract Manufacturers, Suppliers Or Licensees Violate Labor, Trade Or Other Laws.
We require our independent contract manufacturers, suppliers and licensees to operate in compliance with applicable laws and regulations. Manufacturers are required to certify that neither convicted, forced or indentured labor (as defined under United States law) nor child labor (as defined by law in the manufacturer’s country) is used in the production process, that compensation is paid in accordance with local law and that their factories are in compliance with local safety regulations. Although we promote ethical business practices and our sourcing personnel periodically visit and monitor the operations of our independent contract manufacturers, suppliers and licensees, we do not control them or their labor practices. If one of our independent contract manufacturers, suppliers or
20
Table of Contents
licensees violates labor or other laws or diverges from those labor practices generally accepted as ethical in the United States, it could result in adverse publicity for us, damage our reputation in the United States or render our conduct of business in a particular foreign country undesirable or impractical, any of which could harm our business.
In addition, if we, or our foreign manufacturers, violate United States or foreign trade laws or regulations, we may be subject to extra duties, significant monetary penalties, the seizure and the forfeiture of the products we are attempting to import or the loss of our import privileges. Possible violations of United States or foreign laws or regulations could include inadequate record keeping of our imported products, misstatements or errors as to the origin, quota category, classification, marketing or valuation of our imported products, fraudulent visas or labor violations. The effects of these factors could render our conduct of business in a particular country undesirable or impractical and have a negative impact on our operating results.
The Toning Footwear Category Has Come Under Public And Regulatory Scrutiny That May Have A Material Negative Impact On Our Business And Results Of Operations.
Since 2010, the toning footwear product category, including our Shape-ups products, has come under significant public scrutiny, such as highly publicized negative professional opinions, negative publicity and media attention, personal injury lawsuits and attorneys publicly marketing their services to consumers allegedly injured by toning products, including Shape-ups. In addition, we have been responding to inquiries by state, federal, and foreign governmental and quasi-governmental regulators regarding the claims, advertising, and safety of our toning products, and are engaged as defendants in civil lawsuits that involve similar claims. This public and regulatory scrutiny has included the questioning of our advertising, promotional claims, and the overall safety of these products, as well as allegations of personal injuries. We believe that Shape-ups and our other toning products are safe, but the negative publicity from this public and regulatory scrutiny appears to have had a negative impact on sales of toning footwear generally and our Shape-ups products in particular. We are not able to predict whether such negative publicity, regulatory review and related litigation will continue or what the continued effect will be on the sales of our Shape-up products, our business, and our results of operations beyond that included in this annual report. Further details regarding these legal and regulatory matters are discussed in greater detail under “Legal Proceedings” in Part I, Item 3 of this annual report.
It Is Difficult To Predict The Effect Of Regulatory Inquiries About Advertising And Promotional Claims Related To Our Toning Shoe Products.
The toning footwear market is dominated by a handful of competitors who design, market and advertise their products to promote fitness benefits associated with wearing the footwear. Advertising that promotes fitness benefits associated with the toning footwear market has come under review from state, federal, and foreign governmental and quasi-governmental regulators. As discussed in greater detail under “Legal Proceedings” in Part I, Item 3 of this annual report, we announced on May 16, 2012 that we had settled all domestic legal proceedings relating to advertising claims made in connection with the marketing of our toning shoe products. Under the terms of the global settlement—without admitting any fault or liability, with no findings being made that our company had violated any law, and with no fines or penalties being imposed—we made payments in the aggregate amount of $50 million to settle all domestic advertising class action lawsuits and related claims brought by the FTC and the SAGs. On November 8, 2012, we were served with a Grand Jury Subpoena (“Subpoena”) that was issued by a Grand Jury of the United States District Court for the Northern District of Ohio, in Cleveland, Ohio for documents and information relating to past advertising claims for our toning footwear, including Shape-ups and Resistance Runners. The Subpoena, which seeks documents and information related to outside studies conducted on our toning footwear, appears related to the FTC’s inquiry into our claims and advertising for Shape-ups and our other toning shoe products. The Grand Jury investigation is in its early stages and we are fully cooperating in the process of producing documents and other information requested. The Assistant United States Attorney has informed us that neither we nor our employees are targets at the present time. Although we do not believe this Grand Jury investigation will have a material adverse impact on our results of operations or financial position, it is too early to predict the timing and outcome of this investigation, if there will be any additional regulatory inquiries or whether the final resolution of these matters could have a material adverse impact on our advertising, promotional claims, business, results of operations and financial position.
Our Strategies Involve A Number Of Risks That Could Prevent Or Delay The Successful Opening Of New Stores As Well As Negatively Impact The Performance Of Our Existing Stores.
Our ability to open and operate new stores successfully depends on many factors, including, among others: our ability to identify suitable store locations, the availability of which is outside of our control; negotiate acceptable lease terms, including desired tenant improvement allowances; source sufficient levels of inventory to meet the needs of new stores; hire, train and retain store personnel; successfully integrate new stores into our existing operations; and satisfy the fashion preferences in new geographic areas.
21
Table of Contents
In addition, some or a substantial number of new stores could be opened in regions of the United States in which we currently have few or no stores. Any expansion into new markets may present competitive, merchandising and distribution challenges that are different from those currently encountered in our existing markets. Any of these challenges could adversely affect our business and results of operations. In addition, to the extent that any new store openings are in existing markets, we may experience reduced net sales volumes in existing stores in those markets.
We Depend On Key Personnel To Manage Our Business Effectively In A Rapidly Changing Market, And If We Are Unable To Retain Existing Personnel, Our Business Could Be Harmed.
Our future success depends upon the continued services of Robert Greenberg, Chairman of the Board and Chief Executive Officer; Michael Greenberg, President and a member of our Board of Directors; and David Weinberg, Executive Vice President, Chief Operating Officer, Chief Financial Officer and a member of our Board of Directors. The loss of the services of any of these individuals or any other key employee could harm us. Our future success also depends on our ability to identify, attract and retain additional qualified personnel. Competition for employees in our industry is intense and we may not be successful in attracting and retaining such personnel.
The Disruption, Expense And Potential Liability Associated With Existing And Unanticipated Future Litigation Against Us Could Have A Material Adverse Effect On Our Business, Results Of Operations And Financial Condition.
In addition to the legal matters included in our reserve for loss contingencies, we occasionally become involved in litigation arising from the normal course of business, and we are unable to determine the extent of any liability that may arise from any such unanticipated future litigation. We have no reason to believe that there is a reasonable possibility or a probability our company may incur a material loss, or a material loss in excess of a recorded accrual, with respect to any other such loss contingencies. However, the outcome of litigation is inherently uncertain and assessments and decisions on defense and settlement can change significantly in a short period of time. Therefore, although we consider the likelihood of such an outcome to be remote with respect to those matters for which we have not reserved an amount for loss contingencies, if one or more of these legal matters were resolved against us in the same reporting period for amounts in excess of our expectations, our consolidated financial statements of a particular reporting period could be materially adversely affected. Further, any unanticipated litigation in the future, regardless of its merits, could also significantly divert management’s attention from our operations and result in substantial legal fees being incurred. Such disruptions, legal fees and any losses resulting from these unanticipated future claims could have a material adverse effect on our business, consolidated financial statements and financial condition.
For a discussion of risks related to regulatory inquiries, see the risks discussed on page 21 under “It Is Difficult To Predict The Effect Of Regulatory Inquiries About Advertising And Promotional Claims Related To Our Toning Shoe Products.”
Our Ability To Compete Could Be Jeopardized If We Are Unable To Protect Our Intellectual Property Rights Or If We Are Sued For Intellectual Property Infringement.
We believe that our trademarks, design patents and other proprietary rights are important to our success and our competitive position. We use trademarks on nearly all of our products and believe that having distinctive marks that are readily identifiable is an important factor in creating a market for our goods, in identifying us and in distinguishing our goods from the goods of others. We consider our Skechers®, S in Shield Design, Performance-S Shifted Design, Shape-ups®, Twinkle Toes®, Bella Ballerina™, Skechers GOrun® and Skechers GOwalk® trademarks to be among our most valuable assets, and we have registered these trademarks in many countries. In addition, we own many other trademarks that we utilize in marketing our products. We also have a number of design patents and a limited number of utility patents covering components and features used in various shoes. We believe that our patents and trademarks are generally sufficient to permit us to carry on our business as presently conducted. While we vigorously protect our trademarks against infringement, we cannot guarantee that we will be able to secure patents or trademark protection for our intellectual property in the future or that protection will be adequate for future products. Further, we have been sued for patent and trademark infringement and cannot be sure that our activities do not and will not infringe on the intellectual property rights of others. If we are compelled to prosecute infringing parties, defend our intellectual property or defend ourselves from intellectual property claims made by others, we may face significant expenses and liability as well as the diversion of management’s attention from our business, each of which could negatively impact our business or financial condition.
22
Table of Contents
In addition, the laws of foreign countries where we source and distribute our products may not protect intellectual property rights to the same extent as do the laws of the United States. We cannot assure you that the actions we have taken to establish and protect our trademarks and other intellectual property rights outside the United States will be adequate to prevent imitation of our products by others or, if necessary, successfully challenge another party’s counterfeit products or products that otherwise infringe on our intellectual property rights on the basis of trademark or patent infringement. Continued sales of these products could adversely affect our sales and our brand and result in the shift of consumer preference away from our products. We may face significant expenses and liability in connection with the protection of our intellectual property rights outside the United States, and if we are unable to successfully protect our rights or resolve intellectual property conflicts with others, our business or financial condition could be adversely affected.
Breaches Or Compromises Of Our Information Security Systems, Information Technology Systems And Our Infrastructure To Support Our Business Could Result In Exposure Of Private Information, Disruption Of Our Business And Damage To Our Reputation, Which Could Harm Our Business, Results Of Operation And Financial Condition.
We utilize information security and information technology systems and websites that allow for the secure storage and transmission of proprietary or private information regarding our customers, employees, and others, including credit card information and personal identification information. A security breach may expose us to a risk of loss or misuse of this information, litigation, and potential liability. We may not have the resources or technical sophistication to anticipate or prevent rapidly-evolving types of cyber-attacks. Attacks may be targeted at us, our customers, or others who have entrusted us with information. Actual or anticipated attacks may cause us to incur costs, including costs to deploy additional personnel and protection technologies, train employees, and engage third-party experts and consultants. Advances in computer capabilities, new technological discoveries, or other developments may result in the technology used by us to protect transaction or other data being breached or compromised. In addition, data and security breaches can also occur as a result of non-technical issues, including breach by us or by persons with whom we have commercial relationships that result in the unauthorized release of personal or confidential information. Any compromise or breach of our cyber security systems could result in private information exposure and a violation of applicable privacy and other laws, significant potential liability including legal and financial costs, and loss of confidence in our security measures by customers, which could have an adverse effect on our business, financial condition and reputation.
Natural Disasters Or A Decline In Economic Conditions In California Could Increase Our Operating Expenses Or Adversely Affect Our Sales Revenue.
As of December 31, 2014, a substantial portion of our operations are located in California, including 82 of our retail stores, our headquarters in Manhattan Beach, and our domestic distribution center in Rancho Belago. Because a significant portion of our net sales is derived from sales in California, a decline in the economic conditions in California, whether or not such decline spreads beyond California, could materially adversely affect our business. Furthermore, a natural disaster or other catastrophic event, such as an earthquake or wild fires affecting California, could significantly disrupt our business including the operation of our only domestic distribution center. We may be more susceptible to these issues than our competitors whose operations are not as concentrated in California.
One Principal Stockholder Is Able To Control Substantially All Matters Requiring Approval By Our Stockholders And Another Stockholder Is Able To Exert Significant Influence Over All Matters Requiring A Vote Of Our Stockholders, And Their Interests May Differ From The Interests Of Our Other Stockholders.
As of December 31, 2014, our Chairman of the Board and Chief Executive Officer, Robert Greenberg, beneficially owned 38.8% of our outstanding Class B common shares, members of Mr. Greenberg’s immediate family beneficially owned an additional 14.6% of our outstanding Class B common shares, and Gil Schwartzberg, trustee of several trusts formed by Mr. Greenberg and his wife for estate planning purposes, beneficially owned 45.9% of our outstanding Class B common shares. The holders of Class A common shares and Class B common shares have identical rights except that holders of Class A common shares are entitled to one vote per share while holders of Class B common shares are entitled to ten votes per share on all matters submitted to a vote of our stockholders. As a result, as of December 31, 2014, Mr. Greenberg beneficially owned 27.8% of the aggregate number of votes eligible to be cast by our stockholders, and together with shares beneficially owned by other members of his immediate family, Mr. Greenberg and his immediate family beneficially owned 39.1% of the aggregate number of votes eligible to be cast by our stockholders, and Mr. Schwartzberg beneficially owned 32.9% of the aggregate number of votes eligible to be cast by our stockholders. Therefore, Mr. Greenberg and Mr. Schwartzberg are each able to exert significant influence over all matters requiring approval by our stockholders. Matters that require the approval of our stockholders include the election of directors and the approval of mergers or other business combination transactions. Mr. Greenberg also has significant influence over our management and operations. As a result of such
23
Table of Contents
influence, certain transactions are not likely without the approval of Messrs. Greenberg and Schwartzberg, including proxy contests, tender offers, open market purchase programs or other transactions that can give our stockholders the opportunity to realize a premium over the then-prevailing market prices for their shares of our Class A common shares. Because Messrs. Greenberg’s and Schwartzberg’s interests may differ from the interests of the other stockholders, their ability to significantly influence or substantially control, respectively, actions requiring stockholder approval may result in our company taking action that is not in the interests of all stockholders. The differential in the voting rights may also adversely affect the value of our Class A common shares to the extent that investors or any potential future purchaser view the superior voting rights of our Class B common shares to have value.
Our Charter Documents And Delaware Law May Inhibit A Takeover, Which May Adversely Affect The Value Of Our Stock.
Provisions of Delaware law, our certificate of incorporation or our bylaws could make it more difficult for a third party to acquire us, even if closing such a transaction would be beneficial to our stockholders. Mr. Greenberg’s substantial beneficial ownership position, together with the authorization of Preferred Stock, the disparate voting rights between our Class A Common Stock and Class B Common Stock, the classification of our Board of Directors and the lack of cumulative voting in our certificate of incorporation and bylaws, may have the effect of delaying, deferring or preventing a change in control, may discourage bids for our Class A Common Stock at a premium over the market price of the Class A Common Stock and may adversely affect the market price of our Class A Common Stock.
| ITEM 1B. | UNRESOLVED STAFF COMMENTS |
None.
| ITEM 2. | PROPERTIES |
Our corporate headquarters are located at three properties in Manhattan Beach, California, which consist of an aggregate of approximately 143,000 square feet. We own our corporate headquarters.
Our U.S. distribution center is a 1.8 million square-foot facility located on approximately 110 acres in Rancho Belago, California. We are leasing the distribution center from a joint venture, HF Logistics-SKX (the “JV”), that we formed with HF Logistics I, LLC (“HF”) in January 2010 for the purpose of building and operating the facility. The lease for this facility expires in 2031, with a base rent of $940,695 per month, or approximately $11.3 million per year. The JV is included in our consolidated financial statements.
Our European Distribution Center consists of 483,000 square-foot facilities in Liege, Belgium currently under two concurrent operating leases that expire in 2029, with base rent of approximately $2.5 million per year. The lease agreements also provide for early termination rights at five-year intervals upon 12-month advance notice in writing to terminate the lease. We did not exercise the first such early termination right prior to April 1, 2013.
All of our domestic retail stores and showrooms are leased with terms expiring between March 2015 and July 2026. The leases provide for rent escalations tied to either increases in the lessor’s operating expenses, fluctuations in the consumer price index in the relevant geographical area or a percentage of the store’s gross sales in excess of the base annual rent. Total base rent expense related to our domestic retail stores and showrooms was $52.9 million for the year ended December 31, 2014.
We also lease all of our international administrative offices, retail stores, showrooms and distribution facilities located in Canada, Switzerland, the United Kingdom, Germany, France, Spain, Italy, the Netherlands, Brazil, Malaysia, China, Hong Kong, Japan, Chile, Singapore, India and Portugal. The property leases expire at various dates between March 2015 and March 2030. Total base rent for the leased administrative properties aggregated approximately $36.0 million for the year ended December 31, 2014.
24
Table of Contents
| ITEM 3. | LEGAL PROCEEDINGS |
Our claims and advertising for our toning products including for our Shape-ups are subject to the requirements of, and routinely come under review by regulators including the U.S. Federal Trade Commission (“FTC”), states’ Attorneys General and government and quasi-government regulators in foreign countries. We have responded to requests for information regarding our claims and advertising from regulatory and quasi-regulatory agencies in several countries and are fully cooperating with such requests. While we believe that our claims and advertising with respect to our core toning products are supported by scientific tests, expert opinions and other relevant data, and while we have been successful in defending our claims and advertising in several different countries, we have discontinued using certain test results and we periodically review and update our claims and advertising. The regulatory inquiries may conclude in a variety of outcomes, including the closing of the inquiry with no further regulatory action, settlement of any issues through changes in its claims and advertising, settlement of any issues through payment to the regulatory entity, or litigation.
As we disclosed in previous periodic SEC filings, the FTC and Attorneys General for 44 states and the District of Columbia (“SAGs”) had been reviewing the claims and advertising for Shape-ups and our other toning shoe products. We also disclosed that we had been named as a defendant in multiple consumer class actions challenging our claims and advertising for our toning shoe products, including Shape-ups. On May 16, 2012, we announced that we had settled all domestic legal proceedings relating to advertising claims made in connection with the marketing of our toning shoe products. Under the terms of the global settlement — without admitting any fault or liability, with no findings being made that our company had violated any law, and with no fines or penalties being imposed — we made payments in the aggregate amount of $50 million to settle and finally resolve the domestic advertising class action lawsuits and related claims brought by the FTC and the SAGs. The FTC Stipulated Final Judgment was approved by the United States District Court for the Northern District of Ohio on July 12, 2012. Consent judgments in the 45 SAG actions were approved and entered by courts in those jurisdictions. On May 13, 2013, the United States District Court for the Western District of Kentucky entered an order finally approving the nationwide consumer class action settlement, and the time for any appeals from that final approval order has expired.
On November 8, 2012, we were served with a Grand Jury Subpoena (“Subpoena”) for documents and information relating to our past advertising claims for our toning footwear, including Shape-ups and Resistance Runners. The Subpoena was issued by a Grand Jury of the United States District Court for the Northern District of Ohio, in Cleveland, Ohio. The Subpoena seeks documents and information related to outside studies conducted on our toning footwear. This Subpoena appears to grow out of the FTC’s inquiry into our claims and advertising for Shape-ups and our other toning shoe products, which we settled with the FTC, SAGs and consumer class as part of a global settlement, as set forth above. We are fully cooperating and are in the process of producing documents and other information requested in the Subpoena. The Assistant United States Attorney has informed us that neither our company nor our employees are targets at the present time. Although we do not believe this matter will have a material adverse impact on our results of operations or financial position, it is too early to predict the timing and outcome of this matter or reasonably estimate a range of potential losses, if any.
The toning footwear category, including our Shape-ups products, has also been the subject of some media attention arising from a number of consumer complaints and lawsuits alleging injury while wearing Shape-ups. We believe our products are safe and are defending ourselves from these media stories and injury lawsuits. It is too early to predict the outcome of any case or inquiry, whether there will be future personal injury cases filed, whether adverse results in any single case or in the aggregate would have a material adverse impact on our results of operations, financial position, or result in a material loss in excess of a recorded accrual and whether insurance coverage will be adequate to cover any losses.
Patty Tomlinson v. Skechers U.S.A., Inc. — On January 13, 2011, Patty Tomlinson filed a lawsuit against our company in Circuit Court in Washington County, Arkansas, Case No. CV11-121-7. The complaint alleges, on her behalf and on behalf of all others similarly situated, that our advertising for Shape-ups violates Arkansas’ Deceptive Trade Practices Act, constitutes a breach of certain express and implied warranties, and is resulting in unjust enrichment (the “Tomlinson action”). The complaint seeks certification of a statewide class, compensatory damages, prejudgment interest, and attorneys’ fees and costs. On February 18, 2011, we removed the case to the United States District Court for the Western District of Arkansas, where it was pending as Patty Tomlinson v. Skechers U.S.A., Inc., CV 11-05042 JLH. On March 21, 2011, Ms. Tomlinson moved to remand the action back to Arkansas state court, which motion we opposed. On May 25, 2011, the Court ordered the case remanded to Arkansas state court and denied our motion to dismiss or transfer as moot, but stayed the remand pending completion of appellate review. On September 11, 2012, the District Court lifted its stay and remanded this case to the Circuit Court of Washington County, Arkansas. On October 11, 2012, by stipulation of the parties, the state Circuit Court issued an order staying the case. On August 13, 2012, the United States District Court for the Western District of Kentucky granted preliminary approval of the nationwide consumer class action settlement in Grabowski v. Skechers U.S.A., Inc. Case No. 3:12-CV-00204, and Morga v. Skechers U.S.A., Inc., Case No. 3:12-CV-00205 (the “Grabowski/Morga class
25
Table of Contents
actions”), and issued a preliminary injunction enjoining the continued prosecution of the Tomlinson action, among other cases. On May 13, 2013, the Court in the Grabowski/Morga class actions entered an order finally approving the nationwide consumer class action settlement, and the time for any appeals therefrom has expired. The settlement in the Grabowski/Morga class actions is expected entirely to resolve the class claims brought by the plaintiff in Tomlinson.
Elma Boatright and Sharon White v. Skechers U.S.A., Inc., Skechers U.S.A., Inc. II and Skechers Fitness Group — On February 15, 2012, Elma Boatright and Sharon White filed a lawsuit against our company in the United States District Court for the Western District of Kentucky, Case No. 3:12-cv-87-S. The complaint alleges, on behalf of the named plaintiffs and all others similarly situated, that our advertising for Shape-ups is false and misleading, thereby constituting a breach of contract, breach of implied and express warranties, fraud, and resulting in unjust enrichment. The complaint seeks certification of a nationwide class, compensatory damages, and attorneys’ fees and costs. On March 6, 2012, the named plaintiffs filed a motion to consolidate this action with In re Skechers Toning Shoe Products Liability Litigation, case no. 11-md-02308-TBR. On August 13, 2012, the United States District Court for the Western District of Kentucky granted preliminary approval of the consumer class action settlement agreement in the Grabowski/Morga class actions (described above), and issued a preliminary injunction enjoining the continued prosecution of this action. On May 13, 2013, the Court in the Grabowski/Morga class actions entered an order finally approving the nationwide consumer class action settlement, and the time for any appeals therefrom has expired. The settlement in the Grabowski/Morga class actions is expected entirely to resolve the class claims brought by the plaintiff in Boatright.
Jason Angell v. Skechers U.S.A., Inc., Skechers U.S.A., Inc. II and Skechers U.S.A. Canada, Inc. — On April 12, 2012, Jason Angell filed a motion to authorize the bringing of a class action in the Superior Court of Québec, District of Montréal. Petitioner Angell seeks to bring a class action on behalf of all residents of Canada (or in the alternative, all residents of Québec) who purchased Skechers Shape-ups footwear. Petitioner’s motion alleges that we have marketed Shape-ups through the use of false and misleading advertisements and representations about the products’ ability to provide health benefits to users. The motion requests the Court’s authorization to institute a class action seeking damages (including damages for bodily injury), punitive damages, and injunctive relief. Petitioner’s motion was formally presented to the Court on June 29, 2012. At a mediation held on February 28, 2013, the parties reached an agreement in principle to settle the Angell action (as well as the Niras and Dedato actions described below) through authorization by the Québec Superior Court of a nationwide settlement class. That agreement was finalized by the parties in December 2013 and thereafter presented to the Québec Superior Court for approval. On November 5, 2014, the Court issued its formal judgment approving the settlement. Notwithstanding, if approval of the class action settlement is reversed on appeal, we cannot predict the outcome of the Angell action or a reasonable range of potential losses or whether the outcome of the Angell action would have a material adverse impact on our results of operations, financial position or result in a material loss in excess of the settlement or a recorded accrual.
Brenda Davies/Kourtney Smith v. Skechers U.S.A., Inc., Skechers U.S.A., Inc. II, and Skechers U.S.A. Canada Inc. — On September 5, 2012, Brenda Davies filed a Statement of Claim in the Court of Queen’s Bench in Edmonton, Alberta, on behalf of all residents of Canada who purchased Skechers Shape-ups footwear. The Statement of Claim alleges that Skechers marketed Shape-ups through the use of false and misleading advertisements and representations about the products’ ability to provide fitness benefits to users. The Statement of Claim seeks damages (including damages for bodily injury), restitution, punitive damages, and injunctive relief. On or about November 21, 2013, an Amended Statement of Claim was filed to substitute a new representative plaintiff, Kourtney Smith, in place of Ms. Davies and to allege substantially the same claims as in the original Statement of Claim with respect to all Skechers toning footwear sold to residents of Canada. On or about February 28, 2014, representative plaintiff Smith agreed to the terms and conditions of the settlement reached in the Angell, Niras, and Dedato class actions (described above and below), and agreed to discontinue the Davies/Smith action once the settlement in the Angell, Niras, and Dedato class actions is finally approved by the Court and affirmed on appeal in the event an appeal is taken. On November 5, 2014, the Québec Superior Court issued its formal judgment approving the settlement in the Angell class action. On January 16, 2015, the Court in the Davies/Smith action issued an order effectively dismissing that action. Notwithstanding, if approval of the class action settlement is reversed on appeal, we cannot predict the outcome of the Davies/Smith action or a reasonable range of potential losses or whether the outcome of the Davies/Smith action would have a material adverse impact on our results of operations, financial position or result in a material loss in excess of the settlement or a recorded accrual.
George Niras v. Skechers U.S.A., Inc., Skechers U.S.A., Inc. II, and Skechers U.S.A. Canada Inc. — On September 21, 2012, George Niras filed a Statement of Claim in the Ontario Superior Court of Justice on behalf of all residents of Canada who purchased Shape-ups, Resistance Runner, Shape-ups Toners/Trainers, or Tone-ups. The Statement of Claim alleges that Skechers marketed these toning shoes through the use of false and misleading advertisements and representations about the products’ ability to provide health benefits to users. The Statement seeks damages, restitution, punitive damages, and injunctive relief. Skechers has not yet responded to the Statement. At a mediation held on February 28, 2013, the parties reached an agreement in principle to settle the Niras action (as
26
Table of Contents
well as the Angell action described above and the Dedato action described below) through authorization by the Québec Superior Court of a nationwide settlement class. That agreement was finalized by the parties in December 2013 and thereafter presented to the Québec Superior Court for approval. On November 5, 2014, the Québec Superior Court issued its formal judgment approving the settlement. On November 20, 2014, the Ontario Superior Court issued an order effectively dismissing the Niras action. Notwithstanding, if approval of the class action settlement is reversed on appeal, we cannot predict the outcome of the Niras action or a reasonable range of potential losses or whether the outcome of the Niras action would have a material adverse impact on our results of operations, financial position or result in a material loss in excess of the settlement or a recorded accrual.
Frank Dedato v. Skechers U.S.A., Inc. and Skechers U.S.A. Canada, Inc. — On or about November 5, 2012, Frank Dedato filed a Statement of Claim in Ontario Superior Court of Justice on behalf of all residents of Canada who purchased Shape-ups, Tone-ups or Resistance Runner footwear. The Statement of Claim alleges that Skechers has allegedly made misleading statements about its footwear products’ ability to provide fitness benefits to users. The Statement of Claim seeks damages, restitution, punitive damages, and injunctive relief. Skechers has not yet responded to the Statement of Claim. At a mediation held on February 28, 2013, the parties reached an agreement in principle to settle the Dedato action (as well as the Angell and Niras actions described above) through authorization by the Québec Superior Court of a nationwide settlement class. That agreement was finalized by the parties in December 2013 and thereafter presented to the Québec Superior Court for approval. On November 5, 2014, the Québec Superior Court issued its formal judgment approving the settlement. On November 19, 2014, the Ontario Superior Court in issued an order effectively dismissing the Dedato action. Notwithstanding, if approval of the class action settlement is reversed on appeal, we cannot predict the outcome of the Dedato action or a reasonable range of potential losses or whether the outcome of the Dedato action would have a material adverse impact on our results of operations, financial position or result in a material loss in excess of the settlement or a recorded accrual.
Susan Cooper et al. v. Ontrea Inc. et al. — On October 22, 2014, the Company was named as a third-party defendant in a lawsuit pending in the Court of Queen’s Bench in Calgary, Alberta, Case No. 1301 10673. The third party notice asserts claims for indemnification and contribution arising from injuries plaintiff allegedly sustained as a result of wearing Shape-ups shoes. The class action settlement in the Angell action, described above, is expected to resolve the Cooper action. However, if approval of the class action settlement is reversed on appeal, we cannot predict the outcome of the Cooper action or a reasonable range of potential losses or whether the outcome of the Cooper action would have a material adverse impact on our results of operations, financial position or result in a material loss in excess of the settlement or a recorded accrual.
Personal Injury Lawsuits Involving Shape-ups — As previously reported, on February 20, 2011, Skechers U.S.A., Inc., Skechers U.S.A., Inc. II and Skechers Fitness Group were named as defendants in a lawsuit that alleged, among other things, that Shape-ups are defective and unreasonably dangerous, negligently designed and/or manufactured, and do not conform to representations made by our company, and that we failed to provide adequate warnings of alleged risks associated with Shape-ups. In total, we are named as a defendant in 1,171 currently pending cases (some on behalf of multiple plaintiffs) filed in various courts that assert further varying injuries but employ similar legal theories and assert similar claims to the first case, as well as claims for breach of express and implied warranties, loss of consortium, and fraud. Although there are some variations in the relief sought, the plaintiffs generally seek compensatory and/or economic damages, exemplary and/or punitive damages, and attorneys’ fees and costs.
On December 19, 2011, the Judicial Panel on Multidistrict Litigation issued an order establishing a multidistrict litigation (“MDL”) proceeding in the United States District Court for the Western District of Kentucky entitled In re Skechers Toning Shoe Products Liability Litigation, case no. 11-md-02308-TBR. Since 2011, a total of 1,081 personal injury cases have been filed in or transferred to the MDL proceeding and 414 individuals have submitted claims by plaintiff fact sheets. The Company has resolved 432 personal injury claims in the MDL proceedings, comprised of 62 that were filed as formal actions and 370 that were submitted by plaintiff fact sheets. Skechers has also settled 8 claims in principle — 6 filed cases and 2 claims submitted by plaintiff fact sheets — and anticipates that those settlements will be finalized in the near term. Thirty-four cases in the MDL proceeding have been dismissed either voluntarily or on motions by Skechers and 38 unfiled claims submitted by plaintiff fact sheet have been abandoned. The MDL currently encompasses 979 personal injury cases (which include the claims of 939 individuals who filed court approved questionnaires) and 4 claims submitted by plaintiff fact sheets. Under a mediation procedure authorized by the District Court, a total of 2,353 settlement questionnaires were submitted by persons who had yet to file a lawsuit or who were already participants in the MDL or related coordinated proceedings pending in California state court (described in greater detail below). Mediations were held on October 4, 2014 and December 16, 2014, but no settlements were reached. On December 29, 2014, the District Court ordered that a total of sixty cases be selected by the parties for staggered, accelerated discovery and then either be remanded to their originating districts or set for trial. The sixty cases were selected in January 2015 and both written and deposition discovery is proceeding. To the extent that the sixty selected cases are not resolved by dispositive motions or otherwise, trials are expected to be set for dates in early to mid-2016.
27
Table of Contents
Skechers U.S.A., Inc., Skechers U.S.A., Inc. II and Skechers Fitness Group also have been named as defendants in a total of 70 personal injury actions filed in various Superior Courts of the State of California that were brought on behalf of 913 individual plaintiffs (360 of whom also submitted MDL court-approved questionnaires for mediation purposes in the MDL proceeding). Of those cases, 67 were originally filed in the Superior Court for the County of Los Angeles (the “LASC cases”). On August 20, 2014, the Judicial Council of California granted a petition by the Company to coordinate all personal injury actions filed in California that relate to Shape-ups with the LASC cases (collectively, the “LASC Coordinated Cases”). On October 6, 2014, three cases that had been pending in other counties were transferred to and coordinated with the LASC Coordinated Cases. Four of the actions originally filed as LASC cases, brought on behalf of a total of 6 plaintiffs, have been dismissed. The claims of 44 additional plaintiffs have been dismissed entirely from certain of the lawsuits, either voluntarily, on motion by Skechers, or as pursuant to settlement agreement. The claims of 21 persons have been dismissed in part, either voluntarily or on motions by Skechers. Thus, the LASC Coordinated Cases currently involve 66 pending personal injury lawsuits brought on behalf of a total of 863 plaintiffs. On March 12, 2014, the Superior Court selected twelve plaintiffs as bellwether cases to be set for one or more trials starting in March 2015. To date, extensive written discovery and document productions have taken place in the LASC cases. Over twenty fact witness depositions have been taken (all of which were cross-noticed in the MDL), as have eight expert depositions. Two of the bellwether cases have settled and one bellwether plaintiff dismissed her action after Skechers filed a motion for summary judgment. On January 7, 2015, the Court vacated the March 2015 initial bellwether trial date and granted Skechers’ motions for summary adjudication in five bellwether cases with respect to those plaintiffs’ advertising-related claims, including their claims for breach of warranty, fraud, and violations of consumer protection laws. On February 25, 2015, the Court granted Skechers’ motions for summary adjudication in the four remaining bellwether cases with respect to those plaintiffs’ advertising-related claims, including their claims for breach of warranty, fraud, and violations of consumer protection laws; the Court also granted Skechers’ summary adjudication motions as to two of the four plaintiffs’ products liability claims for an alleged failure to warn, and took under submission the portion of Skechers’ motions seeking summary adjudication of all four plaintiffs’ products liability claims for alleged design defects. The Court also set trial dates of October 26, 2015 and January 25, 2016 for the first two bellwether cases, but deferred selection of the specific individual bellwether plaintiff to go forward on those two dates to a later time.
In other state courts, a total of 136 personal injury actions (some on behalf of numerous plaintiffs) have been filed that were not removed to federal court and transferred to the MDL. Ten of those actions have been resolved and dismissed. The remaining 126 actions include the claims of 539 plaintiffs, 533 of whom had submitted court-approved settlement questionnaires in the MDL. Sixteen of those personal injury actions have been removed to various federal courts and are expected to be transferred to the MDL in the near term. It is further expected that removal petitions and requests for transfer to the MDL will be filed for the other 110 state court personal injury actions. No discovery has taken place in these actions and no trial dates have been set.
The personal injury cases in the MDL and LASC Coordinated Cases and in other state courts are in many instances solicited and handled by the same plaintiffs law firms. It is too early to predict the outcome of any case, whether there will be future personal injury cases filed, whether adverse results in any single case or in the aggregate would have a material adverse impact on our operations or financial position, and whether insurance coverage will be adequate to cover any losses. Notwithstanding, we believe we have meritorious defenses, vehemently deny the allegations and intend to defend each of these cases vigorously.
Gloria Basaraba v. Robert Greenberg, et al. — On July 15, 2013, plaintiff Gloria Basaraba moved to file under seal a shareholder derivative complaint against Skechers, nine individual members of its Board of Directors and a former employee in the United States District Court for the Central District of California, Case No. CV13-5061. The complaint included allegations of breach of fiduciary duties, gross mismanagement, waste of corporate assets and unjust enrichment based on the development of Skechers’ toning footwear products, advertising and marketing activities relating thereto, and subsequent litigation involving those issues. The complaint sought compensatory damages, a court order directing Skechers to reform and improve their corporate governance and internal procedures, and attorneys’ fees, costs and expenses. On August 26, 2013, the Court denied plaintiff’s motion to seal and ordered that she file an operative complaint. On September 5, 2013, plaintiff filed the operative complaint against the same defendants, except for the former employee. The operative complaint seeks to recover under the same causes of action as in the prior complaint on the basis of many of the same allegations. On November 12, 2013 and November 15, 2013, the individual defendants and Skechers respectively moved to dismiss the complaint. The motions to dismiss were subsequently taken off calendar in light of the parties’ settlement discussions. A settlement eventually was reached and, on September 16, 2014, the Court granted preliminary approval thereof. On October 10, 2014, plaintiff moved for final approval of the settlement. On that same day, plaintiff also moved for approval of attorneys’ fees and expenses and an incentive award pursuant to the settlement agreement. On November 10, 2014, the Court granted plaintiff’s motion
28
Table of Contents
for final settlement approval, finding the settlement fair, reasonable, and adequate. On November 12, 2014, the Court granted plaintiff’s motion for attorneys’ fees and expenses and an incentive award. This settlement is now final and it did not have a material adverse impact on our operations, financial position or result in a material loss in excess of a recorded accrual.
Converse, Inc. v. Skechers U.S.A., Inc. — On October 14, 2014, Converse filed an action against our company in the United States District Court for the Eastern District of New York, Brooklyn Division, Case 1:14-cv-05977-DLI-MDG, alleging trademark infringement, false designation of origin, unfair competition, trademark dilution and deceptive practices arising out of our alleged use of certain design elements on footwear. The complaint seeks, among other things, injunctive relief, profits, actual damages, enhanced damages, punitive damages, costs and attorneys’ fees. On October 14, 2014, Converse also filed a complaint naming 27 respondents including our company with the U.S. International Trade Commission, Federal Register Doc. 2014-24890, alleging violations of federal law in the importation into and the sale within the United States of certain footwear. Converse has requested that the Commission issue a general exclusion order, or in the alternative a limited exclusion order, and cease and desist orders. While it is too early to predict the outcome of these legal proceedings or whether an adverse result in either or both of them would have a material adverse impact on our operations or financial position, we believe we have meritorious defenses and intend to defend these legal matters vigorously.
Deckers Outdoor Corporation v. Skechers U.S.A., Inc. — On November 20, 2014, Deckers filed an action against our company in the United States District Court for the Central District of California, Case 2:14-cv-08988-SJO-FFM, alleging trademark infringement, patent infringement, trade dress infringement, and unfair competition arising out of our alleged use of certain names and design elements. The complaint seeks, among other things, injunctive relief, an accounting of profits, compensatory damages, statutory, treble and punitive damages, costs and attorneys’ fees. While it is too early to predict the outcome of these legal proceedings or whether an adverse result in either or both of them would have a material adverse impact on our operations or financial position, we believe we have meritorious defenses and intend to defend these legal matters vigorously.
In addition to the matters included in its reserve for loss contingencies, we occasionally become involved in litigation arising from the normal course of business, and we are unable to determine the extent of any liability that may arise from any such unanticipated future litigation. We have no reason to believe that there is a reasonable possibility or a probability that we may incur a material loss, or a material loss in excess of a recorded accrual, with respect to any other such loss contingencies. However, the outcome of litigation is inherently uncertain and assessments and decisions on defense and settlement can change significantly in a short period of time. Therefore, although we consider the likelihood of such an outcome to be remote with respect to those matters for which we have not reserved an amount for loss contingencies, if one or more of these legal matters were resolved against our company in the same reporting period for amounts in excess of our expectations, our condensed consolidated financial statements of a particular reporting period could be materially adversely affected.
| ITEM 4. | MINE SAFETY DISCLOSURES |
Not applicable.
29
Table of Contents
| ITEM 5. | MARKET FOR REGISTRANT’S COMMON EQUITY, RELATED STOCKHOLDER MATTERS AND ISSUER PURCHASES OF EQUITY SECURITIES |
Our Class A Common Stock trades on the New York Stock Exchange under the symbol “SKX.” The following table sets forth, for the periods indicated, the high and low sales prices of our Class A Common Stock.
| LOW | HIGH | |||||||
| YEAR ENDED DECEMBER 31, 2014 |
||||||||
| First Quarter |
$ | 26.46 | $ | 36.78 | ||||
| Second Quarter |
33.14 | 47.53 | ||||||
| Third Quarter |
44.46 | 64.69 | ||||||
| Fourth Quarter |
47.76 | 62.34 | ||||||
| YEAR ENDED DECEMBER 31, 2013 |
||||||||
| First Quarter |
$ | 17.02 | $ | 22.61 | ||||
| Second Quarter |
19.99 | 24.50 | ||||||
| Third Quarter |
23.93 | 31.56 | ||||||
| Fourth Quarter |
26.62 | 34.95 | ||||||
HOLDERS
As of February 17, 2015, there were 101 holders of record of our Class A Common Stock (including holders who are nominees for an undetermined number of beneficial owners) and 29 holders of record of our Class B Common Stock. These figures do not include beneficial owners who hold shares in nominee name. The Class B Common Stock is not publicly traded but each share is convertible upon request of the holder into one share of Class A Common Stock.
DIVIDEND POLICY
Earnings have been and will be retained for the foreseeable future in the operations of our business. We have not declared or paid any cash dividends on our Class A Common Stock and do not anticipate paying any cash dividends in the foreseeable future. Our current policy is to retain all of our earnings to finance the growth and development of our business.
EQUITY COMPENSATION PLAN INFORMATION
Our equity compensation plan information is provided as set forth in Part III, Item 12 of this annual report.
30
Table of Contents
PERFORMANCE GRAPH
The following graph demonstrates the total return to stockholders of our company’s Class A Common Stock from December 31, 2009 to December 31, 2014, relative to the performance of the Russell 2000 Index, which includes our Class A Common Stock, and the peer group index, which is believed to include companies engaged in businesses similar to ours. The peer group index consists of six companies: Nike, Inc., adidas AG, Steven Madden, Ltd., Wolverine World Wide, Inc., Crocs, Inc., and Deckers Outdoor Corporation.
The graph assumes an investment of $100 on December 31, 2009 in each of our company’s Class A Common Stock and the stocks comprising each of the Russell 2000 Index and the customized peer group index. Each of the indices assumes that all dividends were reinvested. The stock performance of our company’s Class A Common Stock shown on the graph is not necessarily indicative of future performance. We will not make nor endorse any predictions as to our future stock performance.
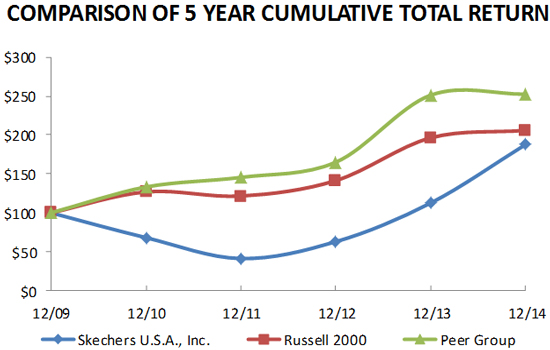
| 12/09 | 12/10 | 12/11 | 12/12 | 12/13 | 12/14 | |||||||||||||||||||
| Skechers U.S.A., Inc. |
100.00 | 68.00 | 41.21 | 62.90 | 112.65 | 187.86 | ||||||||||||||||||
| Russell 2000 |
100.00 | 126.86 | 121.56 | 141.43 | 196.34 | 205.95 | ||||||||||||||||||
| Peer Group |
100.00 | 133.14 | 145.52 | 165.04 | 251.16 | 252.38 | ||||||||||||||||||
31
Table of Contents
| ITEM 6. | SELECTED FINANCIAL DATA |
The following tables set forth our company’s selected consolidated financial data as of and for each of the years in the five-year period ended December 31, 2014 and should be read in conjunction with our audited consolidated financial statements and notes thereto included under Part II, Item 8 of this annual report.
(In thousands, except net earnings (loss) per share)
| YEARS ENDED DECEMBER 31, | ||||||||||||||||||||
| STATEMENT OF OPERATIONS DATA: |
2014 | 2013 | 2012 | 2011 | 2010 | |||||||||||||||
| Net sales |
$ | 2,377,561 | $ | 1,846,361 | $ | 1,560,321 | $ | 1,606,016 | $ | 2,006,868 | ||||||||||
| Gross profit |
1,071,905 | 818,792 | 683,326 | 623,748 | 911,906 | |||||||||||||||
| Earnings (loss) from operations |
209,071 | 93,609 | 22,319 | (133,793 | ) | 195,568 | ||||||||||||||
| Earnings (loss) before income taxes (benefit) |
191,380 | 82,215 | 10,473 | (131,047 | ) | 196,603 | ||||||||||||||
| Net earnings (loss) attributable to Skechers U.S.A., Inc. |
138,811 | 54,788 | 9,512 | (67,484 | ) | 136,148 | ||||||||||||||
| Net earnings (loss) per share:(1) |
||||||||||||||||||||
| Basic |
2.74 | 1.09 | 0.19 | (1.39 | ) | 2.87 | ||||||||||||||
| Diluted |
2.72 | 1.08 | 0.19 | (1.39 | ) | 2.78 | ||||||||||||||
| Weighted average shares:(1) |
||||||||||||||||||||
| Basic |
50,613 | 50,363 | 49,495 | 48,491 | 47,433 | |||||||||||||||
| Diluted |
51,026 | 50,563 | 49,942 | 48,491 | 49,050 | |||||||||||||||
| AS OF DECEMBER 31, | ||||||||||||||||||||
| BALANCE SHEET DATA: |
2014 | 2013 | 2012 | 2011 | 2010 | |||||||||||||||
| Working capital |
$ | 779,277 | $ | 704,506 | $ | 647,771 | $ | 578,885 | $ | 666,054 | ||||||||||
| Total assets |
1,674,918 | 1,408,570 | 1,340,220 | 1,281,888 | 1,304,794 | |||||||||||||||
| Long-term borrowings, excluding current installments |
15,081 | 116,488 | 128,517 | 76,531 | 51,650 | |||||||||||||||
| Skechers U.S.A., Inc. equity |
1,075,249 | 930,322 | 875,969 | 852,561 | 908,203 | |||||||||||||||
| (1) | Basic earnings per share represents net earnings (loss) divided by the weighted-average number of common shares outstanding for the period. Diluted earnings (loss) per share, in addition to the weighted average determined for basic earnings (loss) per share, reflects the potential dilution that could occur if options to issue common stock were exercised or converted into common stock. |
32
Table of Contents
| ITEM 7. | MANAGEMENT’S DISCUSSION AND ANALYSIS OF FINANCIAL CONDITION AND RESULTS OF OPERATIONS |
GENERAL
We design, market and sell contemporary footwear for men, women and children under the Skechers brand. Our footwear is sold through a wide range of department stores and leading specialty retail stores, mid-tier retailers, boutiques, our own retail stores, distributor and licensee-owned international retail stores and our e-commerce websites. Our objective is to continue to profitably grow our domestic operations while leveraging our brand name to expand internationally.
Our operations are organized along our distribution channels and we have the following four reportable sales segments: domestic wholesale sales, international wholesale sales, which include international direct subsidiary sales and international distributor sales, retail sales and e-commerce sales. We evaluate segment performance based primarily on net sales and gross margins. See detailed segment information in Note 13 – Segment Information in our consolidated financial statements included under Part II, Item 8 of this annual report.
FINANCIAL OVERVIEW
Our net sales for 2014 increased $531.2 million, or 28.8%, to $2.378 billion, compared to net sales of $1.846 billion in 2013. The increase in net sales was broad based across our domestic wholesale, international wholesale and retail segments, with the largest increases across our Women’s Go, Women’s Active, Men’s and Women’s Sport, and Men’s USA divisions, which was partially offset by reduced sales of our BOB’s products during 2014. Net earnings attributable to Skechers U.S.A., Inc. were $138.8 million for 2014, an increase of $84.0 million, or 153.4%, compared to net earnings of $54.8 million in 2013. Diluted income per share for 2014 was $2.72, which reflected a 151.1% increase from the $1.08 diluted income per share reported in the prior year. The increase in net earnings attributable to Skechers U.S.A., Inc. for 2014 was primarily the result of increased sales in our domestic wholesale and international direct subsidiary sales segments following the introduction of new products and increased margins in our retail and international direct subsidiary sales segments attributable to sales of product mix with higher margins. Our working capital was $779.3 million at December 31, 2014, which was an increase of $74.8 million from working capital of $704.5 million at December 31, 2013. Our cash increased $94.7 million to $466.7 million at December 31, 2014 from $372.0 million at December 31, 2013. This increase in cash of $94.7 million was primarily the result of our increased net earnings and increased payables, which were partially offset by increased inventories and increased accounts receivables.
2014 OVERVIEW
In 2014, we focused on product development, domestic and international growth, development of our global infrastructure, and balance sheet and expense management.
New product design and delivery. Our success depends on our ability to design and deliver trend-right, affordable product to consumers across a broad range of demographics. In 2014, we focused on continuously updating our core styles, by adding fresh looks to our existing lines, and developing new lines that included lifestyle and performance footwear, such as Skechers GOrun 4, which has broadened and diversified our collection of product offerings.
Grow our domestic business. In 2014, our focus was on maintaining our core Skechers business in our domestic wholesale accounts, while finding new opportunities to add shelf space and expand into new locations with new Skechers categories. We also focused on expanding our domestic retail distribution channel by opening 48 additional domestic stores.
Further develop our international businesses. In 2014, we continued to focus on improving our international operations by increasing our customer base within our existing subsidiary business and increasing our product offering to accounts within each country. We also focused on expanding our international retail distribution channel by opening 19 additional international stores.
Develop our global infrastructure. In 2014, we completed the first phase of the automation upgrade of our European Distribution Center equipment as well as the transition in Chile from a third-party warehouse to a distribution center operated by us. We continue to upgrade our distribution facilities to increase our capacity and efficiency and to better manage our growth worldwide.
Balance sheet and expense management. During 2014, we continued to focus on managing our inventory levels and bringing our marketing expenses and general and administrative expenses in line with expected sales.
33
Table of Contents
OUTLOOK FOR 2015
During 2015, we will continue to develop new lifestyle and performance product at affordable prices. The global footwear market is competitive; however, we believe our new styles and lines that we will be launching in the spring and fall seasons will enable us to continue to broaden the targeted demographic profile of our consumer base, increase our shelf space and open 50 to 60 new retail locations, predominantly in the United States, without detracting from existing business. In addition, we will continue to develop our product distribution infrastructure by completing additional phases of equipment upgrades at our European Distribution Center and Rancho Belago distribution center. These upgrades will allow us to be more efficient and to support expected future growth. We expect these equipment upgrades to be substantially complete by the end of 2015.
DEFINITIONS
Comparable Sales
As part of our discussion of our results of operations, we disclose comparable store sales, which exclude the impact of e-commerce sales. With respect to any reporting period, we define comparable store sales as sales for stores that are owned and operated for at least thirteen full calendar months as of the last day of any calendar month within the current reporting period, and include only those sales for each of the comparable full calendar months that the store is open within each period. When a store closes at the end of a lease during a reporting period, we include in comparable store sales the sales for the number of comparable full calendar months that the store was open within the reporting period. We include new stores in comparable store sales commencing with the fourteenth month of operations because we believe it provides a more meaningful comparison of operating results of months with stabilized operations, and excludes a new store’s first full calendar month of operations when operating results may not be representative for a variety of reasons.
Definitions and calculations of comparable store sales differ among companies in the retail industry, and therefore comparable store sales disclosed by us may not be comparable to the metrics disclosed by other companies.
Cost of Sales or Gross Margins
Our cost of sales includes the cost of footwear purchased from our manufacturers, duties, quota costs, inbound freight (including ocean, air and freight from the dock to our distribution centers), broker fees and storage costs. Because we include expenses related to our distribution network in general and administrative expenses, while some of our competitors may include expenses of this type in cost of sales, our gross margins may not be comparable and we may report higher gross margins than some of our competitors in part for this reason.
Selling expenses
Selling expenses consist primarily of the following: sales representative sample costs, sales commissions, trade shows, advertising and promotional costs, which may include television and ad production costs, and point-of-purchase costs.
General and administrative expenses
General and administrative expenses consist primarily of the following: salaries, wages and related taxes, various overhead costs associated with our corporate staff, stock-based compensation, domestic and international retail operations, non-selling related costs of our international operations, costs associated with our Rancho Belago, European and other foreign distribution centers, professional fees related to both legal and accounting, insurance, depreciation and amortization, and asset impairment, legal settlements, amongst other expenses. Our distribution network related costs are included in general and administrative expenses and are not allocated to specific segments.
34
Table of Contents
YEAR ENDED DECEMBER 31, 2014 COMPARED TO THE YEAR ENDED DECEMBER 31, 2013
Net sales
Net sales for 2014 were $2.378 billion, which was an increase of $531.2 million, or 28.8%, compared to net sales of $1.846 billion for 2013. The increase in net sales broad based and was attributable to higher sales in our domestic wholesale segment, international wholesale segment and our retail segment primarily due to the introduction of new styles and lines of footwear.
Our domestic wholesale net sales increased $195.8 million, or 24.4%, to $998.0 million for 2014 compared to $802.2 million for 2013. The increase in our domestic wholesale segment was attributable to strong sales and significant growth in several key divisions including our Women’s Go, Women’s Active, Men’s and Women’s Sport, and Men’s USA divisions, which was partially offset by reduced sales of our BOB’s products during 2014. The increase in the domestic wholesale segment’s net sales also resulted from a 19.1% unit sales volume increase to 44.9 million pairs in 2014 from 37.7 million pairs in 2013. The average selling price per pair within the domestic wholesale segment increased 4.4%, to $22.20 per pair for 2014 from $21.26 for 2013, which was primarily the result of increased selling prices for our Women’s Sport, Women’s Active and Men’s USA divisions.
Our international wholesale segment net sales increased $210.4 million, or 43.9%, to $689.2 million for 2014 compared to sales of $478.8 million for 2013. Our international wholesale sales consist of direct sales by our foreign subsidiaries — those sales we make to department stores and specialty retailers — and sales to our distributors, who in turn sell to retailers in various international regions where we do not sell directly. Direct sales by our foreign subsidiaries increased $143.0 million, or 40.4%, to $497.1 million for 2014 compared to sales of $354.1 million for 2013. The largest sales increases during the year came from our subsidiaries in the United Kingdom, Germany, and Canada and our joint ventures in China and Hong Kong. The increases are primarily attributable to sales of our Women’s and Men’s Go, Women’s Active and Men’s and Women’s Sport lines. Our distributor sales increased $67.3 million, or 54.1%, to $192.0 million for 2014, compared to sales of $124.7 million for 2013. This was primarily attributable to increased sales to our distributors in Australia and New Zealand, South Korea, Taiwan, and the United Arab Emirates (“UAE”).
Our retail segment sales increased $125.3 million to $663.5 million for the year ended December 31, 2014, a 23.3% increase over sales of $538.2 million for 2013. The increase in retail sales was primarily attributable to increased comparable sales of 10.6%, which included increased sales of our Women’s Go, Women’s Active, Men’s and Women’s Sport, and Men’s USA divisions and a net increase of 41 domestic and 18 international stores compared to 2013. For the year ended December 31, 2014, our domestic retail sales increased 16.2% compared to 2013, which was attributable to positive comparable domestic store sales of 8.9% and increased domestic store count, and our international retail store sales increased 64.2% compared to 2013, which was attributable to increased international store count and positive comparable international store sales of 20.8%. During 2014, we opened two new domestic concept stores, 17 domestic factory outlet stores, 29 domestic warehouse outlet stores, nine international concept stores, seven international factory outlet stores and three international warehouse outlet stores.
We believe that we have established our presence in most major domestic retail markets. We had 363 domestic stores and 84 international retail stores as of February 15, 2015, and we currently plan to open approximately 50 to 60 stores in 2015. We opened 48 domestic retail stores and 19 international retail stores in 2014, while closing seven underperforming domestic stores and one international concept store. We opened 31 domestic retail stores and 16 international retail stores in 2013, while closing 10 underperforming domestic stores and one international store. We periodically review all of our stores for impairment. During 2014 and 2013, we did not record an impairment charge. Further, we carefully review our under-performing stores and may consider the non-renewal of leases upon completion of the current term of the applicable lease.
Our e-commerce net sales decreased $0.3 million to $26.9 million for 2014, a 1.3% decrease compared to sales of $27.2 million for 2013. Our e-commerce sales made up approximately 1.1% and 1.5% of our consolidated net sales for 2014 and 2013, respectively.
Gross profit
Gross profit for 2014 increased $253.1 million to $1.072 billion from $818.8 million for 2013. Gross profit as a percentage of net sales, or gross margin, increased to 45.1% in 2014 from 44.4% for 2013. Our domestic wholesale segment gross profit increased $79.2 million, or 27.4%, to $368.0 million for 2014 from $288.8 million for 2013 attributable to increased sales volume. Domestic wholesale margins increased to 36.9% for 2014 from 36.0% for 2013. The increase in domestic wholesale margins was primarily attributable to higher margins in our Men’s USA and Women’s Sport lines.
35
Table of Contents
Gross profit for our international wholesale segment increased $93.8 million, or 47.2%, to $292.7 million for 2014 compared to $198.9 million for 2013. Gross margins were 42.5% for 2014 compared to 41.5% for 2013. The increase in gross margins for our international wholesale segment was primarily attributable to increased sales by our subsidiaries, which historically have achieved higher gross margins attributable to direct sales to customers than our international wholesale sales through our foreign distributors. Gross margins for our international direct subsidiary sales were 48.6% for 2014 as compared to 47.3% for 2013 primarily attributable to increased sales of our newer products. Gross margins for our international distributor sales were 26.5% for 2014 as compared to 25.1% for 2013.
Gross profit for our retail segment increased $79.6 million, or 24.9%, to $398.6 million for 2014 as compared to $319.0 million for 2013. Gross margins for all stores were 60.1% for 2014 compared to 59.3% for 2013. Gross margins for our domestic stores were 60.8% for 2014 as compared to 59.6% for 2013. Gross margins for our international stores were 57.2% for 2014 and 2013. The increases in domestic and overall retail margins were primarily attributable to increased sales of our newer products at higher margins.
Selling expenses
Selling expenses increased by $27.5 million, or 17.9%, to $181.0 million for 2014 from $153.5 million for 2013, although selling expenses decreased as a percentage of net sales to 7.6% for 2014 from 8.3% for 2013 attributable to increased net sales. The increase in selling expenses was primarily the result of higher advertising expenses, which also decreased as a percentage of net sales to 5.3% in 2014 from 5.6% in 2013 attributable to increased net sales.
General and administrative expenses
General and administrative expenses increased by $111.5 million, or 19.2%, to $690.9 million for 2014 from $579.4 million for 2013. As a percentage of sales, general, administrative and legal expenses were 29.1% and 31.4% for 2014 and 2013, respectively. The increase in general, administrative and legal expenses was primarily attributable to $41.6 million related to supporting our growing international operations, increased store operating costs of $31.6 million primarily attributable to an additional 59 stores in comparison to the prior year, increased salaries and wages of $19.9 million, which includes incentive compensation, $7.5 million from bad debt write-offs and increased warehouse and distribution costs of $11.9 million. In addition, the expenses related to our distribution network, including the functions of purchasing, receiving, inspecting, allocating, warehousing and packaging of our products totaled $134.8 million and $122.9 million for 2014 and 2013, respectively.
Other income (expense)
Interest income was $0.8 million for each of 2014 and 2013. Interest expense for 2014 increased $0.6 million to $12.5 million compared to $11.9 million in 2013. The increase was primarily attributable to increased interest expense of $1.3 million attributable to interest incurred on purchases from our foreign manufacturers that increased compared to the prior year, which was offset by reduced interest paid on loans for our domestic distribution center equipment. Loss on foreign currency transactions for 2014 increased $4.6 million to $5.4 million compared to $0.8 million in 2013. This increased foreign currency exchange loss was primarily attributable to higher short-term intercompany investments balances in our foreign subsidiaries and a stronger U.S. dollar. Gain on disposal of assets for 2014 decreased $1.3 million to a loss of $0.9 million as compared to a gain of $0.4 million in 2013.
Income taxes
Our provision for income tax expense (benefit) and our effective income tax rate are significantly impacted by the mix of our domestic and foreign earnings (loss) before income taxes. In the non-U.S. jurisdictions in which we have operations, the applicable statutory rates are generally significantly lower than in the U.S., ranging from 0% to 34%. Our provision for income tax expense (benefit) was calculated using the applicable statutory income tax rate for each jurisdiction applied to our pre-tax earnings (loss) in each jurisdiction, while our effective tax rate is calculated by dividing income tax expense (benefit) by earnings (loss) before income taxes.
36
Table of Contents
Our earnings (loss) before income taxes and income tax expense (benefit) for 2014, 2013 and 2012 are as follows (in thousands):
| Years Ended December 31, | ||||||||||||||||||||||||
| 2014 | 2013 | 2012 | ||||||||||||||||||||||
| Income tax jurisdiction |
Earnings (loss) before income taxes |
Income tax expense |
Earnings (loss) before income taxes |
Income tax expense |
Earnings (loss) before income taxes |
Income tax expense (benefit) |
||||||||||||||||||
| United States |
$ | 82,778 | $ | 32,500 | $ | 38,705 | $ | 12,807 | $ | (27,379 | ) | $ | (5,867 | ) | ||||||||||
| Canada |
6,241 | 1,572 | 4,091 | 1,187 | 2,564 | 545 | ||||||||||||||||||
| Chile |
629 | 138 | 9,622 | 1,920 | 5,971 | 1,043 | ||||||||||||||||||
| Peoples Republic of China (“China”) |
15,201 | 1,179 | 6,148 | 1,646 | 1,278 | 319 | ||||||||||||||||||
| Jersey (1) |
77,555 | 0 | 25,348 | 0 | 25,162 | 0 | ||||||||||||||||||
| Non-benefited loss operations (2) |
(13,021 | ) | 0 | (15,841 | ) | 0 | (13,492 | ) | 0 | |||||||||||||||
| Other jurisdictions (3) |
21,997 | 3,795 | 14,142 | 3,787 | 16,369 | 3,921 | ||||||||||||||||||
|
|
|
|
|
|
|
|
|
|
|
|
|
|||||||||||||
| Earnings before income taxes |
$ | 191,380 | $ | 39,184 | $ | 82,215 | $ | 21,347 | $ | 10,473 | $ | (39 | ) | |||||||||||
|
|
|
|
|
|
|
|
|
|
|
|
|
|||||||||||||
| Effective tax rate (4) |
20.5 | % | 26.0 | % | (0.4 | )% | ||||||||||||||||||
| (1) | Jersey does not assess income tax on corporate net earnings. |
| (2) | Consists of entities in the following tax jurisdictions where no tax benefit is recognized in the period being reported because of the provision of offsetting valuation allowances: Japan, Brazil and India. |
| (3) | Consists of entities in the following tax jurisdictions, each of which comprises not more than 5%, of 2014 consolidated earnings (loss) before taxes: UK, Germany, France, Spain, Belgium, Italy, Netherlands, Switzerland, Malaysia, Thailand, Singapore, Hong Kong, Portugal and Austria. |
| (4) | The effective tax rate is calculated by dividing income tax expense (benefit) by earnings before income taxes. |
For 2014, the effective tax rate was lower than the U.S. federal and state combined statutory rate of approximately 39% primarily because of earnings from foreign operations in jurisdictions imposing either lower tax rates on corporate earnings or no corporate income tax. During 2014, as reflected in the table above, earnings (loss) before income taxes in the U.S. was earnings of $82.8 million, with income tax expense of $32.5 million, an average rate of 39.3%, while earnings (loss) before income taxes in non-U.S. jurisdictions was earnings of $108.6 million, with aggregate income tax expense of $6.7 million, an average rate of 6.2%. Combined, this results in consolidated earnings before income taxes for the period of $191.4 million, and consolidated income tax expense for the period of $39.2 million, resulting in an effective tax rate of 20.5%. We estimate our annual effective tax rate for 2015 to be between 20 percent and 25 percent. The estimated effective tax rate for 2015 is subject to management’s ongoing review and revision, if necessary.
For 2014, of our $108.6 million in earnings before income tax earned outside the U.S., $77.6 million was earned in Jersey, which does not impose a tax on corporate earnings. In addition, there were foreign losses of $13.0 million for which no tax benefit was recognized during the year ended December 31, 2014 because of the provision of offsetting valuation allowances. Individually, none of the other foreign jurisdictions included in “Other jurisdictions” in the table above had more than 5% of our 2014 consolidated earnings (loss) before taxes.
Unremitted earnings of non-U.S. subsidiaries are expected to be reinvested outside of the U.S. indefinitely. Such earnings would become taxable upon the sale or liquidation of these subsidiaries or upon the remittance of dividends.
As of December 31, 2014, we had approximately $466.7 million in cash and cash equivalents, of which $193.2 million, or 41.4%, was held outside the U.S. Of the $193.2 million held by our non-U.S. subsidiaries, approximately $42.8 million is available for repatriation to the U.S. without incurring U.S. income taxes and applicable non-U.S. income and withholding taxes in excess of the amounts accrued in our financial statements as of December 31, 2014. We believe our cash and cash equivalents held in the U.S. and cash provided from operations are sufficient to meet our liquidity needs in the U.S. for the next twelve months and we do not expect that we will need to repatriate any of the funds presently designated as indefinitely reinvested outside the U.S. Under current applicable tax laws, if we chose to repatriate some or all of the funds we have designated as indefinitely reinvested outside the U.S., the amount repatriated would be subject to U.S. income taxes and applicable non-U.S. income and withholding taxes. As of December 31, 2014 and 2013, U.S. income taxes have not been provided on cumulative total earnings of approximately $318.2 million and $226.0 million, respectively.
37
Table of Contents
Non-controlling interest in net income and loss of consolidated subsidiaries
Non-controlling interest for 2014 increased $7.3 million to expense of $13.4 million as compared expense of $6.1 million for 2013. Non-controlling interest represents the share of net earnings or loss that is attributable to our joint venture partners.
YEAR ENDED DECEMBER 31, 2013 COMPARED TO THE YEAR ENDED DECEMBER 31, 2012
Net sales
Net sales for 2013 were $1.846 billion, which was an increase of $286.0 million, or 18.3%, compared to net sales of $1.560 billion for 2012. The increase in net sales was primarily attributable to higher sales in our domestic wholesale, international subsidiaries and retail segments of new styles and lines of footwear that we launched in the second half of 2012.
Our domestic wholesale net sales increased $149.5 million, or 22.9%, to $802.2 million for 2013 compared to $652.7 million for 2012. The increase in our domestic wholesale segment was attributable to strong sales and significant growth in several key divisions including our Women’s Go, and Men’s and Women’s Sport and BOBS divisions, which were offset by reduced sales in our Women’s Active and Women’s USA divisions. The increase in the domestic wholesale segment’s net sales also resulted from a 24.3% unit sales volume increase to 37.7 million pairs in 2013 from 30.4 million pairs in 2012. The average selling price per pair within the domestic wholesale segment decreased slightly to $21.26 per pair for 2013 from $21.50 for 2012, which was primarily the result of lower selling prices in our BOBS and Men’s lines and increased closeouts as compared to 2012.
Our international wholesale segment net sales increased $46.6 million, or 10.8%, to $478.8 million for 2013 compared to sales of $432.2 million for 2012. Direct sales by our foreign subsidiaries increased $59.7 million, or 20.3%, to $354.1 million for 2013 compared to sales of $294.4 million for 2012. The largest sales increases during the year came from our subsidiaries in Canada and France and our joint ventures in Hong Kong, China, Singapore and India, which were offset by decreases in Spain and Italy. The increases are primarily attributable to sales of our Women’s and Men’s Go, Women’s Active, Women’s Sport and Twinkle Toes’ lines. Our distributor sales decreased $13.0 million, or 9.5%, to $124.7 million for 2013, compared to sales of $137.7 million for 2012. This was primarily attributable to decreased sales to our distributors in Panama, South Korea, Ukraine and the United Arab Emirates.
Our retail segment net sales increased $84.6 million, or 18.7%, to $538.2 million for 2013, compared to sales of $453.6 million for 2012. The increase in retail sales was attributable to positive comparable store sales and a net increase of 21 domestic stores and 15 international stores. For 2013, we realized positive comparable store sales of 14.8% in our domestic retail stores and 15.2% in our international retail stores. The comparable store sales increase was principally driven by increased sales of our newer products. During 2013, we opened 10 new domestic concept stores, 13 domestic factory outlet stores, eight domestic warehouse outlet stores, eight international concept stores and eight international factory outlet stores. Our domestic retail sales increased 17.8% for 2013 in comparison to 2012 as the result of the positive comparable store sales and the net increase of 21 domestic stores. Our international retail sales increased 24.1% for 2013 compared to 2012, which was primarily attributable to increases in net sales in Canada, Chile and the United Kingdom as well as a net increase of 15 international stores.
We believe that we have established our presence in most major domestic retail markets. We had 324 domestic stores and 70 international retail stores as of February 15, 2014. We opened 31 domestic retail stores and 16 international retail stores in 2013, while closing 10 underperforming domestic stores and one international store. In 2012, we closed five domestic stores and two international concept stores. We periodically review all of our stores for impairment. During 2013 and 2012, we did not record an impairment charge. Further, we carefully review our under-performing stores and may consider the non-renewal of leases upon completion of the current term of the applicable lease.
Our e-commerce net sales increased $5.3 million to $27.2 million for 2013, a 24.2% increase compared to sales of $21.9 million for 2012. Our e-commerce sales made up approximately 1.5% and 1.4% of our consolidated net sales for 2013 and 2012, respectively.
Gross profit
Gross profit for 2013 increased $135.5 million to $818.8 million from $683.3 million for 2012. Gross profit as a percentage of net sales, or gross margin, increased to 44.4% in 2013 from 43.8% for 2012. Our domestic wholesale segment gross profit increased $45.9 million, or 18.9%, to $288.8 million for 2013 from $242.9 million for 2012 attributable to increased sales volume. Domestic wholesale margins decreased to 36.0% for 2013 from 37.2% for 2012. The decrease in domestic wholesale margins was primarily
38
Table of Contents
attributable to lower margins in our Men’s and Women’s Active lines as well as increased non-toning closeouts, which were partially offset by reduced sales of discounted toning products as compared to the same period in the prior year.
Gross profit for our international wholesale segment increased $32.4 million, or 19.5%, to $198.9 million for 2013 compared to $166.5 million for 2012. Gross margins were 41.5% for 2013 compared to 38.5% for 2012. The increase in gross margins for our international wholesale segment was primarily attributable to increased sales by our European subsidiaries, which historically have achieved higher gross margins attributable to direct sales to customers than our international wholesale sales through our foreign distributors. Gross margins for our direct foreign subsidiary sales were 47.3% for 2013 as compared to 44.7% for 2012 primarily attributable to reduced sales of discounted toning products and increased sales of our newer products. Gross margins for our international distributor sales were 25.1% for 2013 as compared to 25.3% for 2012.
Gross profit for our retail segment increased $55.0 million, or 20.8%, to $319.0 million for 2013 as compared to $264.0 million for 2012. Gross margins for all stores were 59.3% for 2013 compared to 58.2% for 2012. Gross margins for our domestic stores were 59.6% for 2013 as compared to 58.6% for 2012. Gross margins for our international stores were 57.2% for 2013 as compared to 56.1% for 2012. The increases in domestic and overall retail margins were primarily attributable to increased sales of our newer products at higher margins and reduced sales of discounted toning products at lower margins.
Selling expenses
Selling expenses increased by $18.6 million, or 13.8%, to $153.5 million for 2013 from $134.9 million for 2012, although selling expenses decreased as a percentage of net sales to 8.3% for 2013 from 8.7% for 2012 attributable to increased net sales. The increase in selling expenses was primarily the result of higher advertising expenses, which also decreased as a percentage of net sales to 5.6% in 2013 from 5.8% in 2012 attributable to increased net sales.
General, administrative and legal expenses
General, administrative and legal expenses increased by $46.2 million, or 8.7%, to $579.4 million for 2013 from $533.2 million for 2012. As a percentage of sales, general, administrative and legal expenses were 31.4% and 34.2% for 2013 and 2012, respectively. The increase in general, administrative and legal expenses was primarily attributable to increased salaries and wages of $14.3 million, which includes incentive compensation, increased warehouse and distribution costs of $8.1 million and increased rent expense of $5.3 million primarily attributable to an additional 36 stores in comparison to the prior year. In addition, the expenses related to our distribution network, including the functions of purchasing, receiving, inspecting, allocating, warehousing and packaging of our products totaled $122.9 million and $119.3 million for 2013 and 2012, respectively.
Interest income
Interest income for 2013 increased $0.2 million to $0.8 million as compared to $0.6 million for 2012. The increase in interest income was primarily attributable to higher cash balances.
Interest expense
Interest expense for 2013 decreased $1.4 million to $11.9 million compared to $13.3 million in 2012. The decrease was primarily attributable to decreased interest expense of $0.3 million attributable to reduced principal balances on loans related to equipment in our domestic distribution center and reduced interest expense of $0.5 million attributable to lower interest rates on loans related to our domestic distribution center that we refinanced in November 2012. Interest expense was also incurred on amounts owed to our foreign manufacturers.
Gain on disposal of assets
Gain on disposal of assets for 2013 increased $0.6 million to a gain of $0.4 million as compared to a loss of $0.2 million in 2012.
Income taxes
Our provision for income tax expense (benefit) and our effective income tax rate are significantly impacted by the mix of our domestic and foreign earnings (loss) before income taxes. In the non-U.S. jurisdictions in which we have operations, the applicable statutory rates are generally significantly lower than in the U.S., ranging from 0% to 41%. Our provision for income tax expense
39
Table of Contents
(benefit) was calculated using the applicable statutory income tax rate for each jurisdiction applied to our pre-tax earnings (loss) in each jurisdiction, while our effective tax rate is calculated by dividing income tax expense (benefit) by earnings (loss) before income taxes.
Our earnings (loss) before income taxes and income tax expense (benefit) for 2013, 2012 and 2011 are as follows (in thousands):
| Years Ended December 31, | ||||||||||||||||||||||||
| 2013 | 2012 | 2011 | ||||||||||||||||||||||
| Income tax jurisdiction |
Earnings (loss) before income taxes |
Income tax expense |
Earnings (loss) before income taxes |
Income tax expense (benefit) |
Earnings (loss) before income taxes |
Income tax expense (benefit) |
||||||||||||||||||
| United States |
$ | 38,705 | $ | 12,807 | $ | (27,379 | ) | $ | (5,867 | ) | $ | (161,976 | ) | $ | (66,355 | ) | ||||||||
| Canada |
4,091 | 1,187 | 2,564 | 545 | 945 | 309 | ||||||||||||||||||
| Chile |
9,622 | 1,920 | 5,971 | 1,043 | 9,321 | 2,030 | ||||||||||||||||||
| Peoples Republic of China (“China”) |
6,148 | 1,646 | 1,278 | 319 | 1,416 | 354 | ||||||||||||||||||
| Jersey (1) |
25,348 | 0 | 25,162 | 0 | 25,109 | 0 | ||||||||||||||||||
| Non-benefited loss operations (2) |
(15,841 | ) | 0 | (13,492 | ) | 0 | (16,844 | ) | 0 | |||||||||||||||
| Other jurisdictions (3) |
14,142 | 3,787 | 16,369 | 3,921 | 10,982 | 195 | ||||||||||||||||||
|
|
|
|
|
|
|
|
|
|
|
|
|
|||||||||||||
| Earnings (loss) before income taxes |
$ | 82,215 | $ | 21,347 | $ | 10,473 | $ | (39 | ) | $ | (131,047 | ) | $ | (63,467 | ) | |||||||||
|
|
|
|
|
|
|
|
|
|
|
|
|
|||||||||||||
| Effective tax rate (4) |
26.0 | % | (0.4 | %) | 48.4 | % | ||||||||||||||||||
| (1) | Jersey does not assess income tax on corporate net earnings. |
| (2) | Consists of entities in the following tax jurisdictions where no tax benefit is recognized in the period being reported because of the provision of offsetting valuation allowances: Japan, Brazil, China, Hong Kong and India. |
| (3) | Consists of entities in the following tax jurisdictions, each of which comprises not more than 5%, of 2013 consolidated earnings (loss) before taxes: UK, Germany, France, Spain, Belgium, Italy, Netherlands, Switzerland, Malaysia, Thailand, Singapore, China, Hong Kong, Portugal and Austria. |
| (4) | The effective tax rate is calculated by dividing income tax expense (benefit) by earnings (loss) before income taxes. |
For 2013, the effective tax rate was lower than the U.S. federal and state combined statutory rate of approximately 40% primarily because of earnings from foreign operations in jurisdictions imposing either lower tax rates on corporate earnings or no corporate income tax. During 2013, as reflected in the table above, earnings (loss) before income taxes in the U.S. was earnings of $38.7 million, with income tax expense of $12.8 million, an average rate of 33.1%, while earnings (loss) before income taxes in non-U.S. jurisdictions was earnings of $43.5 million, with aggregate income tax expense of $8.5 million, an average rate of 19.6%. Combined, this results in consolidated earnings (loss) before income taxes for the period of $82.2 million, and a consolidated income tax expense for the period of $21.3, resulting in an effective tax rate of 26.0%.
For 2013, of our $43.5 million in earnings before income tax earned outside the U.S., $25.3 million was earned in Jersey, which does not impose a tax on corporate earnings. In addition, there were foreign losses of $15.8 million for which no tax benefit was recognized during the year ended December 31, 2013 because of the provision of offsetting valuation allowances. Individually, none of the other foreign jurisdictions included in “Other jurisdictions” in the table above had more than 5% of our 2013 consolidated earnings (loss) before taxes.
Unremitted earnings of non-U.S. subsidiaries are expected to be reinvested outside of the U.S. indefinitely. Such earnings would become taxable upon the sale or liquidation of these subsidiaries or upon the remittance of dividends.
As of December 31, 2013, we had approximately $372.0 million in cash and cash equivalents, of which $166.5 million, or 44.8%, was held outside the U.S. Of the $166.5 million held by our non-U.S. subsidiaries, approximately $51.2 million is available for repatriation to the U.S. without incurring U.S. income taxes and applicable non-U.S. income and withholding taxes in excess of the amounts accrued in our financial statements as of December 31, 2013. We believe our cash and cash equivalents held in the U.S. and cash provided from operations are sufficient to meet our liquidity needs in the U.S. for the next twelve months and we do not expect that we will need to repatriate any of the funds presently designated as indefinitely reinvested outside the U.S. Under current applicable tax laws, if we chose to repatriate some or all of the funds we have designated as indefinitely reinvested outside the U.S., the amount repatriated would be subject to U.S. income taxes and applicable non-U.S. income and withholding taxes. As of December
40
Table of Contents
31, 2013 and 2012, U.S. income taxes have not been provided on cumulative total earnings of approximately $226.0 million and $171.2 million, respectively.
Non-controlling interest in net income and loss of consolidated subsidiaries
Non-controlling interest for 2013 increased $5.1 million to expense of $6.1 million as compared expense of $1.0 million for 2012. Non-controlling interest represents the share of net earnings or loss that is attributable to our joint venture partners.
LIQUIDITY AND CAPITAL RESOURCES
Cash Flows
Our working capital at December 31, 2014 was $779.3 million, an increase of $74.8 million from working capital of $704.5 million at December 31, 2013. Our cash and cash equivalents at December 31, 2014 was $466.7 million compared to $372.0 million at December 31, 2013. This increase in cash of $94.7 million, after consideration of the effect of exchange rates, was the result of our net earnings of $152.2 million, depreciation of property and equipment of $47.6 million and increased payables of $98.7 million, which was partially offset by capital expenditures of $56.9 million, increased receivables of $70.7 million and increased inventory levels of $100.2 million. Our primary sources of operating cash are collections from customers on wholesale and retail sales. Our primary uses of cash are inventory purchases, selling, general and administrative expenses and debt service payments.
Net cash provided by operating activities was $163.9 million for 2014 and net cash provided by operating activities was $99.0 million for 2013. On a comparative year-to-year basis, the $64.9 million increase in cash flows from operating activities in 2014 from cash used in operating activities in 2013 primarily resulted from an increase in net earnings of $91.3 million and an increase in accounts payable balances of $81.1 million primarily attributable to increased unpaid balances to our contract manufactures due to increased purchases at the end of the year when compared to the same period in the prior year. The increase in net earnings and accounts payable balances were partially offset by a $127.0 million increase in inventories to support increased worldwide backlogs and increased accounts receivable balances as of December 31, 2014 as compared to December 31, 2013.
Net cash used in investing activities was $56.9 million for 2014 as compared to $41.4 million in 2013. The increase in cash used in investing activities in 2014 as compared to 2013 was the result of increased capital expenditures. Capital expenditures for 2014 were approximately $56.9 million, which consisted of $28.4 million for new store openings and remodels, $13.9 million for the initial phase of automation upgrades for our European Distribution Center equipment, $2.5 million in domestic warehouse equipment upgrades, $1.8 million for equipment costs for our new distribution center in Chile and $2.1 million related to a property purchase for potential future corporate development. This was compared to capital expenditures of $41.3 million in the prior year, which primarily consisted of development costs for our Rancho Belago distribution center and new store openings and remodels. We expect our ongoing capital expenditures for 2015 to be between $35.0 million and $45.0 million, which includes opening 50 to 60 retail stores, store remodels, a property purchase for potential future corporate development and investments in information technology. In addition, we are currently in the process of designing and installing additional phases of equipment upgrades for our European Distribution Center and Rancho Belago distribution center and estimate the remaining cost of these equipment upgrades to be approximately $25.0 million. We expect these upgrades to be substantially complete by the end of 2015. We believe our current cash, operating cash flows, available lines of credit and current financing arrangements should be adequate to fund these capital expenditures, although we may seek additional funding for all or a portion of these expenditures.
Net cash used in financing activities was $9.0 million during 2014 compared to $9.9 million during 2013. The increase in cash used by financing activities was primarily attributable to decreased contributions received from the non-controlling interest which were offset by increased short-term borrowings.
Sources of Liquidity
On April 30, 2010, we entered into a construction loan agreement (the “Loan Agreement”), by and among HF Logistics-SKX T1, LLC, a wholly-owned subsidiary of the JV (“HF-T1”), Bank of America, N.A. and Raymond James Bank, FSB. Borrowings made pursuant to the Loan Agreement were up to a maximum limit of $55.0 million (the “Loan”), which were used to construct our domestic distribution facility in Rancho Belago, California. Borrowings bore interest based on LIBOR, and the Loan Agreement’s original maturity date was April 30, 2012, which was extended to November 30, 2012. On November 16, 2012, HF-T1 executed a modification to the Loan Agreement (the “Modification”), which increased the borrowings under the Loan to $80.0 million and extended the maturity date of the Loan to October 31, 2015. The $80.0 million was used to (i) repay $54.7 million in outstanding
41
Table of Contents
borrowings under the original Loan, (ii) repay a loan of $18.3 million including accrued interest from HF to the JV, (iii) repay a loan to the JV of $2.5 million including accrued interest from Skechers RB, LLC, a wholly-owned subsidiary of our company (iv) pay a deferred management fee of $1.9 million to HF, and (iv) pay distributions of $0.9 million to each of HF and Skechers RB, LLC, with (v) $0.8 million used for loan fees and other closing costs. Under the Modification, OneWest Bank, FSB is an additional lender that funded in part the increase to the Loan, and the interest rate on the Loan is the daily British Bankers Association LIBOR rate plus a margin of 3.75%, which is no longer subject to a minimum rate. The Loan Agreement and the Modification are subject to customary covenants and events of default. We were in compliance with all debt covenant provisions related to the Loan Agreement as of the date of this annual report. We had $77.9 million outstanding under the Loan Agreement and the Modification, which is included in short-term borrowings on December 31, 2014. We paid commitment fees of $0.6 million on the Modification, which are being amortized to interest expense over the three-year life of the Modification.
On December 29, 2010, we entered into a master loan and security agreement (the “Master Agreement”), by and between us and Banc of America Leasing & Capital, LLC, and an Equipment Security Note (together with the Master Agreement, the “Loan Documents”), by and among us, Banc of America Leasing & Capital, LLC, and Bank of Utah, as agent (“Agent”). We used the proceeds to refinance certain equipment already purchased and to purchase new equipment for use in our Rancho Belago distribution facility. Borrowings made pursuant to the Master Agreement may be in the form of one or more equipment security notes (each a “Note,” and, collectively, the “Notes”) up to a maximum limit of $80.0 million and each for a term of 60 months. The Note entered into on the same date as the Master Agreement represents a borrowing of approximately $39.3 million. Interest accrues at a fixed rate of 3.54% per annum. On June 30, 2011, we entered into another Note agreement for approximately $36.3 million. Interest accrues at a fixed rate of 3.19% per annum. As of December 31, 2014, an aggregate of $37.1 million was outstanding under the Notes, of which $23.2 million is included in long-term borrowings and $13.9 million is included in short-term borrowings. We paid commitment fees of $0.8 million on this loan, which are being amortized to interest expense over the five-year life of the Notes.
On June 30, 2009, we entered into a $250.0 million secured credit agreement, (the “Credit Agreement”) with a syndicate of banks, of which six currently remain as participants. On November 5, 2009, March 4, 2010, May 3, 2011, and September 30, 2013, we entered into four successive amendments to the Credit Agreement (collectively, the “Amended Credit Agreement”). The Amended Credit Agreement matures in June 2015. The Amended Credit Agreement permits us and certain of our subsidiaries to borrow up to $250.0 million based upon a borrowing base of eligible accounts receivable and inventory, which amount can be increased to $300.0 million at our request and upon satisfaction of certain conditions including obtaining the commitment of existing or prospective lenders willing to provide the incremental amount. Borrowings bear interest at our election based on LIBOR or a Base Rate (defined as the greatest of the base LIBOR plus 1.00%, the Federal Funds Rate plus 0.5% or one of the lenders’ prime rate), in each case, plus an applicable margin based on the average daily principal balance of revolving loans under the credit agreement (0.50%, 0.75% or 1.00% for Base Rate loans and 1.50%, 1.75% or 2.00% for LIBOR loans). We pay a monthly unused line of credit fee of 0.25% or 0.375% per annum, which varies based on the average daily principal balance of outstanding revolving loans and undrawn amounts of letters of credit outstanding during such month. The Amended Credit Agreement further provides for a limit on the issuance of letters of credit to a maximum of $50.0 million. The Amended Credit Agreement contains customary affirmative and negative covenants for secured credit facilities of this type, including a fixed charge coverage ratio that applies when excess availability is less than $40.0 million. In addition, the Amended Credit Agreement places limits on additional indebtedness that we are permitted to incur as well as other restrictions on certain transactions. We paid syndication and commitment fees of $6.7 million on this facility, which are being amortized over the six-year life of the facility.
As of December 31, 2014, outstanding short-term and long-term borrowings were $118.3 million, of which $37.1 million relates to notes payable for warehouse equipment for our domestic distribution center that are secured by the equipment, and $79.4 million primarily relates to our construction loans for our domestic distribution center and $1.7 million relates to our joint venture in India.
We believe that existing cash balances, anticipated cash flows from operations, available borrowings under our secured line of credit, and current financing arrangements will be sufficient to provide us with the liquidity necessary to fund our anticipated working capital and capital requirements through at least March 31, 2016 and for the foreseeable future. We did not provide for deferred income taxes on accumulated undistributed earnings of our non-U.S. subsidiaries on approximately $318.2 million of cumulative undistributed earnings as of December 31, 2014. However, in connection with our current strategies, we will face significant working capital requirements and capital expenditures. Our future capital requirements will depend on many factors, including, but not limited to, the sustained pace and strength of the economic recovery in our markets, costs associated with upgrading the equipment in both our European Distribution Center and Rancho Belago distribution center, the levels at which we maintain inventory, sale of excess inventory at discounted prices, the market acceptance of our footwear, the success of our international operations, the levels of advertising and marketing required to promote our footwear, the extent to which we invest in new product design and improvements to our existing product design, any potential acquisitions of other brands or companies, and the number and timing of new store
42
Table of Contents
openings. To the extent that available funds are insufficient to fund our future activities, we may need to raise additional funds through public or private financing of debt or equity. Recently, we have been successful in raising additional funds through financing activities however, we cannot be assured that additional financing will be available to us or that, if available, it can be obtained on terms favorable to our stockholders and us. Failure to obtain such financing could delay or prevent our current business plans, which could adversely affect our business, financial condition and results of operations. In addition, if additional capital is raised through the sale of additional equity or convertible securities, dilution to our stockholders could occur.
DISCLOSURE ABOUT CONTRACTUAL OBLIGATIONS AND COMMERCIAL COMMITMENTS
The following table summarizes our material contractual obligations and commercial commitments as of December 31, 2014 (In thousands):
| Total | Less than One Year |
One to Three Years |
Three to Five Years |
More Than Five Years |
||||||||||||||||
| Short-term borrowings |
$ | 1,810 | $ | 1,810 | $ | — | $ | — | $ | — | ||||||||||
| Long-term borrowings (1) |
116,488 | 101,407 | 14,525 | 556 | — | |||||||||||||||
| Operating lease obligations (2) |
1,069,447 | 142,695 | 255,399 | 209,997 | 461,356 | |||||||||||||||
| Purchase obligations (3) |
733,578 | 733,578 | — | — | — | |||||||||||||||
| Rancho Belago and EDC equipment |
24,016 | 24,016 | — | — | — | |||||||||||||||
| Minimum payments related to other arrangements |
6,509 | 4,748 | 1,761 | — | — | |||||||||||||||
|
|
|
|
|
|
|
|
|
|
|
|||||||||||
| Total (4) |
$ | 1,951,848 | $ | 1,008,254 | $ | 271,685 | $ | 210,553 | $ | 461,356 | ||||||||||
|
|
|
|
|
|
|
|
|
|
|
|||||||||||
| (1) | Amounts include anticipated interest payments based on interest rates currently in effect. |
| (2) | Operating lease obligations consists primarily of real property leases for our retail stores, corporate offices, European and other international distribution centers. These leases frequently include options that permit us to extend beyond the terms of the initial fixed term. We currently expect to fund these commitments with cash flows from operations and existing cash balances. |
| (3) | Purchase obligations include the following: (i) accounts payable balances for the purchase of footwear of $171.5 million, (ii) outstanding letters of credit of $3.4 million and (iii) open purchase commitments with our foreign manufacturers for $558.7 million. We currently expect to fund these commitments with cash flows from operations and existing cash balances. |
| (4) | Our consolidated balance sheet as of December 31, 2014, included $7.9 million in unrecognized tax benefits. The future payments related to these unrecognized tax benefits have not been presented in the table above due to the uncertainty of the amounts and potential timing of cash settlements with the tax authorities, and whether any settlement would occur. |
OFF-BALANCE SHEET ARRANGEMENTS
We do not have any relationships with unconsolidated entities or financial partnerships such as entities often referred to as structured finance or special purpose entities that would have been established for the purpose of facilitating off-balance-sheet arrangements or for other contractually narrow or limited purposes. As such, we are not exposed to any financing, liquidity, market or credit risk that could arise if we had engaged in such relationships.
CRITICAL ACCOUNTING POLICIES AND USE OF ESTIMATES
Management’s Discussion and Analysis of Financial Condition and Results of Operations is based upon our consolidated financial statements, which have been prepared in accordance with accounting principles generally accepted in the United States of America. The preparation of these financial statements requires us to make difficult, subjective and complex estimates and judgments that affect the reported amounts of assets, liabilities, sales and expenses, and related disclosure of contingent assets and liabilities.
43
Table of Contents
We base our estimates and judgments on historical experience, other available information, and on other assumptions that are believed to be reasonable under the circumstances, the results of which form the basis for making judgments about the carrying values of assets and liabilities. In determining whether an estimate is critical, we consider if the nature of the estimates or assumptions is material due to the levels of subjectivity and judgment or the susceptibility of such matters to change, and if the impact of the estimates and assumptions on financial condition or operating performance is material. Actual results may differ from these estimates under different assumptions or conditions.
We believe the following critical accounting estimates are affected by significant judgments used in the preparation of our consolidated financial statements: revenue recognition, allowance for bad debts, returns, sales allowances and customer chargebacks, inventory write-downs, valuation of long-lived assets, litigation reserves, and valuation of deferred income taxes.
Revenue Recognition. We derive income from the sale of footwear and royalties earned from licensing the Skechers brand. Domestically, goods are shipped Free on Board (“FOB”) shipping point directly from our domestic distribution center in Rancho Belago, California. For our international wholesale customers in the European community, product is shipped FOB shipping point direct from our distribution center in Liege, Belgium. For our distributor sales, the goods are generally delivered directly from the independent factories to our distributors’ freight forwarders on a Free Named Carrier (“FCA”) basis. We recognize revenue on wholesale sales when products are shipped and the customer takes title and assumes risk of loss, collection of the relevant receivable is reasonably assured, persuasive evidence of an arrangement exists and the sales price is fixed or determinable. This generally occurs at time of shipment. Related costs paid to third-party shipping companies are recorded as a cost of sales. We recognize revenue from retail sales at the point of sale. Sales and value added taxes collected from retail customers are excluded from reported revenues. While customers do not have the right to return goods, we periodically decide to accept returns or provide customers with credits. Allowances for estimated returns, discounts, doubtful accounts and chargebacks are provided for when related revenue is recorded.
Royalty income is earned from our licensing arrangements. Upon signing a new licensing agreement, we receive up-front fees, which are generally characterized as prepaid royalties. These fees are initially deferred and recognized as revenue as earned (i.e., as licensed sales are reported to the Company or on a straight-line basis over the term of the agreement). The first calculated royalty payment is based on actual sales of the licensed product or, in some cases minimum royalty payments. Typically, at each quarter-end we receive correspondence from our licensees indicating what the actual sales for the period were. This information is used to calculate and accrue the related royalties currently receivable based on the terms of the agreement.
Allowance for bad debts, returns, sales allowances and customer chargebacks. We provide a reserve against our receivables for estimated losses that may result from our customers’ inability to pay. To minimize the likelihood of uncollectibility, customers’ credit-worthiness is reviewed periodically based on external credit reporting services, financial statements issued by the customer and our experience with the account, and it is adjusted accordingly. When a customer’s account becomes significantly past due, we generally place a hold on the account and discontinue further shipments to that customer, minimizing further risk of loss. We determine the amount of the reserve by analyzing known uncollectible accounts, aged receivables, economic conditions in the customers’ countries or industries, historical losses and our customers’ credit-worthiness. Amounts later determined and specifically identified to be uncollectible are charged or written off against this reserve. Allowance for returns, sales allowances and customer chargebacks are recorded against revenue. Allowances for bad debts are recorded to general and administrative expenses.
We also reserve for potential disputed amounts or chargebacks from our customers. Our chargeback reserve is based on a collectibility percentage based on factors such as historical trends, current economic conditions, and nature of the chargeback receivables. We also reserve for potential sales returns and allowances based on historical trends.
The likelihood of a material loss on an uncollectible account would be mainly dependent on deterioration in the overall economic conditions in a particular country or region. Reserves are fully provided for all probable losses of this nature. For receivables that are not specifically identified as high risk, we provide a reserve based upon our historical loss rate as a percentage of sales. Gross trade accounts receivable were $293.1 million and $241.9 million, and the allowance for bad debts, returns, sales allowances and customer chargebacks were $21.0 million and $15.9 million, at December 31, 2014 and 2013, respectively. Our credit losses charged to expense for the years ended December 31, 2014, 2013 and 2012 were $11.8 million, $2.6 million and $1.5 million, respectively. In addition, we recorded sales return and allowance expense (recoveries) for the years ended December 31, 2014, 2013 and 2012 of $2.3 million, $0.2 million and $(0.4) million, respectively.
Inventory write-downs. Inventories are stated at the lower of cost or market. We continually review our inventory for excess and slow moving inventory. Our review is based on inventory on hand, prior sales and our expected net realizable value. Our analysis includes a review of inventory quantities on hand at period end in relation to year-to-date sales, existing orders from customers and
44
Table of Contents
projections for sales in the foreseeable future. The net realizable value, or market value, is determined based on our estimate of sales prices of such inventory based upon historical sales experience on a style by style basis. A write-down of inventory is considered permanent and creates a new cost basis for those units. The likelihood of any material inventory write-down is dependent primarily on our expectation of future consumer demand for our product. A misinterpretation or misunderstanding of future consumer demand for our product or of the economy, or other failure to estimate correctly, could result in inventory valuation changes, either favorably or unfavorably, compared to the requirement determined to be appropriate as of the balance sheet date. Our gross inventory value was $457.1 million and $361.9 million and our inventory reserve was $3.3 million and $3.8 million, at December 31, 2014 and 2013, respectively.
Valuation of intangibles and long-lived assets. When circumstances warrant, we test for recoverability of the asset groups’ carrying value using estimates of undiscounted future cash flows based on the existing service potential of the applicable asset group in determining the fair value of each asset group. We evaluate whether it is more likely than not that the fair value of a reporting unit is less than its carrying amount based upon our assessment of the following events or changes in circumstances:
| • | macroeconomic conditions such as a deterioration in general economic conditions, limitations on accessing capital, fluctuations in foreign exchange rates, or other developments in equity and credit markets; |
| • | industry and market considerations such as a deterioration in the environment in which an entity operates, an increased competitive environment, a decline in market-dependent multiples or metrics, or a change in the market for an entity’s products or services, or a regulatory or political development; |
| • | cost factors such as increases in raw materials, labor, or other costs that have a negative effect on earnings and cash flows; |
| • | overall financial performance such as negative or declining cash flows or a decline in actual or planned revenue or earnings compared with actual and projected results of relevant prior periods; |
| • | other relevant entity-specific events such as changes in management, key personnel, strategy, or customers, contemplation of bankruptcy, or litigation; |
| • | events affecting a reporting unit such as a change in the composition or carrying amount of its net assets, a more-likely-than-not expectation of selling or disposing all, or a portion, of a reporting unit, the testing for recoverability of a significant asset group within a reporting unit, or recognition of a goodwill impairment loss in the financial statements of a subsidiary that is a component of a reporting unit; |
| • | a sustained decrease in share price. |
If the assets are considered to be impaired, the impairment we recognize is the amount by which the carrying value of the assets exceeds the fair value of the assets. In addition, we base the useful lives and related amortization or depreciation expense on our estimate of the period that the assets will generate revenues or otherwise be used by us. In addition, we prepare a summary of cash flows for each of our retail stores to assess potential impairment of the fixed assets and leasehold improvements. Stores with negative cash flows opened in excess of twenty-four months are then reviewed in detail to determine if impairment exists. Management reviews both quantitative and qualitative factors to asses if a triggering event occurred. For the years ended December 31, 2014, 2013 and 2012, respectively we did not record an impairment charge.
Litigation reserves. Estimated amounts for claims that are probable and can be reasonably estimated are recorded as liabilities in our consolidated balance sheets. The likelihood of a material change in these estimated reserves would depend on additional information or new claims as they may arise and the favorable or unfavorable outcome of the particular litigation. Both the likelihood and amount (or range of loss) on a large portion of our remaining pending litigation is uncertain. As such, we are unable to make a reasonable estimate of the liability that could result from unfavorable in outcomes in our remaining pending litigation. As additional information becomes available, we will assess the potential liability related to our pending litigation and revise our estimates. Such revisions in our estimates of the potential liability could materially impact our results of operations and financial position.
Valuation of deferred income taxes. We record a valuation allowance when necessary to reduce our deferred tax assets to the amount that is more likely than not to be realized. The likelihood of a material change in our expected realization of our deferred tax assets depends on future taxable income and the effectiveness of our tax planning strategies amongst the various domestic and international tax jurisdictions in which we operate. We evaluate our projections of taxable income to determine the recoverability of our deferred tax assets and the need for a valuation allowance. As of December 31, 2014, we had net deferred tax assets of $26.4 million reduced by a valuation allowance of $17.5 million against loss carry-forwards not expected to be utilized by certain foreign subsidiaries.
45
Table of Contents
INFLATION
We do not believe that the relatively moderate rates of inflation experienced in the United States over the last three years have had a significant effect on our sales or profitability. However, we cannot accurately predict the effect of inflation on future operating results. Although higher rates of inflation have been experienced in a number of foreign countries in which our products are manufactured, we do not believe that inflation has had a material effect on our sales or profitability. While we have been able to offset our foreign product cost increases by increasing prices or changing suppliers in the past, we cannot assure you that we will be able to continue to make such increases or changes in the future.
EXCHANGE RATES
We receive U.S. dollars for substantially all of our domestic and a portion of our international product sales as well as our royalty income. Inventory purchases from offshore contract manufacturers are primarily denominated in U.S. dollars; however, purchase prices for our products may be impacted by fluctuations in the exchange rate between the U.S. dollar and the local currencies of the contract manufacturers, which may have the effect of increasing our cost of goods in the future. During 2014 and 2013, exchange rate fluctuations did not have a material impact on our inventory costs. We do not engage in hedging activities with respect to such exchange rate risk.
RECENT ACCOUNTING PRONOUNCEMENTS
In May 2014, the Financial Accounting Standards Board (“FASB”) amended the FASB Accounting Standards Codification and created a new Topic 606, “Revenue from Contracts with Customers” (“ASC 606”). This amendment prescribes that an entity should recognize revenue to depict the transfer of promised goods or services to customers in an amount that reflects the consideration to which the entity expects to be entitled in exchange for those goods or services. The amendment supersedes the revenue recognition requirements in Topic 605, “Revenue Recognition”, and most industry-specific guidance throughout the Industry Topics of the Codification. For annual and interim reporting periods the mandatory adoption date of ASC 606 is January 1, 2017, and there will be two methods of adoption allowed, either a full retrospective adoption or a modified retrospective adoption. The Company is currently evaluating the impact of ASC 606, but at the current time does not know what impact the new standard will have on revenue recognized and other accounting decisions in future periods, if any, nor what method of adoption will be selected if the impact is material.
In August 2014, the FASB amended the FASB Accounting Standards Codification and amended Subtopic 205-40, “Presentation of Financial Statements — Going Concern.” This amendment prescribes that an entity’s management should evaluate whether there are conditions or events, considered in the aggregate, that raise substantial doubt about the entity’s ability to continue as a going concern within one year after the date that the financial statements are issued. The amendments will become effective for the Company’s annual and interim reporting periods beginning January 1, 2017. The Company is evaluating the impact on its consolidated financial statements, however, the Company does not expect that the adoption of this standard will have a material impact on the Company’s consolidated financial statements.
| ITEM 7A. | QUANTITATIVE AND QUALITATIVE DISCLOSURES ABOUT MARKET RISK |
Market risk is the potential loss arising from the adverse changes in market rates and prices, such as interest rates, marketable debt security prices and foreign currency exchange rates. Changes in interest rates, marketable debt security prices and changes in foreign currency exchange rates have and will have an impact on our results of operations. We do not hold any derivative securities that require fair value presentation under ASC 815-10.
Interest rate fluctuations. Interest rates charged on our long-term debt are based on either the prime rate of interest or the LIBOR, and changes in either of these rates of interest could have an effect on the interest charged on our outstanding balances. At December 31, 2014 we had $1.8 million and $77.9 million of outstanding short-term and long-term borrowings, respectively subject to changes in interest rates; however, we do not expect that any changes will have a material impact on our financial condition or results of operations.
Foreign exchange rate fluctuations. We face market risk to the extent that changes in foreign currency exchange rates affect our non-U.S. dollar functional currency foreign subsidiary’s revenues, expenses, assets and liabilities. In addition, changes in foreign exchange rates may affect the value of our inventory commitments. Also, inventory purchases of our products may be impacted by
46
Table of Contents
fluctuations in the exchange rates between the U.S. dollar and the local currencies of the contract manufacturers, which could have the effect of increasing the cost of goods sold in the future. We manage these risks by primarily denominating these purchases and commitments in U.S. dollars. We do not currently engage in hedging activities with respect to such exchange rate risks. A 200 basis point reduction in the exchange rates used to calculate foreign currency translations at December 31, 2014 would have reduced the values of our net investments by approximately $11.0 million.
47
Table of Contents
| ITEM 8. | FINANCIAL STATEMENTS AND SUPPLEMENTARY DATA |
INDEX TO CONSOLIDATED FINANCIAL STATEMENTS AND FINANCIAL STATEMENT SCHEDULE
| Page | ||||
| 49 | ||||
| 50 | ||||
| 51 | ||||
| 52 | ||||
| 53 | ||||
| 54 | ||||
| 55 | ||||
| 77 | ||||
48
Table of Contents
Report of Independent Registered Public Accounting Firm
Board of Directors and Stockholders
Skechers U.S.A., Inc.
Manhattan Beach, CA
We have audited the accompanying consolidated balance sheets of Skechers U.S.A., Inc. and subsidiaries as of December 31, 2014 and 2013 and the related consolidated statements of earnings, comprehensive income, equity, and cash flows for each of the three years in the period ended December 31, 2014. In connection with our audits of the financial statements, we have also audited the financial statement schedule listed in the accompanying index. These financial statements and schedule are the responsibility of the Company’s management. Our responsibility is to express an opinion on these financial statements and schedule based on our audits.
We conducted our audits in accordance with the standards of the Public Company Accounting Oversight Board (United States). Those standards require that we plan and perform the audit to obtain reasonable assurance about whether the financial statements are free of material misstatement. An audit includes examining, on a test basis, evidence supporting the amounts and disclosures in the financial statements, assessing the accounting principles used and significant estimates made by management, as well as evaluating the overall presentation of the financial statements and schedule. We believe that our audits provide a reasonable basis for our opinion.
In our opinion, the consolidated financial statements referred to above present fairly, in all material respects, the financial position of Skechers U.S.A., Inc. and subsidiaries at December 31, 2014 and 2013, and the results of their operations and their cash flows for each of the three years in the period ended December 31, 2014, in conformity with accounting principles generally accepted in the United States of America.
Also, in our opinion, the financial statement schedule, when considered in relation to the basic consolidated financial statements taken as a whole, present fairly, in all material respects, the information set forth therein.
We also have audited, in accordance with the standards of the Public Company Accounting Oversight Board (United States), Skechers U.S.A., Inc. and subsidiaries’ internal control over financial reporting as of December 31, 2014, based on criteria established in Internal Control — Integrated Framework (2013) issued by the Committee of Sponsoring Organizations of the Treadway Commission (COSO) and our report dated February 27, 2015 expressed an unqualified opinion thereon.
/s/ BDO USA, LLP
Los Angeles, CA
February 27, 2015
49
Table of Contents
SKECHERS U.S.A., INC. AND SUBSIDIARIES
CONSOLIDATED BALANCE SHEETS
(In thousands, except par values)
| December 31, 2014 |
December 31, 2013 |
|||||||
| ASSETS | ||||||||
| Current Assets: |
||||||||
| Cash and cash equivalents |
$ | 466,685 | $ | 372,011 | ||||
| Trade accounts receivable, less allowances of $21,007 in 2014 and $15,926 in 2013 |
272,103 | 225,941 | ||||||
| Other receivables |
16,510 | 10,599 | ||||||
|
|
|
|
|
|||||
| Total receivables |
288,613 | 236,540 | ||||||
| Inventories |
453,837 | 358,168 | ||||||
| Prepaid expenses and other current assets |
57,015 | 26,094 | ||||||
| Deferred tax assets |
18,864 | 22,115 | ||||||
|
|
|
|
|
|||||
| Total current assets |
1,285,014 | 1,014,928 | ||||||
| Property, plant and equipment, at cost, less accumulated depreciation and amortization |
373,183 | 361,755 | ||||||
| Goodwill and other intangible assets, less accumulated amortization |
1,630 | 2,377 | ||||||
| Deferred tax assets |
2,044 | 9,950 | ||||||
| Other assets, at cost |
13,047 | 19,560 | ||||||
|
|
|
|
|
|||||
| Total non-current assets |
389,904 | 393,642 | ||||||
|
|
|
|
|
|||||
| TOTAL ASSETS |
$ | 1,674,918 | $ | 1,408,570 | ||||
|
|
|
|
|
|||||
| LIABILITIES AND EQUITY |
| |||||||
| Current Liabilities: |
||||||||
| Current installments of long-term borrowings |
$ | 101,407 | $ | 12,028 | ||||
| Short-term borrowings |
1,810 | 87 | ||||||
| Accounts payable |
352,815 | 258,183 | ||||||
| Accrued expenses |
49,705 | 40,124 | ||||||
|
|
|
|
|
|||||
| Total current liabilities |
505,737 | 310,422 | ||||||
| Long-term borrowings, excluding current installments |
15,081 | 116,488 | ||||||
| Other long-term liabilities |
19,993 | 1,740 | ||||||
|
|
|
|
|
|||||
| Total non-current liabilities |
35,074 | 118,228 | ||||||
|
|
|
|
|
|||||
| Total liabilities |
540,811 | 428,650 | ||||||
| Commitments and contingencies |
||||||||
| Stockholders’ equity: |
||||||||
| Preferred Stock, $.001 par value; 10,000 shares authorized; none issued and outstanding |
— | — | ||||||
| Class A Common Stock, $.001 par value; 100,000 shares authorized; 40,287 and 39,688 shares issued and outstanding at December 31, 2014 and 2013, respectively |
40 | 40 | ||||||
| Class B Common Stock, $.001 par value; 60,000 shares authorized; 10,470 and 10,870 shares issued and outstanding at December 31, 2014 and 2013, respectively |
10 | 11 | ||||||
| Additional paid-in capital |
355,636 | 342,143 | ||||||
| Accumulated other comprehensive loss |
(16,077 | ) | (8,701 | ) | ||||
| Retained earnings |
735,640 | 596,829 | ||||||
|
|
|
|
|
|||||
| Skechers U.S.A., Inc. equity |
1,075,249 | 930,322 | ||||||
| Noncontrolling interests |
58,858 | 49,598 | ||||||
|
|
|
|
|
|||||
| Total equity |
1,134,107 | 979,920 | ||||||
|
|
|
|
|
|||||
| TOTAL LIABILITIES AND EQUITY |
$ | 1,674,918 | $ | 1,408,570 | ||||
|
|
|
|
|
|||||
See accompanying notes to consolidated financial statements.
50
Table of Contents
SKECHERS U.S.A., INC. AND SUBSIDIARIES
CONSOLIDATED STATEMENTS OF EARNINGS
(In thousands, except per share data)
| Years Ended December 31, | ||||||||||||
| 2014 | 2013 | 2012 | ||||||||||
| Net sales |
$ | 2,377,561 | $ | 1,846,361 | $ | 1,560,321 | ||||||
| Cost of sales |
1,305,656 | 1,027,569 | 876,995 | |||||||||
|
|
|
|
|
|
|
|||||||
| Gross profit |
1,071,905 | 818,792 | 683,326 | |||||||||
| Royalty income |
9,107 | 7,734 | 7,104 | |||||||||
|
|
|
|
|
|
|
|||||||
| 1,081,012 | 826,526 | 690,430 | ||||||||||
|
|
|
|
|
|
|
|||||||
| Operating expenses: |
||||||||||||
| Selling |
181,018 | 153,491 | 134,920 | |||||||||
| General and administrative |
690,923 | 579,426 | 533,191 | |||||||||
|
|
|
|
|
|
|
|||||||
| 871,941 | 732,917 | 668,111 | ||||||||||
|
|
|
|
|
|
|
|||||||
| Earnings from operations |
209,071 | 93,609 | 22,319 | |||||||||
|
|
|
|
|
|
|
|||||||
| Other income (expense): |
||||||||||||
| Interest income |
837 | 841 | 559 | |||||||||
| Interest expense |
(12,466 | ) | (11,890 | ) | (13,324 | ) | ||||||
| Other, net |
(662 | ) | 447 | (216 | ) | |||||||
| Gain (loss) on foreign currency transactions |
(5,400 | ) | (792 | ) | 1,135 | |||||||
|
|
|
|
|
|
|
|||||||
| (17,691 | ) | (11,394 | ) | (11,846 | ) | |||||||
|
|
|
|
|
|
|
|||||||
| Earnings before income tax expense |
191,380 | 82,215 | 10,473 | |||||||||
| Income tax expense (benefit) |
39,184 | 21,347 | (39 | ) | ||||||||
|
|
|
|
|
|
|
|||||||
| Net earnings |
152,196 | 60,868 | 10,512 | |||||||||
| Less: Net earnings attributable to noncontrolling interests |
13,385 | 6,080 | 1,000 | |||||||||
|
|
|
|
|
|
|
|||||||
| Net earnings attributable to Skechers U.S.A., Inc. |
$ | 138,811 | $ | 54,788 | $ | 9,512 | ||||||
|
|
|
|
|
|
|
|||||||
| Net earnings per share attributable to Skechers U.S.A., Inc.: |
||||||||||||
| Basic |
$ | 2.74 | $ | 1.09 | $ | 0.19 | ||||||
|
|
|
|
|
|
|
|||||||
| Diluted |
$ | 2.72 | $ | 1.08 | $ | 0.19 | ||||||
|
|
|
|
|
|
|
|||||||
| Weighted average shares used in calculating earnings per share attributable to Skechers U.S.A., Inc.: |
||||||||||||
| Basic |
50,613 | 50,363 | 49,495 | |||||||||
|
|
|
|
|
|
|
|||||||
| Diluted |
51,026 | 50,563 | 49,942 | |||||||||
|
|
|
|
|
|
|
|||||||
See accompanying notes to consolidated financial statements.
51
Table of Contents
SKECHERS U.S.A., INC. AND SUBSIDIARIES
CONSOLIDATED STATEMENTS OF COMPREHENSIVE INCOME
(In thousands)
| Years Ended December 31, | ||||||||||||
| 2014 | 2013 | 2012 | ||||||||||
| Net earnings |
$ | 152,196 | $ | 60,868 | $ | 10,512 | ||||||
| Other comprehensive income, net of tax: |
||||||||||||
| Loss on foreign currency translation adjustment, net of tax |
(7,954 | ) | (6,363 | ) | (1,251 | ) | ||||||
|
|
|
|
|
|
|
|||||||
| Comprehensive income |
144,242 | 54,505 | 9,261 | |||||||||
| Less: Comprehensive income attributable to noncontrolling interests |
12,807 | 6,018 | 1,255 | |||||||||
|
|
|
|
|
|
|
|||||||
| Comprehensive income attributable to Skechers U.S.A., Inc. |
$ | 131,435 | $ | 48,487 | $ | 8,006 | ||||||
|
|
|
|
|
|
|
|||||||
See accompanying notes to consolidated financial statements.
52
Table of Contents
SKECHERS U.S.A., INC. AND SUBSIDIARIES
CONSOLIDATED STATEMENTS OF EQUITY
(In thousands)
| SHARES | AMOUNT | ACCUMULATED | ||||||||||||||||||||||||||||||||||||||
| CLASS A COMMON STOCK |
CLASS B COMMON STOCK |
CLASS A COMMON STOCK |
CLASS B COMMON STOCK |
ADDITIONAL PAID-IN CAPITAL |
OTHER COMPREHENSIVE LOSS |
RETAINED EARNINGS |
SKECHERS U.S.A., INC. EQUITY |
NON CONTROLLING INTERESTS |
TOTAL STOCKHOLDERS’ EQUITY |
|||||||||||||||||||||||||||||||
| Balance at December 31, 2011 |
37,959 | 11,297 | $ | 38 | $ | 11 | $ | 320,877 | $ | (894 | ) | $ | 532,529 | $ | 852,561 | $ | 39,966 | $ | 892,527 | |||||||||||||||||||||
| Net earnings |
— | — | — | — | — | — | 9,512 | 9,512 | 1,000 | 10,512 | ||||||||||||||||||||||||||||||
| Foreign currency translation adjustment |
— | — | — | — | — | (1,506 | ) | — | (1,506 | ) | 255 | (1,251 | ) | |||||||||||||||||||||||||||
| Contribution from noncontrolling interest of consolidated entity |
— | — | — | — | — | — | — | — | 3,501 | 3,501 | ||||||||||||||||||||||||||||||
| Distribution to noncontrolling interest of consolidated entity |
— | — | — | — | — | — | — | — | (1,602 | ) | (1,602 | ) | ||||||||||||||||||||||||||||
| Stock compensation expense |
— | — | — | — | 11,527 | — | — | 11,527 | — | 11,527 | ||||||||||||||||||||||||||||||
| Proceeds from issuance of common stock under the employee stock purchase plan |
186 | — | — | — | 2,374 | — | — | 2,374 | — | 2,374 | ||||||||||||||||||||||||||||||
| Proceeds from issuance of common stock under the employee stock option plan |
853 | — | 1 | — | 1,050 | — | — | 1,051 | — | 1,051 | ||||||||||||||||||||||||||||||
| Tax benefit of stock options exercised |
— | — | — | — | 450 | — | — | 450 | — | 450 | ||||||||||||||||||||||||||||||
| Conversion of Class B Common Stock into Class A Common Stock |
23 | (23 | ) | — | — | — | — | — | — | — | — | |||||||||||||||||||||||||||||
|
|
|
|
|
|
|
|
|
|
|
|
|
|
|
|
|
|
|
|
|
|||||||||||||||||||||
| Balance at December 31, 2012 |
39,021 | 11,274 | $ | 39 | $ | 11 | $ | 336,278 | $ | (2,400 | ) | $ | 542,041 | $ | 875,969 | $ | 43,120 | $ | 919,089 | |||||||||||||||||||||
| Net earnings |
— | — | — | — | — | — | 54,788 | 54,788 | 6,080 | 60,868 | ||||||||||||||||||||||||||||||
| Foreign currency translation adjustment |
— | — | — | — | — | (6,301 | ) | — | (6,301 | ) | (62 | ) | (6,363 | ) | ||||||||||||||||||||||||||
| Contribution from noncontrolling interest of consolidated entity |
— | — | — | — | — | — | — | — | 3,635 | 3,635 | ||||||||||||||||||||||||||||||
| Distribution to noncontrolling interest of consolidated entity |
— | — | — | — | — | — | — | — | (3,175 | ) | (3,175 | ) | ||||||||||||||||||||||||||||
| Stock compensation expense |
— | — | — | — | 2,388 | — | — | 2,388 | — | 2,388 | ||||||||||||||||||||||||||||||
| Proceeds from issuance of common stock under the employee stock purchase plan |
149 | — | — | — | 2,614 | — | — | 2,614 | — | 2,614 | ||||||||||||||||||||||||||||||
| Proceeds from issuance of common stock under the employee stock option plan |
114 | — | 1 | — | 332 | — | — | 333 | — | 333 | ||||||||||||||||||||||||||||||
| Tax benefit of stock options exercised |
— | — | — | — | 531 | — | — | 531 | — | 531 | ||||||||||||||||||||||||||||||
| Conversion of Class B Common Stock into Class A Common Stock |
404 | (404 | ) | — | — | — | — | — | — | — | — | |||||||||||||||||||||||||||||
|
|
|
|
|
|
|
|
|
|
|
|
|
|
|
|
|
|
|
|
|
|||||||||||||||||||||
| Balance at December 31, 2013 |
39,688 | 10,870 | $ | 40 | $ | 11 | $ | 342,143 | $ | (8,701 | ) | $ | 596,829 | $ | 930,322 | $ | 49,598 | $ | 979,920 | |||||||||||||||||||||
| Net earnings |
— | — | — | — | — | — | 138,811 | 138,811 | 13,385 | 152,196 | ||||||||||||||||||||||||||||||
| Foreign currency translation adjustment |
— | — | — | — | — | (7,376 | ) | — | (7,376 | ) | (578 | ) | (7,954 | ) | ||||||||||||||||||||||||||
| Contribution from noncontrolling interest of consolidated entity |
— | — | — | — | — | — | — | — | 503 | 503 | ||||||||||||||||||||||||||||||
| Distribution to noncontrolling interest of consolidated entity |
— | — | — | — | — | — | — | — | (4,050 | ) | (4,050 | ) | ||||||||||||||||||||||||||||
| Stock compensation expense |
— | — | — | — | 8,684 | — | — | 8,684 | — | 8,684 | ||||||||||||||||||||||||||||||
| Proceeds from issuance of common stock under the employee stock purchase plan |
102 | — | — | — | 3,363 | — | — | 3,363 | — | 3,363 | ||||||||||||||||||||||||||||||
| Proceeds from issuance of common stock under the employee stock option plan |
97 | — | — | — | — | — | — | — | — | — | ||||||||||||||||||||||||||||||
| Tax benefit of stock options exercised |
— | — | — | — | 1,446 | — | — | 1,446 | — | 1,446 | ||||||||||||||||||||||||||||||
| Conversion of Class B Common Stock into Class A Common Stock |
400 | (400 | ) | — | (1 | ) | — | — | — | (1 | ) | — | (1 | ) | ||||||||||||||||||||||||||
|
|
|
|
|
|
|
|
|
|
|
|
|
|
|
|
|
|
|
|
|
|||||||||||||||||||||
| Balance at December 31, 2014 |
40,287 | 10,470 | $ | 40 | $ | 10 | $ | 355,636 | $ | (16,077 | ) | $ | 735,640 | $ | 1,075,249 | $ | 58,858 | $ | 1,134,107 | |||||||||||||||||||||
|
|
|
|
|
|
|
|
|
|
|
|
|
|
|
|
|
|
|
|
|
|||||||||||||||||||||
See accompanying notes to consolidated financial statements
53
Table of Contents
SKECHERS U.S.A., INC. AND SUBSIDIARIES
CONSOLIDATED STATEMENTS OF CASH FLOWS
(In thousands)
| Years Ended December 31, | ||||||||||||
| 2014 | 2013 | 2012 | ||||||||||
| Cash flows from operating activities: |
||||||||||||
| Net earnings |
$ | 152,196 | $ | 60,868 | $ | 10,512 | ||||||
| Adjustments to reconcile net earnings to net cash provided by (used in) operating activities: |
||||||||||||
| Depreciation of property, plant and equipment |
47,557 | 42,397 | 41,542 | |||||||||
| Amortization of deferred financing costs |
1,201 | 1,201 | 1,195 | |||||||||
| Amortization of intangible assets |
747 | 912 | 906 | |||||||||
| Provision for bad debts, returns and allowances |
14,153 | 2,868 | 1,112 | |||||||||
| Tax benefit from share-based compensation |
— | (201 | ) | (78 | ) | |||||||
| Non-cash share-based compensation |
8,684 | 2,388 | 11,527 | |||||||||
| Deferred income taxes (benefits) |
22,411 | 11,583 | (7,538 | ) | ||||||||
| Loss (gain) on disposal of property, plant and equipment |
837 | (447 | ) | 216 | ||||||||
| (Increase) decrease in assets: |
||||||||||||
| Receivables |
(70,695 | ) | (21,279 | ) | (36,989 | ) | ||||||
| Inventories |
(100,162 | ) | (22,589 | ) | (111,813 | ) | ||||||
| Prepaid expenses and other current assets |
(31,788 | ) | 1,205 | 60,266 | ||||||||
| Other assets |
4,548 | (3,239 | ) | (4,955 | ) | |||||||
| Increase (decrease) in liabilities: |
||||||||||||
| Accounts payable |
98,686 | 17,596 | 9,958 | |||||||||
| Accrued expenses |
15,507 | 5,714 | 20,692 | |||||||||
|
|
|
|
|
|
|
|||||||
| Net cash provided by (used in) operating activities |
163,882 | 98,977 | (3,447 | ) | ||||||||
|
|
|
|
|
|
|
|||||||
| Cash flows from investing activities: |
||||||||||||
| Capital expenditures |
(56,905 | ) | (41,294 | ) | (52,452 | ) | ||||||
| Intangible additions |
— | (87 | ) | — | ||||||||
|
|
|
|
|
|
|
|||||||
| Net cash used in investing activities |
(56,905 | ) | (41,381 | ) | (52,452 | ) | ||||||
|
|
|
|
|
|
|
|||||||
| Cash flows from financing activities: |
||||||||||||
| Net proceeds from the issuances of stock through employee stock purchase plan and the exercise of stock options |
3,363 | 2,947 | 3,425 | |||||||||
| Contribution from non-controlling interest of consolidated entity |
503 | 3,635 | 3,501 | |||||||||
| Distributions to non-controlling interest of consolidated entity |
(4,050 | ) | (3,175 | ) | (1,602 | ) | ||||||
| Excess tax benefits from share-based compensation |
1,446 | 732 | 528 | |||||||||
| Proceeds (payments) on short-term borrowings |
1,723 | (2,382 | ) | (47,998 | ) | |||||||
| Proceeds from long-term debt |
— | — | 82,143 | |||||||||
| Payments on long-term debt |
(12,028 | ) | (11,667 | ) | (10,243 | ) | ||||||
|
|
|
|
|
|
|
|||||||
| Net cash (used in) provided by financing activities |
(9,043 | ) | (9,910 | ) | 29,754 | |||||||
|
|
|
|
|
|
|
|||||||
| Net increase (decrease) in cash and cash equivalents |
97,934 | 47,686 | (26,145 | ) | ||||||||
| Effect of exchange rates on cash and cash equivalents |
(3,260 | ) | (1,501 | ) | 827 | |||||||
| Cash and cash equivalents at beginning of year |
372,011 | 325,826 | 351,144 | |||||||||
|
|
|
|
|
|
|
|||||||
| Cash and cash equivalents at end of year |
$ | 466,685 | $ | 372,011 | $ | 325,826 | ||||||
|
|
|
|
|
|
|
|||||||
| Supplemental disclosures of cash flow information: |
||||||||||||
| Cash paid (received) during the year for: |
||||||||||||
| Interest |
$ | 10,822 | $ | 10,624 | $ | 11,812 | ||||||
| Income taxes paid (recovered) |
29,499 | 5,480 | (48,706 | ) | ||||||||
See accompanying notes to consolidated financial statements.
54
Table of Contents
SKECHERS U.S.A., INC. AND SUBSIDIARIES
NOTES TO CONSOLIDATED FINANCIAL STATEMENTS
DECEMBER 31, 2014, 2013 and 2012
| (1) | THE COMPANY AND SUMMARY OF SIGNIFICANT ACCOUNTING POLICIES |
| (a) | The Company and Basis of Presentation |
Skechers U.S.A., Inc. and subsidiaries (the “Company”) designs, develops, markets and distributes footwear. The Company also operates 362 domestic and 87 international retail stores and an e-commerce business as of December 31, 2014.
The consolidated financial statements have been prepared in accordance with accounting principles generally accepted in the United States and include the accounts of the Company and its subsidiaries. All significant intercompany balances and transactions have been eliminated in consolidation.
| (b) | Use of Estimates |
The Company has made a number of estimates and assumptions relating to the reporting of assets, liabilities, revenues and expenses and the disclosure of contingent assets and liabilities to prepare these consolidated financial statements in conformity with accounting principles generally accepted in the United States. Significant areas requiring the use of estimates relate primarily to revenue recognition, allowance for bad debts, returns, sales allowances and customer chargebacks, inventory write-downs, valuation of intangibles and long-lived assets, litigation reserves and valuation of deferred income taxes. Actual results could differ from those estimates.
| (c) | Revenue Recognition |
The Company recognizes revenue on wholesale sales when products are shipped and the customer takes title and assumes risk of loss, collection of the relevant receivable is reasonably assured, persuasive evidence of an arrangement exists and the sales price is fixed or determinable. This generally occurs at time of shipment. Wholesale sales, which include amounts billed for shipping and handling costs, are recognized net of allowances for estimated returns, sales allowances, discounts, chargebacks. Allowances for estimated returns, discounts, doubtful accounts and chargebacks are recorded when related revenue is recorded. Related costs paid to third-party shipping companies are recorded as cost of sales. The Company recognizes revenue from retail and e-commerce sales at the point of sale. Sales and value added taxes collected from retail customers are excluded from reported revenues.
Royalty income is earned from licensing arrangements. Upon signing a new licensing agreement, the Company receives up-front fees, which are generally characterized as prepaid royalties. These fees are initially deferred and recognized as revenue as earned. In addition, the Company receives royalty payments based on actual sales of the licensed products. Typically, at each quarter-end the Company receives correspondence from licensees indicating the actual sales for the period. This information is used to calculate and record the related royalties based on the terms of the agreement.
| (d) | Business Segment Information |
The Company’s operations and segments are organized along its distribution channels and consist of the following: domestic wholesale, international wholesale, retail and e-commerce sales. Information regarding these segments is summarized in Note 13 — Segment Information.
| (e) | Noncontrolling Interests |
The Company has equity interests in several joint ventures that were established either to exclusively distribute the Company’s products throughout Asia or to construct the Company’s domestic distribution facility. These joint ventures are variable interest entities (“VIE”)’s under Accounting Standards Codification (“ASC”) 810-10-15-14. The Company’s determination of the primary beneficiary of a VIE considers all relationships between the Company and the VIE, including management agreements, governance documents and other contractual arrangements. The Company has determined for its VIE’s the Company is the primary beneficiary because it has both of the following characteristics: (a) the power to direct the activities of a VIE that most significantly impact the
55
Table of Contents
entity’s economic performance, and (b) the obligation to absorb losses of the entity that could potentially be significant to the variable interest entity or the right to receive benefits from the entity that could potentially be significant to the variable interest entity. Accordingly, the Company includes the assets and liabilities and results of operations of these entities in its consolidated financial statements, even though the Company may not hold a majority equity interest. There have been no changes during 2014 in the accounting treatment or characterization of any previously identified VIE. The Company continues to reassess these relationships quarterly. The assets of these joint ventures are restricted in that they are not available for general business use outside the context of such joint ventures. The holders of the liabilities of each joint venture have no recourse to the Company. The Company does not have a variable interest in any unconsolidated VIEs.
| (f) | Fair Value of Financial Instruments |
The carrying amount of the Company’s financial instruments, which principally include cash and cash equivalents, investments, accounts receivable, accounts payable and accrued expenses approximate fair value due to the relatively short maturity of such instruments.
The carrying amount of the Company’s long-term borrowings are considered Level 2 liabilities, which approximates the fair value based upon current rates and terms available to the Company for similar debt.
| (g) | Cash and Cash Equivalents |
Cash and cash equivalents consist primarily of certificates of deposit with an initial term of less than three months. For purposes of the consolidated statements of cash flows, the Company considers all highly liquid debt instruments with original maturities of three months or less to be cash equivalents.
| (h) | Allowance for Bad Debts, Returns, Sales Allowances and Customer Chargebacks |
The Company provides a reserve charged against revenue and its receivables for estimated losses that may result from its customers’ inability to pay. To minimize the likelihood of uncollectibility, customers’ credit-worthiness is reviewed periodically based on external credit reporting services, financial statements issued by the customer and the Company’s experience with the account, and it is adjusted accordingly. When a customer’s account becomes significantly past due, the Company generally places a hold on the account and discontinues further shipments to that customer, minimizing further risk of loss. The Company determines the amount of the reserve by analyzing known uncollectible accounts, aged receivables, economic conditions in the customers’ countries or industries, historical losses and its customers’ credit-worthiness. Amounts later determined and specifically identified to be uncollectible are charged or written off against this reserve.
The Company also reserves for potential disputed amounts or chargebacks from its customers. The Company’s chargeback reserve is based on a collectibility percentage based on factors such as historical trends, current economic conditions, and nature of the chargeback receivables. The Company also reserves for potential sales returns and allowances based on historical trends.
The likelihood of a material loss on an uncollectible account would be mainly dependent on deterioration in the overall economic conditions in a particular country or environment. Reserves are fully provided for all probable losses of this nature. For receivables that are not specifically identified as high risk, the Company provides a reserve based upon its historical loss rate as a percentage of sales.
| (i) | Inventories |
Inventories, principally finished goods, are stated at the lower of cost (based on the first-in, first-out method) or market (net realizable value). Cost includes shipping and handling fees and costs, which are subsequently expensed to cost of sales. The Company provides for estimated losses from obsolete or slow-moving inventories and writes down the cost of inventory at the time such determinations are made. Reserves are estimated based upon inventory on hand, historical sales activity, industry trends, the retail environment, and the expected net realizable value. The net realizable value is determined based upon estimated sales prices of such inventory through off-price or discount store channels.
56
Table of Contents
| (j) | Property, Plant and Equipment |
Depreciation and amortization of property, plant and equipment is computed using the straight-line method based on the following estimated useful lives:
| Buildings |
20 years | |
| Building improvements |
10 years | |
| Furniture, fixtures and equipment |
5 to 20 years | |
| Leasehold improvements |
Useful life or remaining lease term, whichever is shorter |
Property, plant and equipment subject to depreciation and amortization is reviewed for impairment whenever events or changes in circumstances indicate that the carrying amount of an asset may not be recoverable. The Company reviews both quantitative and qualitative factors to assess if a triggering event occurred. The Company prepares a summary of store cash flows from its retail stores to assess potential impairment of the fixed assets and leasehold improvements. Stores with negative cash flows opened in excess of 24 months are then reviewed in detail to determine if impairment exists. Recoverability of assets to be held and used is measured by a comparison of the carrying amount of an asset to the estimated undiscounted future cash flows expected to be generated by the asset. If the carrying amount of an asset exceeds its estimated future cash flows, an impairment charge is recognized in the amount by which the carrying amount of the asset exceeds the fair value of the asset. The Company did not record impairment charges during the years ended December 31, 2014, December 31, 2013 or December 31, 2012.
| (k) | Goodwill, Intangible Assets, Purchased Intangibles and Deferred Financing Costs |
Goodwill and other intangible assets are measured for impairment at least annually and more often when events indicate that impairment exists. Intellectual property, which include purchased intellectual property, artwork and designs, trade names and trademarks are amortized over their useful lives ranging from 1–10 years, generally on a straight-line basis. Intangible assets, which were primarily allocated to the domestic wholesale segment, as of December 31, 2014 and 2013, are as follows (in thousands):
| 2014 | 2013 | |||||||
| Intellectual property |
$ | 7,887 | $ | 7,887 | ||||
| Goodwill |
1,575 | 1,575 | ||||||
| Less accumulated amortization |
(7,832 | ) | (7,085 | ) | ||||
|
|
|
|
|
|||||
| Total intangible assets |
$ | 1,630 | $ | 2,377 | ||||
|
|
|
|
|
|||||
The Company recorded, in general and administrative expenses, amortization expense of $0.7 million, $0.9 million and $0.9 million for the years ended December 31, 2014, 2013 and 2012, respectively. The Company recorded, in interest expense, amortization of deferred financing costs of $1.2 million, $1.2 million and $1.2 million for the years ended December 31, 2014, 2013 and 2012, respectively. The Company did not record impairment charges during the years ended December 31, 2014, December 31, 2013 or December 31, 2012.
| (l) | Income Taxes |
The Company accounts for income taxes in accordance with ASC 740-10, which requires that the Company recognize deferred tax liabilities for taxable temporary differences and deferred tax assets for deductible temporary differences and operating loss carry-forwards using enacted tax rates in effect in the years the differences are expected to reverse. Deferred income tax benefit or expense is recognized as a result of changes in net deferred tax assets or deferred tax liabilities. A valuation allowance is recorded when it is more likely than not that some or all of any deferred tax assets will not be realized.
| (m) | Foreign Currency Translation |
In accordance with ASC 830-30, certain international operations use the respective local currencies as their functional currency, while other international operations use the U.S. Dollar as their functional currency. The Company considers the U.S. dollar as its reporting currency. The Company operates internationally through several foreign subsidiaries. Translation adjustments for these subsidiaries are included in other comprehensive income. Additionally, one international subsidiary, Skechers S.a.r.l. located in Switzerland, operates with a functional currency of the U.S. dollar. Resulting re-measurement gains and losses from this subsidiary are included in the determination of net earnings. Assets and liabilities of the foreign operations denominated in local currencies are translated at the rate of exchange at the balance sheet date. Revenues and expenses are translated at the weighted average rate of
57
Table of Contents
exchange during the period. Translations of intercompany loans of a long-term investment nature are included as a component of translation adjustment in other comprehensive income.
| (n) | Net Earnings Per Share Attributable to Skechers U.S.A., Inc. |
Basic earnings per share represents net earnings divided by the weighted average number of common shares outstanding for the period. Diluted earnings per share, in addition to the weighted average determined for basic earnings per share, includes potential common shares which would arise from the exercise of stock options using the treasury stock method.
The Company has two classes of issued and outstanding common stock, Class A Common Stock and Class B Common Stock. Holders of Class A Common Stock and holders of Class B Common Stock have substantially identical rights, including rights with respect to any declared dividends or distributions of cash or property and the right to receive proceeds on liquidation or dissolution of the Company after payment of the Company’s indebtedness. The two classes have different voting rights, with holders of Class A Common Stock entitled to one vote per share while holders of Class B Common Stock are entitled to ten votes per share on all matters submitted to a vote of stockholders. The Company uses the two-class method for calculating net earnings per share. Basic and diluted net earnings per share of Class A Common Stock and Class B Common Stock are identical. The shares of Class B Common Stock are convertible at any time at the option of the holder into shares of Class A Common Stock on a share-for-share basis. In addition, shares of Class B Common Stock will be automatically converted into a like number of shares of Class A Common Stock upon any transfer to any person or entity which is not a permitted transferee.
The following is a reconciliation of net earnings and weighted average common shares outstanding for purposes of calculating earnings per share (in thousands):
| Years Ended December 31, | ||||||||||||
| Basic earnings per share |
2014 | 2013 | 2012 | |||||||||
| Net earnings attributable to Skechers U.S.A., Inc. |
$ | 138,811 | $ | 54,788 | $ | 9,512 | ||||||
| Weighted average common shares outstanding |
50,613 | 50,363 | 49,495 | |||||||||
| Basic earnings per share |
$ | 2.74 | $ | 1.09 | $ | 0.19 | ||||||
| Years Ended December 31, | ||||||||||||
| Diluted earnings per share |
2014 | 2013 | 2012 | |||||||||
| Net earnings attributable to Skechers U.S.A., Inc. |
$ | 138,811 | $ | 54,788 | $ | 9,512 | ||||||
| Weighted average common shares outstanding |
50,613 | 50,363 | 49,495 | |||||||||
| Dilutive stock options |
413 | 200 | 447 | |||||||||
|
|
|
|
|
|
|
|||||||
| Weighted average common shares outstanding |
51,026 | 50,563 | 49,942 | |||||||||
|
|
|
|
|
|
|
|||||||
| Diluted earnings per share |
$ | 2.72 | $ | 1.08 | $ | 0.19 | ||||||
|
|
|
|
|
|
|
|||||||
There were no options excluded from the computation of diluted earnings per share for the years ended December 31, 2014, 2013 or 2012.
| (o) | Comprehensive Income |
Comprehensive income consists of net earnings and foreign currency translation adjustments. Comprehensive income is presented in the consolidated statements of comprehensive income. Components of accumulated other comprehensive income consist of foreign currency translation adjustments and income attributable to non-controlling interests. The Company operates internationally through several foreign subsidiaries. Assets and liabilities of the foreign operations denominated in local currencies are translated at the rate of exchange at the balance sheet date. Revenues and expenses are translated at the weighted average rate of exchange during the period of translation. The resulting translation adjustments along with translation adjustments related to intercompany loans of a long-term nature are included in the translation adjustment in other comprehensive income.
58
Table of Contents
| (p) | Advertising Costs |
Advertising costs are expensed in the period in which the advertisements are first run or over the life of the endorsement contract. Advertising expense for the years ended December 31, 2014, 2013 and 2012 was approximately $141.7 million, $118.5 million and $103.9 million, respectively. Prepaid advertising costs were $13.0 million and $5.5 million at December 31, 2014 and 2013, respectively. Prepaid amounts outstanding at December 31, 2014 and 2013, represent the unamortized portion of endorsement contracts, advertising in trade publications and media productions created which had not run as of December 31, 2014 and 2013, respectively.
| (q) | Product Design and Development Costs |
The Company charges all product design and development costs to general and administrative expenses when incurred. Product design and development costs aggregated approximately $10.3 million, $9.2 million, and $9.5 million during the years ended December 31, 2014, 2013 and 2012, respectively.
| (r) | Warehouse and Distribution Costs |
The Company’s distribution network related costs are included in general and administrative expenses and are not allocated to specific segments. The expenses related to its distribution network, including the functions of purchasing, receiving, inspecting, allocating, warehousing and packaging of its products totaled $134.8 million, $122.9 million and $119.3 million for 2014, 2013 and 2012, respectively.
| (s) | Recent Accounting Pronouncements |
In May 2014, the FASB amended the FASB Accounting Standards Codification and created a new Topic ASC 606. This amendment prescribes that an entity should recognize revenue to depict the transfer of promised goods or services to customers in an amount that reflects the consideration to which the entity expects to be entitled in exchange for those goods or services. The amendment supersedes the revenue recognition requirements in Topic 605, “Revenue Recognition”, and most industry-specific guidance throughout the Industry Topics of the Codification. For annual and interim reporting periods the mandatory adoption date of ASC 606 is January 1, 2017, and there will be two methods of adoption allowed, either a full retrospective adoption or a modified retrospective adoption. The Company is currently evaluating the impact of ASC 606, but at the current time does not know what impact the new standard will have on revenue recognized and other accounting decisions in future periods, if any, nor what method of adoption will be selected if the impact is material.
In August 2014, the FASB amended the FASB Accounting Standards Codification and amended Subtopic 205-40, “Presentation of Financial Statements — Going Concern.” This amendment prescribes that an entity should evaluate whether there are conditions or events, considered in the aggregate, that raise substantial doubt about the entity’s ability to continue as a going concern within one year after the date that the financial statements are issued. The amendments will become effective for the Company’s annual and interim reporting periods beginning January 1, 2017. The Company is evaluating the impact on its consolidated financial statements, however, the Company does not expect that the adoption of this standard will have a material impact on the Company’s consolidated financial statements.
| (2) | PROPERTY, PLANT AND EQUIPMENT |
Property, plant and equipment at December 31, 2014 and 2013 is summarized as follows (in thousands):
| 2014 | 2013 | |||||||
| Land |
$ | 61,163 | $ | 59,113 | ||||
| Buildings and improvements |
177,348 | 176,987 | ||||||
| Furniture, fixtures and equipment |
217,271 | 195,629 | ||||||
| Leasehold improvements |
197,467 | 174,663 | ||||||
|
|
|
|
|
|||||
| Total property, plant and equipment |
653,249 | 606,392 | ||||||
| Less accumulated depreciation and amortization |
280,066 | 244,637 | ||||||
|
|
|
|
|
|||||
| Property, plant and equipment, net |
$ | 373,183 | $ | 361,755 | ||||
|
|
|
|
|
|||||
59
Table of Contents
| (3) | ACCRUED EXPENSES |
Accrued expenses at December 31, 2014 and 2013 are summarized as follows (in thousands):
| 2014 | 2013 | |||||||
| Accrued inventory purchases |
$ | 22,553 | $ | 15,514 | ||||
| Accrued payroll and taxes |
27,152 | 24,610 | ||||||
|
|
|
|
|
|||||
| Accrued expenses |
$ | 49,705 | $ | 40,124 | ||||
|
|
|
|
|
|||||
| (4) | LINE OF CREDIT AND SHORT-TERM BORROWINGS |
On June 30, 2009, the Company entered into a $250.0 million secured credit agreement, (the “Credit Agreement”) with a syndicate of banks, of which six currently remain as participants. On November 5, 2009, March 4, 2010, May 3, 2011, and September 30, 2013, the company entered into four successive amendments to the Credit Agreement (collectively, the “Amended Credit Agreement”). The Amended Credit Agreement matures in June 2015. The Amended Credit Agreement permits the Company and certain of its subsidiaries to borrow up to $250.0 million based upon a borrowing base of eligible accounts receivable and inventory, which amount can be increased to $300.0 million at its request and upon satisfaction of certain conditions including obtaining the commitment of existing or prospective lenders willing to provide the incremental amount. Borrowings bear interest at the Company’s election based on LIBOR or a Base Rate (defined as the greatest of the base LIBOR plus 1.00%, the Federal Funds Rate plus 0.5% or one of the lenders’ prime rate), in each case, plus an applicable margin based on the average daily principal balance of revolving loans under the credit agreement (0.50%, 0.75% or 1.00% for Base Rate loans and 1.50%, 1.75% or 2.00% for LIBOR loans). The company pays a monthly unused line of credit fee of 0.25% or 0.375% per annum, which varies based on the average daily principal balance of outstanding revolving loans and undrawn amounts of letters of credit outstanding during such month. The Amended Credit Agreement further provides for a limit on the issuance of letters of credit to a maximum of $50.0 million. The Amended Credit Agreement contains customary affirmative and negative covenants for secured credit facilities of this type, including a fixed charge coverage ratio that applies when excess availability is less than $40.0 million. In addition, the Amended Credit Agreement places limits on additional indebtedness that the Company is permitted to incur as well as other restrictions on certain transactions. The Company paid syndication and commitment fees of $6.7 million on this facility, which are being amortized to interest expense over the six-year life of the facility. As of December 31, 2014, there is $0.1 million outstanding under this facility, which is classified as short-term borrowings in the consolidated balance sheet. The remaining balance in short-term borrowings, as of December 31, 2014, is related to the Company’s joint venture in India.
| (5) | LONG-TERM BORROWINGS |
Long-term borrowings at December 31, 2014 and 2013 is as follows (in thousands):
| 2014 | 2013 | |||||||
| Note payable to bank, due in monthly installments of $346.6 (includes principal and interest), variable rate interest at 3.92% per annum, secured by property, balloon payment of $77,060 due October 2015 |
$ | 77,900 | $ | 78,908 | ||||
| Note payable to bank, due in monthly installments of $531.4 (includes principal and interest), fixed rate interest at 3.54% per annum, secured by property, balloon payment of $12,635 due December 2015 |
19,159 | 23,573 | ||||||
| Note payable to bank, due in monthly installments of $483.9 (includes principal and interest), fixed rate interest at 3.19% per annum, secured by property, balloon payment of $11,670 due June 2016 |
17,940 | 24,265 | ||||||
| Note payable to TCF Equipment Finance, Inc., due in monthly installments of $30.5 (includes principal and interest), fixed rate interest at 5.24% per annum, maturity date of July 2019 |
1,489 | 1,770 | ||||||
|
|
|
|
|
|||||
| Subtotal |
116,488 | 128,516 | ||||||
| Less current installments |
101,407 | 12,028 | ||||||
|
|
|
|
|
|||||
| Total long-term borrowings, excluding current installments |
$ | 15,081 | $ | 116,488 | ||||
|
|
|
|
|
|||||
60
Table of Contents
The aggregate maturities of long-term borrowings at December 31, 2014 are as follows:
| 2015 |
101,407 | |||
| 2016 |
14,198 | |||
| 2017 |
328 | |||
| 2018 |
345 | |||
| 2019 |
210 | |||
| Thereafter |
— | |||
|
|
|
|||
| $ | 116,488 | |||
|
|
|
The Company’s long-term debt obligations contain both financial and non-financial covenants, including cross-default provisions. The Company is in compliance with its non-financial covenants, including any cross default provisions, and financial covenants of its long-term borrowings as of December 31, 2014.
On April 30, 2010, the Company entered into a construction loan agreement (the “Loan Agreement”), by and among HF Logistics-SKX T1, LLC, a wholly-owned subsidiary of the JV (“HF-T1”), Bank of America, N.A. and Raymond James Bank, FSB. Borrowings made pursuant to the Loan Agreement were up to a maximum limit of $55.0 million (the “Loan”), which were used to construct the domestic distribution facility in Rancho Belago, California. Borrowings bore interest based on LIBOR, and the Loan Agreement’s original maturity date was April 30, 2012, which was extended to November 30, 2012. On November 16, 2012, HF-T1 executed a modification to the Loan Agreement (the “Modification”), which increased the borrowings under the Loan to $80.0 million and extended the maturity date of the Loan to October 31, 2015. The $80.0 million was used to (i) repay $54.7 million in outstanding borrowings under the original Loan, (ii) repay a loan of $18.3 million including accrued interest from HF to the JV, (iii) repay a loan to the JV of $2.5 million including accrued interest from Skechers RB, LLC, a wholly-owned subsidiary of the Company (iv) pay a deferred management fee of $1.9 million to HF, and (iv) pay distributions of $0.9 million to each of HF and Skechers RB, LLC, with (v) $0.8 million used for loan fees and other closing costs. Under the Modification, OneWest Bank, FSB is an additional lender that funded in part the increase to the Loan, and the interest rate on the Loan is the daily British Bankers Association LIBOR rate plus a margin of 3.75%, which is no longer subject to a minimum rate. The Loan Agreement and the Modification are subject to customary covenants and events of default. As of December 31, 2014, there was $77.9 million outstanding under the Loan Agreement and the Modification, which is included in current installments of long-term borrowings. As of December 31, 2013, there was $78.9 million outstanding under the Loan Agreement and the Modification, which was included in long-term borrowings. The Company paid commitment fees of $0.6 million on the Loan, which are being amortized to interest expense over the life of the Loan.
On December 29, 2010, the Company entered into a master loan and security agreement (the “Master Agreement”), by and between us and Banc of America Leasing & Capital, LLC, and an Equipment Security Note (together with the Master Agreement, the “Loan Documents”), by and among us, Banc of America Leasing & Capital, LLC, and Bank of Utah, as agent (“Agent”). The Company used the proceeds to refinance certain equipment already purchased and to purchase new equipment for use in the Rancho Belago distribution facility. Borrowings made pursuant to the Master Agreement may be in the form of one or more equipment security notes (each a “Note,” and, collectively, the “Notes”) up to a maximum limit of $80.0 million and each for a term of 60 months. The Note entered into on the same date as the Master Agreement represents a borrowing of approximately $39.3 million. Interest will accrue at a fixed rate of 3.54% per annum. On June 30, 2011, the Company entered into another Note agreement for approximately $36.3 million. Interest will accrue at a fixed rate of 3.19% per annum. As of December 31, 2014, the Company had $37.1 million outstanding on the Notes, of which $23.2 is included in current installments of long-term borrowings and $13.9 million is included in long-term borrowings. As of December 31, 2013, there was $47.8 million outstanding on the Notes, which was included in long-term borrowings. The Company paid commitment fees of $0.8 million on this loan, which are being amortized to interest expense over the five-year life of the Notes.
61
Table of Contents
| (6) | INCOME TAXES |
The provisions for income tax expense (benefit) were as follows (in thousands):
| 2014 | 2013 | 2012 | ||||||||||
| Federal: |
||||||||||||
| Current |
$ | 7,677 | $ | 632 | $ | (67 | ) | |||||
| Deferred |
23,659 | 11,537 | (6,381 | ) | ||||||||
|
|
|
|
|
|
|
|||||||
| Total federal |
31,336 | 12,169 | (6,448 | ) | ||||||||
|
|
|
|
|
|
|
|||||||
| State: |
||||||||||||
| Current |
2,060 | 519 | 1,796 | |||||||||
| Deferred |
529 | 119 | (307 | ) | ||||||||
|
|
|
|
|
|
|
|||||||
| Total state |
2,589 | 638 | 1,489 | |||||||||
|
|
|
|
|
|
|
|||||||
| Foreign: |
||||||||||||
| Current |
5,399 | 8,228 | 5,325 | |||||||||
| Deferred |
(140 | ) | 312 | (405 | ) | |||||||
|
|
|
|
|
|
|
|||||||
| Total foreign |
5,259 | 8,540 | 4,920 | |||||||||
|
|
|
|
|
|
|
|||||||
| Total income taxes (benefit) |
$ | 39,184 | $ | 21,347 | $ | (39 | ) | |||||
|
|
|
|
|
|
|
|||||||
The Company’s provision for income tax expense (benefit) and effective income tax rate are significantly impacted by the mix of the Company’s domestic and foreign earnings (loss) before income taxes. In the non-U.S. jurisdictions in which the Company has operations, the applicable statutory rates are generally significantly lower than in the U.S., ranging from 0% to 34%. The Company’s provision for income tax expense (benefit) was calculated using the applicable statutory rate for each jurisdiction applied to the Company’s pre-tax earnings (loss) in each jurisdiction, while the Company’s effective tax rate is calculated by dividing income tax expense (benefit) by earnings before income taxes.
The Company’s earnings (loss) before income taxes and income tax expense (benefit) for 2014, 2013 and 2012 are as follows (in thousands):
| Years Ended December 31, | ||||||||||||||||||||||||
| 2014 | 2013 | 2012 | ||||||||||||||||||||||
| Income tax jurisdiction |
Earnings (loss) before income taxes |
Income tax expense |
Earnings (loss) before income taxes |
Income tax expense |
Earnings (loss) before income taxes |
Income tax expense (benefit) |
||||||||||||||||||
| United States |
$ | 82,778 | $ | 32,500 | $ | 38,705 | $ | 12,807 | $ | (27,379 | ) | $ | (5,867 | ) | ||||||||||
| Canada |
6,241 | 1,572 | 4,091 | 1,187 | 2,564 | 545 | ||||||||||||||||||
| Chile |
629 | 138 | 9,622 | 1,920 | 5,971 | 1,043 | ||||||||||||||||||
| Peoples Republic of China (“China”) |
15,201 | 1,179 | 6,148 | 1,646 | 1,278 | 319 | ||||||||||||||||||
| Jersey (1) |
77,555 | — | 25,348 | — | 25,162 | — | ||||||||||||||||||
| Non-benefited loss operations (2) |
(13,021 | ) | — | (15,841 | ) | — | (13,492 | ) | — | |||||||||||||||
| Other jurisdictions (3) |
21,997 | 3,795 | 14,142 | 3,787 | 16,369 | 3,921 | ||||||||||||||||||
|
|
|
|
|
|
|
|
|
|
|
|
|
|||||||||||||
| Earnings before income taxes |
$ | 191,380 | $ | 39,184 | $ | 82,215 | $ | 21,347 | $ | 10,473 | $ | (39 | ) | |||||||||||
|
|
|
|
|
|
|
|
|
|
|
|
|
|||||||||||||
| Effective tax rate (4) |
20.5 | % | 26.0 | % | (0.4 | )% | ||||||||||||||||||
| (1) | Jersey does not assess income tax on corporate net earnings. |
| (2) | Consists of entities in the following tax jurisdictions where no tax benefit is recognized in the period being reported because of the provision of offsetting valuation allowances: Japan, Brazil and India. |
| (3) | Consists of entities in the following tax jurisdictions, each of which comprises not more than 5%, of 2014 consolidated earnings (loss) before taxes: UK, Germany, France, Spain, Belgium, Italy, Netherlands, Switzerland, Malaysia, Thailand, Singapore, Hong Kong, Portugal and Austria. |
| (4) | The effective tax rate is calculated by dividing income tax expense (benefit) by earnings before income taxes. |
62
Table of Contents
For 2014, the effective tax rate was lower than the U.S. federal and state combined statutory rate of approximately 39% primarily because of earnings from foreign operations in jurisdictions imposing either lower tax rates on corporate earnings or no corporate income tax. During 2014, as reflected in the table above, earnings (loss) before income taxes in the U.S. was earnings of $82.8 million, with income tax expense of $32.5 million, an average rate of 39.3%, while earnings (loss) before income taxes in non-U.S. jurisdictions was earnings of $108.6 million, with aggregate income tax expense of $6.7 million, an average rate of 6.2%. Combined, this results in consolidated earnings before income taxes for the period of $191.4 million, and consolidated income tax expense for the period of $39.2 million, resulting in an effective tax rate of 20.5%.
For 2014, of the Company’s $108.6 million in earnings before income tax earned outside the U.S., $77.6 million was earned in Jersey, which does not impose a tax on corporate earnings. In addition, there were foreign losses of $13.0 million for which no tax benefit was recognized during the year ended December 31, 2014 because of the provision of offsetting valuation allowances. Individually, none of the other foreign jurisdictions included in “Other jurisdictions” in the table above had more than 5% of 2014 consolidated earnings (loss) before taxes.
Unremitted earnings of non-U.S. subsidiaries are expected to be reinvested outside of the U.S. indefinitely. Such earnings would become taxable upon the sale or liquidation of these subsidiaries or upon the remittance of dividends.
As of December 31, 2014, the Company had approximately $466.7 million in cash and cash equivalents, of which $193.2 million, or 41.4%, was held outside the U.S. Of the $193.2 million held by the Company’s non-U.S. subsidiaries, approximately $42.8 million is available for repatriation to the U.S. without incurring U.S. income taxes and applicable non-U.S. income and withholding taxes in excess of the amounts accrued in the Company’s financial statements as of December 31, 2014. The Company’s cash and cash equivalents held in the U.S. and cash provided from operations are sufficient to meet the Company’s liquidity needs in the U.S. for the next twelve months and the Company does not expect to repatriate any of the funds presently designated as indefinitely reinvested outside the U.S. Under current applicable tax laws, if the Company chooses to repatriate some or all of the funds designated as indefinitely reinvested outside the U.S., the amount repatriated would be subject to U.S. income taxes and applicable non-U.S. income and withholding taxes. As of December 31, 2014 and 2013, U.S. income taxes have not been provided on cumulative total earnings of $318.2 million and $226.0 million, respectively.
Income taxes differ from the statutory tax rates as applied to earnings before income taxes as follows (in thousands):
| 2014 | 2013 | 2012 | ||||||||||
| Expected income tax expense |
$ | 66,981 | $ | 28,775 | $ | 3,666 | ||||||
| State income tax, net of federal benefit |
1,032 | 255 | 1,406 | |||||||||
| Rate differential on foreign income |
(27,364 | ) | (11,897 | ) | (8,752 | ) | ||||||
| Change in unrecognized tax benefits |
(2,717 | ) | 740 | (149 | ) | |||||||
| Non-deductible expenses |
288 | (150 | ) | 194 | ||||||||
| Prior year R&D credit claims |
— | (493 | ) | — | ||||||||
| Other |
3,333 | (1,187 | ) | 79 | ||||||||
| Change in valuation allowance |
(2,369 | ) | 5,304 | 3,517 | ||||||||
|
|
|
|
|
|
|
|||||||
| Total provision (benefit) for income taxes |
$ | 39,184 | $ | 21,347 | $ | (39 | ) | |||||
|
|
|
|
|
|
|
|||||||
| Effective tax rate |
20.5 | % | 26.0 | % | (0.4 | )% | ||||||
63
Table of Contents
The tax effects of temporary differences that give rise to significant portions of deferred tax assets and deferred tax liabilities at December 31, 2014 and 2013 are presented below (in thousands):
| DEFERRED TAX ASSETS: |
2014 | 2013 | ||||||
| Deferred tax assets – current: |
||||||||
| Inventory adjustments |
$ | 4,942 | $ | 5,075 | ||||
| Accrued expenses |
15,103 | 17,084 | ||||||
| Allowances for bad debts and chargebacks |
6,407 | 6,179 | ||||||
|
|
|
|
|
|||||
| Total current assets |
26,452 | 28,338 | ||||||
|
|
|
|
|
|||||
| Deferred tax assets – long term: |
||||||||
| Loss carryforwards |
23,247 | 43,711 | ||||||
| Business credit carryforward |
4,042 | 9,763 | ||||||
| Share-based compensation |
2,282 | 279 | ||||||
| Valuation allowance |
(17,534 | ) | (19,903 | ) | ||||
|
|
|
|
|
|||||
| Total long term assets |
12,037 | 33,850 | ||||||
|
|
|
|
|
|||||
| Total deferred tax assets |
38,489 | 62,188 | ||||||
|
|
|
|
|
|||||
| Deferred tax liabilities – current: |
||||||||
| Prepaid expenses |
7,588 | 6,223 | ||||||
| Deferred tax liabilities – long term: |
||||||||
| Depreciation on property, plant and equipment |
22,050 | 24,703 | ||||||
|
|
|
|
|
|||||
| Total deferred tax liabilities |
29,638 | 30,926 | ||||||
|
|
|
|
|
|||||
| Net deferred tax assets |
$ | 8,851 | $ | 31,262 | ||||
|
|
|
|
|
|||||
The Company believes it is more likely than not that the results of future operations will generate sufficient taxable income to realize the net deferred tax assets.
Unused U.S. Federal tax credits and net operating losses carried forward from 2012 and prior tax years were used to reduce the Company’s 2014 and 2013 federal tax liability. There were no Federal carry-forward amounts remaining as of December 31, 2014. Federal tax credits and net operating loss carry-forward amounts remaining as of December 31, 2013 were $7.8 million and $47.7 million, respectively. As of December 31, 2014 and 2013, no valuation allowance against the related deferred tax asset has been set up for these loss and tax credit carry-forwards as the carry-forwards were fully utilized in reducing taxable income in 2013 and 2014.
State tax credit and net operating loss carry-forward amounts remaining as of December 31, 2014 were $7.2 million and $65.6 million, respectively. State tax credit and net operating loss carry-forward amounts remaining as of December 31, 2013 were $6.0 million and $109.2 million, respectively. These tax credit and net operating loss carry-forward amounts don’t begin to expire until 2028 and 2021, respectively. As of December 31, 2014 and 2013, no valuation allowance against the related deferred tax asset has been set up for these loss and credit carry-forwards as it is believed the carry-forwards will be fully utilized in reducing future taxable income.
As of December 31, 2014 and 2013, the Company had combined foreign net operating loss carry-forwards available to reduce future taxable income of approximately $56.9 million and $55.9 million, respectively. Some of these net operating losses expire beginning in 2015; however others can be carried forward indefinitely. As of December 31, 2014 and 2013, valuation allowances of $15.9 million and $16.5 million, respectively, had been set up against the related deferred tax assets for those loss carry-forwards that are not more likely than not to be fully utilized in reducing future taxable income.
64
Table of Contents
The balance of unrecognized tax benefits included in net prepaid expenses and long-term liabilities in the consolidated balance sheets decreased by $2.9 million during the year. A reconciliation of the beginning and ending amount of unrecognized tax benefits is as follows (in thousands):
| 2014 | 2013 | |||||||
| Beginning balance |
$ | 10,816 | $ | 10,221 | ||||
| Additions for current year tax positions |
773 | 696 | ||||||
| Additions for prior year tax positions |
— | 164 | ||||||
| Reductions for prior year tax positions |
(2,227 | ) | (5 | ) | ||||
| Settlement of uncertain tax positions |
— | — | ||||||
| Reductions related to lapse of statute of limitations |
(1,426 | ) | (260 | ) | ||||
|
|
|
|
|
|||||
| Ending balance |
$ | 7,936 | $ | 10,816 | ||||
|
|
|
|
|
|||||
If recognized, $7.1 million of unrecognized tax benefits would be recorded as a reduction in income tax expense.
Estimated interest and penalties related to the underpayment of income taxes are classified as a component of income tax expense (benefit) and totaled ($0.2) million for the year ended December 31, 2014, $0.1 million for the year ended December 31, 2013, and $0.2 million for the year ended December 31, 2012. Accrued interest and penalties were $1.7 million and $1.8 million as of December 31, 2014 and 2013, respectively.
The amount of income taxes the Company pays is subject to ongoing audits by taxing jurisdictions around the world. The Company’s estimate of the potential outcome of any uncertain tax position is subject to its assessment of relevant risks, facts, and circumstances existing at that time. The Company believes that it has adequately provided for these matters. However, the Company’s future results may include favorable or unfavorable adjustments to its estimates in the period the audits are resolved, which may impact the Company’s effective tax rate.
As of December 31, 2014, the Company’s tax filings are generally subject to examination in the U.S. and several Asian and European tax jurisdictions for years ending on or after December 31, 2007. During the year, the Company reduced the balance of 2014 and prior year unrecognized tax benefits by $1.4 million as a result of expiring statutes.
The Company is currently under examination by the IRS for tax years 2007 through 2011. The Company is also under examination by a number of states and certain foreign jurisdictions. During the year ended December 31, 2014, there was no reduction in the balance of 2014 and prior year unrecognized tax benefits due to any settlement of an examination. It is reasonably possible that certain federal, state and foreign examinations could be settled during the next twelve months which would reduce the balance of 2014 and prior year unrecognized tax benefits by $4.1 million.
| (7) | COMMITMENTS AND CONTINGENCIES |
| (a) | Leases |
The Company leases facilities under operating lease agreements expiring through November 2031. The Company pays taxes, maintenance and insurance in addition to the lease obligations. The Company also leases certain equipment and automobiles under operating lease agreements expiring at various dates through September 2018. Rent expense for the years ended December 31, 2014, 2013 and 2012 approximated $107.0 million, $94.0 million and $88.7 million, respectively.
Minimum lease payments, which take into account escalation clauses, are recognized on a straight-line basis over the minimum lease term. Subsequent adjustments to the lease payments due to changes in an existing index, usually the consumer price index, are typically included in the calculation of the minimum lease payments when the adjustment is known. Reimbursements for leasehold improvements are recorded as liabilities and are amortized over the lease term. Lease concessions, usually a free rent period, are considered in the calculation of the minimum lease payments for the minimum lease term.
65
Table of Contents
Future minimum lease payments under noncancellable leases at December 31, 2014 are as follows (in thousands):
| OPERATING LEASES |
||||
| Year ending December 31: |
||||
| 2015 |
$ | 142,695 | ||
| 2016 |
135,195 | |||
| 2017 |
120,204 | |||
| 2018 |
110,608 | |||
| 2019 |
99,389 | |||
| Thereafter |
461,356 | |||
|
|
|
|||
| $ | 1,069,447 | |||
|
|
|
|||
| (b) | Litigation |
The Company recognizes legal expense in connection with loss contingencies as incurred.
In accordance with accounting principles generally accepted in the U.S., the Company records a liability in its consolidated financial statements for loss contingencies when a loss is known or considered probable and the amount can be reasonably estimated. When determining the estimated loss or range of loss, significant judgment is required to estimate the amount and timing of a loss to be recorded. Estimates of probable losses resulting from litigation and governmental proceedings are inherently difficult to predict, particularly when the matters are in the procedural stages or with unspecified or indeterminate claims for damages, potential penalties, or fines. Accordingly, the Company cannot determine the final amount, if any, of its liability beyond the amount accrued in the consolidated financial statements as of December 31, 2014, nor is it possible to estimate what litigation-related costs will be in the future.
| (c) | Product and Other Financing |
The Company finances production activities in part through the use of interest-bearing open purchase arrangements with certain of its international manufacturers. These arrangements currently bear interest at rates between 0% and 0.5% for 30- to 60- day financing. The amounts outstanding under these arrangements at December 31, 2014 and 2013 were $171.4 million and $69.1 million, respectively, which are included in accounts payable in the accompanying consolidated balance sheets. Interest expense incurred by the Company under these arrangements amounted to $5.1 million in 2014, $3.9 million in 2013, and $3.8 million in 2012. The Company has open purchase commitments with its foreign manufacturers at December 31, 2014 of $558.7 million, which are not included in the accompanying consolidated balance sheets.
| (8) | NONCONTROLLING INTERESTS |
The following VIE’s are consolidated into the Company’s consolidated financial statements and the carrying amounts and classification of assets and liabilities were as follows (in thousands):
| HF Logistics-SKX, LLC |
December 31, 2014 | December 31, 2013 | ||||||
| Current assets |
$ | 6,812 | $ | 3,076 | ||||
| Noncurrent assets |
118,837 | 129,796 | ||||||
|
|
|
|
|
|||||
| Total assets |
$ | 125,649 | $ | 132,872 | ||||
|
|
|
|
|
|||||
| Current liabilities |
$ | 78,668 | $ | 1,835 | ||||
| Noncurrent liabilities |
1,194 | 79,389 | ||||||
|
|
|
|
|
|||||
| Total liabilities |
$ | 79,862 | $ | 81,224 | ||||
|
|
|
|
|
|||||
66
Table of Contents
| Distribution joint ventures (1) |
December 31, 2014 | December 31, 2013 | ||||||
| Current assets |
$ | 94,819 | $ | 49,835 | ||||
| Noncurrent assets |
10,322 | 9,209 | ||||||
|
|
|
|
|
|||||
| Total assets |
$ | 105,141 | $ | 59,044 | ||||
|
|
|
|
|
|||||
| Current liabilities |
$ | 38,470 | $ | 15,687 | ||||
| Noncurrent liabilities |
66 | 32 | ||||||
|
|
|
|
|
|||||
| Total liabilities |
$ | 38,536 | $ | 15,719 | ||||
|
|
|
|
|
|||||
| (1) | Distribution joint ventures include Skechers China Limited, Skechers Southeast Asia Limited, Skechers Thailand Limited, Skechers South Asia Private Limited, and Skechers Retail India Private Limited. |
Noncontrolling interest earnings was $13.4 million, $6.1 million and $1.0 million for the years ended December 31, 2014, 2013 and 2012, respectively, which represents the share of net earnings or loss that is attributable to the Company’s joint venture partners. HF Logistics-SKX, LLC made cash capital distributions of $3.7 million and $3.2 million during the years ended December 31, 2014 and 2013, respectively. Skechers China Limited made capital distributions of $0.4 million during the year ended December 31, 2014. The distribution joint venture partners made cash capital contributions of $0.5 million, $3.6 million and $3.5 million during the year ended December 31, 2014, 2013 and 2012, respectively.
| (9) | STOCK COMPENSATION |
| (a) | Equity Incentive Plans |
In January 1998, the Company’s Board of Directors adopted the Amended and Restated 1998 Stock Option, Deferred Stock and Restricted Stock Plan for the grant of incentive stock options (“ISOs”), non-qualified stock options and deferred and restricted stock (the “Equity Incentive Plan”). In June 2001, the stockholders approved an amendment to the plan to increase the number of shares of Class A Common Stock authorized for issuance under the plan to 8,215,154. In May 2003, stockholders approved an amendment to the plan to increase the number of shares of Class A Common Stock authorized for issuance under the plan to 11,215,154. Stock option awards are generally granted with an exercise price per share equal to the market price of a share of Class A Common Stock on the date of grant. Stock option awards generally become exercisable over a three-year graded vesting period and expire ten years from the date of grant.
On April 16, 2007, the Company’s Board of Directors adopted the 2007 Incentive Award Plan (the “2007 Plan”), which became effective upon approval by the Company’s stockholders on May 24, 2007. The Company’s Board of Directors terminated the Equity Incentive Plan as of May 24, 2007, with no granting of awards being permitted thereafter, although any awards then outstanding under the Equity Incentive Plan remain in force according to the terms of such terminated plan and the applicable award agreements. A total of 7,500,000 shares of Class A Common Stock are reserved for issuance under the 2007 Plan, which provides for grants of ISOs, non-qualified stock options, restricted stock and various other types of equity awards as described in the plan to the employees, consultants and directors of the Company and its subsidiaries. The 2007 Plan is administered by the Compensation Committee of the Company’s Board of Directors.
| (b) | Valuation Assumptions |
There were no stock options granted under the Equity Incentive Plan or the 2007 Plan during 2014, 2013 or 2012. There were no options exercised during 2014. The total intrinsic value of options exercised during 2013 and 2012 was $0.9 million and $1.9 million, respectively.
67
Table of Contents
| (c) | Stock-Based Payment Awards |
Stock options granted pursuant to the 1998 Stock Option, Deferred Stock and Restricted Stock Plan and the 2007 Incentive Award Plan (the “Equity Incentive Plans”) were as follows:
| SHARES | WEIGHTED AVERAGE OPTION EXERCISE PRICE |
|||||||
| Outstanding at December 31, 2011 |
206,400 | $ | 7.62 | |||||
| Granted |
— | — | ||||||
| Exercised |
(149,489 | ) | 7.03 | |||||
| Cancelled |
(4,215 | ) | 6.95 | |||||
|
|
|
|||||||
| Outstanding at December 31, 2012 |
52,696 | 9.34 | ||||||
| Granted |
— | — | ||||||
| Exercised |
(37,696 | ) | 8.83 | |||||
| Cancelled |
— | — | ||||||
|
|
|
|||||||
| Outstanding at December 31, 2013 |
15,000 | 10.60 | ||||||
| Granted |
— | — | ||||||
| Exercised |
— | — | ||||||
| Cancelled |
(15,000 | ) | 10.60 | |||||
|
|
|
|||||||
| Outstanding at December 31, 2014 |
0 | $ | 0 | |||||
|
|
|
|||||||
There was no unrecognized compensation cost related to stock option shares as of December 31, 2014 and 2013, respectively.
A summary of the status and changes of nonvested shares related to the Equity Incentive Plans as of and for the period ended December 31, 2014 is presented below:
| SHARES | WEIGHTED AVERAGE GRANT-DATE FAIR VALUE |
|||||||
| Nonvested at December 31, 2011 |
740,493 | $ | 19.02 | |||||
| Granted |
281,000 | 17.58 | ||||||
| Vested/Released |
(704,160 | ) | 18.58 | |||||
| Cancelled |
(33,000 | ) | 27.60 | |||||
|
|
|
|||||||
| Nonvested at December 31, 2012 |
284,333 | 17.69 | ||||||
| Granted |
67,500 | 27.70 | ||||||
| Vested/Released |
(75,667 | ) | 18.03 | |||||
| Cancelled |
— | — | ||||||
|
|
|
|||||||
| Nonvested at December 31, 2013 |
276,166 | 20.05 | ||||||
| Granted |
1,092,500 | 47.02 | ||||||
| Vested/Released |
(97,333 | ) | 19.98 | |||||
| Cancelled |
(7,500 | ) | 18.75 | |||||
|
|
|
|||||||
| Nonvested at December 31, 2014 |
1,263,833 | $ | 43.38 | |||||
|
|
|
|||||||
As of December 31, 2014, a total of 3,716,381 shares remain available for grant as equity awards under the 2007 Plan.
The Company recognized compensation expense of $8.7 million, $2.4 million and $11.5 million and related income tax benefits (expense) of $1.4 million, $0.5 million, and $0.5 million for grants under its stock-based compensation plans in the consolidated statements of operations for the years ended December 31, 2014, 2013, and 2012, respectively. There was $48.7 million and $5.0 million of unrecognized compensation cost related to nonvested common shares as of December 31, 2014 and 2013, respectively. That cost is expected to be recognized over a weighted average period of 3.0 years and 2.7 years, respectively. The total fair value of shares vested during the period ended December 31, 2014 and 2013 was $1.9 million and $1.4 million, respectively.
| (d) | Stock Purchase Plans |
On April 16, 2007, the Company’s Board of Directors adopted the 2008 Employee Stock Purchase Plan (the “2008 ESPP”), and the Company’s stockholders approved the 2008 ESPP on May 24, 2007. The 2008 ESPP became effective on January 1, 2008, and the Company’s Board of Directors terminated the 1998 ESPP as of such date, with no additional granting of rights being permitted under
68
Table of Contents
the 1998 ESPP. The 2008 ESPP provides that a total of 3,000,000 shares of Class A Common Stock are reserved for issuance under the plan. The number of shares that may be made available for sale is subject to automatic increases on the first day of each fiscal year during the term of the 2008 ESPP as provided in the plan. The 2008 ESPP is intended to qualify as an “employee stock purchase plan” under Section 423 of the Internal Revenue Code of 1986, as amended. The terms of the 2008 ESPP permit eligible employees to purchase Class A Common Stock at six-month intervals through payroll deductions, which may not exceed 15% of an employee’s compensation. The price of Class A Common Stock purchased under the 2008 ESPP is 85% of the lower of the fair market value of the Class A Common Stock at the beginning of each six-month offering period or on the applicable purchase date. Employees may end their participation in an offering at any time during the offering period. The 2008 ESPP is administered by the Company’s Board of Directors.
During 2014, 2013 and 2012, 102,153 shares, 149,257 shares and 186,199 shares were issued under the 2008 ESPP for which the Company received approximately $3.4 million, $2.6 million and $2.4 million, respectively.
| (10) | STOCKHOLDERS’ EQUITY |
The authorized capital stock of the Company consists of 100,000,000 shares of Class A Common Stock, par value $.001 per share, 60,000,000 shares of Class B Common Stock, par value $.001 per share, and 10,000,000 shares of preferred stock, $.001 par value per share.
The Company has two classes of issued and outstanding common stock, Class A Common Stock and Class B Common Stock. Holders of Class A Common Stock and holders of Class B Common Stock have substantially identical rights, including rights with respect to any declared dividends or distributions of cash or property and the right to receive proceeds on liquidation or dissolution of the Company after payment of the Company’s indebtedness. The two classes have different voting rights, with holders of Class A Common Stock entitled to one vote per share while holders of Class B Common Stock are entitled to ten votes per share on all matters submitted to a vote of stockholders. The shares of Class B Common Stock are convertible at any time at the option of the holder into shares of Class A Common Stock on a share-for-share basis. In addition, shares of Class B Common Stock will be automatically converted into a like number of shares of Class A Common Stock upon any transfer to any person or entity which is not a permitted transferee.
During 2014, 2013 and 2012, certain Class B stockholders converted 399,776 shares, 404,396 shares and 22,880 shares, respectively, of Class B Common Stock to Class A Common Stock.
| (11) | BUSINESS AND CREDIT CONCENTRATIONS |
The Company generates the majority of its sales in the United States; however, several of its products are sold into various foreign countries, which subject the Company to the risks of doing business abroad. In addition, the Company operates in the footwear industry, which is impacted by the general economy, and its business depends on the general economic environment and levels of consumer spending. Changes in the marketplace may significantly affect the Company’s estimates and its performance. The Company performs regular evaluations concerning the ability of customers to satisfy their obligations and provides for estimated doubtful accounts. Domestic accounts receivable, which generally do not require collateral from customers, amounted to $166.9 million and $138.4 million before allowances for bad debts and sales returns, and chargebacks at December 31, 2014 and 2013, respectively. Foreign accounts receivable, which generally are collateralized by letters of credit, amounted to $126.2 million and $103.5 million before allowance for bad debts, sales returns, and chargebacks at December 31, 2014 and 2013, respectively. International net sales amounted to $819.3 million, $558.1 million and $496.0 million for the years ended December 31, 2014, 2013 and 2012, respectively. The Company’s credit losses charged to expense for the years ended December 31, 2014, 2013 and 2012 were $11.8 million, $2.6 million and $1.5 million, respectively. In addition, the Company’s recorded sales return and allowance expense (recoveries) for the years ended December 31, 2014, 2013 and 2012 were $2.3 million, $0.2 million and $(0.4) million, respectively.
Assets located outside the United States consist primarily of cash, accounts receivable, inventory, property, plant and equipment, and other assets. Net assets held outside the United States were $548.9 million and $413.2 million at December 31, 2014 and 2013, respectively.
During 2014, 2013 and 2012, no customer accounted for 10.0% or more of net sales. No customer accounted for more than 10% of net trade receivables at December 31, 2014 or December 31, 2013. During 2014, 2013 and 2012, net sales to the five largest customers were approximately 15.7%, 18.1% and 18.1%, respectively.
69
Table of Contents
The Company’s top five manufacturers produced the following for the years ended December 31, 2014, 2013 and 2012, respectively:
| Percentage of total production Years Ended December 31, |
||||||||||||
| 2014 | 2013 | 2012 | ||||||||||
| Manufacturer #1 |
37.5 | % | 37.8 | % | 33.5 | % | ||||||
| Manufacturer #2 |
6.1 | % | 7.1 | % | 9.2 | % | ||||||
| Manufacturer #3 |
5.7 | % | 6.1 | % | 6.7 | % | ||||||
| Manufacturer #4 |
4.9 | % | 4.8 | % | 6.6 | % | ||||||
| Manufacturer #5 |
4.7 | % | 4.1 | % | 5.6 | % | ||||||
|
|
|
|
|
|
|
|||||||
| 58.9 | % | 59.9 | % | 61.6 | % | |||||||
|
|
|
|
|
|
|
|||||||
The majority of the Company’s products are produced in China. The Company’s operations are subject to the customary risks of doing business abroad, including but not limited to currency fluctuations and revaluations, custom duties and related fees, various import controls and other monetary barriers, restrictions on the transfer of funds, labor unrest and strikes and, in certain parts of the world, political instability. The Company believes it has acted to reduce these risks by diversifying manufacturing among various factories. To date, these business risks have not had a material adverse impact on the Company’s operations.
| (12) | EMPLOYEE BENEFIT PLANS |
The Company has a 401(k) profit sharing plan covering all employees who are 21 years of age and have completed six months of service. Employees may contribute up to 15.0% of annual compensation. Company contributions to the plan are discretionary and vest over a six year period. The Company did not make a contribution to the plan for the years ended December 31, 2014, 2013 and 2012, respectively.
In May 2013, the Company established the Skechers U.S.A., Inc. Deferred Compensation Plan (the “Plan”), which allows eligible employees to defer compensation up to a maximum amount to a future date on a nonqualified basis. The Plan provides for the Company to make discretionary contributions to participating employees, which will be determined by the Company’s Compensation Committee. The Company did not make a contribution to the plan for the year ended December 31, 2014 or 2013. The value of the deferred compensation is recognized based on the fair value of the participants’ accounts as determined monthly. The Company has established a rabbi trust (the “Trust”) as a reserve for the benefits payable under the Plan. The assets of the Trust and deferred liabilities are presented in the Company’s condensed consolidated balance sheets.
| (13) | SEGMENT INFORMATION |
The Company has four reportable segments – domestic wholesale sales, international wholesale sales, retail sales, and e-commerce sales. The Company evaluates segment performance based primarily on net sales and gross margins. All other costs and expenses of the Company are analyzed on an aggregate basis, and these costs are not allocated to the Company’s segments. Net sales, gross margins and identifiable assets for the domestic wholesale, international wholesale, retail, and the e-commerce segment on a combined basis were as follows (in thousands):
| 2014 | 2013 | 2012 | ||||||||||
| Net sales |
||||||||||||
| Domestic wholesale |
$ | 997,994 | $ | 802,163 | $ | 652,651 | ||||||
| International wholesale |
689,195 | 478,799 | 432,163 | |||||||||
| Retail |
663,528 | 538,186 | 453,600 | |||||||||
| E-commerce |
26,844 | 27,213 | 21,907 | |||||||||
|
|
|
|
|
|
|
|||||||
| Total |
$ | 2,377,561 | $ | 1,846,361 | $ | 1,560,321 | ||||||
|
|
|
|
|
|
|
|||||||
70
Table of Contents
| 2014 | 2013 | 2012 | ||||||||||
| Gross profit |
||||||||||||
| Domestic wholesale |
$ | 367,980 | $ | 288,818 | $ | 242,931 | ||||||
| International wholesale |
292,722 | 198,853 | 166,454 | |||||||||
| Retail |
398,613 | 319,036 | 264,010 | |||||||||
| E-commerce |
12,590 | 12,085 | 9,931 | |||||||||
|
|
|
|
|
|
|
|||||||
| Total |
$ | 1,071,905 | $ | 818,792 | $ | 683,326 | ||||||
|
|
|
|
|
|
|
|||||||
| 2014 | 2013 | |||||||
| Identifiable assets |
||||||||
| Domestic wholesale |
$ | 979,582 | $ | 865,071 | ||||
| International wholesale |
510,063 | 374,738 | ||||||
| Retail |
185,041 | 168,532 | ||||||
| E-commerce |
232 | 229 | ||||||
|
|
|
|
|
|||||
| Total |
$ | 1,674,918 | $ | 1,408,570 | ||||
|
|
|
|
|
|||||
| 2014 | 2013 | 2012 | ||||||||||
| Additions to property, plant and equipment |
||||||||||||
| Domestic wholesale |
$ | 9,655 | $ | 9,652 | $ | 33,488 | ||||||
| International wholesale |
18,899 | 4,828 | 2,939 | |||||||||
| Retail |
28,351 | 26,814 | 16,025 | |||||||||
|
|
|
|
|
|
|
|||||||
| Total |
$ | 56,905 | $ | 41,294 | $ | 52,452 | ||||||
|
|
|
|
|
|
|
|||||||
Geographic Information
The following summarizes the Company’s operations in different geographic areas as of and for the years ended December 31:
| 2014 | 2013 | 2012 | ||||||||||
| Net Sales (1) |
||||||||||||
| United States |
$ | 1,558,226 | $ | 1,288,302 | $ | 1,064,298 | ||||||
| Canada |
85,139 | 63,665 | 49,460 | |||||||||
| Other international (2) |
734,196 | 494,394 | 446,563 | |||||||||
|
|
|
|
|
|
|
|||||||
| Total |
$ | 2,377,561 | $ | 1,846,361 | $ | 1,560,321 | ||||||
|
|
|
|
|
|
|
|||||||
| 2014 | 2013 | |||||||
| Property, plant and equipment |
||||||||
| United States |
$ | 332,383 | $ | 337,727 | ||||
| Canada |
7,203 | 5,079 | ||||||
| Other international (2) |
33,597 | 18,949 | ||||||
|
|
|
|
|
|||||
| Total |
$ | 373,183 | $ | 361,755 | ||||
|
|
|
|
|
|||||
| (1) | The Company has subsidiaries in Canada, the United Kingdom, Germany, France, Spain, Portugal, Italy, the Netherlands, Japan, Brazil and Chile that generate net sales within those respective countries and in some cases the neighboring regions. The Company has joint ventures in India, China, Hong Kong, Malaysia, Singapore and Thailand that generate net sales from those countries. The Company also has a subsidiary in Switzerland that generates net sales from that country in addition to net sales to distributors located in numerous non-European countries. Net sales are attributable to geographic regions based on the location of the Company subsidiary. |
| (2) | Other international consists of Switzerland, the United Kingdom, Germany, Austria, France, Spain, Portugal, Italy, the Netherlands, China, Hong Kong, Malaysia, Singapore, Thailand, Brazil, Chile, Vietnam, India and Japan. |
71
Table of Contents
| (14) | RELATED PARTY TRANSACTIONS |
The Company paid approximately $160,000, $178,000, and $162,000 during 2014, 2013 and 2012, respectively, to the Manhattan Inn Operating Company, LLC (“MIOC”) for lodging, food and events including the Company’s holiday party at the Shade Hotel, which is owned and operated by MIOC. Michael Greenberg, President and a director of the Company, owns a 12% beneficial ownership interest in MIOC, and four other officers, directors and senior vice presidents of the Company own in aggregate an additional 5% beneficial ownership in MIOC. The Company had no outstanding accounts receivable or payable with MIOC or the Shade Hotel at December 31, 2014.
On July 29, 2010, the Company formed the Skechers Foundation (the “Foundation”), which is a 501(c)(3) non-profit entity that does not have any shareholders or members. The Foundation is not a subsidiary of and is not otherwise affiliated with the Company, and the Company does not have a financial interest in the Foundation. However, two officers and directors of the Company, Michael Greenberg, the Company’s President, and David Weinberg, the Company’s Chief Operating Officer and Chief Financial Officer, are also officers and directors of the Foundation. During the year ended December 31, 2014, the Company did not make any contributions to the Foundation. During the years ended December 31, 2013 and 2012, the Company contributed $1.1 million and $1.0 million, respectively, to the Foundation to use for various charitable causes.
The Company had receivables from officers and employees of $0.6 million and $0.4 million at December 31, 2014 and 2013, respectively. These amounts primarily relate to travel advances and incidental personal purchases on Company-issued credit cards. These receivables are short-term and are expected to be repaid within a reasonable period of time. The Company had no other significant transactions with or payables to officers, directors or significant shareholders of the Company.
| (15) | SUBSEQUENT EVENTS |
The Company has evaluated events subsequent to December 31, 2014, to assess the need for potential recognition or disclosure in this filing. Based upon this evaluation, it was determined that no subsequent events occurred that require recognition in the consolidated financial statements.
| (16) | SUMMARY OF QUARTERLY FINANCIAL INFORMATION (UNAUDITED) |
Summarized unaudited financial data are as follows (in thousands):
| 2014 |
MARCH 31 | JUNE 30 | SEPTEMBER 30 | DECEMBER 31 | ||||||||||||
| Net sales |
$ | 546,518 | $ | 587,051 | $ | 674,270 | $ | 569,722 | ||||||||
| Gross profit |
240,403 | 269,375 | 304,498 | 257,629 | ||||||||||||
| Net earnings attributable to Skechers U.S.A., Inc. |
30,965 | 34,802 | 51,123 | 21,921 | ||||||||||||
| Net earnings per share: |
||||||||||||||||
| Basic |
$ | 0.61 | $ | 0.69 | $ | 1.01 | $ | 0.43 | ||||||||
| Diluted |
0.61 | 0.68 | 1.00 | 0.43 | ||||||||||||
| 2013 |
MARCH 31 | JUNE 30 | SEPTEMBER 30 | DECEMBER 31 | ||||||||||||
| Net sales |
$ | 451,621 | $ | 428,247 | $ | 515,756 | $ | 450,737 | ||||||||
| Gross profit |
192,732 | 194,894 | 230,521 | 200,645 | ||||||||||||
| Net earnings attributable to Skechers U.S.A., Inc. |
6,680 | 7,094 | 26,849 | 14,165 | ||||||||||||
| Net earnings per share: |
||||||||||||||||
| Basic |
$ | 0.13 | $ | 0.14 | $ | 0.53 | $ | 0.28 | ||||||||
| Diluted |
0.13 | 0.14 | 0.53 | 0.28 | ||||||||||||
72
Table of Contents
| ITEM 9. | CHANGES IN AND DISAGREEMENTS WITH ACCOUNTANTS ON ACCOUNTING AND FINANCIAL DISCLOSURE |
None.
| ITEM 9A. | CONTROLS AND PROCEDURES |
Attached as exhibits to this annual report on Form 10-K are certifications of our Chief Executive Officer (“CEO”) and Chief Financial Officer (“CFO”), which are required in accordance with Rule 13a-14 of the Securities Exchange Act of 1934, as amended (the “Exchange Act”). This “Controls and Procedures” section includes information concerning the controls and controls evaluation referred to in the certifications.
EVALUATION OF DISCLOSURE CONTROLS AND PROCEDURES
We maintain disclosure controls and procedures that are designed to ensure that information required to be disclosed by a company in the reports that it files under the Exchange Act is recorded, processed, summarized and reported within required time periods and that such information is accumulated and communicated to allow timely decisions regarding required disclosures. As of the end of the period covered by this annual report on Form 10-K, we carried out an evaluation under the supervision and with the participation of our management, including our CEO and CFO, of the effectiveness of the design and operation of our disclosure controls and procedures pursuant to Rule 13a-15 of the Exchange Act. Based upon that evaluation, our CEO and CFO concluded that our disclosure controls and procedures are effective, at the reasonable assurance level as of such time.
MANAGEMENT’S REPORT ON INTERNAL CONTROL OVER FINANCIAL REPORTING
Our management is responsible for establishing and maintaining adequate internal control over financial reporting, as such term is defined in Rule 13a-15(f) of the Exchange Act. Internal control over financial reporting includes those policies and procedures that:
| (i) | pertain to the maintenance of records that, in reasonable detail, accurately and fairly reflect the transactions and dispositions of our assets; |
| (ii) | provide reasonable assurance that transactions are recorded as necessary to permit preparation of financial statements in accordance with generally accepted accounting principles, and that our receipts and expenditures are being made only in accordance with authorizations of our management and directors; and |
| (iii) | provide reasonable assurance regarding prevention or timely detection of unauthorized acquisition, use or disposition of our assets that could have a material effect on our financial statements. |
We conducted an evaluation of the effectiveness of our internal control over financial reporting based on the framework in Internal Control — Integrated Framework issued by the Committee of Sponsoring Organizations of the Treadway Commission (COSO). Based on our evaluation under the framework in Internal Control — Integrated Framework (2013), our management has concluded that as of December 31, 2014, our internal control over financial reporting is effective.
Our independent registered public accountants, BDO USA, LLP, audited the consolidated financial statements included in this annual report on Form 10-K and have issued an attestation report on the effectiveness of our internal control over financial reporting as of December 31, 2014, which is set forth below.
INHERENT LIMITATIONS ON EFFECTIVENESS OF CONTROLS
Our management, including our Chief Executive Officer and Chief Financial Officer, does not expect that our disclosure controls and procedures or our internal control over financial reporting will prevent or detect all error and all fraud. A control system, no matter how well designed and operated, can provide only reasonable, not absolute, assurance that the control system’s objectives will be met. The design of a control system must reflect the fact that there are resource constraints, and the benefits of controls must be considered relative to their costs. Further, because of the inherent limitations in all control systems, no evaluation of controls can provide absolute assurance that misstatements due to error or fraud will not occur or that all control issues and instances of fraud, if any, within the Company have been detected. These inherent limitations include the realities that judgments in decision-making can be faulty and that breakdowns can occur because of simple error or mistake. Controls can also be circumvented by the individual acts of some persons, by collusion of two or more people, or by management override of the controls. The design of any system of controls is based in part
73
Table of Contents
on certain assumptions about the likelihood of future events, and there can be no assurance that any design will succeed in achieving its stated goals under all potential future conditions. Projections of any evaluation of controls’ effectiveness to future periods are subject to risks. Over time, controls may become inadequate because of changes in conditions or deterioration in the degree of compliance with policies or procedures. Because of the inherent limitations in a cost-effective control system, misstatements as a result of error or fraud may occur and not be detected.
CHANGES IN INTERNAL CONTROL OVER FINANCIAL REPORTING
There were no changes to our internal controls over financial reporting that have materially affected, or are reasonably likely to materially affect, our internal controls over financial reporting during the fourth quarter of 2014. The results of our evaluation are discussed above in Management’s Report on Internal Control Over Financial Reporting.
74
Table of Contents
Report of Independent Registered Public Accounting Firm
Board of Directors and Stockholders
Skechers U.S.A., Inc.
Manhattan Beach, CA
We have audited Skechers U.S.A., Inc. and subsidiaries’ internal control over financial reporting as of December 31, 2014, based on criteria established in Internal Control — Integrated Framework (2013) issued by the Committee of Sponsoring Organizations of the Treadway Commission (the COSO criteria). Skechers U.S.A., Inc. and subsidiaries’ management is responsible for maintaining effective internal control over financial reporting and for its assessment of the effectiveness of internal control over financial reporting, included in the accompanying Item 9A, Management’s Report on Internal Control Over Financial Reporting. Our responsibility is to express an opinion on the company’s internal control over financial reporting based on our audit.
We conducted our audit in accordance with the standards of the Public Company Accounting Oversight Board (United States). Those standards require that we plan and perform the audit to obtain reasonable assurance about whether effective internal control over financial reporting was maintained in all material respects. Our audit included obtaining an understanding of internal control over financial reporting, assessing the risk that a material weakness exists, and testing and evaluating the design and operating effectiveness of internal control based on the assessed risk. Our audit also included performing such other procedures as we considered necessary in the circumstances. We believe that our audit provides a reasonable basis for our opinion.
A company’s internal control over financial reporting is a process designed to provide reasonable assurance regarding the reliability of financial reporting and the preparation of financial statements for external purposes in accordance with generally accepted accounting principles. A company’s internal control over financial reporting includes those policies and procedures that (1) pertain to the maintenance of records that, in reasonable detail, accurately and fairly reflect the transactions and dispositions of the assets of the company; (2) provide reasonable assurance that transactions are recorded as necessary to permit preparation of financial statements in accordance with generally accepted accounting principles, and that receipts and expenditures of the company are being made only in accordance with authorizations of management and directors of the company; and (3) provide reasonable assurance regarding prevention or timely detection of unauthorized acquisition, use, or disposition of the company’s assets that could have a material effect on the financial statements.
Because of its inherent limitations, internal control over financial reporting may not prevent or detect misstatements. Also, projections of any evaluation of effectiveness to future periods are subject to the risk that controls may become inadequate because of changes in conditions, or that the degree of compliance with the policies or procedures may deteriorate.
In our opinion, Skechers U.S.A., Inc. and subsidiaries maintained, in all material respects, effective internal control over financial reporting as of December 31, 2014, based on the COSO criteria.
We also have audited, in accordance with the standards of the Public Company Accounting Oversight Board (United States), the consolidated balance sheets of Skechers U.S.A., Inc. and subsidiaries as of December 31, 2014 and 2013, and the related consolidated statements of earnings, comprehensive income, equity, cash flows, and schedule for each of the three years in the period ended December 31, 2014, and our report dated February 27, 2015 expressed an unqualified opinion thereon.
/s/ BDO USA, LLP
Los Angeles, CA
February 27, 2015
75
Table of Contents
| ITEM 9B. | OTHER INFORMATION |
None.
| ITEM 10. | DIRECTORS, EXECUTIVE OFFICERS AND CORPORATE GOVERNANCE |
The information required by this Item 10 is hereby incorporated by reference from our definitive proxy statement, to be filed pursuant to Regulation 14A within 120 days after the end of our 2014 fiscal year.
| ITEM 11. | EXECUTIVE COMPENSATION |
The information required by this Item 11 is hereby incorporated by reference from our definitive proxy statement, to be filed pursuant to Regulation 14A within 120 days after the end of our 2014 fiscal year.
| ITEM 12. | SECURITY OWNERSHIP OF CERTAIN BENEFICIAL OWNERS AND MANAGEMENT AND RELATED STOCKHOLDER MATTERS |
The information required by this Item 12 is hereby incorporated by reference from our definitive proxy statement, to be filed pursuant to Regulation 14A within 120 days after the end of our 2014 fiscal year.
| ITEM 13. | CERTAIN RELATIONSHIPS AND RELATED TRANSACTIONS, AND DIRECTOR INDEPENDENCE |
The information required by this Item 13 is hereby incorporated by reference from our definitive proxy statement, to be filed pursuant to Regulation 14A within 120 days after the end of our 2014 fiscal year.
| ITEM 14. | PRINCIPAL ACCOUNTING FEES AND SERVICES |
The information required by this Item 14 is hereby incorporated by reference from our definitive proxy statement, to be filed pursuant to Regulation 14A within 120 days after the end of our 2014 fiscal year.
| ITEM 15. | EXHIBITS, FINANCIAL STATEMENT SCHEDULES |
| 1. | Financial Statements: See “Index to Consolidated Financial Statements and Financial Statement Schedule” in Part II, Item 8 on page 48 of this annual report on Form 10-K. |
| 2. | Financial Statement Schedule: See “Schedule II — Valuation and Qualifying Accounts” on page 77 of this annual report on Form 10-K. |
| 3. | Exhibits: The exhibits listed in the accompanying “Index to Exhibits” are filed or incorporated by reference as part of this Form 10-K. |
76
Table of Contents
SCHEDULE II — VALUATION AND QUALIFYING ACCOUNTS
(in thousands)
Years Ended December 31, 2014, 2013, and 2012
| DESCRIPTION |
BALANCE AT BEGINNING OF PERIOD |
CHARGED TO REVENUE COSTS AND EXPENSES |
DEDUCTIONS AND WRITE-OFFS |
BALANCE AT END OF PERIOD |
||||||||||||
| Year-ended December 31, 2012: |
||||||||||||||||
| Allowance for chargebacks |
$ | 2,340 | $ | 1,357 | $ | (896 | ) | $ | 2,801 | |||||||
| Allowance for doubtful accounts |
10,331 | 186 | (3,350 | ) | 7,167 | |||||||||||
| Reserve for sales returns and allowances |
7,752 | (431 | ) | (367 | ) | 6,954 | ||||||||||
| Reserve for shrinkage |
300 | 1,300 | (1,300 | ) | 300 | |||||||||||
| Reserve for obsolescence |
11,959 | 931 | (4,041 | ) | 8,849 | |||||||||||
| Year-ended December 31, 2013: |
||||||||||||||||
| Allowance for chargebacks |
$ | 2,801 | $ | 1,514 | $ | (1,825 | ) | $ | 2,490 | |||||||
| Allowance for doubtful accounts |
7,167 | 1,105 | (2,292 | ) | 5,980 | |||||||||||
| Reserve for sales returns and allowances |
6,954 | 249 | 253 | 7,456 | ||||||||||||
| Reserve for shrinkage |
300 | 1,166 | (1,200 | ) | 266 | |||||||||||
| Reserve for obsolescence |
8,849 | 1,333 | (6,697 | ) | 3,485 | |||||||||||
| Year-ended December 31, 2014: |
||||||||||||||||
| Allowance for chargebacks |
$ | 2,490 | $ | 5,530 | $ | (1,469 | ) | $ | 6,551 | |||||||
| Allowance for doubtful accounts |
5,980 | 6,284 | (6,823 | ) | 5,441 | |||||||||||
| Reserve for sales returns and allowances |
7,456 | 2,339 | (780 | ) | 9,015 | |||||||||||
| Reserve for shrinkage |
266 | 1,292 | (1,220 | ) | 338 | |||||||||||
| Reserve for obsolescence |
3,485 | 5,656 | (6,140 | ) | 3,001 | |||||||||||
See accompanying report of independent registered public accounting firm
77
Table of Contents
INDEX TO EXHIBITS
| EXHIBIT NUMBER |
DESCRIPTION OF EXHIBIT | |
| 3.1 | Amended and Restated Certificate of Incorporation dated April 29, 1999 (incorporated by reference to exhibit number 3.1 of the Registrant’s Registration Statement on Form S-1, as amended (File No. 333-60065), filed with the Securities and Exchange Commission on May 12, 1999). | |
| 3.2 | Bylaws dated May 28, 1998 (incorporated by reference to exhibit number 3.2 of the Registrant’s Registration Statement on Form S-1 (File No. 333-60065) filed with the Securities and Exchange Commission on July 29, 1998). | |
| 3.2 (a) | Amendment to Bylaws dated as of April 8, 1999 (incorporated by reference to exhibit number 3.2(a) of the Registrant’s Form 10-K for the year ended December 31, 2005). | |
| 3.2 (b) | Second Amendment to Bylaws dated as of December 18, 2007 (incorporated by reference to exhibit number 3.1 of the Registrant’s Form 8-K filed with the Securities and Exchange Commission on December 20, 2007). | |
| 4.1 | Form of Specimen Class A Common Stock Certificate (incorporated by reference to exhibit number 4.1 of the Registrant’s Registration Statement on Form S-1, as amended (File No. 333-60065), filed with the Securities and Exchange Commission on May 12, 1999). | |
| 10.1 ** | Amended and Restated 1998 Stock Option, Deferred Stock and Restricted Stock Plan (incorporated by reference to exhibit number 10.1 of the Registrant’s Registration Statement on Form S-1 (File No. 333-60065) filed with the Securities and Exchange Commission on July 29, 1998). | |
| 10.1 (a)** | Amendment No. 1 to Amended and Restated 1998 Stock Option, Deferred Stock and Restricted Stock Plan (incorporated by reference to exhibit number 4.4 of the Registrant’s Registration Statement on Form S-8 (File No. 333-71114), filed with the Securities and Exchange Commission on October 5, 2001). | |
| 10.1 (b)** | Amendment No. 2 to Amended and Restated 1998 Stock Option, Deferred Stock and Restricted Stock Plan (incorporated by reference to exhibit number 4.5 of the Registrant’s Registration Statement on Form S-8 (File No. 333-135049), filed with the Securities and Exchange Commission on June 15, 2006). | |
| 10.1 (c)** | Amendment No. 3 to Amended and Restated 1998 Stock Option, Deferred Stock and Restricted Stock Plan (incorporated by reference to exhibit number 10.1 of the Registrant’s Form 8-K filed with the Securities and Exchange Commission on February 23, 2007). | |
| 10.2 ** | 2006 Annual Incentive Compensation Plan (incorporated by reference to Appendix A of the Registrant’s Definitive Proxy Statement filed with the Securities and Exchange Commission on May 1, 2006). | |
| 10.3 ** | 2007 Incentive Award Plan (incorporated by reference to exhibit number 10.1 of the Registrant’s Form 8-K filed with the Securities and Exchange Commission on May 24, 2007). | |
| 10.4 ** | Form of Restricted Stock Agreement under 2007 Incentive Award Plan (incorporated by reference to exhibit number 10.3 of the Registrant’s Form 10-K for the year ended December 31, 2007). | |
| 10.5 ** | 2008 Employee Stock Purchase Plan (incorporated by reference to exhibit number 10.2 of the Registrant’s Form 8-K filed with the Securities and Exchange Commission on May 24, 2007). | |
| 10.5 (a)** | Amendment No. 1 to 2008 Employee Stock Purchase Plan (incorporated by reference to exhibit number 10.5 of the Registrant’s Form 10-Q for the quarter ended June 30, 2010). | |
| 10.6 ** | Indemnification Agreement dated June 7, 1999 between the Registrant and its directors and executive officers (incorporated by reference to exhibit number 10.6 of the Registrant’s Form 10-K for the year ended December 31, 1999). | |
78
Table of Contents
| 10.6 (a)** | List of Registrant’s directors and executive officers who entered into Indemnification Agreement referenced in Exhibit 10.6 with the Registrant (incorporated by reference to exhibit number 10.6(a) of the Registrant’s Form 10-K for the year ended December 31, 2005). | |
| 10.7 | Registration Rights Agreement dated June 9, 1999, between the Registrant, the Greenberg Family Trust and Michael Greenberg (incorporated by reference to exhibit number 10.7 of the Registrant’s Form 10-Q for the quarter ended June 30, 1999). | |
| 10.8 | Tax Indemnification Agreement dated June 8, 1999, between the Registrant and certain shareholders (incorporated by reference to exhibit number 10.8 of the Registrant’s Form 10-Q for the quarter ended June 30, 1999). | |
| 10.9 + | Credit Agreement dated June 30, 2009, by and among the Registrant, certain of its subsidiaries that are also borrowers under the Agreement, and certain lenders including Wells Fargo Foothill, LLC, as co-lead arranger and administrative agent, Bank of America, N.A., as syndication agent, and Banc of America Securities LLC, as the other co-lead arranger (incorporated by reference to exhibit number 10.1 of the Registrant’s Form 10-Q/A filed with the Securities and Exchange Commission on November 16, 2010). | |
| 10.9 (a) | Amendment Number One to Credit Agreement dated November 5, 2009, by and among the Registrant, certain of its subsidiaries that are also borrowers under the Agreement, and certain lenders including Wells Fargo Foothill, LLC, as co-lead arranger and administrative agent, Bank of America, N.A., as syndication agent, and Banc of America Securities LLC, as the other co-lead arranger (incorporated by reference to exhibit number 10.2 of the Registrant’s Form 10-Q/A filed with the Securities and Exchange Commission on November 16, 2010). | |
| 10.9 (b) | Amendment Number Two to Credit Agreement dated March 4, 2010, by and among the Registrant, certain of its subsidiaries that are also borrowers under the Agreement, and certain lenders including Wells Fargo Capital Finance, LLC (formerly known as Wells Fargo Foothill, LLC), as co-lead arranger and administrative agent, Bank of America, N.A., as syndication agent, and Banc of America Securities LLC, as the other co-lead arranger (incorporated by reference to exhibit number 10.3 of the Registrant’s Form 10-Q for the quarter ended March 31, 2010). | |
| 10.9 (c)+ | Amendment Number Three to Credit Agreement dated May 3, 2011, by and among the Registrant, certain of its subsidiaries that are also borrowers under the Agreement, and certain lenders including Wells Fargo Capital Finance, LLC (formerly known as Wells Fargo Foothill, LLC), as co-lead arranger and administrative agent, Bank of America, N.A., as syndication agent, and Banc of America Securities LLC, as the other co-lead arranger (incorporated by reference to exhibit number 10.1 of the Registrant’s Form 10-Q for the quarter ended March 31, 2011). | |
| 10.9 (d) | Amendment Number Four to Credit Agreement dated September 30, 2013, by and among the Registrant, certain of its subsidiaries that are also borrowers under the Agreement, and certain lenders including Wells Fargo Capital Finance, LLC (formerly known as Wells Fargo Foothill, LLC), as co-lead arranger and administrative agent, Bank of America, N.A., as syndication agent, and Banc of America Securities LLC, as the other co-lead arranger (incorporated by reference to exhibit number 10.1 of the Registrant’s Form 10-Q for the quarter ended September 30, 2013). | |
| 10.10 | Schedule 1.1 of Defined Terms to the Credit Agreement dated June 30, 2009, by and among the Registrant, certain of its subsidiaries that are also borrowers under the Agreement, and certain lenders including Wells Fargo Foothill, LLC, Bank of America, N.A., and Banc of America Securities LLC (incorporated by reference to exhibit number 10.2 of the Registrant’s Form 8-K filed with the Securities and Exchange Commission on July 7, 2009). | |
| 10.11 | Amended and Restated Limited Liability Company Agreement dated April 12, 2010 between Skechers R.B., LLC, a Delaware limited liability company and wholly owned subsidiary of the Registrant, and HF Logistics I, LLC, regarding the ownership and management of the joint venture, HF Logistics-SKX, LLC, a Delaware limited liability company (incorporated by reference to exhibit number 10.11 of the Registrant’s Form 10-K for the year ended December 31, 2011). | |
79
Table of Contents
| 10.12 | Construction Loan Agreement dated as of April 30, 2010, by and among HF Logistics-SKX T1, LLC, which is a wholly owned subsidiary of a joint venture entered into between HF Logistics I, LLC and a wholly owned subsidiary of the Registrant, Bank of America, N.A., as administrative agent and as a lender, and Raymond James Bank FSB, as a lender (incorporated by reference to exhibit number 10.12 of the Registrant’s Form 10-K for the year ended December 31, 2011). | |
| 10.12 (a) | Modification to Construction Loan Agreement And Other Loan Documents dated November 16, 2012, by and among HF Logistics-SKX T1, LLC, which is a wholly owned subsidiary of a joint venture entered into between HF Logistics I, LLC and a wholly owned subsidiary of the Registrant, Bank of America, N.A., as administrative agent and as a lender, Raymond James Bank, N.A., as a lender, and OneWest Bank, FSB, as a lender (incorporated by reference to exhibit number 10.1 of the Registrant’s Form 8-K filed with the Securities and Exchange Commission on November 21, 2012). | |
| 10.13 | Master Loan and Security Agreement, dated December 29, 2010, by and between the Registrant and Banc of America Leasing & Capital, LLC (incorporated by reference to exhibit number 10.1 of the Registrant’s Form 8-K filed with the Securities and Exchange Commission on January 4, 2011). | |
| 10.14 | Equipment Security Note, dated December 29, 2010, by and among the Registrant, Banc of America Leasing & Capital, LLC, and Bank of Utah, as agent (incorporated by reference to exhibit number 10.2 of the Registrant’s Form 8-K filed with the Securities and Exchange Commission on January 4, 2011). | |
| 10.15 | Equipment Security Note, dated June 30, 2011, by and among the Registrant, Banc of America Leasing & Capital, LLC, and Bank of Utah, as agent (incorporated by reference to exhibit number 10.3 of the Registrant’s Form 8-K filed with the Securities and Exchange Commission on July 1, 2011). | |
| 10.16 | Lease Agreement, dated February 8, 2002, between Skechers International, a subsidiary of the Registrant, and ProLogis Belgium II SPRL, regarding ProLogis Park Liege Distribution Center I in Liege, Belgium (incorporated by reference to exhibit number 10.29 of the Registrant’s Form 10-K for the year ended December 31, 2002). | |
| 10.17 | Lease Agreement dated September 25, 2007 between the Registrant and HF Logistics I, LLC, regarding distribution facility in Rancho Belago, California (incorporated by reference to exhibit number 10.1 of the Registrant’s Form 8-K filed with the Securities and Exchange Commission on September 27, 2007). | |
| 10.17 (a) | First Amendment to Lease Agreement, dated December 18, 2009, between the Registrant and HF Logistics I, LLC, regarding distribution facility in Rancho Belago, California (incorporated by reference to exhibit number 10.6 of the Registrant’s Form 10-Q for the quarter ended March 31, 2010). | |
| 10.17 (b) | Second Amendment to Lease Agreement, dated April 12, 2010, between the Registrant and HF Logistics I, LLC, regarding distribution facility in Rancho Belago, California (incorporated by reference to exhibit number 10.4 of the Registrant’s Form 10-Q for the quarter ended September 30, 2010). | |
| 10.17 (c) | Assignment of Lease Agreement, dated April 12, 2010, between HF Logistics I, LLC and HF Logistics-SKX T1, LLC, regarding distribution facility in Rancho Belago, California (incorporated by reference to exhibit number 10.5 of the Registrant’s Form 10-Q for the quarter ended September 30, 2010). | |
| 10.17 (d) | Third Amendment to Lease Agreement, dated August 18, 2010, between the Registrant and HF Logistics-SKX T1, LLC, regarding distribution facility in Rancho Belago, California (incorporated by reference to exhibit number 10.6 of the Registrant’s Form 10-Q for the quarter ended September 30, 2010). | |
| 10.18 | Lease Agreement dated May 20, 2008 between Skechers EDC SPRL, a subsidiary of the Registrant, and ProLogis Belgium III SPRL, regarding ProLogis Park Liege Distribution Center II in Liege, Belgium (incorporated by reference to exhibit number 10.3 of the Registrant’s Form 10-Q for the quarter ended June 30, 2010). | |
| 10.19 | Addendum to Lease Agreement dated May 20, 2008 between Skechers EDC SPRL, a subsidiary of the Registrant, and ProLogis Belgium III SPRL, regarding ProLogis Park Liege Distribution Center I in Liege, Belgium (incorporated by reference to exhibit number 10.4 of the Registrant’s Form 10-Q for the quarter ended June 30, 2010). | |
80
Table of Contents
| 10.20 | Skechers U.S.A., Inc. Deferred Compensation Plan (incorporated by reference to exhibit number 10.1 of the Registrant’s Form 8-K filed with the Securities and Exchange Commission on May 3, 2013). | |
| 21.1 | Subsidiaries of the Registrant. | |
| 23.1 | Consent of Independent Registered Public Accounting Firm. | |
| 31.1 | Certification of the Chief Executive Officer pursuant Securities Exchange Act Rule 13a-14(a). | |
| 31.2 | Certification of the Chief Financial Officer pursuant Securities Exchange Act Rule 13a-14(a). | |
| 32.1 *** | Certification pursuant to 18 U.S.C. 1350, as adopted pursuant to Section 906 of the Sarbanes-Oxley Act of 2002. | |
| 101.INS | XBRL Instance Document. | |
| 101.SCH | XBRL Taxonomy Extension Schema Document. | |
| 101.CAL | XBRL Taxonomy Extension Calculation Linkbase Document. | |
| 101.LAB | Taxonomy Extension Label Linkbase Document. | |
| 101.PRE | XBRL Taxonomy Extension Presentation Linkbase Document. | |
| 101.DEF | XBRL Taxonomy Extension Definition Linkbase Document. | |
| + | Confidential treatment has been granted by the SEC and/or a renewal is being requested from the SEC to the previously granted confidential treatment with respect to certain information in the exhibit pursuant to Rule 24b-2 of the Exchange Act. Such information was omitted from the filing and filed separately with the Secretary of the SEC. |
| ** | Management contract or compensatory plan or arrangement required to be filed as an exhibit. |
| *** | In accordance with Item 601(b)(32)(ii) of Regulation S-K, this exhibit shall not be deemed “filed” for the purposes of Section 18 of the Exchange Act or otherwise subject to the liability of that section, nor shall it be deemed incorporated by reference in any filing under the Securities Act of 1933, as amended, or the Exchange Act. |
81
Table of Contents
SIGNATURES
Pursuant to the requirements of Section 13 or 15(d) of the Securities Exchange Act of 1934, the Registrant has duly caused this report to be signed on its behalf by the undersigned, thereunto duly authorized, in the City of Manhattan Beach, State of California on the 27th day of February 2015.
| SKECHERS U.S.A., INC. | ||
| By: |
/s/ Robert Greenberg | |
| Robert Greenberg | ||
| Chairman of the Board and Chief Executive Officer | ||
Pursuant to the requirements of the Securities Exchange Act of 1934, this report has been signed by the following persons on behalf of the Registrant and in the capacities and on the dates indicated.
| SIGNATURE |
TITLE |
DATE | ||
| /s/ Robert Greenberg |
Chairman of the Board and Chief Executive Officer | February 27, 2015 | ||
| Robert Greenberg | (Principal Executive Officer) | |||
| /s/ Michael Greenberg |
President and Director | February 27, 2015 | ||
| Michael Greenberg | ||||
| /s/ David Weinberg |
Executive Vice President, Chief Operating Officer, | February 27, 2015 | ||
| David Weinberg | Chief Financial Officer and Director | |||
| (Principal Financial and Accounting Officer) | ||||
| /s/ Jeffrey Greenberg |
Director | February 27, 2015 | ||
| Jeffrey Greenberg | ||||
| /s/ Geyer Kosinski |
Director | February 27, 2015 | ||
| Geyer Kosinski | ||||
| /s/ Morton D. Erlich |
Director | February 27, 2015 | ||
| Morton D. Erlich | ||||
| /s/ Richard Siskind |
Director | February 27, 2015 | ||
| Richard Siskind | ||||
| /s/ Thomas Walsh |
Director | February 27, 2015 | ||
| Thomas Walsh | ||||
| /s/ Rick Rappaport |
Director | February 27, 2015 | ||
| Rick Rappaport | ||||
82