Attached files
| file | filename |
|---|---|
| EXCEL - IDEA: XBRL DOCUMENT - QLIK TECHNOLOGIES INC | Financial_Report.xls |
| EX-31.1 - EX-31.1 - QLIK TECHNOLOGIES INC | d845787dex311.htm |
| EX-21.1 - EX-21.1 - QLIK TECHNOLOGIES INC | d845787dex211.htm |
| EX-32.1 - EX-32.1 - QLIK TECHNOLOGIES INC | d845787dex321.htm |
| EX-31.2 - EX-31.2 - QLIK TECHNOLOGIES INC | d845787dex312.htm |
| EX-23.1 - EX-23.1 - QLIK TECHNOLOGIES INC | d845787dex231.htm |
Table of Contents
UNITED STATES
SECURITIES AND EXCHANGE COMMISSION
Washington, D.C. 20549
FORM 10-K
(Mark One)
| x | ANNUAL REPORT PURSUANT TO SECTION 13 OR 15(d) OF THE SECURITIES EXCHANGE ACT OF 1934 |
For the fiscal year ended December 31, 2014
OR
| ¨ | TRANSITION REPORT PURSUANT TO SECTION 13 OR 15(d) OF THE SECURITIES EXCHANGE ACT OF 1934 |
For the transition period from to
Commission File Number 001-34803
Qlik Technologies Inc.
(Exact name of registrant as specified in its charter)
| Delaware | 20-1643718 | |
| (State or other jurisdiction of incorporation or organization) |
(I.R.S. Employer Identification No.) | |
| 150 N. Radnor Chester Road, Suite E-220 Radnor, Pennsylvania |
19087 | |
| (Address of principal executive offices) | (Zip Code) | |
(888) 828-9768
(Registrant’s telephone number, including area code)
Securities registered pursuant to Section 12(b) of the Act:
| (Title of each class) |
(Name of each exchange on which registered) | |
| Common Stock, $0.0001 par value | The NASDAQ Stock Market LLC |
Securities registered pursuant to Section 12(g) of the Act:
None.
(Title of Class)
Indicate by check mark if the registrant is a well-known seasoned issuer, as defined in Rule 405 of the Securities Act. Yes x No ¨
Indicate by check mark if the registrant is not required to file reports pursuant to Section 13 or Section 15(d) of the Act. Yes ¨ No x
Indicate by check mark whether the registrant: (1) has filed all reports required to be filed by Section 13 or 15(d) of the Securities Exchange Act of 1934 during the preceding 12 months (or for such shorter period that the registrant was required to file such reports), and (2) has been subject to such filing requirements for the past 90 days. Yes x No ¨
Indicate by check mark whether the registrant has submitted electronically and posted on its corporate Web site, if any, every Interactive Date File required to be submitted and posted pursuant to Rule 405 of Regulation S-T (§ 232.405 of this chapter) during the preceding 12 months (or for such shorter period that the registrant was required to submit and post such files). Yes x No ¨
Indicate by check mark if disclosure of delinquent filers pursuant to Item 405 of Regulation S-K (§ 229.405 of this chapter) is not contained herein, and will not be contained, to the best of registrant’s knowledge, in definitive proxy or information statements incorporated by reference in Part III of this Form 10-K or any amendment to this Form 10-K. ¨
Indicate by check mark whether the registrant is a large accelerated filer, an accelerated filer, a non-accelerated filer, or a smaller reporting company. See the definitions of “large accelerated filer,” “accelerated filer,” and “smaller reporting company” in Rule 12b-2 of the Exchange Act. (Check one):
| Large accelerated filer | x | Accelerated filer | ¨ | |||
| Non-accelerated filer | ¨ (Do not check if a smaller reporting company) | Smaller reporting company | ¨ |
Indicate by check mark whether the registrant is a shell company (as defined in Rule 12b-2 of the Exchange Act). Yes ¨ No x
As of June 30, 2014, the last business day of the registrant’s most recently completed second fiscal quarter, the aggregate market value of shares of common stock held by non-affiliates of the registrant was approximately $1.8 billion based on the number of shares held by non-affiliates and based on the last reported sale price of the registrant’s common stock on the NASDAQ Stock Market LLC. For purposes of this disclosure, shares of common stock held by persons who held more than 10% of the outstanding shares of common stock at such time and shares held by executive officers and directors of the registrant have been excluded because such persons may be deemed to be affiliates. This determination of executive officer or affiliate status is not necessarily a conclusive determination for other purposes.
As of February 20, 2015, there were 90,912,253 shares of the registrant’s common stock issued and outstanding.
DOCUMENTS INCORPORATED BY REFERENCE
Certain portions of the definitive Proxy Statement to be used in connection with the registrant’s 2015 Annual Meeting of Stockholders are incorporated by reference into Part III of this Form 10-K to the extent stated. That Proxy Statement will be filed within 120 days of registrant’s fiscal year ended December 31, 2014.
Table of Contents
Table of Contents
Special Note Regarding Forward-Looking Statements
This Annual Report on Form 10-K, except for historical financial information contained herein, contains forward-looking statements, including, but not limited to, statements regarding the value and effectiveness of our products, the introduction of product enhancements or additional products and our growth, expansion and market leadership, that involve risks, uncertainties, assumptions and other factors which, if they do not materialize or prove correct, could cause our results to differ materially from those expressed or implied by such forward-looking statements. All statements, other than statements of historical fact, are statements that could be deemed forward-looking statements, including statements containing the words “predicts,” “plan,” “expects,” “focus,” “anticipates,” “believes,” “goal,” “target,” “estimate,” “potential,” “may,” “help,” “key,” “will,” “might,” “momentum,” “can,” “could,” “design,” “see,” “seek,” “forecast” and similar words. We intend all such forward-looking statements to be covered by the safe harbor provisions for forward-looking statements contained in Section 21E of the Securities Exchange Act of 1934, as amended, or the Exchange Act, and the Private Securities Litigation Reform Act of 1995. Actual results may differ materially from those projected in such statements due to various factors, including but not limited to:
| • | risk and uncertainties inherent in our business; |
| • | our ability to attract new customers and retain existing customers; |
| • | our ability to effectively sell, service and support our products; |
| • | our ability to adapt to changing licensing and go to market business models; |
| • | our ability to manage our international operations; |
| • | currency fluctuations that affect our revenue and expenses; |
| • | our ability to compete effectively; |
| • | our ability to develop and introduce new products and add-ons or enhancements to existing products; |
| • | our ability to continue to promote and maintain our brand in a cost-effective manner; |
| • | our ability to manage growth; |
| • | our ability to attract and retain key personnel; |
| • | our ability to successfully integrate acquisitions into our business; |
| • | the scope and validity of intellectual property rights applicable to our products; |
| • | adverse economic conditions in general and adverse economic conditions specifically affecting the markets in which we operate; and |
| • | other risks discussed in the section titled “Risk Factors,” set forth in Part I, Item 1A of this Annual Report on Form 10-K and elsewhere in this report. |
Any statements regarding our products are intended to outline our general product direction and should not be relied on in making a purchase decision, as the development, release and timing of any features or functionality described for our products remains at its sole discretion. Past performance is not necessarily indicative of future results. There can be no assurance that the actual results or developments anticipated by us will be realized or, even if substantially realized, that they will have the expected consequences to, or effects on, us. Therefore, no assurance can be given that the outcomes stated in such forward-looking statements and estimates will be achieved.
1
Table of Contents
The forward-looking statements in this Annual Report on Form 10-K represent our views as of the date of this Annual Report on Form 10-K. We anticipate that subsequent events and developments will cause our views to change. However, while we may elect to update these forward-looking statements at some point in the future, we undertake no intention or obligation to update or revise any forward-looking statements, whether as a result of new information, future events or otherwise. You should, therefore, not rely on these forward-looking statements as representing our views as of any date subsequent to the date of this Annual Report on Form 10-K.
2
Table of Contents
| ITEM 1. | BUSINESS |
Overview
Qlik Technologies Inc. (“We”, “Qlik” or the “Company”) has pioneered powerful, user-driven Business Intelligence (“BI”) solutions that enable our customers to make better, faster and more informed business decisions, wherever they are. Our software products help people create and share insights and analysis in groups and across organizations. Business users can explore data, ask and answer their own stream of questions and follow their own path to insight, or collaborate across teams and organizations.
Our software products are powered by our in-memory engine which maintains associations in data and calculates aggregations rapidly, as business users interact with our software. Our Data Discovery solutions are designed to give our customers significant improvements in usability, flexibility and performance at lower costs compared to traditional BI solutions.
For the years ended December 31, 2014, 2013 and 2012, our revenue was approximately $556.8 million, $470.5 million and $388.5 million, representing year-over-year growth of approximately 18% in 2014 and 21% in 2013 and 2012. In addition, we generated income (loss) from operations of approximately ($8.9) million, $3.4 million and $14.6 million for the years ended December 31, 2014, 2013 and 2012. For the year ended December 31, 2014, software license revenue and maintenance revenue comprised approximately 91% of our total revenue and professional services revenue comprised approximately 9% of our total revenue. For the years ended December 31, 2013 and 2012, software license revenue and maintenance revenue comprised approximately 92% of our total revenue and professional services revenue comprised approximately 8% of our total revenue.
We currently operate in one business segment, namely, the development, commercialization and implementation of software products and related services. See Note 10 to our consolidated financial statements, Business and Geographic Segment Information, for information regarding our business and the geographies in which we operate. We have a diversified distribution model that consists of a direct sales force, a partner network of solution providers (or resellers), original equipment manufacturer (“OEM”) relationships and system integrators.
Who Uses Our Software?
Our customer base consisted of approximately 34,000 active customers as of December 31, 2014. Our software products address the needs of a diverse range of customers from small businesses to middle market customers to large enterprises. During 2014, our software products were licensed by customers such as Ace Insurance, Air Force Material Command, AllianceBernstein LP, AmericsourceAnalogic Corporation, Boston Scientific India Private Limited, British Telecommunications plc, Canadian Pacific Railway Limited, Children’s Hospital of Wisconsin, Columbus McKinnon Corporation, David Lloyd Leisure, Deutsche Börse AG, Harbour Industries, Inc., Harris Farm Markets, IKEA Japan K.K., Ingram Micro UK Ltd, Mission Health, Nestlé Nederland BV, Palmetto Health, SK Hynix Inc., Southern Illinois Healthcare, STAR India Pvt Ltd, Steven Madden, Ltd., Suguna Foods, Sunstar Americas, Inc., SUZUKI MOTOR CORPORATION, Topps Tiles (UK) Ltd, Tupperware, the U.S. Department of Energy and the U.S. Department of Justice. We have customers in over 100 countries and approximately 71% of our revenue for the year ended December 31, 2014 was derived internationally. For the years ended December 31, 2013 and 2012, approximately 70% and 72%, respectively, of our revenue was derived internationally.
The use of our software products empower business users to:
| • | Discover new insights by rapidly accessing and understanding data in ways that fit how people naturally think and ask questions. |
| • | Decide on best actions by collaborating with others, discussing insights and persuading others through data presented in an interactive application (“app”) rather than in a static view. |
3
Table of Contents
| • | Do what is best at each decision point with confidence, based on the consensus that develops when new data is analyzed and explored with multiple associations and different points of view. Teams can take action more rapidly and move projects forward more effectively when everyone understands the data underlying decisions. |
The ease of use and flexibility of our software products empower a broad set of business users in the roles of sales, marketing, human resources and finance; executive leadership and other management; operations, support and IT; and business and data analysts. Examples of Qlik® solution users include:
| • | Pharmaceutical Sales Representative — uses Qlik products on an iPad to access current industry sales trends and doctor prescription history while on a sales call with a busy physician. |
| • | Police Sergeant — uses Qlik products to maintain a consolidated view of crime levels and optimize staffing allocations to dispatch police into high crime areas. |
| • | Data Scientist — uses Qlik products to visualize and extend statistical models built in “R”, an open source programming language used primarily for statistical modeling, to understand traffic flows and congestion patterns and advise on options to improve travel times. |
| • | Healthcare Chief Medical Information Officer — uses Qlik products to analyze all aspects of hospital performance including population management, emergency room effectiveness and Affordable Care Act compliance. |
| • | Investment Research Analyst — uses Qlik products to combine data from multiple market data sources and provide an end to end view on market perspectives and research topics which are of interest to clients. |
| • | Retail Customer Insight Analyst — uses Qlik products for Omni-Channel analytics to gain insight into tracking Online Sales, Order Management, Customer Pickup of Online Purchases and to provides a single view of customers across all shopping channels. |
What Differentiates Our Software Products?
Most BI products can only help people answer questions that are understood in advance. In contrast, our software products are designed to enable users to explore live data, and uncover insights they can use to see hidden trends, interesting correlations, make discoveries and solve problems in new ways.
Our software products empower non-technical users to explore data freely, with just clicks, learning at each step along the way and coming up with next steps based on those findings naturally. We describe this way of working as Natural Analytics — a proprietary technology and design approach that utilizes people’s innate ability to detect patterns, compare, sort and categorize information, anticipate outcomes and collaborate on decisions. Specifically, Natural Analytics:
| • | enables all users to explore complex data, making and sharing discoveries using natural human abilities rather than being taught advanced techniques; |
| • | optimizes data structures, the analytical query engine, the interactive user experience, visualizations and collaboration; |
| • | encourages browsing and exploration, categorization and other decision making processes, tapping into our natural human ability to process complex information; and |
| • | replicates the way the human brain searches for information, makes connections between various findings and uncovers insights through association, comparison and anticipation. |
Technically, four main factors, when taken together, enable our software products to address the challenge of getting the maximum value from information:
| • | Patented Core Technology. At the heart of our Data Discovery solutions is our patented core technology, which generates views of information for non-technical users as needed. This does not |
4
Table of Contents
| require development of reports or visualizations by those users — users just click and learn. Every time a user clicks, the engine responds, updating every object in the app with a newly calculated set of data and visualizations specific to the user’s latest selections. |
| • | The Associative Experience. Unlike traditional BI tools that only offer pre-defined data drill paths and interactions, our Data Discovery solutions allow users to explore data in an ad hoc manner. Our QIX Data Indexing Engine automatically manages all the relationships in the data and presents information to the user using a “green/white/gray” interface. User selections are highlighted in green, associated data is represented in white, and excluded (unassociated) data appear in gray. This instant feedback encourages users to think of new questions and continue on their path of exploration and discovery. Users are given guidance to lead them down a relevant path, without limiting them to a pre-defined one. |
| • | Interactive Visualization. Our software products support a wide range of visualizations that assist decision makers in the understanding and assimilation of data. Many of the newer BI vendors provide similar charting capabilities. What differentiates our solutions is the combination of visualization with powerful backend processing capabilities and associative navigation approach, which provides a greater level of interactivity and insight. Alone, visualization tools provide a narrower analytic value than that provided by our use of visualization in context. |
| • | Collaboration and Mobility. Our software solutions further drive flexibility and value by enabling users to incorporate people and place, in addition to data, into decision making. Users can communicate with each other in the context of their decision making through annotations, real-time collaborative sessions and shared bookmarks. The full set of our solutions’ capabilities, including the associative experience and collaboration, are available on most mobile devices. With our solutions, people can ask and answer their questions and follow-up questions, with their colleagues, wherever they are. |
Our Industry
Business Intelligence and Data Analytics Tools
We believe that to succeed in today’s increasingly competitive markets and challenging economic environment, organizations must accelerate the rate at which they identify and respond to changing business conditions. An organization’s agility and success in the global marketplace are dependent upon, among other things, its ability to enable business users to harness the power of increasing volumes of information to make effective business decisions.
In seeking to empower people with information to gain a competitive advantage, many organizations have implemented a range of solutions, including BI and data analysis tools. We believe that these traditional BI tools often fail to provide timely and critical insights to business professionals due to inflexible data architecture, poor usability and substantial implementation time and costs. As a result of these limitations, many business users have turned to alternative tools like spreadsheets to help them perform data analysis. However, these general productivity tools were not specifically designed to facilitate interactivity, collaboration and aggregation and exploration of data for decision making. Furthermore, lacking a centralized infrastructure, users of these tools often end up with different answers resulting from a “dueling spreadsheets” problem.
Trends Driving the Growth of Data Discovery
According to a large independent IT research and advisory company, the “Data Discovery” requirements, which focus on user-driven analysis like that provided by our solutions, drove half of new license spend. We believe this spending is being driven by a number of trends, including:
Unbound human and computer interaction. Increasingly, the barriers between humans and technology are being removed. An example is the increased use of touch devices. Users do not want to simply view the data
5
Table of Contents
presented to them in static reports. Instead, they want to feel the data and interact with it. They want to use it to build a case, persuade others, and reach consensus based on facts. And this interaction is untethered — allowing access to data anywhere and from any device. With traditional BI, static reports are the norm. But our Data Discovery solutions empower users to explore their data and uncover hidden insights, naturally.
The Ongoing, Accelerating Data Boom. Intel estimates that by the year 2020, 50 billion devices will be connected to the internet, many of them creating sensor data, as the ‘internet of things’ becomes a fact of life. With vast amounts of data available, users need a way to sort the signal from the noise. Users have unprecedented access to computing storage and power, but it is only useful if they have the ability to analyze the stored data. Users are demanding better, greater access to all of their data, regardless of where it comes from. That is where Data Discovery offers value. It gives users the self-service access to data that they want, while giving IT the governance and control that they need.
Rise of Information Activism. A new, tech-savvy generation has entered the workforce, and their expectations are different than those of past generations. This new generation of workers grew up with the internet and is less likely to be passive with data. They tend to bring their own devices everywhere they go, and expect it to be easy to mash-up data, communicate, and collaborate with their peers. We believe that our software products enable this active use of data.
The Evolution and Elevation of the Role of IT. Chief Information Officers strive to drive innovation. IT must transform from being gatekeepers to storekeepers, providing business users with the tools they need to be successful. However, to achieve this transformation, they need to stock helpful tools and provide consumable “information products” or apps. While offering more usable and productive tools, IT must continue to mitigate risk by adhering to strict governance and security policies. Our Data Discovery solutions, and, in particular, our newly launched product — Qlik® Sense — was designed for this specific convergence of requirements.
Differentiation via Information Exploitation. In today’s IT environments, companies are shifting to differentiating based on information exploitation. That means the focus is changing from enterprise resource planning (“ERP”) apps to analytics. Analytics apps, like those delivered by our Data Discovery solutions, help companies access the data they need to set themselves apart from the competition.
The Need for Speed and Agility. To get maximum return from information, analysis must be delivered fast enough to be in sync with the operational tempo people need for the decision at hand. Traditional, system-of-record BI tools cannot change fast enough to deliver on time — they just cannot cope with the demands for speed and agility of modern business.
Transformation of Analytics. It is no longer good enough for BI products to report what happened in the past, but rather it must actively monitor and understand what is happening today, why it is happening and how this will develop. This requires a shift in BI efforts to connect things that are seemingly unrelated, and to discover hidden insights in the data that help anticipate what comes next. With our Data Discovery solutions, organizations are doing just that.
Other Software Tools May Not Meet Customer Needs
Although organizations are increasing their adoption of BI and data analytics tools, we believe that both traditional BI tools and newer data visualization tools are inadequate to meet the needs of business users because of the following limitations:
Traditional Analysis Tools Do Not Serve Business Users. Most traditional BI tools were developed specifically for data analysts and other quantitative professionals, like statisticians, and are driven and deployed by IT departments in a top-down approach. These systems require sophisticated programming skills to construct or modify predefined, inflexible data sets, known as “data cubes.” These tools are used by data analysts or IT professionals to produce static reports or pre-configured dashboards which the business user cannot easily
6
Table of Contents
modify or explore in an interactive manner. A typical business user does not possess the skills or authority needed to modify the underlying data cube and therefore must engage their IT departments to reconfigure the analysis to produce the requested information between each decision cycle. The decision cycle may be as short as a follow-on question occurring to a business user as they begin to explore a data set. As a result, business users often do not have access to critical data in a timely manner and may miss important insights and opportunities.
Inflexible Solutions are Difficult to Implement and Maintain. Traditional BI solutions require the integration of large volumes of data stored across an organization, as well as outside the organization, such as information held by partners, suppliers, customers and internet websites. Traditional BI solutions require the development of a pre-defined summarization of the data, or data warehouse to support static query and reporting tools. These tasks can be time-consuming and complex and often require significant professional services support to complete. In addition, traditional BI solutions can be difficult to update and require substantial investments to refresh the underlying data.
Traditional Business Intelligence Solutions Are Slow to Deliver Value. Traditional BI solutions have become complex product “stacks” that combine multiple disparate products into a single “solution.” Due to the complexities and overhead of these large stacks, we believe that a typical BI implementation takes twelve to eighteen months, or more. By that time the business, and the business user requirements, may have significantly evolved or changed, resulting in an extensive queue of user requests to update and revise reports or dashboards. Even simple changes can take weeks or months to implement resulting in a solution that we believe is always a few steps behind the business user’s requirements.
Substantial Total-Cost-of-Ownership. Organizations incur significant hardware, software license and maintenance and professional services costs to deploy and maintain traditional BI solutions. We estimate that the cost of developing and maintaining BI and data warehouse applications is about three to five times the cost of the software. These initial and ongoing costs result in a substantial total-cost-of-ownership for many traditional BI applications. In addition, most providers of traditional BI tools rely upon software maintenance fees and professional services revenue for a large portion of their total revenue, and thus, we believe have little incentive to migrate to a more customer friendly license-based model or to solutions that are simple to install and easy-to-use.
Spreadsheets Not Suited to Data Exploration and Analysis and Lack Reliability. Spreadsheets have been widely adopted by business users for data analysis because they are readily available. For example, Microsoft Excel comes standard with most new laptops. However, spreadsheets are general purpose business productivity tools designed for data input and calculation. The performance, utility and manageability of spreadsheets decline when users analyze large data sets or perform real-time, dynamic calculations. Spreadsheets are often shared and edited by numerous parties, resulting in multiple versions of similar material. This lack of version control causes inconsistencies in analysis, an inability to audit workflows and significant data reliability challenges. Furthermore, spreadsheets lack sophisticated data security features and can cause a number of data security challenges given that they can be easily shared via email or detachable storage drives.
Data Visualization Tools Do Not Meet IT Requirements. The newer breed of data visualization tools offer data analysts easier and less complex tools for creating compelling data visualizations. However, these tools require more technical sophistication than the typical business user possesses, and delivers a business user experience that may be visually appealing, but is quite limited in scope, lacking the associative query and powerful backend found in our solutions. Business users still need to go back to the data analysts or IT staff whenever new views need to be created, limiting the ability for the business user to uncover new insights, or follow their own paths to discovery.
Our Solution
Qlik has led a shift in the BI market towards user-driven solutions. A large independent IT research and advisory company describes the new user-driven segment of the BI platforms market as “Data Discovery”. Data
7
Table of Contents
Discovery is user-driven BI that enables people to create and share knowledge and analysis in groups and across organizations. Our Data Discovery solutions help users ask and answer their own stream of questions and follow their own path to insight on their own and in teams and groups. Our Data Discovery solutions are designed to deliver:
Insight Everywhere. Instead of just a few people involved in creating insights, Data Discovery enables business users across an organization to participate. We believe this approach is analogous to open source computing, peer creation, or open innovation. Data Discovery is about intelligence creation rather than just information consumption. It is not about a big set of centrally-controlled, prepackaged, and tightly-distributed data delivered to passive end users. Rather, it is about providing data access and analysis to individuals and groups, and letting them get what they need more rapidly and precisely.
An App Model. We believe most organizations would prefer to avoid the cost and limited value of deploying and managing monolithic business applications. Our Data Discovery solutions empower users of varying skill levels to contribute to the creation and deployment of straightforward, purpose-built, intuitive apps that can be more easily reused and discarded when no longer needed. Along with our partner ecosystem, we provide services to develop apps for our customers when needed. We believe that our apps can enable innovation to flourish at the edges of the organization and spread inward.
Mobility. Business decision makers at all levels in an organization need readily available data. Tablets and other large-form-factor mobile devices help to make business data ubiquitous. Unlike traditional BI solutions, which address the need for mobile solutions by delivering static reports and dashboards to mobile devices, the responsive design capabilities of our Data Discovery solutions provide an intuitive interface and an application infrastructure that is designed to enable users to explore data and draw associations and insights wherever they happen to be working.
Remixability and Reassembly. Nobody can predict what questions business users will have when they start exploring data, not even the users themselves. Traditional BI solutions require IT professionals to get and stay involved, creating new queries and reports whenever users come up with new questions. In contrast, our Data Discovery solutions make it easy for business users to reuse, share, remix and reassemble data in new views on their own and in groups and to create new visualizations for deeper understanding.
A Social and Collaborative Experience. Often the real value of a discovery is unlocked when a minor breakthrough in one part of an organization leads to a major insight elsewhere. Our Data Discovery solutions can help broaden communities of people who engage in active decision-making to drive knowledge across an organization and enables users to collaborate on insights.
Our Business Model
We have developed a differentiated business model that features:
Broad User Focus. We market and sell directly to both IT and business users by providing intuitive solutions that can be installed and used with limited training. The ease by which business users can evaluate and benefit from our software products substantially expands our addressable market by allowing us to target a wide range of organizational functions, generate incremental business from existing customers and expand our footprint within those organizations. Unlike most existing BI tools, our Data Discovery solutions are purpose-built for business users and does not require substantial IT support to install, integrate and maintain. However, as customers expand their deployments and we sell our software products into larger organizations, we increasingly sell to IT departments, as well as business users.
Low Risk Rapid Product Adoption. To facilitate adoption of our solutions, we offer downloadable, easy-to-install, full-featured versions of QlikView Personal Edition and Qlik Sense Desktop Editions for individual use, free-of-charge. These “free” editions which we refer to as our “freemium” model provide significant
8
Table of Contents
functionality for individual users to perform self-service analytics and spread awareness of our products. We allow our customers to purchase licenses in the way that best meets their needs. This provides the flexibility organizations desire when evaluating software purchases.
“Land and Expand” Customer Approach. We seek to initially “land” within the organization of a new customer by enabling specific business users or departments to meet a business need. After demonstrating the value of our solution to those initial adopters, we work to “expand” the use of our solution across the organization by targeting other business units, geographies and use cases. Our customer penetration strategy is focused on creating a loyal user base that promotes adoption through tangible results and word-of-mouth marketing to facilitate incremental sales.
Globally Diversified Distribution Model. We seek to maximize the reach of our Data Discovery solutions by employing a multi-pronged sales approach that leverages a direct sales force and partner network which includes solution providers, OEM relationships and systems integrators. We typically enter new markets through partnerships and solution provider agreements to minimize cost and risk while we assess demand in the new market. For example, we successfully grew our initial sales in Spain, France, Italy and Japan without maintaining a local direct sales office and plan to use this strategy to target additional international regions. As of December 31, 2014, we had distribution capabilities in over 100 countries and a network of over 1,700 channel partners worldwide to help generate demand for our Data Discovery solutions.
Community-Based Marketing and Support. The user-driven culture and collaboration of our user community, called Qlik Community, begins with us and extends out to our customers, partners and freemium users, further driving the Qlik brand. This community of over 125,000 registered users as of December 31, 2014 promotes the use of our software products within customer and partner organizations, as well as from one organization to another. We utilize the Qlik Community to provide low-cost support and obtain valuable insights used by our product management team for product development. Qlik Community provides our members with a low-cost, user-friendly product support resource that includes discussion forums where they can share their Data Discovery experiences and to find answers to questions about the product and its features; user groups based on location, industry and job function; blogs written by our employees; an opportunity to test beta software and provide feedback; and user-generated content, including best practices, how-to’s and documentation.
On-line Networking Community of Developers. Qlik Branch is a collaborative workspace and open exchange that provides customers, fans, developers and partners simplified access to the open and powerful application programming interfaces of Qlik Sense and QlikView for better and easier integration with home-grown and third-party web technologies and applications. Because all projects are shared under open source licensing, users create and post solutions as well as find solutions and download extensions with complete source code for free.
Our Growth Strategy
Our mission is “Simplifying Decisions for Everyone, Everywhere.” To that end, we aim to make our Data Discovery solutions the primary solutions on which business users in organizations of all sizes and shapes make decisions. The key elements of our growth strategy include:
Increase Our Global Market Penetration. We intend to continue to expand our presence in targeted geographies by growing our direct sales force and global partner network. We began our operations in Sweden, have established a substantial foothold in Western Europe and continue to expand globally. We continue to increase our presence in North America by continuing to expand our direct sales force and grow our indirect channel in the region. We also plan to continue to seek to enter new international markets by establishing distribution partnerships to drive sales. We are leveraging our prior experience in Europe and the United States (“U.S.”) with distribution partners and master solution providers to further penetrate international regions, such as Asia-Pacific, Latin America, Eastern Europe, Middle East and Africa.
9
Table of Contents
Further Penetrate Our Existing Customer Base. We intend to increase penetration of existing customers by capitalizing on current users’ satisfaction to promote our Data Discovery solutions to other users and departments within their organizations. We believe a substantial opportunity exists to increase our sales to these customers. Historically, we have migrated new customers from single project and departmental deployments to multi-department deployments by building on the satisfaction and benefits that our customers experience using our solutions.
Expand Our OEM Alliances and Strategic Relationships. We believe we have a significant opportunity to expand the use of our software products through our OEM relationships, which accounted for approximately 6% of our total billings in 2014, as well as through other distribution relationships. We have an ongoing effort to increase our number of OEM alliances with other independent software vendors that license our technology to embed within and enhance their solutions. In addition, we seek to grow the number of relationships with systems integrators and consultants and to use this channel to generate additional inbound customer prospects.
Expand the Adoption of Data Discovery. We have been a pioneer in Data Discovery, or user driven BI. We plan to continue to enhance our current solutions by adding new functionality that extends our analytics, visualization and search capabilities to broader use cases. Today, BI is primarily used for internally focused decision-making by data analysts and other quantitative professionals. Due to their capabilities, our Data Discovery solutions can be extended to adjacent areas where data-driven decisions are critical, including web site navigation, content search and information management, external data communication, product configuration and e-commerce applications.
Increase Adoption of Our Data Discovery Solutions with Mobile and Social Data Discovery. Our Data Discovery solutions help people make better business decisions more quickly and easily. Qlik has helped people derive insights from data since we first began shipping software in the late 1990s. The addition of our mobile Data Discovery capabilities in 2009 enabled business users to help make decisions “on location” and derive insights from people being in a particular place at a particular time. We re-launched mobile Data Discovery in 2011 with our support for tablets and smartphones running HTML5 browsers. The HTML5 approach enables us to support a wide variety of mobile devices, and enables our customers to build applications once and deploy them to any of our solutions. With the introduction of our social Data Discovery capabilities in 2011, we now enable users to more easily derive insights not just from data and place but also from people. With annotations and collaborative sessions, users can collaboratively create guided analytic apps, communicate with each other in the context of their decision apps, and explore their business data in real time with others. Our newly launched product, Qlik Sense, puts the social and collaborative experience front and center. Workgroups and teams can collaborate by collectively sharing analyses anytime, anywhere, and on any device. Its touch-driven interface and responsive design automatically adapt visualizations for the best possible experience on any device. Data Storytelling allows multiple users, on any device to share their insights at a point in time in presentation format. Users can add commentary and narrative and drill down directly from the presentation to Qlik Sense to answer questions on a real-time basis. This helps to drive communication of insight and facilitates group discovery.
Our Software Products
Our Data Discovery solutions can be deployed in a variety of configurations.
QlikView
Our core solution for guided analytics is QlikView. At the simplest level, a single user can download and install a desktop version of QlikView and run the entire product on a single machine. That user can manually share their work with other users or they can acquire a QlikView server to more easily share information and collaborate in their discoveries. As deployments scale, companies typically have multiple servers serving large user communities who are accessing those servers with a mixture of desktop and web clients, on a wide array of mobile and desktop computing devices. A typical scenario is for a company to start with one or more individuals using the product independently and over time scaling up to large enterprise-wide deployments.
10
Table of Contents
Single User Deployment
QlikView is designed to provide business users with a simple and efficient way to create analytic applications to solve specific business challenges. QlikView Desktop is a Windows application that is installed on the user’s computer. QlikView Desktop enables the user to load data from disparate sources such as databases, data warehouses, flat files, SAP, Salesforce.com, XML files or web services into the computer’s memory. Users can then create an array of user interface objects such as charts, graphs, tables and list-boxes and analyze and visualize the data that is stored in memory. In addition, any user interface elements can be grouped together into a static report suitable for printing or emailing. These analytic applications are valuable on a standalone basis but gain their real value when shared with others in the organization.
We offer QlikView as a free download (called QlikView Personal Edition) to develop analyses, but with the restriction that users can only use analyses they have built themselves. This is referred to as a Personal Use License and allows users to connect to any underlying data source, load data, build user interfaces and conduct interactive analyses of their data. The Personal Use License limits the use of the QlikView files to the person who created it. To share the analysis with another user, each user must have a QlikView license, rather than a Personal Use License. The Personal Use License provides a way for individuals to learn and gain value from QlikView and also generates leads for our sales organization.
Small Workgroup Deployment
A small workgroup deployment involves the use of multiple QlikView applications on standalone client machines without a central server. In order to share QlikView data and analysis created by others in the workgroup, each user must have an individual license. Because all data and analysis is contained within a QlikView file by email or other messaging tool, on a portal or on a shared drive, this deployment approach is typically favored by organizations with small user populations and/or poor network connectivity.
Departmental and Enterprise Deployments
Departmental and enterprise deployments utilize a server to provide centralization of all QlikView analysis. The QlikView Server component supports authentication and security models to ensure appropriate user access and simultaneous access to analyses by large user groups. We designed QlikView Server to maximize the use of the processing power of standard multi-core servers by spreading calculations over all available CPU cores. The QlikView Server can be grouped across more than one physical server into clusters to provide fault tolerance and additional scale.
Server based deployments scale from small user groups to enterprise-wide use. We offer the QlikView Server at two license levels: Small Business Edition and Enterprise Edition. Small Business Edition is limited to 25 users and is suitable only for small and midsize deployments. The Enterprise Edition includes capabilities designed for larger and more technically complex implementations.
To manage large deployments of QlikView, we offer our QlikView Publisher component which is an administrative interface for maintaining QlikView analyses. QlikView Publisher enables users to reload data in a QlikView analysis on a periodic basis to ensure that the most current data is available. QlikView Publisher connects to directory servers within organizations and applies user security rules to a QlikView analysis to ensure appropriate user access. QlikView Publisher is licensed on a per server basis. For large enterprise deployments, multiple QlikView Servers and QlikView Publishers can be clustered to provide load balancing and fail over capabilities.
Access to the QlikView Server is governed by a Client Access License (“CAL”) licensing model. The most common QlikView Server license type is a Named User CAL. In addition to access to the QlikView Server, we offer separately licensable options for other offerings.
11
Table of Contents
QlikView on-Premise or in the Cloud
We sell on-premise licenses; however, our users have deployed QlikView on-premise or in the cloud. We also have partners that are using QlikView to deliver software-as-a-service (“SaaS”) BI offerings.
QlikView Expressor®
QlikView Expressor provides a rich graphical studio for designing and managing data integration for QlikView apps. The product allows designers and developers to centrally define and manage data definitions, transformations and other design artifacts in business terms, thus establishing a comprehensive semantic framework for their QlikView environment. These definitions can be abstracted from specific data sources, insulating our software products from changes in the underlying data systems and providing clear lineage into the definitions and usage of data.
The QlikView Governance Dashboard uses QlikView Expressor to capture and integrate metadata about a QlikView deployment into a common data model and QlikView app. IT staff can use this app to understand how QlikView is being used across their organization.
QlikView NPrinting®
QlikView NPrinting is an advanced report generation, distribution and scheduling application for QlikView. It allows organizations to create great looking reports quickly, in a variety of popular formats including Microsoft Office and pixel perfect (.PDF), using data and analytics from QlikView. QlikView NPrinting ensures that the right reports get to the right people, how and when they need them, either through centralized scheduling and distribution or on-demand requests directly from QlikView apps. With QlikView NPrinting, QlikView can serve as a single system for both interactive analytics and reporting, allowing organizations to retire legacy BI and reporting systems and save significant costs.
Qlik® Sense
Qlik Sense is our next-generation, self-service data visualization and analysis application built using Qlik’s market-proven data indexing engine. Qlik Sense delivers the ease-of-use business users require to create personalized visualizations, reports and dashboards through simple drag-and-drop techniques, while ensuring centralized data security and governance. Qlik Sense is designed to expand on Qlik’s focus of filling the gap between visualization or dashboard solutions and complex BI platforms tied to report-centric ways of doing business. As Data Discovery is being adopted as an alternative BI platform, Qlik Sense is designed to give users the immediate insights they need and IT professionals the enterprise manageability and governance they require. It supports the way human curiosity naturally searches, filters, questions and finds associations in data to find meaning in information — more easily revealing insights and enabling decisions in the process.
Qlik® Sense Desktop
We offer Qlik Sense Desktop as a free download to develop and share analyses. It allows users to connect to any underlying data source, load data, build user interfaces and conduct interactive analyses of their data. To share the analysis with another user, users can avail themselves of the Qlik® Cloud environment to allow others to experience and interact with the visualizations that have been shared. Qlik Sense Desktop and Qlik Cloud together provide a way for individuals to learn and gain value from Qlik Sense, facilitate the viral spreading of awareness of Qlik and also generate leads for our sales organization.
Small Workgroup, Departmental and Enterprise Deployments
Small workgroup, departmental and enterprise deployments utilize a server to provide centralization of all Qlik Sense analysis. Qlik Sense supports authentication and security models to ensure appropriate user access
12
Table of Contents
and simultaneous access to analyses by large user groups. A Qlik Sense deployment contains services which include the engine, scheduling, proxy and repository. We designed Qlik Sense to maximize the use of the processing power of standard multi-core servers by spreading calculations over all available central processing units (“CPUs”) cores. Qlik Sense can be grouped across more than one physical server into clusters to provide fault tolerance and additional scale.
A deployed version of Qlik Sense provides customers with a governed, secure environment, integration with enterprise data sources and management tools, centralized server-side development, full mobile capabilities and extensible application programming interfaces to deliver Qlik Sense into portals and existing applications that need analytics.
Access to Qlik Sense is governed by perpetual licenses that utilize a flexible “token” usage model. Token usage is based on user consumption only, and we give customers the ability to allocate tokens based on two usage types: Frequent and Infrequent. Customers can reallocate and rebalance their usage types as often as they want.
Qlik® Sense on-Premise or in the Cloud
Qlik Sense can also be deployed in the Cloud, using third party hosting services as either a full cloud-hosted solution or a hybrid of on-premise and cloud. Qlik Sense contains a Deployment Manager tool to facilitate this.
Qlik Cloud is our cloud-based environment to permit sharing and collaboration of Qlik Sense visualizations both amongst and between customers.
Our Technology
Our in-memory technology benefits from two important computer hardware trends: 64-bit computing, which increases the amount of memory available on computers, and multi-core CPUs which allow for parallel processing of complex calculations. Because of these capabilities, our software products are able to store data in memory and perform real-time calculations sourced from disparate systems. It is our expectation that the amount of available memory and number of CPU cores and processing speed will continue to increase in the future. These expected improvements will drive our software product’s future performance with minimal incremental investment because we perform calculations in memory and on multiple cores in parallel. Our software products integrate with nearly all data sources and can scale from a single user to enterprise deployments without requiring significant additional infrastructure.
Qlik’s Core Technology: the Basics
Our primary architectural principles are to provide business user simplicity, iterative development and rapid deployment. In developing our solution, we endeavor to obscure the underlying technical complexity from the user while providing powerful, easy-to-use functionality. In-memory technology is important for BI, since it helps speed performance. Our QlikView and Qlik Sense software products:
Hold data in memory for multiple users, for a fast user experience. Our software products hold all the data needed for analysis in memory, where it is available for immediate exploration by users. Users experience zero wait time as our software performs the calculations needed to deliver the aggregations users request quickly. Our software is a multi-user, distributed environment; it stores common calculations and shares them among users, so the calculations do not have to be redone every time someone needs them.
Compress data to approximately 10% of its original size. Our software achieves a significant reduction in the size of the data used for analysis using a data dictionary (a hash table) and by using only the number of bits required. For example, the “day of the week” field has only seven possible field values, and these values are stored only once in memory, regardless of how many records contain each value.
13
Table of Contents
Optimize the power of the processors. The ability of our software products to perform real-time calculations enables them to handle the calculation of complex measures and metrics quickly. Our software is designed to spread the calculation load across all available CPU cores and to manage this workload across many concurrent users. Our software can cache results across users so that the most commonly used calculations are performed the least number of times. Unlike technologies that simply support multi-processor hardware, our software is optimized to take advantage of the power of multi-processor hardware, with the goal of maximizing performance and the potential return from hardware investment.
Connect to Big Data sources in real time as needed. In situations where users wish to view and analyze very large data sets that cannot fit in memory, QlikView Direct Discovery can be used to dynamically connect to a Big Data source, such as Hadoop. This flexibility gives users a “relief valve” to extend the user experience of our software beyond simply the data held in-memory.
Maintain associations in the data automatically. Our software’s inference engine enables our associative experience. This engine maintains the associations among every piece of data in the entire data set used in an application; neither developers nor end users have to maintain the associations. As a result, users are not limited to static reports, pre-determined drill paths or pre-configured dashboards. Instead, they can navigate their data up, down and sideways, exploring it in any way they want.
Calculate aggregations as needed. Our software’s inference engine calculates aggregations based on selections the user makes, which we call the “state” of the app. As a result, users are not limited to predefined calculations or preconceived insights based on data joins made by IT. Users can define whatever view or type of insight they want and our software dynamically calculates the answer. Our software only calculates the aggregations for which the user asks for; it does not pre-calculate aggregations as often seen in traditional BI approaches.
The Qlik Associative Experience
People process information in non-hierarchical ways when making decisions. Faced with a decision, each person uses a different path to reach a conclusion. We designed our software products to support this type of decision-making by allowing users to explore data according to their own thought processes, seeing updated calculations and relationships with each interaction. Our software is designed to mirror the fluid, associative nature of human thought. With our software products, users explore data, make discoveries and uncover insights that can be used to help them solve business problems in new ways. Users can gain unexpected insights because our software products:
Are Designed to Work the Way Peoples’ Minds Work. With our software products, discovery is flexible. Users can navigate and interact with data any way they want. They are not limited to just following predefined drill paths or using preconfigured dashboards. Users ask and answer streams of questions on their own and in groups and teams, forging new paths to insight and decision. With our software, business users can see hidden trends and make discoveries to help speed up business decision making.
Showcase Data Relationships. Traditional BI query tools filter data that is not part of the current query. In contrast, users of our software products can see relationships in the data. They can see not just which data is associated with their selections; they can just as easily see which data is not associated. The user’s selections are highlighted in green. Field values related to the selection are highlighted in white. Unrelated data is highlighted in gray. The result is new insights and unexpected discoveries.
Provide Direct — and Indirect — Search. With our software search, users type relevant words or phrases in any order and get associative results. With a global search bar, users can search across the entire data set. With search boxes on individual list boxes, users can confine the search to just that field. Users can conduct both direct and indirect searches.
14
Table of Contents
Rapid, Iterative App Development
We provide powerful, easy-to-use Data Discovery solutions that do not include purpose-specific apps when installed out-of-the-box. Each of our customers’ business challenges are unique and change rapidly. This includes customers within the same industry. Therefore, our customers are best positioned to create analytic apps that meet their individual needs, and they require a flexible solution that empowers them to quickly address their challenges.
In many cases, business users can build apps themselves and can often take over maintenance of apps that developers have built. In contrast, traditional BI solutions require IT or specialized users to get involved whenever new questions arise. Our software products are designed to make it easier for business users to remix and reassemble data in new views and create new visualizations for deeper understanding.
With our solutions, the cycle time between data collection and deployment of analysis to the business user can be as short as a few weeks and sometimes as little as a few days. Neither users nor developers must manage the associations in the data, as our software maintains the associations automatically. As a result, our customers can go very quickly from prototyping to deployment to refinement. Our software products facilitate the development of all common types of business analysis, including dashboards, analytic applications or reports, on a single platform with a common user interface. And by moving all data in-memory, our software does not require the use of data warehouses for high performance analyses, thus shortening the time to value creation. At the same time, customers that have already implemented a data warehouse can use our software to derive more value from this existing investment.
With QlikView extension objects, designers can create custom visualizations and user interface components for use within QlikView. Extension objects can also be used to bring mapping tools, bar charts, tag clouds, infographic charts or other visualizations into QlikView. Once integrated into QlikView applications, custom and third-party visualizations can take advantage of QlikView’s core capabilities.
Additionally, we license our software products to partners, such as independent software vendors, solution providers and systems integrators, to create a wide variety of applications. We have aligned with partners who have domain specific knowledge and who will use such knowledge to build and support purpose-specific analytic apps that such partners can license directly to a user.
Research and Development
Our research and development (“R&D”) organization is responsible for the design, development, testing and support of our software products. Our current R&D efforts are focused on new releases of existing software products as well as new software products and modules.
As of December 31, 2014, we had 358 people in our R&D organization. Our R&D employees are principally located in Lund, Sweden and Boston, Massachusetts, with the vast majority of our R&D organization located in Lund, Sweden. With our recent acquisitions, we now have small R&D operations in Iceland and Italy.
We use an agile philosophy in our development process which encourages broad participation in design and testing and rapid prototyping. We use automated testing extensively throughout our development life cycle. The processes covering the product development life cycle are designed in alignment with the Capability Maturity Model Integration (“for Development CMMI 1.3”), a quality model developed by the Software Engineering Institute (“SEI”) to continuously improve development processes.
For our core solution for guided analytics, QlikView, we typically deliver service releases every two to four months.
15
Table of Contents
With Qlik Sense, we introduced a significant change to how we ship software. Enterprise software customers generally balance between two choices: the need for mission critical, enterprise-class stability and predictability and the desire to continuously adopt new functionality for advantage. Qlik Sense ships on a new release cadence designed to suit both of these often contradictory requirements. Customers with lengthy internal processes or other enterprise requirements can select a major upgrade annually. Customers who like to see new functionality more frequently can enjoy up to three feature releases a year.
We work closely with our customers in developing our software products and have designed a flexible product development process that is responsive to customer feedback that we receive throughout the process. Planning for each major release begins with identifying themes for the release. Themes are short statements of intent for one or more releases based on industry trends. The product management team then defines the themes further by identifying user scenarios that can be built by the development team, validated with customers and tested as part of the release.
To validate the product during development, specific customers and partners are identified to provide detailed feedback on product design. Then, a broad set of customers and partners are involved in beta testing major releases of our software products.
Within our operations, we are extensive users of our own software product. We install, upgrade and use our software product internally in a pre-release and beta state before allowing it to be made generally available. Consequently, this process allows us to identify and resolve many deployment issues prior to making the product available to customers.
Innovation is a critical factor in our success, and identifying and incubating innovation is built into our R&D process. The Qlik labs department continually pushes the boundaries of our software products, looking for innovative uses of our software products, or innovative ways to extend the capabilities and value of the platform. We invest time and money in identifying and nurturing new software product concepts with the intention of incorporating successful ideas into the platform as new software product modules or as entirely new software products.
Marketing and Sales
We market and sell our software products and services through our direct sales force and an indirect sales channel comprised of a global partner network. Our direct sales force consists of professional sales people who typically have several years of experience selling enterprise software. Our global partner network brings key technological and industry expertise that we utilize to help us reach customer organizations around the world.
Our global partner network includes master resellers, elite solution providers and solution providers. These partners are authorized to sell licenses and to implement and provide first line support for our solutions. A master reseller is generally appointed to extend geographic sales into a territory where we have no direct sales presence. Designation of elite solution providers versus solution providers is driven by the amount of sales volume that they derive from the sale of our software products. Additionally, we work with global, national and local system integrators and other technological consulting firms who provide complementary skills, domain or industry experience, as well as geographic coverage.
Our global partner network also includes OEM partners and technology partners. OEM partners use our technology as a bundled or add-on feature in their products and services. Typically OEM partners include software companies, SaaS vendors and information providers. More broadly, this category applies to any organization seeking to leverage our Data Discovery solutions to power the analytics in an existing or new product or in a service offering. Technology partners include providers of data management and analytics engines, and other business applications, operating systems, integration and development tools, as well as hardware platforms. We invest both development and business resources in an attempt to ensure that our solutions are optimized and certified for common technology platforms, allowing our customers to benefit from these expanded solutions with seamless integration.
16
Table of Contents
We support our global partner network through a program that provides a structured framework to effectively recruit, enable and support partners who sell and deliver complementary solutions using our software. Our team provides a complete lifecycle of support to partners, based on three fundamental principles:
| • | enable partners through technical support, education, training and certification |
| • | market with and for partners through branding, awareness, customer marketing and lead generation programs |
| • | sell our software products and “Powered by Qlik” products with effective sales tools and sales support. |
As of December 31, 2014, our global partner network was comprised of more than 1,700 partners in over 100 countries. No individual partner represented more than 2% of our revenues in the fiscal years ended December 31, 2014 and 2013 and no individual partner represented more than 3% of our revenues in the fiscal year ended December 31, 2012.
We focus our marketing efforts on driving industry thought leadership, increasing brand awareness, communicating the value of targeted solutions and product advantages and generating qualified leads for our sales force and channel partners. We rely on a variety of marketing vehicles, including digital and social media, Qlik events and webinars, industry trade shows, advertising, public relations, industry research, our website, Qlik Community and collaborative relationships with technology vendors. In addition, we work closely with a number of our global partners on co-marketing and lead-generation activities in an effort to broaden our marketing reach.
Global Services
To support customers’ path to progressively optimize how they use data more strategically, we have developed an ecosystem of people, services, and technology to maximize effectiveness and accelerate time to value. This can optimize each customer’s journey, starting with foundational system design and progressing through development, enterprise integration, education and adoption and on-going support.
We complement our solutions with a complete range of services to ensure successful deployment and usage of our software products. This includes educational services for customers ramping up and learning about our software products; maintenance and support, and consulting services to provide in-depth technical assistance.
Education Services. Education Services offers a number of training choices to our customers and partners to support the knowledge and skills development needed to build, design, deploy and administer our software products. Education Services accelerates the path to full data discovery by training users on how to use our software products. We offer an array of live classroom, virtual classroom and on-demand training courses, as well as tailored, private onsite classroom training. Our courses include training on all aspects of our software products, from introductory on-demand mini-courses to multi-day hands-on deep technical classroom sessions.
Maintenance and Support. Our customers generally receive one year of software maintenance and support as part of their initial license of our software products and have the option to annually renew their maintenance agreements. These annual maintenance agreements provide customers the right to receive unspecified software updates, maintenance releases and patches, and access to our support services. We offer two levels of support — standard support and premium support which provides extended support coverage. We provide support from our support offices in Lund, Sweden; Raleigh, North Carolina; Dusseldorf, Germany; Tokyo, Japan; and Sydney, Australia. We also utilize and promote Qlik Community as a supplemental support resource for our customers.
Consulting Services. Our revenue model is license driven with most deployments requiring limited professional services. We believe that this enables our customers to achieve rapid time-to-value. While the vast majority of implementation projects are conducted by our partners, we have also established a consulting services
17
Table of Contents
department to support customers and partners, including larger customers with complex IT environments, with more in-depth technical know-how and best practices about our software products including implementation, scripting, user interface design, application development and security management.
Customers
As of December 31, 2014, we had approximately 34,000 active customers in over 100 countries. Our customers conduct their respective businesses in numerous industry verticals, including consumer packaged goods, financial services, pharmaceuticals, retail, manufacturing, technology and healthcare. We do not believe our business is substantially dependent on any particular customer as no customer represented more than 2% of our revenue for fiscal years ended December 31, 2014, 2013 or 2012. Our target markets are not confined to certain industries and geographies as we are focused on providing a solution that generally meets the needs of business users.
Brand and Intellectual Property
Our intellectual property is an essential element of our business. We own trademarks for the “Qlik,” “QlikTech,” “Qlik Sense” and “QlikView” and our logos. We rely on a combination of copyright, patent, trademark, trade dress and trade secrecy laws, as well as confidentiality procedures and contractual restrictions, to establish and protect our proprietary rights both domestically and abroad. These laws, procedures and restrictions provide only limited protection. As of December 31, 2014, we had eight issued U.S. patents and had nine pending applications for U.S. patents. In addition, as of December 31, 2014, we had 21 issued and 21 pending applications for foreign patents. Any future patents issued to us may be challenged, invalidated or circumvented. Any patents that might be issued in the future, with respect to pending or future patent applications, may not provide sufficiently broad protection or may not prove to be enforceable in actions against alleged infringers. We endeavor to enter into agreements with our employees and contractors and with parties with whom we do business in order to limit access to and disclosure of our proprietary information.
We cannot be certain that the steps we have taken will prevent unauthorized use or reverse engineering of our technology. Moreover, others may independently develop technologies that are competitive with ours or that infringe our intellectual property. The enforcement of our intellectual property rights also depends on any legal actions against these infringers being successful, but these actions may not be successful, even when our rights have been infringed.
Furthermore, effective patent, trademark, trade dress, copyright and trade secret protection may not be available in every country in which our software products are offered. In addition, the legal standards relating to the validity, enforceability and scope of protection of intellectual property rights are uncertain and still evolving.
From time to time, we may encounter disputes over rights and obligations concerning intellectual property. Although we believe that our software products do not infringe the intellectual property rights of any third party, we cannot be certain that we will prevail in any intellectual property dispute. If we do not prevail in these disputes, we may lose some or all of our intellectual property protection, be enjoined from further sales of software products determined to infringe the rights of others and/or be forced to pay substantial royalties to a third party, any of which could harm our business, financial condition and results of operations.
Competition
Our technology utilized in our solutions and differentiated business model help us to compete in the highly competitive BI market. We face competition from many companies that are offering, or may soon offer, products that compete with our solutions.
To date, we have primarily faced competitors in several broad categories, including BI software, analytical processes, query tools, web-based reporting tools and report delivery technology. Independent competitors that
18
Table of Contents
are primarily focused on BI products include, among others, Actuate, Information Builders, MicroStrategy, the SAS Institute, Tableau and TIBCO. We also compete with large software corporations, including suppliers of enterprise resource planning software, that provide one or more capabilities competitive with our software products, such as IBM, Microsoft, Oracle and SAP AG. We believe we generally compete favorably with respect to these competitors; however, some of our current competitors and potential competitors have advantages over us, such as:
| • | longer operating histories |
| • | significantly greater financial, technical, marketing or other resources |
| • | stronger brand and business user recognition |
| • | broader global distribution and presence. |
Current and future competitors may also have greater resources to make strategic acquisitions. By doing so, these competitors may increase their ability to meet the needs of our potential customers. Our current or prospective indirect channel partners may establish cooperative relationships with our current or future competitors. These relationships may limit our ability to sell our software products through specific distribution channels. Accordingly, new competitors or alliances among current and future competitors may emerge and rapidly gain significant market share. These developments could limit our ability to obtain revenues from new customers and to maintain technical support revenues from our installed customer base.
See Part I, Item 1A of this Annual Report on Form 10-K entitled “Risk Factors” for further discussion regarding our competition.
Culture and Employees
As of December 31, 2014, we had 2,038 employees, of which 552 were employed in the U.S. and 1,486 were employed outside the U.S. We believe that having a strong company culture and set of values is critical to our success. Our corporate culture provides us with a competitive advantage by supporting our ability to keep our market offering consistent despite a globally diverse employee base. To communicate and reinforce our culture, we have a set of corporate values which provide a framework for guiding employees in implementation of our business model without direct managerial control. Our values are:
| • | challenge the conventional |
| • | move fast, but be thorough |
| • | open and straightforward |
| • | take responsibility |
| • | teamwork yields the best results. |
Our values are taught and reinforced from the moment new employees join our company. Shortly after being hired, each employee attends QlikAcademy, an intensive four-day training program in Lund, Sweden, to learn our corporate strategy, our organization, our software products, our sales model and our cultural values. Our values form the fabric of our work ethic, and we believe they enable us to recruit, properly develop and manage our highly talented employees. Our culture encourages innovation and idea generation to address complex technical challenges. In addition, we embrace individual thinking and creativity. Despite the size of our organization, we constantly seek to maintain a small-company feel that promotes interaction and the exchange of ideas among employees. We try to minimize company hierarchy to facilitate meaningful communication among employees at all levels and across all departments. This openness extends to our partners and customers, as well as allowing us to establish strong relationships that contribute to our growth.
19
Table of Contents
Every year since 2000, we have hosted an annual Qlik summit (“Summit”) where we bring together all of our employees in one location to build cross-border relationships and to facilitate communications. During the Summit we update employees on our progress, provide training around new initiatives, host presentations by industry speakers and key customers and allow open interaction between employees from around the world. Our Summit is a critical mechanism for promoting consistent and efficient execution of the year’s strategic plan. Having the Summit at a single time and in a single location provides our globally distributed organization with an opportunity to share ideas and best practices. We believe that the Summit is one of the key elements in maintaining our unique company culture.
We consider our current relationship with our employees to be good. We are not a party to a collective bargaining agreement with any of our employees.
Company Information and Website
We file annual, quarterly and current reports, proxy statements and other documents with the Securities and Exchange Commission (“SEC”) under the Securities Exchange Act of 1934. The public may read and copy any materials that we file with the SEC at the SEC’s Public Reference Room at Station Place, 100 F Street, N.E., Washington, DC 20549. The public may obtain information on the operation of the Public Reference Room by calling the SEC at 1-800-SEC-0330. Also, the SEC maintains an Internet website that contains reports, proxy and information statements and other information regarding issuers, including us, that file electronically with the SEC. The public can obtain any documents that we file with the SEC at http://www.sec.gov.
In addition, our company website can be found on the internet at http://www.qlik.com. The website contains information about us, our software products and our operations. Copies of each of our filings with the SEC on Form 10-K, Form 10-Q and Form 8-K, and all amendments to those reports, can be viewed and downloaded free of charge as soon as reasonably practicable after the reports and amendments are electronically filed with or furnished to the SEC. To view the reports, access http://investor.qlik.com and click on “Financial Information.” References to our company website address in this report are intended to be inactive textual references only, and none of the information contained on our website is part of this report or incorporated in this report by reference.
20
Table of Contents
| ITEM 1A. | RISK FACTORS |
Our business is subject to numerous risks. You should carefully consider the risks described below together with the other information set forth in this Annual Report on Form 10-K and other documents we file with the SEC, which could materially affect our business, financial condition, and operating results. Past financial performance should not be considered to be a reliable indicator of future performance. The risks described below are not the only risks facing our company. Risks and uncertainties not currently known to us or that we currently deem to be immaterial also may materially adversely affect our business, financial condition, operating results and the price of our common stock.
We target a global marketplace and compete in a rapidly evolving industry which makes our future operating results difficult to predict. If we are unable to enhance products or acquire new products that respond to rapidly changing customer requirements, technological developments or evolving industry standards, our long-term revenue growth will be harmed.
We target the global business intelligence, or BI, marketplace, which is an industry characterized by rapid technological innovation, changing customer needs, substantial competition, evolving industry standards and frequent introductions of new products, enhancements and services. Any of these factors can render our existing software products and services obsolete or unmarketable. We believe that our future success will depend in large part on our ability to successfully:
| • | support current and future releases of popular hardware, operating systems, computer programming languages, databases and software applications |
| • | develop new products and product enhancements that achieve market acceptance in a timely manner |
| • | maintain technological competiveness and meet an expanding range of customer requirements. |
As we encounter increasing competitive pressures, we will likely be required to modify, enhance, reposition or introduce new products and service offerings. We may not be successful in doing so in a timely, cost-effective and appropriately responsive manner, or at all, which may have an adverse effect on our business, quarterly operating results and financial condition. All of these factors make it difficult to predict our future operating results which may impair our ability to manage our business.
We may experience quarterly fluctuations in our operating results due to a number of factors which make our future results difficult to predict and could cause our operating results to fall below expectations or our guidance.
Our operating results may fluctuate due to a variety of factors, many of which are outside of our control. As a result, comparing our operating results on a period-to-period basis may not be meaningful. Our past results should not be relied on as an indication of our future performance. If our revenue or operating results fall below the expectations of investors or securities analysts or below any guidance we may provide to the market, the price of our common stock could decline substantially.
Our operating results have varied in the past and are expected to continue to do so in the future. In addition to other risk factors listed in this “Risk Factors” section, factors that may affect our quarterly operating results, business and financial condition include the following:
| • | demand for our software products and services and the size and timing of orders |
| • | market acceptance of our current products, such as QlikView® and Qlik® Sense, and future products |
| • | a slowdown in spending on information technology, or IT, and software by our current and/or prospective customers |
| • | sales cycles and performance of our indirect channel partners and original equipment manufacturers (known as OEMs) |
21
Table of Contents
| • | budgeting cycles of our current or potential customers |
| • | foreign currency exchange rate fluctuations |
| • | the management, performance and expansion of our domestic and international operations |
| • | the rate of renewals of our maintenance agreements |
| • | changes in the competitive dynamics of our markets |
| • | our ability to control and predict costs, including our operating expenses |
| • | customers delaying purchasing decisions in anticipation of new products or product enhancements by us or our competitors |
| • | the timing of recognizing revenue in any given quarter as a result of revenue recognition rules |
| • | the timing and amount of our tax benefits or tax expenses as a result of, among other things, complex tax laws and any changes to such tax laws in the jurisdictions in which we operate |
| • | the seasonality of our business |
| • | failure to successfully manage or integrate any acquisitions, including our recent acquisitions of DataMarket and Vizubi |
| • | an increase in the rate of product returns |
| • | the outcome or publicity surrounding any pending or threatened lawsuits |
| • | general economic and political conditions in our domestic and international markets. |
In addition, we may in the future experience fluctuations in our gross and operating margins due to changes in the mix of our direct and indirect sales, domestic and international revenues and expenses, and license, maintenance and professional services revenues.
We have introduced a new licensing model with Qlik Sense through the use of tokens and may implement future changes to our license pricing and licensing model structure for any or all of our products including increased prices, changes to the types and terms of our licensing structure and maintenance parameters. If these changes are not accepted by our current or future customers, our business, operating results and financial condition could be harmed.
Based upon the factors described above and those described elsewhere in this section entitled “Risk Factors”, we have a limited ability to forecast the amount and mix of future revenues and expenses, which may cause our operating results to fall below our estimates or the expectations of public market analysts and investors.
Product enhancement and new product introductions involve inherent risks.
We compete in a market characterized by rapid technological advances in software development, evolving standards in software technology and frequent new product introductions and enhancements. To succeed, we must continually expand and refresh our product offerings to include newer features or products, such as the launch of our new product in September 2014 of Qlik Sense, and enter into agreements allowing integration of third-party technology into our products. The introduction of new products or updated versions of continuing products has inherent risks, including, but not limited to:
| • | product quality, including the possibility of software defects |
| • | delays in releasing new products |
| • | customers delaying purchase decisions in anticipation of new products to be released |
| • | customer confusion and extended evaluation and negotiation time |
| • | the fit of the new products and features with the customer’s needs |
22
Table of Contents
| • | the successful adaptation of third-party technology into our products |
| • | educating our sales, marketing and consulting personnel to work with new products and features |
| • | competition from earlier and more established entrants |
| • | market acceptance of initial product releases |
| • | marketing effectiveness, including challenges in distribution |
| • | higher than expected research and development costs |
| • | the accuracy of assumptions about the nature of customer demand. |
If we are unable to successfully introduce, market, and sell new products and technologies, enhance and improve existing products in accordance with our stated release cadence in a timely and cost-effective manner, and properly position and/or price our products, our business, results of operations, or financial position could be materially impacted.
If new industry standards emerge or if we are unable to respond to rapid technological changes, demand for our software products may be adversely affected.
We believe that our future success is dependent in large part on our ability:
| • | to support current and future industry standards, including databases and operating systems |
| • | to maintain technological competiveness |
| • | meet an expanding range of customer requirements, including cloud-based programming or software-as-a-service licensing structures |
| • | to introduce new products and features for our customers. |
The emergence of new industry standards in related fields may adversely affect the demand for our existing software products. Our business and results of operations may be adversely affected if new technologies emerged that were incompatible with customer deployments of our software products. We currently support Open Database Connectivity, or ODBC, and Object Linking and Embedding Database, or OLEDB, standards in database access technology. If we are unable to adapt our software products on a timely basis to new standards in database access technology, the ability of our software products to access customer databases could be impaired. In addition, the emergence of new server operating systems standards could adversely affect the demand for our existing software products. Our software products currently require the Windows Server operating system when deployed on a server, as used in most multi-user deployments. If customers are unwilling to use a Windows Server, we may not be able to achieve compatibility on a timely basis or without substantial research and development and support expense. We currently support all generally available client operating systems that run industry standard web browsers, but we cannot provide assurance that we will be able to support future client operating systems and web browsers in a timely and cost-effective manner, if at all.
The markets for our software products and services are also characterized by rapid technological and customer requirement changes. In particular, our technology is optimized for servers utilizing the x86 and x64 families of microprocessors. If the speed and performance of these microprocessor families do not continue to increase at the rates we anticipate, our software may not attain the performance speed and capabilities that we expect. Also, if different microprocessor architecture were to gain widespread acceptance in server applications, we may not be able to achieve compatibility on a timely basis or without substantial research and development and support expense. Our delay or inability to achieve compatibility with different microprocessor architecture or other technological change or in satisfying changing customer requirements could render our existing and future products obsolete and unmarketable. As a result, we may not be able to accurately predict the lifecycle of our software products and services, and they may become obsolete before we receive the amount of revenues that we anticipate from them.
23
Table of Contents
Our long-term growth depends on our ability to enhance and improve our existing products and to introduce or acquire new products that respond to these demands. The creation of BI software is inherently complex. The development and testing of new products and product enhancements can require significant research and development expenditures. As a result, substantial delays in the general availability of such new releases or significant problems in the installation or implementation of such new releases could harm our business, operating results and financial condition. We may not successfully develop and market product enhancements or new products that respond to technological change or new customer requirements. Even if we introduce a new product, we may experience a decline in revenues of our existing products that is not fully matched by the new product’s revenue. For example, customers may delay making purchases of a new product to make a more thorough evaluation of the product, or until industry and marketplace reviews become widely available. In addition, we may lose existing customers who choose a competitor’s product rather than to migrate to our new product. This could result in a temporary or permanent revenue shortfall and harm our business, operating results and financial condition. If we are unable to develop or acquire enhancements to, and new features for, our existing products or acceptable new products that keep pace with rapid technological developments and customer requirements, our products may become obsolete, less marketable and less competitive, and our business, operating results and financial condition will be harmed.
We depend on revenue from a single software product.
Despite our release of Qlik Sense in September 2014, we have and continue to be heavily dependent on our QlikView product. Our business would be harmed by a decline in demand for, or in the price of, our software products as a result of, among other factors:
| • | any change in our pricing model |
| • | any change in our licensing model |
| • | any change in our go to market model |
| • | increased competition |
| • | support, research and development or other expenditures undertaken in attempts, whether or not successful, to develop new products |
| • | maturation in the markets for our products. |
Our financial results would suffer if the market for BI software does not continue to grow or if we are unable to further penetrate this market.
Nearly all of our revenues to date have come from sales of BI software and related maintenance and professional services. We expect these sales to account for substantially all of our revenues for the foreseeable future. Although demand for BI software has grown in recent years, the market for BI software applications is still evolving. We cannot be sure that this market will continue to grow or, even if it does grow, that customers will purchase our software products or services. We have spent, and intend to keep spending, considerable resources to educate potential customers about BI software in general and our software products and services in particular. However, we cannot be sure that these expenditures will help our software products achieve any additional market acceptance or enable us to attract new customers or new users at existing customers. A reduction in the demand for our software products and services could be caused by, among other things, lack of customer acceptance, weakening economic conditions, competing technologies and services or decreases in software spending. If the market and our market share fail to grow or grow more slowly than we currently expect, our business, operating results and financial condition would be harmed.
Our operating income (loss) could fluctuate as we make further expenditures to expand our operations in order to support additional growth in our business.
We have continued to make significant investments in our operations to support additional growth, such as hiring substantial numbers of new personnel, investing in research and development, investing in new facilities,
24
Table of Contents
acquiring other companies or their assets and establishing and broadening our international operations in order to expand our business. We intend to make additional investments in research and development, systems, infrastructure, marketing and sales personnel and to continue to expand our operations to support anticipated future growth in our business. As a result of these investments, our operating income (loss) could fluctuate.
We use indirect channel partners and if we are unable to maintain successful relationships with them, our business, operating results and financial condition could be harmed.
In addition to our direct sales force, we use indirect channel partners, such as distribution partners, value-added resellers, system integrators and OEMs to license and support our software products. For the years ended December 31, 2014 and 2013, transactions by indirect channel partners accounted for more than 50% of our total product licenses and first year maintenance billings. We expect to continue to rely substantially on our channel partners in the future.
Our channel partners may offer customers the products of several different companies, including products that compete with ours. Our channel partners generally do not have an exclusive relationship with us; thus, we cannot be certain that they will prioritize or provide adequate resources for selling our products. Divergence in strategy or contract defaults by any of these channel partners may harm our ability to develop, market, sell or support our software products. In addition, establishing and retaining qualified indirect sales channel partners and training them in our software products and services requires significant time and resources. In order to develop and expand our distribution channel, we must continue to scale and improve our processes and procedures that support our channel partners, including investment in systems and training. These processes and procedures may become increasingly complex and difficult to manage as we grow our organization.
Our ability to achieve revenue growth in the future will depend in part on our success in maintaining successful relationships with our current and future channel partners and their ability to license and support our software products. There can be no assurance that our channel partners will continue to cooperate with us when our distribution agreements expire, change or are up for renewal. If we are unable to maintain our relationships with these channel partners, our business, operating results and financial condition could be harmed. Also, in a number of regions we rely on a limited number of resellers, and our business may be harmed if any of these resellers were to fail to effectively license our software in their specified geographic territories.
In addition, we rely on our channel partners to operate in accordance with the terms of their contractual agreements with us. For example, our agreements with our channel partners limit the terms and conditions pursuant to which they are authorized to resell or distribute our software products and offer technical support and related services. We also typically require our channel partners to provide us with the dates and details of product license transactions sold to end user customers. If our channel partners do not comply with their contractual obligations to us, our business, results of operations and financial condition may be harmed.
If we are unable to expand our direct sales capabilities and increase sales productivity, we may not be able to generate increased revenues.
We may be required to expand our direct sales force in order to generate increased revenue from new and existing customers. We have and intend to continue to increase our number of direct sales professionals. New hires require training and take time to achieve full productivity. We cannot be certain that recent and future new hires will become as productive as necessary or that we will be able to hire enough qualified individuals in the future. Failure to hire qualified direct sales personnel and increase sales productivity will preclude us from expanding our business and growing our revenue, which may harm our business, operating results and financial condition.
25
Table of Contents
As we continue to pursue new enterprise customers, additional OEM opportunities or more complicated deployments, our sales cycle, forecasting processes and deployment processes may become more unpredictable and require greater time and expense.
Our sales cycle may lengthen as we continue to pursue new enterprise customers. Enterprise customers may undertake a significant evaluation process in regard to enterprise software which can last from several months to a year or longer. If our sales cycle were to lengthen in this manner, events may occur during this period that affect the size or timing of a purchase or even cause cancellations, and this may lead to more unpredictability in our business and operating results. Additionally, sales cycles for sales of our software products tend to be longer, ranging from three to 12 months or more which may make forecasting more complex and uncertain. We may spend substantial time, effort and money on our sales efforts without any assurance that our efforts will produce any sales. We may spend substantial time, effort, and money in our sales efforts without being successful in generating any sales. In addition, product purchases by large enterprises are frequently subject to budget constraints, multiple approvals, and unplanned administrative, processing, and other delays. Finally, large enterprises typically have longer implementation cycles, require greater product functionality and scalability and a broader range of services, demand that vendors take on a larger share of risks, sometimes require acceptance provisions that can lead to a delay in revenue recognition, and expect greater payment flexibility from vendors. All of these factors can add further risk to business conducted with these end-customers. If we fail to realize an expected sale from a large end-customer in a particular quarter or at all, our business, operating results, and financial condition could be materially and adversely affected.
In addition, we may face unexpected deployment challenges with enterprise customers or more complicated installations of our software products. It may be difficult to deploy our software products if the customer has unexpected database, hardware or software technology issues. Additional deployment complexities may occur if a customer hires a third party to deploy our software products or if one of our indirect channel partners leads the implementation of our solution. Any difficulties or delays in the initial implementation could cause customers to reject our software or lead to the delay or non-receipt of future orders, in which case our business, operating results and financial condition would be harmed.
Managing our international operations is complex and our failure to do so successfully could harm our business, operating results and financial condition.
We receive a significant portion of our total revenues from international sales from foreign direct and indirect operations. International revenues accounted for approximately 71% of our total revenues for the year ended December 31, 2014, approximately 70% of our total revenues for the year ended December 31, 2013 and approximately 72% of our total revenues for the year ended December 31, 2012. We have facilities located in Australia, Austria, Belgium, Brazil, Canada, China, Denmark, Finland, France, Germany, Hong Kong, Iceland, India, Italy, Japan, the Netherlands, Norway, Poland, Portugal, Russia, Singapore, Spain, Sweden, Switzerland, the United Arab Emirates and the United Kingdom. We expect to continue to add personnel in these and additional countries. Our international operations require significant management attention and financial resources.
There are certain risks inherent in our international business activities including, but not limited to:
| • | managing and staffing international offices and the increased costs associated with multiple international locations |
| • | maintaining relationships with indirect channel partners outside the U.S., whose sales and lead generation activities are very important to our international operations |
| • | multiple legal systems and unexpected changes in legal requirements |
| • | tariffs, export restrictions, trade barriers and other regulatory or contractual limitations on our ability to sell or develop our products in certain foreign markets |
| • | trade laws and business practices favoring local competition |
26
Table of Contents
| • | costs of localizing products and potential lack of acceptance of localized versions |
| • | potential tax issues, including restrictions on repatriating earnings and multiple, conflicting, changing and complex tax laws and regulations |
| • | employer payroll tax withholdings with respect to exercises by employees of options to purchase common stock |
| • | weaker intellectual property protection in some countries |
| • | difficulties in enforcing contracts and collecting accounts receivable, longer sales cycles and longer payment cycles, especially in emerging markets |
| • | the significant presence of some of our competitors in certain international markets |
| • | our ability to adapt to sales practices and customer requirements in different cultures |
| • | political instability, including war and terrorism or the threat of war and terrorism |
| • | adverse economic conditions, including the stability and solvency of business financial markets, financial institutions and sovereign nations. |
We believe that, over time, a significant portion of our revenues and costs will continue to be denominated in foreign currencies. To the extent such denomination in foreign currencies does occur, gains and losses on the conversion to the U.S. dollar of accounts receivable, accounts payable and other monetary assets and liabilities arising from international operations have and may continue to contribute to fluctuations in our results of operations and adjustments to our financial guidance. For example, the strengthening of the U.S. dollar relative to other currencies in which we do business negatively impacted our reported total revenue and loss from operations during 2014. Although we continue to utilize short-term foreign currency forward contracts to cover a portion of our foreign currency transaction exposure related to certain intercompany borrowings, our policies do not allow speculation in derivative instruments for profit or execution of derivative instrument contracts for which there are no underlying exposures. We do not use financial instruments for trading purposes and we are not a party to any leveraged derivatives. We monitor underlying market risk exposures on an ongoing basis and believe that we can modify or adapt our hedging strategies as needed. If we are not effective in any future foreign exchange hedging transactions in which we engage, our business, operating results and financial condition could be harmed.
In addition, compliance with foreign and U.S. laws and regulations that are applicable to our international operations is complex and may increase our cost of doing business in international jurisdictions, and our international operations could expose us to fines and penalties if we fail to comply with these regulations. These laws and regulations include import and export requirements, U.S. laws such as the Foreign Corrupt Practices Act and anti-money laundering regulations, and local laws prohibiting corrupt payments. Although we have implemented policies and procedures designed to help ensure compliance with these laws, there can be no assurance that our employees, partners and other persons with whom we do business will not take actions in violation of our policies or these laws. Any violations of these laws could subject us to civil or criminal penalties, including substantial fines or prohibitions on our ability to offer our products and services in one or more countries, and could also materially damage our reputation, our brand and our international business.
Our failure to manage any of these risks successfully could harm our international operations, business operating results and financial condition and reduce our international sales.
We are required to comply with U.S. export control laws and regulations. Noncompliance with those laws and regulations could materially harm our business.
Our solutions are subject to U.S. and European Union export controls. U.S. export control laws and economic sanctions prohibit the shipment of certain solutions and services to U.S. embargoed or sanctioned countries, governments and persons and complying with export control and sanctions regulations for a particular sale may be time-consuming and may result in the delay or loss of sales opportunities. Penalties for violations of
27
Table of Contents
the U.S. export control laws include substantial fines and the possible loss of export or import privileges and criminal action for knowing or willful violations.
Further, if our operating partners fail to obtain appropriate import, export or re-export licenses or permits, we may also be harmed, become the subject of government investigations or penalties, and incur reputational harm. Changes in our solutions or changes in export and import regulations may create delays in the introduction of our solutions in international markets, prevent our customers with international operations from deploying our solutions globally or, in some cases, prevent the export or import of our solutions to certain countries, governments or persons altogether. Any change in export or import regulations, economic sanctions or related legislation, shift in the enforcement or scope of existing regulations, or change in the countries, governments, persons or technologies targeted by such regulations, could result in decreased use of our solutions by, or in our decreased ability to export or sell our solutions to, existing or potential customers with international operations. Any decreased use of our solutions or limitation on our ability to export or sell our solutions would likely harm our business, financial condition and results of operations.
Government regulation of the Internet and e-commerce and of the international exchange of certain technologies is subject to possible unfavorable changes, and our failure to comply with applicable regulations could harm our business and operating results
As Internet commerce continues to evolve, increasing regulation by federal, state or foreign governments becomes more likely. For example, we believe increased regulation is likely in the area of data privacy, and laws and regulations applying to the solicitation, collection, processing or use of personal or consumer information could affect our customers’ ability to use and share data, potentially reducing demand for our products and services. In addition, taxation of products and services provided over the Internet or other charges imposed by government agencies or by private organizations for accessing the Internet may also be imposed. Any regulation imposing greater fees for Internet use or restricting the exchange of information over the Internet could result in reduced growth or a decline in the use of the Internet and could diminish the viability of our Internet-based services, which could harm our business and operating results.
Our business depends on customers renewing their annual maintenance contracts and our ability to collect renewal fees.
Any decline in maintenance renewals could harm our future operating results. We currently sell our software products pursuant to a perpetual license with a fixed upfront fee which ordinarily includes one year of maintenance as part of the initial price. Our customers have no obligation to renew their maintenance agreements after the expiration of this initial period, and they may not renew these agreements. We may be unable to predict future customer renewal rates accurately. Our customers’ renewal rates may decline or fluctuate as a result of a number of factors, including their level of satisfaction with our software products, the prices of our software products, the prices of products and services offered by our competitors, reductions in our customers’ spending levels or general, industry-specific or local economic conditions. If our customers do not renew their maintenance arrangements or if they renew them on less favorable terms, our revenues may decline, our operating and financial condition will be harmed and our business will suffer. A substantial portion of our quarterly maintenance revenue is attributable to maintenance agreements entered into during previous quarters. As a result, if there is a decline in renewed maintenance agreements in any one quarter, only a small portion of the decline will be reflected in our maintenance revenue recognized in that quarter and the rest will be reflected in our maintenance revenue recognized in the following four quarters or more. In addition, we may have difficulties collecting renewal fees from our customers, especially in regards to customers located in emerging international markets or markets experiencing slowed growth, recessions or other adverse economic conditions. If we are unable to collect renewal fees from customers, our business, results of operations and financial condition will be harmed.
28
Table of Contents
Our software products could contain undetected errors, or bugs, which could cause problems with product performance and which could in turn reduce demand for our software products, reduce our revenue and lead to product liability claims against us.
Software products like ours, which consist of hundreds of thousands of lines of code and incorporate licensed software from third parties, may contain errors and/or defects. Although we test our software, we have in the past discovered software errors in our products after their introduction. Despite testing by us and by our current and potential customers, errors may be found in new products or releases after deployment begins. This could result in lost revenue, damage to our reputation or delays in market acceptance which could harm our business, operating results and financial condition. We may also have to expend resources to correct these defects and the resulting effects of these defects.
Our license agreements with customers typically contain provisions designed to limit our exposure to product liability, warranty and other claims. It is possible, however, that these provisions may not be effective as a result of existing or future laws of certain domestic or international jurisdictions or unfavorable judicial decisions in such jurisdictions, and we may be exposed to product liability, warranty and other claims. If these claims are made, our potential exposure may be substantial given the use of our products in business-critical applications. A successful product liability claim against us could harm our business, operating results and financial condition.
We face intense competition which may lead to reduced revenue and loss of market share.
The markets for BI software, analytical applications and information management are intensely competitive and subject to rapidly changing technology and evolving standards. In addition, many companies in these markets are offering, or may soon offer, products and services that may compete with our software products.
We face competitors in several broad categories, including BI software, analytical processes, query, search and reporting tools. We compete with large software corporations, including suppliers of enterprise resource planning (“ERP”) software that provide one or more capabilities that are competitive with our software products, such as IBM (which acquired Cognos in 2008), Microsoft, Oracle (which acquired Hyperion Solutions in 2007) and SAP AG (which acquired Business Objects in 2008), and with open source BI vendors, including Pentaho and JasperSoft (which was acquired by TIBCO in 2014). Open source software is software that is made widely available by its authors and is licensed “as is” for a nominal fee or, in some cases, at no charge. As the use of open source software becomes more widespread, certain open source technology could become competitive with our proprietary technology, which could cause sales of our products to decline or force us to reduce the fees we charge for our products. We also compete, or may increasingly in the future compete, with various independent competitors that are primarily focused on BI products, such as Actuate, Information Builders, MicroStrategy, the SAS Institute, Tableau Software and TIBCO. We expect additional competition as other established and emerging companies or open source vendors enter the BI software market and new products and technologies are introduced. We expect this to be particularly true with respect to our cloud-based initiatives as we and our competitors seek to provide business analytics products based on a software-as-a-service, or SaaS, platform. This is an evolving area of business analytics solutions, and we anticipate competition to increase based on customer demand for these types of products.
Many of our competitors have longer operating histories, significantly greater financial, technical, marketing or other resources and greater name recognition than we do. In addition, many of our competitors have strong relationships with current and potential customers and extensive knowledge of the BI industry. As a result, they may be able to respond more quickly to new or emerging technologies and changes in customer requirements or devote greater resources to the development, promotion and sale of their products than us. Increased competition may lead to price cuts, fewer customer orders, reduced gross margins, longer sales cycles and loss of market share. We may not be able to compete successfully against current and future competitors, and our business, operating results and financial condition will be harmed if we fail to meet these competitive pressures.
29
Table of Contents
Current and future competitors may also make strategic acquisitions or establish cooperative relationships among themselves or with others. By doing so, these competitors may increase their ability to meet the needs of our current or potential customers. Our current or prospective indirect channel partners may establish cooperative relationships with our current or future competitors. These relationships may limit our ability to sell our software products through specific distribution channels. Accordingly, new competitors or alliances among current and future competitors may emerge and rapidly gain significant market share. These developments could limit our ability to obtain revenues from new customers and to sustain maintenance revenues from our installed customer base. If we are unable to compete successfully against current and future competitors, our business, operating results and financial condition would be harmed.
The forecasts of market growth we have publicly provided may prove to be inaccurate, and even if the markets in which we compete achieve the forecasted growth, we cannot assure our business will grow at similar rates, if at all.
Growth forecasts are subject to significant uncertainty and are based on assumptions and estimates that may not prove to be accurate, including fluctuations in foreign currency exchange rates. The forecasts we have publicly provided relating to the expected growth in the BI marketplace, cloud computing markets and technology market may prove to be inaccurate. Even if these markets experience the forecasted growth we have publicly provided, we may not grow our business at similar rates, or at all. Our growth is subject to many factors, including our success in implementing our business strategy, which is subject to many risks and uncertainties. Accordingly, the forecasts of market growth we have publicly provided should not be taken as indicative of our future growth.
Our estimate of the market size for our solutions we have publicly provided may prove to be inaccurate, and even if the market size is accurate, we cannot assure our business will serve a significant portion of the market.
Our estimate of the market size for our solutions we have publicly provided is subject to significant uncertainty and is based on assumptions and estimates, including our internal analysis and industry experience, which may not prove to be accurate. Our ability to serve a significant portion of this estimated market is subject to many factors, including our success in implementing our business strategy, which is subject to many risks and uncertainties. Accordingly, even if our estimate of the market size is accurate, we cannot assure you that our business will serve a significant portion of this estimated market for our solutions.
If customers demand BI software to be provided via a “software as a service” business model, our business could be harmed.
Software as a service, or SaaS, is a model of software deployment where a software provider typically licenses an application to customers for use as a service on demand through web browser technologies. A SaaS business model can require a vendor to undertake substantial capital investments and related sales and support resources and personnel. If customers were to require BI software like ours to be provided via a SaaS deployment, we would need to undertake significant investments in order to implement this alternative business model. If the prevalence of cloud-based data increases, current and prospective customers may increasingly demand SaaS-based BI software platforms. In addition, we would be obligated to apply new revenue recognition policies. Even if we undertook these investments, we may be unsuccessful in implementing a SaaS business model. These factors could harm our business, operating results and financial condition.
If we fail to develop and maintain our brand cost-effectively, our business may be harmed.
We believe that developing and maintaining awareness and integrity of our brand in a cost-effective manner are important to achieving widespread acceptance of our software products and our existing and future products and are important elements in attracting new customers and maintaining existing customers. We believe that the importance of brand recognition will increase as competition in our market further intensifies. In January 2014, we rebranded our company under the name “Qlik.” Successful promotion of our brand will depend on the
30
Table of Contents
effectiveness of our marketing efforts and on our ability to provide reliable and useful products and services at competitive prices. Brand promotion activities may not yield increased revenue, and even if they do, the increased revenue may not offset the expenses we incur in building and maintaining our brand. We also rely on our customer base and community of end-users in a variety of ways, including to give us feedback on our products and to provide user-based support to our other customers. If we fail to promote and maintain our brand successfully or to maintain loyalty among our customers and Qlik Community, our user community, or if we incur substantial expenses in an unsuccessful attempt to promote and maintain our brand, we may fail to attract new customers or retain our existing customers and our business may be harmed.
If we are unable to manage our growth effectively, our revenues and profits could be adversely affected.
We plan to continue to expand our operations and employee headcount significantly, and we anticipate that further significant expansion will be required. Our future operating results depend to a large extent on our ability to manage this expansion and growth successfully. Sustaining our growth will place significant demands on our management as well as on our administrative, operational and financial resources. To manage our growth, we must continue to improve our operational, financial and management information systems and expand, motivate and manage our workforce. If we are unable to manage our growth successfully without compromising our quality of service or our profit margins, or if new systems that we implement to assist in managing our growth do not produce the expected benefits, our revenues and profits could be harmed. Risks that we face in undertaking future expansion include:
| • | training new personnel to become productive and generate revenue |
| • | enabling partners to sell our software products |
| • | controlling expenses and investments in anticipation of expanded operations |
| • | implementing and enhancing our administrative, operational and financial infrastructure, systems and processes, including our recently implemented ERP software |
| • | addressing new markets |
| • | expanding operations in the U.S. and international regions. |
A failure to manage our growth effectively could harm our business, operating results, financial condition and ability to market and sell our software products and services.
If we are unable to recruit or retain skilled personnel, or if we lose the services of any of our key personnel, our business, operating results and financial condition could be harmed.
Our future success depends on our continuing ability to attract, train and retain highly skilled personnel, and we face intense competition for these employees. We may not be able to retain our current key employees or attract, train or retain other highly skilled personnel in the future. If we lose the services of one or all of our key employees, or if we are unable to attract, train and retain the highly skilled personnel we need, our business, operating results and financial condition could be harmed.
In addition, we must successfully integrate new employees into our operations and generate sufficient revenues to justify the costs associated with these employees. If we fail to successfully integrate employees or to generate the revenue necessary to offset employee-related expenses, our business and financial results could be adversely affected.
31
Table of Contents
The success of our business is heavily dependent on the leadership of key management personnel, including Lars Björk, Chief Executive Officer, and other members of our senior management team. The loss of one or more key management personnel could adversely affect our continued operations.
Our future success depends in a large part upon the continued service of key members of our senior management team. In particular, Lars Björk, our Chief Executive Officer, is critical to the overall management of our organization, as well as the development of our brand, our technology, our culture and our strategic direction.
We have experienced significant changes, and may experience additional changes in the future, to our senior management team. For us to compete successfully and grow, we must retain, recruit and develop key personnel who can provide the needed expertise for our industry and products. However, the market for qualified personnel is competitive and we may not succeed in recruiting additional senior management personnel or may fail to replace current senior management personnel effectively who depart without qualified or effective successors. Any successors that we hire from outside of our company would likely be unfamiliar with our business model and industry and may therefore require significant time to understand and appreciate the important aspects of our business or fail to do so altogether. Our effort to retain and develop personnel may also result in significant additional expenses, which could adversely affect our profitability. The loss of any of our management or key personnel could seriously harm our business.
Future product development is dependent on adequate research and development resources.
In order to remain competitive, we must continue to develop new products, applications and enhancements to our existing software products. This is particularly true as we strive to further expand our software products and product capabilities. Maintaining adequate research and development resources, such as the appropriate personnel, talent and development technology, to meet the demands of the market is essential. Our research and development organization is primarily located in Lund, Sweden, and we may have difficulty hiring suitably skilled personnel in this region or expanding our research and development organization to facilities located in other geographic locations. In addition, many of our competitors expend a considerably greater amount of resources on their respective research and development programs. Our failure to maintain adequate research and development resources or to compete effectively with the research and development programs of our competitors would present an advantage to such competitors.
If we fail to offer high quality customer support, our business would suffer.
Once our software products are deployed to our customers, our customers rely on our support services to resolve any related issues. High quality customer support is important for the successful marketing and sale of our software products and services and for the renewal of existing customers. The importance of high quality customer support will increase as we expand our business and pursue new enterprise customers. If we do not help our customers quickly resolve post-deployment issues and provide effective ongoing support, our ability to sell our software products and professional services to existing customers would suffer and our reputation with existing or potential customers would be harmed.
We currently utilize a combination of internal support personnel and third party support organizations, and we cannot provide assurance that actions taken or not taken by our third party support organization will not harm our reputation or business. As we expand our sales infrastructure, we will be required to engage and train additional support personnel and resources. Further, our support organization will face additional challenges as we enter new international markets, including challenges associated with delivering support, training and documentation in languages required by new customers. If we fail to maintain high quality customer support or to grow our internal and external support organization to match any future sales growth, our business will suffer.
If we do not meet our revenue forecasts, we may be unable to reduce our expenses to avoid or minimize harm to our results of operations.
Our revenues are difficult to forecast and are likely to fluctuate significantly from period to period. We base our operating expense budgets on expected revenue trends, and many of our expenses, such as office and
32
Table of Contents
equipment leases and personnel costs, will be relatively fixed in the short term and will increase as we continue to make investments in our business and hire additional personnel. In the event we alter our licensing model, our ability to forecast revenue and expenses may be further hampered. Our estimates of sales trends may not correlate with actual revenues in a particular quarter or over a longer period of time. Variations in the rate and timing of conversion of our sales prospects into actual licensing revenues could cause us to plan or budget inaccurately and those variations could adversely affect our financial results. In particular, delays or reductions in amount or cancellation of customers’ purchases of our software products would adversely affect the overall level and timing of our revenues, and our business, results of operations and financial condition could be harmed. Due to the relatively fixed nature of many of our expenses, we may be unable to adjust spending quickly enough to offset any unexpected revenue shortfall.
In the course of our sales to customers, we may encounter difficulty collecting accounts receivable and could be exposed to risks associated with uncollectible accounts receivable. In the event we are unable to collect on our accounts receivable, it could negatively affect our cash flows, operating results and business.
Our methodologies and software products may infringe the intellectual property rights of third parties or be found to contain unexpected open source software, and this may create liability for us or otherwise harm our business.
Third parties may claim that our current or future products infringe their intellectual property rights, and such claims may result in legal claims against our customers and us. These claims may damage our reputation, harm our customer relationships and create liability for us. We expect the number of such claims will increase as the number of products and the level of competition in our industry segments grow, the functionality of products overlap and the volume of issued software patents and patent applications continues to increase. We generally agree in our customer contracts to indemnify customers for expenses or liabilities they incur as a result of third party intellectual property infringement claims associated with our products or services. To the extent that any claim arises as a result of third party technology we have licensed for use in our product, we may be unable to recover from the appropriate third party any expenses or other liabilities that we incur.
In addition, software products like ours that contain hundreds of thousands of lines of software code at times incorporate open source software code. The use of open source software code is typically subject to varying forms of software licenses, called copyleft or open source licenses. These types of licenses may require that any person who creates a software product that redistributes or modifies open source software that was subject to an open source license must also make their own software product subject to the same open source license. This can lead to a requirement that the newly created software product be provided free of charge or be made available or distributed in source code form. Although we do not believe our software includes any open source software that would result in the imposition of any such requirement on portions of our software products, our software could be found to contain this type of open source software.
Moreover, we cannot assure you that our processes for controlling our use of open source software in our products will be effective. If we are held to have breached the terms of an open source software license, we could be required to seek licenses from third parties to continue offering our products on terms that are not economically feasible, to re-engineer our products, to discontinue the sale of our products if re-engineering could not be accomplished on a timely basis, or to make generally available, in source code form, our proprietary code, any of which could adversely affect our business, operating results, and financial condition.
In addition to risks related to license requirements, usage of open source software can lead to greater risks than use of third-party commercial software, as open source licensors generally do not provide warranties or assurance of title, non-infringement or controls on origin of the software. In addition, many of the risks associated with usage of open source software, such as the lack of warranties or assurances of title, cannot be eliminated, and could, if not properly addressed, negatively affect our business. We have established processes to help alleviate these risks, including a review process for screening requests from our development organizations for the use of open source software, but we cannot be sure that all open source software is submitted for approval prior to use in our products.
33
Table of Contents
Responding to any infringement claim, regardless of its validity, or discovering open source software code in our products could harm our business, operating results and financial condition, by, among other things:
| • | resulting in time-consuming and costly litigation |
| • | diverting management’s time and attention from developing our business |
| • | requiring us to pay monetary damages or enter into royalty and licensing agreements that we would not normally find acceptable |
| • | causing product shipment or deployment delays |
| • | requiring us to stop selling certain of our products |
| • | requiring us to redesign certain of our products using alternative non-infringing or non-open source technology or practices, which could require significant effort and expense |
| • | requiring us to disclose our software source code, the detailed program commands for our software |
| • | requiring us to satisfy indemnification obligations to our customers. |
Our intellectual property rights are valuable, and any inability to protect them could reduce the value of our software products, services and brand.
As of December 31, 2014, we had eight issued U.S. patents and nine pending applications for U.S. patents expiring at various times ranging from 2015 through 2033 and 21 issued and 21 pending applications for foreign patents expiring at various times ranging from 2015 through 2031. We rely on a combination of copyright, trademark, patent, trade secrets, confidentiality procedures and contractual commitments to protect our proprietary information. For example, we license our software products pursuant to click-wrap or signed license agreements that impose certain restrictions on a licensee’s ability to utilize the software. We also seek to avoid disclosure of our intellectual property, including by requiring those persons with access to our proprietary information to execute confidentiality agreements with us and by restricting access to our source code.
Despite our efforts, these measures can only provide limited protection. Unauthorized third parties may try to copy or reverse engineer portions of our software products or may otherwise obtain and use our intellectual property. Any patents owned by us may be invalidated, circumvented or challenged. Any of our pending or future patent applications, whether or not being currently challenged, may not be issued with the scope of the claims we seek, if at all. Legal standards relating to the validity, enforceability and scope of protection of intellectual property rights in other countries are uncertain and may afford little or no effective protection for our services, software, methodology and other proprietary rights. Consequently, we may be unable to prevent our intellectual property rights from being exploited abroad, which could require costly efforts to protect them. Policing the unauthorized use of our proprietary rights is expensive, difficult and, in some cases, impossible. Litigation may be necessary in the future to enforce or defend our intellectual property rights, to protect our trade secrets or to determine the validity and scope of the proprietary rights of others. Such litigation could result in substantial costs and diversion of management resources, either of which could harm our business. Accordingly, despite our efforts, we may not be able to prevent third parties from infringing upon or misappropriating our intellectual property. If we cannot protect our proprietary technology against unauthorized copying or use, we may not remain competitive.
Furthermore, many of our current and potential competitors have the ability to dedicate substantially greater resources to developing and protecting their technology or intellectual property rights than we do. In addition, our attempts to protect our proprietary technology and intellectual property rights may be further limited as our employees may be recruited by our current or future competitors and may take with them significant knowledge of our proprietary information. Consequently, others may develop services and methodologies that are similar or superior to our services and methodologies or may design around our intellectual property.
34
Table of Contents
Computer “hackers” may damage our systems, services and products, and breaches of data protection could impact our business.
Computer programmers and hackers may be able to penetrate our network security and misappropriate our confidential information or that of third parties, create system disruptions or cause interruptions or shutdowns of our internal systems and services. If successful, any of these events could damage our computer systems or those of our customers and could disrupt or prevent us from providing timely maintenance and support for our software products. Computer programmers and hackers also may be able to develop and deploy viruses, worms and other malicious software programs that attack our products or otherwise exploit any security vulnerabilities of our products. The costs to us to eliminate or alleviate security problems, bugs, viruses, worms, malicious software programs and security vulnerabilities could be significant, and the efforts to address these problems could result in interruptions, delays, cessation of service and loss of existing or potential customers and may impede our sales and other critical functions.
In the course of our regular business operations and providing maintenance and support services to our customers, we process and transmit proprietary information and sensitive or confidential data, including personal information of employees, customers and others. Breaches in security could expose us, our employees, our customers or the individuals affected to a risk of loss or misuse of this information, which could result in potential regulatory actions, litigation and potential liability for us, as well as the loss of existing or potential customers and damage to our brand and reputation.
Economic uncertainties or downturns could materially harm our business.
We are subject to risks arising from changes and uncertainty in domestic and global economies. Our operations and performance depend significantly on worldwide economic conditions. Current or future economic downturns could harm our business and results of operations. Negative conditions in the general economies of the countries in which we do business, such as actual or threatened military action, terrorist attacks, financial credit market fluctuations and changes in tax laws, could cause a decrease in corporate spending on BI software in general and negatively affect the rate of growth of our business and our results of operations.
The macroeconomic condition of some countries in which we operate has been hindered by unemployment, budget deficits, high public debt, the risk of defaults on sovereign debt and potential or actual private bank failures. In recent years, policies undertaken by certain central banks, such as the U.S. Federal Reserve, the European Central Bank, and the Bank of England, have involved quantitative easing and the impact of these policies on macroeconomic trends and our customers is difficult to predict. These conditions make it extremely difficult for our customers and us to accurately forecast and plan future business activities, and they could cause our customers to slow spending on our products and services which would delay and lengthen sales cycles. Furthermore, during challenging economic times our customers may face issues in gaining timely access to sufficient credit which could result in an impairment of their ability to make timely payments to us. If that were to occur, we may be required to increase our allowance for doubtful accounts and our operating results would be harmed.
We maintain operating or other bank accounts at financial institutions in the U.S., Sweden and other regions. In particular, a significant amount of our cash balances in the U.S. and Sweden are in excess of the insurance limits of the U.S. government’s Federal Deposit Insurance Corporation, or FDIC, and Swedish government’s Swedish Deposit Insurance Scheme, or Insättningsgarantin. The FDIC insures deposits in most banks and savings associations located in the U.S. and protects depositors against the loss of their deposits if an FDIC-insured bank or savings association fails, subject to specified monetary ceilings. Similarly, the Swedish Deposit Insurance Scheme is a state-provided guarantee of deposits in accounts at Swedish banks, subject to specified monetary ceilings. We could incur substantial losses if the underlying financial institutions in these or other regions fail or are otherwise unable to return our deposits.
35
Table of Contents
We have a significant number of customers in the consumer products and services, healthcare, retail, manufacturing and financial services industries. A substantial downturn in these industries may cause organizations to react to worsening conditions by reducing their capital expenditures in general or by specifically reducing their spending on IT. Customers in these industries may delay or cancel IT projects or seek to lower their costs by renegotiating vendor contracts. Also, customers with excess IT resources may choose to develop in-house software solutions rather than obtain those solutions from us. Moreover, competitors may respond to market conditions by lowering prices and attempting to lure away our customers. In addition, the increased pace of consolidation in certain industries may result in reduced overall spending on our products.
We cannot predict the timing, strength or duration of any economic slowdown or recovery, generally or in the consumer products and services, manufacturing and financial services industries. During challenging and uncertain economic times and in tight credit markets, many customers delay or reduce technology purchases. Contract negotiations may become more protracted or difficult if customers institute additional internal approvals for technology purchases or require more negotiation of contract terms and conditions. These economic conditions, and uncertainty as to the general direction of the macroeconomic environment, are beyond our control and could result in reductions in sales of our products, longer sales cycles, difficulties in collection of accounts receivable or delayed payments, slower adoption of new technologies, increased price competition and reductions in the rate at which our customers renew their maintenance agreements and procure consulting services.
Our business could be harmed as a result of the risks associated with our acquisitions.
As part of our business strategy, we may from time to time seek to acquire businesses or assets that provide us with additional intellectual property, customer relationships and geographic coverage. We can provide no assurances that we will be able to find and identify desirable acquisition targets or that we will be successful in entering into a definitive agreement with any one target. In addition, even if we reach a definitive agreement with a target, there is no assurance that we will complete any future acquisition.
Any acquisitions we undertake or have recently completed, including the acquisitions of DataMarket and Vizubi, will likely be accompanied by business risks which may include, among other things:
| • | the effect of the acquisition on our financial and strategic position and reputation |
| • | the failure of an acquisition to result in expected benefits, which may include benefits relating to enhanced revenues, technology, human resources, costs savings, operating efficiencies, goodwill and other synergies |
| • | the difficulty, cost and management effort required to integrate the acquired businesses, including costs and delays in implementing common systems and procedures and costs and delays caused by communication difficulties |
| • | the assumption of certain known or unknown liabilities of the acquired business, including litigation-related liabilities |
| • | the reduction of our cash available for operations and other uses, the increase in amortization expense related to identifiable assets acquired, potentially dilutive issuances of equity securities or the incurrence of debt |
| • | a lack of experience in new markets, new business culture, products or technologies or an initial dependence on unfamiliar distribution partners |
| • | the possibility that we will pay more than the value we derive from the acquisition |
| • | the impairment of relationships with our customers, partners or suppliers or those of the acquired business |
| • | the potential loss of key employees of the acquired business. |
36
Table of Contents
These factors could harm our business, results of operations or financial condition.
In addition to the risks commonly encountered in the acquisition of a business or assets as described above, we may also experience risks relating to the challenges and costs of closing a transaction. The risks described above may be exacerbated as a result of managing multiple acquisitions at once.
Business disruptions could affect our operating results.
A significant portion of our research and development activities and certain other critical business operations are concentrated at a single facility in Sweden. In addition, a significant amount of our management operations are concentrated in a single facility in Radnor, Pennsylvania. We are also a highly automated business and a disruption or failure of our systems could cause delays in completing sales and providing services. A major natural disaster, fire, act of terrorism or other catastrophic event that results in the destruction or disruption of any of our critical business operations or IT systems could severely affect our ability to conduct normal business operations and, as a result, our future operating results could be harmed.
Future litigation could harm our results of operation and financial condition.
In addition to intellectual property litigation, from time to time, we may be subject to other litigation. We record a related liability when we can make a reasonable estimate of the liability relating to pending litigation and determine that it is probable. As additional information becomes available, we assess the potential liability and revise estimates as appropriate. However, because of uncertainties relating to litigation, the amount of our estimates could be wrong. In addition to the related cost and use of cash, pending or future litigation could cause the diversion of management’s attention and resources.
We are incurring significant costs and demands upon management as a result of complying with the laws and regulations affecting public companies, which could harm our operating results.
As a public company, we are incurring significant legal, accounting and other expenses that we did not incur as a private company. In addition, the Sarbanes-Oxley Act of 2002, as well as rules subsequently implemented by the SEC, the Financial Industry Regulatory Authority, Inc. (“FINRA”) and The NASDAQ Stock Exchange Global Select Market (“NASDAQ”) imposes various requirements on public companies, including requirements with respect to corporate governance practices. Our management and other personnel devote a substantial amount of time to these compliance initiatives. Moreover, these rules and regulations have substantially increased our legal and financial compliance costs and made some activities more time-consuming and costly. We also expect these rules and regulations may make it more difficult and more expensive for us to obtain director and officer liability insurance, and we may be required to accept reduced policy limits and coverage or incur substantial costs to maintain the same or similar coverage. These rules and regulations could also make it more difficult for us to attract and retain qualified persons to serve on our board of directors, our board committees or as executive officers.
If we do not adequately manage and evolve our financial reporting and managerial systems and processes, our ability to manage and grow our business may be harmed. A failure or disruption in these services would materially and adversely affect our ability to manage our business effectively.
We have experienced rapid growth over the last several years. We rely heavily on information technology systems to help manage critical functions, such as order processing, sales forecasts and employee data. Our ability to successfully implement our business plan and comply with regulations, including the Sarbanes-Oxley Act, requires an effective planning and management process. We expect that we will need to continue to improve existing, and implement new, operational and financial systems, procedures and controls to manage our business effectively in the future. During the quarter ended September 30, 2014, we implemented a new ERP system. If we experience a breakdown in our procedures or controls, our ability to record and report financial and management information on a timely and accurate basis could be impaired. In addition, if one or more of our
37
Table of Contents
technology-related hardware or software providers suffer an interruption in their business, or experience delays, disruptions or quality control problems in their operations, or we have to change or add additional systems and services, our ability to manage our business would suffer.
Many of our key financial systems used for internal purposes are cloud based solutions provided by third parties
Our new ERP system along with certain other internal financial systems are cloud based solutions provided by third parties. The use of cloud based systems provided by third parties exposes us to certain risks of those third parties. If a disruption of services by third party cloud financial system providers were to occur, it could have a material adverse effect on our ability to record and report financial and management information on a timely and accurate basis.
If we fail to maintain proper and effective internal control over financial reporting, our operating results and our ability to operate our business could be harmed.
The Sarbanes-Oxley Act requires, among other things, that we establish and maintain effective internal control over financial reporting and disclosure controls and procedures. Under the SEC’s current rules, we are required to perform system and process evaluation and testing of our internal control over financial reporting to allow management to report on the effectiveness of our internal control over financial reporting, as required by Section 404 of the Sarbanes-Oxley Act. Our independent registered public accounting firm is also required to report on our internal control over financial reporting. Our testing and our independent registered public accounting firm’s testing may reveal deficiencies in our internal control over financial reporting that are deemed to be material weaknesses and render our internal control over financial reporting ineffective. Due to the extent of our international operations, our financial reporting requires substantial international activities, resources and reporting consolidation. We are also subject to complex tax laws, regulations, accounting principles and interpretations thereof. We have and expect to continue to incur substantial accounting and auditing expense and to expend significant management time in complying with the requirements of Section 404. If we are not able to maintain compliance with the requirements of Section 404 in a timely manner, or if we or our independent registered public accounting firm identify deficiencies in our internal control over financial reporting that are deemed to be material weaknesses, the market price of our stock could decline and we could be subject to investigations or sanctions by the SEC, FINRA, NASDAQ or other regulatory authorities. In addition, we could be required to expend significant management time and financial resources to correct any material weaknesses that may be identified or to respond to any regulatory investigations or proceedings.
Our results of operations may be adversely affected by changes in or interpretations of accounting standards.
We prepare our audited consolidated financial statements in conformity with generally accepted accounting principles in the United States (“U.S. GAAP”). These principles are subject to interpretation by the SEC and various bodies formed to interpret and create appropriate accounting standards. It is possible that future requirements, including the recently released new guidance related to revenue recognition (ASU 2014-09, Revenue from Contracts with Customers: Topic 606), could change our current application of U.S. GAAP, resulting in a material adverse impact on our financial position or results of operations. Our accounting policies that recently have been or may be affected by changes in the accounting rules are as follows:
| • | software revenue recognition |
| • | accounting for income taxes |
| • | accounting for leases |
| • | accounting for business combinations and related goodwill |
| • | accounting for stock-based awards issued to employees |
| • | assessing fair value of financial and non-financial assets |
| • | application, if any of IFRS. |
38
Table of Contents
We continuously review our compliance with all applicable new and existing revenue recognition accounting pronouncements. Depending upon the outcome of these ongoing reviews and the potential issuance of further accounting pronouncements, implementation guidelines and interpretations, we may be required to modify our reported results, revenue recognition policies or business practices which could harm our results of operations.
We may have exposure to additional tax liabilities.
We are subject to complex taxes in the U.S. and a variety of foreign jurisdictions. All of these jurisdictions have in the past and may in the future make changes to their corporate income tax rates and other income tax laws which could increase our future income tax provision.
Our future income tax obligations could be affected by earnings that are lower than anticipated in jurisdictions where we have lower statutory rates and by earnings that are higher than anticipated in jurisdictions where we have higher statutory rates, by changes in the valuation of our deferred tax assets and liabilities, changes in the amount of unrecognized tax benefits or by changes in tax laws, regulations, accounting principles or interpretations thereof.
Our determination of our tax liability is subject to review by applicable U.S. and foreign tax authorities. Any adverse outcome of such a review could harm our operating results and financial condition. The determination of our worldwide provision for income taxes and other tax liabilities requires significant judgment and, in the ordinary course of business, there are many transactions and calculations where the ultimate tax determination is complex and uncertain. Moreover, as a multinational business, we have subsidiaries that engage in many intercompany transactions in a variety of tax jurisdictions where the ultimate tax determination is complex and uncertain.
We are also subject to non-income taxes, such as payroll, sales, use, value-added, net worth, property and goods and services taxes in the U.S. and various foreign jurisdictions. We are regularly audited by tax authorities with respect to these non-income taxes and may have exposure to additional non-income tax liabilities which could have an adverse effect on our results of operations and financial condition. In addition, our future effective tax rates could be favorably or unfavorably affected by changes in tax rates, changes in the valuation of our deferred tax assets or liabilities, or changes in tax laws or their interpretation. Such changes could have an adverse impact on our financial results.
As a result of these and other factors, the ultimate amount of tax obligations owed may differ from the amounts recorded in our financial statements and any such difference may harm our financial results in future periods in which we change our estimates of our tax obligations or in which the ultimate tax outcome is determined.
We may be subject to increased income taxes, and other restrictions and limitations, if we were to decide to repatriate any of our foreign cash balances to the U.S.
As of December 31, 2014, we held approximately $99.4 million, or approximately 41%, of our cash and cash equivalents outside of the U.S. We use our foreign held cash by reinvesting it in our foreign operations. Our current intention is to continue to reinvest our foreign earnings in our foreign operations. Our current plans do not anticipate a need to repatriate cash to fund our domestic operations. In the event cash from foreign operations is needed to fund operations in the U.S. or our foreign cash balance continues to grow such that we are unable to reinvest such cash outside of the U.S., it may become increasingly likely that we would repatriate some of our foreign cash balances to the U.S. In such event, we would be subject to additional income taxes in the U.S.
Additionally, if we were to repatriate foreign held cash to the U.S., we would use a portion of our domestic net operating loss carryforward which could result in us being subject to cash income taxes on the earnings of our domestic business sooner than would otherwise have been the case.
39
Table of Contents
If securities or industry analysts do not publish research or reports or publish unfavorable research or reports about our business, our stock price and trading volume could decline.
The trading market for our common stock may be influenced by the research and reports that securities or industry analysts may publish about us, our business, our market or our competitors. If any of the analysts who may cover us adversely change their recommendation regarding our stock or products, or provide more favorable relative recommendations about our competitors, our stock price would likely decline. If any analyst who may cover us were to cease coverage of our company or fail to regularly publish reports on us, interest in our stock could decrease, which could cause our stock price or trading volume to decline.
The price of our common stock may be volatile and fluctuate substantially.
The market price of our common stock could be highly volatile and may fluctuate substantially due to the following factors (in addition to the other risk factors described in this section):
| • | quarterly variations in our results of operations or those of our competitors |
| • | announcements by us or our competitors of acquisitions, new products, significant contracts or commercial relationships |
| • | our ability to respond to changing industry standards, technological developments or customer requirements on a timely basis |
| • | commencement of, or our involvement in, litigation |
| • | any major change in our board of directors or management |
| • | financial guidance or business updates we may provide |
| • | recommendations by securities analysts or changes in earnings estimates |
| • | announcements about our earnings that are not in line with analyst expectations or guidance we may provide |
| • | changes in our licensing or go to business models |
| • | announcements by our competitors of their earnings that are not in line with analyst expectations |
| • | the volume of shares of our common stock available for public sale |
| • | sales of stock by us or by our stockholders |
| • | short sales, hedging and other derivative transactions involving shares of our common stock |
| • | adoption of new accounting standards or tax laws or regulations |
| • | general economic conditions in the U.S. and abroad and slow or negative growth of related markets |
| • | general political conditions in the U.S. and abroad, including terrorist attacks, war or threat of terrorist attacks or war. |
In addition, the stock market in general, NASDAQ and the market for technology companies in particular, have experienced extreme price and volume fluctuations that have often been unrelated or disproportionate to the operating performance of the particular companies affected. These broad market and industry factors may materially harm the market price irrespective of our operating performance. As a result of these factors, an investor might be unable to resell their shares at or above the price paid. In addition, in the past, following periods of volatility in the overall market or the market price of a company’s securities, securities class action litigation has often been instituted against the affected company. This type of litigation, if instituted against us, could result in substantial costs and a diversion of our management’s attention and resources.
40
Table of Contents
Future sales of our common stock in the public market, including sales by our stockholders with significant holdings, may depress our stock price.
The market price of our common stock could drop due to sales of a large number of shares or the perception that such sales could occur, including sales or perceived sales by our directors, officers or large stockholders. These sales could also make it more difficult or impossible for us to sell equity securities in the future at a time and price that we deem appropriate to raise funds through future offerings of equity securities.
Our management has broad discretion over the use of our cash reserves, if any, and might not apply this cash in ways that increase the value of an investment.
Our management has broad discretion to use our cash reserves, if any, and you will be relying on the judgment of our management regarding the application of this cash. They might not apply our cash in ways that increase the value of an investment. We expect to use our cash reserves for general corporate purposes, including working capital, capital expenditures, acquisitions and further development of our products, services and solutions. We have not allocated this cash for any specific purposes. Our management might not be able to yield any return on the investment and use of this cash.
We currently do not intend to pay dividends on our common stock, and consequently, your only opportunity to achieve a return on investment is if the price of our common stock appreciates and you sell your shares at a price above your cost.
We currently do not intend to declare or pay dividends on shares of our common stock in the foreseeable future. See “Dividend Policy” for more information. Consequently, your only opportunity to achieve a return on your investment in our company will be if the market price of our common stock appreciates and you sell your shares at a price above your cost. There is no guarantee that the price of our common stock will ever exceed the price that you pay. Investors seeking cash dividends should not purchase our common stock.
Anti-takeover provisions in our certificate of incorporation and bylaws and in Delaware law could prevent or delay a change in control of our company.
We are a Delaware corporation, and the anti-takeover provisions of the Delaware General Corporation Law may discourage, delay or prevent a change in control by prohibiting us from engaging in a business combination with an interested stockholder for a period of three years after the person becomes an interested stockholder even if a change of control would be beneficial to our existing stockholders. In addition, our restated certificate of incorporation and amended and restated bylaws may discourage, delay or prevent a change in our management or control over us that stockholders may consider favorable. Our restated certificate of incorporation and amended and restated bylaws:
| • | authorize the issuance of “blank check” preferred stock that could be issued by our board of directors to thwart a takeover attempt |
| • | do not provide for cumulative voting in the election of directors which would allow holders of less than a majority of the stock to elect some directors |
| • | establish a classified board of directors, as a result of which the successors to the directors whose terms have expired will be elected to serve from the time of election and qualification until the third annual meeting following their election |
| • | require that directors only be removed from office for cause |
| • | provide that vacancies on the board of directors, including newly-created directorships, may be filled only by a majority vote of directors then in office |
| • | limit who may call special meetings of stockholders |
| • | prohibit stockholder action by written consent, requiring all actions to be taken at a meeting of the stockholders |
41
Table of Contents
| • | establish advance notice requirements for nominating candidates for election to the board of directors or for proposing matters that can be acted upon by stockholders at stockholder meetings. |
| ITEM 1B. | UNRESOLVED STAFF COMMENTS |
None.
| ITEM 2. | PROPERTIES |
Our global corporate headquarters and principal executive offices are located in Radnor, Pennsylvania. We have corporate and development offices located in Lund, Sweden. We have corporate and sales and marketing offices located in Winnersh, United Kingdom. See “Management’s Discussion and Analysis of Financial Condition and Results of Operations” for additional details on contractual obligations and commitments.
| Location |
Type of Facility | Size (sq. ft) | Ownership Status | Lease Expiration Date | ||||||
| Radnor, Pennsylvania |
Global Headquarters | 60,572 | Leased | October 31, 2021 | ||||||
| Lund, Sweden |
Corporate and Research & Development | 121,100 | Leased | April 30, 2019 | ||||||
| Winnersh, United Kingdom |
Corporate and Sales & Marketing | 21,259 | Leased | January 2, 2022 | ||||||
We maintain other leased locations in the U.S. and throughout the world. In the U.S., we lease additional office space in Dallas, Texas, Itasca, Illinois, Newton, Massachusetts, New York, New York, Raleigh, North Carolina, Irvine, California and Burlingame, California. Throughout the world, we lease offices in Australia, Austria, Belgium, Brazil, Canada, China, Denmark, Finland, France, Germany, Hong Kong, Iceland, India, Italy, Japan, the Netherlands, Norway, Poland, Portugal, Russia, Singapore, Spain, Sweden, Switzerland, the United Arab Emirates and the United Kingdom. We believe our current facilities and planned expansion facilities will be adequate for the foreseeable future; however, we will continue to seek additional space as needed to satisfy any growth.
| ITEM 3. | LEGAL PROCEEDINGS |
We are party to routine litigation incidental to the ordinary course of our business and we may from time to time become subject to additional proceedings or additional claims or remedies sought in current proceedings. These actions typically seek, among other things, breach of contract or employment-related damages, intellectual property claims for damages, punitive damages, civil penalties or other losses or declaratory relief. Although there can be no assurance as to the outcome of any such proceedings, we do not believe any of the proceedings currently pending, if determined adversely to us, would individually or in the aggregate have a material adverse effect on our business, operating results or financial condition. See risks discussed in the section titled “Risk Factors” for more information.
Our intellectual property is an essential element of our business. We own trademarks for “Qlik,” “QlikTech,” “Qlik Sense,” “QlikView” and our logos. We rely on a combination of copyright, trademark, trade dress and trade secrecy laws, as well as confidentiality procedures and contractual restrictions, to establish and protect our proprietary rights both domestically and abroad. These laws, procedures and restrictions provide only limited protection. As of December 31, 2014, we had eight issued U.S. patents and had nine pending applications for U.S. patents. In addition, as of December 31, 2014, we had 21 issued and 21 pending applications for foreign patents. Any future patents issued to us may be challenged, invalidated or circumvented. Any patents that might be issued in the future, with respect to pending or future patent applications may not provide sufficiently broad protection or may not prove to be enforceable in actions against alleged infringers. We endeavor to enter into agreements with our employees and contractors and with parties with whom we do business in order to limit access to and disclosure of our proprietary information.
| ITEM 4. | MINE SAFETY DISCLOSURES |
Not applicable.
42
Table of Contents
| ITEM 5. | MARKET FOR REGISTRANT’S COMMON EQUITY, RELATED STOCKHOLDER MATTERS AND ISSUER PURCHASES OF EQUITY SECURITIES |
Market Information
Our common stock is quoted on NASDAQ under the symbol “QLIK.” The following table sets forth, for the period indicated, the high and low sales prices of our common stock as reported by NASDAQ.
| Common Stock Price | ||||||||||||||||
| 2014 | 2013 | |||||||||||||||
| High | Low | High | Low | |||||||||||||
| First quarter |
$ | 31.55 | $ | 24.90 | $ | 28.12 | $ | 19.60 | ||||||||
| Second quarter |
$ | 28.07 | $ | 20.17 | $ | 31.33 | $ | 23.37 | ||||||||
| Third quarter |
$ | 29.59 | $ | 21.04 | $ | 37.57 | $ | 27.99 | ||||||||
| Fourth quarter |
$ | 32.15 | $ | 22.12 | $ | 35.49 | $ | 23.23 | ||||||||
As of February 17, 2015, there were approximately 24 holders of record of our common stock. The number of holders of record of our common stock does not reflect the number of beneficial holders whose shares are held by depositors, brokers or other nominees.
Dividend Policy
We have never declared or paid any cash or stock dividends on our common stock. It is our policy to retain earnings to finance the growth and development of our business and, therefore, we do not anticipate declaring or paying any cash or stock dividends in the foreseeable future.
43
Table of Contents
Stock Performance Graph
The following graph compares the total cumulative shareholder return on our common stock since July 16, 2010, the date our stock commenced public trading, through December 31, 2014 to two indices: the NASDAQ Composite Index and the NASDAQ Computer & Data Processing Index. The graph assumes an initial investment of $100 in our common stock and in each of the indices (including reinvestment of dividends). The comparisons in the graph are required by the SEC and are not intended to forecast or be indicative of possible future performance of our common stock.
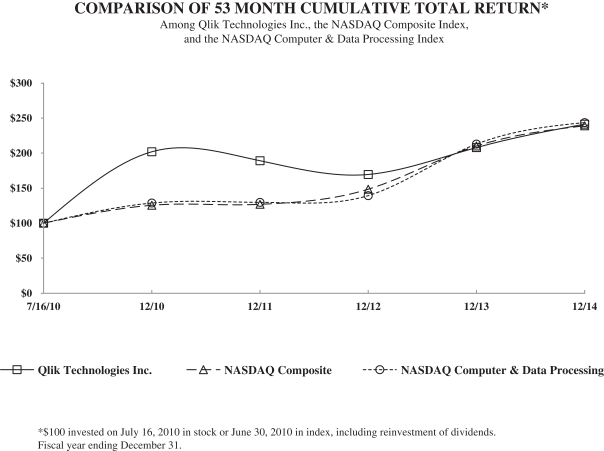
| 7/16/2010 | 12/31/2010 | 12/31/2011 | 12/31/2012 | 12/31/2013 | 12/31/2014 | |||||||||||||||||||
| Qlik Technologies Inc. |
$ | 100.00 | $ | 202.11 | $ | 189.06 | $ | 169.69 | $ | 208.05 | $ | 241.33 | ||||||||||||
| NASDAQ Composite |
$ | 100.00 | $ | 125.67 | $ | 126.83 | $ | 148.53 | $ | 210.31 | $ | 239.07 | ||||||||||||
| NASDAQ Computer & Data Processing |
$ | 100.00 | $ | 128.83 | $ | 129.89 | $ | 139.48 | $ | 212.97 | $ | 243.68 | ||||||||||||
Recent Sales of Unregistered Securities
None.
Use of Proceeds
In July 2010, we completed the initial public offering of shares of our common stock. The offer and sale of all of the shares in the initial public offering (“IPO”) were registered under the Securities Act pursuant to a registration statement on Form S-1 (File No. 333-165844), which was declared effective by the SEC on July 15,
44
Table of Contents
2010. Our portion of the net proceeds from the IPO was approximately $115.1 million after deducting underwriting discounts of approximately $9.0 million and offering costs of approximately $4.7 million.
We used approximately $5.4 million of the net proceeds from the IPO to repay in full the principal and accrued interest and prepayment fee on our prior debt facility. We intend to use the balance of the net proceeds from the IPO for working capital and other general corporate purposes, including financing our growth, enhancing our existing products, developing new products and funding capital expenditures. Pending such usage, we have invested the net proceeds primarily in short-term, interest-bearing money market accounts.
| ITEM 6. | SELECTED FINANCIAL DATA |
The consolidated statement of operations data for the three years ended December 31, 2014 and the consolidated balance sheet data as of December 31, 2014 and 2013 have been derived from our audited consolidated financial statements included elsewhere in this Annual Report on Form 10-K. The consolidated statement of operations data for the years ended December 31, 2011 and 2010 and the consolidated balance sheet data as of December 31, 2012, 2011 and 2010 have been derived from our audited consolidated financial statements that do not appear in this Annual Report on Form 10-K. The following selected consolidated financial data should be read in conjunction with “Management’s Discussion and Analysis of Financial Conditions and Results of Operations” set forth below and our consolidated financial statements and related notes included elsewhere in this Annual Report on Form 10-K. The historical results are not necessarily indicative of the results to be expected in any future period.
| Year Ended December 31, | ||||||||||||||||||||
| 2014 | 2013 | 2012 | 2011 | 2010 | ||||||||||||||||
| (in thousands, except share and per share data) | ||||||||||||||||||||
| Consolidated statement of operations data: |
||||||||||||||||||||
| Revenue: |
||||||||||||||||||||
| License revenue |
$ | 300,888 | $ | 270,769 | $ | 238,674 | $ | 204,414 | $ | 145,225 | ||||||||||
| Maintenance revenue |
203,550 | 160,552 | 120,490 | 89,129 | 59,846 | |||||||||||||||
| Professional services revenue |
52,359 | 39,129 | 29,373 | 27,076 | 21,450 | |||||||||||||||
|
|
|
|
|
|
|
|
|
|
|
|||||||||||
| Total revenue |
556,797 | 470,450 | 388,537 | 320,619 | 226,521 | |||||||||||||||
| Cost of revenue: |
||||||||||||||||||||
| License revenue |
8,196 | 7,345 | 5,058 | 3,540 | 3,670 | |||||||||||||||
| Maintenance revenue |
11,363 | 10,585 | 8,526 | 6,787 | 4,089 | |||||||||||||||
| Professional services revenue |
55,903 | 43,893 | 29,705 | 24,020 | 16,319 | |||||||||||||||
|
|
|
|
|
|
|
|
|
|
|
|||||||||||
| Total cost of revenue |
75,462 | 61,823 | 43,289 | 34,347 | 24,078 | |||||||||||||||
|
|
|
|
|
|
|
|
|
|
|
|||||||||||
| Gross profit |
481,335 | 408,627 | 345,248 | 286,272 | 202,443 | |||||||||||||||
| Operating expenses: |
||||||||||||||||||||
| Sales and marketing |
308,375 | 255,010 | 211,314 | 178,456 | 125,059 | |||||||||||||||
| Research and development |
72,636 | 60,400 | 39,995 | 24,870 | 13,798 | |||||||||||||||
| General and administrative |
109,200 | 89,795 | 79,309 | 63,287 | 36,018 | |||||||||||||||
|
|
|
|
|
|
|
|
|
|
|
|||||||||||
| Total operating expenses |
490,211 | 405,205 | 330,618 | 266,613 | 174,875 | |||||||||||||||
|
|
|
|
|
|
|
|
|
|
|
|||||||||||
| Income (loss) from operations |
(8,876 | ) | 3,422 | 14,630 | 19,659 | 27,568 | ||||||||||||||
| Other expense, net |
(1,826 | ) | (2,522 | ) | (2,891 | ) | (795 | ) | (6,854 | ) | ||||||||||
|
|
|
|
|
|
|
|
|
|
|
|||||||||||
| Income (loss) before provision for income taxes |
(10,702 | ) | 900 | 11,739 | 18,864 | 20,714 | ||||||||||||||
| Provision for income taxes |
(13,929 | ) | (10,879 | ) | (7,900 | ) | (9,820 | ) | (7,198 | ) | ||||||||||
|
|
|
|
|
|
|
|
|
|
|
|||||||||||
| Net income (loss) |
$ | (24,631 | ) | $ | (9,979 | ) | $ | 3,839 | $ | 9,044 | $ | 13,516 | ||||||||
|
|
|
|
|
|
|
|
|
|
|
|||||||||||
| Net income (loss) per common share: |
||||||||||||||||||||
| Basic |
$ | (0.27 | ) | $ | (0.11 | ) | $ | 0.04 | $ | 0.11 | $ | 0.24 | ||||||||
| Diluted |
$ | (0.27 | ) | $ | (0.11 | ) | $ | 0.04 | $ | 0.11 | $ | 0.21 | ||||||||
| Weighted average number of common shares: |
||||||||||||||||||||
| Basic |
89,886,403 | 87,702,222 | 85,423,074 | 82,043,958 | 45,232,782 | |||||||||||||||
| Diluted |
89,886,403 | 87,702,222 | 87,640,844 | 85,574,414 | 52,061,916 | |||||||||||||||
45
Table of Contents
The chart above includes the following stock-based compensation expense:
| Year Ended December 31, | ||||||||||||||||||||
| 2014 | 2013 | 2012 | 2011 | 2010 | ||||||||||||||||
| (in thousands) | ||||||||||||||||||||
| Cost of revenue |
$ | 2,804 | $ | 2,854 | $ | 1,651 | $ | 701 | $ | 188 | ||||||||||
| Sales and marketing |
17,911 | 13,374 | 10,337 | 5,672 | 1,572 | |||||||||||||||
| Research and development |
3,876 | 3,386 | 2,058 | 710 | 96 | |||||||||||||||
| General and administrative |
11,441 | 9,304 | 5,269 | 3,123 | 1,162 | |||||||||||||||
|
|
|
|
|
|
|
|
|
|
|
|||||||||||
| $ | 36,032 | $ | 28,918 | $ | 19,315 | $ | 10,206 | $ | 3,018 | |||||||||||
|
|
|
|
|
|
|
|
|
|
|
|||||||||||
| As of December 31, | ||||||||||||||||||||
| 2014 | 2013 | 2012 | 2011 | 2010 | ||||||||||||||||
| (in thousands) | ||||||||||||||||||||
| Consolidated balance sheet data: |
||||||||||||||||||||
| Cash and cash equivalents |
$ | 244,018 | $ | 227,693 | $ | 195,803 | $ | 177,413 | $ | 158,712 | ||||||||||
| Working capital |
238,753 | 224,485 | 197,264 | 182,020 | 151,175 | |||||||||||||||
| Total assets |
561,969 | 467,922 | 390,373 | 317,708 | 265,064 | |||||||||||||||
| Deferred revenue, including current portion |
132,129 | 102,321 | 85,942 | 67,116 | 50,024 | |||||||||||||||
| Total liabilities |
253,477 | 195,752 | 164,811 | 128,173 | 105,874 | |||||||||||||||
| Total stockholders’ equity |
308,492 | 272,170 | 225,562 | 189,535 | 159,190 | |||||||||||||||
46
Table of Contents
| ITEM 7. | MANAGEMENT’S DISCUSSION AND ANALYSIS OF FINANCIAL CONDITION AND RESULTS OF OPERATIONS |
The following discussion and analysis of our financial condition and results of operations should be read in conjunction with “Selected Financial Data” and our consolidated financial statements and related notes appearing elsewhere in this Annual Report on Form 10-K. In addition to historical information, this discussion and analysis contains forward-looking statements that involve risks, uncertainties and assumptions. Our actual results may differ materially from those anticipated in these forward-looking statements as a result of certain factors. We discuss factors that we believe could cause or contribute to these differences below and elsewhere in this Annual Report on Form 10-K, including those set forth under “Risk Factors” and “Special Note Regarding Forward-Looking Statements.”
Introduction
Management’s Discussion and Analysis of Financial Condition and Results of Operations are provided to help provide an understanding of our financial condition and results of operations. This item of our Annual Report on Form 10-K is organized as follows:
| • | Overview including Key Financial Metrics and Trends. This section provides a general description of our business, the key financial metrics that we use in assessing our performance, and anticipated trends that we expect to affect our financial condition and results of operations. |
| • | Consolidated Results of Operations. This section provides a comparison of our results of operations for the years ended December 31, 2014 and 2013 and the years ended December 31, 2013 and 2012. |
| • | Foreign Exchange Rates. This section discusses the impact of foreign exchange rate fluctuations for the year ended December 31, 2014 compared to the year ended December 31, 2013. |
| • | Seasonality. This section discusses the seasonality in the sale of our products and services. |
| • | Acquisitions. This section discusses recent acquisitions and how we account for them. |
| • | Liquidity and Capital Resources. This section provides an analysis of our cash flows for the years ended December 31, 2014 and 2013, a discussion of our capital requirements and the resources available to us to meet those requirements. |
| • | Critical Accounting Policies and Estimates. This section discusses accounting policies that are considered important to our financial condition and results of operations. The accounting policies require significant judgment or require estimates on our part in applying them. Our significant accounting policies, including those considered to be critical accounting policies, are summarized in Note 2 to the consolidated financial statements. |
| • | Contractual Obligations & Commitments. This section discusses contractual obligations and commitments expected to have an effect on our liquidity and cash flow in future periods. |
| • | Off-Balance Sheet Arrangements. This section discusses off-balance sheet arrangements expected to have an effect on our liquidity and cash flow in future periods. |
| • | Inflation. This section discusses how inflation could impact our financial condition and results of operations. |
| • | Recent Accounting Pronouncements. This section provides for recent accounting pronouncements that could impact our financial condition and results of operations. |
Overview
We have pioneered powerful, user-driven Business Intelligence (“BI”) solutions that enable our customers to make better, faster and more informed business decisions, wherever they are. Our software products help people create and share insights and analysis in groups and across organizations. Business users can explore data, ask and answer their own stream of questions and follow their own path to insight, or collaborate across teams and organizations.
47
Table of Contents
Our software products are powered by our in-memory engine which maintains associations in data and calculates aggregations rapidly, as business users interact with our software. Our Data Discovery solutions are designed to give our customers significant improvements in usability, flexibility and performance at lower costs compared to traditional BI solutions.
For the years ended December 31, 2014, 2013 and 2012, our revenue was approximately $556.8 million, $470.5 million and $388.5 million, representing year-over-year growth of approximately 18% in 2014 and 21% in 2013 and 2012, respectively. In addition, we generated income (loss) from operations of approximately ($8.9) million, $3.4 million and $14.6 million for the years ended December 31, 2014, 2013 and 2012. For the year ended December 31, 2014, software license revenue and maintenance revenue comprised approximately 91% of our total revenue and professional services revenue comprised approximately 9% of our total revenue. For the years ended December 31, 2013 and 2012, software license revenue and maintenance revenue comprised approximately 92% of our total revenue and professional services revenue comprised approximately 8% of our total revenue.
We currently operate in one business segment, namely, the development, commercialization and implementation of software products and related services. See Note 10 to our consolidated financial statements, Business and Geographic Segment Information, for information regarding our business and the geographies in which we operate. We have a diversified distribution model that consists of a direct sales force, a partner network of solution providers (or resellers), original equipment manufacturer (“OEM”) relationships and system integrators.
We have grown our customer base to approximately 34,000 active customers as of December 31, 2014 and increased our revenue at approximately a 25% compound annual growth rate from 2010 through 2014. During 2014, our software products were licensed by customers such as Ace Insurance, Air Force Material Command, AllianceBernstein LP, AmericsourceAnalogic Corporation, Boston Scientific India Private Limited, British Telecommunications plc, Canadian Pacific Railway Limited, Children’s Hospital of Wisconsin, Columbus McKinnon Corporation, David Lloyd Leisure, Deutsche Börse AG, Harbour Industries, Inc., Harris Farm Markets, IKEA Japan K.K., Ingram Micro UK Ltd, Mission Health, Nestlé Nederland BV, Palmetto Health, SK Hynix Inc., Southern Illinois Healthcare, STAR India Pvt Ltd, Steven Madden, Ltd., Suguna Foods, Sunstar Americas, Inc., SUZUKI MOTOR CORPORATION, Topps Tiles (UK) Ltd, Tupperware, the U.S. Department of Energy and the U.S. Department of Justice. We have customers in over 100 countries and approximately 71% of our revenue for the year ended December 31, 2014 was derived internationally. For the years ended December 31, 2013 and 2012, approximately 70% and 72%, respectively, of our revenue was derived internationally.
We have a differentiated business model designed to accelerate the adoption of our product to reduce the time and cost to purchase and implement our software products. Our low risk approach to product sales provides a needed alternative to costly, all-or-nothing traditional BI models. We initially focus on specific business users or departments within a prospective customer’s organization and seek to solve a targeted business need. After demonstrating our product’s benefits to initial adopters within an organization, we work to expand sales of our product to other business units, geographies and use cases with the long-term goal of broad organizational deployment.
We generally license our software products under perpetual licenses which generally include one year of maintenance as part of the initial purchase price of the product. Our customers can renew, and generally have renewed, their maintenance agreements for a fee that is based upon a percentage of the initial license fee paid. For the year ended December 31, 2014, our total revenue was comprised of approximately 54% license revenue, 37% maintenance revenue and 9% professional services revenue. For the year ended December 31, 2013, our total revenue was comprised of approximately 58% license revenue, 34% maintenance revenue and 8% professional services revenue. For the year ended December 31, 2012, our total revenue was comprised of approximately 61% license revenue, 31% maintenance revenue and 8% professional services revenue. Total billings from our OEM relationships accounted for approximately 6% and 8% of our total billings during the years ended December 31, 2014 and 2013, respectively. Additionally, our online Qlik Community provides us
48
Table of Contents
with a loyal and growing network of users who promote our software, provide support for other users and contribute valuable insights and feedback for our product development efforts.
To complement our software products, we have developed a differentiated business model that has the following attributes:
| • | Broad User Focus — marketing and selling our software products directly to the business user by providing easy-to-use solutions that can be used with minimal training. |
| • | Low Risk Rapid Product Adoption — providing a low risk alternative to costly, all-or-nothing, enterprise-wide deployment requirements. |
| • | “Land and Expand” Customer Approach — initially targeting specific business users or departments in an organization to create a loyal user base that promotes broad adoption of our software products across an organization. |
| • | Globally Diversified Distribution Model — employing a multi-pronged international sales approach that leverages a direct sales force and partner network. |
| • | Community-Based Marketing and Support — augmenting our development, marketing and support efforts through our online Qlik Community. |
In evaluating our operating results, we focus on the productivity of our sales force, the effectiveness of our channel partners, the effectiveness of our local and corporate level marketing, our ability to close opportunities generated by our marketing leads and the competitiveness of our technology. In each of these areas, we have taken steps designed to improve our operating results, including undertaking additional sales training for our sales representatives, hiring more experienced regional sales management, making additional investments in marketing activities, developing a partner enablement program to focus on the results of our sales partners around the world and expanding our research and development staff with a focus on product enhancement, testing and quality assurance.
From a risk perspective, we have had to deal with the impact of the recessionary global environment during the past several years, and the unsettled global economic environment could affect our operating results in future periods. Approximately 71% of our revenue during the year ended December 31, 2014 was derived internationally, of which approximately 52% was derived in Europe. Approximately 70% of our revenue during the year ended December 31, 2013 was derived internationally, of which approximately 53% was derived in Europe. Approximately 72% of our revenue during the year ended December 31, 2012 was derived internationally, of which approximately 56% was derived in Europe. We have faced pricing pressure from some of our competitors and we seek to minimize the impact by demonstrating the value delivered by QlikView in comparison to these other BI products. In addition, as we continue to further penetrate the enterprise and the size and complexity of our sales opportunities continue to expand, we have seen an increase in the average length of time in our sales cycles. As a result, we seek to continue to improve the management of our sales pipeline in response to these dynamics. Also, the growth in our business has required the continued hiring of experienced staff across all of our geographic territories. To aid this effort we have focused on improving our local recruiting initiatives, as well as on developing further internal training programs to prepare employees for greater responsibilities.
We believe global economic conditions remain unstable and have contributed to an increase in the average length of time in our sales cycles. In addition, these conditions may result in an increase in the average length of time it takes to collect outstanding accounts receivable.
49
Table of Contents
Key Financial Metrics and Trends
Revenues
Our revenue is comprised of license, maintenance and professional services. We license our software under perpetual licenses which generally include one year of maintenance as part of the initial purchase price of the product. License revenue reflects the revenue recognized from sales of licenses to new customers and additional licenses to existing customers. Approximately 63% of total license and first year maintenance billings were generated from existing customers during 2014 and 2013. Based upon our land and expand sales strategy, we expect that on an annual basis the contribution of license and first year maintenance from existing customers will continue to exceed the contribution of license and first year maintenance from new customers. Customers can renew, and generally have renewed, their maintenance agreements for a fee that is based upon a percentage of the initial license fee paid. Current customers with maintenance agreements are entitled to receive unspecified upgrades and enhancements when and if they become available. We have experienced growth in maintenance revenue primarily due to increased license sales and growth in our customer base and high retention of those customers. In each of the years ended December 31, 2014 and 2013, our annual maintenance renewal rates were greater than 90%. Professional services revenue is comprised of training, installation and other consulting revenues, and represented approximately 9% of total revenues for the year ended December 31, 2014 and 8% of total revenues for the years ended December 31, 2013 and 2012. We do not expect the percentage contribution to change significantly during the near term. The contribution from our partner network has grown over time and we anticipate that revenues from partners will continue to be more than 50% of total revenues. Given the size of the U.S. market and our current penetration there, we expect that the U.S. will represent our largest growth opportunity in terms of absolute U.S. dollars during the near term and will likely be an important contributor to future revenue growth. Due to the global diversity of our customer base, our results are impacted by movements in the currencies of the major territories in which we operate. The primary foreign currencies generally impacting our results are the Swedish kronor, the euro and the British pound. Inflation and changing prices had no material effect on our revenue or income from operations during the years ended December 2014, 2013 and 2012.
Cost of Revenue
Cost of revenue primarily consists of personnel costs, fees paid to subcontractors providing technical support services, referral fees paid to third parties in connection with software license sales, amortization of technology related intangible assets acquired and other discrete professional services. Personnel costs include salaries, employee benefit and social costs, bonuses and stock-based compensation.
Operating Expenses
We classify our operating expenses into three categories: sales and marketing, research and development, and general and administrative. Our operating expenses primarily consist of personnel costs, sales commissions, travel and entertainment costs, marketing program costs, facilities, legal, accounting, outside contractors and consultants, the cost of our annual employee summit, other professional services costs and depreciation and amortization. Personnel costs include salaries, employee benefit and social costs, bonuses and stock-based compensation. Historically, we have focused on the continued growth of our license revenues, and as a result, sales and marketing has represented the largest amount of total expenses both in absolute dollar terms and as a percentage of total revenues.
Sales and Marketing. Sales and marketing expenses primarily consist of personnel costs for our sales, marketing and business development employees and executives; commissions earned by our sales related personnel; travel and entertainment costs; facilities costs attributable to our sales and marketing personnel; the cost of marketing programs and events; the cost of employee training programs; and the cost of business development programs. We have made incremental investments in sales and marketing in 2014, including the hiring of additional sales personnel in both the U.S. and our international locations. In addition, in the fourth quarter of 2014, we held our first global user event. We expect that our sales and marketing expenses will
50
Table of Contents
continue to increase in absolute dollars, but decline as a percentage of revenue over time as we expect to derive greater efficiencies from the investments made in our sales and marketing organization.
Research and Development. Research and development expenses primarily consist of personnel and facility costs for our research and development and product management employees along with the amortization of research and development related intangible assets acquired. The vast majority of our research and development staff is based in Lund, Sweden. We have devoted our development efforts primarily to enhancing the functionality and expanding the capabilities of our software products. We expect that our research and development expenses will continue to increase in absolute dollars and remain constant or increase as a percentage of revenue in the near term as we increase our research and development and product management headcount to further strengthen and enhance our software products.
General and Administrative. General and administrative expenses primarily consist of personnel costs for our executive, finance, legal, human resources, information systems and administrative personnel, as well as the cost of facilities attributable to general and administrative operations, the cost of employee training programs, depreciation and amortization, legal, accounting, other professional services fees and other corporate expenses. We also expect that general and administrative expenses will continue to increase in absolute dollars because of our efforts to expand our global operations, but we believe over time general and administrative costs will decline as a percentage of revenues as we expect to derive greater efficiencies from the investments made in our corporate infrastructure.
Stock-Based Compensation. Stock-based compensation expense is based on the fair value of those awards at the date of grant. We use the Black-Scholes-Merton (“Black-Scholes”) option-pricing model to determine the fair value of common stock option awards and Stock-settled Stock Appreciation Rights (“SSARs”). The fair value of a restricted stock unit is determined by using the closing price of our common stock on the date of grant. The estimated fair value of Maximum Value Stock-settled Stock Appreciation Rights (“MVSSSARs”) is determined by utilizing a lattice model under the option-pricing method. The estimated fair value of stock-based compensation awards on the date of grant is amortized on a straight-line basis over the requisite service period. Stock-based compensation expense is recorded within cost of revenue, sales and marketing, research and development and general and administrative expenses.
Other Income (Expense), net
Other income (expense), net primarily consists of net interest and foreign exchange gains or losses. Net interest represents interest income received on our cash and cash equivalents and interest expense associated with outstanding debt. Foreign exchange gains or losses relate to our business activities in foreign countries and the re-measurement of intercompany transactions between subsidiaries with different functional reporting currencies, as well as the impact of our short-term foreign currency forward contracts related to certain intercompany borrowings. As a result of our business activities in foreign countries, we expect that foreign exchange gains or losses will continue to occur due to fluctuations in exchange rates in the countries where we do business.
Provision for Income Taxes
Provision for income taxes primarily consists of corporate income taxes related to income at our U.S. and international subsidiaries. The provision includes amounts for U.S. federal, state and foreign income taxes.
Deferred tax assets and liabilities are recognized for the future tax consequences attributable to differences between the financial statement carrying amounts of existing assets and liabilities and their respective tax bases and operating loss and tax credit carryforwards. Deferred tax assets and liabilities are measured using enacted tax rates expected to apply to taxable income in the years in which those temporary differences are expected to be recovered or settled. The effect on deferred tax assets and liabilities of a change in tax rates is recognized in income in the period that includes the enactment date. A valuation allowance is recorded against deferred tax
51
Table of Contents
assets if it is more-likely-than-not that such assets will not be realized in the near term. The factors used to assess the likelihood of realization are the forecast of future taxable income, the remaining time period to utilize any tax operating losses and tax credits and available tax planning strategies that could be implemented to realize deferred tax assets.
In evaluating our ability to realize deferred tax assets, we consider all available positive and negative evidence. Our negative evidence includes historical taxable losses generated by certain subsidiaries. Our positive evidence includes historical taxable income at certain subsidiaries as well as projected future taxable income. In determining future taxable income, we make assumptions for the amount of taxable income, the reversal of temporary differences and the implementation of feasible and prudent tax planning strategies. These assumptions require us to make judgments about our future taxable income and are consistent with the plans and estimates we use to manage our business.
The effective tax rates for 2014, 2013 and 2012 were (130.1%), 1208.8% and 67.3%, respectively. The effective tax rate for 2014 and 2013 reflects approximately $8.1 million and $2.2 million of charges related to valuation allowances.
Impact of Foreign Currency Translation
Approximately 69% of our operating revenues for the year ended December 31, 2014 were earned in foreign denominated currencies, including the euro, the British pound and the Swedish kronor. Approximately 70% of our operating revenues for the years ended December 31, 2013 and 2012 were earned in foreign denominated currencies, including the euro, the British pound and the Swedish kronor. We continue to monitor our foreign exchange risk in part through operational means, including monitoring the proportion of same-currency revenues in relation to same-currency costs and the proportion of same-currency assets in relation to same-currency liabilities. As we operate in multiple foreign currencies, changes in those currencies relative to the U.S. dollar will impact our revenues and expenses. If the U.S. dollar weakens against a specific foreign currency, our revenues will increase having a positive impact on net income, and our overall expenses will increase, having a negative impact on net income. Likewise, if the U.S. dollar strengthens against a specific foreign currency, our revenues will decrease having a negative impact on net income, and our overall expenses will decrease, having a positive impact on net income. Therefore, significant shifts in foreign currencies can impact our short-term results, as well as our long-term forecasts and targets.
Foreign currency exchange rate fluctuations negatively impacted total revenue for the year ended December 31, 2014 compared to the year ended December 31, 2013 by approximately $9.1 million, principally driven by the overall strengthening of the U.S. dollar relative to the foreign currencies in which we operate. Total cost of revenue and operating expenses for the year ended December 31, 2014 compared to the year ended December 31, 2013 were positively impacted as a result of foreign exchange rate fluctuations by approximately $6.9 million, principally driven by the overall strengthening of the U.S. dollar relative to the foreign currencies in which we operate.
52
Table of Contents
Consolidated Results of Operations
The following table sets forth a summary of our consolidated statements of operations for the periods indicated as a percentage of total revenue:
| Year Ended December 31, | ||||||||||||
| 2014 | 2013 | 2012 | ||||||||||
| Revenue: |
||||||||||||
| License revenue |
54.0 | % | 57.6 | % | 61.4 | % | ||||||
| Maintenance revenue |
36.6 | 34.1 | 31.0 | |||||||||
| Professional services revenue |
9.4 | 8.3 | 7.6 | |||||||||
|
|
|
|
|
|
|
|||||||
| Total revenues |
100.0 | 100.0 | 100.0 | |||||||||
| Cost of revenue: |
||||||||||||
| License revenue |
1.5 | 1.6 | 1.3 | |||||||||
| Maintenance revenue |
2.1 | 2.2 | 2.2 | |||||||||
| Professional services revenue |
10.0 | 9.3 | 7.6 | |||||||||
|
|
|
|
|
|
|
|||||||
| Total cost of revenue |
13.6 | 13.1 | 11.1 | |||||||||
|
|
|
|
|
|
|
|||||||
| Gross profit |
86.4 | 86.9 | 88.9 | |||||||||
| Operating expenses: |
||||||||||||
| Sales and marketing |
55.4 | 54.2 | 54.4 | |||||||||
| Research and development |
13.0 | 12.9 | 10.3 | |||||||||
| General and administrative |
19.6 | 19.1 | 20.4 | |||||||||
|
|
|
|
|
|
|
|||||||
| Total operating expenses |
88.0 | 86.2 | 85.1 | |||||||||
|
|
|
|
|
|
|
|||||||
| Income (loss) from operations |
(1.6 | ) | 0.7 | 3.8 | ||||||||
| Other expense, net |
(0.3 | ) | (0.5 | ) | (0.8 | ) | ||||||
|
|
|
|
|
|
|
|||||||
| Income (loss) before provision for income taxes |
(1.9 | ) | 0.2 | 3.0 | ||||||||
| Provision for income taxes |
(2.5 | ) | (2.3 | ) | (2.0 | ) | ||||||
|
|
|
|
|
|
|
|||||||
| Net income (loss) |
(4.4 | )% | (2.1 | )% | 1.0 | % | ||||||
|
|
|
|
|
|
|
|||||||
Comparison of the Years Ended December 31, 2014 and 2013
Revenue
The following table sets forth revenue by source:
| Year Ended December 31, | ||||||||||||||||||||||||
| 2014 | 2013 | |||||||||||||||||||||||
| Amount | Percentage of Revenue |
Amount | Percentage of Revenue |
Period-to-Period Change |
||||||||||||||||||||
| (dollars in thousands) | ||||||||||||||||||||||||
| Revenue: |
||||||||||||||||||||||||
| License revenue |
$ | 300,888 | 54.0 | % | $ | 270,769 | 57.6 | % | $ | 30,119 | 11.1 | % | ||||||||||||
| Maintenance revenue |
203,550 | 36.6 | % | 160,552 | 34.1 | % | 42,998 | 26.8 | % | |||||||||||||||
| Professional services revenue |
52,359 | 9.4 | % | 39,129 | 8.3 | % | 13,230 | 33.8 | % | |||||||||||||||
|
|
|
|
|
|
|
|
|
|
|
|||||||||||||||
| Total revenue |
$ | 556,797 | 100.0 | % | $ | 470,450 | 100.0 | % | $ | 86,347 | 18.4 | % | ||||||||||||
|
|
|
|
|
|
|
|
|
|
|
|||||||||||||||
Revenue was approximately $556.8 million for the year ended December 31, 2014 compared to approximately $470.5 million for the year ended December 31, 2013, an increase of 18.4%. Total revenue for the year ended December 31, 2014 was negatively impacted by approximately $9.1 million as a result of foreign currency exchange rate fluctuations, principally driven by the overall strengthening of the U.S. dollar relative to the foreign currencies in which we operate. The increase in revenue from the prior year period was primarily driven by revenue growth in the Americas (includes North America and South America), Rest of World (includes
53
Table of Contents
Asia-Pacific, Middle East and Africa), the United Kingdom (includes United Kingdom and Ireland) and the Benelux region (includes Belgium, the Netherlands, Luxembourg and Eastern Europe), which grew by 15.8%, 39.6%, 29.4% and 20.3%, respectively, and contributed approximately $67.3 million in incremental total revenue. License revenue grew by approximately $30.1 million, or 11.1%. There was no material change in the pricing for our products during the year. Revenue growth was achieved primarily due to volume growth as new customers acquired our software products for the first time, along with additional license purchases by our existing customers. During the year ended December 31, 2014, we closed 556 contracts that had total license and first year’s maintenance exceeding $100,000, compared to 511 contracts for the same period last year. Included in the deals exceeding $100,000, we closed 147 contracts that had total license and first year’s maintenance exceeding $250,000, compared to 141 contracts for the same period last year. Included in the deals exceeding $250,000, we closed 20 contracts that had total license and first year’s maintenance exceeding $1.0 million, compared to 15 contracts for the same period last year. Amounts invoiced to existing customers represented a larger share of total billings during the year ended December 31, 2014, approximately 77%, resulting from our “land and expand” sales strategy, compared to approximately 75% during the year ended December 31, 2013. Billings from our indirect partner channel for license and first year maintenance were approximately 53% of total license and first year maintenance billings for the year ended December 31, 2014 compared to approximately 57% for the year ended December 31, 2013. Maintenance revenues grew by 26.8% during the year ended December 31, 2014 compared to the year ended December 31, 2013 driven by annual maintenance renewal rates of greater than 90% and an increase in our customer base. Professional services revenue grew 33.8% during the year ended December 31, 2014 compared to the year ended December 31, 2013 due to growth in consulting and training revenue, resulting primarily from an increase in our customer base and expanded professional services engagements with certain larger customers. The revenue growth during the year ended December 31, 2014 as compared to the year ended December 31, 2013 may not be indicative of our future revenue growth, if any.
Cost of Revenue and Gross Profit
The following table sets forth cost of revenue and gross profit for each revenue source:
| Year Ended December 31, | ||||||||||||||||||||||||
| 2014 | 2013 | |||||||||||||||||||||||
| Amount | Percentage of Related Revenue |
Amount | Percentage of Related Revenue |
Period-to-Period Change |
||||||||||||||||||||
| (dollars in thousands) | ||||||||||||||||||||||||
| Cost of Revenue: |
||||||||||||||||||||||||
| Cost of license revenue |
$ | 8,196 | 2.7 | % | $ | 7,345 | 2.7 | % | $ | 851 | 11.6 | % | ||||||||||||
| Cost of maintenance revenue |
11,363 | 5.6 | % | 10,585 | 6.6 | % | 778 | 7.4 | % | |||||||||||||||
| Cost of professional services revenue |
55,903 | 106.8 | % | 43,893 | 112.2 | % | 12,010 | 27.4 | % | |||||||||||||||
|
|
|
|
|
|
|
|||||||||||||||||||
| Total cost of revenue |
$ | 75,462 | 13.6 | % | $ | 61,823 | 13.1 | % | $ | 13,639 | 22.1 | % | ||||||||||||
|
|
|
|
|
|
|
|||||||||||||||||||
| Gross Profit: |
||||||||||||||||||||||||
| License revenue |
$ | 292,692 | 97.3 | % | $ | 263,424 | 97.3 | % | $ | 29,268 | 11.1 | % | ||||||||||||
| Maintenance revenue |
192,187 | 94.4 | % | 149,967 | 93.4 | % | 42,220 | 28.2 | % | |||||||||||||||
| Professional services revenue |
(3,544 | ) | -6.8 | % | (4,764 | ) | -12.2 | % | 1,220 | -25.6 | % | |||||||||||||
|
|
|
|
|
|
|
|||||||||||||||||||
| Total gross profit |
$ | 481,335 | 86.4 | % | $ | 408,627 | 86.9 | % | $ | 72,708 | 17.8 | % | ||||||||||||
|
|
|
|
|
|
|
|||||||||||||||||||
Cost of revenue was approximately $75.5 million for the year ended December 31, 2014 compared to approximately $61.8 million for the year ended December 31, 2013, an increase of approximately $13.6 million, or 22.1%. Total cost of revenue for the year ended December 31, 2014 compared to the year ended December 31, 2013 was positively impacted as a result of foreign currency exchange rate fluctuations by approximately $0.7 million. Cost of license revenue largely consists of referral fees paid to third parties in connection with software license sales and the amortization of technology related intangible assets acquired. Referral fees increased
54
Table of Contents
approximately $0.8 million as a result of increased license revenue for the year ended December 31, 2014 as compared to the year ended December 31, 2013. Cost of maintenance revenue increased approximately $0.8 million for the year ended December 31, 2014 as compared to the same period in 2013. In anticipation of continued growth in our current customer base, we increased headcount in our support organization which increased personnel costs by approximately $0.5 million (including a $0.1 million increase in stock-based compensation). In addition, we had an increase in other cost of maintenance revenue of approximately $0.3 million for the year ended December 31, 2014 as compared to the same period in 2013. Cost of professional services revenue increased approximately $12.0 million for the year ended December 31, 2014 as compared to the same period in 2013 largely due to increased personnel costs of approximately $9.9 million. In addition, we had an increase in outside contractor costs and other cost of professional services revenue of approximately $1.2 million, an increase in travel and entertainment costs of approximately $0.7 million and an increase in facility and infrastructure costs of approximately $0.2 million as we continue to invest in our services organization.
Total gross profit increased approximately $72.7 million, or 17.8%, for the year ended December 31, 2014 compared to the year ended December 31, 2013 largely due to an increase in total revenue of approximately $86.3 million, or 18.4%. The increase in our total gross profit during the year ended December 31, 2014 as compared to the year ended December 31, 2013 may not be indicative of our future gross profit. For the year ended December 31, 2014, total gross margin decreased to 86.4% from 86.9% for the year ended December 31, 2013. The decrease in our total gross margin from the prior year period is primarily due to the cost of professional services revenue, which increased approximately $12.0 million for the year ended December 31, 2014 as compared to the same period in 2013 and was largely due to increased personnel costs and an increase in outside contractor costs and other cost of professional services revenue. The total gross margin during the year ended December 31, 2014 as compared to the year ended December 31, 2013 may not be indicative of our future gross margin.
Operating Expenses
The following table sets forth operating expenses as a percentage of revenue:
| Year Ended December 31, | ||||||||||||||||||||||||
| 2014 | 2013 | |||||||||||||||||||||||
| Amount | Percentage of Revenue |
Amount | Percentage of Revenue |
Period-to-Period Change |
||||||||||||||||||||
| (dollars in thousands) | ||||||||||||||||||||||||
| Operating expenses: |
||||||||||||||||||||||||
| Sales and marketing |
$ | 308,375 | 55.4 | % | $ | 255,010 | 54.2 | % | $ | 53,365 | 20.9 | % | ||||||||||||
| Research and development |
72,636 | 13.0 | % | 60,400 | 12.8 | % | 12,236 | 20.3 | % | |||||||||||||||
| General and administrative |
109,200 | 19.6 | % | 89,795 | 19.1 | % | 19,405 | 21.6 | % | |||||||||||||||
|
|
|
|
|
|
|
|
|
|
|
|||||||||||||||
| Total operating expenses |
$ | 490,211 | 88.0 | % | $ | 405,205 | 86.1 | % | $ | 85,006 | 21.0 | % | ||||||||||||
|
|
|
|
|
|
|
|
|
|
|
|||||||||||||||
Sales and Marketing. Sales and marketing expenses increased approximately $53.4 million, or 20.9%, for the year ended December 31, 2014 as compared to the year ended December 31, 2013. Sales and marketing expenses for the year ended December 31, 2014 compared to the year ended December 31, 2013 were positively impacted as a result of foreign currency exchange rate fluctuations by approximately $2.7 million. The increase in sales and marketing expenses was primarily attributable to an increase in personnel and commission costs of approximately $43.9 million (including a $4.5 million increase in stock-based compensation), reflecting higher employee headcount and higher variable compensation resulting from increased license revenue. In addition, we had an increase in marketing, advertising and public relations costs of $4.0 million. In November 2014, we held our first global user event which resulted in an increase in event costs of $2.3 million. In addition, we had an increase in outside consulting costs and other sales and marketing costs of approximately $1.9 million, an increase in travel and entertainment costs of approximately $1.2 million and an increase in facility and infrastructure costs of approximately $0.1 million to support global expansion.
55
Table of Contents
Research and Development. Research and development expenses increased by approximately $12.2 million, or 20.3%, during the year ended December 31, 2014 as compared to the year ended December 31, 2013. Research and development expenses for the year ended December 31, 2014 compared to the year ended December 31, 2013 were positively impacted by foreign currency exchange rate fluctuations by approximately $2.2 million. The increase in research and development expenses was largely attributable to product management costs of approximately $5.0 million related to the market introduction of Qlik Sense. In addition, we had an increase in personnel costs of approximately $3.2 million (including a $0.5 million increase in stock-based compensation) and an increase in outside professional fees of approximately $2.1 million related to the market introduction of Qlik Sense. The increase in research and development expenses also reflects an increase of approximately $1.4 million in other research and development costs, such as facility and infrastructure costs and travel and entertainment costs, as well as an increase of approximately $0.5 million related to the amortization of research and development related intangible assets acquired.
General and Administrative. General and administrative expenses increased by approximately $19.4 million, or 21.6%, for the year ended December 31, 2014 compared to the year ended December 31, 2013. General and administrative expenses for the year ended December 31, 2014 compared to the year ended December 31, 2013 were positively impacted as a result of foreign currency exchange rate fluctuations by approximately $1.3 million. The increase in general and administrative expenses for the year ended December 31, 2014 compared to the year ended December 31, 2013 was largely due to an increase in personnel costs of approximately $10.2 million (including a $2.1 million increase in stock-based compensation). In addition, we had an increase of approximately $5.2 million primarily related to information systems consulting, software licensing and support fees and data communication costs. Also, we had an increase of approximately $2.0 million primarily related to professional fees, such as accounting, tax and legal fees and an increase in other general and administrative costs primarily related to facility and infrastructure costs of approximately $2.0 million to support global expansion.
Other Expense, net.
During the year ended December 31, 2014, other expense, net was approximately $1.8 million. Other expense, net for the year ended December 31, 2014 primarily consisted of foreign exchanges losses of approximately $2.0 million offset by net interest income of approximately $0.2 million. During the year ended December 31, 2013, other expense, net was approximately $2.5 million. Other expense, net, for the year ended December 31, 2013 primarily consisted of foreign exchange losses of approximately $2.7 million offset by net interest income of approximately $0.2 million.
Provision for Income Taxes.
For the year ended December 31, 2014, we recorded a provision for income taxes of approximately $13.9 million, which resulted in an effective tax rate of (130.1%), compared to a provision of approximately $10.9 million, or an effective tax rate of 1208.8%, for the year ended December 31, 2013. We operate in an international environment with significant operations in various locations outside the U.S.; accordingly, the consolidated income tax rate is a composite rate reflecting our income (loss) and the applicable tax rate in the various locations where we operate. Permanent differences and non-cash income tax charges, including the change in our valuation allowance, have a significant impact on our effective tax rate. The effective tax rate for the year ended December 31, 2014 reflects the effects of the foreign tax rate differential, permanent differences, and the changes in the valuation allowance on deferred tax assets. The effective tax rate for the year ended December 31, 2013 reflects the effects of a foreign tax rate differential and discrete items offset by the effects of permanent differences and changes in the valuation allowance on deferred tax assets. The primary differences between the effective tax rates for the years ended December 31, 2014 and 2013 are caused by changes in the mix of income by jurisdiction and the increases in valuation allowances against deferred tax assets, the impact of the permanent differences, and discrete items.
56
Table of Contents
Comparison of the Years Ended December 31, 2013 and 2012
Revenue
The following table sets forth revenue by source:
| Year Ended December 31, | ||||||||||||||||||||||||
| 2013 | 2012 | |||||||||||||||||||||||
| Amount | Percentage of Revenue |
Amount | Percentage of Revenue |
Period to Period Change |
||||||||||||||||||||
| (dollars in thousands) | ||||||||||||||||||||||||
| Revenue |
||||||||||||||||||||||||
| License revenue |
$ | 270,769 | 57.6 | % | $ | 238,674 | 61.4 | % | $ | 32,095 | 13.4 | % | ||||||||||||
| Maintenance revenue |
160,552 | 34.1 | % | 120,490 | 31.0 | % | 40,062 | 33.2 | % | |||||||||||||||
| Professional services revenue |
39,129 | 8.3 | % | 29,373 | 7.6 | % | 9,756 | 33.2 | % | |||||||||||||||
|
|
|
|
|
|
|
|
|
|
|
|
|
|||||||||||||
| Total revenue |
$ | 470,450 | 100.0 | % | $ | 388,537 | 100.0 | % | $ | 81,913 | 21.1 | % | ||||||||||||
|
|
|
|
|
|
|
|
|
|
|
|
|
|||||||||||||
Revenue was approximately $470.5 million for the year ended December 31, 2013 compared to approximately $388.5 million for the year ended December 31, 2012, an increase of 21.1%. Total revenue for the year ended December 31, 2013 was positively impacted by approximately $2.2 million by foreign currency rate fluctuations, principally driven by the weakening of the U.S. dollar relative to the Swedish kronor and the euro, partially offset by the strengthening of the U.S. dollar relative to the Japanese yen, the British pound, the Australian dollar and the Brazilian real. The increase in revenue from the prior year period was primarily driven by revenue growth in the Americas (includes North America and South America), Rest of World (includes Asia-Pacific, Middle East and Africa), the Nordic region (includes Sweden, Denmark, Finland and Norway) and France, which grew by 29.3%, 26.7%, 17.9% and 24.5%, respectively, and contributed approximately $63.9 million in incremental total revenue. License revenue grew by approximately $32.1 million, or 13.4%. There was no material change in the pricing for our product during the year. Revenue growth was achieved primarily due to volume growth as new customers acquired our product for the first time, along with additional license purchases by our existing customers. During the year ended December 31, 2013, we closed 511 contracts that had total license and first year’s maintenance exceeding $100,000, compared to 458 contracts for the same period last year. Included in the deals exceeding $100,000, we closed 141 contracts that had total license and first year’s maintenance exceeding $250,000, compared to 114 contracts for the same period last year. Included in the deals exceeding $250,000, we closed 15 contracts that had total license and first year’s maintenance exceeding $1.0 million, compared to 11 contracts for the same period last year. Amounts invoiced to existing customers represented a larger share of total billings in 2013, approximately 75%, resulting from our “land and expand” sales strategy, compared to approximately 74% in 2012. Billings from our indirect partner channel for license and first year maintenance were approximately 57% of total license and first year maintenance billings for the year ended December 31, 2013 compared to approximately 54% for the same period in 2012. Maintenance revenues grew by 33.2% in the year ended December 31, 2013 compared to the year ended December 31, 2012 driven by annual maintenance renewal rates of approximately 90% and an increase in our customer base. Professional services revenue grew 33.2% in the year ended December 31, 2013 compared to the year ended December 31, 2012 due to growth in consulting and training revenue, resulting primarily from an increase in our customer base. The revenue growth in the year ended December 31, 2013 as compared to the year ended December 31, 2012 may not be indicative of our future revenue growth, if any.
57
Table of Contents
Cost of Revenue and Gross Profit
The following table sets forth cost of revenue for each revenue source:
| Year Ended December 31, | ||||||||||||||||||||||||
| 2013 | 2012 | |||||||||||||||||||||||
| Amount | Percentage of Related Revenue |
Amount | Percentage of Related Revenue |
Period to Period Change |
||||||||||||||||||||
| (dollars in thousands) | ||||||||||||||||||||||||
| Cost of Revenue: |
||||||||||||||||||||||||
| Cost of license revenue |
$ | 7,345 | 2.7 | % | $ | 5,058 | 2.1 | % | $ | 2,287 | 45.2 | % | ||||||||||||
| Cost of maintenance revenue |
10,585 | 6.6 | % | 8,526 | 7.1 | % | 2,059 | 24.1 | % | |||||||||||||||
| Cost of professional services revenue |
43,893 | 112.2 | % | 29,705 | 101.1 | % | 14,188 | 47.8 | % | |||||||||||||||
|
|
|
|
|
|
|
|||||||||||||||||||
| Total cost of revenue |
$ | 61,823 | 13.1 | % | $ | 43,289 | 11.1 | % | $ | 18,534 | 42.8 | % | ||||||||||||
|
|
|
|
|
|
|
|||||||||||||||||||
| Gross Profit: |
||||||||||||||||||||||||
| License revenue |
$ | 263,424 | 97.3 | % | $ | 233,616 | 97.9 | % | $ | 29,808 | 12.8 | % | ||||||||||||
| Maintenance revenue |
149,967 | 93.4 | % | 111,964 | 92.9 | % | 38,003 | 33.9 | % | |||||||||||||||
| Professional services revenue |
(4,764 | ) | -12.2 | % | (332 | ) | -1.1 | % | (4,432 | ) | 1334.9 | % | ||||||||||||
|
|
|
|
|
|
|
|||||||||||||||||||
| Total gross profit |
$ | 408,627 | 86.9 | % | $ | 345,248 | 88.9 | % | $ | 63,379 | 18.4 | % | ||||||||||||
|
|
|
|
|
|
|
|||||||||||||||||||
Cost of revenue was approximately $61.8 million for the year ended December 31, 2013 compared to approximately $43.3 million for the year ended December 31, 2012, an increase of approximately $18.5 million, or 42.8%. Total cost of revenue for the year ended December 31, 2013 compared to the year ended December 31, 2012 was negatively impacted as a result of foreign currency exchange rate fluctuations by approximately $0.6 million. Cost of license revenue largely consists of referral fees paid to third parties in connection with software license sales and the amortization of technology related intangible assets acquired. Referral fees increased approximately $1.5 million and amortization of intangible assets increased approximately $0.8 million for the year ended December 31, 2013 as compared to the year ended December 31, 2012. Cost of maintenance revenue increased approximately $2.0 million for the year ended December 31, 2013 as compared to the same period in 2012. In anticipation of continued growth in our current customer base, we increased headcount in our support organization which increased personnel costs by approximately $1.6 million (including a $0.1 million increase in stock-based compensation). In addition, we had an increase in other cost of maintenance revenue of approximately $0.4 million. Cost of professional services revenue increased approximately $14.2 million largely due to increased personnel costs of approximately $8.3 million (including a $1.0 million increase in stock-based compensation) for the year ended December 31, 2013 compared to the same period in 2012. In addition, we had an increase in outside contractor costs and other cost of professional services revenue of approximately $4.0 million, an increase in travel and entertainment costs of approximately $1.5 million and an increase in facility and infrastructure costs of approximately $0.4 million as we continue to invest in our services organization.
Total gross profit increased approximately $63.4 million, or 18.4%, for the year ended December 31, 2013 compared to the year ended December 31, 2012 largely due to an increase in total revenue of approximately $81.9 million, or 21.1%. The increase in our total gross profit during the year ended December 31, 2013 as compared to the year ended December 31, 2012 may not be indicative of our future gross profit. For the year ended December 31, 2013, total gross margin decreased to 86.9% from 88.9% for the year ended December 31, 2012. The decrease in our total gross margin from the prior year period is largely due to a decrease in the gross margin from professional services revenue compared to the prior year period as we continue to invest in our services organization. The total gross margin during the year ended December 31, 2013 as compared to the year ended December 31, 2012 may not be indicative of our future gross margin.
58
Table of Contents
Operating Expenses
The following table sets forth operating expenses as a percentage of revenue:
| Year Ended December 31, | ||||||||||||||||||||||||
| 2013 | 2012 | |||||||||||||||||||||||
| Amount | Percentage of Revenue |
Amount | Percentage of Revenue |
Period to Period Change |
||||||||||||||||||||
| (dollars in thousands) | ||||||||||||||||||||||||
| Operating expenses: |
||||||||||||||||||||||||
| Sales and marketing |
$ | 255,010 | 54.2 | % | $ | 211,314 | 54.4 | % | $ | 43,696 | 20.7 | % | ||||||||||||
| Research and development |
60,400 | 12.9 | % | 39,995 | 10.3 | % | 20,405 | 51.0 | % | |||||||||||||||
| General and administrative |
89,795 | 19.1 | % | 79,309 | 20.4 | % | 10,486 | 13.2 | % | |||||||||||||||
|
|
|
|
|
|
|
|
|
|
|
|
|
|||||||||||||
| Total operating expenses |
$ | 405,205 | 86.2 | % | $ | 330,618 | 85.1 | % | $ | 74,587 | 22.6 | % | ||||||||||||
|
|
|
|
|
|
|
|
|
|
|
|
|
|||||||||||||
Sales and Marketing. Sales and marketing expenses increased approximately $43.7 million, or 20.7% for the year ended December 31, 2013 as compared to the year ended December 31, 2012. Sales and marketing expenses for the year ended December 31, 2013 compared to the year ended December 31, 2012 were negatively impacted as a result of foreign currency exchange rate fluctuations by approximately $1.0 million. The year over year increase in sales and marketing expenses was primarily attributable to an increase in personnel and commission costs of approximately $33.2 million (including a $3.1 million increase in stock-based compensation), reflecting higher employee headcount and higher variable compensation resulting from increased license revenue. In addition, we had an increase in outside consulting costs and other sales and marketing costs of approximately $6.9 million, an increase of approximately $3.1 million in travel and entertainment costs and an increase in facility and infrastructure costs of approximately $0.5 million to support global expansion.
Research and Development. Research and development expenses increased by approximately $20.4 million or 51.0% during the year ended December 31, 2013 as compared to the year ended December 31, 2012. Research and development expenses for the year ended December 31, 2013 compared to the year ended December 31, 2012 were negatively impacted as a result of foreign currency exchange rate fluctuations by approximately $1.5 million. The year over year increase in research and development expenses was primarily attributable to higher personnel costs of approximately $19.1 million (including a $1.4 million increase in stock-based compensation) as we continued the development of the next generation of our software products. The increase in research and development expenses also reflects an increase in travel and entertainment costs of approximately $0.8 million as well as an increase in facility costs of approximately $0.5 million.
General and Administrative. General and administrative expenses were approximately $89.8 million for the year ended December 31, 2013 compared to approximately $79.3 million for the year ended December 31, 2012, an increase of approximately $10.5 million, or 13.2%. General and administrative expenses for the year ended December 31, 2013 compared to the year ended December 31, 2012 were negatively impacted as a result of foreign currency exchange rate fluctuations by approximately $0.6 million. The increase in general and administrative expenses for the year ended December 31, 2013 compared to the year ended December 31, 2012 was largely due to an increase in personnel costs of approximately $8.9 million (including a $4.0 million increase in stock-based compensation). Included in the increase in stock-based compensation expense is a charge of approximately $0.9 million related to the modification of certain common stock option awards of a former executive. In addition, we had an increase of approximately $2.1 million in information technology costs as we continued to expand our infrastructure to support anticipated global growth, an increase of approximately $1.1 million related to travel and entertainment due to the increase in the number of our general and administrative personnel and an increase in facility and infrastructure costs of approximately $0.6 million to support global expansion. These increases were offset by a decrease of approximately $2.2 million in legal and accounting fees and other general and administrative costs.
59
Table of Contents
Other Expense, net.
Other expense, net was approximately $2.5 million for the year ended December 31, 2013 compared to other expense, net of approximately $2.9 million for the year ended December 31, 2012. During the year ended December 31, 2013, we had foreign exchange losses and other expenses of approximately $2.7 million offset by net interest income of approximately $0.2 million. During the year ended December 31, 2012, we had foreign exchange losses of approximately $3.1 million offset by net interest income of approximately $0.2 million.
Provision for Income Taxes.
The effective tax rate for the year ended December 31, 2013 was 1208.8% compared to 67.3% in 2012. The effective tax rate increased primarily due to a decrease in pre-tax income from the prior year. Therefore, permanent differences and non-cash income tax charges, including the change in the valuation allowance and other reserves against tax assets, had a larger impact on the effective tax rate as a result of the lower level of pre-tax income in 2013. We operate in an international environment with significant operations in various locations outside the U.S.; accordingly, the consolidated income tax rate is a composite rate reflecting our income (loss) and the applicable tax rate in the various locations where we operate. During the years ended December 31, 2013 and 2012, the permanent differences and non-cash income tax charges related to changes in the valuation allowance and other reserves against tax assets increased the effective tax rate by 1071.9% and 45.6%, respectively.
Foreign Exchange Rates
We conduct business in our foreign operations in local currencies. Accordingly, our revenue and operating expense results presented above are affected by changes in foreign exchange rates. Income and expense accounts are translated at the average monthly exchange rates during the period.
Foreign currency exchange rate fluctuations negatively impacted total revenue for the year ended December 31, 2014 compared to the year ended December 31, 2013 by approximately $9.1 million, principally driven by the overall strengthening of the U.S. dollar relative to the foreign currencies in which we operate. Total cost of revenue and operating expenses for the year ended December 31, 2014 compared to the year ended December 31, 2013 were positively impacted as a result of foreign exchange rate fluctuations by approximately $6.9 million, principally driven by the overall strengthening of the U.S. dollar relative to the foreign currencies in which we operate.
Seasonality
Our quarterly results reflect seasonality in the sale of our products and services. Historically, we have experienced a pattern of increased license sales in the fourth quarter which can make it difficult to achieve sequential revenue growth in the first quarter. In addition, our European operations generally provide lower revenues in the summer months because of the generally reduced level of economic activity in Europe during those months. Similarly, our gross margins and income (loss) from operations have been affected by these historical trends because the majority of our expenses are relatively fixed in the near-term. The timing of revenues in relation to our expenses, much of which does not vary directly with revenue, has an impact on the cost of revenue, sales and marketing expense, research and development expense and general and administrative expense as a percentage of revenue in each calendar quarter during the year. The majority of our expenses is personnel-related and includes salaries, stock-based compensation, benefits and incentive-based compensation plan expenses. As a result, we have not experienced significant seasonal fluctuations in the timing of expenses from period to period, other than an increase in total operating expenses during the first quarter of each year as a result of our annual employee summit and an increase in sales and marketing expenses in the second quarter of each year due to our annual partner event. On a quarterly basis, we have usually generated the majority of our revenues in the final month of each quarter and a significant amount in the last two weeks of a quarter. We
60
Table of Contents
believe this is due to customer buying patterns typical in this industry. Although these seasonal factors are common in the technology sector, historical patterns should not be considered a reliable indicator of our future sales activity or performance.
Acquisitions
Vizubi
On December 23, 2014, we acquired all of the outstanding shares of Vizubi Software Srl, an Italian company, and all of the outstanding shares of Vizubi, Inc., a U.S. corporation (collectively “Vizubi”). Vizubi’s NPrinting product allows organizations to create visually-appealing reports with drag-and-drop simplicity, in a variety of popular formats, using data and analytics from QlikView. We purchased Vizubi for a total maximum purchase price of $21.3 million. We paid approximately $6.8 million to the sellers at closing. In addition, the preliminary purchase price includes approximately $2.8 million of deferred purchase price to be paid in first quarter of 2015. The total maximum purchase price also includes approximately $11.7 million of contingent consideration payable upon the achievement of certain product development milestones and financial targets as set forth in the purchase agreement governing the transaction. At the purchase date, we preliminarily estimated the fair value of the contingent consideration at approximately $9.0 million, and therefore, this amount was included in the preliminary purchase price. The results of operations and financial position of Vizubi are included in our consolidated financial statements from and after the date of acquisition. The inclusion of Vizubi did not have a material impact on our consolidated financial results for the year ended December 31, 2014. We preliminarily allocated approximately $9.6 million of the purchase price to finite-lived intangible assets, of which we estimated approximately $7.9 million was related to developed technology, approximately $1.3 million was related to customer relationships and approximately $0.4 million was related to trade name. The value assigned to Vizubi’s developed technology was determined by using the excess earnings method. Under this method, the value of the developed technology is a function of the estimated obsolescence curve of the developed technology as of the corresponding valuation date, the expected future net cash flows generated by the developed technology and the discount rate that reflects the level of risk associated with receiving future cash flows attributable to the developed technology. The fair value of the contingent consideration was determined using a discounted cash flow model. Under this model, the fair value of the contingent consideration is a function of the probability of achieving the milestones, the estimated achievement date of the milestones and the discount rate that reflects the level of risk associated with the liability. The identified finite intangible assets will be amortized over their estimated useful life. After preliminarily allocating the purchase price to the assets acquired and liabilities assumed based on an estimation of their fair values at the date of acquisition, we recorded goodwill of approximately $10.2 million related to this acquisition. Goodwill represents the excess of the purchase price over the net identifiable tangible and intangible assets acquired. We believe the goodwill related to the acquisition was a result of the expected synergies to be realized from combining operations and is not expected to be deductible for income tax purposes.
We are in the process of finalizing the purchase price allocation including the valuation of intangible assets acquired and liabilities assumed related to the acquisition. The items pending finalization include the valuation of acquired intangible assets, the assumed deferred revenue and the evaluation of deferred income taxes. We expect to complete this purchase price allocation during the first quarter of 2015.
DataMarket
On October 21, 2014, we acquired all of the outstanding shares of DataMarket ehf. (“DataMarket”), an Icelandic company. DataMarket specializes in the provisioning of data for analysis. We purchased DataMarket for a total maximum purchase price of $13.3 million. We paid approximately $11.5 million to the sellers at closing. In addition, the preliminary purchase price includes approximately $0.1 million of deferred purchase price to be paid in first quarter of 2015. The total maximum purchase price also includes approximately $1.7 million of contingent consideration payable upon the achievement of certain product development milestones and financial targets as set forth in the purchase agreement governing the transaction. At the purchase date, we
61
Table of Contents
estimated the fair value of the contingent consideration at approximately $1.6 million, and therefore, this amount was included in the preliminary purchase price. The results of operations and financial position of DataMarket are included in our consolidated financial statements from and after the date of acquisition. The inclusion of DataMarket did not have a material impact on our consolidated financial results for the year ended December 31, 2014. We allocated approximately $3.9 million of the purchase price to finite-lived intangible assets, of which approximately $2.8 million was related to developed technology, approximately $1.0 million was related to customer relationships and approximately $0.1 million was related to trade name. The value assigned to DataMarket’s developed technology was determined by using the excess earnings method. Under this method, the value of the developed technology is a function of the estimated obsolescence curve of the developed technology as of the corresponding valuation date, the expected future net cash flows generated by the developed technology and the discount rate that reflects the level of risk associated with receiving future cash flows attributable to the developed technology. We amortize the developed technology on a straight-line basis over an estimated useful life of eight years and we amortize the customer relationships and trade name on a straight-line basis over an estimated useful life of four years. The fair value of the contingent consideration was determined using a discounted cash flow model. Under this model, the fair value of the contingent consideration is a function of the probability of achieving the milestones, the estimated achievement date of the milestones and the discount rate that reflects the level of risk associated with the liability. After preliminarily allocating the purchase price to the assets acquired and liabilities assumed based on an estimation of their fair values at the date of acquisition, we recorded goodwill of approximately $9.9 million related to this acquisition. Goodwill represents the excess of the purchase price over the net identifiable tangible and intangible assets acquired. We believe the goodwill related to the acquisition was a result of the expected synergies to be realized from combining operations and is not expected to be deductible for income tax purposes.
We are in the process of finalizing the purchase price allocation including the valuation of intangible assets acquired and liabilities assumed related to the acquisition. The items pending finalization include the valuation of acquired intangible assets and the evaluation of deferred income taxes. We expect to complete this purchase price allocation during the first quarter of 2015.
QlikTech Italy
On October 3, 2013, we acquired the ongoing operations of our Italian master reseller (“QlikTech Italy”) that specializes in the distribution of QlikView software and provides maintenance and consulting services related to that software. We purchased QlikTech Italy for a total maximum purchase price of approximately 7.5 million euros (approximately $10.2 million based on an exchange rate of 1.355 on October 3, 2013). The total maximum purchase price included approximately $1.4 million of contingent consideration payable upon the achievement of certain revenue targets as set forth in the purchase agreement. At the purchase date, we estimated that approximately $0.2 million of contingent consideration would be payable based upon the achievement of certain revenue targets, and therefore, this amount was included in the preliminary purchase price. The results of operations and financial position of QlikTech Italy are included in our consolidated financial statements from and after the date of acquisition. The inclusion of QlikTech Italy did not have a material impact on our consolidated financial results for the year ended December 31, 2014 and 2013. Had the acquisition occurred as of the beginning of the periods presented in our consolidated financial statements, the pro forma statements of operations would not be materially different than the consolidated statements of operations presented.
During the three months ended March 31, 2014, we completed the purchase price allocation for QlikTech Italy. The adjustments from the preliminary purchase price allocation were immaterial.
NComVA
On May 2, 2013, we acquired all of the outstanding shares of NComVA AB (“NComVA”), a Swedish software company that specializes in advanced visualization technology, for a purchase price of approximately 70.4 million Swedish kronor (approximately $10.9 million based on an exchange rate of 0.155 at May 2, 2013). The acquisition of NComVA is expected to expand the use of our software products by providing expertise and
62
Table of Contents
capabilities in advanced visualization and analysis to pair with our associative approach to delivering a deeper understanding of data, especially when multiple data sources are analyzed together. The results of operations and financial position of NComVA are included in our consolidated financial statements from and after the date of acquisition. The inclusion of NComVA did not have a material impact on our consolidated financial results for the year ended December 31, 2013. We allocated approximately $7.3 million of the purchase price to finite-lived intangible assets, which consisted primarily of developed technology. The value assigned to NComVA’s developed technology was determined by using the excess earnings method. Under this method, the value of the developed technology is a function of the estimated obsolescence curve of the developed technology as of the corresponding valuation date, the expected future net cash flows generated by the developed technology and the discount rate that reflects the level of risk associated with receiving future cash flows attributable to the developed technology. We amortize the developed technology on a straight-line basis over an estimated useful life of five years. After allocating the purchase price to the assets acquired and liabilities assumed based on an estimation of their fair values at the date of acquisition, we recorded goodwill of approximately $5.1 million related to this acquisition. Goodwill represents the excess of the purchase price over the net identifiable tangible and intangible assets acquired. We believe the goodwill related to the acquisition was a result of the expected synergies to be realized from combining operations and is not expected to be deductible for income tax purposes.
The purchase price for the acquisition of NComVA was approximately $10.9 million. We paid approximately $4.9 million of the purchase price to the sellers at closing. In addition, the purchase price includes approximately $2.7 million of deferred purchase price, which is expected to be paid in July 2015, and up to approximately $3.3 million of contingent cash consideration, approximately $1.2 million of which was paid in October 2013 and approximately $2.1 million of which was paid in July 2014 upon the achievement of certain product development milestones. The range of undiscounted amounts we may be required to pay for the contingent cash consideration was estimated to be between zero and approximately $3.3 million. We estimated that the attainment of these product development milestones was considered highly probable on the purchase date. Accordingly, we included approximately $3.3 million of the contingent cash consideration within the purchase price.
Liquidity and Capital Resources
Our principal sources of liquidity are cash and cash equivalents and the on-going collection of our accounts receivable. As of December 31, 2014, we had cash and cash equivalents totaling approximately $244.0 million, net accounts receivable of approximately $203.8 million and working capital of approximately $238.8 million. Our cash and cash equivalents held domestically were approximately $144.6 million as of December 31, 2014. We believe that our cash and cash equivalents balances in the U.S. are currently sufficient to fund our U.S. operations. As of December 31, 2014, cash and cash equivalents held by foreign subsidiaries were approximately $99.4 million, which include undistributed earnings of foreign subsidiaries indefinitely invested outside of the U.S. of approximately $32.7 million. Except as required under U.S. tax law, we do not accrue for U.S. taxes on our undistributed earnings of foreign subsidiaries that have not been previously taxed since we intend to continue to invest such undistributed earnings outside of the U.S. If these funds are needed for our operations in the U.S., we would be required to accrue and, subsequent to the full utilization of our existing net operating loss carryforwards, pay U.S. taxes to repatriate these funds.
During 2014, approximately $11.5 million, net of cash acquired, was used for the acquisition of DataMarket and approximately $5.7 million, net of cash acquired, was used for the acquisition of Vizubi. Our capital expenditures for 2014 were approximately $13.0 million, comprised primarily of additional leasehold improvements, furniture and fixtures and computer equipment, as well as investments made in new enterprise resource planning system.
We believe that our existing cash and cash equivalents and our cash flow from operations will be sufficient to fund our operations and our capital expenditures for at least the next 12 months. Our future capital requirements will depend on many factors, including our rate of revenue growth, the expansion of our sales and marketing activities, the timing and extent of spending to support product development efforts and expansion into new territories, the timing of introductions of new software products and enhancements to existing software
63
Table of Contents
products and the continuing market acceptance of our software offerings. We may from time to time enter into agreements, arrangements or letters of intent regarding potential investments in, or acquisitions of, complementary businesses, applications or technologies. If we enter into these types of arrangements, it could require us to seek additional equity or debt financing sooner or in greater amounts than anticipated. Additional funds may not be available on terms favorable to us or at all.
The following table shows selected balance sheet data as well as our cash flows from operating activities, investing activities, and financing activities for the stated periods:
| December 31, 2014 |
December 31, 2013 |
|||||||
| (dollars in thousands) | ||||||||
| Cash and cash equivalents |
$ | 244,018 | $ | 227,693 | ||||
| Accounts receivable, net |
203,766 | 162,009 | ||||||
| Deferred revenue |
132,129 | 102,321 | ||||||
| Working capital |
238,753 | 224,485 | ||||||
| Year Ended December 31, | ||||||||||||
| 2014 | 2013 | 2012 | ||||||||||
| (dollars in thousands) | ||||||||||||
| Cash flow activities |
||||||||||||
| Net cash provided by operating activities |
$ | 35,598 | $ | 29,725 | $ | 27,692 | ||||||
| Net cash used in investing activities |
(30,265 | ) | (22,990 | ) | (21,126 | ) | ||||||
| Net cash provided by financing activities |
23,376 | 25,722 | 9,684 | |||||||||
Cash and Cash Equivalents
Our cash and cash equivalents at December 31, 2014 were held for working capital purposes and were invested primarily in bank deposits and money market accounts having less than 90 day maturities. We do not enter into investments for trading or speculative purposes. These balances could be impacted if the underlying depository institutions or the guarantors fail or could be subject to adverse conditions in the financial markets. We can provide no assurances that access to our funds will not be impacted by adverse conditions in the financial markets.
Cash Flows
Cash Provided by Operating Activities
Net cash provided by operating activities was approximately $35.6 million for the year ended December 31, 2014. We incurred non-cash expenses totaling approximately $61.2 million for the year ended December 31, 2014. Non-cash expenses primarily consisted of stock-based compensation expense, provisions for bad debt, net foreign currency losses, and depreciation and amortization expense. In addition, we incurred an excess tax benefit from stock-based compensation of approximately $6.4 million for the year ended December 31, 2014.
The change in certain assets and liabilities resulted in a net source of cash of approximately $5.4 million for the year ended December 31, 2014. Net cash provided by operating activities is driven by sales of our products. Collection of accounts receivable from the sale of our products is a significant component of our cash flows from operating activities, as is the change in deferred revenue related to these sales. In addition, net cash provided by operating activities reflects income tax payments made of approximately $11.1 million.
Net cash provided by operating activities was approximately $29.7 million for the year ended December 31, 2013. We incurred non-cash expenses totaling approximately $37.6 million for the year ended December 31, 2013. Non-cash expenses primarily consisted of stock-based compensation expense, provisions for bad debt, net foreign currency losses, and depreciation and amortization expense. We realized an excess tax benefit from stock-based compensation of approximately $4.0 million for the year ended December 31, 2013.
64
Table of Contents
The change in certain assets and liabilities resulted in a net source of cash of $6.1 million for the year ended December 31, 2013. Net cash provided by operating activities is driven by sales of our products. Collection of accounts receivable from product sales is a significant component of our cash flows from operating activities, as is the change in deferred revenue related to these sales. In addition, net cash provided by operating activities reflects income tax payments made of approximately $10.5 million.
Net cash provided by operating activities was approximately $27.7 million for the year ended December 31, 2012. We incurred non-cash expenses totaling approximately $26.6 million for the year ended December 31, 2012. Non-cash expenses primarily consisted of stock-based compensation expense, provisions for bad debt, net foreign currency losses, and depreciation and amortization expense. We realized an excess tax benefit from stock-based compensation of approximately $4.8 million for the year ended December 31, 2012.
The change in certain assets and liabilities resulted in a net source of cash of approximately $2.1 million for the year ended December 31, 2012. Net cash provided by operating activities is driven by sales of our products. Collection of accounts receivable from product sales is a significant component of our cash flows from operating activities, as is the change in deferred revenue related to these sales. In addition, net cash provided by operating activities reflects income tax payments made of approximately $2.7 million.
Cash Used in Investing Activities
Net cash used in investing activities was approximately $30.2 million for the year ended December 31, 2014. Cash used in investing activities for the year ended December 31, 2014, consisted of approximately $11.5 million, net of cash acquired, used for the acquisition of DataMarket and approximately $5.7 million, net of cash acquired, used for the acquisition of Vizubi. In addition, cash used in investing activities for the year ended December 31, 2014 consisted of approximately $13.0 million for capital expenditures related to leasehold improvements, furniture and fixtures, computer equipment and investments made in a new enterprise resource planning system as we continued to expand our infrastructure and workforce.
Net cash used in investing activities was approximately $23.0 million for the year ended December 31, 2013. Cash used in investing activities for the year ended December 31, 2013 included approximately $9.6 million for capital expenditures related to leasehold improvements, furniture and fixtures, computer equipment and investments made in a new enterprise resource planning system as we continued to expand our infrastructure and workforce. In addition, during the year ended December 31, 2013, we acquired the ongoing operations of QlikTech Italy which resulted in a use of cash of approximately $9.0 million and we acquired all of the outstanding shares of NComVA which resulted in a net use of cash of approximately $4.4 million.
Net cash used in investing activities was approximately $21.1 million for the year ended December 31, 2012. During the year ended December 31, 2012, we acquired Expressor which resulted in a use of cash of approximately $10.8 million. In addition, cash used in investing activities for the year ended December 31, 2012 included approximately $10.3 million for capital expenditures related to leasehold improvements and computer equipment as we continued to expand our infrastructure and workforce. During the year ended December 31, 2012, we began to occupy a new office in Winnersh, United Kingdom. During the year ended December 31, 2012, we incurred approximately $2.3 million of capital expenditures related to this new office space.
Cash Provided By Financing Activities
Net cash provided by financing activities was approximately $23.4 million for the year ended December 31, 2014. Net cash provided by financing activities included proceeds from the exercise of common stock options of approximately $19.2 million and an excess tax benefit from stock-based compensation of approximately $6.4 million. These proceeds were offset by payments on contingent consideration of approximately $1.9 million during the period for the achievement of certain product development milestones related to the May 2013 acquisition of NComVA AB and approximately $0.2 million during the period for the achievement of certain financial milestones related to the October 2013 acquisition of QlikTech Italy.
65
Table of Contents
Net cash provided by financing activities was approximately $25.7 million for the year ended December 31, 2013. Net cash provided by financing activities included proceeds from the exercise of common stock options of approximately $23.1 million and an excess tax benefit from stock-based compensation of approximately $4.0 million. These proceeds were offset by payments on contingent consideration of approximately $1.2 million for the achievement of certain product development milestones related to the acquisition of NComVA and payments on contingent consideration of approximately $0.2 million for the achievement of certain financial targets related to the acquisition of Syllogic Corporation in January 2010.
Net cash provided by financing activities was approximately $9.7 million for the year ended December 31, 2012. Net cash provided by financing activities for the year ended December 31, 2012 primarily resulted from the proceeds from the exercise of common stock options of approximately $5.5 million and an excess tax benefit from stock-based compensation of approximately $4.8 million. These proceeds were offset by payments under our subsidiaries’ lines of credit of approximately $0.4 million and payments on contingent consideration of approximately $0.2 million for the achievement of certain financial targets related to the acquisition of Syllogic Corporation in January 2010.
Non-GAAP Financial Measures
In order to supplement our audited consolidated financial statements presented in accordance with U.S. generally accepted accounting principles (“U.S. GAAP”), we use measures of non-generally accepted accounting principles (“Non-GAAP”) income (loss) from operations, Non-GAAP net income (loss), Non-GAAP net income (loss) per basic and diluted common share and constant currency. We believe that the Non-GAAP financial information provided can assist investors in understanding and assessing our on-going core operations and prospects for the future. This Non-GAAP financial information provides an additional tool for investors to use in comparing our financial results with other companies in our industry, many of which present similar Non-GAAP financial measures to investors. In addition, we believe that these Non-GAAP financial measures are useful to investors because they allow for greater transparency into the indicators used as a basis for our internal budgeting and operational decision making.
For the years ended December 31, 2014 and 2013, Non-GAAP income from operations is determined by taking GAAP income (loss) from operations and adding back stock-based compensation expense, employer payroll taxes on stock transactions, amortization of intangible assets and contingent consideration adjustments. Non-GAAP net income is determined by taking GAAP income (loss) before provision for income taxes and adding back stock-based compensation expense, employer payroll taxes on stock transactions, amortization of intangible assets and contingent consideration adjustments and the result is tax affected at an estimated long-term effective tax rate of 30%. We believe that the effective tax rate used in the Non-GAAP net income (loss) and related per diluted common share calculations are reasonable estimates of the long-term normalized effective tax rate under our global structure. We believe these adjustments provide useful information to both management and investors due to the following factors:
| • | Stock-based compensation. Although stock-based compensation is an important aspect of the compensation of our employees and executives, determining the fair value of the stock-based instruments involves a high degree of judgment and estimation and the expense recorded may bear little resemblance to the actual value realized upon the future exercise or termination of the related stock-based awards. Furthermore, unlike cash compensation, the value of stock-based compensation is determined using a complex formula that incorporates factors, such as market volatility, that are beyond our control. We believe it is useful to exclude stock-based compensation in order to better understand the long-term performance of our core business and to facilitate comparison of our results to those of peer companies. |
| • | Employer payroll taxes on stock transactions. The amount of employer payroll taxes on stock transactions is dependent on our stock price and other factors that are beyond our control and which we believe do not correlate to the operation of our business. |
66
Table of Contents
| • | Amortization of intangible assets. A portion of the purchase price of our acquisitions is generally allocated to intangible assets, such as intellectual property, and is subject to amortization. However, we do not acquire businesses on a predictable cycle. Additionally, the amount of an acquisition’s purchase price allocated to intangible assets and the term of its related amortization can vary significantly and are unique to each acquisition. Therefore, we believe that the presentation of Non-GAAP financial measures that adjust for the amortization of intangible assets provides investors and others with a consistent basis for comparison across accounting periods. |
| • | Contingent consideration adjustment. We periodically enter into business combinations which may contain contingent consideration arrangements. At each reporting date, we measure these contingent consideration liabilities at fair value until the contingencies are resolved. During the year ended December 31, 2014, a charge of approximately $0.2 million was recorded related to changes in the fair value of contingent consideration liabilities and is included in our consolidated statement of operations. We believe that these costs are generally non-recurring and do not correlate to the ongoing operation of our business. |
The following is a reconciliation of Non-GAAP income from operations, Non-GAAP net income and Non-GAAP net income per common share to the most comparable U.S. GAAP measure for the periods indicated (in thousands, except share and per share data):
| Year Ended December 31, |
||||||||
| 2014 | 2013 | |||||||
| Reconciliation of Non-GAAP Income from Operations: |
||||||||
| GAAP income (loss) from operations |
$ | (8,876 | ) | $ | 3,422 | |||
| Stock-based compensation expense |
36,032 | 28,918 | ||||||
| Employer payroll taxes on stock transactions |
2,493 | 1,410 | ||||||
| Contingent consideration adjustment |
170 | — | ||||||
| Amortization of intangibles |
3,029 | 2,485 | ||||||
|
|
|
|
|
|||||
| Non-GAAP income from operations |
$ | 32,848 | $ | 36,235 | ||||
|
|
|
|
|
|||||
| Reconciliation of Non-GAAP Net Income: |
||||||||
| GAAP net loss |
$ | (24,631 | ) | $ | (9,979 | ) | ||
| Stock-based compensation expense |
36,032 | 28,918 | ||||||
| Employer payroll taxes on stock transactions |
2,493 | 1,410 | ||||||
| Contingent consideration adjustment |
170 | — | ||||||
| Amortization of intangibles |
3,029 | 2,485 | ||||||
| Income tax adjustment (1) |
4,622 | 765 | ||||||
|
|
|
|
|
|||||
| Non-GAAP net income |
$ | 21,715 | $ | 23,599 | ||||
|
|
|
|
|
|||||
67
Table of Contents
| Year Ended December 31, | ||||||||
| 2014 | 2013 | |||||||
| Reconciliation of Non-GAAP Income per Share: |
||||||||
| Non-GAAP net income per common share — basic |
$ | 0.24 | $ | 0.27 | ||||
|
|
|
|
|
|||||
| Non-GAAP net income per common share — diluted |
$ | 0.24 | $ | 0.26 | ||||
|
|
|
|
|
|||||
| GAAP net income (loss) per common share — basic |
$ | (0.27 | ) | $ | (0.11 | ) | ||
|
|
|
|
|
|||||
| GAAP net income (loss) per common share — diluted |
$ | (0.27 | ) | $ | (0.11 | ) | ||
|
|
|
|
|
|||||
| Non-GAAP weighted average number of common shares outstanding — basic |
89,886,403 | 87,702,222 | ||||||
|
|
|
|
|
|||||
| Non-GAAP weighted average number of common shares outstanding — diluted |
90,848,678 | 89,272,353 | ||||||
|
|
|
|
|
|||||
| GAAP weighted average number of common shares outstanding — basic |
89,886,403 | 87,702,222 | ||||||
|
|
|
|
|
|||||
| GAAP weighted average number of common shares outstanding — diluted |
89,886,403 | 87,702,222 | ||||||
|
|
|
|
|
|||||
| (1) | Income tax adjustment is used to adjust the U.S. GAAP provision for income taxes to a Non-GAAP provision (benefit) for income taxes by taking U.S. GAAP income (loss) before provision for income taxes and adding back (1) stock-based compensation expense, (2) employer payroll taxes on stock transactions, (3) amortization of intangible assets and (4) contingent consideration adjustment and applying an estimated long-term tax rate of 30%. |
The following table reflects the impact of changes in foreign currency exchange rates from the prior year periods on the reported amounts of total revenue for the year ended December 31, 2014. To determine the revenue growth rates on a constant currency basis for the year ended December 31, 2014, revenue from entities reporting in foreign currencies was translated into U.S. dollars using the comparable prior year period’s foreign currency exchange rates.
| Year Ended December 31, | ||||||||||||
| 2014 | 2013 | % change | ||||||||||
| (unaudited) | ||||||||||||
| Constant currency reconciliation: |
||||||||||||
| Total revenue, as reported |
$ | 556,797 | $ | 470,450 | 18 | % | ||||||
| Estimated impact of foreign currency fluctuations |
2 | % | ||||||||||
|
|
|
|||||||||||
| Total revenue constant currency growth rate |
20 | % | ||||||||||
|
|
|
|||||||||||
Critical Accounting Policies and Estimates
We prepare our consolidated financial statements in accordance with U.S. GAAP. The preparation of consolidated financial statements also requires us to make estimates and assumptions that affect the reported amounts of assets, liabilities, revenue, costs and expenses, and related disclosures. We base our estimates on historical experience and on various other assumptions that we believe to be reasonable under the circumstances. Actual results could differ significantly from the estimates made by our management. To the extent that there are differences between our estimates and actual results, our future financial statement presentation, financial condition, results of operations, and cash flows will be affected. We believe that these accounting policies are
68
Table of Contents
critical to understanding our historical and future performance, as these policies relate to the more significant areas involving management’s judgments and estimates. There were no material changes to our critical accounting policies and use of estimates during the year ended December 31, 2014.
Revenue Recognition
We derive substantially all of our revenue from three sources: (i) license revenues; (ii) maintenance revenues; and (iii) professional services revenues. The majority of license revenue is from the sale of perpetual licenses to customers or resellers. Maintenance, which generally has a contractual term of 12 months, includes telephone and web-based support and rights to software updates and upgrades on a when-and-if-available basis. Professional services include training, implementation, consulting and expert services.
For each arrangement, we recognize revenue when (a) persuasive evidence of an arrangement exists, such as a signed contract or purchase order; (b) delivery of the product has occurred and there are no remaining obligations or substantive customer acceptance provisions; (c) the fee is fixed or determinable; and (d) collection of the fee is deemed reasonably assured. Delivery is considered to have occurred upon electronic transfer of the license key that provides immediate availability of the product to the purchaser.
As substantially all of our software licenses are sold in multiple-element arrangements that include either maintenance or both maintenance and professional services, we use the residual method to determine the amount of license revenue to be recognized. Under the residual method, consideration is allocated to undelivered elements based upon vendor-specific objective evidence (“VSOE”) of the fair value of those elements, with the residual of the arrangement fee allocated to and recognized as license revenue. We have established VSOE of the fair value of maintenance through independent maintenance renewals, which demonstrate a consistent relationship of maintenance pricing as a percentage of the contractual license fee, and for new products for which renewals have not yet occurred, we have established VSOE of maintenance based on prices established by management with relevant authority. Maintenance revenue is deferred and recognized ratably over the contractual period of the maintenance arrangement, which is generally 12 months. Arrangements that include other professional services are evaluated to determine whether those services are essential to the functionality of other elements of the arrangement. We have determined that these services are not considered essential and the amounts allocated to the services are recognized as revenue when the services are performed. The VSOE of the fair value of our professional services is based on the price for these same services when they are sold separately. Revenue for services that are sold either on a stand-alone basis or included in multiple-element arrangements is recognized as the services are performed.
Certain of our license arrangements include license remix rights which allow the customer to change or alternate its use of our software products after those software products have been delivered to the customer. Under these arrangements, the customer has the right to deploy and use at least one copy of each licensed product, and the cumulative value of all products in use cannot exceed the total license fee. Assuming all other revenue recognition criteria have been met, we recognize revenue under these arrangements upon delivery of the first license key of each product eligible for remix under the arrangement.
For sales made through resellers, we recognize revenue upon the delivery of the license key only if those resellers provide us, at the time of placing their order, with the identity of the end-user customer to whom the product has been sold. Resellers do not carry inventory of our software products and, generally, do not have the right to return our software products. Sales made through resellers are evidenced by a reseller agreement, together with purchase orders on a transaction-by-transaction basis.
We also sell software licenses to original equipment manufacturers (“OEMs”) who integrate our software products for distribution with their applications. We do not offer any rights to return products sold to OEM’s. The OEM’s end-user customer is licensed to use our software products solely in conjunction with the OEM’s application. In OEM arrangements, license key delivery is required as the basis for revenue recognition. We recognize revenue under its OEM arrangements when (a) persuasive evidence of an arrangement exists, such as a
69
Table of Contents
signed contract or purchase order; (b) delivery of the product has occurred and there are no remaining obligations or substantive customer acceptance provisions; (c) the fee is fixed or determinable; and (d) collection of the fee is deemed reasonably assured.
We record taxes collected on revenue-producing activities on a net basis.
We do not offer specified upgrades or incrementally significant discounts. We record advance payments as deferred revenues until the product is shipped, services are delivered or obligations are met and the revenue can be recognized. Deferred revenues represent the excess of amounts invoiced or paid over amounts recognized as revenues. Deferred revenues to be recognized as revenues within the next twelve months have been classified as current liabilities and deferred revenues to be recognized as revenues beyond the next twelve months have been classified as non-current liabilities. Any contingencies, such as rights of return, conditions of acceptance, and warranties are accounted for as a separate element. The effect of accounting for these contingencies included in revenue arrangements has not been material.
Stock-Based Compensation
Our stock-based compensation is as follows:
| Year Ended December 31, | ||||||||||||
| 2014 | 2013 | 2012 | ||||||||||
| (in thousands) | ||||||||||||
| Cost of revenue |
$ | 2,804 | $ | 2,854 | $ | 1,651 | ||||||
| Sales and marketing |
17,911 | 13,374 | 10,337 | |||||||||
| Research and development |
3,876 | 3,386 | 2,058 | |||||||||
| General and administrative |
11,441 | 9,304 | 5,269 | |||||||||
|
|
|
|
|
|
|
|||||||
| $ | 36,032 | $ | 28,918 | $ | 19,315 | |||||||
|
|
|
|
|
|
|
|||||||
Common Stock Options and SSARs
For the years ended December 31, 2014, 2013 and 2012, we calculated the fair value of common stock options and SSARs granted using the Black-Scholes pricing model with the following assumptions:
| Year Ended December 31, | ||||||
| 2014 | 2013 | 2012 | ||||
| Expected dividend yield.. |
0.0% | 0.0% | 0.0% | |||
| Risk-free interest rate. |
1.5 - 1.8% | 0.9 - 1.7% | 0.8 - 1.2% | |||
| Expected volatility |
41.8 - 44.9% | 46.6 - 47.7% | 46.7 - 47.5% | |||
| Expected term (all other grants, in years). |
5.16 - 5.36 | 5.19 - 6.25 | 6.25 | |||
We use the Black-Scholes option-pricing model to value common stock option awards and SSARs. The Black-Scholes option-pricing model requires the input of subjective assumptions, including the expected term of the stock-based compensation awards and stock price volatility. We use blended volatility to estimate expected volatility. Blended volatility includes a weighting of our historical volatility from the date of our IPO to the respective grant date and an average of our peer group historical volatility consistent with the expected term of the common stock option and SSARs. Our peer group volatility includes the historical volatility of certain companies that share similar characteristics in terms of revenue size and industry. We expect to continue to use a larger proportion of our own stock price volatility in future periods as we develop additional experience of our own common stock price fluctuations considered in relation to the expected term of the common stock option and SSARs. For common stock options granted prior to the third quarter of 2013, we based the expected term on the simplified method. Beginning in the third quarter of 2013, we began using our historical activity related to common stock option exercises and post-vesting forfeitures in order to estimate the expected term of our
70
Table of Contents
common stock option awards, as we believe we now have a sufficient amount of experience to provide a reasonable basis for the calculation of the expected term. This change in estimate did not have a material impact on the results of operations for 2014 or 2013. The risk-free interest rate used to value common stock option awards is based on the U.S. Treasury yield curve with a remaining term equal to the expected term assumed at the grant date. The assumptions used in calculating the fair value of stock-based compensation awards represent management’s best estimate and involve inherent uncertainties and the application of management judgment. As a result, if factors change and we use different assumptions, stock-based compensation expense could be materially different in the future.
Following our IPO, we established a policy of using the closing sale price per share of our common stock as quoted on NASDAQ on the date of grant for purposes of determining the exercise price per share of our options to purchase common stock.
For all common stock options and SSARs, we recognize expense over the requisite service period using the straight-line method. In addition to the assumptions used to calculate the fair value of common stock options and SSARs, we are required to estimate the expected forfeiture rate of all stock-based awards and only recognize expense for those awards expected to vest. The estimation of the number of common stock awards that will ultimately vest requires judgment, and to the extent actual results or updated estimates differ from our current estimates, such amounts will be recorded as a cumulative adjustment in the period in which estimates are revised. We consider many factors when estimating expected forfeitures, including types of awards, employee class and an analysis of our historical and known forfeitures on existing awards. During the period in which the awards vest, we will record additional expense if the actual forfeiture rate is lower than estimated and a recovery of expense if the actual forfeiture rate is higher than estimated.
As of December 31, 2014, there was approximately $48.4 million of unrecognized stock-based compensation expense, net of estimated forfeitures, related to non-vested employee and non-employee director common stock option awards and SSARs that we expect to recognize over a weighted-average period of approximately 2.5 years.
Based upon the closing price of our common stock on December 31, 2014 of $30.89, the aggregate intrinsic value of common stock options outstanding as of December 31, 2014 was approximately $81.8 million, of which approximately $49.5 million related to vested common stock options and approximately $32.3 million related to unvested common stock options. Based upon the closing price of our common stock on December 31, 2014 of $30.89, the aggregate intrinsic value of SSARs outstanding at December 31, 2014 was approximately $0.7 million, of which approximately $0.1 million related to vested SSARs and approximately $0.6 million related to unvested SSARs.
Restricted Stock Units
The fair value of a restricted stock unit is determined by using the closing price of our common stock on the date of grant. A restricted stock unit award entitles the holder to receive shares of our common stock as the award vests, which is generally based on length of service. Stock-based compensation expense related to restricted stock unit awards is amortized on a straight-line basis over the vesting period.
As of December 31, 2014, there was approximately $17.8 million of total unrecognized compensation cost, net of estimated forfeitures, related to the unvested restricted stock unit awards. The remaining cost is expected to be recognized over a weighted-average period of approximately 2.8 years.
Maximum Value Stock-settled Stock Appreciation Rights
The estimated fair value of a MVSSSAR is determined by utilizing a lattice model under the option-pricing method. MVSSSARs contain a predetermined cap on the maximum stock price at which point the instrument must be exercised. At exercise, employees holding MVSSSARs will receive shares of our common stock with a value equal to the difference between the exercise price and the current market price per share of our common
71
Table of Contents
stock, subject to a predetermined cap. The exercise price of MVSSSARs is determined by using the closing price of our common stock on the date of grant. Vesting is based on length of service. Stock-based compensation expense related to MVSSSARs is amortized on a straight-line basis over the vesting period. The fair value of MVSSSARs is determined by utilizing a lattice model under the option-pricing method. The key inputs to the lattice model are the current price of our common stock, the fair value of our common stock at date of grant, the maximum fair value at which the MVSSSARs must be exercised, the vesting period, the contractual term, the volatility, the risk-free interest rate, the employment termination rate and assumptions with respect to early exercise behavior.
As of December 31, 2014, there was approximately $4.8 million of total unrecognized compensation cost related to unvested MVSSSARs. The remaining cost is expected to be recognized over a weighted-average period of approximately 2.5 years.
Based upon the closing price of our common stock on December 31, 2014 of $30.89, the aggregate intrinsic value of MVSSSARs outstanding as of December 31, 2014 was approximately $6.9 million, of which approximately $1.1 million related to vested MVSSSARs and approximately $5.8 million related to unvested MVSSSARs.
Research and Development Expense for Software Products
Software development costs are generally expensed as incurred until technological feasibility has been established, at which time such costs are capitalized to the extent that the capitalizable costs do not exceed the realizable value of such costs, until the product is available for general release to customers. Based on our product development process, technological feasibility is established upon the completion of a working model of the software product that has been tested to be consistent with the product design specifications and that is free of any uncertainties related to high-risk development issues. Costs incurred by us between completion of the working model and the point at which the product is ready for general release have been insignificant. Accordingly, we generally charge all such costs to research and development expense.
Income Taxes
We recognize deferred tax assets and liabilities for the expected future tax consequences of temporary differences between the respective financial statement carrying amounts of existing assets and liabilities and their respective tax bases and operating loss and tax credit carry forwards. For the year ended December 31, 2014, our tax provision consists principally of foreign current income taxes and approximately $8.1 million of charges related to valuation allowances. For the year ended December 31, 2013, our tax provision consists principally of foreign current income taxes and approximately $2.2 million of charges related to valuation allowances.
We continue to assess the realizability of our deferred tax assets. In assessing the realizability of these deferred tax assets, management considers whether it is more-likely-than-not that some portion or all of the deferred tax assets will be realized in the near term. We establish valuation allowances when necessary to reduce deferred tax assets to the amounts expected to be realized. The factors used to assess the likelihood of realization include our latest forecast of future taxable income and available tax planning strategies that could be implemented to realize the net deferred tax assets. As of December 31, 2014 and 2013, our deferred tax assets had a valuation allowance of approximately $22.0 million and approximately $15.3 million, respectively, as a result of the unrealizability of those assets.
As of December 31, 2014, we have approximately $6.4 million of U.S. federal net operating loss carry forwards, approximately $23.1 million of state net operating loss carry forwards and approximately $23.0 million of foreign net operating loss carry forwards. The majority of these foreign net operating losses carry forward indefinitely. The net operating loss in the U.S. will expire, if unused, in 2031. We also have approximately $2.3 million of federal tax credits that will expire, if unused, between 2017 and 2020.
Utilization of U.S. federal and state net operating loss carry forwards may be subject to limitations under Section 382 of the Internal Revenue Code of 1986 due to ownership change limitations that may have occurred
72
Table of Contents
previously or that could occur in the future. These ownership changes may limit the amount of net operating loss carry forwards that can be utilized annually to offset future taxable income. We have not completed a study to assess whether ownership changes have occurred. There also could be additional ownership changes in the future which may result in additional limitations of these net operating loss carry forwards.
In addition to the aforementioned net operating loss carry forwards, we have approximately $127.9 million in cumulative income tax deductions from the exercise of common stock options and the vesting of restricted stock units, which have expiration periods beginning in 2030. The income tax benefit for these carryforwards will be recorded in additional paid-in-capital when realized. Since we were able to reduce actual cash income taxes for U.S. federal and state purposes and in certain foreign jurisdictions, the realization of approximately $6.4 million, $4.0 million and $4.8 million of income tax savings was recognized as a benefit to additional paid-in-capital during the years ended December 31, 2014, 2013 and 2012, respectively.
We use a more-likely-than-not recognition threshold based on the technical merits of tax positions taken. Tax positions that meet the more-likely-than-not recognition threshold are measured as the largest amount of the tax benefits, determined on a cumulative probability basis, which is more-likely-than-not to be realized upon ultimate settlement in the financial statements. We recognize interest and penalties related to income tax matters in the provision for income taxes. At December 31, 2014 and 2013, our reserve for uncertain tax positions was approximately $1.5 million and $2.3 million, respectively.
We identify, evaluate and measure all uncertain tax positions taken or to be taken on tax returns and to record liabilities for the amount of these positions that may not be sustained, or may only partially be sustained, upon examination by the relevant taxing authorities. Although we believe that our estimates and judgments were reasonable, actual results may differ from these estimates. Some or all of these judgments are subject to review by the taxing authorities.
Our annual provision for income taxes and the determination of the resulting deferred tax assets and liabilities involve a significant amount of management judgment. Management’s judgments, assumptions and estimates relative to the current provision for income tax take into account current tax laws, our interpretation of current tax laws and possible outcomes of current and future audits conducted by foreign and domestic tax authorities. We operate within federal, state and international taxing jurisdictions and are subject to audit in these jurisdictions. These audits can involve complex issues which may require an extended period of time to resolve.
We expect the earnings of our foreign subsidiaries will continue to be reinvested indefinitely. Accordingly, at December 31, 2014, no provision has been made for U.S. federal and state income taxes of these foreign earnings of approximately $32.7 million. Upon distribution of these earnings, in the form of dividends or otherwise, we may be subject to U.S. income taxes and foreign withholding taxes. The determination of the amount of unrecognized deferred U.S. income tax liability on these earnings is not practicable because of the complexities with the hypothetical calculations.
Contractual Obligations and Commitments
The following table summarizes our contractual obligations at December 31, 2014 and the effect such obligations are expected to have on our liquidity and cash flow in future periods.
| Payment Due by Period | ||||||||||||||||||||
| Total | Less Than 1 Year | 1 to 3 Years | 3 to 5 Years | Thereafter | ||||||||||||||||
| (dollars in thousands) | ||||||||||||||||||||
| Operating lease obligations |
$ | 73,224 | $ | 16,662 | $ | 27,407 | $ | 19,406 | $ | 9,749 | ||||||||||
| Other obligations |
19,430 | 13,192 | 6,238 | — | — | |||||||||||||||
|
|
|
|
|
|
|
|
|
|
|
|||||||||||
| Total contractual obligations |
$ | 92,654 | $ | 29,854 | $ | 33,645 | $ | 19,406 | $ | 9,749 | ||||||||||
|
|
|
|
|
|
|
|
|
|
|
|||||||||||
We generally do not enter into long-term minimum purchase commitments. Our principal commitments consist of obligations under facility leases for office space.
73
Table of Contents
In June 2012, we entered into a software licensing agreement with a third party vendor. The minimum term of the agreement continues through June 30, 2017. As of December 31, 2014, we made payments of approximately $4.3 million pursuant to the agreement. As of December 31, 2014, payments totaling approximately $1.8 million are payable under this software licensing agreement through December 2016. In December 2013, we entered into another software licensing agreement with a third party vendor. The minimum term of the agreement continues through January 14, 2017. As of December 31, 2014, we made payments of approximately $3.7 million pursuant to the agreement. As of December 31, 2014, payments totaling approximately $7.4 million are payable under this software licensing agreement through January 2017. These amounts under both software licensing agreements are included in “other obligations” in the table above.
We have obligations related to unrecognized tax benefit liabilities totaling approximately $1.5 million, which have been excluded from the tables above as we do not think it is practicable to make reliable estimates of the periods in which payment for these obligations will be made. However, the following table estimates when these obligations will expire. See Note 7 of our notes to the consolidated financial statements.
| Expiration by Period | ||||||||||||||||||||
| Total | Less Than 1 Year | 1 to 3 Years | 3 to 5 Years | Thereafter | ||||||||||||||||
| (dollars in thousands) | ||||||||||||||||||||
| Unrecognized Tax Benefit Liabilities |
$ | 1,466 | $ | 103 | $ | 130 | $ | 456 | $ | 777 | ||||||||||
Off-Balance Sheet Arrangements
We have no off-balance sheet arrangements other than those that are discussed above.
Inflation
Normally, inflation does not have a significant impact on our operations as our products and services are not generally sold on long-term contracts. Consequently, we can adjust our selling prices, to the extent permitted by competition, to reflect cost increases caused by inflation.
Recent Accounting Pronouncements
From time to time, new accounting pronouncements are issued by the Financial Accounting Standards Board (“FASB”) or other standard setting bodies that are adopted by us as of the specified effective date. Unless otherwise discussed, we believe that the impact of recently issued standards that are not yet effective will not have a material impact on our financial position or consolidated results of operations upon adoption.
In May 2014, the FASB issued Accounting Standards Update No. 2014-09, Revenue from Contracts with Customers: Topic 606 (ASU 2014-09), to supersede nearly all existing revenue recognition guidance under U.S. GAAP. The core principle of ASU 2014-09 is to recognize revenues when promised goods or services are transferred to customers in an amount that reflects the consideration that is expected to be received for those goods or services. ASU 2014-09 defines a five step process to achieve this core principle and, in doing so, it is possible more judgment and estimates may be required within the revenue recognition process than required under existing U.S. GAAP. ASU 2014-09 is effective for us beginning on January 1, 2017 using either of two methods: (i) retrospective to each prior reporting period presented with the option to elect certain practical expedients as defined within ASU 2014-09; or (ii) retrospective with the cumulative effect of initially applying ASU 2014-09 recognized at the date of initial application and providing certain additional disclosures as defined per ASU 2014-09. We have not yet selected a transition method and we are currently evaluating the impact of adopting ASU 2014-09 on our consolidated financial statements.
In August 2014, the FASB issued Accounting Standards Update No. 2014-15, Disclosure of Uncertainties about an Entity’s Ability to Continue as a Going Concern (ASU 2014-15), to provide guidance on management’s responsibility in evaluating whether there is substantial doubt about a company’s ability to continue as a going concern and to provide related footnote disclosures. ASU 2014-15 is effective for us beginning in the first quarter of 2016 with early adoption permitted. The adoption of this standard is not expected to have a material impact on our consolidated financial statements.
74
Table of Contents
| ITEM 7A. | QUANTITATIVE AND QUALITATIVE DISCLOSURES ABOUT MARKET RISK |
Market risk represents the risk of loss that may impact our financial position due to adverse changes in financial market prices and rates. Our market risk exposure is primarily a result of fluctuations in foreign currency exchange rates. We do not hold financial instruments for trading purposes.
Market Risk
We are exposed to certain financial risks, including fluctuations in foreign currency exchange rates and interest rates. We manage our exposure to these market risks through internally established policies and procedures. Our policies do not allow speculation in derivative instruments for profit or execution of derivative instrument contracts for which there are no underlying exposures. We do not use financial instruments for trading purposes and we are not a party to any leveraged derivatives. We monitor our underlying market risk exposures on an ongoing basis and, where appropriate, may use hedging strategies to mitigate these risks.
Interest Rate Sensitivity
We had cash and cash equivalents of approximately $244.0 million at December 31, 2014 and approximately $227.7 million at December 31, 2013. We held these amounts in cash or money market funds.
We hold cash and cash equivalents for working capital purposes. We do not have material exposure to market risk with respect to investments, as our investments consist primarily of highly liquid investments purchased with original maturities of three months or less. We do not use derivative financial instruments for speculative or trading purposes; however, we may adopt specific hedging strategies in the future. Any declines in interest rates, however, will reduce future interest income.
Foreign Exchange Risk
We market our products in the Americas, Europe, the Asia-Pacific Regions, and Africa and largely develop our products in Europe and the U.S. As a result of our business activities in foreign countries, our financial results could be affected by factors such as changes in foreign currency exchange rates or economic conditions in foreign markets, and there is no assurance that foreign currency exchange rate fluctuations will not harm our business in the future. We sell our products in certain countries in the local currency of the respective country. There is a risk that we will have to adjust local currency product pricing due to the competitive pressure when there has been significant volatility in foreign exchange rates. In addition, a vast majority of our product development activities are principally based at our facility in Lund, Sweden. This provides some natural hedging because most of our subsidiaries’ operating expenses are denominated in their local currencies. Regardless of this natural hedging, our results of operations may be adversely impacted by the foreign exchange rate fluctuation. We will continue to monitor our exposure to foreign currency fluctuations and, at times, we may use financial hedging techniques to minimize the effect of these fluctuations. We may choose not to continue to hedge certain foreign exchange exposure for a variety of reasons, including accounting considerations and the prohibitive economic cost of hedging particular exposure.
During the year ended December 31, 2014, we began using derivative instruments, specifically, short-term foreign currency forward contracts to hedge certain exposures to fluctuations in foreign currency exchange rates. We use these short-term foreign currency forward contracts to manage foreign currency exchange rate risks related to certain intercompany borrowings that are utilized to fund operations. We execute these short-term foreign currency forward contracts with financial institutions that hold an investment grade credit rating. These short-term foreign currency forward contracts do not meet the requirements for hedge accounting, and are recorded on our consolidated balance sheet as either an asset or liability measured at fair value at the balance sheet date.
75
Table of Contents
As of December 31, 2014, we had one short-term foreign currency forward contract outstanding to sell Swedish kronor with a notional value of $107.0 million U.S. dollars. As of December 31, 2014, the unrealized loss on our short-term foreign currency forward contract was approximately $0.9 million and is recorded within accrued expenses on the consolidated balance sheet. At December 31, 2013, we had no foreign currency forward contracts outstanding.
For the year ended December 31, 2014, the consolidated statement of operations reflects a gain of approximately $9.4 million, within foreign exchange losses, net, related to short-term foreign currency forward contracts. During the years ended December 31, 2013 and 2012, there was no impact in the consolidated statements of operations related to foreign currency forward contracts. Cash flows received or paid in connection with the settlement of short-term foreign currency forward contracts are included in cash flows from operating activities in the period in which the short-term foreign currency forward contracts are settled.
Foreign exchange risk exposures arise from transactions denominated in a currency other than our functional currency and from foreign denominated revenue and profit translated into U.S. dollars. Approximately 69% of our revenues for the year ended December 31, 2014 were earned in foreign denominated currencies other than the U.S. dollar. Approximately 70% of our revenues for the years ended December 31, 2013 and 2012 were earned in foreign denominated currencies other than the U.S. dollar. The principal foreign currencies in which we conduct business are the euro, the Swedish kronor and the British pound. The translation of currencies in which we operate into the U.S. dollar may affect consolidated revenues and gross profit margins as expressed in U.S. dollars. We seek to manage our foreign exchange risk in part through operational means, including managing same-currency revenues in relation to same-currency costs and same-currency assets in relation to same-currency liabilities. As we operate in multiple foreign currencies, changes in those currencies relative to the U.S. dollar will impact our revenues and expenses. If the U.S. dollar weakens against a specific foreign currency, our revenues will increase having a positive impact on net income, and our overall expenses will increase, having a negative impact on net income. Likewise, if the U.S. dollar strengthens against a specific foreign currency, our revenues will decrease having a negative impact on net income, and our overall expenses will decrease, having a positive impact on net income. Therefore, significant shifts in foreign currencies can impact our short-term results, as well as our long-term forecasts and targets.
Our actual future gains and losses may differ materially due to the inherent limitations with the timing and amount of changes in foreign currency exchange rates and our actual exposure and positions.
| ITEM 8. | FINANCIAL STATEMENTS AND SUPPLEMENTARY DATA |
Our consolidated financial statements are submitted on pages F-1 through F-34 of this report.
| ITEM 9. | CHANGES IN AND DISAGREEMENTS WITH ACCOUNTANTS ON ACCOUNTING AND FINANCIAL DISCLOSURE |
None.
| ITEM 9A. | CONTROL AND PROCEDURES |
| (a) | Evaluation of Disclosure and Control Procedures |
Our management, with the participation of our Chief Executive Officer and Chief Financial Officer, evaluated the effectiveness of our disclosure controls and procedures (as defined in Rules 13a-15(e) and 15d-15(e) under the Securities Exchange Act of 1934, as amended) as of December 31, 2014, the end of the period covered by this Annual Report on Form 10-K. Based on that evaluation, our Chief Executive Officer and Chief Financial Officer concluded that, as of December 31, 2014, our disclosure controls and procedures were effective to provide reasonable assurance that information required to be disclosed by us in reports that we file or submit under the Securities Exchange Act of 1934, as amended, is recorded, processed, summarized and reported within
76
Table of Contents
the time periods specified in the SEC’s rules and forms, and include controls and procedures designed to ensure that the information required to be disclosed by us in such reports is accumulated and communicated to our management, including our Chief Executive Officer and Chief Financial Officer, as appropriate, to allow timely decisions regarding required disclosures.
Our management, including our Chief Executive Officer and Chief Financial Officer, does not expect that our disclosure controls and procedures will prevent or detect all errors and all fraud. While our disclosure controls and procedures are designed to provide reasonable assurance of their effectiveness, because of the inherent limitations in all control systems, no evaluation of controls can provide absolute assurance that all control issues and instances of fraud, if any, within our company have been detected.
| (b) | Management’s Annual Report on Internal Control over Financial Reporting |
Our management is responsible for establishing and maintaining adequate internal control over financial reporting. Under the supervision and with the participation of our management, including our Chief Executive Officer and Chief Financial Officer, we assessed the effectiveness of our internal control over financial reporting as of the end of the period covered by this report based on the framework in “Internal Control — Integrated Framework” issued by the Committee of Sponsoring Organizations of the Treadway Commission (2013 framework). Based on that assessment, our Chief Executive Officer and Chief Financial Officer concluded that our internal control over financial reporting is effective to provide reasonable assurance regarding the reliability of our financial reporting and the preparation of the financial statements for external purposes in accordance with U.S. GAAP, as of December 31, 2014.
Ernst & Young LLP, the independent registered public accounting firm that audited our Consolidated Financial Statements included in this Annual Report on Form 10-K, has issued an attestation report on our internal control over financial reporting which is included below.
| (c) | Changes in Internal Control over Financial Reporting |
There were no changes in our internal control over financial reporting during the fourth quarter of 2014, which were identified in connection with management’s evaluation required by paragraph (d) of Rules 13a-15 and 15d-15 under the Exchange Act, that have materially affected, or are reasonably likely to materially affect, our internal control over financial reporting.
77
Table of Contents
Report of Independent Registered Public Accounting Firm on Internal Control over Financial Reporting
The Board of Directors and Stockholders of Qlik Technologies Inc.:
We have audited Qlik Technologies Inc.’s internal control over financial reporting as of December 31, 2014, based on criteria established in Internal Control — Integrated Framework issued by the Committee of Sponsoring Organizations of the Treadway Commission (2013 framework), (the COSO criteria). Qlik Technologies Inc.’s management is responsible for maintaining effective internal control over financial reporting, and for its assessment of the effectiveness of internal control over financial reporting, included in the accompanying Management’s Annual Report on Internal Control over Financial Reporting. Our responsibility is to express an opinion on the company’s internal control over financial reporting based on our audit.
We conducted our audit in accordance with the standards of the Public Company Accounting Oversight Board (United States). Those standards require that we plan and perform the audit to obtain reasonable assurance about whether effective internal control over financial reporting was maintained in all material respects. Our audit included obtaining an understanding of internal control over financial reporting, assessing the risk that a material weakness exists, testing and evaluating the design and operating effectiveness of internal control based on the assessed risk, and performing such other procedures as we considered necessary in the circumstances. We believe that our audit provides a reasonable basis for our opinion.
A company’s internal control over financial reporting is a process designed to provide reasonable assurance regarding the reliability of financial reporting and the preparation of financial statements for external purposes in accordance with generally accepted accounting principles. A company’s internal control over financial reporting includes those policies and procedures that (1) pertain to the maintenance of records that, in reasonable detail, accurately and fairly reflect the transactions and dispositions of the assets of the company; (2) provide reasonable assurance that transactions are recorded as necessary to permit preparation of financial statements in accordance with generally accepted accounting principles, and that receipts and expenditures of the company are being made only in accordance with authorizations of management and directors of the company; and (3) provide reasonable assurance regarding prevention or timely detection of unauthorized acquisition, use, or disposition of the company’s assets that could have a material effect on the financial statements.
Because of its inherent limitations, internal control over financial reporting may not prevent or detect misstatements. Also, projections of any evaluation of effectiveness to future periods are subject to the risk that controls may become inadequate because of changes in conditions, or that the degree of compliance with the policies or procedures may deteriorate.
In our opinion, Qlik Technologies Inc. maintained, in all material respects, effective internal control over financial reporting as of December 31, 2014, based on the COSO criteria.
We also have audited, in accordance with the standards of the Public Company Accounting Oversight Board (United States), the consolidated balance sheets of Qlik Technologies Inc. as of December 31, 2014 and 2013, and the related consolidated statements of operations, comprehensive income (loss), stockholders’ equity and cash flows for each of the three years in the period ended December 31, 2014 and our report dated February 27, 2015 expressed an unqualified opinion thereon.
/s/ Ernst & Young LLP
Philadelphia, Pennsylvania
February 27, 2015
78
Table of Contents
| ITEM 9B. | OTHER INFORMATION |
None.
| ITEM 10. | DIRECTORS, EXECUTIVE OFFICERS AND CORPORATE GOVERNANCE |
Except as set forth below, the information required by this Item is incorporated by reference from our proxy statement for our 2015 Annual Meeting of Stockholders to be filed with the SEC within 120 days after the end of our fiscal year ended December 31, 2014.
Executive Officers of the Registrant
The following table sets forth the name, age, and position of each of our executive officers as of February 17, 2015:
| Name |
Age | Positions Held | ||||
| Lars Björk (1) |
52 | President, Chief Executive Officer and Director | ||||
| Timothy MacCarrick |
49 | Chief Financial Officer and Treasurer | ||||
| Leslie Bonney |
56 | Chief Operating Officer | ||||
| Eugene “Rick” Jackson |
54 | Chief Marketing Officer | ||||
| Anthony Deighton |
41 | Chief Technology Officer and Senior Vice President, Products | ||||
| Diane Adams |
55 | Chief People Officer | ||||
| Dennis Johnson |
41 | Chief Accounting Officer | ||||
| Deborah Lofton |
47 | Vice President and General Counsel and Secretary | ||||
| (1) | Member of the Board of Directors |
Lars Björk has served as our President and Chief Executive Officer since October 2007 and as a member of our board of directors since October 2004. From August 2006 to October 2007, he served as our Chief Financial Officer and Chief Operating Officer. From August 2000 to August 2006, Mr. Björk served as Chief Financial Officer of QlikTech International AB. From January 1999 to August 2000, he served as Chief Information Officer of Resurs Finance. From May 1994 to January 1999, Mr. Björk served Chief Financial Officer of ScandStick, a manufacturer of adhesive material. Mr. Björk received an M.B.A. from the University of Lund, Sweden and a Degree in Engineering from the Technical College in Helsingborg, Sweden.
Timothy MacCarrick has served as our Chief Financial Officer and Treasurer since July 2013. Prior to joining the Company, Mr. MacCarrick served as Chief Operating Officer (“COO”) at De Lage Landen International B.V. from June 2010 to June 2013. Prior to De Lage Landen, from July 2008 to May 2010, Mr. MacCarrick was Corporate Vice President and Chief Financial Officer (“CFO”) for Crane Co. Prior to Crane, Mr. MacCarrick was employed by Xerox from 1988 until June 2008, where he most recently served as Corporate Vice President and Vice President, Finance, Xerox North America and held a number of financial management positions, including Chief Financial Officer for Xerox Europe. Mr. MacCarrick holds an M.B.A. in Finance and a B.S. in Accounting and Law from Clarkson University. Mr. MacCarrick graduated from the INSEAD International Executive Program and is a Lean Six Sigma Certified Green Belt.
Leslie Bonney has served as our Chief Operating Officer since March 2011. From March 2010 to March 2011, Mr. Bonney served as our Executive Vice President of Global Field Operations. From October 2007 to March 2010, Mr. Bonney served as our Senior Vice President Worldwide Sales. From June 2005 to October 2007, Mr. Bonney served as our Vice President International Markets. From January 2004 to June 2005, Mr. Bonney served as Senior Vice President and General Manager Europe, Middle East and Africa markets of StreamServe, a document management company. Mr. Bonney received a B.Sc. in Marine Biology from James Cook University.
79
Table of Contents
Anthony Deighton has served as our Chief Technology Officer and Senior Vice President, Products since September 2011. Mr. Deighton served as our Senior Vice President, Products from January 2005 to September 2011. He previously served as the General Manager of Siebel Systems’ Employee Relationship Management (“ERM”) business unit, among a variety of other product marketing roles at Siebel Systems from October 1999 to January 2005. Prior to joining Siebel, Mr. Deighton worked as a business analyst at A.T. Kearney in Chicago, Illinois. Mr. Deighton received a B.A. in Economics from Northwestern University and an M.B.A. with high distinction from Harvard Business School.
Eugene “Rick” Jackson has served as our Chief Marketing Officer (“CMO”) since May 2014. Mr. Jackson previously served as CMO at Rackspace from July 2013 to May 2014. Prior to Rackspace, he served as CMO at VMware, where he was responsible for leading the company’s global marketing strategy since early 2009. In addition, Rick has led marketing organizations at Borland Software, BEA Systems, and NetGravity. Mr. Jackson holds a B.S. in Computer Science from California State University, Northridge.
Diane Adams has served as our Chief People Officer since June 2013. Prior to joining the Company, Ms. Adams served as Executive Vice President, Culture and Talent, with Allscripts from August 2009 to January 2013. Prior to Allscripts, from June 1995 to August 2009, Ms. Adams served in a number of human resources leadership roles with Cisco Systems. During her last three years with Cisco, she held the dual role of Vice President, Human Resources, International; and Vice President, Human Resources, Worldwide Sales. Ms. Adams holds a B.A. in Business Administration from the University of North Carolina at Chapel Hill.
Dennis Johnson has served as our Chief Accounting Officer since January 2012. Mr. Johnson served as our Vice President, Finance from January 2011 to January 2012. He also served as our Director of Accounting and External Reporting from September 2009 to January 2011. Mr. Johnson held various positions at MEDecision, Inc. from 2002 to 2009 including Vice President, Finance and Corporate Controller. Mr. Johnson holds a B.S. in Accounting from La Salle University and an M.B.A. in Finance from Villanova University and is an active Certified Public Accountant in the Commonwealth of Pennsylvania.
Deborah Lofton has served as our Vice President and General Counsel and Secretary since January 2011. From January 2008 to January 2011, Ms. Lofton served as Counsel at McCausland Keen & Buckman. From 2005 to 2007, Ms. Lofton served as Senior Vice President, General Counsel and Secretary of InfraSource Services, Inc. Prior to that, Ms. Lofton held executive level positions at SunGard Availability Services, RMH Teleservices, Inc. and SunGard Data Systems, Inc. Ms. Lofton has a B.A. in American Government from the University of Virginia and a J.D. from the University of Virginia School of Law.
Code of Business Conduct
Our board of directors has adopted a code of business conduct that applies to all of our employees, officers (including our principal executive officer, principal financial officer, principal accounting officer or controller, or persons performing similar functions) and directors. The full text of our code of business conduct is posted on our website at http://www.qlik.com under the Investor Relations section. We intend to disclose future amendments to certain provisions of our code of business conduct, or waivers of such provisions, applicable to our directors and executive officers (including our principal executive officer, principal financial officer, principal accounting officer or controller, or persons performing similar functions) at the same location on our website identified above and also in a Current Report on Form 8-K within four business days following the date of such amendment or waiver. A copy of the code of business conduct is also available upon request to the Corporate Secretary at Qlik Technologies Inc., 150 N. Radnor-Chester Road, Suite E-220, Radnor, PA 19087.
| ITEM 11. | EXECUTIVE COMPENSATION |
The information required by this item is incorporated by reference from the information in our proxy statement for our 2015 Annual Meeting of Stockholders to be filed with the SEC within 120 days after the end of our fiscal year ended December 31, 2014.
80
Table of Contents
| ITEM 12. | SECURITY OWNERSHIP OF CERTAIN BENEFICIAL OWNERS AND MANAGEMENT AND RELATED STOCKHOLDER MATTERS |
Other than with respect to the Securities Authorized for Issuance under Equity Compensation Plans below, the information required by this item is incorporated by reference from the information in our proxy statement for our 2015 Annual Meeting of Stockholders to be filed with the SEC within 120 days after the end of our fiscal year ended December 31, 2014.
Securities Authorized for Issuance under Equity Compensation Plans
The following table provides certain information regarding our equity compensation plans in effect as of December 31, 2014:
| Plan Category |
Number of Securities to be Issued Under Equity Compensation Plans |
Weighted-Average Exercise Price Under Equity Compensation Plans |
Number of Securities Remaining Available for Issuance Under Equity Compensation Plans (Excluding Securities Reflected in Column (a)) |
|||||||||
| (a) | (b) | (c) | ||||||||||
| Equity compensation plans approved by security holders |
11,580,044 | (1) | $ | 23.13 | (2) | 3,213,021 | (3) | |||||
| Equity compensation plans not approved by security holders |
— | — | — | |||||||||
|
|
|
|
|
|
|
|||||||
| Total |
11,580,044 | (1) | $ | 23.13 | (2) | 3,213,021 | (3) | |||||
|
|
|
|
|
|
|
|||||||
| (1) | Includes 8,822,487 shares issuable upon exercise of outstanding options, 276,837 shares issuable upon exercise of SSARs, 1,014,914 shares issuable upon settlement of restricted stock units and 467,710 shares issuable upon the exercise of MVSSSARs under the 2010 Equity Incentive Plan. Includes 666,134 shares issuable upon exercise of outstanding options under the 2007 Equity Incentive Plan. Includes 331,962 shares issuable upon exercise of outstanding options under the 2004 Equity Incentive Plan. |
| (2) | Does not take into account restricted stock units, which have no exercise price. |
| (3) | On January 1 of each year, the number of shares reserved under the 2010 Equity Incentive Plan is automatically increased by 3.75% of the total number of shares of Common Stock that are outstanding at that time, or, if less, by 3,300,000 shares (or such lesser number as may be approved by the Company’s board of directors). |
| ITEM 13. | CERTAIN RELATIONSHIPS AND RELATED TRANSACTIONS, AND DIRECTOR INDEPENDENCE |
The information required by this item is incorporated by reference from the information in our proxy statement for our 2015 Annual Meeting of Stockholders to be filed with the SEC within 120 days after the end of our fiscal year ended December 31, 2014.
| ITEM 14. | PRINCIPAL ACCOUNTANT FEES AND SERVICES |
The information required by this item is incorporated by reference from the information in our proxy statement for our 2015 Annual Meeting of Stockholders to be filed with the SEC within 120 days after the end of our fiscal year ended December 31, 2014.
81
Table of Contents
| ITEM 15. | EXHIBITS AND FINANCIAL STATEMENT SCHEDULES |
(a) The following documents are filed as part of this Annual Report on Form 10-K:
(1) Financial Statements.
The list of consolidated financial statements and schedules set forth in accompanying Index to Consolidated Financial Statements on page F-1 of this Annual Report on Form 10-K, which is incorporated into this item by reference.
(2) Financial Statement Schedule.
No financial statement schedules have been submitted because they are not required or are not applicable or because the information required is included in the consolidated financial statements or the notes thereto.
(b) Exhibits required by Item 601 of Regulation S-K.
The information required by this item is set forth on the exhibit index that follows the signature page of this Annual Report on Form 10-K.
82
Table of Contents
Pursuant to the requirements of Section 13 or 15(d) of the Securities Exchange Act of 1934, the registrant has duly caused this report to be signed on its behalf by the undersigned thereunto duly authorized, on February 27, 2015.
| QLIK TECHNOLOGIES INC. | ||
| By: | /s/ LARS BJÖRK | |
| Lars Björk | ||
| President, Chief Executive Officer, and Director (Principal Executive Officer) | ||
Pursuant to the requirements of the Securities Exchange Act of 1934, this report has been signed below by the following persons on behalf of the registrant and in the capacities and on the dates indicated.
| Signatures |
Title |
Date | ||
| /s/ LARS BJÖRK Lars Björk |
President, Chief Executive Officer, and Director (Principal Executive Officer) |
February 27, 2015 | ||
| /s/ TIMOTHY MACCARRICK Timothy MacCarrick |
Chief Financial Officer and Treasurer (Principal Financial Officer) |
February 27, 2015 | ||
| /s/ DENNIS JOHNSON Dennis Johnson |
Chief Accounting Officer (Principal Accounting Officer) |
February 27, 2015 | ||
| /s/ BRUCE GOLDEN Bruce Golden |
Chairman of the Board | February 27, 2015 | ||
| /s/ JOHN GAVIN, JR. John Gavin, Jr. |
Director | February 27, 2015 | ||
| /s/ DEBORAH HOPKINS Deborah Hopkins |
Director | February 27, 2015 | ||
| /s/ ALEXANDER OTT Alexander Ott |
Director | February 27, 2015 | ||
| /s/ STEFFAN TOMLINSON Steffan Tomlinson |
Director | February 27, 2015 | ||
| /s/ PAUL WAHL Paul Wahl |
Director | February 27, 2015 | ||
83
Table of Contents
INDEX TO CONSOLIDATED FINANCIAL STATEMENTS
| Page | ||||
| F-2 | ||||
| F-3 | ||||
| F-4 | ||||
| F-5 | ||||
| F-6 | ||||
| F-7 | ||||
| F-8 | ||||
F-1
Table of Contents
Report of Independent Registered Public Accounting Firm
on the Consolidated Financial Statements
The Board of Directors and Stockholders of Qlik Technologies Inc.:
We have audited the accompanying consolidated balance sheets of Qlik Technologies Inc. as of December 31, 2014 and 2013, and the related consolidated statements of operations, comprehensive income (loss), stockholders’ equity and cash flows for each of the three years in the period ended December 31, 2014. These financial statements are the responsibility of the Company’s management. Our responsibility is to express an opinion on these financial statements based on our audits.
We conducted our audits in accordance with the standards of the Public Company Accounting Oversight Board (United States). Those standards require that we plan and perform the audit to obtain reasonable assurance about whether the financial statements are free of material misstatement. An audit includes examining, on a test basis, evidence supporting the amounts and disclosures in the financial statements. An audit also includes assessing the accounting principles used and significant estimates made by management, as well as evaluating the overall financial statement presentation. We believe that our audits provide a reasonable basis for our opinion.
In our opinion, the financial statements referred to above present fairly, in all material respects, the consolidated financial position of Qlik Technologies Inc. at December 31, 2014 and 2013, and the consolidated results of its operations and its cash flows for each of the three years in the period ended December 31, 2014, in conformity with U.S. generally accepted accounting principles.
We also have audited, in accordance with the standards of the Public Company Accounting Oversight Board (United States), Qlik Technologies Inc.’s internal control over financial reporting as of December 31, 2014, based on criteria established in Internal Control-Integrated Framework issued by the Committee of Sponsoring Organizations of the Treadway Commission (2013 framework) and our report dated February 27, 2015 expressed an unqualified opinion thereon.
/s/ Ernst & Young LLP
Philadelphia, Pennsylvania
February 27, 2015
F-2
Table of Contents
CONSOLIDATED BALANCE SHEETS
(in thousands, except share data)
| December 31, 2014 |
December 31, 2013 |
|||||||
| Assets |
||||||||
| Current assets: |
||||||||
| Cash and cash equivalents |
$ | 244,018 | $ | 227,693 | ||||
| Accounts receivable, net |
203,766 | 162,009 | ||||||
| Prepaid expenses and other current assets |
19,901 | 16,296 | ||||||
| Deferred income taxes |
2,082 | 1,886 | ||||||
|
|
|
|
|
|||||
| Total current assets |
469,767 | 407,884 | ||||||
| Property and equipment, net |
26,455 | 21,500 | ||||||
| Intangible assets, net |
21,195 | 12,695 | ||||||
| Goodwill |
38,702 | 21,233 | ||||||
| Deferred income taxes |
3,015 | 2,107 | ||||||
| Deposits and other noncurrent assets |
2,835 | 2,503 | ||||||
|
|
|
|
|
|||||
| Total assets |
$ | 561,969 | $ | 467,922 | ||||
|
|
|
|
|
|||||
| Liabilities and stockholders’ equity |
||||||||
| Current liabilities: |
||||||||
| Income taxes payable |
$ | 2,139 | $ | 2,634 | ||||
| Accounts payable |
6,887 | 5,262 | ||||||
| Deferred revenue |
127,565 | 98,684 | ||||||
| Accrued payroll and other related costs |
53,674 | 46,780 | ||||||
| Accrued expenses |
40,712 | 29,495 | ||||||
| Deferred income taxes |
37 | 544 | ||||||
|
|
|
|
|
|||||
| Total current liabilities |
231,014 | 183,399 | ||||||
| Long-term liabilities: |
||||||||
| Deferred revenue |
4,564 | 3,637 | ||||||
| Deferred income taxes |
3,477 | 894 | ||||||
| Other long-term liabilities |
14,422 | 7,822 | ||||||
|
|
|
|
|
|||||
| Total liabilities |
253,477 | 195,752 | ||||||
| Commitments and contingencies |
||||||||
| Stockholders’ equity: |
||||||||
| Preferred stock, $0.0001 par value, 10,000,000 authorized, none issued and outstanding at December 31, 2014 and December 31, 2013 |
|
— |
|
|
— |
| ||
| Common stock, $0.0001 par value, 300,000,000 shares authorized; 90,852,434 issued and outstanding at December 31, 2014 and 88,989,091 issued and outstanding at December 31, 2013 |
|
9 |
|
|
9 |
| ||
| Additional paid-in-capital |
327,419 | 265,711 | ||||||
| Retained earnings (accumulated deficit) |
(21,594 | ) | 3,037 | |||||
| Accumulated other comprehensive income |
2,658 | 3,413 | ||||||
|
|
|
|
|
|||||
| Total stockholders’ equity |
308,492 | 272,170 | ||||||
|
|
|
|
|
|||||
| Total liabilities and stockholders’ equity |
$ | 561,969 | $ | 467,922 | ||||
|
|
|
|
|
|||||
F-3
Table of Contents
CONSOLIDATED STATEMENTS OF OPERATIONS
(in thousands, except share and per share data)
| Year Ended December 31, | ||||||||||||
| 2014 | 2013 | 2012 | ||||||||||
| Revenue: |
||||||||||||
| License revenue |
$ | 300,888 | $ | 270,769 | $ | 238,674 | ||||||
| Maintenance revenue |
203,550 | 160,552 | 120,490 | |||||||||
| Professional services revenue |
52,359 | 39,129 | 29,373 | |||||||||
|
|
|
|
|
|
|
|||||||
| Total revenue |
556,797 | 470,450 | 388,537 | |||||||||
| Cost of revenue: |
||||||||||||
| License revenue |
8,196 | 7,345 | 5,058 | |||||||||
| Maintenance revenue |
11,363 | 10,585 | 8,526 | |||||||||
| Professional services revenue |
55,903 | 43,893 | 29,705 | |||||||||
|
|
|
|
|
|
|
|||||||
| Total cost of revenue |
75,462 | 61,823 | 43,289 | |||||||||
|
|
|
|
|
|
|
|||||||
| Gross profit |
481,335 | 408,627 | 345,248 | |||||||||
| Operating expenses: |
||||||||||||
| Sales and marketing |
308,375 | 255,010 | 211,314 | |||||||||
| Research and development |
72,636 | 60,400 | 39,995 | |||||||||
| General and administrative |
109,200 | 89,795 | 79,309 | |||||||||
|
|
|
|
|
|
|
|||||||
| Total operating expenses |
490,211 | 405,205 | 330,618 | |||||||||
|
|
|
|
|
|
|
|||||||
| Income (loss) from operations |
(8,876 | ) | 3,422 | 14,630 | ||||||||
| Other expense, net: |
||||||||||||
| Interest income, net |
147 | 231 | 250 | |||||||||
| Foreign exchange losses, net |
(1,973 | ) | (2,753 | ) | (3,141 | ) | ||||||
|
|
|
|
|
|
|
|||||||
| Total other expense, net |
(1,826 | ) | (2,522 | ) | (2,891 | ) | ||||||
|
|
|
|
|
|
|
|||||||
| Income (loss) before provision for income taxes |
(10,702 | ) | 900 | 11,739 | ||||||||
| Provision for income taxes |
(13,929 | ) | (10,879 | ) | (7,900 | ) | ||||||
|
|
|
|
|
|
|
|||||||
| Net income (loss) |
$ | (24,631 | ) | $ | (9,979 | ) | $ | 3,839 | ||||
|
|
|
|
|
|
|
|||||||
| Net income (loss) per common share: |
||||||||||||
| Basic |
$ | (0.27 | ) | $ | (0.11 | ) | $ | 0.04 | ||||
| Diluted |
$ | (0.27 | ) | $ | (0.11 | ) | $ | 0.04 | ||||
| Weighted average number of common shares: |
||||||||||||
| Basic |
89,886,403 | 87,702,222 | 85,423,074 | |||||||||
| Diluted |
89,886,403 | 87,702,222 | 87,640,844 | |||||||||
F-4
Table of Contents
CONSOLIDATED STATEMENTS OF COMPREHENSIVE INCOME (LOSS)
(in thousands)
| Year Ended December 31, | ||||||||||||
| 2014 | 2013 | 2012 | ||||||||||
| Net income (loss) |
$ | (24,631 | ) | $ | (9,979 | ) | $ | 3,839 | ||||
| Foreign currency translation gains (losses) |
(755 | ) | 490 | 2,631 | ||||||||
|
|
|
|
|
|
|
|||||||
| Comprehensive income (loss) |
$ | (25,386 | ) | $ | (9,489 | ) | $ | 6,470 | ||||
|
|
|
|
|
|
|
|||||||
F-5
Table of Contents
CONSOLIDATED STATEMENTS OF STOCKHOLDERS’ EQUITY
(in thousands, except share data)
| Stockholders’ Equity | ||||||||||||||||||||||||
| Common | Additional Paid- in- Capital |
Retained Earnings (Accumulated Deficit) |
Accumulated Other Comprehensive Income |
|||||||||||||||||||||
| Shares | Amount | Total | ||||||||||||||||||||||
| Balance at January 1, 2012 |
84,397,823 | $ | 8 | $ | 180,058 | $ | 9,177 | $ | 292 | $ | 189,535 | |||||||||||||
| Exercise of common stock options |
1,833,377 | 1 | 5,452 | — | — | 5,453 | ||||||||||||||||||
| Vesting of restricted stock units |
55,092 | — | — | — | — | — | ||||||||||||||||||
| Stock-based compensation expense |
— | — | 19,315 | — | — | 19,315 | ||||||||||||||||||
| Excess tax benefit from stock-based compensation |
— | — | 4,789 | — | — | 4,789 | ||||||||||||||||||
| Net income |
— | — | — | 3,839 | — | 3,839 | ||||||||||||||||||
| Foreign currency translation adjustment |
— | — | — | — | 2,631 | 2,631 | ||||||||||||||||||
|
|
|
|
|
|
|
|
|
|
|
|
|
|||||||||||||
| Balance at December 31, 2012 |
86,286,292 | $ | 9 | $ | 209,614 | $ | 13,016 | $ | 2,923 | $ | 225,562 | |||||||||||||
| Exercise of common stock options |
2,572,273 | — | 23,132 | — | — | 23,132 | ||||||||||||||||||
| Vesting of restricted stock units |
93,842 | — | — | — | — | — | ||||||||||||||||||
| Exercise of MVSSSARs |
36,684 | — | — | — | — | — | ||||||||||||||||||
| Stock-based compensation expense |
— | — | 28,918 | — | — | 28,918 | ||||||||||||||||||
| Excess tax benefit from stock-based compensation |
— | — | 4,047 | — | — | 4,047 | ||||||||||||||||||
| Net loss |
— | — | — | (9,979 | ) | — | (9,979 | ) | ||||||||||||||||
| Foreign currency translation adjustment |
— | — | — | — | 490 | 490 | ||||||||||||||||||
|
|
|
|
|
|
|
|
|
|
|
|
|
|||||||||||||
| Balance at December 31, 2013 |
88,989,091 | $ | 9 | $ | 265,711 | $ | 3,037 | $ | 3,413 | $ | 272,170 | |||||||||||||
| Exercise of common stock options |
1,665,625 | — | 19,239 | — | — | 19,239 | ||||||||||||||||||
| Vesting of restricted stock units |
159,566 | — | — | — | — | — | ||||||||||||||||||
| Exercise of MVSSSARs |
38,152 | — | — | — | — | — | ||||||||||||||||||
| Stock-based compensation expense |
— | — | 36,032 | — | — | 36,032 | ||||||||||||||||||
| Excess tax benefit from stock-based compensation |
— | — | 6,437 | — | — | 6,437 | ||||||||||||||||||
| Net loss |
— | — | — | (24,631 | ) | — | (24,631 | ) | ||||||||||||||||
| Foreign currency translation adjustment |
— | — | — | — | (755 | ) | (755 | ) | ||||||||||||||||
|
|
|
|
|
|
|
|
|
|
|
|
|
|||||||||||||
| Balance at December 31, 2014 |
90,852,434 | $ | 9 | $ | 327,419 | $ | (21,594 | ) | $ | 2,658 | $ | 308,492 | ||||||||||||
|
|
|
|
|
|
|
|
|
|
|
|
|
|||||||||||||
F-6
Table of Contents
CONSOLIDATED STATEMENTS OF CASH FLOWS
(in thousands)
| Year Ended December 31, | ||||||||||||
| 2014 | 2013 | 2012 | ||||||||||
| Cash flows from operating activities |
||||||||||||
| Net income (loss) |
$ | (24,631 | ) | $ | (9,979 | ) | $ | 3,839 | ||||
| Adjustments to reconcile net income (loss) to net cash provided by operating activities: |
||||||||||||
| Depreciation and amortization |
11,731 | 8,228 | 5,255 | |||||||||
| Stock-based compensation expense |
36,032 | 28,918 | 19,315 | |||||||||
| Excess tax benefit from stock-based compensation |
(6,437 | ) | (4,047 | ) | (4,789 | ) | ||||||
| Unrealized foreign currency loss, net |
14,189 | 1,818 | 755 | |||||||||
| Other non-cash items |
(723 | ) | (1,301 | ) | 1,250 | |||||||
| Changes in assets and liabilities: |
||||||||||||
| Accounts receivable |
(51,450 | ) | (18,667 | ) | (32,591 | ) | ||||||
| Prepaid expenses and other assets |
(6,024 | ) | (2,059 | ) | (4,098 | ) | ||||||
| Deferred revenue |
37,669 | 15,625 | 17,403 | |||||||||
| Accrued expenses and other liabilities |
25,242 | 11,189 | 21,353 | |||||||||
|
|
|
|
|
|
|
|||||||
| Net cash provided by operating activities |
35,598 | 29,725 | 27,692 | |||||||||
| Cash flows from investing activities |
||||||||||||
| Acquisitions, net of cash acquired |
(17,245 | ) | (13,351 | ) | (10,792 | ) | ||||||
| Capital expenditures |
(13,020 | ) | (9,639 | ) | (10,334 | ) | ||||||
|
|
|
|
|
|
|
|||||||
| Net cash used in investing activities |
(30,265 | ) | (22,990 | ) | (21,126 | ) | ||||||
| Cash flows from financing activities |
||||||||||||
| Proceeds from exercise of common stock options |
19,239 | 23,132 | 5,453 | |||||||||
| Excess tax benefit on stock-based compensation |
6,437 | 4,047 | 4,789 | |||||||||
| Payments on contingent consideration |
(2,168 | ) | (1,456 | ) | (202 | ) | ||||||
| Payments on line of credit, net |
(132 | ) | (1 | ) | (356 | ) | ||||||
|
|
|
|
|
|
|
|||||||
| Net cash provided by financing activities |
23,376 | 25,722 | 9,684 | |||||||||
| Effect of exchange rates on cash |
(12,384 | ) | (567 | ) | 2,140 | |||||||
|
|
|
|
|
|
|
|||||||
| Net increase in cash and cash equivalents |
16,325 | 31,890 | 18,390 | |||||||||
| Cash and cash equivalents, beginning of period |
227,693 | 195,803 | 177,413 | |||||||||
|
|
|
|
|
|
|
|||||||
| Cash and cash equivalents, end of period |
$ | 244,018 | $ | 227,693 | $ | 195,803 | ||||||
|
|
|
|
|
|
|
|||||||
| Supplemental cash flow information: |
||||||||||||
| Cash paid during the period for income taxes |
$ | 11,071 | $ | 10,505 | $ | 2,682 | ||||||
|
|
|
|
|
|
|
|||||||
| Non-cash investing activities: |
||||||||||||
| Tenant improvement allowance received under operating lease |
$ | 1,863 | $ | 91 | $ | 542 | ||||||
|
|
|
|
|
|
|
|||||||
F-7
Table of Contents
NOTES TO CONSOLIDATED FINANCIAL STATEMENTS
| (1) | Description of Business |
Qlik Technologies Inc. (“We”, “Qlik” or the “Company”) has pioneered powerful, user-driven business intelligence (“BI”) solutions that enable its customers to make better, faster and more informed business decisions, wherever they are. The Company’s software products help people create and share insights and analysis in groups and across organizations. Business users can explore data, ask and answer their own stream of questions and follow their own path to insight on their own and in teams and groups. Through its wholly owned subsidiaries, the Company sells software solutions that are powered by the Company’s in-memory engine which maintains associations in data and calculates aggregations rapidly, as needed. The Company’s software products are designed to give customers significant improvements in usability, flexibility and performance at lower costs compared to traditional BI solutions.
| (2) | Significant Accounting Policies |
Basis of Presentation and Consolidation
The consolidated financial statements include the accounts of the Company and its wholly owned subsidiaries. All material intercompany balances and transactions have been eliminated. Prior year amounts have been reclassified where appropriate to conform to the current year classification for comparative purposes.
Use of Estimates
The preparation of consolidated financial statements in conformity with accounting principles generally accepted in the United States (“U.S. GAAP”) requires management to make estimates and assumptions that affect the reported amounts of assets and liabilities and disclosures of contingent assets and liabilities at the date of the financial statements and the reported amounts of revenue and expenses during the reporting period. Actual results could differ from those estimates.
The Company evaluates its estimates, including those related to the accounts receivable allowance, useful lives of long-lived assets, the recoverability of goodwill and other intangible assets, assessing fair values of assets and liabilities acquired in and contingent consideration related to business acquisitions, and assumptions used for the purpose of determining stock-based compensation expense and income taxes, among others. The Company bases its estimates on historical experience and on various other assumptions that are believed to be reasonable, the results of which form the basis for making judgments about the carrying value of assets and liabilities as well as reported revenue and expenses during the periods presented.
Foreign Currency Translation
The financial statements of the Company’s foreign operations are measured using the local currency as the functional currency. The local currency assets and liabilities are translated at the rate of exchange to the United States (“U.S.”) dollar on the balance sheet date and the local currency revenues and expenses are translated at average rates of exchange to the U.S. dollar during the reporting periods. Foreign currency transaction gains (losses) have been reflected as a component of other expense, net within the Company’s consolidated statements of operations and foreign currency translation gains (losses) have been included as a component of the Company’s consolidated statements of comprehensive income (loss) and accumulated other comprehensive income (loss) within the Company’s consolidated balance sheets.
Cash and Cash Equivalents
The Company considers all highly liquid investments having an original maturity of three months or less when purchased to be cash equivalents. The Company maintains deposits with financial institutions, the balances
F-8
Table of Contents
of which from time to time exceed the federally insured amount. These balances could be impacted if the underlying financial depository institutions or the guarantors fail or could be subject to adverse conditions in the financial markets.
Accounts Receivable
The Company makes estimates regarding the collectability of its accounts receivable. When the Company evaluates the adequacy of its allowance for doubtful accounts, it considers multiple factors, including historical write-off experience, the need for specific customer reserves, the aging of receivables, customer creditworthiness and changes in customer payment cycles. If any of the factors used to calculate the allowance for doubtful accounts change or if the allowance does not reflect the Company’s future ability to collect outstanding receivables, additional provisions for doubtful accounts may be needed, and future results of operations could be materially affected. Once the outstanding receivable is determined to be uncollectible and all efforts at collection have been exhausted, the outstanding receivable is written-off.
The following table summarizes the changes in the Company’s allowance for doubtful accounts for the period indicated:
| Year Ended December 31, | ||||||||||||
| 2014 | 2013 | 2012 | ||||||||||
| (in thousands) | ||||||||||||
| Balance at the beginning of the period |
$ | 1,442 | $ | 704 | $ | 891 | ||||||
| Amounts to expense |
1,545 | 1,829 | 2,120 | |||||||||
| Accounts written off |
(1,204 | ) | (1,091 | ) | (2,307 | ) | ||||||
|
|
|
|
|
|
|
|||||||
| Balance at the end of the period |
$ | 1,783 | $ | 1,442 | $ | 704 | ||||||
|
|
|
|
|
|
|
|||||||
Concentration of Market Risk
The Company is exposed to certain financial risks, including fluctuations in foreign currency exchange rates and interest rates. The Company manages its exposure to these market risks through internally established policies and procedures. The Company’s policies do not allow speculation in derivative instruments for profit or execution of derivative instrument contracts for which there are no underlying exposures. The Company does not use financial instruments for trading purposes and the Company is not a party to any leveraged derivatives. The Company monitors its underlying market risk exposures on an ongoing basis and, where appropriate, may use hedging strategies to mitigate these risks.
During the year ended December 31, 2014, the Company began using derivative instruments, specifically, short-term foreign currency forward contracts to hedge certain exposures to fluctuations in foreign currency exchange rates. The Company uses these short-term foreign currency forward contracts to manage foreign currency exchange rate risks related to certain intercompany borrowings that are utilized to fund operations. The Company executes these short-term foreign currency forward contracts with financial institutions that hold an investment grade credit rating. These short-term foreign currency forward contracts do not meet the requirements for hedge accounting, and are recorded on the Company’s consolidated balance sheet as either an asset or liability measured at fair value at the balance sheet date. As of December 31, 2014, the Company had one short-term foreign currency forward contract outstanding to sell Swedish kronor with a notional value of $107.0 million U.S. dollars. As of December 31, 2014, the unrealized loss on the Company’s short-term foreign currency forward contract was approximately $0.9 million and is recorded within accrued expenses on the consolidated balance sheet. At December 31, 2013, the Company had no foreign currency forward contracts outstanding. For the year ended December 31, 2014, the consolidated statement of operations reflects a gain of approximately $9.4 million, within foreign exchange losses, net, related to short-term foreign currency forward contracts. During the years ended December 31, 2013 and 2012, there was no impact in the consolidated statements of operations related to foreign currency forward contracts. Cash flows received or paid
F-9
Table of Contents
in connection with the settlement of short-term foreign currency forward contracts are included in cash flows from operating activities in the period in which the short-term foreign currency forward contracts are settled.
The Company does not believe its business is substantially dependent on any particular customer as no customer represented more than 2% of its revenue in 2014, 2013 or 2012. The Company’s target markets are not confined to certain industries and geographies as it is focused on providing a solution that generally meets the needs of all business users. As of December 31, 2014, the Company’s global partner network was comprised of more than 1,700 partners in over 100 countries. No individual partner represented more than 2% of the Company’s revenues in the fiscal years ended December 31, 2014 and 2013 and no individual partner represented more than 3% of the Company’s revenues in the fiscal year ended December 31, 2012.
Concentration of Credit Risk
The Company’s principal financial instruments subject to potential concentration of credit risk are cash and cash equivalents and accounts receivable, which are unsecured. The Company’s cash and cash equivalents are maintained at various financial institutions across multiple geographies. Deposits held with banks may at times exceed the amount of insurance provided on such deposits. Generally, these deposits may be redeemed upon demand and, therefore, management believes they bear minimal risk. Concentration of credit risk with respect to trade accounts receivables is generally limited by a large customer base and its geographic dispersion. The Company believes it has a diverse customer base consisting of Fortune 500 corporations, universities, large international companies and other smaller businesses. As of and for the years ended December 31, 2014, 2013 and 2012, there were no significant concentrations with respect to the Company’s consolidated revenue or accounts receivable.
Property and Equipment
Property and equipment are recorded at cost. Depreciation is computed using the straight-line method over the estimated useful lives of the assets. The estimated useful lives are as follows: three years for computers and equipment and five years for furniture and fixtures. Leasehold improvements are amortized over the shorter of the asset’s useful life or the remaining term of the lease.
Expenditures for major additions and improvements are capitalized, while minor replacements, maintenance and repairs are charged to expense as incurred. When property is retired or otherwise disposed of, the costs and accumulated depreciation are removed from the accounts. Any resulting gain or loss is recognized concurrently.
Long-lived Assets
The Company considers whether indicators of impairment of long-lived assets held for use, including identified intangible assets, are present. If such indicators are present, the Company determines whether the sum of the estimated undiscounted future cash flows attributable to such assets is less than their carrying amount, and if so, the Company recognizes an impairment loss based on the excess of the carrying amount of the assets over their fair value. No circumstances or events indicated impairment to long-lived assets during the years ended December 31, 2014, 2013 or 2012.
Business Combinations
The Company recognizes assets acquired, liabilities assumed and any contingent consideration related to business combinations at fair value on the date of acquisition. The purchase price allocation process requires management to make significant estimates and assumptions with respect to the fair value of any intangible assets acquired, deferred revenues assumed, or contingent consideration within the arrangement. Unanticipated events and circumstances may occur which may affect the accuracy or validity of such assumptions or estimates. All
F-10
Table of Contents
subsequent changes to a valuation allowance or uncertain tax position related to the acquired company that occur within the measurement period and are based on facts and circumstances that existed at the acquisition date are recognized as an adjustment to goodwill.
Acquisition-related transaction costs, including legal and accounting fees and other external costs directly related to the acquisition, are recognized separately from the acquisition and expensed as incurred in general and administrative expenses in the consolidated statements of operations.
Goodwill and Other Intangible Assets
Goodwill represents the excess of the purchase price of an acquired business over the fair value of the underlying net tangible and intangible assets acquired. The Company tests goodwill for impairment annually on October 1, or whenever events or changes in circumstances indicate an impairment. The guidance for goodwill requires impairment testing based on reporting units. The Company periodically evaluates its business and has determined that it continues to operate in one segment, which it considers its sole reporting unit. If it is determined that an impairment has occurred, the Company will record a write-down of the carrying value and charge the impairment as an operating expense in the period the determination is made. Although the Company believes goodwill is appropriately stated in the consolidated financial statements, changes in strategy or market conditions could significantly impact these judgments and require an adjustment to the recorded balance. There was no impairment during the years ended December 31, 2014, 2013 and 2012.
Intangible assets that are not considered to have an indefinite life are amortized over their useful lives on a straight-line basis. On a periodic basis, the Company evaluates the estimated remaining useful life of acquired intangible assets and whether events or changes in circumstances warrant a revision to the remaining period of amortization. The carrying amounts of these assets are periodically reviewed for impairment whenever events or changes in circumstances indicate that the carrying value of these assets may not be recoverable. The cost of intangible assets are amortized on a straight-line basis over their estimated useful lives ranging from three to nine years.
Revenue Recognition
The Company derives its revenues from three sources: (i) license revenues; (ii) maintenance revenues; and (iii) professional services revenues. The majority of license revenue is from the sale of perpetual licenses to customers or resellers. Maintenance, which generally has a contractual term of 12 months, includes telephone and web-based support and rights to software updates and upgrades on a when-and-if-available basis. Professional services include training, implementation, consulting and expert services.
For each arrangement, the Company recognizes revenue when (a) persuasive evidence of an arrangement exists, such as a signed contract or purchase order; (b) delivery of the product has occurred and there are no remaining obligations or substantive customer acceptance provisions; (c) the fee is fixed or determinable; and (d) collection of the fee is deemed reasonably assured. Delivery is considered to have occurred upon electronic transfer of the license key that provides immediate availability of the product to the purchaser.
As substantially all of the Company’s software licenses are sold in multiple-element arrangements that include either maintenance or both maintenance and professional services, the Company uses the residual method to determine the amount of license revenue to be recognized. Under the residual method, consideration is allocated to undelivered elements based upon vendor-specific objective evidence (“VSOE”) of the fair value of those elements, with the residual of the arrangement fee allocated to and recognized as license revenue. The Company has established VSOE of the fair value of maintenance through independent maintenance renewals, which demonstrate a consistent relationship of maintenance pricing as a percentage of the contractual license fee, and for new products for which renewals have not yet occurred, the Company has established VSOE of maintenance based on prices established by management with relevant authority. Maintenance revenue is deferred and recognized ratably over the contractual period of the maintenance arrangement, which is generally 12 months. Arrangements that include other professional services are evaluated to determine whether those
F-11
Table of Contents
services are essential to the functionality of other elements of the arrangement. The Company has determined that these services are not considered essential and the amounts allocated to the services are recognized as revenue when the services are performed. The VSOE of the fair value of the Company’s professional services is based on the price for these same services when they are sold separately. Revenue for services that are sold either on a stand-alone basis or included in multiple-element arrangements is recognized as the services are performed.
Certain of the Company’s license arrangements include license remix rights which allow the customer to change or alternate its use of the Company’s products after those products have been delivered to the customer. Under these arrangements, the customer has the right to deploy and use at least one copy of each licensed product, and the cumulative value of all products in use cannot exceed the total license fee. Assuming all other revenue recognition criteria have been met, the Company recognizes revenue under these arrangements upon delivery of the first license key of each product eligible for remix under the arrangement.
For sales made through resellers, the Company recognizes revenue upon the delivery of the license key only if those resellers provide the Company, at the time of placing their order, with the identity of the end-user customer to whom the product has been sold. Resellers do not carry inventory of the Company’s software products and, generally, do not have the right to return the Company’s software products. Sales made through resellers are evidenced by a reseller agreement, together with purchase orders on a transaction-by-transaction basis.
The Company also sells software licenses to original equipment manufacturers (“OEMs”) who integrate the Company’s products for distribution with their applications. The Company does not offer any rights to return products sold to OEM’s. The OEM’s end-user customer is licensed to use the Company’s products solely in conjunction with the OEM’s application. In OEM arrangements, license key delivery is required as the basis for revenue recognition. The Company recognizes revenue under its OEM arrangements when (a) persuasive evidence of an arrangement exists (e.g. a signed contract or purchase order); (b) delivery of the product has occurred and there are no remaining obligations or substantive customer acceptance provisions; (c) the fee is fixed or determinable; and (d) collection of the fee is deemed reasonably assured.
The Company records taxes collected on revenue-producing activities on a net basis.
Deferred Revenue
Deferred revenue consists of billings or payments received in advance of revenue recognition primarily from the Company’s maintenance agreements described above and is recognized as the revenue recognition criteria are met. The Company generally invoices its customers in annual installments. Accordingly, the deferred revenue balance does not represent the total contract value of annual maintenance agreements.
Cost of Revenue
Cost of license revenue is primarily comprised of referral fees paid to third parties in connection with software license sales and the amortization of technology related intangible assets acquired.
Cost of maintenance revenue is primarily comprised of the costs associated with the customer support personnel that provide maintenance and support services to the Company’s customers.
Cost of professional services revenue is primarily comprised of the costs associated with professional services personnel, consultants and subcontractors that provide consulting and training services to the Company’s customers.
Product Warranties
Substantially all of the Company’s software products are covered by a standard warranty of up to 120 days. In the event of a failure of software covered by this warranty, the Company must repair or replace the software
F-12
Table of Contents
or, if those remedies are insufficient, provide a refund. To date, the Company has not been required to record any reserve or revise any of the Company’s assumptions or estimates used in determining its warranty allowance. If the historical data the Company uses to calculate the adequacy of the warranty allowance is not indicative of future requirements, a warranty reserve may be required.
Guarantees
The standard commercial terms in the Company’s sales contracts include an indemnification clause that indemnifies the customer against certain liabilities and damages arising from any claims of patent, copyright, or other proprietary rights of any third party. Due to the nature of the intellectual property indemnification provided to the Company’s customers, it cannot estimate the fair value, or determine the total nominal amount, of the indemnification until such time as a claim for such indemnification is made. In the event of a claim made against the Company under such provision, the Company will evaluate estimated losses for such indemnification considering such factors as the degree of probability of an unfavorable outcome and the ability to make a reasonable estimate of the amount of loss. To date, the Company has not had any claims made against it under such provision and, accordingly, has not accrued any liabilities related to such indemnifications in its consolidated financial statements.
Commissions
The Company records commission expense related to license sales in the period in which the sale is made. For arrangements that consist solely of professional services, commission expense is recorded in the period in which the professional services have been rendered.
Research and Development
Software development costs are generally expensed as incurred until technological feasibility has been established, at which time such costs are capitalized to the extent that the capitalizable costs do not exceed the realizable value of such costs, until the product is available for general release to customers. Based on the Company’s product development process, technological feasibility is established upon the completion of a working model of the software product that has been tested to be consistent with the product design specifications and that is free of any uncertainties related to high-risk development issues. Costs incurred by the Company between completion of the working model and the point at which the product is ready for general release have been insignificant. Accordingly, the Company generally charges all such costs to research and development expense in the accompanying consolidated statements of operations.
Advertising
Advertising costs are charged to operations as incurred and include direct marketing, events, public relations, sales collateral materials and partner programs. Advertising expense was approximately $27.5 million, $22.5 million and $21.0 million for the years ended December 31, 2014, 2013 and 2012, respectively.
Income Taxes
Deferred tax assets and liabilities are recognized for the future tax consequences attributable to differences between the financial statement carrying amounts of existing assets and liabilities and their respective tax bases and operating loss and tax credit carry forwards. These deferred tax assets and liabilities are measured using enacted tax rates expected to be applied to taxable income in the years in which those temporary differences are expected to be reversed or utilized. The effect of a change in tax rates on deferred tax assets and liabilities is recognized in income in the period that includes the enactment date. Deferred tax assets are reduced by a valuation allowance when, in the opinion of management, it is more-likely-than-not that some portion or all of the deferred tax assets will not be realized.
F-13
Table of Contents
The Company uses a more-likely-than-not recognition threshold based on the technical merits of tax positions taken. Tax positions that meet the more-likely-than-not recognition threshold are measured as the largest amount of the tax benefits, determined on a cumulative probability basis, which is more-likely-than-not to be realized upon ultimate settlement in the financial statements. The Company recognizes interest and penalties related to income tax matters in the provision for income taxes.
Stock-Based Compensation
The Company recognizes the cost of stock-based compensation based on the fair value of those awards at the date of grant over the requisite service period on a straight-line basis. The Company uses the Black-Scholes-Merton (“Black-Scholes”) option pricing model to determine the fair value of common stock option awards and Stock-settled Stock Appreciation Rights (“SSARs”). The fair value of a restricted stock unit is determined by using the closing price of the Company’s common stock on the date of grant. The fair value of Maximum Value Stock-settled Stock Appreciation Rights (“MVSSSARs”) is determined by utilizing a lattice model under the option-pricing method. Stock-based compensation plans, related expenses and assumptions used in the Black-Scholes option-pricing model and the lattice model under the option-pricing method are more fully described in Note 11 to these audited consolidated financial statements. Stock-based compensation expense is recorded within cost of revenue, sales and marketing, research and development and general and administrative expenses in the consolidated statements of operations.
The following table sets forth the total stock-based compensation expense included in the consolidated statements of operations for the years ended December 31, 2014, 2013 and 2012:
| Year Ended December 31, | ||||||||||||
| 2014 | 2013 | 2012 | ||||||||||
| (in thousands) | ||||||||||||
| Cost of revenue |
$ | 2,804 | $ | 2,854 | $ | 1,651 | ||||||
| Sales and marketing |
17,911 | 13,374 | 10,337 | |||||||||
| Research and development |
3,876 | 3,386 | 2,058 | |||||||||
| General and administrative |
11,441 | 9,304 | 5,269 | |||||||||
|
|
|
|
|
|
|
|||||||
| $ | 36,032 | $ | 28,918 | $ | 19,315 | |||||||
|
|
|
|
|
|
|
|||||||
Net Income (Loss) Per Common Share
The following table sets forth the computation of basic and diluted net income (loss) per share for the periods indicated:
| Year Ended December 31, | ||||||||||||
| 2014 | 2013 | 2012 | ||||||||||
| (in thousands, except share and per share data) | ||||||||||||
| Basic net income (loss) per common share calculation: |
||||||||||||
| Net income (loss) attributable to common shares |
$ | (24,631 | ) | $ | (9,979 | ) | $ | 3,839 | ||||
| Weighted average common shares outstanding |
89,886,403 | 87,702,222 | 85,423,074 | |||||||||
|
|
|
|
|
|
|
|||||||
| Basic net income (loss) per common share |
$ | (0.27 | ) | $ | (0.11 | ) | $ | 0.04 | ||||
|
|
|
|
|
|
|
|||||||
F-14
Table of Contents
| Year Ended December 31, | ||||||||||||
| 2014 | 2013 | 2012 | ||||||||||
| (in thousands, except share and per share data) | ||||||||||||
| Diluted net income (loss) per common share calculation: |
||||||||||||
| Net income (loss) attributable to common shares |
$ | (24,631 | ) | $ | (9,979 | ) | $ | 3,839 | ||||
| Weighted average shares used to compute basic net income (loss) per share |
89,886,403 | 87,702,222 | 85,423,074 | |||||||||
| Effect of potentially dilutive securities: |
||||||||||||
| Common stock options, SSARs, restricted stock units and MVSSSARs |
— | — | 2,217,770 | |||||||||
|
|
|
|
|
|
|
|||||||
| Weighted average shares used to compute diluted net income (loss) per share |
89,886,403 | 87,702,222 | 87,640,844 | |||||||||
|
|
|
|
|
|
|
|||||||
| Diluted net income (loss) per common share |
$ | (0.27 | ) | $ | (0.11 | ) | $ | 0.04 | ||||
|
|
|
|
|
|
|
|||||||
Diluted net income (loss) per common share for the periods presented does not reflect the potential issuance of common shares underlying the following securities as the effect would be anti-dilutive:
| Year Ended December 31, | ||||||||||||
| 2014 | 2013 | 2012 | ||||||||||
| Common stock options |
9,820,583 | 9,796,816 | 2,515,661 | |||||||||
| SSARs |
276,837 | — | — | |||||||||
| Restricted stock units |
1,014,914 | 372,452 | 126,020 | |||||||||
| MVSSSARs |
467,710 | 356,867 | 16,478 | |||||||||
|
|
|
|
|
|
|
|||||||
| Total |
11,580,044 | 10,526,135 | 2,658,159 | |||||||||
|
|
|
|
|
|
|
|||||||
Recent Accounting Pronouncements
From time to time, new accounting pronouncements are issued by the Financial Accounting Standards Board (“FASB”) or other standard setting bodies that are adopted by the Company as of the specified effective date. Unless otherwise discussed, the Company believes that the impact of recently issued standards that are not yet effective will not have a material impact on its financial position or consolidated results of operations upon adoption.
In May 2014, the FASB issued Accounting Standards Update No. 2014-09, Revenue from Contracts with Customers: Topic 606 (ASU 2014-09), to supersede nearly all existing revenue recognition guidance under U.S. GAAP. The core principle of ASU 2014-09 is to recognize revenues when promised goods or services are transferred to customers in an amount that reflects the consideration that is expected to be received for those goods or services. ASU 2014-09 defines a five step process to achieve this core principle and, in doing so, it is possible more judgment and estimates may be required within the revenue recognition process than required under existing U.S. GAAP. ASU 2014-09 is effective for the Company beginning on January 1, 2017 using either of two methods: (i) retrospective to each prior reporting period presented with the option to elect certain practical expedients as defined within ASU 2014-09; or (ii) retrospective with the cumulative effect of initially applying ASU 2014-09 recognized at the date of initial application and providing certain additional disclosures as defined per ASU 2014-09. The Company is currently evaluating the impact of adopting ASU 2014-09 on its consolidated financial statements and has not yet selected a transition method, nor has it determined the effect of the standard on its ongoing financial reporting.
F-15
Table of Contents
In August 2014, the FASB issued Accounting Standards Update No. 2014-15, Disclosure of Uncertainties about an Entity’s Ability to Continue as a Going Concern (ASU 2014-15), to provide guidance on management’s responsibility in evaluating whether there is substantial doubt about a company’s ability to continue as a going concern and to provide related footnote disclosures. ASU 2014-15 is effective for the Company beginning in the first quarter of 2016 with early adoption permitted. The adoption of this standard is not expected to have a material impact on the Company’s consolidated financial statements.
| (3) | Acquisitions |
Vizubi
On December 23, 2014, the Company acquired all of the outstanding shares of Vizubi Software Srl, an Italian company, and all of the outstanding shares of Vizubi, Inc., a U.S. corporation (collectively “Vizubi”). Vizubi’s NPrinting product allows organizations to create visually-appealing reports with drag-and-drop simplicity, in a variety of popular formats, using data and analytics from QlikView. The Company purchased Vizubi for a total maximum purchase price of approximately $21.3 million. The Company paid approximately $6.8 million to the sellers at closing. In addition, the preliminary purchase price includes approximately $2.8 million of deferred payments to be made in first quarter of 2015. The total maximum purchase price also includes approximately $11.7 million of contingent consideration payable upon the achievement of certain product development milestones and financial targets as set forth in the purchase agreement governing the transaction. At the purchase date, the Company preliminarily estimated the fair value of the contingent consideration at approximately $9.0 million, and therefore, this amount was included in the preliminary purchase price. The contingent consideration is payable at various intervals through December 31, 2017. The results of operations and financial position of Vizubi are included in the Company’s consolidated financial statements from and after the date of acquisition. The inclusion of Vizubi did not have a material impact on the Company’s consolidated financial results for the year ended December 31, 2014.
The total preliminary purchase price at December 23, 2014 is summarized in the following table (in thousands):
| Amount of cash paid |
$ | 6,825 | ||
| Deferred purchase price |
2,770 | |||
| Fair value of contingent consideration |
8,992 | |||
|
|
|
|||
| Total preliminary purchase price |
$ | 18,587 | ||
|
|
|
The following table summarizes the preliminary estimated fair values of the assets acquired and the liabilities assumed at December 23, 2014 (in thousands):
| Intangible assets |
$ | 9,577 | ||
| Goodwill |
10,222 | |||
| Cash |
1,088 | |||
| Accounts receivable |
1,671 | |||
| Other assets |
72 | |||
| Liabilities assumed |
(1,036 | ) | ||
| Deferred tax liability |
(3,007 | ) | ||
|
|
|
|||
| Total preliminary purchase price |
$ | 18,587 | ||
|
|
|
The Company preliminarily allocated approximately $9.6 million of the purchase price to finite-lived intangible assets, of which the Company estimated approximately $7.9 million was related to developed technology, approximately $1.3 million was related to customer relationships and approximately $0.4 million was related to trade name. The value assigned to Vizubi’s developed technology was determined by using the excess earnings method. Under this method, the value of the developed technology is a function of the estimated obsolescence curve of the developed technology as of the corresponding valuation date, the expected future net
F-16
Table of Contents
cash flows generated by the developed technology and the discount rate that reflects the level of risk associated with receiving future cash flows attributable to the developed technology. The identified finite intangible assets will be amortized over their estimated useful life. The fair value of the contingent consideration was determined using a discounted cash flow model. Under this model, the fair value of the contingent consideration is a function of the probability of achieving the milestones, the estimated achievement date of the milestones and the discount rate that reflects the level of risk associated with the liability. After preliminarily allocating the purchase price to the assets acquired and liabilities assumed based on an estimation of their fair values at the date of acquisition, the Company recorded goodwill of approximately $10.2 million related to this acquisition. Goodwill represents the excess of the purchase price over the net identifiable tangible and intangible assets acquired. The Company believes the goodwill related to the acquisition was a result of the expected synergies to be realized from combining operations and is not expected to be deductible for income tax purposes.
The Company is still finalizing the purchase price allocation including the valuation of intangible assets acquired and liabilities assumed related to the acquisition. The items pending finalization include the valuation of acquired intangible assets, the assumed deferred revenue and the evaluation of deferred income taxes. The Company expects to complete this purchase price allocation during the first quarter of 2015.
DataMarket
On October 21, 2014, the Company acquired all of the outstanding shares of DataMarket ehf. (“DataMarket”), an Icelandic company. DataMarket specializes in the provisioning of data for analysis. The Company purchased DataMarket for a total maximum purchase price of approximately $13.3 million. The Company paid approximately $11.5 million to the sellers at closing. In addition, the preliminary purchase price includes approximately $0.1 million of deferred payments to be made in first quarter of 2015. The total maximum purchase price also includes approximately $1.7 million of contingent consideration payable upon the achievement of certain product development milestones and financial targets as set forth in the purchase agreement governing the transaction. At the purchase date, the Company estimated the fair value of the contingent consideration at approximately $1.6 million, and therefore, this amount was included in the preliminary purchase price. The contingent consideration is payable at various intervals through September 30, 2017. The results of operations and financial position of DataMarket are included in the Company’s consolidated financial statements from and after the date of acquisition. The inclusion of DataMarket did not have a material impact on the Company’s consolidated financial results for the year ended December 31, 2014.
The total preliminary purchase price at October 21, 2014 is summarized in the following table (in thousands):
| Amount of cash paid |
$ | 11,531 | ||
| Deferred purchase price |
106 | |||
| Fair value of contingent consideration |
1,567 | |||
|
|
|
|||
| Total preliminary purchase price |
$ | 13,204 | ||
|
|
|
The following table summarizes the preliminary estimated fair values of the assets acquired and the liabilities assumed at October 21, 2014 (in thousands):
| Intangible assets |
$ | 3,911 | ||
| Goodwill |
9,876 | |||
| Cash |
23 | |||
| Accounts receivable |
98 | |||
| Other assets |
87 | |||
| Deferred tax asset |
393 | |||
| Liabilities assumed |
(402 | ) | ||
| Deferred tax liability |
(782 | ) | ||
|
|
|
|||
| Total preliminary purchase price |
$ | 13,204 | ||
|
|
|
F-17
Table of Contents
The Company preliminarily allocated approximately $3.9 million of the purchase price to finite-lived intangible assets, of which approximately $2.8 million was related to developed technology, approximately $1.0 million was related to customer relationships and approximately $0.1 million was related to trade name. The value assigned to DataMarket’s developed technology was determined by using the excess earnings method. Under this method, the value of the developed technology is a function of the estimated obsolescence curve of the developed technology as of the corresponding valuation date, the expected future net cash flows generated by the developed technology and the discount rate that reflects the level of risk associated with receiving future cash flows attributable to the developed technology. The Company amortizes the developed technology on a straight-line basis over an estimated useful life of eight years and the Company amortizes the customer relationships and trade name on a straight-line basis over an estimated useful life of four years. The fair value of the contingent consideration was determined using a discounted cash flow model. Under this model, the fair value of the contingent consideration is a function of the probability of achieving the milestones, the estimated achievement date of the milestones and the discount rate that reflects the level of risk associated with the liability. After preliminarily allocating the purchase price to the assets acquired and liabilities assumed based on an estimation of their fair values at the date of acquisition, the Company recorded goodwill of approximately $9.9 million related to this acquisition. Goodwill represents the excess of the purchase price over the net identifiable tangible and intangible assets acquired. The Company believes the goodwill related to the acquisition was a result of the expected synergies to be realized from combining operations and is not expected to be deductible for income tax purposes.
The Company is still finalizing the purchase price allocation including the valuation of intangible assets acquired and liabilities assumed related to the acquisition. The items pending finalization include the valuation of acquired intangible assets and the evaluation of deferred income taxes. The Company expects to complete this purchase price allocation during the first quarter of 2015.
QlikTech Italy
On October 3, 2013, the Company acquired the ongoing operations of its Italian master reseller (“QlikTech Italy”) that specializes in the distribution of QlikView software and provides maintenance and consulting services related to that software. The Company purchased QlikTech Italy for a total maximum purchase price of approximately 7.5 million euros (approximately $10.2 million based on an exchange rate of 1.355 on October 3, 2013). The total maximum purchase price included approximately $1.4 million of contingent consideration payable upon the achievement of certain revenue targets as set forth in the purchase agreement. At the purchase date, the Company estimated that approximately $0.2 million of contingent consideration would be payable based upon the achievement of certain revenue targets, and therefore, this amount was included in the preliminary purchase price. The results of operations and financial position of QlikTech Italy are included in the Company’s consolidated financial statements from and after the date of acquisition. The inclusion of QlikTech Italy did not have a material impact on the Company’s consolidated financial results for the year ended December 31, 2013. Had the acquisition occurred as of the beginning of the periods presented in these consolidated financial statements, the pro forma statements of operations would not be materially different than the consolidated statements of operations presented.
During the three months ended March 31, 2014, the Company completed the purchase price allocation for QlikTech Italy including the valuation of intangible assets acquired; deferred revenue assumed; and deferred income taxes. The adjustments from the preliminary purchase price allocation were immaterial.
F-18
Table of Contents
The following table summarizes the preliminary estimated fair values of the assets acquired and liabilities assumed at October 3, 2013 based on an exchange rate of 1.355 (in thousands):
| Cash |
$ | — | ||
| Other assets |
63 | |||
| Property and equipment |
421 | |||
| Liabilities assumed |
(1,397 | ) | ||
|
|
|
|||
| Net liabilities assumed |
$ | (913 | ) | |
| Deferred tax liability |
(959 | ) | ||
| Intangible assets |
2,033 | |||
| Goodwill |
8,819 | |||
|
|
|
|||
| Total preliminary purchase price |
$ | 8,980 | ||
|
|
|
|||
Of the total estimated purchase price, approximately $2.0 million has been allocated to finite-lived intangible assets acquired, which consists of the preliminary value assigned to QlikTech Italy’s customer relationships. The value assigned to QlikTech Italy’s customer relationships was determined based on the acquired existing customer revenue base, an estimated growth rate on the existing revenue base, an estimated attrition rate and the estimated net cash flows to be generated by this existing customer base, which is discounted to reflect the level of risk associated with receiving future cash flows attributable to the customer relationships. The Company expects to amortize the customer relationships on a straight-line basis over an estimated useful life of nine years. The amortization of intangible assets is not expected to be deductible for income tax purposes.
Goodwill represents the excess of the purchase price over the net identifiable tangible and intangible assets acquired. The Company believes the goodwill related to the acquisition was a result of the expected synergies to be realized from combining operations and is not expected to be deductible for income tax purposes.
NComVA
On May 2, 2013, the Company acquired all of the outstanding shares of NComVA AB (“NComVA”), a Swedish software company that specializes in advanced visualization technology, for a purchase price of approximately 70.4 million Swedish kronor (approximately $10.9 million based on an exchange rate of 0.155 at May 2, 2013). The acquisition of NComVA is expected to expand the use of the Company’s software products by providing expertise and capabilities in advanced visualization and analysis to pair with QlikView’s associative approach to delivering a deeper understanding of data, especially when multiple data sources are analyzed together. The results of operations and financial position of NComVA are included in the Company’s consolidated financial statements from and after the date of acquisition. The inclusion of NComVA did not have a material impact on the Company’s consolidated financial results for the year ended December 31, 2013. Had the acquisition occurred as of the beginning of the periods presented in these consolidated financial statements, the pro forma statements of operations would not be materially different than the consolidated statements of operations presented.
The purchase price for the acquisition of NComVA was approximately $10.9 million. The Company paid approximately $4.9 million of the purchase price to the sellers at closing. In addition, the purchase price includes approximately $2.7 million of deferred payments, which are expected to be made in July 2015, and up to approximately $3.3 million of contingent cash consideration, approximately $1.2 million of which was paid in October 2013 and approximately $2.1 million of which was paid in July 2014 upon the achievement of certain product development milestones. The range of undiscounted amounts the Company may be required to pay for the contingent cash consideration was estimated to be between zero and approximately $3.3 million. The Company estimated that the attainment of these product development milestones was considered highly probable on the purchase date. Accordingly, the Company included approximately $3.3 million of the contingent cash consideration within the purchase price.
F-19
Table of Contents
The following table summarizes the estimated fair values of the assets acquired and liabilities assumed at May 2, 2013 based on an exchange rate of 0.155 (in thousands):
| Cash |
$ | 517 | ||
| Other assets |
18 | |||
| Liabilities assumed |
(473 | ) | ||
|
|
|
|||
| Net assets acquired |
$ | 62 | ||
| Deferred tax liability |
(1,605 | ) | ||
| Intangible assets |
7,296 | |||
| Goodwill |
5,124 | |||
|
|
|
|||
| Total purchase price |
$ | 10,877 | ||
|
|
|
|||
The finite-lived intangible assets relate to acquired technology. The value assigned to NComVA’s acquired technology was determined by employing the cost savings method. Under this method, the value of the acquired technology is determined by calculating the present value of the cost savings that the business expects to make as a result of owning the asset. The Company amortizes the acquired technology on a straight-line basis over an estimated useful life of five years. The amortization of intangible assets is not expected to be deductible for income tax purposes. Accordingly, a deferred tax liability was recorded as part of the purchase price.
Goodwill represents the excess of the purchase price over the net identifiable tangible and intangible assets acquired. The Company believes the goodwill related to the acquisition was a result of the expected synergies to be realized from combining operations and is not expected to be deductible for income tax purposes.
| (4) | Goodwill and Other Intangible Assets |
The Company tests goodwill resulting from acquisitions for impairment annually on October 1, or whenever events or changes in circumstances indicate an impairment. There was no impairment in the years ended December 31, 2014, 2013 or 2012.
The following table provides a rollforward of the Company’s goodwill:
| 2014 | 2013 | |||||||
| (in thousands) | ||||||||
| Balance at January 1 |
$ | 21,233 | $ | 7,367 | ||||
| Acquisitions |
20,098 | 13,943 | ||||||
| Impact of foreign currency translation |
(2,629 | ) | (77 | ) | ||||
|
|
|
|
|
|||||
| Balance at December 31 |
$ | 38,702 | $ | 21,233 | ||||
|
|
|
|
|
|||||
The following table provides information regarding the Company’s intangible assets subject to amortization:
| December 31, 2014 | December 31, 2013 | |||||||||||||||||||||||
| Gross Amount |
Accumulated Amortization |
Net Amount |
Gross Amount |
Accumulated Amortization |
Net Amount |
|||||||||||||||||||
| (in thousands) | ||||||||||||||||||||||||
| Acquired technology |
$ | 21,740 | $ | (4,885 | ) | $ | 16,855 | $ | 13,442 | $ | (3,020 | ) | $ | 10,422 | ||||||||||
| Customer relationships and other identified intangible assets |
4,790 | (923 | ) | 3,867 | 2,775 | (690 | ) | 2,085 | ||||||||||||||||
| Trade names |
766 | (293 | ) | 473 | 391 | (203 | ) | 188 | ||||||||||||||||
|
|
|
|
|
|
|
|
|
|
|
|
|
|||||||||||||
| Total |
$ | 27,296 | $ | (6,101 | ) | $ | 21,195 | $ | 16,608 | $ | (3,913 | ) | $ | 12,695 | ||||||||||
|
|
|
|
|
|
|
|
|
|
|
|
|
|||||||||||||
F-20
Table of Contents
Amortization of intangible assets was approximately $3.0 million, $2.3 million and $0.9 million for the years ended December 31, 2014, 2013 and 2012, respectively. The estimated aggregate amortization expense for each of the succeeding years is as follows: approximately $4.5 million in 2015; $4.4 million in 2016; $3.9 million in 2017; $2.6 million in 2018; $1.5 million in 2019; and $4.3 million thereafter. The weighted average amortization period for all intangible assets is approximately 6.2 years. The weighted average amortization periods for acquired technology is approximately 6.3 years, customer relationships and other identified intangible assets is approximately 6.0 years and trade names is approximately 3.5 years.
| (5) | Fair Value Measurements |
Fair value is defined as the price that would be received from selling an asset or paid to transfer a liability in an orderly transaction between market participants at the measurement date. When determining the fair value measurements for assets and liabilities required or permitted to be recorded at fair value, the Company considers the principal or most advantageous market in which it would transact and it considers assumptions that market participants would use when pricing the asset or liability. The Company evaluates the fair value of certain assets and liabilities using the following fair value hierarchy which ranks the quality and reliability of inputs, or assumptions, used in the determination of fair value:
| • | Level 1 – quoted prices in active markets for identical assets and liabilities |
| • | Level 2 – inputs other than Level 1 quoted prices that are directly or indirectly observable |
| • | Level 3 – unobservable inputs that are not corroborated by market data |
The Company is exposed to certain risks related to its ongoing business operations, including the fluctuation of foreign currency exchange rates. The Company uses short-term foreign currency forward contracts as part of its strategy to manage these risks, but does not hold or issue these or any other types of derivative instruments for trading purposes or speculation. The Company uses these short-term foreign currency forward contracts to manage foreign currency exchange rate risks related to certain intercompany borrowings. The Company executes these instruments with financial institutions that hold an investment grade credit rating. These short-term foreign currency forward contracts do not meet the requirements for hedge accounting and are recorded on the Company’s balance sheet as either an asset or liability measured at their fair value as of the reporting date. The changes in the fair value of derivative instruments, as measured using the three-level hierarchy described above, are recognized in other expense, net, in the Company’s audited consolidated statements of operations.
The Company evaluates assets and liabilities subject to fair value measurements on a recurring and non-recurring basis to determine the appropriate level to classify them for each reporting period. This determination requires significant judgments to be made by the Company. The following table sets forth the Company’s assets and liabilities that were measured at fair value as of December 31, 2014 and 2013, by level within the fair value hierarchy:
| Amounts at Fair Value |
Fair Value Measurement Using | |||||||||||||||
| Level 1 | Level 2 | Level 3 | ||||||||||||||
| (in thousands) | ||||||||||||||||
| As of December 31, 2014 |
||||||||||||||||
| Assets |
||||||||||||||||
| Cash and cash equivalents |
$ | 244,018 | $ | 244,018 | $ | — | $ | — | ||||||||
| Liabilities |
||||||||||||||||
| Accrued contingent consideration |
$ | 10,492 | $ | — | $ | — | $ | 10,492 | ||||||||
| Foreign currency contracts |
$ | 908 | $ | — | $ | 908 | $ | — | ||||||||
| As of December 31, 2013 |
||||||||||||||||
| Assets |
||||||||||||||||
| Cash and cash equivalents |
$ | 227,693 | $ | 227,693 | $ | — | $ | — | ||||||||
| Liabilities |
||||||||||||||||
| Accrued contingent consideration |
$ | 2,263 | $ | — | $ | — | $ | 2,263 | ||||||||
F-21
Table of Contents
The fair value of the Company’s foreign currency short-term forward contracts is determined using Level 2 observable market inputs, including quoted pricing intervals from public data sources, to extrapolate forward points to be added to or subtracted from the closing market spot rate on the reporting date, and then are discounted to present value. As of December 31, 2014, the Company had one short-term foreign currency forward contract outstanding to sell Swedish kronor with a notional value of $107.0 million U.S. dollars. As of December 31, 2014, the unrealized loss on the Company’s short-term foreign currency forward contract was approximately $0.9 million and is recorded within accrued expenses on the audited consolidated balance sheet. At December 31, 2013, the Company had no foreign currency forward contracts outstanding.
A reconciliation of the beginning and ending balances of acquisition related accrued contingent consideration using significant unobservable inputs (Level 3) for the year ended December 31, 2014 follows (in thousands):
| Accrued contingent consideration as of December 31, 2013 |
$ | 2,263 | ||
| Acquisition date fair value of contingent consideration |
10,558 | |||
| Change in fair value of contingent consideration |
(18 | ) | ||
| Payment of contingent consideration |
(2,311 | ) | ||
|
|
|
|||
| Accrued contingent consideration as of December 31, 2014 |
$ | 10,492 | ||
|
|
|
The accrued contingent consideration liability is related to acquisition related contingent consideration. During the year ended December 31, 2014, the Company recorded approximately $10.6 million that is payable based on the achievement of certain product development milestones and financial targets related to the DataMarket and Vizubi acquisitions. During the year ended December 31, 2014, the Company revised its estimate of the amount of contingent consideration that it expected to be payable in connection with its October 2013 acquisition of QlikTech Italy, and accordingly recorded an increase of approximately $0.2 million to the fair value of the contingent consideration liability. In addition, during the year ended December 31, 2014, the change in fair value of the contingent consideration includes a foreign currency translation gain of approximately $0.2 million. During the year ended December 31, 2014, the Company paid approximately $2.0 million of contingent consideration related to the May 2013 acquisition of NComVA and approximately $0.3 million related to the October 2013 acquisition of QlikTech Italy.
Assets and liabilities that are measured at fair value on a non-recurring basis include intangible assets and goodwill. These items are recognized at fair value in the period in which an acquisition is completed, or when they are considered to be impaired. During the year ended December 31, 2014, the Company completed the acquisition of DataMarket and Vizubi (See Note 3), and recorded the fair value of the assets acquired and liabilities assumed on the date of acquisition. During the year ended December 31, 2013, the Company completed the acquisition of NComVA and QlikTech Italy (See Note 3), and recorded the fair value of the assets acquired and liabilities assumed on the date of acquisition. These non-recurring fair value measurements, primarily for intangible assets acquired, were based on Level 3 unobservable inputs. There were no other non-recurring fair value adjustments recorded during the years ended December 31, 2014 and 2013.
| (6) | Property and Equipment, net |
The following is a summary of property and equipment, net for the period indicated:
| December 31, | ||||||||
| 2014 | 2013 | |||||||
| (in thousands) | ||||||||
| Computers and equipment |
$ | 26,357 | $ | 20,298 | ||||
| Furniture and fixtures |
9,688 | 7,854 | ||||||
| Leasehold improvements |
11,450 | 7,100 | ||||||
|
|
|
|
|
|||||
| 47,495 | 35,252 | |||||||
| Less: accumulated depreciation |
(21,040 | ) | (13,752 | ) | ||||
|
|
|
|
|
|||||
| Total |
$ | 26,455 | $ | 21,500 | ||||
|
|
|
|
|
|||||
F-22
Table of Contents
Depreciation and amortization expense relating to property and equipment totaled approximately $8.4 million, $5.7 million and $4.4 million for the years ended December 31, 2014, 2013 and 2012, respectively.
| (7) | Provision for Income Taxes |
The effective tax rates for the years ended December 31, 2014, 2013 and 2012 were (130.1%), 1208.8% and 67.3%, respectively.
Income (loss) before provision for income taxes is allocated as follows:
| Year Ended December 31, | ||||||||||||
| 2014 | 2013 | 2012 | ||||||||||
| (in thousands) | ||||||||||||
| U.S. operations |
$ | 6,556 | $ | (2,259 | ) | $ | (3,452 | ) | ||||
| Foreign operations |
(17,258 | ) | 3,159 | 15,191 | ||||||||
|
|
|
|
|
|
|
|||||||
| Income (loss) before provision for income taxes |
$ | (10,702 | ) | $ | 900 | $ | 11,739 | |||||
|
|
|
|
|
|
|
|||||||
Provision (benefit) for income taxes is comprised of the following:
| Year Ended December 31, | ||||||||||||
| 2014 | 2013 | 2012 | ||||||||||
| (in thousands) | ||||||||||||
| Current |
||||||||||||
| U.S. federal |
$ | 4,392 | $ | 2,524 | $ | 2,772 | ||||||
| State and local |
431 | 390 | 485 | |||||||||
| Foreign |
12,108 | 10,411 | 5,295 | |||||||||
|
|
|
|
|
|
|
|||||||
| $ | 16,931 | $ | 13,325 | $ | 8,552 | |||||||
|
|
|
|
|
|
|
|||||||
| Deferred |
||||||||||||
| U.S. federal |
$ | — | $ | — | $ | — | ||||||
| State and local |
— | — | — | |||||||||
| Foreign |
(3,002 | ) | (2,446 | ) | (652 | ) | ||||||
|
|
|
|
|
|
|
|||||||
| $ | (3,002 | ) | $ | (2,446 | ) | $ | (652 | ) | ||||
|
|
|
|
|
|
|
|||||||
| Total |
||||||||||||
| U.S. federal |
$ | 4,392 | $ | 2,524 | $ | 2,772 | ||||||
| State and local |
431 | 390 | 485 | |||||||||
| Foreign |
9,106 | 7,965 | 4,643 | |||||||||
|
|
|
|
|
|
|
|||||||
| $ | 13,929 | $ | 10,879 | $ | 7,900 | |||||||
|
|
|
|
|
|
|
|||||||
F-23
Table of Contents
The provision for income taxes differs from the amount of taxes determined by applying the U.S. federal statutory income tax rate to income before the provision for income taxes as a result of the following:
| Year Ended December 31, | ||||||||||||
| 2014 | 2013 | 2012 | ||||||||||
| (in thousands) | ||||||||||||
| U.S. federal statutory income tax |
$ | (3,638 | ) | $ | 306 | $ | 3,991 | |||||
| Increase (reduction) in income taxes resulting from: |
||||||||||||
| Effect of foreign operations |
7,690 | 4,499 | (1,394 | ) | ||||||||
| Change in valuation allowance |
8,075 | 2,195 | 3,564 | |||||||||
| State and local income taxes, net of federal income tax benefit |
284 | 257 | 320 | |||||||||
| Permanent differences |
2,247 | 3,236 | 1,792 | |||||||||
| Unrecognized tax benefits |
(909 | ) | (192 | ) | (453 | ) | ||||||
| Other |
180 | 578 | 80 | |||||||||
|
|
|
|
|
|
|
|||||||
| Total |
$ | 13,929 | $ | 10,879 | $ | 7,900 | ||||||
|
|
|
|
|
|
|
|||||||
Deferred tax assets and liabilities reflect the net tax effects of temporary differences between the carrying amount of assets and liabilities for financial reporting purposes and the amounts used for income tax purposes.
Significant components of the Company’s deferred tax assets and liabilities are as follows:
| December 31, 2014 | December 31, 2013 | |||||||
| (in thousands) | ||||||||
| Deferred tax assets: |
||||||||
| Accrued expenses |
$ | 3,569 | $ | 2,705 | ||||
| Foreign tax credits |
3,692 | 2,436 | ||||||
| Stock-based compensation |
13,997 | 9,430 | ||||||
| Other assets |
4,105 | 2,448 | ||||||
| Net operating loss carryforwards |
7,785 | 5,873 | ||||||
|
|
|
|
|
|||||
| Total gross deferred tax assets |
33,148 | 22,892 | ||||||
| Less: valuation allowance |
(21,993 | ) | (15,280 | ) | ||||
|
|
|
|
|
|||||
| Net deferred tax assets |
11,155 | 7,612 | ||||||
| Deferred tax liabilities: |
||||||||
| Depreciation and amortization |
(8,939 | ) | (4,707 | ) | ||||
| Other |
(633 | ) | (350 | ) | ||||
|
|
|
|
|
|||||
| Total deferred tax liabilities |
(9,572 | ) | (5,057 | ) | ||||
|
|
|
|
|
|||||
| Total net deferred tax assets |
$ | 1,583 | $ | 2,555 | ||||
|
|
|
|
|
|||||
| As reported |
||||||||
| Deferred tax assets, current |
$ | 2,082 | $ | 1,886 | ||||
| Deferred tax assets, non-current |
3,015 | 2,107 | ||||||
| Deferred tax liabilities, current |
(37 | ) | (544 | ) | ||||
| Deferred tax liabilities, non-current |
(3,477 | ) | (894 | ) | ||||
|
|
|
|
|
|||||
| Total net deferred tax assets |
$ | 1,583 | $ | 2,555 | ||||
|
|
|
|
|
|||||
F-24
Table of Contents
The following table summarizes the changes in the Company’s valuation allowance on deferred tax assets for the period indicated:
| Year Ended December 31, | ||||||||||||
| 2014 | 2013 | 2012 | ||||||||||
| (in thousands) | ||||||||||||
| Balance at the beginning of the period |
$ | 15,280 | $ | 18,667 | $ | 7,903 | ||||||
| Amounts charged to expense |
8,075 | 2,195 | 3,564 | |||||||||
| Acquisition related |
— | — | 7,436 | |||||||||
| Change in valuation allowance due to liquidiation of subsidiary |
— | (5,361 | ) | — | ||||||||
| Other decreases |
(1,362 | ) | (221 | ) | (236 | ) | ||||||
|
|
|
|
|
|
|
|||||||
| Balance at the end of the period |
$ | 21,993 | $ | 15,280 | $ | 18,667 | ||||||
|
|
|
|
|
|
|
|||||||
In assessing the realizability of deferred tax assets, management considers whether it is more-likely-than-not that some portion or all of the deferred tax assets will not be realized in the near term. The ultimate realization of deferred tax assets is dependent upon the generation of future taxable income during the periods in which those temporary differences become deductible.
Based upon the level of historical taxable income and projection for future taxable income during the periods in which the temporary differences become deductible, the Company determined it is not more-likely-than-not that all U.S. and Swedish deferred tax assets will be realized. Therefore, the Company has recorded a full valuation allowance against all U.S. and Swedish deferred tax assets as of December 31, 2014.
For jurisdictions outside of the U.S. and Sweden, based upon the level of historical taxable income and projections for future taxable income over the periods in which the deferred tax assets are deductible as of December 31, 2014, management believes it is more-likely-than-not that the Company will realize the benefits associated with the deductible differences in these foreign jurisdictions. The amount of the deferred tax assets considered realizable could be reduced in the near term if estimates of future taxable income during the carry forward period are reduced.
As of December 31, 2014, the Company has approximately $6.4 million of U.S. federal net operating loss carry forwards, approximately $23.1 million of state net operating loss carry forwards and approximately $23.0 million of foreign net operating loss carry forwards. The majority of the foreign net operating losses carry forward indefinitely. The net operating loss carry forwards in the U.S. will expire, if unused, in 2031. The Company also has approximately $2.3 million of federal tax credits that will expire, if unused, between 2017 and 2020.
Utilization of U.S. federal and state net operating loss carry forwards may be subject to limitations under Section 382 of the Internal Revenue Code of 1986 due to ownership change limitations that may have occurred previously or that could occur in the future. These ownership changes may limit the amount of net operating loss carry forwards that can be utilized annually to offset future taxable income. The Company has not completed a study to assess whether ownership changes have occurred. There also could be additional ownership changes in the future which may result in additional limitations of these net operating loss carry forwards.
In addition to the aforementioned net operating loss carry forwards, the Company has approximately $127.9 million in cumulative income tax deductions from the exercise of common stock options and the vesting of restricted stock units, which have expiration periods beginning in 2030 through 2033. The income tax benefit for these carryforwards will be recorded in additional paid-in-capital when realized. Since the Company was able to reduce actual cash income taxes for U.S. federal and state purposes and in certain foreign jurisdictions, the realization of approximately $6.4 million, $4.0 million and $4.8 million of income tax savings was recognized as a benefit to additional paid-in-capital during the years ended December 31, 2014, 2013 and 2012, respectively.
F-25
Table of Contents
The Company does not recognize tax benefits that are not more-likely-than-not to be supported based upon the technical merits of the tax position taken. In assessing its unrecognized tax benefits, the Company has analyzed its tax return filing positions in all of the federal, state and foreign filing jurisdictions where it is required to file income tax returns, as well as all open years in those jurisdictions.
The following table indicates the changes to the Company’s unrecognized tax benefits:
| Year Ended December 31, | ||||||||||||
| 2014 | 2013 | 2012 | ||||||||||
| (in thousands) | ||||||||||||
| Balance at beginning of period |
$ | 2,341 | $ | 2,435 | $ | 2,871 | ||||||
| Expiration of statute of limitations for the assessment of taxes |
(195 | ) | (211 | ) | (333 | ) | ||||||
| Increase related to current tax year |
— | 126 | 124 | |||||||||
| Decrease related to prior tax years |
(454 | ) | — | (244 | ) | |||||||
| Decrease as a result of settlements |
(85 | ) | — | — | ||||||||
| Foreign currency translation adjustments |
(141 | ) | (9 | ) | 17 | |||||||
|
|
|
|
|
|
|
|||||||
| Balance at end of period |
$ | 1,466 | $ | 2,341 | $ | 2,435 | ||||||
|
|
|
|
|
|
|
|||||||
Of the Company’s unrecognized tax benefits, approximately $1.5 million would affect the Company’s effective tax rate in the period recognized. The Company does not expect its unrecognized tax benefit liability to change significantly over the next 12 months. The Company recognizes interest and penalties as a component of income tax expense in the consolidated statement of operations. In each of the years ended December 31, 2013 and 2012, the Company recorded less than $0.1 million in interest and penalties in income tax expense. As of December 31, 2014, there was no accrued interest and penalties.
Although the Company believes that the estimates and assumptions supporting its assessments are reasonable, the final determination of tax audits and any related litigation could be materially different than that which is reflected in the historical income tax provision and recorded assets and liabilities. Based on the results of an audit or litigation, there could be a material effect on the Company’s income tax benefit (provision), net income (loss) or cash flows in the period or periods for which that determination is made.
The Company and its subsidiaries file U.S. federal income tax returns, as well as income tax returns in multiple U.S. state and foreign jurisdictions. Because of net operating losses, which were used in the 2009 tax return, the Company’s U.S. federal tax returns for 2003 and later years remain subject to examination. The Company is subject to non-U.S. income tax examinations for the tax years 2009 through 2014.
The Company expects the earnings of its foreign subsidiaries will continue to be reinvested indefinitely. Accordingly, at December 31, 2014, no provision has been made for U.S. federal and state income taxes on these foreign earnings of approximately $32.7 million. Upon distribution of these earnings, in the form of dividends or otherwise, the Company may be subject to U.S. income taxes and a minimal amount of foreign withholding taxes under current withholding tax rules. The determination of the amount of unrecognized deferred U.S. income tax on these earnings is not practicable because of the complexities with the hypothetical calculations.
| (8) | Capital Stock |
The Company’s authorized capital consists of 300,000,000 shares of Common Stock, par value $0.0001 per share, and 10,000,000 shares of preferred stock, par value $0.0001 per share.
Common Stock
Outstanding shares. At December 31, 2014, the Company had outstanding 90,852,434 shares of Common Stock.
F-26
Table of Contents
As of December 31, 2014, there were 9,820,583 shares of Common Stock subject to outstanding options, 276,837 shares of Common Stock subject to outstanding SSARs, 1,014,914 shares of Common Stock issuable upon vesting of restricted stock units outstanding and 467,710 shares of Common Stock issuable for MVSSSARs based on the value equal to the difference between the exercise price and the then current market price, subject to a predetermined cap.
Voting Rights. Each holder of Common Stock is entitled to one vote for each share of common stock held on all matters submitted to a vote of the stockholders, including the election of directors. The Company’s restated certificate of incorporation and amended and restated bylaws do not provide for cumulative voting rights. Because of this, the holders of a majority of the shares of common stock entitled to vote in any election of directors can elect all of the directors standing for election, if they should so choose.
Dividends. Subject to preferences that may be applicable to any then outstanding preferred stock, the holders of the Company’s outstanding shares of common stock are entitled to receive dividends, if any, as may be declared from time to time by the Company’s board of directors out of legally available funds. At present, the Company has no plans to issue dividends.
Liquidation Preference. In the event of the Company’s liquidation, dissolution or winding up, holders of common stock will be entitled to share ratably in the net assets legally available for distribution to stockholders after the payment of all of the Company’s debts and other liabilities, subject to the satisfaction of any liquidation preference granted to the holders of any outstanding shares of preferred stock.
Other Rights and Preferences. Holders of the Company’s common stock have no preemptive, conversion or subscription rights, and there are no redemption or sinking fund provisions applicable to the Company’s common stock. The rights, preferences and privileges of the holders of common stock are subject to, and may be adversely affected by, the rights of the holders of shares of any series of the Company’s preferred stock that the Company may designate and issue in the future.
Fully Paid and Non-assessable. All of the Company’s outstanding shares of common stock are fully paid and non-assessable.
Preferred Stock
At December 31, 2014 and 2013, the Company had no shares of preferred stock outstanding.
The Company’s board of directors is authorized to issue preferred stock in one or more series, to establish the number of shares to be included in each such series and to fix the designation, powers, preferences and rights of such shares and any qualifications, limitations or restrictions thereof. The issuance of preferred stock may have the effect of delaying, deferring or preventing a change in control of the Company without further action by the stockholders and may adversely affect the voting and other rights of the holders of common stock. The issuance of preferred stock with voting and conversion rights may adversely affect the voting power of the holders of common stock, including the loss of voting control to others. At present, the Company has no plans to issue any preferred stock.
| (9) | Commitments and Contingencies |
Litigation
The Company is party to routine litigation incidental to the ordinary course of its business and may from time to time become subject to additional proceedings or additional claims or remedies sought in current proceedings. These actions typically seek, among other things, breach of contract or employment-related damages, intellectual property claims for damages, punitive damages, civil penalties or other losses or declaratory relief. Although there can be no assurance as to the outcome of any such proceedings, the Company does not believe any of the proceedings currently pending, if determined adverse, would individually or in the aggregate have a material adverse effect on the Company’s business, operating results or financial condition.
F-27
Table of Contents
The Company’s intellectual property is an essential element of its business. The Company owns registered trademarks for “Qlik,” “QlikTech,” “Qlik® Sense,” “QlikView” and the Company’s logos. The Company relies on a combination of copyright, trademark, trade dress and trade secrecy laws, as well as confidentiality procedures and contractual restrictions, to establish and protect the Company’s proprietary rights both domestically and abroad. These laws, procedures and restrictions provide only limited protection. As of December 31, 2014, the Company had eight issued U.S. patents and had nine pending applications for U.S. patents. In addition, as of December 31, 2014, the Company had 21 issued and 21 pending applications for foreign patents. Any future patents issued to the Company may be challenged, invalidated or circumvented. Any patents that might be issued in the future, with respect to pending or future patent applications may not provide sufficiently broad protection or may not prove to be enforceable in actions against alleged infringers. The Company endeavors to enter into agreements with the Company’s employees and contractors and with parties with whom the Company does business in order to limit access to and disclosure of the Company’s proprietary information.
Leases
The Company conducts its operations in leased facilities under leases expiring at various dates through 2022. Rent expense was approximately $14.7 million, $12.7 million and $11.1 million for the years ended December 31, 2014, 2013 and 2012, respectively.
The future minimum lease payments under non-cancelable operating leases are as follows (in thousands):
| Year ending December 31: |
||||
| 2015 |
$ | 16,662 | ||
| 2016 |
14,523 | |||
| 2017 |
12,884 | |||
| 2018 |
11,471 | |||
| 2019 |
7,935 | |||
| Thereafter |
9,749 | |||
|
|
|
|||
| Total future minimum lease payments |
$ | 73,224 | ||
|
|
|
The Company’s significant lease agreements relate to the global corporate headquarters and principal executive offices located in Radnor, Pennsylvania, its primary research and development center in Lund, Sweden and its offices located in Winnersh, United Kingdom. The Company’s lease agreement for its global corporate headquarters and principal executive offices has a term of ten years and expires in the fourth quarter of 2021. The lease agreements related to the Company’s primary research and development center has a term of eight years and expires in the second quarter of 2019. The Company’s lease agreement for its offices in Winnersh, United Kingdom has a term of ten years and expires in the first quarter of 2022.
| (10) | Business and Geographic Segment Information |
The Company currently operates in one business segment, namely, the development, commercialization and implementation of software products and related services. The Company is managed and operated as one business. A single management team that reports to the chief operating decision maker comprehensively manages the entire business. The Company does not operate any material separate lines of business or separate business entities with respect to its products or product development.
F-28
Table of Contents
The following geographic data includes revenues generated by subsidiaries located within that geographic region. The Company’s revenues were generated in the following geographic regions for the periods indicated:
| Year Ended December 31, | ||||||||||||
| 2014 | 2013 | 2012 | ||||||||||
| (in thousands) | ||||||||||||
| The Americas |
$ | 202,124 | $ | 174,510 | $ | 135,008 | ||||||
| Europe |
289,288 | 249,109 | 216,564 | |||||||||
| Rest of world |
65,385 | 46,831 | 36,965 | |||||||||
|
|
|
|
|
|
|
|||||||
| Consolidated total |
$ | 556,797 | $ | 470,450 | $ | 388,537 | ||||||
|
|
|
|
|
|
|
|||||||
During the year ended December 31, 2014, sales from customers in the U.S. and the United Kingdom were approximately $160.5 million and $57.7 million, respectively. During the year ended December 31, 2013, sales from customers in the U.S. and the United Kingdom were approximately $139.7 million and $42.3 million, respectively. During the year ended December 31, 2012, sales from customers in the U.S. and the United Kingdom were approximately $108.3 million and $39.1 million, respectively.
The following geographic data includes property and equipment, net based on physical location within that geographic region.
| As of December 31, | ||||||||
| 2014 | 2013 | |||||||
| (in thounsands) | ||||||||
| The Americas |
$ | 16,111 | $ | 11,117 | ||||
| Europe |
8,186 | 9,190 | ||||||
| Rest of world |
2,158 | 1,193 | ||||||
|
|
|
|
|
|||||
| Consolidated total |
$ | 26,455 | $ | 21,500 | ||||
|
|
|
|
|
|||||
As of December 31, 2014, property and equipment, net held in the U.S. and Sweden were approximately $15.7 million and $4.6 million, respectively. As of December 31, 2013, property and equipment, net held in the U.S. and Sweden were approximately $10.6 million and $5.2 million, respectively.
| (11) | Share-Based Compensation |
In 2004, the Company’s Board of Directors and stockholders approved the Company’s 2004 Omnibus Stock Option and Award Plan (“2004 Plan”) which provided for the granting of either incentive or nonqualified common stock options and other types of awards to purchase up to 11,124,400 shares of the Company’s common stock. In 2007, the Company’s Board of Directors and stockholders approved the Company’s 2007 Omnibus Stock Option and Award Plan (“2007 Plan”). The 2007 Plan provided for the granting of either incentive common stock options or nonqualified common stock options and other types of awards to purchase up to 18,124,400 shares of the Company’s common stock. The 2004 Plan and the 2007 Plan provided for stock-based awards to employees, directors and advisors. Common stock options were granted at a strike price not less than the estimated fair market value at the date of grant as determined by the Board of Directors.
The Company’s 2010 Equity Incentive Plan (“2010 Plan”) took effect on the effective date of the registration statement, July 16, 2010, for the Company’s IPO. The Company initially reserved 3,300,000 shares of its common stock for issuance under the 2010 Plan. The number of shares reserved for issuance under the 2010 Plan will be increased automatically on January 1st of each year by a number equal to the smallest of (i) 3,300,000 shares; (ii) 3.75% of the shares of common stock outstanding at that time; or (iii) a number of shares determined by the Company’s Board of Directors. As of December 31, 2014, there were 3,213,021 shares available for grant under the 2010 Plan. In February 2015, the number of shares of common stock authorized for issuance under the 2010 Plan was automatically increased by 3,300,000 shares.
F-29
Table of Contents
The 2004 Plan, 2007 Plan and 2010 Plan were designed to help attract and retain the Company and its subsidiaries’ personnel, to reward employees and directors for past services and to motivate such individuals through added incentives to further contribute to the success of the Company. The maximum term for options granted is ten years. Options granted pursuant to the 2004 Plan, 2007 Plan and 2010 Plan generally vest at 25% after the first year and then vest 6.25% each quarter over the remaining three years.
Common Stock Options and SSARs
The Company uses the Black-Scholes option-pricing model to value common stock option awards and SSARs. The Black-Scholes option-pricing model requires the input of subjective assumptions, including the expected term of the stock-based compensation awards and stock price volatility. The Company uses blended volatility to estimate expected volatility. Blended volatility includes a weighting of the Company’s historical volatility from the date of its IPO to the respective grant date and an average of the Company’s peer group historical volatility consistent with the expected term of the common stock option. The Company’s peer group volatility includes the historical volatility of certain companies that share similar characteristics in terms of revenue size and industry. The Company expects to continue to use a larger proportion of its own stock price volatility in future periods as the Company develops additional experience of its own common stock price fluctuations considered in relation to the expected term of the common stock option. For common stock options granted prior to the third quarter of 2013, the Company based the expected term on the simplified method. Beginning in the third quarter of 2013, the Company began using its historical activity related to common stock option exercises and post-vesting forfeitures in order to estimate the expected term of its common stock option awards, as the Company believes it now has a sufficient amount of experience to provide a reasonable basis for the calculation of the expected term. This change in estimate did not have a material impact on the results of operations for the years ended December 31, 2014 or 2013. The risk-free interest rate used to value common stock option awards is based on the U.S. Treasury yield curve with a remaining term equal to the expected term assumed at the grant date. The assumptions used in calculating the fair value of stock-based compensation awards represent management’s best estimate and involve inherent uncertainties and the application of management judgment. As a result, if factors change and management uses different assumptions, stock-based compensation expense could be materially different in the future.
For all grants subsequent to the Company’s July 2010 IPO, the exercise price of the award is equal to the Company’s stock price on the date of grant. For all option grants prior to the Company’s IPO, the fair value of the Common Stock underlying the option grants was determined by the Company’s Board of Directors, with the assistance of management, which intended all options granted to be exercisable at a price per share not less than the per share fair value of the Company’s Common Stock underlying those options on the date of grant.
The following provides a summary of the common stock option activity for the Company as of the noted dates:
| Number of Shares |
Weighted- Average Exercise Price |
Weighted- Average Remaining Contractual Term (Years) |
||||||||||
| Outstanding as of January 1, 2014 |
9,796,816 | $ | 20.44 | 7.79 | ||||||||
| Granted |
2,687,692 | 24.13 | — | |||||||||
| Exercised |
(1,665,625 | ) | 11.55 | — | ||||||||
| Forfeited |
(998,300 | ) | 23.77 | — | ||||||||
|
|
|
|||||||||||
| Outstanding as of December 31, 2014 |
9,820,583 | $ | 22.62 | 7.70 | ||||||||
|
|
|
|||||||||||
| Exercisable at December 31, 2014 |
4,650,768 | $ | 20.32 | 6.58 | ||||||||
| Vested and expected to vest at December 31, 2014 |
9,248,719 | $ | 22.51 | 7.64 | ||||||||
F-30
Table of Contents
The grant date weighted-average fair value per common stock option for the years ended December 31, 2014, 2013 and 2012 was approximately $9.89, $12.64 and $9.83, respectively. The total fair value of the common stock options that vested during the years ended December 31, 2014, 2013 and 2012 was approximately $25.9 million, $22.5 million and $14.3 million, respectively.
Proceeds from the exercise of common stock options were approximately $19.2 million, $23.1 million and $5.5 million for the years ended December 31, 2014, 2013, and 2012, respectively. The total intrinsic value of common stock options exercised during 2014, 2013 and 2012 was approximately $27.7 million, $51.9 million and $43.0 million, respectively. The aggregate intrinsic value of fully vested common stock options outstanding as of December 31, 2014 is approximately $49.5 million. In addition, the aggregate intrinsic value of common stock options expected to vest as of December 31, 2014 is approximately $78.1 million. As a result of option exercises in certain jurisdictions in which the exercise reduced taxable income, the Company recorded an excess tax benefit from stock-based compensation of approximately $6.4 million, $4.0 million and $4.8 million for the years ended December 31, 2014, 2013, and 2012, respectively.
The following provides a summary of the SSARs activity for the Company as of the noted dates:
| Number of Shares |
Weighted- Average Exercise Price |
|||||||
| Outstanding as of January 1, 2014 |
— | $ | — | |||||
| Granted |
278,917 | 28.27 | ||||||
| Exercised |
— | — | ||||||
| Forfeited |
(2,080 | ) | 27.00 | |||||
|
|
|
|||||||
| Outstanding as of December 31, 2014 |
276,837 | $ | 28.28 | |||||
|
|
|
|||||||
| Exercisable at December 31, 2014 |
21,233 | $ | 27.00 | |||||
| Vested and expected to vest at December 31, 2014 |
261,493 | $ | 28.41 | |||||
The grant date weighted-average fair value for SSARs granted during the year December 31, 2014 was approximately $11.38. For the years ended December 31, 2013 and 2012, the Company did not grant any SSARs.
The assumptions used in the Black-Scholes option-pricing model for common stock options and SSARs are as follows:
| Year Ended December 31, | ||||||
| 2014 | 2013 | 2012 | ||||
| Expected dividend yield |
0.0% | 0.0% | 0.0% | |||
| Risk-free interest rate |
1.5% - 1.8% | 0.9% - 1.7% | 0.8% - 1.2% | |||
| Expected volatility |
41.8% - 44.9% | 46.6% - 47.7% | 46.7% - 47.5% | |||
| Expected term (all other grants, in years) |
5.16 - 5.36 | 5.19 - 6.25 | 6.25 | |||
For the years ended December 31, 2014, 2013 and 2012, the Company recorded stock-based compensation expense of approximately $26.2 million, $23.9 million and $16.1 million, respectively, related to common stock option grants and SSARs. Included in stock-based compensation expense for the year ended December 31, 2013 and 2012 is a charge of approximately $0.9 million and $1.3 million, respectively, related to the modifications of certain common stock option awards of former employees.
As of December 31, 2014, there was approximately $48.4 million of total unrecognized compensation cost, net of estimated forfeitures, related to non-vested employee and non-employee director common stock options and SSARs. The remaining cost is expected to be recognized over a weighted-average period of approximately 2.5 years.
F-31
Table of Contents
Restricted Stock Units
The Company grants restricted stock unit awards to its employees and non-employee directors under the provisions of the 2010 Plan. The fair value of a restricted stock unit is determined by using the closing price of the Company’s common stock on the date of grant. A restricted stock unit award entitles the holder to receive shares of the Company’s common stock as the award vests, which is generally based on length of service. Stock-based compensation expense is amortized on a straight-line basis over the vesting period.
The following provides a summary of the restricted stock unit activity for the Company as of the noted dates:
| Number of Shares |
Weighted- Average Grant Date Fair Value |
|||||||
| Unvested as of January 1, 2014 |
372,452 | $ | 27.12 | |||||
| Granted |
867,874 | 24.04 | ||||||
| Vested |
(159,566 | ) | 28.23 | |||||
| Forfeited |
(65,846 | ) | 23.66 | |||||
|
|
|
|||||||
| Unvested as of December 31, 2014 |
1,014,914 | $ | 24.54 | |||||
|
|
|
|||||||
For the years ended December 31, 2014, 2013 and 2012, the Company recorded stock-based compensation expenses of approximately $7.5 million, $3.1 million and $2.1 million, respectively, related to restricted stock units.
As of December 31, 2014, there was approximately $17.8 million of total unrecognized compensation cost, net of estimated forfeitures, related to unvested restricted stock unit awards. The remaining cost is expected to be recognized over a weighted-average period of approximately 2.8 years.
Maximum Value Stock-settled Stock Appreciation Rights
The Company grants Maximum Value Stock-settled Stock Appreciation Rights (“MVSSSARs”) to its Swedish employees under the provisions of the 2010 Plan. MVSSSARs contain a predetermined cap on the maximum stock price at which point the instrument must be exercised. At exercise, employees holding MVSSSARs will receive shares of the Company’s common stock with a value equal to the difference between the exercise price and the current market price per share of the Company’s common stock, subject to a predetermined cap. The exercise price of MVSSSARs is determined by using the closing price of the Company’s common stock on the date of grant. Vesting is based on length of service. Stock-based compensation expense is amortized on a straight-line basis over the vesting period. The fair value of MVSSSARs is determined by utilizing a lattice model under the option-pricing method. The key inputs to the lattice model are the current price of the Company’s common stock, the fair value of the Company’s common stock at date of grant, the maximum fair value at which the MVSSSARs must be exercised, the vesting period, the contractual term, the volatility, the risk-free interest rate, the employment termination rate and assumptions with respect to early exercise behavior.
The following provides a summary of the MVSSSAR activity for the Company as of the noted dates:
| Number of Shares |
Weighted- Average Exercise Price |
|||||||
| Outstanding as of January 1, 2014 |
974,669 | $ | 25.81 | |||||
| Granted |
515,009 | 24.93 | ||||||
| Exercised |
(117,826 | ) | 19.66 | |||||
| Forfeited |
(106,401 | ) | 26.62 | |||||
|
|
|
|||||||
| Outstanding as of December 31, 2014 |
1,265,451 | $ | 25.96 | |||||
|
|
|
|||||||
F-32
Table of Contents
For the years ended December 31, 2014, 2013 and 2012, the Company recorded stock-based compensation expenses of approximately $2.3 million, $1.9 million and $1.1 million, respectively, related to MVSSSARs.
As of December 31, 2014, there was approximately $4.8 million of total unrecognized compensation cost related to unvested MVSSSARs. The remaining cost is expected to be recognized over a weighted-average period of approximately 2.5 years.
For the year ended December 31, 2014, the Company settled 117,826 MVSSSARs by issuing 38,152 shares of the Company’s common stock. For the year ended December 31, 2013, the Company settled 141,627 MVSSSARs by issuing 36,684 shares of the Company’s common stock. For the year ended December 31, 2011, the Company did not settle any MVSSSARs. If settlement of all outstanding MVSSSARs had occurred on December 31, 2014 at the predetermined cap on the maximum stock price at which point the instrument must be exercised, the Company would have issued 467,710 shares of the Company’s common stock.
| (12) | Shares Reserved for Future Issuance |
At December 31, 2014, the Company had reserved a total of its authorized shares of common stock for issuance under its equity incentive plan and other classes of stock for future issuance as follows:
| Granted and outstanding stock options, SSARs, restricted stock units and MVSSSARs |
11,580,044 | |||
| Future issuance of stock options |
3,213,021 | |||
| Future issuance of preferred stock |
10,000,000 |
In February 2015, the number of shares of common stock authorized for issuance under the 2010 Plan was automatically increased by 3,300,000 shares.
| (13) | Benefits Plans |
The Company sponsors a 401(k) savings plan covering substantially all U.S. employees who meet certain age and employment criteria. Employees may contribute up to the Internal Revenue Service maximum employee contribution each year. The Company has contributed up to a 3% non-elective contribution based on eligible employee earnings. The Company’s non-elective contributions are subject to a graded vesting schedule. The first 50% vests on the second anniversary of the employees hire date and the second 50% vest on the third anniversary of the employees hire date. In the foreign entities, the Company has defined contribution plans for the employees’ retirements who meet certain age, employment, and salary criteria. The Company’s benefit plans expense was approximately $14.1 million, $11.4 million and $8.8 million for the years ended December 31, 2014, 2013 and 2012, respectively.
F-33
Table of Contents
| (14) | Comparison of Summarized Unaudited Quarterly Results |
The following table sets forth certain unaudited quarterly financial information for fiscal 2014 and 2013. This data should be read together with the Company’s consolidated financial statements and the related notes included elsewhere in this Annual Report on Form 10-K. The Company has prepared the unaudited information on a basis consistent with its audited financial statements and have included all adjustments of a normal and recurring nature, which, in the opinion of management, are considered necessary to fairly present the Company’s revenue and operating expenses for the quarters presented. The Company’s historical operating results for any quarter are not necessarily indicative of results for any future period.
| For the Three Months Ended | ||||||||||||||||||||||||||||||||
| March 31, 2013 |
June 30, 2013 |
September 30, 2013 |
December 31, 2013 |
March 31, 2014 |
June 30, 2014 |
September 30, 2014 |
December 31, 2014 |
|||||||||||||||||||||||||
| (in thousands, execept per share data) | ||||||||||||||||||||||||||||||||
| Consolidated statement of operations data: |
||||||||||||||||||||||||||||||||
| Revenue |
$ | 96,548 | $ | 108,007 | $ | 104,100 | $ | 161,795 | $ | 111,112 | $ | 131,618 | $ | 131,284 | $ | 182,783 | ||||||||||||||||
| Cost of revenue |
14,356 | 14,594 | 14,942 | 17,931 | 18,039 | 18,809 | 18,021 | 20,593 | ||||||||||||||||||||||||
|
|
|
|
|
|
|
|
|
|
|
|
|
|
|
|
|
|||||||||||||||||
| Gross profit |
82,192 | 93,413 | 89,158 | 143,864 | 93,073 | 112,809 | 113,263 | 162,190 | ||||||||||||||||||||||||
| Total operating expenses |
98,953 | 102,505 | 92,557 | 111,190 | 116,570 | 119,810 | 121,899 | 131,932 | ||||||||||||||||||||||||
|
|
|
|
|
|
|
|
|
|
|
|
|
|
|
|
|
|||||||||||||||||
| Income (loss) from operations |
(16,761 | ) | (9,092 | ) | (3,399 | ) | 32,674 | (23,497 | ) | (7,001 | ) | (8,636 | ) | 30,258 | ||||||||||||||||||
| Other income (expense), net |
(1,451 | ) | (469 | ) | 64 | (666 | ) | (328 | ) | (11 | ) | (1,701 | ) | 214 | ||||||||||||||||||
|
|
|
|
|
|
|
|
|
|
|
|
|
|
|
|
|
|||||||||||||||||
| Income (loss) before income taxes |
$ | (18,212 | ) | $ | (9,561 | ) | $ | (3,335 | ) | $ | 32,008 | $ | (23,825 | ) | $ | (7,012 | ) | $ | (10,337 | ) | $ | 30,472 | ||||||||||
| Benefit (provision) for income taxes |
5,006 | 1,512 | 6,330 | (23,727 | ) | (2,055 | ) | (3,194 | ) | (4,028 | ) | (4,652 | ) | |||||||||||||||||||
|
|
|
|
|
|
|
|
|
|
|
|
|
|
|
|
|
|||||||||||||||||
| Net income (loss) |
$ | (13,206 | ) | $ | (8,049 | ) | $ | 2,995 | $ | 8,281 | $ | (25,880 | ) | $ | (10,206 | ) | $ | (14,365 | ) | $ | 25,820 | |||||||||||
|
|
|
|
|
|
|
|
|
|
|
|
|
|
|
|
|
|||||||||||||||||
| Net income (loss) per common share: |
||||||||||||||||||||||||||||||||
| Basic |
$ | (0.15 | ) | $ | (0.09 | ) | $ | 0.03 | $ | 0.09 | $ | (0.29 | ) | $ | (0.11 | ) | $ | (0.16 | ) | $ | 0.29 | |||||||||||
| Diluted |
$ | (0.15 | ) | $ | (0.09 | ) | $ | 0.03 | $ | 0.09 | $ | (0.29 | ) | $ | (0.11 | ) | $ | (0.16 | ) | $ | 0.28 | |||||||||||
F-34
Table of Contents
EXHIBIT INDEX
| Exhibit |
Description of Document | |
| 3.2 (4) | Restated Certificate of Incorporation of Registrant | |
| 3.4 (1) | Amended and Restated Bylaws of the Registrant | |
| 4.2 (2) | Form of Registrant’s Common Stock Certificate | |
| 4.3 (1) | Investors’ Rights Agreement, dated November 17, 2004 and as amended on various dates, by and among the Registrant, certain stockholders and the investors listed on the signature pages thereto | |
| 4.3.A (4) | Amendment and Waiver of Notice Agreement, dated June 11, 2010, by and among the Registrant and certain investors listed on the signature pages thereto | |
| 10.11† (3) | Amended and Restated Employment Agreement, dated June 1, 2010, by and between the Registrant and Lars Björk | |
| 10.13† (2) | Employment Agreement, dated May 2, 2005, by and between the Registrant and Leslie Bonney | |
| 10.13.A† (3) | Letter Agreement, dated June 1, 2010, by and between the Registrant and Leslie Bonney | |
| 10.14† (3) | Amended and Restated Employment Offer Letter, dated June 1, 2010, by and between the Registrant and Anthony Deighton | |
| 10.18† (1) | 2004 Omnibus Stock Option and Award Plan | |
| 10.19† (1) | 2007 Omnibus Stock Option and Award Plan | |
| 10.20† (1) | 2010 Omnibus Equity Incentive Plan, as currently in effect | |
| 10.21† (1) | Form of Notice of Director Stock Unit Award under 2010 Omnibus Equity Incentive Plan | |
| 10.21A † (5) | Form of US Employee Notice of Stock Option Grant and Stock Option Agreement under 2010 Omnibus Equity Incentive Plan | |
| 10.21B † (5) | Form of International Employee Notice of Stock Option Grant and Stock Option Agreement under 2010 Omnibus Equity Incentive Plan | |
| 10.21D † (8) | Form of Swedish Employee Notice of Maximum Value Stock-Settled Stock Appreciation Right Grant and Award Agreement under 2010 Omnibus Equity Incentive Plan | |
| 10.21E † (8) | Form of Notice of Employee Restricted Stock Unit Award and Stock Unit Terms and Conditions | |
| 10.21F† (16) | Form of Notice of Stock Option Grant under 2010 Omnibus Equity Incentive Plan | |
| 10.21G† (16) | Form of Notice of Employee Stock Unit Award under 2010 Omnibus Equity Incentive Plan | |
| 10.27† (1) | Omnibus Stock Option and Award Plan Non-Qualified Stock Option Award Agreements granted to Lars Björk under the 2004 Omnibus Stock Option and Award Plan and the 2007 Omnibus Stock Option and Award Plan | |
| 10.27.A† (3) | Omnibus Stock Option and Award Plan Non-Qualified Stock Option Award Agreement granted to Lars Björk under the 2007 Omnibus Stock Option and Award Plan, dated May 21, 2010 | |
| 10.28† (1) | 2004 and 2009 Omnibus Stock Option and Award Plans and Sub-Plans for the UK Agreements granted to Leslie Bonney | |
| 10.28.A† (3) | 2010 Omnibus Stock Option and Award Plan and Sub-Plan for the UK Agreement granted to Leslie Bonney, dated May 21, 2010 | |
1
Table of Contents
| Exhibit |
Description of Document | |
| 10.31† (3) | Omnibus Stock Option and Award Plan Non-Qualified Stock Option Award Agreement granted to John Gavin, Jr. under the 2007 Omnibus Stock Option and Award Plan | |
| 10.36 (1) | Lease, dated November 15, 2005, between the Registrant and Radnor Properties-SDC, L.P. | |
| 10.37 (1) | First Amendment to Lease, dated March 13, 2009, between the Registrant and Radnor Properties-SDC, L.P. | |
| 10.41 (6) | Second Amendment to Lease dated as of November 23, 2010, by and between Radnor Properties – SDC, L.P. and the Registrant | |
| 10.42 (5) | Translation of Transfer Agreement dated December 1, 2010 between QlikTech International AB and Sony Ericsson Mobile Communications AB (SEMC) and two separate lease agreements whereby SEMC leased property from Fastighets AB Remulus Lund 3 | |
| 10.43 (9) | Translation of Lease Agreements dated June 23, 2011 between QlikTech International AB and Fastighets AB Remulus Lund 3 | |
| 10.44 (10) | Third Amendment to Lease dated as of November 23, 2010 by and between Radnor Properties — SDC, L.P. and the Registrant | |
| 10.45 (7) | Fourth Amendment to Lease, dated August 13, 2013, by and between the Registrant and Radnor Properties-SDC, L.P. | |
| 10.46† (11) | Employment Offer Letter, dated May 31, 2013, by and between the Registrant and Diane Adams | |
| 10.47† (12) | Employment Offer Letter, dated June 2, 2013, by and between the Registrant and Timothy J. MacCarrick | |
| 10.50 (13) | Form of Indemnification Agreement | |
| 10.52† (17) | Executive Severance Plan | |
| 10.55 (14) | Fifth Amendment to Lease, dated February 25, 2014, by and between the Registrant and Radnor Properties-SDC, L.P. | |
| 10.56† (15) | Employment Offer Letter, dated April 17, 2014, by and between the Registrant and Eugene D. Jackson | |
| 10.57† (15) | 2014 Executive Performance Award Plan | |
| 10.58† (15) | Form of Swedish Employee Notice of Stock-Settled Stock Appreciation Right Grant and Award Agreement under 2010 Omnibus Equity Incentive Plan | |
| 21.1* | List of subsidiaries of the Registrant (including jurisdiction of organization and names under which subsidiaries do business) | |
| 23.1* | Consent of Independent Registered Public Accounting Firm | |
| 31.1* | Certification of Chief Executive Officer pursuant to Exchange Act Rules 13a-14(a) and 15d-14(a), as adopted pursuant to Section 302 of the Sarbanes-Oxley Act of 2002 | |
| 31.2* | Certification of Chief Financial Officer pursuant to Exchange Act Rules 13a-14(a) and 15d-14(a), as adopted pursuant to Section 302 of the Sarbanes-Oxley Act of 2002 | |
| 32.1** | Certifications of Chief Executive Officer and Chief Financial Officer pursuant to 18 U.S.C. Section 1350 as adopted pursuant to Section 906 of the Sarbanes-Oxley Act of 2002 | |
| 101* | Interactive Data File (Annual Report on Form 10-K, for the year ended December 31, 2012, furnished in XBRL (eXtensible Business Reporting Language)). | |
2
Table of Contents
| † | Compensation arrangement |
| * | Filed herewith |
| ** | The certification attached as Exhibit 32.1 is not deemed “filed” with the SEC and is not to be incorporated by reference into any filing of the registrant under the Securities Act of 1933 or the Securities Exchange Act of 1934, whether made before or after the date hereof and irrespective of any general incorporation language contained in such filing, except to the extent that the registrant specifically incorporates it by reference. |
| (1) | Incorporated by reference to the same numbered exhibit to the Registrant’s Registration Statement on Form S-1 (SEC File No. 333-165844) filed on April 1, 2010. |
| (2) | Incorporated by reference to the same numbered exhibit to the Registrant’s Amendment No. 2 to Registration Statement on Form S-1 (SEC File No. 333-165844) filed on May 27, 2010. |
| (3) | Incorporated by reference to the same numbered exhibit to the Registrant’s Amendment No. 3 to Registration Statement on Form S-1 (SEC File No. 333-165844) filed on June 4, 2010. |
| (4) | Incorporated by reference to the same numbered exhibit to the Registrant’s Amendment No. 4 to Registration Statement on Form S-1 (SEC File No. 333-165844) filed on June 28, 2010. |
| (5) | Incorporated by reference to the same numbered exhibit to the Registrant’s Annual Report on Form 10-K (SEC File No. 001-34803) filed on March 16, 2011. |
| (6) | Incorporated by reference to Exhibit 10.1 to the Registrant’s Current Report on Form 8-K (SEC File No. 001-34803) filed on November 23, 2010. |
| (7) | Incorporated by reference to Exhibit 10.51 to the Registrant’s Quarterly Report on Form 10-Q (SEC File No. 001-34803) filed on November 1, 2013. |
| (8) | Incorporated by reference to the same numbered exhibit to the Registrant’s Quarterly Report on Form 10-Q (SEC File No. 001-34803) filed on August 5, 2011. |
| (9) | Incorporated by reference to Exhibit 10.43 to the Registrant’s Quarterly Report on Form 10-Q (SEC File No. 001-34803) filed on August 5, 2011. |
| (10) | Incorporated by reference to Exhibit 10.44 to the Registrant’s Quarterly Report on Form 10-Q (SEC File No. 001-34803) filed on August 5, 2011. |
| (11) | Incorporated by reference to Exhibit 10.47 to the Registrant’s Quarterly Report on Form 10-Q (SEC File No. 001-34803) filed on August 2, 2013. |
| (12) | Incorporated by reference to Exhibit 10.48 to the Registrant’s Quarterly Report on Form 10-Q (SEC File No. 001-34803) filed on August 2, 2013. |
| (13) | Incorporated by reference to Exhibit 10.45 to the Registrant’s Quarterly Report on Form 10-Q (SEC File No. 001-34803) filed on August 2, 2013. |
| (14) | Incorporated by reference to the same numbered exhibit to the Registrant’s Quarterly Report on Form 10-Q (SEC File No. 001-34803) filed May 2, 2014. |
| (15) | Incorporated by reference to the same numbered exhibit to the Registrant’s Quarterly Report on Form 10-Q (SEC File No. 001-34803) filed August 1, 2014. |
| (16) | Incorporated by reference to the same numbered exhibit to the Registrant’s Quarterly Report on Form 10-Q (SEC File No. 001-34803) filed October 31, 2014. |
| (17) | Incorporated by reference to Exhibit 10.51 to the Registrant’s Annual Report on Form 10-K (SEC File No. 001-34803) filed February 28, 2014. |
3