Attached files
| file | filename |
|---|---|
| EX-21.1 - EX-21.1 - Noble Corp | d837461dex211.htm |
| EX-10.33 - EX-10.33 - Noble Corp | d837461dex1033.htm |
| EXCEL - IDEA: XBRL DOCUMENT - Noble Corp | Financial_Report.xls |
| EX-32.3 - EX-32.3 - Noble Corp | d837461dex323.htm |
| EX-31.1 - EX-31.1 - Noble Corp | d837461dex311.htm |
| EX-32.1 - EX-32.1 - Noble Corp | d837461dex321.htm |
| EX-31.2 - EX-31.2 - Noble Corp | d837461dex312.htm |
| EX-31.3 - EX-31.3 - Noble Corp | d837461dex313.htm |
| EX-32.2 - EX-32.2 - Noble Corp | d837461dex322.htm |
| EX-23.1 - EX-23.1 - Noble Corp | d837461dex231.htm |
Table of Contents
UNITED STATES
SECURITIES AND EXCHANGE COMMISSION
Washington, D.C. 20549
FORM 10-K
| x | ANNUAL REPORT PURSUANT TO SECTION 13 OR 15(d) OF THE SECURITIES EXCHANGE ACT OF 1934 |
For the fiscal year ended December 31, 2014
| ¨ | TRANSITION REPORT PURSUANT TO SECTION 13 OR 15(d) OF THE SECURITIES EXCHANGE ACT OF 1934 |
For the transition period from to
Commission file number: 001-36211
Noble Corporation plc
(Exact name of registrant as specified in its charter)
| England and Wales (Registered Number 08354954) | 98-0619597 | |
| (State or other jurisdiction of incorporation or organization) |
(I.R.S. employer identification number) |
Devonshire House, 1 Mayfair Place, London, England, W1J 8AJ
(Address of principal executive offices) (Zip Code)
Registrant’s telephone number, including area code: +44 20 3300 2300
Securities registered pursuant to Section 12(b) of the Act:
| Title of each class |
Name of each exchange on which registered | |
| Shares, Nominal Value $0.01 per Share | New York Stock Exchange |
Commission file number: 001-31306
Noble Corporation
(Exact name of registrant as specified in its charter)
| Cayman Islands | 98-0366361 | |
| (State or other jurisdiction of incorporation or organization) |
(I.R.S. employer identification number) |
Suite 3D Landmark Square, 64 Earth Close, P.O. Box 31327
George Town, Grand Cayman, Cayman Islands KY1-1206
(Address of principal executive offices) (Zip Code)
Registrant’s telephone number, including area code: (345) 938-0293
Securities registered pursuant to Sections 12(b) and 12(g) of the Act:
None
Indicate by check mark if the registrant is a well-known seasoned issuer, as defined in Rule 405 of the Securities Act.
Yes x No ¨
Indicate by check mark if the registrant is not required to file reports pursuant to Section 13 or Section 15(d) of the Act. Yes ¨ No x
Indicate by check mark whether the registrant (1) has filed all reports required to be filed by Section 13 or 15(d) of the Securities Exchange Act of 1934 during the preceding 12 months, and (2) has been subject to such filing requirements for the past 90 days. Yes x No ¨
Indicate by check mark whether the registrant has submitted electronically and posted on its corporate Website, if any, every Interactive Data File required to be submitted and posted pursuant to Rule 405 of Regulation S-T during the preceding 12 months. Yes x No ¨
Indicate by check mark if disclosure of delinquent filers pursuant to Item 405 of Regulation S-K is not contained herein, and will not be contained, to the best of registrant’s knowledge, in definitive proxy or information statements incorporated by reference in Part III of this Form 10-K or any amendment to this Form 10-K. x
Indicate by check mark whether the registrant is a large accelerated filer, an accelerated filer, a non-accelerated filer, or a smaller reporting company. See the definitions of “large accelerated filer,” “accelerated filer” and “smaller reporting company” in Rule 12b-2 of the Exchange Act.
| Noble Corporation plc: | Large accelerated filer x | Accelerated filer ¨ | Non-accelerated filer ¨ | Smaller reporting company ¨ |
| Noble Corporation: | Large accelerated filer ¨ | Accelerated filer ¨ | Non-accelerated filer x | Smaller reporting company ¨ |
Indicate by check mark whether the registrant is a shell company (as defined in Rule 12b-2 of the Exchange Act).
Yes ¨ No x
As of June 30, 2014, the aggregate market value of the registered shares of Noble Corporation plc held by non-affiliates of the registrant was $8.5 billion based on the closing sale price as reported on the New York Stock Exchange.
Number of shares outstanding and trading at February 13, 2015: Noble Corporation plc – 241,954,168
Number of shares outstanding: Noble Corporation – 261,245,693
DOCUMENTS INCORPORATED BY REFERENCE
The proxy statement for the 2015 annual general meeting of the shareholders of Noble Corporation plc will be incorporated by reference into Part III of this Form 10-K.
This Form 10-K is a combined annual report being filed separately by two registrants: Noble Corporation plc, a public limited company incorporated under the laws of England and Wales (“Noble-UK”), and its wholly-owned subsidiary, Noble Corporation, a Cayman Islands company (“Noble-Cayman”). Noble-Cayman meets the conditions set forth in General Instructions I(1) of Form 10-K and is therefore filing this Form 10-K with the reduced disclosure format contemplated by paragraphs (a) and (c) of General Instruction I(2) of Form 10-K.
Table of Contents
This combined Annual Report on Form 10-K is separately filed by Noble Corporation plc, a public limited company incorporated under the laws of England and Wales (“Noble-UK”), and Noble Corporation, a Cayman Islands company (“Noble-Cayman”). Information in this filing relating to Noble-Cayman is filed by Noble-UK and separately by Noble-Cayman on its own behalf. Noble-Cayman makes no representation as to information relating to Noble-UK (except as it may relate to Noble-Cayman) or any other affiliate or subsidiary of Noble-UK.
This report should be read in its entirety as it pertains to each Registrant. Except where indicated, the Consolidated Financial Statements and the Notes to the Consolidated Financial Statements are combined. References in this Annual Report on Form 10-K to “Noble,” the “Company,” “we,” “us,” “our” and words of similar meaning refer collectively to Noble-UK and its consolidated subsidiaries, including Noble-Cayman after November 20, 2013 and to Noble Corporation, a Swiss corporation (“Noble-Swiss”), and its consolidated subsidiaries for periods through November 20, 2013. Noble-UK became a successor registrant to Noble-Swiss under the Securities Exchange Act of 1934, as amended (the “Exchange Act”), pursuant to Rule 12g-3 of the Exchange Act as a result of the consummation of the Transaction described in Part I, Item 1 of this Annual Report on Form 10-K.
Table of Contents
| Item 1. | Business. |
General
Noble Corporation plc, a public limited company incorporated under the laws of England and Wales (“Noble-UK”), is a leading offshore drilling contractor for the oil and gas industry. We perform contract drilling services with our fleet of mobile offshore drilling units located worldwide. As of the filing date of this Annual Report on Form 10-K, our fleet consisted of 15 jackups, nine drillships and eight semisubmersibles, including one high-specification, harsh environment jackup under construction. This excludes the semisubmersibles, Noble Driller, Noble Jim Thompson and Noble Paul Wolff.
For additional information on the specifications of our fleet, see “Item 2. Properties.—Drilling Fleet.” At December 31, 2014, our fleet was located in the United States, Brazil, Argentina, the North Sea, the Mediterranean, the Middle East, Asia and Australia. Noble and its predecessors have been engaged in the contract drilling of oil and gas wells since 1921.
Spin-off of Paragon Offshore plc (“Paragon Offshore”)
On August 1, 2014, Noble-UK completed the separation and spin-off of a majority of its standard specification offshore drilling business (the “Spin-off”) through a pro rata distribution of all of the ordinary shares of its wholly-owned subsidiary, Paragon Offshore, to the holders of Noble’s ordinary shares. Our shareholders received one share of Paragon Offshore for every three shares of Noble owned as of July 23, 2014, the record date for the distribution. Through the Spin-off, we disposed of most of our standard specification drilling units and related assets, liabilities and business. Prior to the Spin-off, Paragon Offshore issued approximately $1.7 billion of long-term debt. We used the proceeds from this debt to repay certain amounts outstanding under our commercial paper program. The results of operations for Paragon Offshore prior to the Spin-off date and incremental Spin-off related costs have been classified as discontinued operations for all periods presented in this Annual Report on Form 10-K. For additional information regarding the Spin-off, see “Part II Item 8 Financial Statements and Supplementary Data, Note 2—Spin-off of Paragon Offshore plc.”
Consummation of Merger and Redomiciliation
On November 20, 2013, pursuant to the Merger Agreement dated as of June 30, 2013 between Noble Corporation, a Swiss corporation (“Noble-Swiss”), and Noble-UK, Noble-Swiss merged with and into Noble-UK, with Noble-UK as the surviving company (the “Transaction”). In the Transaction, all of the outstanding ordinary shares of Noble-Swiss were cancelled, and Noble-UK issued, through an exchange agent, one ordinary share of Noble-UK in exchange for each ordinary share of Noble-Swiss. The Transaction effectively changed the place of incorporation of our publicly traded parent holding company from Switzerland to the United Kingdom.
Noble Corporation, a Cayman Islands company (“Noble-Cayman”), is an indirect, wholly-owned subsidiary of Noble-UK, our publicly-traded parent company. Noble-UK’s principal asset is all of the shares of Noble-Cayman. Noble-Cayman has no public equity outstanding. The consolidated financial statements of Noble-UK include the accounts of Noble-Cayman, and Noble-UK conducts substantially all of its business through Noble-Cayman and its subsidiaries.
Business Strategy
Our goal is to be the preferred offshore drilling contractor for the oil and gas industry based upon the following core principles:
| • | operate in a manner that provides a safe working environment for our employees while protecting the environment and our assets; |
| • | provide an attractive investment vehicle for our shareholders; and |
| • | deliver superior customer service through a diverse and technically advanced fleet operated by proficient crews. |
2
Table of Contents
Our business strategy has also focused on reshaping our fleet to emphasize our deepwater and high specification jackup capabilities, coupled with utilizing those drilling assets in important oil and gas producing areas throughout the world.
We have actively expanded our deepwater and high-specification drilling capabilities in recent years through the construction of rigs. As part of this technical and operational expansion, we believe that we have a fleet which gives us a competitive advantage for the increasingly complex programs required by our customers. During 2014, we continued to execute our newbuild program, completing the following milestones:
| • | we commenced operations in the first quarter of 2014 on the Noble Houston Colbert, a high-specification, harsh environment jackup, under a 22-month contract in Argentina; |
| • | we commenced operations in the first quarter of 2014 on the Noble Regina Allen, a high-specification, harsh environment jackup, under an 18-month contract in the North Sea; |
| • | we commenced operations in the third quarter of 2014 on the Noble Sam Croft, a dynamically positioned, ultra-deepwater, harsh environment drillship, under a three-year contract in the U.S. Gulf of Mexico; |
| • | we commenced operations in the third quarter of 2014 on the Noble Sam Turner, a high-specification, harsh environment jackup, under a two-year contract in the North Sea; |
| • | we commenced operations in the fourth quarter of 2014 on the Noble Tom Madden, a dynamically positioned, ultra-deepwater, harsh environment drillship, under a three-year contract in the U.S. Gulf of Mexico; |
| • | we completed construction of the Noble Tom Prosser, a high-specification, harsh environment jackup, which was delivered from the shipyard during the second quarter of 2014. This unit is currently undergoing final commissioning and crew familiarization and is scheduled to begin mobilizing to Australia in the third quarter of 2015, after which it will begin operations under an 18-month contract; |
| • | we accepted delivery of the Noble Sam Hartley, a high-specification, harsh environment jackup, which was delivered from the shipyard during the fourth quarter of 2014. The rig is currently undergoing rig modifications before exiting the shipyard in the second quarter of 2015; and |
| • | we continued construction of the Noble Lloyd Noble, (formerly CJ70-Mariner), a high-specification, harsh environment jackup, that is scheduled to commence operations under a four-year contract in the North Sea in mid-2016. |
Our historical strategy with respect to construction of new rigs has typically been to expand our drilling fleet in connection with a long-term drilling contract that covers a substantial portion of our capital investment and provides an acceptable return on our capital employed. However, in response to the addition of a significant number of new, technologically advanced units in the global fleet, changes in customer requirements and preferences and our strong backlog, we determined that in order to maintain long-term competitiveness, it was both necessary and desirable for us to engage in building high-specification jackups and floating units on a speculative basis. In 2011, we began our current newbuild program. To date, we have completed and are operating four drillships and four jackups. Currently, we have one newbuild project remaining, the heavy-duty, harsh environment jackup, Noble Lloyd Noble. Additionally, the Noble Sam Hartley, a newbuild heavy-duty, harsh environment jackup, is currently undergoing post-delivery modifications in the shipyard. The Noble Sam Hartley does not have a customer contract and we continue to market the unit. We currently do not have plans to build additional units on speculation given the market uncertainty. While we may decide to pursue new speculative building in the future, we do not plan to do so until we have better visibility into the offshore drilling market.
Demand for our services is, in part, a function of the worldwide demand for oil and gas and the global supply of mobile offshore drilling units. In recent years, there has been a significant increase in the number of jackups and ultra-deepwater drilling units, many of which are currently under construction without a contract. The introduction of non-contracted newbuild rigs into the marketplace has increased the supply of rigs competing for drilling service contracts. Further, since June 2014 the price of oil has dropped by more than 50 percent. As a result, our customers have reduced their planned exploration and development spending and the number of rigs they have under contract and plan to contract during 2015. This combination of increased supply of drilling rigs and reduced demand for such rigs has resulted in falling dayrates and may result in reduced utilization of our units if current contracts expire.
3
Table of Contents
Drilling Contracts
We typically employ each drilling unit under an individual contract. Although the final terms of the contracts result from negotiations with our customers, many contracts are awarded based upon a competitive bidding process. Our drilling contracts generally contain the following terms:
| • | contract duration extending over a specific period of time or a period necessary to drill a defined number wells; |
| • | provisions permitting early termination of the contract by the customer (i) if the unit is lost or destroyed or (ii) if operations are suspended for a specified period of time due to breakdown of equipment; |
| • | provisions allowing the impacted party to terminate the contract if specified “force majeure” events beyond the contracting parties’ control occur for a defined period of time; |
| • | payment of compensation to us (generally in U.S. Dollars although some customers, typically national oil companies, require a part of the compensation to be paid in local currency) on a “daywork” basis, so that we receive a fixed amount for each day (“dayrate”) that the drilling unit is operating under contract (a lower rate or no compensation is payable during periods of equipment breakdown and repair or adverse weather or in the event operations are interrupted by other conditions, some of which may be beyond our control); |
| • | payment by us of the operating expenses of the drilling unit, including labor costs and the cost of incidental supplies; and |
| • | provisions that allow us to recover certain cost increases from our customers in certain long-term contracts. |
The terms of some of our drilling contracts permit the customer to terminate the contract after specified notice periods by tendering contractually specified termination amounts and, in some cases, without any payment.
Generally, our contracts allow us to recover our mobilization and demobilization costs associated with moving a drilling unit from one regional location to another. When market conditions require us to assume these costs, our operating margins are reduced accordingly. For shorter moves, such as “field moves,” our customers have generally agreed to assume the costs of moving the unit in the form of a reduced dayrate or “move rate” while the unit is being moved.
For a discussion of our backlog of commitments for contract drilling services, please read “Management’s Discussion and Analysis of Financial Condition and Results of Operations – Contract Drilling Services Backlog.”
Offshore Drilling Operations
Contract Drilling Services
We conduct offshore contract drilling operations, which accounted for over 98 percent of our operating revenues for the years ended December 31, 2014, 2013 and 2012. During the three years ended December 31, 2014, we principally conducted our contract drilling operations in the United States, Argentina, Brazil, the North Sea, the Mediterranean, West Africa, the Middle East, Asia and Australia. Revenues from Royal Dutch Shell, plc (“Shell”) and its affiliates accounted for approximately 55 percent, 67 percent and 51 percent of our consolidated operating revenues in 2014, 2013 and 2012, respectively. Revenues from Saudi Arabian Oil Company (“Saudi Aramco”) accounted for approximately 10 percent of our consolidated operating revenues in both 2013 and 2012. Saudi Aramco did not account for more than 10 percent of our consolidated operating revenues in 2014. Revenues from Petróleo Brasileiro S.A. (“Petrobras”) accounted for approximately 11 percent of our consolidated operating revenues in 2012. Petrobras did not account for more than 10 percent of our consolidated operating revenues in either 2014 or 2013. No other single customer accounted for more than 10 percent of our consolidated operating revenues in 2014, 2013 or 2012.
Labor Contracts
During 2011, we commenced a refurbishment project with Shell for one of its rigs. Under the contract, we provided the management and oversight of the project, as well as the personnel necessary to complete the refurbishment. During 2012, the construction phase of the project was completed and the rig began operating off the coast of Alaska. In 2013, in connection with Shell’s delay of the Alaskan Arctic drilling project, this contract was terminated. We provided labor personnel and management services on the project, but did not own or lease the related rig. During 2014, we did not have any active labor contracts nor did we have any revenues or expenses from continuing operations related to labor services contracts.
4
Table of Contents
Competition
The offshore contract drilling industry is a highly competitive and cyclical business characterized by high capital and maintenance costs. We compete with other providers of offshore drilling rigs. Some of our competitors may have access to greater financial resources than we do.
In the provision of contract drilling services, competition involves numerous factors, including price, rig availability and suitability, experience of the workforce, efficiency, safety performance record, condition and age of equipment, operating integrity, reputation, industry standing and client relations. We believe that we compete favorably with respect to all of these factors. In addition to having one of the newest fleets in the industry among large peer companies, we follow a policy of keeping our equipment well-maintained and technologically competitive. However, our equipment could be made obsolete by the development of new techniques and equipment, regulations or customer preferences.
We compete on a worldwide basis, but competition may vary by region at any particular time. Demand for offshore drilling equipment also depends on the exploration and development programs of oil and gas producers, which in turn are influenced by many factors, including: the financial condition of such producers, general global economic conditions, prices of oil and gas, political considerations and national oil and gas production policies.
In addition, industry-wide shortages of supplies, services, skilled personnel and equipment necessary to conduct our business have historically occurred. We cannot assure that any such shortages experienced in the past will not happen again in the future.
Governmental Regulations and Environmental Matters
Political developments and numerous governmental regulations, which may relate directly or indirectly to the contract drilling industry, affect many aspects of our operations. Our contract drilling operations are subject to various laws and regulations in countries in which we operate, including laws and regulations relating to the equipping and operation of drilling units, environmental discharges and related recordkeeping, safety management systems, the reduction of greenhouse gas emissions to address climate change, currency conversions and repatriation, oil and gas exploration and development, taxation of offshore earnings and earnings of expatriate personnel and use of local employees, content and suppliers by foreign contractors. A number of countries actively regulate and control the ownership of concessions and companies holding concessions, the exportation of oil and gas and other aspects of the oil and gas industries in their countries. In addition, government actions, including initiatives by the Organization of Petroleum Exporting Countries (“OPEC”), may continue to contribute to oil price volatility. In some areas of the world, this government activity has adversely affected the amount of exploration and development work done by oil and gas companies and their need for offshore drilling services, and likely will continue to do so.
The regulations applicable to our operations include provisions that regulate the discharge of materials into the environment or require remediation of contamination under certain circumstances. Many of the countries in whose waters we operate from time to time regulate the discharge of oil and other contaminants in connection with drilling and marine operations. Failure to comply with these laws and regulations, or failure to obtain or comply with permits, may result in the assessment of administrative, civil and criminal penalties, imposition of remedial requirements and the imposition of injunctions to force future compliance. We have made, and will continue to make, expenditures to comply with environmental requirements. To date, we have not made material expenditures in order to comply, and we do not believe that our compliance with such requirements will have a material adverse effect on our results of operations, our competitive position or materially increase our capital expenditures. Although these requirements impact the energy and energy services industries, generally they do not appear to affect us in any material respect that is different, or to any materially greater or lesser extent, than other companies in the energy services industry. However, our business and prospects could be adversely affected by regulatory activity that prohibits or restricts our customers’ exploration and production activities, results in reduced demand for our services or imposes environmental protection requirements that result in increased costs to us, our customers or the oil and natural gas industry in general.
5
Table of Contents
The following is a summary of some of the existing laws and regulations that apply in the United States and Europe, which serves as an example of the various laws and regulations to which we are subject. While laws vary widely in each jurisdiction, each of the laws and regulations below addresses environmental issues similar to those in most of the other jurisdictions in which we operate.
Spills and Releases. The Comprehensive Environmental Response, Compensation, and Liability Act in the U.S. (“CERCLA”), and similar state and foreign laws and regulations, impose joint and several liabilities, without regard to fault or the legality of the original act, on certain classes of persons that contributed to the release of a “hazardous substance” into the environment. These persons include the “owner” and “operator” of the site where the release occurred, past owners and operators of the site, and companies that disposed or arranged for the disposal of the hazardous substances found at the site. Responsible parties under CERCLA may be liable for the costs of cleaning up hazardous substances that have been released into the environment and for damages to natural resources. In the course of our ordinary operations, we may generate waste that may fall within CERCLA’s definition of a “hazardous substance.” However, we have to date not received any notification that we are, or may be, potentially responsible for cleanup costs under CERCLA.
Offshore Regulation. In response to the Macondo well blowout incident in April 2010, the U.S. Department of Interior, through the Bureau of Ocean Energy Management (“BOEM”) and the Bureau of Safety and Environmental Enforcement (“BSEE”), has undertaken an aggressive overhaul of the offshore oil and natural gas regulatory process that has significantly impacted oil and gas development in the U.S. Gulf of Mexico. From time to time, new rules, regulations and requirements have been proposed and implemented by BOEM, BSEE or the United States Congress that materially limit or prohibit, and increase the cost of, offshore drilling. These new rules, regulations and requirements including the adoption of new safety requirements and policies relating to the approval of drilling permits, restrictions on oil and gas development and production activities in the U.S. Gulf of Mexico and the Arctic, implementation of safety and environmental management systems, mandatory third party compliance audits, and the promulgation of numerous Notices to Lessees have impacted and may continue to impact our operations. In addition to these rules, regulations and requirements, the U.S. federal government is considering new legislation that could impose additional equipment and safety requirements on operators and drilling contractors in the U.S. Gulf of Mexico, as well as regulations relating to the protection of the environment. If the new regulations, policies, operating procedures and possibility of increased legal liability are viewed by our current or future customers as a significant impairment to expected profitability on projects, then they could discontinue or curtail their offshore operations in the impacted region, thereby adversely affecting our operations by limiting drilling opportunities or imposing materially increased costs.
The Oil Pollution Act. The U.S. Oil Pollution Act of 1990 (“OPA”) and similar regulations, including but not limited to the International Convention for the Prevention of Pollution from Ships (“MARPOL”), adopted by the International Maritime Organization (“IMO”), as enforced in the United States through the domestic implementing law called the Act to Prevent Pollution from Ships, impose certain operational requirements on offshore rigs operating in the U.S. and govern liability for leaks, spills and blowouts involving pollutants. OPA imposes strict, joint and several liabilities on “responsible parties” for damages, including natural resource damages, resulting from oil spills into or upon navigable waters, adjoining shorelines or in the exclusive economic zone of the United States. A “responsible party” includes the owner or operator of an onshore facility and the lessee or permit holder of the area in which an offshore facility is located. OPA establishes a liability limit for onshore facilities of $350 million, while the liability limit for offshore facilities is equal to all removal costs plus up to $75 million in other damages. In December 2014, BOEM proposed increasing this liability limit to $134 million. These liability limits may not apply if a spill is caused by a party’s gross negligence or willful misconduct, if the spill resulted from violation of a federal safety, construction or operating regulation, or if a party fails to report a spill or to cooperate fully in a clean-up.
Regulations under OPA require owners and operators of rigs in United States waters to maintain certain levels of financial responsibility. The failure to comply with OPA’s requirements may subject a responsible party to civil, criminal, or administrative enforcement actions. We are not aware of any action or event that would subject us to liability under OPA, and we believe that compliance with OPA’s financial assurance and other operating requirements will not have a material impact on our operations or financial condition.
Waste Handling. The U.S. Resource Conservation and Recovery Act (“RCRA”), and similar state, local and foreign laws and regulations govern the management of wastes, including the treatment, storage and disposal of hazardous wastes. RCRA imposes stringent operating requirements, and liability for failure to meet such requirements, on a person who is either a “generator” or “transporter” of hazardous waste or an “owner” or “operator” of a hazardous waste treatment, storage or disposal facility. RCRA and many state counterparts
6
Table of Contents
specifically exclude from the definition of hazardous waste drilling fluids, produced waters, and other wastes associated with the exploration, development, or production of crude oil and natural gas. As a result, our operations generate minimal quantities of RCRA hazardous wastes. However, these wastes may be regulated by the United States Environmental Protection Agency (“EPA”) or state agencies as solid waste. In addition, ordinary industrial wastes, such as paint wastes, waste solvents, laboratory wastes, and waste compressor oils may be regulated under RCRA as hazardous waste. We do not believe the current costs of managing our wastes, as they are presently classified, to be significant. However, any repeal or modification of this or similar exemption in similar state statutes, would increase the volume of hazardous waste we are required to manage and dispose of, and would cause us, as well as our competitors, to incur increased operating expenses with respect to our U.S. operations.
Water Discharges. The U.S. Federal Water Pollution Control Act of 1972, as amended, also known as the “Clean Water Act,” and similar state laws and regulations impose restrictions and controls on the discharge of pollutants into federal and state waters. These laws also regulate the discharge of storm water in process areas. Pursuant to these laws and regulations, we are required to obtain and maintain approvals or permits for the discharge of wastewater and storm water. In addition, the U.S. Coast Guard has promulgated requirements for ballast water management as well as supplemental ballast water requirements, which include limits applicable to specific discharge streams, such as deck runoff, bilge water and gray water. We do not anticipate that compliance with these laws will cause a material impact on our operations or financial condition.
Air Emissions. The U.S. Federal Clean Air Act and associated state laws and regulations restrict the emission of air pollutants from many sources, including oil and natural gas operations. New facilities may be required to obtain permits before operations can commence, and existing facilities may be required to obtain additional permits, and incur capital costs, in order to remain in compliance. Federal and state regulatory agencies can impose administrative, civil and criminal penalties for non-compliance with air permits or other requirements of the Clean Air Act and associated state laws and regulations. In general, we believe that compliance with the Clean Air Act and similar state laws and regulations will not have a material impact on our operations or financial condition.
Climate Change. There is increasing attention concerning the issue of climate change and the effect of greenhouse gas (“GHG”) emissions. The EPA regulates the permitting of GHG emissions from stationary sources under the Clean Air Act’s Prevention of Significant Deterioration (“PSD”) and Title V permitting programs, which require the use of “best available control technology” for GHG emissions from new and modified major stationary sources, which can sometimes include drillships. The EPA has also adopted rules requiring the monitoring and reporting of GHG emissions from specified sources in the United States, including, among other things, certain onshore and offshore oil and natural gas production facilities, on an annual basis. Facilities containing petroleum and natural gas systems that emit 25,000 metric tons or more of CO2 equivalent per year are now required to report annual GHG emissions to the EPA.
Further, proposed legislation has been introduced in Congress that would establish an economy-wide cap on emissions of GHG’s in the United States and would require most sources of GHG emissions to obtain GHG emission “allowances” corresponding to their annual emissions of GHG’s. Moreover, in 2005, the Kyoto Protocol to the 1992 United Nations Framework Convention on Climate Change, which establishes a binding set of emission targets for GHGs, became binding on all countries that had ratified it. Recent international discussions in advance of the United Nations Climate Change Conference in Paris in 2015 are exploring options to replace the Kyoto Protocol. While it is not possible at this time to predict how new treaties and legislation that may be enacted to address GHG emissions would impact our business, the modification of existing laws or regulations or the adoption of new laws or regulations curtailing exploratory or developmental drilling for oil and gas could materially and adversely affect our operations by limiting drilling opportunities or imposing materially increased costs. Moreover, incentives to conserve energy or use alternative energy sources could have a negative impact on our business if such incentives reduce the worldwide demand for oil and gas.
7
Table of Contents
Countries in the European Union implement the U.N.’s Kyoto Protocol on GHG emissions through the Emissions Trading System (“ETS”), though ETS will continue to require GHG reductions in the future that are not currently prescribed by the Kyoto Protocol or related agreements. The ETS program establishes a GHG “cap and trade” system for certain industry sectors, including power generation at some offshore facilities. Total GHG from these sectors is capped, and the cap is reduced over time to achieve a 21% GHG reduction from these sectors between 2005 and 2020. More generally, the EU Commission has proposed a roadmap for reducing emissions by 80% by 2050 compared to 1990 levels. Some EU member states have enacted additional and more long-term legally binding targets. For example, the U.K. has committed to reduce GHG emissions by 80% by 2050. These reduction targets may also be affected by future negotiations under the United Nations Framework Convention on Climate Change and its Kyoto Protocol.
Entities operating under the cap must either reduce their GHG emissions, purchase tradable emissions allowances, or EUAs, from other program participants, or purchase international GHG offset credits generated under the Kyoto Protocol’s Clean Development Mechanisms or Joint Implementation. As the cap declines, prices for emissions allowances or GHG offset credits may rise. However, due to the over-allocation of EUAs by EU member states in earlier phases and the impact of the recession in the EU, there has been a general over-supply of EUAs. The EU has recently approved amending legislation to withhold the auction of EUAs in a process known as “backloading.” EU proposals for wider structural reform of the EU ETS may follow the enactment of the backloading proposal. Both backloading and wider structural reforms are aimed at reviving the EU carbon price.
In addition, the U.K. government, which implements ETS in the U.K. North Sea, has introduced a carbon price floor mechanism to place an incrementally increasing minimum price on carbon. Thus, the cost of compliance with ETS can be expected to increase over time. Additional member state climate change legislation may result in potentially material capital expenditures.
We have determined that combustion of diesel fuel (Scope 1) aboard all of our vessels worldwide is the company’s primary source of GHG emissions, including carbon dioxide, methane and nitrous oxide. The data necessary to report indirect emissions from generation of purchased power (Scope 2) has not been previously collected. We will establish the necessary procedures to collect and report Scope 2 data in 2015.
For the year ended December 31, 2014, our estimated carbon dioxide equivalent (“CO2e”) gas emissions, including Paragon Offshore through the Spin-off date, were 832,845 tonnes as compared to 873,971 tonnes for the year ended December 31, 2013. Excluding Paragon Offshore, our estimated CO2e gas emissions for the year ended December 31, 2014 were 631,612 tonnes as compared to 505,223 tonnes for the year ended December 31, 2013 due to fleet expansion. When expressed as an intensity measure of tonnes of C02e gas emissions per dollar of contract drilling revenues from continuing operations, both the 2014 and 2013 intensity measure was .0002.
Our Scope 1 CO2e gas emissions reporting has been prepared with reference to the requirements set out in the UK Companies Act 2006 Regulations 2013, the Environmental Reporting Guidelines (June 2013) issued by the Department for Environment Food & Rural Affairs, the World Resources Institute and World Business Council for Sustainable Development GHG Protocol Corporate Accounting and Reporting Standard Revised and the International Organization for Standardization (“ISO”) 14064-1, “Specification with guidance at the organizational level for quantification and reporting of greenhouse gas emissions and removals (2006).” We have used SANGEA™ Emissions Estimation Software to estimate CO2e gas of Scope 1 emissions based on diesel fuel consumption.
It is our intent to have the procedures related to GHG emissions independently assessed in the future.
Safety. The U.S. Occupational Safety and Health Act (“OSHA”) and other similar laws and regulations govern the protection of the health and safety of employees. The OSHA hazard communication standard, EPA community right-to-know regulations under Title III of CERCLA and similar state statutes require that information be maintained about hazardous materials used or produced in our operations and that this information be provided to employees, state and local governments and citizens. We believe that we are in substantial compliance with these requirements and with other applicable OSHA requirements.
On June 10, 2013, the European Union adopted a new directive, Directive 2013/30/EU, on the safety of offshore oil and gas operations within the exclusive economic zone (which can extend up to 200 nautical miles from a coast) or the continental shelf of any of its member states. The directive establishes minimum requirements for preventing major accidents in offshore oil and gas operations, and aims to limit the consequences of such accidents. All European Union member states will be required to adopt national legislation or regulations by July 19, 2015 to implement the new directive’s requirements, which also include reporting requirements related to major safety and environmental hazards that must be satisfied before drilling can take place, as well as the use of “all suitable measures” to both prevent major accidents and limit the human health and environmental consequences of such a major accident should one occur. We believe that our operations are in substantial compliance with the requirements of the directive (as well as the extensive current health and safety regimes implemented in the member states in which we operate), but future developments could require the company to incur significant costs to comply with its implementation.
8
Table of Contents
International Regulatory Regime. IMO provides international regulations governing shipping and international maritime trade. IMO regulations have been widely adopted by U.N. member countries, and in some jurisdictions in which we operate, these regulations have been expanded upon. The requirements contained in the International Management Code for the Safe Operation of Ships and for Pollution Prevention, or ISM Code, promulgated by the IMO, govern much of our drilling operations. Among other requirements, the ISM Code requires the party with operational control of a vessel to develop an extensive safety management system that includes, among other things, the adoption of a safety and environmental protection policy setting forth instructions and procedures for operating its vessels safely and describing procedures for responding to emergencies.
The IMO has also adopted MARPOL, including Annex VI to MARPOL which sets limits on sulfur dioxide and nitrogen oxide emissions from ship exhausts and prohibits deliberate emissions of ozone depleting substances. Annex VI, which applies to all ships, fixed and floating drilling rigs and other floating platforms, imposes a global cap on the sulfur content of fuel oil and allows for specialized areas to be established internationally with even more stringent controls on sulfur emissions. For vessels 400 gross tons and greater, platforms and drilling rigs, Annex VI imposes various survey and certification requirements. On July 15, 2011, the IMO approved mandatory measures to reduce emissions of GHGs from international shipping, requiring energy efficiency and survey and certification measures. These amendments to Annex VI apply to all ships of 400 gross tonnage and above and entered into force on January 1, 2013, affecting the operations of vessels that are registered in countries that are signatories to MARPOL Annex VI or vessels that call upon ports located within such countries. Moreover, 2008 amendments to Annex VI require the imposition of progressively stricter limitations on sulfur emissions from ships. These limitations require that fuels of vessels in covered Emission Control Areas, or ECAs, contain no more than 1% sulfur. The North American ECA became effective in August 2012, capping the sulfur limit in marine fuel at 1%, which has been the capped amount for the North Sea and Baltic Sea ECAs since July 1, 2010. The North Sea ECA encompasses all of the North Sea and the full length of the English Channel. These capped amounts are to decrease progressively until they reach 0.5% by January 1, 2020 for non-ECA areas and 0.1% by January 1, 2015 for ECA areas, including the North American ECA. The amendments also establish new tiers of stringent nitrogen oxide emissions standards for new marine engines, depending on their date of installation.
The IMO has negotiated international conventions that impose liability for oil pollution in international waters and the territorial waters of the signatory to such conventions such as the Ballast Water Management Convention, or BWM Convention. The BWM Convention’s implementing regulations call for a phased introduction of mandatory ballast water exchange requirements (beginning in 2009), to be replaced in time with a requirement for mandatory ballast water treatment. The BWM Convention has not become effective, but the IMO has passed a resolution encouraging the ratification of the BWM Convention and calling upon those countries that have already ratified to encourage the installation of ballast water management systems on new ships. Under the requirements of the BWM Convention for rigs with ballast water capacity of more than 5000 cubic meters that were constructed in 2011 or before, ballast water management exchange or treatment will be accepted until 2016. From 2016 (or not later than the first intermediate or renewal survey after 2016), only ballast water treatment will be accepted by the BWM Convention. All of our drilling rigs are in substantial compliance with the proposed terms of the BWM Convention.
The IMO has also adopted the International Convention for Civil Liability for Bunker Oil Pollution Damage of 2001, or Bunker Convention. The Bunker Convention provides a liability, compensation and compulsory insurance system for the victims of oil pollution damage caused by spills of bunker oil. Under the Bunker Convention, ship owners must pay compensation for pollution damage (including the cost of preventive measures) caused in the territory, including the territorial sea of a State Party, as well as its exclusive economic zone or equivalent area. Registered owners of any seagoing vessel and seaborne craft over 1,000 gross tons, of any type whatsoever, and registered in a State Party, or entering or leaving a port in the territory of a State Party, must maintain insurance which meets the requirements of the Bunker Convention and to obtain a certificate issued by a State Party attesting that such insurance is in force. The State issued certificate must be carried on board at all times. We believe that all of our drilling rigs are currently compliant in all material respects with these regulations.
The IMO continues to review and introduce new regulations. It is impossible to predict what additional regulations, if any, may be passed by the IMO and what effect, if any, such regulation may have on our operations.
9
Table of Contents
Insurance and Indemnification Matters
Our operations are subject to many hazards inherent in the drilling business, including blowouts, fires and collisions or groundings of offshore equipment, and damage or loss from adverse weather and sea conditions. These hazards could cause personal injury or loss of life, loss of revenues, pollution and other environmental damage, damage to or destruction of property and equipment and oil and natural gas producing formations, and could result in claims by employees, customers or third parties.
Our drilling contracts provide for varying levels of indemnification from our customers and in most cases also require us to indemnify our customers for certain losses. Under our drilling contracts, liability with respect to personnel and property is typically assigned on a “knock-for-knock” basis, which means that we and our customers assume liability for our respective personnel and property, irrespective of the fault or negligence of the party indemnified. In addition, our customers may indemnify us in certain instances for damage to our down-hole equipment and, in some cases, our subsea equipment.
Our customers typically assume responsibility for and indemnify us from loss or liability resulting from pollution or contamination, including third-party damages and clean-up and removal, arising from operations under the contract and originating below the surface of the water. We are generally responsible for pollution originating above the surface of the water and emanating from our drilling units. Additionally, our customers typically indemnify us for liabilities incurred as a result of a blow-out or cratering of the well and underground reservoir loss or damage.
In addition to the contractual indemnities described above, we also carry Protection and Indemnity (“P&I”) insurance, which is a comprehensive general liability insurance program covering liability resulting from offshore operations. Our P&I insurance includes coverage for liability resulting from personal injury or death of third parties and our offshore employees, third party property damage, pollution, spill clean-up and containment and removal of wrecks or debris. Our insurance policy does not exclude losses resulting from our gross negligence or willful misconduct. Our P&I insurance program is renewed in March of each year and currently has a standard deductible of $10 million per occurrence, with maximum liability coverage of $750 million.
Our insurance policies and contractual rights to indemnity may not adequately cover our losses and liabilities in all cases. For additional information, please read “We may have difficulty obtaining or maintaining insurance in the future and our insurance coverage and contractual indemnity rights may not protect us against all of the risks and hazards we face” included in Part I, Item 1A, “Risk Factors,” of this Annual Report on Form 10-K.
The above description of our insurance program and the indemnification provisions of our drilling contracts is only a summary as of the time of preparation of this report, and is general in nature. Our insurance program and the terms of our drilling contracts may change in the future. In addition, the indemnification provisions of our drilling contracts may be subject to differing interpretations, and enforcement of those provisions may be limited by public policy and other considerations.
Employees
At December 31, 2014, we had approximately 3,700 employees, excluding approximately 1,100 persons we engaged through labor contractors or agencies. Approximately 81 percent of our employees are located offshore. Of our shorebased employees, approximately 70 percent are male. We are not a party to any material collective bargaining agreements, and we consider our employee relations to be satisfactory.
We place considerable value on the involvement of our employees and maintain a practice of keeping them informed on matters affecting them, as well as on the performance of the Company. Accordingly, we conduct formal and informal meetings with employees, maintain a Company intranet website with matters of interest, issue a quarterly publication of Company activities and other matters of interest, and offer a variety of in-house training.
We are committed to a policy of recruitment and promotion on the basis of aptitude and ability without discrimination of any kind. Management actively pursues both the employment of disabled persons whenever a suitable vacancy arises and the continued employment and retraining of employees who become disabled while employed by the company. Training and development is undertaken for all employees, including disabled persons.
10
Table of Contents
Financial Information about Segments and Geographic Areas
Information regarding our revenues from external customers, segment profit or loss and total assets attributable to each segment for the last three fiscal years is presented in “Part II Item 8. Financial Statements and Supplementary Data, Note 19 — Segment and Related Information.”
Information regarding our operating revenues and identifiable assets attributable to each of our geographic areas of operations for the last three fiscal years is presented in “Part II Item 8. Financial Statements and Supplementary Data, Note 19 — Segment and Related Information.”
Available Information
Our Annual Report on Form 10-K, Quarterly Reports on Form 10-Q, Current Reports on Form 8-K and amendments to those reports filed or furnished pursuant to Section 13(a) or 15(d) of the U.S. Securities Exchange Act of 1934 are available free of charge at our website at http://www.noblecorp.com. These filings are also available to the public at the U.S. Securities and Exchange Commission’s (the “SEC”) Public Reference Room at 100 F Street, NE, Room 1580, Washington, DC 20549. The public may obtain information on the operation of the Public Reference Room by calling the SEC at 1-800-SEC-0330. Electronic filings with the SEC are also available on the SEC’s website at http://www.sec.gov.
You may also find information related to our corporate governance, board committees and company code of ethics (and any amendments or waivers of compliance) at our website. Among the documents you can find there are the following:
| • | Articles of Association; |
| • | Code of Business Conduct and Ethics |
| • | Corporate Governance Guidelines; |
| • | Audit Committee Charter; |
| • | Nominating and Corporate Governance Committee Charter; |
| • | Health, Safety, Environment and Engineering Committee Charter; and |
| • | Compensation Committee Charter. |
| Item 1A. | Risk Factors. |
You should carefully consider the following risk factors in addition to the other information included in this Annual Report on Form 10-K. Each of these risk factors could affect our business, operating results and financial condition, as well as affect an investment in our shares.
Risk Factors Relating to Our Business
Our business depends on the level of activity in the oil and gas industry. Adverse developments affecting the industry, including a decline in oil or gas prices, reduced demand for oil and gas products and increased regulation of drilling and production, could have a material adverse effect on our business, financial condition and results of operations.
Demand for drilling services depends on a variety of economic and political factors and the level of activity in offshore oil and gas exploration and development and production markets worldwide. Commodity prices, including oil and gas prices, and market expectations of potential changes in these prices, may significantly affect this level of activity, as well as dayrates for our services. However, higher prices do not necessarily translate into increased drilling activity because our clients’ expectations of future commodity prices typically drive demand for our rigs. Oil and gas prices and the level of activity in offshore oil and gas exploration and development are extremely volatile and are affected by numerous factors beyond our control, including:
| • | the cost of exploring for, developing, producing and delivering oil and gas; |
| • | potential acceleration in the development, and the price and availability, of alternative fuels; |
| • | increased supply of oil and gas resulting from growing onshore hydraulic fracturing activity and shale development; |
| • | worldwide production and demand for oil and gas, which are impacted by changes in the rate of economic growth in the global economy; |
| • | the ability of OPEC to set and maintain production levels and pricing; |
11
Table of Contents
| • | the level of production in non-OPEC countries; |
| • | worldwide financial instability or recessions; |
| • | regulatory restrictions or any moratorium on offshore drilling; |
| • | expectations regarding future energy prices; |
| • | the discovery rate of new oil and gas reserves either onshore or offshore; |
| • | the rate of decline of existing and new oil and gas reserves; |
| • | available pipeline and other oil and gas transportation capacity; |
| • | oil refining capacity; |
| • | the ability of oil and gas companies to raise capital; |
| • | worldwide instability in the financial and credit sectors and a reduction in the availability of liquidity and credit; |
| • | the relative cost of offshore drilling versus onshore oil and gas production; |
| • | advances in exploration, development and production technology either onshore or offshore; |
| • | technical advances affecting energy consumption, including the displacement of hydrocarbons through increasing transportation fuel efficiencies; |
| • | merger and divestiture activity among oil and gas producers; |
| • | the availability of, and access to, suitable locations from which our customers can produce hydrocarbons; |
| • | adverse weather conditions, including hurricanes, typhoons, winter storms and rough seas; |
| • | tax laws, regulations and policies; |
| • | laws and regulations related to environmental matters, including those addressing alternative energy sources and the risks of global climate change; |
| • | the political environment of oil-producing regions, including uncertainty or instability resulting from civil disorder, an outbreak or escalation of armed hostilities or acts of war or terrorism; and |
| • | the laws and regulations of governments regarding exploration and development of their oil and gas reserves or speculation regarding future laws or regulations. |
Adverse developments affecting the industry as a result of one or more of these factors, including a decline in oil or gas prices (such as the decline since June 2014, any further decline, or the failure of oil prices to recover from their current levels), a global recession, reduced demand for oil and gas products, increased supply due to the development of new onshore drilling and production technologies, and increased regulation of drilling and production, particularly if several developments were to occur in a short period of time, would have a material adverse effect on our business, financial condition and results of operations.
The contract drilling industry is a highly competitive and cyclical business with intense price competition. If we are unable to compete successfully, our profitability may be materially reduced.
The offshore contract drilling industry is a highly competitive and cyclical business characterized by high capital and operating costs and evolving capability of newer rigs. Drilling contracts are traditionally awarded on a competitive bid basis. Intense price competition, rig availability, location and suitability, experience of the workforce, efficiency, safety performance record, technical capability and condition of equipment, operating integrity, reputation, industry standing and client relations are all factors in determining which contractor is awarded a job. Our future success and profitability will partly depend upon our ability to keep pace with our customers’ demands with respect to these factors. If current competitors, or new market entrants, implement new technical capabilities, services or standards that are more attractive to our customers, it could have a material adverse effect on our business, financial condition and results of operations.
In addition to intense competition, our industry has historically been cyclical. The contract drilling industry is currently in a period characterized by low demand for drilling services and excess rig supply. Periods of low demand or excess rig supply intensify the competition in the industry and may result in some of our rigs being idle or earning substantially lower dayrates for long periods of times. We cannot provide you with any assurances as to when such period will end, or when there will be higher demand for contract drilling services or a reduction in the number of drilling rigs.
12
Table of Contents
An over-supply of rigs may lead to a reduction in dayrates and demand for our rigs and, therefore, may adversely impact our revenues and profitability.
Prior to the recent downturn, we experienced a period of high utilization and high dayrates, and industry participants increased the supply of drilling rigs by building new drilling rigs, including some drilling rigs that have not yet entered service. This increase in supply, combined with the decrease in demand for drilling rigs resulting from the substantial decline in the price of oil since June 2014, has resulted in an oversupply of drilling rigs, which has contributed to the recent decline in utilization and dayrates.
We are currently experiencing competition from newbuild rigs that have either already entered the market or are scheduled to enter the market in 2015 and beyond. The entry of these rigs into the market has resulted in lower dayrates for both newbuilds and experienced rigs rolling off their current contracts. Lower utilization and dayrates adversely affect our revenues and profitability. In addition, our competitors may relocate rigs to markets in which we operate, which could exacerbate excess rig supply which may lower dayrates and utilization in those markets. To the extent that the drilling rigs currently under construction or on order have not been contracted for future work, there may be increased price competition as such vessels become operational, which could lead to a further reduction in dayrates and in utilization, and we may be required to idle additional drilling rigs.
We may record additional losses or impairment charges related to sold or idle rigs.
Prolonged periods of low utilization or low dayrates, the cold stacking of idle assets, the sale of assets below their then carrying value or the decline in market value of our assets may cause us to experience losses. If future cash flow estimates, based upon information available to management at the time, indicate that the carrying value of any of our rigs may not be recoverable or if we sell assets for less than their then carrying value, we may recognize additional impairment charges on our fleet. For example, in the fourth quarter of 2014, we decided that we would discontinue marketing the Noble Driller, Noble Paul Wolff and Noble Jim Thompson. In connection with this decision, we recorded an impairment charge of $685 million on these three units.
We may not be able to renew or replace expiring contracts or obtain contracts for our uncontracted newbuilds, and our customers may terminate or seek to renegotiate or repudiate our drilling contracts.
We have a number of customer contracts that will expire in 2015 and 2016. Our ability to renew these contracts or obtain new contracts and the terms of any such contracts will depend on market conditions and our customers. During the fourth quarter of 2014 and the first quarter of 2015, a number of oil and gas companies, including some of our customers, have publicly announced significant reductions in their planned exploration and development spending during 2015 and beyond. These reductions in spending could further reduce the demand for contract drilling services and as a result, our business, financial condition and results of operations would be materially adversely affected.
In addition, the Noble Sam Hartley, a newbuild heavy-duty, harsh environment jackup that is currently undergoing post-delivery modifications in the shipyard, does not have a customer contract. We will attempt to secure a contract for this unit prior to the completion of the modification project, but we may be unable to obtain a contract for this rig. In addition, for our rigs under contract that have expired or have been terminated by our customers, we may be unable to secure extensions or new contracts, or in the alternative, may receive dayrates under new contracts which may be below, perhaps substantially below, the existing dayrates. This would have a material adverse effect on our results of operations and cash flows.
Our customers may generally terminate our term drilling contracts if a drilling rig is destroyed or lost or if we have to suspend drilling operations for a specified period of time as a result of a breakdown of major equipment or, in some cases, due to other events beyond the control of either party. In the case of nonperformance and under certain other conditions, our drilling contracts generally allow our customers to terminate without any payment to us. The terms of some of our drilling contracts permit the customer to terminate the contract after a specified notice period by tendering contractually specified termination amounts and, in some cases, without any payment. These termination payments may not fully compensate us for the loss of a contract. The early termination of a contract may result in a rig being idle for an extended period of time and a reduction in our contract backlog and associated revenue, which could have a material adverse effect on our business, financial condition and results of operations.
In addition, during periods of depressed market conditions, such as the one we are currently experiencing and which we expect to continue during 2015, we may be subject to an increased risk of our customers seeking to renegotiate or repudiate their contracts. Our customers’ ability to perform their obligations under drilling contracts with us may also be adversely affected by restricted credit markets, economic downturns and industry downturns, such as the one we are currently experiencing. If our customers cancel or are unable to renew some of their contracts and we are unable to secure new contracts on a timely basis and on substantially similar terms, if contracts are disputed or suspended for an extended period of time or if a number of our contracts are renegotiated, it could have a material adverse effect on our business, financial condition and results of operations.
13
Table of Contents
We can provide no assurance that our current backlog of contract drilling revenue will be ultimately realized.
Generally, contract backlog only includes future revenues under firm commitments; however, from time to time, we may report anticipated commitments under letters of intent or award for which definitive agreements have not yet been, but are expected to be, executed. In addition, we may not receive some or all of the bonuses that we include in our backlog. We can provide no assurance that we will be able to perform under these contracts due to events beyond our control or that we will be able to ultimately execute a definitive agreement in cases where one does not currently exist. Moreover, we can provide no assurance that our customers will be able to or willing to fulfill their contractual commitments to us or that they will not seek to renegotiate or repudiate their contracts, especially during the current industry downturn. Our inability to perform under our contractual obligations or to execute definitive agreements or our customers’ inability or unwillingness to fulfill their contractual commitments to us, including as a result of contract repudiations during currently depressed market conditions, may have a material adverse effect on our business, financial condition and results of operations.
We are substantially dependent on several of our customers, including Shell and Freeport-McMoRan, Inc. (“Freeport”), and the loss of these customers could have a material adverse effect on our financial condition and results of operations.
Any concentration of customers increases the risks associated with any possible termination or nonperformance of drilling contracts, failure to renew contracts or award new contracts or reduction of their drilling programs. We estimate Shell and Freeport represented approximately 60 percent and 12 percent, respectively, of our backlog at December 31, 2014. Revenues from Shell and Freeport accounted for approximately 55 percent and 4 percent, respectively, of our consolidated operating revenues for the year ended December 31, 2014. This concentration of customers increases the risks associated with any possible termination or nonperformance of contracts, in addition to our exposure to credit risk. If any of these customers were to terminate or fail to perform their obligations under their contracts and we were not able to find other customers for the affected drilling units promptly, our financial condition and results of operations could be materially adversely affected.
Our business involves numerous operating hazards.
Our operations are subject to many hazards inherent in the drilling business, including:
| • | well blowouts; |
| • | fires; |
| • | collisions or groundings of offshore equipment; |
| • | punch-throughs; |
| • | mechanical or technological failures; |
| • | failure of our employees to comply with our internal environmental, health and safety guidelines; |
| • | pipe or cement failures and casing collapses, which could release oil, gas or drilling fluids; |
| • | geological formations with abnormal pressures; |
| • | spillage handling and disposing of materials; and |
| • | adverse weather conditions, including hurricanes, typhoons, winter storms and rough seas. |
These hazards could cause personal injury or loss of life, suspend drilling operations, result in regulatory investigation or penalties, seriously damage or destroy property and equipment, result in claims by employees, customers or third parties, cause environmental damage and cause substantial damage to oil and gas producing formations or facilities. Operations also may be suspended because of machinery breakdowns, abnormal drilling conditions, and failure of subcontractors to perform or supply goods or services or personnel shortages. The occurrence of any of the hazards we face could have a material adverse effect on our business, financial condition and results of operations.
14
Table of Contents
We are exposed to risks relating to operations in international locations.
We operate in various regions throughout the world that may expose us to political and other uncertainties, including risks of:
| • | seizure, nationalization or expropriation of property or equipment; |
| • | monetary policies, government credit rating downgrades and potential defaults, and foreign currency fluctuations and devaluations; |
| • | limitations on the ability to repatriate income or capital; |
| • | complications associated with repairing and replacing equipment in remote locations; |
| • | repudiation, nullification, modification or renegotiation of contracts; |
| • | limitations on insurance coverage, such as war risk coverage, in certain areas; |
| • | import-export quotas, wage and price controls, imposition of trade barriers and other forms of government regulation and economic conditions that are beyond our control; |
| • | delays in implementing private commercial arrangements as a result of government oversight; |
| • | financial or operational difficulties in complying with foreign bureaucratic actions; |
| • | changing taxation rules or policies; |
| • | other forms of government regulation and economic conditions that are beyond our control and that create operational uncertainty; |
| • | governmental corruption; |
| • | piracy; and |
| • | terrorist acts, war, revolution and civil disturbances. |
Further, we operate in certain less-developed countries with legal systems that are not as mature or predictable as those in more developed countries, which can lead to greater uncertainty in legal matters and proceedings. Examples of challenges of operating in these countries include:
| • | ongoing changes in Brazilian laws related to the importation of rigs and equipment that may impose bonding, insurance or duty-payment requirements; |
| • | procedural requirements for temporary import permits, which may be difficult to obtain; |
| • | the effect of certain temporary import permit regimes, where the duration of the permit does not coincide with the general term of the drilling contract; and |
| • | ongoing claims in Brazil related to withholding taxes payable on our service contracts. |
Our ability to do business in a number of jurisdictions is subject to maintaining required licenses and permits and complying with applicable laws and regulations. Changes in, compliance with, or our failure to comply with the laws and regulations of the countries where we operate may negatively impact our operations in those countries and could have a material adverse effect on our results of operations.
In addition, other governmental actions, including initiatives by OPEC, may continue to cause oil price volatility. In some areas of the world, this governmental activity has adversely affected the amount of exploration and development work done by major oil companies, which may continue. In addition, some governments favor or effectively require the awarding of drilling contracts to local contractors, require use of a local agent, require partial local ownership or require foreign contractors to employ citizens of, or purchase supplies from, a particular jurisdiction. These practices may adversely affect our ability to compete and our results of operations.
Operating and maintenance costs of our rigs may be significant and may not correspond to revenue earned.
Our operating expenses and maintenance costs depend on a variety of factors including: crew costs, costs of provisions, equipment, insurance, maintenance and repairs, and shipyard costs, many of which are beyond our control. Our total operating costs are generally related to the number of drilling rigs in operation and the cost level in each country or region where such drilling rigs are located. Equipment maintenance costs fluctuate depending upon the type of activity that the drilling rig is performing and the age and condition of the equipment. Operating and maintenance costs will not necessarily fluctuate in proportion to changes in operating revenues. While operating revenues may fluctuate as a function of changes in dayrate, costs for operating a rig may not be proportional to the dayrate received and may vary based on a variety of factors, including the scope and length of required rig preparations and the duration of the contractual period over which such expenditures are amortized. Any investments in our rigs may not result in an increased dayrate for or income from such rigs. A disproportionate amount of operating and maintenance costs in comparison to dayrates could have a material adverse effect on our business, financial condition and results of operations.
15
Table of Contents
In connection with the Spin-off, we agreed to indemnify Paragon Offshore for certain liabilities, and Paragon Offshore agreed to indemnify us for certain liabilities. We have significant exposure to losses resulting from this obligation, and there can be no assurances that the Paragon Offshore indemnities will be sufficient to insure us against the full amount of the related liabilities, or that Paragon Offshore’s ability to satisfy its indemnification obligations will not be impaired in the future.
We entered into certain agreements with Paragon Offshore in connection with the Spin-off, including a master separation agreement, tax sharing agreement, transition services agreement and transition services agreement relating to our operations offshore Brazil. Pursuant to the agreements, we agreed to indemnify Paragon Offshore for certain liabilities, and Paragon Offshore agreed to indemnify us for certain liabilities. We have significant exposure to losses resulting from our obligations under these agreements. Third parties could seek to hold us responsible for any of the liabilities that Paragon Offshore has agreed to retain, and there can be no assurance that the indemnity from Paragon Offshore will be sufficient to protect us against the full amount of such liabilities, or that Paragon Offshore will be able to fully satisfy its indemnification obligations. Moreover, even if we ultimately succeed in recovering from Paragon Offshore any amounts for which we are held liable, we may be temporarily required to bear these losses. If Paragon Offshore is unable to satisfy its indemnification obligations, the underlying liabilities could have a material adverse effect on our business, financial condition and results of operations.
Following the Spin-off, we continue to rely on Paragon Offshore to assist us in operations offshore Brazil. In addition, Paragon Offshore has significant payables owed to us in connection with the Spin-off and agreements executed in connection with our separation.
Pursuant to the transition services agreement relating to our operations offshore Brazil, Paragon Offshore has agreed to provide local administrative and operational services for rigs operating in Brazil at the time of the Spin-off. We currently have one rig in Brazil operating under this arrangement. In addition, in connection with the Spin-off, we executed a number of agreements with Paragon Offshore that govern our relationship after the Spin-off. If Paragon Offshore is unable to perform under its obligations under the transition services agreement relating to our operations offshore Brazil or is unable or unwilling to repay its obligations under the agreements executed in connection with our separation, it could have a material adverse effect on our business, financial condition and results of operations.
Governmental laws and regulations, including environmental laws and regulations, may add to our costs, result in delays, or limit our drilling activity.
Our business is affected by public policy and laws and regulations relating to the energy industry and the environment in the geographic areas where we operate.
The drilling industry is dependent on demand for services from the oil and gas exploration and production industry, and accordingly, we are directly affected by the adoption of laws and regulations that for economic, environmental or other policy reasons curtail exploration and development drilling for oil and gas. We may be required to make significant capital expenditures to comply with governmental laws and regulations. Governments in some foreign countries are increasingly active in regulating and controlling the ownership of concessions, the exploration for oil and gas, and other aspects of the oil and gas industries. There is increasing attention in the United States and worldwide concerning the issue of climate change and the effect of GHGs.
Our operations are also subject to numerous laws and regulations controlling the discharge of materials into the environment or otherwise relating to the protection of the environment. The modification of existing laws or regulations or the adoption of new laws or regulations that result in the curtailment of exploratory or developmental drilling for oil and gas could materially and adversely affect our operations by limiting drilling opportunities or imposing materially increased costs. As a result, the application of these laws could have a material adverse effect on our results of operations by increasing our cost of doing business, discouraging our customers from drilling for hydrocarbons, disrupting revenue through permitting or similar delays, or subjecting us to liability. For example, we, as an operator of mobile offshore drilling units in navigable U.S. waters and certain offshore areas, including the U.S. Outer Continental Shelf, are liable for damages and for the cost of removing oil spills for which we may be held responsible, subject to certain limitations. Our operations may involve the use or handling of materials that are classified as environmentally hazardous. Laws and regulations protecting the environment have generally become more stringent and in certain circumstances impose “strict liability”, rendering a person liable for environmental damage without regard to negligence or fault. Environmental laws and regulations may expose us to liability for the conduct of or conditions caused by others or for acts that were in compliance with all applicable laws at the time they were performed.
16
Table of Contents
As disclosed in “Part II Item 8. Financial Statements and Supplementary Data, Note 18 — Commitments and Contingencies”, in November 2012, the U.S. Coast Guard in Alaska conducted an inspection and investigation of the Noble Discoverer and the Kulluk, and referred the matters to the U.S. Department of Justice (“DOJ”) for further investigation. In December 2014, a subsidiary reached a settlement with the DOJ regarding its investigation of the Noble Discoverer and the Kulluk. Under the terms of the plea agreement, the subsidiary pled guilty to violations relating to maintaining proper oil record books for the Noble Discoverer and Kulluk, maintaining proper ballast records for the Noble Discoverer and notification of hazardous conditions with respect to the Noble Discoverer. The subsidiary paid $8.2 million in fines and $4 million in community service payments and implemented a comprehensive environmental compliance plan. Under the plea agreement, we were also placed on probation for four years. If during the term of probation, the subsidiary fails to adhere to the terms of the plea agreement, the DOJ may withdraw from the plea agreement and would be free to prosecute the subsidiary on all charges arising out of its investigation, including any charges dismissed pursuant to the terms of the plea agreement, as well as potentially other charges.
Any violation of anti-bribery or anti-corruption laws, including the Foreign Corrupt Practices Act, the United Kingdom Bribery Act, or similar laws and regulations could result in significant expenses, divert management attention, and otherwise have a negative impact on us.
We operate in countries known to have a reputation for corruption. We are subject to the risk that we, our affiliated entities or their respective officers, directors, employees and agents may take action determined to be in violation of such anti-corruption laws, including the U.S. Foreign Corrupt Practices Act of 1977, or FCPA, the United Kingdom Bribery Act 2010, or U.K. Bribery Act, and similar laws in other countries.
In 2010, we finalized settlements with the SEC and the DOJ relating to certain reimbursement payments made by our then Nigerian affiliate to our customs agents in Nigeria in the years 2003 to 2007 and paid fines and penalties to the DOJ and the SEC. Any violation of the FCPA, the U.K. Bribery Act or other applicable anti-corruption laws could result in substantial fines, sanctions, civil and/or criminal penalties and curtailment of operations in certain jurisdictions and might adversely affect our business, results of operations or financial condition. In addition, actual or alleged violations could damage our reputation and ability to do business. Further, detecting, investigating, and resolving actual or alleged violations is expensive and can consume significant time and attention of our senior management.
Changes in, compliance with, or our failure to comply with the certain laws and regulations may negatively impact our operations and could have a material adverse effect on our results of operations.
Our operations are subject to various laws and regulations in countries in which we operate, including laws and regulations relating to:
| • | the importing, exporting, equipping and operation of drilling rigs; |
| • | repatriation of foreign earnings; |
| • | currency exchange controls; |
| • | oil and gas exploration and development; |
| • | taxation of offshore earnings and earnings of expatriate personnel; and |
| • | use and compensation of local employees and suppliers by foreign contractors. |
Legal and regulatory proceedings relating to the energy industry, and the complex government regulations to which our business is subject, have at times adversely affected our business and may do so in the future. Governmental actions and initiatives by OPEC may continue to cause oil price volatility. In some areas of the world, this activity has adversely affected the amount of exploration and development work done by major oil companies, which may continue. In addition, some governments favor or effectively require the awarding of drilling contracts to local contractors, require use of a local agent or require foreign contractors to employ citizens of, or purchase supplies from, a particular jurisdiction. These practices may adversely affect our ability to compete and our results of operations.
17
Table of Contents
Public and regulatory scrutiny of the energy industry has resulted in increased regulations being either proposed or implemented. In addition, existing regulations might be revised or reinterpreted, new laws, regulations and permitting requirements might be adopted or become applicable to us, our rigs, our customers, our vendors or our service providers, and future changes in laws and regulations could significantly increase our costs and could have a material adverse effect on our business, financial condition and results of operations. In addition, we may be required to post additional surety bonds to secure performance, tax, customs and other obligations relating to our rigs in jurisdictions where bonding requirements are already in effect and in other jurisdictions where we may operate in the future. These requirements would increase the cost of operating in these countries, which could materially adversely affect our business, financial condition and results of operations.
Adverse effects may continue as a result of the uncertainty of ongoing inquiries, investigations and court proceedings, or additional inquiries and proceedings by federal or state regulatory agencies or private plaintiffs. In addition, we cannot predict the outcome of any of these inquiries or whether these inquiries will lead to additional legal proceedings against us, civil or criminal fines or penalties, or other regulatory action, including legislation or increased permitting requirements. Legal proceedings or other matters against us, including environmental matters, suits, regulatory appeals, challenges to our permits by citizen groups and similar matters, might result in adverse decisions against us. The result of such adverse decisions, either individually or in the aggregate, could be material and may not be covered fully or at all by insurance.
Possible changes in tax laws could affect us and our shareholders.
We operate through various subsidiaries in numerous countries throughout the world. Consequently, we are subject to changes in tax laws, treaties or regulations or the interpretation or enforcement thereof in the United Kingdom, the U.S. or jurisdictions in which we or any of our subsidiaries operate or are incorporated. For example, the Organization for Economic Co-Operation and Development (“OECD”) published a Base Erosion and Profit Shifting Action Plan (“BEPS”) in July 2013. BEPS seeks to reform the taxation of multinational companies. Although any recommendations made by the OECD are not changes in tax law, this may result in unilateral country action which may be uncoordinated, may create double taxation and increase controversy, both of which would be adverse for the global economy and may result in a material adverse effect on our financial statements.
Tax laws and regulations are highly complex and subject to interpretation. Our income tax expense is based upon our interpretation of the tax laws in effect in various countries at the time that the expense was incurred. If these laws, treaties or regulations change or other taxing authorities do not agree with our assessment of the effects of such laws, treaties and regulations, this could have a material adverse effect on us, resulting in a higher effective tax rate on our worldwide earnings or a reclassification of the tax impact of our significant corporate restructuring transactions.
In addition, the manner in which our shareholders are taxed on distributions on, and dispositions of, our shares could be affected by changes in tax laws, treaties or regulations or the interpretation or enforcement thereof in the United Kingdom, the U.S. or other jurisdictions in which our shareholders are resident. Any such changes could result in increased taxes for our shareholders and affect the trading price of our shares.
Operational interruptions or maintenance or repair work may cause our customers to suspend or reduce payment of dayrates until operation of the respective drilling rig is resumed, which may lead to loss of revenue or termination or renegotiation of the drilling contract.
If our drilling rigs are idle for reasons that are not related to the ability of the rig to operate, our customers are entitled to pay a waiting, or standby, rate lower than the full operational rate. In addition, if our drilling rigs are taken out of service for maintenance and repair for a period of time exceeding the scheduled maintenance periods set forth in our drilling contracts, we will not be entitled to payment of dayrates until the rig is able to work. Several factors could cause operational interruptions, including:
| • | breakdowns of equipment and other unforeseen engineering problems; |
| • | work stoppages, including labor strikes; |
| • | shortages of material and skilled labor; |
| • | delays in repairs by suppliers; |
18
Table of Contents
| • | surveys by government and maritime authorities; |
| • | periodic classification surveys; |
| • | inability to obtain permits; |
| • | severe weather, strong ocean currents or harsh operating conditions; and |
| • | force majeure events. |
If the interruption of operations were to exceed a determined period due to an event of force majeure, our customers have the right to pay a rate that is significantly lower than the waiting rate for a period of time, and, thereafter, may terminate the drilling contracts related to the subject rig. Suspension of drilling contract payments, prolonged payment of reduced rates or termination of any drilling contract as a result of an interruption of operations as described herein could materially adversely affect our business, financial condition and results of operations.
19
Table of Contents
As a result of our significant cash flow needs, we may be required to incur additional indebtedness, and in the event of lost market access, may have to delay or cancel discretionary capital expenditures.
Our currently anticipated cash flow needs, both in the short-term and long-term, may include the following:
| • | normal recurring operating expenses; |
| • | committed and discretionary capital expenditures; |
| • | payments of dividends; |
| • | repayment of maturing debt; and |
| • | repurchase of shares. |
In the future, we may require funding for capital expenditures that is beyond the amount available to us from cash generated by our operations, cash on hand and borrowings under our existing bank credit facilities and commercial paper program. We may raise such additional capital in a number of ways, including accessing capital markets, obtaining additional lines of credit or disposing of assets. However, we can provide no assurance that any of these options will be available to us on terms acceptable to us or at all.
Our debt instruments could limit our operations and our debt level may limit our flexibility to obtain financing and pursue business opportunities. Our ability to obtain financing or to access the capital markets may be limited by our financial condition and our credit ratings at the time of any such financing and the covenants in our existing debt agreements, as well as by adverse market conditions resulting from, among other things, a depressed oil price, general economic conditions and uncertainties that are beyond our control. Even if we are successful in obtaining additional capital through debt financings, incurring additional indebtedness may significantly increase our interest expense and may reduce our flexibility to respond to changing business and economic conditions or to fund working capital needs, because we will require additional funds to service our outstanding indebtedness.
Access to our commercial paper program is dependent upon our credit ratings. A decline in our credit ratings below investment grade would prohibit us from accessing the commercial paper market, and we would likely transfer our outstanding borrowings to our revolving credit facilities. Our revolving credit facilities have interest rates that are generally higher than those found in the commercial paper market, which would result in increased interest expense in the future.
In addition, our revolving credit facilities have provisions which change the applicable interest rates based upon our credit ratings. If our credit ratings were to decline, the interest expense under our revolving credit facilities would increase.
We may delay or cancel discretionary capital expenditures, which could have certain adverse consequences including delaying upgrades or equipment purchases that could make the affected rigs less competitive, adversely affect customer relationships and negatively impact our ability to contract such rigs.
We may have difficulty obtaining or maintaining insurance in the future and our insurance coverage and contractual indemnity rights may not protect us against all of the risks and hazards we face.
We do not procure insurance coverage for all of the potential risks and hazards we may face. Furthermore, no assurance can be given that we will be able to obtain insurance against all of the risks and hazards we face or that we will be able to obtain or maintain adequate insurance at rates and with deductibles or retention amounts that we consider commercially reasonable.
Our insurance carriers may interpret our insurance policies such that they do not cover losses for which we make claims. Our insurance policies may also have exclusions of coverage for some losses. Uninsured exposures may include expatriate activities prohibited by U.S. laws, radiation hazards, certain loss or damage to property onboard our rigs and losses relating to shorebased terrorist acts or strikes. Furthermore, the damage sustained to offshore oil and gas assets as a result of hurricanes in recent years has negatively impacted certain aspects of the energy insurance market, resulting in more restrictive and expensive coverage for U.S. named windstorm perils. Accordingly, we have elected to significantly reduce the named windstorm insurance on our rigs operating in the U.S. Gulf of Mexico. Presently, we insure the Noble Jim Thompson, Noble Amos Runner and Noble Driller for “total loss only” when caused by a named windstorm. For the Noble Bully I, our customer assumes the risk of loss due to a named windstorm event, pursuant to the terms of the drilling contract, through the purchase of insurance coverage (provided that we are responsible for any deductible under such policy) or, at its option, the assumption of
20
Table of Contents
the risk of loss up to the insured value in lieu of the purchase of such insurance. The remaining rigs in the U.S. Gulf of Mexico are self-insured for named windstorm perils. Further, we may decide to discontinue named windstorm insurance on all of our rigs in the U.S. Gulf of Mexico. If one or more future significant weather-related events occur in the Gulf of Mexico, or in any other geographic area in which we operate, we may experience increases in insurance costs, additional coverage restrictions or unavailability of certain insurance products.
Under our drilling contracts, liability with respect to personnel and property is customarily assigned on a “knock-for-knock” basis, which means that we and our customers assume liability for our respective personnel and property, irrespective of the fault or negligence of the party indemnified. Although our drilling contracts generally provide for indemnification from our customers for certain liabilities, including liabilities resulting from pollution or contamination originating below the surface of the water, enforcement of these contractual rights to indemnity may be limited by public policy and other considerations and, in any event, may not adequately cover our losses from such incidents. There can also be no assurance that those parties with contractual obligations to indemnify us will necessarily be in a financial position to do so.
Although we maintain insurance in the geographic areas in which we operate, pollution, reservoir damage and environmental risks generally are not fully insurable. Our insurance policies may not adequately cover our losses or may have exclusions of coverage for some losses. We do not have insurance coverage or rights to indemnity for all risks, including loss of hire insurance on most of the rigs in our fleet. Uninsured exposures may include expatriate activities prohibited by U.S. laws and regulations, radiation hazards, certain loss or damage to property onboard our rigs and losses relating to shorebased terrorist acts or strikes. If a significant accident or other event occurs and is not fully covered by insurance or contractual indemnity, it could adversely affect our business, financial condition and results of operations.
A loss of a major tax dispute or a successful tax challenge to our operating structure, intercompany pricing policies or the taxable presence of our subsidiaries in certain countries could result in a higher tax rate on our worldwide earnings, which could result in a material adverse effect on our financial condition.
Income tax returns that we file will be subject to review and examination. We will not recognize the benefit of income tax positions we believe are more likely than not to be disallowed upon challenge by a tax authority. If any tax authority successfully challenges our operational structure, intercompany pricing policies or the taxable presence of our subsidiaries in certain countries, if the terms of certain income tax treaties are interpreted in a manner that is adverse to our structure, or if we lose a material tax dispute in any country, our effective tax rate on our worldwide earnings could increase substantially and result in a material adverse effect on our financial condition.
Construction, conversion or upgrades of rigs are subject to risks, including delays and cost overruns, which could have an adverse impact on our available cash resources and results of operations.
We currently have one remaining ongoing new construction project. In addition, we will continue to make significant upgrade, refurbishment and repair expenditures to our fleet from time to time; some of which may be unplanned. Our customers may also require certain shipyard reliability upgrade projects for our rigs. These projects and other efforts of this type are subject to risks of cost overruns or delays inherent in any large construction project as a result of numerous factors, including the following:
| • | shortages of equipment, materials or skilled labor; |
| • | work stoppages and labor disputes; |
| • | unscheduled delays in the delivery of ordered materials and equipment; |
| • | local customs strikes or related work slowdowns that could delay importation of equipment or materials; |
| • | weather interferences; |
| • | difficulties in obtaining necessary permits or approvals or in meeting permit or approval conditions; |
| • | design and engineering problems; |
| • | inadequate regulatory support infrastructure in the local jurisdiction; |
| • | latent damages or deterioration to hull, equipment and machinery in excess of engineering estimates and assumptions; |
| • | unforeseen increases in the cost of equipment, labor and raw materials, particularly steel; |
| • | unanticipated actual or purported change orders; |
| • | client acceptance delays; |
21
Table of Contents
| • | disputes with shipyards and suppliers; |
| • | delays in, or inability to obtain, access to funding; |
| • | shipyard availability, failures and difficulties, including as a result of financial problems of shipyards or their subcontractors; and |
| • | failure or delay of third-party equipment vendors or service providers. |
The failure to complete a rig repair, upgrade, refurbishment or new construction on time, or at all, or the inability to complete a rig conversion or new construction in accordance with its design specifications, may result in loss of revenues, penalties, or delay, renegotiation or cancellation of a drilling contract or the recognition of an asset impairment. Additionally, capital expenditures for rig repair, upgrade, refurbishment and construction projects could materially exceed our planned capital expenditures. Moreover, when our rigs are undergoing upgrade, refurbishment and repair, they may not earn a dayrate during the period they are out of service. If we experience substantial delays and cost overruns in our shipyard projects, it could have a material adverse effect on our business, financial condition and results of operations.
Our operations are subject to numerous laws and regulations relating to the protection of the environment and of human health and safety, and compliance with these laws and regulations could impose significant costs and liabilities that exceed our current expectations.
Substantial costs, liabilities, delays and other significant issues could arise from environmental, health and safety laws and regulations covering our operations, and we may incur substantial costs and liabilities in maintaining compliance with such laws and regulations. Our operations are subject to extensive international conventions and treaties, and national or federal, state and local laws and regulations, governing environmental protection, including with respect to the discharge of materials into the environment and the security of chemical and industrial facilities. These laws govern a wide range of environmental issues, including:
| • | the release of oil, drilling fluids, natural gas or other materials into the environment; |
| • | air emissions from our drilling rigs or our facilities; |
| • | handling, cleanup and remediation of solid and hazardous wastes at our drilling rigs or our facilities or at locations to which we have sent wastes for disposal; |
| • | restrictions on chemicals and other hazardous substances; and |
| • | wildlife protection, including regulations that ensure our activities do not jeopardize endangered or threatened animals, fish and plant species, nor destroy or modify the critical habitat of such species. |
Various governmental authorities have the power to enforce compliance with these laws and regulations and the permits issued under them, oftentimes requiring difficult and costly actions. Failure to comply with these laws, regulations and permits, or the release of oil or other materials into the environment, may result in the assessment of administrative, civil and criminal penalties, the imposition of remedial obligations, the imposition of stricter conditions on or revocation of permits, the issuance of moratoria or injunctions limiting or preventing some or all of our operations, delays in granting permits and cancellation of leases, or could affect our relationship with certain consumers.
There is an inherent risk of the incurrence of environmental costs and liabilities in our business, some of which may be material, due to the handling of our customers’ hydrocarbon products as they are gathered, transported, processed and stored, air emissions related to our operations, historical industry operations, and water and waste disposal practices. Joint, several or strict liability may be incurred without regard to fault under certain environmental laws and regulations for the remediation of contaminated areas and in connection with past, present or future spills or releases of natural gas, oil and wastes on, under, or from past, present or future facilities. Private parties may have the right to pursue legal actions to enforce compliance as well as to seek damages for non-compliance with environmental laws and regulations or for personal injury or property damage arising from our operations. In addition, increasingly strict laws, regulations and enforcement policies could materially increase our compliance costs and the cost of any remediation that may become necessary. Our insurance may not cover all environmental risks and costs or may not provide sufficient coverage if an environmental claim is made against us.
Our business may be adversely affected by increased costs due to stricter pollution control equipment requirements or liabilities resulting from non-compliance with required operating or other regulatory permits. Also, we might not be able to obtain or maintain from time to time all required environmental regulatory approvals for our operations. If there is a delay in obtaining any required environmental regulatory approvals, or if we fail to obtain
22
Table of Contents
and comply with them, the operation or construction of our facilities could be prevented or become subject to additional costs. In addition, the steps we could be required to take to bring certain facilities into regulatory compliance could be prohibitively expensive, and we might be required to shut down, divest or alter the operation of those facilities, which might cause us to incur losses.
We make assumptions and develop expectations about possible expenditures related to environmental conditions based on current laws and regulations and current interpretations of those laws and regulations. If the interpretation of laws or regulations, or the laws and regulations themselves, change, our assumptions may change, and new capital costs may be incurred to comply with such changes. In addition, new environmental laws and regulations might adversely affect our operations, as well as waste management and air emissions. For instance, governmental agencies could impose additional safety requirements, which could affect our profitability. Further, new environmental laws and regulations might adversely affect our customers, which in turn could affect our profitability.
Finally, although some of our drilling rigs will be separately owned by our subsidiaries, under certain circumstances a parent company and all of the unit-owning affiliates in a group under common control engaged in a joint venture could be held liable for damages or debts owed by one of the affiliates, including liabilities for oil spills under environmental laws. Therefore, it is possible that we could be subject to liability upon a judgment against us or any one of our subsidiaries.
Failure to attract and retain skilled personnel or an increase in personnel costs could adversely affect our operations.
We require skilled personnel to operate and provide technical services and support for our drilling units. In the past, during periods of high demand for drilling services and increasing worldwide industry fleet size, shortages of qualified personnel have occurred. These shortages could result in our loss of qualified personnel to competitors, impair our ability to attract and retain qualified personnel for our new or existing drilling units, impair the timeliness and quality of our work and create upward pressure on personnel costs, any of which could adversely affect our operations.
Any failure to comply with the complex laws and regulations governing international trade could adversely affect our operations.
The shipment of goods, services and technology across international borders subjects our business to extensive trade laws and regulations. Import activities are governed by unique customs laws and regulations in each of the countries of operation. Moreover, many countries, including the United States, control the export and re-export of certain goods, services and technology and impose related export recordkeeping and reporting obligations. Governments also may impose economic sanctions against certain countries, persons and other entities that may restrict or prohibit transactions involving such countries, persons and entities. U.S. sanctions, in particular, are targeted against certain countries that are heavily involved in the petroleum and petrochemical industries, which includes drilling activities.
The laws and regulations concerning import activity, export recordkeeping and reporting, export control and economic sanctions are complex and constantly changing. These laws and regulations may be enacted, amended, enforced or interpreted in a manner materially impacting our operations. Shipments can be delayed and denied export or entry for a variety of reasons, some of which are outside our control and some of which may result from failure to comply with existing legal and regulatory regimes. Shipping delays or denials could cause unscheduled operational downtime. Any failure to comply with applicable legal and regulatory trading obligations could also result in criminal and civil penalties and sanctions, such as fines, imprisonment, debarment from government contracts, seizure of shipments and loss of import and export privileges.
Currently, we do not, nor do we intend to, operate in countries that are subject to significant sanctions and embargoes imposed by the U.S. government or identified by the U.S. government as state sponsors of terrorism, such as Cuba, Iran, Sudan and Syria. The U.S. sanctions and embargo laws and regulations vary in their application, as they do not all apply to the same covered persons or proscribe the same activities, and such sanctions and embargo laws and regulations may be amended or strengthened over time. Although we believe that we will be in compliance with all applicable sanctions and embargo laws and regulations at the filing date, and intend to maintain such compliance, there can be no assurance that we will be in compliance in the future, particularly as the scope of certain laws may be unclear and may be subject to changing interpretations. Any such violation could result in fines
23
Table of Contents
or other penalties and could result in some investors deciding, or being required, to divest their interest, or not to invest, in us. In addition, certain institutional investors may have investment policies or restrictions that prevent them from holding securities of companies that have contracts with countries identified by the U.S. government as state sponsors of terrorism. In addition, our reputation and the market for our securities may be adversely affected if we engage in certain other activities, such as entering into drilling contracts with individuals or entities in countries subject to significant U.S. sanctions and embargo laws that are not controlled by the governments of those countries, or engaging in operations associated with those countries pursuant to contracts with third parties that are unrelated to those countries or entities controlled by their governments.
Pension expenses associated with our retirement benefit plans may fluctuate significantly depending upon changes in actuarial assumptions, future investment performance of plan assets and legislative or other regulatory actions.
A portion of our current and retired employee population is covered by pension and other post-retirement benefit plans, the costs of which are dependent upon various assumptions, including estimates of rates of return on benefit plan assets, discount rates for future payment obligations, mortality assumptions, rates of future cost growth and trends for future costs. In addition, funding requirements for benefit obligations of our pension and other post-retirement benefit plans are subject to legislative and other government regulatory actions. Recently, the Society of Actuaries released revised mortality tables, which update life expectancy assumptions. In consideration of these tables, we modified the mortality assumptions used in determining our pension and post-retirement benefit obligations as of December 31, 2014, which increased our pension liability by $14 million as of December 31, 2014. This will have a related impact on our annual pension cost in future years. The new mortality assumptions may result in additional funding requirements dependent upon the funded status of our plans. These expectations presume all other assumptions remain constant and there are no changes to applicable funding regulations. Future changes in estimates and assumptions associated with our pension and other post-retirement benefit plans could have a material adverse effect on our financial condition, results of operations, cash flows and/or financial disclosures.
Our operations present hazards and risks that require significant and continuous oversight, and we depend upon the security and reliability of our technologies, systems and networks in numerous locations where we conduct business.
Our floaters and high-specification units utilize certain technologies that make us vulnerable to cyber-attacks that we may not be able to adequately protect against. These cyber security risks could disrupt certain of our operations for an extended period of time and result in the loss of critical data and in higher costs to correct and remedy the effects of such incidents. If our systems for protecting against information technology and cyber security risks prove to be insufficient, we could be materially adversely affected by having our business and financial systems compromised, our proprietary information altered, lost or stolen, or our business operations and safety procedures disrupted.
Fluctuations in exchange rates and nonconvertibility of currencies could result in losses to us.
We may experience currency exchange losses when revenues are received or expenses are paid in nonconvertible currencies, when we do not hedge an exposure to a foreign currency or when the result of a hedge is a loss. We may also incur losses as a result of an inability to collect revenues due to a shortage of convertible currency available to the country of operation, controls over currency exchange or controls over the repatriation of income or capital.
We are subject to litigation that could have an adverse effect on us.
We are, from time to time, involved in various litigation matters. These matters may include, among other things, contract disputes, personal injury claims, asbestos and other toxic tort claims, environmental claims or proceedings, employment matters, governmental claims for taxes or duties, and other litigation that arises in the ordinary course of our business. Although we intend to defend these matters vigorously, we cannot predict with certainty the outcome or effect of any claim or other litigation matter, and there can be no assurance as to the ultimate outcome of any litigation. Litigation may have an adverse effect on us because of potential negative outcomes, costs of attorneys, the allocation of management’s time and attention, and other factors.
24
Table of Contents
We are a holding company, and we are dependent upon cash flow from subsidiaries to meet our obligations.
We currently conduct our operations through our subsidiaries, and our operating income and cash flow are generated by our subsidiaries. As a result, cash we obtain from our subsidiaries is the principal source of funds necessary to meet our debt service obligations. Contractual provisions or laws, as well as our subsidiaries’ financial condition and operating requirements, may limit our ability to obtain the cash that we require from our subsidiaries to pay our debt service obligations. Applicable tax laws may also subject such payments to us by our subsidiaries to further taxation.
Forward-Looking Statements
This Annual Report on Form 10-K includes “forward-looking statements” within the meaning of Section 27A of the U.S. Securities Act of 1933, as amended, and Section 21E of the U.S. Securities Exchange Act of 1934, as amended. All statements other than statements of historical facts included in this report regarding rig demand, the offshore drilling market, oil prices, contract backlog, fleet status, our financial position, business strategy, impairments, repayment of debt, timing or number of share repurchases, borrowings under our credit facilities or other instruments, sources of funds, completion, delivery dates and acceptance of our newbuild rigs, future capital expenditures, contract commitments, dayrates, contract commencements, extension or renewals, contract tenders, the outcome of any dispute, litigation, audit or investigation, plans and objectives of management for future operations, foreign currency requirements, results of joint ventures, indemnity and other contract claims, construction and upgrade of rigs, industry conditions, access to financing, impact of competition, governmental regulations and permitting, availability of labor, worldwide economic conditions, taxes and tax rates, indebtedness covenant compliance, dividends and distributable reserves, timing or results of acquisitions or dispositions, and timing for compliance with any new regulations are forward-looking statements. When used in this report, the words “anticipate,” “believe,” “estimate,” “expect,” “intend,” “may,” “plan,” “project,” “should” and similar expressions are intended to be among the statements that identify forward-looking statements. Although we believe that the expectations reflected in such forward-looking statements are reasonable, we cannot assure you that such expectations will prove to be correct. These factors include those described in “Risk Factors” above, or in our other SEC filings, among others. Such risks and uncertainties are beyond our ability to control, and in many cases, we cannot predict the risks and uncertainties that could cause our actual results to differ materially from those indicated by the forward-looking statements. You should consider these risks when you are evaluating us.
| Item 1B. | Unresolved Staff Comments. |
None.
| Item 2. | Properties. |
Drilling Fleet
Our drilling fleet is composed of the following types of units: drillships, semisubmersibles, and jackups. Each type of drilling rig is described further below. Several factors determine the type of unit most suitable for a particular job, the most significant of which include the water depth and the environment of the intended drilling location, whether the drilling is being done over a platform or other structure, and the intended well depth.
Drillships
Our drillships are self-propelled vessels. These units maintain their position over the well through the use of either a fixed mooring system or a computer-controlled dynamic positioning system. Certain of our drillships are capable of drilling in water depths up to 12,000 feet.
As of the filing date of this Annual Report on Form 10-K, our drillship fleet consisted of the following 9 units:
| • | four dynamically positioned Gusto Engineering Pelican Class drillships; |
| • | two dynamically positioned Bully-class drillships operated by us through a 50 percent joint venture with a subsidiary of Shell; |
| • | two dynamically positioned Globetrotter-class drillships; and |
| • | one conventionally moored Sonat Discoverer Class drillship capable of drilling in Arctic environments. |
25
Table of Contents
Semisubmersibles
Semisubmersibles are floating platforms which, by means of a water ballasting system, can be submerged to a predetermined depth so that a substantial portion of the hull is below the water surface during drilling operations in order to improve stability. These units maintain their position over the well through the use of either a fixed mooring system or a computer controlled dynamic positioning system and can drill in many areas where jackups cannot drill. Semisubmersibles normally require water depths of at least 200 feet in order to conduct operations. Certain of our semisubmersibles are capable of drilling in water depths of up to 12,000 feet.
As of the filing date of this Annual Report on Form 10-K, our semisubmersible fleet consisted of the following eight units:
| • | three Noble EVA-4000™ semisubmersibles; |
| • | three Friede & Goldman 9500 Enhanced Pacesetter semisubmersibles; and |
| • | two Bingo 9000 design unit semisubmersibles. |
Jackups
Jackups are mobile, self-elevating drilling platforms equipped with legs that can be lowered to the ocean floor until a foundation is established for support. The rig hull includes the drilling rig, jacking system, crew quarters, loading and unloading facilities, storage areas for bulk and liquid materials, helicopter landing deck and other related equipment. All of our jackups are independent leg (i.e., the legs can be raised or lowered independently of each other) and cantilevered. A cantilevered jackup has a feature that permits the drilling platform to be extended out from the hull, allowing it to perform drilling or workover operations over pre-existing platforms or structures. Moving a rig to the drill site involves jacking up its legs until the hull is floating on the surface of the water. The hull is then towed to the drill site by tugs and the legs are jacked down to the ocean floor. The jacking operation continues until the hull is raised out of the water, and drilling operations are conducted with the hull in its raised position. Our jackups are capable of drilling in water depths up to approximately 500 feet. As of the filing date of this Annual Report on Form 10-K, we had 15 jackups in our fleet, including one high-specification, harsh environment jackup under construction.
26
Table of Contents
Offshore Fleet Table
The following table sets forth certain information concerning our offshore fleet at February 12, 2015. We operate and own all of the units included in the table.
| Water | Drilling | |||||||||||
| Depth | Depth | |||||||||||
| Year Built | Rating | Capacity | ||||||||||
| Name |
Make |
or Rebuilt (1) | (feet) | (feet) | Location | Status (2) | ||||||
| Drillships—9 |
||||||||||||
| Noble Bob Douglas |
Hyundai Gusto P 10000 | 2013 N | 12,000 | 40,000 | U.S. Gulf of Mexico | Active | ||||||
| Noble Bully I (3)(4) |
GustoMSC Bully PRD 12000 | 2011 N | 8,200 | 40,000 | U.S. Gulf of Mexico | Active | ||||||
| Noble Bully II (3)(4) |
GustoMSC Bully PRD 12000 | 2011 N | 10,000 | 40,000 | In transit | Active | ||||||
| Noble Discoverer (3) |
Sonat Discoverer Class | 2009 R | 1,000 | 20,000 | Malaysia | Active | ||||||
| Noble Don Taylor(3) |
Hyundai Gusto P 10000 | 2013 N | 12,000 | 40,000 | U.S. Gulf of Mexico | Active | ||||||
| Noble Globetrotter I (3) |
Globetrotter Class | 2011 N | 10,000 | 30,000 | U.S. Gulf of Mexico | Active | ||||||
| Noble Globetrotter II (3) |
Globetrotter Class | 2013 N | 10,000 | 30,000 | Turkey | Active | ||||||
| Noble Sam Croft(3) |
Hyundai Gusto P 10000 | 2014 N | 12,000 | 40,000 | U.S. Gulf of Mexico | Active | ||||||
| Noble Tom Madden(3) |
Hyundai Gusto P 10000 | 2014 N | 12,000 | 40,000 | U.S. Gulf of Mexico | Active | ||||||
| Semisubmersibles—8 |
||||||||||||
| Noble Amos Runner |
Noble EVA-4000™ | 1999 R/2008 M | 8,000 | 32,500 | U.S. Gulf of Mexico | Active | ||||||
| Noble Clyde Boudreaux |
F&G 9500 Enhanced Pacesetter | 2007 R/M | 10,000 | 35,000 | Australia | Active | ||||||
| Noble Danny Adkins |
Bingo 9000—DP | 2009 R | 12,000 | 35,000 | U.S. Gulf of Mexico | Active | ||||||
| Noble Dave Beard |
F&G 9500 Enhanced Pacesetter—DP | 2009 R | 10,000 | 35,000 | Brazil | Active | ||||||
| Noble Homer Ferrington |
F&G 9500 Enhanced Pacesetter | 2004 R | 7,200 | 30,000 | Italy | Stacked | ||||||
| Noble Jim Day |
Bingo 9000—DP | 2010 R | 12,000 | 35,000 | U.S. Gulf of Mexico | Active | ||||||
| Noble Max Smith |
Noble EVA-4000™ | 1999 R | 7,000 | 30,000 | Singapore | Active | ||||||
| Noble Paul Romano |
Noble EVA-4000™ | 1998 R/2007 M | 6,000 | 32,500 | Canary Islands | Active | ||||||
| Independent Leg Cantilevered Jackups—15 |
||||||||||||
| Noble Alan Hay |
Levingston Class 111-C | 2005 R | 300 | 25,000 | U.A.E. | Active | ||||||
| Noble Charles Copeland |
MLT Class 82-SD-C | 2001 R | 280 | 20,000 | Saudi Arabia | Active | ||||||
| Noble David Tinsley |
Modec 300C-38 | 2010 R | 300 | 25,000 | U.A.E. | Active | ||||||
| Noble Gene House |
Modec 300C-38 | 1998 R | 300 | 25,000 | Saudi Arabia | Active | ||||||
| Noble Hans Deul (3) |
F&G JU-2000E | 2009 N | 400 | 30,000 | U.K. | Active | ||||||
| Noble Houston Colbert (3) |
F&G JU-3000N | 2013 N | 400 | 30,000 | Argentina | Active | ||||||
| Noble Joe Beall |
Modec 300C-38 | 2004 R | 300 | 25,000 | Saudi Arabia | Active | ||||||
| Noble Lloyd Noble (3) |
Gusto MSC CJ70-x150-ST | 2016 N | 500 | 32,000 | Singapore | Active | ||||||
| Noble Mick O’Brien (3) |
F&G JU-3000N | 2013 N | 400 | 30,000 | U.A.E. | Active | ||||||
| Noble Regina Allen (3) |
F&G JU-3000N | 2013 N | 400 | 30,000 | The Netherlands | Active | ||||||
| Noble Roger Lewis (3) |
F&G JU-2000E | 2007 N | 400 | 30,000 | Saudi Arabia | Active | ||||||
| Noble Sam Hartley (3) |
F&G JU-3000N | 2015 N | 400 | 30,000 | Singapore | Shipyard | ||||||
| Noble Sam Turner (3) |
F&G JU-3000N | 2014 N | 400 | 30,000 | Denmark | Active | ||||||
| Noble Scott Marks (3) |
F&G JU-2000E | 2009 N | 400 | 30,000 | Saudi Arabia | Active | ||||||
| Noble Tom Prosser (3) |
F&G JU-3000N | 2014 N | 400 | 30,000 | Singapore | Shipyard | ||||||
Footnotes to Drilling Fleet Table
| 1. | Rigs designated with an “R” were modified, refurbished or otherwise upgraded in the year indicated by capital expenditures in an amount deemed material by management. Rigs designated with an “N” are newbuilds. Rigs designated with an “M” have been upgraded to the Noble NC-5SM mooring standard. |
| 2. | Rigs listed as “active” were either operating under contract or were actively seeking contracts; rigs listed as “shipyard” are in a shipyard for construction, repair, refurbishment or upgrade; rigs listed as “stacked” are idle without a contract and have reduced or no crew. |
| 3. | Harsh environment capability. |
| 4. | We own and operate the Noble Bully I and Noble Bully II through joint ventures with a subsidiary of Shell. Under the terms of the joint venture agreements, each party has an equal 50 percent ownership stake in both vessels. |
Facilities
Our corporate headquarters are located in London, England. We also maintain offices in Sugar Land, Texas, where significant worldwide global support activity occurs. In addition, we own and lease operational, administrative and marketing offices, as well as other sites used primarily for operations, storage and maintenance and repairs for drilling rigs and equipment in various locations worldwide.
27
Table of Contents
| Item 3. | Legal Proceedings. |
Information regarding legal proceedings is set forth in Note 18 to our consolidated financial statements included in Item 8 of this Annual Report on Form 10-K.
| Item 4. | Mine Safety Disclosures. |
Not applicable.
| Item 5. | Market for Registrant’s Common Equity, Related Stockholder Matters and Issuer Purchases of Equity Securities. |
Market for Shares and Related Shareholder Information
Noble-UK shares are listed and traded on the New York Stock Exchange under the symbol “NE”. The following table sets forth for the periods indicated the high and low sales prices and dividends or returns of capital declared and paid in U.S. Dollars per share and are adjusted retroactively to reflect the impact of the Spin-off of Paragon Offshore, which was completed on August 1, 2014:
| Cash Dividends |
||||||||||||
| Declared and | ||||||||||||
| High | Low | Paid | ||||||||||
| 2014 |
||||||||||||
| Fourth quarter |
$ | 21.83 | $ | 14.52 | $ | 0.375 | ||||||
| Third quarter |
28.59 | 22.22 | 0.375 | |||||||||
| Second quarter |
30.44 | 25.77 | 0.375 | |||||||||
| First quarter |
33.01 | 25.05 | 0.375 | |||||||||
| 2013 |
||||||||||||
| Fourth quarter |
$ | 36.48 | $ | 32.18 | $ | 0.250 | ||||||
| Third quarter |
37.21 | 33.11 | 0.250 | |||||||||
| Second quarter |
38.33 | 30.74 | 0.130 | |||||||||
| First quarter |
37.49 | 30.91 | 0.130 | |||||||||
The declaration and payment of dividends or returns of capital will depend on our results of operations, financial condition, cash requirements, future business prospects, contractual restrictions and other factors deemed relevant by our Board of Directors and our shareholders.
On February 13, 2015, there were 241,954,168 shares outstanding held by 421 shareholder accounts of record.
UK Tax Consequences to Shareholders of Noble-UK
The tax consequences discussed below do not reflect a complete analysis or listing of all the possible tax consequences that may be relevant to shareholders of Noble. Shareholders should consult their own tax advisors in respect of the tax consequences related to receipt, ownership, purchase or sale or other disposition of our shares.
UK Income Tax on Dividends and Similar Distributions
A non-UK tax resident holder will not be subject to UK income taxes on dividend income and similar distributions in respect of our shares, unless the shares are attributable to a permanent establishment or a fixed place of business maintained in the UK by such non-UK holder.
28
Table of Contents
Disposition of Noble-UK Shares
Shareholders who are neither UK tax resident nor holding their Noble-UK shares in connection with a trade carried on through a permanent establishment in the UK will not be subject to any UK taxes on chargeable gains as a result of any disposals of their shares. Noble-UK shares held outside the facilities of The Depository Trust Company (“DTC”) should be treated as UK situs assets for the purpose of U.K. inheritance tax.
UK Withholding Tax—Dividends to Shareholders
Payments of dividends by Noble-UK will not be subject to any withholding in respect of UK taxation, regardless of the tax residence of the recipient shareholder.
Stamp Duty and Stamp Duty Reserve Tax in Relation to the Transfer of Shares
Stamp duty and/or stamp duty reserve tax (“SDRT”) are imposed by the UK on certain transfers of chargeable securities (which include shares in companies incorporated in the UK) at a rate of 0.5 percent of the consideration paid for the transfers in question. Certain transfers of shares to depositaries or into clearance systems are charged at a higher rate of 1.5 percent. Her Majesty’s Revenue and Customs (“HMRC”) regard DTC as a clearance system for these purposes.
Transfers of the Ordinary Shares through the facilities of DTC will not attract a charge to stamp duty or SDRT in the UK. Any transfer of title to Ordinary Shares from within those facilities to a holder outside those facilities, and any subsequent transfers that occur entirely outside those facilities, will ordinarily attract stamp duty or SDRT at a rate of 0.5 percent. This duty must be paid (and, where relevant, the transfer document stamped by HMRC) before the transfer can be registered in the books of Noble-UK. However, if those Ordinary Shares of Noble-UK are redeposited into the facilities of DTC, that redeposit will attract stamp duty or SDRT at the rate of 1.5 percent.
Share Repurchases
Under UK law, the company is only permitted to purchase its own shares by way of an “off market purchase” in a plan approved by shareholders. Prior to our redomiciliation to the UK, a resolution was adopted by Noble-UK’s sole shareholder authorizing the repurchase of 6,769,891 shares during the five-year period commencing on the date of the redomiciliation. This number of shares corresponds to the number of shares that Noble-Swiss had authority to repurchase at the time of the redomiciliation. During 2014, we repurchased all shares covered by this authorization.
In December 2014, we received shareholder approval to repurchase up to 37,000,000 additional ordinary shares, or approximately 15 percent of our outstanding ordinary shares at the time of shareholder approval. Any repurchases are expected to be funded using cash on hand, cash from operations or short-term borrowings under our credit facilities. The authority to make such repurchases will expire on the later of April 2016 or at the end of the Company’s 2016 annual general meeting of shareholders, at which time we could seek shareholder approval for further repurchases.
The following table sets forth for the periods indicated certain information with respect to purchases of shares by Noble-UK during the fourth quarter of 2014:
| Total Number of | Maximum Number | |||||||||||||||
| Shares Purchased | of Shares that May | |||||||||||||||
| Total Number | Average | as Part of Publicly | Yet Be Purchased | |||||||||||||
| of Shares | Price Paid | Announced Plans | Under Plans | |||||||||||||
| Period |
Purchased | per Share(1) | or Programs | or Programs | ||||||||||||
| October 2014 |
— | $ | — | — | 4,759,891 | |||||||||||
| November 2014 |
4,759,891 | $ | 21.13 | 4,759,891 | — | |||||||||||
| December 2014 |
— | $ | — | — | 37,000,000 | |||||||||||
| (1) | The average price paid per share does not include the impact of commissions and stamp tax. Including these items, the average price paid per share during the fourth quarter of 2014 was $21.26. |
29
Table of Contents
All share repurchases were made in the open market and were pursuant to the share repurchase program discussed above. All shares repurchased during the quarter were immediately cancelled.
In January 2015, we repurchased 6.2 million of our ordinary shares at an average price of $16.10 per share, excluding commissions and stamp tax. Including these items, the average price paid per share during January 2015 was $16.21. There can be no assurance as to the timing or amount of any additional repurchases. However, we intend to take a cautious approach to future share repurchases at least until market conditions in the offshore drilling business stabilize.
Stock Performance Graph
This graph shows the cumulative total shareholder return of our shares over the five-year period from January 1, 2010 to December 31, 2014. The graph also shows the cumulative total returns for the same five-year period of the S&P 500 Index and the Dow Jones U.S. Oil Equipment & Services Index. The graph assumes that $100 was invested in our shares and the two indices on January 1, 2010 and that all dividends or distributions and returns of capital were reinvested on the date of payment.
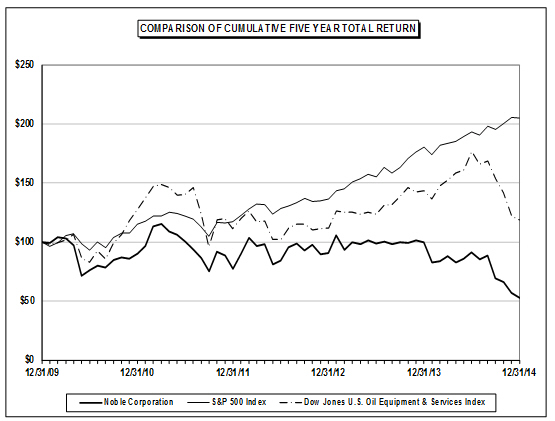
| INDEXED RETURNS | ||||||||||||||||||||
| Year Ended December 31, | ||||||||||||||||||||
| Company Name / Index |
2010 | 2011 | 2012 | 2013 | 2014 | |||||||||||||||
| Noble Corporation |
$ | 90.35 | $ | 77.55 | $ | 90.72 | $ | 99.61 | $ | 52.56 | ||||||||||
| S&P 500 Index |
115.06 | 117.49 | 136.30 | 180.44 | 205.14 | |||||||||||||||
| Dow Jones U.S. Oil Equipment & Services |
127.34 | 111.51 | 111.88 | 143.66 | 118.91 | |||||||||||||||
Investors are cautioned against drawing any conclusions from the data contained in the graph, as past results are not necessarily indicative of future performance.
The above graph and related information shall not be deemed “soliciting material” or to be “filed” with the SEC, nor shall such information be incorporated by reference into any future filing under the Securities Act of 1933 or Securities Exchange Act of 1934, each as amended, except to the extent that we specifically incorporate it by reference into such filing.
30
Table of Contents
| Item 6. | Selected Financial Data. |
The following table sets forth selected financial data of us and our consolidated subsidiaries over the five-year period ended December 31, 2014, which information is derived from our audited financial statements. This information should be read in connection with, and is qualified in its entirety by, the more detailed information in our financial statements included in Item 8 of this Annual Report on Form 10-K.
| Year Ended December 31, | ||||||||||||||||||||
| 2014 | 2013 | 2012 | 2011 | 2010 | ||||||||||||||||
| (In thousands, except per share amounts) | ||||||||||||||||||||
| Statement of Income Data |
||||||||||||||||||||
| Operating revenues from continuing operations |
$ | 3,232,504 | $ | 2,538,143 | $ | 2,200,699 | $ | 1,429,826 | $ | 1,194,089 | ||||||||||
| Net income (loss) from continuing operations attributable to Noble-UK(1) |
(152,011 | ) | 478,595 | 414,389 | 190,745 | 243,176 | ||||||||||||||
| Net income (loss) from continuing operations per share attributable to Noble-UK: |
||||||||||||||||||||
| Basic |
(0.60 | ) | 1.86 | 1.63 | 0.75 | 0.95 | ||||||||||||||
| Diluted |
(0.60 | ) | 1.86 | 1.63 | 0.75 | 0.95 | ||||||||||||||
| Balance Sheet Data (at end of period) |
||||||||||||||||||||
| Cash and marketable securities |
$ | 68,510 | $ | 114,458 | $ | 282,092 | $ | 239,196 | $ | 337,871 | ||||||||||
| Property and equipment, net |
12,112,509 | 14,558,090 | 13,025,972 | 12,130,345 | 10,213,158 | |||||||||||||||
| Total assets |
13,286,822 | 16,217,957 | 14,607,774 | 13,495,159 | 11,302,387 | |||||||||||||||
| Long-term debt |
4,869,020 | 5,556,251 | 4,634,375 | 4,071,964 | 2,686,484 | |||||||||||||||
| Total debt(2) |
4,869,020 | 5,556,251 | 4,634,375 | 4,071,964 | 2,766,697 | |||||||||||||||
| Total equity |
7,287,034 | 9,050,028 | 8,488,290 | 8,097,852 | 7,287,634 | |||||||||||||||
| Other Data |
||||||||||||||||||||
| Net cash from operating activities |
$ | 1,778,208 | $ | 1,702,317 | $ | 1,381,693 | $ | 740,240 | $ | 1,636,902 | ||||||||||
| Net cash from investing activities |
(2,109,268 | ) | (2,485,107 | ) | (1,790,888 | ) | (2,521,546 | ) | (2,896,469 | ) | ||||||||||
| Net cash from financing activities |
285,112 | 615,156 | 452,091 | 1,682,631 | 861,945 | |||||||||||||||
| Capital expenditures(3) |
2,072,885 | 2,487,520 | 1,669,811 | 2,621,235 | 1,406,010 | |||||||||||||||
| Working capital(4) |
259,888 | 339,020 | 393,876 | 232,432 | 110,347 | |||||||||||||||
| Cash distributions declared per share(5) |
1.50 | 0.76 | 0.54 | 0.60 | 0.88 | |||||||||||||||
| (1) | Results for 2014, 2013 and 2012 include impairment charges of $745 million, $4 million and $20 million, respectively. |
| (2) | Consists of Long-Term Debt and Current Maturities of Long-Term Debt. |
| (3) | Capital expenditures includes expenditures made for rigs that were ultimately transferred to Paragon Offshore as part of the Spin-off. |
| (4) | Working capital is calculated as current assets less current liabilities. |
| (5) | Amounts in 2010 include a special dividend of approximately $0.56. |
| Item 7. | Management’s Discussion and Analysis of Financial Condition and Results of Operations. |
The following discussion is intended to assist you in understanding our financial position at December 31, 2014 and 2013, and our results of operations for each of the years in the three-year period ended December 31, 2014. The following discussion should be read in conjunction with the consolidated financial statements and related notes contained in this Annual Report on Form 10-K for the year ended December 31, 2014 filed by Noble-UK and Noble-Cayman.
The results of operations for Paragon Offshore prior to August 1, 2014, the Spin-off date, and non-recurring costs related to the Spin-off have been classified as discontinued operations for all periods presented in this report. The terms “earnings” and “loss” as used in this “Management’s Discussion and Analysis of Financial Condition and Results of Operations” refer to income/(loss) from continuing operations. Income/ (loss) from continuing operations is representative of the Company’s current business operations and focus.
31
Table of Contents
Executive Overview
Our 2014 financial and operating results from continuing operations include:
| • | operating revenues totaling $3.2 billion; |
| • | net loss of $152 million, or $0.60 per diluted share, which includes a $713 million after-tax impairment charge recognized on three of our rigs and our total goodwill balance; |
| • | net cash from operating activities totaling $1.8 billion; and |
| • | an increase in debt to 40.1 percent of total capitalization at the end of 2014, up from 38.0 percent at the end of 2013 as a result of a decrease in our total equity from the Spin-off and the impairment charge recognized in the current year. |
The business environment for offshore drillers during 2014 and early 2015 has been challenging. The supply of offshore drilling rigs from newbuilds and rigs completing current contracts increased while demand for these same rigs decreased. Beginning in June 2014, the price of oil, a key factor in determining customer activity levels, began to decline rapidly, with the Brent crude price declining from approximately $112 per barrel on June 30, 2014 to approximately $52 per barrel on January 30, 2015. In this environment, operators reacted quickly and began to curtail drilling programs. This environment resulted in a dramatic reduction in dayrates for new contracts and lower utilization.
We expect 2015 to be a challenging year with potential for further deterioration of the offshore drilling market. The present level of global economic activity and the lack of production cuts within OPEC are contributing to the uncertainty. Current conditions do not support the capital expenditure programs that the offshore drilling industry has undertaken in recent years. We cannot give any assurances as to when these conditions in the offshore drilling market will improve, or when there will be higher demand for contract drilling services or a decline in the number of drilling rigs. While current market conditions persist, we intend to focus on operating efficiency and cost control, which could include stacking additional drilling rigs.
We do continue to believe in the long-term fundamentals for the industry, especially for those contractors with a modern fleet of high-specification rigs. Also, we believe the ultimate recovery will benefit from any sustained under-investment by clients in this current market phase.
In October 2014, we announced that our Board of Directors authorized the development of a master limited partnership (“MLP”), which would be comprised of interests in select drilling rigs from our existing fleet. The anticipated offering was subject to the final approval of our Board of Directors and market conditions. We believed that the MLP in the then-current market conditions would provide financial flexibility. The drilling market and related MLP market conditions have deteriorated significantly, and we have consequently decided not to pursue an MLP. We will monitor the MLP market and may or may not decide to resume development of an MLP.
In December 2014, we received shareholder approval to repurchase up to 37,000,000 additional ordinary shares, or approximately 15 percent of our outstanding ordinary shares at the time of the shareholder approval. Any repurchases are expected to be funded using cash on hand, cash from operations or short-term borrowings under our credit facilities. During January 2015, we repurchased 6.2 million of our ordinary shares at an average price of $16.10 per share, excluding commissions and stamp tax. There can be no assurance as to the timing or amount of any additional repurchases. However, we intend to take a cautious approach to future share repurchases at least until market conditions in the offshore drilling business stabilize. The authority to make such repurchases will expire on the later of April 2016 or at the end of the Company’s 2016 annual general meeting of shareholders, at which time we could seek shareholder approval for further repurchases.
Our business strategy has focused on reshaping our fleet to emphasize our deepwater drilling and high-specification jackup capabilities and the deployment of our drilling assets in important oil and gas producing areas throughout the world.
32
Table of Contents
We have actively expanded our offshore deepwater drilling and high-specification jackup capabilities in recent years through the construction of rigs. Although we plan to focus on capital preservation and liquidity based on current market conditions, we also plan to continue to evaluate opportunities to enhance our fleet to achieve greater technological capability, which we believe will lead to increased drilling efficiencies and the ability to complete the increasingly more complex programs required by our customers. During 2014, we continued to execute our newbuild program, completing the following milestones:
| • | we commenced operations in the first quarter of 2014 on the Noble Houston Colbert, a high-specification, harsh environment jackup, under a 22-month contract in Argentina; |
| • | we commenced operations in the first quarter of 2014 on the Noble Regina Allen, a high-specification, harsh environment jackup, under an 18-month contract in the North Sea; |
| • | we commenced operations in the third quarter of 2014 on the Noble Sam Croft, a dynamically positioned, ultra-deepwater, harsh environment drillship, under a three-year contract in the U.S. Gulf of Mexico; |
| • | we commenced operations in the third quarter of 2014 on the Noble Sam Turner, a high-specification, harsh environment jackup, under a two-year contract in the North Sea; |
| • | we commenced operations in the fourth quarter of 2014 on the Noble Tom Madden, a dynamically positioned, ultra-deepwater, harsh environment drillship, under a three-year contract in the U.S. Gulf of Mexico; |
| • | we completed construction of the Noble Tom Prosser, a high-specification, harsh environment jackup, which was delivered from the shipyard during the second quarter of 2014. This unit is currently undergoing final commissioning and crew familiarization and is scheduled to begin mobilizing to Australia in the third quarter of 2015, after which it will begin operations under an 18-month contract; |
| • | we accepted delivery of the Noble Sam Hartley, a high-specification, harsh environment jackup, which was delivered from the shipyard during the fourth quarter of 2014. The rig is currently undergoing rig modifications before exiting the shipyard in the second quarter of 2015; and |
| • | we continued construction of the Noble Lloyd Noble, (formerly CJ70-Mariner), a high-specification, harsh environment jackup, that is scheduled to commence operations under a four-year contract in the North Sea in mid-2016. |
While we cannot predict the future level of demand or dayrates for our drilling services or future conditions in the offshore contract drilling industry, we continue to believe we are well positioned within the industry and that our newbuild activity will further strengthen our position.
Spin-off of Paragon Offshore plc
On August 1, 2014, Noble-UK completed the separation and spin-off of a majority of its standard specification offshore drilling business through a pro rata distribution of all of the ordinary shares of its wholly-owned subsidiary, Paragon Offshore, to the holders of Noble’s ordinary shares. Our shareholders received one share of Paragon Offshore for every three shares of Noble owned as of July 23, 2014, the record date for the distribution. Through the Spin-off, we disposed of most of our standard specification drilling units and related assets, liabilities and business. Prior to the Spin-off, Paragon Offshore issued approximately $1.7 billion of long-term debt. We used the proceeds from this debt to repay certain amounts outstanding under our commercial paper program. The results of operations for Paragon Offshore prior to the Spin-off date and incremental Spin-off related costs have been classified as discontinued operations for all periods presented in this Annual Report on Form 10-K. For additional information regarding the Spin-off, see “Part II Item 8 Financial Statements and Supplementary Data Note 2—Spin-off of Paragon Offshore plc.”
Prior to the completion of the Spin-off, Noble and Paragon Offshore entered into a series of agreements to effect the separation and Spin-off and govern the relationship between the parties after the Spin-off.
Master Separation Agreement (“MSA”)
The general terms and conditions relating to the separation and Spin-off are set forth in the MSA. The MSA identifies the assets transferred, liabilities assumed and contracts assigned either to Paragon Offshore by us or by Paragon Offshore to us in the separation and describes when and how these transfers, assumptions and assignments would occur. The MSA provides for, among other things, Paragon Offshore’s responsibility for liabilities relating to its business and the responsibility of Noble for liabilities related to our, and in certain limited cases, Paragon Offshore’s business, in each case irrespective of when the liability arose. The MSA also contains indemnification obligations and ongoing commitments by us and Paragon Offshore.
33
Table of Contents
Employee Matters Agreement (“EMA”)
The EMA allocates liabilities and responsibilities between us and Paragon Offshore relating to employment, compensation and benefits and other employment related matters.
Tax Sharing Agreement
The tax sharing agreement provides for the allocation of tax liabilities and benefits between us and Paragon Offshore and governs the parties’ assistance with tax-related claims.
Transition Services Agreements
Under two transition services agreements, we agreed to continue, for a limited period of time, to provide various interim support services to Paragon Offshore, and Paragon Offshore agreed to provide various interim support services to us, including providing operational and administrative support for our remaining Brazilian operations.
Impairment
In the fourth quarter of 2014, we decided that we would discontinue marketing the semisubmersibles, Noble Driller, Noble Jim Thompson and Noble Paul Wolff, as a result of current market conditions. In connection with the preparation of the consolidated financial statements included in this Annual Report, we evaluated these units for impairments and recorded an impairment charge of $685 million on these units. Additionally, we fully impaired the $60 million of goodwill on our books, which originated from the acquisition of FDR Holdings Limited (“Frontier”) in 2010, as a result of a significant decline in the market value of our stock, a decrease in oil and gas prices, significant reductions in the projected dayrates for new contracts and reduced utilization forecasts.
Consistent with our policy, we will continue to evaluate property and equipment for impairment on an annual basis or whenever events or changes in circumstances indicate that the carrying amount may not be recoverable. Further sustained declines in the offshore drilling market, or lack of recovery in market conditions, to the extent actual results do not meet our estimated assumptions, may lead to additional impairments losses in the future.
Contract Drilling Services Backlog
We maintain a backlog (as defined below) of commitments for contract drilling services. The following table sets forth, as of December 31, 2014, the amount of our contract drilling services backlog and the percent of available operating days committed for the periods indicated:
| Year Ending December 31, | ||||||||||||||||||||||||
| Total | 2015 | 2016 | 2017 | 2018 | 2019-2023 | |||||||||||||||||||
| (In millions) | ||||||||||||||||||||||||
| Contract Drilling Services Backlog |
||||||||||||||||||||||||
| Semisubmersibles/Drillships (1) (4) |
$ | 8,027 | $ | 2,371 | $ | 1,785 | $ | 1,123 | $ | 714 | $ | 2,034 | ||||||||||||
| Jackups |
2,083 | 700 | 520 | 333 | 252 | 278 | ||||||||||||||||||
|
|
|
|
|
|
|
|
|
|
|
|
|
|||||||||||||
| Total (2) |
$ | 10,110 | $ | 3,071 | $ | 2,305 | $ | 1,456 | $ | 966 | $ | 2,312 | ||||||||||||
|
|
|
|
|
|
|
|
|
|
|
|
|
|||||||||||||
| Percent of Available Days Committed(3) |
||||||||||||||||||||||||
| Semisubmersibles/Drillships |
80 | % | 58 | % | 35 | % | 24 | % | 14 | % | ||||||||||||||
| Jackups |
82 | % | 46 | % | 25 | % | 19 | % | 2 | % | ||||||||||||||
|
|
|
|
|
|
|
|
|
|
|
|||||||||||||||
| Total |
81 | % | 52 | % | 30 | % | 21 | % | 8 | % | ||||||||||||||
|
|
|
|
|
|
|
|
|
|
|
|||||||||||||||
| (1) | Our drilling contract with Petróleo Brasileiro S.A. (“Petrobras”) provides an opportunity for us to earn performance bonuses based on reaching targets for downtime experienced for our rig operating offshore Brazil. Our backlog includes an amount equal to 50 percent of potential performance bonuses for this rig, or approximately $9 million. |
34
Table of Contents
| The drilling contracts with Royal Dutch Shell, plc (“Shell”) for the Noble Globetrotter I, Noble Globetrotter II, Noble Clyde Boudreaux, Noble Don Taylor and the Noble Jim Day provide opportunities for us to earn performance bonuses based on key performance indicators as defined by the contracts. Our backlog includes an amount equal to 25 percent of potential performance bonuses for these rigs, or approximately $141 million. |
| (2) | Some of our drilling contracts provide the customer with certain early termination rights and, in very limited cases, these termination rights require minimal or no notice and financial penalties. However, we have not received any notification of contract cancellations as of February 15, 2015. |
| (3) | Percent of available days committed is calculated by dividing the total number of days our rigs are operating under contract for such period, or committed days, by the product of the total number of our rigs, including cold stacked rigs, and the number of calendar days in such period. Committed days do not include the days that a rig is stacked or the days that a rig is expected to be out of service for significant overhaul, repairs or maintenance. Percentages take into account additional capacity from the estimated dates of deployment of our newbuild rigs that are scheduled to commence operations during 2015 and 2016. |
| (4) | Noble and a subsidiary of Shell are involved in joint ventures that own and operate both the Noble Bully I and the Noble Bully II. Under the terms of the joint venture agreements, each party has an equal 50 percent share in both rigs. As of December 31, 2014, the combined amount of backlog for these rigs totals approximately $1.7 billion, all of which is included in our backlog. Noble’s proportional interest in the backlog for these rigs totals $830 million. |
Our contract drilling services backlog reflects estimated future revenues attributable to both signed drilling contracts and letters of intent that we expect to result in binding drilling contracts. A letter of intent is generally subject to customary conditions, including the execution of a definitive drilling contract. It is possible that some customers that have entered into letters of intent will not enter into signed drilling contracts. As of December 31, 2014, our contract drilling services backlog did not include any letters of intent.
We calculate backlog for any given unit and period by multiplying the full contractual operating dayrate for such unit by the number of days remaining in the period. The reported contract drilling services backlog does not include amounts representing revenues for mobilization, demobilization and contract preparation, which are not expected to be significant to our contract drilling services revenues, amounts constituting reimbursables from customers or amounts attributable to uncommitted option periods under drilling contracts or letters of intent.
The amount of actual revenues earned and the actual periods during which revenues are earned may be materially different than the backlog amounts and backlog periods set forth in the table above due to various factors, including, but not limited to, shipyard and maintenance projects, unplanned downtime, achievement of bonuses, weather conditions and other factors that result in applicable dayrates lower than the full contractual operating dayrate. In addition, amounts included in the backlog may change because drilling contracts may be varied or modified by mutual consent or customers may exercise early termination rights contained in some of our drilling contracts or decline to enter into a drilling contract after executing a letter of intent. As a result, our backlog as of any particular date may not be indicative of our actual operating results for the periods for which the backlog is calculated. Please read Part I, Item 1A, “Risk Factors—We can provide no assurance that our current backlog of contract drilling revenue will be ultimately realized.”
RESULTS OF OPERATIONS
2014 Compared to 2013
General
Net loss from continuing operations attributable to Noble-UK for 2014 was $152 million, or $0.60 per diluted share, on operating revenues of $3.2 billion, compared to net income from continuing operations for 2013 of $479 million, or $1.86 per diluted share, on operating revenues of $2.5 billion.
As a result of Noble-UK conducting all of its business through Noble-Cayman and its subsidiaries, the financial position and results of operations for Noble-Cayman, and the reasons for material changes in the amount of revenue and expense items between 2014 and 2013, would be the same as the information presented below regarding Noble-UK in all material respects, except operating income for Noble-Cayman for the years ended December 31, 2014 and 2013 was $50 million and $65 million higher, respectively, than operating income for Noble-UK for the same periods. The operating income difference is primarily a result of executive costs directly attributable to Noble-UK for operations support and stewardship related services. In addition, we had non-recurring costs of $63 million and $18 million in 2014 and 2013, respectively, related to the Spin-off, which we recognized as part of discontinued operations at the Noble-UK level.
35
Table of Contents
Rig Utilization, Operating Days and Average Dayrates
Operating results from continuing operations for our contract drilling services segment are dependent on three primary metrics: rig utilization, operating days and dayrates. The following table sets forth the average rig utilization, operating days and average dayrates for our rig fleet for 2014 and 2013:
| Average Rig | Operating | Average | ||||||||||||||||||||||||||||||
| Utilization (1) | Days (2) | Dayrates | ||||||||||||||||||||||||||||||
| 2014 | 2013 | 2014 | 2013 | % Change | 2014 | 2013 | % Change | |||||||||||||||||||||||||
| Jackups |
91 | % | 95 | % | 3,682 | 2,987 | 23 | % | $ | 177,345 | $ | 145,257 | 22 | % | ||||||||||||||||||
| Semisubmersibles |
71 | % | 86 | % | 2,844 | 3,448 | -18 | % | 409,848 | 385,118 | 6 | % | ||||||||||||||||||||
| Drillships |
100 | % | 100 | % | 2,756 | 1,715 | 61 | % | 482,426 | 403,947 | 19 | % | ||||||||||||||||||||
| Other |
0 | % | 0 | % | — | — | — | — | — | — | ||||||||||||||||||||||
|
|
|
|
|
|||||||||||||||||||||||||||||
| Total |
86 | % | 85 | % | 9,282 | 8,150 | 14 | % | $ | 339,154 | $ | 301,181 | 13 | % | ||||||||||||||||||
|
|
|
|
|
|||||||||||||||||||||||||||||
| (1) | We define utilization for a specific period as the total number of days our rigs are operating under contract, divided by the product of the total number of our rigs, including cold stacked rigs, and the number of calendar days in such period. Information reflects our policy of reporting on the basis of the number of available rigs in our fleet, excluding newbuild rigs under construction. |
| (2) | Information reflects the number of days that our rigs were operating under contract. |
Contract Drilling Services
The following table sets forth the operating results from continuing operations for our contract drilling services segment for 2014 and 2013 (dollars in thousands):
| Change | ||||||||||||||||
| 2014 | 2013 | $ | % | |||||||||||||
| Operating revenues: |
||||||||||||||||
| Contract drilling services |
$ | 3,147,859 | $ | 2,454,745 | $ | 693,114 | 28 | % | ||||||||
| Reimbursables (1) |
82,393 | 65,308 | 17,085 | 26 | % | |||||||||||
| Other |
1 | 11 | (10 | ) | -91 | % | ||||||||||
|
|
|
|
|
|
|
|
|
|||||||||
| $ | 3,230,253 | $ | 2,520,064 | $ | 710,189 | 28 | % | |||||||||
|
|
|
|
|
|
|
|
|
|||||||||
| Operating costs and expenses: |
||||||||||||||||
| Contract drilling services |
$ | 1,500,512 | $ | 1,168,764 | $ | 331,748 | 28 | % | ||||||||
| Reimbursables (1) |
65,080 | 50,161 | 14,919 | 30 | % | |||||||||||
| Depreciation and amortization |
608,590 | 497,303 | 111,287 | 22 | % | |||||||||||
| General and administrative |
106,278 | 116,334 | (10,056 | ) | -9 | % | ||||||||||
| Loss on impairment |
745,428 | 3,585 | 741,843 | 20693 | % | |||||||||||
| Gain on disposal of assets, net |
— | (35,646 | ) | 35,646 | * | * | ||||||||||
| Gain on contract settlements/extinguishments, net |
— | (30,618 | ) | 30,618 | * | * | ||||||||||
|
|
|
|
|
|
|
|
|
|||||||||
| 3,025,888 | 1,769,883 | 1,256,005 | 71 | % | ||||||||||||
|
|
|
|
|
|
|
|
|
|||||||||
| Operating income |
$ | 204,365 | $ | 750,181 | $ | (545,816 | ) | -73 | % | |||||||
|
|
|
|
|
|
|
|
|
|||||||||
| (1) | We record reimbursements from customers for out-of-pocket expenses as operating revenues and the related direct costs as operating expenses. Changes in the amount of these reimbursables generally do not have a material effect on our financial position, results of operations or cash flows. |
| ** | Not a meaningful percentage. |
Operating Revenues. Changes in contract drilling services revenues for the current year as compared to the prior year were driven by increases in both average dayrates and operating days. The 13 percent increase in average dayrates increased revenues by approximately $352 million while the 14 percent increase in operating days increased revenues by an additional $341 million.
The increase in contract drilling services revenues relates to our drillships and jackups, which generated approximately $636 million and $219 million more revenue, respectively, in 2014. These amounts were offset by decreases in revenues for our semisubmersibles, which declined $162 million from the prior year.
36
Table of Contents
The increase in drillship revenues was driven by a 61 percent increase in operating days and a 19 percent increase in average dayrates, resulting in a $420 million and a $216 million increase in revenues, respectively, from the prior year. The increase in both average dayrates and operating days was primarily the result of the newbuilds Noble Don Taylor, Noble Globetrotter II, Noble Bob Douglas, Noble Sam Croft and Noble Tom Madden, which commenced their contracts in August 2013, September 2013, December 2013, July 2014 and November 2014, respectively. Additionally, there were favorable dayrate changes on the contracts for the Noble Bully II and the Noble Discoverer during the current year.
The 22 percent increase in jackup average dayrates resulted in a $118 million increase in revenues, which was coupled with a 23 percent increase in jackup operating days, resulting in a $101 million increase in revenues from the prior year. The increase in average dayrates and operating days resulted from the contract commencements of the Noble Mick O’Brien, Noble Regina Allen, Noble Houston Colbert and Noble Sam Turner in November 2013, January 2014, March 2014, and August 2014, respectively. Additionally, a contract extension on the Noble Roger Lewis resulted in a favorable dayrate change during 2014. This was partially offset by increased downtime on the Noble Scott Marks and the Noble David Tinsley. Furthermore, the Noble Lewis Dugger, which was sold in July 2013, was utilized during a portion of the prior year.
The 6 percent increase in average dayrates on our semisubmersibles resulted in a $70 million increase in revenues from 2013. The increase in average dayrates was due to favorable dayrate changes on new contracts across the semisubmersible fleet, as well as the Noble Paul Romano returning to work during the current year. The 18 percent decline in operating days resulted in a $232 million decrease in revenues driven by contract completions on the Noble Paul Wolff, Noble Homer Ferrington and Noble Max Smith. Additionally, the Noble Amos Runner was in the shipyard undergoing regulatory inspections and maintenance during a portion of the current year but operated during the prior year.
Operating Costs and Expenses. Contract drilling services operating costs and expenses increased $332 million for the current year as compared to the prior year. A significant portion of the increase was due to the crew-up and operating expenses for our newbuild rigs as they commenced, or prepared to commence, operating under contracts, which added approximately $322 million in expense in the current year. The remaining change was primarily driven by a $20 million increase in mobilization expense due to certain rig moves and the demobilization of certain rigs, partially offset by a $5 million decrease in operations support and rig-related expenses and a $5 million decrease in rig and operations support labor.
Depreciation and amortization increased $111 million in 2014 over 2013, which is primarily attributable to newbuild rigs placed in service since the beginning of 2013 as noted above.
Loss on impairment during the current year relates to a $685 million charge on our semisubmersibles, Noble Driller, Noble Jim Thompson and Noble Paul Wolff, which we decided to no longer actively market as a result of current market conditions. Additionally, we fully impaired the $60 million of goodwill on our books, which originated from the acquisition of FDR Holdings Limited (“Frontier”) in 2010, as a result of a significant decline in the market value of our stock, coupled with a decrease in oil and gas prices, significant reductions in the projected dayrates for new contracts and reduced utilization forecasts. Loss on impairment during the prior year was related to our two cold stacked submersible rigs. These rigs were subsequently sold to an unrelated third party in January 2014.
Gain on disposal of assets during the prior year was attributable to the sale of the Noble Lewis Dugger to an unrelated third party in Mexico.
Gain on contract settlements/extinguishments during the prior year was attributable to the $45 million settlement of all claims against the former shareholders of Frontier, which we acquired in July 2010, relating to alleged breaches of various representations and warranties contained in the purchase agreement. A portion of the settlement, totaling approximately $14 million, was allocated to discontinued operations as it related to certain standard specification rigs.
37
Table of Contents
Other
The following table sets forth the operating results from continuing operations for our other services for 2014 and 2013 (dollars in thousands):
| Change | ||||||||||||||||
| 2014 | 2013 | $ | % | |||||||||||||
| Operating revenues: |
||||||||||||||||
| Labor contract drilling services |
$ | — | $ | 17,095 | $ | (17,095 | ) | -100 | % | |||||||
| Reimbursables (1) |
2,251 | 984 | 1,267 | 129 | % | |||||||||||
|
|
|
|
|
|
|
|
|
|||||||||
| $ | 2,251 | $ | 18,079 | $ | (15,828 | ) | -88 | % | ||||||||
|
|
|
|
|
|
|
|
|
|||||||||
| Operating costs and expenses: |
||||||||||||||||
| Labor contract drilling services |
$ | — | $ | 11,601 | $ | (11,601 | ) | -100 | % | |||||||
| Reimbursables (1) |
1,298 | 249 | 1,049 | 421 | % | |||||||||||
| Depreciation and amortization |
18,883 | 14,210 | 4,673 | 33 | % | |||||||||||
| General and administrative |
493 | 1,663 | (1,170 | ) | -70 | % | ||||||||||
|
|
|
|
|
|
|
|
|
|||||||||
| 20,674 | 27,723 | (7,049 | ) | -25 | % | |||||||||||
|
|
|
|
|
|
|
|
|
|||||||||
| Operating loss |
$ | (18,423 | ) | $ | (9,644 | ) | $ | (8,779 | ) | -91 | % | |||||
|
|
|
|
|
|
|
|
|
|||||||||
| (1) | We record reimbursements from customers for out-of-pocket expenses as operating revenues and the related direct costs as operating expenses. Changes in the amount of these reimbursables generally do not have a material effect on our financial position, results of operations or cash flows. |
Operating Revenues and Costs and Expenses. The change in both revenues and expenses relates to the cancellation of a project with Shell for one of its rigs operating under a labor contract in Alaska during 2013.
Other Income and Expenses
General and administrative expenses. Overall, general and administrative expenses decreased $11 million in 2014 from 2013 primarily as a result of decreased legal and tax expenses related to ongoing projects.
Interest Expense, net of amount capitalized. Interest expense, net of amount capitalized, increased $49 million in 2014 from 2013. The increase is a result of lower capitalized interest in the current year as compared to the prior year due primarily to the completion of construction on four of our newbuild drillships and four of our newbuild jackups, partially offset by the repayment of our $300 million fixed rate senior note in June 2013 and our $250 million fixed rate senior note in March 2014 using availability under our commercial paper program at lower interest rates. During the current year, we capitalized approximately 23 percent of total interest charges versus approximately 52 percent during the prior year.
Income Tax Provision. Our income tax provision increased $15 million in the current year. Excluding the impact of the impairment charges recognized in 2014 and 2013 and the sale of the Noble Lewis Dugger in 2013, taxes increased $58 million driven by a higher worldwide effective tax rate and higher pre-tax income. A 34 percent increase in the worldwide effective tax rate during the current year increased income tax expense by $36 million. The increase in the worldwide effective tax rate was a result of a change in the geographic mix of pre-tax earnings and the effect of the new UK tax law, which became effective retroactively to April 1, 2014, offset by favorable discrete items. Additionally, a 28 percent increase in pre-tax earnings generated a $22 million increase in income tax expense.
Discontinued Operations. Net income from discontinued operations for the current year was $161 million as compared to $304 million for the prior year. Revenues reported within discontinued operations were $1.0 billion during the current year as compared to $1.7 billion for the prior year. Operating income included within discontinued operations was $220 million during the current year and $381 million for the prior year. The variance is attributable to seven months of operations in the current year versus a full year of operations in 2013, coupled with a $45 million increase in non-recurring Spin-off costs during the current year.
38
Table of Contents
2013 Compared to 2012
General
Net income from continuing operations attributable to Noble-UK for 2013 was $479 million, or $1.86 per diluted share, on operating revenues of $2.5 billion, compared to net income from continuing operations for 2012 of $414 million, or $1.63 per diluted share, on operating revenues of $2.2 billion.
As a result of Noble-UK conducting all of its business through Noble-Cayman and its subsidiaries, the financial position and results of operations for Noble-Cayman, and the reasons for material changes in the amount of revenue and expense items between 2013 and 2012, would be the same as the information presented below regarding Noble-UK in all material respects, except operating income for Noble-Cayman for the years ended December 31, 2013 and 2012 was $65 million and $51 million higher, respectively, than operating income for Noble-UK for the same periods. The operating income difference is primarily a result of executive costs directly attributable to Noble-UK for operations support and stewardship related services. In addition, we had non-recurring costs of $18 million and $7 million in 2013 and 2012, respectively, related to the Spin-off, which we recognized as part of discontinued operations at the Noble-UK level.
Rig Utilization, Operating Days and Average Dayrates
Operating results from continuing operations for our contract drilling services segment are dependent on three primary metrics: rig utilization, operating days and dayrates. The following table sets forth the average rig utilization, operating days and average dayrates for our rig fleet for 2013 and 2012:
| Average Rig | Operating | Average | ||||||||||||||||||||||||||||||
| Utilization (1) | Days (2) | Dayrates | ||||||||||||||||||||||||||||||
| 2013 | 2012 | 2013 | 2012 | % Change | 2013 | 2012 | % Change | |||||||||||||||||||||||||
| Jackups |
95 | % | 93 | % | 2,987 | 3,079 | -3 | % | $ | 145,257 | $ | 121,598 | 19 | % | ||||||||||||||||||
| Semisubmersibles |
86 | % | 91 | % | 3,448 | 3,650 | -6 | % | 385,118 | 368,258 | 5 | % | ||||||||||||||||||||
| Drillships |
100 | % | 100 | % | 1,715 | 1,092 | 57 | % | 403,947 | 339,959 | 19 | % | ||||||||||||||||||||
| Other |
0 | % | 0 | % | — | — | — | — | — | — | ||||||||||||||||||||||
|
|
|
|
|
|||||||||||||||||||||||||||||
| Total |
85 | % | 86 | % | 8,150 | 7,821 | 4 | % | $ | 301,181 | $ | 267,181 | 13 | % | ||||||||||||||||||
|
|
|
|
|
|||||||||||||||||||||||||||||
| (1) | We define utilization for a specific period as the total number of days our rigs are operating under contract, divided by the product of the total number of our rigs, including cold stacked rigs, and the number of calendar days in such period. Information reflects our policy of reporting on the basis of the number of available rigs in our fleet, excluding newbuild rigs under construction. |
| (2) | Information reflects the number of days that our rigs were operating under contract. |
39
Table of Contents
Contract Drilling Services
The following table sets forth the operating results from continuing operations for our contract drilling services segment for 2013 and 2012 (dollars in thousands):
| Change | ||||||||||||||||
| 2013 | 2012 | $ | % | |||||||||||||
| Operating revenues: |
||||||||||||||||
| Contract drilling services |
$ | 2,454,745 | $ | 2,089,621 | $ | 365,124 | 17 | % | ||||||||
| Reimbursables (1) |
65,308 | 65,347 | (39 | ) | 0 | % | ||||||||||
| Other |
11 | 12 | (1 | ) | -8 | % | ||||||||||
|
|
|
|
|
|
|
|
|
|||||||||
| $ | 2,520,064 | $ | 2,154,980 | $ | 365,084 | 17 | % | |||||||||
|
|
|
|
|
|
|
|
|
|||||||||
| Operating costs and expenses: |
||||||||||||||||
| Contract drilling services |
$ | 1,168,764 | $ | 969,310 | $ | 199,454 | 21 | % | ||||||||
| Reimbursables (1) |
50,161 | 55,002 | (4,841 | ) | -9 | % | ||||||||||
| Depreciation and amortization |
497,303 | 427,234 | 70,069 | 16 | % | |||||||||||
| General and administrative |
116,334 | 97,967 | 18,367 | 19 | % | |||||||||||
| Loss on impairment |
3,585 | 12,710 | (9,125 | ) | -72 | % | ||||||||||
| Gain on disposal of assets, net |
(35,646 | ) | — | (35,646 | ) | * | * | |||||||||
| Gain on contract settlements/extinguishments, net |
(30,618 | ) | (33,255 | ) | 2,637 | -8 | % | |||||||||
|
|
|
|
|
|
|
|
|
|||||||||
| 1,769,883 | 1,528,968 | 240,915 | 16 | % | ||||||||||||
|
|
|
|
|
|
|
|
|
|||||||||
| Operating income |
$ | 750,181 | $ | 626,012 | $ | 124,169 | 20 | % | ||||||||
|
|
|
|
|
|
|
|
|
|||||||||
| (1) | We record reimbursements from customers for out-of-pocket expenses as operating revenues and the related direct costs as operating expenses. Changes in the amount of these reimbursables generally do not have a material effect on our financial position, results of operations or cash flows. |
| ** | Not a meaningful percentage. |
Operating Revenues. Changes in contract drilling services revenues for 2013 as compared to 2012 were driven by increases in both average dayrates and operating days. The 13 percent increase in average dayrates increased revenues by approximately $277 million while the 4 percent increase in operating days increased revenues by an additional $88 million.
The increase in contract drilling services revenues relates to our drillships and jackups, which generated approximately $321 million and $60 million more revenue, respectively, in 2013. These amounts were offset by decreases in revenues for our semisubmersibles, which declined $16 million from 2012.
The increase in drillship revenues was driven by a 57 percent increase in operating days and a 19 percent increase in average dayrates, resulting in a $212 million and a $109 million increase in revenues, respectively, from 2012. The increase in both average dayrates and operating days was the result of the timing of contract commencements of our newbuilds during the period.
The 19 percent increase in jackup average dayrates resulted in a $71 million increase in revenues from 2012. The increase in average dayrates resulted from favorable dayrate changes on new contracts across the jackup fleet and the contract commencement of the Noble Mick O’Brien in November 2013. Additionally, revenue of $18 million was recognized in 2013 in connection with the cancellation of a contract by our customer on the Noble Houston Colbert. The 3 percent decline in operating days resulted in an $11 million decrease in revenues driven by the Noble Lewis Dugger, which was sold in July 2013 but fully utilized during 2012.
The 5 percent increase in average dayrates on our semisubmersibles resulted in a $58 million increase in revenues from 2012. The increase in average dayrates is due to favorable dayrate changes on new contracts across the semisubmersible fleet. The 6 percent decline in operating days resulted in a $74 million decrease in revenues driven by the Noble Paul Romano, which was off contract during 2013 but operated during a portion of 2012 and the Noble Homer Ferrington, which completed its contract during 2013 but experienced full utilization during 2012. These decreases were partially offset by the Noble Max Smith, which experienced full utilization during 2013 after being off contract during 2012.
40
Table of Contents
Operating Costs and Expenses. Contract drilling services operating costs and expenses increased $199 million for 2013 as compared to 2012. A portion of the increase is due to the crew-up and operating expenses for our newbuild rigs as they commenced operating under contracts, which added approximately $134 million in expense in 2013. The remaining change was primarily driven by a $43 million increase in rig and operations support labor due to rigs returning, or preparing to return, to work and salary increases effective in the second and third quarters of 2012 and a $33 million increase in shorebase support due to increased project-related costs. These increases were partially offset by an $11 million decrease in maintenance and rig-related expense.
Depreciation and amortization increased $70 million in 2013 over 2012, which is primarily attributable to newbuild rigs placed in service since the beginning of 2012.
Loss on impairment during 2012 related to an impairment charge on our submersible fleet, primarily as a result of the declining market outlook for drilling services for that rig type. During 2013, we recorded an additional impairment charge of approximately $4 million on our two cold stacked submersible rigs arising from the potential disposition of these assets to an unrelated third party. In January 2014, we completed the sale of the submersibles for a total sales price of $7 million.
Gain on disposal of assets during 2013 was attributable to the sale of the Noble Lewis Dugger to an unrelated third party in Mexico.
Gain on contract settlements/extinguishments during 2013 was attributable to the $45 million settlement of all claims against the former shareholders of Frontier, which we acquired in July 2010, relating to alleged breaches of various representations and warranties contained in the purchase agreement. A portion of the settlement, totaling approximately $14 million, was allocated to discontinued operations as it related to certain standard specification rigs. During 2012, we recognized a $28 million gain on the settlement of an action with certain vendors for damages sustained during Hurricane Ike. Additionally, we recognized a $5 million gain from a claims settlement on the Noble David Tinsley, which had experienced a “punch-through” while being positioned on location in 2009.
Other
The following table sets forth the operating results from continuing operations for our other services for 2013 and 2012 (dollars in thousands):
| Change | ||||||||||||||||
| 2013 | 2012 | $ | % | |||||||||||||
| Operating revenues: |
||||||||||||||||
| Labor contract drilling services |
$ | 17,095 | $ | 45,299 | $ | (28,204 | ) | -62 | % | |||||||
| Reimbursables (1) |
984 | 420 | 564 | 134 | % | |||||||||||
|
|
|
|
|
|
|
|
|
|||||||||
| $ | 18,079 | $ | 45,719 | $ | (27,640 | ) | -60 | % | ||||||||
|
|
|
|
|
|
|
|
|
|||||||||
| Operating costs and expenses: |
||||||||||||||||
| Labor contract drilling services |
$ | 11,601 | $ | 22,976 | $ | (11,375 | ) | -50 | % | |||||||
| Reimbursables (1) |
249 | 422 | (173 | ) | -41 | % | ||||||||||
| Depreciation and amortization |
14,210 | 13,072 | 1,138 | 9 | % | |||||||||||
| General and administrative |
1,663 | 2,023 | (360 | ) | -18 | % | ||||||||||
| Loss on impairment |
— | 7,674 | (7,674 | ) | * | * | ||||||||||
|
|
|
|
|
|
|
|
|
|||||||||
| 27,723 | 46,167 | (18,444 | ) | -40 | % | |||||||||||
|
|
|
|
|
|
|
|
|
|||||||||
| Operating loss |
$ | (9,644 | ) | $ | (448 | ) | $ | (9,196 | ) | -2053 | % | |||||
|
|
|
|
|
|
|
|
|
|||||||||
| (1) | We record reimbursements from customers for out-of-pocket expenses as operating revenues and the related direct costs as operating expenses. Changes in the amount of these reimbursables generally do not have a material effect on our financial position, results of operations or cash flows. |
| ** | Not a meaningful percentage. |
Operating Revenues and Costs and Expenses. The change in both revenues and expenses for our labor contract drilling services primarily relates to the 2013 cancellation of a project with Shell for one of its rigs operating under a labor contract in Alaska.
41
Table of Contents
Loss on impairment during 2012 related to an impairment charge on certain corporate assets, as a result of a declining market for, and the potential disposal of, the assets.
Other Income and Expenses
General and administrative expenses. Overall, general and administrative expenses increased $18 million in 2013 from 2012 primarily as a result of increased legal and tax expenses related to ongoing projects of $9 million, coupled with increases in employee-related costs of $9 million.
Interest Expense, net of amount capitalized. Interest expense, net of amount capitalized, increased $21 million in 2013 from 2012. The increase is a result of a reduction in capitalized interest in 2013 as compared to 2012 due primarily to the completion of construction on three of our newbuild drillships and two of our newbuild jackups, coupled with increased borrowings outstanding under our credit facilities and commercial paper program. During 2013, we capitalized approximately 52 percent of total interest charges versus approximately 61 percent during 2012.
Income Tax Provision. Our income tax provision decreased $3 million in 2013 as compared to 2012. Excluding the impact of the impairment charges recognized in 2013 and 2012 and the sale of the Noble Lewis Dugger in 2013, taxes decreased $19 million driven by a lower effective tax rate, partially offset by higher pre-tax earnings. A 25 percent decrease in the worldwide effective tax rate during 2013 decreased income tax expense by $26 million. The decrease in the effective tax rate was a result of a change in the geographic mix of pre-tax earnings and the resolution of certain discrete tax items. Additionally, an 8 percent increase in pre-tax earnings generated a $7 million increase in income tax expense.
Discontinued Operations. Net income from discontinued operations for 2013 was $304 million as compared to $108 million for 2012. Revenues reported within discontinued operations were $1.7 billion during 2013 as compared to $1.3 billion for 2012. Operating income included within discontinued operations was $381 million during 2013 and $158 million for 2012. The variance is attributable to an increase in average dayrates as a result of improved market conditions and increased operating days as rigs returned to work, partially offset by an $11 million increase in non-recurring Spin-off costs during 2013.
LIQUIDITY AND CAPITAL RESOURCES
Overview
Cash flows from discontinued operations are combined with cash flows from continuing operations within each cash flow statement category on our Consolidated Statements of Cash Flows included in this Annual Report on Form 10-K. Net cash from operating activities in 2014 was $1.8 billion, which compared to $1.7 billion and $1.4 billion in 2013 and 2012, respectively. We had working capital of $260 million and $339 million at December 31, 2014 and 2013, respectively. Our total debt as a percentage of total debt plus equity increased to 40.1 percent at December 31, 2014, up from 38.0 percent at December 31, 2013 as a result of a decrease in our total equity from the Spin-off and the impairment charge recognized in the current year.
Net cash used in investing activities in 2014 was $2.1 billion, which compared to $2.5 billion and $1.8 billion in 2013 and 2012, respectively. The variance primarily relates to lower expenditures related to the completion of a majority of our newbuild projects, coupled with seven months of expenditures for Paragon Offshore in 2014 as compared to a full year in 2013 and 2012.
Net cash from financing activities in 2014 was $285 million, which compared to $615 million and $452 million in 2013 and 2012, respectively. The variance from 2013 to 2014 primarily relates to an increase in our dividends paid to $1.50 per share in 2014 as compared to $0.76 per share in 2013. In 2014, we repurchased approximately 6.8 million shares in accordance with our share repurchase program. Additionally, 2014 includes the proceeds from the issuance of approximately $1.7 billion of long-term debt by Paragon Offshore prior to the Spin-off, which we used to repay commercial paper issuances.
Our principal sources of capital in 2014 were the proceeds from the indebtedness incurred by Paragon Offshore, the cash generated from operating activities noted above and borrowings under our commercial paper program. Cash generated during the current year was primarily used to fund our capital expenditure program.
42
Table of Contents
Our currently anticipated cash flow needs, both in the short-term and long-term, may include the following:
| • | normal recurring operating expenses; |
| • | committed and discretionary capital expenditures; |
| • | payments of dividends; |
| • | repayment of maturing debt; and |
| • | repurchase of shares. |
We currently expect to fund these cash flow needs with cash generated by our operations, cash on hand, borrowings under our existing or future credit facilities and commercial paper program, potential issuances of long-term debt, or asset sales. However, to adequately cover our expected cash flow needs, we may require capital in excess of the amount available from these sources, and we may seek additional sources of liquidity and/or delay or cancel certain discretionary capital expenditures or other payments as necessary.
At December 31, 2014, we had a total contract drilling services backlog of approximately $10.1 billion. Our backlog as of December 31, 2014 includes a commitment of 81 percent of available days for 2015. See “Contract Drilling Services Backlog” for additional information regarding our backlog.
Capital Expenditures
We expect our primary use of available liquidity during 2015 to be for capital expenditures. Capital expenditures, including capitalized interest, totaled $2.1 billion, $2.5 billion and $1.7 billion for 2014, 2013 and 2012, respectively.
At December 31, 2014, we had one rig under construction, and capital expenditures, excluding capitalized interest, for new construction during 2014 totaled $1.4 billion, as follows (in millions):
| Rig type/name |
||||
| Currently under construction |
||||
| Jackups |
||||
| Noble Lloyd Noble (formerly CJ70-Mariner) |
$ | 7.8 | ||
| Recently completed construction projects |
||||
| Noble Tom Madden |
$ | 378.2 | ||
| Noble Sam Croft |
355.7 | |||
| Noble Sam Hartley |
158.0 | |||
| Noble Tom Prosser |
149.1 | |||
| Noble Sam Turner |
143.5 | |||
| Noble Houston Colbert |
134.7 | |||
| Noble Globetrotter II |
10.9 | |||
| Noble Bob Douglas |
10.2 | |||
| Noble Don Taylor |
3.2 | |||
| Noble Regina Allen |
1.6 | |||
| Noble Mick O’Brien |
0.5 | |||
| Other |
0.2 | |||
|
|
|
|||
| Total Newbuild Capital Expenditures |
$ | 1,353.6 | ||
|
|
|
|||
In addition to the newbuild expenditures noted above, capital expenditures during 2014, including expenditures related to Paragon Offshore through the date of the Spin-off, consisted of the following:
| • | $522 million for Noble-related major projects, subsea related expenditures and upgrades and replacements to drilling equipment; |
| • | $150 million for Paragon-related major projects, subsea related expenditures and upgrades and replacements to drilling equipment; and |
| • | $47 million in capitalized interest. |
43
Table of Contents
Our total capital expenditure budget for 2015 is approximately $555 million, which is currently anticipated to be spent as follows:
| • | $484 million for major projects, subsea related expenditures and upgrades and replacements to drilling equipment; and |
| • | approximately $71 million in newbuild expenditures. |
In addition to the amounts noted above, we anticipate incurring capitalized interest, which may fluctuate as a result of the timing of completion of ongoing projects. In connection with our capital expenditure program, we have entered into certain commitments, including shipyard and purchase commitments, for approximately $729 million at December 31, 2014, of which we expect to spend approximately $308 million in 2015.
From time to time we consider possible projects that would require expenditures that are not included in our capital budget, and such unbudgeted expenditures could be significant. In addition, we will continue to evaluate acquisitions of drilling units from time to time. Other factors that could cause actual capital expenditures to materially exceed plan include delays and cost overruns in shipyards (including costs attributable to labor shortages), shortages of equipment, latent damage or deterioration to hull, equipment and machinery in excess of engineering estimates and assumptions, changes in governmental regulations and requirements and changes in design criteria or specifications during repair or construction.
Dividends
Our most recent quarterly dividend payment to shareholders, totaling approximately $93 million (or $0.375 per share), was declared on January 30, 2015 and paid on February 20, 2015 to holders of record on February 10, 2015.
The declaration and payment of dividends require authorization of the Board of Directors of Noble-UK and such dividends on issued share capital may be paid only out of Noble-UK’s “distributable reserves” on its statutory balance sheet. Noble-UK is not permitted to pay dividends out of share capital, which includes share premiums. The amount of future dividends will depend on our results of operations, financial condition, cash requirements, future business prospects, contractual restrictions and other factors deemed relevant by our Board of Directors.
Share Repurchases
Under UK law, the company is only permitted to purchase its own shares by way of an “off market purchase” in a plan approved by shareholders. Prior to our redomiciliation to the UK, a resolution was adopted by Noble-UK’s sole shareholder authorizing the repurchase of 6,769,891 shares during the five-year period commencing on the date of the redomiciliation. This number of shares corresponds to the number of shares that Noble-Swiss had authority to repurchase at the time of the redomiciliation. During 2014, we repurchased all shares covered by this authorization.
Share repurchases for each of the three years ended December 31 are as follows:
| Year Ended |
Total Number of Shares Purchased |
Total Cost(1) | Average Price Paid per Share(1) |
|||||||||
| 2014 |
6,769,891 | $ | 154,145 | $ | 22.77 | |||||||
| 2013 |
190,187 | 7,653 | 40.24 | |||||||||
| 2012 |
302,150 | 10,516 | 34.80 | |||||||||
| (1) | The total cost and average price paid per share includes the impact of commissions and stamp tax for share repurchases made in the open market. |
In December 2014, we received shareholder approval to repurchase up to 37,000,000 additional ordinary shares, or approximately 15 percent of our outstanding ordinary shares at the time of the shareholder approval. Any repurchases are expected to be funded using cash on hand, cash from operations or short-term borrowings under our credit facilities. The authority to make such repurchases will expire on the later of April 2016 or the end of the Company’s 2016 annual general meeting of shareholders, at which time we could seek shareholder approval for further repurchases.
44
Table of Contents
In January 2015, we repurchased 6.2 million of our ordinary shares at an average price of $16.10 per share, excluding commissions and stamp tax. Including these items, the average price paid per share during January 2015 was $16.21. There can be no assurance as to the timing or amount of any such repurchases. However, we intend to take a cautious approach to future share repurchases at least until market conditions in the offshore drilling business stabilize.
Credit Facilities and Senior Unsecured Notes
Credit Facilities and Commercial Paper Program
At December 31, 2014, we had three credit facilities with an aggregate maximum available capacity of $2.9 billion, and a commercial paper program, which allowed us to issue up to $2.7 billion in unsecured commercial paper notes. Amounts issued under the commercial paper program are supported by the unused capacity under our credit facilities and, therefore, are classified as long-term on our Consolidated Balance Sheet. The outstanding amounts of commercial paper reduce availability under our credit facilities.
Our total debt related to the credit facilities and commercial paper program was $1.1 billion at December 31, 2014 as compared to $1.6 billion at December 31, 2013. At December 31, 2014, we had no letters of credit issued under the credit facilities.
In January 2015, we replaced the credit facilities discussed above with two new credit facilities, a five year $2.4 billion senior unsecured credit facility that matures in January 2020 and a $225 million 364-day senior unsecured credit facility that matures in January 2016 (together, the “Credit Facilities”). The $2.4 billion facility provides us with the ability to issue up to $500 million in letters of credit. The issuance of letters of credit under the facility reduces the amount available for borrowing. Following the establishment of the new Credit Facilities, we reduced the size of our commercial paper program to $2.4 billion from $2.7 billion. We believe this provides us with sufficient borrowing capacity for our current cash flow needs.
Senior Unsecured Notes
Our total debt related to senior unsecured notes was $3.7 billion at December 31, 2014 as compared to $4.0 billion at December 31, 2013. The decrease in senior unsecured notes outstanding is a result of the maturity of our $250 million 7.375% Senior Notes during March 2014, which was repaid using proceeds from issuances under our commercial paper program.
Our $350 million 3.45% Senior Notes mature during the third quarter of 2015. We anticipate using availability under our Credit Facilities or commercial paper issuances to repay the outstanding balance; therefore, we continue to report the balance as long-term at December 31, 2014.
Covenants
The Credit Facilities and commercial paper program are guaranteed by our indirect, wholly-owned subsidiaries, Noble Holding International Limited (“NHIL”) and Noble Holding Corporation (“NHC”). The covenants and events of default under the Credit Facilities are substantially similar, and each facility contains a covenant that limits our ratio of debt to total tangible capitalization, as defined in the Credit Facilities, to 0.60. At December 31, 2014, our ratio of debt to total tangible capitalization was approximately 0.40. We were in compliance with all covenants under the credit facilities as of December 31, 2014.
In addition to the covenants from the Credit Facilities noted above, the indentures governing our outstanding senior unsecured notes contain covenants that place restrictions on certain merger and consolidation transactions, unless we are the surviving entity or the other party assumes the obligations under the indenture, and on the ability to sell or transfer all or substantially all of our assets. In addition, there are restrictions on incurring or assuming certain liens and sale and lease-back transactions. At December 31, 2014, we were in compliance with all of our debt covenants. We continually monitor compliance with the covenants under our notes and expect to remain in compliance during 2015.
45
Table of Contents
Other
At December 31, 2014, we had letters of credit of $149 million, including bonds covering the temporary importation of equipment, performance bonds and expatriate visa guarantees.
Summary of Contractual Cash Obligations and Commitments
The following table summarizes our contractual cash obligations and commitments at December 31, 2014 (in thousands):
| Payments Due by Period | ||||||||||||||||||||||||||||||||
| Total | 2015 | 2016 | 2017 | 2018 | 2019 | Thereafter | Other | |||||||||||||||||||||||||
| Contractual Cash Obligations |
||||||||||||||||||||||||||||||||
| Long-term debt obligations (1) |
$ | 4,869,020 | $ | 1,473,495 | $ | 299,982 | $ | 299,920 | $ | — | $ | 201,695 | $ | 2,593,928 | $ | — | ||||||||||||||||
| Interest payments |
2,557,636 | 178,401 | 161,252 | 153,240 | 149,177 | 140,983 | 1,774,583 | — | ||||||||||||||||||||||||
| Operating leases |
73,575 | 22,509 | 17,682 | 11,492 | 5,289 | 5,134 | 11,469 | — | ||||||||||||||||||||||||
| Pension plan contributions |
128,229 | 9,659 | 8,380 | 9,209 | 9,944 | 11,121 | 79,916 | — | ||||||||||||||||||||||||
| Purchase commitments (2) |
729,453 | 307,676 | 421,777 | — | — | — | — | — | ||||||||||||||||||||||||
| Tax reserves (3) |
115,787 | — | — | — | — | — | — | 115,787 | ||||||||||||||||||||||||
|
|
|
|
|
|
|
|
|
|
|
|
|
|
|
|
|
|||||||||||||||||
| Total contractual cash obligations |
$ | 8,473,700 | $ | 1,991,740 | $ | 909,073 | $ | 473,861 | $ | 164,410 | $ | 358,933 | $ | 4,459,896 | $ | 115,787 | ||||||||||||||||
|
|
|
|
|
|
|
|
|
|
|
|
|
|
|
|
|
|||||||||||||||||
| (1) | In 2015, our $350 million 3.45% Senior Notes and amounts outstanding under our credit facilities and commercial paper program mature. We anticipate drawing on our Credit Facilities or issuances under our commercial paper program to repay these outstanding balances; therefore, we have shown the entire $350 million Senior Notes balance and $1.1 billion balance on our credit facilities and commercial paper program as long-term on our December 31, 2014 Consolidated Balance Sheet. |
| (2) | Purchase commitments consist of obligations outstanding to external vendors primarily related to future capital purchases. |
| (3) | Tax reserves are included in “Other” due to the difficulty in making reasonably reliable estimates of the timing of cash settlements to taxing authorities. See Note 14 to our accompanying consolidated financial statements. |
At December 31, 2014, we had other commitments that we are contractually obligated to fulfill with cash if the obligations are called. These obligations include letters of credit that guarantee our performance as it relates to our drilling contracts, tax and other obligations in various jurisdictions. These letters of credit obligations are not normally called, as we typically comply with the underlying performance requirement.
The following table summarizes our other commercial commitments at December 31, 2014 (in thousands):
| Amount of Commitment Expiration Per Period | ||||||||||||||||||||||||||||
| Total | 2015 | 2016 | 2017 | 2018 | 2019 | Thereafter | ||||||||||||||||||||||
| Contractual Cash Obligations |
||||||||||||||||||||||||||||
| Letters of Credit |
$ | 148,870 | $ | 148,309 | $ | — | $ | — | $ | — | $ | — | $ | 561 | ||||||||||||||
|
|
|
|
|
|
|
|
|
|
|
|
|
|
|
|||||||||||||||
| Total commercial commitments |
$ | 148,870 | $ | 148,309 | $ | — | $ | — | $ | — | $ | — | $ | 561 | ||||||||||||||
|
|
|
|
|
|
|
|
|
|
|
|
|
|
|
|||||||||||||||
CRITICAL ACCOUNTING POLICIES AND ESTIMATES
Our consolidated financial statements are impacted by the accounting policies used and the estimates and assumptions made by management during their preparation. Critical accounting policies and estimates that most significantly impact our consolidated financial statements are described below.
Principles of Consolidation
The consolidated financial statements include our accounts, those of our wholly-owned subsidiaries and entities in which we hold a controlling financial interest. Our consolidated financial statements include the accounts of two joint ventures, in each of which we own a 50 percent interest. Our ownership interest meets the definition of variable interest under Financial Accounting Standards Board (“FASB”) codification and we have determined that we are the primary beneficiary. Intercompany balances and transactions have been eliminated in consolidation.
The combined joint venture carrying amount of the Bully-class drillships at December 31, 2014 totaled $1.4 billion, which was primarily funded through partner equity contributions. For 2014, operating revenues and net income related to these joint ventures totaled $372 million and $157 million, respectively, as compared to operating revenues and net income of $355 million and $145 million in 2013.
46
Table of Contents
Property and Equipment
Property and equipment is stated at cost, reduced by provisions to recognize economic impairment in value whenever events or changes in circumstances indicate an asset’s carrying value may not be recoverable. At December 31, 2014 and 2013, we had $970 million and $1.9 billion of construction-in-progress, respectively. Such amounts are included in “Property and equipment, at cost” in the accompanying Consolidated Balance Sheets. Major replacements and improvements are capitalized. When assets are sold, retired or otherwise disposed of, the cost and related accumulated depreciation are eliminated from the accounts and the gain or loss is recognized. Drilling equipment and facilities are depreciated using the straight-line method over their estimated useful lives as of the date placed in service or date of major refurbishment. Estimated useful lives of our drilling equipment range from three to thirty years. Other property and equipment is depreciated using the straight-line method over useful lives ranging from two to forty years.
Interest is capitalized on construction-in-progress using the weighted average cost of debt outstanding during the period of construction. Capitalized interest for the years ended December 31, 2014, 2013 and 2012 was $47 million, $115 million and $136 million, respectively.
Scheduled maintenance of equipment is performed based on the number of hours operated in accordance with our preventative maintenance program. Routine repair and maintenance costs are charged to expense as incurred; however, the costs of the overhauls and asset replacement projects that benefit future periods and which typically occur every three to five years are capitalized when incurred and depreciated over an equivalent period. These overhauls and asset replacement projects are included in “Property and equipment, at cost” in the Consolidated Balance Sheets. Such amounts, net of accumulated depreciation, totaled $179 million and $400 million at December 31, 2014 and 2013, respectively. Depreciation expense from continuing operations related to overhauls and asset replacement totaled $77 million, $70 million and $53 million for the years ended December 31, 2014, 2013 and 2012, respectively.
We evaluate the impairment of property and equipment whenever events or changes in circumstances indicate that the carrying amount of an asset may not be recoverable. In addition, on an annual basis, we complete an impairment analysis on our rig fleet. An impairment loss on our property and equipment exists when the estimated undiscounted cash flows expected to result from the use of the asset and its eventual disposition are less than its carrying amount. Any impairment loss recognized represents the excess of the asset’s carrying value over the estimated fair value. As part of this analysis, we make assumptions and estimates regarding future market conditions. To the extent actual results do not meet our estimated assumptions, for a given rig class, we may take an impairment loss in the future.
As a result of our annual impairment test conducted during the fourth quarter of 2014, we recognized a $685 million charge on our semisubmersibles, Noble Driller, Noble Jim Thompson and Noble Paul Wolff, which we decided to no longer actively market as a result of current market conditions. During 2012, we recognized a $13 million impairment charge on our submersible fleet, primarily as a result of the declining market outlook for drilling services for that rig type. During 2013, we recorded an additional impairment charge of approximately $4 million on our two cold stacked submersible rigs arising from the potential disposition of these assets to an unrelated third party. In January 2014, we completed the sale of the submersibles for a total sales price of $7 million. In 2012, we also recognized an impairment charge of $8 million related to certain corporate assets as a result of a declining market for, and the potential disposal of, the assets.
Goodwill
We conduct impairment testing for our goodwill annually during the fourth quarter, and on an interim basis when an event occurs or circumstances change that indicate that the fair value of a reporting unit or the indefinite-lived intangible asset may have declined below its carrying value.
We test goodwill at the reporting unit level, which is defined as an operating segment or one level below an operating segment that constitutes a business for which financial information is available and is regularly reviewed by management. Our goodwill is identified to one reporting unit Contract Drilling Services.
Before testing goodwill, we consider whether or not to first assess qualitative factors to determine whether the existence of events or circumstances lead to a determination that it is more likely than not that the fair value of a reporting unit is less than its carrying amount and whether the two-step impairment test is required.
47
Table of Contents
If, as the result of our qualitative assessment, we determine that the two-step impairment test is required, or, alternatively, if we elect to forgo the qualitative assessment, we test goodwill for impairment by comparing the carrying amount of the reporting unit, to the fair value of the reporting unit utilizing both market and income evaluation methodologies. If this test suggests that the goodwill is not supportable, we proceed to the second step which compares the implied goodwill at the date of the test, to the book value of goodwill of the reporting unit. If the implied goodwill is lower than the book value of goodwill a write-down is taken to the implied value.
As a result of our annual impairment test conducted during the fourth quarter of 2014, we determined that the goodwill associated with the acquisition of Frontier in 2010 was impaired as a result of a significant decline in the market value of our stock, coupled with a decrease in oil and gas prices, significant reductions in the projected dayrates for new contracts and reduced utilization forecasts. For the year ended December 31, 2014, we fully impaired the $60 million of goodwill on our books.
Insurance Reserves
We maintain various levels of self-insured retention for certain losses including property damage, loss of hire, employment practices liability, employers’ liability, and general liability, among others. We accrue for property damage and loss of hire charges on a per event basis.
Employment practices liability claims are accrued based on actual claims during the year. Maritime employer’s liability claims are generally estimated using actuarial determinations. General liability claims are estimated by our internal claims department by evaluating the facts and circumstances of each claim (including incurred but not reported claims) and making estimates based upon historical experience with similar claims. At December 31, 2014 and 2013, loss reserves for personal injury and protection claims totaled $21 million and $29 million, respectively, and such amounts are included in “Other current liabilities” in the accompanying Consolidated Balance Sheets.
Revenue Recognition
Our typical dayrate drilling contracts require our performance of a variety of services for a specified period of time. We determine progress towards completion of the contract by measuring efforts expended and the cost of services required to perform under a drilling contract, as the basis for our revenue recognition. Revenues generated from our dayrate-basis drilling contracts and labor contracts are recognized on a per day basis as services are performed and begin upon the contract commencement, as defined under the specified drilling or labor contract. Dayrate revenues are typically earned, and contract drilling expenses are typically incurred ratably over the term of our drilling contracts. We review and monitor our performance under our drilling contracts to confirm the basis for our revenue recognition. Revenues from bonuses are recognized when earned, and when collectability is reasonably assured.
In our dayrate drilling contracts, we typically receive compensation and incur costs for mobilization, equipment modification or other activities prior to the commencement of a contract. Any such compensation may be paid through a lump-sum payment or other daily compensation. Pre-contract compensation and costs are deferred until the contract commences. The deferred pre-contract compensation and costs are amortized into income, using the straight-line method, over the term of the initial contract period, regardless of the activity taking place. This approach is consistent with the economics for which the parties have contracted. Once a contract commences, we may conduct various activities, including drilling and well bore related activities, rig maintenance and equipment installation, movement between well locations or other activities.
Deferred revenues from drilling contracts totaled $263 million and $303 million at December 31, 2014 and 2013, respectively. Such amounts are included in either “Other current liabilities” or “Other liabilities” in the accompanying Consolidated Balance Sheets, based upon our expected time of recognition. Related expenses deferred under drilling contracts totaled $94 million at December 31, 2014 as compared to $157 million at December 31, 2013, and are included in either “Other current assets” or “Other assets” in the accompanying Consolidated Balance Sheets, based upon our expected time of recognition.
We record reimbursements from customers for “out-of-pocket” expenses as revenues and the related direct cost as operating expenses.
48
Table of Contents
Income Taxes
We operate in a number of countries throughout the world and our tax returns filed in those jurisdictions are subject to review and examination by tax authorities within those jurisdictions. During 2013, the U.S. Internal Revenue Service (“IRS”) completed its examination of our tax reporting for the taxable year ended December 31, 2008 and concluded that we were entitled to a refund. The congressional Joint Committee on Taxation took no exception to the conclusions reached by the IRS, and the refund, plus interest, was received in March 2014. The IRS also completed its examination of our tax reporting for the taxable year ended December 31, 2009, and informed us that it made no changes to our reported tax. During the first quarter of 2014, the IRS began its examination of our tax reporting for the taxable years ended December 31, 2010 and 2011. We believe that we have accurately reported all amounts in our 2010 and 2011 tax returns. We believe the ultimate resolution of the outstanding assessments will not have a material adverse effect on our consolidated financial statements. We recognize uncertain tax positions that we believe have a greater than 50 percent likelihood of being sustained. We cannot predict or provide assurance as to the ultimate outcome of any existing or future assessments.
Audit claims of approximately $66 million attributable to income, customs and other business taxes have been assessed against us. We have received tax assessments of approximately $141 million related to Paragon Offshore’s assets that operated through Noble-retained entities in Mexico, and Paragon Offshore has received tax assessments of approximately $165 million for Noble assets that operated through a Paragon Offshore-retained entity in Brazil. Of these tax assessments in Mexico and Brazil, approximately $20 million and $46 million, respectively, relate to Noble’s share of the tax liability. Under the tax sharing agreement (“TSA”) entered into at the time of the Spin-off, Paragon Offshore has an obligation to indemnify us for all assessed amounts that are related to Paragon Offshore’s Mexico assets, approximately $121 million, and we have an obligation to indemnify Paragon Offshore for all assessed amounts that are related to Noble’s Brazil assets, approximately $46 million, in each case, if and when such payments become due. We have contested, or intend to contest, these assessments, including through litigation if necessary, and we believe the ultimate resolution, for which we have not made any accrual, will not have a material adverse effect on our consolidated financial statements. Tax authorities may issue additional assessments or pursue legal actions as a result of tax audits and we cannot predict or provide assurance as to the ultimate outcome of such assessments and legal actions.
On January 23, 2015, Noble received an official notification of a ruling from the Second Chamber of the Supreme Court in Mexico. The ruling settled an ongoing dispute in Mexico relating to the classification of a Noble subsidiary’s business activity and the applicable rate of depreciation under the Mexican law. The ruling did not result in any additional tax liability to Noble. Additionally, the ruling does not constitute mandatory jurisprudence in Mexico, and thus is only applicable to the Noble subsidiary named in the ruling. We will continue to contest future assessments received. Any claim by the tax authorities relating to this issue is subject to a full indemnification from Paragon Offshore under the TSA.
In certain jurisdictions, we have recognized deferred tax assets and liabilities. Judgment and assumptions are required in determining whether deferred tax assets will be fully or partially utilized. When we estimate that all or some portion of certain deferred tax assets such as net operating loss carryforwards will not be utilized, we establish a valuation allowance for the amount ascertained to be unrealizable. We continually evaluate strategies that could allow for future utilization of our deferred tax assets. Any change in the ability to utilize such deferred tax assets will be accounted for in the period of the event affecting the valuation allowance. If facts and circumstances cause us to change our expectations regarding future tax consequences, the resulting adjustments could have a material effect on our financial results or cash flow.
In certain circumstances, we expect that, due to changing demands of the offshore drilling markets and the ability to redeploy our offshore drilling units, certain units will not reside in a location long enough to give rise to future tax consequences. As a result, no deferred tax asset or liability has been recognized in these circumstances. Should our expectations change regarding the length of time an offshore drilling unit will be used in a given location, we will adjust deferred taxes accordingly.
Certain Significant Estimates and Contingent Liabilities
The preparation of financial statements in conformity with accounting principles generally accepted in the United States of America (“GAAP”) requires management to make estimates and assumptions that affect the reported amounts of assets and liabilities and disclosure of contingent assets and liabilities at the date of the financial statements and the reported amount of revenues and expenses during the reporting period. Certain accounting
49
Table of Contents
policies involve judgments and uncertainties to such an extent that there is reasonable likelihood that materially different amounts could have been reported under different conditions, or if different assumptions had been used. We evaluate our estimates and assumptions on a regular basis. We base our estimates on historical experience and various other assumptions that are believed to be reasonable under the circumstances, the results of which form the basis for making judgments about carrying values of assets and liabilities that are not readily apparent from other sources. Actual results may differ from these estimates and assumptions used in preparation of our consolidated financial statements. In addition, we are involved in several litigation matters, some of which could lead to potential liability to us. We follow FASB standards regarding contingent liabilities which are discussed in “Part II Item 8. Financial Statements and Supplementary Data, Note 18—Commitments and Contingencies.”
New Accounting Pronouncements
In April 2014, the FASB issued Accounting Standards Update (“ASU”) No. 2014-08, which amends FASB Accounting Standards Codification (“ASC”) Topic 205, “Presentation of Financial Statements” and ASC Topic 360, “Property, Plant, and Equipment.” This ASU alters the definition of a discontinued operation to cover only asset disposals that are a strategic shift with a major effect on an entity’s operations and finances, and calls for more extensive disclosures about a discontinued operation’s assets, liabilities, income and expenses. The guidance is effective for all disposals, or classifications as held-for-sale, of components of an entity that occur within annual periods beginning on or after December 15, 2014. This standard was not early adopted in connection with the Spin-off. We are still evaluating what impact, if any, the adoption of this guidance will have on our financial condition, results of operations, cash flows or financial disclosures.
In May 2014, the FASB issued ASU No. 2014-09, which amends ASC Topic 606, “Revenue from Contracts with Customers.” The amendments in this ASU are intended to provide a more robust framework for addressing revenue issues, improve comparability of revenue recognition practices and improve disclosure requirements. The amendments in this update are effective for interim and annual reporting periods beginning after December 15, 2016. We are still evaluating what impact, if any, the adoption of this guidance will have on our financial condition, results of operations, cash flows or financial disclosures.
In June 2014, the FASB issued ASU No. 2014-12, which amends ASC Topic 718, “Compensation-Stock Compensation.” The guidance requires that a performance target that affects vesting and that could be achieved after the requisite service period be treated as a performance condition and should not be reflected in the estimate of the grant-date fair value of the award. The guidance is effective for annual periods beginning after December 15, 2015. The guidance can be applied prospectively for all awards granted or modified after the effective date or retrospectively to all awards with performance targets outstanding as of the beginning of the earliest annual period presented in the financial statements and to all new or modified awards thereafter. We are still evaluating what impact, if any, the adoption of this guidance will have on our financial condition, results of operations, cash flows or financial disclosures.
In August 2014, the FASB issued ASU No. 2014-15, which amends ASC Subtopic 205-40, “Disclosure of Uncertainties about an Entity’s Ability to continue as a Going Concern.” The amendments in this ASU provide guidance related to management’s responsibility to evaluate whether there is substantial doubt about an entity’s ability to continue as a going concern and to provide related footnote disclosures. The amendments are effective for the annual period ending after December 15, 2016, and for annual periods and interim periods thereafter. We are still evaluating what impact, if any, the adoption of this guidance will have on our financial condition, results of operations, cash flows or financial disclosures.
In January 2015, the FASB issued ASU No. 2015-01, which amends ASC Subtopic 225-20, “Income Statement – Extraordinary and Unusual Items.” The amendment in this ASU eliminates from GAAP the concept of extraordinary items. The amendments in this update are effective for interim and annual reporting periods beginning after December 15, 2015. We are still evaluating what impact, if any, the adoption of this guidance will have on our financial condition, results of operations, cash flows or financial disclosures.
In February 2015, the FASB issued ASU No. 2015-02 which amends ASC Subtopic 810, “Consolidations.” This amendment affects reporting entities that are required to evaluate whether they should consolidate certain legal entities. Specifically, the amendments modify the evaluation of whether limited partnerships and similar legal entities are VIEs or voting interest entities; eliminate the presumption that a general partner should consolidate a limited partnership; affect the consolidation analysis of reporting entities that are involved with VIEs, particularly those that have fee arrangements and related party relationships. The standard is effective for interim and annual reporting periods beginning after December 15, 2015. The standard may be applied retrospectively or through a cumulative effect adjustment to retained earnings as of the beginning of the year of adoption. We are still evaluating what impact, if any, the adoption of this guidance will have on our financial condition, results of operations, cash flows or financial disclosures.
50
Table of Contents
Item 7A. Quantitative and Qualitative Disclosures About Market Risk.
Market risk is the potential for loss due to a change in the value of a financial instrument as a result of fluctuations in interest rates, currency exchange rates or equity prices, as further described below.
Interest Rate Risk
We are subject to market risk exposure related to changes in interest rates on borrowings under the Credit Facilities and commercial paper program. Interest on borrowings under the Credit Facilities is at an agreed upon percentage point spread over LIBOR, or a base rate stated in the agreements. At December 31, 2014, we had $1.1 billion in borrowings outstanding under our credit facilities and commercial paper program, which is supported by the credit facilities. Assuming our current level of debt, a change in LIBOR rates of 1 percent would increase our interest charges by approximately $11 million per year.
Access to our commercial paper program is dependent upon our credit ratings. A decline in our credit ratings below investment grade would prohibit us from accessing the commercial paper market. If we were unable to access the commercial paper market, we would likely transfer our outstanding borrowings to our revolving credit facilities. Our revolving credit facilities have interest rates that are generally higher than those found in the commercial paper market, which would result in increased interest expense in the future.
In addition, our revolving credit facilities have provisions which vary the applicable interest rates based upon the Company’s credit ratings. If our credit ratings were to decline, the interest expense under our revolving credit facilities would increase.
We maintain certain debt instruments at a fixed rate whose fair value will fluctuate based on changes in interest rates and market perceptions of our credit risk. The fair value of our total debt was $4.5 billion and $5.7 billion at December 31, 2014 and December 31, 2013, respectively. The decrease in fair value was a result of a decrease in the value of our senior notes stemming from market conditions, coupled with a decrease in the amount of debt outstanding under our credit facilities and commercial paper program and the repayment of our $250 million fixed rate senior note.
Foreign Currency Risk
Although we are a U.K. company, we define foreign currency as any non-U.S. denominated currency. Our functional currency is primarily the U.S. Dollar, which is consistent with the oil and gas industry. However, outside the United States, a portion of our expenses are incurred in local currencies. Therefore, when the U.S. Dollar weakens (strengthens) in relation to the currencies of the countries in which we operate, our expenses reported in U.S. Dollars will increase (decrease).
We are exposed to risks on future cash flows to the extent that local currency expenses exceed revenues denominated in local currency that are other than the functional currency. To help manage this potential risk, we periodically enter into derivative instruments to manage our exposure to fluctuations in currency exchange rates, and we may conduct hedging activities in future periods to mitigate such exposure. These contracts are primarily accounted for as cash flow hedges, with the effective portion of changes in the fair value of the hedge recorded on the Consolidated Balance Sheet and in “Accumulated other comprehensive loss” (“AOCL”). Amounts recorded in AOCL are reclassified into earnings in the same period or periods that the hedged item is recognized in earnings. The ineffective portion of changes in the fair value of the hedged item is recorded directly to earnings. We have documented policies and procedures to monitor and control the use of derivative instruments. We do not engage in derivative transactions for speculative or trading purposes, nor are we a party to leveraged derivatives.
Specifically, our North Sea and Brazilian operations have a significant amount of their cash operating expenses payable in local currencies. To limit the potential risk of currency fluctuations, we periodically enter into forward contracts, which settle monthly in the operations’ respective local currencies. All of these contracts have a maturity of less than 12 months. At December 31, 2014, we had no outstanding derivative contracts. Depending on market conditions, we may elect to utilize short-term forward currency contracts in the future.
51
Table of Contents
Market Risk
We have a U.S. noncontributory defined benefit pension plan that covers certain salaried employees and a U.S. noncontributory defined benefit pension plan that covers certain hourly employees, whose initial date of employment is prior to August 1, 2004 (collectively referred to as our “qualified U.S. plans”). These plans are governed by the Noble Drilling Employees’ Retirement Trust. The benefits from these plans are based primarily on years of service and, for the salaried plan, employees’ compensation near retirement. These plans are designed to qualify under the Employee Retirement Income Security Act of 1974 (“ERISA”), and our funding policy is consistent with funding requirements of ERISA and other applicable laws and regulations. We make cash contributions, or utilize credits available to us, for the qualified U.S. plans when required. The benefit amount that can be covered by the qualified U.S. plans is limited under ERISA and the Internal Revenue Code (“IRC”) of 1986. Therefore, we maintain an unfunded, nonqualified excess benefit plan designed to maintain benefits for specified employees at the formula level in the qualified salary U.S. plan. We refer to the qualified U.S. plans and the excess benefit plan collectively as the “U.S. plans”.
In addition to the U.S. plans, each of Noble Drilling (Land Support) Limited and Noble Resources Limited, both indirect, wholly-owned subsidiaries of Noble-UK, maintains a pension plan that covers all of its salaried, non-union employees. Benefits are based on credited service and employees’ compensation, as defined by the plans.
Changes in market asset values related to the pension plans noted above could have a material impact upon our Consolidated Statement of Comprehensive Income (Loss) and could result in material cash expenditures in future periods.
52
Table of Contents
Item 8. Financial Statements and Supplementary Data.
The following financial statements are filed in this Item 8:
| Page | ||||
| Report of Independent Registered Public Accounting Firm (Noble-UK) |
54 | |||
| 55 | ||||
| 56 | ||||
| 57 | ||||
| 58 | ||||
| 59 | ||||
| Report of Independent Registered Public Accounting Firm (Noble-Cayman) |
60 | |||
| 61 | ||||
| 62 | ||||
| 63 | ||||
| 64 | ||||
| 65 | ||||
| 66 | ||||
53
Table of Contents
REPORT OF INDEPENDENT REGISTERED PUBLIC ACCOUNTING FIRM
To the Board of Directors and
Shareholders of Noble Corporation plc
In our opinion, the accompanying consolidated balance sheets and the related consolidated statements of income, comprehensive income (loss), equity, and cash flows present fairly, in all material respects, the financial position of Noble Corporation plc and its subsidiaries at December 31, 2014 and 2013, and the results of their operations and their cash flows for each of the three years in the period ended December 31, 2014 in conformity with accounting principles generally accepted in the United States of America. Also in our opinion, the Company maintained, in all material respects, effective internal control over financial reporting as of December 31, 2014, based on criteria established in Internal Control—Integrated Framework (2013) issued by the Committee of Sponsoring Organizations of the Treadway Commission (COSO). Noble Corporation plc’s management is responsible for these financial statements, for maintaining effective internal control over financial reporting and for its assessment of the effectiveness of internal control over financial reporting, included in Management’s Annual Report on Internal Control over Financial Reporting as appearing under Item 9A. Our responsibility is to express opinions on these financial statements and on Noble Corporation plc’s internal control over financial reporting based on our integrated audits. We conducted our audits in accordance with the standards of the Public Company Accounting Oversight Board (United States). Those standards require that we plan and perform the audits to obtain reasonable assurance about whether the financial statements are free of material misstatement and whether effective internal control over financial reporting was maintained in all material respects. Our audits of the financial statements included examining, on a test basis, evidence supporting the amounts and disclosures in the financial statements, assessing the accounting principles used and significant estimates made by management, and evaluating the overall financial statement presentation. Our audit of internal control over financial reporting included obtaining an understanding of internal control over financial reporting, assessing the risk that a material weakness exists, and testing and evaluating the design and operating effectiveness of internal control based on the assessed risk. Our audits also included performing such other procedures as we considered necessary in the circumstances. We believe that our audits provide a reasonable basis for our opinions.
A company’s internal control over financial reporting is a process designed to provide reasonable assurance regarding the reliability of financial reporting and the preparation of financial statements for external purposes in accordance with generally accepted accounting principles. A company’s internal control over financial reporting includes those policies and procedures that (i) pertain to the maintenance of records that, in reasonable detail, accurately and fairly reflect the transactions and dispositions of the assets of the company; (ii) provide reasonable assurance that transactions are recorded as necessary to permit preparation of financial statements in accordance with generally accepted accounting principles, and that receipts and expenditures of the company are being made only in accordance with authorizations of management and directors of the company; and (iii) provide reasonable assurance regarding prevention or timely detection of unauthorized acquisition, use, or disposition of the company’s assets that could have a material effect on the financial statements.
Because of its inherent limitations, internal control over financial reporting may not prevent or detect misstatements. Also, projections of any evaluation of effectiveness to future periods are subject to the risk that controls may become inadequate because of changes in conditions, or that the degree of compliance with the policies or procedures may deteriorate.
/s/ PricewaterhouseCoopers LLP
Houston, Texas
February 27, 2015
54
Table of Contents
NOBLE CORPORATION PLC AND SUBSIDIARIES
CONSOLIDATED BALANCE SHEET
(In thousands)
| December 31, | December 31, | |||||||
| 2014 | 2013 | |||||||
| ASSETS |
|
|||||||
| Current assets |
||||||||
| Cash and cash equivalents |
$ | 68,510 | $ | 114,458 | ||||
| Accounts receivable |
569,096 | 949,069 | ||||||
| Taxes receivable |
107,490 | 140,269 | ||||||
| Prepaid expenses and other current assets |
183,466 | 187,139 | ||||||
|
|
|
|
|
|||||
| Total current assets |
928,562 | 1,390,935 | ||||||
|
|
|
|
|
|||||
| Property and equipment, at cost |
14,442,922 | 19,198,767 | ||||||
| Accumulated depreciation |
(2,330,413 | ) | (4,640,677 | ) | ||||
|
|
|
|
|
|||||
| Property and equipment, net |
12,112,509 | 14,558,090 | ||||||
|
|
|
|
|
|||||
| Other assets |
245,751 | 268,932 | ||||||
|
|
|
|
|
|||||
| Total assets |
$ | 13,286,822 | $ | 16,217,957 | ||||
|
|
|
|
|
|||||
| LIABILITIES AND EQUITY |
||||||||
| Current liabilities |
||||||||
| Accounts payable |
$ | 265,389 | $ | 347,214 | ||||
| Accrued payroll and related costs |
102,520 | 151,161 | ||||||
| Taxes payable |
94,230 | 125,119 | ||||||
| Dividends payable |
— | 128,249 | ||||||
| Other current liabilities |
206,535 | 300,172 | ||||||
|
|
|
|
|
|||||
| Total current liabilities |
668,674 | 1,051,915 | ||||||
|
|
|
|
|
|||||
| Long-term debt |
4,869,020 | 5,556,251 | ||||||
| Deferred income taxes |
120,589 | 225,455 | ||||||
| Other liabilities |
341,505 | 334,308 | ||||||
|
|
|
|
|
|||||
| Total liabilities |
5,999,788 | 7,167,929 | ||||||
|
|
|
|
|
|||||
| Commitments and contingencies |
||||||||
| Equity |
||||||||
| Shares; 247,501 and 253,448 shares outstanding |
2,475 | 2,534 | ||||||
| Additional paid-in capital |
695,638 | 810,286 | ||||||
| Retained earnings |
5,936,035 | 7,591,927 | ||||||
| Accumulated other comprehensive loss |
(69,418 | ) | (82,164 | ) | ||||
|
|
|
|
|
|||||
| Total shareholders’ equity |
6,564,730 | 8,322,583 | ||||||
|
|
|
|
|
|||||
| Noncontrolling interests |
722,304 | 727,445 | ||||||
|
|
|
|
|
|||||
| Total equity |
7,287,034 | 9,050,028 | ||||||
|
|
|
|
|
|||||
| Total liabilities and equity |
$ | 13,286,822 | $ | 16,217,957 | ||||
|
|
|
|
|
|||||
See accompanying notes to the consolidated financial statements.
55
Table of Contents
NOBLE CORPORATION PLC AND SUBSIDIARIES
CONSOLIDATED STATEMENTS OF INCOME
(In thousands, except per share amounts)
| Year Ended December 31, | ||||||||||||
| 2014 | 2013 | 2012 | ||||||||||
| Operating revenues |
||||||||||||
| Contract drilling services |
$ | 3,147,859 | $ | 2,454,745 | $ | 2,089,621 | ||||||
| Reimbursables |
84,644 | 66,292 | 65,767 | |||||||||
| Labor contract drilling services |
— | 17,095 | 45,299 | |||||||||
| Other |
1 | 11 | 12 | |||||||||
|
|
|
|
|
|
|
|||||||
| 3,232,504 | 2,538,143 | 2,200,699 | ||||||||||
|
|
|
|
|
|
|
|||||||
| Operating costs and expenses |
||||||||||||
| Contract drilling services |
1,500,512 | 1,168,764 | 969,310 | |||||||||
| Reimbursables |
66,378 | 50,410 | 55,424 | |||||||||
| Labor contract drilling services |
— | 11,601 | 22,976 | |||||||||
| Depreciation and amortization |
627,473 | 511,513 | 440,306 | |||||||||
| General and administrative |
106,771 | 117,997 | 99,990 | |||||||||
| Loss on impairment |
745,428 | 3,585 | 20,384 | |||||||||
| Gain on disposal of assets, net |
— | (35,646 | ) | — | ||||||||
| Gain on contract settlements/extinguishments, net |
— | (30,618 | ) | (33,255 | ) | |||||||
|
|
|
|
|
|
|
|||||||
| 3,046,562 | 1,797,606 | 1,575,135 | ||||||||||
|
|
|
|
|
|
|
|||||||
| Operating income |
185,942 | 740,537 | 625,564 | |||||||||
| Other income (expense) |
||||||||||||
| Interest expense, net of amount capitalized |
(155,179 | ) | (106,300 | ) | (85,763 | ) | ||||||
| Interest income and other, net |
(1,298 | ) | 4,184 | 3,564 | ||||||||
|
|
|
|
|
|
|
|||||||
| Income from continuing operations before income taxes |
29,465 | 638,421 | 543,365 | |||||||||
| Income tax provision |
(106,651 | ) | (92,117 | ) | (95,183 | ) | ||||||
|
|
|
|
|
|
|
|||||||
| Net income (loss) from continuing operations |
(77,186 | ) | 546,304 | 448,182 | ||||||||
| Net income from discontinued operations, net of tax |
160,502 | 304,102 | 107,955 | |||||||||
|
|
|
|
|
|
|
|||||||
| Net income |
83,316 | 850,406 | 556,137 | |||||||||
| Net income attributable to noncontrolling interests |
(74,825 | ) | (67,709 | ) | (33,793 | ) | ||||||
|
|
|
|
|
|
|
|||||||
| Net income attributable to Noble Corporation plc |
$ | 8,491 | $ | 782,697 | $ | 522,344 | ||||||
|
|
|
|
|
|
|
|||||||
| Net income (loss) attributable to Noble Corporation plc |
||||||||||||
| Income (loss) from continuing operations |
$ | (152,011 | ) | $ | 478,595 | $ | 414,389 | |||||
| Income from discontinued operations |
160,502 | 304,102 | 107,955 | |||||||||
|
|
|
|
|
|
|
|||||||
| Net income attributable to Noble Corporation plc |
$ | 8,491 | $ | 782,697 | $ | 522,344 | ||||||
|
|
|
|
|
|
|
|||||||
| Per share data: |
||||||||||||
| Basic: |
||||||||||||
| Income (loss) from continuing operations |
$ | (0.60 | ) | $ | 1.86 | $ | 1.63 | |||||
| Income from discontinued operations |
0.63 | 1.19 | 0.42 | |||||||||
|
|
|
|
|
|
|
|||||||
| Net income attributable to Noble Corporation plc |
$ | 0.03 | $ | 3.05 | $ | 2.05 | ||||||
|
|
|
|
|
|
|
|||||||
| Diluted: |
||||||||||||
| Income (loss) from continuing operations |
$ | (0.60 | ) | $ | 1.86 | $ | 1.63 | |||||
| Income from discontinued operations |
0.63 | 1.19 | 0.42 | |||||||||
|
|
|
|
|
|
|
|||||||
| Net income attributable to Noble Corporation plc |
$ | 0.03 | $ | 3.05 | $ | 2.05 | ||||||
|
|
|
|
|
|
|
|||||||
| Weighted- Average Shares Outstanding |
||||||||||||
| Basic |
252,909 | 253,288 | 252,435 | |||||||||
| Diluted |
252,909 | 253,547 | 252,791 | |||||||||
See accompanying notes to the consolidated financial statements.
56
Table of Contents
NOBLE CORPORATION PLC AND SUBSIDIARIES
CONSOLIDATED STATEMENTS OF COMPREHENSIVE INCOME (LOSS)
(In thousands)
| Year Ended December 31, | ||||||||||||
| 2014 | 2013 | 2012 | ||||||||||
| Net income |
$ | 83,316 | $ | 850,406 | $ | 556,137 | ||||||
| Other comprehensive income (loss), net of tax |
||||||||||||
| Foreign currency translation adjustments |
(118 | ) | (3,188 | ) | (8,076 | ) | ||||||
| Foreign currency forward contracts |
— | — | 3,061 | |||||||||
| Net pension plan gain (loss) (net of tax provision (benefit) of ($21,429) in 2014, $14,155 in 2013 and ($3,777) in 2012 ) |
(41,608 | ) | 29,861 | (41,658 | ) | |||||||
| Amortization of deferred pension plan amounts (net of tax provision of $1,102 in 2014, $2,924 in 2013 and $2,841 in 2012) |
2,764 | 6,612 | 5,545 | |||||||||
| Net pension plan curtailment and settlement expense (net of tax provision of $9,902 in 2014) |
18,389 | — | — | |||||||||
| Prior service cost arising during the period (net of tax benefit of $317 in 2014) |
(1,159 | ) | — | — | ||||||||
|
|
|
|
|
|
|
|||||||
| Other comprehensive income (loss), net |
(21,732 | ) | 33,285 | (41,128 | ) | |||||||
|
|
|
|
|
|
|
|||||||
| Total comprehensive income |
61,584 | 883,691 | 515,009 | |||||||||
| Net comprehensive income attributable to noncontrolling interests |
(74,825 | ) | (67,709 | ) | (33,793 | ) | ||||||
|
|
|
|
|
|
|
|||||||
| Comprehensive income (loss) attributable to Noble Corporation plc |
$ | (13,241 | ) | $ | 815,982 | $ | 481,216 | |||||
|
|
|
|
|
|
|
|||||||
See accompanying notes to the consolidated financial statements.
57
Table of Contents
NOBLE CORPORATION PLC AND SUBSIDIARIES
CONSOLIDATED STATEMENTS OF CASH FLOWS
(In thousands)
| Year Ended December 31, | ||||||||||||
| 2014 | 2013 | 2012 | ||||||||||
| Cash flows from operating activities |
||||||||||||
| Net income |
$ | 83,316 | $ | 850,406 | $ | 556,137 | ||||||
| Adjustments to reconcile net income to net cash from operating activities: |
||||||||||||
| Depreciation and amortization |
863,547 | 879,422 | 758,621 | |||||||||
| Loss on impairment |
745,428 | 43,688 | 20,384 | |||||||||
| Gain on disposal of assets, net |
— | (35,646 | ) | — | ||||||||
| Deferred income taxes |
(10,999 | ) | (15,955 | ) | (20,119 | ) | ||||||
| Amortization of share-based compensation |
46,389 | 43,620 | 35,930 | |||||||||
| Net change in other assets and liabilities |
50,527 | (63,218 | ) | 30,740 | ||||||||
|
|
|
|
|
|
|
|||||||
| Net cash from operating activities |
1,778,208 | 1,702,317 | 1,381,693 | |||||||||
|
|
|
|
|
|
|
|||||||
| Cash flows from investing activities |
||||||||||||
| Capital expenditures |
(2,072,885 | ) | (2,487,520 | ) | (1,669,811 | ) | ||||||
| Change in accrued capital expenditures |
(36,383 | ) | (58,587 | ) | (121,077 | ) | ||||||
| Proceeds from disposal of assets |
— | 61,000 | — | |||||||||
|
|
|
|
|
|
|
|||||||
| Net cash from investing activities |
(2,109,268 | ) | (2,485,107 | ) | (1,790,888 | ) | ||||||
|
|
|
|
|
|
|
|||||||
| Cash flows from financing activities |
||||||||||||
| Net change in borrowings outstanding on bank credit facilities |
(437,647 | ) | 1,221,333 | (635,192 | ) | |||||||
| Repayment of long-term debt |
(250,000 | ) | (300,000 | ) | — | |||||||
| Proceeds from issuance of senior notes, net of debt issuance costs |
— | — | 1,186,636 | |||||||||
| Financing costs on credit facilities |
(398 | ) | (2,484 | ) | (5,221 | ) | ||||||
| Long-term borrowings of Paragon Offshore |
1,710,550 | — | — | |||||||||
| Financing costs on long-term borrowings of Paragon Offshore |
(14,676 | ) | — | — | ||||||||
| Cash balances of Paragon Offshore in Spin-off |
(104,152 | ) | — | — | ||||||||
| Dividends paid to noncontrolling interests |
(79,966 | ) | (105,388 | ) | — | |||||||
| Contributions from noncontrolling interests |
— | — | 40,000 | |||||||||
| Repurchases of shares |
(154,145 | ) | — | — | ||||||||
| Repurchases of employee shares surrendered for taxes |
— | (7,653 | ) | (10,516 | ) | |||||||
| Employee stock transactions |
2,125 | 4,261 | 14,677 | |||||||||
| Par value reduction/dividend payments |
(386,579 | ) | (194,913 | ) | (138,293 | ) | ||||||
|
|
|
|
|
|
|
|||||||
| Net cash from financing activities |
285,112 | 615,156 | 452,091 | |||||||||
|
|
|
|
|
|
|
|||||||
| Net change in cash and cash equivalents |
(45,948 | ) | (167,634 | ) | 42,896 | |||||||
| Cash and cash equivalents, beginning of period |
114,458 | 282,092 | 239,196 | |||||||||
|
|
|
|
|
|
|
|||||||
| Cash and cash equivalents, end of period |
$ | 68,510 | $ | 114,458 | $ | 282,092 | ||||||
|
|
|
|
|
|
|
|||||||
See accompanying notes to the consolidated financial statements.
58
Table of Contents
NOBLE CORPORATION PLC AND SUBSIDIARIES
CONSOLIDATED STATEMENTS OF EQUITY
(In thousands)
| Accumulated | ||||||||||||||||||||||||||||||||
| Capital in | Other | |||||||||||||||||||||||||||||||
| Shares | Excess of | Retained | Treasury | Noncontrolling | Comprehensive | Total | ||||||||||||||||||||||||||
| Balance | Par Value | Par Value | Earnings | Shares | Interests | Loss | Equity | |||||||||||||||||||||||||
| Balance at December 31, 2011 |
252,639 | $ | 766,595 | $ | 48,356 | $ | 6,676,444 | $ | (10,553 | ) | $ | 691,331 | $ | (74,321 | ) | $ | 8,097,852 | |||||||||||||||
| Employee related equity activity |
||||||||||||||||||||||||||||||||
| Amortization of share-based compensation |
— | — | 35,930 | — | — | — | — | 35,930 | ||||||||||||||||||||||||
| Issuance of share-based compensation shares |
437 | 1,307 | (1,299 | ) | — | — | — | — | 8 | |||||||||||||||||||||||
| Exercise of stock options |
646 | 1,836 | 11,705 | — | — | — | — | 13,541 | ||||||||||||||||||||||||
| Tax benefit of equity transactions |
— | — | 1,128 | — | — | — | — | 1,128 | ||||||||||||||||||||||||
| Restricted shares forfeited or repurchased for taxes |
(374 | ) | (1,138 | ) | 1,138 | — | (10,516 | ) | — | — | (10,516 | ) | ||||||||||||||||||||
| Net income |
— | — | — | 522,344 | — | 33,793 | — | 556,137 | ||||||||||||||||||||||||
| Contributions from noncontrolling interests |
— | — | — | — | — | 40,000 | — | 40,000 | ||||||||||||||||||||||||
| Par value reduction/dividend payments |
— | (58,470 | ) | (13,427 | ) | — | — | — | — | (71,897 | ) | |||||||||||||||||||||
| Dividends |
— | — | — | (132,765 | ) | — | — | — | (132,765 | ) | ||||||||||||||||||||||
| Other comprehensive loss, net |
— | — | — | — | — | — | (41,128 | ) | (41,128 | ) | ||||||||||||||||||||||
|
|
|
|
|
|
|
|
|
|
|
|
|
|
|
|
|
|||||||||||||||||
| Balance at December 31, 2012 |
253,348 | $ | 710,130 | $ | 83,531 | $ | 7,066,023 | $ | (21,069 | ) | $ | 765,124 | $ | (115,449 | ) | $ | 8,488,290 | |||||||||||||||
| Employee related equity activity |
||||||||||||||||||||||||||||||||
| Amortization of share-based compensation |
— | — | 43,620 | — | — | — | — | 43,620 | ||||||||||||||||||||||||
| Issuance of share-based compensation shares |
667 | 1,872 | (1,855 | ) | — | — | — | — | 17 | |||||||||||||||||||||||
| Exercise of stock options |
212 | 496 | 5,155 | — | — | — | — | 5,651 | ||||||||||||||||||||||||
| Tax benefit of equity transactions |
— | — | (1,407 | ) | — | — | — | — | (1,407 | ) | ||||||||||||||||||||||
| Restricted shares forfeited or repurchased for taxes |
— | — | — | — | (7,653 | ) | — | — | (7,653 | ) | ||||||||||||||||||||||
| Retirement of treasury shares |
— | — | (28,722 | ) | — | 28,722 | — | — | — | |||||||||||||||||||||||
| Redomiciliation to the United Kingdom |
(779 | ) | (709,964 | ) | 709,964 | — | — | — | — | — | ||||||||||||||||||||||
| Net income |
— | — | — | 782,697 | — | 67,709 | — | 850,406 | ||||||||||||||||||||||||
| Dividends paid to noncontrolling interests |
— | — | — | — | — | (105,388 | ) | — | (105,388 | ) | ||||||||||||||||||||||
| Dividends |
— | — | — | (256,793 | ) | — | — | — | (256,793 | ) | ||||||||||||||||||||||
| Other comprehensive income, net |
— | — | — | — | — | — | 33,285 | 33,285 | ||||||||||||||||||||||||
|
|
|
|
|
|
|
|
|
|
|
|
|
|
|
|
|
|||||||||||||||||
| Balance at December 31, 2013 |
253,448 | $ | 2,534 | $ | 810,286 | $ | 7,591,927 | $ | — | $ | 727,445 | $ | (82,164 | ) | $ | 9,050,028 | ||||||||||||||||
| Employee related equity activity |
||||||||||||||||||||||||||||||||
| Amortization of share-based compensation |
— | — | 46,389 | — | — | — | — | 46,389 | ||||||||||||||||||||||||
| Issuance of share-based compensation shares |
692 | 6 | (9,076 | ) | — | — | — | — | (9,070 | ) | ||||||||||||||||||||||
| Exercise of stock options |
131 | 3 | 2,644 | — | — | — | — | 2,647 | ||||||||||||||||||||||||
| Tax benefit of equity transactions |
— | — | (528 | ) | — | — | — | — | (528 | ) | ||||||||||||||||||||||
| Repurchases of shares |
(6,770 | ) | (68 | ) | (154,077 | ) | — | — | — | — | (154,145 | ) | ||||||||||||||||||||
| Net income |
— | — | — | 8,491 | — | 74,825 | — | 83,316 | ||||||||||||||||||||||||
| Dividends paid to noncontrolling interests |
— | — | — | — | — | (79,966 | ) | — | (79,966 | ) | ||||||||||||||||||||||
| Dividends |
— | — | — | (258,330 | ) | — | — | — | (258,330 | ) | ||||||||||||||||||||||
| Spin-off of Paragon Offshore |
— | — | — | (1,406,053 | ) | — | — | 34,478 | (1,371,575 | ) | ||||||||||||||||||||||
| Other comprehensive loss, net |
— | — | — | — | — | — | (21,732 | ) | (21,732 | ) | ||||||||||||||||||||||
|
|
|
|
|
|
|
|
|
|
|
|
|
|
|
|
|
|||||||||||||||||
| Balance at December 31, 2014 |
247,501 | $ | 2,475 | $ | 695,638 | $ | 5,936,035 | $ | — | $ | 722,304 | $ | (69,418 | ) | $ | 7,287,034 | ||||||||||||||||
|
|
|
|
|
|
|
|
|
|
|
|
|
|
|
|
|
|||||||||||||||||
See accompanying notes to the consolidated financial statements.
59
Table of Contents
REPORT OF INDEPENDENT REGISTERED PUBLIC ACCOUNTING FIRM
To the Board of Directors and
Shareholder of Noble Corporation
In our opinion, the accompanying consolidated balance sheets and the related consolidated statements of income, comprehensive income, equity, and cash flows present fairly, in all material respects, the financial position of Noble Corporation and its subsidiaries at December 31, 2014 and 2013, and the results of their operations and their cash flows for each of the three years in the period ended December 31, 2014 in conformity with accounting principles generally accepted in the United States of America. Also in our opinion, the Company maintained, in all material respects, effective internal control over financial reporting as of December 31, 2014, based on criteria established in Internal Control—Integrated Framework (2013) issued by the Committee of Sponsoring Organizations of the Treadway Commission (COSO). Noble Corporation’s management is responsible for these financial statements, for maintaining effective internal control over financial reporting and for its assessment of the effectiveness of internal control over financial reporting, included in Management’s Annual Report on Internal Control over Financial Reporting as appearing under Item 9A. Our responsibility is to express opinions on these financial statements and on Noble Corporation’s internal control over financial reporting based on our integrated audits. We conducted our audits in accordance with the standards of the Public Company Accounting Oversight Board (United States). Those standards require that we plan and perform the audits to obtain reasonable assurance about whether the financial statements are free of material misstatement and whether effective internal control over financial reporting was maintained in all material respects. Our audits of the financial statements included examining, on a test basis, evidence supporting the amounts and disclosures in the financial statements, assessing the accounting principles used and significant estimates made by management, and evaluating the overall financial statement presentation. Our audit of internal control over financial reporting included obtaining an understanding of internal control over financial reporting, assessing the risk that a material weakness exists, and testing and evaluating the design and operating effectiveness of internal control based on the assessed risk. Our audits also included performing such other procedures as we considered necessary in the circumstances. We believe that our audits provide a reasonable basis for our opinions.
A company’s internal control over financial reporting is a process designed to provide reasonable assurance regarding the reliability of financial reporting and the preparation of financial statements for external purposes in accordance with generally accepted accounting principles. A company’s internal control over financial reporting includes those policies and procedures that (i) pertain to the maintenance of records that, in reasonable detail, accurately and fairly reflect the transactions and dispositions of the assets of the company; (ii) provide reasonable assurance that transactions are recorded as necessary to permit preparation of financial statements in accordance with generally accepted accounting principles, and that receipts and expenditures of the company are being made only in accordance with authorizations of management and directors of the company; and (iii) provide reasonable assurance regarding prevention or timely detection of unauthorized acquisition, use, or disposition of the company’s assets that could have a material effect on the financial statements.
Because of its inherent limitations, internal control over financial reporting may not prevent or detect misstatements. Also, projections of any evaluation of effectiveness to future periods are subject to the risk that controls may become inadequate because of changes in conditions, or that the degree of compliance with the policies or procedures may deteriorate.
/s/ PricewaterhouseCoopers LLP
Houston, Texas
February 27, 2015
60
Table of Contents
NOBLE CORPORATION AND SUBSIDIARIES
CONSOLIDATED BALANCE SHEET
(In thousands)
| December 31, | December 31, | |||||||
| 2014 | 2013 | |||||||
| ASSETS |
|
|||||||
| Current assets |
||||||||
| Cash and cash equivalents |
$ | 65,780 | $ | 110,382 | ||||
| Accounts receivable |
569,096 | 949,069 | ||||||
| Taxes receivable |
107,289 | 140,029 | ||||||
| Prepaid expenses and other current assets |
139,669 | 184,348 | ||||||
|
|
|
|
|
|||||
| Total current assets |
881,834 | 1,383,828 | ||||||
|
|
|
|
|
|||||
| Property and equipment, at cost |
14,404,371 | 19,160,350 | ||||||
| Accumulated depreciation |
(2,318,220 | ) | (4,631,678 | ) | ||||
|
|
|
|
|
|||||
| Property and equipment, net |
12,086,151 | 14,528,672 | ||||||
|
|
|
|
|
|||||
| Other assets |
222,254 | 269,014 | ||||||
|
|
|
|
|
|||||
| Total assets |
$ | 13,190,239 | $ | 16,181,514 | ||||
|
|
|
|
|
|||||
| LIABILITIES AND EQUITY |
||||||||
| Current liabilities |
||||||||
| Accounts payable |
$ | 261,012 | $ | 345,910 | ||||
| Accrued payroll and related costs |
91,487 | 143,346 | ||||||
| Taxes payable |
91,471 | 120,588 | ||||||
| Other current liabilities |
201,914 | 300,172 | ||||||
|
|
|
|
|
|||||
| Total current liabilities |
645,884 | 910,016 | ||||||
|
|
|
|
|
|||||
| Long-term debt |
4,869,020 | 5,556,251 | ||||||
| Deferred income taxes |
120,589 | 225,455 | ||||||
| Other liabilities |
335,964 | 334,308 | ||||||
|
|
|
|
|
|||||
| Total liabilities |
5,971,457 | 7,026,030 | ||||||
|
|
|
|
|
|||||
| Commitments and contingencies |
||||||||
| Equity |
||||||||
| Ordinary shares; 261,246 shares outstanding |
26,125 | 26,125 | ||||||
| Capital in excess of par value |
530,657 | 497,316 | ||||||
| Retained earnings |
6,009,114 | 7,986,762 | ||||||
| Accumulated other comprehensive loss |
(69,418 | ) | (82,164 | ) | ||||
|
|
|
|
|
|||||
| Total shareholder equity |
6,496,478 | 8,428,039 | ||||||
|
|
|
|
|
|||||
| Noncontrolling interests |
722,304 | 727,445 | ||||||
|
|
|
|
|
|||||
| Total equity |
7,218,782 | 9,155,484 | ||||||
|
|
|
|
|
|||||
| Total liabilities and equity |
$ | 13,190,239 | $ | 16,181,514 | ||||
|
|
|
|
|
|||||
See accompanying notes to the consolidated financial statements.
61
Table of Contents
NOBLE CORPORATION AND SUBSIDIARIES
CONSOLIDATED STATEMENTS OF INCOME
(In thousands, except per share amounts)
| Year Ended December 31, | ||||||||||||
| 2014 | 2013 | 2012 | ||||||||||
| Operating revenues |
||||||||||||
| Contract drilling services |
$ | 3,147,859 | $ | 2,454,745 | $ | 2,089,621 | ||||||
| Reimbursables |
84,644 | 66,292 | 65,767 | |||||||||
| Labor contract drilling services |
— | 17,095 | 45,299 | |||||||||
| Other |
1 | 11 | 12 | |||||||||
|
|
|
|
|
|
|
|||||||
| 3,232,504 | 2,538,143 | 2,200,699 | ||||||||||
|
|
|
|
|
|
|
|||||||
| Operating costs and expenses |
||||||||||||
| Contract drilling services |
1,507,471 | 1,159,171 | 960,837 | |||||||||
| Reimbursables |
66,378 | 50,410 | 55,424 | |||||||||
| Labor contract drilling services |
— | 11,601 | 23,129 | |||||||||
| Depreciation and amortization |
624,278 | 509,341 | 438,374 | |||||||||
| General and administrative |
52,994 | 64,859 | 59,366 | |||||||||
| Loss on impairment |
745,428 | 3,585 | 20,384 | |||||||||
| Gain on disposal of assets, net |
— | (35,646 | ) | — | ||||||||
| Gain on contract settlements/extinguishments, net |
— | (30,618 | ) | (33,255 | ) | |||||||
|
|
|
|
|
|
|
|||||||
| 2,996,549 | 1,732,703 | 1,524,259 | ||||||||||
|
|
|
|
|
|
|
|||||||
| Operating income |
235,955 | 805,440 | 676,440 | |||||||||
| Other income (expense) |
||||||||||||
| Interest expense, net of amount capitalized |
(155,179 | ) | (106,300 | ) | (85,763 | ) | ||||||
| Interest income and other, net |
1,124 | 3,556 | 3,071 | |||||||||
|
|
|
|
|
|
|
|||||||
| Income from continuing operations before income taxes |
81,900 | 702,696 | 593,748 | |||||||||
| Income tax provision |
(105,930 | ) | (88,977 | ) | (94,183 | ) | ||||||
|
|
|
|
|
|
|
|||||||
| Net income (loss) from continuing operations |
(24,030 | ) | 613,719 | 499,565 | ||||||||
| Net income from discontinued operations, net of tax |
223,083 | 321,804 | 115,151 | |||||||||
|
|
|
|
|
|
|
|||||||
| Net income |
199,053 | 935,523 | 614,716 | |||||||||
|
|
|
|
|
|
|
|||||||
| Net income attributable to noncontrolling interests |
(74,825 | ) | (67,709 | ) | (33,793 | ) | ||||||
|
|
|
|
|
|
|
|||||||
| Net income attributable to Noble Corporation |
$ | 124,228 | $ | 867,814 | $ | 580,923 | ||||||
|
|
|
|
|
|
|
|||||||
See accompanying notes to the consolidated financial statements.
62
Table of Contents
NOBLE CORPORATION AND SUBSIDIARIES
CONSOLIDATED STATEMENTS OF COMPREHENSIVE INCOME
(In thousands)
| Year Ended December 31, | ||||||||||||
| 2014 | 2013 | 2012 | ||||||||||
| Net income |
$ | 199,053 | $ | 935,523 | $ | 614,716 | ||||||
| Other comprehensive income (loss), net of tax |
||||||||||||
| Foreign currency translation adjustments |
(118 | ) | (3,188 | ) | (8,076 | ) | ||||||
| Foreign currency forward contracts |
— | — | 3,061 | |||||||||
| Net pension plan gain (loss) (net of tax provision (benefit) of ($21,429) in 2014, $14,155 in 2013 and ($3,777) in 2012 ) |
(41,608 | ) | 29,861 | (41,658 | ) | |||||||
| Amortization of deferred pension plan amounts (net of tax provision of $1,102 in 2014, $2,924 in 2013 and $2,841 in 2012) |
2,764 | 6,612 | 5,545 | |||||||||
| Net pension plan curtailment and settlement expense (net of tax provision of $9,902 in 2014) |
18,389 | — | — | |||||||||
| Prior service cost arising during the period (net of tax benefit of $317 in 2014) |
(1,159 | ) | — | — | ||||||||
|
|
|
|
|
|
|
|||||||
| Other comprehensive income (loss), net |
(21,732 | ) | 33,285 | (41,128 | ) | |||||||
|
|
|
|
|
|
|
|||||||
| Total comprehensive income |
177,321 | 968,808 | 573,588 | |||||||||
| Net comprehensive income attributable to noncontrolling interests |
(74,825 | ) | (67,709 | ) | (33,793 | ) | ||||||
|
|
|
|
|
|
|
|||||||
| Comprehensive income attributable to Noble Corporation |
$ | 102,496 | $ | 901,099 | $ | 539,795 | ||||||
|
|
|
|
|
|
|
|||||||
See accompanying notes to the consolidated financial statements.
63
Table of Contents
NOBLE CORPORATION AND SUBSIDIARIES
CONSOLIDATED STATEMENTS OF CASH FLOWS
(In thousands)
| Year ended December 31, | ||||||||||||
| 2014 | 2013 | 2012 | ||||||||||
| Cash flows from operating activities |
||||||||||||
| Net income |
$ | 199,053 | $ | 935,523 | $ | 614,716 | ||||||
| Adjustments to reconcile net income to net cash from operating activities: |
||||||||||||
| Depreciation and amortization |
860,353 | 877,250 | 756,689 | |||||||||
| Loss on impairment |
745,428 | 43,688 | 20,384 | |||||||||
| Gain on disposal of assets, net |
— | (35,646 | ) | — | ||||||||
| Deferred income taxes |
(10,999 | ) | (15,955 | ) | (20,119 | ) | ||||||
| Capital contribution by parent—share-based compensation |
33,341 | 26,862 | 19,838 | |||||||||
| Net change in other assets and liabilities |
44,740 | (63,092 | ) | 29,119 | ||||||||
|
|
|
|
|
|
|
|||||||
| Net cash from operating activities |
1,871,916 | 1,768,630 | 1,420,627 | |||||||||
|
|
|
|
|
|
|
|||||||
| Cash flows from investing activities |
||||||||||||
| Capital expenditures |
(2,072,751 | ) | (2,485,617 | ) | (1,667,477 | ) | ||||||
| Change in accrued capital expenditures |
(36,383 | ) | (58,587 | ) | (121,077 | ) | ||||||
| Proceeds from disposal of assets |
— | 61,000 | — | |||||||||
|
|
|
|
|
|
|
|||||||
| Net cash from investing activities |
(2,109,134 | ) | (2,483,204 | ) | (1,788,554 | ) | ||||||
|
|
|
|
|
|
|
|||||||
| Cash flows from financing activities |
||||||||||||
| Net change in borrowings outstanding on bank credit facilities |
(437,647 | ) | 1,221,333 | (635,192 | ) | |||||||
| Repayment of long-term debt |
(250,000 | ) | (300,000 | ) | — | |||||||
| Proceeds from issuance of senior notes, net of debt issuance costs |
— | — | 1,186,636 | |||||||||
| Financing costs on credit facilities |
(398 | ) | (2,484 | ) | (5,221 | ) | ||||||
| Long-term borrowings of Paragon Offshore |
1,710,550 | — | — | |||||||||
| Financing costs on long-term borrowing of Paragon Offshore |
(14,676 | ) | — | — | ||||||||
| Cash balances of Paragon Offshore in Spin-off |
(104,152 | ) | — | — | ||||||||
| Dividends paid to noncontrolling interests |
(79,966 | ) | (105,388 | ) | — | |||||||
| Contributions from noncontrolling interests |
— | — | 40,000 | |||||||||
| Distributions to parent company, net |
(631,095 | ) | (265,880 | ) | (175,977 | ) | ||||||
|
|
|
|
|
|
|
|||||||
| Net cash from financing activities |
192,616 | 547,581 | 410,246 | |||||||||
|
|
|
|
|
|
|
|||||||
| Net change in cash and cash equivalents |
(44,602 | ) | (166,993 | ) | 42,319 | |||||||
| Cash and cash equivalents, beginning of period |
110,382 | 277,375 | 235,056 | |||||||||
|
|
|
|
|
|
|
|||||||
| Cash and cash equivalents, end of period |
$ | 65,780 | $ | 110,382 | $ | 277,375 | ||||||
|
|
|
|
|
|
|
|||||||
See accompanying notes to the consolidated financial statements.
64
Table of Contents
NOBLE CORPORATION AND SUBSIDIARIES
CONSOLIDATED STATEMENTS OF EQUITY
(In thousands)
| Shares | Capital in Excess of |
Retained | Noncontrolling | Accumulated Other Comprehensive |
Total | |||||||||||||||||||||||
| Balance | Par Value | Par Value | Earnings | Interests | Loss | Equity | ||||||||||||||||||||||
| Balance at December 31, 2011 |
261,246 | $ | 26,125 | $ | 450,616 | $ | 6,979,882 | $ | 691,331 | $ | (74,321 | ) | $ | 8,073,633 | ||||||||||||||
| Distributions to parent |
— | — | — | (175,977 | ) | — | — | (175,977 | ) | |||||||||||||||||||
| Capital contributions by parent- |
||||||||||||||||||||||||||||
| Share-based compensation |
— | — | 19,838 | — | — | — | 19,838 | |||||||||||||||||||||
| Net income |
— | — | — | 580,923 | 33,793 | — | 614,716 | |||||||||||||||||||||
| Contributions from noncontrolling interests |
— | — | — | — | 40,000 | — | 40,000 | |||||||||||||||||||||
| Other comprehensive loss, net |
— | — | — | — | — | (41,128 | ) | (41,128 | ) | |||||||||||||||||||
|
|
|
|
|
|
|
|
|
|
|
|
|
|
|
|||||||||||||||
| Balance at December 31, 2012 |
261,246 | $ | 26,125 | $ | 470,454 | $ | 7,384,828 | $ | 765,124 | $ | (115,449 | ) | $ | 8,531,082 | ||||||||||||||
| Distributions to parent |
— | — | — | (265,880 | ) | — | — | (265,880 | ) | |||||||||||||||||||
| Capital contributions by parent- |
||||||||||||||||||||||||||||
| Share-based compensation |
— | — | 26,862 | — | — | — | 26,862 | |||||||||||||||||||||
| Net income |
— | — | — | 867,814 | 67,709 | — | 935,523 | |||||||||||||||||||||
| Dividends paid to noncontrolling interests |
— | — | — | — | (105,388 | ) | — | (105,388 | ) | |||||||||||||||||||
| Other comprehensive income, net |
— | — | — | — | — | 33,285 | 33,285 | |||||||||||||||||||||
|
|
|
|
|
|
|
|
|
|
|
|
|
|
|
|||||||||||||||
| Balance at December 31, 2013 |
261,246 | $ | 26,125 | $ | 497,316 | $ | 7,986,762 | $ | 727,445 | $ | (82,164 | ) | $ | 9,155,484 | ||||||||||||||
| Distributions to parent |
— | — | — | (631,095 | ) | — | — | (631,095 | ) | |||||||||||||||||||
| Capital contributions by parent- |
||||||||||||||||||||||||||||
| Share-based compensation |
— | — | 33,341 | — | — | — | 33,341 | |||||||||||||||||||||
| Net income |
— | — | — | 124,228 | 74,825 | — | 199,053 | |||||||||||||||||||||
| Dividends paid to noncontrolling interests |
— | — | — | — | (79,966 | ) | — | (79,966 | ) | |||||||||||||||||||
| Spin-off of Paragon Offshore |
— | — | — | (1,470,781 | ) | — | 34,478 | (1,436,303 | ) | |||||||||||||||||||
| Other comprehensive loss, net |
— | — | — | — | — | (21,732 | ) | (21,732 | ) | |||||||||||||||||||
|
|
|
|
|
|
|
|
|
|
|
|
|
|
|
|||||||||||||||
| Balance at December 31, 2014 |
261,246 | $ | 26,125 | $ | 530,657 | $ | 6,009,114 | $ | 722,304 | $ | (69,418 | ) | $ | 7,218,782 | ||||||||||||||
|
|
|
|
|
|
|
|
|
|
|
|
|
|
|
|||||||||||||||
See accompanying notes to the consolidated financial statements.
65
Table of Contents
NOBLE CORPORATION PLC AND SUBSIDIARIES
NOBLE CORPORATION AND SUBSIDIARIES
NOTES TO CONSOLIDATED FINANCIAL STATEMENTS
(Unless otherwise indicated, dollar amounts in tables are in thousands, except per share data)
Note 1 – Organization and Significant Accounting Policies
Organization and Business
Noble Corporation plc, a public limited company incorporated under the laws of England and Wales (“Noble-UK”), is a leading offshore drilling contractor for the oil and gas industry. We perform contract drilling services with our fleet of mobile offshore drilling units located worldwide. As of the filing date of this Annual Report on Form 10-K, our fleet consisted of 15 jackups, nine drillships and eight semisubmersibles, including one high-specification, harsh environment jackup under construction. This excludes the semisubmersibles, Noble Driller, Noble Jim Thompson and Noble Paul Wolff.
At December 31, 2014, our fleet was located in the United States, Brazil, Argentina, the North Sea, the Mediterranean, the Middle East, Asia and Australia. Noble and its predecessors have been engaged in the contract drilling of oil and gas wells since 1921.
On November 20, 2013, pursuant to the Merger Agreement dated as of June 30, 2013 between Noble Corporation, a Swiss corporation (“Noble-Swiss”), and Noble-UK, Noble-Swiss merged with and into Noble-UK, with Noble-UK as the surviving company (the “Transaction”). In the Transaction, all of the outstanding ordinary shares of Noble-Swiss were cancelled, and Noble-UK issued, through an exchange agent, one ordinary share of Noble-UK in exchange for each ordinary share of Noble-Swiss. The Transaction effectively changed the place of incorporation of our publicly traded parent holding company from Switzerland to the United Kingdom.
Noble Corporation, a Cayman Islands company (“Noble-Cayman”), is an indirect, wholly-owned subsidiary of Noble-UK, our publicly-traded parent company. Noble-UK’s principal asset is all of the shares of Noble-Cayman. Noble-Cayman has no public equity outstanding. The consolidated financial statements of Noble-UK include the accounts of Noble-Cayman, and Noble-UK conducts substantially all of its business through Noble-Cayman and its subsidiaries.
Principles of Consolidation
The consolidated financial statements include our accounts, those of our wholly-owned subsidiaries and entities in which we hold a controlling financial interest. Our consolidated financial statements include the accounts of two joint ventures, in each of which we own a 50 percent interest. Our ownership interest meets the definition of variable interest under Financial Accounting Standards Board (“FASB”) codification and we have determined that we are the primary beneficiary. Intercompany balances and transactions have been eliminated in consolidation.
Foreign Currency Translation
Although we are a UK company, we define foreign currency as any non-U.S. denominated currency. In non-U.S. locations where the U.S. Dollar has been designated as the functional currency (based on an evaluation of factors including the markets in which the subsidiary operates, inflation, generation of cash flow, financing activities and intercompany arrangements), local currency transaction gains and losses are included in net income. In non-U.S. locations where the local currency is the functional currency, assets and liabilities are translated at the rates of exchange on the balance sheet date, while income statement items are translated at average rates of exchange during the year. The resulting gains or losses arising from the translation of accounts from the functional currency to the U.S. Dollar are included in “Accumulated other comprehensive loss” in the Consolidated Balance Sheets. We did not recognize any material gains or losses on foreign currency transactions or translations during the three years ended December 31, 2014.
Cash and Cash Equivalents
Cash and cash equivalents include cash on hand, demand deposits with banks and all highly liquid investments with original maturities of three months or less. Our cash, cash equivalents and short-term investments are subject to potential credit risk, and certain of our cash accounts carry balances greater than the federally insured limits. Cash and cash equivalents are primarily held by major banks or investment firms. Our cash management and investment policies restrict investments to lower risk, highly liquid securities and we perform periodic evaluations of the relative credit standing of the financial institutions with which we conduct business.
66
Table of Contents
NOBLE CORPORATION PLC AND SUBSIDIARIES
NOBLE CORPORATION AND SUBSIDIARIES
NOTES TO CONSOLIDATED FINANCIAL STATEMENTS
(Unless otherwise indicated, dollar amounts in tables are in thousands, except per share data)
Property and Equipment
Property and equipment is stated at cost, reduced by provisions to recognize economic impairment in value whenever events or changes in circumstances indicate an asset’s carrying value may not be recoverable. Major replacements and improvements are capitalized. When assets are sold, retired or otherwise disposed of, the cost and related accumulated depreciation are eliminated from the accounts and the gain or loss is recognized. Drilling equipment and facilities are depreciated using the straight-line method over their estimated useful lives as of the date placed in service or date of major refurbishment. Estimated useful lives of our drilling equipment range from three to thirty years. Other property and equipment is depreciated using the straight-line method over useful lives ranging from two to forty years. Included in accounts payable were $70 million and $88 million of capital accruals as of December 31, 2014 and 2013, respectively.
Interest is capitalized on construction-in-progress using the weighted average cost of debt outstanding during the period of construction.
Scheduled maintenance of equipment is performed based on the number of hours operated in accordance with our preventative maintenance program. Routine repair and maintenance costs are charged to expense as incurred; however, the costs of the overhauls and asset replacement projects that benefit future periods and which typically occur every three to five years are capitalized when incurred and depreciated over an equivalent period. These overhauls and asset replacement projects are included in “Drilling equipment and facilities” in Note 7. Such amounts, net of accumulated depreciation, totaled $179 million and $400 million at December 31, 2014 and 2013, respectively. Depreciation expense from continuing operations related to overhauls and asset replacement totaled $77 million, $70 million and $53 million for the years ended December 31, 2014, 2013 and 2012, respectively.
We evaluate the impairment of property and equipment whenever events or changes in circumstances indicate that the carrying amount of an asset may not be recoverable. In addition, on an annual basis, we complete an impairment analysis on our rig fleet. An impairment loss on our property and equipment exists when the estimated undiscounted cash flows expected to result from the use of the asset and its eventual disposition are less than its carrying amount. Any impairment loss recognized represents the excess of the asset’s carrying value over the estimated fair value. As part of this analysis, we make assumptions and estimates regarding future market conditions. To the extent actual results do not meet our estimated assumptions, for a given rig class, we may take an impairment loss in the future. For additional information, see Note 11.
Goodwill
We conduct impairment testing for our goodwill annually during the fourth quarter, and on an interim basis when an event occurs or circumstances change that indicate that the fair value of a reporting unit or the indefinite-lived intangible asset may have declined below its carrying value.
We test goodwill at the reporting unit level, which is defined as an operating segment or one level below an operating segment that constitutes a business for which financial information is available and is regularly reviewed by management. Our goodwill is identified to one reporting unit Contract Drilling Services.
Before testing goodwill, we consider whether or not to first assess qualitative factors to determine whether the existence of events or circumstances lead to a determination that it is more likely than not that the fair value of a reporting unit is less than its carrying amount and whether the two-step impairment test is required.
If, as the result of our qualitative assessment, we determine that the two-step impairment test is required, or, alternatively, if we elect to forgo the qualitative assessment, we test goodwill for impairment by comparing the carrying amount of the reporting unit, to the fair value of the reporting unit utilizing both market and income evaluation methodologies. If this test suggests that the goodwill is not supportable, we proceed to the second step which compares the implied goodwill at the date of the test, to the book value of goodwill of the reporting unit. If the implied goodwill is lower than the book value of goodwill a write-down is taken to the implied value. For additional information, see Note 11.
67
Table of Contents
NOBLE CORPORATION PLC AND SUBSIDIARIES
NOBLE CORPORATION AND SUBSIDIARIES
NOTES TO CONSOLIDATED FINANCIAL STATEMENTS
(Unless otherwise indicated, dollar amounts in tables are in thousands, except per share data)
Deferred Costs
Deferred debt issuance costs are being amortized through interest expense over the life of the debt securities.
Insurance Reserves
We maintain various levels of self-insured retention for certain losses including property damage, loss of hire, employment practices liability, employers’ liability, and general liability, among others. We accrue for property damage and loss of hire charges on a per event basis.
Employment practices liability claims are accrued based on actual claims during the year. Maritime employer’s liability claims are generally estimated using actuarial determinations. General liability claims are estimated by our internal claims department by evaluating the facts and circumstances of each claim (including incurred but not reported claims) and making estimates based upon historical experience with similar claims. At December 31, 2014 and 2013, loss reserves for personal injury and protection claims totaled $21 million and $29 million, respectively, and such amounts are included in “Other current liabilities” in the accompanying Consolidated Balance Sheets.
Revenue Recognition
Our typical dayrate drilling contracts require our performance of a variety of services for a specified period of time. We determine progress towards completion of the contract by measuring efforts expended and the cost of services required to perform under a drilling contract, as the basis for our revenue recognition. Revenues generated from our dayrate-basis drilling contracts and labor contracts are recognized on a per day basis as services are performed and begin upon the contract commencement, as defined under the specified drilling or labor contract. Dayrate revenues are typically earned, and contract drilling expenses are typically incurred ratably over the term of our drilling contracts. We review and monitor our performance under our drilling contracts to confirm the basis for our revenue recognition. Revenues from bonuses are recognized when earned, and when collectability is reasonably assured.
In our dayrate drilling contracts, we typically receive compensation and incur costs for mobilization, equipment modification or other activities prior to the commencement of a contract. Any such compensation may be paid through a lump-sum payment or other daily compensation. Pre-contract compensation and costs are deferred until the contract commences. The deferred pre-contract compensation and costs are amortized, using the straight-line method, into income over the term of the initial contract period, regardless of the activity taking place. This approach is consistent with the economics for which the parties have contracted. Once a contract commences, we may conduct various activities, including drilling and well bore related activities, rig maintenance and equipment installation, movement between well locations or other activities.
Deferred revenues from drilling contracts totaled $263 million and $303 million at December 31, 2014 and 2013, respectively. Such amounts are included in either “Other current liabilities” or “Other liabilities” in the accompanying Consolidated Balance Sheets, based upon our expected time of recognition. Related expenses deferred under drilling contracts totaled $94 million at December 31, 2014 as compared to $157 million at December 31, 2013, and are included in either “Other current assets” or “Other assets” in the accompanying Consolidated Balance Sheets, based upon our expected time of recognition.
We record reimbursements from customers for “out-of-pocket” expenses as revenues and the related direct cost as operating expenses.
Income Taxes
Income taxes are based on the laws and rates in effect in the countries in which operations are conducted or in which we or our subsidiaries are considered resident for income tax purposes. In certain circumstances, we expect that, due to changing demands of the offshore drilling markets and the ability to redeploy our offshore drilling units, certain of such units will not reside in a location long enough to give rise to future tax consequences. As a result, no deferred tax asset or liability has been recognized in these circumstances. Should our expectations change regarding the length of time an offshore drilling unit will be used in a given location, we will adjust deferred taxes accordingly.
68
Table of Contents
NOBLE CORPORATION PLC AND SUBSIDIARIES
NOBLE CORPORATION AND SUBSIDIARIES
NOTES TO CONSOLIDATED FINANCIAL STATEMENTS
(Unless otherwise indicated, dollar amounts in tables are in thousands, except per share data)
We operate through various subsidiaries in numerous countries throughout the world, including the United States. Consequently, we are subject to changes in tax laws, treaties or regulations or the interpretation or enforcement thereof in the U.S., UK or jurisdictions in which we or any of our subsidiaries operate or are resident. Our income tax expense is based upon our interpretation of the tax laws in effect in various countries at the time that the expense was incurred. If the U.S. Internal Revenue Service (“IRS”) or other taxing authorities do not agree with our assessment of the effects of such laws, treaties and regulations, this could have a material adverse effect on us including the imposition of a higher effective tax rate on our worldwide earnings or a reclassification of the tax impact of our significant corporate restructuring transactions.
Earnings per Share
Our unvested share-based payment awards, which contain non-forfeitable rights to dividends, are participating securities and are included in the computation of earnings per share pursuant to the “two-class” method. The “two-class” method allocates undistributed earnings between common shares and participating securities. The diluted earnings per share calculation under the “two-class” method also includes the dilutive effect of potential shares issued in connection with stock options. The dilutive effect of stock options is determined using the treasury stock method.
Share-Based Compensation Plans
We record the grant date fair value of share-based compensation arrangements as compensation cost using a straight-line method over the service period. Share-based compensation is expensed or capitalized based on the nature of the employee’s activities.
Certain Significant Estimates
The preparation of financial statements in conformity with accounting principles generally accepted in the United States of America (“GAAP”) requires management to make estimates and assumptions that affect the reported amounts of assets and liabilities and disclosure of contingent assets and liabilities at the date of the financial statements and the reported amount of revenues and expenses during the reporting period. Certain accounting policies involve judgments and uncertainties to such an extent that there is reasonable likelihood that materially different amounts could have been reported under different conditions, or if different assumptions had been used. We evaluate our estimates and assumptions on a regular basis. We base our estimates on historical experience and various other assumptions that are believed to be reasonable under the circumstances, the results of which form the basis for making judgments about carrying values of assets and liabilities that are not readily apparent from other sources. Actual results may differ from these estimates and assumptions used in preparation of our consolidated financial statements.
Reclassifications
Certain amounts in prior periods have been reclassified to conform to the current year presentation.
Accounting Pronouncements
In April 2014, the FASB issued Accounting Standards Update (“ASU”) No. 2014-08, which amends FASB Accounting Standards Codification (“ASC”) Topic 205, “Presentation of Financial Statements” and ASC Topic 360, “Property, Plant, and Equipment.” This ASU alters the definition of a discontinued operation to cover only asset disposals that are a strategic shift with a major effect on an entity’s operations and finances, and calls for more extensive disclosures about a discontinued operation’s assets, liabilities, income and expenses. The guidance is effective for all disposals, or classifications as held-for-sale, of components of an entity that occur within annual periods beginning on or after December 15, 2014. This standard was not early adopted in connection with the Spin-off. We are still evaluating what impact, if any, the adoption of this guidance will have on our financial condition, results of operations, cash flows or financial disclosures.
In May 2014, the FASB issued ASU No. 2014-09, which amends ASC Topic 606, “Revenue from Contracts with Customers.” The amendments in this ASU are intended to provide a more robust framework for addressing revenue issues, improve comparability of revenue recognition practices and improve disclosure requirements. The amendments in this update are effective for interim and annual reporting periods beginning after December 15, 2016. We are still evaluating what impact, if any, the adoption of this guidance will have on our financial condition, results of operations, cash flows or financial disclosures.
69
Table of Contents
NOBLE CORPORATION PLC AND SUBSIDIARIES
NOBLE CORPORATION AND SUBSIDIARIES
NOTES TO CONSOLIDATED FINANCIAL STATEMENTS
(Unless otherwise indicated, dollar amounts in tables are in thousands, except per share data)
In June 2014, the FASB issued ASU No. 2014-12, which amends ASC Topic 718, “Compensation-Stock Compensation.” The guidance requires that a performance target that affects vesting and that could be achieved after the requisite service period be treated as a performance condition and should not be reflected in the estimate of the grant-date fair value of the award. The guidance is effective for annual periods beginning after December 15, 2015. The guidance can be applied prospectively for all awards granted or modified after the effective date or retrospectively to all awards with performance targets outstanding as of the beginning of the earliest annual period presented in the financial statements and to all new or modified awards thereafter. We are still evaluating what impact, if any, the adoption of this guidance will have on our financial condition, results of operations, cash flows or financial disclosures.
In August 2014, the FASB issued ASU No. 2014-15, which amends ASC Subtopic 205-40, “Disclosure of Uncertainties about an Entity’s Ability to continue as a Going Concern.” The amendments in this ASU provide guidance related to management’s responsibility to evaluate whether there is substantial doubt about an entity’s ability to continue as a going concern and to provide related footnote disclosures. The amendments are effective for the annual period ending after December 15, 2016, and for annual periods and interim periods thereafter. We are still evaluating what impact, if any, the adoption of this guidance will have on our financial condition, results of operations, cash flows or financial disclosures.
In January 2015, the FASB issued ASU No. 2015-01, which amends ASC Subtopic 225-20, “Income Statement – Extraordinary and Unusual Items.” The amendment in this ASU eliminates from GAAP the concept of extraordinary items. The amendments in this update are effective for interim and annual reporting periods beginning after December 15, 2015. We are still evaluating what impact, if any, the adoption of this guidance will have on our financial condition, results of operations, cash flows or financial disclosures.
In February 2015, the FASB issued ASU No. 2015-02 which amends ASC Subtopic 810, “Consolidations.” This amendment affects reporting entities that are required to evaluate whether they should consolidate certain legal entities. Specifically, the amendments modify the evaluation of whether limited partnerships and similar legal entities are VIEs or voting interest entities; eliminate the presumption that a general partner should consolidate a limited partnership; affect the consolidation analysis of reporting entities that are involved with VIEs, particularly those that have fee arrangements and related party relationships. The standard is effective for interim and annual reporting periods beginning after December 15, 2015. The standard may be applied retrospectively or through a cumulative effect adjustment to retained earnings as of the beginning of the year of adoption. We are still evaluating what impact, if any, the adoption of this guidance will have on our financial condition, results of operations, cash flows or financial disclosures.
Note 2 – Spin-off of Paragon Offshore plc (“Paragon Offshore”)
On August 1, 2014, Noble-UK completed the separation and spin-off of a majority of its standard specification offshore drilling business (the “Spin-off”) through a pro rata distribution of all of the ordinary shares of its wholly-owned subsidiary, Paragon Offshore, to the holders of Noble’s ordinary shares. Our shareholders received one share of Paragon Offshore for every three shares of Noble owned as of July 23, 2014, the record date for the distribution. Through the Spin-off, we disposed of most of our standard specification drilling units and related assets, liabilities and business. Prior to the Spin-off, Paragon Offshore issued approximately $1.7 billion of long-term debt. We used the proceeds from this debt to repay certain amounts outstanding under our commercial paper program.
Prior to the completion of the Spin-off, Noble and Paragon Offshore entered into a series of agreements to effect the separation and Spin-off and govern the relationship between the parties after the Spin-off.
Master Separation Agreement (“MSA”)
The general terms and conditions relating to the separation and Spin-off are set forth in the MSA. The MSA identifies the assets transferred, liabilities assumed and contracts assigned either to Paragon Offshore by us or by Paragon Offshore to us in the separation and describes when and how these transfers, assumptions and assignments would occur. The MSA provides for, among other things, Paragon Offshore’s responsibility for liabilities relating to its business and the responsibility of Noble for liabilities related to our, and in certain limited cases, Paragon Offshore’s business, in each case irrespective of when the liability arose. The MSA also contains indemnification obligations and ongoing commitments by us and Paragon Offshore.
Employee Matters Agreement (“EMA”)
The EMA allocates liabilities and responsibilities between us and Paragon Offshore relating to employment, compensation and benefits and other employment related matters.
70
Table of Contents
NOBLE CORPORATION PLC AND SUBSIDIARIES
NOBLE CORPORATION AND SUBSIDIARIES
NOTES TO CONSOLIDATED FINANCIAL STATEMENTS
(Unless otherwise indicated, dollar amounts in tables are in thousands, except per share data)
Tax Sharing Agreement (“TSA”)
The TSA provides for the allocation of tax liabilities and benefits between us and Paragon Offshore and governs the parties’ assistance with tax-related claims.
Transition Services Agreements
Under two transition services agreements, we agreed to continue, for a limited period of time, to provide various interim support services to Paragon Offshore, and Paragon Offshore agreed to provide various interim support services to us, including providing operational and administrative support for our remaining Brazilian operations.
Note 3 — Discontinued Operations
Paragon Offshore, which had been reflected as continuing operations in our consolidated financial statements prior to the Spin-off, meets the criteria for being reported as discontinued operations and has been reclassified as such in our results of operations. The results of discontinued operations for the three years ended December 31, 2014 include the historical results of Paragon Offshore through the Spin-off date, including costs incurred by Noble to complete the Spin-off. Non-recurring Spin-off related costs totaled $63 million, $18 million and $7 million for the years ended December 31, 2014, 2013 and 2012, respectively.
Prior to the Spin-off, Paragon Offshore issued approximately $1.7 billion of debt consisting of:
| • | $1.08 billion aggregate principal amount of senior notes in two separate tranches, comprising $500 million of 6.75% Senior Notes due 2022 and $580 million of 7.25% Senior Notes due 2024; and |
| • | $650 million of a senior secured term credit agreement, at an interest rate of LIBOR plus 2.75%, subject to a LIBOR floor of 1%, which has an initial term of seven years. |
We allocated interest expense on this debt, which is directly related to Paragon Offshore, to discontinued operations. For the year ended December 31, 2014, we allocated approximately $4 million of interest expense related to such debt. No interest was allocated to discontinued operations for the years ended December 31, 2013 and 2012.
The following table provides the results of operations from discontinued operations:
| Year Ended December 31, | ||||||||||||
| 2014 | 2013 | 2012 | ||||||||||
| Operating revenues |
||||||||||||
| Contract drilling services |
$ | 993,253 | $ | 1,615,325 | $ | 1,259,741 | ||||||
| Reimbursables |
21,899 | 45,582 | 49,728 | |||||||||
| Labor contract drilling services |
19,304 | 35,146 | 36,591 | |||||||||
| Other |
2 | 94 | 253 | |||||||||
|
|
|
|
|
|
|
|||||||
| Operating revenues from discontinued operations |
$ | 1,034,458 | $ | 1,696,147 | $ | 1,346,313 | ||||||
|
|
|
|
|
|
|
|||||||
| Income from discontinued operations |
||||||||||||
| Income from discontinued operations before income taxes |
$ | 216,391 | $ | 379,591 | $ | 159,860 | ||||||
| Income tax provision |
(55,889 | ) | (75,489 | ) | (51,905 | ) | ||||||
|
|
|
|
|
|
|
|||||||
| Net income from discontinued operations, net of tax |
$ | 160,502 | $ | 304,102 | $ | 107,955 | ||||||
|
|
|
|
|
|
|
|||||||
71
Table of Contents
NOBLE CORPORATION PLC AND SUBSIDIARIES
NOBLE CORPORATION AND SUBSIDIARIES
NOTES TO CONSOLIDATED FINANCIAL STATEMENTS
(Unless otherwise indicated, dollar amounts in tables are in thousands, except per share data)
The carrying value of the major categories of assets and liabilities of Paragon Offshore immediately preceding the Spin-off on August 1, 2014, which are excluded from our Consolidated Balance Sheet at December 31, 2014, were as follows:
| ASSETS |
| |||
| Current assets |
||||
| Cash and cash equivalents |
$ | 104,152 | ||
| Accounts receivable |
362,100 | |||
| Prepaid expenses and other current assets |
90,089 | |||
|
|
|
|||
| Total current assets of discontinued operations |
556,341 | |||
|
|
|
|||
| Property and equipment, at cost |
5,609,119 | |||
| Accumulated depreciation |
(2,640,943 | ) | ||
|
|
|
|||
| Property and equipment, net |
2,968,176 | |||
|
|
|
|||
| Other assets |
84,894 | |||
|
|
|
|||
| Total assets of discontinued operations |
$ | 3,609,411 | ||
|
|
|
|||
| LIABILITIES |
||||
| Current liabilities |
||||
| Accounts payable |
$ | 132,446 | ||
| Accrued payroll and related costs |
64,580 | |||
| Other current liabilities |
103,768 | |||
|
|
|
|||
| Total current liabilities of discontinued operations |
300,794 | |||
|
|
|
|||
| Long-term debt |
1,726,750 | |||
| Other liabilities |
172,467 | |||
|
|
|
|||
| Total liabilities of discontinued operations |
$ | 2,200,011 | ||
|
|
|
|||
Included in “Other assets” of Paragon Offshore at August 1, 2014 was approximately $15 million of goodwill from the acquisition of FDR Holdings Limited (“Frontier”) that was allocated to Paragon Offshore. The above amounts do not include the impact of the agreements entered into as a result of the Spin-off, which are discussed further in Note 2.
Note 4 – Consolidated Joint Ventures
We maintain a 50 percent interest in two joint ventures, each with a subsidiary of Royal Dutch Shell plc (“Shell”), that own and operate the two Bully-class drillships. We have determined that we are the primary beneficiary of the joint ventures. Accordingly, we consolidate the entities in our consolidated financial statements after eliminating intercompany transactions. Shell’s equity interests are presented as noncontrolling interests on our Consolidated Balance Sheets.
During the years ended December 31, 2014 and 2013, the Bully joint ventures approved and paid dividends totaling $160 million and $211 million, respectively. Of these amounts approximately $80 million and $105 million, respectively, were paid to our joint venture partner.
The combined carrying amount of the Bully-class drillships at both December 31, 2014 and 2013 totaled $1.4 billion. These assets were primarily funded through partner equity contributions. Cash held by the Bully joint ventures totaled approximately $47 million at December 31, 2014 as compared to approximately $50 million at December 31, 2013. Operational results for the years ended December 31, 2014 and 2013 are as follows:
| Year Ended | ||||||||
| December 31, | ||||||||
| 2014 | 2013 | |||||||
| Operating revenues |
$ | 372,313 | $ | 355,115 | ||||
| Net income |
$ | 157,171 | $ | 145,447 | ||||
72
Table of Contents
NOBLE CORPORATION PLC AND SUBSIDIARIES
NOBLE CORPORATION AND SUBSIDIARIES
NOTES TO CONSOLIDATED FINANCIAL STATEMENTS
(Unless otherwise indicated, dollar amounts in tables are in thousands, except per share data)
Note 5- Earnings per Share
The following table sets forth the computation of basic and diluted earnings per share for Noble-UK:
| Year Ended December 31, | ||||||||||||
| 2014 | 2013 | 2012 | ||||||||||
| Basic |
||||||||||||
| Income (loss) from continuing operations |
$ | (152,011 | ) | $ | 478,595 | $ | 414,389 | |||||
| Earnings allocated to unvested share-based payment awards |
— | (5,669 | ) | (4,212 | ) | |||||||
|
|
|
|
|
|
|
|||||||
| Income (loss) from continuing operations to common shareholders |
(152,011 | ) | 472,926 | 410,177 | ||||||||
|
|
|
|
|
|
|
|||||||
| Income from discontinued operations |
160,502 | 304,102 | 107,955 | |||||||||
| Earnings allocated to unvested share-based payment awards |
— | (3,602 | ) | (1,097 | ) | |||||||
|
|
|
|
|
|
|
|||||||
| Income from discontinued operations, net of tax to common shareholders |
160,502 | 300,500 | 106,858 | |||||||||
|
|
|
|
|
|
|
|||||||
| Net income attributable to Noble-UK |
8,491 | 782,697 | 522,344 | |||||||||
| Earnings allocated to unvested share-based payment awards |
— | (9,271 | ) | (5,309 | ) | |||||||
|
|
|
|
|
|
|
|||||||
| Net income to common shareholders—basic |
$ | 8,491 | $ | 773,426 | $ | 517,035 | ||||||
|
|
|
|
|
|
|
|||||||
| Diluted |
||||||||||||
| Income (loss) from continuing operations |
$ | (152,011 | ) | $ | 478,595 | $ | 414,389 | |||||
| Earnings allocated to unvested share-based payment awards |
— | (5,663 | ) | (4,206 | ) | |||||||
|
|
|
|
|
|
|
|||||||
| Income (loss) from continuing operations to common shareholders |
(152,011 | ) | 472,932 | 410,183 | ||||||||
|
|
|
|
|
|
|
|||||||
| Income from discontinued operations |
160,502 | 304,102 | 107,955 | |||||||||
| Earnings allocated to unvested share-based payment awards |
— | (3,598 | ) | (1,096 | ) | |||||||
|
|
|
|
|
|
|
|||||||
| Income from discontinued operations, net of tax to common shareholders |
160,502 | 300,504 | 106,859 | |||||||||
|
|
|
|
|
|
|
|||||||
| Net income attributable to Noble-UK |
8,491 | 782,697 | 522,344 | |||||||||
| Earnings allocated to unvested share-based payment awards |
— | (9,261 | ) | (5,302 | ) | |||||||
|
|
|
|
|
|
|
|||||||
| Net income to common shareholders—diluted |
$ | 8,491 | $ | 773,436 | $ | 517,042 | ||||||
|
|
|
|
|
|
|
|||||||
| Weighted average shares outstanding—basic |
252,909 | 253,288 | 252,435 | |||||||||
| Incremental shares issuable from assumed exercise of stock options |
— | 259 | 356 | |||||||||
|
|
|
|
|
|
|
|||||||
| Weighted average shares outstanding—diluted |
252,909 | 253,547 | 252,791 | |||||||||
|
|
|
|
|
|
|
|||||||
| Weighted average unvested share-based payment awards |
— | 3,036 | 2,592 | |||||||||
|
|
|
|
|
|
|
|||||||
| Earnings per share |
||||||||||||
| Basic |
||||||||||||
| Continuing operations |
$ | (0.60 | ) | $ | 1.86 | $ | 1.63 | |||||
| Discontinued operations |
0.63 | 1.19 | 0.42 | |||||||||
|
|
|
|
|
|
|
|||||||
| Net income attributable to Noble-UK |
$ | 0.03 | $ | 3.05 | $ | 2.05 | ||||||
|
|
|
|
|
|
|
|||||||
| Diluted |
||||||||||||
| Continuing operations |
$ | (0.60 | ) | $ | 1.86 | $ | 1.63 | |||||
| Discontinued operations |
0.63 | 1.19 | 0.42 | |||||||||
|
|
|
|
|
|
|
|||||||
| Net income attributable to Noble-UK |
$ | 0.03 | $ | 3.05 | $ | 2.05 | ||||||
|
|
|
|
|
|
|
|||||||
| Dividends per share |
$ | 1.50 | $ | 0.76 | $ | 0.54 | ||||||
Only those items having a dilutive impact on our basic earnings per share are included in diluted earnings per share. The effect of stock options and unvested share-based payment awards is not included in the computation for periods in which a net loss from continuing operations occurs because to do so would be anti-dilutive. For the years ended December 31, 2014, 2013 and 2012, approximately 2 million shares, 0.9 million shares and 1 million shares underlying stock options, respectively, were excluded from the diluted earnings per share as such stock options were not dilutive. For the year ended December 31, 2014, we experienced a net loss from continuing operations. As such, approximately 4 million unvested share-based payment awards were excluded from the diluted earnings per share calculation at December 31, 2014 as such awards were not dilutive.
73
Table of Contents
NOBLE CORPORATION PLC AND SUBSIDIARIES
NOBLE CORPORATION AND SUBSIDIARIES
NOTES TO CONSOLIDATED FINANCIAL STATEMENTS
(Unless otherwise indicated, dollar amounts in tables are in thousands, except per share data)
Note 6- Receivables from Customers
At December 31, 2014, we had receivables of approximately $14 million related to the Noble Max Smith, which are being disputed by our former customer, Petróleos Mexicanos (“Pemex”). These receivables have been classified as long-term and are included in “Other assets” on our Consolidated Balance Sheet. The disputed amounts relate to lost revenues for downtime that occurred after our rig was damaged when one of Pemex’s supply boats collided with our rig in 2010. In January 2012, we filed a lawsuit against Pemex in Mexican court seeking recovery of these amounts. While we can make no assurances as to the outcome of this dispute, we believe we are entitled to the disputed amounts.
Note 7- Property and Equipment
Property and equipment, at cost, as of December 31, 2014 and 2013 for Noble-UK consisted of the following:
| 2014 | 2013 | |||||||
| Drilling equipment and facilities |
$ | 13,254,240 | $ | 17,130,986 | ||||
| Construction in progress |
969,985 | 1,854,434 | ||||||
| Other |
218,697 | 213,347 | ||||||
|
|
|
|
|
|||||
| Property and equipment, at cost |
$ | 14,442,922 | $ | 19,198,767 | ||||
|
|
|
|
|
|||||
Capital expenditures, including capitalized interest, totaled $2.1 billion, $2.5 billion and $1.7 billion for the years ended December 31, 2014, 2013 and 2012, respectively. Capitalized interest was $47 million, $115 million and $136 million for the years ended December 31, 2014, 2013 and 2012, respectively.
Capital expenditures related to Paragon Offshore for the years ended December 31, 2014, 2013 and 2012 totaled $150 million, $359 million and $525 million, respectively. Additionally, a portion of our property and equipment at December 31, 2013 was related to Paragon Offshore. Depreciation expense for Paragon Offshore that was classified as discontinued operations totaled $236 million, $368 million and $318 million for the years ended December 31, 2014, 2013 and 2012, respectively.
74
Table of Contents
NOBLE CORPORATION PLC AND SUBSIDIARIES
NOBLE CORPORATION AND SUBSIDIARIES
NOTES TO CONSOLIDATED FINANCIAL STATEMENTS
(Unless otherwise indicated, dollar amounts in tables are in thousands, except per share data)
Note 8- Debt
Long-term debt consists of the following at December 31, 2014 and 2013:
| December 31, | December 31, | |||||||
| 2014 | 2013 | |||||||
| Senior unsecured notes: |
||||||||
| 7.375% Senior Notes due 2014 |
$ | — | $ | 249,964 | ||||
| 3.45% Senior Notes due 2015 |
350,000 | 350,000 | ||||||
| 3.05% Senior Notes due 2016 |
299,982 | 299,967 | ||||||
| 2.50% Senior Notes due 2017 |
299,920 | 299,886 | ||||||
| 7.50% Senior Notes due 2019 |
201,695 | 201,695 | ||||||
| 4.90% Senior Notes due 2020 |
499,151 | 499,022 | ||||||
| 4.625% Senior Notes due 2021 |
399,627 | 399,576 | ||||||
| 3.95% Senior Notes due 2022 |
399,264 | 399,178 | ||||||
| 6.20% Senior Notes due 2040 |
399,895 | 399,893 | ||||||
| 6.05% Senior Notes due 2041 |
397,681 | 397,646 | ||||||
| 5.25% Senior Notes due 2042 |
498,310 | 498,283 | ||||||
|
|
|
|
|
|||||
| Total senior unsecured notes |
3,745,525 | 3,995,110 | ||||||
| Credit facilities & commercial paper program |
1,123,495 | 1,561,141 | ||||||
|
|
|
|
|
|||||
| Total long-term debt |
$ | 4,869,020 | $ | 5,556,251 | ||||
|
|
|
|
|
|||||
Credit Facilities and Commercial Paper Program
At December 31, 2014, we had three credit facilities with an aggregate maximum available capacity of $2.9 billion, and a commercial paper program, which allowed us to issue up to $2.7 billion in unsecured commercial paper notes. Amounts issued under the commercial paper program are supported by the unused capacity under our credit facilities and, therefore, are classified as long-term on our Consolidated Balance Sheet. The outstanding amounts of commercial paper reduce availability under our credit facilities.
In January 2015, we replaced the credit facilities discussed above with two new credit facilities, a five year $2.4 billion senior unsecured credit facility that matures in January 2020 and a $225 million 364-day senior unsecured credit facility that matures in January 2016 (together, the “Credit Facilities”). The $2.4 billion facility provides us with the ability to issue up to $500 million in letters of credit. The issuance of letters of credit under the facility reduces the amount available for borrowing. At December 31, 2014, we had no letters of credit issued under the credit facilities. Following the establishment of the new Credit Facilities, we reduced the size of our commercial paper program to $2.4 billion from $2.7 billion.
Senior Unsecured Notes
In March 2014, we repaid our $250 million 7.375% Senior Notes using issuances under our commercial paper program.
Our $350 million 3.45% Senior Notes mature during the third quarter of 2015. We anticipate using availability under our Credit Facilities or commercial paper issuances to repay the outstanding balance; therefore, we continue to report the balance as long-term at December 31, 2014.
Covenants
The Credit Facilities are guaranteed by our indirect, wholly-owned subsidiaries, Noble Holding International Limited (“NHIL”) and Noble Holding Corporation (“NHC”). The covenants and events of default under the Credit Facilities are substantially similar, and each facility contains a covenant that limits our ratio of debt to total tangible capitalization, as defined in the Credit Facilities, to 0.60. At December 31, 2014, our ratio of debt to total tangible capitalization was approximately 0.40. We were in compliance with all covenants under the credit facilities as of December 31, 2014.
75
Table of Contents
NOBLE CORPORATION PLC AND SUBSIDIARIES
NOBLE CORPORATION AND SUBSIDIARIES
NOTES TO CONSOLIDATED FINANCIAL STATEMENTS
(Unless otherwise indicated, dollar amounts in tables are in thousands, except per share data)
In addition to the covenants from the Credit Facilities noted above, the indentures governing our outstanding senior unsecured notes contain covenants that place restrictions on certain merger and consolidation transactions, unless we are the surviving entity or the other party assumes the obligations under the indenture, and on the ability to sell or transfer all or substantially all of our assets. In addition, there are restrictions on incurring or assuming certain liens and sale and lease-back transactions. At December 31, 2014, we were in compliance with all of our debt covenants.
Other
Interest payable related to our long-term debt was $62 million and $67 million at December 31, 2014 and 2013, respectively. Such amounts are included in “Other current liabilities” in the accompanying Consolidated Balance Sheets.
At December 31, 2014, we had letters of credit of $149 million, including bonds covering the temporary importation of equipment, performance bonds and expatriate visa guarantees.
Aggregate principal repayments of total debt for the next five years and thereafter are as follows:
| 2015(1)(2) |
2016 | 2017 | 2018 | 2019 | Thereafter | Total | ||||||||||||||||||
| $1,473,495 |
$ | 299,982 | $ | 299,920 | $ | — | $ | 201,695 | $ | 2,593,928 | $ | 4,869,020 | ||||||||||||
| (1) | In August 2015, our $350 million 3.45% Senior Notes mature. We anticipate using availability on our Credit Facilities or commercial paper issuances to repay the outstanding balance; therefore, we have shown the entire balance as long-term on our Consolidated Balance Sheet at December 31, 2014. |
| (2) | Amounts outstanding under our credit facilities and commercial paper program mature during 2015. As amounts issued under the commercial paper program are supported by the unused committed capacity under our Credit Facilities, they are classified as long-term on our Consolidated Balance Sheet at December 31, 2014. |
Fair Value of Financial Instruments
Fair value represents the amount at which an instrument could be exchanged in a current transaction between willing parties. The estimated fair value of our senior notes was based on the quoted market prices for similar issues or on the current rates offered to us for debt of similar remaining maturities (Level 2 measurement). All remaining fair value disclosures are presented in Note 15 and Note 17.
The following table presents the estimated fair value of our long-term debt as of December 31, 2014 and 2013:
| December 31, 2014 | December 31, 2013 | |||||||||||||||
| Carrying | Estimated | Carrying | Estimated | |||||||||||||
| Value | Fair Value | Value | Fair Value | |||||||||||||
| Senior unsecured notes: |
||||||||||||||||
| 7.375% Senior Notes due 2014 |
$ | — | $ | — | $ | 249,964 | $ | 253,634 | ||||||||
| 3.45% Senior Notes due 2015 |
350,000 | 354,992 | 350,000 | 363,019 | ||||||||||||
| 3.05% Senior Notes due 2016 |
299,982 | 302,515 | 299,967 | 309,878 | ||||||||||||
| 2.50% Senior Notes due 2017 |
299,920 | 287,014 | 299,886 | 302,891 | ||||||||||||
| 7.50% Senior Notes due 2019 |
201,695 | 212,068 | 201,695 | 232,839 | ||||||||||||
| 4.90% Senior Notes due 2020 |
499,151 | 471,095 | 499,022 | 528,597 | ||||||||||||
| 4.625% Senior Notes due 2021 |
399,627 | 363,837 | 399,576 | 413,868 | ||||||||||||
| 3.95% Senior Notes due 2022 |
399,264 | 346,425 | 399,178 | 390,520 | ||||||||||||
| 6.20% Senior Notes due 2040 |
399,895 | 350,351 | 399,893 | 421,720 | ||||||||||||
| 6.05% Senior Notes due 2041 |
397,681 | 343,653 | 397,646 | 417,312 | ||||||||||||
| 5.25% Senior Notes due 2042 |
498,310 | 385,181 | 498,283 | 476,873 | ||||||||||||
|
|
|
|
|
|
|
|
|
|||||||||
| Total senior unsecured notes |
3,745,525 | 3,417,131 | 3,995,110 | 4,111,151 | ||||||||||||
| Credit facilities and commercial paper program |
1,123,495 | 1,123,495 | 1,561,141 | 1,561,141 | ||||||||||||
|
|
|
|
|
|
|
|
|
|||||||||
| Total long-term debt |
$ | 4,869,020 | $ | 4,540,626 | $ | 5,556,251 | $ | 5,672,292 | ||||||||
|
|
|
|
|
|
|
|
|
|||||||||
76
Table of Contents
NOBLE CORPORATION PLC AND SUBSIDIARIES
NOBLE CORPORATION AND SUBSIDIARIES
NOTES TO CONSOLIDATED FINANCIAL STATEMENTS
(Unless otherwise indicated, dollar amounts in tables are in thousands, except per share data)
Note 9- Equity
Share Capital
As of December 31, 2014, Noble-UK had approximately 247.5 million shares outstanding and trading as compared to approximately 253.4 million shares outstanding and trading at December 31, 2013. Repurchased shares are recorded at cost, and include shares repurchased pursuant to our approved share repurchase program discussed below. Our Board of Directors may increase our share capital through the issuance of up to 53 million authorized shares (at current nominal value of $0.01 per share) without obtaining shareholder approval.
Our most recent quarterly dividend payment to shareholders, totaling approximately $93 million (or $0.375 per share), was declared on January 30, 2015 and paid on February 20, 2015 to holders of record on February 10, 2015.
The declaration and payment of dividends require authorization of the Board of Directors of Noble-UK, provided that such dividends on issued share capital may be paid only out of Noble-UK’s “distributable reserves” on its statutory balance sheet. Noble-UK is not permitted to pay dividends out of share capital, which includes share premiums. The amount of any such dividends will depend on our results of operations, financial condition, cash requirements, future business prospects, contractual restrictions and other factors deemed relevant by our Board of Directors.
Share Repurchases
Under UK law, the company is only permitted to purchase its own shares by way of an “off market purchase” in a plan approved by shareholders. Prior to our redomiciliation to the UK, a resolution was adopted by Noble-UK’s sole shareholder authorizing the repurchase of 6,769,891 shares during the five-year period commencing on the date of the redomiciliation. This number of shares corresponds to the number of shares that Noble-Swiss had authority to repurchase at the time of the redomiciliation. During 2014, we repurchased all shares covered by this authorization.
Share repurchases for each of the three years ended December 31 are as follows:
| Total Number | Average | |||||||||||
| Year Ended | of Shares | Price Paid | ||||||||||
| December 31, |
Purchased | Total Cost(1) | per Share(1) | |||||||||
| 2014 |
6,769,891 | $ | 154,145 | $ | 22.77 | |||||||
| 2013 |
190,187 | 7,653 | 40.24 | |||||||||
| 2012 |
302,150 | 10,516 | 34.80 | |||||||||
| (1) | The total cost and average price paid per share includes the impact of commissions and stamp tax for share repurchases made in the open market. |
In December 2014, we received shareholder approval to repurchase up to 37,000,000 additional ordinary shares, or approximately 15 percent of our outstanding ordinary shares at the time of the shareholder approval. Any repurchases are expected to be funded using cash on hand, cash from operations or short-term borrowings under our credit facilities. The authority to make such repurchases will expire on the later of April 2016 or the end of the Company’s 2016 annual general meeting of shareholders, at which time we could seek shareholder approval for further repurchases.
Share-Based Compensation Plans
Stock Plans
The Noble Corporation 1991 Stock Option and Restricted Stock Plan, as amended (the “1991 Plan”), provides for the granting of options to purchase our shares, with or without stock appreciation rights, and the awarding of restricted shares or units to selected employees. In connection with the Spin-off, the total number of shares subject to issue under existing awards under the 1991 Plan was increased from 50.1 million to 60.3 million. As of December 31, 2014, we had 6.5 million shares remaining available for grants to employees under the 1991 Plan.
77
Table of Contents
NOBLE CORPORATION PLC AND SUBSIDIARIES
NOBLE CORPORATION AND SUBSIDIARIES
NOTES TO CONSOLIDATED FINANCIAL STATEMENTS
(Unless otherwise indicated, dollar amounts in tables are in thousands, except per share data)
Prior to October 25, 2007, the Noble Corporation 1992 Nonqualified Stock Option and Share Plan for Non-Employee Directors (the “1992 Plan”) provided for the granting of nonqualified stock options to our non-employee directors. On October 25, 2007, the 1992 Plan was amended and restated to, among other things, eliminate grants of stock options to non-employee directors and modify the annual award of restricted shares from a fixed number of restricted shares to an annually-determined variable number of restricted or unrestricted shares. In connection with the Spin-off, the total number of shares subject to issue under existing awards under the 1992 Plan was increased from 2.0 million to 2.3 million. As of December 31, 2014, we had 0.6 million shares remaining available for award to non-employee directors under the 1992 Plan.
Stock Options
Pursuant to the EMA (see Note 2), we modified the outstanding stock options for our employees in connection with the Spin-off. As the awards contained an antidilution provision, we made certain adjustments to the exercise price and number of our stock options to preserve the economic value of the grants immediately prior to the Spin-off. Each outstanding stock option of Noble, whether or not exercisable, that was held by a current or former Noble employee was adjusted such that the holder received an additional number of stock options of Noble based on a price ratio. The exercise price was adjusted by a factor equal to exercise price of the option prior to the Spin-off divided by the price ratio. The price ratio was calculated by dividing the average closing price of our stock during the 10 trading-day period prior to the Spin-off by the average closing price of our stock during the 10 trading-day period subsequent to the Spin-off. Each outstanding stock option of Noble, whether or not exercisable, that was held by an employee transferring to Paragon Offshore was vested at the Spin-off date and the exercise price and number of awards were adjusted in the same manner as explained above for Noble employees. At the Spin-off, we recognized the remaining expense for the accelerated vesting of stock options held by Paragon Offshore employees.
As a result of the Spin-off, an additional 339,223 stock options were issued to preserve the economic value of the grants immediately prior to the Spin-off, as discussed above. As no incremental fair value was awarded as a result of the issuance of these additional awards, the modification did not result in additional compensation expense.
Options have a term of 10 years, an exercise price equal to the fair market value of a share on the date of grant and generally vest over a three-year period. A summary of the status of stock options granted under both the 1991 Plan and 1992 Plan as of December 31, 2014, 2013 and 2012 and the changes during the year ended on those dates is presented below:
| 2014 | 2013 | 2012 | ||||||||||||||||||||||
| Number of | Weighted | Number of | Weighted | Number of | Weighted | |||||||||||||||||||
| Shares | Average | Shares | Average | Shares | Average | |||||||||||||||||||
| Underlying | Exercise | Underlying | Exercise | Underlying | Exercise | |||||||||||||||||||
| Options | Price | Options | Price | Options | Price | |||||||||||||||||||
| Outstanding at beginning of year |
1,808,987 | $ | 33.13 | 2,027,089 | $ | 32.44 | 2,498,662 | $ | 29.22 | |||||||||||||||
| Granted |
— | — | — | — | 358,772 | 36.04 | ||||||||||||||||||
| Exercised (1) |
(131,706 | ) | 20.08 | (212,017 | ) | 26.66 | (645,731 | ) | 20.97 | |||||||||||||||
| Forfeited |
(57,871 | ) | 30.18 | (6,085 | ) | 31.35 | (184,614 | ) | 35.92 | |||||||||||||||
| Spin-off adjustment |
339,223 | N/A | — | — | — | — | ||||||||||||||||||
|
|
|
|
|
|
|
|||||||||||||||||||
| Outstanding at end of year (2) |
1,958,633 | 28.43 | 1,808,987 | 33.13 | 2,027,089 | 32.44 | ||||||||||||||||||
|
|
|
|
|
|
|
|||||||||||||||||||
| Exercisable at end of year (2) |
1,846,465 | $ | 28.35 | 1,510,929 | $ | 32.47 | 1,453,945 | $ | 30.70 | |||||||||||||||
|
|
|
|
|
|
|
|||||||||||||||||||
| (1) | The intrinsic value of options exercised during the year ended December 31, 2014 was $3 million. |
| (2) | The aggregate intrinsic value of options outstanding and exercisable at December 31, 2014 was $0. |
78
Table of Contents
NOBLE CORPORATION PLC AND SUBSIDIARIES
NOBLE CORPORATION AND SUBSIDIARIES
NOTES TO CONSOLIDATED FINANCIAL STATEMENTS
(Unless otherwise indicated, dollar amounts in tables are in thousands, except per share data)
The following table summarizes additional information about stock options outstanding at December 31, 2014:
| Options Outstanding | Options Exercisable | |||||||||||||||||||
| Number of | Weighted | Weighted | Weighted | |||||||||||||||||
| Shares | Average | Average | Average | |||||||||||||||||
| Underlying | Remaining | Exercise | Number | Exercise | ||||||||||||||||
| Options | Life (Years) | Price | Exercisable | Price | ||||||||||||||||
| $20.49 to $21.99 |
513,103 | 2.25 | $ | 21.24 | 513,103 | $ | 21.24 | |||||||||||||
| $22.00 to $29.74 |
312,531 | 2.71 | 27.13 | 294,553 | 27.24 | |||||||||||||||
| $29.75 to $35.73 |
1,132,999 | 5.37 | 32.04 | 1,038,809 | 32.17 | |||||||||||||||
|
|
|
|
|
|||||||||||||||||
| Total |
1,958,633 | 4.13 | $ | 28.43 | 1,846,465 | $ | 28.35 | |||||||||||||
|
|
|
|
|
|||||||||||||||||
No stock options were granted during the years ended December 31, 2014 and 2013, respectively. Fair value information and related valuation assumptions for stock options granted during the year ended December 31, 2012 is as follows:
| 2012 | ||||
| Weighted average fair value per option granted |
$ | 13.41 | ||
| Valuation assumptions: |
||||
| Expected option term (years) |
6 | |||
| Expected volatility |
43.0 | % | ||
| Historical dividend yield |
1.4 | % | ||
| Risk-free interest rate |
1.1 | % | ||
The fair value of each option is estimated on the date of grant using a Black-Scholes pricing model. Assumptions used in the valuation are shown in the table above. The expected term of options granted represents the period of time that the options are expected to be outstanding and is derived from historical exercise behavior, current trends and values derived from lattice-based models. Expected volatilities are based on implied volatilities of traded options on our shares, historical volatility of our shares, and other factors. The expected dividend yield is based on historical yields on the date of grant. The risk-free rate is based on the U.S. Treasury yield curve in effect at the time of grant.
A summary of the status of our non-vested stock options at December 31, 2014, and changes during the year ended December 31, 2014, is presented below:
| Shares | Weighted-Average | |||||||
| Under Outstanding | Grant-Date | |||||||
| Options | Fair Value | |||||||
| Non-Vested Options at January 1, 2014 |
298,058 | $ | 13.13 | |||||
| Vested |
(204,877 | ) | 13.16 | |||||
| Spin-off adjustment |
18,987 | N/A | ||||||
|
|
|
|||||||
| Non-Vested Options at December 31, 2014 |
112,168 | $ | 13.05 | |||||
|
|
|
|||||||
At December 31, 2014, there was $0.1 million of total unrecognized compensation cost remaining for option grants awarded under the 1991 Plan. We attribute the service period to the vesting period and the unrecognized compensation is expected to be recognized over a weighted-average period of 0.08 years. Compensation cost recognized during the years ended December 31, 2014, 2013 and 2012 related to stock options totaled $2 million, $3 million and $4 million, respectively. We issue new shares to meet the share requirements upon exercise of stock options.
79
Table of Contents
NOBLE CORPORATION PLC AND SUBSIDIARIES
NOBLE CORPORATION AND SUBSIDIARIES
NOTES TO CONSOLIDATED FINANCIAL STATEMENTS
(Unless otherwise indicated, dollar amounts in tables are in thousands, except per share data)
Restricted Stock Units (“RSU’s)
Pursuant to the EMA (see Note 2), we modified the outstanding RSU awards, both time-vested restricted stock units (“TVRSUs”) and market-based performance-vested restricted stock units (“PVRSUs”), for our employees in connection with the Spin-off. As the awards contained an antidilution provision, we made certain adjustments to the number of our share-based compensation awards to preserve the economic value of the grants immediately prior to the Spin-off. Each outstanding and unvested RSU of Noble that was held by a current or former Noble employee was adjusted such that the holder received an additional number of RSUs of Noble based on a price ratio, which was calculated as noted above in “Stock Options”. Each outstanding and unvested TVRSU of Noble that was held by an employee transferring to Paragon Offshore was cancelled and an equivalent award was granted by Paragon Offshore. Each outstanding and unvested PVRSU of Noble that was held by an employee transferring to Paragon Offshore was continued pro-rata at the time of Spin-off, subject to the achievement of the performance condition at the end of the performance period. The remaining unvested PVRSUs were cancelled and an equivalent award was granted by Paragon Offshore, except for the 2012 PVRSU grants. For the 2012 PVRSU grants, a bonus will be paid by Paragon Offshore for the cancelled portion of the award should the performance factor be achieved.
As a result of the Spin-off, an additional 326,853 TVRSUs and 329,937 PVRSUs were issued to preserve the economic value of the grants immediately prior to the Spin-off, as discussed above. As no incremental fair value was awarded as a result of the issuance of these additional awards, the modification did not result in additional compensation expense.
We have awarded both TVRSU’s and PVRSU’s under the 1991 Plan. The TVRSU’s generally vest over a three year period. The number of PVRSU’s which vest will depend on the degree of achievement of specified corporate performance criteria over a three-year performance period. These criteria are strictly market based criteria as defined by FASB standards.
The TVRSU is valued on the date of award at our underlying share price. The total compensation for units that ultimately vest is recognized over the service period. The shares and related nominal value are recorded when the restricted stock unit vests and additional paid-in capital is adjusted as the share-based compensation cost is recognized for financial reporting purposes.
The market-based PVRSU is valued on the date of grant based on the estimated fair value. Estimated fair value is determined based on numerous assumptions, including an estimate of the likelihood that our stock price performance will achieve the targeted thresholds and the expected forfeiture rate. The fair value is calculated using a Monte Carlo Simulation Model. The assumptions used to value the PVRSU’s include historical volatility, risk-free interest rates, and expected dividends over a time period commensurate with the remaining term prior to vesting, as follows:
| 2014 | 2013 | 2012 | ||||||||||
| Valuation assumptions: |
||||||||||||
| Expected volatility |
33.0 | % | 34.8 | % | 41.4 | % | ||||||
| Expected dividend yield |
4.7 | % | 1.3 | % | 1.5 | % | ||||||
| Risk-free interest rate |
0.7 | % | 0.4 | % | 0.3 | % | ||||||
Additionally, similar assumptions were made for each of the companies included in the defined index and the peer group of companies in order to simulate the future outcome using the Monte Carlo Simulation Model.
A summary of the RSU awards for each of the years in the period ended December 31 is as follows:
| 2014 | 2013 | 2012 | ||||||||||
| TVRSU |
||||||||||||
| Units awarded (maximum available) |
1,617,534 | 1,033,009 | 932,274 | |||||||||
| Weighted-average share price at award date |
$ | 31.56 | $ | 41.32 | $ | 36.53 | ||||||
| Weighted-average vesting period (years) |
3.0 | 3.0 | 3.0 | |||||||||
| PVRSU |
||||||||||||
| Units awarded (maximum available) |
740,364 | 565,650 | 481,206 | |||||||||
| Weighted-average share price at award date |
$ | 31.66 | $ | 41.42 | $ | 36.90 | ||||||
| Three-year performance period ended December 31 |
2016 | 2015 | 2014 | |||||||||
| Weighted-average award-date fair value |
$ | 19.66 | $ | 24.97 | $ | 20.05 | ||||||
80
Table of Contents
NOBLE CORPORATION PLC AND SUBSIDIARIES
NOBLE CORPORATION AND SUBSIDIARIES
NOTES TO CONSOLIDATED FINANCIAL STATEMENTS
(Unless otherwise indicated, dollar amounts in tables are in thousands, except per share data)
In October 2014, our Board of Directors approved a modification of certain PVRSU awards. The modification related to the composition of our peer groups for a portion of the 2013 and 2014 grants currently in place. The value of the modification was determined by taking the fair value of the modified award as compared to the fair value of the previous award immediately prior to modification, using a Monte Carlo Simulation Model to value both grants. In connection with this modification, we expect to incur approximately $0.5 million of related compensation cost over the life of the grant.
We award shares under the 1992 Plan. During the years ended December 31, 2014, 2013 and 2012, we awarded 50,796, 57,095 and 65,329 shares to non-employee directors, resulting in related compensation cost of $2 million in each of the three years.
A summary of the status of non-vested RSU’s at December 31, 2014 and changes during the year ended December 31, 2014 is presented below:
| Weighted | Weighted | |||||||||||||||
| Average | Average | |||||||||||||||
| TVRSU’s | Award-Date | PVRSU’s | Award-Date | |||||||||||||
| Outstanding | Fair Value | Outstanding (1) | Fair Value | |||||||||||||
| Non-vested RSU’s at January 1, 2014 |
1,652,360 | $ | 39.40 | 1,397,137 | $ | 21.06 | ||||||||||
| Awarded |
1,617,534 | 31.56 | 740,364 | 19.66 | ||||||||||||
| Vested |
(749,935 | ) | 38.76 | (180,975 | ) | 16.77 | ||||||||||
| Forfeited |
(149,006 | ) | 35.50 | (253,882 | ) | 17.66 | ||||||||||
| Surrendered in connection with Spin-off |
(816,627 | ) | 34.22 | (89,612 | ) | 20.95 | ||||||||||
| Spin-off adjustment |
326,853 | N/A | 329,937 | N/A | ||||||||||||
|
|
|
|
|
|||||||||||||
| Non-vested RSU’s at December 31, 2014 |
1,881,179 | $ | 34.66 | 1,942,969 | $ | 21.44 | ||||||||||
|
|
|
|
|
|||||||||||||
| (1) | The number of PVRSU’s shown equals the units that would vest if the “maximum” level of performance is achieved. The minimum number of units is zero and the “target” level of performance is 50 percent of the amounts shown. |
At December 31, 2014 there was $31 million of total unrecognized compensation cost related to the TVRSU’s which is expected to be recognized over a remaining weighted-average period of 1.6 years. The total award-date fair value of TVRSU’s vested during the year ended December 31, 2014 was $29 million.
At December 31, 2014, there was $13 million of total unrecognized compensation cost related to the PVRSU’s which is expected to be recognized over a remaining weighted-average period of 1.6 years. The total potential compensation for PVRSU’s is recognized over the service period regardless of whether the performance thresholds are ultimately achieved. During the year ended December 31, 2014, 218,195 PVRSU’s for the 2011-2013 performance period were forfeited. In January 2015, 517,223 PVRSU’s for the 2012-2014 performance period were forfeited.
Share-based amortization recognized during the years ended December 31, 2014, 2013 and 2012 related to all restricted stock totaled $46 million ($37 million net of income tax), $44 million ($36 million net of income tax) and $36 million ($31 million net of income tax), respectively. Included in share-based amortization for the years ended December 31, 2014, 2013 and 2012 was approximately $7 million, $10 million and $8 million, respectively, related to Paragon Offshore that was classified as discontinued operations. Capitalized share-based amortization totaled approximately $1 million per year in 2014, 2013 and 2012, respectively.
81
Table of Contents
NOBLE CORPORATION PLC AND SUBSIDIARIES
NOBLE CORPORATION AND SUBSIDIARIES
NOTES TO CONSOLIDATED FINANCIAL STATEMENTS
(Unless otherwise indicated, dollar amounts in tables are in thousands, except per share data)
Note 10- Accumulated Other Comprehensive Loss
The following tables set forth the components of “Accumulated other comprehensive loss” (“AOCL”) for the years ended December 31, 2014 and 2013 and changes in AOCL by component for the year ended December 31, 2014. All amounts within the tables are shown net of tax.
| Gains / | Defined | |||||||||||||||
| (Losses) on | Benefit | Foreign | ||||||||||||||
| Cash Flow | Pension | Currency | ||||||||||||||
| Hedges(1) | Items(2) | Items | Total | |||||||||||||
| Balance at December 31, 2012 |
$ | — | $ | (95,071 | ) | $ | (20,378 | ) | $ | (115,449 | ) | |||||
|
|
|
|
|
|
|
|
|
|||||||||
| Activity during period: |
||||||||||||||||
| Other comprehensive income (loss) before reclassifications |
(1,200 | ) | 29,861 | (3,188 | ) | 25,473 | ||||||||||
| Amounts reclassified from AOCL |
1,200 | 6,612 | — | 7,812 | ||||||||||||
|
|
|
|
|
|
|
|
|
|||||||||
| Net other comprehensive income (loss) |
— | 36,473 | (3,188 | ) | 33,285 | |||||||||||
|
|
|
|
|
|
|
|
|
|||||||||
| Balance at December 31, 2013 |
$ | — | $ | (58,598 | ) | $ | (23,566 | ) | $ | (82,164 | ) | |||||
|
|
|
|
|
|
|
|
|
|||||||||
| Activity during period: |
||||||||||||||||
| Other comprehensive income (loss) before reclassifications |
(4,286 | ) | (30,952 | ) | (118 | ) | (35,356 | ) | ||||||||
| Amounts reclassified from AOCL |
4,286 | 9,338 | — | 13,624 | ||||||||||||
|
|
|
|
|
|
|
|
|
|||||||||
| Net other comprehensive income (loss) |
— | (21,614 | ) | (118 | ) | (21,732 | ) | |||||||||
| Spin-off of Paragon Offshore(3) |
— | 21,772 | 12,706 | 34,478 | ||||||||||||
|
|
|
|
|
|
|
|
|
|||||||||
| Balance at December 31, 2014 |
$ | — | $ | (58,440 | ) | $ | (10,978 | ) | $ | (69,418 | ) | |||||
|
|
|
|
|
|
|
|
|
|||||||||
| (1) | Gains on cash flow hedges are related to our foreign currency forward contracts. Reclassifications from AOCL are recognized through “contract drilling services” expense on our Consolidated Statements of Income. See Note 16 for additional information. |
| (2) | Defined benefit pension items relate to actuarial changes, the amortization of prior service costs and curtailment and settlement expenses. Reclassifications from AOCL are recognized as expense on our Consolidated Statements of Income through either “contract drilling services” or “general and administrative”. See Note 15 for additional information. |
| (3) | Reclassifications for the Spin-off of Paragon Offshore represent accumulated balances in AOCL that were transferred as part of the Spin-off. |
Note 11- Loss on Impairment
Asset impairments
In connection with the preparation of the consolidated financial statements included in this Annual Report, consistent with our accounting policies discussed in Note 1, we evaluate our drilling fleet assets for impairment on an annual basis or whenever there are changes in facts which suggest that the value of the asset is not recoverable.
During the fourth quarter of 2014, in connection with our annual impairment analysis, we reviewed assumptions on the future marketability of the Noble Driller, the Noble Jim Thompson and the Noble Paul Wolff (together the “impaired rigs”) with consideration given to their years in service, limited technical features and anticipated capital requirements in light of the current market conditions and decided to discontinue marketing these units. We evaluated these units for impairment and recorded an impairment of approximately $685 million on these rigs for the year ended December 31, 2014. The total remaining book value at of $47 million at December 31, 2014 represented the equipment present on the rigs, which will be redeployed within our fleet. The remaining book value is a level 3 fair value measurement under accounting literature as it contains significant estimation and non-observable inputs.
In 2012, we determined that our submersible rig fleet, consisting of two cold stacked rigs, was partially impaired due to the declining market outlook for drilling services for that rig type. We estimated the fair value of the rigs based on the salvage value of the rigs and a then recent transaction involving a similar unit owned by a peer
82
Table of Contents
NOBLE CORPORATION PLC AND SUBSIDIARIES
NOBLE CORPORATION AND SUBSIDIARIES
NOTES TO CONSOLIDATED FINANCIAL STATEMENTS
(Unless otherwise indicated, dollar amounts in tables are in thousands, except per share data)
company (Level 2 fair value measurement). Based on these estimates, we recognized a charge of approximately $13 million for the year ended December 31, 2012. During 2013, we recorded an additional impairment charge of approximately $4 million on these rigs arising from the potential disposition of these assets to an unrelated third party. In January 2014, we completed the sale of the submersibles for a total sales price of $7 million.
Also in 2012, we determined that certain corporate assets were partially impaired due to a declining market for, and the potential disposal of, the assets. We estimated the fair value of the assets based on a signed letter of intent to sell the assets (Level 2 fair value measurement). Based on these estimates, we recognized a charge of approximately $8 million for the year ended December 31, 2012.
Goodwill
In connection with our acquisition of Frontier in 2010, we recognized goodwill in our Contract Drilling Services reporting unit. In connection with the preparation of the consolidated financial statements included in this Annual Report, as discussed in Note 1, we conduct goodwill impairment testing annually in the fourth quarter of each year and when events occur that would potentially reduce the fair value of our reporting unit below its carrying amount.
As part of our annual test completed during the fourth quarter, we noted a significant decline in the market value of our stock, coupled with a decrease in oil and gas prices, significant reductions in the projected dayrates for new contracts and reduced utilization forecasts. These factors drove our fair value of the reporting unit below the book value, and we concluded that the goodwill in the Contract Drilling Services reporting unit was impaired. We deemed this to be a level 3 fair value measurement under accounting literature as it contains significant estimation and non-observable inputs. During the fourth quarter, we fully impaired the $60 million of goodwill on our books.
Note 12- Gain on Disposal of Assets, net
During the third quarter of 2013, we completed the sale of the Noble Lewis Dugger for $61 million to an unrelated third party in Mexico. In connection with the sale, we recorded a pre-tax gain of approximately $36 million.
Note 13- Gain on Contract Settlements/Extinguishments, Net
In 2013, we received $45 million related to the settlement of all claims against the former shareholders of FDR Holdings, Ltd., which we acquired in July 2010, relating to alleged breaches of various representations and warranties contained in the purchase agreement. A portion of the settlement, totaling approximately $14 million, was allocated to discontinued operations as it related to certain standard specification rigs.
In 2012, we received approximately $5 million from the settlement of a claim relating to the Noble David Tinsley, which had experienced a “punch-through” while being positioned on location in 2009. We had originally recorded a $17 million charge during 2009 related to this incident. Additionally, during the second quarter of 2012, we settled an action against certain vendors for damages sustained during Hurricane Ike. We recognized a net gain of approximately $28 million related to this settlement. We also resolved all outstanding matters with Anadarko Petroleum Company (“Anadarko”) related to the previously disclosed force majeure action, Hurricane Ike matters and receivables relating to the Noble Amos Runner.
Note 14- Income Taxes
Noble-UK is a company which is tax resident in the UK and, as such, will be subject to UK corporation tax on its taxable profits and gains. A UK tax exemption is available in respect of qualifying dividends income and capital gains related to the sale of qualifying participations. We operate in various countries throughout the world, including the United States. The income of the non-UK subsidiaries is not expected to be subject to UK corporation tax. Prior to the redomiciliation, Noble-Swiss was the group holding company and was exempt from Swiss cantonal and communal income tax on its worldwide income, and was also granted participation relief from Swiss federal tax for qualifying dividend income and capital gains related to the sale of qualifying participations. It is expected that the participation relief will result in a full exemption of participation income from Swiss federal income tax. We do not expect the redomiciliation from Switzerland to the UK to have a material impact on our effective tax rate.
83
Table of Contents
NOBLE CORPORATION PLC AND SUBSIDIARIES
NOBLE CORPORATION AND SUBSIDIARIES
NOTES TO CONSOLIDATED FINANCIAL STATEMENTS
(Unless otherwise indicated, dollar amounts in tables are in thousands, except per share data)
Consequently, we have taken account of those tax exemptions and provided for income taxes based on the laws and rates in effect in the countries in which operations are conducted, or in which we or our subsidiaries have a taxable presence for income tax purposes.
The components of the net deferred taxes are as follows:
| 2014 | 2013 | |||||||
| Deferred tax assets |
||||||||
| United States |
||||||||
| Deferred pension plan amounts |
$ | 23,497 | $ | 8,859 | ||||
| Accrued expenses not currently deductible |
14,250 | 31,769 | ||||||
| Other |
11,267 | 14,542 | ||||||
| Non-U.S. |
||||||||
| Net operating loss carry forwards |
6,907 | 33,021 | ||||||
| Deferred pension plan amounts |
3,096 | 2,130 | ||||||
| Other |
— | 300 | ||||||
|
|
|
|
|
|||||
| Deferred tax assets |
59,017 | 90,621 | ||||||
| Less: valuation allowance |
(6,907 | ) | (16,847 | ) | ||||
|
|
|
|
|
|||||
| Net deferred tax assets |
$ | 52,110 | $ | 73,774 | ||||
|
|
|
|
|
|||||
| Deferred tax liabilities |
||||||||
| United States |
||||||||
| Excess of net book basis over remaining tax basis |
$ | (166,959 | ) | $ | (275,073 | ) | ||
| Other |
(4,969 | ) | (6,002 | ) | ||||
| Non-U.S. |
||||||||
| Excess of net book basis over remaining tax basis |
(200 | ) | (1,034 | ) | ||||
| Other |
(397 | ) | (2,452 | ) | ||||
|
|
|
|
|
|||||
| Deferred tax liabilities |
$ | (172,525 | ) | $ | (284,561 | ) | ||
|
|
|
|
|
|||||
| Net deferred tax liabilities |
$ | (120,415 | ) | $ | (210,787 | ) | ||
|
|
|
|
|
|||||
Income (loss) from continuing operations before income taxes consists of the following:
| Year Ended December 31, | ||||||||||||
| 2014 | 2013 | 2012 | ||||||||||
| United States |
$ | 38,206 | $ | 178,090 | $ | 135,618 | ||||||
| Non-U.S. |
(8,741 | ) | 460,331 | 407,747 | ||||||||
|
|
|
|
|
|
|
|||||||
| Total |
$ | 29,465 | $ | 638,421 | $ | 543,365 | ||||||
|
|
|
|
|
|
|
|||||||
The income tax provision for continuing operations consists of the following:
| Year Ended December 31, | ||||||||||||
| 2014 | 2013 | 2012 | ||||||||||
| Current- United States |
$ | 50,829 | $ | 83,302 | $ | 65,244 | ||||||
| Current- Non-U.S. |
74,288 | 23,836 | 45,593 | |||||||||
| Deferred- United States |
(18,655 | ) | (14,032 | ) | (16,256 | ) | ||||||
| Deferred- Non-U.S. |
189 | (989 | ) | 602 | ||||||||
|
|
|
|
|
|
|
|||||||
| Total |
$ | 106,651 | $ | 92,117 | $ | 95,183 | ||||||
|
|
|
|
|
|
|
|||||||
84
Table of Contents
NOBLE CORPORATION PLC AND SUBSIDIARIES
NOBLE CORPORATION AND SUBSIDIARIES
NOTES TO CONSOLIDATED FINANCIAL STATEMENTS
(Unless otherwise indicated, dollar amounts in tables are in thousands, except per share data)
The following is a reconciliation of our reserve for uncertain tax positions, excluding interest and penalties:
| 2014 | 2013 | 2012 | ||||||||||
| Gross balance at January 1, |
$ | 115,969 | $ | 115,009 | $ | 108,036 | ||||||
| Additions based on tax positions related to current year |
16,880 | 2,318 | 3,704 | |||||||||
| Additions for tax positions of prior years |
12,928 | 18,906 | 16,432 | |||||||||
| Reductions for tax positions of prior years |
(8 | ) | (7,910 | ) | (7,917 | ) | ||||||
| Expiration of statutes |
(2,852 | ) | (2,633 | ) | (1,903 | ) | ||||||
| Reduction due to Spin-off |
(26,870 | ) | — | — | ||||||||
| Tax settlements |
(7,235 | ) | (9,721 | ) | (3,343 | ) | ||||||
|
|
|
|
|
|
|
|||||||
| Gross balance at December 31, |
108,812 | 115,969 | 115,009 | |||||||||
| Related tax benefits |
(1,064 | ) | (2,038 | ) | (9,981 | ) | ||||||
|
|
|
|
|
|
|
|||||||
| Net reserve at December 31, |
$ | 107,748 | $ | 113,931 | $ | 105,028 | ||||||
|
|
|
|
|
|
|
|||||||
The liabilities related to our reserve for uncertain tax positions are comprised of the following:
| 2014 | 2013 | |||||||
| Reserve for uncertain tax positions, excluding interest and penalties |
$ | 107,748 | $ | 113,931 | ||||
| Interest and penalties included in “Other liabilities” |
8,039 | 13,190 | ||||||
|
|
|
|
|
|||||
| Reserve for uncertain tax positions, including interest and penalties |
$ | 115,787 | $ | 127,121 | ||||
|
|
|
|
|
|||||
If these reserves of $116 million are not realized, the provision for income taxes will be reduced by $116 million.
We include, as a component of our “Income tax provision”, potential interest and penalties related to recognized tax contingencies within our global operations. Interest and penalties resulted in an income tax benefit of $1 million in 2014, an income tax benefit of $7 million in 2013 and an income tax expense of $5 million in 2012.
It is reasonably possible that our existing liabilities related to our reserve for uncertain tax positions may increase or decrease in the next twelve months primarily due to the completion of open audits or the expiration of statutes of limitation. However, we cannot reasonably estimate a range of changes in our existing liabilities due to various uncertainties, such as the unresolved nature of various audits.
We conduct business globally and, as a result, we file numerous income tax returns in the U.S. and non-U.S. jurisdictions. In the normal course of business we are subject to examination by taxing authorities throughout the world, including major jurisdictions such as Brazil, India, Mexico, Nigeria, Norway, Qatar, Saudi Arabia, Switzerland, the United Kingdom and the United States. We are no longer subject to U.S. Federal income tax examinations for years before 2010 and non-U.S. income tax examinations for years before 2000.
Noble-UK conducts substantially all of its business through Noble-Cayman and its subsidiaries. The income of our non-UK subsidiaries is not subject to UK income tax. Earnings are taxable in the United Kingdom at the UK statutory rate of 21.5 percent. Ongoing consultative process in the United Kingdom and a possible change in law could materially impact our tax rate on operations in the United Kingdom continental shelf. A reconciliation of tax rates outside of the United Kingdom and the Cayman Islands to our Noble-UK effective rate for continuing operations is shown below:
| Year Ended December 31, |
||||||||||||
| 2014 | 2013 | 2012 | ||||||||||
| Effect of: |
||||||||||||
| Tax rates which are different than the UK and Cayman Island rates |
19.3 | % | 15.5 | % | 18.6 | % | ||||||
| Tax impact of asset impairment |
344.0 | % | 0.0 | % | 0.0 | % | ||||||
| Resolution of tax authority audits |
-1.3 | % | -1.1 | % | -1.1 | % | ||||||
|
|
|
|
|
|
|
|||||||
| Total |
362.0 | % | 14.4 | % | 17.5 | % | ||||||
|
|
|
|
|
|
|
|||||||
85
Table of Contents
NOBLE CORPORATION PLC AND SUBSIDIARIES
NOBLE CORPORATION AND SUBSIDIARIES
NOTES TO CONSOLIDATED FINANCIAL STATEMENTS
(Unless otherwise indicated, dollar amounts in tables are in thousands, except per share data)
We generated and fully utilized U.S. foreign tax credits of $17 million, $15 million and $22 million in 2014, 2013 and 2012, respectively.
For the year ended December 31, 2013, deferred income taxes were not provided on approximately $80 million of undistributed earnings of our subsidiaries. We considered such earnings to be permanently reinvested. If such earnings would have been distributed, we may have been subject to additional income taxes of approximately $20 to $25 million. All aforementioned earnings were held by subsidiaries which, as a result of the Spin-off, are now subsidiaries of Paragon Offshore. Therefore, at December 31, 2014, we have no undistributed earnings of our subsidiaries for which deferred income taxes have not been provided.
Note 15- Employee Benefit Plans
Defined Benefit Plans
Prior to the Spin-off, each of Noble Drilling (Land Support) Limited (“NDLS”), Noble Enterprises Limited (“NEL”) and Noble Drilling (Nederland) B.V. (“NDNBV”), all indirect, wholly-owned subsidiaries of Noble-UK, maintained a pension plan that covered all of its salaried, non-union employees. Benefits were based on credited service and employees’ compensation near retirement, as defined by the respective plan.
As a result of the Spin-off, employees of Paragon Offshore no longer participate in benefit plans sponsored or maintained by Noble. At the time of the Spin-off, NEL and NDNBV transferred all assets and obligations to Paragon Offshore. The benefits of retained Noble employees who participated in the NEL plan prior to the Spin-off were frozen in the NEL plan and their future benefits were replicated into a new plan maintained by an indirect, wholly-owned subsidiary of Noble-UK, Noble Resources Limited (“NRL”).
Subsequent to the Spin-off, Noble maintains the NDLS and NRL plans. Benefits are based on credited service and employees’ compensation near retirement, as defined by the respective plan. Reference to our “non-U.S. plans” included throughout this report relates to the Noble-maintained NDLS and NRL plans, as well as activity for the NEL and NDNBV plans prior to the Spin-off.
In addition to the non-U.S. plans discussed above, we have two U.S. noncontributory defined benefit pension plans: one which covers certain salaried employees and one which covers certain hourly employees, whose initial date of employment is prior to August 1, 2004 (collectively referred to as our “qualified U.S. plans”). These plans are governed by the Noble Drilling Employees’ Retirement Trust (the “Trust”). The benefits from these plans are based primarily on years of service and, for the salaried plan, employees’ compensation near retirement. These plans qualify under the Employee Retirement Income Security Act of 1974 (“ERISA”), and our funding policy is consistent with funding requirements of ERISA and other applicable laws and regulations. We make cash contributions, or utilize credit balances available to us under the plan, for the qualified U.S. plans when required. The benefit amount that can be covered by the qualified U.S. plans is limited under ERISA and the Internal Revenue Code (“IRC”) of 1986. Therefore, we maintain an unfunded, nonqualified excess benefit plan designed to maintain benefits for specified employees at the formula level in the qualified salary U.S. plan. We refer to the qualified U.S. plans and the excess benefit plan collectively as the “U.S. plans”.
Employees participating in the U.S. plans that transferred to Paragon Offshore at the time of the Spin-off terminated under these plans as of July 31, 2014. In connection with the termination of these employees, we recognized a curtailment expense of $0.2 million for the year ended December 31, 2014. Additionally in 2014, we recognized a settlement expense of $10 million related to those terminated employees that elected to receive their accumulated benefits as a lump sum distribution.
86
Table of Contents
NOBLE CORPORATION PLC AND SUBSIDIARIES
NOBLE CORPORATION AND SUBSIDIARIES
NOTES TO CONSOLIDATED FINANCIAL STATEMENTS
(Unless otherwise indicated, dollar amounts in tables are in thousands, except per share data)
A reconciliation of the changes in projected benefit obligations (“PBO”) for our non-U.S. and U.S. plans is as follows:
| Year Ended December 31, | ||||||||||||||||
| 2014 | 2013 | |||||||||||||||
| Non-U.S. | U.S. | Non-U.S. | U.S. | |||||||||||||
| Benefit obligation at beginning of year |
$ | 161,591 | $ | 223,938 | $ | 151,781 | $ | 225,885 | ||||||||
| Service cost |
4,777 | 8,901 | 5,496 | 10,724 | ||||||||||||
| Interest cost |
4,650 | 10,546 | 5,085 | 9,049 | ||||||||||||
| Actuarial loss (gain) |
6,145 | 51,524 | (4,584 | ) | (17,652 | ) | ||||||||||
| Plan amendments |
1,595 | — | (227 | ) | — | |||||||||||
| Benefits paid |
(2,819 | ) | (4,262 | ) | (2,558 | ) | (4,068 | ) | ||||||||
| Settlement |
— | (34,397 | ) | — | — | |||||||||||
| Curtailment |
— | (18,178 | ) | — | — | |||||||||||
| Plan participants’ contributions |
266 | — | 956 | — | ||||||||||||
| Foreign exchange rate changes |
(7,071 | ) | — | 5,642 | — | |||||||||||
| Spin-off adjustment |
(96,581 | ) | — | — | — | |||||||||||
|
|
|
|
|
|
|
|
|
|||||||||
| Benefit obligation at end of year |
$ | 72,553 | $ | 238,072 | $ | 161,591 | $ | 223,938 | ||||||||
|
|
|
|
|
|
|
|
|
|||||||||
A reconciliation of the changes in fair value of plan assets is as follows:
| Year Ended December 31, | ||||||||||||||||
| 2014 | 2013 | |||||||||||||||
| Non-U.S. | U.S. | Non-U.S. | U.S. | |||||||||||||
| Fair value of plan assets at beginning of year |
$ | 174,257 | $ | 201,011 | $ | 151,819 | $ | 167,170 | ||||||||
| Actual return on plan assets |
6,717 | 7,750 | 8,470 | 31,518 | ||||||||||||
| Employer contributions |
6,863 | 2,017 | 9,365 | 6,391 | ||||||||||||
| Benefits and expenses paid |
(2,819 | ) | (4,262 | ) | (2,558 | ) | (4,068 | ) | ||||||||
| Settlement |
— | (34,397 | ) | — | — | |||||||||||
| Plan participants’ contributions |
266 | — | 956 | — | ||||||||||||
| Foreign exchange rate changes |
(11,068 | ) | — | 6,205 | — | |||||||||||
| Spin-off adjustment |
(96,502 | ) | — | — | — | |||||||||||
|
|
|
|
|
|
|
|
|
|||||||||
| Fair value of plan assets at end of year |
$ | 77,714 | $ | 172,119 | $ | 174,257 | $ | 201,011 | ||||||||
|
|
|
|
|
|
|
|
|
|||||||||
The funded status of the plans is as follows:
| Year Ended December 31, | ||||||||||||||||
| 2014 | 2013 | |||||||||||||||
| Non-U.S. | U.S. | Non-U.S. | U.S. | |||||||||||||
| Funded status |
$ | 5,161 | $ | (65,953 | ) | $ | 12,666 | $ | (22,927 | ) | ||||||
Amounts recognized in the Consolidated Balance Sheets consist of:
| Year Ended December 31, | ||||||||||||||||
| 2014 | 2013 | |||||||||||||||
| Non-U.S. | U.S. | Non-U.S. | U.S. | |||||||||||||
| Other assets (noncurrent) |
$ | 7,725 | $ | — | $ | 13,586 | $ | 6,132 | ||||||||
| Other liabilities (current) |
— | (3,037 | ) | — | (2,120 | ) | ||||||||||
| Other liabilities (noncurrent) |
(2,564 | ) | (62,916 | ) | (920 | ) | (26,939 | ) | ||||||||
|
|
|
|
|
|
|
|
|
|||||||||
| Net amount recognized |
$ | 5,161 | $ | (65,953 | ) | $ | 12,666 | $ | (22,927 | ) | ||||||
|
|
|
|
|
|
|
|
|
|||||||||
87
Table of Contents
NOBLE CORPORATION PLC AND SUBSIDIARIES
NOBLE CORPORATION AND SUBSIDIARIES
NOTES TO CONSOLIDATED FINANCIAL STATEMENTS
(Unless otherwise indicated, dollar amounts in tables are in thousands, except per share data)
Amounts recognized in AOCL consist of:
| Year Ended December 31, | ||||||||||||||||
| 2014 | 2013 | |||||||||||||||
| Non-U.S. | U.S. | Non-U.S. | U.S. | |||||||||||||
| Net actuarial loss |
$ | 11,793 | $ | 73,705 | $ | 30,902 | $ | 45,338 | ||||||||
| Prior service cost |
1,531 | 468 | (232 | ) | 905 | |||||||||||
| Deferred income tax asset |
(3,096 | ) | (25,961 | ) | (2,130 | ) | (16,185 | ) | ||||||||
|
|
|
|
|
|
|
|
|
|||||||||
| Accumulated other comprehensive loss |
$ | 10,228 | $ | 48,212 | $ | 28,540 | $ | 30,058 | ||||||||
|
|
|
|
|
|
|
|
|
|||||||||
Pension cost includes the following components:
| Year Ended December 31, | ||||||||||||||||||||||||
| 2014 | 2013 | 2012 | ||||||||||||||||||||||
| Non-U.S. | U.S. | Non-U.S. | U.S. | Non-U.S. | U.S. | |||||||||||||||||||
| Service Cost |
$ | 4,777 | $ | 8,901 | $ | 5,496 | $ | 10,724 | $ | 4,461 | $ | 9,612 | ||||||||||||
| Interest Cost |
4,650 | 10,546 | 5,085 | 9,049 | 5,372 | 8,719 | ||||||||||||||||||
| Return on plan assets |
(6,117 | ) | (15,499 | ) | (5,836 | ) | (13,102 | ) | (5,344 | ) | (11,171 | ) | ||||||||||||
| Amortization of prior service cost |
46 | 196 | — | 227 | — | 227 | ||||||||||||||||||
| Recognized net actuarial loss |
769 | 2,857 | 1,670 | 7,639 | 803 | 7,356 | ||||||||||||||||||
| Curtailment expense |
— | 241 | — | — | — | — | ||||||||||||||||||
| Settlement expense |
— | 9,872 | — | — | — | — | ||||||||||||||||||
|
|
|
|
|
|
|
|
|
|
|
|
|
|||||||||||||
| Net pension expense |
$ | 4,125 | $ | 17,114 | $ | 6,415 | $ | 14,537 | $ | 5,292 | $ | 14,743 | ||||||||||||
|
|
|
|
|
|
|
|
|
|
|
|
|
|||||||||||||
Included in net pension expense for the years ended December 31, 2014, 2013 and 2012 for non-U.S. plans was approximately $2 million, $4 million and $3 million, respectively, related to Paragon Offshore that was classified as discontinued operations. Included in net pension expense for the years ended December 31, 2014, 2013 and 2012 for U.S. plans was approximately $11 million, $4 million and $4 million, respectively, related to Paragon Offshore that was classified as discontinued operations.
The estimated prior service cost and net actuarial loss that will be amortized from AOCL into net periodic pension cost in 2015 are $0.1 million and $0.3 million, respectively, for non-U.S. plans and $0.1 million and $6.2 million, respectively, for U.S. plans.
During 2014, we adopted the Retirement Plan (“RP”) 2014 mortality tables with the Mortality Projection (“MP”) scale as issued by the Society of Actuaries. The RP 2014 mortality tables represent the new standard for defined benefit mortality assumptions due to longer life expectancies. The adoption of the updated mortality tables and the mortality improvement scales increased our pension liability on our U.S. plans by approximately $14 million as of December 31, 2014.
Defined Benefit Plans—Disaggregated Plan Information
Disaggregated information regarding our non-U.S. and U.S. plans is summarized below:
| Year Ended December 31, | ||||||||||||||||
| 2014 | 2013 | |||||||||||||||
| Non-U.S. | U.S. | Non-U.S. | U.S. | |||||||||||||
| Projected benefit obligation |
$ | 72,553 | $ | 238,072 | $ | 161,591 | $ | 223,938 | ||||||||
| Accumulated benefit obligation |
68,902 | 202,716 | 154,140 | 185,383 | ||||||||||||
| Fair value of plan assets |
77,714 | 172,119 | 174,257 | 201,011 | ||||||||||||
88
Table of Contents
NOBLE CORPORATION PLC AND SUBSIDIARIES
NOBLE CORPORATION AND SUBSIDIARIES
NOTES TO CONSOLIDATED FINANCIAL STATEMENTS
(Unless otherwise indicated, dollar amounts in tables are in thousands, except per share data)
The following table provides information related to those plans in which the PBO exceeded the fair value of the plan assets at December 31, 2014 and 2013. The PBO is the actuarially computed present value of earned benefits based on service to date and includes the estimated effect of any future salary increases.
| Year Ended December 31, | ||||||||||||||||
| 2014 | 2013 | |||||||||||||||
| Non-U.S. | U.S. | Non-U.S. | U.S. | |||||||||||||
| Projected benefit obligation |
$ | 3,157 | $ | 238,072 | $ | 6,740 | $ | 200,472 | ||||||||
| Fair value of plan assets |
592 | 172,119 | 5,820 | 171,413 | ||||||||||||
The PBO for the unfunded excess benefit plan was $20 million at December 31, 2014 as compared to $13 million in 2013, and is included under “U.S.” in the above tables.
The following table provides information related to those plans in which the accumulated benefit obligation (“ABO”) exceeded the fair value of plan assets at December 31, 2014 and 2013. The ABO is the actuarially computed present value of earned benefits based on service to date, but differs from the PBO in that it is based on current salary levels.
| Year Ended December 31, | ||||||||||||||||
| 2014 | 2013 | |||||||||||||||
| Non-U.S. | U.S. | Non-U.S. | U.S. | |||||||||||||
| Accumulated benefit obligation |
$ | 1,355 | $ | 202,716 | $ | 6,493 | $ | 11,997 | ||||||||
| Fair value of plan assets |
592 | 172,119 | 5,820 | — | ||||||||||||
The ABO for the unfunded excess benefit plan was $13 million at December 31, 2014 as compared to $12 million in 2013, and is included under “U.S.” in the above tables.
Defined Benefit Plans—Key Assumptions
The key assumptions for the plans are summarized below:
| Year Ended December 31, | ||||||||
| 2014 | 2013 | |||||||
| Non-U.S. | U.S. | Non-U.S. | U.S. | |||||
| Weighted-average assumptions used to determine benefit obligations: |
||||||||
| Discount Rate |
2.6%-3.7% | 3.0%-4.1% | 3.9%-4.7% | 3.9%-5.1% | ||||
| Rate of compensation increase |
3.6%-4.1% | 5.0% | 3.6%-4.5% | 5.0% | ||||
| Year Ended December 31, | ||||||||||||
| 2014 | 2013 | 2012 | ||||||||||
| Non-U.S. | U.S. | Non-U.S. | U.S. | Non-U.S. | U.S. | |||||||
| Weighted-average assumptions used to determine periodic benefit cost: |
||||||||||||
| Discount Rate |
2.7%-4.7% | 3.9%-5.1% | 2.5%-4.5% | 3.1%-4.2% | 4.7%-5.0% | 4.3%-4.7% | ||||||
| Expected long-term return on assets |
2.3%-6.0% | 7.8% | 2.3%-5.7% | 7.8% | 3.9%-5.4% | 7.8% | ||||||
| Rate of compensation increase |
3.6%-4.5% | 5.0% | 3.6%-4.1% | 5.0% | 2.3%-4.4% | 5.0% | ||||||
The discount rate used to calculate the net present value of future benefit obligations for our U.S. plan is based on the average of current rates earned on long-term bonds that receive a Moody’s rating of “Aa” or better. We have determined that the timing and amount of expected cash outflows on our plan reasonably match this index. For non-U.S. plans, the discount rates used to calculate the net present value of future benefit obligations are determined by using a yield curve of high quality bond portfolios with an average maturity approximating that of the liabilities.
89
Table of Contents
NOBLE CORPORATION PLC AND SUBSIDIARIES
NOBLE CORPORATION AND SUBSIDIARIES
NOTES TO CONSOLIDATED FINANCIAL STATEMENTS
(Unless otherwise indicated, dollar amounts in tables are in thousands, except per share data)
We employ third-party consultants for our U.S. and non-U.S. plans that use a portfolio return model to assess the initial reasonableness of the expected long-term rate of return on plan assets. To develop the expected long-term rate of return on assets, we considered the current level of expected returns on risk free investments (primarily government bonds), the historical level of risk premium associated with the other asset classes in which the portfolio is invested and the expectations for future returns of each asset class. The expected return for each asset class was then weighted based on the target asset allocation to develop the expected long-term rate of return on assets for the portfolio.
Defined Benefit Plans—Plan Assets
Non-U.S. Plans
Both the NEL and NDNBV pension plans assets and liabilities were transferred to Paragon Offshore as part of the Spin-off.
The NRL pension plan has a targeted asset allocation of 100 percent debt securities. The investment objective for the NRL Plan assets is to earn a favorable return against the Barclays Capital Euro-Treasury AAA index. We evaluate the performance of this plan on an annual basis.
The NDLS pension plan has a target asset allocation of 70 percent equity securities and 30 percent debt securities. The investment objective of the plan, as adopted by the plan’s trustees, is to achieve a favorable return against a benchmark of blended United Kingdom market indices. By achieving this objective, the trustees believe the plan will be able to avoid significant volatility in the contribution rate and provide sufficient plan assets to cover the plan’s benefit obligations were the plan to be liquidated. To achieve these objectives, the trustees have given the plan’s investment managers full discretion in the day-to-day management of the plan’s assets. The plan’s assets are invested with two investment managers. The performance objective communicated to one of these investment managers is to exceed a blend of FTSE A Over 15 Year Gilts index and iBoxx Sterling Non Gilts index by 1.25 percent per annum. The performance objective communicated to the other investment manager is to exceed a blend of FTSE’s All Share index, North America index, Europe index and Pacific Basin index by 1.00 to 2.00 percent per annum. This investment manager is prohibited by the trustees from investing in real estate. The trustees meet with the investment managers periodically to review and discuss their investment performance.
The actual fair values of Non-U.S. pension plans as of December 31, 2014 and 2013 are as follows:
| December 31, 2014 | ||||||||||||||||
| Estimated Fair Value | ||||||||||||||||
| Measurements | ||||||||||||||||
| Quoted | Significant | |||||||||||||||
| Prices in | Other | Significant | ||||||||||||||
| Active | Observable | Unobservable | ||||||||||||||
| Carrying | Markets | Inputs | Inputs | |||||||||||||
| Amount | (Level 1) | (Level 2) | (Level 3) | |||||||||||||
| Cash and cash equivalents |
$ | 87 | $ | 87 | $ | — | $ | — | ||||||||
| Equity securities: |
||||||||||||||||
| International companies |
$ | 53,261 | $ | 53,261 | $ | — | $ | — | ||||||||
| Fixed income securities: |
||||||||||||||||
| Corporate bonds |
$ | 23,774 | $ | — | $ | 23,774 | $ | — | ||||||||
| Other |
592 | — | — | 592 | ||||||||||||
|
|
|
|
|
|
|
|
|
|||||||||
| Total |
$ | 77,714 | $ | 53,348 | $ | 23,774 | $ | 592 | ||||||||
|
|
|
|
|
|
|
|
|
|||||||||
90
Table of Contents
NOBLE CORPORATION PLC AND SUBSIDIARIES
NOBLE CORPORATION AND SUBSIDIARIES
NOTES TO CONSOLIDATED FINANCIAL STATEMENTS
(Unless otherwise indicated, dollar amounts in tables are in thousands, except per share data)
| December 31, 2013 | ||||||||||||||||
| Estimated Fair Value | ||||||||||||||||
| Measurements | ||||||||||||||||
| Quoted | Significant | |||||||||||||||
| Prices in | Other | Significant | ||||||||||||||
| Active | Observable | Unobservable | ||||||||||||||
| Carrying | Markets | Inputs | Inputs | |||||||||||||
| Amount | (Level 1) | (Level 2) | (Level 3) | |||||||||||||
| Cash and cash equivalents |
$ | 207 | $ | 207 | $ | — | $ | — | ||||||||
| Equity securities: |
||||||||||||||||
| International companies |
$ | 54,722 | $ | 54,722 | $ | — | $ | — | ||||||||
| Fixed income securities: |
||||||||||||||||
| Corporate bonds |
$ | 41,767 | $ | — | $ | 41,767 | $ | — | ||||||||
| Other |
77,561 | — | — | 77,561 | ||||||||||||
|
|
|
|
|
|
|
|
|
|||||||||
| Total |
$ | 174,257 | $ | 54,929 | $ | 41,767 | $ | 77,561 | ||||||||
|
|
|
|
|
|
|
|
|
|||||||||
At December 31, 2013, assets of both NEL and NDNBV were invested in instruments that are similar in form to a guaranteed insurance contract, which were transferred to Paragon Offshore in the Spin-off. At December 31, 2014, assets of NRL were invested in instruments that are similar in form to a guaranteed insurance contract. There are no observable market values for these assets (Level 3); however, the amounts listed as plan assets were materially similar to the anticipated benefit obligations that were anticipated under the plans. Amounts were therefore calculated using actuarial assumptions completed by third-party consultants employed by Noble. The following table details the activity related to these investments during the year.
| Market | ||||
| Value | ||||
| Balance as of December 31, 2013 |
$ | 77,561 | ||
| Assets transferred out in Spin-off |
(77,561 | ) | ||
| Assets purchased |
749 | |||
| Assets sold/benefits paid |
(157 | ) | ||
|
|
|
|||
| Balance as of December 31, 2014 |
$ | 592 | ||
|
|
|
|||
U.S. Plans
The Trust invests in equity securities, fixed income debt securities, and cash equivalents and other short-term investments. The Trust may invest in these investments directly or through pooled vehicles, including mutual funds.
The Company’s overall investment strategy, or target range, is to achieve a mix of approximately 66.5 percent in equity securities, 32 percent in debt securities and 1.5 percent in cash holdings. Actual results may deviate from the target range, however any deviation from the target range of asset allocations must be approved by the Trust’s governing committee.
The performance objective of the Trust is to outperform the return of the Total Index Composite as constructed to reflect the target allocation weightings for each asset class. This objective should be met over a market cycle, which is defined as a period not less than three years or more than five years. U.S. equity securities (common stock, convertible preferred stock and convertible bonds) should achieve a total return (after fees) that exceeds the total return of an appropriate market index over a full market cycle of three to five years. Non-U.S. equity securities (common stock, convertible preferred stock and convertible bonds), either from developed or emerging markets, should achieve a total return (after fees) that exceeds the total return of an appropriate market index over a full market cycle of three to five years. Fixed income debt securities should achieve a total return (after fees) that exceeds the total return of an appropriate market index over a full market cycle of three to five years.
91
Table of Contents
NOBLE CORPORATION PLC AND SUBSIDIARIES
NOBLE CORPORATION AND SUBSIDIARIES
NOTES TO CONSOLIDATED FINANCIAL STATEMENTS
(Unless otherwise indicated, dollar amounts in tables are in thousands, except per share data)
Cash equivalent and short-term investments should achieve relative performance better than the 90-day Treasury bills. When mutual funds are used by the Trust, those mutual funds should achieve a total return that equals or exceeds the total return of each fund’s appropriate Lipper or Morningstar peer category over a full market cycle of three to five years. Lipper and Morningstar are independent mutual fund rating and information services.
For investments in equity securities, no individual options or financial futures contracts are purchased unless approved in writing by the Trust’s governing committee. In addition, no private placements or purchases of venture capital are allowed. The target amount in international equities is 20 percent of plan assets and may not exceed 23 percent of plan assets. Of the international equities amount, no more than 30 percent can be related to any particular country. The Trust’s equity managers vote all proxies in the best interest of the Trust without regards to social issues. The Trust’s governing committee reserves the right to comment on and exercise control over the response to any individual proxy solicitation.
For fixed income debt securities, corporate bonds purchased are primarily limited to investment grade securities as established by Moody’s or Standard & Poor’s. The total fixed income exposure from any single non-government or government agency issuer shall not exceed 42 percent of the Trust’s fixed income holdings. The average duration of the total portfolio shall not exceed the Barclays Capital Aggregate Bond Index by 1.5 years. All interest and principal receipts are swept, as received, into an alternative cash management vehicle until reallocated in accordance with the Trust’s core allocation.
For investments in mutual funds, the assets of the Trust are subject to the guidelines and limits imposed by such mutual fund’s prospectus and the other governing documentation at the fund level.
For investments in cash equivalent and short-term investments, the Trust utilizes a money market mutual fund which invests in U.S. government and agency obligations, repurchase agreements collateralized by U.S. government or agency securities, commercial paper, bankers’ acceptances, certificate of deposits, delayed delivery transactions, reverse repurchase agreements, time deposits and Euro obligations. Bankers’ acceptances shall be made in larger banks (ranked by assets) rated “Aa” or better by Moody’s and in conformance with all FDIC regulations concerning capital requirements.
Equity securities include our shares in the amounts $4 million (2.1 percent of total U.S. plan assets) at December 31, 2013. No shares of Noble were included in equity securities at December 31, 2014.
The actual fair values of U.S. pension plan assets as of December 31, 2014 and 2013 are as follows:
| December 31, 2014 | ||||||||||||||||
| Estimated Fair Value | ||||||||||||||||
| Measurements | ||||||||||||||||
| Quoted | Significant | |||||||||||||||
| Prices in | Other | Significant | ||||||||||||||
| Active | Observable | Unobservable | ||||||||||||||
| Carrying | Markets | Inputs | Inputs | |||||||||||||
| Amount | (Level 1) | (Level 2) | (Level 3) | |||||||||||||
| Cash and cash equivalents |
$ | 5,998 | $ | — | $ | 5,998 | $ | — | ||||||||
| Equity securities: |
||||||||||||||||
| United States |
$ | 80,823 | $ | 80,823 | $ | — | $ | — | ||||||||
| International |
33,392 | 33,392 | — | — | ||||||||||||
| Fixed income securities: |
||||||||||||||||
| Corporate bonds |
$ | 51,906 | $ | 51,906 | $ | — | $ | — | ||||||||
|
|
|
|
|
|
|
|
|
|||||||||
| Total |
$ | 172,119 | $ | 166,121 | $ | 5,998 | $ | — | ||||||||
|
|
|
|
|
|
|
|
|
|||||||||
92
Table of Contents
NOBLE CORPORATION PLC AND SUBSIDIARIES
NOBLE CORPORATION AND SUBSIDIARIES
NOTES TO CONSOLIDATED FINANCIAL STATEMENTS
(Unless otherwise indicated, dollar amounts in tables are in thousands, except per share data)
| December 31, 2013 | ||||||||||||||||
| Estimated Fair Value | ||||||||||||||||
| Measurements | ||||||||||||||||
| Quoted | Significant | |||||||||||||||
| Prices in | Other | Significant | ||||||||||||||
| Active | Observable | Unobservable | ||||||||||||||
| Carrying | Markets | Inputs | Inputs | |||||||||||||
| Amount | (Level 1) | (Level 2) | (Level 3) | |||||||||||||
| Cash and cash equivalents |
$ | 2,184 | $ | — | $ | 2,184 | $ | — | ||||||||
| Equity securities: |
||||||||||||||||
| United States |
$ | 104,899 | $ | 80,714 | $ | 24,185 | $ | — | ||||||||
| International |
33,012 | 33,012 | — | — | ||||||||||||
| Fixed income securities: |
||||||||||||||||
| Corporate bonds |
$ | 60,916 | $ | 60,916 | $ | — | $ | — | ||||||||
|
|
|
|
|
|
|
|
|
|||||||||
| Total |
$ | 201,011 | $ | 174,642 | $ | 26,369 | $ | — | ||||||||
|
|
|
|
|
|
|
|
|
|||||||||
While the underlying investments related to the equity securities are traded in active markets, which is a Level 1 measurement, the funds we own the investments through are not themselves actively traded, and therefore are being presented as a Level 2 measurement at December 31, 2013.
As of December 31, 2014, no single security made up more than 10 percent of total assets of either the U.S. or the Non-U.S. plans.
Defined Benefit Plans—Cash Flows
In 2014, we made total contributions of $7 million and $2 million to our non-U.S. and U.S. pension plans, respectively. In 2013, we made total contributions of $9 million and $6 million to our non-U.S. and U.S. pension plans, respectively. In 2012, we made total contributions of $6 million and $11 million to our non-U.S. and U.S. pension plans, respectively. We expect our aggregate minimum contributions to our non-U.S. and U.S. plans in 2015, subject to applicable law, to be $2 million and $3 million, respectively. We continue to monitor and evaluate funding options based upon market conditions and may increase contributions at our discretion.
The following table summarizes our estimated benefit payments at December 31, 2014:
| Payments by Period | ||||||||||||||||||||||||||||
| Total | 2015 | 2016 | 2017 | 2018 | 2019 | Thereafter | ||||||||||||||||||||||
| Estimated benefit payments |
||||||||||||||||||||||||||||
| Non U.S. plans |
$ | 23,037 | $ | 1,630 | $ | 1,693 | $ | 1,882 | $ | 1,955 | $ | 2,207 | $ | 13,670 | ||||||||||||||
| U.S. plans |
105,192 | 8,029 | 6,687 | 7,327 | 7,989 | 8,914 | 66,246 | |||||||||||||||||||||
|
|
|
|
|
|
|
|
|
|
|
|
|
|
|
|||||||||||||||
| Total estimated benefit payments |
$ | 128,229 | $ | 9,659 | $ | 8,380 | $ | 9,209 | $ | 9,944 | $ | 11,121 | $ | 79,916 | ||||||||||||||
|
|
|
|
|
|
|
|
|
|
|
|
|
|
|
|||||||||||||||
Other Benefit Plans
We sponsor a 401(k) Restoration Plan, which is a nonqualified, unfunded employee benefit plan under which specified employees may elect to defer compensation in excess of amounts deferrable under our 401(k) savings plan. The 401(k) Restoration Plan has no assets, and amounts withheld for the 401(k) Restoration Plan are kept by us for general corporate purposes. The investments selected by employees and associated returns are tracked on a phantom basis. Accordingly, we have a liability to the employee for amounts originally withheld plus phantom investment income or less phantom investment losses. We are at risk for phantom investment income and, conversely, benefit should phantom investment losses occur. At December 31, 2014 and 2013, our liability for the 401(k) Restoration Plan was $7 million and $8 million, respectively, and is included in “Accrued payroll and related costs.”
93
Table of Contents
NOBLE CORPORATION PLC AND SUBSIDIARIES
NOBLE CORPORATION AND SUBSIDIARIES
NOTES TO CONSOLIDATED FINANCIAL STATEMENTS
(Unless otherwise indicated, dollar amounts in tables are in thousands, except per share data)
In 2005 we enacted a profit sharing plan, the Noble Drilling Services Inc. Profit Sharing Plan, which covers eligible employees, as defined. Participants in the plan become fully vested in the plan after five years of service, or three years beginning in 2007. Profit sharing contributions are discretionary, require Board of Directors approval and are made in the form of cash. Contributions recorded related to this plan totaled $6 million, $5 million and $4 million in 2014, 2013 and 2012, respectively.
We sponsor a 401(k) savings plan and other retirement, health and welfare plans for the benefit of our employees. The cost of maintaining these plans for continuing operations aggregated approximately $70 million, $80 million and $69 million in 2014, 2013 and 2012, respectively. We do not provide post-retirement benefits (other than pensions) or any post-employment benefits to our employees.
Note 16- Derivative Instruments and Hedging Activities
We periodically enter into derivative instruments to manage our exposure to fluctuations in interest rates and foreign currency exchange rates. We have documented policies and procedures to monitor and control the use of derivative instruments. We do not engage in derivative transactions for speculative or trading purposes, nor are we a party to leveraged derivatives.
For foreign currency forward contracts, hedge effectiveness is evaluated at inception based on the matching of critical terms between derivative contracts and the hedged item. Any change in fair value resulting from ineffectiveness is recognized immediately in earnings.
Cash Flow Hedges
Several of our regional shorebases, including our North Sea and Brazilian operations, have a significant amount of their cash operating expenses payable in local currencies. To limit the potential risk of currency fluctuations, we periodically enter into forward contracts, which settle monthly in the operations’ respective local currencies. All of these contracts have a maturity of less than 12 months. During 2014 and 2013, we entered into forward contracts of approximately $195 million and $128 million, respectively, all of which settled during their respective years. At both December 31, 2014 and 2013, we had no outstanding derivative contracts.
Financial Statement Presentation
To supplement the fair value disclosures in Note 17, the following summarizes the recognized gains and losses of cash flow hedges and non-designated derivatives through AOCL or through “other income” for the years ended December 31, 2014 and 2013:
| Gain/(loss) recognized through AOCL |
Gain reclassified from AOCL to “contract drilling services” expense |
Gain/(loss) recognized through “contract drililng services” expense |
||||||||||||||||||||||
| 2014 | 2013 | 2014 | 2013 | 2014 | 2013 | |||||||||||||||||||
| Cash flow hedges |
||||||||||||||||||||||||
| Foreign currency forward contracts |
$ | 4,286 | $ | 1,200 | $ | (4,286 | ) | $ | (1,200 | ) | $ | — | $ | — | ||||||||||
Note 17- Financial Instruments and Credit Risk
The following tables present the carrying amount and estimated fair value as of December 31, 2014 and 2013 of our financial instruments recognized at fair value on a recurring basis:
| December 31, 2014 | ||||||||||||||||
| Estimated Fair Value Measurements | ||||||||||||||||
| Quoted | Significant | |||||||||||||||
| Prices in | Other | Significant | ||||||||||||||
| Active | Observable | Unobservable | ||||||||||||||
| Carrying | Markets | Inputs | Inputs | |||||||||||||
| Amount | (Level 1) | (Level 2) | (Level 3) | |||||||||||||
| Assets— |
||||||||||||||||
| Marketable securities |
$ | 6,175 | $ | 6,175 | $ | — | $ | — | ||||||||
94
Table of Contents
NOBLE CORPORATION PLC AND SUBSIDIARIES
NOBLE CORPORATION AND SUBSIDIARIES
NOTES TO CONSOLIDATED FINANCIAL STATEMENTS
(Unless otherwise indicated, dollar amounts in tables are in thousands, except per share data)
| December 31, 2013 | ||||||||||||||||
| Estimated Fair Value Measurements | ||||||||||||||||
| Quoted | Significant | |||||||||||||||
| Prices in | Other | Significant | ||||||||||||||
| Active | Observable | Unobservable | ||||||||||||||
| Carrying | Markets | Inputs | Inputs | |||||||||||||
| Amount | (Level 1) | (Level 2) | (Level 3) | |||||||||||||
| Assets— |
||||||||||||||||
| Marketable securities |
$ | 7,230 | $ | 7,230 | $ | — | $ | — | ||||||||
The foreign currency forward contracts have been valued using actively quoted prices and quotes obtained from the counterparties to the contracts. Our cash and cash equivalents, accounts receivable and accounts payable are by their nature short-term. As a result, the carrying values included in the accompanying Consolidated Balance Sheets approximate fair value.
Concentration of Credit Risk
The market for our services is the offshore oil and gas industry, and our customers consist primarily of major integrated oil companies, government-owned oil companies and independent oil and gas producers. We perform ongoing credit evaluations of our customers and do not require material collateral. We maintain reserves for potential credit losses when necessary. Our results of operations and financial condition should be considered in light of the fluctuations in demand experienced by drilling contractors as changes in oil and gas producers’ expenditures and budgets occur. These fluctuations can impact our results of operations and financial condition as supply and demand factors directly affect utilization and dayrates, which are the primary determinants of our net cash provided by operating activities.
Revenues from Shell and its affiliates accounted for approximately 55 percent, 67 percent and 51 percent of our consolidated operating revenues in 2014, 2013 and 2012, respectively. Revenues from Saudi Arabian Oil Company (“Saudi Aramco”) accounted for approximately 10 percent of our consolidated operating revenues in both 2013 and 2012. Saudi Aramco did not account for more than 10 percent of our consolidated operating revenues in 2014. Revenues from Petróleo Brasileiro S.A. (“Petrobras”) accounted for approximately 11 percent of our consolidated operating revenues in 2012. Petrobras did not account for more than 10 percent of our consolidated operating revenues in either 2014 or 2013. No other customer accounted for more than 10 percent of our consolidated operating revenues in 2014, 2013 or 2012.
Note 18- Commitments and Contingencies
The Noble Homer Ferrington was under contract with a subsidiary of ExxonMobil Corporation (“ExxonMobil”), which entered into an assignment agreement with British Petroleum plc (“BP”) for a two-well farmout of the rig in Libya after successfully drilling two wells with the rig for ExxonMobil. In August 2010, BP attempted to terminate the assignment agreement claiming that the rig was not in the required condition, and ExxonMobil informed us that we must look to BP for payment of the dayrate during the assignment period. In August 2010, we initiated arbitration proceedings under the drilling contract against both BP and ExxonMobil. We do not believe BP had the right to terminate the assignment agreement and believe the rig was ready to operate under the drilling contract. The rig operated under farmout arrangements from March 2011 to the conclusion of the contract in the second quarter of 2012. We believe we are owed dayrate by either or both of these clients. The operating dayrate was approximately $538,000 per day for the work in Libya. The arbitration process is proceeding, and we intend to vigorously pursue these claims. As a result of the uncertainties noted above, we have not recognized any revenue during the assignment period and the matter could have a material positive effect on our results of operations or cash flows in the period the matter is resolved should the arbitration panel ultimately rule in our favor.
In November 2012, the U.S. Coast Guard in Alaska conducted an inspection of our drillship, the Noble Discoverer, and cited a number of deficiencies to be remediated, including issues relating to the main propulsion and safety management system. We initiated a comprehensive effort to address the deficiencies identified by the Coast Guard and worked with the agency to keep it apprised of our progress. We also conducted an internal investigation in conjunction with the Coast Guard inspection, and the Coast Guard conducted its own investigation. We reported
95
Table of Contents
NOBLE CORPORATION PLC AND SUBSIDIARIES
NOBLE CORPORATION AND SUBSIDIARIES
NOTES TO CONSOLIDATED FINANCIAL STATEMENTS
(Unless otherwise indicated, dollar amounts in tables are in thousands, except per share data)
certain potential violations of applicable law to the Coast Guard identified as a result of our internal investigation. These related to what we believe were certain unauthorized disposals of collected deck and sea water from the Noble Discoverer, collected, treated deck water from the Kulluk and potential record-keeping issues with the oil record books for the Noble Discoverer and Kulluk and other matters. The Coast Guard referred the Noble Discoverer and Kulluk matters to the U.S. Department of Justice (“DOJ”) for further investigation. In December 2014, one of our subsidiaries reached a settlement with the DOJ regarding its investigation of the Noble Discoverer and the Kulluk. Under the terms of the agreement, the subsidiary pled guilty to oil record book, ballast record and required hazardous condition reporting violations with respect to the Noble Discoverer and an oil record book violation with respect to the Kulluk. The subsidiary paid $8.2 million in fines and $4 million in community service payments, and was placed on probation for four years, provided that we may petition the court for early dismissal of probation after three years. If during the term of probation, the subsidiary fails to adhere to the terms of the plea agreement, the DOJ may withdraw from the plea agreement and would be free to prosecute the subsidiary on all charges arising out of its investigation, including any charges dismissed pursuant to the terms of the plea agreement, as well as potentially other charges. We also implemented a comprehensive environmental compliance plan.
We are from time to time a party to various lawsuits that are incidental to our operations in which the claimants seek an unspecified amount of monetary damages for personal injury, including injuries purportedly resulting from exposure to asbestos on drilling rigs and associated facilities. At December 31, 2014, there were 42 asbestos related lawsuits in which we are one of many defendants. These lawsuits have been filed in the United States in the states of Illinois, Louisiana, Mississippi and Texas. We intend to vigorously defend against the litigation. We do not believe the ultimate resolution of these matters will have a material adverse effect on our financial position, results of operations or cash flows.
We are a defendant in certain claims and litigation arising out of operations in the ordinary course of business, the resolution of which, in the opinion of management, will not be material to our financial position, results of operations or cash flows. There is inherent risk in any litigation or dispute and no assurance can be given as to the outcome of these claims.
We operate in a number of countries throughout the world and our tax returns filed in those jurisdictions are subject to review and examination by tax authorities within those jurisdictions. During 2013, the IRS completed its examination of our tax reporting for the taxable year ended December 31, 2008 and concluded that we were entitled to a refund. The congressional Joint Committee on Taxation took no exception to the conclusions reached by the IRS, and the refund, plus interest, was received in March 2014. The IRS also completed its examination of our tax reporting for the taxable year ended December 31, 2009, and informed us that it made no changes to our reported tax. During the first quarter of 2014, the IRS began its examination of our tax reporting for the taxable years ended December 31, 2010 and 2011. We believe that we have accurately reported all amounts in our 2010 and 2011 tax returns. We believe the ultimate resolution of the outstanding assessments, for which we have not made any accrual, will not have a material adverse effect on our consolidated financial statements. We recognize uncertain tax positions that we believe have a greater than 50 percent likelihood of being sustained. We cannot predict or provide assurance as to the ultimate outcome of any existing or future assessments.
Audit claims of approximately $66 million attributable to income, customs and other business taxes have been assessed against us. We have received tax assessments of approximately $141 million related to Paragon Offshore assets that operated through Noble-retained entities in Mexico, and Paragon Offshore has received tax assessments of approximately $165 million for Noble assets that operated through a Paragon Offshore-retained entity in Brazil. Of these tax assessments in Mexico and Brazil, approximately $20 million and $46 million, respectively, relate to Noble’s share of the tax liability. Under the TSA, Paragon Offshore has an obligation to indemnify us for all assessed amounts that are related to Paragon Offshore’s Mexico assets, approximately $121 million, and we have an obligation to indemnify Paragon Offshore for all assessed amounts that are related to Noble’s Brazil assets, approximately $46 million, in each case, if and when such payments become due. We have contested, or intend to contest, these assessments, including through litigation if necessary, and we believe the ultimate resolution, for which we have not made any accrual, will not have a material adverse effect on our consolidated financial statements. Tax authorities may issue additional assessments or pursue legal actions as a result of tax audits and we cannot predict or provide assurance as to the ultimate outcome of such assessments and legal actions.
96
Table of Contents
NOBLE CORPORATION PLC AND SUBSIDIARIES
NOBLE CORPORATION AND SUBSIDIARIES
NOTES TO CONSOLIDATED FINANCIAL STATEMENTS
(Unless otherwise indicated, dollar amounts in tables are in thousands, except per share data)
On January 23, 2015, Noble received an official notification of a ruling from the Second Chamber of the Supreme Court in Mexico. The ruling settled an ongoing dispute in Mexico relating to the classification of a Noble subsidiary’s business activity and the applicable rate of depreciation under the Mexican law. The ruling did not result in any additional tax liability to Noble. Additionally, the ruling does not constitute mandatory jurisprudence in Mexico, and thus is only applicable to the Noble subsidiary named in the ruling. We will continue to contest future assessments received. Any claim by the tax authorities relating to this issue is subject to a full indemnification from Paragon Offshore under the TSA.
We have been notified by Petrobras that it is currently challenging assessments by Brazilian tax authorities of withholding taxes associated with the provision of drilling rigs for its operations in Brazil during 2008 and 2009. Petrobras has also notified us that if Petrobras must ultimately pay such withholding taxes, it will seek reimbursement from us for the portion allocable to our drilling rigs. The amount of withholding tax that Petrobras indicates may be allocable to Noble drilling rigs is R$79 million (approximately $30 million). We believe that our contract with Petrobras requires Petrobras to indemnify us for these withholding taxes. We will, if necessary, vigorously defend our rights.
We maintain certain insurance coverage against specified marine perils, which includes physical damage and loss of hire. Damage caused by hurricanes has negatively impacted certain aspects of the energy insurance market, resulting in more restrictive and expensive coverage for U.S. named windstorm perils. Accordingly, we have elected to significantly reduce the named windstorm insurance on our rigs operating in the U.S. Gulf of Mexico. Presently, we insure the Noble Jim Thompson, Noble Amos Runner and Noble Driller for “total loss only” when caused by a named windstorm. For the Noble Bully I, our customer assumes the risk of loss due to a named windstorm event, pursuant to the terms of the drilling contract, through the purchase of insurance coverage (provided that we are responsible for any deductible under such policy) or, at its option, the assumption of the risk of loss up to the insured value in lieu of the purchase of such insurance. The remaining rigs in the U.S. Gulf of Mexico are self-insured for named windstorm perils. In addition, we maintain a physical damage deductible on our rigs of $25 million per occurrence. The loss of hire coverage applies only to our rigs operating under contract with a dayrate equal to or greater than $200,000 a day and is subject to a 45-day waiting period for each unit and each occurrence.
Although we maintain insurance in the geographic areas in which we operate, pollution, reservoir damage and environmental risks generally are not fully insurable. Our insurance policies and contractual rights to indemnity may not adequately cover our losses or may have exclusions of coverage for some losses. We do not have insurance coverage or rights to indemnity for all risks, including loss of hire insurance on most of the rigs in our fleet. Uninsured exposures may include expatriate activities prohibited by U.S. laws and regulations, radiation hazards, certain loss or damage to property on board our rigs and losses relating to shorebased terrorist acts or strikes. If a significant accident or other event occurs and is not fully covered by insurance or contractual indemnity, it could materially adversely affect our financial position, results of operations or cash flows. Additionally, there can be no assurance that those parties with contractual obligations to indemnify us will necessarily be financially able to indemnify us against all these risks.
We carry protection and indemnity insurance covering marine third party liability exposures, which also includes coverage for employer’s liability resulting from personal injury to our offshore drilling crews. Our protection and indemnity policy currently has a standard deductible of $10 million per occurrence, with maximum liability coverage of $750 million.
In connection with our capital expenditure program, we had outstanding commitments, including shipyard and purchase commitments of approximately $729 million at December 31, 2014.
We have entered into agreements with certain of our executive officers, as well as certain other employees. These agreements become effective upon a change of control of Noble-UK (within the meaning set forth in the agreements) or a termination of employment in connection with or in anticipation of a change of control, and remain effective for three years thereafter. These agreements provide for compensation and certain other benefits under such circumstances.
Note 19- Segment and Related Information
We report our contract drilling operations as a single reportable segment, Contract Drilling Services, which reflects how we manage our business, and the fact that all of our drilling fleet is dependent upon the worldwide oil industry. The mobile offshore drilling units comprising our offshore rig fleet operate in a single, global market for
97
Table of Contents
NOBLE CORPORATION PLC AND SUBSIDIARIES
NOBLE CORPORATION AND SUBSIDIARIES
NOTES TO CONSOLIDATED FINANCIAL STATEMENTS
(Unless otherwise indicated, dollar amounts in tables are in thousands, except per share data)
contract drilling services and are often redeployed globally due to changing demands of our customers, which consist largely of major non-U.S. and government owned/controlled oil and gas companies throughout the world. As of December 31, 2014, our contract drilling services segment conducts contract drilling operations in the United States, Brazil, Argentina, the North Sea, the Mediterranean, the Middle East, Asia and Australia.
We evaluate the performance of our operating segment based on revenues from external customers and segment profit. Summarized financial information of our reportable segment for continuing operations for the years ended December 31, 2014, 2013 and 2012 is shown in the following tables. The “Other” column includes results of labor contract drilling services in Alaska for 2013 and 2012, as well as corporate related items for all periods. The consolidated financial statements of Noble-UK include the accounts of Noble-Cayman, and Noble-UK conducts substantially all of its business through Noble-Cayman and its subsidiaries. As a result, the summarized financial information for Noble-Cayman is substantially the same as Noble-UK.
| Contract | ||||||||||||
| Drilling | ||||||||||||
| Services | Other | Total | ||||||||||
| 2014 |
||||||||||||
| Revenues from external customers |
$ | 3,230,253 | $ | 2,251 | $ | 3,232,504 | ||||||
| Depreciation and amortization |
608,590 | 18,883 | 627,473 | |||||||||
| Segment operating income (loss) |
204,365 | (18,423 | ) | 185,942 | ||||||||
| Interest expense, net of amount capitalized |
(164 | ) | (155,015 | ) | (155,179 | ) | ||||||
| Income tax (provision) benefit |
(130,654 | ) | 24,003 | (106,651 | ) | |||||||
| Segment profit (loss) |
216,659 | (208,168 | ) | 8,491 | ||||||||
| Total assets (at end of period) |
13,019,089 | 267,733 | 13,286,822 | |||||||||
| 2013 |
||||||||||||
| Revenues from external customers |
$ | 2,520,064 | $ | 18,079 | $ | 2,538,143 | ||||||
| Depreciation and amortization |
497,303 | 14,210 | 511,513 | |||||||||
| Segment operating income (loss) |
750,181 | (9,644 | ) | 740,537 | ||||||||
| Interest expense, net of amount capitalized |
(694 | ) | (105,606 | ) | (106,300 | ) | ||||||
| Income tax provision |
(90,468 | ) | (1,649 | ) | (92,117 | ) | ||||||
| Segment profit (loss) |
874,816 | (92,119 | ) | 782,697 | ||||||||
| Total assets (at end of period) |
15,495,071 | 722,886 | 16,217,957 | |||||||||
| 2012 |
||||||||||||
| Revenues from external customers |
$ | 2,154,980 | $ | 45,719 | $ | 2,200,699 | ||||||
| Depreciation and amortization |
427,234 | 13,072 | 440,306 | |||||||||
| Segment operating income (loss) |
626,012 | (448 | ) | 625,564 | ||||||||
| Interest expense, net of amount capitalized |
(394 | ) | (85,369 | ) | (85,763 | ) | ||||||
| Income tax (provision) benefit |
(110,373 | ) | 15,190 | (95,183 | ) | |||||||
| Segment profit (loss) |
645,560 | (123,216 | ) | 522,344 | ||||||||
98
Table of Contents
NOBLE CORPORATION PLC AND SUBSIDIARIES
NOBLE CORPORATION AND SUBSIDIARIES
NOTES TO CONSOLIDATED FINANCIAL STATEMENTS
(Unless otherwise indicated, dollar amounts in tables are in thousands, except per share data)
The following table presents revenues and identifiable assets by country based on the location of the service provided:
| Revenues | Identifiable Assets | |||||||||||||||||||
| Year Ended December 31, | As of December 31, | |||||||||||||||||||
| 2014 | 2013 | 2012 | 2014 | 2013 (3) | ||||||||||||||||
| United States |
$ | 1,639,509 | $ | 1,338,634 | $ | 1,061,254 | $ | 6,739,636 | $ | 5,525,839 | ||||||||||
| Argentina |
97,743 | — | — | 304,131 | — | |||||||||||||||
| Australia |
146,474 | 133,214 | 42,353 | 541,655 | 624,238 | |||||||||||||||
| Benin |
66,077 | 41,251 | — | — | 803,788 | |||||||||||||||
| Brazil |
447,266 | 527,706 | 430,737 | 799,599 | 3,921,306 | |||||||||||||||
| Denmark |
28,980 | — | — | 272,788 | — | |||||||||||||||
| Egypt |
19,961 | 33,685 | 103,380 | — | — | |||||||||||||||
| Malaysia |
11,126 | — | — | 1,144,498 | 23,002 | |||||||||||||||
| Malta |
15,495 | 7,453 | 35,776 | — | 454,951 | |||||||||||||||
| Mexico |
127 | 14,529 | 40,218 | 35,994 | 439,098 | |||||||||||||||
| Morocco |
69,056 | — | — | — | — | |||||||||||||||
| New Zealand |
56,911 | 11,995 | 9,563 | — | 663,165 | |||||||||||||||
| Saudi Arabia |
260,544 | 246,083 | 220,657 | 479,525 | 584,230 | |||||||||||||||
| Singapore (1) |
— | — | — | 982,731 | 618,341 | |||||||||||||||
| South Korea (1) |
— | — | — | — | 894,347 | |||||||||||||||
| Switzerland (2) |
— | — | — | 27,645 | 32,162 | |||||||||||||||
| The Netherlands |
82,026 | — | — | 249,074 | 339,560 | |||||||||||||||
| Turkey |
13,960 | — | — | 740,362 | — | |||||||||||||||
| United Arab Emirates |
108,044 | 71,896 | 59,321 | 331,812 | 443,166 | |||||||||||||||
| United Kingdom |
84,078 | 87,908 | 66,232 | 248,835 | 400,989 | |||||||||||||||
| Other |
85,127 | 23,789 | 131,208 | 388,537 | 449,775 | |||||||||||||||
|
|
|
|
|
|
|
|
|
|
|
|||||||||||
| Total |
$ | 3,232,504 | $ | 2,538,143 | $ | 2,200,699 | $ | 13,286,822 | $ | 16,217,957 | ||||||||||
|
|
|
|
|
|
|
|
|
|
|
|||||||||||
| (1) | Singapore and South Korea consist primarily of asset values for newbuild rigs under construction in shipyards. |
| (2) | Switzerland assets consist of general corporate assets, which generate no external revenue for the Company. |
| (3) | Amounts in 2013 include identifiable assets that were ultimately transferred to Paragon Offshore as part of the Spin-off. |
Note 20- Supplemental Cash Flow Information (Noble-UK)
The net effect of changes in other assets and liabilities on cash flows from operating activities is as follows. Amounts for 2014 are shown net of Paragon Offshore, which was distributed to shareholders in a non-cash transaction.
| December 31, | ||||||||||||
| 2014 | 2013 | 2012 | ||||||||||
| Accounts receivable |
$ | 29,730 | $ | (165,233 | ) | $ | (143,010 | ) | ||||
| Other current assets |
(3,201 | ) | (47,848 | ) | (43,246 | ) | ||||||
| Other assets |
(96,941 | ) | 34,757 | (385 | ) | |||||||
| Accounts payable |
63,546 | 50,731 | 28,565 | |||||||||
| Other current liabilities |
(28,644 | ) | 61,644 | 108,385 | ||||||||
| Other liabilities |
86,037 | 2,731 | 80,431 | |||||||||
|
|
|
|
|
|
|
|||||||
| $ | 50,527 | $ | (63,218 | ) | $ | 30,740 | ||||||
|
|
|
|
|
|
|
|||||||
99
Table of Contents
NOBLE CORPORATION PLC AND SUBSIDIARIES
NOBLE CORPORATION AND SUBSIDIARIES
NOTES TO CONSOLIDATED FINANCIAL STATEMENTS
(Unless otherwise indicated, dollar amounts in tables are in thousands, except per share data)
Additional cash flow information is as follows:
| Year Ended December 31, | ||||||||||||
| 2014 | 2013 | 2012 | ||||||||||
| Cash paid during the period for: |
||||||||||||
| Interest, net of amounts capitalized |
$ | 159,835 | $ | 81,897 | $ | 56,144 | ||||||
| Income taxes (net of refunds) |
$ | 132,527 | $ | 219,088 | $ | 148,612 | ||||||
| Non-cash activities during the period: |
||||||||||||
| Spin-off of Paragon Offshore |
$ | 1,409,400 | N/A | N/A | ||||||||
Note 21- Supplemental Cash Flow Information (Noble-Cayman)
The net effect of changes in other assets and liabilities on cash flows from operating activities is as follows. Amounts for 2014 are shown net of Paragon Offshore, which was distributed to shareholders in a non-cash transaction.
| December 31, | ||||||||||||
| 2014 | 2013 | 2012 | ||||||||||
| Accounts receivable |
$ | 29,730 | $ | (165,233 | ) | $ | (143,010 | ) | ||||
| Other current assets |
(12,670 | ) | (48,186 | ) | (44,632 | ) | ||||||
| Other assets |
(96,925 | ) | 35,103 | (385 | ) | |||||||
| Accounts payable |
60,488 | 49,980 | 28,289 | |||||||||
| Other current liabilities |
(21,921 | ) | 62,516 | 108,425 | ||||||||
| Other liabilities |
86,038 | 2,728 | 80,432 | |||||||||
|
|
|
|
|
|
|
|||||||
| $ | 44,740 | $ | (63,092 | ) | $ | 29,119 | ||||||
|
|
|
|
|
|
|
|||||||
Additional cash flow information is as follows:
| Year Ended December 31, | ||||||||||||
| 2014 | 2013 | 2012 | ||||||||||
| Cash paid during the period for: |
||||||||||||
| Interest, net of amounts capitalized |
$ | 159,835 | $ | 81,897 | $ | 56,144 | ||||||
| Income taxes (net of refunds) |
$ | 130,356 | $ | 216,391 | $ | 148,612 | ||||||
| Non-cash activities during the period: |
||||||||||||
| Spin-off of Paragon Offshore |
$ | 1,409,400 | N/A | N/A | ||||||||
Note 22- Information about Noble-Cayman
Guarantees of Registered Securities
In May 2014, as part of the separation of Paragon Offshore, NHC assumed all of the obligations of Noble Drilling Corporation (“NDC”) under the Senior Notes due 2019, and NDC was released from all obligations under the Senior Notes due 2019. As such, we removed NDC from the guarantor financial statements and NHC is no longer combined with Noble Drilling Holding, LLC (“NDH”), as they are now issuers and guarantors on separate debt instruments. We have recast prior periods presented to conform to the guarantor structure as it existed at December 31, 2014.
100
Table of Contents
NOBLE CORPORATION PLC AND SUBSIDIARIES
NOBLE CORPORATION AND SUBSIDIARIES
NOTES TO CONSOLIDATED FINANCIAL STATEMENTS
(Unless otherwise indicated, dollar amounts in tables are in thousands, except per share data)
Noble-Cayman, or one or more wholly-owned subsidiaries of Noble-Cayman, are a co-issuer or full and unconditional guarantor or otherwise obligated as of December 31, 2014 as follows:
| Issuer | ||||
| Notes |
(Co-Issuer(s)) |
Guarantor(s) | ||
| $350 million 3.45% Senior Notes due 2015 | NHIL | Noble-Cayman | ||
| $300 million 3.05% Senior Notes due 2016 | NHIL | Noble-Cayman | ||
| $300 million 2.50% Senior Notes due 2017 | NHIL | Noble-Cayman | ||
| $202 million 7.50% Senior Notes due 2019 | NHC | Noble-Cayman; | ||
| NDH | ||||
| Noble Drilling Services 6 LLC (“NDS6”) | ||||
| $500 million 4.90% Senior Notes due 2020 | NHIL | Noble-Cayman | ||
| $400 million 4.625% Senior Notes due 2021 | NHIL | Noble-Cayman | ||
| $400 million 3.95% Senior Notes due 2022 | NHIL | Noble-Cayman | ||
| $400 million 6.20% Senior Notes due 2040 | NHIL | Noble-Cayman | ||
| $400 million 6.05% Senior Notes due 2041 | NHIL | Noble-Cayman | ||
| $500 million 5.25% Senior Notes due 2042 | NHIL | Noble-Cayman |
The following consolidating financial statements of Noble-Cayman, NHC, NDH, NHIL, NDS6 and all other subsidiaries present investments in both consolidated and unconsolidated affiliates using the equity method of accounting.
101
Table of Contents
NOBLE CORPORATION AND SUBSIDIARIES
CONDENSED CONSOLIDATING BALANCE SHEET
December 31, 2014
(in thousands)
| Other | ||||||||||||||||||||||||||||||||
| Non-guarantor | ||||||||||||||||||||||||||||||||
| Noble- | Subsidiaries | Consolidating | ||||||||||||||||||||||||||||||
| Cayman | NHC | NDH | NHIL | NDS6 | of Noble | Adjustments | Total | |||||||||||||||||||||||||
| ASSETS |
||||||||||||||||||||||||||||||||
| Current assets |
||||||||||||||||||||||||||||||||
| Cash and cash equivalents |
$ | 5 | $ | — | $ | 254 | $ | — | $ | — | $ | 65,521 | $ | — | $ | 65,780 | ||||||||||||||||
| Accounts receivable |
— | — | 37,655 | 2,336 | — | 529,105 | — | 569,096 | ||||||||||||||||||||||||
| Taxes receivable |
— | 63,373 | 752 | — | — | 43,164 | — | 107,289 | ||||||||||||||||||||||||
| Short-term notes receivable from affiliates |
123,449 | — | 1,077,965 | — | 333,966 | 171,925 | (1,707,305 | ) | — | |||||||||||||||||||||||
| Accounts receivable from affiliates |
2,019,319 | 374,012 | 192,771 | 157,164 | 125,834 | 4,191,406 | (7,060,506 | ) | — | |||||||||||||||||||||||
| Prepaid expenses and other current assets |
14,274 | — | 1,764 | — | — | 123,631 | — | 139,669 | ||||||||||||||||||||||||
|
|
|
|
|
|
|
|
|
|
|
|
|
|
|
|
|
|||||||||||||||||
| Total current assets |
2,157,047 | 437,385 | 1,311,161 | 159,500 | 459,800 | 5,124,752 | (8,767,811 | ) | 881,834 | |||||||||||||||||||||||
|
|
|
|
|
|
|
|
|
|
|
|
|
|
|
|
|
|||||||||||||||||
| Property and equipment, at cost |
— | — | 2,040,168 | — | — | 12,364,203 | — | 14,404,371 | ||||||||||||||||||||||||
| Accumulated depreciation |
— | — | (278,147 | ) | — | — | (2,040,073 | ) | — | (2,318,220 | ) | |||||||||||||||||||||
|
|
|
|
|
|
|
|
|
|
|
|
|
|
|
|
|
|||||||||||||||||
| Property and equipment, net |
— | — | 1,762,021 | — | — | 10,324,130 | — | 12,086,151 | ||||||||||||||||||||||||
|
|
|
|
|
|
|
|
|
|
|
|
|
|
|
|
|
|||||||||||||||||
| Notes receivable from affiliates |
3,304,654 | — | 236,921 | 1,980,391 | 5,000 | 1,581,429 | (7,108,395 | ) | — | |||||||||||||||||||||||
| Investments in affiliates |
4,567,335 | 1,318,239 | 2,921,452 | 8,266,444 | 6,290,918 | — | (23,364,388 | ) | — | |||||||||||||||||||||||
| Other assets |
2,908 | — | 6,212 | 19,826 | 517 | 192,791 | — | 222,254 | ||||||||||||||||||||||||
|
|
|
|
|
|
|
|
|
|
|
|
|
|
|
|
|
|||||||||||||||||
| Total assets |
$ | 10,031,944 | $ | 1,755,624 | $ | 6,237,767 | $ | 10,426,161 | $ | 6,756,235 | $ | 17,223,102 | $ | (39,240,594 | ) | $ | 13,190,239 | |||||||||||||||
|
|
|
|
|
|
|
|
|
|
|
|
|
|
|
|
|
|||||||||||||||||
| LIABILITIES AND EQUITY |
||||||||||||||||||||||||||||||||
| Current liabilities |
||||||||||||||||||||||||||||||||
| Short-term notes payables from affiliates |
$ | — | $ | 171,925 | $ | — | $ | — | $ | 371,720 | $ | 1,163,660 | $ | (1,707,305 | ) | $ | — | |||||||||||||||
| Accounts payable |
600 | — | 10,130 | — | — | 250,282 | — | 261,012 | ||||||||||||||||||||||||
| Accrued payroll and related costs |
— | — | 7,738 | — | — | 83,749 | — | 91,487 | ||||||||||||||||||||||||
| Accounts payable to affiliates |
606,224 | 63,602 | 3,513,705 | 61,982 | 16,869 | 2,798,124 | (7,060,506 | ) | — | |||||||||||||||||||||||
| Taxes payable |
— | — | — | — | — | 91,471 | — | 91,471 | ||||||||||||||||||||||||
| Other current liabilities |
16,150 | — | 13,409 | 57,053 | 4,412 | 110,890 | — | 201,914 | ||||||||||||||||||||||||
|
|
|
|
|
|
|
|
|
|
|
|
|
|
|
|
|
|||||||||||||||||
| Total current liabilities |
622,974 | 235,527 | 3,544,982 | 119,035 | 393,001 | 4,498,176 | (8,767,811 | ) | 645,884 | |||||||||||||||||||||||
|
|
|
|
|
|
|
|
|
|
|
|
|
|
|
|
|
|||||||||||||||||
| Long-term debt |
1,123,495 | — | — | 3,543,830 | 201,695 | — | — | 4,869,020 | ||||||||||||||||||||||||
| Notes payable to affiliates |
1,769,068 | — | 598,715 | 1,169,180 | 192,216 | 3,379,216 | (7,108,395 | ) | — | |||||||||||||||||||||||
| Deferred income taxes |
— | — | — | — | — | 120,589 | — | 120,589 | ||||||||||||||||||||||||
| Other liabilities |
19,929 | — | 29,093 | — | — | 286,942 | — | 335,964 | ||||||||||||||||||||||||
|
|
|
|
|
|
|
|
|
|
|
|
|
|
|
|
|
|||||||||||||||||
| Total liabilities |
3,535,466 | 235,527 | 4,172,790 | 4,832,045 | 786,912 | 8,284,923 | (15,876,206 | ) | 5,971,457 | |||||||||||||||||||||||
|
|
|
|
|
|
|
|
|
|
|
|
|
|
|
|
|
|||||||||||||||||
| Commitments and contingencies |
||||||||||||||||||||||||||||||||
| Total shareholder equity |
6,496,478 | 1,520,097 | 2,064,977 | 5,594,116 | 5,969,323 | 7,812,656 | (22,961,169 | ) | 6,496,478 | |||||||||||||||||||||||
| Noncontrolling interests |
— | — | — | — | — | 1,125,523 | (403,219 | ) | 722,304 | |||||||||||||||||||||||
|
|
|
|
|
|
|
|
|
|
|
|
|
|
|
|
|
|||||||||||||||||
| Total equity |
6,496,478 | 1,520,097 | 2,064,977 | 5,594,116 | 5,969,323 | 8,938,179 | (23,364,388 | ) | 7,218,782 | |||||||||||||||||||||||
|
|
|
|
|
|
|
|
|
|
|
|
|
|
|
|
|
|||||||||||||||||
| Total liabilities and equity |
$ | 10,031,944 | $ | 1,755,624 | $ | 6,237,767 | $ | 10,426,161 | $ | 6,756,235 | $ | 17,223,102 | $ | (39,240,594 | ) | $ | 13,190,239 | |||||||||||||||
|
|
|
|
|
|
|
|
|
|
|
|
|
|
|
|
|
|||||||||||||||||
102
Table of Contents
NOBLE CORPORATION AND SUBSIDIARIES
CONDENSED CONSOLIDATING BALANCE SHEET
December 31, 2013
(in thousands)
| Other | ||||||||||||||||||||||||||||||||
| Non-guarantor | ||||||||||||||||||||||||||||||||
| Noble- | Subsidiaries | Consolidating | ||||||||||||||||||||||||||||||
| Cayman | NHC | NDH | NHIL | NDS6 | of Noble | Adjustments | Total | |||||||||||||||||||||||||
| ASSETS |
||||||||||||||||||||||||||||||||
| Current assets |
||||||||||||||||||||||||||||||||
| Cash and cash equivalents |
$ | 1 | $ | — | $ | 402 | $ | 4 | $ | — | $ | 109,975 | $ | — | $ | 110,382 | ||||||||||||||||
| Accounts receivable |
— | — | 34,038 | — | — | 915,031 | — | 949,069 | ||||||||||||||||||||||||
| Taxes receivable |
— | 52,307 | — | — | — | 87,722 | — | 140,029 | ||||||||||||||||||||||||
| Short-term notes receivable from affiliates |
— | — | 1,456,245 | 139,195 | 19,500 | 52,611 | (1,667,551 | ) | — | |||||||||||||||||||||||
| Accounts receivable from affiliates |
1,244,019 | — | 108,208 | 210,868 | 27,537 | 6,010,430 | (7,601,062 | ) | — | |||||||||||||||||||||||
| Prepaid expenses and other current assets |
— | — | 6,336 | — | — | 178,012 | — | 184,348 | ||||||||||||||||||||||||
|
|
|
|
|
|
|
|
|
|
|
|
|
|
|
|
|
|||||||||||||||||
| Total current assets |
1,244,020 | 52,307 | 1,605,229 | 350,067 | 47,037 | 7,353,781 | (9,268,613 | ) | 1,383,828 | |||||||||||||||||||||||
|
|
|
|
|
|
|
|
|
|
|
|
|
|
|
|
|
|||||||||||||||||
| Property and equipment, at cost |
— | — | 2,340,216 | — | — | 16,820,134 | — | 19,160,350 | ||||||||||||||||||||||||
| Accumulated depreciation |
— | — | (310,171 | ) | — | — | (4,321,507 | ) | — | (4,631,678 | ) | |||||||||||||||||||||
|
|
|
|
|
|
|
|
|
|
|
|
|
|
|
|
|
|||||||||||||||||
| Property and equipment, net |
— | — | 2,030,045 | — | — | 12,498,627 | — | 14,528,672 | ||||||||||||||||||||||||
|
|
|
|
|
|
|
|
|
|
|
|
|
|
|
|
|
|||||||||||||||||
| Notes receivable from affiliates |
3,304,753 | — | 124,216 | 2,367,555 | 5,000 | 1,390,500 | (7,192,024 | ) | — | |||||||||||||||||||||||
| Investments in affiliates |
8,601,712 | 2,907,379 | 6,595,591 | 9,456,735 | 5,440,004 | — | (33,001,421 | ) | — | |||||||||||||||||||||||
| Other assets |
6,256 | — | 6,332 | 22,681 | 639 | 233,106 | — | 269,014 | ||||||||||||||||||||||||
|
|
|
|
|
|
|
|
|
|
|
|
|
|
|
|
|
|||||||||||||||||
| Total assets |
$ | 13,156,741 | $ | 2,959,686 | $ | 10,361,413 | $ | 12,197,038 | $ | 5,492,680 | $ | 21,476,014 | $ | (49,462,058 | ) | $ | 16,181,514 | |||||||||||||||
|
|
|
|
|
|
|
|
|
|
|
|
|
|
|
|
|
|||||||||||||||||
| LIABILITIES AND EQUITY |
||||||||||||||||||||||||||||||||
| Current liabilities |
||||||||||||||||||||||||||||||||
| Short-term notes payables from affiliates |
$ | — | $ | 52,611 | $ | 139,195 | $ | — | $ | 750,000 | $ | 725,745 | $ | (1,667,551 | ) | $ | — | |||||||||||||||
| Accounts payable |
— | — | 5,310 | — | — | 340,600 | — | 345,910 | ||||||||||||||||||||||||
| Accrued payroll and related costs |
— | — | 8,582 | — | — | 134,764 | — | 143,346 | ||||||||||||||||||||||||
| Accounts payable to affiliates |
1,104,410 | 653,049 | 4,032,776 | 216,866 | 21,173 | 1,572,788 | (7,601,062 | ) | — | |||||||||||||||||||||||
| Taxes payable |
— | — | 827 | — | — | 119,761 | — | 120,588 | ||||||||||||||||||||||||
| Other current liabilities |
412 | — | 22,106 | 62,431 | 4,412 | 210,811 | — | 300,172 | ||||||||||||||||||||||||
|
|
|
|
|
|
|
|
|
|
|
|
|
|
|
|
|
|||||||||||||||||
| Total current liabilities |
1,104,822 | 705,660 | 4,208,796 | 279,297 | 775,585 | 3,104,469 | (9,268,613 | ) | 910,016 | |||||||||||||||||||||||
|
|
|
|
|
|
|
|
|
|
|
|
|
|
|
|
|
|||||||||||||||||
| Long-term debt |
1,561,141 | — | — | 3,793,414 | 201,696 | — | — | 5,556,251 | ||||||||||||||||||||||||
| Notes payable to affiliates |
2,042,808 | — | 534,683 | 975,000 | 260,216 | 3,379,317 | (7,192,024 | ) | — | |||||||||||||||||||||||
| Deferred income taxes |
— | — | — | — | — | 225,455 | — | 225,455 | ||||||||||||||||||||||||
| Other liabilities |
19,931 | — | 24,502 | — | — | 289,875 | — | 334,308 | ||||||||||||||||||||||||
|
|
|
|
|
|
|
|
|
|
|
|
|
|
|
|
|
|||||||||||||||||
| Total liabilities |
4,728,702 | 705,660 | 4,767,981 | 5,047,711 | 1,237,497 | 6,999,116 | (16,460,637 | ) | 7,026,030 | |||||||||||||||||||||||
|
|
|
|
|
|
|
|
|
|
|
|
|
|
|
|
|
|||||||||||||||||
| Commitments and contingencies |
||||||||||||||||||||||||||||||||
| Total shareholder equity |
8,428,039 | 2,254,026 | 5,593,432 | 7,149,327 | 4,255,183 | 13,238,656 | (32,490,624 | ) | 8,428,039 | |||||||||||||||||||||||
| Noncontrolling interests |
— | — | — | — | — | 1,238,242 | (510,797 | ) | 727,445 | |||||||||||||||||||||||
|
|
|
|
|
|
|
|
|
|
|
|
|
|
|
|
|
|||||||||||||||||
| Total equity |
8,428,039 | 2,254,026 | 5,593,432 | 7,149,327 | 4,255,183 | 14,476,898 | (33,001,421 | ) | 9,155,484 | |||||||||||||||||||||||
|
|
|
|
|
|
|
|
|
|
|
|
|
|
|
|
|
|||||||||||||||||
| Total liabilities and equity |
$ | 13,156,741 | $ | 2,959,686 | $ | 10,361,413 | $ | 12,197,038 | $ | 5,492,680 | $ | 21,476,014 | $ | (49,462,058 | ) | $ | 16,181,514 | |||||||||||||||
|
|
|
|
|
|
|
|
|
|
|
|
|
|
|
|
|
|||||||||||||||||
103
Table of Contents
NOBLE CORPORATION AND SUBSIDIARIES
CONDENSED CONSOLIDATING STATEMENT OF INCOME
Year Ended December 31, 2014
(in thousands)
| Other | ||||||||||||||||||||||||||||||||
| Non-guarantor | ||||||||||||||||||||||||||||||||
| Noble- | Subsidiaries | Consolidating | ||||||||||||||||||||||||||||||
| Cayman | NHC | NDH | NHIL | NDS6 | of Noble | Adjustments | Total | |||||||||||||||||||||||||
| Operating revenues |
||||||||||||||||||||||||||||||||
| Contract drilling services |
$ | — | $ | — | $ | 327,070 | $ | — | $ | — | $ | 3,067,195 | $ | (246,406 | ) | $ | 3,147,859 | |||||||||||||||
| Reimbursables |
— | — | 6,239 | — | — | 78,405 | — | 84,644 | ||||||||||||||||||||||||
| Other |
— | — | — | — | — | 1 | — | 1 | ||||||||||||||||||||||||
|
|
|
|
|
|
|
|
|
|
|
|
|
|
|
|
|
|||||||||||||||||
| Total operating revenues |
— | — | 333,309 | — | — | 3,145,601 | (246,406 | ) | 3,232,504 | |||||||||||||||||||||||
|
|
|
|
|
|
|
|
|
|
|
|
|
|
|
|
|
|||||||||||||||||
| Operating costs and expenses |
||||||||||||||||||||||||||||||||
| Contract drilling services |
30,885 | 39,039 | 120,971 | 115,909 | — | 1,447,073 | (246,406 | ) | 1,507,471 | |||||||||||||||||||||||
| Reimbursables |
— | — | 4,687 | — | — | 61,691 | — | 66,378 | ||||||||||||||||||||||||
| Depreciation and amortization |
— | — | 65,164 | — | — | 559,114 | — | 624,278 | ||||||||||||||||||||||||
| General and administrative |
2,437 | 11,376 | — | 31,620 | 1 | 7,560 | — | 52,994 | ||||||||||||||||||||||||
| Loss on impairment |
— | — | — | — | — | 745,428 | — | 745,428 | ||||||||||||||||||||||||
|
|
|
|
|
|
|
|
|
|
|
|
|
|
|
|
|
|||||||||||||||||
| Total operating costs and expenses |
33,322 | 50,415 | 190,822 | 147,529 | 1 | 2,820,866 | (246,406 | ) | 2,996,549 | |||||||||||||||||||||||
|
|
|
|
|
|
|
|
|
|
|
|
|
|
|
|
|
|||||||||||||||||
| Operating income (loss) |
(33,322 | ) | (50,415 | ) | 142,487 | (147,529 | ) | (1 | ) | 324,735 | — | 235,955 | ||||||||||||||||||||
| Other income (expense) |
||||||||||||||||||||||||||||||||
| Income (loss) of unconsolidated affiliates—continuing operations |
(2,885,628 | ) | 157,648 | (80,080 | ) | 604,419 | 448,785 | — | 1,754,856 | — | ||||||||||||||||||||||
| Income (loss) of unconsolidated affiliates—discontinued operations, net of tax |
223,083 | 50,565 | 28,580 | 170,845 | 6,240 | — | (479,313 | ) | — | |||||||||||||||||||||||
|
|
|
|
|
|
|
|
|
|
|
|
|
|
|
|
|
|||||||||||||||||
| Total income (loss) of unconsolidated affiliates |
(2,662,545 | ) | 208,213 | (51,500 | ) | 775,264 | 455,025 | — | 1,275,543 | — | ||||||||||||||||||||||
| Interest expense, net of amounts capitalized |
(93,536 | ) | (3,046 | ) | (24,974 | ) | (169,666 | ) | (33,671 | ) | (3,148,822 | ) | 3,318,536 | (155,179 | ) | |||||||||||||||||
| Interest income and other, net |
2,913,631 | — | 249,005 | 89,449 | 3,308 | 64,267 | (3,318,536 | ) | 1,124 | |||||||||||||||||||||||
|
|
|
|
|
|
|
|
|
|
|
|
|
|
|
|
|
|||||||||||||||||
| Income from continuing operations before income taxes |
124,228 | 154,752 | 315,018 | 547,518 | 424,661 | (2,759,820 | ) | 1,275,543 | 81,900 | |||||||||||||||||||||||
| Income tax provision |
— | (68,805 | ) | (3,574 | ) | — | (1,546 | ) | (32,005 | ) | — | (105,930 | ) | |||||||||||||||||||
|
|
|
|
|
|
|
|
|
|
|
|
|
|
|
|
|
|||||||||||||||||
| Net income from continuing operations |
124,228 | 85,947 | 311,444 | 547,518 | 423,115 | (2,791,825 | ) | 1,275,543 | (24,030 | ) | ||||||||||||||||||||||
| Net income from discontinued operations, net of tax |
— | (18,655 | ) | 6,634 | — | — | 235,104 | — | 223,083 | |||||||||||||||||||||||
|
|
|
|
|
|
|
|
|
|
|
|
|
|
|
|
|
|||||||||||||||||
| Net Income |
124,228 | 67,292 | 318,078 | 547,518 | 423,115 | (2,556,721 | ) | 1,275,543 | 199,053 | |||||||||||||||||||||||
| Net income attributable to noncontrolling interests |
— | — | — | — | — | (98,603 | ) | 23,778 | (74,825 | ) | ||||||||||||||||||||||
|
|
|
|
|
|
|
|
|
|
|
|
|
|
|
|
|
|||||||||||||||||
| Net income attributable to Noble Corporation |
124,228 | 67,292 | 318,078 | 547,518 | 423,115 | (2,655,324 | ) | 1,299,321 | 124,228 | |||||||||||||||||||||||
|
|
|
|
|
|
|
|
|
|
|
|
|
|
|
|
|
|||||||||||||||||
| Other comprehensive loss, net |
(21,732 | ) | — | — | — | — | (21,732 | ) | 21,732 | (21,732 | ) | |||||||||||||||||||||
|
|
|
|
|
|
|
|
|
|
|
|
|
|
|
|
|
|||||||||||||||||
| Comprehensive income attributable to Noble Corporation |
$ | 102,496 | $ | 67,292 | $ | 318,078 | $ | 547,518 | $ | 423,115 | $ | (2,677,056 | ) | $ | 1,321,053 | $ | 102,496 | |||||||||||||||
|
|
|
|
|
|
|
|
|
|
|
|
|
|
|
|
|
|||||||||||||||||
104
Table of Contents
NOBLE CORPORATION AND SUBSIDIARIES
CONDENSED CONSOLIDATING STATEMENT OF INCOME
Year Ended December 31, 2013
(in thousands)
| Other | ||||||||||||||||||||||||||||||||
| Non-guarantor | ||||||||||||||||||||||||||||||||
| Noble- | Subsidiaries | Consolidating | ||||||||||||||||||||||||||||||
| Cayman | NHC | NDH | NHIL | NDS6 | of Noble | Adjustments | Total | |||||||||||||||||||||||||
| Operating revenues |
||||||||||||||||||||||||||||||||
| Contract drilling services |
$ | — | $ | — | $ | 240,631 | $ | — | $ | — | $ | 2,291,475 | $ | (77,361 | ) | $ | 2,454,745 | |||||||||||||||
| Reimbursables |
— | — | 8,498 | — | — | 57,794 | — | 66,292 | ||||||||||||||||||||||||
| Labor contract drilling services |
— | — | — | — | — | 17,095 | — | 17,095 | ||||||||||||||||||||||||
| Other |
— | — | — | — | — | 11 | — | 11 | ||||||||||||||||||||||||
|
|
|
|
|
|
|
|
|
|
|
|
|
|
|
|
|
|||||||||||||||||
| Total operating revenues |
— | — | 249,129 | — | — | 2,366,375 | (77,361 | ) | 2,538,143 | |||||||||||||||||||||||
|
|
|
|
|
|
|
|
|
|
|
|
|
|
|
|
|
|||||||||||||||||
| Operating costs and expenses |
||||||||||||||||||||||||||||||||
| Contract drilling services |
24,039 | 22,195 | 70,359 | 110,138 | — | 1,009,801 | (77,361 | ) | 1,159,171 | |||||||||||||||||||||||
| Reimbursables |
— | — | 6,850 | — | — | 43,560 | — | 50,410 | ||||||||||||||||||||||||
| Labor contract drilling services |
— | — | — | — | — | 11,601 | — | 11,601 | ||||||||||||||||||||||||
| Depreciation and amortization |
— | — | 62,778 | — | — | 446,563 | — | 509,341 | ||||||||||||||||||||||||
| General and administrative |
7,380 | 7,396 | — | 36,050 | 1 | 14,032 | — | 64,859 | ||||||||||||||||||||||||
| Loss on impairment |
— | — | — | — | — | 3,585 | — | 3,585 | ||||||||||||||||||||||||
| Gain on disposal of assets, net |
— | — | — | — | — | (35,646 | ) | — | (35,646 | ) | ||||||||||||||||||||||
| Gain on contract settlements/extinguishments, net |
(45,000 | ) | — | — | — | — | 14,382 | — | (30,618 | ) | ||||||||||||||||||||||
|
|
|
|
|
|
|
|
|
|
|
|
|
|
|
|
|
|||||||||||||||||
| Total operating costs and expenses |
(13,581 | ) | 29,591 | 139,987 | 146,188 | 1 | 1,507,878 | (77,361 | ) | 1,732,703 | ||||||||||||||||||||||
|
|
|
|
|
|
|
|
|
|
|
|
|
|
|
|
|
|||||||||||||||||
| Operating income (loss) |
13,581 | (29,591 | ) | 109,142 | (146,188 | ) | (1 | ) | 858,497 | — | 805,440 | |||||||||||||||||||||
| Other income (expense) |
||||||||||||||||||||||||||||||||
| Income (loss) of unconsolidated affiliates—continuing operations |
653,815 | 65,868 | (53,235 | ) | 641,155 | (1,136,831 | ) | — | (170,772 | ) | — | |||||||||||||||||||||
| Income (loss) of unconsolidated affiliates—discontinued operations, net of tax |
321,804 | 45,098 | 308,188 | 431,149 | 63,235 | — | (1,169,474 | ) | — | |||||||||||||||||||||||
|
|
|
|
|
|
|
|
|
|
|
|
|
|
|
|
|
|||||||||||||||||
| Total income (loss) of unconsolidated affiliates |
975,619 | 110,966 | 254,953 | 1,072,304 | (1,073,596 | ) | — | (1,340,246 | ) | — | ||||||||||||||||||||||
| Interest expense, net of amounts capitalized |
(127,995 | ) | (1,081 | ) | (23,156 | ) | (139,784 | ) | (45,897 | ) | (1,852,423 | ) | 2,084,036 | (106,300 | ) | |||||||||||||||||
| Interest income and other, net |
6,609 | — | 262,717 | 154,442 | 1,569,003 | 94,821 | (2,084,036 | ) | 3,556 | |||||||||||||||||||||||
|
|
|
|
|
|
|
|
|
|
|
|
|
|
|
|
|
|||||||||||||||||
| Income from continuing operations before income taxes |
867,814 | 80,294 | 603,656 | 940,774 | 449,509 | (899,105 | ) | (1,340,246 | ) | 702,696 | ||||||||||||||||||||||
| Income tax provision |
— | (24,592 | ) | 3,655 | — | — | (68,040 | ) | — | (88,977 | ) | |||||||||||||||||||||
|
|
|
|
|
|
|
|
|
|
|
|
|
|
|
|
|
|||||||||||||||||
| Net income from continuing operations |
867,814 | 55,702 | 607,311 | 940,774 | 449,509 | (967,145 | ) | (1,340,246 | ) | 613,719 | ||||||||||||||||||||||
| Net income from discontinued operations, net of tax |
— | (16,569 | ) | 24,529 | (55 | ) | — | 313,899 | — | 321,804 | ||||||||||||||||||||||
|
|
|
|
|
|
|
|
|
|
|
|
|
|
|
|
|
|||||||||||||||||
| Net Income |
867,814 | 39,133 | 631,840 | 940,719 | 449,509 | (653,246 | ) | (1,340,246 | ) | 935,523 | ||||||||||||||||||||||
| Net income attributable to noncontrolling interests |
— | — | — | — | — | (114,314 | ) | 46,605 | (67,709 | ) | ||||||||||||||||||||||
|
|
|
|
|
|
|
|
|
|
|
|
|
|
|
|
|
|||||||||||||||||
| Net income attributable to Noble Corporation |
867,814 | 39,133 | 631,840 | 940,719 | 449,509 | (767,560 | ) | (1,293,641 | ) | 867,814 | ||||||||||||||||||||||
|
|
|
|
|
|
|
|
|
|
|
|
|
|
|
|
|
|||||||||||||||||
| Other comprehensive income, net |
33,285 | — | — | — | — | 33,285 | (33,285 | ) | 33,285 | |||||||||||||||||||||||
|
|
|
|
|
|
|
|
|
|
|
|
|
|
|
|
|
|||||||||||||||||
| Comprehensive income attributable to Noble Corporation |
$ | 901,099 | $ | 39,133 | $ | 631,840 | $ | 940,719 | $ | 449,509 | $ | (734,275 | ) | $ | (1,326,926 | ) | $ | 901,099 | ||||||||||||||
|
|
|
|
|
|
|
|
|
|
|
|
|
|
|
|
|
|||||||||||||||||
105
Table of Contents
NOBLE CORPORATION AND SUBSIDIARIES
CONDENSED CONSOLIDATING STATEMENT OF INCOME
Year Ended December 31, 2012
(in thousands)
| Other | ||||||||||||||||||||||||||||||||
| Non-guarantor | ||||||||||||||||||||||||||||||||
| Noble- | Subsidiaries | Consolidating | ||||||||||||||||||||||||||||||
| Cayman | NHC | NDH | NHIL | NDS6 | of Noble | Adjustments | Total | |||||||||||||||||||||||||
| Operating revenues |
||||||||||||||||||||||||||||||||
| Contract drilling services |
$ | — | $ | — | $ | 161,577 | $ | — | $ | — | $ | 2,006,624 | $ | (78,580 | ) | $ | 2,089,621 | |||||||||||||||
| Reimbursables |
— | — | 6,637 | — | — | 59,130 | — | 65,767 | ||||||||||||||||||||||||
| Labor contract drilling services |
— | — | — | — | — | 45,299 | — | 45,299 | ||||||||||||||||||||||||
| Other |
— | — | — | — | — | 943 | (931 | ) | 12 | |||||||||||||||||||||||
|
|
|
|
|
|
|
|
|
|
|
|
|
|
|
|
|
|||||||||||||||||
| Total operating revenues |
— | — | 168,214 | — | — | 2,111,996 | (79,511 | ) | 2,200,699 | |||||||||||||||||||||||
|
|
|
|
|
|
|
|
|
|
|
|
|
|
|
|
|
|||||||||||||||||
| Operating costs and expenses |
||||||||||||||||||||||||||||||||
| Contract drilling services |
2,646 | 17,551 | 45,474 | 82,736 | — | 891,941 | (79,511 | ) | 960,837 | |||||||||||||||||||||||
| Reimbursables |
— | — | 5,886 | — | — | 49,538 | — | 55,424 | ||||||||||||||||||||||||
| Labor contract drilling services |
— | — | — | — | — | 23,129 | — | 23,129 | ||||||||||||||||||||||||
| Depreciation and amortization |
— | — | 60,738 | — | — | 377,636 | — | 438,374 | ||||||||||||||||||||||||
| General and administrative |
3,036 | 7,786 | — | 35,606 | 1 | 12,937 | — | 59,366 | ||||||||||||||||||||||||
| Loss on impairment |
— | — | — | — | — | 20,384 | — | 20,384 | ||||||||||||||||||||||||
| Gain on contract settlements/extinguishments, net |
— | — | (4,869 | ) | — | — | (28,386 | ) | — | (33,255 | ) | |||||||||||||||||||||
|
|
|
|
|
|
|
|
|
|
|
|
|
|
|
|
|
|||||||||||||||||
| Total operating costs and expenses |
5,682 | 25,337 | 107,229 | 118,342 | 1 | 1,347,179 | (79,511 | ) | 1,524,259 | |||||||||||||||||||||||
|
|
|
|
|
|
|
|
|
|
|
|
|
|
|
|
|
|||||||||||||||||
| Operating income (loss) |
(5,682 | ) | (25,337 | ) | 60,985 | (118,342 | ) | (1 | ) | 764,817 | — | 676,440 | ||||||||||||||||||||
| Other income (expense) |
||||||||||||||||||||||||||||||||
| Income (loss) of unconsolidated affiliates—continuing operations |
569,295 | 82,257 | 168,972 | 527,469 | (244,644 | ) | — | (1,103,349 | ) | — | ||||||||||||||||||||||
| Income (loss) of unconsolidated affiliates—discontinued operations, net of tax |
115,151 | 32,769 | 188,511 | 280,121 | 60,481 | — | (677,033 | ) | — | |||||||||||||||||||||||
|
|
|
|
|
|
|
|
|
|
|
|
|
|
|
|
|
|||||||||||||||||
| Total income (loss) of unconsolidated affiliates |
684,446 | 115,026 | 357,483 | 807,590 | (184,163 | ) | — | (1,780,382 | ) | — | ||||||||||||||||||||||
| Interest expense, net of amounts capitalized |
(105,147 | ) | (20,950 | ) | (23,105 | ) | (120,361 | ) | (43,090 | ) | (666,968 | ) | 893,858 | (85,763 | ) | |||||||||||||||||
| Interest income and other, net |
7,306 | — | 40,845 | 135,001 | 594,328 | 119,449 | (893,858 | ) | 3,071 | |||||||||||||||||||||||
|
|
|
|
|
|
|
|
|
|
|
|
|
|
|
|
|
|||||||||||||||||
| Income from continuing operations before income taxes |
580,923 | 68,739 | 436,208 | 703,888 | 367,074 | 217,298 | (1,780,382 | ) | 593,748 | |||||||||||||||||||||||
| Income tax provision |
— | (18,446 | ) | (4,576 | ) | — | — | (71,161 | ) | — | (94,183 | ) | ||||||||||||||||||||
|
|
|
|
|
|
|
|
|
|
|
|
|
|
|
|
|
|||||||||||||||||
| Net income from continuing operations |
580,923 | 50,293 | 431,632 | 703,888 | 367,074 | 146,137 | (1,780,382 | ) | 499,565 | |||||||||||||||||||||||
| Net income from discontinued operations, net of tax |
— | (23,622 | ) | 10,160 | — | — | 128,613 | — | 115,151 | |||||||||||||||||||||||
|
|
|
|
|
|
|
|
|
|
|
|
|
|
|
|
|
|||||||||||||||||
| Net Income |
580,923 | 26,671 | 441,792 | 703,888 | 367,074 | 274,750 | (1,780,382 | ) | 614,716 | |||||||||||||||||||||||
| Net income attributable to noncontrolling interests |
— | — | — | — | — | (68,969 | ) | 35,176 | (33,793 | ) | ||||||||||||||||||||||
|
|
|
|
|
|
|
|
|
|
|
|
|
|
|
|
|
|||||||||||||||||
| Net income attributable to Noble Corporation |
580,923 | 26,671 | 441,792 | 703,888 | 367,074 | 205,781 | (1,745,206 | ) | 580,923 | |||||||||||||||||||||||
|
|
|
|
|
|
|
|
|
|
|
|
|
|
|
|
|
|||||||||||||||||
| Other comprehensive loss, net |
(41,128 | ) | — | — | — | — | (41,128 | ) | 41,128 | (41,128 | ) | |||||||||||||||||||||
|
|
|
|
|
|
|
|
|
|
|
|
|
|
|
|
|
|||||||||||||||||
| Comprehensive income attributable to Noble Corporation |
$ | 539,795 | $ | 26,671 | $ | 441,792 | $ | 703,888 | $ | 367,074 | $ | 164,653 | $ | (1,704,078 | ) | $ | 539,795 | |||||||||||||||
|
|
|
|
|
|
|
|
|
|
|
|
|
|
|
|
|
|||||||||||||||||
106
Table of Contents
NOBLE CORPORATION AND SUBSIDIARIES
CONDENSED CONSOLIDATING STATEMENT OF CASH FLOWS
Year Ended December 31, 2014
(in thousands)
| Other | ||||||||||||||||||||||||||||||||
| Non-guarantor | ||||||||||||||||||||||||||||||||
| Noble- | Subsidiaries | Consolidating | ||||||||||||||||||||||||||||||
| Cayman | NHC | NDH | NHIL | NDS6 | of Noble | Adjustments | Total | |||||||||||||||||||||||||
| Cash flows from operating activities |
||||||||||||||||||||||||||||||||
| Net cash from operating activities |
$ | 2,825,524 | $ | (151,987 | ) | $ | 366,583 | $ | (232,605 | ) | $ | (31,788 | ) | $ | (903,811 | ) | $ | — | $ | 1,871,916 | ||||||||||||
|
|
|
|
|
|
|
|
|
|
|
|
|
|
|
|
|
|||||||||||||||||
| Cash flows from investing activities |
||||||||||||||||||||||||||||||||
| New construction and capital expenditures |
— | — | (1,404,560 | ) | — | — | (704,574 | ) | — | (2,109,134 | ) | |||||||||||||||||||||
| Notes receivable from affiliates |
50 | — | — | 273,744 | — | — | (273,794 | ) | — | |||||||||||||||||||||||
|
|
|
|
|
|
|
|
|
|
|
|
|
|
|
|
|
|||||||||||||||||
| Net cash from investing activities |
50 | — | (1,404,560 | ) | 273,744 | — | (704,574 | ) | (273,794 | ) | (2,109,134 | ) | ||||||||||||||||||||
|
|
|
|
|
|
|
|
|
|
|
|
|
|
|
|
|
|||||||||||||||||
| Cash flows from financing activities |
||||||||||||||||||||||||||||||||
| Net change in borrowings outstanding on bank credit facilities |
(437,647 | ) | — | — | — | — | — | — | (437,647 | ) | ||||||||||||||||||||||
| Repayment of long-term debt |
— | — | — | (250,000 | ) | — | — | — | (250,000 | ) | ||||||||||||||||||||||
| Long-term borrowings of Paragon Offshore |
— | — | — | — | — | 1,710,550 | — | 1,710,550 | ||||||||||||||||||||||||
| Financing costs on long-term borrowings of Paragon Offshore |
— | — | — | — | — | (14,676 | ) | (14,676 | ) | |||||||||||||||||||||||
| Cash balances of Paragon Offshore in Spin-Off |
— | — | — | — | — | (104,152 | ) | — | (104,152 | ) | ||||||||||||||||||||||
| Dividends paid to noncontrolling interests |
— | — | — | — | — | (79,966 | ) | — | (79,966 | ) | ||||||||||||||||||||||
| Financing costs on credit facilities |
(398 | ) | — | — | — | — | — | — | (398 | ) | ||||||||||||||||||||||
| Distributions to parent company, net |
(631,095 | ) | — | — | — | — | — | — | (631,095 | ) | ||||||||||||||||||||||
| Advances (to) from affiliates |
(1,482,686 | ) | 151,987 | 1,037,829 | 208,857 | 31,788 | 52,225 | — | — | |||||||||||||||||||||||
| Notes payable to affiliates |
(273,744 | ) | — | — | — | — | (50 | ) | 273,794 | — | ||||||||||||||||||||||
|
|
|
|
|
|
|
|
|
|
|
|
|
|
|
|
|
|||||||||||||||||
| Net cash from financing activities |
(2,825,570 | ) | 151,987 | 1,037,829 | (41,143 | ) | 31,788 | 1,563,931 | 273,794 | 192,616 | ||||||||||||||||||||||
|
|
|
|
|
|
|
|
|
|
|
|
|
|
|
|
|
|||||||||||||||||
| Net change in cash and cash equivalents |
4 | — | (148 | ) | (4 | ) | — | (44,454 | ) | — | (44,602 | ) | ||||||||||||||||||||
| Cash and cash equivalents, beginning of period |
1 | — | 402 | 4 | — | 109,975 | — | 110,382 | ||||||||||||||||||||||||
|
|
|
|
|
|
|
|
|
|
|
|
|
|
|
|
|
|||||||||||||||||
| Cash and cash equivalents, end of period |
$ | 5 | $ | — | $ | 254 | $ | — | $ | — | $ | 65,521 | $ | — | $ | 65,780 | ||||||||||||||||
|
|
|
|
|
|
|
|
|
|
|
|
|
|
|
|
|
|||||||||||||||||
107
Table of Contents
NOBLE CORPORATION AND SUBSIDIARIES
CONDENSED CONSOLIDATING STATEMENT OF CASH FLOWS
Year Ended December 31, 2013
(in thousands)
| Other | ||||||||||||||||||||||||||||||||
| Non-guarantor | ||||||||||||||||||||||||||||||||
| Noble- | Subsidiaries | Consolidating | ||||||||||||||||||||||||||||||
| Cayman | NHC | NDH | NHIL | NDS6 | of Noble | Adjustments | Total | |||||||||||||||||||||||||
| Cash flows from operating activities |
||||||||||||||||||||||||||||||||
| Net cash from operating activities |
$ | (117,993 | ) | $ | (133,595 | ) | $ | 424,147 | $ | (128,315 | ) | $ | 1,523,225 | $ | 201,161 | $ | — | $ | 1,768,630 | |||||||||||||
|
|
|
|
|
|
|
|
|
|
|
|
|
|
|
|
|
|||||||||||||||||
| Cash flows from investing activities |
||||||||||||||||||||||||||||||||
| New construction and capital expenditures |
— | — | (1,594,449 | ) | — | — | (949,755 | ) | — | (2,544,204 | ) | |||||||||||||||||||||
| Notes receivable from affiliates |
— | — | — | — | — | 294,798 | (294,798 | ) | — | |||||||||||||||||||||||
| Proceeds from disposal of assets |
— | — | — | — | — | 61,000 | — | 61,000 | ||||||||||||||||||||||||
|
|
|
|
|
|
|
|
|
|
|
|
|
|
|
|
|
|||||||||||||||||
| Net cash from investing activities |
— | — | (1,594,449 | ) | — | — | (593,957 | ) | (294,798 | ) | (2,483,204 | ) | ||||||||||||||||||||
|
|
|
|
|
|
|
|
|
|
|
|
|
|
|
|
|
|||||||||||||||||
| Cash flows from financing activities |
||||||||||||||||||||||||||||||||
| Net change in borrowings outstanding on bank credit facilities |
1,221,333 | — | — | — | — | — | — | 1,221,333 | ||||||||||||||||||||||||
| Repayment of long-term debt |
(300,000 | ) | — | — | — | — | — | — | (300,000 | ) | ||||||||||||||||||||||
| Dividends paid to noncontrolling interests |
— | — | — | — | — | (105,388 | ) | — | (105,388 | ) | ||||||||||||||||||||||
| Financing costs on credit facilities |
(2,484 | ) | — | — | — | — | — | — | (2,484 | ) | ||||||||||||||||||||||
| Distributions to parent company, net |
(265,880 | ) | — | — | — | — | — | — | (265,880 | ) | ||||||||||||||||||||||
| Advances (to) from affiliates |
(241,180 | ) | 133,595 | 1,169,800 | 128,317 | (1,523,225 | ) | 332,693 | — | — | ||||||||||||||||||||||
| Notes payable to affiliates |
(294,798 | ) | — | — | — | — | — | 294,798 | — | |||||||||||||||||||||||
|
|
|
|
|
|
|
|
|
|
|
|
|
|
|
|
|
|||||||||||||||||
| Net cash from financing activities |
116,991 | 133,595 | 1,169,800 | 128,317 | (1,523,225 | ) | 227,305 | 294,798 | 547,581 | |||||||||||||||||||||||
|
|
|
|
|
|
|
|
|
|
|
|
|
|
|
|
|
|||||||||||||||||
| Net change in cash and cash equivalents |
(1,002 | ) | — | (502 | ) | 2 | — | (165,491 | ) | — | (166,993 | ) | ||||||||||||||||||||
| Cash and cash equivalents, beginning of period |
1,003 | — | 904 | 2 | — | 275,466 | — | 277,375 | ||||||||||||||||||||||||
|
|
|
|
|
|
|
|
|
|
|
|
|
|
|
|
|
|||||||||||||||||
| Cash and cash equivalents, end of period |
$ | 1 | $ | — | $ | 402 | $ | 4 | $ | — | $ | 109,975 | $ | — | $ | 110,382 | ||||||||||||||||
|
|
|
|
|
|
|
|
|
|
|
|
|
|
|
|
|
|||||||||||||||||
108
Table of Contents
NOBLE CORPORATION AND SUBSIDIARIES
CONDENSED CONSOLIDATING STATEMENT OF CASH FLOWS
Year Ended December 31, 2012
(in thousands)
| Other | ||||||||||||||||||||||||||||||||
| Non-guarantor | ||||||||||||||||||||||||||||||||
| Noble- | Subsidiaries | Consolidating | ||||||||||||||||||||||||||||||
| Cayman | NHC | NDH | NHIL | NDS6 | of Noble | Adjustments | Total | |||||||||||||||||||||||||
| Cash flows from operating activities |
||||||||||||||||||||||||||||||||
| Net cash from operating activities |
$ | (86,784 | ) | $ | (99,193 | ) | $ | 134,370 | $ | (96,642 | ) | $ | 551,358 | $ | 1,017,518 | $ | — | $ | 1,420,627 | |||||||||||||
|
|
|
|
|
|
|
|
|
|
|
|
|
|
|
|
|
|||||||||||||||||
| Cash flows from investing activities |
||||||||||||||||||||||||||||||||
| New construction and capital expenditures |
— | — | (682,477 | ) | — | — | (1,106,077 | ) | — | (1,788,554 | ) | |||||||||||||||||||||
| Notes receivable from affiliates |
— | — | — | (1,188,287 | ) | — | — | 1,188,287 | — | |||||||||||||||||||||||
|
|
|
|
|
|
|
|
|
|
|
|
|
|
|
|
|
|||||||||||||||||
| Net cash from investing activities |
— | — | (682,477 | ) | (1,188,287 | ) | — | (1,106,077 | ) | 1,188,287 | (1,788,554 | ) | ||||||||||||||||||||
|
|
|
|
|
|
|
|
|
|
|
|
|
|
|
|
|
|||||||||||||||||
| Cash flows from financing activities |
||||||||||||||||||||||||||||||||
| Net change in borrowings outstanding on bank credit facilities |
(635,192 | ) | — | — | — | — | — | — | (635,192 | ) | ||||||||||||||||||||||
| Proceeds from issuance of senior notes, net of debt issuance costs |
— | — | — | 1,186,636 | — | — | — | 1,186,636 | ||||||||||||||||||||||||
| Financing costs on credit facilities |
(5,221 | ) | — | — | — | — | — | — | (5,221 | ) | ||||||||||||||||||||||
| Contributions from joint venture partners |
— | — | — | — | — | 40,000 | — | 40,000 | ||||||||||||||||||||||||
| Distributions to parent company, net |
(175,977 | ) | — | — | — | — | — | — | (175,977 | ) | ||||||||||||||||||||||
| Advances (to) from affiliates |
(284,256 | ) | 99,193 | 548,626 | 98,295 | (551,358 | ) | 89,500 | — | — | ||||||||||||||||||||||
| Notes payable to affiliates |
1,188,287 | — | — | — | — | — | (1,188,287 | ) | — | |||||||||||||||||||||||
|
|
|
|
|
|
|
|
|
|
|
|
|
|
|
|
|
|||||||||||||||||
| Net cash from financing activities |
87,641 | 99,193 | 548,626 | 1,284,931 | (551,358 | ) | 129,500 | (1,188,287 | ) | 410,246 | ||||||||||||||||||||||
|
|
|
|
|
|
|
|
|
|
|
|
|
|
|
|
|
|||||||||||||||||
| Net change in cash and cash equivalents |
857 | — | 519 | 2 | — | 40,941 | — | 42,319 | ||||||||||||||||||||||||
| Cash and cash equivalents, beginning of period |
146 | — | 385 | — | — | 234,525 | — | 235,056 | ||||||||||||||||||||||||
|
|
|
|
|
|
|
|
|
|
|
|
|
|
|
|
|
|||||||||||||||||
| Cash and cash equivalents, end of period |
$ | 1,003 | $ | — | $ | 904 | $ | 2 | $ | — | $ | 275,466 | $ | — | $ | 277,375 | ||||||||||||||||
|
|
|
|
|
|
|
|
|
|
|
|
|
|
|
|
|
|||||||||||||||||
109
Table of Contents
NOBLE CORPORATION PLC AND SUBSIDIARIES
NOBLE CORPORATION AND SUBSIDIARIES
NOTES TO CONSOLIDATED FINANCIAL STATEMENTS
(Unless otherwise indicated, dollar amounts in tables are in thousands, except per share data)
Note 23- Unaudited Interim Financial Data
Unaudited interim consolidated financial information from continuing operations for Noble-UK for the years ended December 31, 2014 and 2013 is as follows:
| Quarter Ended | ||||||||||||||||
| Mar. 31 | Jun. 30 | Sep. 30 | Dec. 31 | |||||||||||||
| 2014 |
||||||||||||||||
| Operating revenues |
$ | 795,187 | $ | 803,781 | $ | 828,796 | $ | 804,740 | ||||||||
| Operating income (loss) |
248,968 | 235,205 | 243,633 | (541,864 | ) | |||||||||||
| Net income (loss) from continuing operations attributable to Noble-UK |
154,814 | 140,325 | 147,389 | (594,539 | ) | |||||||||||
| Net income (loss) per share from continuning operations attributable to Noble-UK (1) |
||||||||||||||||
| Basic |
0.60 | 0.54 | 0.57 | (2.38 | ) | |||||||||||
| Diluted |
0.60 | 0.54 | 0.57 | (2.38 | ) | |||||||||||
| Quarter Ended | ||||||||||||||||
| Mar. 31 | Jun. 30 | Sep. 30 | Dec. 31 | |||||||||||||
| 2013 |
||||||||||||||||
| Operating revenues |
$ | 566,061 | $ | 606,480 | $ | 640,513 | $ | 725,089 | ||||||||
| Operating income |
135,437 | 159,973 | 239,248 | 205,879 | ||||||||||||
| Net income from continuing operations attributable to Noble-UK |
66,899 | 102,406 | 165,267 | 144,023 | ||||||||||||
| Net income per share from continuning operations attributable to Noble-UK (1) |
||||||||||||||||
| Basic |
0.26 | 0.40 | 0.64 | 0.56 | ||||||||||||
| Diluted |
0.26 | 0.40 | 0.64 | 0.56 | ||||||||||||
| (1) | Net income (loss) per share is computed independently for each of the quarters presented. Therefore, the sum of the quarters’ net income (loss) per share may not equal the total computed for the year. |
110
Table of Contents
NOBLE CORPORATION PLC AND SUBSIDIARIES
NOBLE CORPORATION AND SUBSIDIARIES
NOTES TO CONSOLIDATED FINANCIAL STATEMENTS
(Unless otherwise indicated, dollar amounts in tables are in thousands, except per share data)
The Consolidated Statements of Comprehensive Income included for both Noble-UK and Noble-Cayman in our Quarterly Report on Form 10-Q for the quarter ended September 30, 2014 erroneously included an adjustment related to the Spin-off for the historical accumulated other comprehensive income of Paragon Offshore and omitted the line item “Total comprehensive income”. We concluded these errors were not material individually, or in the aggregate, to either Noble-UK or Noble-Cayman in our Quarterly Report on Form 10-Q for the quarter ended September 30, 2014 and we will revise these numbers accordingly in the Quarterly Report on Form 10-Q for the quarter ended September 30, 2015.
The following chart presents the recast of Noble-UK for the three and nine months ended September 30, 2014 to properly reflect the activity for the respective periods:
| Three Months Ended September 30, 2014 |
Nine Months Ended September 30, 2014 |
|||||||||||||||
| As Reported | As Adjusted | As Reported | As Adjusted | |||||||||||||
| Net income |
$ | 147,646 | $ | 147,646 | $ | 678,350 | $ | 678,350 | ||||||||
| Other comprehensive income (loss), net of tax |
||||||||||||||||
| Foreign currency translation adjustments |
(1,577 | ) | (1,577 | ) | 1,143 | 1,143 | ||||||||||
| Foreign currency forward contracts |
(6,925 | ) | (6,925 | ) | (273 | ) | (273 | ) | ||||||||
| Net pension plan loss (net of tax benefit of $386 for both the three and nine months ended September 30, 2014) |
(1,409 | ) | (1,409 | ) | (1,409 | ) | (1,409 | ) | ||||||||
| Net pension plan curtailment and settlement expense (net of tax provision of $193 for both the three and nine months ended September 30, 2014) |
358 | 358 | 358 | 358 | ||||||||||||
| Amortization of deferred pension plan amounts (net of tax provision of $253 and $732 for the three months ended September 30, 2014 and 2013, respectively, and $758 and $2,192 for the nine months ended September 30, 2014 and 2013, respectively) |
571 | 571 | 2,099 | 2,099 | ||||||||||||
|
|
|
|
|
|
|
|
|
|||||||||
| Other comprehensive income (loss), net |
(8,982 | ) | (8,982 | ) | 1,918 | 1,918 | ||||||||||
| Spin-off of Paragon Offshore |
34,478 | — | 34,478 | — | ||||||||||||
|
|
|
|
|
|
|
|
|
|||||||||
| Total comprehensive income |
n/a | 138,664 | n/a | 680,268 | ||||||||||||
| Net comprehensive income attributable to noncontrolling interests |
(20,471 | ) | (20,471 | ) | (60,290 | ) | (60,290 | ) | ||||||||
|
|
|
|
|
|
|
|
|
|||||||||
| Comprehensive income attributable to Noble Corporation plc |
$ | 152,671 | $ | 118,193 | $ | 654,456 | $ | 619,978 | ||||||||
|
|
|
|
|
|
|
|
|
|||||||||
111
Table of Contents
NOBLE CORPORATION PLC AND SUBSIDIARIES
NOBLE CORPORATION AND SUBSIDIARIES
NOTES TO CONSOLIDATED FINANCIAL STATEMENTS
(Unless otherwise indicated, dollar amounts in tables are in thousands, except per share data)
The following chart presents the recast of Noble-Cayman for the three and nine months ended September 30, 2014 to properly reflect the activity for the respective periods:
| Three Months Ended September 30, 2014 |
Nine Months Ended September 30, 2014 |
|||||||||||||||
| As Reported |
As Adjusted |
As Reported |
As Adjusted |
|||||||||||||
| Net income |
$ | 193,705 | $ | 193,705 | $ | 784,078 | $ | 784,078 | ||||||||
| Other comprehensive income (loss), net of tax |
||||||||||||||||
| Foreign currency translation adjustments |
(1,577 | ) | (1,577 | ) | 1,143 | 1,143 | ||||||||||
| Foreign currency forward contracts |
(6,925 | ) | (6,925 | ) | (273 | ) | (273 | ) | ||||||||
| Net pension plan loss (net of tax benefit of $386 for both the three and nine months ended September 30, 2014) |
(1,409 | ) | (1,409 | ) | (1,409 | ) | (1,409 | ) | ||||||||
| Net pension plan curtailment and settlement expense (net of tax provision of $193 for both the three and nine months ended September 30, 2014) |
358 | 358 | 358 | 358 | ||||||||||||
| Amortization of deferred pension plan amounts (net of tax provision of $253 and $732 for the three months ended September 30, 2014 and 2013, respectively, and $758 and $2,192 for the nine months ended September 30, 2014 and 2013, respectively) |
571 | 571 | 2,099 | 2,099 | ||||||||||||
|
|
|
|
|
|
|
|
|
|||||||||
| Other comprehensive income (loss), net |
(8,982 | ) | (8,982 | ) | 1,918 | 1,918 | ||||||||||
| Spin-off of Paragon Offshore |
34,478 | — | 34,478 | — | ||||||||||||
|
|
|
|
|
|
|
|
|
|||||||||
| Total comprehensive income |
n/a | 184,723 | n/a | 785,996 | ||||||||||||
| Net comprehensive income attributable to noncontrolling interests |
(20,471 | ) | (20,471 | ) | (60,290 | ) | (60,290 | ) | ||||||||
|
|
|
|
|
|
|
|
|
|||||||||
| Comprehensive income attributable to Noble Corporation |
$ | 198,730 | $ | 164,252 | $ | 760,184 | $ | 725,706 | ||||||||
|
|
|
|
|
|
|
|
|
|||||||||
Note 24- Subsequent Event
In January 2015, we repurchased 6.2 million of our ordinary shares at an average price of $16.10 per share, excluding commissions and stamp tax. Including these items, the average price paid per share during January 2015 was $16.21. There can be no assurance as to the timing or amount of any additional repurchases. However, we intend to take a cautious approach to future share repurchases at least until market conditions in the offshore drilling business stabilize.
112
Table of Contents
| Item 9. | Changes in and Disagreements With Accountants on Accounting and Financial Disclosure |
None.
| Item 9A. | Controls and Procedures. |
Evaluation of Disclosure Controls and Procedures
David W. Williams, Chairman, President and Chief Executive Officer of Noble Corporation plc, a public limited company incorporated under the laws of England and Wales (“Noble-UK”), and James A. MacLennan, Senior Vice President and Chief Financial Officer of Noble-UK, have evaluated the disclosure controls and procedures of Noble-UK as of the end of the period covered by this report. On the basis of this evaluation, Mr. Williams and Mr. MacLennan have concluded that Noble-UK’s disclosure controls and procedures were effective as of December 31, 2014. Noble-UK’s disclosure controls and procedures are designed to ensure that information required to be disclosed by Noble-UK in the reports that it files with or submits to the SEC are recorded, processed, summarized and reported within the time periods specified in the SEC’s rules and forms and is accumulated and communicated to management as appropriate to allow timely decisions regarding required disclosure.
David W. Williams, President and Chief Executive Officer of Noble Corporation, a Cayman Islands company (“Noble-Cayman”), and Dennis J. Lubojacky, Vice President and Chief Financial Officer of Noble-Cayman, have evaluated the disclosure controls and procedures of Noble-Cayman as of the end of the period covered by this report. On the basis of this evaluation, Mr. Williams and Mr. Lubojacky have concluded that Noble-Cayman’s disclosure controls and procedures were effective as of December 31, 2014. Noble-Cayman’s disclosure controls and procedures are designed to ensure that information required to be disclosed by Noble-Cayman in the reports that it files with or submits to the SEC are recorded, processed, summarized and reported within the time periods specified in the SEC’s rules and forms and is accumulated and communicated to management as appropriate to allow timely decisions regarding required disclosure.
Changes in Internal Control over Financial Reporting
There were no changes in either Noble-UK’s or Noble-Cayman’s internal control over financial reporting that occurred during the quarter ended December 31, 2014 that have materially affected, or are reasonably likely to materially affect, the internal control over financial reporting of each of Noble-UK or Noble-Cayman.
Management’s Annual Report on Internal Control Over Financial Reporting
The management of Noble-UK and Noble-Cayman is responsible for establishing and maintaining adequate internal control over financial reporting, as such term is defined in Rule 13a-15(f) promulgated under the U.S. Securities Exchange Act of 1934, as amended.
Internal control over financial reporting includes the controls themselves, monitoring (including internal auditing practices), and actions taken to correct deficiencies as identified. There are inherent limitations to the effectiveness of internal control over financial reporting, however well designed, including the possibility of human error and the possible circumvention or overriding of controls. The design of an internal control system is also based in part upon assumptions and judgments made by management about the likelihood of future events, and there can be no assurance that an internal control will be effective under all potential future conditions. As a result, even an effective system of internal controls can provide no more than reasonable assurance with respect to the fair presentation of financial statements and the processes under which they were prepared.
Under the supervision and with the participation of our management, including our Chief Executive Officer and Chief Financial Officer, we conducted an evaluation of the effectiveness of our internal control over financial reporting based on the framework in Internal Control—Integrated Framework issued by the Committee of Sponsoring Organizations of the Treadway Commission in 2013. Based on the assessment by management of Noble-UK and Noble-Cayman, both Noble-UK and Noble-Cayman maintained effective internal control over financial reporting as of December 31, 2014.
PricewaterhouseCoopers LLP, the independent registered public accounting firm that audited our financial statements included in this Annual Report on Form 10-K, has audited the effectiveness of internal control over financial reporting as of December 31, 2014 as stated in their report, which is provided in this Annual Report on Form 10-K.
113
Table of Contents
| Item 9B. | Other Information. |
None.
| Item 10. | Directors, Executive Officers and Corporate Governance. |
The sections entitled “Election of Directors”, “Additional Information Regarding the Board of Directors”, “Section 16(a) Beneficial Ownership Reporting Compliance”, and “Other Matters” appearing in the proxy statement for the 2015 annual general meeting of shareholders (the “2015 Proxy Statement”), will set forth certain information with respect to directors, certain corporate governance matters and reporting under Section 16(a) of the Securities Exchange Act of 1934, and are incorporated in this report by reference.
Executive Officers of the Registrant
The following table sets forth certain information as of February 27, 2015 with respect to our executive officers:
| Name | Age |
Position | ||
| David W. Williams | 57 | Chairman, President and Chief Executive Officer | ||
| Julie J. Robertson | 59 | Executive Vice President and Corporate Secretary | ||
| James A. MacLennan | 55 | Senior Vice President and Chief Financial Officer | ||
| William E. Turcotte | 51 | Senior Vice President and General Counsel | ||
| Simon W. Johnson | 44 | Senior Vice President – Marketing and Contracts | ||
| Scott W. Marks | 55 | Senior Vice President – Engineering | ||
| Bernie G. Wolford | 55 | Senior Vice President – Operations | ||
| Dennis J. Lubojacky | 62 | Vice President and Controller |
David W. Williams was named Chairman, President and Chief Executive Officer effective January 2, 2008. Mr. Williams served as Senior Vice President—Business Development of Noble Drilling Services Inc. from September 2006 to January 2007, as Senior Vice President—Operations of Noble Drilling Services Inc. from January to April 2007, and as Senior Vice President and Chief Operating Officer of Noble from April 2007 to January 2, 2008. Prior to September 2006, Mr. Williams served for more than five years as Executive Vice President of Diamond Offshore Drilling, Inc., an offshore oil and gas drilling contractor.
Julie J. Robertson was named Executive Vice President effective February 10, 2006. In this role, Ms. Robertson is responsible for overseeing human resources, procurement and supply chain, learning and development, health, safety and environmental functions, and information technology. Ms. Robertson served as Senior Vice President—Administration from July 2001 to February 10, 2006. Ms. Robertson has served continuously as Corporate Secretary since December 1993. Ms. Robertson served as Vice President—Administration of Noble Drilling from 1996 to July 2001. In 1994, Ms. Robertson became Vice President—Administration of Noble Drilling Services Inc. From 1989 to 1994, Ms. Robertson served consecutively as Manager of Benefits and Director of Human Resources for Noble Drilling Services Inc. Prior to 1989, Ms. Robertson served consecutively in the positions of Risk and Benefits Manager and Marketing Services Coordinator for a predecessor subsidiary of Noble, beginning in 1979.
James A. MacLennan was named Senior Vice President and Chief Financial Officer effective January 9, 2012. Prior to joining Noble, Mr. MacLennan served as Chief Financial Officer and Corporate Secretary of Ennis Traffic Safety Solutions, a leading producer of pavement marking materials, from January 2011 to December 2011.
114
Table of Contents
From June 2010 to January 2011, Mr. MacLennan did not hold a principal employment. Mr. MacLennan served as Executive Vice President and Chief Financial Officer of Lodgian, Inc., a publicly-traded independent owner and operator of hotels in the United States from March 2006 until Lodgian was acquired by and merged into Lone Star Funds in May 2010. Prior to joining Lodgian, Mr. MacLennan was Chief Financial Officer and Treasurer of Theragenics Corporation, a New York Stock Exchange-listed company that manufactures medical devices. Previously, Mr. MacLennan was Executive Vice President and Chief Financial Officer of Lanier Worldwide, Inc., a publicly-traded technical products company. Mr. MacLennan spent much of his early career in financial positions of increasing responsibility in the oil and gas industry, most notably with Exxon Corporation and later with Noble Corporation. Mr. MacLennan is a Chartered Accountant.
William E. Turcotte was named Senior Vice President and General Counsel effective December 16, 2008. Prior to joining Noble, Mr. Turcotte served as Senior Vice President, General Counsel and Corporate Secretary of Cornell Companies, Inc., a private corrections company, since March 2007. He served as Vice President, Associate General Counsel and Assistant Secretary of Transocean, Inc., an offshore oil and gas drilling contractor, from October 2005 to March 2007 and as Associate General Counsel and Assistant Secretary from January 2000 to October 2005. From 1992 to 2000, Mr. Turcotte served in various legal positions with Schlumberger Limited in Houston, Caracas and Paris. Mr. Turcotte was in private practice prior to joining Schlumberger.
Simon W. Johnson was named Senior Vice President - Marketing and Contracts effective 1 March 2014. Mr. Johnson joined Noble Corporation in 2010 and most recently served as Vice President - Marketing (Europe, Africa and Middle East). Prior to joining Noble, Mr. Johnson served as a Commercial Director at Seadrill Limited, an offshore driller. Mr. Johnson has held numerous international marketing roles in the offshore drilling industry during the past 16 years. His early career was spent in offshore and shorebase operations roles.
Scott W. Marks was named Senior Vice President – Engineering effective January 2007. Mr. Marks served as Vice President – Project Management and Construction from August 2006 to January 2007, as Vice President – Support Engineering from September 2005 to August 2006 and as Director of Engineering from January 2003 to September 2005. Mr. Marks has been with Noble since 1991, serving as a Project Manager and as a Drilling Superintendent prior to 2003.
Bernie G. Wolford was named Senior Vice President – Operations effective February 6, 2012. Mr. Wolford served as Vice President—Operational Excellence from March 2010 to February 2012. From January 2003 until March 2010, Mr. Wolford was self-employed. During that time, he provided consulting services to Noble as a contractor on the construction of the Noble Dave Beard from March 2009 to December 2009. He also supported the operations of Mass Technology Corp., an independent downstream refining and storage company, as a significant shareholder of that company, from February 2007 to February 2009. Mr. Wolford began his career in the offshore drilling industry with Transworld Drilling in 1981, which was acquired by Noble in 1991. From 1981 through December 2002, he served in various roles in engineering, project management and operations with Transworld and Noble.
Dennis J. Lubojacky was named Vice President and Controller effective April 27, 2012. In this position, Mr. Lubojacky also serves as principal accounting officer of Noble-UK. Since February 2010, Mr. Lubojacky has also served as Vice President and Chief Financial Officer of Noble-Cayman. Mr. Lubojacky has also served as Vice President and Controller of a subsidiary of Noble-UK from July 2007 through October 2011 and from January 2012 until his new appointment. Mr. Lubojacky served as principal financial officer and principal accounting officer of Noble Corporation from October 2011 through January 2012. From April 2006 to June 2007, he served as Controller and Chief Accounting Officer of TODCO, an oil and gas drilling contractor. Mr. Lubojacky is a Certified Public Accountant.
We have adopted a Code of Business Conduct and Ethics that applies to directors, officers and employees, including our principal executive officer, principal financial officer and principal accounting officer. Our Code of Business Conduct and Ethics is posted on our website at http://www.noblecorp.com in the “Governance” area. Changes to and waivers granted with respect to our Code of Business Conduct and Ethics related to the officers identified above, and our other executive officers and directors, that we are required to disclose pursuant to applicable rules and regulations of the SEC will also be posted on our website.
115
Table of Contents
| Item 11. | Executive Compensation. |
The sections entitled “Executive Compensation” and “Compensation Committee Report” appearing in the 2015 Proxy Statement set forth certain information with respect to the compensation of our management and our compensation committee report, and are incorporated in this report by reference.
| Item 12. | Security Ownership of Certain Beneficial Owners and Management and Related Stockholder Matters. |
The sections entitled “Equity Compensation Plan Information” and “Security Ownership of Certain Beneficial Owners and Management” appearing in the 2015 Proxy Statement set forth certain information with respect to securities authorized for issuance under equity compensation plans and the ownership of our voting securities and equity securities, and are incorporated in this report by reference.
| Item 13. | Certain Relationships and Related Transactions and Director Independence. |
The sections entitled “Additional Information Regarding the Board of Directors—Board Independence” and “Policies and Procedures Relating to Transactions with Related Persons” appearing in the 2015 Proxy Statement set forth certain information with respect to director independence and transactions with related persons, and are incorporated in this report by reference.
| Item 14. | Principal Accounting Fees and Services. |
The section entitled “Auditors” appearing in the 2015 Proxy Statement sets forth certain information with respect to accounting fees and services, and is incorporated in this report by reference.
| ITEM 15. | EXHIBITS, FINANCIAL STATEMENT SCHEDULES. |
| (a) | The following documents are filed as part of this report: |
| (1) | A list of the financial statements filed as a part of this report is set forth in Item 8 on page 53 and is incorporated herein by reference. |
| (2) | Financial Statement Schedules: |
All schedules are omitted because they are either not applicable or required information is shown in the financial statements or notes thereto.
| (3) | Exhibits: |
The information required by this Item 15(a)(3) is set forth in the Index to Exhibits accompanying this Annual Report on Form 10-K and is incorporated herein by reference.
116
Table of Contents
Pursuant to the requirements of Section 13 or 15(d) of the Securities Exchange Act of 1934, the Registrant has duly caused this report to be signed on its behalf by the undersigned, thereunto duly authorized.
Noble Corporation plc, a company registered under the laws of England and Wales
| Date: February 27, 2015 | By: | /s/ DAVID W. WILLIAMS | ||||
| David W. Williams Chairman, President and Chief Executive Officer |
Pursuant to the requirements of the Securities Exchange Act of 1934, this report has been signed by the following persons on behalf of the Registrant and in the capacities and on the dates indicated.
| Signature | Capacity In Which Signed | Date | ||
| /s/ DAVID W. WILLIAMS |
Chairman, President and | February 27, 2015 | ||
| David W. Williams | Chief Executive Officer | |||
| (Principal Executive Officer) | ||||
| /s/ JAMES A. MACLENNAN |
Senior Vice President and | February 27, 2015 | ||
| James A. MacLennan | Chief Financial Officer | |||
| (Principal Financial Officer) | ||||
| /s/ DENNIS J. LUBOJACKY |
Vice President and Controller | February 27, 2015 | ||
| Dennis J. Lubojacky | (Principal Accounting Officer) | |||
| /s/ ASHLEY ALMANZA |
Director | February 27, 2015 | ||
| Ashley Almanza | ||||
| /s/ MICHAEL A. CAWLEY |
Director | February 27, 2015 | ||
| Michael A. Cawley | ||||
| /s/ JULIE H. EDWARDS |
Director | February 27, 2015 | ||
| Julie H. Edwards | ||||
| /s/ GORDON T. HALL |
Director | February 27, 2015 | ||
| Gordon T. Hall | ||||
| /s/ SCOTT D. JOSEY |
Director | February 27, 2015 | ||
| Scott D. Josey | ||||
| /s/ JON A. MARSHALL |
Director | February 27, 2015 | ||
| Jon A. Marshall | ||||
| /s/ MARY P. RICCIARDELLO |
Director | February 27, 2015 | ||
| Mary P. Ricciardello | ||||
117
Table of Contents
SIGNATURES
Pursuant to the requirements of Section 13 or 15(d) of the Securities Exchange Act of 1934, the Registrant has duly caused this report to be signed on its behalf by the undersigned, thereunto duly authorized.
Noble Corporation, a Cayman Islands company
| Date: February 27, 2015 | By: | /s/ DAVID W. WILLIAMS | ||
| David W. Williams President, Chief Executive Officer and Director |
Pursuant to the requirements of the Securities Exchange Act of 1934, this report has been signed by the following persons on behalf of the Registrant and in the capacities and on the dates indicated.
| Signature | Capacity In Which Signed | Date | ||
| /s/ DAVID W. WILLIAMS |
President, Chief Executive Officer and | February 27, 2015 | ||
| David W. Williams | Director (Principal Executive Officer) | |||
| /s/ DENNIS J. LUBOJACKY |
Vice President, Chief Financial | February 27, 2015 | ||
| Dennis J. Lubojacky | Officer and Director | |||
| (Principal Financial and Accounting Officer) | ||||
| /s/ DAVID M.J. DUJACQUIER |
Director | February 27, 2015 | ||
| David M.J. Dujacquier | ||||
| /s/ ALAN R. HAY |
Director | February 27, 2015 | ||
| Alan R. Hay | ||||
| /s/ ANDREW J. STRONG |
Director | February 27, 2015 | ||
| Andrew J. Strong | ||||
118
Table of Contents
INDEX TO EXHIBITS
| Exhibit Number |
Exhibit | |
| 2.1 | Merger Agreement, dated as of June 30, 2013, between Noble Corporation, a Swiss corporation (“Noble-Swiss”) and Noble Corporation Limited (“Noble-UK”)(filed as Exhibit 2.1 to Noble-Swiss’ Current Report on Form 8-K filed on July 1, 2013 and incorporated herein by reference). | |
| 2.2 | Agreement and Plan of Merger, Reorganization and Consolidation, dated as of December 19, 2008, among Noble-Swiss, Noble Corporation, a Cayman Islands company (“Noble-Cayman”), and Noble Cayman Acquisition Ltd. (filed as Exhibit 1.1 to Noble-Cayman’s Current Report on Form 8-K filed on December 22, 2008 and incorporated herein by reference). | |
| 2.3 | Amendment No. 1 to Agreement and Plan of Merger, Reorganization and Consolidation, dated as of February 4, 2009, among Noble-Swiss, Noble-Cayman and Noble Cayman Acquisition Ltd. (filed as Exhibit 2.2 to Noble-Cayman’s Current Report on Form 8-K filed on February 4, 2009 and incorporated herein by reference). | |
| 2.4 | Master Separation Agreement, dated as of July 31, 2014, between Noble-Cayman and Paragon Offshore plc. (filed as Exhibit 2.1 to Noble-UK’s Current Report on Form 8-K filed on August 5, 2014 and incorporated herein by reference). | |
| 3.1 | Composite Copy of Articles of Association of Noble-UK, as of June 10, 2014 (filed as Exhibit 3.1 to Noble-UK’s Quarterly Report on Form 10-Q for the quarter ended September 30, 2014 and incorporated herein by reference). | |
| 3.2 | Memorandum and Articles of Association of Noble-Cayman (filed as Exhibit 3.1 to Noble-Cayman’s Current Report on Form 8-K filed on March 30, 2009 and incorporated herein by reference). | |
| 4.1 | Indenture dated as of March 1, 1999, between Noble Drilling Corporation and JP Morgan Chase Bank, National Association (formerly Chase Bank of Texas, National Association), as trustee (filed as Exhibit 4.1 to Noble Drilling Corporation’s Current Report on Form 8-K filed on March 23, 1999 and incorporated herein by reference). | |
| 4.2 | Supplemental Indenture dated as of March 16, 1999, between Noble Drilling Corporation and JP Morgan Chase Bank, National Association (formerly Chase Bank of Texas, National Association), as trustee, relating to 7.50% senior notes due 2019 of Noble Drilling Corporation (filed as Exhibit 4.2 to Noble Drilling Corporation’s Current Report on Form 8-K filed on March 23, 1999 and incorporated herein by reference). | |
| 4.3 | Second Supplemental Indenture, dated as of April 30, 2002, between Noble Drilling Corporation, Noble Holding (U.S.) Corporation and Noble Corporation, and JP Morgan Chase Bank, National Association, as trustee, relating to 7.50% senior notes due 2019 of Noble Drilling Corporation (filed as Exhibit 4.6 to Noble-Cayman’s Quarterly Report on Form 10-Q for the quarter ended March 31, 2002 and incorporated herein by reference). | |
| 4.4 | Third Supplemental Indenture, dated as of December 20, 2005, between Noble Drilling Corporation, Noble Drilling Holding LLC, Noble Holding (U.S.) Corporation and Noble Corporation and JP Morgan Chase Bank, National Association, as trustee, relating to 7.50% senior notes due 2019 of Noble Drilling Corporation (filed as Exhibit 4.14 to Noble-Cayman’s Registration Statement on Form S-3 (No. 333-131885) and incorporated herein by reference). | |
| 4.5 | Fourth Supplemental Indenture, dated as of September 25, 2009, among Noble Drilling Corporation, as Issuer, Noble Drilling Holding LLC, as Co-Issuer, Noble Drilling Services 1 LLC, as Co-Issuer, Noble Holding (U.S.) Corporation, as Guarantor, Noble-Cayman, as Guarantor, and The Bank of New York Mellon Trust Company, N.A., as Trustee (relating to Noble Drilling Corporation 7.50% Senior Notes due 2019) (filed as Exhibit 4.1 to Noble-Swiss’ Current Report on Form 8-K filed on October 1, 2009 and incorporated herein by reference). | |
119
Table of Contents
| 4.6 | Fifth Supplemental Indenture, dated as of October 1, 2009, among Noble Drilling Corporation, as Issuer, Noble Drilling Holding LLC, as Co-Issuer, Noble Drilling Services 6 LLC, as Co-Issuer, Noble Holding (U.S.) Corporation, as Guarantor, Noble-Cayman, as Guarantor, and The Bank of New York Mellon Trust Company, N.A., as Trustee (relating to Noble Drilling Corporation 7.50% Senior Notes due 2019) (filed as Exhibit 4.2 to Noble-Swiss’ Current Report on Form 8-K filed on October 1, 2009 and incorporated herein by reference). | |
| 4.7 | Indenture, dated as of May 26, 2006, between Noble Corporation, as Issuer, and JPMorgan Chase Bank, National Association, as trustee (filed as Exhibit 4.1 to Noble-Cayman’s Current Report on Form 8-K filed on May 26, 2006 and incorporated herein by reference). | |
| 4.8 | First Supplemental Indenture, dated as of May 26, 2006, between Noble Corporation, as Issuer, Noble Drilling Corporation, as Guarantor, and JP Morgan Chase Bank, National Association, as trustee, relating to 5.875% senior notes due 2013 of Noble Corporation (filed as Exhibit 4.2 to Noble-Cayman’s Current Report on Form 8-K filed on May 26, 2006 and incorporated herein by reference). | |
| 4.9 | Second Supplemental Indenture, dated as of October 1, 2009, among Noble-Cayman, as Issuer, Noble Drilling Corporation, as Guarantor, Noble Holding International Limited, as Guarantor, and The Bank of New York Mellon Trust Company, N.A., as Trustee (relating to Noble-Cayman’s 5.875% Senior Notes due 2013) (filed as Exhibit 4.3 to Noble-Swiss’ Current Report on Form 8-K filed on October 1, 2009 and incorporated herein by reference). | |
| 4.10 | Revolving Credit Agreement dated as of February 11, 2011 among Noble Corporation, a Cayman Islands company; the Lenders from time to time parties thereto; Wells Fargo Bank, National Association, as Administrative Agent, Swingline Lender and an Issuing Bank; Barclays Capital, a division of Barclays Bank PLC, and HSBC Securities (USA) Inc., as Co-Syndication Agents; and Wells Fargo Securities, LLC, Barclays Capital, a division of Barclays Bank PLC, and HSBC Securities (USA) Inc., as Joint Lead Arrangers and Joint Lead Bookrunners (filed as Exhibit 4.1 to Noble-Cayman’s Current Report on Form 8-K filed on February 17, 2011 and incorporated herein by reference). | |
| 4.11 | First Amendment to Revolving Credit Agreement dated as of March 11, 2011 among Noble Corporation, a Cayman Islands company; the Lenders from time to time parties thereto; Wells Fargo Bank, National Association, as Administrative Agent, Swingline Lender and an Issuing Bank; Barclays Capital, a division of Barclays Bank PLC and HSBC Securities (USA) Inc., as Co-Syndication Agents; and Wells Fargo Securities, LLC, Barclays Capital, a division of Barclays Bank PLC, and HSBC Securities (USA) Inc., as Joint Lead Arrangers and Joint Lead Bookrunners (filed as Exhibit 4.2 to Noble-Swiss’ Quarterly Report on Form 10-Q for the quarter ended March 31, 2011 and incorporated herein by reference). | |
| 4.12 | Second Amendment to Revolving Credit Agreement dated as of January 11, 2013 among Noble Corporation, a Cayman Islands company; the Lenders from time to time parties thereto; Wells Fargo Bank, National Association, as Administrative Agent, Swingline Lender and an Issuing Bank; Barclays Capital, a division of Barclays Bank PLC and HSBC Securities (USA) Inc., as Co-Syndication Agents; and Wells Fargo Securities, LLC, Barclays Capital, a division of Barclays Bank PLC, and HSBC Securities (USA) Inc., as Joint Lead Arrangers and Joint Lead Bookrunners (filed as Exhibit 4.12 to Noble-Swiss’ Annual Report on Form 10-K for the year ended December 31, 2012 and incorporated herein by reference). | |
| 4.13 | Third Amendment to Revolving Credit Agreement dated as of December 6, 2013, by and among Noble-Cayman, as borrower, Wells Fargo Bank, National Association, as administrative agent, and the lenders party thereto, and consented and agreed to by Noble Drilling Corporation and Noble Holding International Limited, as guarantors (filed as Exhibit 4.1 to Noble-UK’s Current Report on Form 8-K filed on December 12, 2013 and incorporated herein by reference). | |
120
Table of Contents
| 4.14 | Indenture, dated as of November 21, 2008, between Noble Holding International Limited, as Issuer, and The Bank of New York Mellon Trust Company, N.A., as Trustee (filed as Exhibit 4.1 to Noble-Cayman’s Current Report on Form 8-K filed on November 21, 2008 and incorporated herein by reference). | |
| 4.15 | First Supplemental Indenture, dated as of November 21, 2008, among Noble Holding International Limited, as Issuer, Noble Corporation, as Guarantor, and The Bank of New York Mellon Trust Company, N.A., as Trustee, relating to 7.375% senior notes due 2014 of Noble Holding International Limited (filed as Exhibit 4.2 to Noble-Cayman’s Current Report on Form 8-K filed on November 21, 2008 and incorporated herein by reference). | |
| 4.16 | Second Supplemental Indenture, dated as of July 26, 2010, among Noble Holding International Limited, as Issuer, Noble Corporation, as Guarantor, and The Bank of New York Mellon Trust Company, N.A., as Trustee, relating to 3.45% senior notes due 2015 of Noble Holding International Limited, 4.90% senior notes due 2020 of Noble Holding International Limited, and 6.20% senior notes due 2040 of Noble Holding International Limited (filed as Exhibit 4.2 to Noble-Cayman’s Current Report on Form 8-K filed on July 26, 2010 and incorporated herein by reference). | |
| 4.17 | Third Supplemental Indenture, dated as of February 3, 2011, among Noble Holding International Limited, as Issuer, Noble Corporation, as Guarantor, and The Bank of New York Mellon Trust Company, N.A., as Trustee, relating to 3.05% senior notes due 2016 of Noble Holding International Limited, 4.625% senior notes due 2021 of Noble Holding International Limited, and 6.05% senior notes due 2041 of Noble Holding International Limited (filed as Exhibit 4.1 to Noble-Cayman’s Current Report on Form 8-K filed on February 3, 2011 and incorporated herein by reference). | |
| 4.18 | Fourth Supplemental Indenture, dated as of February 10, 2012, among Noble Holding International Limited, as Issuer, Noble Corporation, as Guarantor, and The Bank of New York Mellon Trust Company, N.A., as Trustee, relating to 2.5% senior notes due 2017 of Noble Holding International Limited, 3.95% senior notes due 2022 of Noble Holding International Limited, and 5.25% senior notes due 2042 of Noble Holding International Limited (filed as Exhibit 4.2 to Noble-Cayman’s Current Report on Form 8-K filed on February 13, 2012 and incorporated herein by reference). | |
| 4.19 | Revolving Credit Agreement dated as of June 8, 2012 among Noble Corporation, a Cayman Islands company; the Lenders from time to time parties thereto; Wells Fargo Bank, National Association, as Administrative Agent, Swingline Lender and an Issuing Bank; SunTrust Bank, as Syndication Agent; Barclays Bank PLC, HSBC Securities (USA) Inc. and The Bank of Tokyo-Mitsubishi UFJ, Ltd., as Co-Documentation Agents; and Wells Fargo Securities, LLC, SunTrust Robinson Humphrey, Inc., Barclays Bank PLC, HSBC Securities (USA) Inc. and The Bank of Tokyo-Mitsubishi UFJ, Ltd., as Joint Lead Arrangers and Joint Lead Bookrunners (filed as Exhibit 4.1 to Noble-Swiss’ Current Report on Form 8-K filed on June 11, 2012 and incorporated herein by reference). | |
| 4.20 | First Amendment to Revolving Credit Agreement dated as of December 6, 2013, by and among Noble-Cayman, as borrower, Wells Fargo Bank, National Association, as administrative agent, and the lenders party thereto, and consented and agreed to by Noble Drilling Corporation and Noble Holding International Limited, as guarantors (filed as Exhibit 4.2 to Noble-UK’s Current Report on Form 8-K filed on December 12, 2013 and incorporated herein by reference). | |
| 4.21 | Guaranty Agreement dated as of June 8, 2012, between Noble Drilling Corporation, a Delaware corporation, and Wells Fargo Bank, National Association (filed as Exhibit 4.2 to Noble-Swiss’ Current Report on Form 8-K filed on June 11, 2012 and incorporated herein by reference). | |
| 4.22 | Guaranty Agreement dated as of June 8, 2012, between Noble Holding International Limited, a Cayman Islands company, and Wells Fargo Bank, National Association (filed as Exhibit 4.3 to Noble-Swiss’ Current Report on Form 8-K filed on June 11, 2012 and incorporated herein by reference). | |
121
Table of Contents
| 4.23 | 364-Day Revolving Credit Agreement dated as of August 22, 2013 among Noble Corporation, a Cayman Islands company; the Lenders from time to time parties thereto; JPMorgan Chase Bank, N.A., as Administrative Agent and Swingline Lender; Barclays Bank PLC, Citibank, N.A., Deutsche Bank Securities, Inc. and Wells Fargo Bank, National Association, as Co-Syndication Agents; and BNP Paribas, Credit Agricole Corporate & Investment Bank, Credit Suisse AG, Cayman Islands Branch, Goldman Sachs Bank USA, HSBC Bank USA, N.A., SunTrust Bank and The Bank of Tokyo-Mitsubishi UFJ, LTD., as Co-Documentation agents (filed as Exhibit 4.1 to Noble-Swiss’ Current Report on Form 8-K filed on August 22, 2013 and incorporated herein by reference). | |
| 4.24 | First Amendment to 364-Day Revolving Credit Agreement dated as of December 6, 2013, by and among Noble-Cayman, as borrower, JPMorgan Chase Bank, N.A., as administrative agent, and the lenders party thereto, and consented and agreed to by Noble Drilling Corporation and Noble Holding International Limited, as guarantors (filed as Exhibit 4.3 to Noble-UK’s Current Report on Form 8-K filed on December 12, 2013 and incorporated herein by reference). | |
| 4.25 | Guaranty Agreement dated as of August 22, 2013 between Noble Drilling Corporation, a Delaware corporation, and JPMorgan Chase Bank, N.A. (filed as Exhibit 4.2 to Noble-Swiss’ Current Report on Form 8-K filed on August 22, 2013 and incorporated herein by reference). | |
| 4.26 | Guaranty Agreement dated as of August 22, 2013 between Noble Holding International Limited, a Cayman Islands company, and JPMorgan Chase Bank, N.A. (filed as Exhibit 4.3 to Noble-Swiss’ Current Report on Form 8-K filed on August 22, 2013 and incorporated herein by reference). | |
| 4.27 | Second Amendment to 364-Day Revolving Credit Agreement dated as of August 18, 2014, by and among Noble-Cayman, as borrower, JPMorgan Chase Bank, N.A., as administrative agent, and the lenders party thereto, and consented and agreed to by Noble Holding (U.S.) Corporation and Noble Holding International Limited, as guarantors (filed as Exhibit 4.1 to Noble-UK’s Current Report on Form 8-K filed on August 20, 2014 and incorporated herein by reference). | |
| 4.28 | Revolving Credit Agreement dated as of January 26, 2015, among Noble-Cayman and Noble International Finance Company, a Cayman Islands company, as borrowers; JPMorgan Chase Bank, N.A., as administrative agent and a swingline lender; Wells Fargo Bank, National Association, as a swingline lender; the lenders party thereto; Barclays Bank PLC, Citibank, N.A., DNB Bank ASA New York Branch, HSBC Bank USA, N.A., SunTrust Bank and Wells Fargo, as co-syndication agents; BNP Paribas, Credit Suisse AG, Cayman Islands Branch and Mizuho Bank, Ltd, as co-documentation agents; and J.P. Morgan Securities LLC, Barclays Bank PLC, Citigroup Global Markets Inc., DNB Markets, Inc., HSBC Securities (USA) Inc., SunTrust Robinson Humphrey, Inc. and Wells Fargo Securities, LLC, as joint lead arrangers and joint lead bookrunners (filed as Exhibit 4.1 to Noble-UK’s Current Report on Form 8-K filed on January 29, 2015 and incorporated herein by reference). | |
| 4.29 | 364-Day Revolving Credit Agreement dated as of January 29, 2015, among Noble-Cayman and Noble International Finance Company, a Cayman Islands company, as borrowers; JPMorgan, as administrative agent; the lenders party thereto; Barclays Bank PLC, Citibank, N.A. and HSBC Bank USA, N.A., as co-syndication agents; BNP Paribas, as documentation agent; and J.P. Morgan Securities LLC, Barclays Bank PLC, Citigroup Global Markets Inc., and HSBC Securities (USA) Inc., as joint lead arrangers and joint lead bookrunners (filed as Exhibit 4.2 to Noble-UK’s Current Report on Form 8-K filed on January 29, 2015 and incorporated herein by reference). | |
| 10.1* | Noble Drilling Corporation Equity Compensation Plan for Non-Employee Directors (filed as Exhibit 4.1 to Noble Drilling Corporation’s Registration Statement on Form S-8 (No. 333-17407) dated December 6, 1996 and incorporated herein by reference). | |
122
Table of Contents
| 10.2* | Amendment, effective as of May 1, 2002, to the Noble Drilling Corporation Equity Compensation Plan for Non-Employee Directors (filed as Exhibit 10.1 to Post-Effective Amendment No. 1 to Noble-Cayman’s Registration Statement on Form S-8 (No. 333-17407) and incorporated herein by reference). | |
| 10.3* | Amendment No. 2 to the Noble Corporation Equity Compensation Plan for Non-Employee Directors dated February 4, 2005 (filed as Exhibit 10.20 to Noble-Cayman’s Annual Report on Form 10-K for the year ended December 31, 2004 and incorporated herein by reference). | |
| 10.4* | Amendment to the Noble Corporation Equity Compensation Plan for Non-Employee Directors dated December 31, 2008 (filed as Exhibit 10.29 to Noble-Cayman’s Annual Report on Form 10-K for the year ended December 31, 2008 and incorporated herein by reference). | |
| 10.5* | Amended and Restated Noble Corporation Equity Compensation Plan for Non-Employee Directors effective March 27, 2009 (filed as Exhibit 10.5 to Noble-Swiss’ Annual Report on Form 10-K for the year ended December 31, 2010 and incorporated herein by reference). | |
| 10.6* | Noble Corporation Equity Compensation Plan for Non-Employee Directors, effective as of November 20, 2013 (filed as Exhibit 10.7 to Noble-UK’s Current Report on Form 8-K filed on November 20, 2013 and incorporated herein by reference). | |
| 10.7* | Noble Drilling Corporation 401(k) Savings Restoration Plan (filed as Exhibit 10.1 to Noble Drilling Corporation’s Registration Statement on Form S-8 dated January 18, 2001 (No. 333-53912) and incorporated herein by reference). | |
| 10.8* | Amendment No. 1 to the Noble Drilling Corporation 401(k) Savings Restoration Plan (filed as Exhibit 10.1 to Post-Effective Amendment No. 1 to Noble-Cayman’s Registration Statement on Form S-8 (No. 333-53912) and incorporated herein by reference). | |
| 10.9* | Amendment No. 2 to the Noble Drilling Corporation 401(k) Savings Restoration Plan dated February 25, 2003 (filed as Exhibit 10.30 to Noble-Cayman’s Annual Report on Form 10-K for the year ended December 31, 2005 and incorporated herein by reference). | |
| 10.10* | Amendment No. 3 to the Noble Drilling Corporation 401(k) Savings Restoration Plan dated March 9, 2005 (filed as Exhibit 10.31 to Noble-Cayman’s Annual Report on Form 10-K for the year ended December 31, 2005 and incorporated herein by reference). | |
| 10.11* | Amendment No. 4 to the Noble Drilling Corporation 401(k) Savings Restoration Plan dated March 30, 2007 (filed as Exhibit 10.41 to Noble-Cayman’s Annual Report on Form 10-K for the year ended December 31, 2007 and incorporated herein by reference). | |
| 10.12* | Amendment No. 5 to the Noble Drilling Corporation 401(k) Savings Restoration Plan effective May 1, 2010 (filed as Exhibit 10.11 to Noble-Swiss’ Annual Report on Form 10-K for the year ended December 31, 2010 and incorporated herein by reference). | |
| 10.13* | Noble Drilling Corporation Retirement Restoration Plan dated April 27, 1995 (filed as Exhibit 10.2 to Noble Drilling Corporation’s Quarterly Report on Form 10-Q for the quarter ended March 31, 1995 and incorporated herein by reference). | |
| 10.14* | Amendment No. 1 to the Noble Drilling Corporation Retirement Restoration Plan dated January 29, 1998 (filed as Exhibit 10.18 to Noble Drilling Corporation’s Annual Report on Form 10-K for the year ended December 31, 1997 and incorporated herein by reference). | |
| 10.15* | Amendment No. 2 to the Noble Drilling Corporation Retirement Restoration Plan dated June 28, 2004, effective as of July 1, 2004 (filed as Exhibit 10.32 to Noble-Cayman’s Annual Report on Form 10-K for the year ended December 31, 2005 and incorporated herein by reference). | |
123
Table of Contents
| 10.16* | Noble Drilling Corporation Retirement Restoration Plan dated December 29, 2008, effective January 1, 2009 (filed as Exhibit 10.32 to Noble-Cayman’s Annual Report on Form 10-K for the year ended December 31, 2008 and incorporated herein by reference). | |
| 10.17* | Amendment No. 1 to Noble Drilling Corporation Retirement Restoration Plan dated July 10, 2009 (filed as Exhibit 10.16 to Noble-Swiss’ Annual Report on Form 10-K for the year ended December 31, 2010 and incorporated herein by reference). | |
| 10.18* | Amended and Restated Noble Corporation 1992 Nonqualified Stock Option and Restricted Share Plan for Non-Employee Directors dated February 4, 2005 (filed as Exhibit 10.21 to Noble-Cayman’s Annual Report on Form 10-K for the year ended December 31, 2004 and incorporated herein by reference). | |
| 10.19* | Second Amended and Restated Noble Corporation 1992 Nonqualified Stock Option and Share Plan for Non-Employee Directors (filed as Exhibit 10.2 to Noble-Cayman’s Quarterly Report on Form 10-Q for the quarter ended September 25, 2007 and incorporated herein by reference). | |
| 10.20* | Amendment to the Second Amended and Restated Noble Corporation 1992 Nonqualified Stock Option and Share Plan for Non-Employee Directors dated December 31, 2008 (filed as Exhibit 10.28 to Noble-Cayman’s Annual Report on Form 10-K for the year ended December 31, 2008 and incorporated herein by reference). | |
| 10.21* | Third Amendment to Second Amended and Restated Noble Corporation 1992 Nonqualified Stock Option and Share Plan for Non-Employee Directors effective March 27, 2009 (filed as Exhibit 10.20 to Noble-Cayman’s Annual Report on Form 10-K for the year ended December 31, 2010 and incorporated herein by reference). | |
| 10.22* | Fourth Amended and Restated Noble Corporation 1992 Nonqualified Stock Option and Share Plan for Non-Employee Directors effective February 1, 2013 (filed as Exhibit 10.1 to Noble-Swiss’ Current Report on Form 8-K filed on February 5, 2013 and incorporated herein by reference). | |
| 10.23* | Fifth Amended and Restated Noble Corporation 1992 Nonqualified Stock Option and Share Plan for Non-Employee Directors, effective as of November 20, 2013 (filed as Exhibit 10.6 to Noble-UK’s Current Report on Form 8-K filed on November 20, 2013 and incorporated herein by reference). | |
| 10.24* | Sixth Amended and Restated Noble Corporation 1992 Nonqualified Stock Option and Share Plan for Non-Employee Directors, effective as of January 30, 2014 (filed as Exhibit 10.24 to Noble-UK’s Annual Report on Form 10-K for the year ended December 31, 2013 and incorporated herein by reference). | |
| 10.25* | Composite copy of the Noble Corporation 1991 Stock Option and Restricted Stock Plan dated as of February 6, 2010 (filed as Exhibit 10.18 to Noble-Cayman’s Annual Report on Form 10-K for the year ended December 31, 2009 and incorporated herein by reference). | |
| 10.26* | Third Amendment to the Noble Corporation 1991 Stock Option and Restricted Stock Plan, effective as of February 3, 2012 (filed as Exhibit 10.2 to Noble-Cayman’s Current Report on Form 8-K filed on February 7, 2012 and incorporated herein by reference). | |
| 10.27* | Amended and Restated 1991 Stock Option and Restricted Stock Plan (filed as Exhibit 10.2 to Noble-Cayman’s Current Report on Form 8-K filed on April 30, 2012 and incorporated herein by reference). | |
| 10.28* | Noble Corporation 1991 Stock Option and Restricted Stock Plan, effective as of November 20, 2013 (filed as Exhibit 10.5 to Noble-UK’s Current Report on Form 8-K filed on November 20, 2013 and incorporated herein by reference). | |
124
Table of Contents
| 10.29* | Noble Corporation 1991 Stock Option and Restricted Stock Plan, effective as of January 30, 2014 (filed as Exhibit 10.29 to Noble-UK’s Annual Report on Form 10-K for the year ended December 31, 2013 and incorporated herein by reference). | |
| 10.30* | Noble Drilling Corporation 2009 401(k) Savings Restoration Plan effective January 1, 2009 (filed as Exhibit 10.31 to Noble-Cayman’s Annual Report on Form 10-K for the year ended December 31, 2008 and incorporated herein by reference). | |
| 10.31* | Amendment No. 1 to the Noble Drilling Corporation 2009 401(k) Savings Restoration Plan effective May 1, 2010 (filed as Exhibit 10.23 to Noble-Swiss’ Annual Report on Form 10-K for the year ended December 31, 2010 and incorporated herein by reference). | |
| 10.32* | Amendment No. 2 to the Noble Drilling Corporation 2009 401(k) Savings Restoration Plan effective November 1, 2013 (filed as Exhibit 10.32 to Noble-UK’s Annual Report on Form 10-K for the year ended December 31, 2013 and incorporated herein by reference). | |
| 10.33* | Noble Corporation Summary of Directors’ Compensation. | |
| 10.34* | Form of Noble Corporation Performance-Vested Restricted Stock Agreement under the Noble Corporation 1991 Stock Option and Restricted Stock Plan (filed as Exhibit 10.2 to Noble-Cayman’s Quarterly Report on Form 10-Q for the quarter ended March 31, 2011 and incorporated herein by reference). | |
| 10.35* | Form of Noble Corporation Time-Vested Restricted Stock Unit Agreement under the Noble Corporation 1991 Stock Option and Restricted Stock Plan (filed as Exhibit 10.2 to Noble-Cayman’s Current Report on Form 8-K filed on January 13, 2012 and incorporated herein by reference). | |
| 10.36* | Form of Noble Corporation Nonqualified Stock Option Agreement under the Noble Corporation 1991 Stock Option and Restricted Stock Plan (filed as Exhibit 10.3 to Noble-Cayman’s Current Report on Form 8-K filed on January 13, 2012 and incorporated herein by reference). | |
| 10.37* | Form of Noble Corporation Performance-Vested Restricted Stock Unit Agreement under the Noble Corporation 1991 Stock Option and Restricted Stock Plan (filed as Exhibit 10.7 to Noble-Cayman’s Quarterly Report on Form 10-Q for the quarter ended March 31, 2012 and incorporated herein by reference). | |
| 10.38* | Form of Noble Corporation Performance-Vested Restricted Stock Unit Agreement under the Noble Corporation 1991 Stock Option and Restricted Stock Plan (filed as Exhibit 4.12 to Noble-Swiss’ Annual Report on Form 10-K for the year ended December 31, 2012 and incorporated herein by reference). | |
| 10.39* | Form of Noble Corporation Performance-Vested Restricted Stock Unit Award under the Noble Corporation 1991 Stock Option and Restricted Stock Plan (filed as Exhibit 10.39 to Noble-UK’s Annual Report on Form 10-K for the year ended December 31, 2013 and incorporated herein by reference). | |
| 10.40* | Form of Noble Corporation Time-Vested Restricted Stock Unit Award under the Noble Corporation 1991 Stock Option and Restricted Stock Plan (filed as Exhibit 10.40 to Noble-UK’s Annual Report on Form 10-K for the year ended December 31, 2013 and incorporated herein by reference). | |
| 10.41* | Amended and Restated Form of Noble-UK 2013 Performance-Vested Restricted Stock Unit Award under the Noble-UK 1991 Stock Option and Restricted Stock Plan (filed as Exhibit 10.1 to Noble-UK’s Current Report on Form 8-K for the year filed on October 16, 2014 and incorporated herein by reference). | |
125
Table of Contents
| 10.42* | Amended and Restated Form of Noble-UK 2014 Performance-Vested Restricted Stock Unit Award under the Noble-UK 1991 Stock Option and Restricted Stock Plan (filed as Exhibit 10.2 to Noble-UK’s Current Report on Form 8-K for the year filed on October 16, 2014 and incorporated herein by reference). | |
| 10.43* | Noble Corporation 2012 Short Term Incentive Plan (filed as Exhibit 10.6 to Noble-Cayman’s Quarterly Report on Form 10-Q for the quarter ended March 31, 2012 and incorporated herein by reference). | |
| 10.44* | Noble Corporation 2013 Short Term Incentive Plan (filed as Exhibit 10.41 to Noble-Swiss’ Annual Report on Form 10-K for the year ended December 31, 2012 and incorporated herein by reference). | |
| 10.45* | Noble Corporation 2013 Short Term Incentive Plan, effective as of November 20, 2013 (filed as Exhibit 10.8 to Noble-UK’s Current Report on Form 8-K filed on November 20, 2013 and incorporated herein by reference). | |
| 10.46* | Noble Corporation 2014 Short Term Incentive Plan (filed as Exhibit 10.5 to Noble-UK’s Quarterly Report on Form 10-Q for the quarter ended September 30, 2014 and incorporated herein by reference). | |
| 10.47* | Form of Restated Employment Agreement and Guaranty Agreement (2009 Form) (filed as Exhibit 10.2 to Noble-UK’s Current Report on Form 8-K filed on November 20, 2013 and incorporated herein by reference). | |
| 10.48* | Form of Restated Employment Agreement and Guaranty Agreement (2011 Form) (filed as Exhibit 10.3 to Noble-UK’s Current Report on Form 8-K filed on November 20, 2013 and incorporated herein by reference). | |
| 10.49* | Form of Restated Employment Agreement and Guaranty Agreement (2012 Form) (filed as Exhibit 10.4 to Noble-UK’s Current Report on Form 8-K filed on November 20, 2013 and incorporated herein by reference). | |
| 10.50* | Form of Commercial Paper Dealer Agreement dated as of September 19, 2012 between Noble Corporation, a Cayman Islands company, Noble Holding International Limited, a Cayman Islands company, Noble Drilling Corporation, a Delaware corporation, and certain investment banks (filed as Exhibit 10.1 to Noble-Swiss’ Current Report on Form 8-K filed on September 19, 2012 and incorporated herein by reference). | |
| 10.51* | Form of Issuing and Paying Agent Agreement dated as of September 19, 2012 between Noble Corporation, a Cayman Islands company, and the Issuing and Paying Agent (filed as Exhibit 10.2 to Noble-Swiss’ Current Report on Form 8-K filed on September 19, 2012 and incorporated herein by reference). | |
| 10.52* | Form of Indemnity Agreement (filed as Exhibit 10.1 to Noble-UK’s Current Report on Form 8-K filed on November 20, 2013 and incorporated herein by reference). | |
| 10.53 | Tax Sharing Agreement, dated as of July 31, 2014, between Noble-UK and Paragon Offshore plc. (filed as Exhibit 10.1 to Noble-UK’s Current Report on Form 8-K filed on August 5, 2014 and incorporated herein by reference). | |
| 10.54 | Employee Matters Agreement, dated as of July 31, 2014, between Noble-Cayman and Paragon Offshore plc. (filed as Exhibit 10.2 to Noble-UK’s Current Report on Form 8-K filed on August 5, 2014 and incorporated herein by reference). | |
126
Table of Contents
| 10.55 | Transition Services Agreement, dated as of July 31, 2014, between Noble-Cayman and Paragon Offshore plc. (filed as Exhibit 10.3 to Noble-UK’s Current Report on Form 8-K filed on August 5, 2014 and incorporated herein by reference). | |
| 10.56 | Transition Services Agreement (Brazil), dated as of July 31, 2014, among Paragon Offshore do Brasil Limitada, Paragon Offshore (Nederland) B.V., Paragon Offshore plc, Noble-Cayman, Noble Dave Beard Limited and Noble Drilling (Nederland) II B.V. (filed as Exhibit 10.4 to Noble-UK’s Current Report on Form 8-K filed on August 5, 2014 and incorporated herein by reference). | |
| 21.1 | Subsidiaries of Noble-UK and Noble-Cayman. | |
| 23.1 | Consent of PricewaterhouseCoopers LLP. | |
| 31.1 | Certification of David W. Williams pursuant to SEC Rule 13a-14(a) or Rule 15d-14(a). | |
| 31.2 | Certification of James A. MacLennan pursuant to SEC Rule 13a-14(a) or Rule 15d-14(a). | |
| 31.3 | Certification of Dennis J. Lubojacky pursuant to SEC Rule 13a-14(a) or Rule 15d-14(a). | |
| 32.1+ | Certification of David W. Williams pursuant to 18 U.S.C. Section 1350, as Adopted Pursuant to Section 906 of the Sarbanes-Oxley Act of 2002. | |
| 32.2+ | Certification of James A. MacLennan pursuant to 18 U.S.C. Section 1350, as Adopted Pursuant to Section 906 of the Sarbanes-Oxley Act of 2002. | |
| 32.3+ | Certification of Dennis J. Lubojacky pursuant to 18 U.S.C. Section 1350, as Adopted Pursuant to Section 906 of the Sarbanes-Oxley Act of 2002. | |
| 101 | Interactive data files | |
* Management contract or compensatory plan or arrangement.
+ Furnished in accordance with Item 601(b)(32)(ii) of Regulation S-K.
127