Attached files
| file | filename |
|---|---|
| EX-23.4 - EX-23.4 - National Commerce Corp | d837527dex234.htm |
| EX-23.3 - EX-23.3 - National Commerce Corp | d837527dex233.htm |
| EX-10.10 - EX-10.10 - National Commerce Corp | d837527dex1010.htm |
| EX-5.1 - EX-5.1 - National Commerce Corp | d837527dex51.htm |
| EX-4.1 - EX-4.1 - National Commerce Corp | d837527dex41.htm |
| EX-23.2 - EX-23.2 - National Commerce Corp | d837527dex232.htm |
Table of Contents
Index to Financial Statements
As filed with the Securities and Exchange Commission on February 27, 2015
Registration No. 333-201371
UNITED STATES
SECURITIES AND EXCHANGE COMMISSION
Washington, D.C. 20549
AMENDMENT NO. 1
TO
FORM S-1
REGISTRATION STATEMENT
UNDER
THE SECURITIES ACT OF 1933
NATIONAL COMMERCE CORPORATION
(Exact name of registrant as specified in its charter)
| Delaware (State or other jurisdiction of incorporation or organization) |
6021 (Primary Standard Industrial Classification Code Number) |
20-8627710 (I.R.S. Employer Identification No.) |
813 Shades Creek Parkway, Suite 100
Birmingham, Alabama 35209
(205) 313-8100
(Address, including zip code, and telephone number, including area code, of registrant’s principal executive offices)
John H. Holcomb, III
Chairman and Chief Executive Officer
813 Shades Creek Parkway, Suite 100
Birmingham, Alabama 35209
(205) 313-8100
(Name, address, including zip code, and telephone number, including area code, of agent for service)
(Copies of all communications, including communications sent to agent for service)
| Timothy W. Gregg, Esq. Andrew S. Nix, Esq. Maynard, Cooper & Gale, P.C. 1901 Sixth Avenue North 2400 Regions/Harbert Plaza Birmingham, Alabama 35203 (205) 254-1000 |
Frank M. Conner, III, Esq. Michael P. Reed, Esq. Covington & Burling LLP One CityCenter 850 Tenth Street, N.W. Washington, D.C. 20001 (202) 662-6000 |
Approximate date of commencement of proposed sale to the public: As soon as practicable after this registration statement becomes effective.
If any of the securities being registered on this Form are to be offered on a delayed or continuous basis pursuant to Rule 415 under the Securities Act of 1933 check the following box: ¨
If this Form is filed to register additional securities for an offering pursuant to Rule 462(b) under the Securities Act, check the following box and list the Securities Act registration statement number of the earlier effective registration statement for the same offering. ¨
If this Form is a post-effective amendment filed pursuant to Rule 462(c) under the Securities Act, check the following box and list the Securities Act registration statement number of the earlier effective registration statement for the same offering. ¨
If this Form is a post-effective amendment filed pursuant to Rule 462(d) under the Securities Act, check the following box and list the Securities Act registration statement number of the earlier effective registration statement for the same offering. ¨
Indicate by check mark whether the registrant is a large accelerated filer, an accelerated filer, a non-accelerated filer, or a smaller reporting company. See the definitions of “large accelerated filer,” “accelerated filer” and “smaller reporting company” in Rule 12b-2 of the Exchange Act. (Check one):
| Large accelerated filer |
¨ |
Accelerated filer |
¨ | |||
| Non-accelerated filer |
¨ (Do not check if a smaller reporting company) |
Smaller reporting company |
x | |||
The registrant is an “emerging growth company,” as defined in Section 2(a) of the Securities Act of 1933, as amended. This registration statement complies with the requirements that apply to an issuer that is an emerging growth company.
The registrant hereby amends this registration statement on such date or dates as may be necessary to delay its effective date until the registrant shall file a further amendment which specifically states that this registration statement shall thereafter become effective in accordance with Section 8(a) of the Securities Act or until the registration statement shall become effective on such date as the Securities and Exchange Commission, acting pursuant to said Section 8(a), may determine.
Table of Contents
Index to Financial Statements
The information in this preliminary prospectus is not complete and may be changed. Neither we nor the selling shareowner may sell any of these securities until the registration statement filed with the Securities and Exchange Commission is effective. This preliminary prospectus is not an offer to sell these securities, and it is not soliciting an offer to buy these securities, in any jurisdiction where the offer or sale is not permitted.
SUBJECT TO COMPLETION, DATED FEBRUARY 27, 2015
PRELIMINARY PROSPECTUS

Shares
National Commerce Corporation
Common Stock
This is the initial public offering of common stock of National Commerce Corporation. We are a bank holding company headquartered in Birmingham, Alabama. We operate two subsidiary banks – National Bank of Commerce and United Legacy Bank. Through our subsidiary banks, we provide a broad array of financial services to businesses, business owners and professionals through eight full-service banking offices in Alabama and seven full-service banking offices in Central Florida. We also own a majority stake in a transaction-based finance company that provides factoring, invoicing, collection and accounts receivable management services to transportation companies and automotive parts and service providers.
We are offering shares of our common stock, and the selling shareowner identified in this prospectus is offering shares of our common stock. We will not receive any of the proceeds from the sale of shares of our common stock by the selling shareowner.
Prior to this offering, there has been no established public market for our common stock. It is currently estimated that the initial public offering price per share of our common stock will be between $ and $ per share. We have applied to list our common stock on the NASDAQ Global Select Market under the symbol “NCOM.”
We are an “emerging growth company,” as defined under the federal securities laws, and will, therefore, be subject to reduced reporting requirements. See “Implications of Being an Emerging Growth Company.”
Investing in our common stock involves risks. See “Risk Factors” beginning on page 19.
| Per Share | Total | |||||||
| Initial public offering price |
$ | $ | ||||||
| Underwriting discounts |
$ | $ | ||||||
| Proceeds to us (before expenses) |
$ | $ | ||||||
| Proceeds to the selling shareowner (before expenses) |
$ | $ | ||||||
We have granted the underwriters the right to purchase up to additional shares of our common stock at the initial public offering price, less the underwriting discount, for a period of up to 30 days after the date of this prospectus to cover over-allotments.
Neither the Securities and Exchange Commission nor any state securities commission has approved or disapproved of these securities or determined if this prospectus is truthful or complete. Any representation to the contrary is a criminal offense.
The shares of our common stock to be issued are not deposits or savings accounts or other obligations of any of our bank or non-bank subsidiaries and are not insured by the Federal Deposit Insurance Corporation or any other governmental agency.
The underwriters expect to deliver the shares of our common stock to investors on or about , 2015.
| Keefe, Bruyette & Woods
A Stifel Company | ||||
| Raymond James |
Sterne Agee | FIG Partners, LLC |
The date of this prospectus is , 2015.
Table of Contents
Index to Financial Statements
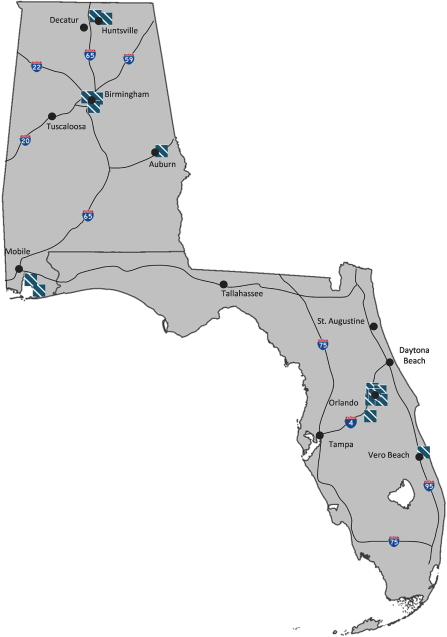
Table of Contents
Index to Financial Statements
| ii | ||||
| iii | ||||
| iii | ||||
| 1 | ||||
| 8 | ||||
| 10 | ||||
| Unaudited Pro Forma Condensed Combined Financial Information |
15 | |||
| 19 | ||||
| 39 | ||||
| 41 | ||||
| 42 | ||||
| 43 | ||||
| 44 | ||||
| Management’s Discussion and Analysis of Financial Condition and Results of Operations |
45 | |||
| 70 | ||||
| 83 | ||||
| 94 | ||||
| 101 | ||||
| 107 | ||||
| 109 | ||||
| 112 | ||||
| 118 | ||||
| Material U.S. Federal Income Tax Considerations for Non-U.S. Holders |
120 | |||
| 122 | ||||
| 127 | ||||
| 127 | ||||
| 127 | ||||
| F-1 |
i
Table of Contents
Index to Financial Statements
In this prospectus, unless the context suggests otherwise, references to “NCC,” the “Company,” “we,” “us” and “our” refer to National Commerce Corporation, a Delaware corporation, as well as our subsidiaries, including our wholly owned subsidiaries, National Bank of Commerce and United Legacy Bank, which we may sometimes refer to as “NBC” and “ULB,” respectively, and CBI Holding Company, LLC, which we may sometimes refer to as “CBI.” References to the “Banks” refer to National Bank of Commerce and United Legacy Bank, collectively.
You should rely only on the information contained in this prospectus or in any free writing prospectus that we may authorize to be delivered to you. We have not, and the underwriters have not, authorized anyone to provide you with different or additional information. If anyone provides you with different or additional information, you should not rely on it. We are not, and the underwriters are not, making an offer of these securities in any jurisdiction where the offer is not permitted. The information contained in this prospectus or any free writing prospectus is accurate only as of its date, regardless of the time of delivery of this prospectus or of any sale of common stock. Our business, financial condition, results of operations and prospects may have changed since that date.
This prospectus describes the specific details regarding this offering and the terms and conditions of the common stock being offered hereby and the risks of investing in our common stock. It is important for you to read and consider all information contained in this prospectus in making your investment decision. You also should read and consider the information in the documents to which we have referred you in the section entitled “Where You Can Find More Information” before making your investment decision.
Neither we, nor any of our officers, directors, agents or representatives, nor the selling shareowner or the underwriters make any representation to you about the legality of an investment in our common stock. You should not interpret the contents of this prospectus or any free writing prospectus to be legal, business, investment or tax advice. You should consult with your own advisors for that type of advice and consult with them about the legal, tax, business, financial and other issues that you should consider before investing in our common stock.
We further note that the representations, warranties and covenants made by us or the selling shareowner in any agreement that is filed as an exhibit to the registration statement of which this prospectus is a part were made solely for the benefit of the parties to such agreement, including, in some cases, for the purpose of allocating risk among the parties to such agreements, and should not be deemed to be a representation, warranty or covenant to you. Moreover, such representations, warranties or covenants were accurate only as of the date when made. Accordingly, such representations, warranties and covenants should not be relied on as accurately representing the current state of our affairs or the affairs of any selling shareowner.
“National Bank of Commerce” and its logos and other trademarks referred to and included in this prospectus belong to us. Solely for convenience, we refer to our trademarks in this prospectus without the ™ symbol, but such references are not intended to indicate that we will not assert, to the fullest extent under applicable law, our rights to our trademarks. Other service marks, trademarks and trade names referred to in this prospectus, if any, are the property of their respective owners.
Figures in the tables included in this prospectus may not total due to rounding. When used herein, “GAAP” refers to generally accepted accounting principles in the United States.
Until , 2015 (the 25th day after the date of this prospectus), all dealers effecting transactions in our common stock, whether or not participating in this offering, may be required to deliver a prospectus. This delivery requirement is in addition to the obligation of dealers to deliver a prospectus when acting as underwriters and with respect to their unsold allotments or subscriptions.
ii
Table of Contents
Index to Financial Statements
Certain market and industry data included in this prospectus has been obtained from periodic industry publications, third-party sources, filings of public companies in our industry and internal company surveys. These sources include government and industry sources. Industry publications and surveys generally state that the information contained therein has been obtained from sources that we cannot independently verify, but that we believe to be reliable. Although we believe the industry and market data to be reliable as of the date of this prospectus, this information could prove to be inaccurate. Industry and market data could be inaccurate because of the methods by which sources obtained their data and because information cannot always be verified with complete certainty due to the limits on the availability and reliability of raw data, the voluntary nature of the data gathering process and other limitations and uncertainties. In addition, we do not know all of the assumptions regarding general economic conditions or growth that were used in preparing the forecasts from the sources relied upon or cited herein.
IMPLICATIONS OF BEING AN EMERGING GROWTH COMPANY
As a company with less than $1.0 billion in gross revenue during our last fiscal year, we qualify as an “emerging growth company,” as defined in the Jumpstart Our Business Startups Act of 2012, or the JOBS Act, and Section 2(a) of the Securities Act of 1933, as amended, or the Securities Act. An emerging growth company may take advantage of reduced regulatory and reporting requirements that are otherwise generally applicable to public companies. As an emerging growth company:
| • | we may present only two years of audited financial statements and only two years of related “Management’s Discussion and Analysis of Financial Condition and Results of Operations” in this prospectus; |
| • | we may provide less than five years of selected financial data in an initial public offering registration statement; |
| • | we are exempt from the requirement to obtain an attestation and report from our auditors on the assessment of our internal control over financial reporting pursuant to the Sarbanes-Oxley Act of 2002, or the Sarbanes-Oxley Act; |
| • | we are permitted to provide less extensive disclosure about our executive compensation arrangements; and |
| • | we are not required to hold non-binding advisory votes on executive compensation or golden parachute arrangements. |
We may take advantage of these provisions until December 31, 2019 unless we earlier cease to be an emerging growth company. We will cease to be an emerging growth company if we have more than $1.0 billion in annual gross revenues, have more than $700.0 million in market value of our common stock held by non-affiliates, or issue more than $1.0 billion of non-convertible debt in a three-year period. We may choose to take advantage of some but not all of these reduced regulatory and reporting requirements. We have elected to adopt the reduced disclosure requirements described above for purposes of the registration statement of which this prospectus is a part.
Following this offering, we may continue to take advantage of some or all of the reduced regulatory, accounting and reporting requirements that will be available to us as long as we continue to qualify as an emerging growth company. If we do, the information that we provide to shareowners may be different than what you might get from other public companies in which you hold stock.
In addition, Section 107 of the JOBS Act provides that an emerging growth company can take advantage of the extended transition period provided in Section 7(a)(2)(B) of the Securities Act for complying with new or revised financial accounting standards. An emerging growth company can therefore delay the adoption of certain
iii
Table of Contents
Index to Financial Statements
accounting standards until those standards would otherwise apply to private companies. However, we have opted out of such extended transition period and, as a result, we comply and will continue to comply with new or revised financial accounting standards on the relevant dates on which adoption of such standards is required for non-emerging growth companies. Our decision to opt out of the extended transition period for complying with new or revised financial accounting standards is irrevocable.
iv
Table of Contents
Index to Financial Statements
This summary provides an overview of selected information contained elsewhere in this prospectus and does not contain all the information that may be important to you. Before making an investment decision to purchase shares of our common stock, you should carefully read this prospectus and the registration statement of which this prospectus is a part in their entirety, including the information discussed under “Risk Factors” and “Management’s Discussion and Analysis of Financial Condition and Results of Operations,” along with our consolidated financial statements and notes thereto that are included herein.
Our Company
National Commerce Corporation is a bank holding company headquartered in Birmingham, Alabama. We operate two subsidiary banks – National Bank of Commerce, or NBC, and United Legacy Bank, or ULB. We intend to consolidate ULB with NBC on or about February 28, 2015, although each of the ULB banking offices will continue to operate as “United Legacy Bank, a division of National Bank of Commerce.”
Through our Banks, we provide a broad array of financial services to businesses, business owners and professionals through eight full-service banking offices in Alabama (Birmingham, Huntsville, Auburn-Opelika, and Baldwin County) and seven full-service banking offices in Central Florida (Longwood, Winter Park, Orlando, Oviedo, Kissimmee, and Vero Beach). We also own a 70% equity interest in CBI Holding Company, LLC, or CBI, which owns Corporate Billing, LLC, or Corporate Billing, a transaction-based finance company headquartered in Decatur, Alabama, that provides factoring, invoicing, collection, and accounts receivable management services to transportation companies and automotive parts and service providers throughout the United States and parts of Canada. As of December 31, 2014, we had total assets of $1.14 billion, total deposits of $971.1 million, total loans of $888.7 million, and total shareholders’ equity of $136.2 million.
Our senior management team began working together in the early 1990s for a previous bank, which ultimately grew to become Alabama National BanCorporation, or ALAB, a bank holding company that operated banks in Alabama, Florida and Georgia. The team grew the total assets of that institution from approximately $800 million in 1995 to assets of approximately $8.0 billion in 2007 and grew its market capitalization to approximately $1.1 billion in the same time period. This growth was achieved through a combination of organic growth and the acquisition of 14 banks, four bank branches and four non-bank financial service businesses. In February 2008, ALAB was acquired by Royal Bank of Canada for $1.6 billion.
In addition to our senior management team, a number of our employees have many years of experience working together dating back to the early 1990s. With the exception of the greater Orlando market, our markets are led by a market president who held the same role in those markets for ALAB. Many members of our accounting, information technology, risk, and operations teams also include leaders who held similar roles at ALAB.
Our management’s extensive tenure working together has led to the development of several core operating beliefs that infuse our Company and guide our strategy. These philosophies have guided our management for over 20 years, and we believe that they are critical to our success.
| • | Managers should think from an owner’s perspective. The members of our board of directors and senior management team have a significant ownership stake in the Company, beneficially owning 31.1% of our outstanding common stock as of February 25, 2015. We use compensation structures for our market presidents designed to motivate them as owners. We use the term “shareowners” rather than the more commonly used “shareholders” or “stockholders” to describe the holders of our shares, including our managers, as we view them all as fellow owners of the Company. |
1
Table of Contents
Index to Financial Statements
| • | Creation of long-term shareowner value is our primary purpose. While we care about how much we earn for our shareowners every month, quarter, and year, we care less about next quarter’s earnings per share than we do about next year’s earnings per share, and we care less about next year’s earnings per share than we do about our earnings per share in three or five years. We believe that decisions focused on long-term results will be more effective in creating shareowner value, and we view the maximization of long-term shareowner value as our primary purpose. |
| • | Superior credit quality and risk management practices and a strong and effective control environment will increase shareowner value. We are dedicated to maintaining strong credit risk management without sacrificing growth. When problem credits occur, we operate under the belief that decisive corrective action should be taken. This means addressing problems quickly when they arise in order to return a problem credit to current status with a high likelihood of future timely payments, or, alternatively, to liquidate the account. By assessing problems realistically and implementing decisive remedial action, we believe that we can lessen our losses and maintain our primary focus on growing our business and delivering value for our shareowners. |
| • | We intend to achieve strong growth through our operating structure, our teams, and the markets that we serve. Organic growth and acquisitive growth are equally important for our future outlook. We seek to maintain growth rates above the industry average by combining our core values and long-term focus with an emphasis on expanding our scale through organic growth and acquisitions of high-quality community banks with proven management teams that embrace our management philosophy. |
| • | A distributed decision-making process is superior to a centralized one. We believe that managers located and operating in their banking markets create a more responsive, customer-driven company. We provide systems, credit policies, audit and compliance controls, and product offerings to the market presidents and their teams, and management’s job is to support them in achieving success within their markets. |
| • | A culture of candor – both with ourselves and with others – encourages collective accountability and collaboration. We encourage openness and transparency in all aspects of our business. We expect this candor to manifest itself in many ways, including in building successful banking relationships with new customers and maintaining and expanding relationships with existing customers, the timely recognition of problems, the realistic assessment of asset and collateral values, and open and honest communication internally, as well as with our regulators, investors, and analysts. |
| • | We have instilled a leadership culture with an appropriate sense of humility. We are not immune from making mistakes, and we are more likely to recognize and learn from our missteps if we maintain a sense of humility. This environment creates an attractive place of employment for our current team and potential new team members. We also believe that developing a culture in which mistakes are recognized, acknowledged, and addressed promotes ethical business practices and can help prevent mistakes from escalating into crises. |
Our Board of Directors and Senior Management Team
Our directors bring many years of experience in executive management and board membership of other companies. Our directors have a broad range of experience across many industries, including manufacturing, distribution, accounting, insurance, law, real estate, engineering, and government contracting, which include the industries of some of our largest customers. In addition, five of our non-executive directors have experience as directors, having formerly served as directors of ALAB or its banking subsidiaries operating in our current markets, and four of those non-executive directors have experience as directors of a publicly traded banking institution.
2
Table of Contents
Index to Financial Statements
Our senior management team has worked together for many years and has extensive experience in the commercial banking industry in the markets in which we currently operate. Certain biographical information for our senior executives is as follows:
John H. Holcomb, III – Chairman and Chief Executive Officer of NCC and Chairman of NBC. John has 37 years of commercial banking experience, focused on the markets in which we currently operate, and has served as our Chairman and Chief Executive Officer since October 2010. He previously served as Chairman and Chief Executive Officer of ALAB from 1996 until its sale in 2008. He subsequently served as Vice Chairman of RBC Bank (USA) until June 2009. John is a graduate of Furman University.
Richard Murray, IV – President and Chief Operating Officer of NCC and President and Chief Executive Officer of NBC. Richard has 29 years of commercial banking experience in the markets in which we currently operate and has served as our President and Chief Operating Officer since October 2010. He previously held senior positions at ALAB, where he served as President and Chief Operating Officer from 2000 until its sale in 2008. He then served as President of the Alabama and Florida markets for RBC Bank (USA) until June 2009. Richard is a Vanderbilt graduate and holds an MBA from Samford University.
William E. Matthews, V – Vice Chairman and Chief Financial Officer of NCC and NBC. Will has 24 years of experience in finance. Will served as ALAB’s Chief Financial Officer from 1998 until its sale in 2008, and he held the same title at RBC Bank (USA) until March 2009. Will then entered the private equity industry, serving as a partner at New Capital Partners. He became an outside member of our board of directors in October 2010 and became our Chief Financial Officer in November 2011. Will graduated from Princeton University and earned an MBA from the Wharton School of the University of Pennsylvania.
For additional information on the other members of our management team and other key employees, see “Business – Our Board of Directors and Management Team,” beginning on page 71, and “Management – Executive Officers and Directors,” beginning on page 94.
Our History
We were originally incorporated as Americus Financial Services, Inc., or Americus, in November 2006. Americus was a one-bank holding company for Red Mountain Bank, N.A., or Red Mountain Bank, a national banking association that commenced operations in Birmingham, Alabama on June 21, 2004. Americus became the holding company for Red Mountain Bank on March 15, 2007 by means of a share exchange with all Red Mountain Bank shareholders. In March 2009, the Office of the Comptroller of the Currency, or the OCC, placed Red Mountain Bank under a formal agreement addressing, among other things, deficiencies in its lending practices and asset quality.
On October 29, 2010, Charles Investment Group, LLC, or CIG, a Delaware limited liability company led by members of our senior management team, acquired control of Americus by acquiring newly issued voting shares of Americus for $58 million. This resulted in CIG acquiring a 67.5% ownership stake and a controlling interest in Americus. Following this change of control, Americus reconstituted the board of directors with eight new directors and two continuing directors, installed our current management team, changed Red Mountain Bank’s name to National Bank of Commerce, and subsequently changed Americus’s name to National Commerce Corporation. On December 31, 2014, CIG distributed all of its shares of our common stock to its members on a pro rata basis and subsequently deregistered as a bank holding company.
Following the change of control and the appointment of our senior management team, NBC entered three additional markets in Alabama: Madison County (Huntsville), Baldwin County, and Auburn-Opelika, which were each led by former ALAB employees. In March 2012, the OCC terminated the formal agreement with NBC because NBC’s operations had returned to a sufficiently safe and sound condition.
3
Table of Contents
Index to Financial Statements
NBC subsequently opened branches in Gulf Shores and Madison, Alabama in July 2012 and March 2013, respectively. NBC opened a loan production office in Vero Beach, Florida in April 2014, which it converted into a full-service banking office in November 2014.
In August 2014, we acquired a 70% equity interest in CBI, which owns Corporate Billing. Corporate Billing began in 1995 as a subsidiary of First American Bank, ALAB’s largest subsidiary bank, and the management team of Corporate Billing worked with our current senior management team during their time at ALAB. We have an option to purchase the remaining 30% equity interest in CBI for a price based on a multiple of CBI’s earnings, which becomes exercisable on August 29, 2019 and expires on August 29, 2022. James R. (“Skip”) Thompson, Corporate Billing’s Chief Executive Officer, was formerly the Chief Executive Officer of First American Bank for approximately 10 years. After the 2008 sale of ALAB, RBC Bank (USA) subsequently sold Corporate Billing to a group led by Mr. Thompson, former ALAB director Britt Sexton, and a third individual, who collectively own Factor, LLC, or Factor, which is the entity holding the remaining 30% equity interest in CBI.
In December 2014, we completed the acquisition of United Group Banking Company of Florida, Inc., or United, a one-bank holding company. Its bank subsidiary, ULB, is a Florida state-chartered commercial bank with five banking offices located in three counties in the Orlando, Florida metropolitan area. ULB is led by its President and Chief Executive Officer, Dave Powers, who has over 30 years of experience as a banker in the Orlando metropolitan area. He and his senior management team have a deep history of operating banks in the Central Florida markets. We have contractually retained nine key employees, including the entire senior management team. Consistent with our philosophy, ULB maintains a focus on delivering a relationship-driven banking experience and maintenance of a strong credit culture. We believe that the acquisition of United is consistent with our focus on seeking acquisitions of high-quality community banks with proven management teams that complement our philosophy.
Our Growth and Performance
When our senior management team assumed the leadership of Americus in late October 2010, it inherited an institution operating under a formal agreement with the OCC. Following the change of control, our immediate efforts were to stabilize the organization, lessen its risk profile, restructure its balance sheet, resolve all regulatory issues, terminate the formal agreement with the OCC, and implement an operating strategy to promote sustainable and prudent growth. Throughout this process, management focused on pursuing transactions and initiatives to maximize the opportunities for growth over the long-term. For example, we converted to a new data processor in the fourth quarter of 2012, incurring a charge of nearly $1.1 million in order to position NBC for future expansion and to develop a platform for increased scale in the coming years.
From December 31, 2010 to December 31, 2014, we have grown total assets from $375 million to $1.14 billion, total loans from $210 million to $888.7 million, and total deposits from $271 million to $971.1 million. Over that period, total assets, loans, and deposits grew at annualized rates of 32%, 43%, and 38%, while asset quality ratios improved significantly. The addition of Corporate Billing in the third quarter of 2014 contributed to a 51% increase in total loans from June 30, 2014 to December 31, 2014. In December 2014, we completed the acquisition of United, which, on September 30, 2014, had total assets of $232 million, total loans of $156 million, and total deposits of $198 million.
We have seen increases in loan growth, particularly in our Birmingham, Huntsville, Auburn-Opelika, and Baldwin County markets. According to data made available as of each June 30 by the Federal Deposit Insurance Corporation, or the FDIC, deposits grew by 89% in Auburn-Opelika from June 30, 2013 to June 30, 2014. In the same time period, deposits grew by 8% in Birmingham, 54% in Huntsville, and 25% in Baldwin County.
4
Table of Contents
Index to Financial Statements
Our Growth
The table below illustrates our total assets, loans and deposits, as well as our compound annualized growth rate, or CAGR, from December 31, 2010, shortly after CIG acquired control and installed our senior management team, to December 31, 2014.
| (Dollars in millions) |
2010 | 2011 | 2012 | 2013 | 2014 | CAGR | ||||||||||||||||||
| Total Assets |
$ | 375 | $ | 426 | $ | 693 | $ | 792 | $ | 1,138 | 32 | % | ||||||||||||
| Total Loans |
$ | 210 | $ | 300 | $ | 441 | $ | 582 | $ | 889 | 43 | % | ||||||||||||
| Total Deposits |
$ | 271 | $ | 325 | $ | 580 | $ | 678 | $ | 971 | 38 | % | ||||||||||||
Our profitability also has increased significantly, moving from a sizable loss in 2010 to a profit of $5.4 million for the year ended December 31, 2014, which reflects an annualized return on average assets of 0.66% for this period. With the addition of CBI, our net interest margin increased from 3.30% for the three months ended June 30, 2014 to 4.56% for the three months ended December 31, 2014.
Our post-2010 growth has coincided with a significant improvement in asset quality ratios. Our non-performing assets declined from $13.4 million as of December 31, 2010, or 3.58% of total assets, to $6.2 million as of December 31, 2014, or 0.55% of total assets. Since December 31, 2010, non-performing assets to loans plus other real estate declined from 6.29% to 0.69% at December 31, 2014.
Market Areas and Growth Strategy
We currently conduct our banking operations through our Banks’ 15 banking locations. We plan to merge ULB into NBC on or about February 28, 2015, although each of the ULB banking offices will operate as “United Legacy Bank, a division of National Bank of Commerce” for some period of time after the bank merger. According to 2014 data from the U.S. Census Bureau, the projected population growth in our markets from 2014 to 2019 is expected to be 4.52%, versus a U.S. average of 3.50%. In addition, approximately 93% of our deposits are in metropolitan statistical areas, or MSAs.
| Metropolitan Statistical Area |
Total Population 2014 (Actual) |
Population Change 2010-2014 (%) |
Projected Population Change 2014-2019 (%) |
Median Household Income 2014 ($) |
Projected Household Income Change 2014-2019 (%) |
Unemployment (%) |
||||||||||||||||||
| Birmingham-Hoover, AL |
1,142,042 | 1.24 | 1.71 | 46,029 | 1.43 | 4.8 | ||||||||||||||||||
| Huntsville, AL |
439,012 | 5.13 | 5.07 | 55,834 | 9.27 | 4.8 | ||||||||||||||||||
| Daphne-Fairhope-Foley (Micro), AL |
196,491 | 7.81 | 7.27 | 54,973 | 13.67 | 5.0 | ||||||||||||||||||
| Auburn-Opelika, AL |
152,270 | 8.57 | 7.95 | 41,226 | 4.22 | 4.2 | ||||||||||||||||||
| Orlando-Kissimmee-Sanford FL |
2,277,414 | 6.70 | 7.48 | 45,240 | (2.97 | ) | 5.3 | |||||||||||||||||
| Sebastian-Vero Beach, FL |
142,896 | 3.53 | 4.93 | 38,846 | (10.10 | ) | 6.5 | |||||||||||||||||
| Alabama |
4,847,067 | 1.41 | 1.79 | 42,869 | 4.55 | 6.0 | ||||||||||||||||||
| Florida |
19,654,457 | 4.54 | 5.74 | 44,318 | (0.49 | ) | 5.8 | |||||||||||||||||
| United States |
317,199,353 | 2.74 | 3.50 | 51,579 | 4.58 | 5.5 | ||||||||||||||||||
|
|
|
|
|
|
|
|||||||||||||||||||
| NCC Markets Weighted Average |
4.23 | 4.52 | 2.99 | |||||||||||||||||||||
| * | Unemployment data as of November 2014 |
Source: SNL Financial, Bureau of Labor Statistics
The following table presents our deposits as of December 31, 2013 and December 31, 2014, as well as the percentage growth year-over-year.
5
Table of Contents
Index to Financial Statements
| Metropolitan Statistical Area |
NCC Deposits 12/31/2013 ($000) |
NCC Deposits 12/31/2014 ($000) |
NCC Y-o-Y Deposit Growth ‘13 - ‘14 (%) |
|||||||||
| Birmingham-Hoover, AL |
$ | 408,224 | 421,749 | 3.31 | % | |||||||
| Huntsville, AL |
176,381 | 205,280 | 16.38 | |||||||||
| Orlando-Kissimmee-Sanford, FL(1) |
182,118 | 196,924 | 8.13 | |||||||||
| Daphne-Fairhope-Foley, AL |
59,397 | 70,820 | 19.23 | |||||||||
| Auburn-Opelika, AL |
34,029 | 66,728 | 96.09 | |||||||||
| Sebastian-Vero Beach, FL |
— | 9,559 | — | |||||||||
| (1) | The Orlando-Kissimmee-Sanford, FL totals for 12/31/13 represent United deposits and, therefore, are not included in NCC’s deposits at 12/31/13. |
In addition to our banking operations, we conduct our factoring business through one office in Decatur, Alabama, with clients located throughout the United States and parts of Canada. Technology allows us to service a geographically broad client base in this business, with sales representatives traveling to meet existing and potential clients in their places of business.
We intend to continue to expand organically where possible by growing our Banks in their respective market areas and nearby attractive markets through “de novo” branch expansions when we can find a team justifying such expansion. Our decentralized community banking strategy allows our Banks to compete effectively with our larger competitors by providing superior customer service with localized decision making capabilities, resulting in greater responsiveness.
In addition to our strategy of pursuing organic growth, we intend to pursue expansion into attractive, higher growth markets in Florida, Alabama, and potentially other southeastern states through acquisitions of community banks and subsequent growth in those markets. Our team has extensive experience finding community bank partners, negotiating transactions, and merging and integrating new banks by implementing our management control structure in a manner that allows our new partners to grow within our acceptable risk parameters. We focus our acquisition strategy on high-quality community banks with proven management teams that view us as a partner, rather than as an exit strategy. Typically, our strategy is to maintain the management team of each acquired bank, allowing it to retain its local entrepreneurial identity and decision making, while simultaneously creating efficiencies in the administrative and back office operations of the bank. We also prefer to retain the involvement of local directors by creating a local advisory board after entering a new market.
We intend to achieve our primary goal of maximizing long-term shareowner value by focusing on the following objectives:
| • | Continue growing within our existing markets; |
| • | Continue the expansion of Corporate Billing to achieve appropriate risk-adjusted returns; |
| • | Enter into high growth, metropolitan markets in Florida (particularly along the Interstate 4 corridor), Alabama, and potentially other markets in the southeastern U.S. where we have an opportunity for growth; |
| • | Focus on commercial and professional customers in our existing markets with the goal of providing superior customer service and maintaining strong asset quality; |
| • | Promote local decision making and accountability in our market areas, with appropriate control structures and a culture of ownership; |
| • | Enhance our products and services opportunistically, ensuring we are adding value to customers and providing an appropriate return on shareowners’ capital over time; and |
| • | Ensure management’s interests are aligned with those of shareowners. |
6
Table of Contents
Index to Financial Statements
Risk Factors
There are a number of risks that you should consider before investing in our common stock. These risks are discussed more fully in the section titled “Risk Factors,” beginning on page 19.
Corporate Information
We are a Delaware corporation. Our executive offices are located at 813 Shades Creek Parkway, Suite 100, Birmingham, Alabama 35209, and our telephone number is (205) 313-8100.
We maintain an internet website at www.nationalbankofcommerce.com. Information on, or accessible through, our website is not part of this prospectus.
7
Table of Contents
Index to Financial Statements
| Common stock offered |
shares | |
| Common stock offered by the selling shareowner |
shares | |
| Common stock to be outstanding after this offering |
shares | |
| Underwriters’ option to purchase additional shares |
shares | |
| Voting rights |
One vote per share | |
| Use of proceeds |
We estimate that the net proceeds to us from the sale of shares in this offering, after deducting the underwriting discount and estimated offering expenses payable by us, will be approximately $ million based on an assumed initial public offering price of $ per share. We intend to use the net proceeds of this offering to support our growth, for working capital, and for other general corporate purposes, including to finance our organic growth and expand our business through investments in or acquisitions of bank and non-bank financial services companies that we believe are complementary to our business and consistent with our growth strategy. We will not receive any proceeds from the sale of common stock by the selling shareowner in this offering. See “Use of Proceeds” and “Principal and Selling Shareowners.” | |
| Dividend policy |
Our board of directors has not declared a dividend since our inception and does not expect to declare a dividend in 2015. Any future determination relating to dividend policy after 2015 will be made at the discretion of our board of directors and will depend on a number of factors, including our future earnings, capital requirements, financial condition, future prospects, regulatory restrictions, and other factors that our board of directors may deem relevant. See “Dividend Policy.” | |
| Risk factors |
You should read the “Risk Factors” section of this prospectus beginning on page 19 for a discussion of factors to consider carefully before deciding to invest in shares of our common stock. | |
8
Table of Contents
Index to Financial Statements
| Stock exchange listing and symbol |
We have applied to have our common stock listed on the NASDAQ Global Select Market under the symbol “NCOM.” | |
| Directed share program |
At our request, the underwriters have reserved up to 5% of the common stock being offered by this prospectus for sale at the initial public offering price to our directors, officers, employees, business associates, and related persons. See “Underwriting.” | |
The number of shares of our common stock to be issued and outstanding immediately after the completion of this offering is based on an aggregate of 7,541,541 shares outstanding as of February 25, 2015, and excludes, as of February 25, 2015, 368,778 shares of our common stock issuable upon the exercise of outstanding options and settlement of outstanding performance awards that have been granted under the National Commerce Corporation 2011 Equity Incentive Plan, or the Incentive Plan, 118,722 additional shares of our common stock that are reserved for issuance under the Incentive Plan, and 102,586 shares of our common stock issuable upon the exercise of outstanding options under the United Group Banking Company of Florida, Inc. Officers’ and Employees’ Stock Option Plan, or the United Option Plan.
Except as otherwise indicated, all information in this prospectus:
| • | assumes an initial public offering price of $ per share, which is the midpoint of the price range set forth on the cover page of this prospectus; and |
| • | assumes no exercise by the underwriters of their option to purchase additional shares of our common stock from us or the selling shareowner. |
9
Table of Contents
Index to Financial Statements
SUMMARY HISTORICAL CONSOLIDATED FINANCIAL AND OTHER DATA
The following tables set forth our summary consolidated financial data as of and for the years ended December 31, 2014, 2013, 2012 and 2011. The summary consolidated financial data as of and for the years ended December 31, 2014 and 2013 has been derived from our audited consolidated financial statements included elsewhere in this prospectus. Our historical results are not necessarily indicative of the results that may be expected in the future.
On August 29, 2014, NBC entered into a membership interest purchase agreement with the members of CBI, pursuant to which NBC acquired, effective as of August 29, 2014, 70% of the outstanding membership interests of CBI in exchange for cash consideration of $16,180,587. Our consolidated financial statements as of and for the year ended December 31, 2014 include the financial position, results of operations and cash flows attributable to CBI for the portion of such period subsequent to August 29, 2014. Consequently, our results for this period are not fully comparable for prior periods.
On December 15, 2014, we completed our merger with United, a bank holding company, and thereby acquired United’s wholly owned banking subsidiary, ULB. We paid an aggregate of $2,953,884 in cash (including cash in lieu of fractional shares) and issued 1,617,027 shares of our common stock as consideration in the merger. Because our merger with United closed on December 15, 2014, our consolidated financial statements as of and for the year ended December 31, 2014 include the financial position, results of operations and cash flows attributable to United for the portion of such period subsequent to December 15, 2014. Consequently, our results for this period are not fully comparable for prior periods.
You should read this summary of financial and other data along with “Management’s Discussion and Analysis of Financial Condition and Results of Operations,” “Business” and our financial statements and the related notes, all included elsewhere in this prospectus.
10
Table of Contents
Index to Financial Statements
SUMMARY CONSOLIDATED FINANCIAL DATA
| Twelve Months Ended December 31, | ||||||||||||||||
| (Dollars in thousands, except per share information) |
2014 | 2013 | 2012 | 2011 | ||||||||||||
| Statement of Income Data |
||||||||||||||||
| Interest income |
$ | 31,342 | $ | 23,312 | $ | 19,952 | $ | 17,006 | ||||||||
| Interest expense |
2,869 | 2,613 | 3,280 | 3,560 | ||||||||||||
| Net interest income |
28,473 | 20,699 | 16,672 | 13,446 | ||||||||||||
| Provision for loan losses |
978 | — | 125 | 600 | ||||||||||||
| Gain (loss) on sale of securities |
(33 | ) | 47 | — | 64 | |||||||||||
| Other noninterest income(1) |
5,065 | 5,255 | 4,665 | 2,401 | ||||||||||||
| Merger related expenses |
662 | 257 | — | — | ||||||||||||
| Other noninterest expense(2) |
22,791 | 19,428 | 18,084 | 14,600 | ||||||||||||
| Income before income taxes |
9,074 | 6,316 | 3,128 | 711 | ||||||||||||
| Income tax expense |
3,159 | 2,310 | 1,071 | 169 | ||||||||||||
| Net income before minority interest |
5,915 | 4,006 | 2,057 | 542 | ||||||||||||
| Net income attributable to minority interest |
512 | — | — | — | ||||||||||||
| Net income to common shareholders |
5,403 | 4,006 | 2,057 | 542 | ||||||||||||
| Balance sheet (at period end) |
||||||||||||||||
| Cash and cash equivalents |
$ | 123,435 | $ | 124,136 | $ | 171,287 | $ | 49,311 | ||||||||
| Securities available for sale |
34,932 | 47,979 | 40,724 | 50,050 | ||||||||||||
| Mortgage loans held for sale |
9,329 | 7,159 | 13,836 | 7,896 | ||||||||||||
| Acquired purchased credit impaired loans |
9,077 | — | — | — | ||||||||||||
| Acquired non-purchased credit impaired loans |
143,981 | — | — | — | ||||||||||||
| Nonacquired loans held for investment(3) |
653,063 | 582,002 | 441,452 | 300,086 | ||||||||||||
| CBI loans (factoring receivables) |
82,600 | — | — | — | ||||||||||||
| Total gross loans held for investment |
888,721 | 582,002 | 441,452 | 300,086 | ||||||||||||
| Total intangibles |
30,591 | — | — | — | ||||||||||||
| Total assets |
1,138,426 | 791,781 | 693,359 | 426,380 | ||||||||||||
| Total deposits |
971,060 | 678,031 | 580,294 | 324,578 | ||||||||||||
| Borrowings |
22,000 | 22,000 | 24,695 | 17,031 | ||||||||||||
| Total liabilities |
1,002,265 | 702,842 | 607,509 | 342,920 | ||||||||||||
| Minority interest |
7,239 | — | — | — | ||||||||||||
| Common equity |
75 | 5,730 | 5,730 | 5,730 | ||||||||||||
| Total shareholders equity |
136,161 | 88,939 | 85,850 | 83,460 | ||||||||||||
| Tangible common equity |
105,265 | 88,939 | 85,850 | 83,460 | ||||||||||||
| Selected Performance Ratios |
||||||||||||||||
| Return on average assets (ROAA)(4) |
0.66 | % | 0.60 | % | 0.38 | % | 0.14 | % | ||||||||
| Return on average equity (ROAE) |
5.55 | 4.61 | 2.43 | 0.66 | ||||||||||||
| Return on average tangible common equity (ROATCE) |
6.07 | 4.61 | 2.43 | 0.66 | ||||||||||||
| Net interest margin (NIM) |
3.75 | 3.25 | 3.16 | 3.49 | ||||||||||||
| Efficiency ratio |
69.93 | 75.85 | 84.75 | 92.13 | ||||||||||||
| Operating efficiency ratio(5) |
67.96 | 74.86 | 84.75 | 92.13 | ||||||||||||
| Noninterest income / average assets |
0.62 | 0.79 | 0.85 | 0.60 | ||||||||||||
| Noninterest expense / average assets |
2.88 | 2.97 | 3.31 | 3.60 | ||||||||||||
| Yield on loans |
4.68 | 4.37 | 4.94 | 5.95 | ||||||||||||
| Cost of deposits |
0.35 | 0.38 | 0.58 | 0.93 | ||||||||||||
| Per Share Outstanding Data |
||||||||||||||||
| Net earnings per share |
$ | 0.92 | $ | 0.70 | $ | 0.36 | $ | 0.11 | ||||||||
| Diluted net earnings per share |
0.91 | 0.69 | 0.36 | 0.11 | ||||||||||||
| Common shares outstanding at year end |
7,541,541 | 5,730,114 | 5,730,114 | 5,730,114 | ||||||||||||
| Weighted average diluted shares |
5,960,199 | 5,764,285 | 5,740,400 | 5,153,945 | ||||||||||||
| Book value per share |
18.05 | 15.52 | 14.98 | 14.57 | ||||||||||||
| Tangible book value per share |
13.96 | 15.52 | 14.98 | 14.57 | ||||||||||||
11
Table of Contents
Index to Financial Statements
| Twelve Months Ended December 31, | ||||||||||||||||
| (Dollars in thousands, except per share information) |
2014 | 2013 | 2012 | 2011 | ||||||||||||
| Nonperforming assets |
||||||||||||||||
| Nonacquired |
||||||||||||||||
| Nonaccrual loans |
$ | 2,276 | $ | 3,371 | $ | 244 | $ | 1,730 | ||||||||
| Other real estate and repossesed assets |
823 | 845 | 95 | 905 | ||||||||||||
| Total nonacquired nonperforming assets |
3,099 | 4,216 | 339 | 2,635 | ||||||||||||
| Acquired |
||||||||||||||||
| Nonaccrual loans |
2,589 | — | — | — | ||||||||||||
| Other real estate and repossesed assets |
557 | — | — | — | ||||||||||||
| Loans past due 90 days or more and still accruing |
297 | — | — | — | ||||||||||||
| Total acquired nonperforming assets |
3,443 | — | — | — | ||||||||||||
| Asset Quality Ratios |
||||||||||||||||
| Nonperforming assets / Assets |
0.57 | % | 0.53 | % | 0.05 | % | 0.62 | % | ||||||||
| Nonperforming assets / Loans + OREO |
0.73 | 0.72 | 0.08 | 0.88 | ||||||||||||
| Nonacquired nonperforming assets / Nonacquired loans + nonacquired OREO |
0.47 | 0.72 | 0.08 | 0.88 | ||||||||||||
| Net charge-offs (recoveries) to average loans |
0.05 | 0.19 | 0.13 | 0.45 | ||||||||||||
| Allowance for loan losses to total loans |
1.10 | 1.57 | 2.27 | 3.45 | ||||||||||||
| Allowance for loan losses to nonperforming loans |
189.89 | 270.51 | 4,106.56 | 597.86 | ||||||||||||
| Allowance for loan losses to nonacquired loans(3) |
1.50 | 1.57 | 2.27 | 3.45 | ||||||||||||
| Capital ratios (at period end) |
||||||||||||||||
| Tier 1 Leverage Ratio |
10.68 | % | 12.18 | % | 12.42 | % | 18.00 | % | ||||||||
| Tier 1 Common Capital Ratio |
10.66 | 14.58 | 17.60 | 25.35 | ||||||||||||
| Tier 1 Risk-based Capital Ratio |
10.66 | 14.58 | 17.60 | 25.35 | ||||||||||||
| Total Risk Based Capital Ratio |
11.75 | 15.83 | 18.86 | 26.63 | ||||||||||||
| Equity / Assets |
11.96 | 11.23 | 12.38 | 19.57 | ||||||||||||
| Tangible common equity to tangible assets |
9.50 | 11.23 | 12.38 | 19.57 | ||||||||||||
| Composition of Loans Held for Investment |
||||||||||||||||
| Owner occupied CRE |
$ | 132,126 | $ | 71,790 | $ | 48,829 | $ | 35,636 | ||||||||
| Non owner occupied CRE |
198,658 | 146,509 | 108,405 | 67,191 | ||||||||||||
| C&I |
113,788 | 102,286 | 91,337 | 41,904 | ||||||||||||
| Factored Receivables |
82,600 | — | — | — | ||||||||||||
| C&D |
83,663 | 58,372 | 36,267 | 45,569 | ||||||||||||
| 1-4 family |
221,222 | 162,091 | 128,103 | 81,420 | ||||||||||||
| Multifamily |
23,420 | 22,316 | 17,637 | 22,020 | ||||||||||||
| Consumer and other |
33,244 | 18,638 | 10,874 | 6,346 | ||||||||||||
| Deposit Composition |
||||||||||||||||
| Demand |
$ | 217,643 | $ | 128,837 | $ | 67,040 | $ | 51,218 | ||||||||
| NOW |
154,816 | 107,060 | 96,514 | 49,244 | ||||||||||||
| Money market and savings |
392,394 | 304,071 | 277,342 | 153,985 | ||||||||||||
| Time deposits less than $100,000 |
74,367 | 15,979 | 20,766 | 27,195 | ||||||||||||
| Time deposits greater than or equal to $100,000 |
131,840 | 122,084 | 118,632 | 42,936 | ||||||||||||
| Mortgage Metrics |
||||||||||||||||
| Total production |
$ | 207,269 | $ | 246,649 | $ | 212,128 | $ | 72,871 | ||||||||
| (1) | Excludes securities gains (losses). |
| (2) | Excludes merger-related expenses. |
| (3) | Excludes CBI loans. |
| (4) | Net income to common shareholders / average assets. |
| (5) | Excludes merger related expenses. |
12
Table of Contents
Index to Financial Statements
Factoring
On August 29, 2014, we acquired a 70% stake in CBI, which is the corporate parent of Corporate Billing. Corporate Billing is a transaction-based finance company engaged in factoring, invoicing, collection, and accounts receivable management services to companies in the transportation industry throughout the United States and parts of Canada. Corporate Billing’s factoring activities include the purchase and collection of accounts receivable on both a recourse and non-recourse basis, with its recourse operations focused primarily in the transportation industry and its non-recourse operations focused primarily in the automotive dealer and distributor industries. The financial metrics illustrated below represent CBI’s performance for each of the years ended December 31, 2014, 2013, 2012 and 2011. With the exception of the period between August 29, 2014 and December 31, 2014, which is included in NCC’s results for the year ended December 31, 2014, these metrics reflect CBI’s performance on a stand-alone basis, before NCC owned or controlled any aspect of the company.
|
|
||||||||||||||||
| Twelve Months Ended December 31, | ||||||||||||||||
| (Dollars in thousands) |
2014 | 2013 | 2012 | 2011 | ||||||||||||
| Recourse purchased volume |
$ | 389,468 | $ | 295,608 | $ | 286,967 | $ | 272,108 | ||||||||
| Non-recourse purchased volume |
355,902 | 317,485 | 228,652 | 209,632 | ||||||||||||
| Total purchased volume |
745,370 | 613,093 | 515,619 | 481,739 | ||||||||||||
| Average turn dates |
37.74 | 38.82 | 39.57 | 36.87 | ||||||||||||
| Net charge-offs / total purchased volume |
0.04 | % | 0.09 | % | 0.05 | % | 0.05 | % | ||||||||
| Average discount rate |
1.66 | 1.62 | 1.70 | 1.70 | ||||||||||||
GAAP Reconciliation and Management Explanation of Non-GAAP Financial Measures
Some of the financial measures included in our selected historical consolidated financial and other data are not measures of financial performance recognized by GAAP. These non-GAAP financial measures include tangible common equity, return on average tangible common equity, efficiency ratio, operating efficiency ratio, tangible book value per share, and tangible common equity to tangible assets. Our management uses these non-GAAP financial measures in its analysis of our performance:
| • | “Tangible common equity” is total shareholders’ equity less goodwill, other intangible assets and minority interest not included in intangible assets. |
| • | “Tangible book value per share” is defined as tangible common equity divided by total common shares outstanding. This measure is important to investors interested in changes from period-to-period in book value per share exclusive of changes in intangible assets. |
| • | “Tangible common equity to tangible assets” is defined as the ratio of shareholders’ equity less goodwill, other intangible assets and minority interest not included in intangible assets, divided by total assets less goodwill and other intangible assets. We believe that this measure is important to many investors in the marketplace who are interested in relative changes from period-to period in equity and total assets, each exclusive of changes in intangible assets. |
| • | “Average tangible common equity” is defined as the average of our tangible common equity for the applicable period. |
| • | “Return on average tangible common equity,” or ROATCE, is defined as net income available to common shareholders divided by average tangible common equity. |
| • | “Efficiency ratio” is defined as noninterest expense divided by our operating revenue (which is equal to net interest income plus noninterest income) excluding one-time gains and losses on sales of securities. This measure is important to investors looking for a measure of efficiency in our productivity measured by the amount of revenue generated for each dollar spent. |
13
Table of Contents
Index to Financial Statements
| • | “Operating efficiency ratio” is defined as noninterest expense divided by our operating revenue, excluding one-time gains and losses on sales of securities and one-time gains and expenses related to merger and acquisition-related activities. This measure is important to investors looking for a measure of efficiency in our productivity measured by the amount of revenue generated for each dollar spent. |
We believe that these non-GAAP financial measures provide useful information to management and investors that is supplementary to our financial condition, results of operations and cash flows computed in accordance with GAAP; however, we acknowledge that our non-GAAP financial measures have a number of limitations. As such, you should not view these disclosures as a substitute for results determined in accordance with GAAP, and they are not necessarily comparable to non-GAAP financial measures that other companies use. The following reconciliation table provides a more detailed analysis of these non-GAAP financial measures:
| NON-GAAP RECONCILIATION | ||||||||||||||||
| For the Twelve Months Ended December 31, | ||||||||||||||||
| (Dollars in thousands, except per share information) |
2014 | 2013 | 2012 | 2011 | ||||||||||||
| Total shareholders equity |
$ | 136,161 | $ | 88,939 | $ | 85,850 | $ | 83,460 | ||||||||
| Less: Intangible assets |
30,591 | — | — | — | ||||||||||||
| Less: minority interest not included in intangible assets |
305 | — | — | — | ||||||||||||
|
|
|
|
|
|
|
|
|
|||||||||
| Tangible common equity |
$ | 105,265 | $ | 88,939 | $ | 85,850 | $ | 83,460 | ||||||||
| Common shares outstanding at year or period end |
7,541,541 | 5,730,114 | 5,730,114 | 5,730,114 | ||||||||||||
| Tangible book value per share |
$ | 13.96 | $ | 15.52 | $ | 14.98 | $ | 14.57 | ||||||||
|
|
|
|
|
|
|
|
|
|||||||||
| Total assets at end of period |
$ | 1,138,426 | $ | 791,781 | $ | 693,359 | $ | 426,380 | ||||||||
| Less: Intangible assets |
30,591 | — | — | — | ||||||||||||
|
|
|
|
|
|
|
|
|
|||||||||
| Adjusted total assets at end of period |
1,107,835 | 791,781 | 693,359 | 426,380 | ||||||||||||
| Tangible common equity to tangible assets |
9.50 | % | 11.23 | % | 12.38 | % | 19.57 | % | ||||||||
|
|
|
|
|
|
|
|
|
|||||||||
| Total average shareholders equity |
$ | 97,326 | $ | 86,969 | $ | 84,782 | $ | 81,917 | ||||||||
| Less: Average intangible assets |
8,244 | — | — | — | ||||||||||||
| Less: average minority interest not included in intangible assets |
136 | — | — | — | ||||||||||||
|
|
|
|
|
|
|
|
|
|||||||||
| Average tangible common equity |
$ | 88,946 | $ | 86,969 | $ | 84,782 | $ | 81,917 | ||||||||
| Net income to common shareholders |
5,403 | 4,006 | 2,057 | 542 | ||||||||||||
| Return on average tangible common equity (ROATCE) |
6.07 | % | 4.61 | % | 2.43 | % | 0.66 | % | ||||||||
|
|
|
|
|
|
|
|
|
|||||||||
| Efficiency ratio: |
||||||||||||||||
| Net interest income |
$ | 28,473 | $ | 20,699 | $ | 16,672 | $ | 13,446 | ||||||||
| Total noninterest income |
5,032 | 5,302 | 4,665 | 2,465 | ||||||||||||
| Less: gain (loss) on sale of securities |
(33 | ) | 47 | — | 64 | |||||||||||
|
|
|
|
|
|
|
|
|
|||||||||
| Operating revenue |
$ | 33,538 | $ | 25,954 | $ | 21,337 | $ | 15,847 | ||||||||
|
|
|
|
|
|
|
|
|
|||||||||
| Expenses: |
||||||||||||||||
| Total noninterest expenses |
$ | 23,453 | $ | 19,685 | $ | 18,084 | $ | 14,600 | ||||||||
|
|
|
|
|
|
|
|
|
|||||||||
| Efficiency ratio |
69.93 | % | 75.85 | % | 84.75 | % | 92.13 | % | ||||||||
|
|
|
|
|
|
|
|
|
|||||||||
| Operating efficiency ratio: |
||||||||||||||||
| Net interest income |
$ | 28,473 | $ | 20,699 | $ | 16,672 | $ | 13,446 | ||||||||
| Total noninterest income |
5,032 | 5,302 | 4,665 | 2,465 | ||||||||||||
| Less: gain (loss) on sale of securities |
(33 | ) | 47 | — | 64 | |||||||||||
|
|
|
|
|
|
|
|
|
|||||||||
| Operating revenue |
$ | 33,538 | $ | 25,954 | $ | 21,337 | $ | 15,847 | ||||||||
|
|
|
|
|
|
|
|
|
|||||||||
| Expenses: |
||||||||||||||||
| Total noninterest expenses |
$ | 23,453 | $ | 19,685 | $ | 18,084 | $ | 14,600 | ||||||||
| Less: merger expenses |
662 | 257 | — | — | ||||||||||||
|
|
|
|
|
|
|
|
|
|||||||||
| Adjusted noninterest expenses |
$ | 22,791 | $ | 19,428 | $ | 18,084 | $ | 14,600 | ||||||||
|
|
|
|
|
|
|
|
|
|||||||||
| Operating efficiency ratio |
67.96 | % | 74.86 | % | 84.75 | % | 92.13 | % | ||||||||
|
|
|
|
|
|
|
|
|
|||||||||
14
Table of Contents
Index to Financial Statements
UNAUDITED PRO FORMA CONDENSED COMBINED FINANCIAL INFORMATION
The following unaudited pro forma condensed combined statement of income of NCC for the year ended December 31, 2014 has been prepared to reflect our acquisitions of United on December 15, 2014 and CBI on August 29, 2014, after giving effect to the adjustments described in the notes to the unaudited pro forma condensed combined financial statements. The unaudited pro forma condensed combined statement of income has been prepared assuming the United and CBI transactions were consummated on January 1, 2014. The unaudited pro forma condensed combined statement of income (i) includes the historical results of CBI for the six months ended June 30, 2014, with the pro forma adjustments reflecting the results of CBI from July 1, 2014 through August 29, 2014, and (ii) include the historical results for United for the nine months ended September 30, 2014, with the pro forma adjustments reflecting the results of United from October 1, 2014 through December 15, 2014.
In the United merger, each issued and outstanding share of United common stock (other than cash election shares, as discussed below) was converted into the right to receive 0.057794 shares of our common stock, plus cash in lieu of any fractional share of our common stock otherwise issuable equal to the product of $22.68 times the fractional share of our common stock otherwise issuable, which we refer to as the stock consideration. Subject to the proration procedures described in the Agreement and Plan of Merger, dated June 6, 2014, between United and NCC, or the merger agreement, each share of United common stock whose holder elected to receive cash for such share, or a cash election, was converted into the right to receive $1.30 in cash, without interest, which we refer to as the cash consideration. Accordingly, we issued a total of 1,617,027 shares of our common stock as stock consideration in the United merger and paid aggregate cash consideration of $2,953,884 for cash elections and cash in lieu of fractional shares. The total estimated aggregate value of the consideration paid in the United merger is $33.3 million.
In our acquisition of CBI, which closed on August 29, 2014, CBI’s members received $16.2 million in cash on the closing date. In exchange for the payment, we received a 70% interest in CBI. We also have an option to purchase the remaining 30% interest in CBI between the fifth and eighth anniversaries of the closing date of the acquisition. Since we purchased more than 50% of CBI, our consolidated financial statements include 100% of the assets and liabilities of CBI and a noncontrolling interest to reflect the minority ownership.
The unaudited pro forma condensed combined statements of income have been prepared assuming the acquisition method of accounting in accordance with Accounting Standards Codification Topic 805, Business Combinations, or ASC 805. In business combination transactions in which the consideration given is not in the form of cash (that is, in the form of non–cash assets, liabilities incurred or equity interests issued), measurement of the acquisition consideration is based on the fair value of the consideration given or the fair value of the asset (or net assets) acquired, whichever is more clearly evident and, thus, a more reliable measure. Under ASC 805, all of the assets acquired and liabilities assumed in a business combination are recognized at their acquisition date fair value, while transaction costs and restructuring costs associated with the business combination are expensed as incurred. The excess of the acquisition consideration over the fair value of assets acquired and liabilities assumed, if any, is allocated to goodwill.
The unaudited pro forma condensed combined statement of income is presented for illustrative purposes only and does not indicate either the operating results that would have occurred had the United merger and CBI acquisition been consummated on January 1, 2014, or future results of operations or financial condition. The unaudited pro forma condensed combined statement of income is based upon assumptions and adjustments that we believe are reasonable. Only such adjustments as have been described above and in the accompanying footnotes have been applied in order to give effect to the proposed transaction. Such assumptions and adjustments are subject to change as future events materialize and fair value estimates are refined.
15
Table of Contents
Index to Financial Statements
The unaudited pro forma condensed combined statements of income should be read together with:
| • | the accompanying notes to the unaudited pro forma condensed combined statement of income; |
| • | our separate audited historical consolidated financial statements and accompanying notes as of and for the years ended December 31, 2014 and 2013, included elsewhere in this prospectus; |
| • | United’s separate audited historical consolidated financial statements and accompanying notes as of and for the year ended December 31, 2013, included elsewhere in this prospectus; |
| • | CBI’s separate audited historical consolidated financial statements and accompanying notes as of and for the year ended December 31, 2013, included elsewhere in this prospectus; |
| • | United’s separate unaudited historical consolidated financial statements and accompanying notes as of and for the three and nine months ended September 30, 2014, included elsewhere in this prospectus; and |
| • | CBI’s separate unaudited historical consolidated financial statements and accompanying notes as of and for the three and six months ended June 30, 2014, included elsewhere in this prospectus. |
16
Table of Contents
Index to Financial Statements
The following unaudited pro forma condensed combined statement of income for the year ended December 31, 2014 combines the consolidated historical income statements of NCC, United and CBI assuming the companies had been combined as of January 1, 2014 on a purchase accounting basis.
National Commerce Corporation, United Group Banking Company of Florida, Inc. and
CBI Holding Company, LLC
Unaudited Pro Forma Condensed Combined Statement of Income
For the Year Ended December 31, 2014
(amounts in thousands, except share and per share data)
| Historical | CBI Pro Forma Adjustments (1) |
United Pro Forma Adjustments (2) |
Pro Forma Combined |
|||||||||||||||||||||||||||||
| NCC | CBI (1) | United (2) | ||||||||||||||||||||||||||||||
| Statement of Income Data |
||||||||||||||||||||||||||||||||
| Interest on and dividends on securities |
$ | 1,347 | $ | — | $ | 771 | $ | — | $ | 150 | d | $ | 2,268 | |||||||||||||||||||
| Interest and fees on loans |
29,812 | 5,606 | 5,437 | 2,131 | a | 1,514 | d | 44,783 | ||||||||||||||||||||||||
| 283 | e | |||||||||||||||||||||||||||||||
| Interest on Federal Funds sold and other investments |
183 | — | 34 | — | 10 | d | 227 | |||||||||||||||||||||||||
|
|
|
|
|
|
|
|
|
|
|
|
|
|||||||||||||||||||||
| Total interest income |
31,342 | 5,606 | 6,242 | 2,131 | 1,957 | 47,278 | ||||||||||||||||||||||||||
| Interest on deposits |
2,427 | — | 661 | — | 164 | d | 3,252 | |||||||||||||||||||||||||
| Interest on borrowed money |
442 | 867 | 24 | 330 | a | 7 | d | 1,670 | ||||||||||||||||||||||||
|
|
|
|
|
|
|
|
|
|
|
|
|
|||||||||||||||||||||
| — | ||||||||||||||||||||||||||||||||
| Total interest expense |
2,869 | 867 | 685 | 330 | 171 | 4,922 | ||||||||||||||||||||||||||
| Net interest income |
28,473 | 4,739 | 5,557 | 1,801 | 1,786 | 42,356 | ||||||||||||||||||||||||||
| Provision for loan losses |
978 | 166 | 285 | 75 | a | 85 | d | 1,589 | ||||||||||||||||||||||||
|
|
|
|
|
|
|
|
|
|
|
|
|
|||||||||||||||||||||
| Net interest income after provision for loan losses |
27,495 | 4,573 | 5,272 | 1,726 | 1,701 | 40,767 | ||||||||||||||||||||||||||
| Gain (loss) on sale of securities |
(33 | ) | — | 36 | — | 58 | d | 61 | ||||||||||||||||||||||||
| Other noninterest income |
5,065 | — | 394 | — | 106 | d | 5,565 | |||||||||||||||||||||||||
| Total noninterest expense |
23,453 | 2,466 | 5,124 | 1,224 | a | 1,392 | d | 34,033 | ||||||||||||||||||||||||
| 374 | f | |||||||||||||||||||||||||||||||
|
|
|
|
|
|
|
|
|
|
|
|
|
|||||||||||||||||||||
| Income before taxes |
9,074 | 2,107 | 578 | 502 | 99 | 12,360 | ||||||||||||||||||||||||||
| Provision for income taxes |
3,159 | — | 218 | 694 | b | 38 | g | 4,109 | ||||||||||||||||||||||||
|
|
|
|
|
|
|
|
|
|
|
|
|
|||||||||||||||||||||
| Net income before minority interest |
5,915 | 2,107 | 360 | (192 | ) | 61 | 8,251 | |||||||||||||||||||||||||
| Net income attributable to minority interest |
512 | — | — | 783 | c | — | 1,295 | |||||||||||||||||||||||||
|
|
|
|
|
|
|
|
|
|
|
|
|
|||||||||||||||||||||
| Net income to common |
$ | 5,403 | $ | 2,107 | $ | 360 | $ | (975 | ) | $ | 61 | $ | 6,956 | |||||||||||||||||||
|
|
|
|
|
|
|
|
|
|
|
|
|
|||||||||||||||||||||
| Selected Performance Metrics |
||||||||||||||||||||||||||||||||
| ROAA |
0.66 | % | 0.62 | % | ||||||||||||||||||||||||||||
| ROAE |
5.55 | % | 5.27 | % | ||||||||||||||||||||||||||||
| ROATCE |
6.07 | % | 6.95 | % | ||||||||||||||||||||||||||||
| Net interest margin |
3.75 | % | 4.08 | % | ||||||||||||||||||||||||||||
| Efficiency ratio |
69.93 | % | 71.02 | % | ||||||||||||||||||||||||||||
| Noninterest income / average assets |
0.62 | % | 0.50 | % | ||||||||||||||||||||||||||||
| Noninterest expense / average assets |
2.88 | % | 3.04 | % | ||||||||||||||||||||||||||||
| PER COMMON SHARE |
||||||||||||||||||||||||||||||||
| Net Income basic |
$ | 0.92 | $ | 0.94 | ||||||||||||||||||||||||||||
| Net Income diluted |
$ | 0.91 | $ | 0.93 | ||||||||||||||||||||||||||||
| Average diluted shares outstanding, basic |
5,888,862 | 7,430,575 | ||||||||||||||||||||||||||||||
| Average diluted shares outstanding, diluted |
5,960,199 | 7,501,912 | ||||||||||||||||||||||||||||||
17
Table of Contents
Index to Financial Statements
| 1. | The pro forma income statement assumes that the acquisition of CBI occurred at the beginning of the earliest period presented and purchase accounting marks applied to the CBI balance sheet as of January 1, 2014. |
The amounts under the historical column for the year ended December 31, 2014 for CBI are its results of operations from January 1, 2014 through June 30, 3014. The results of CBI from July 1, 2014 through August 29, 2014 (the acquisition date) are included in the CBI pro forma adjustments column. The results of CBI from the acquisition date through December 31, 2014, are included in the NCC historical column. See Footnote a below.
The following adjustments were made to the historical income statement to reflect the purchase accounting entry and related fair value adjustments.
| a. | Entry to record the results of operations of CBI from July 1, 2014 through August 29, 2014. |
| b. | Entry to record the related taxes of the CBI earnings and pro forma adjustments. CBI is a pass through entity and records no federal or state income tax expense. |
| c. | Entry to record noncontrolling interests in earnings of CBI. |
| 2. | The pro forma income statement assumes that the merger of NCC and United occurred at the beginning of the earliest period presented and purchase accounting marks applied to the United balance sheet as of January 1, 2014. |
The amounts in the historical column for the year ended December 31, 2014 for United are its results of operations from January 1, 2014 through September 30, 2014. The results of United from October 1, 2014 through December 15, 2014 (the acquisition date) are included in the United pro forma adjustments column. For purposes of this pro forma presentation, we have excluded approximately $1.4 million in merger-related expenses paid by United after October 1, 2014 but prior to December 15, 2014. The results of United from the acquisition date through December 31, 2014 are included in the NCC historical column. See Footnote d below.
The following adjustments were made to the historical income statement to reflect the purchase accounting entry and related fair market value adjustments.
| d. | Entry to record results of operations of United from October 1, 2014 through December 15, 2014. |
| e. | Entry to record the accretable yield recognized during the period. The accretable portion of the recorded discount will be accreted using an effective yield method. |
| f. | Entry to record the core deposit amortization during the period. The core deposit intangible will be amortized over seven years using an accelerated method. |
| g. | Entry to record tax effect of the pro forma adjustments assuming a tax rate of 37%. |
18
Table of Contents
Index to Financial Statements
This offering and investing in our common stock involves a high degree of risk. You should carefully consider the following risks and uncertainties and all other information contained in this prospectus before deciding to invest in shares of our common stock. The occurrence of any of these risks could have a material adverse effect on our business, prospects, results of operations or financial condition, in which case the trading price of our common stock could decline and you could lose all or part of your investment. Additional risks of which we are not presently aware or that we currently believe are immaterial may also harm our business and results of operations.
Risks Relating to Our Business
Our business is concentrated in, and largely dependent upon, the continued growth and welfare of the general geographic markets in which we operate.
Our commercial banking operations are concentrated in Alabama and Central Florida. As of December 31, 2014, approximately 92.5% of our total loans were to borrowers located in Alabama and Florida. As a result, our financial condition and results of operations and cash flows are affected by changes in the economic conditions of those states or the regions of which they are a part. Our success depends to a significant extent upon the business activity, population, income levels, deposits, and real estate activity in these markets. Although our customers’ business and financial interests may extend well beyond these market areas, adverse conditions that affect these market areas could reduce our growth rate, affect the ability of our customers to repay their loans, affect the value of collateral underlying loans, impact our ability to attract deposits, and generally affect our financial conditions and results of operations. Because of our geographic concentration, we may be less able than other regional or national financial institutions to diversify our credit risks across multiple markets.
A return of recessionary conditions could result in increases in our level of nonperforming loans and/or reduced demand for our products and services, which could have an adverse effect on our results of operations.
Economic recession or other economic problems, including those affecting our markets and regions, but also those affecting the U.S. or world economies, could have a material adverse impact on the demand for our products and services. Since the conclusion of the last recession, economic growth has been slow and uneven, and unemployment levels remain high. If economic conditions deteriorate, or if there are negative developments affecting the domestic and international credit markets, the value of our loans and investments may be harmed, which in turn would have an adverse effect on our financial performance, and our financial condition may be adversely affected. In addition, although deteriorating market conditions could adversely affect our financial condition, results of operations, and cash flows, we cannot provide any assurance that we would benefit from any market growth or favorable economic conditions, either in our primary market areas or nationally, even if they do occur.
Difficult conditions in the market for financial products and services may materially and adversely affect our business and results of operations.
Dramatic declines in the housing market during recent years, along with increasing foreclosures and unemployment, resulted in significant write-downs of asset values by financial institutions, including government-sponsored entities and major commercial and investment banks. These write-downs, initially of mortgage-backed securities but spreading to credit default swaps and other derivative securities, caused many financial institutions to seek additional capital, to merge with larger and stronger institutions, and, in some cases, to fail. This market turmoil and tightening of credit led to an increased level of commercial and consumer delinquencies, lack of consumer confidence, increased market volatility, and widespread reduction of business activity generally. Although conditions have improved, a return of these trends could have a material adverse effect on our business and operations. Negative market developments may affect consumer confidence levels and may cause adverse changes in payment patterns, causing increases in delinquencies and default rates, which may impact our charge-offs and provisions for loan and credit losses. Economic deterioration that affects household
19
Table of Contents
Index to Financial Statements
and/or corporate incomes could also result in reduced demand for credit or fee-based products and services. These conditions would have adverse effects on us and others in the financial services industry.
Our small to medium-sized business and entrepreneurial customers may have fewer financial resources than larger entities to weather a downturn in the economy, which may impair a borrower’s ability to repay a loan, and such impairment could adversely affect our financial condition and results of operations.
We focus our business development and marketing strategy primarily to serve the banking and financial services needs of small to medium-sized businesses and entrepreneurs. These small to medium-sized businesses and entrepreneurs may have fewer financial resources in terms of capital or borrowing capacity than larger entities. If economic conditions negatively impact the Alabama and Central Florida markets generally, and small to medium-sized businesses are adversely affected, our financial condition and results of operations may be negatively affected.
Our financial performance will be negatively impacted if we are unable to execute our growth strategy.
Our current growth strategy is to grow organically and supplement that growth with select acquisitions. Our ability to grow organically depends primarily on generating loans and deposits of acceptable risk and expense, and we may not be successful in continuing this organic growth. Our ability to identify appropriate markets for expansion, recruit and retain qualified personnel, and fund growth at a reasonable cost depends upon prevailing economic conditions, maintenance of sufficient capital, competitive factors, and changes in banking laws, among other factors. Conversely, if we grow too quickly and are unable to control costs and maintain asset quality, such growth, whether organic or through select acquisitions, could materially and adversely affect our financial condition and results of operations.
External economic factors, such as changes in monetary policy and inflation and deflation, may have an adverse effect on our business, financial condition and results of operations.
Our financial condition and results of operations are affected by credit policies of monetary authorities, particularly the Board of Governors of the Federal Reserve System, or the Federal Reserve. Actions by monetary and fiscal authorities, including the Federal Reserve, could lead to inflation, deflation, or other economic phenomena that could adversely affect our financial performance. The primary impact of inflation on our operations most likely will be reflected in increased operating costs. Conversely, deflation generally will tend to erode collateral values and diminish loan quality. Virtually all of our assets and liabilities are monetary in nature. As a result, interest rates have a more significant impact on our performance than general levels of inflation or deflation. Interest rates do not necessarily move in the same direction or by the same magnitude as the prices of goods and services.
Our profitability is vulnerable to interest rate fluctuations.
Our profitability depends substantially upon our net interest income. Net interest income is the difference between the interest earned on assets (such as loans and securities held in our investment portfolio) and the interest paid for liabilities (such as interest paid on savings and money market accounts and time deposits).
Income associated with interest-earning assets and costs associated with interest-bearing liabilities may not be affected uniformly by fluctuations in interest rates. The magnitude and duration of changes in interest rates are events over which we have no control, and such changes may have an adverse effect on our net interest income. Prepayment and early withdrawal levels, which are also impacted by changes in interest rates, can significantly affect our assets and liabilities. For example, an increase in interest rates could, among other things, reduce the demand for loans and decrease loan repayment rates. Such an increase could also adversely affect the ability of our floating-rate borrowers to meet their higher payment obligations, which could in turn lead to an increase in non-performing assets and net charge-offs. Conversely, a decrease in the general level of interest rates could affect us by, among other things, leading to greater competition for deposits and incentivizing borrowers to prepay or refinance their loans more quickly or frequently than they otherwise would. The primary tool that management uses to measure interest rate risk is a simulation model that evaluates the impact of varying levels of prevailing interest rates and the impact on net interest income and the economic value of equity. As of December 31, 2014, this simulation analysis indicated that if prevailing interest rates immediately decreased by
20
Table of Contents
Index to Financial Statements
300 basis points, we would expect net interest income to decrease by approximately $3.1 million, or 6.8%, over the next 12 months, and a decline in the economic value of equity of $16.3 million, or 10.8%. We believe that this is unlikely based on current interest rate levels. Conversely, if prevailing interest rates immediately increased by 300 basis points, we would expect net interest income to increase by approximately $6.8 million, or 15.1%, over the next 12 months, and an increase in the economic value of equity of $7.0 million, or 4.7%. However, fluctuations in interest rates affect different classes of income-earning assets differently, and there can be no assurance as to the actual effect on our results of operations should such an increase or decrease occur.
Generally, the interest rates on our interest-earning assets and interest-bearing liabilities do not change at the same rate, to the same extent or on the same basis. Even assets and liabilities with similar maturities or re-pricing periods may react in different degrees to changes in market interest rates. Interest rates on certain types of assets and liabilities may fluctuate in advance of changes in general market interest rates, while interest rates on other types of assets and liabilities may lag behind changes in general market rates. Certain assets, such as fixed and adjustable rate mortgage loans, have features that limit changes in interest rates on a short-term basis and over the life of the asset. Changes in interest rates could materially and adversely affect our financial condition and results of operations.
Market interest rates for loans, investments, and deposits are highly sensitive to many factors beyond our control.
Generally, interest rate spreads (the difference between interest rates earned on assets and interest rates paid on liabilities) have narrowed in recent years as a result of changing market conditions, policies of various government and regulatory authorities, and competitive pricing pressures, and we cannot predict whether these rate spreads will narrow even further. This narrowing of interest rate spreads could adversely affect our financial condition and results of operations. In addition, we cannot predict whether interest rates will continue to remain at present levels. Changes in interest rates may cause significant changes, up or down, in our net interest income.
We attempt to minimize the adverse effects of changes in interest rates by structuring our asset-liability composition in order to obtain the maximum spread between interest income and interest expense. However, there can be no assurance that we will be successful in minimizing the adverse effects of changes in interest rates. Depending on our portfolio of loans and investments, our financial condition and results of operations may be adversely affected by changes in interest rates.
We could suffer losses from a decline in the credit quality of the assets that we hold.
We could sustain losses if borrowers, guarantors, and related parties fail to perform in accordance with the terms of their loans. We have adopted underwriting and credit monitoring procedures and policies that we believe are appropriate to minimize this risk, including the establishment and review of the allowance for credit losses, periodic assessment of the likelihood of nonperformance, tracking loan performance, and diversifying our credit portfolio. These policies and procedures, however, may not prevent unexpected losses that could materially adversely affect our financial condition and results of operations. In particular, we face credit quality risks presented by past, current, and potential economic and real estate market conditions.
A significant portion of our loan portfolio is secured by real estate, and events that negatively impact the real estate market could negatively impact our business.
A significant portion of our loan portfolio is secured by either residential or commercial real estate. As of December 31, 2014, we had approximately $221.2 million in residential real estate loans and $330.8 million in commercial real estate loans outstanding, representing approximately 24.9% and 37.2%, respectively, of our total loans outstanding on that date.
There are significant risks associated with real estate-based lending. Real estate collateral may deteriorate in value during the time that credit is extended, in which case we might not be able to sell such collateral for an amount necessary to satisfy a defaulting borrower’s obligation to us. In that event, there could be a material adverse effect on our financial condition and results of operations. Additionally, commercial real estate loans are
21
Table of Contents
Index to Financial Statements
subject to unique risks. These types of loans are often viewed as having more risks than residential real estate or other consumer loans, primarily because relatively large amounts are loans to a relatively small number of borrowers. Thus, the deterioration of even a small number of these loans could cause a significant increase in the loan loss allowance or loan charge-offs, which in turn could have a material adverse effect on our financial condition and results of operations. Furthermore, commercial real estate loans depend on cash flows from the property securing the debt. Cash flows may be affected significantly by general economic conditions, and a downturn in a local economy in one of our markets or in occupancy rates where a property is located could increase the likelihood of default.
The foregoing risks are enhanced as a result of the limited geographic scope of our principal markets. Most of the real estate securing our loans is located in Alabama and Central Florida. Because the value of this collateral depends upon local real estate market conditions and is affected by, among other things, neighborhood characteristics, real estate tax rates, the cost of operating the properties, and local governmental regulation, adverse changes in any of these factors in Alabama or Central Florida could cause a decline in the value of the collateral securing a significant portion of our loan portfolio. Further, the concentration of real estate collateral in these two markets limits our ability to diversify the risk of such occurrences.
Our allowance for estimated loan losses may not be adequate to cover actual loan losses, which may require us to take a charge to earnings and adversely impact our financial condition and results of operations.
We maintain an allowance for estimated loan losses that we believe is adequate to absorb any probable losses in our loan portfolio. Management determines the amount of the allowance based upon an analysis of general market conditions, credit quality of our loan portfolio and performance of our customers relative to their financial obligations with us. We periodically evaluate the loan portfolio for risk grading, which can result in changes in our allowance. The amount of future losses is affected by changes in economic, operating, and other conditions, including changes in interest rates, which may be beyond our control, and such losses may exceed the allowance for estimated loan losses. Although we believe that our allowance for estimated loan losses is adequate to absorb any probable losses on existing loans that may become uncollectible, there can be no assurance that the allowance will prove sufficient to cover actual loan losses in the future. If actual losses exceed the estimate, the excess losses could adversely affect our net income and capital. Such excess could also lead to larger allowances for loan losses in future periods, which could in turn adversely affect new income and capital in those periods. If economic conditions differ substantially from the assumptions used in the estimate, or if the performance of our loan portfolio deteriorates, future losses may occur, and increases in the allowance may be necessary, either of which would have a negative effect on our financial condition and results of operations.
Additionally, federal banking regulators, as part of their supervisory function, periodically review the adequacy of our allowance for estimated loan losses. These agencies may require us to establish additional allowances based on their judgment of the information available at the time of their examinations. If these regulatory agencies require us to increase the allowance for estimated loan losses, it would have a negative effect on our financial condition and results of operations.
Our use of appraisals in deciding whether to make a loan secured by real property does not ensure the value of the real property collateral.
In considering whether to make a loan secured by real property, we generally require an appraisal. However, an appraisal is only an estimate of the value of the property at the time the appraisal is made. If the appraisal does not reflect the amount that may be obtained upon any sale or foreclosure of the property, we may not realize an amount equal to the indebtedness secured by the property.
Any expansion into new markets or new lines of business might not be successful.
As part of our ongoing strategic plan, we may consider expansion into new geographic markets. Such expansion might take the form of the establishment of de novo branches or the acquisition of existing banks or bank branches. There are considerable costs associated with opening new branches, and new branches generally do not generate sufficient revenues to offset costs until they have been in operation for some time. Additionally, we may consider expansion into new lines of business through the acquisition of third parties or organic growth
22
Table of Contents
Index to Financial Statements
and development. There are substantial risks associated with such efforts, including risks that (i) revenues from such activities might not be sufficient to offset the development, compliance, and other implementation costs, (ii) competing products and services and shifting market preferences might affect the profitability of such activities, and (iii) our internal controls might be inadequate to manage the risks associated with new activities. Furthermore, it is possible that our unfamiliarity with new markets or lines of business might adversely affect the success of such actions. If any such expansions into new geographic or product markets are not successful, there could be an adverse effect on our financial condition and results of operations.
We have incurred, and expect to continue incurring, substantial expenses related to our recent acquisitions.
We have incurred, and expect to continue incurring, substantial expenses in connection with completing our recent acquisitions and integrating the operations of the acquired businesses with our operations. There are a number of factors beyond our control that could affect the total amount or the timing of our transaction and integration expenses, and such expenses may exceed our initial projections. Many of the expenses that will be incurred, by their nature, are difficult to estimate accurately at the present time. As a result, the transaction and integration expenses associated with our recent acquisitions could, particularly in the near term, exceed the savings that we expect to achieve from the elimination of duplicative expenses and the realization of economies of scale and cost savings related to the integration of the acquired businesses following the completion of our recent acquisitions.
Acquisitions may disrupt our business and dilute shareowner value, and integrating acquired companies may be more difficult, costly, or time-consuming than we expect.
Our business strategy focuses on both organic growth and growth through acquisitions of financial institutions located in the southeastern United States. Our pursuit of acquisitions may disrupt our business, and common stock that we issue as merger consideration may have the effect of diluting the value of your investment. In addition, we may fail to realize some or all of the anticipated benefits of completed acquisitions, including our acquisition of a controlling interest in CBI on August 29, 2014 and our acquisition of United on December 15, 2014. We anticipate that the integration of CBI, United and other businesses that we acquire in the future may be a time-consuming and expensive process, even if the integration process is effectively planned and implemented.
In addition, our acquisition activities could be material to our business and involve a number of significant risks, including the following:
| • | incurring time and expense associated with identifying and evaluating potential acquisitions and negotiating potential transactions, resulting in our attention being diverted from the operation of our existing business; |
| • | using inaccurate estimates and judgments to evaluate credit, operations, management, and market risks with respect to the target company or the assets and liabilities that we seek to acquire; |
| • | exposure to potential asset quality issues of the target company; |
| • | intense competition from other banking organizations and other potential acquirers, many of which have substantially greater resources than we do; |
| • | potential exposure to unknown or contingent liabilities of banks and businesses we acquire, including, without limitation, liabilities for regulatory and compliance issues; |
| • | inability to realize the expected revenue increases, cost savings, increases in geographic or product presence, and other projected benefits of the acquisition; |
| • | incurring time and expense required to integrate the operations and personnel of the combined businesses; |
| • | inconsistencies in standards, procedures, and policies that would adversely affect our ability to maintain relationships with customers and employees; |
| • | experiencing higher operating expenses relative to operating income from the new operations; |
23
Table of Contents
Index to Financial Statements
| • | creating an adverse short-term effect on our results of operations; |
| • | losing key employees and customers; |
| • | significant problems relating to the conversion of the financial and customer data of the entity; |
| • | integration of acquired customers into our financial and customer product systems; |
| • | potential changes in banking or tax laws or regulations that may affect the target company; or |
| • | risks of impairment to goodwill or other-than-temporary impairment of investment securities. |
If difficulties arise with respect to the integration process, the economic benefits expected to result from acquisitions might not occur. As with any merger of financial institutions, there also may be business disruptions that cause us to lose customers or cause customers to move their business to other financial institutions. Failure to successfully integrate businesses that we acquire could have an adverse effect on our profitability, return on equity, return on assets, or our ability to implement our strategy, any of which in turn could have a material adverse effect on our business, financial condition, and results of operation.
Our liquidity needs might adversely affect our financial condition and results of operations.
The primary sources of funds for NBC and ULB are customer deposits and loan repayments. Loan repayments are subject to the credit risks described above. In addition, deposit levels may be affected by a number of factors, including interest rates paid by competitors, general interest rate levels, returns available to customers on alternative investments, and general economic conditions. Therefore, NBC and ULB may be required to rely from time to time on secondary sources of liquidity to meet withdrawal demands or otherwise fund operations or support growth. NBC and ULB have lines of credit in place with the Federal Home Loan Bank of Atlanta and correspondent banks that we believe are adequate to meet the Banks’ liquidity needs. However, there can be no assurance that these arrangements will be sufficient to meet future liquidity needs, particularly if loan demand grows faster than anticipated.
As a bank holding company, the sources of funds available to us are limited.
Any future constraints on liquidity at the holding company level could impair our ability to declare and pay dividends on our common stock. In some instances, notice to, or approval from, the Federal Reserve may be required prior to our declaration or payment of dividends. Further, our operations are primarily conducted by our subsidiary Banks, which are subject to significant regulation. Federal and state banking laws restrict the payment of dividends by banks to their holding companies, and NBC and ULB will be subject to these restrictions in paying dividends to us. Because our ability to receive dividends or loans from NBC and ULB is restricted, our ability to pay dividends to our shareowners is also restricted. As of December 31, 2014, NBC and ULB each had a negative retained earnings balance, and, accordingly, each Bank is prohibited from paying dividends on its common stock to us without the approval of the OCC, in the case of NBC, and the Florida Office of Financial Regulation, or FOFR, and the Federal Reserve, in the case of ULB. We expect that the consolidation of ULB and NBC will occur on or about February 28, 2015 and that NBC will have a positive retained earnings balance in the first half of 2015. However, even after NBC has a positive retained earnings balance, its ability to pay dividends on its common stock to us without OCC approval is limited by banking laws to its retained net income available to holders of its common stock to date for the then current fiscal year, plus retained net income from the prior two fiscal years.
Additionally, the right of a bank holding company to participate in the assets of its subsidiary bank in the event of a bank-level liquidation or reorganization is subject to the claims of the bank’s creditors, including depositors, which take priority, except to the extent that the holding company may be a creditor with a recognized claim.
Our largest loan relationships currently make up a material percentage of our total loan portfolio.
As of December 31, 2014, our ten largest loan relationships totaled over $61.6 million in loan exposure, or 6.9% of the total loan portfolio. The concentration risk associated with having a small number of large loan relationships is that, if one or more of these relationships were to become delinquent or suffer default, we could
24
Table of Contents
Index to Financial Statements
be at serious risk of material losses. The allowance for loan losses may not be adequate to cover losses associated with any of these relationships, and any loss or increase in the allowance would negatively affect our earnings and capital. Even if the loans are collateralized, the large increase in classified assets could harm our reputation with our regulators and inhibit our ability to execute our business plan.
Several of our large depositors have relationships with each other, which creates a higher risk that one customer’s withdrawal of its deposit could lead to a loss of other deposits from customers within the relationship, which, in turn, could force us to fund our business through more expensive and less stable sources.
As of December 31, 2014, our ten largest non-brokered depositors accounted for $183.6 million in deposits, or approximately 18.9% of our total deposits. Further, our non-brokered deposit account balance was $922.1 million, or approximately 95.0% of our total deposits, as of December 31, 2014. Several of our large depositors have business, family, or other relationships with each other, which creates a risk that any one customer’s withdrawal of its deposit could lead to a loss of other deposits from customers within the relationship.
Withdrawals of deposits by any one of our largest depositors or by one of our related customer groups could force us to rely more heavily on borrowings and other sources of funding for our business and withdrawal demands, adversely affecting our net interest margin and results of operations. We may also be forced, as a result of any withdrawal of deposits, to rely more heavily on other, potentially more expensive and less stable funding sources. Consequently, the occurrence of any of these events could have a material adverse effect on our business, results of operations, financial condition, and future prospects.
Our factoring services are concentrated in the transportation and automotive parts and services industry, and economic conditions or other factors negatively impacting the transportation and automotive parts and services industry could adversely affect our factoring business.
Factoring for transportation and automotive parts and services businesses constituted approximately 95% of our total factoring business as of December 31, 2014, calculated based on the gross purchases of invoices from such businesses compared to our total gross purchases of factored receivables for December. Given the concentration of our factoring business in the transportation and automotive parts and services industry, economic conditions or other factors that negatively impact this industry could impact our factoring revenues, as the revenues that we earn from purchasing invoices are directly correlated with the amount of revenue generated by our factoring clients (i.e., the volume of transportation and automotive parts and services invoices that they are able to generate by providing their services). Reductions in economic activity will typically cause a decrease in the volume of goods in commerce available to be transported by our factoring clients. The operations of a large number of our factoring clients are susceptible to changing economic conditions in the energy industry. For example, fluctuations in prices of oil and diesel fuel may affect demand for transportation services, which may in turn affect the ability of such factoring clients to satisfy their obligations to us. Additionally, the factoring industry may not continue its historical growth, and we may face increased competition. Our failure to compete effectively in our market could restrain our growth or cause us to lose market share. Any of these events could adversely impact the returns that we realize on our factoring activity or result in a decrease in the overall amount of our factoring activity and could have an adverse effect on our financial condition and results of operations.
Additional regulations and rulemaking impacting the transportation industry may have a disproportionate impact on the small to mid-sized trucking businesses that comprise our primary transportation factoring clients and adversely affect our factoring business.
Our primary transportation factoring clients are small to mid-sized owner-operators and trucking fleets. Recently implemented federal regulations, and regulations proposed to be implemented in the future, may significantly increase the costs and expenses associated with owning or operating a trucking fleet. These regulations include rulemaking proposed by the Federal Motor Carrier Safety Administration of the United States Department of Transportation, or FMCSA, under the Compliance, Safety, Accountability, or CSA, initiative, maximum hours of service limitations imposed by the FMCSA, electronic log requirements, regulations proposed by the federal Food and Drug Administration, or FDA, requiring increased labeling and monitoring by carriers of any commodity transported that is regulated by the FDA, and proposed increases in the amount of
25
Table of Contents
Index to Financial Statements
combined single limit liability insurance coverage required of a carrier from $750,000 to $3.2 million. The costs and burdens of compliance with these requirements will have a disproportionate impact on the small to mid-sized trucking businesses that comprise our client base and may force some or all of these businesses out of the market. Such an occurrence could adversely impact the returns we realize on our factoring activity or result in a decrease in the overall amount of our factoring activity and could have an adverse effect on our business, financial condition, and results of operations.
Our asset-based lending and factoring products may expose us to an increased risk of fraud.
We rely on the structural features embedded in our asset-based lending and factoring products to mitigate the credit risk associated with such products. With respect to our asset-based loans, we limit our lending to a percentage of the customer’s borrowing base assets that we believe can be readily liquidated in the event of financial distress of the borrower. With respect to our factoring products, we purchase the underlying invoices of our customers and become the direct payee under such invoices, thus transferring the credit risk in such transactions from our customers to the underlying account debtors on such invoices. In the event that one or more of our customers fraudulently represents the existence or valuation of borrowing base assets in the case of an asset-based loan, or the existence or validity of an invoice that we purchase in the case of a factoring transaction, we may advance more funds to such customer than we otherwise would and lose the benefit of the structural protections of our products with respect to such advances. In such event, we could be exposed to material additional losses with respect to such loans or factoring products. Although we believe that we have controls in place to monitor and detect fraud with respect to our asset-based lending and factoring products, there is no guarantee that such controls will be effective. We have experienced fraud with respect to these products in the past, and we anticipate that we will experience such fraud in the future. Losses from such fraudulent activity could have a material adverse impact on our financial condition and results of operations.
We may not be able to adequately measure and limit the credit risk associated with our loan portfolio, which could adversely affect our profitability.
As a part of the products and services that we offer, we make commercial and commercial real estate loans. The principal economic risk associated with each class of loans is the creditworthiness of the borrower, which is affected by the strength of the relevant business market segment, local market conditions, and general economic conditions. Additional factors related to the credit quality of commercial loans include the quality of the management of the business and the borrower’s ability both to properly evaluate changes in the supply and demand characteristics affecting our market for products and services, and to effectively respond to those changes. Additional factors related to the credit quality of commercial real estate loans include tenant vacancy rates and the quality of management of the property. A failure to effectively measure and limit the credit risk associated with our loan portfolio could have an adverse effect on our business, financial condition, and results of operations.
We operate in a highly competitive industry and face significant competition from other financial institutions and financial services providers, which may decrease our growth or profits.
Consumer and commercial banking are highly competitive industries. Our market areas contain not only a large number of community and regional banks, but also a significant presence of the country’s largest commercial banks. We compete with other state and national financial institutions, as well as savings and loan associations, savings banks, and credit unions, for deposits and loans. In addition, we compete with financial intermediaries, such as consumer finance companies, commercial finance companies, mortgage banking companies, insurance companies, securities firms, mutual funds, and several government agencies, as well as major retailers, all actively engaged in providing various types of loans and other financial services. Some of these competitors may have a long history of successful operations in our market areas and greater ties to local businesses and more expansive banking relationships, as well as more established depositor bases, fewer regulatory constraints, and lower cost structures than we do. Competitors with greater resources may possess an advantage through their ability to maintain numerous banking locations in more convenient sites, to conduct more extensive promotional and advertising campaigns, or to operate a more developed technology platform. Due to their size, many competitors may offer a broader range of products and services, as well as better pricing
26
Table of Contents
Index to Financial Statements
for certain products and services than we can offer. For example, in the current low interest rate environment, competitors with lower costs of capital may solicit our customers to refinance their loans with a lower interest rate. Further, increased competition among financial services companies due to the recent consolidation of certain competing financial institutions may adversely affect our ability to market our products and services. Technology has lowered barriers to entry and made it possible for banks to compete in our market areas without a retail footprint by offering competitive rates, and for non-banks to offer products and services traditionally provided by banks.
The financial services industry could become even more competitive as a result of legislative, regulatory, and technological changes and continued consolidation. Banks, securities firms, and insurance companies can merge under the umbrella of a financial holding company, which can offer virtually any type of financial service, including banking, securities underwriting, insurance (both agency and underwriting), and merchant banking.
Our ability to compete successfully depends on a number of factors, including:
| • | our ability to develop, maintain, and build upon long-term customer relationships based on quality service and high ethical standards; |
| • | our ability to attract and retain qualified employees to operate our business effectively; |
| • | our ability to expand our market position; |
| • | the scope, relevance, and pricing of products and services that we offer to meet customer needs and demands; |
| • | the rate at which we introduce new products and services relative to our competitors; |
| • | customer satisfaction with our level of service; and |
| • | industry and general economic trends. |
Failure to perform in any of these areas could significantly weaken our competitive position, which could adversely affect our growth and profitability, which, in turn, could harm our business, financial condition, and results of operations.
As a community bank, our ability to maintain our reputation is critical to the success of our business, and the failure to do so may materially adversely affect our performance.
We are a community bank, and our reputation is one of the most valuable components of our business. As such, we strive to conduct our business in a manner that enhances our reputation. This is done, in part, by recruiting, hiring, and retaining employees who share our core values of being an integral part of the communities we serve, delivering superior service to our customers, and caring about our customers and associates. If our reputation is negatively affected, by the actions of our employees or otherwise, our business and, therefore, our operating results may be materially adversely affected.
As a community banking institution, we have lower lending limits and different lending risks than certain of our larger, more diversified competitors.
We are a community banking institution that provides banking services to the local communities in the market areas in which we operate. Our ability to diversify our economic risks is limited by our own local markets and economies. We lend primarily to individuals and to small to medium-sized businesses, which may expose us to greater lending risks than those of banks that lend to larger, better-capitalized businesses with longer operating histories. In addition, our legally mandated lending limits are lower than those of certain of our competitors that have more capital than we do. These lower lending limits may discourage borrowers with lending needs that exceed our limits from doing business with us. We may try to serve such borrowers by selling loan participations to other financial institutions; however, this strategy may not succeed.
27
Table of Contents
Index to Financial Statements
Our financial projections are based upon numerous assumptions about future events, and our actual financial performance may differ materially from our projections if our assumptions are inaccurate.
If the communities in which we operate do not grow, or if the prevailing economic conditions locally or nationally are less favorable than we have assumed, then our ability to reduce our non-performing loans and other real estate owned portfolios and to implement our business strategies may be adversely affected, and our actual financial performance may be materially different from our projections.
Moreover, we cannot give any assurance that we will benefit from any market growth or favorable economic conditions in our market areas even if they do occur. If our senior management team is unable to provide the effective leadership necessary to implement our strategic plan, including the successful integration of United and ULB, our actual financial performance may be materially adversely different from our projections. Additionally, to the extent that any component of our strategic plan requires regulatory approval, if we are unable to obtain necessary approval, we will be unable to completely implement our strategy, which may adversely affect our actual financial results. Our inability to successfully implement our strategic plan could adversely affect the price of our common stock.
Our recent acquisitions of CBI and United may make it difficult for investors to evaluate our business, financial condition, and results of operations, and also impair our ability to accurately forecast our future performance.
We acquired a controlling interest in CBI on August 29, 2014 and completed the acquisition of United on December 15, 2014. As of December 31, 2014, the combined assets of CBI and United constituted approximately 29.4% of our total consolidated assets. Our limited history operating these businesses and the lack of combined historical financial information may not provide an adequate basis for investors to evaluate our business, financial condition, and results of operations, or to assess trends that may be affecting the businesses that we have acquired, or our business as a whole. Our future operating results depend upon a number of factors, including our ability to integrate these acquisitions, manage our growth, retain the customer base of each of NCC, CBI, and United, and successfully identify and respond to emerging trends affecting our primary product lines and markets. As a result of these uncertainties, predictions about our future financial performance may not be as accurate as they would be if we had a longer operating history, which in turn may affect the trading price and volatility of our common stock following the completion of this offering.
Because our business success depends significantly on key management personnel, the departure of such personnel could impair operations.
We depend heavily upon our senior management team. The loss of the services of a member of our senior management team, or an inability to attract other experienced banking personnel, could adversely affect our business. Some of these adverse effects could include the loss of personal contacts with existing or potential customers, as well as the loss of special technical knowledge, experience, and skills of such individuals who are responsible for our operations.
We may be adversely affected by the lack of soundness of other financial institutions or market utilities.
Our ability to engage in routine funding and other transactions could be adversely affected by the actions and commercial soundness of other financial institutions. Financial institutions are interrelated as a result of trading, clearing, counterparty, or other relationships. Defaults by, or even rumors or questions about, one or more financial institutions or market utilities, or the financial services industry generally, may lead to market-wide liquidity problems and losses of depositor, creditor, and counterparty confidence, and could lead to losses or defaults by us or by other institutions.
We depend on the accuracy and completeness of information about customers and counterparties.
In deciding whether to extend credit or enter into other transactions with customers and counterparties, we may rely on information furnished to us by or on behalf of customers and counterparties, including financial statements and other financial information. We also may rely on representations of customers and counterparties as to the accuracy and completeness of that information and, with respect to financial statements, on reports of
28
Table of Contents
Index to Financial Statements
independent auditors. In deciding whether to extend credit, we may rely upon our customers’ representations that their financial statements conform to GAAP and present fairly, in all material respects, the financial condition, results of operations, and cash flows of the customer. We also may rely on customer representations and certifications, or other audit or accountants’ reports, with respect to the business and financial condition of our clients. Our financial condition, results of operations, financial reporting, and reputation could be negatively affected if we rely on materially misleading, false, inaccurate, or fraudulent information.
We are subject to environmental risk in our lending activities.
Because a significant portion of our loan portfolio is secured by real property, we may foreclose upon and take title to such property in the ordinary course of business. If hazardous substances are found on such property, we could be liable for remediation costs, as well as for personal injury and property damage. Environmental laws might require us to incur substantial expenses, materially reduce the property’s value, or limit our ability to use or sell the property. Although management has policies requiring environmental reviews before loans secured by real property are made and before foreclosure is commenced, it is still possible that environmental risks might not be detected and that the associated costs might have a material adverse effect on our financial condition and results of operations.
We continually encounter technological change and may have fewer resources than our competitors to continue to invest in technological improvements.
The banking and financial services industries are undergoing rapid technological changes, with frequent introductions of new technology-driven products and services. In addition to enhancing the level of service provided to customers, the effective use of technology increases efficiency and enables financial institutions to reduce costs. Our future success will depend, in part, upon our ability to address the needs of our customers by using technology to provide products and services that enhance customer convenience and create additional efficiencies in operations. Many of our competitors have greater resources to invest in technological improvements, and we may not be able to effectively implement new technology-driven products and services, which could reduce our ability to effectively compete.
Our information systems may experience a failure or interruption.
We rely heavily on communications and information systems to conduct our business. Any failure or interruption in the operation of these systems could impair or prevent the effective operation of our customer relationship management, general ledger, deposit, lending, or other functions. While we have policies and procedures designed to prevent or limit the effect of a failure or interruption in the operation of our information systems, there can be no assurance that any such failures or interruptions will not occur or, if they do occur, that they will be adequately addressed. The occurrence of any failures or interruptions impacting our information systems could damage our reputation, result in a loss of customer business, and expose us to additional regulatory scrutiny, civil litigation, and possible financial liability, any of which could have a material adverse effect on our financial condition and results of operations.
We use information technology in our operations and offer online banking services to our customers, and unauthorized access to our or our customers’ confidential or proprietary information as a result of a cyber-attack or otherwise could expose us to reputational harm and litigation and adversely affect our ability to attract and retain customers.
Information security risks for financial institutions have generally increased in recent years, in part because of the proliferation of new technologies, the use of the internet and telecommunications technologies to conduct financial transactions, and the increased sophistication and activities of organized crime, hackers, terrorists, activists, and other external parties. We are under continuous threat of loss due to hacking and cyber-attacks, especially as we continue to expand customer capabilities to utilize internet and other remote channels to transact business. Our risk and exposure to these matters remains heightened because of the evolving nature and complexity of these threats from cybercriminals and hackers, our plans to continue to provide internet banking and mobile banking channels, and our plans to develop additional remote connectivity solutions to serve our customers. Therefore, the secure processing, transmission, and storage of information in connection with our
29
Table of Contents
Index to Financial Statements
online banking services are critical elements of our operations. However, our network could be vulnerable to unauthorized access, computer viruses and other malware, phishing schemes, or other security failures. In addition, our customers may use personal smartphones, tablet PCs, or other mobile devices that are beyond our control systems in order to access our products and services. Our technologies, systems and networks, and our customers’ devices, may become the target of cyber-attacks, electronic fraud, or information security breaches that could result in the unauthorized release, gathering, monitoring, misuse, loss, or destruction of our or our customers’ confidential, proprietary, and other information, or otherwise disrupt our or our customers’ or other third parties’ business operations. As cyber threats continue to evolve, we may be required to spend significant capital and other resources to protect against these threats or to alleviate or investigate problems caused by such threats. To the extent that our activities or the activities of our customers involve the processing, storage, or transmission of confidential customer information, any breaches or unauthorized access to such information could present significant regulatory costs and expose us to litigation and other possible liabilities. Any inability to prevent these types of security threats could also cause existing customers to lose confidence in our systems and could adversely affect our reputation and ability to generate deposits. While we have not experienced any material losses relating to cyber-attacks or other information security breaches to date, we may suffer such losses in the future. The occurrence of any cyber-attack or information security breach could result in potential liability to clients, reputational damage, damage to our competitive position, and the disruption of our operations, all of which could adversely affect our financial condition or results of operations.
We are dependent upon outside third parties for the processing and handling of our records and data.
We rely on software developed by third-party vendors to process various transactions. In some cases, we have contracted with third parties to run their proprietary software on our behalf. These systems include, but are not limited to, general ledger, payroll, employee benefits, loan and deposit processing, and securities portfolio accounting. While we perform a review of controls instituted by the applicable vendors over these programs in accordance with industry standards and perform our own testing of user controls, we must rely on the continued maintenance of controls by these third-party vendors, including safeguards over the security of customer data. In addition, we maintain, or contract with third parties to maintain, daily backups of key processing outputs in the event of a failure on the part of any of these systems. Nonetheless, we may incur a temporary disruption in our ability to conduct business or process transactions, or incur damage to our reputation, if the third-party vendor fails to adequately maintain internal controls or institute necessary changes to systems. Such a disruption or breach of security may have a material adverse effect on our business.
The internal controls that we have implemented in order to mitigate risks inherent to the business of banking might fail or be circumvented.
Management regularly reviews and updates our internal controls and procedures that are designed to manage the various risks in our business, including credit risk, operational risk, and interest rate risk. No system of controls, however well-designed and operated, can provide absolute assurance that the objectives of the system will be met. If there were a failure of such a system, or if a system were circumvented, there could be a material adverse effect on our financial condition and results of operations.
Changes in accounting standards could materially impact our financial statements.
From time to time, the Financial Accounting Standards Board or the Securities and Exchange Commission, or the SEC, may change the financial accounting and reporting standards that govern the preparation of our financial statements. Such changes may result in us being subject to new or changing accounting and reporting standards. In addition, the bodies that interpret the accounting standards (such as banking regulators or outside auditors) may change their interpretations or positions on how these standards should be applied. These changes may be beyond our control, can be hard to predict, and can materially impact how we record and report our financial condition and results of operations. In some cases, we could be required to apply a new or revised standard retrospectively, or apply an existing standard differently, also retrospectively, in each case resulting in our needing to revise or restate prior period financial statements.
30
Table of Contents
Index to Financial Statements
Adverse weather or manmade events could negatively affect our core markets or disrupt our operations, which could have an adverse effect upon our business and results of operations.
Our market areas are susceptible to natural disasters, such as hurricanes, tornadoes, tropical storms, other severe weather events, and related flooding and wind damage, and manmade disasters, such as the 2010 oil spill in the Gulf of Mexico. These natural disasters could negatively impact regional economic conditions; cause a decline in the value or destruction of mortgaged properties and increase the risk of delinquencies, foreclosures, or loss on loans originated by us; damage our banking facilities and offices; and negatively impact our growth strategy. Such weather events could disrupt operations, result in damage to properties, and negatively affect the local economies in the markets where we operate. We cannot predict whether or to what extent damage that may be caused by future weather or manmade events will affect our operations or the economies in our current or future market areas, but such events could negatively impact economic conditions in these regions and result in a decline in local loan demand and loan originations, a decline in the value or destruction of properties securing our loans, and an increase in delinquencies, foreclosures, or loan losses. Our business or results of operations may be adversely affected by these and other negative effects of natural or manmade disasters. Further, severe weather, natural disasters, acts of war or terrorism, and other external events could adversely affect us in a number of ways, including an increase in delinquencies, bankruptcies, or defaults that could result in a higher level of non-performing assets, net charge-offs, and provision for loan losses. Such risks could also impair the value of collateral securing loans and hurt our deposit base.
We are or may become involved from time to time in suits, legal proceedings, information-gathering requests, investigations, and proceedings by governmental and self-regulatory agencies that may lead to adverse consequences.
Many aspects of our business involve substantial risk of legal liability. We have been named or threatened to be named as defendants in various lawsuits arising from our business activities (and in some cases from the activities of companies that we have acquired). In addition, from time to time, we are, or may become, the subject of governmental and self-regulatory agency information-gathering requests, reviews, investigations and proceedings, and other forms of regulatory inquiry, including by bank regulatory agencies, the SEC, and law enforcement authorities. The results of such proceedings could lead to significant civil or criminal penalties, including monetary penalties, damages, adverse judgments, settlements, fines, injunctions, restrictions on the way in which we conduct our business, or reputational harm.
Risks Related to the Regulation of Our Industry
We are subject to extensive regulation in the conduct of our business, which imposes additional costs on us and adversely affects our profitability.
As a bank holding company, we are subject to federal regulation under the Bank Holding Company Act of 1956, as amended, or the BHCA, and the examination and reporting requirements of the Federal Reserve. Federal regulation of the banking industry, along with tax and accounting laws, regulations, rules, and standards, may limit our operations significantly and control the methods by which we conduct business, as they limit those of other banking organizations. Banking regulations are primarily intended to protect depositors, deposit insurance funds, and the banking system as a whole, and not shareowners or other creditors. These regulations affect lending practices, capital structure, investment practices, dividend policy, and overall growth, among other things. For example, federal and state consumer protection laws and regulations limit the manner in which we may offer and extend credit. In addition, the laws governing bankruptcy generally favor debtors, making it more expensive and more difficult to collect from customers who become subject to bankruptcy proceedings.
We also may be required to invest significant management attention and resources to evaluate and make any changes necessary to comply with applicable laws and regulations, particularly as a result of regulations adopted under the Dodd-Frank Wall Street Reform and Consumer Protection Act of 2010. This allocation of resources, as well as any failure to comply with applicable requirements, may negatively impact our financial condition and results of operations.
31
Table of Contents
Index to Financial Statements
Changes in laws, government regulation, and monetary policy may have a material effect on our results of operations.
Financial institutions have been the subject of significant legislative and regulatory changes and may be the subject of further significant legislation or regulation in the future, none of which is within our control. New proposals for legislation continue to be introduced in the U.S. Congress that could further substantially increase regulation of the bank and non-bank financial services industries, impose restrictions on the operations and general ability of firms within the industry to conduct business consistent with historical practices, including in the areas of compensation, interest rates, financial product offerings, and disclosures, and have an effect on bankruptcy proceedings with respect to consumer residential real estate mortgages, among other things. Federal and state regulatory agencies also frequently adopt changes to their regulations or change the manner in which existing regulations are applied. Changes to statutes, regulations, or regulatory policies, including changes in their interpretation or implementation by regulators, could affect us in substantial and unpredictable ways. Such changes could, among other things, subject us to additional costs and lower revenues, limit the types of financial services and products that we may offer, ease restrictions on non-banks and thereby enhance their ability to offer competing financial services and products, increase compliance costs, and require a significant amount of management’s time and attention. Failure to comply with statutes, regulations, or policies could result in sanctions by regulatory agencies, civil monetary penalties, or reputational damage, each of which could have a material adverse effect on our business, financial condition, and results of operations.
Banking agencies periodically conduct examinations of our business, including compliance with laws and regulations, and our failure to comply with any supervisory actions to which we become subject as a result of such examinations could materially and adversely affect us.
The Banks are subject to supervision and regulation by banking agencies that periodically conduct examinations of our business, including compliance with laws and regulations – specifically, NBC is subject to examination by the OCC, and ULB is subject to examination by the FOFR and the Federal Reserve. Accommodating such examinations may require management to reallocate resources, which would otherwise be used in the day-to-day operation of other aspects of our business. If, as a result of an examination, any such banking agency was to determine that the financial condition, capital resources, allowance for loan losses, asset quality, earnings prospects, management, liquidity, or other aspects of our operations had become unsatisfactory, or that we or our management were in violation of any law or regulation, such banking agency may take a number of different remedial actions as it deems appropriate. These actions include the power to enjoin “unsafe or unsound” practices, to require affirmative actions to correct any conditions resulting from any violation or practice, to issue an administrative order that can be judicially enforced, to direct an increase in our capital, to restrict our growth, to assess civil monetary penalties against us, our officers, or directors, to remove officers and directors, and, if it is concluded that such conditions cannot be corrected or there is an imminent risk of loss to depositors, to terminate our deposit insurance. If we become subject to such a regulatory action, it could have a material adverse effect on our business, financial condition, and results of operations.
FDIC deposit insurance assessments may continue to materially increase in the future, which would have an adverse effect on earnings.
As member institutions of the FDIC, NBC and ULB are assessed a quarterly deposit insurance premium. Failed banks nationwide have significantly depleted the insurance fund and reduced the ratio of reserves to insured deposits. The FDIC has adopted a Deposit Insurance Fund, or DIF, Restoration Plan, which requires the DIF to attain a 1.35% reserve ratio by September 30, 2020. As a result of this requirement, NBC and ULB could be required to pay significantly higher premiums or additional special assessments that would adversely affect their earnings, thereby reducing the availability of funds to pay dividends to NCC.
We are subject to certain capital requirements by regulators.
Applicable regulations require us to maintain specific capital standards in relation to the respective credit risks of our assets and off-balance sheet exposures. Various components of these requirements are subject to qualitative judgments by regulators. We maintain a “well capitalized” status under the current regulatory framework. Our failure to maintain a “well capitalized” status could affect our customers’ confidence in us,
32
Table of Contents
Index to Financial Statements
which could adversely affect our ability to do business. In addition, failure to maintain such status could also result in restrictions imposed by our regulators on our growth and other activities. Any such effect on customers or restrictions by our regulators could have a material adverse effect on our financial condition and results of operations.
We may need to raise additional capital in the future, including as a result of potential increased minimum capital thresholds established by regulators, but that capital may not be available when it is needed or may be dilutive to shareowners.
We are required by federal and state regulatory authorities to maintain adequate capital levels to support our operations. New regulations implementing minimum capital standards could require financial institutions to maintain higher minimum capital ratios and may place a greater emphasis on common equity as a component of “Tier 1 capital,” which consists generally of shareholders’ equity and qualifying preferred stock, less certain goodwill items and other intangible assets. In order to support our operations and comply with regulatory standards, we may need to raise capital in the future. Our ability to raise additional capital will depend on conditions in the capital markets at that time, which are outside of our control, on our financial performance, and on our successful integration of United and ULB and the operations of NBC and ULB. Accordingly, we cannot assure you of our ability to raise additional capital, if needed, on favorable terms. The capital and credit markets have experienced significant volatility in recent years. In some cases, the markets have produced downward pressure on stock prices and credit availability for certain issuers without regard to those issuers’ underlying financial strength. If we cannot raise additional capital when needed, our financial condition and results of operations may be adversely affected, and our banking regulators may subject us to regulatory enforcement action, including receivership. Furthermore, our issuance of additional shares of our common stock could dilute the economic ownership interest of our shareowners.
We are subject to numerous laws designed to protect consumers, including the Community Reinvestment Act and fair lending laws, and failure to comply with these laws could lead to a wide variety of sanctions.
The Community Reinvestment Act, or CRA, the Equal Credit Opportunity Act, the Fair Housing Act, and other fair lending laws and regulations impose nondiscriminatory lending requirements on financial institutions. The U.S. Department of Justice and other federal agencies are responsible for enforcing these laws and regulations. A successful regulatory challenge to an institution’s performance under the CRA or fair lending laws and regulations could result in a wide variety of sanctions, including damages and civil money penalties, injunctive relief, restrictions on mergers and acquisitions activity, restrictions on expansion, and restrictions on entering new business lines. Private parties may also have the ability to challenge an institution’s performance under fair lending laws in private class action litigation. Such actions could have a material adverse effect on our business, financial condition, results of operations, and future prospects.
We are subject to the Bank Secrecy Act and other anti-money laundering statutes and regulations, and any deemed deficiency by us with respect to these laws could result in significant liability.
The Bank Secrecy Act, the USA PATRIOT Act of 2001, and other laws and regulations require financial institutions, among other duties, to institute and maintain an effective anti-money laundering program and file suspicious activity and currency transaction reports when appropriate. In addition to other bank regulatory agencies, the federal Financial Crimes Enforcement Network of the Department of the Treasury is authorized to impose significant civil money penalties for violations of those requirements and has recently engaged in coordinated enforcement efforts with the state and federal banking regulators, as well as the U.S. Department of Justice, Consumer Financial Protection Bureau, Drug Enforcement Administration, and Internal Revenue Service. We are also subject to increased scrutiny of compliance with the rules enforced by the Office of Foreign Assets Control of the Department of the Treasury regarding, among other things, the prohibition of transacting business with, and the need to freeze assets of, certain persons and organizations identified as a threat to the national security, foreign policy, or economy of the United States. If our policies, procedures, and systems are deemed deficient, we would be subject to liability, including fines and regulatory actions, which may include restrictions on our ability to pay dividends and the necessity to obtain regulatory approvals to proceed with certain aspects of our business plan, including our acquisition plans. Failure to maintain and implement adequate
33
Table of Contents
Index to Financial Statements
programs to combat money laundering and terrorist financing could also have serious reputational consequences for us. Any of these results could have a material adverse effect on our business, financial condition, results of operations, and future prospects.
Risks Related to Our Common Stock and this Offering
An active, liquid market for our common stock may not develop or be sustained upon completion of this offering, which may impair your ability to sell your shares at or above the initial public offering price.
Before this offering, there has been no public market for our common stock. We have applied for listing of our common stock on the NASDAQ Global Select Market, but we cannot provide any assurance that our application will be accepted, or that if accepted, an active, liquid trading market for our common stock will develop. If an active trading market does not develop, you may not be able to sell your shares at the volume, prices, and times desired. The initial public offering price of shares of our common stock will be determined by negotiations between us and the underwriters and may not be indicative of prices that will prevail following the completion of this offering. The initial public offering price does not necessarily bear any relationship to our book value, assets, or financial condition or any other established criteria of value and may not be indicative of the market price for our common stock after this offering. The price at which shares of our common stock trade after the completion of this offering may be lower than the price at which the underwriters sell them in this offering.
The market price of our common stock may be subject to substantial fluctuations, which may make it difficult for you to sell your shares at the volumes, prices, and times desired.
The trading price of our common stock may be volatile and subject to wide price fluctuations in response to various factors, including:
| • | actual or anticipated fluctuations in our operating results, financial condition, or asset quality; |
| • | market conditions in the broader stock market in general, or in our industry in particular; |
| • | publication of research reports about us, our competitors, or the bank and non-bank financial services industries generally, or changes in, or failure to meet, securities analysts’ estimates of our financial and operating performance, or lack of research reports by industry analysts or ceasing of coverage; |
| • | future issuances of our common stock or other securities; |
| • | significant acquisitions or business combinations, strategic partnerships, joint ventures, or capital commitments by or involving our competitors or us; |
| • | additions or departures of key personnel; |
| • | trades of large blocks of our stock; |
| • | economic and political conditions or events; |
| • | regulatory developments; and |
| • | other news, announcements, or disclosures (whether by us or others) related to us, our competitors, our core markets, or the bank and non-bank financial services industries. |
These and other factors may cause the market price and demand for our common stock to fluctuate substantially, which may limit or prevent investors from readily selling their shares of common stock and may otherwise negatively affect the liquidity of our common stock.
Our management will have broad discretion as to the use of proceeds from this offering, and you may not agree with the manner in which we use the proceeds.
We intend to use the net proceeds of this offering for working capital and other general corporate purposes, including to finance our organic growth, support our growth, or expand our existing business through investments in or acquisitions of other businesses, although at present we do not have any current plans, arrangements, or understandings to make any material capital investments or make any material acquisitions. We have not formally
34
Table of Contents
Index to Financial Statements
designated the amount of net proceeds that we will contribute to the Banks or that we will use for any particular purpose. Accordingly, our management will have broad discretion as to the application of the net proceeds of this offering and could use them for purposes other than those contemplated at the time of this offering. Our shareowners may not agree with the manner in which our management chooses to allocate and invest the net proceeds. We may not be successful in using the net proceeds from this offering to increase our profitability or market value, and we cannot predict whether the proceeds will be invested to yield a favorable return.
We have not historically paid dividends to our shareowners and cannot guarantee that we will pay dividends to our shareowners in the future.
The holders of our common stock will receive dividends if and when declared by our board of directors out of legally available funds. Our board of directors has not declared a dividend on our common stock since our inception. Any future determination relating to our dividend policy will be made at the discretion of our board of directors and will depend on a number of factors, including our future earnings, capital requirements, financial condition, future prospects, regulatory restrictions, and other factors that our board of directors may deem relevant.
Our principal business operations are conducted through NBC and ULB and will be conducted exclusively through NBC following the completion of its merger with ULB. Cash available to pay dividends to our shareowners is derived primarily, if not entirely, from dividends paid by our Banks to us. After the merger, the ability of NBC to pay dividends to us, as well as our ability to pay dividends to our shareowners, will continue to be subject to, and limited by, certain legal and regulatory restrictions. As of December 31, 2014, both NBC and ULB had a negative retained earnings balance and are therefore currently prohibited from paying any dividends on their common stock without the approval of the OCC, in the case of NBC, and the FOFR and the Federal Reserve, in the case of ULB. Further, any lenders making loans to us may impose financial covenants that may be more restrictive with respect to dividend payments than the regulatory requirements.
New investors in our common stock will experience immediate and substantial book value dilution after this offering.
The initial public offering price of our common stock will be substantially higher than the pro forma net tangible book value per share of the outstanding common stock immediately after the offering. Based on the initial public offering price of $ per share and our net tangible book value as of December 31, 2014, if you purchase our common stock in this offering, you will pay more for your shares than the amounts paid by many of our existing shareowners for their shares, and you will suffer immediate dilution of approximately $ per share in pro forma net tangible book value. As a result of this dilution, investors purchasing stock in this offering may receive significantly less than the full purchase price that they paid for the shares purchased in this offering in the event of a liquidation.
If a substantial number of shares become available for sale and are sold in a short period of time, the market price of our common stock could decline.
If our existing shareowners sell substantial amounts of our common stock in the public market following this offering, the market price of our common stock could decrease significantly. The perception in the public market that our existing shareowners might sell shares of common stock could also depress our market price. Upon completion of this offering, we will have shares of common stock outstanding, or shares if the underwriters exercise their over-allotment option in full. Our directors, executive officers, and certain additional other holders of our common stock will be subject to the lock-up agreements described in “Underwriting” and the Rule 144 holding period requirements described in “Shares Eligible for Future Sale.” After all of the lock-up periods have expired and the holding periods have elapsed, additional shares will be eligible for sale in the public market. The market price of shares of our common stock may drop significantly when the restrictions on resale by our existing shareowners lapse. A decline in the price of shares of our common stock might impede our ability to raise capital through the issuance of additional shares of our common stock or other equity securities and could result in a decline in the value of the shares of our common stock purchased in this offering.
35
Table of Contents
Index to Financial Statements
A future issuance of stock could dilute the value of our common stock.
At a special meeting of our shareowners held on February 18, 2015, our shareowners approved a proposal to amend our certificate of incorporation to increase the number of shares of our common stock that we may issue to 30,000,000. As of February 25, 2015, 7,541,541 shares of our common stock were issued and outstanding. Those shares outstanding do not include the potential issuance, as of February 25, 2015, of 322,086 shares of our common stock subject to issuance upon exercise of outstanding stock options under the Incentive Plan and the United Option Plan, 149,278 shares of our common stock that are potentially issuable pursuant to outstanding performance awards under the Incentive Plan (based on projections of the earned percentages of outstanding performance awards as of such date), or 118,722 additional shares of our common stock that were reserved for issuance under the Incentive Plan. Future issuance of any new shares could cause further dilution in the value of our outstanding shares of common stock.
Our directors and executive officers beneficially own a significant portion of our common stock and have substantial influence over us.
Our directors and executive officers, as a group, beneficially owned approximately 31.1% of our outstanding common stock as of February 25, 2015. As a result of this level of ownership, our directors and executive officers have the ability, by taking coordinated action, to exercise significant influence over our affairs and policies. The interests of our directors and executive officers may not be consistent with your interests as a shareowner. This influence may also have the effect of delaying or preventing changes of control or changes in management, or limiting the ability of our other shareowners to approve transactions that they may deem to be in the best interests of our Company.
Shares of our common stock are not insured deposits and may lose value.
Shares of our common stock are not savings or deposit accounts and are not insured by the FDIC’s DIF, or any other agency or private entity. Such shares are subject to investment risk, including the possible loss of some or all of the value of your investment.
The laws that regulate our operations are designed for the protection of depositors and the public, not our shareowners.
The federal and state laws and regulations applicable to our operations give regulatory authorities extensive discretion in connection with their supervisory and enforcement responsibilities, and generally have been promulgated to protect depositors and the FDIC’s DIF and not for the purpose of protecting shareowners. These laws and regulations can materially affect our future business. Laws and regulations now affecting us may be changed at any time, and the interpretation of such laws and regulations by bank regulatory authorities is also subject to change.
We have the ability to incur debt and pledge our assets, including our stock in NBC and ULB, to secure that debt.
We have the ability to incur debt and pledge our assets to secure that debt. Absent special and unusual circumstances, a holder of indebtedness for borrowed money has rights that are superior to those of holders of common stock. For example, interest must be paid to the lender before dividends can be paid to the shareowners, and loans must be paid off before any assets can be distributed to shareowners if we were to liquidate. Furthermore, we would have to make principal and interest payments on our indebtedness, which could reduce our profitability or result in net losses on a consolidated basis.
We are an emerging growth company under the JOBS Act, and we cannot be certain whether the reduced disclosure requirements applicable to emerging growth companies will make our common stock less attractive to investors.
We are an emerging growth company under the JOBS Act, and we therefore are permitted to, and we intend to, take advantage of exemptions from certain disclosure requirements. We are an emerging growth company until the earliest of: (i) the last day of the fiscal year during which we had total annual gross revenues of $1.0 billion or more; (ii) the last day of the fiscal year following the fifth anniversary of the completion of our merger
36
Table of Contents
Index to Financial Statements
with United (December 31, 2019); (iii) the date on which we have, during the previous three-year period, issued more than $1.0 billion in non-convertible debt; or (iv) the date on which we are deemed a “large accelerated filer,” as defined under the federal securities laws. For so long as we remain an emerging growth company, we may take advantage of certain exemptions from various reporting requirements that are applicable to other public companies that are not emerging growth companies, including, but not limited to, not being required to comply with the auditor attestation requirements of Section 404 of the Sarbanes-Oxley Act, reduced disclosure obligations regarding executive compensation in our periodic reports and proxy statements, and exemptions from the requirements of holding a nonbinding advisory vote on certain executive compensation matters, such as “say on pay” and “say on frequency.” As a result, our shareowners may not have access to certain information that they may deem important. Although we intend to rely on certain of the exemptions provided in the JOBS Act, the exact implications of the JOBS Act for us are still subject to interpretations and guidance by the SEC and other regulatory agencies.
In addition, Section 107 of the JOBS Act provides that an emerging growth company can take advantage of the extended transition period provided in Section 7(a)(2)(B) of the Securities Act for complying with new or revised financial accounting standards. An emerging growth company can therefore delay the adoption of certain accounting standards until those standards would otherwise apply to private companies. However, we have determined to opt out of such extended transition period, and, as a result, we will comply with new or revised financial accounting standards on the relevant dates on which adoption of such standards is required for non-emerging growth companies. Our decision to opt out of the extended transition period for complying with new or revised financial accounting standards is irrevocable.
We cannot predict whether investors will find our common stock less attractive as a result of our taking advantage of these exemptions. If some investors find our common stock less attractive as a result of these choices, there may be a less active trading market for our common stock, and our stock price may be more volatile.
The requirements of being a public company may strain our resources and distract our management, which could make it difficult to manage our business, particularly after we are no longer an emerging growth company under the JOBS Act.
Since October 28, 2014, we have been required to comply with the regulatory and reporting requirements of the SEC. Complying with these reporting and other regulatory requirements is time consuming, results in increased costs to us, and could have a material adverse effect on our business, financial condition, and results of operations.
As a public company, we are subject to the requirements of the Securities Exchange Act of 1934, or the Exchange Act, and the Sarbanes-Oxley Act. These requirements may place a strain on our systems and resources. The Exchange Act requires that we file annual, quarterly and current reports with respect to our business and financial condition. The Sarbanes-Oxley Act requires that we maintain effective disclosure controls and procedures and internal controls over financial reporting. To maintain and improve the effectiveness of our disclosure controls and procedures, we must commit significant resources and management oversight. We continue to implement procedures and processes for the purpose of addressing the standards and requirements applicable to public companies. Sustaining our growth also requires us to commit additional management, operational, and financial resources to maintain appropriate operational and financial systems to adequately support expansion. These activities may divert management’s attention from other business concerns, which could have a material adverse effect on our business, financial condition, results of operations, and cash flows.
As an emerging growth company under the JOBS Act, we are permitted to, and intend to, take advantage of certain exemptions from various reporting requirements that are applicable to other public companies that are not emerging growth companies, including, but not limited to, not being required to comply with the auditor attestation requirements of Section 404 of the Sarbanes-Oxley Act and reduced disclosure obligations regarding executive compensation in our periodic reports and proxy statements.
When these exemptions cease to apply, we expect to incur additional expenses and to devote increased management effort toward ensuring compliance with these reporting requirements. Although we could remain an
37
Table of Contents
Index to Financial Statements
emerging growth company for nearly five more years, we may cease to be an emerging growth company earlier under certain circumstances. See “– We are an emerging growth company under the JOBS Act, and we cannot be certain if the reduced disclosure requirements applicable to emerging growth companies will make our common stock less attractive to investors.” for additional information on when we may cease to be an emerging growth company. We cannot predict or estimate the amount of additional costs that we may continue to incur as a result of being a public company or the timing of such costs.
Our internal controls over financial reporting may not be effective, and our independent registered public accounting firm may not be able to certify as to their effectiveness, which could have a significant and adverse effect on our business and reputation.
We are not currently required to comply with SEC rules that implement Section 404 of the Sarbanes-Oxley Act and are, therefore, not required to make a formal assessment of the effectiveness of our internal controls over financial reporting for that purpose. We will be required to comply with these rules upon ceasing to be an emerging growth company, as defined in the JOBS Act.
When evaluating our internal controls over financial reporting, we may identify material weaknesses that we may not be able to remediate in time to meet the applicable deadline imposed upon us for compliance with the requirements of Section 404 of the Sarbanes-Oxley Act. In addition, if we fail to achieve and maintain the adequacy of our internal controls, as such standards are modified, supplemented, or amended from time to time, we may not be able to ensure that we can conclude on an ongoing basis that we have effective internal controls over financial reporting in accordance with Section 404 of the Sarbanes-Oxley Act. We cannot be certain as to the timing of completion of our evaluation, testing, and any remediation actions or the impact of the same on our operations. If we are not able to implement the requirements of Section 404 of the Sarbanes-Oxley Act in a timely manner or with adequate compliance, our independent registered public accounting firm may issue an adverse opinion due to ineffective internal controls over financial reporting, and we may be subject to sanctions or investigations by regulatory authorities, such as the SEC. As a result, there could be a negative reaction in the financial markets due to a loss of confidence in the reliability of our financial statements. In addition, we may be required to incur costs in improving our internal control system and hiring additional personnel. Any such action could negatively affect our results of operations and cash flows.
Our corporate governance documents, and certain corporate and banking laws applicable to us, could make a takeover more difficult.
Certain provisions of our certificate of incorporation and our bylaws, and corporate and federal banking laws, could make it more difficult for a third party to acquire control of our organization or conduct a proxy contest, even if those events were perceived by many of our shareowners as beneficial to their interests. These provisions, and the corporate and banking laws and regulations applicable to us:
| • | empower our board of directors, without shareowner approval, to issue our preferred stock, the terms of which, including voting power, are set by our board of directors; |
| • | only permit our board of directors or the chairman of our board of directors to call a special shareowners’ meeting; |
| • | require at least 120 days’ advance notice of nominations for the election of directors and the presentation of shareowner proposals at meetings of shareowners; and |
| • | require prior regulatory application and approval of any transaction involving control of our organization. |
These provisions may discourage potential acquisition proposals and could delay or prevent a change in control, including under circumstances in which our shareowners might otherwise receive a premium over the market price of our shares.
38
Table of Contents
Index to Financial Statements
SPECIAL NOTE REGARDING FORWARD-LOOKING STATEMENTS
We have made statements under the captions “Prospectus Summary,” “Risk Factors,” “Management’s Discussion and Analysis of Financial Condition and Results of Operations,” and “Business” and in other sections of this prospectus that are forward-looking statements and that reflect our current views with respect to, among other things, future events and financial performance. In some cases, you can identify forward-looking statements by use of words such as “outlook,” “believe,” “expect,” “potential,” “continue,” “may,” “might,” “will,” “should,” “could,” “seek,” “approximately,” “predict,” “intend,” “plan,” “estimate,” “anticipate,” “target,” “project,” “forecast,” “shall,” “contemplate,” “probably,” or the negative version of those words or other comparable words. Any forward-looking statements contained in this prospectus are based upon our historical performance and on our current plans, estimates, and expectations in light of information currently available to us. The inclusion of this forward-looking information should not be regarded as a representation by us, the selling shareowner, the underwriters, or any other person that the future plans, estimates, or expectations contemplated by us will be achieved. Such forward-looking statements are subject to various risks and uncertainties and assumptions relating to our operations, financial results, financial condition, business, prospects, growth strategy, and liquidity. Accordingly, there are or will be important factors that could cause our actual results to differ materially from those indicated in these statements. You should not place undue reliance on any forward-looking statement. There are or will be important factors that could cause our actual results to differ materially from those indicated by forward-looking statements, including, but not limited to, the following:
| • | an economic downturn, especially one affecting our core market areas; |
| • | the occurrence of various events that negatively impact the real estate market, since a significant portion of our loan portfolio is secured by real estate; |
| • | difficult or unfavorable conditions in the market for financial products and services generally; |
| • | interest rate fluctuations, which could have an adverse effect on our profitability; |
| • | external economic factors, such as changes in monetary policy and inflation or deflation, which may have an adverse impact on our financial condition; |
| • | costs arising from the environmental risks associated with making loans secured by real estate; |
| • | continued or increasing competition from other financial services providers, many of which are subject to different regulations than we are; |
| • | losses resulting from a decline in the credit quality of the assets that we hold; |
| • | inadequacies in our allowance for estimated loan losses, which could require us to take a charge to earnings and thereby adversely affect our financial condition; |
| • | inaccuracies or changes in the appraised value of real estate securing the loans that we originate, which could lead to losses if the real estate collateral is later foreclosed upon and sold at a price lower than the appraised value; |
| • | the costs of integrating United’s operations, which may be greater than expected; |
| • | challenges arising from unsuccessful attempts to expand into new geographic markets, products, or services; |
| • | a lack of liquidity resulting from decreased loan repayment rates, lower deposit balances, or other factors; |
| • | restraints on the ability of our Banks to pay dividends to us, which could limit our liquidity; |
| • | occurrences in the transportation and automotive parts and services industry that negatively impact our factoring business, which is concentrated in such industry; |
| • | the loss of our largest loan and depositor relationships; |
| • | limitations on our ability to lend and to mitigate the risks associated with our lending activities as a result of our size and capital position; |
39
Table of Contents
Index to Financial Statements
| • | additional regulatory requirements and restrictions on our business, which could impose additional costs on us; |
| • | increased capital requirements imposed by banking regulators, which may require us to raise capital at a time when capital is not available on favorable terms or at all; |
| • | a failure in the internal controls we have implemented to address the risks inherent to the business of banking; |
| • | inaccuracies in our assumptions about future events, which could result in material differences between our financial projections and actual financial performance; |
| • | the departure of key members or our management personnel; |
| • | failures or interruptions in our information technology systems; |
| • | unauthorized access to nonpublic personal information of our customers, which could expose us to litigation or reputational harm; |
| • | disruptions, security breaches, or other adverse events affecting the third-party vendors who perform several of our critical processing functions; |
| • | the occurrence of adverse weather or manmade events, which could negatively affect our core markets or disrupt our operations; |
| • | an increase in FDIC deposit insurance assessments, which could adversely affect our earnings; and |
| • | an inability to keep pace with the rate of technological advances due to a lack of resources to invest in new technologies. |
The factors identified above should not be construed as an exhaustive list of factors that could affect our future results and should be read in conjunction with the other cautionary statements that are included in this prospectus, including those discussed under the heading “Risk Factors” beginning on page 19. The forward-looking statements made in this prospectus are made only as of the date of this prospectus. We do not undertake any obligation to publicly update or review any forward-looking statement except as required by law, whether as a result of new information, future developments, or otherwise.
If one or more of these or other risks or uncertainties materialize, or if our underlying assumptions prove to be incorrect, our actual results may vary materially from what we may have expressed or implied by these forward-looking statements. We caution that you should not place undue reliance on any of our forward-looking statements. You should specifically consider the factors identified in this prospectus that could cause actual results to differ before making an investment decision to purchase our common stock. Furthermore, new risks and uncertainties arise from time to time, and it is impossible for us to predict those events or how they may affect us.
40
Table of Contents
Index to Financial Statements
Assuming a public offering price of $ per share (the midpoint of the range set forth on the cover page of this prospectus) and after deducting the underwriting discount and estimated offering expenses payable by us, we will receive approximately $ million of proceeds from this offering if the underwriters do not exercise their option to purchase additional shares of our common stock, and approximately $ million of proceeds if the underwriters exercise their option to purchase additional shares of our common stock in full. Each $1.00 increase (decrease) in the initial public offering price per share would increase (decrease) our net proceeds, after deducting the underwriting discount and estimated offering expenses payable by us, by $ million, assuming no exercise of the underwriters’ over-allotment option, and by $ million, assuming exercise of the underwriters’ over-allotment option in full.
We intend to use the net proceeds of this offering to support our growth, for working capital, and for other general corporate purposes, including to finance our organic growth and expand our business through investments in or acquisitions of bank and non-bank financial services companies that we believe are complementary to our business and consistent with our growth strategy. Pending use of the net proceeds from this offering described above, we may hold any net proceeds in cash or invest them in short-term securities or investments.
We will not receive any proceeds from the sale of shares of common stock by the selling shareowner in this offering.
41
Table of Contents
Index to Financial Statements
The holders of our common stock receive dividends if and when declared by our board of directors out of legally available funds. Our board of directors has not declared, and we have not paid, a dividend since our inception, and our board of directors does not expect to declare a dividend in 2015. Any future determination or change relating to our dividend policy will be made at the discretion of our board of directors and will depend on a number of factors, including our future earnings, capital requirements, financial condition, future prospects, regulatory restrictions, and other factors that our board of directors may deem relevant.
We are subject to the Federal Reserve’s policies restricting bank holding companies from declaring or paying cash dividends. As a general matter, the Federal Reserve has indicated that the board of directors of a bank holding company should consult with the Federal Reserve and eliminate, defer, or significantly reduce the bank holding company’s dividends if (i) its net income available to shareowners for the past four quarters, net of dividends previously paid during that period, is not sufficient to fully fund the dividends, (ii) its prospective rate of earnings retention is not consistent with its capital needs and overall current and prospective financial condition, or (iii) it will not meet, or is in danger of not meeting, its minimum regulatory capital adequacy ratios. Our failure to do so could result in the Federal Reserve finding that we are operating in an unsafe and unsound manner.
Our ability to pay dividends is dependent on the ability of our Banks to pay dividends to us. As of December 31, 2014, NBC and ULB each had a negative retained earnings balance, and, accordingly, each Bank is prohibited from paying dividends on its common stock to us without the approval of the OCC, in the case of NBC, and the FOFR and the Federal Reserve, in the case of ULB. We expect that the consolidation of ULB and NBC will occur on or about February 28, 2015 and that NBC will have a positive retained earnings balance in the first half of 2015. However, even after NBC has a positive retained earnings balance, its ability to pay dividends on its common stock to us without OCC approval is limited by banking laws to its retained net income available to holders of its common stock to date for the then current fiscal year, plus retained net income from the prior two fiscal years.
Should the Banks be “significantly undercapitalized” under the applicable federal bank capital standards, or if one of the Banks is “undercapitalized” and has failed to submit an acceptable capital restoration plan or has materially failed to implement such a plan, the FDIC may choose to require us to receive prior approval for any capital distribution from the Federal Reserve. In addition, the Banks generally are prohibited from making a capital distribution if it would cause them to be “undercapitalized” under applicable federal bank capital standards. For more information, see “Supervision and Regulation – Dividend Restrictions; Capital Adequacy Guidelines; and Prompt Corrective Action.”
42
Table of Contents
Index to Financial Statements
The following sets forth our capitalization, including our regulatory capital ratios, on a consolidated basis as of December 31, 2014:
| • | on an actual basis; and |
| • | on a pro forma basis to give effect to the issuance and sale by us of shares of our common stock in this offering, and the receipt of the net proceeds from our sale of these shares at an assumed initial public offering price of $ per share, which is the midpoint of the price range set forth on the cover page of this prospectus, after deducting underwriting discounts and commissions and estimated offering expenses payable by us. |
You should read this table along with “Management’s Discussion and Analysis of Financial Condition and Results of Operations” and our financial statements and the related notes thereto included elsewhere in this prospectus.
| As of December 31, 2014 | ||||||||
| (Dollars in thousands, except ratios) |
Actual | Pro Forma | ||||||
| Shareholders’ equity: |
||||||||
| Common Stock, $0.01 par value per share, 12,500,000 shares authorized; 7,541,541 shares issued and outstanding (actual); and shares issued and outstanding (pro forma) |
75 | |||||||
| Additional paid-in capital |
131,455 | |||||||
| Accumulated deficit |
(3,453 | ) | ||||||
| Noncontrolling interest |
7,239 | |||||||
| Accumulated other comprehensive income |
845 | |||||||
|
|
|
|
|
|||||
| Total shareholders’ equity |
$ | 136,161 | $ | |||||
|
|
|
|
|
|||||
| Book value and tangible book value per share: |
||||||||
| Book value per share |
$ | 18.05 | $ | |||||
| Tangible book value per share |
13.96 | |||||||
| Capital ratios (Current guidelines): |
||||||||
| Tier 1 Leverage Ratio |
10.68 | % | % | |||||
| Tier 1 Common Capital Ratio |
10.66 | % | % | |||||
| Tier 1 Risk-Based Capital Ratio |
10.66 | % | % | |||||
| Total Risk-Based Capital Ratio |
11.75 | % | % | |||||
| Tangible Common Equity to Tangible Assets |
9.50 | % | % | |||||
| Capital ratios (Basel III guidelines): |
||||||||
| Tier 1 Leverage Ratio |
9.94 | % | % | |||||
| Tier 1 Common Capital Ratio |
9.60 | % | % | |||||
| Tier 1 Risk-Based Capital Ratio |
9.60 | % | % | |||||
| Total Risk-Based Capital Ratio |
10.65 | % | % | |||||
| Tangible Common Equity to Tangible Assets |
9.50 | % | % | |||||
43
Table of Contents
Index to Financial Statements
If you invest in our common stock, your ownership interest will be diluted to the extent of the difference between the initial public offering price per share and the pro forma net tangible book value per share of our common stock upon consummation of this offering. Our net tangible book value at December 31, 2014 was $105.3 million, or $13.96 per share of our common stock based on the 7,541,541 shares issued and outstanding as of such date. Our net tangible book value per share represents the amount of our total tangible assets less the amount of our total liabilities, divided by the number of shares of our common stock outstanding on December 31, 2014.
After giving effect to our sale of shares of common stock in this offering at an assumed initial public offering price of $ per share (the midpoint of the price range on the cover page of this prospectus) and after deducting estimated underwriting discounts and commissions and offering expenses payable by us, our pro forma net tangible book value at December 31, 2014 would have been approximately $ million, or $ per share (assuming no exercise of the underwriters’ option to purchase additional shares of our common stock). This amount represents an immediate dilution of net tangible book value of $ per share to new investors purchasing common stock in this offering and an immediate increase in net tangible book value per share of $ to our existing shareowners.
The following table illustrates this per share dilution:
| Assumed initial public offering price per share |
$ | |||
| Net tangible book value per share as of December 31, 2014 |
$ | 13.96 | ||
| Increase in net tangible book value per share attributable to this offering |
$ | |||
| Pro forma net tangible book value per share after this offering |
$ | |||
| Dilution in net tangible book value per share to new investors in this offering |
$ |
The following table sets forth, as of December 31, 2014, the number of shares of common stock purchased from us, the total consideration paid, or to be paid, and the average price per share paid, or to be paid, by existing shareowners and by the new investors in our initial public offering, at an assumed initial public offering price of $ per share, the midpoint of the price range set forth on the cover page of this prospectus, before deducting estimated underwriting discounts and commissions and offering expenses payable by us:
| Shares Purchased | Total Consideration | Average Price Per Share |
||||||||||||||||
| Number | Percent | Amount | Percent | |||||||||||||||
| (in thousands) | ||||||||||||||||||
| Existing shareowners |
% | $ | % | $ | ||||||||||||||
| New investors in this offering |
% | $ | % | $ | ||||||||||||||
| Total |
100% | $ | 100% | $ | ||||||||||||||
If the underwriters exercise in full their option to purchase additional shares in this offering, our pro forma net tangible book value as of December 31, 2014, would be approximately $ million, or $ per share, representing an immediate increase in net tangible book value to our existing shareowners of $ per share and immediate dilution in net tangible book value to investors participating in this offering of approximately $ per share.
The discussion and tables above assume no issuance of shares of our common stock issuable upon the exercise of outstanding options or settlement of outstanding performance awards that have been granted under the Incentive Plan or the United Option Plan, or issuance of any other shares of our common stock reserved for issuance under the Incentive Plan. As of February 25, 2015, there were 322,086 shares of our common stock subject to issuance upon the exercise of stock options issued under the Incentive Plan or the United Option Plan, 149,278 shares of our common stock subject to potential issuance pursuant to outstanding performance awards under the Incentive Plan, and an additional 118,722 shares of our common stock reserved for issuance under the Incentive Plan.
44
Table of Contents
Index to Financial Statements
MANAGEMENT’S DISCUSSION AND ANALYSIS OF FINANCIAL CONDITION
AND RESULTS OF OPERATIONS
The following discussion and analysis of our financial condition and results of operations should be read together with our consolidated financial statements and related notes thereto and other financial information appearing elsewhere in this document. In addition to historical information, this discussion and analysis contains forward-looking statements that involve risks, uncertainties and assumptions that could cause actual results to differ materially from our expectations. Factors that could cause such differences are discussed in the sections entitled “Special Note Regarding Forward-Looking Statements” and “Risk Factors.” We assume no obligation to update any of these forward-looking statements.
The following discussion pertains to our historical results, on a consolidated basis. However, because we conduct all of our material business operations through our subsidiaries, the discussion and analysis relates to activities primarily conducted at the subsidiary level.
All dollar amounts in the tables in this section are in thousands of dollars, except per share data or when specifically identified.
Our Business
We are a bank holding company headquartered in Birmingham, Alabama. We operate two subsidiary banks – NBC and ULB. We intend to consolidate ULB with NBC on or about February 28, 2015, although each of the ULB locations will continue to operate as “United Legacy Bank, a division of National Bank of Commerce.”
Through the Banks, we provide a broad array of financial services to businesses, business owners and professionals through eight full-service banking offices in Alabama (Birmingham, Huntsville, Auburn-Opelika, and Baldwin County) and seven full-service banking offices in Central Florida (Longwood, Winter Park, Orlando, Oviedo, Kissimmee, and Vero Beach). We also own a 70% equity interest in CBI, which owns Corporate Billing, a transaction-based finance company operating a receivables factoring business headquartered in Decatur, Alabama, that provides factoring, invoicing, collection and accounts receivable management services to transportation companies and automotive parts and service providers throughout the United States and Canada.
2014 Acquisitions
CBI Holding Company, LLC
On August 29, 2014, we acquired, through our banking subsidiary NBC, 70% of the outstanding units of CBI, a transaction-based finance company operating a receivables factoring business headquartered in Decatur, Alabama. CBI now operates as a subsidiary of NBC. We have an option to purchase the remaining 30% equity interest for a price based on a multiple of CBI’s earnings. The option is exercisable at any time beginning on August 29, 2019, and expires on August 29, 2022. NBC paid $16.2 million in cash for the 70% equity interest in CBI. Our consolidated financial statements include all of the assets and liabilities of CBI as well as a minority interest representing the 30% equity interest that we have not purchased. As a result, at acquisition, we recorded $23.1 million of goodwill and a non-controlling interest of $6.9 million.
We marked the assets acquired and liabilities assumed to fair value based on information available, and these fair value adjustments are subject to change for up to one year after the closing date as additional information becomes available. Given an average life for CBI’s receivables of 35 to 40 days, the assets and liabilities of CBI are very short-term in nature, and the book value was deemed to be the fair value, with the exception of a $174 thousand discount on the purchased factored receivables, which was accreted into income during September 2014 in accordance with the average life of the related receivables.
United Group Banking Company of Florida, Inc.
On December 15, 2014, we completed our acquisition of United, a bank holding company headquartered in Longwood, Florida. At that time, United’s wholly owned non-banking subsidiary, RBCF Holdings Inc., became a wholly owned subsidiary of the Company. United’s wholly owned banking subsidiary, ULB, is expected to
45
Table of Contents
Index to Financial Statements
merge with and into NBC on or about February 28, 2015. After the merger, ULB will operate in the Orlando market as “United Legacy Bank, a division of National Bank of Commerce.” ULB has a total of five banking locations located in the greater Orlando area and is scheduled to open an additional branch location in the area on February 27, 2015.
Upon consummation of the acquisition, United was merged with and into NCC, with NCC as the surviving entity in the merger. United’s common shareholders received either 0.057794 shares of our common stock, or $1.30 in cash in exchange for each share of United’s common stock, or a combination stock and cash. The total amount of cash that we paid for cash elections was capped at $2,950,000 in the merger agreement (excluding any cash to be paid for fractional shares). We paid an aggregate of $2,953,884 in cash (including cash in lieu of fractional shares) and issued 1,617,027 shares of our common stock. The aggregate estimated value of the consideration paid was $33.3 million. We recorded $5.7 million of goodwill and a core deposit intangible asset of $1.8 million.
We marked United’s assets and liabilities to fair value based on information available, and these fair value adjustments are subject to change for up to one year after the closing date as additional information becomes available. We acquired approximately $233.2 million in assets at fair value from United and added five banking centers with approximately $149.9 million in loans and approximately $200.5 million in deposits.
Additional information regarding the CBI acquisition and the United merger is included in Note 2, “Business Combinations,” of the Notes to Consolidated Financial Statements provided herein.
Overview of 2014 Results
Our net income was $5.4 million in 2014, compared with $4.0 million in 2013. The largest contributing factors leading to the increase in the 2014 net income and other highlights include the following:
| • | Average loans outstanding in 2014 were $629 million, approximately 29% higher than $486 million in average loans outstanding in 2013. The higher loan balance led to an increase in net interest income from $20.7 million in 2013 to $28.5 million in 2014. |
| • | Loan yields in 2014 averaged 4.68%, compared to 4.37% for 2013, and interest-bearing liability costs of 0.51% were 0.04% lower than 0.55% in 2013. As a result, our net interest spread increased from 3.13% to 3.63%. Average non-interest bearing deposits grew from $94 million in 2013 to $150 million in 2014, which reduced our overall funding costs. The combination of the higher loan yields and lower funding costs led to an expansion in our net interest margin from 3.25% in 2013 to 3.75% in 2014. |
| • | The CBI acquisition closed on August 29, 2014, and, as a result, CBI’s income and expenses are included in our results for 2014 for the period beginning as of the date of the closing. CBI’s commercial factored receivables accounted for approximately $28.5 million of the increase in average loans outstanding for 2014, and CBI added approximately $4.2 million in net interest income (excluding the higher internal funding cost allocation used in management’s segment reporting) for the year, as compared to 2013. The higher yield earned on commercial factored receivables for the four months post-acquisition was the primary contributing factor to the increase in the overall loan yield for 2014. Included in net interest income for 2014 was discount accretion of $174 thousand related to factored receivables acquired in the CBI acquisition. |
| • | Our higher net interest income was partially offset by higher operating expenses, which grew to $23.5 million in 2014 from $19.7 million in 2013. The largest category of operating expense increase was salaries and employee benefits, partially reflecting our expansion as well as the addition of the CBI operating expenses and employees for approximately four months of 2014. |
| • | During the third quarter of 2014, we sold 163,485 shares of common stock at $18.35 per share in connection with our entry into the Vero Beach, Florida market area. This sale was to accredited investors in the Vero Beach market area and was intended to help promote local support of our banking operations and business development efforts in that market. |
46
Table of Contents
Index to Financial Statements
| • | On December 15, 2014, we closed the acquisition of United, and as result approximately two weeks of revenue and expense from United are included in our 2014 results. Additionally, the addition of United’s assets and liabilities to our balance sheet increased our loans, deposits, and assets held as of December 31, 2014 by approximately $150 million, $201 million, and $233 million, respectively, although the impact on average balances was limited due to the limited period of time in 2014 that United was part of NCC. |
Critical Accounting Policies and Estimates
Our consolidated financial statements are prepared based on the application of certain accounting policies, the most significant of which are described in the Notes to Consolidated Financial Statements for the year ended December 31, 2014, which are contained elsewhere in this document. Certain of these policies require numerous estimates and strategic or economic assumptions that may prove inaccurate or subject to variation and may significantly affect our reported results and financial position for the current period or future periods. The use of estimates, assumptions, and judgments are necessary when financial assets and liabilities are required to be recorded at, or adjusted to reflect, fair value. Assets carried at fair value inherently result in more financial statement volatility. Fair values and information used to record valuation adjustments for certain assets and liabilities are either based on quoted market prices or are provided by other independent third-party sources, when available. When such information is not available, management estimates valuation adjustments. Changes in underlying factors, assumptions or estimates in any of these areas could have a material impact on our future financial condition and results of operations.
The following briefly describes some of the more complex policies involving a significant degree of judgment about valuation and the application of complex accounting standards and interpretations.
Allowance for Loan Losses
We record estimated probable inherent credit losses in the loan portfolio as an allowance for loan losses. The methodologies and assumptions for determining the adequacy of the overall allowance for loan losses involve significant judgments to be made by management. Some of the more critical judgments supporting our allowance for loan losses include judgments about the creditworthiness of borrowers, estimated value of underlying collateral, assumptions about cash flow, determination of loss factors for estimating credit losses, and the impact of current events, conditions, and other factors impacting the level of inherent losses. Under different conditions or using different assumptions, the actual or estimated credit losses ultimately realized by us may be different from our estimates. In determining the allowance, we estimate losses on individual impaired loans, or groups of loans that are not impaired, where the probable loss can be identified and reasonably estimated. On a quarterly basis, we assess the risk inherent in our loan portfolio based on qualitative and quantitative trends in the portfolio, including the internal risk classification of loans, historical loss rates, changes in the nature and volume of the loan portfolio, industry or borrower concentrations, delinquency trends, detailed reviews of significant loans with identified weaknesses, and the impacts of local, regional, and national economic factors on the quality of the loan portfolio. Based on this analysis, we may record a provision for loan losses in order to maintain the allowance at appropriate levels. For a more complete discussion of the methodology employed to calculate the allowance for loan losses, see Note 1 to our Consolidated Financial Statements for the year ended December 31, 2014, which are included elsewhere in this document.
Investment Securities Impairment
We assess on a quarterly basis whether there have been any events or economic circumstances to indicate that a security with respect to which there is an unrealized loss is impaired on an other-than-temporary basis. In any instance, we would consider many factors, including the severity and duration of the impairment, our intent and ability to hold the security for a period of time sufficient for a recovery in value, recent events specific to the issuer or industry, and, for debt securities, external credit ratings and recent downgrades. Securities with respect to which there is an unrealized loss that is deemed to be other-than-temporary are written down to fair value. The credit portion of the impairment, if any, is recognized as a realized loss in current earnings.
47
Table of Contents
Index to Financial Statements
Income Taxes
Deferred income tax assets and liabilities are computed using the asset and liability method, which recognizes a liability or asset representing the tax effects, based on current tax law, of future deductible or taxable amounts attributable to events recognized in the financial statements. A valuation allowance may be established to the extent necessary to reduce the deferred tax asset to a level at which it is “more likely than not” that the tax asset or benefit will be realized. Realization of tax benefits depends on having sufficient taxable income, available tax loss carrybacks or credits, the reversing of taxable temporary differences and/or tax planning strategies within the reversal period, and that current tax law allows for the realization of recorded tax benefits.
Business Combinations
Assets purchased and liabilities assumed in a business combination are recorded at their fair value. The fair value of a loan portfolio acquired in a business combination requires greater levels of management estimates and judgment than the remainder of purchased assets or assumed liabilities. On the date of acquisition, when the loans have evidence of credit deterioration since origination and it is probable at the date of acquisition that the Company will not collect all contractually required principal and interest payments, the difference between contractually required payments at acquisition and the cash flows expected to be collected at acquisition is referred to as the non-accretable difference. We must estimate expected cash flows at each reporting date. Subsequent decreases to the expected cash flows will generally result in a provision for loan losses. Subsequent increases in cash flows result in a reversal of the provision for loan losses to the extent of prior charges and adjusted accretable yield which will have a positive impact on interest income. In addition, purchased loans without evidence of credit deterioration are also handled under this method.
Comparison of Results of Operations for the years ended December 31, 2014, 2013, and 2012
The following is a narrative discussion and analysis of significant changes in our results of operations for the years ended December 31, 2014, 2013, and 2012.
Net Income
2014 vs. 2013
During the year ended December 31, 2014, our net income was $5.4 million, compared to $4.0 million for the year ended December 31, 2013, an increase of 34.9%. The primary reason for the increase in net income in 2014 compared to 2013 was an increase in net interest income, resulting from higher levels of loan balances and other earning assets, increased loan yields, and a resulting increase in net interest margin. The increased net interest income was partially offset by a reduction in non-interest income of $270 thousand, an increased loan loss provision expense of $978 thousand, and an increase in noninterest expense of $3.8 million during 2014. The largest reduction in non-interest income during 2014 was in revenue from the mortgage division. During the year ended December 31, 2014, mortgage origination and fee income totaled $3.8 million, compared to $4.0 million for year ended December 31, 2013, a reduction of 7.0%. Other non-interest expenses increased $3.7 million during the year ended December 31, 2014. Each category of non-interest expense increased as a result of the growth of our franchise in the markets in which we operate.
Net income also increased during the year ended December 31, 2014, compared to the year ended December 31, 2013, due to the acquisition of CBI on August 29, 2014. CBI contributed $4.2 million of net interest income and $741 thousand of net income during the year ended December 31, 2014. Included in net interest income for 2014 is discount accretion of $174 thousand related to factored receivables acquired in the CBI acquisition. (Note that this CBI net income contribution figure differs from that in our segment reporting because it does not include the funding cost allocation used in management’s segment reporting. See Note 17, “Segment Reporting,” in the Notes to Consolidated Financial Statements provided herein for additional information.) The United acquisition closed on December 15, 2014 and, consequently, did not have a material impact on our net income for 2014.
48
Table of Contents
Index to Financial Statements
2013 vs. 2012
Net income for the year ended December 31, 2013 was $4.0 million, compared to $2.1 million for the year ended December 31, 2012. The primary reason for the increase in net income between 2013 and 2012 was an increase in net interest income. This increase was driven by higher loan balances and reduced interest expense on deposits and borrowings. Income from mortgage loan originations also contributed to the increase. Total mortgage originations and fee income totaled $4.0 million during 2013 compared to $3.3 million during 2012. The higher net interest income and other income was partially offset by an increase in salaries and benefits during 2013 compared to 2012.
Net Interest Income and Net Interest Margin Analysis
The largest component of our net income is net interest income – the difference between the income earned on interest-earning assets and the interest paid on deposits and borrowed funds used to support our assets. Net interest income divided by average earning assets represents our net interest margin. The major factors that affect net interest income and net interest margin are changes in volumes, the yield on interest-earning assets, and the cost of interest-bearing liabilities. Our margin can also be affected by economic conditions, the competitive environment, loan demand, and deposit flow. Our ability to respond to changes in these factors by using effective asset-liability management techniques is critical to maintaining the stability of the net interest margin and our primary source of earnings.
49
Table of Contents
Index to Financial Statements
The following table shows, for the periods indicated, the average balance of each principal category of our assets, liabilities, and shareholders’ equity and the average yields on assets and average costs of liabilities. Such yields and costs are calculated by dividing income or expense by the average daily balances of the associated assets or liabilities.
AVERAGE BALANCE SHEETS & NET INTEREST ANALYSIS
For the Twelve Months Ended December 31,
| (Dollars in thousands, Interest earning assets |
2014 | 2013 | 2012 | |||||||||||||||||||||||||||||||||
| Average Balance |
Interest Income/ Expense |
Average Yield/ Rate |
Average Balance |
Interest Income/ Expense |
Average Yield/ Rate |
Average Balance |
Interest Income/ Expense |
Average Yield/ Rate |
||||||||||||||||||||||||||||
| Loans |
$ | 629,040 | $ | 29,414 | 4.68 | % | $ | 485,769 | $ | 21,241 | 4.37 | % | $ | 356,081 | $ | 17,605 | 4.94 | % | ||||||||||||||||||
| Mortgage loans held for sale |
9,696 | 410 | 4.23 | 11,285 | 419 | 3.71 | 12,662 | 435 | 3.44 | |||||||||||||||||||||||||||
| Securities: |
||||||||||||||||||||||||||||||||||||
| Taxable securities |
41,111 | 1,178 | 2.87 | 48,221 | 1,330 | 2.76 | 45,824 | 1,482 | 3.23 | |||||||||||||||||||||||||||
| Tax-exempt securities |
4,518 | 268 | 5.93 | 3,453 | 213 | 6.17 | 4,686 | 290 | 6.19 | |||||||||||||||||||||||||||
| Cash balances in other banks |
75,099 | 183 | 0.24 | 88,075 | 206 | 0.23 | 108,573 | 261 | 0.24 | |||||||||||||||||||||||||||
| Funds sold |
— | — | 0.00 | 51 | — | 0.00 | 53 | — | 0.00 | |||||||||||||||||||||||||||
|
|
|
|
|
|
|
|
|
|
|
|
|
|||||||||||||||||||||||||
| Total interest earning assets |
759,464 | $ | 31,453 | 4.14 | 636,854 | $ | 23,409 | 3.68 | 527,879 | $ | 20,073 | 3.80 | ||||||||||||||||||||||||
|
|
|
|
|
|
|
|||||||||||||||||||||||||||||||
| Non-interest earning assets |
56,241 | 26,208 | 18,611 | |||||||||||||||||||||||||||||||||
|
|
|
|
|
|
|
|||||||||||||||||||||||||||||||
| Total assets |
$ | 815,705 | $ | 663,062 | $ | 546,490 | ||||||||||||||||||||||||||||||
|
|
|
|
|
|
|
|||||||||||||||||||||||||||||||
| Interest bearing liabilities |
||||||||||||||||||||||||||||||||||||
| Interest bearing transactions accounts |
$ | 121,970 | $ | 331 | 0.27 | % | $ | 98,379 | $ | 247 | 0.25 | % | $ | 65,601 | $ | 179 | 0.27 | % | ||||||||||||||||||
| Savings & money market deposits |
299,549 | 1,111 | 0.37 | 257,238 | 874 | 0.34 | 204,005 | 991 | 0.49 | |||||||||||||||||||||||||||
| Time deposits |
120,145 | 985 | 0.82 | 99,474 | 981 | 0.99 | 94,726 | 1,332 | 1.41 | |||||||||||||||||||||||||||
| Federal Home Loan Bank & other borrowed money |
22,007 | 442 | 2.01 | 23,781 | 511 | 2.15 | 29,712 | 778 | 2.62 | |||||||||||||||||||||||||||
|
|
|
|
|
|
|
|
|
|
|
|
|
|||||||||||||||||||||||||
| Total interest-bearing liabilities |
563,671 | $ | 2,869 | 0.51 | 478,872 | $ | 2,613 | 0.55 | 394,044 | $ | 3,280 | 0.83 | ||||||||||||||||||||||||
|
|
|
|
|
|
|
|||||||||||||||||||||||||||||||
| Non-interest bearing deposits |
150,034 | 93,883 | 65,254 | |||||||||||||||||||||||||||||||||
|
|
|
|
|
|
|
|||||||||||||||||||||||||||||||
| Total funding sources |
713,705 | 572,755 | 459,298 | |||||||||||||||||||||||||||||||||
| Non-interest bearing liabilities |
4,674 | 3,338 | 2,410 | |||||||||||||||||||||||||||||||||
| Shareholders’ equity |
97,326 | 86,969 | 84,782 | |||||||||||||||||||||||||||||||||
|
|
|
|
|
|
|
|||||||||||||||||||||||||||||||
| $ | 815,705 | $ | 663,062 | $ | 546,490 | |||||||||||||||||||||||||||||||
|
|
|
|
|
|
|
|||||||||||||||||||||||||||||||
| Net interest rate spread |
3.63 | % | 3.13 | % | 2.97 | % | ||||||||||||||||||||||||||||||
| Net interest income/margin (Taxable equivalent) |
$ | 28,584 | 3.76 | % | $ | 20,796 | 3.27 | % | $ | 16,793 | 3.18 | % | ||||||||||||||||||||||||
| Tax equivalent adjustment |
111 | 97 | 121 | |||||||||||||||||||||||||||||||||
|
|
|
|
|
|
|
|||||||||||||||||||||||||||||||
| Net interest income/margin |
$ | 28,473 | 3.75 | % | $ | 20,699 | 3.25 | % | $ | 16,672 | 3.16 | % | ||||||||||||||||||||||||
|
|
|
|
|
|
|
|||||||||||||||||||||||||||||||
50
Table of Contents
Index to Financial Statements
Comparison of net interest income for the years ended December 31, 2014 and 2013
Net interest income increased $7.8 million, or 37.6%, to $28.5 million for the year ended December 31, 2014, compared to $20.7 million for 2013. The increase was due to an increase in interest income of $8.0 million, resulting from higher levels of loan volume, which was partially offset by a $256 thousand increase in interest expense. The increase in interest income was primarily due to a 29.5% increase in average loans outstanding during 2014 compared to 2013. The resulting net interest margin for 2014 rose to 3.75%, from 3.25% during 2013. The net interest margin in 2014 benefited from increased loan yields and volume and also an increase in non-interest bearing deposits. During 2014, non-interest bearing deposits averaged $150.0 million, compared to $93.9 million during 2013, an increase of $56.2 million, or 59.8%.
Interest-earning assets averaged $759.5 million for 2014, compared to $636.9 million for 2013, an increase of $122.6 million, or 19.3%. See additional information on growth in our loan portfolio for the periods presented beginning on page 50. The yield on average interest-earning assets increased 46 basis points to 4.14% during 2014, compared to 3.68% for 2013. The yield on earning assets increased primarily due to an increased yield on loans during 2014. During 2014, loan yields increased 31 basis points to 4.68%. The increase in loan yields was primarily due to the factored receivables purchased from and originated by CBI. These factored receivables are generally much higher yielding assets than our traditional loan portfolio. The yield on the factored receivables varies but is approximately 15%. CBI contributed average loan balances of $28.5 million for the year ended December 31, 2014.
Interest-bearing liabilities averaged $563.7 million for 2014, compared to $478.9 million for 2013, an increase of $84.8 million, or 17.7%. The average rate paid on interest-bearing liabilities was 0.51% for 2014, compared to 0.55% for 2013. Each category of deposits either experienced rate reductions or had rates remain virtually flat compared to 2013. We have benefited from the historically low interest rates and repriced time deposits at maturity at the lower current market rates, and we have also lowered rates on other deposit accounts to lower market rates where possible. The increase in average interest-bearing liabilities was partially offset by the rate reductions but overall resulted in slightly higher total interest expense for 2014.
Comparison of net interest income for the years ended December 31, 2013 and 2012
The previous table shows for the years ended December 31, 2013 and 2012 the average balances of each principal category of our assets, liabilities, and shareholders’ equity and the average yields on assets and average costs of liabilities.
Net interest income increased $4.0 million, or 24.2%, to $20.7 million for 2013 compared to $16.7 million for 2012. This increase was due to an increase in interest income of $3.4 million and a decrease in interest expense of $667 thousand. The resulting net interest margin for 2013 increased to 3.25% from 3.16% during 2012.
Interest-earning assets averaged $636.9 million for 2013, compared to $527.9 million for 2012, an increase of $109.0 million, or 20.6%. The primary reason for the increase in interest income was an increase in average loans. During 2013, average loans increased by $129.7 million compared to 2012. Although the average yield on loans during 2013 was 4.37%, compared to 4.94% during 2012, the substantial volume increase offset the yield reduction and led to an overall increase in interest income. The fifty-seven basis point reduction in loan yield was due to the lower loan rates on new loans compared to the average yield on the current loan portfolio. Another factor contributing to the increased interest income for 2013 was a change in the mix of interest-bearing assets. During 2013, average cash balances totaled $88.1 million, a decrease of $20.5 million compared to 2012. These balances were moved from cash to higher yielding loans, increasing total interest income.
Interest-bearing liabilities averaged $478.9 million for 2013, compared to $394.0 million for 2012, an increase of $84.8 million, or 21.5%. The average rate paid on interest-bearing liabilities was 0.55% for 2013, compared to 0.83% for 2012. Each category of deposits experienced rate reductions during 2013. We have benefited from the historically low interest rates and repriced time deposits at maturity at the lower current market rates, and we have also lowered rates on other deposit accounts to lower market rates. The increase in average interest-bearing liabilities was offset by the rate reductions resulting in lower total interest expense.
51
Table of Contents
Index to Financial Statements
The following table reflects, for the periods indicated, the changes in our net interest income due to changes in the volume of earning assets and interest-bearing liabilities and the associated rates paid or earned on these assets and liabilities.
ANALYSIS OF CHANGES IN NET INTEREST INCOME
For the Twelve Months Ended December 31,
| (Dollars in thousands) |
2014 vs. 2013 | 2013 vs. 2012 | ||||||||||||||||||||||
| Variance due to | Variance due to | |||||||||||||||||||||||
| Interest earning assets |
Volume | Yield/Rate | Total | Volume | Yield/Rate | Total | ||||||||||||||||||
| Loans |
$ | 6,616 | $ | 1,557 | $ | 8,173 | $ | 5,850 | $ | (2,214 | ) | $ | 3,636 | |||||||||||
| Mortgage loans held for sale |
(63 | ) | 54 | (9 | ) | (49 | ) | 33 | (16 | ) | ||||||||||||||
| Securities: |
— | |||||||||||||||||||||||
| Taxable securities |
(202 | ) | 50 | (152 | ) | 74 | (226 | ) | (152 | ) | ||||||||||||||
| Tax-exempt securities |
63 | (8 | ) | 55 | (76 | ) | (1 | ) | (77 | ) | ||||||||||||||
| Cash balances in other banks |
(32 | ) | 9 | (23 | ) | (48 | ) | (7 | ) | (55 | ) | |||||||||||||
|
|
|
|
|
|
|
|
|
|
|
|
|
|||||||||||||
| Total interest earning assets |
6,382 | 1,662 | 8,044 | 5,751 | (2,415 | ) | 3,336 | |||||||||||||||||
| Interest bearing liabilities |
||||||||||||||||||||||||
| Interest bearing transactions accounts |
$ | 63 | $ | 21 | $ | 84 | $ | 83 | $ | (15 | ) | $ | 68 | |||||||||||
| Savings & money market deposits |
152 | 85 | 237 | 223 | (340 | ) | (117 | ) | ||||||||||||||||
| Time deposits |
184 | (180 | ) | 4 | 64 | (415 | ) | (351 | ) | |||||||||||||||
| Federal Home Loan Bank & other borrowed money |
(37 | ) | (32 | ) | (69 | ) | (140 | ) | (127 | ) | (267 | ) | ||||||||||||
|
|
|
|
|
|
|
|
|
|
|
|
|
|||||||||||||
| Total interest-bearing liabilities |
362 | (106 | ) | 256 | 230 | (897 | ) | (667 | ) | |||||||||||||||
| Net interest income |
||||||||||||||||||||||||
| Net interest income (Taxable equivalent) |
$ | 6,020 | $ | 1,768 | $ | 7,788 | $ | 5,521 | $ | (1,518 | ) | $ | 4,003 | |||||||||||
| Taxable equivalent adjustment |
11 | 3 | 14 | (6 | ) | (18 | ) | (24 | ) | |||||||||||||||
|
|
|
|
|
|
|
|
|
|
|
|
|
|||||||||||||
| Net interest income |
6,009 | 1,765 | 7,774 | 5,527 | (1,500 | ) | 4,027 | |||||||||||||||||
|
|
|
|
|
|
|
|
|
|
|
|
|
|||||||||||||
Provision for Loan Losses
During the year ended December 31, 2014, we recorded a provision for loan losses of $978 thousand related to our factored receivables and related risk of loss at CBI. The provision for loan losses for the years ended December 31, 2013 and 2012 was zero and $125 thousand, respectively. Our policy is to maintain an allowance for loan losses at a level sufficient to absorb probable incurred losses inherent in the loan portfolio. The allowance is increased by a provision for loan losses, which is a charge to earnings, and is decreased by charge-offs and increased by loan recoveries. In determining the adequacy of our allowance for loan losses, we consider our historical loan loss experience, the general economic environment, the overall portfolio composition, and other information. As these factors change, the level of loan loss provision changes. When individual loans are evaluated for impairment, and an impairment is deemed necessary, the impaired portion of the loan amount is generally charged off. As of December 31, 2014, $873 thousand of our allowance is related to impaired loans.
Noninterest Income
In addition to net interest margin, we generate other types of recurring noninterest income from our operations. Our banking operations generate revenue from service charges and fees on deposit accounts. We have a mortgage division that generates revenue from originating and selling mortgages, and we have a revenue sharing relationship with a registered broker-dealer who has representatives located in some of our banking offices. In addition to these types of recurring noninterest income, the Banks own insurance on several key employees and record income on the increase in the cash surrender value of these policies.
52
Table of Contents
Index to Financial Statements
The following table sets forth the principal components of noninterest income for the periods indicated.
NONINTEREST INCOME
| As of December 31, | ||||||||||||
| (Dollars in thousands) |
2014 | 2013 | 2012 | |||||||||
| Service charges and fees on deposit accounts |
$ | 714 | $ | 630 | $ | 535 | ||||||
| Mortgage origination and fee income |
3,752 | 4,035 | 3,254 | |||||||||
| Income from bank owned life insurance |
242 | 236 | 194 | |||||||||
| Wealth management fees |
58 | 89 | 103 | |||||||||
| Gain on sale of other real estate |
13 | 62 | 396 | |||||||||
| (Loss) gain on sale of investments |
(33 | ) | 47 | — | ||||||||
| Other noninterest income |
286 | 203 | 183 | |||||||||
|
|
|
|
|
|
|
|||||||
| Total noninterest income |
$ | 5,032 | $ | 5,302 | $ | 4,665 | ||||||
|
|
|
|
|
|
|
|||||||
Noninterest income for the years ended December 31, 2014 and 2013 was $5.0 million and $5.3 million, respectively. The primary reason for the decrease in noninterest income was lower revenue from the mortgage division. Mortgage division income decreased $283 thousand during 2014 and totaled $3.8 million for the year, as compared to $4.0 million during 2013. The 2013 period benefited from refinance activity associated with historically low mortgage rates. Although rates remained low during 2014, the volume of refinance activity was lower than prior periods since rates have been at low levels for a long period of time, resulting in fewer customers who had not already refinanced mortgages at lower rates. Our volume is consistently more purchase-weighted than industry trends due to our realtor-driven business model. During the year ended December 31, 2013, refinance activity accounted for approximately 26.8% of production volume, compared to only approximately 17.5% during 2014. Service charges and fees on deposit accounts increased $84 thousand to $714 thousand for 2014. This increase was a result of an increase in number of deposit accounts as we continue to gain momentum and market share in our markets. During 2014, we recorded a loss of $33 thousand on the sale of an investment, and, during 2013, we recorded a gain of $47 thousand on the sale of an investment.
Noninterest income for the years ended December 31, 2013 and 2012 was $5.3 million and $4.7 million, respectively. The most significant increase in noninterest income was from the mortgage division. The mortgage division income increased $781 thousand during 2013 and totaled $4.0 million for the year, as compared to $3.3 million during 2012. This increase was due to the expansion of mortgage division in Birmingham and in the other markets that we serve. We increased originators and support staff in this division in 2013. Historically low interest rates and elevated refinancing activity during the years ended December 31, 2013 and 2012 bolstered the activity of the mortgage division. Service charges and fees on deposit accounts increased $95 thousand, to $630 thousand, for 2013 compared to 2012. This increase resulted from an increase in number of accounts as we gained momentum and market share in Birmingham and our newer markets. The income from bank owned life insurance increased slightly during 2013 due to a full year of income on an investment in bank owned life insurance made during 2012. During 2012, we recorded a gain on sale of other real estate of $396 thousand, and, during 2013, we recorded a $62 thousand gain from the sale of other real estate.
Noninterest expense
Our total noninterest expense increase reflects our continued growth, as well as the expansion of our operational framework, employee expansion, and facility expansion, as we build the foundation to support our recent and future growth. We believe that some of our overhead costs will reduce as a percentage of our revenue as we grow and gain operating leverage by spreading these costs over a larger revenue base.
53
Table of Contents
Index to Financial Statements
The following table presents the primary components of noninterest expense for the periods indicated.
NONINTEREST EXPENSE
| As of December 31, | ||||||||||||
| (Dollars in thousands) |
2014 | 2013 | 2012 | |||||||||
| Salaries and employee benefits |
$ | 13,379 | $ | 11,495 | $ | 9,942 | ||||||
| Commission based compensation |
2,080 | 1,948 | 1,645 | |||||||||
| Occupancy and equipment expense |
1,944 | 1,727 | 1,733 | |||||||||
| Data processing expenses |
1,169 | 845 | 675 | |||||||||
| Advertising and marketing expenses |
344 | 194 | 137 | |||||||||
| Legal fees |
685 | 320 | 388 | |||||||||
| FDIC insurance assessments |
494 | 368 | 390 | |||||||||
| Accounting and audit expenses |
508 | 362 | 304 | |||||||||
| Consulting and other professional expenses |
270 | 189 | 246 | |||||||||
| Telecommunications expenses |
275 | 269 | 266 | |||||||||
| Core deposit intangible amortization |
18 | — | — | |||||||||
| Other noninterest expense |
2,287 | 1,968 | 2,358 | |||||||||
|
|
|
|
|
|
|
|||||||
| Total noninterest expense |
$ | 23,453 | $ | 19,685 | $ | 18,084 | ||||||
|
|
|
|
|
|
|
|||||||
Noninterest expense for the years ended December 31, 2014 and 2013 was $23.4 million and $19.7 million, respectively. The largest components of noninterest expense were related to employee costs shown in the table above as salaries and employee benefits and commission based compensation. Salaries continue to increase as we expand our presence in the markets in which we operate. During April 2014, we opened a loan production office (converted to full service branch in November 2014) in Vero Beach, Florida, which contributed to the increase in salaries during 2014. Commission based compensation is directly related to mortgage loan origination activity and activity at CBI. Total commissions paid varies with mortgage lending volume and production activity at CBI. Commissions related to mortgage lending decreased in 2014 compared to 2013 due to lower mortgage lending revenue, but overall commissions were higher during 2014 due to commissions paid at CBI. Additionally, salaries and benefits for CBI’s employees were included for four months (following the August 29, 2014 acquisition) and ULB’s employees for 15 days (following the December 15, 2014 merger) during 2014, adding to the increased employee costs for the 2014 period. Legal fees and accounting and audit expense were higher in 2014 primarily due to merger-related activities and costs associated with our filings with the Securities and Exchange Commission and preparations for becoming a public reporting company. The changes in the other components of noninterest expense were due to the recent acquisition of CBI, the United merger and our overall asset expansion, facilities growth, and expanding geographic footprint.
Noninterest expense for the years ended December 31, 2013 and 2012 was $19.7 million and $18.1 million, respectively. Salaries and employee benefits totaled $11.5 million during 2013, compared to $9.9 million during 2012. The increase of $1.6 million was due to our continued expansion in the markets that we serve and related increases in personnel as we grow our franchise. The increase in commission based compensation of $303 thousand was due to increased revenue of the mortgage division, as a large component of the compensation in the mortgage division is tied to production. Other noninterest expense for 2012 includes $1.1 million of expense related to the early termination of our prior data processing contract. Under the terms of prior management’s contract with the former data processing provider, our system costs would have continued to increase significantly with our growth. We also identified an alternative provider that we believed would deliver a higher level of service. After a thorough analysis, we determined that an early termination of our contract with the former provider was in our best long-term interests, in spite of the termination costs. The changes in the other components of noninterest expense are due to our increasing asset size, facilities growth, and expanding geographic foot print.
Income Tax Provision
Income tax expense of $3.2 million, $2.3 million, and $1.1 million was recognized during the years ended December 31, 2014, 2013, and 2012, respectively. The increase in income tax expense during each year was due to an increase in pre-tax income. The effective tax rate for the 2014, 2013, and 2012 was 34.8% (36.9% including
54
Table of Contents
Index to Financial Statements
the minority interest), 36.6%, and 34.2%, respectively. Our effective tax rate will generally increase with higher levels of taxable income. The effective tax rates are affected by items of income and expense that are not subject to federal and state taxation.
Comparison of Balance Sheets at December 31, 2014, 2013, and 2012
Overview
Our total assets increased $346.6 million, or 43.8%, from $791.8 million at December 31, 2013, to $1.14 billion at December 31, 2014. Total assets at December 31, 2013 included a $35.0 million short-term loan secured by a certificate of deposit in the same amount that was reflected on our balance sheet at year-end 2013 and 2012, but not at year-end 2014. This loan was paid off very shortly after the 2013 year-end as well as the 2012 year-end through liquidation of the related certificate of deposit. Total assets at December 31, 2014 included the assets of CBI, which was acquired in August 2014, and United, which was merged with and into NCC in December 2014. Excluding the impact of the short-term loan and acquired assets of CBI and United, total assets increased $35.2 million during 2014. Excluding the impact of the short-term loan and the acquired factored receivables from CBI and loans from United, loans increased by $110.2 million during 2014. Cash and cash equivalents decreased by $701 thousand during 2014. However, United had cash and cash equivalents of $37.1 million at acquisition and securities totaling $25.4 million that were liquidated immediately after acquisition. Our cash and cash equivalents would have decreased by $78.5 million without the cash acquired from United and cash from liquidating United’s securities portfolio. The decrease in cash and cash equivalents was a result of investing excess liquidity in loan growth and cash used to fund the CBI acquisition and the associated acquired factored receivables.
Deposits at December 31, 2014 totaled $971.1 million, an increase of $293.0 million as compared to December 31, 2013. Total deposits at December 31, 2013 included the short-term certificate of deposit of $35.0 million securing the loan referenced above. Excluding this short-term deposit and the deposits assumed in the United acquisition, deposits increased $127.5 million during 2014. Our deposits increased during 2014 due to the successful business development efforts of our employees as we continue to move banking relationships from other financial institutions. Additionally, the Banks have also benefited from excess liquidity in the financial markets, as investors are unwilling to make long-term investments due to the low interest rate environment and elect to maintain cash in interest-bearing transaction and money market accounts. In addition to the retail deposit growth, we issued $48.9 million of brokered certificates of deposits during the year ended December 31, 2014 in connection with the CBI acquisition.
Our total assets increased $98.4 million, or 14.2%, from December 31, 2012 to December 31, 2013. The primary reason for this increase was an increase in loans of $140.6 million. The increase in loans was partially offset by a reduction in interest–bearing cash deposits of $47.5 million. During 2013, we increased loans through organic growth and used our idle cash to fund this growth in addition to increasing our deposits. Total deposits at December 31, 2013 totaled $678.0 million, an increase of $97.8 million as compared to December 31, 2012. Our deposits increased during 2013 due to the successful business development efforts of our employees as we moved banking relationships from other financial institutions. NBC, like most banks, has benefitted from excess liquidity in the financial markets, as investors are unwilling to make long-term investments due to the low interest rate environment and elect to maintain cash in interest-bearing transaction and money market accounts.
Loans
Loans are our largest category of earning assets and typically provide higher yields than other types of earning assets. Associated with the higher loan yields are the inherent credit and liquidity risks that we attempt to control and counterbalance. Total loans averaged $629.0 million during the year ended December 31, 2014, or 82.8% of average earning assets, as compared to $485.8 million, or 76.3% of average earning assets, for the year ended December 31, 2013. At December 31, 2014, total loans, net of unearned income, were $888.7 million, compared to $582.0 million at December 31, 2013, an increase of $306.7 million, or 52.7%. Excluding the impact of a short-term loan totaling $35.0 million that was only reflected on our balance sheet at December 31, 2013, and the factored receivables purchased from CBI totaling $81.6 million, and loans acquired from United totaling $149.9 million, loans increased $110.2 million, or 20.2%, during 2014.
55
Table of Contents
Index to Financial Statements
Total loans averaged $485.8 million during the year ended December 31, 2013, or 76.3% of earnings assets, as compared to $356.1 million, or 67.5% of average earning assets, for the year ended December 31, 2012. At December 31, 2013, total loans, net of unearned income, were $582.0 million, compared to $441.5 million at December 31, 2012, representing an increase of $140.6 million, or 31.8%.
The organic, or non-acquired, growth in our loan portfolio is attributable to our ability to attract new customers from other financial institutions and overall growth in our markets. Since October 2010, we have opened branch locations in three new markets and a loan production office in another market, which was converted to a full-service branch in November 2014. Much of our loan growth has come from moving previous customers of our management team from other financial institutions to NBC. We have also been successful in building banking relationships with new customers. We have hired several new bankers in the markets that we serve, and these employees have been successful in transitioning their former clients and attracting new clients to NBC. Our bankers are expected to be involved in their communities and to maintain business development efforts to develop relationships with clients, and our philosophy is to be responsive to customer needs by providing decisions in a timely manner. In addition to our business development efforts, many of the markets that we serve have shown signs of economic recovery over the last few years.
The table below provides a summary of the loan portfolio composition as of the periods indicated.
COMPOSITION OF LOAN PORTFOLIO
| As of December 31, | ||||||||||||||||||||||||
| (Dollars in thousands, except percentages) |
2014 | 2013 | 2012 | |||||||||||||||||||||
| Amount | Percent of Total |
Amount | Percent of Total |
Amount | Percent of Total |
|||||||||||||||||||
| Construction, land development, and other land loans |
$ | 83,663 | 9.41 | % | $ | 58,372 | 10.02 | % | $ | 36,267 | 8.21 | % | ||||||||||||
| Secured by farmland |
1,842 | 0.21 | 347 | 0.06 | 143 | 0.03 | ||||||||||||||||||
| Secured by 1-4 family residential properties |
221,222 | 24.88 | 162,091 | 27.82 | 128,103 | 28.98 | ||||||||||||||||||
| Secured by multifamily (5 or more) residential properties |
23,420 | 2.63 | 22,316 | 3.83 | 17,637 | 3.99 | ||||||||||||||||||
| Secured by nonfarm nonresidential properties |
330,784 | 37.20 | 218,299 | 37.47 | 157,234 | 35.58 | ||||||||||||||||||
|
|
|
|
|
|
|
|
|
|
|
|
|
|||||||||||||
| Loans secured by real estate |
660,931 | 74.33 | 461,425 | 79.20 | 339,384 | 76.79 | ||||||||||||||||||
| Commercial and industrial loans |
113,788 | 12.80 | 102,280 | 17.56 | 90,924 | 20.57 | ||||||||||||||||||
| Factored commercial receivables |
82,600 | 9.29 | — | — | — | — | ||||||||||||||||||
| Consumer loans |
13,962 | 1.57 | 6,113 | 1.06 | 5,002 | 1.13 | ||||||||||||||||||
| Lease financing receivables |
— | — | 6 | 0.00 | 413 | 0.09 | ||||||||||||||||||
| Other loans |
17,869 | 2.01 | 12,725 | 2.18 | 6,251 | 1.41 | ||||||||||||||||||
|
|
|
|
|
|
|
|
|
|
|
|
|
|||||||||||||
| Total gross loans |
889,150 | 100.00 | % | 582,549 | 100.00 | % | 441,974 | 100.00 | % | |||||||||||||||
| Unearned income |
(429 | ) | (547 | ) | (522 | ) | ||||||||||||||||||
|
|
|
|
|
|
|
|||||||||||||||||||
| Total loans, net of unearned income |
888,721 | 582,002 | 441,452 | |||||||||||||||||||||
| Allowance for loan losses |
(9,802 | ) | (9,119 | ) | (10,020 | ) | ||||||||||||||||||
|
|
|
|
|
|
|
|||||||||||||||||||
| Total net loans |
$ | 878,919 | $ | 572,883 | $ | 431,432 | ||||||||||||||||||
|
|
|
|
|
|
|
|||||||||||||||||||
In the context of this discussion, a “real estate mortgage loan” is defined as any loan, other than a loan for construction purposes, secured by real estate, regardless of the purpose of the loan. It is common practice for financial institutions in our market areas, and for us in particular, to obtain a security interest or lien in real estate whenever possible, in addition to any other available collateral. This collateral is taken to reinforce the likelihood of the ultimate repayment of the loan. This practice tends to increase the magnitude of the real estate loan portfolio. In many cases, we prefer real estate collateral to many other potential collateral sources, such as accounts receivable, inventory, and equipment.
56
Table of Contents
Index to Financial Statements
The principal component of our loan portfolio is real estate mortgage loans. At December 31, 2014, this category totaled $660.9 million and represented 74.3% of the total loan portfolio, compared to $461.4 million, or 79.2% of the total loan portfolio, and $339.4 million, or 76.8% of the total loan portfolio, at year-end 2013 and 2012, respectively. Each category of real estate mortgage loans increased during 2014, as described in more detail below.
Loans secured by nonfarm nonresidential properties, or commercial mortgage loans, increased $112.5 million, or 51.5%, to $330.8 million at December 31, 2014, compared to $218.3 million at December 31, 2013. Excluding the acquired United loans, commercial mortgage loans increased $33.5 million, or 15.3%, during 2014. At December 31, 2012, commercial mortgage loans totaled $157.2 million. Commercial mortgage loans are the single largest category of loans, and, at December 31, 2014, accounted for 37.2% of the portfolio. Our management team has a great deal of experience and expertise in commercial mortgages, and this loan type has traditionally comprised a large portion of our loan portfolio. Of the $330.8 million in total commercial mortgage loans at December 31, 2014, approximately $132.1 million were loans secured by owner-occupied properties.
Residential mortgage loans increased $59.1 million, or 36.5%, to $221.2 million at December 31, 2014, compared to $162.1 million at December 31, 2013. Excluding the acquired United loans, residential mortgage loans increased $25.0 million, or 15.4% during 2014. At December 31, 2014 and December 31, 2013, residential mortgages accounted for 24.9% and 27.8%, respectively, of the entire loan portfolio. At December 31, 2012, residential mortgage loans totaled $128.1 million and accounted for 29.0% of the entire loan portfolio.
Real estate construction loans totaled $83.7 million at December 31, 2014, an increase $25.3 million, or 43.3%, over $58.4 million at December 31, 2013. Excluding the acquired United loans, real estate construction loans increased $16.3 million, or 27.9%. At December 31, 2014 and December 31, 2013, this loan type accounted for 9.4% and 10.0%, respectively, of our total loan portfolio. At December 31, 2012, real estate construction loans totaled $36.3 million and accounted for 8.2% of the entire loan portfolio.
Commercial and industrial loans totaled $113.8 million at December 31, 2014, compared to $102.3 million at December 31, 2013. As noted above, the balance as of December 31, 2013 includes a $35.0 million CD-secured short-term loan that was repaid shortly after year-end. Excluding the short-term loan and the acquired United loans, commercial and industrial loans increased $23.0 million, or 34.2% during 2014. During 2013, commercial and industrial loans increased $11.4 million, or 12.5%. We have hired several experienced commercial lenders, and the increases described above are a result of the successful efforts of these employees. We expect this trend with respect to commercial and industrial loans to continue as economic conditions improve.
The repayment of loans is a source of additional liquidity for us. The following table sets forth our loans maturing within specific intervals at December 31, 2014.
LOAN MATURITY AND SENSITIVITY TO CHANGES IN INTEREST RATES
| As of December 31, 2014 | ||||||||||||||||
| (Dollars in thousands) |
One year or less |
Over one year through five years |
Over five years |
Total | ||||||||||||
| Construction, land development, and other land loans |
$ | 51,729 | $ | 28,885 | $ | 3,049 | $ | 83,663 | ||||||||
| Secured by farmland |
1,257 | 585 | 1,842 | |||||||||||||
| Secured by 1-4 family residential properties |
33,423 | 89,284 | 98,515 | 221,222 | ||||||||||||
| Secured by multifamily (5 or more) residential properties |
2,974 | 17,587 | 2,859 | 23,420 | ||||||||||||
| Secured by nonfarm nonresidential properties |
71,624 | 207,604 | 51,556 | 330,784 | ||||||||||||
|
|
|
|
|
|
|
|
|
|||||||||
| Loans secured by real estate |
161,007 | 343,945 | 155,979 | 660,931 | ||||||||||||
| Commercial and industrial loans |
64,434 | 45,193 | 4,161 | 113,788 | ||||||||||||
| Factored commercial receivables |
82,600 | 82,600 | ||||||||||||||
| Consumer loans |
5,042 | 5,308 | 3,612 | 13,962 | ||||||||||||
| Other loans |
2,933 | 6,492 | 8,444 | 17,869 | ||||||||||||
|
|
|
|
|
|
|
|
|
|||||||||
| Total gross loans |
$ | 316,016 | $ | 400,938 | $ | 172,196 | $ | 889,150 | ||||||||
|
|
|
|
|
|
|
|
|
|||||||||
57
Table of Contents
Index to Financial Statements
| Predetermined rates |
Floating rates |
Total | ||||||||||
| Maturing after one year but within five years |
$ | 244,029 | $ | 156,909 | $ | 400,938 | ||||||
| Maturing after five years |
136,147 | 36,049 | 172,196 | |||||||||
|
|
|
|
|
|
|
|||||||
| $ | 380,176 | $ | 192,958 | $ | 573,134 | |||||||
|
|
|
|
|
|
|
|||||||
The information presented in the table above is based upon the contractual maturities of the individual loans, which may be subject to renewal at their contractual maturity. Renewal of such loans is subject to review and credit approval, as well as modification of terms at their maturity. Consequently, we believe that this treatment presents fairly the maturity structure of the loan portfolio.
Investment Securities
We use our securities portfolio primarily to enhance our overall yield on interest-earning assets and as a source of liquidity, as a tool to manage our balance sheet sensitivity and regulatory capital ratios, and as a base upon which to pledge assets for public deposits. When our liquidity position exceeds current needs and our expected loan demand, other investments are considered as a secondary earnings alternative. As investments mature, they are used to meet current cash needs, or they are reinvested to maintain our desired liquidity position. We have designated all of our securities as available-for-sale to provide flexibility, in case an immediate need for liquidity arises, and we believe that the composition of the portfolio offers needed flexibility in managing our liquidity position and interest rate sensitivity without adversely impacting our regulatory capital levels. Securities available-for-sale are reported at fair value with unrealized gains or losses reported as a separate component of other comprehensive income, net of related deferred taxes. Purchase premiums and discounts are recognized in income using the interest method over the terms of the securities.
The following table summarizes the amortized cost and fair value of securities available-for-sale at December 31, 2014, 2013, and 2012.
INVESTMENT SECURITIES
| As of December 31, | ||||||||||||||||||||||||
| (Dollars in thousands) |
2014 | 2013 | 2012 | |||||||||||||||||||||
| Cost | Market | Cost | Market | Cost | Market | |||||||||||||||||||
| U.S. Treasury securities |
$ | 1,501 | $ | 1,501 | $ | — | $ | — | $ | — | $ | — | ||||||||||||
| Securities issued by states and political subdivisions |
4,408 | 4,681 | 4,409 | 4,270 | $ | 5,432 | $ | 5,583 | ||||||||||||||||
| Mortgage-backed securities (MBS) |
||||||||||||||||||||||||
| Residential mortgage pass-through securities |
27,723 | 28,750 | 33,123 | 33,742 | 32,983 | 35,141 | ||||||||||||||||||
| Other residential mortgage-backed securities |
— | — | — | — | — | — | ||||||||||||||||||
| Commercial mortgage-backed securities |
— | — | — | — | — | — | ||||||||||||||||||
|
|
|
|
|
|
|
|
|
|
|
|
|
|||||||||||||
| Total mortgage-backed securities |
27,723 | 28,750 | 33,123 | 33,742 | 32,983 | 35,141 | ||||||||||||||||||
| Investment in mutual funds and other equity securities |
— | — | 10,000 | 9,967 | — | — | ||||||||||||||||||
|
|
|
|
|
|
|
|
|
|
|
|
|
|||||||||||||
| Total investment securities |
$ | 33,632 | $ | 34,932 | $ | 47,532 | $ | 47,979 | $ | 38,415 | $ | 40,724 | ||||||||||||
|
|
|
|
|
|
|
|
|
|
|
|
|
|||||||||||||
58
Table of Contents
Index to Financial Statements
The following table shows the scheduled maturity and average yields of our securities at December 31, 2014.
INVESTMENT SECURITIES MATURITY DISTRIBUTION AND YIELDS
| As of December 31, 2014 | ||||||||||||||||||||||||||||||||||||||||
| (Dollars in thousands, except |
Within one year |
After one but within five years |
After five but within ten years |
After ten years | Other securities | |||||||||||||||||||||||||||||||||||
| Amount | Yield | Amount | Yield | Amount | Yield | Amount | Yield | Amount | Yield | |||||||||||||||||||||||||||||||
| U.S. Treasury securities |
$ | 1,501 | 0.02 | % | $ | — | — | % | $ | — | — | % | $ | — | — | % | $ | — | — | % | ||||||||||||||||||||
| Securities issued by states and political subdivisions |
— | — | — | — | 1,101 | 5.89 | 3,580 | 5.89 | — | — | ||||||||||||||||||||||||||||||
| Mortgage-backed securities (MBS) |
— | — | — | — | — | — | — | — | — | — | ||||||||||||||||||||||||||||||
| Residential mortgage pass-through securities |
— | — | — | — | — | — | — | — | 28,750 | 3.05 | ||||||||||||||||||||||||||||||
| Other residential mortgage-backed securities |
— | — | — | — | — | — | — | — | — | — | ||||||||||||||||||||||||||||||
| Commercial mortgage-backed securities |
— | — | — | — | — | — | — | — | — | — | ||||||||||||||||||||||||||||||
|
|
|
|
|
|
|
|
|
|
|
|
|
|
|
|
|
|
|
|
|
|||||||||||||||||||||
| Total mortgage-backed securities |
— | — | — | — | — | — | — | — | 28,750 | 3.05 | ||||||||||||||||||||||||||||||
| Total investment securities |
$ | 1,501 | 0.02 | % | $ | — | — | % | $ | 1,101 | 5.89 | % | $ | 3,580 | 5.89 | % | $ | 28,750 | 3.05 | % | ||||||||||||||||||||
|
|
|
|
|
|
|
|
|
|
|
|
|
|
|
|
|
|
|
|
|
|||||||||||||||||||||
We invest primarily in mortgage-backed securities, municipal securities, and obligations of government-sponsored entities and agencies of the United States, though we may in some situations also invest in direct obligations of the United States or obligations guaranteed as to the principal and interest by the United States. All of our mortgage-backed securities are residential securities issued by the Federal National Mortgage Association, or FNMA, and the Federal Home Loan Mortgage Corporation, or FHLMC. During all periods presented, we have used most of our excess liquidity to invest in loans, as our loan demand has remained strong, rather than investing in investment securities. During 2013, we invested $10.0 million in a mutual fund that invests primarily in very short duration securities guaranteed by the United States government. We sold this investment during July 2014 to provide liquidity for the CBI acquisition. While investing excess cash in securities would increase our interest income, we have chosen not to expand our securities portfolio as we have grown due to our success growing our loan portfolio and due to the current historically low interest rate environment.
Allowance for Loan Losses, Provision and Asset Quality
Allowance for loan losses and provision
Our allowance for loan losses represents our estimate of probable inherent credit losses in the loan portfolio. We determine the allowance based on an ongoing evaluation of risk as it correlates to potential losses within the portfolio. Increases in the allowance are made by charges to the provision for loan losses. Loans deemed to be uncollectible are charged against the allowance. Recoveries of previously charged-off amounts are credited to our allowance for loan losses.
In the determination of the allowance, we utilize the risk department’s independent analysis of the minimum required loan loss reserve for the Company. In this analysis, problem loans are reviewed for impairment or for loss exposure based on their payment performance, probability of default, and value of the collateral. These totals are then specifically allocated to the reserve. The loan portfolio is then divided into various homogeneous risk pools utilizing collateral codes and/or loan purpose codes and internal risk ratings. Historical losses are used to estimate the probable loss in the current portfolio using both an average loss methodology and a migration loss methodology. The methodologies and the time periods considered are subjective and vary for each risk pool based on systematic risk relative to its ability to estimate losses. As every loan has a risk of loss, the calculation begins with a minimum loss allocation for each loan pool. The minimum loss is estimated based on long term-
59
Table of Contents
Index to Financial Statements
trends for the Banks, the banking industry, and the economy. A minimum loss allocation is similarly applied to letters of credit and unused lines of credit. Loss allocations are adjusted for changes in the economy, problem loans, payment performance, loan policy, management, credit administration systems, credit concentrations, loan growth, and other elements over the time periods utilized in the methodology. The adjusted loss allocations are then applied to the current balances in their respective loan pools. Loss allocations are totaled, yielding the required allowance for loan losses.
We incorporate the data from the allowance calculation with interim changes to that data in our ongoing determination of our allowance for loan losses. We then take into consideration other factors that may support an allowance in excess of required minimums. These factors include systems changes, historically high loan growth, changes in the economy and company management, and lending practices at the time at which the loans were made. We believe that the data that we use in determining our allowance for loan losses is sufficient to estimate the potential losses in the loan portfolio; however, actual results could differ from those estimates.
The following table presents a summary of changes in the allowance for loan losses for the periods and dates indicated.
ALLOWANCE FOR LOAN LOSSES
| For the Twelve Months Ended December 31, |
||||||||||||
| (Dollars in thousands, except percentages) |
2014 | 2013 | 2012 | |||||||||
| Total loans outstanding, net of unearned income |
$ | 888,721 | $ | 582,002 | $ | 441,452 | ||||||
|
|
|
|
|
|
|
|||||||
| Average loans outstanding, net of unearned income |
$ | 629,040 | $ | 485,769 | $ | 356,081 | ||||||
|
|
|
|
|
|
|
|||||||
| Allowance for loan losses at beginning of period |
$ | 9,119 | $ | 10,020 | $ | 10,343 | ||||||
| Charge-offs: |
||||||||||||
| Loans secured by real estate |
429 | 1,558 | 1,702 | |||||||||
| Commercial and industrial loans |
— | 32 | 41 | |||||||||
| Factored receivables |
656 | — | — | |||||||||
| Consumer loans |
— | — | 6 | |||||||||
| All other loans |
3 | — | 365 | |||||||||
|
|
|
|
|
|
|
|||||||
| Total charge-offs |
1,088 | 1,590 | 2,114 | |||||||||
| Recoveries: |
||||||||||||
| Loans secured by real estate |
72 | 354 | 1,412 | |||||||||
| Commercial and industrial loans |
15 | 320 | 211 | |||||||||
| Factored receivables |
633 | — | — | |||||||||
| Consumer loans |
21 | 15 | 43 | |||||||||
| All other loans |
52 | — | — | |||||||||
|
|
|
|
|
|
|
|||||||
| Total recoveries |
793 | 689 | 1,666 | |||||||||
|
|
|
|
|
|
|
|||||||
| Net charge-offs |
295 | 901 | 448 | |||||||||
| Provision for loan losses |
978 | — | 125 | |||||||||
|
|
|
|
|
|
|
|||||||
| Allowance for loan losses at period end |
$ | 9,802 | $ | 9,119 | $ | 10,020 | ||||||
|
|
|
|
|
|
|
|||||||
| Allowance for loan losses to period end loans |
1.10 | % | 1.57 | % | 2.27 | % | ||||||
| Net charge-offs to average loans |
0.05 | % | 0.19 | % | 0.13 | % | ||||||
The table above does not include the allowance for loan losses of United. In accordance with ASC Topic 805, Business Combinations, United’s allowance for loan losses was not brought forward at acquisition; rather, the acquired loans were recorded at fair value and any discount to fair value was recorded against the loans rather than as an allowance for loan losses. The portion of the discount deemed related to credit quality was recorded as a non-accretable difference and the remaining discount recorded as an accretable discount and accreted into interest income over the estimated average life of the loans using the level yield method. At December 31, 2014, United’s acquired loan portfolio totaled $153.1 million and had a related non-accretable difference of $2.9 million and accretable discount of $1.5 million.
60
Table of Contents
Index to Financial Statements
Overall, asset quality indicators have continued to improve, and, as a result, provision expense has been minimal for the traditional bank loan portfolio (excluding factored receivables). During the fourth quarter of 2014, we identified a factoring relationship that posed significant credit risk and required additional provision expense. During the year ended December 31, 2014, we recorded provision expense of $978 thousand related to this exposure and other risks in the factored receivables portfolio. During the year ended December 31, 2013, we did not record any provision expense. During the year ended December 31, 2012, we recorded provision expense of $125 thousand.
Allocation of Our Allowance for Loan Losses
While no portion of our allowance for loan losses is in any way restricted to any individual loan or group of loans and the entire allowance is available to absorb losses from any and all loans, the following table represents management’s allocation of our allowance for loan losses to specific loan categories for the periods indicated.
ALLOCATION OF ALLOWANCE FOR LOAN LOSSES
| As of December 31, | ||||||||||||||||||||||||
| (Dollars in thousands, except percentages) |
2014 | 2013 | 2012 | |||||||||||||||||||||
| Amount | Percent of Loans in each Category to Total Loans |
Amount | Percent of Loans in each Category to Total Loans |
Amount | Percent of Loans in each Category to Total Loans |
|||||||||||||||||||
| Commercial , financial, and agricultural |
$ | 1,523 | 14.81 | % | $ | 1,398 | 19.74 | % | $ | 1,158 | 21.99 | % | ||||||||||||
| Factored receivables |
955 | 9.29 | — | — | ||||||||||||||||||||
| Real estate – mortgage |
5,047 | 64.92 | 4,449 | 69.19 | 5,093 | 68.58 | ||||||||||||||||||
| Real estate – construction |
647 | 9.41 | 964 | 10.02 | 497 | 8.21 | ||||||||||||||||||
| Consumer |
562 | 1.57 | 243 | 1.05 | 170 | 1.13 | ||||||||||||||||||
| Leases |
— | — | — | — | 3 | 0.09 | ||||||||||||||||||
| Unallocated |
1,068 | — | 2,065 | — | 3,099 | — | ||||||||||||||||||
|
|
|
|
|
|
|
|
|
|
|
|
|
|||||||||||||
| $ | 9,802 | 100.00 | % | $ | 9,119 | 100.00 | % | $ | 10,020 | 100.00 | % | |||||||||||||
|
|
|
|
|
|
|
|
|
|
|
|
|
|||||||||||||
Our allowance for loan losses is composed of general reserves and specific reserves. Specific reserves are determined by applying to each segment of our portfolio loss percentages based on that segment’s historical loss experience and adjustment factors derived from internal and external environmental conditions. All loans considered to be impaired are evaluated on an individual basis to determine specific reserve allocations in accordance with GAAP. Loans for which specific reserves are provided are excluded from the calculation of general reserves.
A portion of the allowance is deemed to be a general reserve and remains unallocated to any particular loan category to reflect management’s estimate of probable inherent but not yet specifically identified losses within the portfolio due to the nature of the portfolio and uncertainties in underwriting standards of certain loans. For example, the portfolio includes exposures to various businesses with different organizational structures that may implicate multiple segments within the allocation framework, which will inherently lead to imperfections in the loss percentages applied to the portfolio segments. These inherent risks are amplified by the fact that we remain at risk for unidentified problems in the loan portfolios that we inherited upon acquiring control of NBC and ULB, as many of the loans underwritten by prior management were made using different credit policies and procedures than those that we currently use. Problems with respect to credit quality or the collectibility of these loans often are not apparent from the documentation in the file and frequently do not arise until the loan matures. For example, in some instances, sizable loans with satisfactory payment history and apparently complete documentation have led to write-offs upon maturity of the loan or a subsequent discovery of adverse information. Allocating this risk from the inherited loans to the segment portfolios is not deemed advisable by management due to the breadth of exposure of these loans over the portfolio segments.
Management evaluates the adequacy of our allowance for loan losses and the allocation of our allowance for loan losses on a quarterly basis. Recent variations in the unallocated portion of the allowance have been driven
61
Table of Contents
Index to Financial Statements
by management’s estimate of probable inherent losses within the portfolio that have not yet been specifically identified due in large part to the factors discussed above and consideration of such additional factors as changes in the nature and volume of our loan portfolio, current economic conditions that may affect borrowers’ ability to pay, overall portfolio quality, and review of specific problem loans. In general, we expect that the portion of the unallocated allowance attributable to inherited loans will decrease over time as new loans are made and additional information becomes available with respect to currently unidentified problems and expected losses for the inherited loans. However, because management’s allocation of the allowance among the various loan types is driven by several factors, this decrease may not be linear during certain time frames.
Our procedures for allocating the allowance support an incurred, rather than expected, loss model through utilization of both specific and general reserves (including the unallocated amount). Although leaving a portion of the allowance unallocated may appear to indicate the expectation of future events, it in fact addresses the potential for additional losses on the current portfolio. We deem it prudent to include this component of measurement in our allowance for loan losses and believe that it is appropriate to apply it as an unallocated amount based on the current information available in the files and our exposure to incurred losses over the various segments. In summary, the unallocated portion represents a component that explicitly accounts for the inherent imprecision in the loan loss analysis based on our specific current circumstances.
Nonperforming Assets
The following table presents our nonperforming assets for the dates indicated.
NONPERFORMING ASSETS
| As of December 31, | ||||||||||||
| (Dollars in thousands, except percentages) |
2014 | 2013 | 2012 | |||||||||
| Nonaccrual Loans |
$ | 4,865 | $ | 3,371 | $ | 244 | ||||||
| Loans past due 90 days or more and still accruing |
297 | — | — | |||||||||
|
|
|
|
|
|
|
|||||||
| Total nonperforming loans |
5,162 | 3,371 | 244 | |||||||||
| Other real estate and repossesed assets |
1,380 | 845 | 95 | |||||||||
|
|
|
|
|
|
|
|||||||
| Total nonperforming assets |
$ | 6,542 | $ | 4,216 | $ | 339 | ||||||
|
|
|
|
|
|
|
|||||||
| Allowance for loan losses to period end loans |
1.10 | % | 1.57 | % | 2.27 | % | ||||||
| Allowance for loan losses to period end non-performing loans |
189.9 | 270.51 | 4,106.56 | |||||||||
| Net charge-offs to average loans |
0.05 | 0.19 | 0.13 | |||||||||
| Nonperforming assets to period end loans and foreclosed property and repossessed assets |
0.73 | 0.72 | 0.08 | |||||||||
| Nonperforming loans to period end loans |
0.58 | 0.58 | 0.06 | |||||||||
Accrual of interest is discontinued on a loan when management believes, after considering economic and business conditions and collection efforts, that the borrower’s financial condition is such that the collection of interest is doubtful. In addition to consideration of these factors, we have a consistent and continuing policy of placing all loans (other than factored receivables) on nonaccrual status if they become 90 days or more past due. For CBI’s factored receivables, which are trade credit rather than promissory notes, our practice is to charge off unpaid recourse receivables when they become 90 days past due from the invoice due date and to charge off non-recourse receivables at 120 days past due from the statement billing date. For the recourse receivables, the invoice is charged against the client reserve account established for such purposes unless the client reserve and the client’s financials resources are insufficient, at which point it is charged against loans. When a loan is placed on nonaccrual status, all accrued interest on the loan is reversed and deducted from earnings as a reduction of reported interest income. No additional interest is accrued on the loan balance until collection of both principal and interest becomes reasonably certain. Payments received while a loan is on nonaccrual status will generally be applied to the outstanding principal balance. When a problem loan is finally resolved, there may ultimately be an actual write-down or charge-off of the principal balance of the loan that would necessitate additional charges to the allowance for loan losses.
62
Table of Contents
Index to Financial Statements
Total nonperforming assets increased $2.3 million to $6.5 million at December 31, 2014, from $4.2 million at December 31, 2013. Included in nonperforming assets at December 31, 2014 are nonaccrual loans acquired from United totaling $2.6 million and other real estate and repossessed assets acquired from United of $558 thousand. Excluding the acquired nonperforming assets, nonperforming assets decreased $1.1 million and totaled $3.1 million at December 31, 2014. Improving asset quality has been and will continue to be a primary focus of management.
Deposits
Deposits, which include noninterest-bearing demand deposits, interest-bearing demand deposits, money market accounts, and savings, time, and other deposits (including negotiable orders of withdrawal, or NOW accounts), are the primary funding source for the Banks. We offer a variety of products designed to attract and retain customers, with primary focus on building and expanding client relationships. We continue to focus on establishing a comprehensive relationship with consumer and business borrowers, seeking deposits as well as lending relationships.
The following table details the composition of our deposit portfolio as of the dates indicated.
COMPOSITION OF DEPOSITS
| As of December 31, | ||||||||||||||||||||||||
| (Dollars in thousands, except percentages) |
2014 | 2013 | 2012 | |||||||||||||||||||||
| Amount | Percent of Total |
Amount | Percent of Total |
Amount | Percent of Total |
|||||||||||||||||||
| Noninterest-bearing demand |
$ | 217,643 | 22.41 | % | $ | 128,837 | 19.00 | % | $ | 67,040 | 11.55 | % | ||||||||||||
| Interest-bearing demand |
154,816 | 15.94 | 107,060 | 15.79 | 96,514 | 16.63 | ||||||||||||||||||
| Savings and money market |
392,394 | 40.41 | 304,071 | 44.85 | 277,342 | 47.79 | ||||||||||||||||||
| Time less than $100k |
74,367 | 7.66 | 15,979 | 2.35 | 20,766 | 3.58 | ||||||||||||||||||
| Time equal to or greater than $100k and less than $250k |
46,538 | 4.79 | 35,593 | 5.25 | 41,826 | 7.21 | ||||||||||||||||||
| Time equal to or greater than $250k |
85,302 | 8.78 | 86,491 | 12.76 | 76,806 | 13.24 | ||||||||||||||||||
|
|
|
|
|
|
|
|
|
|
|
|
|
|||||||||||||
| Total deposits |
$ | 971,060 | 100.00 | % | $ | 678,031 | 100.00 | % | $ | 580,294 | 100.00 | % | ||||||||||||
|
|
|
|
|
|
|
|
|
|
|
|
|
|||||||||||||
Total deposits were $971.1 million at December 31, 2014, an increase of $293.0 million from December 31, 2013. As noted above, total deposits at December 31, 2013 included a short-term certificate of deposit totaling $35.0 million securing a short-term loan in the same amount. Excluding this short-term deposit and the deposits of ULB that we assumed upon consummation of the United merger, deposits increased $127.5 million, or 19.8% during 2014. During 2014, we issued brokered certificates of deposits of $48.9 million to fund a portion of the assets acquired in the CBI acquisition. During the year ended December 31, 2013, deposits increased $97.7 million, or 16.8%, over 2012 year-end amounts.
The following table details the maturities of time deposits greater than $100,000 and other time deposits. Other time deposits includes brokered certificates of deposit and internet certificates of deposit. Large certificate of deposit customers and brokered and internet certificate of deposit customers tend to be more sensitive to interest rate levels.
MATURITIES OF CERTIFICATES OF DEPOSIT OF $100,000 OR MORE
AND OTHER TIME DEPOSITS
63
Table of Contents
Index to Financial Statements
| As of December 31, 2014 | ||||||||||||||||||||
| (Dollars in thousands) |
Three months or less |
Over three through twelve months |
Over one year through three years |
Greater than three years |
Total | |||||||||||||||
| Certificates of deposit of $100,000 or more |
$ | 17,394 | $ | 58,299 | $ | 37,137 | $ | 5,035 | $ | 117,865 | ||||||||||
| Other time deposits |
7,920 | 5,249 | 49,247 | 494 | 62,910 | |||||||||||||||
|
|
|
|
|
|
|
|
|
|
|
|||||||||||
| Total |
$ | 25,314 | $ | 63,548 | $ | 86,384 | $ | 5,529 | $ | 180,775 | ||||||||||
|
|
|
|
|
|
|
|
|
|
|
|||||||||||
Deposit growth has been a point of emphasis of ours, and, additionally, we have benefited to a large extent from uncertainty in the financial markets, which has increased the liquidity of many banks as consumers and businesses look for safe places for liquidity, thereby increasing bank deposits. All deposit categories increased during 2014.
Other Funding Sources
We supplement our deposit funding with wholesale funding when needed for balance sheet planning or when the terms are attractive and will not disrupt our offering rates in our markets. A source that we have used for wholesale funding is the Federal Home Loan Bank of Atlanta, or FHLB. We had FHLB borrowings of $22.0 million at December 31, 2014 and 2013 and $24.5 million at December 31, 2012. We have not initiated any additional borrowings from the FHLB since 2012. We have access to brokered deposits and issued $48.9 million of brokered certificates of deposit during 2014 to fund a portion of the assets acquired in the CBI acquisition. Another funding source that we have used to supplement our local funding is internet certificates of deposit. We have used this source to book certificates of deposit three to five years in maturity at rates that are lower than we would offer in our local market, typically below the rates indicated on the LIBOR swap curve for similar maturities. We had internet certificates of deposit balances of $14.0 million, $13.0 million, and $12.6 million at December 31, 2014, 2013, and 2012, respectively.
Liquidity
Market and public confidence in our financial strength and financial institutions in general will largely determine our access to appropriate levels of liquidity. This confidence is significantly dependent on our ability to maintain sound asset quality and appropriate levels of capital reserves.
Liquidity is defined as the ability to meet anticipated customer demands for funds under credit commitments and deposit withdrawals at a reasonable cost and on a timely basis. We measure our liquidity position by giving consideration to both on- and off-balance sheet sources of and demands for funds on a daily, weekly, and monthly basis.
Liquidity risk involves the risk of being unable to fund assets with the appropriate duration and rate-based liabilities, as well as the risk of not being able to meet unexpected cash needs. Liquidity planning and management are necessary to ensure the ability to fund operations in a cost-effective manner and to meet current and future potential obligations such as loan commitments, lease obligations, and unexpected deposit outflows. In this process, we focus on both assets and liabilities and on the manner in which they combine to provide adequate liquidity to meet our needs.
Funds are available from a number of basic banking activity sources, including the core deposit base, the repayment and maturity of loans, and investment security cash flows. Other funding sources include federal funds purchased, brokered certificates of deposit, and borrowings from the FHLB.
Cash and cash equivalents at December 31, 2014, 2013, and 2012 were $123.4 million, $124.1 million, and $171.3 million, respectively. Based on the recorded cash and cash equivalents, our liquidity resources were sufficient at December 31, 2014 to fund loans and meet other cash needs as necessary.
Contractual Obligations
While our liquidity monitoring and management considers both present and future demands for and sources of liquidity, the following table of contractual commitments focuses only on future obligations.
64
Table of Contents
Index to Financial Statements
CONTRACTUAL OBLIGATIONS
As of December 31, 2014
| (Dollars in thousands) |
Due in 1 year or less |
Due after 1 through 3 years |
Due after 3 through 5 years |
Due after 5 years |
Total | |||||||||||||||
| Federal Home Loan Bank advances |
$ | — | $ | 22,000 | $ | — | $ | — | $ | 22,000 | ||||||||||
| Certificates of deposit of less than $100k |
28,657 | 35,076 | 10,661 | — | 74,394 | |||||||||||||||
| Certificates of deposit of $100k or more |
78,862 | 40,358 | 12,620 | — | 131,840 | |||||||||||||||
| Operating leases |
739 | 699 | 192 | — | 1,630 | |||||||||||||||
|
|
|
|
|
|
|
|
|
|
|
|||||||||||
| Total contractual obligations |
$ | 108,258 | $ | 98,133 | $ | 23,473 | $ | — | $ | 229,864 | ||||||||||
|
|
|
|
|
|
|
|
|
|
|
|||||||||||
Off-Balance Sheet Arrangements
We are party to credit-related financial instruments with off-balance sheet risks in the normal course of business to meet the financing needs of our customers. These financial instruments include commitments to extend credit and standby letters of credit. Such commitments involve, to varying degrees, elements of credit and interest rate risk in excess of amounts recorded on our balance sheet. Our exposure to credit loss is represented by the contractual amounts of these commitments. We follow the same credit policies in making commitments as we do for on-balance sheet instruments.
Our off-balance sheet arrangements are summarized in the following table for the periods indicated.
CREDIT EXTENSION COMMITMENTS
| As of December 31, | ||||||||||||
| 2014 | 2013 | 2012 | ||||||||||
| Amount | Amount | Amount | ||||||||||
| Unfunded lines |
$ | 182,820 | $ | 141,887 | 96,244 | |||||||
| Letters of credit |
8,085 | 4,066 | 2,591 | |||||||||
|
|
|
|
|
|
|
|||||||
| Total credit extension commitments |
$ | 190,905 | 145,953 | 98,835 | ||||||||
|
|
|
|
|
|
|
|||||||
Interest Sensitivity and Market Risk
Interest Sensitivity
We monitor and manage the pricing and maturity of our assets and liabilities in order to diminish the potential adverse impact that changes in interest rates could have on net interest income. The principal monitoring technique employed by us is simulation analysis, which technique is augmented by “gap” analysis.
In simulation analysis, we review each individual asset and liability category and their projected behavior in various different interest rate environments. These projected behaviors are based upon management’s past experiences and upon current competitive environments, including the various environments in the different markets in which we compete. Using this projected behavior and differing rate scenarios as inputs, the simulation analysis generates as output projections of net interest income. We also periodically verify the validity of this approach by comparing actual results with those that were projected in previous models.
Another technique used in interest rate management, but to a lesser degree than simulation analysis, is the measurement of the interest sensitivity “gap,” which is the positive or negative dollar difference between assets and liabilities that are subject to interest rate repricing within a given period of time. Interest rate sensitivity can be managed by repricing assets and liabilities, selling securities available for sale or trading securities, replacing an asset or liability at maturity, or by adjusting the interest rate during the life of an asset or liability.
We evaluate interest rate sensitivity risk and then formulate guidelines regarding asset generation and repricing and sources and prices of off-balance sheet commitments in order to decrease interest sensitivity risk. We use computer simulations to measure the net income effect of various interest rate scenarios. The modeling reflects interest rate changes and the related impact on net income over specified periods of time.
65
Table of Contents
Index to Financial Statements
The following table illustrates our interest rate sensitivity at December 31, 2014, assuming that the relevant assets and liabilities are collected and paid, respectively, based upon historical experience rather than their stated maturities.
INTEREST SENSITIVITY ANALYSIS
As of December 31, 2014
| (Dollars in thousands) Interest-earning assets |
0-1 Mos | 1-3 Mos | 3-12 Mos | 1-3 Yrs | 3-5 Yrs | > 5 Yrs | Total | |||||||||||||||||||||
| Loans (1) |
$ | 434,760 | 22,277 | 83,840 | 168,281 | 140,994 | 47,898 | 898,050 | ||||||||||||||||||||
| Securities |
1,864 | 657 | 2,836 | 7,233 | 760 | 21,582 | 34,932 | |||||||||||||||||||||
| Cash balances in other banks |
109,199 | — | — | — | — | — | 109,199 | |||||||||||||||||||||
| Funds sold |
— | — | — | — | — | — | — | |||||||||||||||||||||
|
|
|
|
|
|
|
|
|
|
|
|
|
|
|
|||||||||||||||
| Total interest earning assets |
545,823 | 22,934 | 86,676 | 175,514 | 141,754 | 69,480 | 1,042,181 | |||||||||||||||||||||
| Interest-bearing liabilities |
||||||||||||||||||||||||||||
| Interest-bearing transactions accounts |
63,800 | 3,762 | 16,932 | 31,439 | 17,727 | 21,156 | 154,816 | |||||||||||||||||||||
| Savings & money market deposits |
233,991 | 5,360 | 24,117 | 58,128 | 1,375 | 69,423 | 392,394 | |||||||||||||||||||||
| Time deposits |
7,224 | 24,616 | 75,652 | 78,887 | — | 19,828 | 206,207 | |||||||||||||||||||||
| Federal Home Loan Bank & other borrowed money |
— | — | — | 15,000 | — | 7,000 | 22,000 | |||||||||||||||||||||
|
|
|
|
|
|
|
|
|
|
|
|
|
|
|
|||||||||||||||
| Total interest-bearing liabilities |
$ | 305,015 | 33,738 | 116,701 | 183,454 | 19,102 | 117,407 | 775,417 | ||||||||||||||||||||
| Interest sensitivity gap |
||||||||||||||||||||||||||||
| Period gap |
$ | 240,808 | (10,804 | ) | (30,025 | ) | (7,940 | ) | 122,652 | (47,927 | ) | 266,764 | ||||||||||||||||
| Cumulative gap |
240,808 | 230,004 | 199,979 | 192,039 | 314,691 | 266,764 | ||||||||||||||||||||||
| Cumulative gap – Rate Sensitive Assets/Rate Sensitive Liabilities |
23.11 | % | 22.07 | 19.19 | 18.43 | 30.20 | 25.60 | |||||||||||||||||||||
| (1) | Includes mortgage loans held for sale |
We generally benefit from increasing market rates of interest when we have an asset-sensitive gap (a positive number) and generally benefit from decreasing market interest rates when we are liability-sensitive (a negative number). As shown in the table above, we are asset-sensitive on a cumulative basis throughout all time frames presented. The interest sensitivity analysis presents only a static view of the timing and repricing opportunities, without taking into consideration that changes in interest rates do not affect all assets and liabilities equally. For example, rates paid on a substantial portion of core deposits may change contractually within a relatively short time frame, but those are viewed by management as significantly less interest-sensitive than market-based rates such as those paid on non-core deposits. For this and other reasons, management relies more upon the simulation analysis (as noted above) in managing interest rate risk. Net interest income may be impacted by other significant factors in a given interest rate environment, including changes in the volume and mix of earning assets and interest-bearing liabilities.
Market Risk
Our earnings are dependent, to a large degree, on our net interest income, which is the difference between interest income earned on all earning assets, primarily loans and securities, and interest paid on all interest bearing-liabilities, primarily deposits. Market risk is the risk of loss from adverse changes in market prices and interest rates. Our market risk arises primarily from inherent interest rate risk in our lending, investing, and deposit gathering activities. We seek to reduce our exposure to market risk through actively monitoring and managing interest rate risk. Management relies upon static “gap” analysis to determine the degree of mismatch in
66
Table of Contents
Index to Financial Statements
the maturity and repricing distribution of interest-earning assets and interest-bearing liabilities which quantifies, to a large extent, the degree of market risk inherent in our balance sheet. Gap analysis is further augmented by simulation analysis to evaluate the impact of varying levels of prevailing interest rates and the sensitivity of specific earning assets and interest-bearing liabilities to changes in those prevailing rates. Simulation analysis consists of evaluating the impact on net interest income given changes from 400 basis points below the current prevailing rates to 400 basis points above the current prevailing rates. Management makes certain assumptions as to the effect that varying levels of interest rates have on certain earning assets and interest bearing-liabilities, which assumptions consider both historical experience and consensus estimates of outside sources.
The following table illustrates the results of our simulation analysis to determine the extent to which market risk would affect net interest margin for the next 12 months if prevailing interest rates increased or decreased by the specified amounts from current rates. As noted above, this model uses estimates and assumptions in asset and liability account rate reactions to changes in prevailing interest rates. However, to isolate the market risk inherent in the balance sheet, the model assumes that no growth in the balance sheet occurs during the projection period. This model also assumes an immediate and parallel shift in interest rates, which would result in no change in the shape or slope of the interest rate yield curve. Because of the inherent use of these estimates and assumptions in the simulation model to derive this market risk information, the actual results of the future impact of market risk on our net interest margin may (and most likely will) differ from that found in the table.
MARKET RISK
| Impact on Net Interest Income | ||||||||||||
| As of December 31, | ||||||||||||
| Change in prevailing interest rates |
2014 | 2013 | 2012 | |||||||||
| +400 basis points |
20.42 | % | 23.31 | % | 27.38 | % | ||||||
| +300 basis points |
15.10 | 17.13 | 19.79 | |||||||||
| +200 basis points |
9.54 | 10.61 | 12.28 | |||||||||
| +100 basis points |
4.21 | 4.55 | 5.33 | |||||||||
| 0 basis points |
— | — | — | |||||||||
| -100 basis points |
(1.23 | ) | (1.82 | ) | (0.10 | ) | ||||||
| -200 basis points |
(4.58 | ) | (7.33 | ) | (3.29 | ) | ||||||
| -300 basis points |
(6.83 | ) | (11.00 | ) | (6.31 | ) | ||||||
| -400 basis points |
(7.61 | ) | (12.38 | ) | (7.12 | ) | ||||||
Capital Resources
Total shareholders’ equity attributable to us at December 31, 2014 was $128.9 million, or 11.3% of total assets. At December 31, 2013, total shareholders’ equity attributable to us was $88.9 million, or 11.2% of total assets, compared to $85.9 million at December 31, 2012. The increase in shareholders’ equity for 2014 was attributable to the United acquisition, net income, and the sale of common stock. In connection with our expansion into the Vero Beach, Florida market area, we sold 163,485 shares of common stock at $18.35 per share in a private placement to accredited investors in the Vero Beach area in August 2014 and raised approximately $3.0 million.
The bank regulatory agencies have established risk-based capital requirements for banks. These guidelines are intended to provide an additional measure of a bank’s capital adequacy by assigning weighted levels of risk to asset categories. Banks are also required to systematically maintain capital against such “off-balance sheet” activities such as loans sold with recourse, loan commitments, guarantees, and standby letters of credit. These guidelines are intended to strengthen the quality of capital by increasing the emphasis on common equity and restricting the amount of loan loss reserves and other forms of equity, such as preferred stock, that may be included in capital. Certain items, such as goodwill and other intangible assets, are deducted from total capital in arriving at the various regulatory capital measures such as Tier 1 capital and total risk based capital. Our objective is to maintain our current status as a “well capitalized institution,” as that term is defined by the Banks’ regulators. As of December 31, 2014, NBC and ULB were “well capitalized” under the regulatory framework for prompt corrective action.
67
Table of Contents
Index to Financial Statements
Under the terms of the regulatory guidelines, banks must meet minimum capital adequacy based upon both total assets and risk-adjusted assets. All banks are required to maintain a minimum ratio of total capital to risk-weighted assets of 8%, a minimum ratio of Tier 1 capital to risk-weighted assets of 4%, and a minimum ratio of Tier 1 capital to average assets of 4% (leverage ratio). Adherence to these guidelines has not had an adverse impact on us.
The following table contains selected consolidated capital ratios at December 31, 2014, 2013, and 2012 for the Company and the Banks. ULB’s ratios are not presented as of December 31, 2013 and 2012, as it was not acquired until December 15, 2014.
CAPITAL ADEQUACY ANALYSIS
| (Dollars in thousands, except percentages) | Actual | For Capital Adequacy Purposes |
To Be Well Capitalized Under Prompt Corrective Action Provisions |
|||||||||||||||||||||
| As of December 31, 2014 | Amount | Ratio | Amount | Ratio | Amount | Ratio | ||||||||||||||||||
| Total Capital (to Risk Weighted Assets) |
||||||||||||||||||||||||
| NCC |
$ | 106,289 | 11.75 | % | $ | 72,367 | 8.00 | % | N/A | N/A | ||||||||||||||
| NBC |
$ | 84,148 | 11.42 | % | $ | 58,948 | 8.00 | % | $ | 73,685 | 10.00 | % | ||||||||||||
| ULB |
$ | 18,731 | 11.31 | % | $ | 13,249 | 8.00 | % | $ | 16,561 | 10.00 | % | ||||||||||||
| Tier I Capital (to Risk Weighted Assets) |
||||||||||||||||||||||||
| NCC |
$ | 96,487 | 10.66 | % | $ | 36,205 | 4.00 | % | N/A | N/A | ||||||||||||||
| NBC |
$ | 74,927 | 10.16 | % | $ | 29,499 | 4.00 | % | $ | 44,248 | 6.00 | % | ||||||||||||
| ULB |
$ | 18,731 | 11.31 | % | $ | 6,625 | 4.00 | % | $ | 9,937 | 6.00 | % | ||||||||||||
| Tier I Capital (to Average Assets) |
||||||||||||||||||||||||
| NCC |
$ | 96,487 | 10.68 | % | $ | 36,137 | 4.00 | % | N/A | N/A | ||||||||||||||
| NBC |
$ | 74,927 | 8.57 | % | $ | 34,972 | 4.00 | % | $ | 43,715 | 5.00 | % | ||||||||||||
| ULB |
$ | 18,731 | 8.60 | % | $ | 8,712 | 4.00 | % | $ | 10,890 | 5.00 | % | ||||||||||||
| As of December 31, 2013 |
||||||||||||||||||||||||
| Total Capital (to Risk Weighted Assets) |
||||||||||||||||||||||||
| NCC |
$ | 92,718 | 15.83 | % | $ | 46,847 | 8.00 | % | N/A | N/A | ||||||||||||||
| NBC |
$ | 91,918 | 15.71 | % | $ | 46,803 | 8.00 | % | $ | 58,504 | 10.00 | % | ||||||||||||
| Tier I Capital (to Risk Weighted Assets) |
||||||||||||||||||||||||
| NCC |
$ | 85,376 | 14.58 | % | $ | 23,423 | 4.00 | % | N/A | N/A | ||||||||||||||
| NBC |
$ | 84,583 | 14.46 | % | $ | 23,402 | 4.00 | % | $ | 35,103 | 6.00 | % | ||||||||||||
| Tier I Capital (to Average Assets) |
||||||||||||||||||||||||
| NCC |
$ | 85,376 | 12.18 | % | $ | 28,043 | 4.00 | % | N/A | N/A | ||||||||||||||
| NBC |
$ | 84,583 | 12.07 | % | $ | 28,042 | 4.00 | % | $ | 35,053 | 5.00 | % | ||||||||||||
| As of December 31, 2012 | ||||||||||||||||||||||||
| Total Capital (to Risk Weighted Assets) |
||||||||||||||||||||||||
| NCC |
$ | 83,830 | 18.86 | % | $ | 35,559 | 8.00 | % | N/A | N/A | ||||||||||||||
| NBC |
$ | 82,881 | 18.65 | % | $ | 35,552 | 8.00 | % | $ | 44,440 | 10.00 | % | ||||||||||||
| Tier I Capital (to Risk Weighted Assets) |
||||||||||||||||||||||||
| NCC |
$ | 78,219 | 17.60 | % | $ | 17,780 | 4.00 | % | N/A | N/A | ||||||||||||||
| NBC |
$ | 77,270 | 17.38 | % | $ | 17,784 | 4.00 | % | $ | 26,675 | 6.00 | % | ||||||||||||
| Tier I Capital (to Average Assets) |
||||||||||||||||||||||||
| NCC |
$ | 78,219 | 12.42 | % | $ | 25,187 | 4.00 | % | N/A | N/A | ||||||||||||||
| NBC |
$ | 77,270 | 12.27 | % | $ | 25,190 | 4.00 | % | $ | 31,487 | 5.00 | % | ||||||||||||
68
Table of Contents
Index to Financial Statements
The Company’s capital ratios and those of the Banks at December 31, 2014 have declined from year-end 2013 and 2012 due to growth in loans and assets and due to the $16.2 million in cash consideration paid in the CBI acquisition. Despite the reduction, the ratios remain above the levels for the Company and the Banks to be deemed well-capitalized.
In July 2013, the federal bank regulatory agencies issued a final rule that will revise their risk-based capital requirements and the method for calculating components of capital and of computing risk-weighted assets to make them consistent with agreements that were reached by the Basel Committee on Banking Supervision and certain provisions of the Dodd-Frank Act. The final rule applies to all depository institutions, top-tier bank holding companies with total consolidated assets of $500 million or more, and top-tier savings and loan holding companies. The rule establishes a new common equity Tier 1 minimum capital requirement, increases the minimum capital ratios, and assigns a higher risk weight to certain assets based on the risk associated with these assets. The final rule includes transition periods that generally implement the new regulations over a five-year period. These changes will be phased in beginning in January 2015. While management continues to evaluate this final rule and its potential impact, preliminary assessments indicate that the Banks and the Company will continue to exceed all regulatory capital requirements under the new rule.
Banking regulations limit the amount of dividends that a bank may pay without approval of the regulatory authorities. These restrictions are based on the bank’s level of regulatory classified assets, prior years’ net earnings and ratio of equity capital to assets. Because NBC and ULB currently have negative retained earnings, they are prohibited from paying a dividend without prior regulatory approval. As of December 31, 2014, NBC had negative retained earnings of $2.2 million. Management anticipates that, at the current earnings rate, the negative retained earnings will be eliminated by June 2015. The merger of ULB into NBC will have no impact on the negative retained earnings of NBC. This merger will be treated as a pooling-of-interests.
69
Table of Contents
Index to Financial Statements
Overview
We are a bank holding company headquartered in Birmingham, Alabama. We operate two subsidiary banks – NBC and ULB. We intend to consolidate ULB with NBC in February 2015, although each of the ULB banking offices will continue to operate as “United Legacy Bank, a division of National Bank of Commerce.”
Through our Banks, we provide a broad array of financial services to businesses, business owners, and professionals through eight full-service banking offices in Alabama (Birmingham, Huntsville, Auburn-Opelika, and Baldwin County) and seven full-service banking offices in Central Florida (Longwood, Winter Park, Orlando, Oviedo, Kissimmee, and Vero Beach). We also own a 70% equity interest in CBI, which owns Corporate Billing, a transaction-based finance company headquartered in Decatur, Alabama, that provides factoring, invoicing, collection, and accounts receivable management services to transportation companies and automotive parts and service providers throughout the United States and parts of Canada. As of December 31, 2014, we had total assets of $1.14 billion, total loans of $888.7 million, total deposits of $971.1 million, and total shareholders’ equity of $136.2 million.
Our senior management team began working together in the early 1990s for a previous bank, which ultimately grew to become ALAB, a bank holding company that operated banks in Alabama, Florida and Georgia. The team grew the total assets of that institution from approximately $800 million in 1995 to assets of approximately $8.0 billion in 2007 and grew its market capitalization to approximately $1.1 billion in the same time period. This growth was achieved through a combination of organic growth and the acquisition of 14 banks, four bank branches and four non-bank financial service businesses. In February 2008, ALAB was acquired by Royal Bank of Canada for $1.6 billion.
In addition to our senior management team, a number of our employees have many years of experience working together dating back to the early 1990s. With the exception of the greater Orlando market, in which we established a presence through our December 2014 acquisition of United, our markets are led by a market president who held the same role in those markets for ALAB. Our mortgage division is also led by a former ALAB employee. Many members of our accounting, information technology, risk, and operations teams also include leaders who held similar roles at ALAB, including our Executive Vice President of Bank Operations, Chief Risk Management Officer, Chief Accounting Officer, Senior Lender, Chief Technology Officer, and Human Resources Director.
Our Management Philosophy
Our management’s extensive tenure working together has led to the development of several core operating beliefs that infuse our Company and guide our strategy. These philosophies have guided our management for over 20 years, and we believe that they are critical to our success.
| • | Managers should think from an owner’s perspective. The members of our board of directors and senior management team have a significant ownership stake in the Company, beneficially owning 31.1% of our outstanding common stock as of February 25, 2015. We use compensation structures for our market presidents designed to motivate them as owners. We use the term “shareowners” rather than the more commonly used “shareholders” or “stockholders” to describe the holders of our shares, including our managers, as we view them all as fellow owners of the Company. |
| • | Creation of long-term shareowner value is our primary purpose. While we care about how much we earn for our shareowners every month, quarter, and year, we care less about next quarter’s earnings per share than we do about next year’s earnings per share, and we care less about next year’s earnings per share than we do about our earnings per share in three or five years. We believe that decisions focused on long-term results will be more effective in creating shareowner value, and we view the maximization of long-term shareowner value as our primary purpose. |
| • | Superior credit quality and risk management practices and a strong and effective control environment will increase shareowner value. We are dedicated to maintaining strong credit risk management without sacrificing growth. When problem credits occur, we operate under the belief that decisive corrective action should be taken. This means addressing problems quickly when they arise in |
70
Table of Contents
Index to Financial Statements
| order to return a problem credit to current status with a high likelihood of future timely payments, or, alternatively, to liquidate the account. By assessing problems realistically and implementing decisive remedial action, we believe that we can lessen our losses and maintain our primary focus on growing our business and delivering value for our shareowners. |
| • | We intend to achieve strong growth through our operating structure, our teams, and the markets that we serve. Organic growth and acquisitive growth are equally important for our future outlook. We seek to maintain growth rates above the industry average by combining our core values and long-term focus with an emphasis on expanding our scale through organic growth and acquisitions of high-quality community banks with proven management teams that embrace our management philosophy. |
| • | A distributed decision-making process is superior to a centralized one. We believe that managers located and operating in their banking markets create a more responsive, customer-driven company. We provide systems, credit policies, audit and compliance controls, and product offerings to the market presidents and their teams, and management’s job is to support them in achieving success within their markets. |
| • | A culture of candor – both with ourselves and with others – encourages collective accountability and collaboration. We encourage openness and transparency in all aspects of our business. We expect this candor to manifest itself in many ways, including in building successful banking relationships with new customers and maintaining and expanding relationships with existing customers, the timely recognition of problems, the realistic assessment of asset and collateral values, and open and honest communication internally, as well as with our regulators, investors, and analysts. |
| • | We have instilled a leadership culture with an appropriate sense of humility. We are not immune from making mistakes, and we are more likely to recognize and learn from our missteps if we maintain a sense of humility. This environment creates an attractive place of employment for our current team and potential new team members. We also believe that developing a culture in which mistakes are recognized, acknowledged, and addressed promotes ethical business practices and can help prevent mistakes from escalating into crises. |
Our Board of Directors and Management Team
Our directors bring many years of experience in executive management and board membership of other companies. Our directors have a broad range of experience across many industries, including manufacturing, distribution, accounting, insurance, law, real estate, engineering, and government contracting, which include the industries of some of our largest customers. In addition, five of our non-executive directors have experience as directors; having formerly served as directors of ALAB or its banking subsidiaries operating in our current markets, and four of those non-executive directors have experience as directors of a publicly traded banking institution.
Our senior management team has worked together for many years and has extensive experience in the commercial banking industry in the markets in which we currently operate. Certain biographical information for our senior executives is as follows:
John H. Holcomb, III – Chairman and Chief Executive Officer of NCC and Chairman of NBC. John has 37 years of commercial banking experience, focused on the markets in which we currently operate, and has served as our Chairman and Chief Executive Officer since October 2010. He previously served as Chairman and Chief Executive Officer of ALAB from 1996 until its sale in 2008. He subsequently served as Vice Chairman of RBC Bank (USA) until June 2009. John is a graduate of Furman University.
Richard Murray, IV – President and Chief Operating Officer of NCC and President and Chief Executive Officer of NBC. Richard has 29 years of commercial banking experience in the markets in which we currently operate and has served as our President and Chief Operating Officer since October 2010. He previously held senior positions at ALAB, where he served as President and Chief Operating Officer from 2000 until its sale in 2008. He then served as President of the Alabama and Florida markets for RBC Bank (USA) until June 2009. Richard is a Vanderbilt graduate and holds an MBA from Samford University.
71
Table of Contents
Index to Financial Statements
William E. Matthews, V – Vice Chairman and Chief Financial Officer of NCC and NBC. Will has 24 years of experience in banking and finance. Will served as ALAB’s Chief Financial Officer from 1998 until its sale in 2008, and he held the same title at RBC Bank (USA) until March 2009. Will then entered the private equity industry, serving as a partner at New Capital Partners. He became an outside member of our board of directors in October 2010 and became our Chief Financial Officer in November 2011. Will graduated from Princeton University and earned an MBA from the Wharton School of the University of Pennsylvania.
The bank managers serving as our market presidents have extensive experience in the banking industry in the markets in which we currently operate. With the exception of Mr. Powers, these managers have worked with our senior management team for many years and were previously employed in comparable roles at ALAB. We believe that these market presidents are important to our success, as their banking experience within their markets, their involvement in their communities, and their relationships with customers make us more likely to be successful in our community banking model.
Biographical information regarding our market presidents is set forth below. With the exception of Mr. Aland, our market presidents are not executive officers. For additional information regarding our executive officers, please refer to “Management – Directors and Executive Officers.”
Robert B. Aland, Birmingham Market President. Robert has served as Birmingham Market President of NBC since October 2010. Robert previously served as Birmingham Market President of RBC Bank (USA) from February 2008 until June 2009, and as Birmingham Market President of First American Bank, ALAB’s largest subsidiary bank, from 2005 until February 2008. Robert is 52 and has been a banker for approximately 25 years.
P. Andrew Beindorf, Vero Beach Market President. Andy was the President and Chief Executive Officer of ALAB’s Indian River National Bank in Vero Beach, Florida from 2001 until 2008, followed by service as Market President for RBC Bank (USA) in the Vero Beach area from February 2008 through 2009. From 2010 until the time that he rejoined us as Vero Beach Market President in 2014, Andy served as Executive Vice President and Regional President for CenterState Bank of Florida. Andy is 58 and has been a banker for approximately 36 years.
Eric L. Canada, Auburn-Opelika Market President. Eric served as Market President, including as Auburn-Opelika (Lee County) Market President, for AmSouth Bank before joining ALAB’s First American Bank in 2001, where he again served the Auburn-Opelika area as Market President for First American Bank and, subsequently, for RBC Bank (USA) until 2009. He joined us as Auburn-Opelika Market President in October 2010. Eric is 55 and has been a banker for approximately 30 years.
David G. Powers, President and Chief Executive Officer of ULB. Dave has served as President and Chief Executive Officer of ULB since 2010 and served as President and Chief Executive Officer of United from 2010 until we acquired United on December 15, 2014. Dave is 58 and has over 30 years of experience as a banker in the Orlando metropolitan area.
W. Evans Quinlivan, Huntsville Market President. Evans served as Huntsville Market President for ALAB’s First American Bank from 2000 until 2008, at which point he assumed the same role for RBC Bank (USA) until June 2009. He joined us as Huntsville Market President in October 2010. Evans is 52 and has been a banker for approximately 30 years.
Robert M. Seaborn, Jr., Baldwin County Market President. Robert has more than 30 years of experience as a commercial banker. Prior to joining us in October 2010, Robert was President of ALAB’s First Gulf Bank from 1996 until 2008 and subsequently served as Market President of the Gulf Coast Region for RBC Bank (USA) until July 2009. He is 56.
Our History
We were originally incorporated in November 2006 as Americus, which was a one-bank holding company for Red Mountain Bank, a national banking association that commenced operations in Birmingham, Alabama on June 21, 2004. Americus became the holding company for Red Mountain Bank on March 15, 2007 by means of a share exchange with all Red Mountain Bank shareholders. In March 2009, the OCC placed Red Mountain Bank under a formal agreement addressing, among other things, deficiencies in its lending practices and asset quality.
72
Table of Contents
Index to Financial Statements
On October 29, 2010, CIG, a Delaware limited liability company led by members of our senior management team, acquired control of Americus by acquiring newly issued voting shares of Americus for $58 million. This resulted in CIG acquiring a 67.5% ownership stake and a controlling interest in Americus. Following this change of control, Americus reconstituted the board of directors with eight new directors and two continuing directors, installed our current management team, changed Red Mountain Bank’s name to National Bank of Commerce, and subsequently changed Americus’s name to National Commerce Corporation. On December 31, 2014, CIG distributed all of its shares of our common stock to its members on a pro rata basis and subsequently deregistered as a bank holding company.
Following the change of control and the appointment of our senior management team, NBC entered three additional markets in Alabama: Madison County (Huntsville), Baldwin County, and Auburn-Opelika, which were each led by former ALAB employees. In March 2012, the OCC terminated the formal agreement with NBC because NBC’s operations had returned to a sufficiently safe and sound condition. NBC subsequently opened branches in Gulf Shores and Madison, Alabama in July 2012 and March 2013, respectively. NBC opened a loan production office in Vero Beach, Florida in April 2014, which it converted into a full-service banking office in November 2014.
In August 2014, we acquired a 70% equity interest in CBI, which owns Corporate Billing. Corporate Billing began in 1995 as a subsidiary of First American Bank, ALAB’s largest subsidiary bank, and the management team of Corporate Billing worked with our current senior management team during their time at ALAB. We have an option to purchase the remaining 30% equity interest in CBI for a price based on a multiple of CBI’s earnings, which becomes exercisable on August 29, 2019 and expires on August 29, 2022. James R. (“Skip”) Thompson, Corporate Billing’s Chief Executive Officer, was formerly the Chief Executive Officer of First American Bank for approximately 10 years. After the 2008 sale of ALAB, RBC Bank (USA) subsequently sold Corporate Billing to a group led by Mr. Thompson, former ALAB director Britt Sexton, and a third individual, who collectively own Factor, which holds the remaining 30% equity interest in CBI.
In December 2014, we completed the acquisition of United, a one-bank holding company. Its bank subsidiary, ULB, is a Florida state-chartered commercial bank with five banking offices located in three counties in the Orlando, Florida metropolitan area. United is led by its Chief Executive Officer, Dave Powers, who has over 30 years of experience as a banker in the Orlando metropolitan area. He and his senior management team have a deep history of operating banks in the Central Florida markets. We have contractually retained nine key employees, including the entire senior management team. Consistent with our philosophy, United maintains a focus on delivering a relationship-driven banking experience and maintenance of a strong credit culture. We believe the acquisition of United is consistent with our focus on seeking acquisitions of high-quality community banks with proven management teams that complement our philosophy.
Our Growth and Performance
When our senior management team assumed the leadership of Americus in late October 2010, they inherited an institution operating under a formal agreement with the OCC. Following the change in control, our immediate efforts were to stabilize the organization, lessen its risk profile, restructure its balance sheet, resolve all regulatory issues, terminate the formal agreement with the OCC, and implement an operating strategy to promote sustainable and prudent growth. Throughout this process, management focused on pursuing transactions and initiatives to maximize the opportunities for growth over the long-term. For example, we converted to a new data processor in the fourth quarter of 2012, incurring a charge of nearly $1.1 million in order to position NBC for future expansion and to develop a platform for increased scale in the coming years.
From December 31, 2010 to December 31, 2014, we have grown total assets from $375 million to $1.14 billion, total loans from $210 million to $888.7 million, and total deposits from $271 million to $971.1 million. Over that period, total assets, loans, and deposits grew at annualized rates of 32%, 43%, and 38%, while asset quality ratios improved significantly. The addition of Corporate Billing in the third quarter of 2014 contributed to a 51% increase in total loans from June 30, 2014 to December 31, 2014. In December 2014 we completed the acquisition of United, which, on September 30, 2014, had total assets of $232 million, total loans of $156 million, and total deposits of $198 million.
73
Table of Contents
Index to Financial Statements
We have seen increases in loan growth particularly in our Birmingham, Huntsville, Auburn-Opelika, and Baldwin County markets. According to data made available as of each June 30 by the FDIC, deposits grew by 89% in Auburn-Opelika from June 30, 2013 to June 30, 2014. In the same time period, deposits grew by 8% in Birmingham, 54% in Huntsville, and 25% in Baldwin County.
The table below illustrates our total assets, loans and deposits, as well as our compound annualized growth rate, from December 31, 2010, shortly after CIG acquired control and installed our senior management team, to December 31, 2014, which is reflected on a pro forma basis to give effect to our acquisition of United as though it had been completed on such date.
| (Dollars in millions) |
2010 | 2011 | 2012 | 2013 | 2014 | CAGR | ||||||||||||||||||
| Total Assets |
$ | 375 | $ | 426 | $ | 693 | $ | 792 | $ | 1,138 | 32 | % | ||||||||||||
| Total Loans |
$ | 210 | $ | 300 | $ | 441 | $ | 582 | $ | 889 | 43 | % | ||||||||||||
| Total Deposits |
$ | 271 | $ | 325 | $ | 580 | $ | 678 | $ | 971 | 38 | % | ||||||||||||
Our profitability also has increased significantly, moving from a sizable loss in 2010 to a profit of $5.4 million for the year ended December 31, 2014, which reflects an annualized return on average assets of 0.66% for this period. With the addition of CBI, our net interest margin increased from 3.30% for the three months ended June 30, 2014 to 4.56% for the three months ended December 31, 2014.
Our post-2010 growth has coincided with a significant improvement in asset quality ratios. Our non-performing assets declined from $13.4 million as of December 31, 2010, or 3.58% of total assets, to $6.2 million as of December 31, 2014, or 0.55% of total assets. Since December 31, 2010, non-performing assets to loans plus other real estate declined from 6.29% to 0.69% at December 31, 2014.
Market Areas and Growth Strategy
We currently conduct our banking operations through our Banks’ 15 banking locations. We plan to merge ULB into NBC on or about February 28, 2015, although each of the ULB banking offices will operate as “United Legacy Bank, a division of National Bank of Commerce” for some period of time after the bank merger. According to 2014 data from the U.S. Census Bureau, the projected population growth in our markets from 2014 to 2019 is expected to be 4.52%, versus a U.S. average of 3.50%. In addition, approximately 93% of our deposits are in MSAs.
74
Table of Contents
Index to Financial Statements
We currently operate in attractive markets throughout Alabama and Central Florida. Our markets have many economic drivers, including automotive and manufacturing, healthcare services and military and defense. Redstone Arsenal, home to the U.S. Army Material Command, the Missile Defense Agency of the U.S. Department of Defense, and NASA’s Marshall Space Flight Center, as well as the HudsonAlpha Institute for Biotechnology, a public/private nonprofit research center focused on genomic research that houses 26 companies and more than 400 scientists, researchers and entrepreneurs are both located in our Huntsville market. Huntsville also has the highest concentration of engineers in the United States. Many companies are moving operations to or expanding current operations in the Huntsville market, including Remington Outdoor Company, Polaris, Boeing and General Electric. Orlando is the secondfastest growing metro area in the United States. The University of Alabama at Birmingham is ranked number 21 in the United States in funding from the National Health Institute.
| Metropolitan Statistical Area |
Total Population 2014 (Actual) |
Population Change 2010-2014 (%) |
Projected Population Change 2014-2019 (%) |
Median Household Income 2014 ($) |
Projected Household Income Change 2014-2019 (%) |
Unemployment (%) |
||||||||||||||||||
| Birmingham-Hoover, AL |
1,142,042 | 1.24 | 1.71 | 46,029 | 1.43 | 4.8 | ||||||||||||||||||
| Huntsville, AL |
439,012 | 5.13 | 5.07 | 55,834 | 9.27 | 4.8 | ||||||||||||||||||
| Daphne-Fairhope-Foley (Micro), AL |
196,491 | 7.81 | 7.27 | 54,973 | 13.67 | 5.0 | ||||||||||||||||||
| Auburn-Opelika, AL |
152,270 | 8.57 | 7.95 | 41,226 | 4.22 | 4.2 | ||||||||||||||||||
| Orlando-Kissimmee-Sanford FL |
2,277,414 | 6.70 | 7.48 | 45,240 | (2.97 | ) | 5.3 | |||||||||||||||||
| Sebastian-Vero Beach, FL |
142,896 | 3.53 | 4.93 | 38,846 | (10.10 | ) | 6.5 | |||||||||||||||||
| Alabama |
4,847,067 | 1.41 | 1.79 | 42,869 | 4.55 | 6.0 | ||||||||||||||||||
| Florida |
19,654,457 | 4.54 | 5.74 | 44,318 | (0.49 | ) | 5.8 | |||||||||||||||||
| United States |
317,199,353 | 2.74 | 3.50 | 51,579 | 4.58 | 5.5 | ||||||||||||||||||
|
|
|
|
|
|
|
|||||||||||||||||||
| NCC Markets Weighted Average |
4.23 | 4.52 | 2.99 | |||||||||||||||||||||
| * | Unemployment data as of November 2014 |
Source: SNL Financial, Bureau of Labor Statistics
The following table presents our deposits as of December 31, 2013 and December 31, 2014, as well as the percentage growth year-over-year.
| Metropolitan Statistical Area |
NCC Deposits 12/31/2013 ($000) |
NCC Deposits 12/31/2014 ($000) |
NCC Y-o-Y Deposit Growth ‘13 - ‘14 (%) |
|||||||||
| Birmingham-Hoover, AL |
$ | 408,224 | 421,749 | 3.31 | % | |||||||
| Huntsville, AL |
176,381 | 205,280 | 16.38 | |||||||||
| Orlando-Kissimmee-Sanford, FL (1) |
182,118 | 196,924 | 8.13 | |||||||||
| Daphne-Fairhope-Foley, AL |
59,397 | 70,820 | 19.23 | |||||||||
| Auburn-Opelika, AL |
34,029 | 66,728 | 96.09 | |||||||||
| Sebastian-Vero Beach, FL |
— | 9,559 | — | |||||||||
| (1) | The Orlando-Kissimmee-Sanford, FL totals for 12/31/13 represent United deposits and, therefore, are not included in NCC’s deposits at 12/31/13. |
In addition to our banking operations, we conduct our factoring business through one office in Decatur, Alabama, with clients located throughout the United States and parts of Canada. Technology allows us to service a national client base in this business, with sales representatives traveling to meet existing and potential clients in their places of business.
We intend to continue to expand organically where possible by growing our Banks in their respective market areas and nearby attractive markets through “de novo” branch expansions when we can find a team
75
Table of Contents
Index to Financial Statements
justifying such expansion. Our decentralized community banking strategy allows our Banks to compete effectively with our larger competitors by providing superior customer service with localized decision making capabilities, resulting in greater responsiveness.
In addition to our strategy of pursuing organic growth, we intend to pursue expansion into attractive, higher growth markets in Florida, Alabama, and potentially other southeastern states through acquisitions of community banks and subsequent growth in those markets. Our team has extensive experience finding community bank partners, negotiating transactions, and merging and integrating new banks by implementing our management control structure in a manner that allows our new partners to grow within our acceptable risk parameters. We focus our acquisition strategy on high-quality community banks with proven management teams that view us as a partner, rather than an exit strategy. Typically, our strategy is to maintain the management team of each acquired bank, allowing it to retain its local entrepreneurial identity and decision making, while simultaneously creating efficiencies in the administrative and back office operations of the bank. We also prefer to retain the involvement of local directors by creating a local advisory board after entering a new market.
We intend to achieve our primary goal of maximizing long-term shareowner value by focusing on the following objectives:
| • | Continue growing within our existing markets; |
| • | Continue the expansion of Corporate Billing to achieve appropriate risk-adjusted returns; |
| • | Enter into high growth, metropolitan markets in Florida, Alabama, and potentially other markets in the southeastern U.S. where we have an opportunity for growth; |
| • | Focus on commercial and professional customers in our existing markets with the goal of providing superior customer service and maintaining strong asset quality; |
| • | Promote local decision making and accountability in our market areas, with appropriate control structures and a culture of ownership; |
| • | Enhance our products and services opportunistically, ensuring we are adding value to customers and providing an appropriate return on shareowners’ capital over time; and |
| • | Ensure management’s interests are aligned with those of shareowners. |
Our Products and Services
Through our Banks, we engage in the business of banking, which consists primarily of accepting deposits from the public and making loans and other investments. Through CBI, we provide factoring, invoicing, collection, and accounts receivable management services to transportation companies and automotive parts and service providers throughout the United States and parts of Canada. Our principal sources of funds for loans and investments at our Banks are demand, time, savings, and other deposits (including negotiable orders of withdrawal, or NOW accounts) and the amortization and prepayments of loans and investments. Our principal sources of income are interest and fees collected on loans, interest collected on other investments, fees earned from the origination and sale of residential mortgage loans, and service charges, as well as income from factored receivables through CBI. Our principal expenses are interest paid on savings and other deposits (including NOW accounts), interest paid on other borrowings, employee compensation, office expenses, and other overhead expenses.
76
Table of Contents
Index to Financial Statements
Deposits
Our principal sources of funds are core deposits, including demand deposits, interest-bearing transaction accounts, money market accounts, savings deposits, and certificates of deposit. As of December 31, 2014, our deposit composition was as follows:
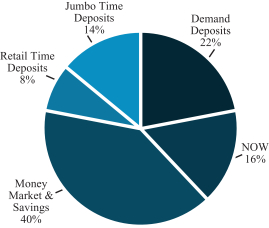
Transaction accounts include checking and NOW accounts, which customers use for cash management and which provide us with a source of fee income, as well as a low-cost source of funds. Time and savings accounts also provide a relatively stable and low-cost source of funding. Our largest source of funds is money market accounts. Certificates of deposit in excess of $100,000 are held primarily by customers in our market areas. We utilize brokered certificates of deposit to supplement our market funding sources when funding needs or pricing warrant the use of wholesale funding.
Deposit rates are reviewed weekly by senior management. Management believes that the rates that we offer are competitive with those offered by other institutions in our market areas. We also focus on customer service to attract and retain deposits.
Lending
We offer a range of lending services, including real estate, consumer, and commercial loans, to individuals, small businesses, and other organizations located in or conducting a substantial portion of their business in our market areas. Our total loans, net of unearned income, at December 31, 2014, were approximately $888.7 million, or approximately 84.8% of total earning assets. The interest rates charged on loans vary with the degree of risk, maturity, and amount of the loan and are further subject to competitive pressures, money market rates, availability of funds, and government regulations.
77
Table of Contents
Index to Financial Statements
As of December 31, 2014, our loan portfolio composition was classified as follows:
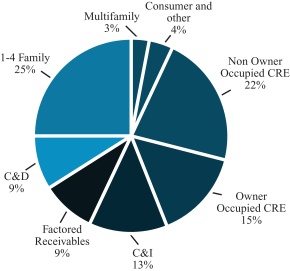
Real Estate Loans. Loans secured by real estate are the primary component of our loan portfolio, constituting approximately $660.9 million, or 74.3% of total loans, net of unearned income, at December 31, 2014. We originate consumer and commercial loans for the purpose of acquiring real estate that are secured by such real estate (CRE). We also often take real estate as an additional source of collateral to secure commercial and industrial (C&I) loans. Such loans are classified as real estate loans rather than commercial and industrial loans if the real estate collateral is considered significant as a secondary source of repayment for the loan. Loans are typically made on a recourse basis supported by financial statements and a review of the repayment ability of the borrower(s) and/or guarantor(s). Origination fees are charged for many loans secured by real estate.
Real estate lending activities consist of the following:
| • | Commercial real estate term loans accrue at either variable or fixed rates. The variable rates approximate current market rates. Amortizations are typically no more than 25 years. |
| • | The primary type of residential mortgage loan is the single-family first mortgage, typically structured with fixed or adjustable interest rates, based on market conditions. These loans usually have fixed rates for up to 5 years, with maturities of 15 to 30 years. We also originate home equity lines of credit secured by residential property. These loans are typically made on a variable-rate basis with maturities up to 10 years. |
| • | Construction and land development (C&D) loans are typically made on a variable-rate basis. Loan terms usually do not exceed 24 months. |
We originate residential loans for sale into the secondary market. These loans are made in accordance with underwriting standards set by the purchaser of the loan, normally as to loan-to-value ratio, interest rate, borrower qualification, and documentation. These loans are generally made under a commitment to purchase from a loan purchaser. We generally collect from the borrower or purchaser a combination of the origination fee, discount points, and/or a service release fee.
Commercial and Industrial Loans. We make loans for commercial purposes in various lines of business. These loans are typically made on terms up to 5 years at fixed or variable rates. The loans are secured by various types of collateral, including accounts receivable, inventory, or, in the case of equipment loans, the financed equipment. We attempt to reduce our credit risk on commercial loans by underwriting the loan based on the borrower’s cash flow and its ability to service the debt from earnings, and by limiting the loan-to-value ratio. Historically, we have typically loaned up to 80% on loans secured by accounts receivable, up to 50% on loans secured by inventory (which are typically also secured by accounts receivable), and up to 100% on loans secured
78
Table of Contents
Index to Financial Statements
by equipment. We also make some unsecured commercial loans. Commercial and industrial loans constituted $113.8 million, or 12.8% of our loan portfolio, at December 31, 2014. Interest rates are negotiable based upon the borrower’s financial condition, credit history, management stability and collateral.
Consumer Loans. Consumer lending includes installment lending to individuals in our market areas and generally consists of loans to purchase automobiles and other consumer durable goods. Consumer loans constituted $14.0 million, or 1.6% of our loan portfolio, at December 31, 2014. Consumer loans are underwritten based on the borrower’s income, current debt level, past credit history and collateral. Consumer rates are both variable and fixed, with terms negotiable. Terms generally range from one to five years depending on the nature and condition of the collateral. Periodic amortization, generally monthly, is typically required.
Loan Approval. Certain credit risks are inherent in making loans. These include repayment risks, risks resulting from uncertainties in the future value of collateral, risks resulting from changes in economic and industry conditions, and risks inherent in dealing with individual borrowers. In particular, longer maturities increase the risk that economic conditions will change and adversely affect collectability.
We attempt to minimize loan losses through various means and the use of standardized underwriting criteria. We have established a standardized loan policy that may be modified based on local market conditions. In particular, on larger credits, we generally rely on the cash flow of a debtor as the source of repayment and secondarily on the value of the underlying collateral. In addition, we attempt to utilize shorter loan terms in order to reduce the risk of a decline in the value of such collateral.
We address repayment risks by adhering to internal credit policies and procedures. These policies and procedures include officer and customer lending limits, a loan committee approval process for larger loans, documentation examination, and follow-up procedures for loan review and any exceptions to credit policies. The point in the loan approval process at which a loan is approved depends on the size of the borrower’s credit relationship with the bank and the loan authority of the lending officer to whom the loan request is made. Each of our lending officers has the authority to approve loans up to an approved loan authority amount, as approved by the bank’s board of directors. Loans in excess of the highest loan authority amount of a particular lending officer must be approved by the bank’s loan committee, or another officer with sufficient loan authority to approve the request.
Risk Ratings. Loan officers are directly responsible for monitoring the risk in their respective portfolios. On commercial loans, risk grades are assigned by the loan officer for the probability of default following analysis of borrower characteristics and external economic factors. However, on consumer loans, risk grades are determined by a borrower’s credit score and personal debt ratio, as well as the borrower’s repayment history with the bank.
Recent Loan Examples
Commercial Real Estate – Multi-Tenant Office Building. NBC extended a loan in the amount of $2.4 million priced at a fixed rate for a 60-month term with a 180-month amortization. The loan has 70% loan-to-value ratio and is secured by a building with 90% occupancy. NBC also has a substantial deposit relationship with the borrower.
Private and Professional Banking – Dermatology Lab. NBC has a relationship with a dermatology lab in one of its metro markets that includes a line of credit priced at a floating rate over LlBOR. The relationship includes over $4.0 million in total loans as well as a significant amount of deposits held at NBC.
Commercial and Industrial – Trailer Manufacturer and Distributor. NBC has a relationship with a business that manufactures and distributes utility trailers and accessories to large-scale retailers. The relationship includes over $3.0 million in owner-occupied building loans priced at a floating rate over LIBOR. The loan-to-value ratio on this property is less than 65%. The borrower also holds a significant amount of deposits at NBC.
Government Contractor – Army and Department of Defense. NBC has a relationship with a government contractor that does business through several large prime contractors focusing on Army and National Guard outsourced contracts. The company maintains a $3.0 million line of credit with NBC with a floating interest rate over LIBOR. The relationship also includes a $3.4 million commercial real estate loan that is majority owner-occupied. There is a significant deposit relationship with the borrower.
79
Table of Contents
Index to Financial Statements
Factoring
Since August 29, 2014, NBC has owned a 70% interest in CBI, the holding company of Corporate Billing. Corporate Billing is a transaction-based finance company engaged in the purchase of accounts receivable at a discount from businesses throughout the United States and parts of Canada, a transaction traditionally known as “factoring.” In a typical factoring transaction, Corporate Billing purchases all of the rights associated with the account receivable and assumes the billing and collection responsibilities. Corporate Billing may purchase a receivable with or without recourse. If an account is purchased without recourse, Corporate Billing bears the loss if the account debtor does not pay the invoice amount. If the receivable is purchased with recourse, however, Corporate Billing has the right to collect the unpaid invoice amount from the seller of the receivable if the account debtor does not pay. Corporate Billing engages in both recourse and non-recourse purchases, with its recourse operations focused primarily in the transportation industry, and its non-recourse operations focused primarily in the automotive dealer and distributor industries. As an operating subsidiary of NBC, Corporate Billing is regulated by the OCC.
The following table sets forth certain information with respect to CBI’s operations for each of the years ended December 31, 2014, 2013, 2012 and 2011:
|
|
||||||||||||||||
| Twelve Months Ended | ||||||||||||||||
| (Dollars in thousands) |
December 31, 2014 |
December 31, 2013 |
December 31, 2012 |
December 31, 2011 |
||||||||||||
| Recourse purchased volume |
389,468 | $ | 295,608 | $ | 286,967 | $ | 272,108 | |||||||||
| Non-recourse purchased volume |
355,902 | 317,485 | 228,652 | 209,632 | ||||||||||||
| Total purchased volume |
745,370 | 613,093 | 515,619 | 481,739 | ||||||||||||
| Average turn dates |
37.74 | 38.82 | 39.57 | 36.87 | ||||||||||||
| Net charge-offs / total purchased volume |
0.04 | % | 0.09 | % | 0.05 | % | 0.05 | % | ||||||||
| Average discount rate |
1.66 | 1.62 | 1.70 | 1.70 | ||||||||||||
Electronic Banking
We offer electronic banking services to our customers, including commercial and retail online banking, automated bill payment, mobile banking, and remote deposit capture for certain customers.
Competition
The financial services industry is highly competitive. We compete for loans, deposits, and financial services in all of our principal markets. We compete directly with other bank and nonbank institutions located within our markets, internet-based banks, out-of-market banks, and bank holding companies that advertise in or otherwise serve our markets, along with money market and mutual funds, brokerage houses, mortgage companies, and insurance companies or other commercial entities that offer financial services products. Competition involves efforts to retain current customers, obtain new loans and deposits, increase the scope and type of services offered, and offer competitive interest rates paid on deposits and charged on loans. Many of our competitors enjoy competitive advantages, including greater financial resources, a wider geographic presence, more accessible branch office locations, the ability to offer additional services, more favorable pricing alternatives, and lower origination and operating costs. Some of our competitors have been in business for a long time and have an established customer base and name recognition. We believe that our competitive pricing, personalized service, and community involvement enable us to effectively compete in the communities in which we operate.
80
Table of Contents
Index to Financial Statements
Properties
Our headquarters and the main office of NBC is located at 813 Shades Creek Parkway, Suite 100, Birmingham, Alabama 35209. Including the main office, NBC operates nine branches with drive-through and/or ATM service. The main office of ULB is located at 425 South U.S. Highway 17-92, Longwood, Florida 32750. Including its main office, ULB operates a total of six full-service banking offices with drive-through and/or ATM service. The office of both CBI and Corporate Billing is 239 Johnson Street, S.E., Decatur, Alabama 35601.
The following table summarizes pertinent details of NBC’s and ULB’s main and banking offices, as well as CBI’s and Corporate Billing’s office, as of December 31, 2014:
| Office Address |
Owned/Leased |
Square Footage | ||
| NATIONAL BANK OF COMMERCE | ||||
| 813 Shades Creek Parkway, Suite 100 Birmingham, AL 35209 (Main Office) |
Leased | 10,471 | ||
| 1919 Cahaba Road Birmingham, AL 35223 |
Leased | 8,340 | ||
| 5 Inverness Center Parkway Birmingham, AL 35242 |
Owned | 15,851 | ||
| 457 Magnolia Avenue Fairhope, AL 36532 |
Owned | 6,008 | ||
| 1544 West 2nd Street, Suite 114 Gulf Shores, AL 36542 |
Leased | 1,600 | ||
| 415 Meridian Street Huntsville, AL 35801 |
Owned | 13,579 | ||
| 8153 Highway 72 West Madison, AL 35758 |
Owned | 4,024 | ||
| 2443 Enterprise Drive Opelika, AL 36801 |
Owned | 6,200 | ||
| 2145 Indian River Boulevard, Suite A Vero Beach, FL 32960 |
Leased | 4,000 | ||
| UNITED LEGACY BANK | ||||
| 425 South U.S. Highway 17-92 Longwood, FL 32750 (Main Office) |
Owned | 13,083 | ||
| 401 South Semoran Boulevard Winter Park, FL 32792 |
Leased | 6,492 | ||
| 3822 Edgewater Drive Orlando (College Park), FL 32804 |
Leased | 2,146 | ||
| 997 West Broadway Street Oviedo, FL 32765 |
Owned | 3,414 | ||
| 1631 N. John Young Parkway Kissimmee, FL 34741 |
Leased | 2,420 | ||
| 1250 Lee Road Winter Park, FL 32789 |
Leased | 2,602 | ||
| CBI / CORPORATE BILLING | ||||
| 239 Johnson Street, S.E. Decatur, Alabama 35601 |
Owned | 8,500 | ||
We believe that our banking and non-banking offices are in good condition and are suitable to our needs.
81
Table of Contents
Index to Financial Statements
Legal Proceedings
We are subject to various pending and threatened litigation in the ordinary course of our business. Although it is not possible to determine at this point in time, based on consultation with legal counsel, management does not anticipate that the ultimate liability, if any, resulting from such litigation will have a material effect on our financial condition and results of operations.
Employees
As of February 25, 2015, we had approximately 240 full-time and full-time equivalent employees. None of these employees is party to a collective bargaining agreement.
82
Table of Contents
Index to Financial Statements
General
We are extensively regulated under both federal and state law. These laws restrict permissible activities and investments and require compliance with various consumer protection provisions applicable to lending, deposit, brokerage, and fiduciary activities. They also impose capital adequacy requirements and conditions on a bank holding company’s ability to repurchase stock or to receive dividends from its subsidiary banks. We are subject to comprehensive examination and supervision by the Federal Reserve, and National Bank of Commerce is subject to comprehensive examination and supervision by the OCC. These regulatory agencies generally have broad discretion to impose restrictions and limitations on our operations. This supervisory framework could materially impact the conduct and profitability of our activities.
In December 2014, we completed a merger with United, pursuant to which we acquired control of ULB. Under the terms of the merger agreement, ULB will be merged with and into NBC, with NBC surviving the merger. We anticipate that the merger of the Banks will be completed on or about February 28, 2015. Until the bank merger is completed, ULB will remain a separate subsidiary of us and will be subject to examination and supervision by the Federal Reserve and the FOFR, as a state-chartered member bank of the Federal Reserve. Many of the laws and regulations to which ULB is subject are similar to those applicable to NBC. Furthermore, following the bank merger, the OCC will have sole supervisory and enforcement authority over the combined bank. Therefore, the discussion of our regulatory framework below focuses exclusively on NCC and NBC, except where the requirements applicable to ULB differ materially from those to which NCC and NBC are currently subject, or as otherwise specifically noted.
To the extent that the following information describes statutory and regulatory provisions, it is qualified in its entirety by reference to the text of the particular statutory and regulatory provisions. Proposals to change the laws and regulations governing the banking industry are frequently raised at both the state and federal levels. The likelihood and timing of any changes in these laws and regulations, and the impact such changes may have on us, are difficult to ascertain. A change in applicable laws and regulations, or in the manner such laws or regulations are interpreted by regulatory agencies or courts, may have a material effect on our business, operations, and earnings.
Regulation of National Commerce Corporation
We are registered as a bank holding company under the BHCA and are subject to regulation and supervision by the Federal Reserve. The BHCA requires us to secure the prior approval of the Federal Reserve before we own or control, directly or indirectly, more than five percent (5%) of the voting shares or substantially all of the assets of any bank or thrift, or merge or consolidate with another bank or thrift holding company. Further, under the BHCA, our activities and those of any nonbank subsidiary are limited to: (i) those activities that the Federal Reserve determines to be so closely related to banking as to be a proper incident thereto, and (ii) investments in companies not engaged in activities closely related to banking, subject to quantitative limitations on the value of such investments. Prior approval of the Federal Reserve may be required before engaging in certain activities. In making such determinations, the Federal Reserve is required to weigh the expected benefits to the public, such as greater convenience, increased competition, and gains in efficiency, against the possible adverse effects, such as undue concentration of resources, decreased or unfair competition, conflicts of interest, and unsound banking practices.
Subject to various exceptions, the BHCA and the Change in Bank Control Act, together with related regulations, require Federal Reserve approval prior to any person or company acquiring “control” of a bank holding company. Control is conclusively presumed to exist if an individual or company acquires 25% or more of any class of voting securities of the bank holding company, and a rebuttable presumption arises if a person or company acquires 10% or more, but less than 25%, of any class of voting securities and either: (i) the bank holding company has registered securities under Section 12 of the Securities Act; or (ii) no other person owns a greater percentage of that class of voting securities immediately after the transaction.
83
Table of Contents
Index to Financial Statements
The BHCA was substantially amended by the Gramm-Leach-Bliley Act, or the GLBA, which, among other things, permits a “financial holding company” to engage in a broader range of non-banking activities, and to engage on less restrictive terms in certain activities than were previously permitted. These expanded activities include securities underwriting and dealing, insurance underwriting and sales, and merchant banking activities. To become a financial holding company, a bank holding company must certify that all depository institutions that it controls are both “well capitalized” and “well managed” (as defined by federal law), and have at least a “satisfactory” CRA rating. The GLBA also imposes certain privacy requirements on all financial institutions and their treatment of consumer information. At this time, we have not elected to become a financial holding company, nor do we expect to make such an election in the foreseeable future.
There are a number of restrictions imposed on us by law and regulatory policy that are designed to minimize potential loss to depositors and to the DIF maintained by the FDIC (as discussed in more detail below) in the event that a subsidiary depository institution should become insolvent. For example, federal law requires a bank holding company to serve as a source of financial strength to its subsidiary depository institutions and to commit resources to support such institutions in circumstances where it might not do so in the absence of such a policy. The Federal Reserve also has the authority under the BHCA to require a bank holding company to terminate any activity or to relinquish control of a non-bank subsidiary upon the Federal Reserve’s determination that such activity or control constitutes a serious risk to the financial soundness and stability of any bank subsidiary of the bank holding company.
Any capital loan by a bank holding company to a subsidiary depository institution is subordinate in right of payment to deposits and certain other indebtedness of the institution. In addition, in the event of the holding company’s bankruptcy, any commitment made by the bank holding company to a federal banking regulatory agency to maintain the capital of its subsidiary depository institution(s) will be assumed by the bankruptcy trustee and entitled to a priority of payment.
The Federal Deposit Insurance Act, or FDIA, provides that, in the event of the “liquidation or other resolution” of an insured depository institution, the claims of depositors of the institution (including the claims of the FDIC as a subrogee of insured depositors) and certain claims for administrative expenses of the FDIC as a receiver will have priority over other general unsecured claims against the institution. If an insured depository institution fails, insured and uninsured depositors, along with the FDIC, will have priority in payment ahead of unsecured, non-deposit creditors, including the institution’s holding company, with respect to any extensions of credit they have made to such insured depository institution.
Regulation of National Bank of Commerce
The operations and investments of NBC are subject to the supervision, examination, and reporting requirements of the National Bank Act and the regulations of the OCC as well as other federal banking statutes and regulations, including with respect to the level of reserves that NBC must maintain against deposits, restrictions on the types, amount, and terms and conditions of loans it may originate, and limits on the types of other activities in which NBC may engage and the investments that it may make. The OCC also has the power to prevent the continuance or development of unsafe or unsound banking practices or other violations of law. Because NBC’s deposits are insured by the FDIC to the maximum extent provided by law, it is also subject to certain FDIC regulations, and the FDIC has backup examination authority and some enforcement powers over NBC. NBC is also subject to numerous state and federal statutes and regulations that affect its business, activities, and operations.
Regulation of United Legacy Bank
ULB is chartered by and headquartered in the state of Florida, and it is subject to supervision and regulation by the FOFR and the Federal Reserve. The FOFR supervises and regulates all areas of ULB’s operations including, without limitation, the making of loans, the issuance of securities, the conduct of ULB’s corporate affairs, the satisfaction of capital adequacy requirements, the payment of dividends, and the establishment or closing of banking offices. The Federal Reserve is ULB’s primary federal regulatory agency, which periodically
84
Table of Contents
Index to Financial Statements
examines ULB’s operations and financial condition and compliance with federal consumer protection laws. In addition, ULB’s deposit accounts are insured by the FDIC to the maximum extent permitted by law, and the FDIC has backup examination authority and some enforcement powers over ULB.
As a state-chartered banking institution in the state of Florida, ULB is empowered by statute, subject to the limitations contained in those statutes, to take and pay interest on savings and time deposits, to accept demand deposits, to make loans on residential and other real estate, to make consumer and commercial loans, to invest, with certain limitations, in equity securities and in debt obligations of banks and corporations, and to provide various other banking services for the benefit of the its customers. Various state consumer laws and regulations also affect the operations of ULB, including state usury laws, consumer credit and equal credit opportunity laws, and fair credit reporting. In addition, the Federal Deposit Insurance Corporation Improvement Act of 1991, or FDICIA, generally prohibits insured state-chartered institutions from conducting activities as principal that are not permitted for national banks.
Transactions with Affiliates
We are subject to federal laws, such as Sections 23A and 23B of the Federal Reserve Act, that limit the size and number of the transactions that depository institutions may engage in with their affiliates. Under these provisions, transactions (such as loans or investments) by a bank with nonbank affiliates are generally limited to 10% of the bank’s capital and surplus for all covered transactions with any one affiliate, and 20% of capital and surplus for all covered transactions with all affiliates. Any extensions of credit to affiliates, with limited exceptions, must be secured by eligible collateral in specified amounts. Banks are also prohibited from purchasing any “low quality” assets from an affiliate. The Dodd-Frank Act imposes additional requirements on transactions with affiliates, including an expansion of the definition of “covered transactions” and an increase in the amount of time for which collateral requirements regarding covered transactions must be maintained.
We are also subject to restrictions on extensions of credit to our executive officers, directors, principal shareowners, and their related interests. These extensions of credit must be made on substantially the same terms, including interest rates and collateral, as those prevailing at the time for comparable transactions with third parties, and must not involve more than the normal risk of repayment or present other unfavorable features. Furthermore, we are prohibited from engaging in asset purchases or sales transactions with our officers, directors, or principal shareowners unless the transaction is on market terms and, if the transaction represents greater than 10% of the capital and surplus of the bank, a majority of the bank’s disinterested directors has approved the transaction.
Monetary Policy
Our earnings are and will be affected by domestic economic conditions and the monetary and fiscal policies of the United States government and its agencies. The monetary policies of the Federal Reserve have a significant effect upon the operating results of commercial banks. The Federal Reserve has a major impact upon the levels of bank loans, investments and deposits through its open market operations in United States government securities and through its regulation of, among other things, the discount rate on bank borrowings and the reserve requirements against bank deposits. It is not possible for us to predict the nature and impact of future changes in monetary and fiscal policies.
Deposit Insurance
Our deposits are insured up to applicable limits by the DIF of the FDIC. The DIF is the successor to the Bank Insurance Fund and the Savings Association Insurance Fund, which were merged in 2006. Under the FDIC’s current risk-based assessment system, as amended by the Dodd-Frank Act and the FDIC’s final rule on assessments, dividend assessment base and large bank pricing, or the Assessment Rule, insured institutions are assigned to one of four categories based on supervisory evaluations, regulatory capital levels, and certain other factors. An institution’s assessment rate depends upon the category to which it is assigned and the applicability of certain potential adjustments established by FDIC regulations, with less risky institutions paying lower assessment rates.
The assessment base against which the assessment rate is applied to determine the total assessment due for a given period is the depository institution’s average total consolidated assets during the assessment period less
85
Table of Contents
Index to Financial Statements
average tangible equity during that assessment period. Tangible equity is defined in the Assessment Rule as Tier 1 Capital and is calculated monthly, unless the insured depository institution has less than $1 billion in assets, in which case the insured depository institution calculates Tier 1 Capital on an end-of-quarter basis. Parents or holding companies of other insured depository institutions are required to report separately from their subsidiary depository institutions.
The Dodd-Frank Act also eliminated the ceiling and increased the floor on the size of the DIF. It established a minimum designated reserve ratio, or the DRR, of 1.35 percent of the estimated insured deposits and required the FDIC to adopt a restoration plan should the reserve ratio fall below 1.35 percent. However, the assessment rate schedules used to determine assessments due from insured depository institutions become progressively lower when the reserve ratio in the DIF exceeds 1.15 percent, 2 percent, and 2.5 percent.
In addition to the assessment for deposit insurance, insured depository institutions are required to make payments on bonds issued in the late 1980s by the Financing Corporation to recapitalize a predecessor deposit insurance fund. This payment is established quarterly and, for each of the four quarters in calendar year 2014, equaled 0.62 basis points on assessable deposits.
The Dodd-Frank Act also raised the limit for federal deposit insurance to $250,000 and increased the cash limit of Securities Investor Protection Corporation protection from $100,000 to $250,000.
The FDIC has authority to increase insurance assessments. A significant increase in insurance assessments would likely have an adverse effect on our operating expenses and results of operations. We cannot predict what insurance assessment rates will be in the future. Furthermore, deposit insurance may be terminated by the FDIC upon a finding that the institution has engaged in unsafe or unsound practices, is in an unsafe or unsound condition to continue operations, or has violated any applicable law, regulation, rule, order, or condition imposed by the FDIC.
Dividend Restrictions
We are a legal entity separate and distinct from our Banks. Our ability to pay dividends and make other distributions depends in part upon the receipt of dividends from our subsidiaries and is limited by federal and state law. The specific limits depend upon a number of factors, including a bank subsidiary’s type of charter, recent earnings, recent dividends, level of capital, and regulatory status. The regulators are authorized, and under certain circumstances are required, to determine that the payment of dividends or other distributions by a bank would be an unsafe or unsound practice and to prohibit that payment. For example, the FDIA generally prohibits a depository institution from making any capital distribution (including payment of a dividend) or paying any management fee to its parent holding company if the depository institution would thereafter be undercapitalized.
A national bank generally may not withdraw, either in the form of a dividend or otherwise, any portion of its permanent capital and may not declare a dividend in excess of its retained net profits. Further, dividends that may be paid by a national bank without the express approval of the OCC are limited to an amount equal to the bank’s retained net profits for the preceding two calendar years plus retained net profits up to the date of any dividend declaration in the current calendar year. Retained net profits, as defined by the OCC, consist of net income, less dividends declared during the period. As of December 31, 2014, both NBC and ULB had a negative retained earnings balance and are therefore currently prohibited from paying any dividends without the approval of the OCC, in the case of NBC, and the FOFR and the Federal Reserve, in the case of ULB. Dividend payments by NBC and ULB in the future will require the generation of net income by each Bank and could require regulatory approval if any proposed dividends are in excess of prescribed guidelines.
The ability of a bank holding company to pay dividends and make distributions can also be limited by other laws or regulations. The Federal Reserve, which has authority to prohibit a bank holding company from paying dividends or making other distributions, has issued a Supervisory Letter stating that a bank holding company should not pay cash dividends unless its net income available to common shareowners has been sufficient to fully fund the dividends, and the prospective rate of earnings retention appears to be consistent with the holding company’s capital needs, asset quality, and overall financial condition. Accordingly, a bank holding company should not pay cash dividends that exceed its net income or that can only be funded in ways that weaken the bank
86
Table of Contents
Index to Financial Statements
holding company’s financial health, such as by borrowing. The Dodd-Frank Act, Basel III (described below), and their respective implementing regulations impose additional restrictions on the ability of banking institutions to pay dividends.
Capital Adequacy Guidelines
In December 2010, the Basel Committee on Banking Supervision released its final framework for strengthening international capital and liquidity regulation, or Basel III. Basel III requires banks to maintain a higher level of capital than previously required, with a greater emphasis on common equity. The Dodd-Frank Act imposed generally applicable capital requirements with respect to bank holding companies and their bank subsidiaries and mandated that the federal banking regulatory agencies adopt rules and regulations to implement the Basel III requirements.
Among other things, the Dodd-Frank Act requires the Federal Reserve to apply consolidated capital requirements to a bank holding company that are no less stringent than those currently applied to depository institutions. In July 2013, the federal banking agencies adopted a final rule, or the Basel III Final Rule, implementing these standards. Under the Basel III Final Rule, trust preferred securities are excluded from Tier I capital unless such securities were issued prior to May 19, 2010 by a bank holding company with less than $15 billion in assets, subject to certain limits. The Dodd-Frank Act additionally provides for countercyclical capital requirements so that the required amount of capital increases in times of economic expansion and decreases in times of economic contraction, consistent with safety and soundness. Under the Basel III Final Rule, which implements this concept, banks must maintain a capital conservation buffer consisting of additional common equity Tier 1 capital equal to 2.5% of risk-weighted assets above each of the required minimum capital levels in order to avoid limitations on paying dividends, engaging in share repurchases, and paying certain discretionary bonuses. This new capital conservation buffer requirement will be phased in beginning in January 2016 at 0.625% of risk-weighted assets and will increase each year until fully implemented at 2.5% in January 2019.
For purposes of calculating risk-weighted assets, the federal banking agencies have promulgated risk-based capital guidelines designed to make regulatory capital requirements more sensitive to differences in risk profiles among banks, to account for off-balance sheet exposures, and to minimize disincentives for holding liquid assets. Under these guidelines, assets and off-balance sheet items are assigned to broad risk categories, each with appropriate weights. The resulting capital ratios represent capital as a percentage of total risk-weighted assets and off-balance sheet items.
Bank assets are given risk-weights under the Basel III Final Rule. In addition, certain off-balance sheet items are assigned certain credit conversion factors to convert them to asset-equivalent amounts to which an appropriate risk-weighting will apply. Those computations result in the total risk-weighted assets. Most loans are assigned to the 100% risk category, except for performing first mortgage loans fully secured by residential property, which carry a 50% risk weighting. Most investment securities (including, primarily, general obligation claims of states or other political subdivisions of the United States) are assigned to the 20% category. Exceptions include municipal or state revenue bonds, which have a 50% risk weighting, and direct obligations of the United States Treasury or obligations backed by the full faith and credit of the United States government, which have a 0% risk weighting. In converting off-balance sheet items, direct credit substitutes, including general guarantees and standby letters of credit backing financial obligations, are given a 100% risk weighting. Transaction-related contingencies such as bid bonds, standby letters of credit backing non-financial obligations, and undrawn commitments (including commercial credit lines with an initial maturity of more than one year) have a 50% risk weighting. Short-term commercial letters of credit have a 20% risk weighting, and certain short-term unconditionally cancelable commitments have a 0% risk weighting.
Under the Basel III Final Rule, as of January 1, 2015, the minimum ratio of total capital to risk-weighted assets (including certain off-balance sheet activities, such as standby letters of credit) is 8%. The required ratio of “Tier 1 Capital” (consisting generally of shareholders’ equity and qualifying preferred stock, less certain goodwill items and other intangible assets) to risk-weighted assets is 6%. While there was previously no required ratio of “Common Equity Tier 1 Capital” (which generally consists of common stock, retained earnings, certain qualifying capital instruments issued by consolidated subsidiaries, and Accumulated Other Comprehensive
87
Table of Contents
Index to Financial Statements
Income, subject to certain adjustments) to risk-weighted assets, a required minimum ratio of 4.5% became effective on January 1, 2015 as well. The remainder of total capital, or “Tier 2 Capital,” may consist of (a) the allowance for loan losses of up to 1.25% of risk-weighted assets, (b) preferred stock not qualifying as Tier 1 Capital, (c) hybrid capital instruments, (d) perpetual debt, (e) mandatory convertible securities, and (f) certain subordinated debt and intermediate-term preferred stock up to 50% of Tier 1 Capital. Total Capital is the sum of Tier 1 Capital and Tier 2 Capital (which is included only to the extent of Tier 1 Capital), less reciprocal holdings of other banking organizations’ capital instruments, investments in unconsolidated subsidiaries, and any other deductions as determined by the appropriate regulator.
In addition, the federal banking agencies have established minimum leverage ratio requirements for banking organizations they supervise, calculated as the ratio of Tier 1 Capital to adjusted average consolidated assets. Prior to the effective date of the Basel III Final Rule, banks and bank holding companies meeting certain specified criteria, including having the highest regulatory rating and not experiencing significant growth or expansion, were permitted to maintain a minimum leverage ratio of Tier 1 Capital to adjusted average quarterly assets equal to 3%. Other banks and bank holding companies generally were required to maintain a minimum leverage ratio between 4% and 5%. Under the Basel III Final Rule, as of January 1, 2015, the required minimum leverage ratio for all banks is 4%.
As an additional means of identifying problems in the financial management of depository institutions, the federal banking regulatory agencies have established certain non-capital safety and soundness standards for institutions for which they are the primary federal regulator. The standards relate generally to operations and management, asset quality, interest rate exposure, and executive compensation. The agencies are authorized to take action against institutions that fail to meet such standards.
Prompt Corrective Action
In addition to the required minimum capital levels described above, federal law establishes a system of “prompt corrective actions” that federal banking agencies are required to take, and certain actions that they have discretion to take, based upon the capital category into which a federally regulated depository institution falls. Regulations set forth detailed procedures and criteria for implementing prompt corrective action in the case of any institution which is not adequately capitalized. Under the prompt corrective action rules effective as of January 1, 2015, an institution is deemed “well capitalized” if its leverage ratio, Common Equity Tier 1 ratio, Tier 1 Capital ratio, and Total Capital ratio meet or exceed 5%, 6.5%, 8%, and 10%, respectively. An institution is deemed to be “adequately capitalized” or better if its leverage, Common Equity Tier 1, Tier 1, and Total Capital ratios meet or exceed the minimum federal regulatory capital requirements, and “undercapitalized” if it fails to meet these minimum capital requirements. An institution is “significantly undercapitalized” if its leverage, Common Equity Tier 1, Tier 1, and Total Capital ratios fall below 3%, 3%, 4%, and 6%, respectively, and “critically undercapitalized” if the institution has a ratio of tangible equity to total assets that is equal to or less than 2%.
The prompt corrective action rules require an undercapitalized institution to file a written capital restoration plan, along with a performance guaranty by its holding company or a third party. In addition, an undercapitalized institution becomes subject to certain automatic restrictions, including a prohibition on payment of dividends and a limitation on asset growth and expansion in certain cases, a limitation on the payment of bonuses or raises to senior executive officers, and a prohibition on the payment of certain “management fees” to any “controlling person.” Institutions that are classified as undercapitalized are also subject to certain additional supervisory actions, including increased reporting burdens and regulatory monitoring; limitations on the institution’s ability to make acquisitions, open new branch offices, or engage in new lines of business; obligations to raise additional capital; restrictions on transactions with affiliates; and restrictions on interest rates paid by the institution on deposits. In certain cases, banking regulatory agencies may require replacement of senior executive officers or directors, or sale of the institution to a willing purchaser. If an institution is deemed to be “critically undercapitalized” and continues in that category for 90 days, the statute requires, with certain narrowly limited exceptions, that the institution be placed in receivership.
88
Table of Contents
Index to Financial Statements
Community Reinvestment Act
The CRA requires the federal banking regulatory agencies to assess all financial institutions that they regulate to determine whether these institutions are meeting the credit needs of the communities they serve, including their assessment area(s) (as established for these purposes in accordance with applicable regulations based principally on the location of branch offices). Under the CRA, institutions are assigned a rating of “outstanding,” “satisfactory,” “needs to improve,” or “unsatisfactory.” An institution’s record in meeting the requirements of the CRA is made publicly available and is taken into consideration in connection with any applications it files with federal regulators to engage in certain activities, including approval of a branch or other deposit facility, mergers and acquisitions, office relocations, or expansions into non-banking activities. Both NBC and ULB received a “satisfactory” rating at their most recent CRA evaluations.
USA PATRIOT Act
Under the Uniting and Strengthening America by Providing Appropriate Tools Required to Intercept and Obstruct Terrorism (USA PATRIOT) Act, which amended the U.S. Bank Secrecy Act, financial institutions are subject to prohibitions against specified financial transactions and account relationships, as well as enhanced due diligence and “know your customer” standards in their dealings with foreign financial institutions and foreign customers. The USA PATRIOT Act also mandates that financial institutions establish anti-money laundering programs meeting certain standards and requires the federal banking regulators to consider the effectiveness of a financial institution’s anti-money laundering activities when reviewing bank mergers and bank holding company acquisitions.
Privacy of Customer Information
The GLBA and the implementing regulations issued by federal regulatory agencies require financial institutions (including banks, insurance agencies, and broker/dealers) to adopt policies and procedures regarding the disclosure of nonpublic personal information about their customers to non-affiliated third parties. In general, financial institutions are required to explain to customers their policies and procedures regarding the disclosure of such nonpublic personal information, and, unless otherwise required or permitted by law, financial institutions are prohibited from disclosing such information except as provided in their policies and procedures. Specifically, the GLBA established certain information security guidelines that require each financial institution, under the supervision and ongoing oversight of its board of directors or an appropriate committee thereof, to develop, implement, and maintain a comprehensive written information security program designed to ensure the security and confidentiality of customer information, to protect against anticipated threats or hazards to the security or integrity of such information, and to protect against unauthorized access to or use of such information that could result in substantial harm or inconvenience to any customer.
The Consumer Financial Protection Bureau
The Dodd-Frank Act created the Consumer Financial Protection Bureau, or the CFPB, which is an independent bureau with broad authority to regulate the consumer finance industry, including regulated financial institutions, non-banks and others involved in extending credit to consumers. The CFPB has authority through rulemaking, orders, policy statements, guidance, and enforcement actions to administer and enforce federal consumer financial laws, to oversee several entities and market segments not previously under the supervision of a federal regulator, and to impose its own regulations and pursue enforcement actions when it determines that a practice is unfair, deceptive, or abusive. The federal consumer financial laws and all of the functions and responsibilities associated with them, many of which were previously enforced by other federal regulatory agencies, were transferred to the CFPB on July 21, 2011. While the CFPB has the power to interpret, administer, and enforce federal consumer financial laws, the Dodd-Frank Act provides that the federal banking regulatory agencies continue to have examination and enforcement powers over the financial institutions that they supervise relating to the matters within the jurisdiction of the CFPB if such institutions have less than $10 billion in assets. The Dodd-Frank Act also gives state attorneys general the ability to enforce federal consumer protection laws.
89
Table of Contents
Index to Financial Statements
Mortgage Loan Origination
The Dodd-Frank Act authorizes the CFPB to establish certain minimum standards for the origination of residential mortgages, including a determination of the borrower’s ability to repay. Under the Dodd-Frank Act and the implementing final rule adopted by the CFPB, or the ATR/QM Rule, a financial institution may not make a residential mortgage loan to a consumer unless it first makes a “reasonable and good faith determination” that the consumer has a “reasonable ability” to repay the loan. In addition, the ATR/QM Rule limits prepayment penalties and permits borrowers to raise certain defenses to foreclosure if they receive any loan other than a “qualified mortgage,” as defined by the CFPB. For this purpose, the ATR/QM Rule defines a “qualified mortgage” to include a loan with a borrower debt-to-income ratio of less than or equal to 43% or, alternatively, a loan eligible for purchase by Fannie Mae or Freddie Mac while they operate under federal conservatorship or receivership, and loans eligible for insurance or guarantee by the Federal Housing Administration, Veterans Administration, or United States Department of Agriculture. Additionally, a qualified mortgage may not: (i) contain excess upfront points and fees; (ii) have a term greater than 30 years; or (iii) include interest-only or negative amortization payments. The ATR/QM Rule specifies the types of income and assets that may be considered in the ability-to-repay determination, the permissible sources for verification, and the required methods of calculating the loan’s monthly payments. The ATR/QM Rule became effective January 10, 2014.
In addition, Section 941 of the Dodd-Frank Act amended the Exchange Act to require sponsors of asset-backed securities (ABS) to retain at least 5 percent of the credit risk of the assets underlying the securities and generally prohibits sponsors from transferring or hedging that credit risk. In October 2014, the federal banking regulatory agencies adopted a final rule to implement this requirement, or the Risk Retention Rule. Among other things, the Risk Retention Rule requires a securitizer to retain not less than 5 percent of the credit risk of any asset that the securitizer, through the issuance of an ABS, transfers, sells, or conveys to a third party; and prohibits a securitizer from directly or indirectly hedging or otherwise transferring the credit risk that the securitizer is required to retain. In certain situations, the final rule allows securitizers to allocate a portion of the risk retention requirement to the originator(s) of the securitized assets, if an originator contributes at least 20 percent of the assets in the securitization. The Risk Retention Rule also provides an exemption to the risk retention requirements for an ABS collateralized exclusively by Qualified Residential Mortgages, or QRMs, and ties the definition of a QRM to the definition of a “qualified mortgage” established by the CFPB for purposes of evaluating a consumer’s ability to repay a mortgage loan. The federal banking agencies have agreed to review the definition of QRMs in 2019, following the CFPB’s own review of its “qualified mortgage” regulation. The Risk Retention Rule will take effect in late 2015, one year after its publication in the Federal Register.
Mortgage Loan Servicing
On January 17, 2013, the CFPB issued a series of final rules as part of an ongoing effort to address mortgage servicing reforms and create uniform standards for the mortgage servicing industry. The rules contain additional requirements for communications with borrowers, address the maintenance of customer account records, govern procedures for responding to written borrower requests and complaints of errors, and provide guidance regarding servicing delinquent loans, foreclosure proceedings, and loss mitigation efforts, among other measures. These rules became effective on January 10, 2014 and have in general led to increased costs to service loans across the mortgage industry.
The Volcker Rule
On December 10, 2013, five federal financial regulatory agencies, including the Federal Reserve and the OCC, adopted final rules implementing the so-called “Volcker Rule” embodied in Section 13 of the BHCA, which was added by Section 619 of the Dodd-Frank Act. The Volcker Rule completes the process begun in October 2011, when the agencies introduced proposed implementing rules for comment. In general, the Volcker Rule prohibits banking entities from (1) engaging in short-term proprietary trading for their own accounts, and (2) having certain ownership interests in, and relationships with, hedge funds or private equity funds, or covered funds. The Volcker Rule is intended to provide greater clarity with respect to both the extent of those primary prohibitions and the related exemptions and exclusions.
90
Table of Contents
Index to Financial Statements
The Volcker Rule also requires each regulated entity to establish an internal compliance program that is consistent with the extent to which it engages in activities covered by the Volcker Rule, which must include (for the largest entities) making regular reports about those activities to regulators. Community and small banks, like us, are afforded some relief under the Volcker Rule. If such banks are engaged only in exempted proprietary trading, such as trading in United States government, agency, state, and municipal obligations, they are exempt entirely from compliance program requirements. Moreover, even if a community or small bank engages in proprietary trading or covered fund activities under the rule, they need only incorporate references to the Volcker Rule into their existing policies and procedures. The Volcker Rule was effective as of April 1, 2014, but the conformance period has been extended from its statutory end date of July 21, 2014 until July 21, 2015.
On January 15, 2014, the federal banking agencies issued an interim final rule, or the Interim Rule, that exempts certain collateralized debt obligations backed by trust-preferred securities, also known as TruPS CDOs, from the broad restrictions of the Volcker Rule. Specifically, the Interim Rule provides that the covered fund restrictions of the Volcker Rule are inapplicable to a banking entity’s ownership interest in, or sponsorship of, any issuer of TruPS CDOs, provided that: (1) the TruPS CDOs were issued before May 19, 2010, by a holding company with $15 billion or less in total consolidated assets, and (2) the banking entity acquired the interest in the TruPS CDOs on or before December 10, 2013, or acquired the interest in the course of a merger with or acquisition of a banking entity that itself acquired the interest on or before that date.
Other Provisions of the Dodd-Frank Act
The Dodd-Frank Act, which became law on July 21, 2010, implements far-reaching changes across the financial regulatory landscape. In addition to the reforms previously mentioned, the Dodd-Frank Act also:
| • | Requires bank holding companies and banks to be both well capitalized and well managed in order to acquire banks located outside their home state and requires any bank holding company electing to be treated as a financial holding company to be both well managed and well capitalized; |
| • | Eliminates all remaining restrictions on interstate banking by authorizing national and state banks to establish de novo branches in any state that would permit a bank chartered in that state to open a branch at that location; |
| • | Repeals Regulation Q, the federal prohibition on the payment of interest on demand deposits, thereby permitting depository institutions to pay interest on business transaction and other accounts; |
| • | Enhances insider transaction limitations by strengthening loan restrictions to insiders and applying the various limits to a greater number of types of transactions, including derivative transactions, repurchase agreements, reverse repurchase agreements, and securities lending or borrowing transactions. The law also restricts certain asset sales to and from an insider to an institution, including requirements that such sales be on market terms and, in certain circumstances, approved by the institution’s board of directors; and |
| • | Strengthens the previous limits on a depository institution’s credit exposure to one borrower (whether a person or group of related persons) in an amount exceeding certain thresholds, by expanding the scope of these restrictions to include credit exposure arising from derivative transactions, repurchase agreements, and securities lending and borrowing transactions. |
Although a significant number of the rules and regulations mandated by the Dodd-Frank Act have been finalized, many of the new requirements called for have yet to be implemented and will likely be subject to implementing regulations over the course of several years. Given the uncertainty associated with the manner in which the provisions of the Dodd-Frank Act will be implemented by the various agencies, the full extent of the impact such requirements will have on financial institutions’ operations is unclear.
Federal Home Loan Bank Membership
National Bank of Commerce and United Legacy Bank are members of the Federal Home Loan Bank of Atlanta, or the FHLBA. Each member of the FHLBA is required to maintain a minimum investment in the Class B stock of the FHLBA. The Board of Directors of the FHLBA can increase the minimum investment
91
Table of Contents
Index to Financial Statements
requirements in the event it has concluded that additional capital is required to allow it to meet its own regulatory capital requirements. Any increase in the minimum investment requirements outside of specified ranges requires the approval of the Federal Housing Finance Agency. Because the extent of any obligation to increase the level of investment in the FHLBA depends entirely upon the occurrence of a future event, we are unable to determine the extent of future required potential payments to the FHLBA at this time. Additionally, in the event that a member financial institution fails, the right of the FHLBA to seek repayment of funds loaned to that institution will take priority (a super lien) over the rights of all other creditors.
Other Laws and Regulations
Our operations are subject to several additional laws, some of which are specific to banking and others of which are applicable to commercial operations generally. For example, with respect to our lending practices, we are subject to the following laws and regulations, among several others:
| • | Truth-In-Lending Act, governing disclosures of credit terms to consumer borrowers; |
| • | Home Mortgage Disclosure Act of 1975, requiring financial institutions to provide information to enable the public and public officials to determine whether a financial institution is fulfilling its obligation to help meet the housing needs of the community it serves; |
| • | Equal Credit Opportunity Act, prohibiting discrimination on the basis of race, creed, or other prohibited factors in extending credit; |
| • | Fair Credit Reporting Act of 1978, as amended by the Fair and Accurate Credit Transactions Act, governing the use and provision of information to credit reporting agencies, certain identity theft protections, and certain credit and other disclosures; |
| • | Fair Debt Collection Practices Act, governing the manner in which consumer debts may be collected by collection agencies; |
| • | Real Estate Settlement Procedures Act, requiring certain disclosures concerning loan closing costs and escrows, and governing transfers of loan servicing and the amounts of escrows in connection with loans secured by one-to-four family residential properties; |
| • | Bank Secrecy Act, as amended by the USA PATRIOT Act, imposing requirements and limitations on specific financial transactions and account relationships, intended to guard against money laundering and terrorism financing; |
| • | Rules and regulations established by the National Flood Insurance Program; |
| • | Sections 22(g) and 22(h) of the Federal Reserve Act which set lending restrictions and limitations regarding loans and other extensions of credit made to executive officers, directors, principal shareowners, and other insiders; |
| • | Sections 23A and 23B of the Federal Reserve Act, imposing restrictions regarding loans and other extensions of credit made by a bank to one or more of its affiliates; and |
| • | Rules and regulations of the various federal agencies charged with the responsibility of implementing these federal laws. |
Our deposit operations are subject to federal laws applicable to depository accounts, including:
| • | Right to Financial Privacy Act, which imposes a duty to maintain confidentiality of consumer financial records and prescribes procedures for complying with administrative subpoenas of financial records; |
| • | Truth-In-Savings Act, requiring certain disclosures for consumer deposit accounts; |
| • | Electronic Funds Transfer Act and Regulation E of the Federal Reserve, which govern automatic deposits to and withdrawals from deposit accounts and customers’ rights and liabilities arising from the use of automated teller machines and other electronic banking services; and |
| • | Rules and regulations of the various federal agencies charged with the responsibility of implementing these federal laws. |
92
Table of Contents
Index to Financial Statements
We are also subject to a variety of laws and regulations that are not limited to banking organizations. For example, in lending to commercial and consumer borrowers, and in owning and operating our own property, we are subject to regulations and potential liabilities under state and federal environmental laws. In addition, we must comply with privacy and data security laws and regulations at both the federal and state level.
We are heavily regulated by regulatory agencies at the federal and state levels. Like most of our competitors, we have faced and expect to continue to face increased regulation and regulatory and political scrutiny, which creates significant uncertainty for us, as well as for the financial services industry in general.
Enforcement Powers
The Financial Institution Reform Recovery and Enforcement Act, or FIRREA, expanded and increased the penalties available for use by the federal regulatory agencies against depository institutions and certain “institution-affiliated parties.” Institution-affiliated parties primarily include management, employees, and agents of a financial institution, as well as independent contractors and consultants, such as attorneys, accountants, and others who participate in the conduct of the financial institution’s affairs. An institution can be subject to an enforcement action due to the failure to timely file required reports, the filing of false or misleading information, or the submission of inaccurate reports, or engaging in other unsafe or unsound banking practices. Civil penalties may be as high as $1,425,000 per day for such violations.
FIRREA provided regulators with greater flexibility to commence enforcement actions against institutions and institution-affiliated parties and to terminate an institution’s deposit insurance. It also expanded the power of banking regulatory agencies to issue regulatory orders. Such orders may, among other things, require affirmative action to correct any harm resulting from a violation or practice, including restitution, reimbursement, indemnification, or guarantees against loss. A financial institution may also be ordered to restrict its growth, dispose of certain assets, rescind agreements or contracts, or take other actions as determined by the ordering agency to be appropriate. The Dodd-Frank Act increases regulatory oversight, supervision and examination of banks, bank holding companies, and their respective subsidiaries by the appropriate regulatory agency.
Future Legislation and Regulation
Regulators have increased their focus on the regulation of the financial services industry in recent years, leading in many cases to greater uncertainty and compliance costs for regulated entities. For example, the provisions of the Dodd-Frank Act could require us to make material expenditures, particularly in the form of personnel training costs and additional compliance expenses. We also may be required to change certain of our business practices in order to comply with the Dodd-Frank Act and its implementing regulations, which in turn could adversely affect our ability to pursue business opportunities that we might otherwise consider pursuing, cause business disruptions, and/or have other impacts that are as of yet unknown to us. Failure to comply with these laws or regulations, even if inadvertent, could result in negative publicity, fines, or additional expenses.
Furthermore, proposals that could substantially intensify the regulation of the financial services industry have been and are expected to continue to be introduced in the United States Congress, in state legislatures, and by applicable regulatory authorities. These proposals may change banking statutes and regulations and our operating environment in substantial and unpredictable ways. If enacted, these proposals could increase or decrease the cost of doing business, limit or expand permissible activities or affect the competitive balance among banks, savings associations, credit unions, and other financial institutions. We cannot predict whether any of these proposals will be enacted and, if enacted, the effect that these proposals, or any implementing regulations, would have on our business, results of operations, or financial condition.
93
Table of Contents
Index to Financial Statements
Executive Officers and Directors
The following table sets forth the name, age, and position, as of February 25, 2015, of the individuals who currently serve as our executive officers and directors.
| Name |
Age | Position |
Director Since | |||||
| John H. Holcomb, III |
63 | Director, Chairman of the Board of Directors and Chief Executive Officer |
2010 | |||||
| Richard Murray, IV |
52 | Director, President and Chief Operating Officer |
2010 | |||||
| William E. Matthews, V |
50 | Director, Vice Chairman of the Board of Directors and Chief Financial Officer |
2010 | |||||
| John R. Bragg |
53 | Executive Vice President – Bank Operations |
||||||
| M. Davis Goodson, Jr. |
42 | Executive Vice President and Senior Lender – NBC |
||||||
| William R. Ireland, Jr. |
57 | Executive Vice President and Chief Risk Management Officer – NBC |
||||||
| Robert B. Aland |
52 | Birmingham President – NBC |
||||||
| James R. (“Skip”) Thompson, III |
55 | President and Chief Executive Officer of Corporate Billing |
||||||
| Bobby A. Bradley |
65 | Director |
2010 | |||||
| R. Holman Head |
58 | Director |
2013 | |||||
| Jerry D. Kimbrough |
63 | Director |
2004* | |||||
| C. Phillip McWane |
57 | Director |
2010 | |||||
| G. Ruffner Page, Jr. |
55 | Director |
2010 | |||||
| W. Stancil Starnes |
66 | Director |
2010 | |||||
| Temple W. Tutwiler, III |
61 | Director |
2013 | |||||
| Russell H. Vandevelde, IV |
48 | Director |
2004* | |||||
| Donald F. Wright |
72 | Director |
2014 | |||||
| * | Service commenced in 2004 as a member of the board of directors of Red Mountain Bank, N.A. |
Below is certain information regarding our executive officers’ and directors’ individual experience, qualifications, attributes, and skills and brief statements of those aspects of our directors’ backgrounds that led us to conclude that they should serve as directors.
John H. Holcomb, III was appointed to our board of directors in 2010. Mr. Holcomb has served as Chairman of our board of directors and our Chief Executive Officer since October 2010 and has served as Chairman of the board of directors of NBC since October 2010. From October 2010 until June 2012, Mr. Holcomb also served as Chief Executive Officer of NBC. Mr. Holcomb previously served as Chairman of the board of directors and Chief Executive Officer of ALAB from 1996 until it was acquired in 2008. Since October 2010, Mr. Holcomb has also served as a Managing Member of CIG, which was our majority shareowner prior to its dissolution on December 31, 2014. Mr. Holcomb has served in senior executive positions with us and NBC since 2010, providing him with extensive knowledge of our operations.
Richard Murray, IV was appointed to our board of directors in 2010. Mr. Murray has served as our President and Chief Operating Officer since October 2010 and President and Chief Executive Officer of NBC since June 2012. From October 2010 until June 2012, Mr. Murray served as President and Chief Operating Officer of NBC. Mr. Murray previously served as President and Chief Operating Officer of ALAB from 2000 until it was acquired in 2008, and then as Regional President (Alabama and Florida) of RBC Bank (USA) from February 2008 until July 2009. Mr. Murray has served in senior executive positions with us and NBC since 2010, providing him with extensive knowledge of our operations.
William E. Matthews, V was appointed to our board of directors in 2010. Mr. Matthews has served as Vice Chairman of the board of directors and NBC since June 2012 and as our and NBC’s Chief Financial Officer since November 2011. He served as Executive Vice President of NCC and NBC from November 2011 until June 2012. Mr. Matthews previously served as Executive Vice President and Chief Financial Officer of ALAB from 1998
94
Table of Contents
Index to Financial Statements
until it was acquired in 2008, and then as Chief Financial Officer of RBC Bank (USA) until March 2009. From March 2009 until October 2011, Mr. Matthews was a partner in New Capital Partners, a private equity firm based in Birmingham, Alabama. Our board of directors believes that Mr. Matthews’ extensive experience as a chief financial officer of various banks contributes valuable experience to our board of directors.
John R. Bragg has served as Executive Vice President – Bank Operations of NCC and NBC since October 2010. Mr. Bragg previously served as Executive Vice President of ALAB from 1995 until it was acquired in 2008, and then served as Senior Vice President – Bank Operations of RBC Bank (USA) from February 2008 until June 2009.
M. Davis Goodson, Jr. has served as Executive Vice President and Senior Lender of NBC since May 2011. Mr. Goodson previously served as Senior Vice President and Senior Lender of NBC from October 2010 until April 2011. Mr. Goodson served in various commercial loan officer and commercial banking manager positions beginning in May 1994, including as Commercial Banking Manager of RBC Bank (USA) from July 2006 until June 2009.
William R. Ireland, Jr. has served as Executive Vice President and Chief Risk Management Officer of NBC since October 2010. Mr. Ireland previously served as Director of Credit Review of RBC Bank (USA) from July 2008 until February 2010 and as Director, Risk Management and Strategic Initiatives of RBC Bank (USA) from February 2008 until July 2008. Mr. Ireland served as Executive Vice President, Chief Risk Management Officer, of ALAB from 2004 until it was acquired in 2008.
Robert B. Aland has served as Birmingham Market President of NBC since October 2010. Mr. Aland previously served as Birmingham Market President of RBC Bank (USA) from February 2008 until June 2009, and as Birmingham Market President of First American Bank, ALAB’s largest subsidiary bank, from 2005 until February 2008.
James R. (“Skip”) Thompson, III has served as President and Chief Executive Officer of Corporate Billing since 2009. Mr. Thompson previously served as Chief Executive Officer of First American Bank, ALAB’s largest subsidiary bank, for approximately 10 years, from 1999 until 2008.
Bobby A. Bradley was appointed to our board of directors in 2010. Ms. Bradley currently serves as Managing Partner of Lewis Properties, LLC, a real estate investment company, Managing Partner of Anderson Investments, LLC, a technology business investment company, and Managing Partner of Genesis II, a family business designed to support various philanthropic and investment efforts. Ms. Bradley previously served as Chief Executive Officer of Computer Systems Technology, Inc. from 1989 until 2003, and then served as Group Manager of Science Applications International Corporation (SAIC) until 2004. Ms. Bradley also served on the board of directors of ALAB from 2005 until it was acquired in 2008. Our board of directors believes that Ms. Bradley’s skills and professional experience in a variety of operational and leadership roles give her a wide range of knowledge on topics important to our business and operations and contributes important insight to our board of directors.
R. Holman Head was appointed to our board of directors in 2013. Mr. Head currently serves as President and Chief Operating Officer of O’Neal Industries, the largest family-owned group of metals service centers in the United States. Mr. Head has been employed by O’Neal Industries in various positions since 1980. Mr. Head is also a partner and officer of Sigma Investments, a private investment company. Mr. Head’s extensive experience as a senior executive officer of a corporation adds valuable expertise and insight to our board of directors.
Jerry D. Kimbrough was appointed to the board of directors of Red Mountain Bank in 2004 and to our board of directors in 2010. Mr. Kimbrough is a certified public accountant and a senior member of the accounting firm of Warren Averett, LLC located in Birmingham, Alabama. Warren Averett, LLC is the largest independent accounting firm in Alabama and ranks in the top 30 accounting firms in the United States. Mr. Kimbrough’s 40 years of experience as a public accountant, as well as his years of experience as our director, add valuable expertise and insight to our board of directors.
C. Phillip McWane was appointed to our board of directors in 2010. Mr. McWane has served as Chairman of McWane, Inc., a pipe and valve manufacturing and technology company, since 1999. Mr. McWane has been
95
Table of Contents
Index to Financial Statements
employed by McWane, Inc. in various positions since 1980. Mr. McWane also served on the board of directors of ALAB from 1995 until it was acquired in 2008. Mr. McWane’s 15 years of experience as a senior executive of a corporation adds valuable expertise and insight to our board of directors.
G. Ruffner Page, Jr. was appointed to our board of directors in 2010. Mr. Page has served as President of McWane, Inc., a pipe and valve manufacturing and technology company, since 1999. Mr. Page previously served as Executive Vice President of National Bank of Commerce, a subsidiary of Alabama National BanCorporation, from 1989 until 1994, at which time he accepted employment at McWane, Inc. Mr. Page also served on the board of directors of ALAB from 1995 until it was acquired in 2008. Mr. Page’s experience as a senior banking executive and a senior executive of McWane, Inc. gives him a wide range of knowledge on topics important to the banking business and contributes valuable experience and insight to our board of directors.
W. Stancil Starnes was appointed to our board of directors in 2010. Mr. Starnes currently serves as Chairman of the Board of Directors and Chief Executive Officer of ProAssurance Corporation, a public holding company for property and casualty insurance companies focused on professional liability insurance. Mr. Starnes practiced law from 1972 until October 2006 and then served as President of Corporate Planning and Administration for Brasfield & Gorrie until May 2007. Mr. Stames currently serves as a director of Infinity Property and Casualty Corporation, a public insurance holding company based in Birmingham, Alabama, where he serves on the audit, compensation, and executive committees. He also served on the board of directors of ALAB from 1995 until it was acquired in 2008. Mr. Starnes has gained valuable insight into the operation and governance of companies through his more than 30 years of legal experience and his management experience with various companies, including public companies.
Temple W. Tutwiler, III was appointed to our board of directors in 2013. Mr. Tutwiler serves as President of Shades Creek Real-Estate & Investment Co. and as a general partner in Tutwiler Properties, Ltd., and serves as an officer of or partner in other family-controlled entities. Mr. Tutwiler has more than 30 years of experience in managing and developing real estate in central Alabama, as well as managing stock and bond portfolios. Mr. Tutwiler also served on the board of directors of First American Bank, ALAB’s largest subsidiary bank, from 1995 until 2008. Our board of directors believes that Mr. Tutwiler’s skills and professional experience in a variety of operational and leadership roles in the real estate and banking industries give him a wide range of knowledge on topics important to our business and operations and contributes valuable experience and insight to our board of directors.
Russell H. Vandevelde, IV was appointed to the board of directors of Red Mountain Bank in 2004 and to our board of directors in 2010. Mr. Vandevelde currently serves as Chief Executive Officer and is a founding member of Executive Benefits Specialists, LLC, an organization specializing in the design, implementation, and administration of benefit plans for financial institutions, with a concentration in community banks. Mr. Vandevelde served as Chairman of our board of directors from approximately May 2009 until October 2010. Our board of directors believes that Mr. Vandevelde’s 15 years as a consultant to financial institutions, as well as his experience as our director, add valuable expertise and insight to our board of directors.
Donald F. Wright was appointed to our board of directors in December 2014 in connection with the completion of our acquisition of United. Mr. Wright has more than 40 years of experience as a lawyer and is currently a senior partner in the law firm of Wright, Fulford, Moorhead & Brown, P.A. Mr. Wright served as a member of the board of directors of United from February 2010 until December 2014, at which time he joined our board of directors following our acquisition of United. Mr. Wright serves on our board of directors and the boards of directors of NBC and ULB. Our board of directors believes that Mr. Wright’s extensive experience as a practicing attorney, during which period he has advised a number of companies on a variety of issues, provides a unique and valuable perspective to our board of directors.
Board Size and Composition
Our certificate of incorporation and bylaws provide that our board of directors will consist of up to 20 directors, with the precise number of directors being determined by our board of directors from time to time. We currently have 12 directors. Our directors are elected for a one-year term and hold office until their successors are duly elected and qualified, or until their earlier death, resignation or removal.
96
Table of Contents
Index to Financial Statements
Director Independence
Our board of directors has determined that all of our directors are “independent directors,” as defined in NASDAQ Marketplace Rule 5605(a)(2), except for Messrs. Holcomb, Murray, and Matthews, who are our senior executive officers. In determining each director’s independence, our board of directors considered the services provided, any loan transactions between us or NBC and the director or the director’s family members or businesses with which our directors or their family members are associated, and other matters that our board of directors deemed pertinent.
Leadership Structure
Mr. Holcomb currently serves as the Chairman of our board of directors and as our Chief Executive Officer. Our board of directors does not have a fixed policy regarding combining the roles of the Chairman and the Chief Executive Officer because it believes that it is in the best interests of our Company to have the flexibility to determine, from time to time, whether the positions should be held by the same person or by separate persons based on the leadership needs of our board of directors and the Company at any particular time. Our board of directors believes that, at this time, having Mr. Holcomb serve in both roles is the most effective leadership structure for our board of directors and is in the best interests of us and our shareowners. In making this determination, our board of directors considered (among other things):
| • | Mr. Holcomb’s proven leadership ability and knowledge of our business and operations; |
| • | that combining these roles provides clear leadership for our board of directors and management, which facilitates development and execution of our strategic initiatives and business plans; |
| • | that combining these roles demonstrates to our employees, customers, and other stakeholders our board of directors’ confidence in Mr. Holcomb’s leadership; |
| • | the fact that nine of our other directors are all “independent directors,” as defined in NASDAQ Marketplace Rule 5605(a)(2); |
| • | the fact that our other directors are diligent and active in their service as directors; and |
| • | the effectiveness of our governance structure and processes. |
Because the positions of Chairman and Chief Executive Officer are held by the same person, our board of directors has designated G. Ruffner Page, Jr. to serve as lead independent director, effective as of January 22, 2015. As lead independent director, Mr. Page will preside over periodic meetings of our independent directors, serve as a liaison between our Chief Executive Officer and the independent directors and perform such additional duties as our board of directors may otherwise determine and delegate.
Meetings and Committees of Our Board of Directors
Our board of directors conducts its business through meetings of the full board of directors and its committees. Board committees include an audit committee, a compensation committee, a nominating and corporate governance committee, and an executive committee. The audit and compensation committees were established by our board of directors on July 17, 2014, the nominating and corporate governance committee was established by our board of directors on October 16, 2014, and the executive committee was established by our board of directors on December 20, 2011. During 2014, our board of directors held 12 meetings. Additionally, the audit committee met 2 times, the compensation committee met 1 time, the nominating and corporate governance committee did not meet, and the executive committee met 1 time.
Audit Committee
The audit committee is responsible for, among other things, the selection, engagement, retention, and compensation of our independent accountants, and the resolution of any disagreements with our independent accountants; the selection, engagement, retention, and compensation of our internal auditing firm; reviewing the audit plan of our independent accountants, the scope and results of their audit engagement, and the accompanying management letter, if any; reviewing the scope and results of our internal auditing; consulting with the independent accountants and management with regard to our accounting methods and principles and the adequacy of our internal financial controls; the preparation of any reports required of an audit committee under
97
Table of Contents
Index to Financial Statements
the rules of the SEC; review of major issues regarding financial statement presentations; the review and approval of related party transactions; pre-approving all audit and permissible non-audit services provided by the independent accountants; reviewing the independence of the independent accountants; and reviewing the range of the independent accountants’ audit and non-audit fees. The audit committee charter is available on NBC’s website at www.nationalbankofcommerce.com, under the “Investor Relations” tab.
The current members of our audit committee are Jerry D. Kimbrough (Chairman), Bobby A. Bradley, R. Holman Head, and Temple W. Tutwiler, III. Our board of directors has determined that (i) each member of our audit committee is an “independent director” as defined in NASDAQ Marketplace Rule 5605(a)(2), (ii) Ms. Bradley, Mr. Head, and Mr. Tutwiler satisfy the heightened independence standards of NASDAQ Marketplace Rule 5605(c)(2)(A)(ii) and SEC Rule 10A-3, (iii) each member of our audit committee is financially literate under the rules and regulations of the NASDAQ Stock Market and the SEC; and (iv) Mr. Kimbrough meets the criteria specified under applicable SEC regulations for an “audit committee financial expert,” as defined in the SEC rules, and satisfies the financial sophistication requirements of the NASDAQ Stock Market.
Compensation Committee
Our compensation committee is responsible for, among other duties as may be directed by our board of directors, reviewing the performance of, and determining and recommending to our board of directors the compensation of, our Chief Executive Officer; reviewing corporate goals relevant to the compensation of our Chief Executive Officer; making recommendations to our board of directors regarding the compensation of all of our executive officers; and reviewing and administering our employee benefit plans and incentive compensation plans, including making grants under those plans. The compensation committee also reviews and approves certain compensation information that we will include in our proxy statements and annual report filings; reviews any employment agreements and any severance arrangements or plans of our executive officers; determines stock ownership guidelines for our executive officers and directors and monitors compliance therewith; reviews and recommends director compensation; and engages and consults with outside compensation consultants, legal counsel, and other advisors as the committee deems necessary. The compensation committee charter is available on NBC’s website at www.nationalbankofcommerce.com, under the “Investor Relations” tab.
The current members of the compensation committee are G. Ruffner Page, Jr. (Chairman), R. Holman Head, W. Stancil Starnes, and Russell H. Vandevelde, IV. Our board of directors has determined that each member of the compensation committee satisfies the independence standards of NASDAQ Marketplace Rule 5605(d)(2)(A) for purposes of serving on a compensation committee, including being an “independent director” as defined in NASDAQ Marketplace Rule 5605(a)(2).
Nominating and Corporate Governance Committee
Our nominating and corporate governance committee is responsible for, among other duties as may be directed by our board of directors, determining the qualifications, qualities, skills, and other expertise required to be a director; developing and recommending to our board of directors criteria to be considered in selecting nominees for director; identifying and screening individuals qualified to become directors; and making recommendations to our board of directors regarding changes in the size of our board of directors and the selection and approval of nominees for director to be submitted to a shareowner vote at annual meetings of shareowners. This committee also is charged with developing and overseeing Corporate Governance Guidelines; developing a process for an annual evaluation of our board of directors and its committees and overseeing such evaluations; reviewing our board committee structure; monitoring communications from shareowners; and reviewing and making recommendations to our board of directors with respect to succession plans for our senior management. The nominating and corporate governance committee charter is available on NBC’s website at www.nationalbankofcommerce.com, under the “Investor Relations” tab.
The current members of our nominating and corporate governance committee are W. Stancil Starnes (Chairman), G. Ruffner Page, Jr., and Temple W. Tutwiler, III. Our board of directors has determined that each member of the nominating and corporate governance committee is an “independent director” as defined in NASDAQ Marketplace Rule 5605(a)(2).
98
Table of Contents
Index to Financial Statements
Executive Committee
The executive committee is authorized to exercise the authority of our board of directors between board meetings, subject to certain limitations. Although the executive committee generally has authority to exercise all powers and authority of the full board of directors in the management and direction of our business and affairs, the executive committee may not approve, adopt, or recommend to the shareowners any action or matter (other than the election or removal of directors) expressly required by law to be submitted to shareowners for approval, nor may it adopt, amend, or repeal any of our bylaws. The executive committee does not have a charter. Current members of the executive committee include G. Ruffner Page, Jr. (Chairman), C. Phillip McWane, John H. Holcomb, III, Richard Murray, IV, and William E. Matthews, V.
Compensation Committee Interlocks and Insider Participation
No member of our compensation committee is or has been at any time an employee of ours. None of the members of our compensation committee is or has been one of our officers, except that G. Ruffner Page, Jr. was considered a non-employee executive officer from December 20, 2011 until July 17, 2014 due to the position of chairman of our executive committee having been designated as one of our “executive officers” during such time period.
None of our executive officers serves or will serve on the board of directors or compensation committee of an entity that has an executive officer that serves on our board of directors or compensation committee. No member of our board of directors is an executive officer of an entity for which one of our executive officers serves as a member of the board of directors or compensation committee thereof.
To the extent that any members of our compensation committee have participated in transactions with us, a description of those transactions is provided in “Director Compensation” and “Certain Relationships and Related Party Transactions.”
Board of Directors’ Role in Risk Oversight
Our board of directors, as a whole and through its committees, has responsibility for the oversight of risk management. In its risk oversight role, our board of directors has the responsibility to satisfy itself that the risk management processes designed and implemented by management are adequate and functioning as designed. Our board of directors oversees an enterprise-wide approach to risk management, designed to support the achievement of organizational objectives, including strategic objectives, to improve long-term organizational performance and enhance shareowner value.
Code of Ethics and Business Conduct
We have adopted a Code of Ethics for CEO and Senior Financial Officers that applies to our Chief Executive Officer, Chief Financial Officer, Controller, and other senior financial officers, or the Senior Officers Code. The Senior Officers Code was designed to be read and applied in conjunction with our Code of Ethics and Business Conduct, or the Code of Business Conduct, applicable to the members of our board of directors and all employees, including our senior financial officers. Both the Senior Officers Code and the Code of Business Conduct are available on NBC’s website at www.nationalbankofcommerce.com, under the “Investor Relations” tab. Any future changes or amendments to the Senior Officers Code or the Code of Business Conduct, and any waiver of the Senior Officers Code or the Code of Business Conduct that applies to our Chief Executive Officer, Chief Financial Officer or Principal Accounting Officer, will be posted to NBC’s website at www.nationalbankofcommerce.com.
Nominations
Any shareowner of our outstanding capital stock entitled to vote on the election of directors also may nominate individuals for election to our board of directors. Nominations, other than those made by our board of directors, must be in writing and must be delivered or mailed to our Secretary no earlier than 150 nor later than 120 days prior to the first anniversary of the prior year’s annual meeting of shareowners; however, if the date of the annual meeting is more than 30 days before or 70 days after such anniversary, or if no annual meeting was
99
Table of Contents
Index to Financial Statements
held in the preceding year, notice must be received no earlier than 150 days before nor less than 120 days before the annual meeting, unless the first public announcement of the date of such meeting is less than 130 days before the date of such annual meeting, in which case notice must be received no later than the tenth day following the day on which such announcement is made. Written nominations by shareowners must contain, to the extent known to the nominating shareowner, the name and address of each proposed nominee, the principal occupation of each proposed nominee, the name and address of the nominating shareowner, the number of shares of capital stock owned by the nominating shareowner, and certain other information set forth in our bylaws. Nominations not made in accordance with these requirements may be disregarded by the chairman of the meeting, and votes for such nominees disregarded.
On January 22, 2015, our nominating and corporate governance committee adopted, and our board of directors approved, corporate governance guidelines specifying the procedures to be followed and criteria to be considered in identifying and evaluating nominees. Under the guidelines, the criteria to be used by the nominating and corporate governance committee in evaluating potential directors should include relevant experience, intelligence, independence, commitment, integrity, diligence, conflicts of interest, age, compatibility with our management team and culture, prominence, understanding of our business, the ability to act in the interests of all stockholders and other factors that the committee may deem relevant, including issues of diversity. The goal of the committee is to identify and nominate a group of directors that will provide a significant composite mix of experience, knowledge and abilities and will allow the board to fulfill its responsibilities. Any individuals proposed by our shareowners to be included by our board for inclusion in its slate of nominees for director will be evaluated by following substantially the same process, and applying substantially the same criteria, as for candidates submitted by board members.
Additional Information Concerning Directors
Our directors serve one-year terms. With the exception of Donald F. Wright, none of the directors or executive officers was selected pursuant to any arrangement or understanding, other than with our directors and executive officers acting within their capacities as such. Under the terms of our merger agreement with United, Mr. Wright will serve until our 2015 annual meeting of shareowners and will be nominated for election at the first two annual meetings of our shareowners following the effective date of the merger (December 15, 2014), unless he is disqualified from service as a director based on the occurrence of certain specified events. Except for the relationship between R. Holman Head and G. Ruffner Page, Jr. as brothers-in-law, there are no family relationships between our directors and executive officers. None of our directors or executive officers serves as a director of any company that has a class of securities registered under, or that is subject to the periodic reporting requirements of, the Exchange Act, or any investment company registered under the Investment Company Act of 1940, other than Mr. Starnes, who serves as Chairman and Chief Executive Officer of ProAssurance Corporation and as a director of Infinity Property and Casualty Corporation, each of which has a class of securities registered under, and is subject to the periodic reporting requirements of, the Exchange Act. None of our directors or executive officers has been involved in any legal proceedings during the past 10 years that are material to an evaluation of the ability or integrity of any of our directors or executive officers or in which such director or officer has or had a material interest adverse to us or any of our subsidiaries. The principal occupation and employment during the past five years of each of our directors and executive officers was carried on, in each case except as specifically identified above, with a corporation or organization that is not a parent, subsidiary or other affiliate of us.
100
Table of Contents
Index to Financial Statements
Compensation of Executive Officers
We are an emerging growth company and are providing disclosure regarding our executive compensation arrangements pursuant to the rules applicable to smaller reporting companies, which means that we are not required to provide a compensation discussion and analysis and certain other disclosure regarding our executive compensation.
Our executive compensation program is designed to attract, motivate, and retain high-quality leadership and incentivize our executive officers to achieve performance goals over the short- and long-term, which also aligns the interests of our executive officers with our shareowners. The following discussion relates to the compensation of our Chief Executive Officer and Chairman of our board of directors, John H. Holcomb, III, and our two most highly compensated executive officers in 2014 (other than Mr. Holcomb), our President and Chief Operating Officer, Richard Murray, IV, and our Chief Financial Officer and Vice Chairman, William E. Matthews, V. Messrs. Holcomb, Murray, and Matthews are collectively referred to herein as our named executive officers. Our board of directors has historically reviewed and determined the compensation of our named executive officers on an annual basis. Beginning in the third quarter of 2014, however, the compensation of our named executive officers is reviewed by the compensation committee and recommended to the independent members of our board of directors.
Elements of Executive Compensation
We do not currently have employment agreements with any of our executive officers. The compensation of our named executive officers presently consists of base salary, equity awards, non-equity incentive compensation, and certain other employee benefits, as further described below.
Base Salaries. Base salaries for our named executive officers are determined based on each officer’s responsibilities, experience, and contributions to our growth, individual performance, Company performance, and general industry conditions.
Equity Awards. Our named executive officers participate in the Incentive Plan. See “2011 Equity Incentive Plan” beginning on page 102 for additional information regarding the Incentive Plan. Grants of equity to our named executive officers under the Incentive Plan have consisted of option awards (none since 2011) and performance share awards. Collectively, these grants provide our named executive officers with the appropriate incentives to continue in our employ and to improve our growth and profitability, serve to align the interests of our named executive officers with our shareowners, and reward our named executive officers for improved Company performance.
Messrs. Holcomb, Murray, and Matthews received grants of performance shares under the Incentive Plan effective as of January 1, 2012, 2013 and 2014 and January 22, 2015. In general, the awards are earned following a four-year award period beginning on January 1 of the applicable year. The earned percentage of the target award is based on the average of our after-tax earnings relative to the corresponding budgets for each of the four years of the award period. However, in order for Messrs. Holcomb, Murray, and Matthews to receive any payout of the award, we must have maintained certain levels of net charge-offs, as compared to other metrics, such as average loans, non-performing assets and other real estate owned, during the applicable four-year award period. Once earned, the awards are payable in shares of our common stock.
Non-Equity Incentive Compensation. Our named executive officers are also eligible to receive an annual cash bonus as a percentage of base salary based on our net income during the year, relative to our budgeted expectations for the year.
Other Employee Benefits. We provide the following additional benefits to our named executive officers on the same basis as all other eligible employees:
| • | Company-sponsored healthcare plans, including coverage for medical and dental benefits; |
| • | a qualified 401(k) savings plan with a matching contribution; and |
| • | payment of life and accidental death and dismemberment insurance premiums. |
101
Table of Contents
Index to Financial Statements
Summary Compensation Table
The following table sets forth, for the years ended December 31, 2014, 2013 and 2012, a summary of the compensation paid to or earned by our named executive officers.
| Name and Principal Position |
Year | Salary ($) |
Stock Awards ($)(1) |
Non-Equity Incentive Plan Compensation ($) |
All Other Compensation ($)(2) |
Total ($) |
||||||||||||||||||
| John H. Holcomb, III |
2014 | 220,000 | 40,000 | 100,000 | 4,647 | 364,647 | ||||||||||||||||||
| Chief Executive Officer and Chairman |
2013 | 200,000 | 30,000 | 80,000 | 3,248 | 313,248 | ||||||||||||||||||
| 2012 | 175,000 | 27,500 | 90,000 | 2,438 | 294,938 | |||||||||||||||||||
| Richard Murray, IV |
2014 | 220,000 | 40,000 | 100,000 | 2,112 | 362,112 | ||||||||||||||||||
| President, Chief Operating Officer |
2013 | 200,000 | 30,000 | 80,000 | 1,998 | 311,998 | ||||||||||||||||||
| 2012 | 165,000 | 27,500 | 90,000 | 2,356 | 284,856 | |||||||||||||||||||
| William E. Matthews, V |
2014 | 220,000 | 40,000 | 100,000 | 2,941 | 362,941 | ||||||||||||||||||
| Chief Financial Officer and Vice |
2013 | 200,000 | 30,000 | 80,000 | 3,248 | 313,248 | ||||||||||||||||||
| Chairman of the Board |
2012 | 165,000 | 27,500 | 90,000 | 2,364 | 284,864 | ||||||||||||||||||
| (1) | Stock awards are reported as the grant date fair value of the shares, computed in accordance with the Financial Accounting Standards Board’s Accounting Standards Codification Topic 718, Compensation – Stock Compensation. These amounts represent the grant date fair value of performance shares awarded to Messrs. Holcomb, Murray, and Matthews on January 1, 2014, 2013 and 2012, respectively. |
| (2) | The amounts in the “All Other Compensation” column for each executive officer include (i) annual premiums of $312 (for 2014) and $248 (for 2013 and 2012) that we paid for life insurance and accidental death and dismemberment policies and (ii) amounts that we contributed to the 401(k) plan account of the executive officer. |
2011 Equity Incentive Plan
General. The Incentive Plan was approved by our shareowners at our annual meeting on October 25, 2011. The purpose of the Incentive Plan is to promote our interests and those of our shareowners by granting equity and equity-related incentives to our employees and affiliates, including NBC employees, in order to provide an additional incentive to each employee to work to increase the value of our common stock and to provide each employee with a stake in our future that corresponds to that of our shareowners. The Incentive Plan provides for the grant of incentive and non-qualified stock options, stock appreciation rights, restricted and unrestricted stock awards, phantom stock, performance awards, and other stock-based awards to our employees, officers, and directors and those of our affiliates, including NBC employees, as further described below. The Incentive Plan reserved for issuance a total of 500,000 shares of our common stock, subject to adjustment in the event of a recapitalization, stock split or similar event. As of February 25, 2015, 219,500 shares of our common stock were subject to outstanding options under the Incentive Plan, 149,278 shares of our common stock were subject to issuance upon vesting of outstanding performance awards under the Incentive Plan (based on projections of the earned percentages of outstanding performance awards as of such date), and 118,722 additional shares of our common stock were reserved for issuance under the Incentive Plan.
Administration of the Incentive Plan. The Incentive Plan provides that it will be administered either by our board of directors or a committee thereof that is appointed by our board of directors for such task, or the Administrator. Currently, the compensation committee of our board of directors is the Administrator of the Incentive Plan. The Administrator has the authority to grant awards under the Incentive Plan, to determine the terms of each award (which are evidenced by a written agreement describing the material terms of the award), to interpret the provisions of the Incentive Plan and to make all other determinations that it may deem necessary or advisable to administer the Incentive Plan.
102
Table of Contents
Index to Financial Statements
Types of Awards Available Under the Incentive Plan.
| • | Options – The Incentive Plan provides for awards in the form of options to purchase shares of our common stock, either as incentive stock options qualified under Section 422 of the Code or options that are not so qualified (referred to as non-qualified stock options). The exercise price of an option may not be less than 100% of the fair market value of our common stock on the date of the grant. The exercise price may be paid in cash, or as otherwise provided in the award agreement. |
| • | Stock Appreciation Rights – The Incentive Plan provides for the grant of stock appreciation rights. The base price of a stock appreciation right may not be less than 100% of the fair market value of our common stock on the date of the grant. The consideration payable upon exercise of a stock appreciation right will be paid in cash, shares of our common stock, or a combination of cash and shares of our common stock, as determined in the sole discretion of the Administrator. |
| • | Stock Awards – The Incentive Plan provides for the grant of restricted or unrestricted stock awards. Stock awards may be issued for any lawful consideration as the Administrator may determine, and the consideration may be in the form of services performed, or may be paid in cash, shares of our common stock, or a combination of cash and shares of our common stock, as determined in the sole discretion of the Administrator. |
| • | Phantom Stock – The Incentive Plan provides for the grant of phantom stock, or awards denominated in stock-equivalent units. Phantom stock units granted to a participant will be credited to a bookkeeping reserve account solely for accounting purposes and will not require a segregation of any of our assets. An award of phantom stock may be settled in cash, shares of our common stock, or a combination of cash and shares of our common stock, as determined in the sole discretion of the Administrator. |
| • | Performance Awards – The Incentive Plan provides for the grant of performance awards that become payable on account of attainment of one or more performance goals established by the Administrator. Performance awards may be settled in cash, shares of our common stock, or a combination of cash and our common stock, as determined in the sole discretion of the Administrator. Performance goals established by the Administrator may be based on our or an affiliate’s operating income or one or more other business criteria selected by the Administrator that apply to an individual or group of individuals, a business unit, or us or an affiliate as a whole, over such performance period as the Administrator may designate. |
| • | Other Stock-Based Awards – The Incentive Plan provides for the grant of other stock-based awards for any lawful consideration as the Administrator may determine. Other stock-based awards may be denominated in cash, in shares of our common stock or other securities, in stock-equivalent units, in stock appreciation units, in securities or debentures convertible into shares of our common stock, or in any combination of the foregoing and may be paid in cash, shares of our common stock, or other securities, in a combination of cash and shares of our common stock, as determined in the sole discretion of the Administrator. |
Vesting. The Administrator has the authority to determine the vesting schedule applicable to each award, and to accelerate the vesting or exercisability of any award.
Performance Criteria. The Incentive Plan provides that the Administrator may grant performance awards that become payable on account of attainment of one or more performance goals established by the Administrator, which may be based on our or an affiliate’s operating income or one or more other business criteria that apply to an individual or group of individuals, a business unit, or us or an affiliate as a whole, over such performance period as the Administrator may designate.
Transferability. Awards granted under the Incentive Plan may not be transferred by a grantee except by will or the laws of descent and distribution, unless (for awards other than incentive stock options or stock appreciation rights granted with respect to incentive stock options) otherwise provided by the Administrator.
Change in Control Transactions. In the event of any transaction resulting in a change in control of us, outstanding stock options and other awards under the Incentive Plan that are payable in or convertible into our
103
Table of Contents
Index to Financial Statements
common stock will terminate upon the effective time of such change in control unless provision is made in connection with the transaction for the continuation or assumption of such awards by, or for the substitution of the equivalent awards of, the surviving or successor entity or a parent thereof. In the event of such termination, the holders of such awards will be permitted, immediately before the change in control, to exercise or convert all portions of such awards that are then exercisable or convertible or that will become exercisable or convertible upon or prior to the effective time of the change in control. The Administrator may, in its sole discretion, take such actions as it deems appropriate to provide for the acceleration of the exercisability of any or all outstanding stock options or other awards.
Adjustments for Other Corporate Transactions. In the event of certain corporate transactions (including a stock dividend or split, spin-off, split-up, dividend, recapitalization, merger, consolidation or share exchange, or similar corporate change that is not part of a transaction resulting in a change in control of us), the Administrator will appropriately adjust, if needed, (a) the maximum number and kind of shares reserved for issuance or with respect to which awards may be granted under the Incentive Plan and (b) the terms of outstanding awards, including, but not limited to, the number, kind, and price of securities subject to such awards.
Termination and Amendment. Our board of directors may terminate, amend, or modify the Incentive Plan or any portion thereof at any time. Except as otherwise determined by our board of directors, termination of the Incentive Plan shall not affect the Administrator’s ability to exercise the powers granted to it with respect to awards granted under the Incentive Plan prior to the date of termination.
Outstanding Equity Awards at 2014 Fiscal Year-End
The following table sets forth information as of December 31, 2014, concerning outstanding equity awards previously granted to our named executive officers:
| Option Awards | Stock Awards | |||||||||||||||||||||||||||||||||||
| Name of Executive |
Number of Securities Underlying Unexercised Options (#) Exercisable |
Number of Securities Underlying Unexercised Options (#) Unexercisable |
Equity Incentive Plan Awards: Number of Securities Underlying Unexercised Unearned Options (#) |
Option Exercise Price ($) |
Option Expiration Date |
Number of Shares or Units of Stock That Have Not Vested (#) |
Market Value of Shares or Units of Stock That Have Not Vested ($) |
Equity Incentive Plan Awards: Number of Unearned Shares, Units or Other Rights That Have Not Vested (#)(1) |
Equity Incentive Plan Awards: Market or Payout Value of Unearned Shares, Units or Other Rights That Have Not Vested ($)(2) |
|||||||||||||||||||||||||||
| John H. Holcomb, III |
23,500 | — | — | 14.57 | 12/31/21 | — | — | 7,313.26 | 132,004.34 | |||||||||||||||||||||||||||
| Richard Murray, IV |
23,500 | — | — | 14.57 | 12/31/21 | — | — | 7,313.26 | 132,004.34 | |||||||||||||||||||||||||||
| William E. Matthews, V |
23,500 | — | — | 14.57 | 12/31/21 | — | — | 7,313.26 | 132,004.34 | |||||||||||||||||||||||||||
| (1) | Messrs. Holcomb, Murray, and Matthews received grants of performance share awards as of January 1, 2012, or the 2012 grant, as of January 1, 2013, or the 2013 grant, and as of January 1, 2014, or the 2014 grant. See “Compensation of Executive Officers – Elements of Executive Compensation; Equity Awards” beginning on page 104 for additional information. The number of performance shares set forth in this column represents the projected number of performance shares, as of December 31, 2014, that each named executive officer could earn at the end of the four-year performance periods ending December 31, 2015 (for the 2012 grant), December 31, 2016 (for the 2013 grant), and December 31, 2017 (for the 2014 grant) based on actual performance during the first three years of the award period for the 2012 grant, the first two years of the award period for the 2013 grant, and the first year of the award period for the 2014 grant. The number of performance shares actually earned by the named executive officers will be determined based on actual performance over the entire four-year award periods for the 2012, 2013 and 2014 grants, and such amount may differ significantly from the amounts shown in this column. |
| For the 2012 grant, the earned percentage of each executive’s award is based on the average of our after-tax earnings relative to the corresponding budgets for each of the four years of the award period; provided, however, that, in order for the executive to receive any payout of the award, we must maintain net charge-offs and non-performing assets at levels averaging at the 50th percentile ranking or better over the four years of the award period when compared to a group of our peers, subject to certain adjustments in the discretion of the compensation committee. |
104
Table of Contents
Index to Financial Statements
| For the 2013 grant and the 2014 grant, the earned percentage of each executive’s award is based on the average of our after-tax earnings relative to the corresponding budgets for each of the four years of the award period; provided, however, that, in order for the executive to receive any payout of the award, we must maintain net charge-offs averaging less than 0.60% of average loans and non-performing assets averaging less than 1.25% of average loans plus other real estate owned over the four years of the award period, subject to certain adjustments in the discretion of the compensation committee. |
| (2) | The amounts shown in this column represent the product of $18.05, which is the book value per share of our common stock on December 31, 2014, and the number of performance shares reflected in the table for the named executive officers as of December 31, 2014. |
Deferral of Compensation Plan
On December 18, 2014, our board of directors adopted the National Commerce Corporation Deferral of Compensation Plan for Key Employees and Non-Employee Directors, or the Deferral Plan, which became effective as of the date of adoption. Under the Deferral Plan, directors and members of a select group of management and highly compensated employees selected by the board or the compensation committee may make an irrevocable election to defer receipt of all or a portion of any form of compensation that is determined by the board or the compensation committee to be eligible for deferral. The Deferral Plan specifies the required timing of the election based on the form of compensation to be received.
A participant in the Deferral Plan may elect to defer all or a portion of his or her deferrable cash compensation into a designated subaccount in which the balance will accrue interest at the 30-Day London Interbank Offered Rate (LIBOR) plus 75 basis points. Alternatively, participants may defer cash compensation and must defer equity compensation into an account that tracks the performance of our common stock and from which distributions may be made solely in the form of shares of our common stock. Generally, a participant may elect to receive distributions either in a lump sum upon a specific date or in annual installments, subject to certain provisions in the Deferral Plan that dictate the timing of such distributions in various circumstances, including death, a change in control, or separation from service prior to age 60. Each participant is always 100% vested in amounts attributable to his or her personal contributions, but any contributions by us may be subject to a vesting schedule.
The Deferral Plan is a non-qualified deferred compensation plan. As such, the rights of all participants to any deferred amounts represent our unsecured promise to pay, and the deferred amounts remain subject to the claims of our creditors.
In connection with the board’s adoption of the Deferral Plan, the board terminated our existing deferral of compensation plan that was adopted in 2012, under which no deferrals had been made.
Retirement Benefits
We maintain a tax-qualified 401(k) savings plan, or the 401(k) Plan, in which our named executive officers participate. The 401(k) Plan allows participants to contribute up to 100% of their pay on a pre-tax basis into individual retirement accounts, subject to the maximum annual limits set by the IRS. We make a matching employer contribution in an amount equal to 50% of the first 3% of each plan participant’s elective deferrals. All contributions to the 401(k) Plan are in the form of cash. Employer contributions vest 20% per year over a 5-year service period. Participants are immediately fully vested in their own contributions to the 401(k) Plan.
Director Compensation
Fees
During 2014, our non-employee directors received $400 for each board meeting that they attended, except for the January board meeting, for which the attendance fee was $200. Beginning on January 1, 2015, our non-employee directors receive an annual retainer of $10,000. Further, our non-employee directors receive an additional $700 for each board meeting attended, $500 for each committee meeting attended in person, and $300 for any committee meeting held telephonically.
All of our directors also serve as directors of NBC. During 2014, our directors received no additional compensation for this board service. Beginning on January 1, 2015, non-employee NBC directors receive an
105
Table of Contents
Index to Financial Statements
annual retainer of $10,000 and an additional $300 for each committee meeting attended; provided, however, that the NBC directors who also serve on NCC’s board do not receive additional retainers or meeting fees in connection with their NBC board service.
Deferral of Compensation Plan
Our directors may participate in the Deferral Plan, as described above.
2014 Non-Employee Director Compensation Table
The following table provides information regarding compensation earned by or paid to our non-employee directors in 2014:
| Name(1) |
Fees Earned or Paid in Cash ($) |
Nonqualified Deferred Compensation Earnings ($) |
Total ($) |
|||||||||
| Bobby A. Bradley |
3,800 | 3,800 | ||||||||||
| R. Holman Head |
4,200 | 4,200 | ||||||||||
| Jerry D. Kimbrough |
5,000 | 5,000 | ||||||||||
| C. Phillip McWane |
4,600 | 4,600 | ||||||||||
| G. Ruffner Page, Jr. |
3,400 | $ | 40,000 | (2) | 43,400 | |||||||
| W. Stancil Starnes |
5,000 | 5,000 | ||||||||||
| Temple W. Tutwiler, III |
3,800 | 3,800 | ||||||||||
| Russell H. Vandevelde, IV |
5,000 | 5,000 | ||||||||||
| Donald F. Wright |
400 | 400 | ||||||||||
| (1) | Although Messrs. Holcomb, Murray, and Matthews serve on our board of directors in addition to their service as our executive officers, they currently receive no additional compensation for their service as directors. |
| (2) | Mr. Page received a grant of performance shares under the Incentive Plan as of January 1, 2014, or the 2014 award, in connection with his service as chairman of the executive committee of our board of directors. Mr. Page’s 2014 award vests over a four-year period beginning on January 1, 2014 and ending on December 31, 2017. The earned percentage of the target award of 2,577.32 shares is based on the average of our after-tax earnings relative to the corresponding budgets for each of the four years of the award period; provided, however, that, in order for Mr. Page to receive any payout of the award, we must maintain net charge-offs averaging less than 0.60% of average loans and non-performing assets averaging less than 1.25% of average loans plus other real estate owned over the four years of the award period, subject to certain adjustments in the discretion of the compensation committee. See “2011 Equity Incentive Plan” beginning on page 102 for additional information. At the end of fiscal year 2014, a total of 7,313.26 shares were subject to issuance to Mr. Page upon vesting of outstanding performance awards under the Incentive Plan, based on projections of the earned percentages of outstanding performance awards as of such date. |
106
Table of Contents
Index to Financial Statements
CERTAIN RELATIONSHIPS AND RELATED PARTY TRANSACTIONS
Policy for the Review and Approval of Related Person Transactions
Under SEC rules, a “related person” is an officer, director, nominee for director, or beneficial holder of more than 5% of any class of our voting securities since the beginning of the last fiscal year, or an immediate family member of any of the foregoing. Pursuant to our related party transaction written policy, directors (including director nominees), executive officers, and employees are required to report any transactions that constitute a transaction requiring disclosure under Item 404 of SEC Regulation S-K. Our CEO, in consultation with outside counsel, makes the initial determination as to whether a potential transaction constitutes a related party transaction. Following this initial determination, the audit committee of our board of directors is responsible for evaluating each related party transaction and making a recommendation to the disinterested members of our board of directors as to whether the transaction at issue is fair, reasonable, and within our policy and whether it should be ratified and approved. The audit committee, in making its recommendation, considers various factors, including the benefit of the transaction to us, the terms of the transaction and whether they are at arm’s-length and in the ordinary course of our business, the direct or indirect nature of the related person’s interest in the transaction, the size and expected term of the transaction, and other facts and circumstances that bear on the materiality of the related party transaction under applicable law and listing standards. The audit committee reviews, at least annually, a summary of our transactions with our directors and officers and with firms that employ our directors, as well as any other related person transactions.
Prior to the adoption of the written policy, our board of directors used similar processes and controls to obtain information from our directors, executive officers, and significant shareowners regarding related party transactions and then determined, based on the facts and circumstances, whether we or a related person had a direct or indirect material interest in these transactions. When considering potential transactions involving a related party, our officers notified our board of directors of the proposed transaction and our board of directors or a committee thereof discussed the transaction and the implications of engaging a related party. If our board of directors (or specified directors as required by applicable legal requirements) determined that the transaction was in our best interests, it voted to approve entering into the transaction with the applicable related party.
Relationships and Related Party Transactions
Banking Transactions
We and our subsidiaries may engage in transactions with directors, officers, employees, and other “related parties” only to the extent that such activities are permitted by, and consistent with, applicable laws and regulations. Federal and state regulations impose a number of restrictions on transactions and dealings between insured depository institutions and related parties. In general, these transactions are subject to certain quantitative limitations and are required to be on substantially the same terms and conditions as are available for transactions between the institution and unrelated parties. “Related parties” include our directors and officers, their spouses, and certain members of their immediate families, as well as other persons or entities with which we have certain relationships, as set forth in federal and state regulations.
We have had in the past, and expect to have in the future, banking transactions in the ordinary course of business with our directors, officers, and principal shareowners, and their associates, on substantially the same terms, including interest rates and collateral, as those prevailing at the same time for comparable transactions with unrelated parties. Such transactions are not expected to involve more than the normal risks of collectability nor present other unfavorable features to us. Loans to individual directors and officers must also comply with our lending policies and statutory lending limits.
Registration Rights Agreements with NBC Holdings, LLC
In connection with its initial investment in Americus in August 2008, NBC Holdings, LLC (previously known as RMB Holdings, LLC), or NBC Holdings, which owned approximately 7.5% of our outstanding common stock as of February 25, 2015, entered into a registration rights agreement with us. The agreement
107
Table of Contents
Index to Financial Statements
provides NBC Holdings and certain transferees of its registrable securities, which we refer to as “holders,” with certain demand registration rights in respect of any registrable securities of our common stock held by them, subject to various conditions and limitations as set forth in the agreement.
Under the terms of the agreement, beginning on the date that is 180 days following an underwritten initial public offering of our common stock and ending on the fifth anniversary of the closing of such initial public offering, holders who own in the aggregate at least twenty-five percent (25%) of our registrable securities, which are defined as Initiating Holders, may demand up to two (2) registrations of such registrable securities held by them, subject to a maximum of one demand registration in any consecutive six-month period. In addition, if we register additional shares of our common stock for sale to the public, we must give notice to each holder of registrable securities of our intention to effect such a registration, and, subject to certain limitations, include in the registration statement any shares of our common stock held by such holder as the holder may request, except in the case of a demand registration initiated by the holder or a registered offering relating to an employee stock plan or a business combination. We are required to bear the registration expenses, other than underwriting discounts and commissions and transfer taxes, associated with any registration of shares of common stock pursuant to the agreement.
The agreement includes customary indemnification provisions in favor of the holders, any underwriter participating in a registered offering made pursuant to an agreement, and any officer, partner, manager, director, or controlling person of such holder or underwriter, as well as any representative of such holder serving on our board of directors, or indemnified party, against certain losses and liabilities, including interest, penalties, and attorneys’ fees, resulting from any breach of a representation or warranty made by us in an underwriting agreement or an untrue statement or omission of material fact in any registration statement or prospectus pursuant to which an indemnified party sells shares of our common stock, unless such liability arose from written information provided to us by the indemnified party specifically for use therein, in which case, if the indemnified party is a holder, such holder must indemnify us and other specified parties for liabilities arising from the information from which the breach, misstatement, or omission resulted, in an amount up to the amount of net proceeds received by the holder in the offering. The agreement provides that it will become void and of no effect as to any holder (including any assignee of a holder) at such time as such person no longer owns any registrable securities. The agreement is filed as Exhibit 4.3 to our Registration Statement on Form S-4, which was filed with the SEC on September 30, 2014, and is incorporated by reference herein.
Registration Rights Agreement with Charles Investment Group, LLC
We entered into a registration rights agreement with CIG in October 2010, in connection with its acquisition of a majority of our outstanding common stock. The registration rights agreement with CIG contained nearly identical terms as the registration rights agreement with NBC Holdings. On December 31, 2014, CIG conducted a liquidating distribution of all of the shares of our common stock that it held on such date to its members but did not assign its registration rights in connection with the distribution. As a result, the registration rights agreement with CIG and all rights granted thereunder terminated at the time of the distribution.
108
Table of Contents
Index to Financial Statements
PRINCIPAL AND SELLING SHAREOWNERS
The following table sets forth information as of February 25, 2015 regarding the beneficial ownership of our common stock, and as adjusted to reflect the sale of common stock offered by us and the selling shareowner, for:
| • | each shareowner known by us to be the beneficial owner of more than 5% of our outstanding shares of common stock; |
| • | each of our named executive officers; |
| • | each of our directors; |
| • | all of our executive officers and directors as a group; and |
| • | the selling shareowner. |
We have determined beneficial ownership in accordance with the rules of the SEC. These rules generally provide that a person is the beneficial owner of securities if such person has or shares the power to vote or direct the voting of securities, or to dispose or direct the disposition of securities, or has the right to acquire such powers within 60 days. For purposes of calculating each person’s percentage ownership, common stock issuable pursuant to options exercisable within 60 days are included as outstanding and beneficially owned for that person or group, but are not deemed outstanding for the purposes of computing the percentage ownership of any other person. Except as disclosed in the footnotes to this table and subject to applicable community property laws, we believe that each beneficial owner identified in the table possesses sole voting and investment power over all our common stock shown as beneficially owned by the beneficial owner.
The percentage of beneficial ownership is based on 7,541,541 shares of our common stock outstanding as of February 25, 2015, shares of common stock to be outstanding after the completion of this offering, assuming no exercise of the underwriters’ option to purchase additional shares of our common stock, and shares of our common stock to be outstanding after the completion of this offering, assuming exercise of the underwriters’ option to purchase additional shares of our common stock. The following table does not reflect any shares of our common stock that our directors, officers, employees, business associates, and related persons may purchase in this offering through the directed share program described under “Underwriting.”
109
Table of Contents
Index to Financial Statements
Unless otherwise indicated in the table or footnotes below, the address for each beneficial owner is c/o National Commerce Corporation, 813 Shades Creek Parkway, Suite 100, Birmingham, Alabama 35209.
| Prior to this Offering | Shares Offered | After this Offering | ||||||||||||||||||||||
| Assuming Underwriters’ Option to Purchase Additional Shares is Not Exercised |
Assuming Underwriters Option to Purchase Additional Shares is Exercised in Full |
Assuming Underwriters’ Option to Purchase Additional Shares is Not Exercised |
Assuming Underwriters Option to Purchase Additional Shares is Exercised in Full |
|||||||||||||||||||||
| Number of Shares Beneficially Owned |
Number of Shares Beneficially Owned |
Number of Shares Beneficially Owned |
||||||||||||||||||||||
| Name |
Number of Shares |
Percentage of Shares |
Number of Shares |
Percentage of Shares |
Number of Shares |
Percentage of Shares |
||||||||||||||||||
| 5% Shareowners (excluding Executive Officers and Directors) |
||||||||||||||||||||||||
| Charles Phillip McWane 2011 Grantor Retained Annuity Trust(1) |
971,195 | 12.9% | % | % | ||||||||||||||||||||
| NBC Holdings, LLC(2) |
565,895 | 7.5% | % | % | ||||||||||||||||||||
| Named Executive Officers and Directors |
||||||||||||||||||||||||
| John H. Holcomb, III(3) |
90,051 | 1.2% | % | % | ||||||||||||||||||||
| Richard Murray, IV(4) |
88,386 | 1.2% | % | % | ||||||||||||||||||||
| William E. Matthews, V(5) |
37,817 | * | % | % | ||||||||||||||||||||
| Bobby A. Bradley |
13,310 | * | % | % | ||||||||||||||||||||
| R. Holman Head |
1,500 | * | % | % | ||||||||||||||||||||
| Jerry D. Kimbrough(6) |
94,326 | 1.3% | % | % | ||||||||||||||||||||
| C. Phillip McWane(7) |
1,331,101 | 17.7% | % | % | ||||||||||||||||||||
| G. Ruffner Page, Jr. (8) |
226,955 | 3.0% | % | % | ||||||||||||||||||||
| W. Stancil Starnes |
66,551 | * | % | % | ||||||||||||||||||||
| Temple W. Tutwiler, III |
6,655 | * | % | % | ||||||||||||||||||||
| Russell H. Vandevelde, IV(9) |
122,663 | 1.6% | % | % | ||||||||||||||||||||
| Donald F. Wright(10) |
30,746 | * | % | % | ||||||||||||||||||||
| Executive Officers and Directors as a Group (17 Persons) |
2,399,304 | 31.1% | % | % | ||||||||||||||||||||
| * | Less than 1% |
| (1) | Consists of shares of our common stock held directly by the Charles Phillip McWane 2011 Grantor Retained Annuity Trust, or the McWane GRAT. Our director C. Phillip McWane exercises sole voting power and shared dispositive power as to the shares held by the McWane GRAT, as described further in note (7) below. |
| (2) | Consists of shares of our common stock held directly by NBC Holdings, LLC. The managing member of NBC Holdings, LLC is ATB Management, LLC, which is managed by Kenneth H. Polk, its sole member and an owner of less than five percent (5%) of NBC Holdings, LLC. The address of NBC Holdings, LLC, ATB Management, LLC and Mr. Polk is 2000 Morris Avenue, Suite 1200, Birmingham, Alabama 35203. NBC Holdings, LLC is also participating in this offering as a selling shareowner. |
| (3) | Includes (a) 66,551 shares of our common stock held directly by Mr. Holcomb and (b) 23,500 shares of our common stock underlying options that are currently exercisable or exercisable within 60 days of February 25, 2015. |
| (4) | Includes (a) 61,560 shares of our common stock held directly by Mr. Murray, (b) 3,326 shares of our common stock held by Mr. Murray’s dependent children over which Mr. Murray exercises voting control, and (c) 23,500 shares of our common stock underlying options that are currently exercisable or exercisable within 60 days of February 25, 2015. |
| (5) | Includes (a) 67 shares of our common stock held directly by Mr. Matthews, (b) 11,750 shares of our common stock held in an individual retirement account for the benefit of Mr. Matthews, (c) 2,500 shares of our common stock held jointly by Mr. Matthews and his spouse and (d) 23,500 shares of our common stock underlying options that are currently exercisable or exercisable within 60 days of February 25, 2015. |
| (6) | Includes (a) 21,866 shares of our common stock held directly by Mr. Kimbrough, (b) 36,495 shares of our common stock held in an individual retirement account for the benefit of Mr. Kimbrough and (c) 35,965 shares of our common stock held by a limited liability company, a majority of the equity of which is owned by a trust of which Mr. Kimbrough’s spouse serves as trustee. |
| (7) | Includes (a) 359,906 shares of our common stock held directly by Mr. McWane and (b) 971,195 shares of our common stock held by the McWane GRAT, as to which Mr. McWane exercises sole voting power and shared dispositive power, as described in note (1) above. Pursuant to the terms of the McWane GRAT, Regions Bank, as trustee and acting through and on behalf of the McWane GRAT, has authority to select and dispose of assets held in the McWane GRAT, including the shares of our common stock held by the McWane GRAT, subject to the prior approval of Mr. McWane. Regions Bank is wholly owned by Regions Financial Corporation. |
| (8) | Includes (a) 67 shares of our common stock held directly by Mr. Page, (b) 23,500 shares of our common stock underlying options that are currently exercisable or exercisable within 60 days of February 25, 2015 and (c) 203,388 shares of our common stock held by the G. Ruffner |
110
Table of Contents
Index to Financial Statements
| Page, Jr. Grantor Retained Annuity Trust, or the “Page GRAT,” as to which Mr. Page exercises sole voting power and shared dispositive power. Pursuant to the terms of the Page GRAT, Regions Bank, as trustee and acting through and on behalf of the Page GRAT, has authority to select and dispose of assets held in the Page GRAT, including the shares of our common stock held by the Page GRAT, subject to the prior approval of Mr. Page. Regions Bank is wholly owned by Regions Financial Corporation. |
| (9) | Includes (a) 98,233 shares of our common stock held directly by Mr. Vandevelde, (b) 19,980 shares of our common stock held in individual retirement accounts for the benefit of Mr. Vandevelde, (c) 1,250 shares of our common stock held in an individual retirement account for the benefit of Mr. Vandevelde’s spouse and (d) 3,200 shares of our common stock held by Mr. Vandevelde as custodian for his four minor children. |
| (10) | Includes 30,746 shares of our common stock that are beneficially owned by Mr. Wright through a revocable trust, with respect to which Mr. Wright serves as a co-trustee with his spouse. |
111
Table of Contents
Index to Financial Statements
The following descriptions are summaries of the material terms of our certificate of incorporation and bylaws. These descriptions contain all information that we consider to be material, but may not contain all of the information that is important to you. To understand them fully, you should read our certificate of incorporation and bylaws, copies of which are filed with the SEC as exhibits to the registration statement of which this prospectus is a part. The summary below is qualified in its entirety by reference to our certificate of incorporation and bylaws. The terms of these securities may also be affected by the provisions of the General Corporation Law of the State of Delaware, or the DGCL.
Please note that, with respect to any of our shares held in book-entry form through The Depository Trust Company or any other share depositary, the depositary or its nominee will be the sole registered and legal owner of those shares, and references in this prospectus to any “shareowner” or “holder” of those shares means only the depositary or its nominee. Persons who hold beneficial interests in our shares through a depositary will not be registered or legal owners of those shares and will not be recognized as such for any purpose. For example, only the depositary or its nominee will be entitled to vote the shares held through it, and any dividends or other distributions to be paid, and any notices to be given, in respect of those shares will be paid or given only to the depositary or its nominee. Owners of beneficial interests in those shares will have to look solely to the depositary with respect to any benefits of share ownership, and any rights they may have with respect to those shares will be governed by the rules of the depositary, which are subject to change from time to time. We have no responsibility for those rules or their application to any interests held through the depositary.
General
Our authorized capital stock consists of common stock and preferred stock. We are currently authorized to issue 30,000,000 shares of common stock, $0.01 par value per share, of which 7,541,541 are currently shares outstanding. As of February 25, 2015, there were approximately 893 record holders of our common stock. In addition, we are authorized to issue 250,000 shares of preferred stock, $0.01 par value per share, of which no shares are currently outstanding. Options to purchase 322,086 shares of our common stock under the Incentive Plan and the United Option Plan (as described above) were outstanding as of February 25, 2015, 149,278 additional shares of our common stock were subject to outstanding performance awards under the Incentive Plan, and an additional 118,722 shares of our common stock were reserved for issuance under the Incentive Plan. Such underlying shares have been reserved for issuance. All outstanding shares of common stock are fully paid and non-assessable, and the shares of common stock to be issued upon completion of this offering will be fully paid and non-assessable.
Voting Rights
Each owner of our common stock is entitled to one vote per share on any matter on which shareowners generally are entitled to vote, including the election of directors. Neither our certificate of incorporation nor our bylaws provide for cumulative voting in the election of directors, which means that the holders of a majority of the outstanding shares of our common stock can elect all of the directors standing for election, and the holders of the remaining shares are not able to elect any directors. Our certificate of incorporation and bylaws may be amended at any regular or special meeting of the shareowners by the affirmative vote of a majority of the voting interest in the outstanding stock, unless applicable law requires otherwise. Our bylaws provide that our board of directors may call a special meeting of shareowners at any time.
Dividends
Owners of our common stock will be entitled to dividends paid by us when and if declared by our board of directors from legally available funds, and subject to the rights of any outstanding class or series of preferred stock. The determination and declaration of dividends is entirely within the discretion of our board of directors, subject to certain limitations under state law and rules and limitations imposed by federal regulators. Holders of our common stock shall share equally on a per share basis in any such dividends or distributions.
112
Table of Contents
Index to Financial Statements
Liquidation or Dissolution
In the event of our liquidation, dissolution, or winding up, the owners of our common stock shall be entitled to receive, in cash or in kind, our assets that are remaining after payment or provision for payment of our debts and liabilities and any amounts owed to holders of our preferred stock. Owners of our common stock shall receive such assets ratably in proportion to the number of shares held by them.
Preemptive Rights
Owners of our common stock do not have any preemptive rights to subscribe for additional shares of our common stock when we offer additional shares for sale. The rights, preferences, and privileges of holders of common stock are subject to, and may be impacted by, the rights of the holders of shares of any series of preferred stock that we may designate and issue in the future.
Other
Our shareowners have no conversion rights or other subscription rights. There are no redemption or sinking fund provisions that are applicable to our common stock.
Director Nominations
Nominations for election to our board of directors may be made by our board of directors or by any shareowner of any outstanding class of our capital stock that is entitled to vote for election of directors. Nominations other than those made by or on behalf of the existing management must be made in writing and be delivered or mailed to our Secretary no less than 120 days nor more than 150 days prior to the first anniversary of the preceding year’s annual meeting, subject to certain exceptions as set forth in our bylaws. Such notification must contain certain information about both the nominator and the nominee, including, with respect to any nominee:
| • | All information relating to the nominee that would be required to be disclosed in a proxy statement in accordance with Regulation 14A under the Exchange Act; |
| • | A notarized affidavit from the proposed nominee addressing the nominee’s willingness to serve, eligibility for election, and consent to being named in the proxy statement as a nominee; |
| • | Information concerning certain compensation and other monetary agreements between the nominator and the nominee, as well as their affiliated parties; |
| • | A description of any voting commitments and/or any other arrangements or obligations by which the proposed nominee would be bound as a director; |
| • | A completed questionnaire regarding such person, which may be obtained from our Secretary, relating to the stock exchange listing requirements for director independence that are applicable to us; and |
| • | Any other information relating to such person that is required pursuant to any other applicable laws or rules or regulations of any governmental authority or of any national securities exchange or similar body overseeing any trading market on which shares of our common stock may be traded. |
Our shareowners may also recommend director candidates for inclusion by the board of directors in the slate of nominees that the board recommends to our shareowners for election by following certain procedures set forth in our corporate governance guidelines.
Preferred Stock
We currently have no shares of preferred stock outstanding. Under our certificate of incorporation, our board of directors is authorized, without further action by our shareowners, to issue shares of preferred stock in one or more classes or series. Our board of directors may fix the rights, preferences, and privileges of the preferred stock, along with any limitations or restrictions, including voting rights, dividend rights, conversion rights, redemption privileges, and liquidation preferences of each class or series of preferred stock. The preferred stock could have voting or conversion rights that could adversely affect the voting power or other rights of holders of common stock. The issuance of preferred stock could also have the effect, under certain circumstances, of delaying, deferring, or preventing a change in control of us.
113
Table of Contents
Index to Financial Statements
Amendment of Certificate of Incorporation and Bylaws
Our certificate of incorporation provides that we reserve the right to amend, alter, change, or repeal any provision contained therein, in the manner prescribed by statute. Our bylaws may be altered, amended, or repealed, and new bylaws made, by our board of directors, but our shareowners may make additional bylaws and may alter and repeal any bylaws whether adopted by them or otherwise.
Exclusive Forum
Our certificate of incorporation provides that our governing documents and internal affairs shall be governed by and interpreted under the laws of the State of Delaware, excluding its conflict of laws principles. Our certificate of incorporation also provides that, unless we consent in writing to the selection of an alternative forum, a state court located within the State of Delaware (or, if no such court has jurisdiction, the Federal District Court for the District of Delaware) shall be the exclusive forum for (i) any derivative action or proceeding brought on our behalf, (ii) any action asserting a claim of breach of fiduciary duty owed by any director, officer, or other employee to us or our shareowners, (iii) any action asserting a claim against us or any current or former director, officer, or other employee arising pursuant to the DGCL, our certificate of incorporation or bylaws, or (iv) any action asserting a claim governed by the internal affairs doctrine. Our certificate of incorporation further provides that any person or entity purchasing or otherwise acquiring any interest in our shares of capital stock shall be deemed to have notice of and to have consented to this provision.
Although we believe the exclusive forum provision of our certificate of incorporation benefits us by providing increased consistency in the application of Delaware law in the types of lawsuits to which it applies, the provision may have the effect of discouraging lawsuits against our directors and officers. The enforceability of similar exclusive forum provisions in other companies’ governing documents has been challenged in legal proceedings and it is possible that, in connection with any action, a court could find the choice of forum provisions contained in our certificate of incorporation to be inapplicable or unenforceable in such action.
Limitation on Liability and Indemnification of Directors and Officers
Our certificate of incorporation provides that our directors will not be personally liable to us or our shareowners for monetary damages for breach of their fiduciary duty as a director, except for (i) breach of their duty of loyalty to us or our shareowners, (ii) acts or omissions not in good faith or which involve intentional misconduct or a knowing violation of law, (iii) payments of unlawful dividends or unlawful stock purchases or redemptions under Section 174 of the DGCL, or (iv) any transaction from which the director derived any improper personal benefit.
Our bylaws provide that we shall indemnify and hold harmless, to the fullest extent permitted by the DGCL, our directors and officers against all liability and loss suffered and expenses (including attorneys’ fees) reasonably incurred in connection with any action, suit, or proceeding , whether civil, criminal, administrative, or investigative, by reason of the fact that he or she, or a person for whom he or she is the legal representative, is or was one of our directors or officers or, while a director or officer, is or was serving at our request in any position or capacity for any other entity. Our bylaws further provide for the advancement of expenses to directors and officers in defending any proceeding prior to its final disposition; provided, that to the extent required by law, an advancement of expenses will be made only upon receipt of an undertaking to repay all amounts advanced if it is ultimately determined that the director or officer is not entitled to indemnification for such expenses. Our bylaws also permit our board of directors to provide for indemnification and advancement of expenses to our employees and agents to the extent and in the manner permitted by the DGCL.
Our bylaws also provide that the indemnification rights set forth in the bylaws are not exclusive of other indemnification rights to which an indemnified party may be entitled under any statute, rule of law, provision in our certificate of incorporation or bylaws, agreement, vote of shareowners or disinterested directors, or otherwise. In this regard, we have entered into an indemnification agreement with each of our directors and executive officers that provides a contractual right to indemnification and advancement of expenses. These indemnification agreements require us to indemnify our directors and executive officers to the fullest extent permitted by Delaware law and for certain liabilities incurred as a result of actions brought, or threatened to be brought, against such directors and executive officers in connection with their duties, subject to certain
114
Table of Contents
Index to Financial Statements
limitations. We also are required to advance expenses to our directors and executive officers upon request to the fullest extent permitted by Delaware law and subject to the same restrictions applicable to indemnification payments. The agreements also contain various covenants by us regarding the maintenance of directors’ and officers’ liability insurance.
Our bylaws authorize us to purchase and maintain insurance on behalf of our directors, officers, employees, and agents, and persons serving at our request in any position or capacity for any other entity, against any liability asserted against or incurred by him or her, or arising out of his or her status as such, whether or not we would have the power or obligation to indemnify such person against the liability.
We are not aware of any pending or threatened action, suit, or proceeding involving any of our directors or officers for which indemnification from us may be sought.
Anti-Takeover Effects of Provisions of the DGCL, Federal Reserve Regulations, and Our Certificate of Incorporation and Bylaws
The DGCL, Federal Reserve regulations, and our certificate of incorporation and bylaws contain a number of provisions that may delay, defer, prevent, or render more difficult a change of control or an unsolicited acquisition proposal that our shareowners might consider favorable, including a proposal that might result in the payment of a premium over the market price for the shares held by our shareowners. Even in the absence of an unsolicited acquisition proposal, these provisions may also adversely affect the prevailing market price for our common stock if they are viewed as limiting the liquidity of our common stock or discouraging takeover attempts in the future.
Federal Reserve Requirements. Under Federal Reserve regulations, takeover attempts, business combinations, and certain acquisitions of our common stock may require the prior approval of or notice to the Federal Reserve. If a company seeks to acquire, either acting alone or in concert with others, 25% or more of any class of our voting stock, acquire control of the election or appointment of a majority of the directors on our board of directors, or exercise a controlling influence over our management or policies, it would be required to obtain the prior approval of the Federal Reserve. In addition, if any individual seeks to acquire, either acting alone or in concert with others, 25% or more of any class of our voting stock, the individual generally is required to provide 60 days’ prior notice to the Federal Reserve. An individual (and also a company not otherwise required to obtain Federal Reserve approval to control us) is presumed to control us, and therefore generally required to provide 60 days’ prior notice to the Federal Reserve, if the individual (or such company) acquires 10% or more of any class of our voting stock, although the individual (or such company) may seek to rebut the presumption of control based on the facts.
Number of Directors. Our bylaws provide that the number of directors will be fixed exclusively pursuant to a resolution adopted by our board of directors, provided that our board of directors shall consist of not fewer than three nor more than 20 individuals. Our board of directors currently consists of 12 members. The inability of shareowners to directly determine the number of directors on our board of directors may diminish the attractiveness of our common stock to a potential purchaser.
Authorized but Unissued or Undesignated Capital Stock. Our authorized capital stock currently consists of 30,000,000 shares of common stock and 250,000 shares of preferred stock. A large quantity of authorized but unissued shares may deter potential takeover attempts because of the ability of our board of directors to authorize the issuance of some or all of these shares to a friendly party, or to the public, which would make it more difficult for a potential acquirer to obtain control of us. This possibility may encourage persons seeking to acquire control of us to negotiate first with our board of directors. The authorized but unissued stock may be issued by our board of directors in one or more transactions. In this regard, our certificate of incorporation grants our board of directors broad power to establish the rights and preferences of authorized and unissued preferred stock. The issuance of shares of preferred stock pursuant to the authority of our board of directors as described above could decrease the amount of earnings and assets available for distribution to owners of our common stock, may adversely affect the rights and powers, including voting rights, of such holders, and may have the effect of delaying, deferring, or preventing a change of control. The preferred stock could also be used in connection with the issuance of a
115
Table of Contents
Index to Financial Statements
shareowner rights plan, sometimes referred to as a “poison pill.” Our board of directors is able to implement a shareowner rights plan without further action by shareowners. Our board of directors does not currently intend to seek shareowner approval prior to any issuance of preferred stock, unless otherwise required by law.
Action by Written Consent. Our certificate of incorporation provides that shareowner action can be taken only at an annual meeting or special meeting of shareowners and cannot be taken by written consent in lieu of a meeting. Furthermore, our bylaws provide that special meetings of shareowners may be called only by our board of directors or the chairman of our board of directors, and prohibit the conduct of any business at a special meeting other than as specified in the notice for such meeting. However, holders of our preferred stock may take action by written consent to the extent, if any, provided in the terms of the class or series of their respective shares. The limitation on the ability of owners of our common stock to call a special meeting and to take action without a meeting, as well as the discrepancy between the rights of common stock and preferred stock with respect to action by written consent, may diminish the relative value of our common stock.
Advance Notice Procedures. Our bylaws establish advance notice procedures with respect to shareowner proposals and the nomination of candidates for election as directors, other than nominations made by or at the direction of our board of directors. In order for any matter to be “properly brought” before a meeting, a shareowner will have to comply with advance notice requirements and provide us with certain information. Generally, to be timely, a shareowner’s notice must be received at our principal executive offices not earlier than the close of business 150 days prior, and not later than the close of business 120 days before, the first anniversary date of the immediately preceding annual meeting of shareowners. Our bylaws also specify requirements as to the form and content of a shareowner’s notice. Under our bylaws, our board of directors may adopt by resolution the rules and regulations for the conduct of meetings. Except to the extent inconsistent with such rules and regulations adopted by our board of directors, the person presiding over the meeting of shareowners shall have the right to adopt rules and regulations for the conduct of such meeting, which may have the effect of precluding the conduct of certain business at a meeting if the rules and regulations are not followed. These provisions may also defer, delay, or discourage a potential acquirer from conducting a solicitation of proxies to elect such potential acquirer’s own slate of directors or otherwise attempting to influence or obtain control of us.
Removal and Replacement of Directors. Our bylaws provide that, unless otherwise required by law or our certificate of incorporation, any newly created directorship resulting from an increase in the authorized number of directors or any vacancy in our board of directors resulting from any cause may be filled only by the affirmative vote of a majority of the directors then in office, even if less than a quorum (and not by shareowners), unless all of the directors have been removed. This provision limiting the ability of shareowners to replace directors in situations other than the annual election of directors could make it more difficult for existing shareowners or another party to effect a change in our management or governance.
Business Combinations with Interested Shareowners. Section 203 of the DGCL, which regulates corporate takeovers, provides that corporations may not engage in certain “business combinations” with any “interested stockholder” for a period of three years following the date that the shareowner became an interested stockholder, unless certain requirements are satisfied or the corporation’s certificate of incorporation or bylaws contains an express election not to be governed by Section 203.
Generally, a “business combination” includes a merger, asset or stock sale, or other transaction resulting in a financial benefit to the interested stockholder. Subject to certain exceptions, an “interested stockholder” is any entity or person beneficially owning 15% or more of our outstanding shares entitled to vote generally in the election of directors or any entity or person affiliated with or controlling or controlled by any of these entities or persons and who beneficially owned 15% or more of our outstanding shares entitled to vote generally in the election of directors at any time within the three-year period immediately prior to the date of the determination.
Neither our certificate of incorporation nor our bylaws contain an express election not to be governed by Section 203. Under certain circumstances, the absence of this election will make it more difficult for a person who would be an interested stockholder to effect various business combinations with us for a three-year period, because such person’s ability to do so will depend upon the existence of one or more of the circumstances listed in the statute rather than a provision in our governing documents. In addition, entities interested in acquiring us
116
Table of Contents
Index to Financial Statements
may be incentivized to negotiate in advance with our board of directors, because the statute allows a potential acquirer to bypass shareowner approval if our board of directors approves either the business combination or the transaction which results in the shareowner becoming an interested stockholder.
These provisions also may have the effect of preventing changes in our board of directors and may make it more difficult to accomplish transactions that shareowners may otherwise deem to be in their best interests.
The foregoing provisions (or the absence thereof, as the case may be) may have the effect of deterring hostile takeovers or delaying or preventing changes in our management or control of us, such as a merger, reorganization or tender offer. In general, our certificate of incorporation and bylaws are structured in a way that enhances the likelihood of continued stability in the composition of our board of directors and its policies and discourages certain types of transactions that may involve our actual or threatened acquisition by another party. The provisions of our certificate of incorporation and bylaws tend to reduce our vulnerability to an unsolicited acquisition proposal and to discourage certain tactics that may be used in proxy fights. However, such provisions could have the effect of discouraging others from making tender offers for our shares and, as a consequence, may also inhibit fluctuations in the market price of our shares of common stock that could result from actual or rumored takeover attempts.
Transfer Agent and Registrar
Broadridge Corporate Issuer Solutions, Inc. is the transfer agent and registrar for our common stock. The transfer agent’s address is 51 Mercedes Way, Edgewood, New York 11717.
Listing and Trading Market for Common Stock
There is no established public trading market for our common stock. We do not make a market in our securities, nor do we attempt to negotiate prices for trades of such securities. We have applied to have our common stock listed on the NASDAQ Global Select Market under the symbol “NCOM,” but we cannot assure you that an active or liquid trading market for our common stock will develop or be sustained.
117
Table of Contents
Index to Financial Statements
SHARES ELIGIBLE FOR FUTURE SALE
Prior to this offering, there has been no public market for our common stock. Although we expect the shares of our common stock to be approved for listing on the NASDAQ Global Select Market, we cannot assure you that a significant public market for our common stock will develop or be sustained. We cannot predict the effect, if any, that sales of shares or availability of any shares for sale will have on the market price of our common stock prevailing from time to time. Sales of substantial amounts of common stock (including shares issued on the exercise of options, warrants, or convertible securities, if any, or upon the settlement of performance awards) or the perception that such sales could occur, could adversely affect the market price of our common stock and our ability to raise additional capital through a future sale of securities.
Upon completion of this offering, we will have shares of common stock issued and outstanding (and shares if the underwriters exercise their option to purchase additional shares of our common stock in full). All of the shares of our common stock (or shares if the underwriters exercise their option to purchase additional shares of our common stock in full) offered by us and the selling shareowner pursuant to this prospectus will be freely tradable without restriction or further registration under the Securities Act unless such shares are purchased by “affiliates,” as that term is defined in Rule 144. Of the shares to be outstanding immediately following the closing of this offering by us and the selling shareowner pursuant to this prospectus, we expect that shares will be freely tradable without restriction or further registration under the Securities Act unless such shares are purchased by our “affiliates,” as that term is defined in Rule 144, and shares of our common stock will be “restricted” or “control” securities under Rule 144, which, subject to certain contractual restrictions, including the lock-up agreements described below, may be sold in the public market only if registered or pursuant to an exemption from registration, such as Rule 144 under the Securities Act. As a result of the contractual 180-day lock-up period described below and the provisions of Rules 144, these shares will be available for sale in the public market as follows:
| Number of Shares |
Date | |
| On the date of this prospectus and up to 90 days from the date of this prospectus. | ||
| After 90 days from the date of this prospectus. | ||
| After 180 days from the date of this prospectus (subject, in some cases, to volume limitations). | ||
Directed Share Program
The underwriters have reserved for sale at the initial public offering price up to % of the common stock being offered by this prospectus for sale at the initial public offering price to our directors, officers, employees, business associates, and related persons. We do not know if these persons will choose to purchase all or any portion of these reserved shares, but any purchases they do make will reduce the number of shares available to the general public. Any reserved shares not so purchased will be offered by the underwriters to the general public on the same terms as the other shares of common stock.
Lock-Up Agreements
All of our directors, executive officers, and certain other shareowners (accounting for shares of our common stock), have agreed, subject to limited exceptions, not to offer, pledge, sell, contract to sell, sell any option or contract to purchase, purchase any option or contract to sell, grant any option, right or warrant to purchase, or otherwise transfer or dispose of, directly or indirectly, or enter into any swap or other arrangement that transfers to another, in whole or in part, any of the economic consequences of ownership of any shares of common stock or any securities convertible into or exercisable or exchangeable for shares of common stock for a period of 180 days after the date of this prospectus, without the prior written consent of Keefe, Bruyette & Woods, Inc.
118
Table of Contents
Index to Financial Statements
Rule 144
In general, under Rule 144, beginning 90 days after the date of this prospectus, a person who is not our affiliate and has not been our affiliate at any time during the preceding three months will be entitled to sell any shares of our common stock that such person has beneficially owned for at least six months, including the holding period of any prior owner other than one of our affiliates, without regard to volume limitations. Sales of our common stock by any such person would be subject to the availability of current public information about us if the shares to be sold were beneficially owned by such person for less than one year. Beginning 90 days after the date of this prospectus, our affiliates who have beneficially owned shares of our common stock for at least six months, including the holding period of any prior owner other than one of our affiliates, would be entitled to sell within any three-month period a number of shares that does not exceed the greater of:
| • | 1% of the number of shares of our common stock then-outstanding, which will equal approximately shares immediately after this offering; and |
| • | the average weekly trading volume in our common stock during the four calendar weeks preceding the date of filing of a Notice of Proposed Sale of Securities pursuant to Rule 144 with respect to the sale. |
Sales under Rule 144 by our affiliates are also subject to manner of sale provisions and notice requirements and the availability of current public information about us.
Subject to the 180-day lock-up period described above, approximately shares of our common stock will be eligible for sale under Rule 144 subject to limitations on sales by affiliates. We cannot estimate the number of shares of our common stock that our existing shareowners will elect to sell under Rule 144.
Rule 701
In general, under Rule 701 under the Securities Act, any of our employees, officers, or directors, or other individuals providing bona fide services to or for us, who purchased shares from us in connection with a qualified compensatory stock plan or other written agreement, are eligible to resell those shares 90 days after the effective date of our prior registration statement on Form S-4 (or February 2, 2015), in reliance on Rule 144, but without compliance with the holding period or certain other restrictions contained in Rule 144.
Registration Rights
For a description of the registration rights we have granted to NBC Holdings, LLC (previously known as RMB Holdings, LLC), see “Certain Relationships and Related Party Transactions – Registration Rights Agreement with NBC Holdings, LLC.”
Stock Options and Performance Awards
As of February 25, 2015, options to purchase 219,500 shares of our common stock at a weighted average exercise price of $14.57 per share were outstanding under the Incentive Plan, of which options to purchase 219,500 shares were vested, and 149,278 shares were subject to issuance upon vesting of outstanding performance awards under the Incentive Plan. In addition, options to purchase 102,586 shares of our common stock at a weighted average exercise price of $23.45 per share were outstanding under the United Option Plan. In December 2014, we filed a registration statement on Form S-8 under the Securities Act to register all of the shares of our common stock subject to outstanding options and performance awards under the Incentive Plan, as well as shares of common stock subject to options and other awards issuable pursuant to the Incentive Plan, and, in December 2014, we filed a registration statement on Form S-8 under the Securities Act to register all of the shares of our common stock subject to outstanding options under the United Option Plan. Accordingly, shares of our common stock registered under the Form S-8 registration statements are available for sale in the open market, subject to Rule 144 volume limitations applicable to affiliates, and subject to any vesting restrictions and lock-up agreements applicable to these shares.
119
Table of Contents
Index to Financial Statements
MATERIAL U.S. FEDERAL INCOME TAX CONSIDERATIONS
FOR NON-U.S. HOLDERS
The following discussion is a summary of material U.S. federal income tax considerations generally applicable to the purchase, ownership, and disposition of our common stock by Non-U.S. Holders. A “Non-U.S. Holder” means a person (other than a partnership) that is not a citizen or resident of the United States, a U.S. domestic corporation, or a person that would otherwise be subject to U.S. federal income tax on a net income basis in respect of such common stock. This discussion deals only with our common stock held as capital assets by holders who purchase common stock in this offering. This discussion does not cover all aspects of U.S. federal income taxation that may be relevant to the purchase, ownership, or disposition of our common stock by prospective investors in light of their particular circumstances. In particular, this discussion does not address all of the tax considerations that may be relevant to persons in special tax situations, including persons that will hold shares of our common stock in connection with a U.S. trade or business or a U.S. permanent establishment, hold more than 5% of our common stock, are a “controlled foreign corporation,” or a “passive foreign investment company,” or are otherwise subject to special treatment under the provisions of the Code. You should consult your own tax advisors about the tax consequences of the purchase, ownership, and disposition of our common stock in light of your own particular circumstances, including the tax consequences under state, local, foreign, and other tax laws and the possible effects of any changes in applicable tax laws.
Furthermore, this summary is based upon the provisions of the Code, the Treasury regulations promulgated thereunder, and administrative and judicial interpretations thereof, all as of the date hereof. Such authorities may be repealed, revoked, modified, or subject to differing interpretations, possibly on a retroactive basis, so as to result in U.S. federal income tax consequences different from those discussed below. This discussion does not address any other U.S. federal tax considerations (such as gift tax) or any state, local, or non-U.S. tax considerations.
Dividends
As discussed under “Dividend Policy” above, we do not currently expect to pay dividends on our common stock. In the event that we do make a distribution of cash or property with respect to our common stock, any such distributions will constitute dividends for U.S. federal income tax purposes to the extent of our current or accumulated earnings and profits, as determined under U.S. federal income tax principles. If a distribution exceeds our current and accumulated earnings and profits, the excess will be treated as a tax-free return of the Non-U.S. Holder’s investment, up to such holder’s tax basis in the common stock. Any remaining excess will be treated as capital gain, subject to the tax treatment described below under “Sale, Exchange, or Other Taxable Disposition of Common Stock.”
Dividends paid to you generally will be subject to U.S. federal withholding tax at a 30% rate, or such lower rate as may be specified by an applicable tax treaty. Even if you are eligible for a lower treaty rate, we and other payors will generally be required to withhold at a 30% rate (rather than the lower treaty rate) on dividend payments to you, unless you have furnished to us or such other payor a valid IRS Form W-8BEN or other documentary evidence establishing your entitlement to the lower treaty rate with respect to such payments. Additional withholding may be required in respect of dividends paid to you, as described below under “Additional Withholding Tax Relating to Foreign Accounts.”
If you are subject to withholding at a rate in excess of a reduced rate for which you are eligible under a tax treaty or otherwise, you may be able to obtain a refund of or credit for any amounts withheld in excess of the applicable rate. Investors are encouraged to consult with their own tax advisors regarding the possible implications of these withholding requirements on their investment in the common stock.
Sale, Exchange, or Other Taxable Disposition of Common Stock
You generally will not be subject to U.S. federal income tax with respect to gain recognized on a sale, exchange, or other taxable disposition of shares of our common stock unless you are an individual present in the United States for 183 or more days in the taxable year of the sale, exchange, or other taxable disposition, and certain other requirements are met. If you are such an individual, you will generally be subject to a flat 30% tax
120
Table of Contents
Index to Financial Statements
on any gain derived from the sale, exchange, or other taxable disposition that may be offset by U.S. source capital losses (even though you are not considered a resident of the United States). In certain circumstances withholding may be required in respect of such gains, as described below under “Additional Withholding Tax Relating to Foreign Accounts.”
Information Reporting and Backup Withholding
We must report annually to the IRS and to each Non-U.S. Holder the amount of dividends paid to such holder and the tax withheld with respect to such dividends, regardless of whether withholding was required. Copies of the information returns reporting such dividends and withholding may also be made available to the tax authorities in the country in which the Non-U.S. Holder resides under the provisions of an applicable income tax treaty. You may be subject to backup withholding for dividends paid to you and in certain circumstances proceeds from the sale of your shares of our common stock unless you certify under penalty of perjury that you are a Non-U.S. Holder or otherwise establish an exemption.
Any amounts withheld under the backup withholding rules may be allowed as a refund or a credit against your U.S. federal income tax liability provided the required information is timely furnished to the IRS.
Additional Withholding Tax Relating to Foreign Accounts
Withholding is required at a rate of 30% on dividends in respect of, and, after December 31, 2016, on gross proceeds from the sale or other disposition of, our common stock held by or through certain foreign financial institutions (including investment funds), unless such institution enters into an agreement with the U.S. Treasury to report, on an annual basis, information with respect to interests in, and accounts maintained by, the institution that are owned by certain U.S. persons and by certain non-U.S. entities that are wholly or partially owned by U.S. persons and to withhold on certain payments. An intergovernmental agreement between the United States and an applicable foreign country, or future Treasury regulations, may modify these requirements. Accordingly, the entity through which our common stock is held may affect the determination of whether such withholding is required. Similarly, dividends in respect of, and gross proceeds from the sale or other disposition of, our common stock held by a Non-U.S. holder that is a non-financial non-U.S. entity that does not qualify under certain exemptions will be subject to withholding at a rate of 30%, unless such entity either (i) certifies that such entity does not have any “substantial United States owners” or (ii) provides certain information regarding the entity’s “substantial United States owners.” We will not pay any additional amounts to holders of our common stock in respect of any amounts so withheld. Prospective investors should consult their tax advisors regarding the possible implications of these rules for their investment in our common stock.
121
Table of Contents
Index to Financial Statements
We and the selling shareowner are offering the shares of our common stock described in this prospectus in an underwritten offering in which we, the selling shareowner, and Keefe, Bruyette & Woods, Inc., as representative for the underwriters named below, will enter into an underwriting agreement with respect to the shares of our common stock being offered hereby. Subject to certain conditions, each underwriter has severally agreed to purchase, and we and the selling shareowner have severally agreed to sell, the number of shares of our common stock indicated in the following table:
| Name |
Number of Shares | |
| Keefe, Bruyette & Woods, Inc. |
||
| Raymond James & Associates, Inc. |
||
| Sterne, Agee & Leach, Inc. |
||
| FIG Partners, LLC |
||
|
| ||
| Total |
||
|
|
The underwriters are offering the shares of our common stock subject to a number of conditions, including receipt and acceptance of the common stock by the underwriters. The obligations of the underwriters to pay and accept delivery of the shares offered by this prospectus are subject to these conditions. The underwriting agreement between us, the selling shareowner, and the underwriters provides that if any underwriter defaults, the purchase commitments of the non-defaulting underwriters may be increased or this offering may be terminated.
In connection with this offering, the underwriters or securities dealers may distribute offering documents to investors electronically.
Commission and Discounts
Shares of our common stock sold by the underwriters to the public will be offered at the initial public offering price set forth on the cover of this prospectus. Any shares of common stock sold by the underwriters to securities dealers may be sold at a discount of up to $ per share from the initial public offering price. Any of these securities dealers may resell any shares of our common stock purchased from the underwriters to other brokers or dealers at a discount of up to $ per share from the initial public offering price. If all of the shares of our common stock are not sold at the initial public offering price, the representative may change the offering price and the other selling terms. Sales of shares of our common stock made outside of the U.S. may be made by affiliates of the underwriters.
The following table shows the initial public offering price, underwriting discount, and proceeds before expenses to us and to the selling shareowner. The information assumes either no exercise or full exercise by the underwriters of their over-allotment option to purchase an additional shares, discussed below:
| Per Share | No Exercise | Full Exercise | ||||||||||
| (in thousands) | ||||||||||||
| Public offering price |
$ | $ | $ | |||||||||
| Underwriting discount |
$ | $ | $ | |||||||||
| Proceeds to us, before expenses |
$ | $ | $ | |||||||||
| Proceeds to selling shareowner, before expenses |
$ | $ | $ | |||||||||
We and the selling shareowner estimate the expenses of this offering, not including the underwriting discounts, to be $ million and are payable by us.
Option to Purchase Additional Shares
We have granted the underwriters an option to buy up to additional shares of our common stock, at the public offering price less underwriting discounts. The underwriters may exercise this option, in whole or in part, from time to time for a period of 30 days from the date of this prospectus. If the underwriters
122
Table of Contents
Index to Financial Statements
exercise this option, each underwriter will be obligated, subject to the conditions in the underwriting agreement, to purchase a number of additional shares of our common stock proportionate to such underwriter’s initial amount relative to the total amount reflected next to their name in the table above.
Lock-Up Agreements
We, our executive officers and directors, the selling shareowners, and certain other persons have entered into lock-up agreements with the underwriters. Under these agreements, we and each of these persons may not, without the prior written approval of the representative, subject to limited exceptions:
| • | offer, pledge, sell, contract to sell, sell any option or contract to purchase, purchase any option or contract to sell, grant any option, right or warrant for the sale of, or otherwise dispose of or transfer any shares of our common stock or any securities convertible into or exchangeable or exercisable for our common stock, whether now owned or hereafter acquired or with respect to which such person has or hereafter acquires the power of disposition, or exercise any right with respect to the registration thereof, or file or cause to be filed any registration statement under the Securities Act, with respect to any of the foregoing; or |
| • | enter into any swap, hedge, or any other agreement or any transaction that transfers, in whole or in part, directly or indirectly, the economic consequence of ownership of the shares of our common stock or such other securities, whether any such swap or transaction is to be settled by delivery of shares of our common stock or other securities, in cash or otherwise. |
These restrictions will be in effect for a period of 180 days after the date of the underwriting agreement. At any time and without public notice, the representative may, in its sole discretion, waive or release all or some of the securities from these lock-up agreements. However, as to any of our executive officers or directors, the representative has agreed to notify us at least three business days before the effective date of any release or waiver, and we have agreed to announce the impending release or waiver by press release through a major news service at least two business days before the effective date of the release or waiver.
These restrictions also apply to securities convertible into or exchangeable or exercisable for or repayable with our common stock to the same extent as they apply to our common stock. They also apply to common stock owned now or acquired later by the person executing the agreement or for which the person executing the agreement later acquires the power of disposition.
Pricing of the Offering
Prior to this offering, there has been no public market for our common stock. The initial public offering price will be determined by negotiations between us, the selling shareowners, and the representative of the underwriters. In addition to prevailing market conditions, among the factors to be considered in determining the initial public offering price of our common stock will be our historical performance, estimates of our business potential and our earnings prospects, an assessment of our management, and the consideration of the above factors in relation to market valuation of companies in related businesses. The estimated initial public offering price range set forth on the cover page of this preliminary prospectus is subject to change as a result of market conditions and other factors. An active trading market for the shares of our common stock may not develop. It is also possible that the shares of our common stock will not trade in the public market at or above the initial public offering price following the completion of this offering.
Exchange Quotation
We have applied to have our common stock approved for listing on the NASDAQ Global Select Market under the symbol “NCOM.”
Indemnification and Contribution
We and the selling shareowners have agreed to indemnify the underwriters and their affiliates, selling agents, and controlling persons against certain liabilities, including under the Securities Act. If we are unable to provide this indemnification, we will contribute to the payments the underwriters and their affiliates, selling agents, and controlling persons may be required to make in respect of those liabilities.
123
Table of Contents
Index to Financial Statements
Price Stabilization, Short Positions, and Penalty Bids
To facilitate this offering, the underwriters may engage in transactions that stabilize, maintain, or otherwise affect the price of our common stock, including:
| • | stabilizing transactions; |
| • | short sales; and |
| • | purchases to cover positions created by short sales. |
Stabilizing transactions consist of bids or purchases made for the purpose of preventing or retarding a decline in the market price of our common stock while this offering is in progress. These transactions may also include making short sales of our common stock, which involve the sale by the underwriters of a greater number of shares of common stock than they are required to purchase in this offering. Short sales may be “covered short sales,” which are short positions in an amount not greater than the underwriters’ purchase option referred to above, or may be “naked short sales,” which are short positions in excess of that amount.
The underwriters may close out any covered short position either by exercising their purchase option, in whole or in part, or by purchasing shares in the open market. In making this determination, the underwriters will consider, among other things, the price of shares available for purchase in the open market compared to the price at which they may purchase shares through the purchase option. The underwriters must close out any naked short position by purchasing shares in the open market. A naked short position is more likely to be created if the underwriters are concerned that there may be downward pressure on the price of our common stock in the open market that could adversely affect investors who purchased in this offering.
As an additional means of facilitating our initial public offering, the underwriters may bid for, and purchase, shares of our common stock in the open market. The underwriting syndicate also may reclaim selling concessions allowed to an underwriter or a dealer for distributing shares of our common stock in this offering, if the syndicate repurchases previously distributed shares of our common stock to cover syndicate short positions or to stabilize the price of our common stock.
As a result of these activities, the price of our common stock may be higher than the price that otherwise might exist in the open market. If these activities are commenced, they may be discontinued by the underwriters at any time without notice. The underwriters may carry out these transactions on the NASDAQ Global Select Market, in the over-the-counter market or otherwise.
Passive Market Making
In connection with this offering, the underwriters and the selling shareowners may engage in passive market making transactions in our common stock on the NASDAQ Global Select Market in accordance with Rule 103 of Regulation M under the Exchange Act during a period before the commencement of offers or sales of our common stock and extending through the completion of the distribution of this offering. A passive market maker must display its bid at a price not in excess of the highest independent bid of that security. However, if all independent bids are lowered below the passive market maker’s bid, the bid must then be lowered when specified purchase limits are exceeded. Passive market making may cause the price of our common stock to be higher than the price that otherwise would exist in the open market in the absence of those transactions. The underwriters and dealers are not required to engage in passive market making and may end passive market making activities at any time.
Electronic Distribution
A prospectus in electronic format may be made available by e-mail or on the websites or through online services maintained by one or more of the underwriters or their affiliates. In those cases, prospective investors may view offering terms online and may be allowed to place orders online. The underwriters may agree with us to allocate a specific number of shares for sale to online brokerage account holders. Any such allocation for online distributions will be made by the underwriters on the same basis as other allocations. Other than the prospectus in electronic format, the information on the underwriters’ websites and any information contained on any other website maintained by any of the underwriters is not part of this prospectus, has not been approved and/or endorsed by the underwriters or us, and should not be relied upon by investors.
124
Table of Contents
Index to Financial Statements
Directed Share Program
At our request, the underwriters have reserved for sale, at the initial public offering price, up to 5% of the shares of our common stock offered by this prospectus for sale to our directors, officers, employees, business associates, and related persons. Reserved shares purchased by our directors and executive officers will be subject to the lock-up provisions described above. The number of shares of our common stock available for sale to the general public will be reduced to the extent these persons purchase the reserved shares. Any reserved shares of our common stock that are not so purchased will be offered by the underwriters to the general public on the same terms as the other shares of common stock offered by this prospectus.
Affiliations
The underwriters and their respective affiliates are full service financial institutions engaged in various activities, which may include securities trading, commercial and investment banking, financial advisory, investment management, investment advisory, investment research, principal investment, hedging, financing, loan referrals, valuation, and brokerage activities. From time to time, the underwriters and/or their respective affiliates have directly and indirectly engaged, and may in the future engage, in various financial advisory, investment banking loan referrals, and commercial banking services with us and our affiliates, for which they received or paid, or may receive or pay, customary compensation, fees, and expense reimbursement. In the ordinary course of their various business activities, the underwriters and their respective affiliates may make or hold a broad array of investments and actively trade debt and equity securities (or related derivative securities) and financial instruments (including bank loans) for their own account and for the accounts of their customers, and those investment and securities activities may involve securities and/or instruments of ours. The underwriters and their respective affiliates may also make investment recommendations and/or publish or express independent research views in respect of those securities or instruments and may at any time hold, or recommend to clients that they acquire, long and/or short positions in those securities and instruments.
Selling Restrictions
European Economic Area
In relation to each Member State of the European Economic Area that has implemented the Prospectus Directive, each a Relevant Member State, each underwriter has represented and agreed that, with effect from and including the date on which the Prospectus Directive is implemented in that Relevant Member State, or the Relevant Implementation Date, it has not made and will not make an offer of shares to the public in that Relevant Member State prior to the publication of a prospectus in relation to the shares of our common stock offered hereby that has been approved by the competent authority in that Relevant Member State or, where appropriate, approved in another Relevant Member State and notified to the competent authority in that Relevant Member State, all in accordance with the Prospectus Directive, except that it may, with effect from and including the Relevant Implementation Date, make an offer of shares to the public in that Relevant Member State at any time:
| • | to legal entities that are authorized or regulated to operate in the financial markets or, if not so authorized or regulated, whose corporate purpose is solely to invest in securities; |
| • | to any legal entity that has two or more of (1) an average of at least 250 employees during the last financial year, (2) a total balance sheet of more than €43,000,000, and (3) an annual net turnover of more than €50,000,000, as shown in its last annual or consolidated accounts; |
| • | to fewer than 100 natural or legal persons or, if the Relevant Member State has implemented the relevant provision of the 2010 PD Amending Directive, 150 natural or legal persons (other than qualified investors, as defined in the Prospectus Directive), subject to obtaining the prior consent of Keefe, Bruyette & Woods, Inc. for any such offer; or |
| • | in any other circumstances that do not require the publication by us of a prospectus pursuant to Article 3 of the Prospectus Directive. |
For the purposes of this provision, the expression “an offer of shares to the public” in relation to any shares in any Relevant Member State means the communication in any form and by any means of sufficient information
125
Table of Contents
Index to Financial Statements
on the terms of the offer and the shares to be offered so as to enable an investor to decide to purchase or subscribe for the shares, as the same may be varied in that Relevant Member State by any measure implementing the Prospectus Directive in that Relevant Member State, and the expression “Prospectus Directive” means Directive 2003/71/EC and includes any relevant implementing measure in each Relevant Member State and “2010 PD Amending Directive” means Directive 2010/73/EU.
United Kingdom
Each underwriter has represented and agreed that:
| • | it has only communicated or caused to be communicated and will only communicate or cause to be communicated an invitation or inducement to engage in investment activity (within the meaning of Section 21 of the Financial Services and Markets Act 2000, as amended, or the FSMA) received by it in connection with the issue or sale of the shares of our common stock offered hereby in circumstances in which Section 21(1) of the FSMA does not apply to us; and |
| • | it has complied and will comply with all applicable provisions of the FSMA with respect to anything done by it in relation to the shares of our common stock offered hereby in, from or otherwise involving the United Kingdom. |
126
Table of Contents
Index to Financial Statements
Certain legal matters relating to this offering, including the validity of the shares to be issued, will be passed upon for us by Maynard, Cooper & Gale, P.C., Birmingham, Alabama. Members of Maynard, Cooper & Gale, P.C. own shares of our common stock representing on an aggregate basis less than 2.0% of the total number of shares of our common stock outstanding. Covington & Burling LLP, Washington, D.C., will act as counsel to the underwriters.
Our consolidated financial statements as of December 31, 2014 and 2013, and for each of the years in the three-year period ended December 31, 2014, included herein beginning on page F-3, have been audited by Porter Keadle Moore LLC, our independent registered public accounting firm, and are included in reliance upon such report given on the authority of such firm as experts in accounting and auditing.
The consolidated financial statements of United as of December 31, 2013 and 2012, and for each of the years in the two-year period ended December 31, 2013, included herein beginning on page F- , have been audited by Saltmarsh, Cleaveland & Gund, P.A.
The consolidated financial statements of CBI as of December 31, 2013 and 2012, and for each of the years in the two-year period ended December 31, 2013, included herein beginning on page F- , have been audited by Talley, Mauldin & Peete, P.C.
WHERE YOU CAN FIND MORE INFORMATION
We have filed with the SEC a registration statement on Form S-1 under the Securities Act with respect to the common stock offered hereby. As allowed by SEC rules, this prospectus, which constitutes part of the registration statement, does not contain all of the information contained in the registration statement and the exhibits and schedules included with the registration statement. For further information with respect to the Company and our common stock, reference is made to the registration statement and the included exhibits and schedules. Statements contained in this prospectus as to the contents of any contract or other document referred to are not necessarily complete, and in each instance, if such contract or document is filed as an exhibit, reference is made to the copy of such contract or other document filed as an exhibit to the registration statement, each statement being qualified in all respects by such reference. A copy of the registration statement, including the exhibits and schedules thereto, may be read and copied at the SEC’s Public Reference Room at 100 F Street, N.E., Washington, D.C. 20549. Information on the operation of the Public Reference Room may be obtained by calling the SEC at 1-800-SEC-0330. In addition, the SEC maintains an Internet site at www.sec.gov, from which interested persons can electronically access the registration statement, including the exhibits and schedules thereto.
We are subject to the information and reporting requirements of the Exchange Act and are required to file annual, quarterly, and current reports and other information with the SEC. You may read and copy these reports and other information at the public reference facilities of the SEC at the addresses set forth above. We also maintain a website at www.nationalbankofcommerce.com, through which you can access our filings with the SEC. Information on, or accessible through, our website is not part of this prospectus. We have included our website address only as an inactive textual reference and do not intend it to be an active link to our website.
127
Table of Contents
Index to Financial Statements
INDEX TO CONSOLIDATED FINANCIAL STATEMENTS
F-1
Table of Contents
Index to Financial Statements
| Audited Financial Statements of CBI as of and for the Year Ended December 31, 2013 |
||||
| F-99 | ||||
| F-101 | ||||
| Consolidated Statement of Operations for the Year Ended December 31, 2013 |
F-102 | |||
| Consolidated Statements of Changes in Members’ Equity for the Year Ended December 31, 2013 |
F-103 | |||
| Consolidated Statement of Cash Flows for the Year Ended December 31, 2013 |
F-104 | |||
| F-105 | ||||
| F-108 | ||||
| Consolidated Schedule of Operating Expenses for the Year Ended December 31, 2013 |
F-109 | |||
| F-110 | ||||
| Consolidating Statement of Operations for the Year Ended December 31, 2013 |
F-111 | |||
| Audited Financial Statements of CBI as of and for the Year Ended December 31, 2012 |
||||
| F-112 | ||||
| F-114 | ||||
| Consolidated Statement of Operations for the Year Ended December 31, 2012 |
F-115 | |||
| Consolidated Statements of Changes in Members’ Equity for the Year Ended December 31, 2012 |
F-116 | |||
| Consolidated Statement of Cash Flows for the Year Ended December 31, 2012 |
F-117 | |||
| F-118 | ||||
| F-121 | ||||
| Consolidated Schedule of Operating Expenses for the Year Ended December 31, 2012 |
F-122 | |||
F-2
Table of Contents
Index to Financial Statements

REPORT OF INDEPENDENT REGISTERED PUBLIC ACCOUNTING FIRM
To the Board of Directors and Shareholders
National Commerce Corporation and subsidiaries
Birmingham, Alabama
We have audited the accompanying consolidated balance sheets of National Commerce Corporation and subsidiaries as of December 31, 2014 and 2013, and the related consolidated statements of earnings, comprehensive income, changes in shareholders’ equity, and cash flows for each of the three years in the period ended December 31, 2014. These financial statements are the responsibility of the Company’s management. Our responsibility is to express an opinion on these financial statements based on our audits.
We conducted our audits in accordance with the standards of the Public Company Accounting Oversight Board (United States). Those standards require that we plan and perform the audit to obtain reasonable assurance about whether the financial statements are free of material misstatement. The Company is not required to have, nor were we engaged to perform, an audit of its internal control over financial reporting. Our audits included consideration of internal control over financial reporting as a basis for designing audit procedures that are appropriate in the circumstances, but not for the purpose of expressing an opinion on the effectiveness of the Company’s internal control over financial reporting. Accordingly, we express no such opinion. An audit also includes examining, on a test basis, evidence supporting the amounts and disclosures in the financial statements, assessing the accounting principles used and significant estimates made by management, as well as evaluating the overall financial statement presentation. We believe that our audits provide a reasonable basis for our opinion.
In our opinion, the consolidated financial statements referred to above present fairly, in all material respects, the financial position of National Commerce Corporation and subsidiaries as of December 31, 2014 and 2013, and the results of their operations and their cash flows for each of the three years in the period ended December 31, 2014, in conformity with U.S. generally accepted accounting principles.

Atlanta, Georgia
February 20, 2015
235 Peachtree Street NE | Suite 1800 | Atlanta, Georgia 30303 | Phone 404.588.4200 | Fax 404.588.4222
F-3
Table of Contents
Index to Financial Statements
Consolidated Balance Sheets
December 31, 2014 and 2013
(In thousands, except share and per share data)
| 2014 | 2013 | |||||||
| Assets | ||||||||
| Cash and due from banks |
$ | 14,236 | 2,273 | |||||
| Interest-bearing deposits with banks |
109,199 | 121,863 | ||||||
|
|
|
|
|
|||||
| Cash and cash equivalents |
123,435 | 124,136 | ||||||
| Investment securities available-for-sale |
34,932 | 47,979 | ||||||
| Other investments |
5,421 | 4,482 | ||||||
| Mortgage loans held-for-sale |
9,329 | 7,159 | ||||||
| Loans, net of unearned income |
888,721 | 582,002 | ||||||
| Less: allowance for loan losses |
9,802 | 9,119 | ||||||
|
|
|
|
|
|||||
| Loans, net |
878,919 | 572,883 | ||||||
| Premises and equipment, net |
27,560 | 16,181 | ||||||
| Accrued interest receivable |
2,193 | 1,430 | ||||||
| Bank owned life insurance |
10,641 | 8,247 | ||||||
| Other real estate |
1,008 | 845 | ||||||
| Deferred tax assets, net |
11,444 | 6,757 | ||||||
| Goodwill |
28,834 | — | ||||||
| Core deposit intangible, net |
1,757 | — | ||||||
| Other assets |
2,953 | 1,682 | ||||||
|
|
|
|
|
|||||
| Total assets |
$ | 1,138,426 | 791,781 | |||||
|
|
|
|
|
|||||
| Liabilities and Shareholders’ Equity | ||||||||
| Deposits: |
||||||||
| Noninterest-bearing demand |
$ | 217,643 | 128,837 | |||||
| Interest-bearing demand |
154,816 | 107,060 | ||||||
| Savings and money market |
392,394 | 304,071 | ||||||
| Time |
206,207 | 138,063 | ||||||
|
|
|
|
|
|||||
| Total deposits |
971,060 | 678,031 | ||||||
| Federal Home Loan Bank advances |
22,000 | 22,000 | ||||||
| Accrued interest payable |
431 | 476 | ||||||
| Other liabilities |
8,774 | 2,335 | ||||||
|
|
|
|
|
|||||
| Total liabilities |
1,002,265 | 702,842 | ||||||
|
|
|
|
|
|||||
| Commitments |
||||||||
| Shareholders’ equity: |
||||||||
| Preferred stock, 250,000 shares authorized, no shares issued or outstanding |
— | — | ||||||
| Common stock – voting, at December 31, 2014, $0.01 par value, 12,500,000 shares authorized and 7,541,541 shares issued and outstanding; at December 31, 2013, $1.00 par value, 11,250,000 shares authorized and 5,164,219 shares issued and outstanding |
75 | 5,164 | ||||||
| Common stock – non-voting, at December 31, 2014 all shares reclassified to common stock; at December 31, 2013, $1.00 par value; 1,250,000 shares authorized, 565,895 shares issued and outstanding |
— | 566 | ||||||
| Additional paid-in capital |
131,455 | 91,774 | ||||||
| Accumulated deficit |
(3,453 | ) | (8,856 | ) | ||||
| Accumulated other comprehensive income |
845 | 291 | ||||||
|
|
|
|
|
|||||
| Total shareholders’ equity attributable to National Commerce Corporation |
128,922 | 88,939 | ||||||
| Noncontrolling interest |
7,239 | — | ||||||
|
|
|
|
|
|||||
| Total shareholders’ equity |
136,161 | 88,939 | ||||||
|
|
|
|
|
|||||
| Total liabilities and shareholders’ equity |
$ | 1,138,426 | 791,781 | |||||
|
|
|
|
|
|||||
See accompanying notes to consolidated financial statements.
F-4
Table of Contents
Index to Financial Statements
Consolidated Statements of Earnings
For the Years Ended December 31, 2014, 2013 and 2012
(In thousands, except per share data)
| 2014 | 2013 | 2012 | ||||||||||
| Interest and dividend income: |
||||||||||||
| Interest and fees on loans |
$ | 29,812 | 21,642 | 18,026 | ||||||||
| Interest and dividends on taxable investment securities |
1,178 | 1,330 | 1,482 | |||||||||
| Interest on non-taxable investment securities |
169 | 134 | 183 | |||||||||
| Interest on interest-bearing deposits and federal funds sold |
183 | 206 | 261 | |||||||||
|
|
|
|
|
|
|
|||||||
| Total interest income |
31,342 | 23,312 | 19,952 | |||||||||
| Interest expense: |
||||||||||||
| Interest on deposits |
2,427 | 2,102 | 2,502 | |||||||||
| Interest on borrowings |
442 | 511 | 778 | |||||||||
|
|
|
|
|
|
|
|||||||
| Total interest expense |
2,869 | 2,613 | 3,280 | |||||||||
|
|
|
|
|
|
|
|||||||
| Net interest income |
28,473 | 20,699 | 16,672 | |||||||||
| Provision for loan losses |
978 | — | 125 | |||||||||
|
|
|
|
|
|
|
|||||||
| Net interest income after provision for loan losses |
27,495 | 20,699 | 16,547 | |||||||||
|
|
|
|
|
|
|
|||||||
| Other income: |
||||||||||||
| Service charges and fees on deposit accounts |
714 | 630 | 535 | |||||||||
| Mortgage origination and fee income |
3,752 | 4,035 | 3,254 | |||||||||
| Income from bank owned life insurance |
242 | 236 | 194 | |||||||||
| Wealth management fees |
58 | 89 | 103 | |||||||||
| Gain on other real estate |
13 | 62 | 396 | |||||||||
| (Loss) gain on sale of investment securities available-for-sale |
(33 | ) | 47 | — | ||||||||
| Other |
286 | 203 | 183 | |||||||||
|
|
|
|
|
|
|
|||||||
| Total other income |
5,032 | 5,302 | 4,665 | |||||||||
|
|
|
|
|
|
|
|||||||
| Other expense: |
||||||||||||
| Salaries and employee benefits |
15,459 | 13,443 | 11,587 | |||||||||
| Occupancy and equipment |
1,944 | 1,727 | 1,733 | |||||||||
| Core deposit intangible amortization |
18 | — | — | |||||||||
| Other operating expense |
6,032 | 4,515 | 4,764 | |||||||||
|
|
|
|
|
|
|
|||||||
| Total other expense |
23,453 | 19,685 | 18,084 | |||||||||
|
|
|
|
|
|
|
|||||||
| Earnings before income taxes |
9,074 | 6,316 | 3,128 | |||||||||
| Income tax expense |
3,159 | 2,310 | 1,071 | |||||||||
|
|
|
|
|
|
|
|||||||
| Net earnings |
5,915 | 4,006 | 2,057 | |||||||||
| Less: Net earnings attributable to noncontrolling interest |
512 | — | — | |||||||||
|
|
|
|
|
|
|
|||||||
| Net earnings attributable to National Commerce Corporation |
$ | 5,403 | 4,006 | 2,057 | ||||||||
|
|
|
|
|
|
|
|||||||
| Basic earnings per common share |
$ | 0.92 | 0.70 | 0.36 | ||||||||
| Diluted earnings per common share |
$ | 0.91 | 0.69 | 0.36 | ||||||||
See accompanying notes to consolidated financial statements.
F-5
Table of Contents
Index to Financial Statements
Consolidated Statements of Comprehensive Income
For the Years Ended December 31, 2014, 2013 and 2012
(In thousands)
| 2014 | 2013 | 2012 | ||||||||||
| Net earnings |
$ | 5,403 | 4,006 | 2,057 | ||||||||
|
|
|
|
|
|
|
|||||||
| Other comprehensive income (loss), net of tax: |
||||||||||||
| Unrealized gains (losses) on investment securities available-for-sale: |
||||||||||||
| Unrealized gains (losses) arising during the period, net of tax of $287, ($635) and $119, respectively |
533 | (1,180 | ) | 222 | ||||||||
| Reclassification adjustment for losses (gains) included in net earnings, net of tax of $12 and ($17) in 2014 and 2013, respectively |
21 | (30 | ) | — | ||||||||
|
|
|
|
|
|
|
|||||||
| Other comprehensive income (loss) |
554 | (1,210 | ) | 222 | ||||||||
|
|
|
|
|
|
|
|||||||
| Comprehensive income |
$ | 5,957 | 2,796 | 2,279 | ||||||||
|
|
|
|
|
|
|
|||||||
See accompanying notes to consolidated financial statements.
F-6
Table of Contents
Index to Financial Statements
Consolidated Statements of Changes in Shareholders’ Equity
For the Years Ended December 31, 2014, 2013 and 2012
(In thousands)
| Common Stock |
Non-voting Common Stock |
Additional Paid-in Capital |
Accumulated Deficit |
Other Comprehensive Income |
Noncontrolling Interest |
Total | ||||||||||||||||||||||
| Balance, December 31, 2011 |
$ | 5,164 | 566 | 91,369 | (14,919 | ) | 1,279 | — | 83,459 | |||||||||||||||||||
| Share-based compensation expense |
— | — | 112 | — | — | 112 | ||||||||||||||||||||||
| Net earnings |
— | — | 2,057 | — | — | 2,057 | ||||||||||||||||||||||
| Change in unrealized gain/loss on securities available-for- sale, net of tax |
— | — | — | — | 222 | — | 222 | |||||||||||||||||||||
|
|
|
|
|
|
|
|
|
|
|
|
|
|
|
|||||||||||||||
| Balance, December 31, 2012 |
5,164 | 566 | 91,481 | (12,862 | ) | 1,501 | — | 85,850 | ||||||||||||||||||||
| Share-based compensation expense |
293 | 293 | ||||||||||||||||||||||||||
| Net earnings |
4,006 | 4,006 | ||||||||||||||||||||||||||
| Change in unrealized gain/loss on securities available-for- sale, net of tax |
— | — | — | — | (1,210 | ) | — | (1,210 | ) | |||||||||||||||||||
|
|
|
|
|
|
|
|
|
|
|
|
|
|
|
|||||||||||||||
| Balance, December 31, 2013 |
5,164 | 566 | 91,774 | (8,856 | ) | 291 | — | 88,939 | ||||||||||||||||||||
| Share-based compensation expense |
358 | 358 | ||||||||||||||||||||||||||
| Net earnings attributable to National Commerce Corporation |
5,403 | 5,403 | ||||||||||||||||||||||||||
| Reclassification for Delaware reincorporation |
(5,108 | ) | (566 | ) | 5,674 | — | ||||||||||||||||||||||
| Exercise of stock options and warrants |
1 | 614 | 615 | |||||||||||||||||||||||||
| Sale of common stock, net of offering expenses of $28 |
2 | 2,970 | 2,972 | |||||||||||||||||||||||||
| Acquisition of United, net of offering expenses of $272 |
16 | 30,067 | 30,083 | |||||||||||||||||||||||||
| Initial noncontrolling interest |
6,934 | 6,934 | ||||||||||||||||||||||||||
| Net earnings attributable to noncontrolling interest |
512 | 512 | ||||||||||||||||||||||||||
| Distributions paid to noncontrolling interest |
(207 | ) | (207 | ) | ||||||||||||||||||||||||
| Share repurchase and retirement |
(2 | ) | (2 | ) | ||||||||||||||||||||||||
| Change in unrealized gain/loss on securities available-for- sale, net of tax |
— | — | — | — | 554 | — | 554 | |||||||||||||||||||||
|
|
|
|
|
|
|
|
|
|
|
|
|
|
|
|||||||||||||||
| Balance, December 31, 2014 |
$ | 75 | — | 131,455 | (3,453 | ) | 845 | 7,239 | 136,161 | |||||||||||||||||||
|
|
|
|
|
|
|
|
|
|
|
|
|
|
|
|||||||||||||||
See accompanying notes to consolidated financial statements.
F-7
Table of Contents
Index to Financial Statements
Consolidated Statements of Cash Flows
For the Years Ended December 31, 2014, 2013 and 2012
(In thousands)
| 2014 | 2013 | 2012 | ||||||||||
| Cash flows from operating activities: |
||||||||||||
| Net earnings |
$ | 5,403 | 4,006 | 2,057 | ||||||||
| Adjustments to reconcile net earnings to net cash provided (used) by operating activities: |
||||||||||||
| Provision for loan losses |
978 | — | 125 | |||||||||
| Net earnings attributable to noncontrolling interest |
512 | — | — | |||||||||
| Depreciation, amortization and accretion |
933 | 757 | 621 | |||||||||
| Loss (gain) on sale of investment securities available-for-sale |
33 | (47 | ) | — | ||||||||
| Loss (gain) on ineffective portion of fair value hedge derivative |
128 | (16 | ) | — | ||||||||
| Change in mortgage loan derivative |
(18 | ) | (79 | ) | — | |||||||
| Deferred tax expense |
552 | 1,901 | 1,000 | |||||||||
| Loss on trade or sale of premises and equipment |
1 | — | — | |||||||||
| Share-based compensation expense |
358 | 293 | 112 | |||||||||
| Income from bank owned life insurance |
(242 | ) | (236 | ) | (194 | ) | ||||||
| Gain on other real estate |
(13 | ) | (62 | ) | (396 | ) | ||||||
| Change in: |
||||||||||||
| Mortgage loans held-for-sale |
(2,170 | ) | 6,677 | (5,939 | ) | |||||||
| Other assets and accrued interest receivable |
(1,321 | ) | 134 | 184 | ||||||||
| Other liabilities and accrued interest payable |
(486 | ) | (118 | ) | 1,266 | |||||||
|
|
|
|
|
|
|
|||||||
| Net cash provided (used) by operating activities |
4,648 | 13,210 | (1,164 | ) | ||||||||
|
|
|
|
|
|
|
|||||||
| Cash flows from investing activities (net of effect of business combinations): |
||||||||||||
| Proceeds from calls, maturities and paydowns of securities available-for-sale |
5,386 | 11,206 | 10,651 | |||||||||
| Proceeds from sale of securities available-for-sale |
35,377 | 952 | — | |||||||||
| Purchases of securities available-for-sale |
(1,501 | ) | (21,225 | ) | (981 | ) | ||||||
| Proceeds from sale of other investments |
427 | 113 | 315 | |||||||||
| Purchases of other investments |
(160 | ) | (246 | ) | (634 | ) | ||||||
| Net cash received in acquisitions |
20,170 | — | — | |||||||||
| Net change in loans |
(75,195 | ) | (142,514 | ) | (142,155 | ) | ||||||
| Proceeds from sale of other real estate |
65 | 329 | 1,546 | |||||||||
| Investment in bank owned life insurance |
— | — | (3,000 | ) | ||||||||
| Purchases of premises and equipment |
(2,832 | ) | (4,076 | ) | (5,925 | ) | ||||||
|
|
|
|
|
|
|
|||||||
| Net cash used by investing activities |
(18,263 | ) | (155,461 | ) | (140,183 | ) | ||||||
|
|
|
|
|
|
|
|||||||
| Cash flows from financing activities (net of effect of business combinations): |
||||||||||||
| Net change in deposits |
92,483 | 97,795 | 255,658 | |||||||||
| Proceeds from Federal Home Loan Bank advances |
— | — | 15,000 | |||||||||
| Repayment of Federal Home Loan Bank advances |
(4,874 | ) | (2,500 | ) | (7,000 | ) | ||||||
| Repayment of short-term debt |
(77,801 | ) | — | — | ||||||||
| Cash distributions paid to noncontrolling interests |
(207 | ) | — | — | ||||||||
| Repayment of non-recourse debt |
— | (195 | ) | (336 | ) | |||||||
| Stock repurchase |
(2 | ) | — | — | ||||||||
| Proceeds from stock offering |
3,000 | — | — | |||||||||
| Stock offering expenses |
(28 | ) | — | — | ||||||||
| Stock offering expenses related to acquisition |
(272 | ) | — | — | ||||||||
| Proceeds from exercise of options and warrants |
615 | — | — | |||||||||
|
|
|
|
|
|
|
|||||||
| Net cash provided by financing activities |
12,914 | 95,100 | 263,322 | |||||||||
|
|
|
|
|
|
|
|||||||
| Net change in cash and cash equivalents |
(701 | ) | (47,151 | ) | 121,975 | |||||||
| Cash and cash equivalents at beginning of the period |
124,136 | 171,287 | 49,312 | |||||||||
|
|
|
|
|
|
|
|||||||
| Cash and cash equivalents at end of the period |
$ | 123,435 | 124,136 | 171,287 | ||||||||
|
|
|
|
|
|
|
|||||||
See accompanying notes to consolidated financial statements.
F-8
Table of Contents
Index to Financial Statements
NATIONAL COMMERCE CORPORATION
Consolidated Statements of Cash Flows (Continued)
For the Years Ended December 31, 2014, 2013 and 2012
(In thousands)
| 2014 | 2013 | 2012 | ||||||||||
| Supplemental disclosure of cash flow information: |
||||||||||||
| Cash paid during the period for: |
||||||||||||
| Interest |
$ | 2,914 | 2,723 | 3,239 | ||||||||
| Income taxes |
$ | 3,233 | 505 | 25 | ||||||||
| Non-cash investing and financing activities: |
||||||||||||
| Change in unrealized gain on securities available-for-sale, net of tax |
$ | 554 | (1,210 | ) | 222 | |||||||
| Transfer of loans to other real estate |
$ | — | 1,017 | 340 | ||||||||
| Transfer of premises held-for-sale to premises and equipment |
$ | — | — | 3,014 | ||||||||
| Assets acquired and liabilities assumed in acquisitions: |
||||||||||||
| Assets acquired in acquisitions |
$ | 307,148 | — | — | ||||||||
| Liabilities assumed in acquisitions |
$ | 290,029 | — | — | ||||||||
See accompanying notes to consolidated financial statements.
F-9
Table of Contents
Index to Financial Statements
Notes to Consolidated Financial Statements
(amounts in tables in thousands, except per share data)
(1) Summary of Significant Accounting Policies
Basis of Presentation
The consolidated financial statements include the accounts of National Commerce Corporation (the “Company”) and its wholly-owned banking subsidiaries, National Bank of Commerce (“NBC”) and United Legacy Bank (“ULB”), collectively, (the “Banks”). In addition to its banking subsidiaries, the Company’s consolidated financial statements include RBCF Holdings Inc., a non-banking subsidiary, as well as NBC’s majority-owned subsidiary, CBI Holding Company, LLC (“CBI”). The Banks provide a full range of commercial and consumer banking services throughout Alabama and Florida, including metropolitan Birmingham, Huntsville, Lee County and Baldwin County in Alabama. In addition to its Alabama locations, the Banks operate full-service banking offices in the greater Orlando area and in Vero Beach, Florida. NBC is primarily regulated by the Office of the Comptroller of Currency (“OCC”) and ULB’s primary regulator is the Florida Office of Financial Regulation (“FOFR”). The Banks undergo periodic examinations by these regulatory agencies. The Company is regulated by the Federal Reserve Bank (“FRB”) and is also subject to periodic examinations. CBI, which conducts business through its wholly-owned subsidiary, Corporate Billing LLC, is a transaction–based finance company headquartered in Decatur, Alabama that provides factoring, invoicing, collection and accounts receivable management services to transportation companies and automotive parts and service providers nationwide.
The accounting principles followed by the Company, and the method of applying these principles, conform with accounting principles generally accepted in the United States of America (“GAAP”) and with general practices within the banking industry. In preparing financial statements in conformity with GAAP, management is required to make estimates and assumptions that affect the reported amounts in the consolidated financial statements. Actual results could differ significantly from those estimates. Material estimates common to the banking industry that are particularly susceptible to significant change in the near term include, but are not limited to, the determination of the allowance for loan losses, the valuation of real estate acquired in connection with foreclosures or in satisfaction of loans, and valuation allowances associated with the realization of deferred tax assets, which are based on future taxable income.
Cash and Cash Equivalents
Cash equivalents include amounts due from banks, interest-bearing deposits with the Federal Reserve Bank of Atlanta (“FRB”), Federal Home Loan Bank (“FHLB”), correspondent banks, and federal funds sold. Generally, federal funds are sold for one-day periods. The Company is required to maintain average reserve balances with the FRB or in cash. At December 31, 2014 and 2013, the Company’s reserve requirements were approximately $2,436,000 and $15,322,000, respectively.
Investment Securities
The Company classifies its securities in one of three categories: trading, available-for-sale, or held-to-maturity. Trading securities are bought and held principally for the purpose of selling them in the near term. Held-to-maturity securities are those securities that the Company has the ability and intent to hold until maturity. All securities not included in trading or held-to-maturity are classified as available-for-sale. At December 31, 2014 and 2013, all securities are classified as available-for-sale.
Available-for-sale securities are recorded at fair value. Held-to-maturity securities are recorded at cost, adjusted for the amortization or accretion of premiums or discounts. Unrealized holding gains and losses, net of the related tax effect, on securities available-for-sale are excluded from earnings and are reported as a separate component of shareholders’ equity until realized. Transfers of securities between categories are recorded at fair value at the date of transfer.
F-10
Table of Contents
Index to Financial Statements
NATIONAL COMMERCE CORPORATION
Notes to Consolidated Financial Statements (Continued)
(amounts in tables in thousands, except per share data)
(1) Summary of Significant Accounting Policies (Continued)
Investment Securities (Continued)
Management evaluates investment securities for other-than-temporary impairment on a quarterly basis. A decline in the market value of any investment below cost that is deemed other-than-temporary is charged to earnings for the decline in value deemed to be credit related and a new cost basis in the security is established. The decline in value attributed to non-credit related factors is recognized in other comprehensive income.
Premiums and discounts are amortized or accreted over the life of the related securities as adjustments to the yield. Realized gains and losses are included in earnings and are derived using the specific identification method for determining the cost of securities sold.
Other Investments
Other investments include FRB stock, FHLB stock and other investments that do not have a readily determinable market value. These investments are carried at cost, which approximates fair value.
Loans and Allowance for Loan Losses
Loans are stated at the principal amount outstanding, net of the allowance for loan losses. Interest on loans is calculated by using the simple interest method on daily balances of the principal amount outstanding.
Nonrefundable loan fees and costs incurred for loans are deferred and recognized in income over the life of the loans.
A loan is considered impaired when, based on current information and events, it is probable that all amounts due according to the contractual terms of the loan agreement will not be collected. Impaired loans are measured based on the present value of expected future cash flows discounted at the loan’s effective interest rate, at the loan’s observable market price, or at the fair value of the collateral of the loan if the loan is collateral dependent. Accrual of interest is discontinued on a loan when management believes, after considering economic and business conditions and collection efforts, that the borrower’s financial condition is such that collection of interest is doubtful. When a loan is placed on nonaccrual status, previously accrued and uncollected interest is charged to interest income on loans. Generally, payments on nonaccrual loans are applied to principal. When a borrower has demonstrated the capacity to service the debt for a reasonable period of time, management may elect to resume the accrual of interest on the loan.
The allowance for loan losses is established through a provision for loan losses charged to expense. Loans are charged against the allowance for loan losses when management believes that the collectibility of the principal is unlikely. The allowance represents an amount which, in management’s judgment, will be adequate to absorb probable losses on existing loans that may become uncollectible.
Management’s judgment in determining the adequacy of the allowance is based on evaluations of the collectibility of loans. These evaluations take into consideration such factors as changes in the nature and volume of the loan portfolio, current economic conditions that may affect the borrower’s ability to pay, overall portfolio quality, and review of specific problem loans.
Management believes that the allowance for loan losses is adequate. While management uses available information to recognize losses on loans, future additions to the allowance may be necessary based on changes in economic conditions. In addition, various regulatory agencies, as an integral part of their examination process, periodically review the Company’s allowance for loan losses. Such agencies may require the Company to recognize additions to the allowance based on judgments that are different than those of management.
F-11
Table of Contents
Index to Financial Statements
NATIONAL COMMERCE CORPORATION
Notes to Consolidated Financial Statements (Continued)
(amounts in tables in thousands, except per share data)
(1) Summary of Significant Accounting Policies (Continued)
Transfers of Financial Assets
Transfers of financial assets are accounted for as sales when control over the assets has been surrendered. Control over transferred assets is deemed to be surrendered when (1) the assets have been isolated from the Company, i.e. put presumptively beyond the reach of the transferor and its creditors, even in bankruptcy or other receivership, (2) the transferee obtains the right (free of conditions that constrain it from taking advantage of that right) to pledge or exchange the transferred assets, and (3) the Company does not maintain effective control over the transferred assets through an agreement to repurchase them before their maturity or the ability to unilaterally cause the holder to return specific assets.
Mortgage Loans Held-for-Sale
Mortgage loans held-for-sale are carried at the lower of aggregate cost or estimated market value. Gains and losses on loans held-for-sale are included in the determination of income for the period in which the sales occur. At December 31, 2014 and 2013, the cost of loans held-for-sale approximates the market value.
Premises and Equipment
Premises and equipment are stated at cost less accumulated depreciation. Major additions and improvements are charged to the property accounts while replacements, maintenance and repairs that do not improve or extend the life of the respective assets are expensed currently. When property is retired or otherwise disposed of, the cost and related accumulated depreciation are removed from the accounts and the resulting gain or loss, if any, is recognized. Depreciation expense is computed using the straight-line method over the following estimated useful lives:
| Building and improvements |
10 – 40 years | |
| Furniture and equipment |
5 – 10 years | |
| Leasehold improvements |
18 years | |
| Computer equipment |
3 years |
Other Real Estate and Repossessed Assets
Other real estate represents properties acquired through or in lieu of loan foreclosure and is initially recorded at fair value less estimated disposal costs. Costs of improvements are capitalized, whereas costs relating to holding other real estate and valuation adjustments are expensed. Revenue and expenses from operations and changes in valuation allowance are included in net expenses from other real estate.
Business Combinations
The Company accounts for business combinations under the acquisition method of accounting in accordance with Accounting Standards Codification (“ASC”) 805, Business Combinations. The Company recognizes the full fair value of the assets acquired and liabilities assumed and immediately expenses transaction costs. There is no separate recognition of the acquired allowance for loan losses on the acquirer’s balance sheet as credit-related factors are incorporated directly into the fair value of the net tangible and intangible assets acquired. If the amount of consideration exceeds the fair value of assets purchased less the fair value of liabilities assumed, goodwill is recorded. Alternatively, if the amount by which the fair value of assets purchased exceeds the fair value of liabilities assumed and consideration paid, a gain (“bargain purchase gain”) is recorded. Fair values are subject to refinement for up to one year after the closing date of an acquisition as information relative to closing date fair values becomes available. Results of operations of the acquired business are included in the statement of income from the effective date of the acquisition. Additional information regarding acquisitions is provided in Note 2.
F-12
Table of Contents
Index to Financial Statements
NATIONAL COMMERCE CORPORATION
Notes to Consolidated Financial Statements (Continued)
(amounts in tables in thousands, except per share data)
(1) Summary of Significant Accounting Policies (Continued)
Goodwill and Intangible Assets
Goodwill represents the excess of cost over the fair value of the net assets purchased in business combinations. Goodwill is required to be tested annually for impairment or whenever events occur that may indicate that the recoverability of the carrying amount is not probable. In the event of an impairment, the amount by which the carrying amount exceeds the fair value is charged to earnings. The Company performs its annual test for impairment in the fourth quarter of each year.
Intangible assets consist of core deposit premiums acquired in connection with business combinations and are based on the established value of acquired customer deposits. The core deposit premium is initially recognized based on a valuation performed as of the consummation date and is amortized over an estimated useful life of three to ten years. Amortization periods are reviewed annually in connection with the annual impairment testing of goodwill.
Purchased Loans
Purchased loans acquired in a business combination are recorded at estimated fair value on their purchase date. When the loans have evidence of credit deterioration since origination and it is probable at the date of acquisition that the Company will not collect all contractually required principal and interest payments, the difference between contractually required payments at acquisition and the cash flows expected to be collected at acquisition is referred to as the non-accretable difference. The Company must estimate expected cash flows at each reporting date. Subsequent decreases to the expected cash flows will generally result in a provision for loan losses. Subsequent increases in expected cash flows result in a reversal of the provision for loan losses to the extent of prior provisions and adjust accretable discount if no prior provisions have been made. This increase in accretable discount will have a positive impact on interest income. In addition, purchased loans without evidence of credit deterioration are also handled under this method.
Income Taxes
Deferred tax assets and liabilities are recognized for the future tax consequences attributable to differences between the financial statement carrying amounts of existing assets and liabilities and their respective tax bases and operating loss and tax credit carryforwards. Deferred tax assets and liabilities are measured using enacted tax rates expected to apply to taxable income in the years in which those temporary differences are expected to be recovered or settled. The effect of a change in tax rates on deferred tax assets and liabilities is recognized in income in the period that includes the enactment date.
In the event the future tax consequences of differences between the financial reporting bases and the tax bases of the assets and liabilities results in deferred tax assets, an evaluation of the probability of being able to realize the future benefits indicated by such asset is required. A valuation allowance is provided for the portion of the deferred tax asset when it is more likely than not that some portion or all of the deferred tax asset will not be realized. In assessing the realizability of the deferred tax assets, management considers the scheduled reversals of deferred tax liabilities, projected future taxable income, and tax planning strategies.
The Company currently evaluates income tax positions judged to be uncertain. A loss contingency reserve is accrued if it is probable that the tax position will be challenged, it is probable that the future resolution of the challenge will confirm that a loss has been incurred, and the amount of such loss can be reasonably estimated.
Derivative Financial Instruments and Hedging Activities
In the normal course of business, the Company enters into derivative contracts to manage interest rate risk by modifying the characteristics of the related balance sheet instruments in order to reduce the adverse effect of changes in interest rates.
F-13
Table of Contents
Index to Financial Statements
NATIONAL COMMERCE CORPORATION
Notes to Consolidated Financial Statements (Continued)
(amounts in tables in thousands, except per share data)
(1) Summary of Significant Accounting Policies (Continued)
Derivative Financial Instruments and Hedging Activities (Continued)
All derivatives are recognized on the balance sheet at their value in accordance with ASC 815, Accounting for Derivative Instruments and Hedging Activities. On the date the derivative contract is entered into, the Company designates the derivative as a hedge of fair value of a recognized asset or liability or of an unrecognized firm commitment. Changes in the fair value of a derivative that are highly effective, and that are designated and qualify as a fair value hedge, along with the loss or gain on the hedged asset or liability that is attributable to the hedged risk (including gains or losses on firm commitments), are recorded in current-period earnings.
The Company formally documents all relationships between hedging instruments and hedged items, as well as its risk-management objective and strategy for undertaking various hedged transactions. This process includes linking all derivatives that are designated as fair value hedges to specific assets and liabilities on the balance sheet. The Company also formally assesses, both at the hedge’s inception and on an ongoing basis, whether the derivatives that are used in hedging transactions are highly effective in offsetting changes in fair values of hedged items. When it is determined that a derivative is not highly effective as a hedge or that it has ceased to be a highly effective hedge, the Company discontinues hedge accounting prospectively, as discussed below.
The Company discontinues hedge accounting prospectively when (a) it is determined that the derivative is no longer effective in offsetting changes in the fair value of a hedged item; (b) the derivative expires or is sold, terminated, or exercised; (c) a hedged firm commitment no longer meets the definition of a firm commitment; or (d) management determines that designation of the derivative as a hedge instrument is no longer appropriate.
When hedge accounting is discontinued because it is determined that the derivative no longer qualifies as an effective fair value hedge, the derivative will continue to be carried on the balance sheet at its fair value, and the hedged asset or liability will no longer be adjusted for changes in fair value. When hedge accounting is discontinued because the hedged item no longer meets the definition of a firm commitment, the derivative will continue to be carried on the balance sheet at its fair value, and any asset or liability that was recorded pursuant to recognition of the firm commitment will be removed from the balance sheet and recognized as a gain or loss in current-period earnings. In all other situations in which hedge accounting is discontinued, the derivative will be carried at its fair value on the balance sheet, with changes in its fair value recognized in current-period earnings.
Mortgage Banking Derivative Commitments
In connection with its mortgage banking activities, the Company enters into loan commitments to fund residential mortgage loans at specified interest rates and within a specified period of time, generally up to 60 days from the time of the rate lock. A loan commitment related to a loan that will be held for sale upon funding is a derivative instrument under ASC 815, which must be recognized at fair value on the consolidated balance sheet in other assets and other liabilities with changes in its value recorded in income from mortgage banking operations.
To hedge the exposure of changes in interest rates impacting the fair value of loans held for sale and related loan commitments, the Company typically enters into forward sales commitments with its secondary market investors at the time a loan commitment is granted to lock in the ultimate sale and price of the loan. These commitments are generally on a best efforts basis. Accordingly, there are no material sales commitment derivative instruments.
As of December 31, 2014 and 2013, the fair value of the Company’s interest rate lock commitment derivatives was approximately $98,000 and $79,000, respectively, and is included in other assets in the accompanying consolidated balance sheets. The Company recognized income of $18,000 and $79,000 during the
F-14
Table of Contents
Index to Financial Statements
NATIONAL COMMERCE CORPORATION
Notes to Consolidated Financial Statements (Continued)
(amounts in tables in thousands, except per share data)
(1) Summary of Significant Accounting Policies (Continued)
Mortgage Banking Derivative Commitments (Continued)
years ended December 31, 2014 and 2013, respectively. These amounts are included in mortgage origination and fee income in the consolidated statements of earnings. There were no material interest rate lock commitment derivatives outstanding at December 31, 2012.
Stock-Based Compensation
The Company accounts for its stock-based compensation plans using a fair value-based method of accounting, whereby compensation cost is measured at the grant date based on the value of the award and is recognized over the service period, which is usually the vesting period.
Accumulated Other Comprehensive Income
At December 31, 2014, 2013 and 2012, accumulated other comprehensive income consisted of net unrealized gains on investment securities available-for-sale.
Net Earnings per Common Share
Basic earnings per common share are computed by dividing net income by the weighted-average number of shares of common stock outstanding during the year. Diluted earnings per common share are computed by dividing net income by the effect of the issuance of potential common shares that are dilutive and by the sum of the weighted-average number of shares of common stock outstanding. Anti-dilutive potential common shares are excluded from the diluted earnings per share computation and totaled 30,000 during 2013 and 2012. In June 2014, these antidilutive securities were exercised and are included in common shares outstanding during 2014. The acquired United options are anti-dilutive and excluded from this calculation.
The reconciliation of the components of basic and diluted earnings per share is as follows:
| 2014 | 2013 | 2012 | ||||||||||
| Net earnings available to common shareholders |
$ | 5,403 | 4,006 | 2,057 | ||||||||
|
|
|
|
|
|
|
|||||||
| Weighted average common shares outstanding |
5,888,862 | 5,730,114 | 5,730,114 | |||||||||
| Dilutive effect of stock options |
19,266 | 6,511 | 3,276 | |||||||||
| Dilutive effect of performance share awards |
52,071 | 27,660 | 7,010 | |||||||||
|
|
|
|
|
|
|
|||||||
| Diluted common shares |
5,960,199 | 5,764,285 | 5,740,400 | |||||||||
|
|
|
|
|
|
|
|||||||
| Basic earnings per common share |
$ | 0.92 | 0.70 | 0.36 | ||||||||
| Diluted earnings per common share |
$ | 0.91 | 0.69 | 0.36 | ||||||||
Reclassifications
Certain 2013 and 2012 amounts have been reclassified to conform to the presentation used in 2014. These reclassifications had no material effect on the operations, financial condition or cash flows of the Company.
Recently Issued Accounting Pronouncements
In July 2013, the Financial Accounting Standards Board (“FASB”) issued Accounting Standards Update (“ASU”) No. 2013-10, Derivatives and Hedging (Topic 815): Inclusion of the Fed Funds Effective Swap Rate (or Overnight Index Swap Rate) as a Benchmark Interest Rate for Hedge Accounting Purposes, which permits the Fed Funds Effective Swap Rate to be used as a U.S. benchmark interest rate for hedge accounting purposes, in addition to the U.S. Treasury and London Interbank Offered Rate. The ASU also amends previous rules by removing the restriction on using different benchmark rates for similar hedges. This amendment applies to all entities that elect to
F-15
Table of Contents
Index to Financial Statements
NATIONAL COMMERCE CORPORATION
Notes to Consolidated Financial Statements (Continued)
(amounts in tables in thousands, except per share data)
(1) Summary of Significant Accounting Policies (Continued)
Recently Issued Accounting Pronouncements (Continued)
apply hedge accounting of the benchmark interest rate. The amendments in this ASU were effective for qualifying new or redesignated hedging relationships entered into on or after July 17, 2013. The Company has adopted this update, although such adoption had no impact on its financial position or results of operations.
In July 2013, the FASB issued ASU No. 2013-11, Income Taxes (Topic 740): Presentation of an Unrecognized Tax Benefit When a Net Operating Loss Carryforward, a Similar Tax Loss, or a Tax Credit Carryforward Exists, which provides that an unrecognized tax benefit, or a portion thereof, should be presented in the financial statements as a reduction to a deferred tax asset for a net operating loss carryforward, a similar tax loss, or a tax credit carryforward, except to the extent that a net operating loss carryforward, a similar tax loss, or a tax credit carryforward is not available at the reporting date to settle any additional income taxes that would result from disallowance of a tax position, or the tax law does not require the entity to use, and the entity does not intend to use, the deferred tax asset for such purpose, then the unrecognized tax benefit should be presented as a liability. These amendments in this ASU are effective for fiscal years, and interim reporting periods within those years, beginning after December 15, 2013. Early adoption and retrospective application is permitted. The Company has adopted this update, although such adoption had no impact on its financial position or results of operations.
In January 2014, the FASB issued ASU No. 2014-04, Receivables-Troubled Debt Restructurings by Creditors (Subtopic 310-40): Reclassification of Residential Real Estate Collateralized Consumer Mortgage Loans upon Foreclosure. These amendments are intended to clarify when a creditor should be considered to have received physical possession of residential real estate property collateralizing a consumer mortgage loan such that the loan should be derecognized and the real estate recognized. The amendments clarify that an in substance repossession or foreclosure occurs, and a creditor is considered to have received physical possession of residential real estate property collateralizing a consumer mortgage loan, upon either: (1) the creditor obtaining legal title to the residential real estate property upon completion of residential foreclosure, or (2) the borrower conveying all interest in the residential real estate property to the creditor to satisfy that loan through completion of a deed in lieu of foreclosure or through a similar legal agreement. Additional disclosures about such activities are required by these amendments. The amendments in this ASU become effective for public companies for annual periods and interim periods within those annual periods beginning after December 15, 2014, and early adoption is permitted. The Company is assessing the impact that these amendments will have on its financial position and results of operations, but does not currently anticipate that it will have a material impact.
In May 2014, the FASB issued ASU No. 2014-09, Revenue from Contracts with Customers (Topic 606). These amendments affect any entity that either enters into contracts with customers to transfer goods or services or enters into contracts for the transfer of nonfinancial assets unless those contracts are within the scope of other standards (e.g. insurance contracts or lease contracts). This ASU will supersede the revenue recognition requirements in Topic 605, Revenue Recognition, and most industry-specific guidance, and creates a Topic 606, Revenue from Contracts with Customers. The core principle of the guidance is that an entity should recognize revenue to depict the transfer of promised goods or services to customers in an amount that reflects the consideration to which the entity expects to be entitled in exchange for those goods or services. This ASU also requires additional disclosure about the nature, amount, timing and uncertainty of revenue and cash flows arising from customer contracts, including significant judgments and changes in judgments and assets recognized from costs incurred to obtain or fulfill a contract. This ASU will be effective for annual reporting periods beginning after December 15, 2016, including interim periods within that reporting period. Early adoption is not permitted. The ASU allows for either full retrospective or modified retrospective adoption. The Company is assessing the effects of this ASU, which exclude financial instruments from its scope, but does not anticipate that it will have a material impact on its financial position or results of operations.
F-16
Table of Contents
Index to Financial Statements
NATIONAL COMMERCE CORPORATION
Notes to Consolidated Financial Statements (Continued)
(amounts in tables in thousands, except per share data)
(1) Summary of Significant Accounting Policies (Continued)
Recently Issued Accounting Pronouncements (Continued)
In June 2014, the FASB issued ASU No. 2014-12, Compensation – Stock Compensation (Topic 718): Accounting for Share-Based Payments When the Terms of an Award Provide That a Performance Target Could Be Achieved After the Requisite Service Period. The amendments clarify the proper method of accounting for share-based payments when the terms of an award provide that a performance target could be achieved after the requisite service period. This ASU requires that a performance target that affects vesting, and that could be achieved after the requisite service period, be treated as a performance condition. The performance target should not be reflected in estimating the grant-date fair value of the award. Compensation cost should be recognized in the period in which it becomes probable that the performance target will be achieved and should represent the compensation cost attributable to the period(s) for which the requisite service has already been rendered. The amendments in this ASU are effective for annual periods and interim periods within those annual periods beginning after December 15, 2015. Earlier adoption is permitted. None of the Company’s share-based payment awards have service components, so the Company does not believe this ASU will have an impact on its financial position or results of operations.
In August 2014, the FASB issued ASU No. 2014-14, Receivables – Troubled Debt Restructurings by Creditors (Subtopic 310-40): Classification of Certain Government-Guaranteed Mortgage Loans upon Foreclosure. These amendments address the diversity in practice regarding the classification and measurement of foreclosed loans which were part of a government-sponsored loan guarantee program (e.g., HUD, FHA, VA). The ASU outlines certain criteria that, if met, require the loan (residential or commercial) should be derecognized and a separate other receivable should be recorded upon foreclosure at the amount of the loan balance (principal and interest) expected to be recovered from the guarantor. This ASU will be effective for annual reporting periods beginning after December 15, 2014, including interim periods within that reporting period. Early adoption is permitted, provided the entity has adopted ASU 2014-04. The ASU should be adopted either prospectively or on a modified retrospective basis. The Company is assessing the impact that these amendments will have on its financial position and results of operations, but does not currently anticipate that it will have a material impact.
(2) Business Combinations
CBI Holding Company, LLC
On August 29, 2014, NBC acquired 70% of the outstanding units of CBI, a receivables factoring business headquartered in Decatur, Alabama. CBI operates as a subsidiary of NBC. NBC has an option to purchase the remaining 30% interest for a purchase price based on a multiple of CBI’s earnings. The option is exercisable at any time beginning on August 29, 2019 and expires on August 29, 2022.
The primary reasons for the purchase were to utilize a portion of the Company’s excess capital and liquidity in a highly profitable business line to enhance revenue production and to diversify its earnings base.
The acquisition was accounted for under the acquisition method of accounting in accordance with ASC 805, Business Combinations. NBC paid $16,181,000 in cash for a 70% interest in CBI. All of the assets and liabilities of CBI are included in the Company’s consolidated balance sheet. In connection with the acquisition, the Company recorded $23,115,000 of goodwill. For income tax purposes, this acquisition was treated as an asset purchase and deferred taxes have been established for the difference between book and tax basis of assets and liabilities where appropriate.
Fair value estimates are based on the information available, and are subject to change for up to one year after the closing date of the acquisition as additional information regarding closing date fair values becomes available. Given an average life for CBI’s receivables of 35 to 40 days, the assets and liabilities of CBI are very
F-17
Table of Contents
Index to Financial Statements
NATIONAL COMMERCE CORPORATION
Notes to Consolidated Financial Statements (Continued)
(amounts in tables in thousands, except per share data)
(2) Business Combinations (Continued)
CBI Holding Company, LLC (Continued)
short term in nature and the book value was deemed to be the fair value, with the exception of a $174,000 discount on the purchased factored receivables, which was accreted into income during September 2014 in accordance with the average life of the related receivables.
The table below summarizes the estimates of fair value of the assets purchased, including goodwill, and the liabilities assumed as of August 29, 2014.
| As of August 29, 2014 |
||||
| Assets: |
||||
| Cash and cash equivalents |
$ | 2,233 | ||
| Factored receivables |
81,559 | |||
| Premises and equipment, net |
444 | |||
| Other assets |
157 | |||
| Goodwill |
23,115 | |||
|
|
|
|||
| Total assets |
107,508 | |||
|
|
|
|||
| Liabilities: |
||||
| Other liabilities |
6,592 | |||
| Note payable |
77,801 | |||
|
|
|
|||
| Total liabilities |
84,393 | |||
|
|
|
|||
| Non controlling interest |
6,934 | |||
|
|
|
|||
| Purchase price |
$ | 16,181 | ||
|
|
|
|||
United Group Banking Company of Florida, Inc.
On December 15, 2014, the Company completed its acquisition of United Group Banking Company of Florida, Inc. (“United”), a bank holding company headquartered in Longwood, Florida. At that time, United’s wholly-owned non-banking subsidiary, RBCF Holdings Inc., became a wholly-owned subsidiary of the Company. United’s wholly-owned banking subsidiary, ULB, is expected to merge with and into NBC during the first quarter of 2015. ULB had a total of five banking locations located in the greater Orlando area as of December 31, 2014. Upon consummation of the acquisition, United was merged with and into the Company, with the Company as the surviving entity in the merger. United’s common shareholders were entitled to elect to receive either 0.057794 shares of the Company’s common stock, or $1.30 in cash in exchange for each share of United’s common stock, or a combination stock and cash. The total amount of cash paid by the Company for cash elections was capped at $2,950,000 in the merger agreement. The Company paid cash for cash elections and cash in lieu of fractional shares totaling $2,953,884 and issued 1,617,027 shares of the Company’s common stock. The aggregate estimated value of the consideration given was $33,309,000. The Company recorded $5,719,000 of goodwill, which is nondeductible for tax purposes, as this acquisition was a nontaxable transaction. Approximately $272,000 of direct stock issuance costs for the acquisition were incurred and charged against additional paid in capital and other acquisition expenses of approximately $368,000 were charged directly to other noninterest expenses.
The acquisition of United was accounted for using the acquisition method of accounting in accordance with ASC 805, Business Combinations. Assets acquired, liabilities assumed and consideration exchanged were recorded at their respective acquisition date fair values. Determining the fair value of assets and liabilities is a
F-18
Table of Contents
Index to Financial Statements
NATIONAL COMMERCE CORPORATION
Notes to Consolidated Financial Statements (Continued)
(amounts in tables in thousands, except per share data)
(2) Business Combinations (Continued)
United Group Banking Company of Florida, Inc. (Continued)
complicated process involving significant judgment regarding methods and assumptions used to calculate estimated fair values. Fair values are preliminary and subject to refinement for up to one year after the closing date of the acquisition as additional information regarding the closing date fair values becomes available.
The following table presents the assets acquired and liabilities assumed of United as of December 15, 2014, at their initial fair value estimates:
| As Recorded By United |
Fair Value Adjustments |
As Recorded By the Company |
||||||||||
| Cash and cash equivalents |
$ | 37,072 | — | 37,072 | ||||||||
| Investment securities |
26,376 | (966 | ) a | 25,410 | ||||||||
| Loans |
154,334 | (4,408 | ) b | 149,926 | ||||||||
| Allowance for loan losses |
2,162 | (2,162 | ) c | — | ||||||||
|
|
|
|
|
|
|
|||||||
| Net loans |
152,172 | (2,246 | ) | 149,926 | ||||||||
| Premises and equipment, net |
8,292 | 648 | d | 8,940 | ||||||||
| Core deposit intangible |
— | 1,776 | e | 1,776 | ||||||||
| Bank owned life insurance |
2,151 | — | 2,151 | |||||||||
| Other real estate and repossessions |
818 | (260 | ) f | 558 | ||||||||
| Other assets |
7,269 | 125 | g | 7,394 | ||||||||
|
|
|
|
|
|
|
|||||||
| Total Assets |
$ | 234,150 | (923 | ) | 233,227 | |||||||
|
|
|
|
|
|
|
|||||||
| — | ||||||||||||
| Non-interest bearing |
$ | 50,007 | — | 50,007 | ||||||||
| Interest-bearing |
150,539 | — | 150,539 | |||||||||
|
|
|
|
|
|
|
|||||||
| Total Deposits |
200,546 | — | 200,546 | |||||||||
| FHLB advances |
4,865 | 9 | h | 4,874 | ||||||||
| Other liabilities |
217 | — | 217 | |||||||||
|
|
|
|
|
|
|
|||||||
| Total Liabilities |
205,628 | 9 | 205,637 | |||||||||
|
|
|
|
|
|
|
|||||||
| — | ||||||||||||
| Net identifiable assets acquired over liabilities assumed |
28,522 | (932 | ) | 27,590 | ||||||||
| Goodwill |
— | 5,719 | 5,719 | |||||||||
|
|
|
|
|
|
|
|||||||
| Net assets acquired over liabilities assumed |
$ | 28,522 | 4,787 | 33,309 | ||||||||
|
|
|
|
|
|
|
|||||||
| Consideration: |
||||||||||||
| Shares of common stock issued |
1,617,027 | |||||||||||
| Estimated value per share of the Company’s stock |
$ | 18.72 | ||||||||||
|
|
|
|||||||||||
| Fair value of Company stock issued |
30,271 | |||||||||||
| Cash exchanged for shares and cash in lieu |
2,954 | |||||||||||
| Value of assumed stock options |
84 | |||||||||||
|
|
|
|||||||||||
| Fair value of total consideration transferred |
$ | 33,309 | ||||||||||
|
|
|
|||||||||||
Explanation of fair value adjustments
| a. | Adjustment reflects fair value adjustments of the available-for-sale portfolio at acquisition date. |
F-19
Table of Contents
Index to Financial Statements
NATIONAL COMMERCE CORPORATION
Notes to Consolidated Financial Statements (Continued)
(amounts in tables in thousands, except per share data)
(2) Business Combinations (Continued)
United Group Banking Company of Florida, Inc. (Continued)
| b. | Adjustment reflects the fair value adjustments based on the Company’s evaluation of the acquired loan portfolio. |
| c. | Adjustment reflects the elimination of United’s allowance for loan losses. |
| d. | Adjustment reflects the fair value adjustment on United’s main office location. |
| e. | Adjustment reflects the recording of core deposit intangible asset. |
| f. | Adjustment reflects the fair value adjustment based on the evaluation of the acquired other real estate and repossessed assets. |
| g. | Adjustment to record the deferred tax asset created by purchase adjustments. |
| h. | Adjustment reflects the fair value adjustment to the FHLB borrowings. |
The discounts on loans will be accreted to interest income over the estimated average life of the loans using the level yield method. The core deposit intangible asset is being amortized over a seven-year life on an accelerated basis.
The following unaudited supplemental pro forma information is presented to show estimated results assuming CBI and United were acquired as of the beginning of each period presented. These unaudited pro forma results are not necessarily indicative of the operating results that the Company would have achieved had it completed the acquisition as of January 1, 2013 or 2014 and should not be considered as representative of future operating results.
| For The Year Ended December 31, |
||||||||
| 2014 | 2013 | |||||||
| Net interest income – pro forma (unaudited) |
$ | 42,281 | $ | 36,073 | ||||
| Net earnings – pro forma (unaudited) |
$ | 7,166 | $ | 5,401 | ||||
| Diluted earnings per common share (unaudited) |
$ | 0.96 | $ | 0.73 | ||||
In many cases, determining the fair value of the acquired assets and assumed liabilities requires the Company to estimate cash flows expected to result from those assets and liabilities and to discount those cash flows at appropriate rates of interest. The most significant of those determinations is related to the fair valuation of acquired loans. Acquired loans are initially recorded at their acquisition date fair values. The carryover of the allowance for loan losses is prohibited, as any credit losses in the loans are included in the determination of the fair value of the loans at the acquisition date. Fair values for acquired loans are based on a discounted cash flow methodology that involves assumptions including the remaining life of the acquired loans, estimated prepayments, estimated value of the underlying collateral and net present value of cash flows expected to be collected. Acquired loans that have evidence of deterioration in credit quality since origination and for which it is probable, at acquisition, that the acquirer will be unable to collect all contractually required payments are specifically identified and analyzed. The excess of cash flows expected at acquisition over the estimated fair value is referred to as the accretable discount and is recognized in interest income over the remaining life of the loan. The difference between contractually required payments at acquisition and the cash flows expected to be collected at acquisition is referred to as the non-accretable discount. The non-accretable discount represents estimated future credit losses expected to be incurred over the life of the loan.
F-20
Table of Contents
Index to Financial Statements
NATIONAL COMMERCE CORPORATION
Notes to Consolidated Financial Statements (Continued)
(amounts in tables in thousands, except per share data)
(2) Business Combinations (Continued)
United Group Banking Company of Florida, Inc. (Continued)
Loans at the acquisition date are presented in the following table.
| Acquired Impaired Loans |
Acquired Performing Loans |
Total Acquired Loans |
||||||||||
| Commercial, financial, and agricultural |
$ | 929 | 22,274 | 23,203 | ||||||||
| Real estate – mortgage |
6,844 | 105,361 | 112,205 | |||||||||
| Real estate – construction |
918 | 7,377 | 8,295 | |||||||||
| Consumer |
336 | 5,887 | 6,223 | |||||||||
|
|
|
|
|
|
|
|||||||
| Total |
$ | 9,027 | 140,899 | 149,926 | ||||||||
|
|
|
|
|
|
|
|||||||
The following table presents information about the purchased credit-impaired loans at acquisition.
| Contractually required principal and interest payments |
$ | 11,956 | ||
| Non-accretable difference |
2,929 | |||
|
|
|
|||
| Cash flows expected to be collected |
9,027 | |||
| Accretable discount |
— | |||
|
|
|
|||
| Fair value of loans acquired with a deterioration of credit quality |
$ | 9,027 | ||
|
|
|
The following table presents changes in the carrying amount of the accretable yield on acquired loans for the year ended December 31, 2014. The Company had no acquisitions prior to the year ended December 31, 2014.
| 2014 | ||||
| Balance, beginning of year |
$ | — | ||
| Acquisition of United |
1,480 | |||
| Accretion |
(13 | ) | ||
| Net transfers from non-accretable difference to accretable yield |
— | |||
|
|
|
|||
| Balance, end of year |
$ | 1,467 | ||
|
|
|
|||
(3) Investment Securities
Investment securities available-for-sale at December 31, 2014 and 2013 are as follows:
| December 31, 2014 |
Amortized Cost |
Gross Unrealized Gains |
Gross Unrealized Losses |
Estimated Fair Value |
||||||||||||
| U.S. Treasury securities |
$ | 1,501 | — | — | 1,501 | |||||||||||
| Mortgage-backed securities |
27,723 | 1,138 | 111 | 28,750 | ||||||||||||
| Municipal securities |
4,408 | 279 | 6 | 4,681 | ||||||||||||
|
|
|
|
|
|
|
|
|
|||||||||
| Total investment securities available-for-sale |
$ | 33,632 | 1,417 | 117 | 34,932 | |||||||||||
|
|
|
|
|
|
|
|
|
|||||||||
| December 31, 2013 |
Amortized Cost |
Gross Unrealized Gains |
Gross Unrealized Losses |
Estimated Fair Value |
||||||||||||
| Mortgage-backed securities |
$ | 33,123 | 1,022 | 403 | 33,742 | |||||||||||
| Municipal securities |
4,409 | 59 | 198 | 4,270 | ||||||||||||
| Mutual fund |
10,000 | — | 33 | 9,967 | ||||||||||||
|
|
|
|
|
|
|
|
|
|||||||||
| Total investment securities available-for-sale |
$ | 47,532 | 1,081 | 634 | 47,979 | |||||||||||
|
|
|
|
|
|
|
|
|
|||||||||
F-21
Table of Contents
Index to Financial Statements
NATIONAL COMMERCE CORPORATION
Notes to Consolidated Financial Statements (Continued)
(amounts in tables in thousands, except per share data)
(3) Investment Securities (Continued)
Management evaluates securities for other-than-temporary impairment on a quarterly basis, and more frequently when economic or market concerns warrant such evaluation. Consideration is given to (1) the length of time and the extent to which the fair value has been less than cost, (2) the financial condition and near-term prospects of the issuer and (3) the intent and ability of the Company to retain its investment in the issuer for a period of time sufficient to allow for any anticipated recovery in fair value.
Details concerning investment securities with unrealized losses as of December 31, 2014 and 2013 are as follows:
| December 31, 2014 | ||||||||||||||||||||||||
| Less than 12 Months | 12 Months or More | Total | ||||||||||||||||||||||
| Fair Value |
Unrealized Losses |
Fair Value |
Unrealized Losses |
Fair Value |
Unrealized Losses |
|||||||||||||||||||
| U.S. Treasury securities |
$ | — | — | — | — | — | — | |||||||||||||||||
| Mortgage-backed securities |
— | — | 7,705 | 111 | 7,705 | 111 | ||||||||||||||||||
| Municipal securities |
— | — | 494 | 6 | 494 | 6 | ||||||||||||||||||
|
|
|
|
|
|
|
|
|
|
|
|
|
|||||||||||||
| $ | — | — | 8,199 | 117 | 8,199 | 117 | ||||||||||||||||||
|
|
|
|
|
|
|
|
|
|
|
|
|
|||||||||||||
| December 31, 2013 | ||||||||||||||||||||||||
| Less than 12 Months | 12 Months or More | Total | ||||||||||||||||||||||
| Fair Value |
Unrealized Losses |
Fair Value |
Unrealized Losses |
Fair Value |
Unrealized Losses |
|||||||||||||||||||
| Mortgage-backed securities |
$ | 8,409 | 403 | — | — | 8,409 | 403 | |||||||||||||||||
| Municipal securities |
2,086 | 198 | — | — | 2,086 | 198 | ||||||||||||||||||
| Mutual fund |
9,967 | 33 | — | — | 9,967 | 33 | ||||||||||||||||||
|
|
|
|
|
|
|
|
|
|
|
|
|
|||||||||||||
| $ | 20,462 | 634 | — | — | 20,462 | 634 | ||||||||||||||||||
|
|
|
|
|
|
|
|
|
|
|
|
|
|||||||||||||
At December 31, 2014, three out of thirteen mortgage-backed securities and one out of nine municipal securities were in a loss position. At December 31, 2013, three out of fourteen mortgage-backed securities, four out of nine municipal securities and the sole mutual fund were in a loss position. In analyzing an issuer’s financial condition, management considers whether the securities are issued by the federal government or its agencies, whether downgrades by bond rating agencies have occurred, and industry analysts’ reports. As management had the ability and intent to hold debt securities until maturity, no declines were deemed to be other than temporary as of December 31, 2014 and 2013.
During 2014, the Company sold investment securities for proceeds of $35,377,000 and realized a gross loss of $33,000 on those sales. During 2013, the Company sold investment securities for proceeds of $952,000 and realized a gross gain of $47,000 on those sales. During 2012, the Company did not sell any investment securities.
At December 31, 2014 and 2013, securities with a carrying value of approximately $34,633,000 and $35,206,000, respectively, were pledged to secure public deposits as required by law and for other purposes.
F-22
Table of Contents
Index to Financial Statements
NATIONAL COMMERCE CORPORATION
Notes to Consolidated Financial Statements (Continued)
(amounts in tables in thousands, except per share data)
(3) Investment Securities (Continued)
The amortized cost and estimated fair value of securities available-for-sale at December 31, 2014, by contractual maturity, are shown below. Expected maturities will differ from contractual maturities because borrowers have the right to call or prepay obligations with or without call or prepayment penalties.
| Amortized Cost |
Fair Value |
|||||||
| Municipal & U.S. Treasury securities: |
||||||||
| 0 to 5 years |
$ | 1,501 | 1,501 | |||||
| 5 to 10 years |
1,047 | 1,101 | ||||||
| Over 10 years |
3,361 | 3,580 | ||||||
| Mortgage-backed securities |
27,723 | 28,750 | ||||||
|
|
|
|
|
|||||
| $ | 33,632 | 34,932 | ||||||
|
|
|
|
|
|||||
(4) Loans
Major classifications of loans at December 31, 2014 and 2013 are summarized as follows:
| 2014 | 2013 | |||||||
| Commercial, financial, and agricultural |
$ | 131,657 | 115,005 | |||||
| Factored commercial receivables |
82,600 | — | ||||||
| Real estate – mortgage |
577,268 | 403,053 | ||||||
| Real estate – construction |
83,663 | 58,372 | ||||||
| Consumer |
13,962 | 6,113 | ||||||
| Leases |
— | 6 | ||||||
|
|
|
|
|
|||||
| 889,150 | 582,549 | |||||||
| Less: Unearned fees |
429 | 547 | ||||||
|
|
|
|
|
|||||
| Total loans and leases |
888,721 | 582,002 | ||||||
| Allowance for loan losses |
(9,802 | ) | (9,119 | ) | ||||
|
|
|
|
|
|||||
| Total net loans and leases |
$ | 878,919 | 572,883 | |||||
|
|
|
|
|
|||||
The Banks grant loans and extensions of credit to individuals and a variety of businesses located in their general trade areas throughout Alabama and Florida, including metropolitan Birmingham, Huntsville, Lee County and Baldwin County in Alabama and metropolitan Orlando and Vero Beach in Florida. Through CBI, the Company also purchases receivables from transportation companies and automotive parts and service providers nationwide. Although the Banks have a diversified loan portfolio, a substantial portion of the loan portfolio is collateralized by improved and unimproved real estate and is dependent upon the real estate market. Portfolio segments utilized by the Banks are identified below. Relevant risk characteristics for these portfolio segments generally include debt service coverage, loan-to-value ratios and financial performance on non-consumer loans and credit scores, debt-to-income, collateral type and loan-to-value ratios for consumer loans.
F-23
Table of Contents
Index to Financial Statements
NATIONAL COMMERCE CORPORATION
Notes to Consolidated Financial Statements (Continued)
(amounts in tables in thousands, except per share data)
(4) Loans (Continued)
The following tables present the balance in the allowance for loan losses and the recorded investment in loans by portfolio segment and based on impairment method as of December 31, 2014, 2013 and 2012. The acquired loans are not included in the allowance for loan losses calculation, as these loans are recorded at fair value and there has been no further indication of credit deterioration that would require an additional provision.
| Balance, December 31, 2014 |
Commercial, financial, and agricultural |
Factored Commercial receivables |
Real estate - mortgage |
Real estate - Construction |
Consumer | Leases | Unallocated | Total | ||||||||||||||||||||||||
| Balance, beginning of year |
$ | 1,398 | — | 4,449 | 964 | 243 | — | 2,065 | 9,119 | |||||||||||||||||||||||
| Provisions charged to operating expense |
61 | 978 | 988 | (350 | ) | 298 | — | (997 | ) | 978 | ||||||||||||||||||||||
| Loans charged off |
(3 | ) | (656 | ) | (429 | ) | — | — | — | — | (1,088 | ) | ||||||||||||||||||||
| Recoveries |
67 | 633 | 39 | 33 | 21 | — | — | 793 | ||||||||||||||||||||||||
|
|
|
|
|
|
|
|
|
|
|
|
|
|
|
|
|
|||||||||||||||||
| Balance, end of year |
$ | 1,523 | 955 | 5,047 | 647 | 562 | — | 1,068 | 9,802 | |||||||||||||||||||||||
|
|
|
|
|
|
|
|
|
|
|
|
|
|
|
|
|
|||||||||||||||||
| Ending balance, individually evaluated for impairment |
$ | — | 473 | 350 | 50 | — | — | — | 873 | |||||||||||||||||||||||
| Ending balance, collectively evaluated for impairment |
1,523 | 482 | 4,697 | 597 | 562 | — | 1,068 | 8,929 | ||||||||||||||||||||||||
| Loans: |
||||||||||||||||||||||||||||||||
| Individually evaluated for impairment |
$ | — | 1,605 | 2,078 | 198 | — | — | — | 3,881 | |||||||||||||||||||||||
| Collectively evaluated for impairment |
$ | 130,656 | 80,995 | 568,363 | 82,551 | 13,627 | — | — | 876,192 | |||||||||||||||||||||||
| Acquired loans with deteriorated credit quality |
$ | 1,001 | — | 6,827 | 914 | 335 | — | — | 9,077 | |||||||||||||||||||||||
F-24
Table of Contents
Index to Financial Statements
NATIONAL COMMERCE CORPORATION
Notes to Consolidated Financial Statements (Continued)
(amounts in tables in thousands, except per share data)
(4) Loans (Continued)
| Balance, December 31, 2013 |
Commercial, financial, and agricultural |
Factored Commercial receivables |
Real estate - mortgage |
Real estate - Construction |
Consumer | Leases | Unallocated | Total | ||||||||||||||||||||||||
| Balance, beginning of year |
$ | 1,158 | — | 5,093 | 497 | 170 | 3 | 3,099 | 10,020 | |||||||||||||||||||||||
| Provisions charged to operating expense |
(47 | ) | — | 864 | 162 | 58 | (3 | ) | (1,034 | ) | — | |||||||||||||||||||||
| Loans charged off |
(32 | ) | — | (1,557 | ) | — | — | — | — | (1,589 | ) | |||||||||||||||||||||
| Recoveries |
319 | — | 49 | 305 | 15 | — | — | 688 | ||||||||||||||||||||||||
|
|
|
|
|
|
|
|
|
|
|
|
|
|
|
|
|
|||||||||||||||||
| Balance, end of year |
$ | 1,398 | — | 4,449 | 964 | 243 | — | 2,065 | 9,119 | |||||||||||||||||||||||
|
|
|
|
|
|
|
|
|
|
|
|
|
|
|
|
|
|||||||||||||||||
| Ending balance, individually evaluated for impairment |
$ | — | — | — | — | — | — | — | — | |||||||||||||||||||||||
| Ending balance, collectively evaluated for impairment |
$ | 1,398 | — | 4,449 | 964 | 243 | — | 2,065 | 9,119 | |||||||||||||||||||||||
| Loans: |
||||||||||||||||||||||||||||||||
| Individually evaluated for impairment |
$ | 27 | — | 3,344 | — | — | — | — | 3,371 | |||||||||||||||||||||||
| Collectively evaluated for impairment |
$ | 114,978 | — | 399,709 | 58,372 | 6,113 | 6 | — | 579,178 | |||||||||||||||||||||||
| Balance, December 31, 2012 |
Commercial, financial, and agricultural |
Factored Commercial receivables |
Real estate - mortgage |
Real estate - Construction |
Consumer | Leases | Unallocated | Total | ||||||||||||||||||||||||
| Balance, beginning of year |
$ | 1,423 | — | 5,509 | 1,071 | 90 | 29 | 2,221 | 10,343 | |||||||||||||||||||||||
| Provisions charged to operating expense |
(435 | ) | — | (397 | ) | (303 | ) | 408 | (25 | ) | 877 | 125 | ||||||||||||||||||||
| Loans charged off |
(41 | ) | — | (409 | ) | (1,292 | ) | (372 | ) | — | — | (2,114 | ) | |||||||||||||||||||
| Recoveries |
211 | — | 391 | 1,021 | 43 | — | — | 1,666 | ||||||||||||||||||||||||
|
|
|
|
|
|
|
|
|
|
|
|
|
|
|
|
|
|||||||||||||||||
| Balance, end of year |
$ | 1,158 | — | 5,094 | 497 | 169 | 4 | 3,098 | 10,020 | |||||||||||||||||||||||
|
|
|
|
|
|
|
|
|
|
|
|
|
|
|
|
|
|||||||||||||||||
| Ending balance, individually evaluated for impairment |
$ | — | — | — | — | — | — | — | — | |||||||||||||||||||||||
| Ending balance, collectively evaluated for impairment |
$ | 1,158 | — | 5,094 | 497 | 169 | 4 | 3,098 | 10,020 | |||||||||||||||||||||||
| Loans: |
||||||||||||||||||||||||||||||||
| Individually evaluated for impairment |
$ | — | — | 244 | — | — | — | — | 244 | |||||||||||||||||||||||
| Collectively evaluated for impairment |
$ | 92,147 | — | 302,873 | 36,267 | 10,030 | 413 | — | 441,730 | |||||||||||||||||||||||
The Banks individually evaluate for impairment all loans that are on nonaccrual status. Additionally, all troubled debt restructurings are individually evaluated for impairment. A loan is considered impaired when, based on current events and circumstances, it is probable that all amounts due according to the contractual terms of the loan will not be collected. Impaired loans are measured based on the present value of expected future cash flows discounted at the loan’s effective interest rate, at the loan’s observable market price, or the fair value of the collateral if the loan is collateral-dependent. Management may also elect to apply an additional collective reserve to groups of impaired loans based on current economic or market factors. Interest payments received on impaired loans are generally applied as a reduction of the outstanding principal balance. During 2014 and 2013, the Banks did not modify any loans that would be considered a troubled debt restructuring.
F-25
Table of Contents
Index to Financial Statements
NATIONAL COMMERCE CORPORATION
Notes to Consolidated Financial Statements (Continued)
(amounts in tables in thousands, except per share data)
(4) Loans (Continued)
The following tables present impaired loans by class of loans as of December 31, 2014 and 2013. The purchased credit-impaired loans are not included in these tables because they are carried at fair value and accordingly have no related associated allowance.
| December 31, 2014 |
Recorded Investment |
Unpaid Principal Balance |
Related Allowance |
Average Recorded Investment |
||||||||||||
| Impaired loans without related allowance: |
||||||||||||||||
| Commercial, financial, and agricultural |
$ | — | — | — | 24 | |||||||||||
| Factored commercial receivables |
— | — | — | — | ||||||||||||
| Real estate – mortgage |
1,052 | 2,030 | — | 1,770 | ||||||||||||
| Real estate – construction |
— | — | — | — | ||||||||||||
| Consumer |
— | — | — | — | ||||||||||||
| Leases |
— | — | — | — | ||||||||||||
|
|
|
|
|
|
|
|
|
|||||||||
| Total |
$ | 1,052 | 2,030 | — | 1,794 | |||||||||||
|
|
|
|
|
|
|
|
|
|||||||||
| Impaired loans with related allowance: |
||||||||||||||||
| Commercial, financial, and agricultural |
$ | — | — | — | — | |||||||||||
| Factored commercial receivables |
1,605 | 1,605 | 473 | 321 | ||||||||||||
| Real estate – mortgage |
1,026 | 1,026 | 350 | 205 | ||||||||||||
| Real estate – construction |
198 | 198 | 50 | 40 | ||||||||||||
| Consumer |
— | — | — | — | ||||||||||||
| Leases |
— | — | — | — | ||||||||||||
|
|
|
|
|
|
|
|
|
|||||||||
| Total |
$ | 2,829 | 2,829 | 873 | 566 | |||||||||||
|
|
|
|
|
|
|
|
|
|||||||||
| Total impaired loans: |
||||||||||||||||
| Commercial, financial, and agricultural |
$ | — | — | — | 24 | |||||||||||
| Factored commercial receivables |
1,605 | 1,605 | 473 | 321 | ||||||||||||
| Real estate – mortgage |
2,078 | 3,056 | 350 | 1,975 | ||||||||||||
| Real estate – construction |
198 | 198 | 50 | 40 | ||||||||||||
| Consumer |
— | — | — | — | ||||||||||||
| Leases |
— | — | — | — | ||||||||||||
|
|
|
|
|
|
|
|
|
|||||||||
| Total |
$ | 3,881 | 4,859 | 873 | 2,360 | |||||||||||
|
|
|
|
|
|
|
|
|
|||||||||
| December 31, 2013 |
Recorded Investment |
Unpaid Principal Balance |
Related Allowance |
Average Recorded Investment |
||||||||||||
| Impaired loans without related allowance: |
||||||||||||||||
| Commercial, financial, and agricultural |
$ | 27 | 236 | — | 2 | |||||||||||
| Real estate – mortgage |
3,344 | 4,429 | — | 2,075 | ||||||||||||
| Real estate – construction |
— | — | — | — | ||||||||||||
| Consumer |
— | — | — | — | ||||||||||||
| Leases |
— | — | — | — | ||||||||||||
|
|
|
|
|
|
|
|
|
|||||||||
| Total |
$ | 3,371 | 4,665 | — | 2,077 | |||||||||||
|
|
|
|
|
|
|
|
|
|||||||||
F-26
Table of Contents
Index to Financial Statements
NATIONAL COMMERCE CORPORATION
Notes to Consolidated Financial Statements (Continued)
(amounts in tables in thousands, except per share data)
(4) Loans (Continued)
For the years ended December 31, 2014, 2013 and 2012, the Banks did not recognize a material amount of interest income on impaired loans.
During 2009, NBC purchased certain loans that had evidence of credit deterioration since origination, and management has determined that it is probable that they will not collect all contractually-required principal and interest payments. These loans were purchased at a discount, and this discount has been deemed a non-accretable difference, as it represents management’s estimate of the difference between the contractually required payments at acquisition and the cash flows expected to be collected over the respective lives of the loans. Subsequent decreases to the expected cash flows will generally result in a provision for loan losses. Subsequent increases in cash flows result in a reversal of the provision for loan losses to the extent of prior charges or a reversal of the non-accretable difference with a positive impact on interest income. Further, any excess of cash flows expected at acquisition over the estimated fair value is referred to as the accretable discount and is recognized in interest income over the remaining life of the loan when there is a reasonable expectation about the amount and timing of such cash flows. The principal balance of the remaining loan was approximately $378,000 and $402,000 as of December 31, 2014 and 2013, respectively, and the non-accretable discount was approximately $71,000 at December 31, 2014 and 2013.
The following tables present the aging of the recorded investment in past due loans and non-accrual loan balances as of December 31, 2014 and 2013 by class of loans. All loans greater than 90 days past due are placed on non-accrual status, excluding factored receivables. For CBI’s factored receivables, which are commercial trade credit rather than promissory notes, our practice is to charge off unpaid recourse receivables when they become 90 days past due from the invoice due date and the non-recourse receivables at 120 days past due from the statement billing date. For the recourse receivables, the invoice is charged against the client reserve account established for such purposes, unless the client reserve is insufficient, at which point it is charged against loans.
| December 31, 2014 |
30-59 Days Past Due |
60-89 Days Past Due |
> 90 Days Past Due |
Total Past Due |
Current | Total | Non-accrual | |||||||||||||||||||||
| Commercial, financial, and agricultural |
$ | — | — | — | — | 131,657 | 131,657 | — | ||||||||||||||||||||
| Factored commercial receivables |
6,327 | 1,013 | 217 | 7,557 | 75,043 | 82,600 | — | |||||||||||||||||||||
| Real estate – mortgage |
191 | 1,963 | 1,572 | 3,726 | 573,542 | 577,268 | 4,133 | |||||||||||||||||||||
| Real estate – construction |
198 | — | — | 198 | 83,465 | 83,663 | 676 | |||||||||||||||||||||
| Consumer |
188 | — | 132 | 320 | 13,642 | 13,962 | 56 | |||||||||||||||||||||
| Leases |
— | — | — | — | — | — | — | |||||||||||||||||||||
|
|
|
|
|
|
|
|
|
|
|
|
|
|
|
|||||||||||||||
| Total |
$ | 6,904 | 2,976 | 1,921 | 11,801 | 877,349 | 889,150 | 4,865 | ||||||||||||||||||||
|
|
|
|
|
|
|
|
|
|
|
|
|
|
|
|||||||||||||||
| December 31, 2013 |
30-59 Days Past Due |
60-89 Days Past Due |
> 90 Days Past Due |
Total Past Due |
Current | Total | Non-accrual | |||||||||||||||||||||
| Commercial, financial, and agricultural |
$ | — | — | — | — | 115,005 | 115,005 | 27 | ||||||||||||||||||||
| Real estate – mortgage |
343 | — | 2,579 | 2,922 | 400,131 | 403,053 | 3,344 | |||||||||||||||||||||
| Real estate – construction |
— | — | — | — | 58,372 | 58,372 | — | |||||||||||||||||||||
| Consumer |
— | — | — | — | 6,113 | 6,113 | — | |||||||||||||||||||||
| Leases |
— | — | — | — | 6 | 6 | — | |||||||||||||||||||||
|
|
|
|
|
|
|
|
|
|
|
|
|
|
|
|||||||||||||||
| Total |
$ | 343 | — | 2,579 | 2,922 | 579,627 | 582,549 | 3,371 | ||||||||||||||||||||
|
|
|
|
|
|
|
|
|
|
|
|
|
|
|
|||||||||||||||
The Banks categorize loans into risk categories based on relevant information about the ability of borrowers to service their debt, such as current financial information, historical payment experience, credit documentation,
F-27
Table of Contents
Index to Financial Statements
NATIONAL COMMERCE CORPORATION
Notes to Consolidated Financial Statements (Continued)
(amounts in tables in thousands, except per share data)
(4) Loans (Continued)
public information and current economic trends, among other factors. The Banks analyze loans individually by classifying the loans as to credit risk. This analysis is performed on a continuous basis. The Banks use the following definitions for their risk ratings:
Other Assets Especially Mentioned (“OAEM”): Weakness exists that could cause future impairment, including the deterioration of financial ratios, past due status and questionable management capabilities. Collateral values generally afford adequate coverage but may not be immediately marketable.
Substandard: Specific and well-defined weaknesses exist that may include poor liquidity and deterioration of financial ratios. The loan may be past due and related deposit accounts experiencing overdrafts. Immediate corrective action is necessary.
Doubtful: Specific weaknesses characterized as Substandard that are severe enough to make collection in full unlikely. There is no reliable secondary source of full repayment. Loans classified as doubtful will usually be placed on non-accrual, analyzed and fully or partially charged off based on a review of any collateral and other relevant factors.
Loss: Specific weakness characterized as Doubtful that are severe enough to be considered uncollectible and of such minimal value that its continuance as an asset is not warranted.
Loans not meeting the criteria above that are analyzed individually as part of the above described process are considered to be “Pass” rated loans. As of December 31, 2014 and 2013, and based on the most recent analyses performed, the risk category of loans by class of loans is as follows:
| December 31, 2014 |
Pass | OAEM | Substandard | Doubtful | Total | |||||||||||||||
| Commercial, financial, and agricultural |
$ | 129,314 | 1,159 | 1,184 | — | 131,657 | ||||||||||||||
| Factored commercial receivables |
80,995 | — | — | 1,605 | 82,600 | |||||||||||||||
| Real estate – mortgage |
565,992 | 4,057 | 2,803 | 4,416 | 577,268 | |||||||||||||||
| Real estate – construction |
82,552 | 94 | 254 | 763 | 83,663 | |||||||||||||||
| Consumer |
13,192 | 201 | 477 | 92 | 13,962 | |||||||||||||||
| Leases |
— | — | — | — | — | |||||||||||||||
|
|
|
|
|
|
|
|
|
|
|
|||||||||||
| Total |
$ | 872,045 | 5,511 | 4,718 | 6,876 | 889,150 | ||||||||||||||
|
|
|
|
|
|
|
|
|
|
|
|||||||||||
| December 31, 2013 |
Pass | OAEM | Substandard | Doubtful | Total | |||||||||||||||
| Commercial, financial, and agricultural |
$ | 111,828 | 1,257 | 1,893 | 27 | 115,005 | ||||||||||||||
| Real estate – mortgage |
392,568 | 3,829 | 3,312 | 3,344 | 403,053 | |||||||||||||||
| Real estate – construction |
58,372 | — | — | — | 58,372 | |||||||||||||||
| Consumer |
6,113 | — | — | — | 6,113 | |||||||||||||||
| Leases |
6 | — | — | — | 6 | |||||||||||||||
|
|
|
|
|
|
|
|
|
|
|
|||||||||||
| Total |
$ | 568,887 | 5,086 | 5,205 | 3,371 | 582,549 | ||||||||||||||
|
|
|
|
|
|
|
|
|
|
|
|||||||||||
F-28
Table of Contents
Index to Financial Statements
NATIONAL COMMERCE CORPORATION
Notes to Consolidated Financial Statements (Continued)
(amounts in tables in thousands, except per share data)
(5) Premises and Equipment
Major classifications of premises and equipment as of December 31, 2014 and 2013 are summarized as follows:
| 2014 | 2013 | |||||||
| Land |
$ | 11,389 | 3,205 | |||||
| Building and improvements |
12,525 | 6,500 | ||||||
| Furniture and equipment |
5,854 | 2,904 | ||||||
| Leasehold improvement |
3,045 | 2,377 | ||||||
| Construction in process |
1,348 | 4,136 | ||||||
| Automobile |
53 | — | ||||||
|
|
|
|
|
|||||
| 34,214 | 19,122 | |||||||
| Less accumulated depreciation |
6,654 | 2,941 | ||||||
|
|
|
|
|
|||||
| $ | 27,560 | 16,181 | ||||||
|
|
|
|
|
|||||
Depreciation expense amounted to approximately $836,000, $737,000 and $553,000 in 2014, 2013 and 2012, respectively.
(6) Deposits
Time deposits greater than or equal to $250,000 totaled approximately $85,302,000 and $86,491,000 as of December 31, 2014 and 2013, respectively.
At December 31, 2014, contractual maturities of time deposits are summarized as follows:
| 2015 |
$ | 107,492 | ||
| 2016 |
45,383 | |||
| 2017 |
30,051 | |||
| 2018 |
16,414 | |||
| 2019 |
6,867 | |||
|
|
|
|||
| $ | 206,207 | |||
|
|
|
As of December 31, 2014, there was one customer with approximately $66,411,000 in deposits, or 7% of total deposits. As of December 31, 2013, there were two customers with approximately $72,250,000 in aggregate deposits, or 11% of total deposits.
At December 31, 2014, the Company had outstanding brokered certificates of deposits of $48,935,000 with an average weighted rate of 0.81%. The Company had no outstanding brokered certificates of deposits at December 31, 2012.
(7) Federal Home Loan Bank Advances and Borrowings
At December 31, 2014 and 2013, the Company had advances outstanding from the FHLB that are summarized as follows:
| Advance |
Interest Basis | Current Rate | Maturity | Call or Conversion Date | ||||
| $ 2,000 | Fixed | 4.06% | February 1, 2019 | N/A | ||||
| 15,000 | Fixed | 1.04% | January 26, 2016 | N/A | ||||
| 5,000 | Fixed | 3.96% | July 2, 2018 | N/A | ||||
|
|
||||||||
| $22,000 | ||||||||
|
|
F-29
Table of Contents
Index to Financial Statements
NATIONAL COMMERCE CORPORATION
Notes to Consolidated Financial Statements (Continued)
(amounts in tables in thousands, except per share data)
(7) Federal Home Loan Bank Advances and Borrowings (Continued)
As of December 31, 2014, the Company had outstanding unfunded standby letters of credit with the FHLB totaling $98,345,000.
The Company had pledged under blanket floating liens approximately $471,481,000 and $409,911,000 in residential first mortgage loans, home equity lines of credit, commercial real estate loans, and loans secured by multi-family real estate as security for these advances and letters and possible future advances as of December 31, 2014 and 2013, respectively. The value of the pledged collateral, when using appropriate discount percentages as prescribed by the FHLB, equals or exceeds the advances and unfunded standby letters of credit outstanding. At December 31, 2014, the Company had approximately $111,032,000 in additional borrowing capacity under its borrowing arrangement with the FHLB.
The Company had available lines of credit for overnight borrowings totaling $84,600,000 at December 31, 2014.
(8) Income Taxes
The components of income tax expense for the years ended December 31, 2014, 2013 and 2012 are as follows:
| 2014 | 2013 | 2012 | ||||||||||
| Current |
$ | 2,607 | 409 | 71 | ||||||||
| Deferred |
28 | 550 | (240 | ) | ||||||||
| Expense of operating loss carryforwards |
536 | 1,351 | 1,240 | |||||||||
| Change in valuation allowance |
(12 | ) | — | — | ||||||||
|
|
|
|
|
|
|
|||||||
| $ | 3,159 | 2,310 | 1,071 | |||||||||
|
|
|
|
|
|
|
|||||||
The difference between income tax expense and the amount computed by applying the statutory federal income tax rate to income before taxes for the years ended December 31, 2014, 2013 and 2012 is as follows:
| 2014 | 2013 | 2012 | ||||||||||
| Pretax income at statutory rate |
$ | 3,085 | 2,147 | 1,064 | ||||||||
| State income tax expense, net |
224 | 251 | 125 | |||||||||
| Cash surrender value income |
(83 | ) | (80 | ) | (66 | ) | ||||||
| Tax exempt interest |
(65 | ) | (56 | ) | (68 | ) | ||||||
| Minority interest |
(174 | ) | — | — | ||||||||
| Merger related expenses |
111 | — | — | |||||||||
| Change in valuation allowance |
(12 | ) | — | — | ||||||||
| Other |
73 | 48 | 16 | |||||||||
|
|
|
|
|
|
|
|||||||
| $ | 3,159 | 2,310 | 1,071 | |||||||||
|
|
|
|
|
|
|
|||||||
F-30
Table of Contents
Index to Financial Statements
NATIONAL COMMERCE CORPORATION
Notes to Consolidated Financial Statements (Continued)
(amounts in tables in thousands, except per share data)
(8) Income Taxes (Continued)
The following summarizes the components of deferred taxes at December 31, 2014 and 2013.
| 2014 | 2013 | |||||||
| Deferred income tax assets: |
||||||||
| Loans and allowance for loan losses |
$ | 4,471 | 2,501 | |||||
| Accrued expenses |
106 | 107 | ||||||
| Operating loss carryforwards and credits |
7,037 | 3,260 | ||||||
| Premises and equipment |
283 | 672 | ||||||
| Capital loss carryforward |
— | 14 | ||||||
| Non-accrual interest income |
31 | 75 | ||||||
| Stock-based compensation |
479 | 347 | ||||||
| Other real estate |
99 | 32 | ||||||
| Investment in pass through entity |
208 | — | ||||||
| Other |
157 | 164 | ||||||
|
|
|
|
|
|||||
| Total gross deferred income tax assets |
12,871 | 7,172 | ||||||
| Less valuation allowance |
— | (12 | ) | |||||
|
|
|
|
|
|||||
| Net deferred income tax assets |
12,871 | 7,160 | ||||||
| Deferred income tax liabilities: |
||||||||
| Unrealized gains on investment securities available-for-sale |
455 | 156 | ||||||
| Prepaid expenses |
182 | 154 | ||||||
| Core deposit intangible |
668 | — | ||||||
| Goodwill |
122 | — | ||||||
| Leases |
— | 93 | ||||||
|
|
|
|
|
|||||
| Total gross deferred income tax liabilities |
1,427 | 403 | ||||||
|
|
|
|
|
|||||
| Net deferred income tax assets |
$ | 11,444 | 6,757 | |||||
|
|
|
|
|
|||||
As of December 31, 2014, the Company has net operating loss carryforwards totaling approximately $18,850,000 for federal taxes and $12,300,000 for state taxes that will begin to expire in 2029 and 2024 for federal and state taxes, respectively, unless previously utilized. The federal operating loss carryforwards are subject to limitation under Internal Revenue Code §382, but are expected to be utilized within the carryforward period. A majority of the state net operating loss carryforwards are also subject to limitation under Internal Revenue Code §382. These net operating losses are also expected to be utilized during the carryforward period.
(9) Commitments
The Company is a party to financial instruments with off-balance-sheet risk in the normal course of business to meet the financing needs of its customers. These financial instruments include commitments to extend credit and standby letters of credit. Those instruments involve, to varying degrees, elements of credit risk in excess of the amount recognized in the balance sheet. The contract amounts of those instruments reflect the extent of involvement the Company has in particular classes of financial instruments.
The exposure to credit loss in the event of nonperformance by the other party to the financial instrument for commitments to extend credit and standby letters of credit is represented by the contractual amount of those instruments. The Company uses the same credit policies in making commitments and conditional obligations as it does for on-balance-sheet instruments.
F-31
Table of Contents
Index to Financial Statements
NATIONAL COMMERCE CORPORATION
Notes to Consolidated Financial Statements (Continued)
(amounts in tables in thousands, except per share data)
(9) Commitments (Continued)
In most cases, the Company requires collateral or other security to support financial instruments with credit risk.
| December 31, | ||||||||
| 2014 | 2013 | |||||||
| Financial instruments whose contract amounts represents credit risk: |
||||||||
| Commitments to extend credit |
$ | 182,820 | 141,887 | |||||
| Stand-by and performance letter of credit |
$ | 8,085 | 4,066 | |||||
Commitments to extend credit are agreements to lend to a customer, as long as there is no violation of any condition established in the contract. Commitments generally have fixed expiration dates or other termination clauses and may require payment of a fee. Since many of the commitments may expire without being drawn upon, the total commitment amounts do not necessarily represent future cash requirements. The Company evaluates each customer’s creditworthiness on a case-by-case basis. The amount of collateral obtained upon an extension of credit, if deemed necessary by the Company, is based on management’s credit evaluation. The type of collateral held varies but may include unimproved and improved real estate, certificates of deposit, or personal property.
Standby and performance letters of credit are conditional commitments issued by the Company to guarantee the performance of a customer to a third party. Those guarantees are primarily issued to local businesses. The credit risk involved in issuing letters of credit is essentially the same as that involved in extending loan facilities to customers.
The Company has entered into operating lease agreements for eight branch locations. At December 31, 2014, seven locations are open and one location is scheduled to open in February 2015. Total rent expense for 2014, 2013 and 2012 was approximately $445,000, $457,000 and $494,000, respectively. Future minimum rent on operating leases as of December 31, 2014 is as follows:
| Year ending December 31, |
||||
| 2015 |
$ | 739 | ||
| 2016 |
388 | |||
| 2017 |
311 | |||
| 2018 |
192 | |||
| 2019 |
— | |||
| Thereafter |
— | |||
|
|
|
|||
| $ | 1,630 | |||
|
|
|
In the normal course of business, the Company may be named as defendant in certain litigation. Some of these matters may claim substantial damages. After consultation with outside legal counsel, management believes that resolution of these issues will not result in material adverse effect on the Company’s financial position or results of operations.
(10) Derivative Financial Instruments and Hedging Transactions
The Company is exposed to certain risks relating to its ongoing business operations. The primary risk managed by using derivative instruments is interest rate risk. Interest rate swaps are entered into to manage interest rate risk associated with certain of the Company’s fixed-rate loans. The Company has also entered into interest rate swap contracts with certain of its customers. To hedge the associated risk, the Company has entered into reciprocal interest rate swap agreements with a third party.
F-32
Table of Contents
Index to Financial Statements
NATIONAL COMMERCE CORPORATION
Notes to Consolidated Financial Statements (Continued)
(amounts in tables in thousands, except per share data)
(10) Derivative Financial Instruments and Hedging Transactions (Continued)
ASC 815, Derivatives and Hedging, requires companies to recognize all derivative instruments as either assets or liabilities at fair value on the balance sheet. As of December 31, 2014 and 2013, the approximate fair values and notional amounts of the Company’s derivative instruments, as well as their location on the consolidated balance sheet, are included in the table below.
| December 31, 2014 |
Balance Sheet Location |
Fair Value | Notional Amount |
|||||||
| Interest rate swaps designated as fair value hedges |
Other Liabilities | $ | (417 | ) | 16,674 | |||||
| Interest rate swaps with customers |
Other Liabilities | $ | (7 | ) | 9,646 | |||||
| Reciprocal interest rate swaps |
Other Assets | $ | 7 | 9,646 | ||||||
| December 31, 2013 |
Balance Sheet Location |
Fair Value | Notional Amount |
|||||||
| Interest rate swaps designated as fair value hedges |
Other Assets | $ | 62 | 17,264 | ||||||
| Interest rate swaps with customers |
Other Liabilities | $ | (352 | ) | 10,018 | |||||
| Reciprocal interest rate swaps |
Other Assets | $ | 352 | 10,018 | ||||||
During the year ended December 31, 2014, the Company recognized a loss of approximately $128,000 related to the ineffective portion of derivatives designated as fair value hedges. During the year ended December 31, 2013, the Company recognized a gain of approximately $16,000 related to the ineffective portion of derivatives designated as fair value hedges. The gain and loss are included in other income on the consolidated statement of earnings. There were no gains or losses recognized on fair value hedges during the year ended December 31, 2012.
(11) Employee Benefit Plans
Equity Incentive Plan
During 2011, the Company adopted the National Commerce Corporation 2011 Equity Incentive Plan (the “2011 Equity Incentive Plan”). The 2011 Equity Incentive Plan was adopted to provide a means of enhancing and encouraging the recruitment and retention of individuals on whom the success of the Company depends. The 2011 Equity Incentive Plan provides for the grant of stock options, phantom stock, performance awards and restricted and unrestricted stock awards. A total of 500,000 shares were reserved for possible issuance under the plan.
The Company did not issue any stock options during 2014, 2013 or 2012, but during 2014 did assume 102,586 options in the acquisition of United.
A summary of activity in the outstanding stock options for the years ended December 31, 2014, 2013 and 2012 is presented below:
| 2014 | 2013 | 2012 | ||||||||||||||||||||||
| Shares | Weighted Average Exercise Price |
Shares | Weighted Average Exercise Price |
Shares | Weighted Average Exercise Price |
|||||||||||||||||||
| Outstanding, beginning of year |
220,500 | $ | 14.57 | 220,500 | $ | 14.57 | 220,500 | $ | 14.57 | |||||||||||||||
| Granted |
— | — | — | — | — | — | ||||||||||||||||||
| Assumed |
102,586 | 23.45 | — | — | — | — | ||||||||||||||||||
| Exercised |
(1,000 | ) | 14.57 | — | — | — | — | |||||||||||||||||
| Forfeited |
— | — | — | — | — | — | ||||||||||||||||||
|
|
|
|
|
|
|
|
|
|
|
|
|
|||||||||||||
| Outstanding, end of year |
322,086 | $ | 17.40 | 220,500 | $ | 14.57 | 220,500 | $ | 14.57 | |||||||||||||||
|
|
|
|
|
|
|
|
|
|
|
|
|
|||||||||||||
| Exercisable, end of year |
322,086 | $ | 17.40 | 220,500 | $ | 14.57 | 220,500 | $ | 14.57 | |||||||||||||||
|
|
|
|
|
|
|
|
|
|
|
|
|
|||||||||||||
F-33
Table of Contents
Index to Financial Statements
NATIONAL COMMERCE CORPORATION
Notes to Consolidated Financial Statements (Continued)
(amounts in tables in thousands, except per share data)
(11) Employee Benefit Plans (Continued)
Equity Incentive Plan (Continued)
The options outstanding and exercisable at December 31, 2014 have a weighted average remaining contractual life of approximately six years. As of December 31, 2014, there was no unrecognized compensation expense, as all stock options immediately vested or the assumed options vested at the date of acquisition. No compensation expense related to stock options was recognized in 2014, 2013 or 2012.
During 2014, 2013 and 2012, the Company granted certain key employees performance share awards under the 2011 Equity Incentive Plan. The awards will vest over five years and the number of shares ultimately awarded is both fixed and variable. Some grants vest over time and ultimate the payout is fixed. Other awards are based on factors such as loan production and the Company’s performance relative to peers over time using metrics such as net income and asset quality. The Company will record total compensation expense equal to the amount of shares it expects to pay out at the end of the award period over the associated vesting period. The Company recognized $358,000, $293,000 and $112,000 in compensation expense related to performance share awards during 2014, 2013 and 2012, respectively. As of December 31, 2014, there was approximately $756,000 of unrecorded compensation expense related to the performance share awards.
Defined Contribution Plan
The Company sponsors a 401(k) savings plan under which eligible employees may choose to save up to 15% of salary income on a pre-tax or after-tax basis, subject to certain Internal Revenue Service limits. Effective January 1, 2013, the Company amended the plan to include a matching employer contribution equal to 50% of the first 3% deferred by eligible participants. During 2014 and 2013, the Company recognized matching contribution expense of approximately $119,000 and $142,000, respectively. Under the plan, the Company can also make additional discretionary contributions, as determined by the Board of Directors. The Company contributed $80,000 to the plan during 2012.
(12) Related Party Transactions
The Company conducts transactions its with directors and executive officers, including companies in which such directors and executive officers have a beneficial interest, in the normal course of business. It is the Company’s policy to comply with federal regulations that require that loan and deposit transactions with directors and executive officers be made on substantially the same terms as those prevailing at the time for comparable loans and deposits to other persons. At December 31, 2014 and 2013, deposits from directors, executive officers and their related interests aggregated approximately $24,746,000 and $8,737,000, respectively. These deposits were taken in the normal course of business at market interest rates. The following is a summary of activity for related party loans for 2014:
| Balance at December 31, 2013 |
$ | 518 | ||
| New loans |
268 | |||
| Repayments |
(210 | ) | ||
| Changes in related parties |
2,261 | |||
|
|
|
|||
| Balance at December 31, 2014 |
$ | 2,837 | ||
|
|
|
F-34
Table of Contents
Index to Financial Statements
NATIONAL COMMERCE CORPORATION
Notes to Consolidated Financial Statements (Continued)
(amounts in tables in thousands, except per share data)
(13) Shareholders’ Equity
In connection with the Company’s formation and initial offering, 247,500 warrants for shares were issued to the organizers. The warrants were issued at the initial offering price of $20 per share and vested evenly over a five-year period. The warrants will be exercisable for a period of ten years following issuance, but generally no later than three months after the holder ceases to serve as a director. As of December 31, 2013, there were 30,000 warrants outstanding and exercisable, all of which were exercised during 2014.
In connection with the Company’s entry into the Vero Beach, Florida market area, the Company completed the sale of 163,485 shares of common stock at $18.35 per share in a private placement on August 8, 2014. The sale of common stock raised $2,972,000, net of offering expenses of $28,000.
During April 2014, the Company reincorporated in the State of Delaware. As a result of this reincorporation, the par value of the Company’s stock was changed from $1.00 par value per share to $0.01 par value per share. Additionally, all outstanding non-voting common shares were converted to common voting shares, and any fractional shares (totaling 17.5 shares) were cashed out. Other than the cash out of fractional shares, the reincorporation had no impact on total shares outstanding or total equity of the Company.
(14) Regulatory Matters
Banking regulations limit the amount of dividends that the Banks may pay without prior approval of the regulatory authorities. These restrictions are based on the level of regulatory classified assets, the prior years’ net earnings, and the ratio of equity capital to total assets. The Banks are currently not allowed to pay dividends until each becomes cumulatively profitable.
The Company and the Banks are subject to various regulatory capital requirements administered by federal banking agencies. Failure to meet minimum capital requirements can initiate certain mandatory and possibly additional discretionary actions by regulators that, if undertaken, could have a direct material effect on the financial statements. Under certain adequacy guidelines and the regulatory framework for prompt corrective action, specific capital guidelines that involve quantitative measures of the assets, liabilities, and certain off-balance sheet items as calculated under regulatory accounting practices must be met. The capital amounts and classifications are also subject to qualitative judgments by the regulators about components, risk weightings, and other factors.
Quantitative measures established by regulation to ensure capital adequacy require the Company and the Banks to maintain minimum amounts and ratios (set forth in the table below) of Total and Tier 1 Capital (as defined in the regulations) to risk-weighted assets (as defined), and of Tier 1 Capital (as defined) to average assets (as defined). Management believes, as of December 31, 2014 and 2013, that the Company and the Banks meet all capital adequacy requirements to which they are subject.
As of December 31, 2014 and 2013, the most recent notification from the regulators categorized the Banks as well capitalized under the regulatory framework for prompt corrective action. To be categorized as well capitalized, the Banks must maintain minimum total risk-based, Tier 1 risk-based and Tier 1 leverage ratios as set forth in the table below. There are no conditions or events since that notification that management believes have changed the Banks’ category.
F-35
Table of Contents
Index to Financial Statements
NATIONAL COMMERCE CORPORATION
Notes to Consolidated Financial Statements (Continued)
(amounts in tables in thousands, except per share data)
(14) Regulatory Matters (Continued)
The Company’s and its banking subsidiaries, NBC and ULB, actual capital amounts (in thousands) and ratios are also presented in the table below. ULB’s ratios are not presented as of December 31, 2013 as it was not acquired until December 15, 2014.
| Actual | For Capital Adequacy Purposes |
To Be Well Capitalized Under Prompt Corrective Action Provisions |
||||||||||||||||||||||
| Amount | Ratio | Amount | Ratio | Amount | Ratio | |||||||||||||||||||
| As of December 31, 2014 |
||||||||||||||||||||||||
| Total Capital (to Risk Weighted Assets) |
||||||||||||||||||||||||
| National Commerce Corporation |
$ | 106,289 | 11.75 | % | $ | 72,367 | 8.00 | % | N/A | N/A | ||||||||||||||
| National Bank of Commerce |
$ | 84,148 | 11.42 | % | $ | 58,948 | 8.00 | % | $ | 73,685 | 10.00 | % | ||||||||||||
| United Legacy Bank |
$ | 18,731 | 11.31 | % | $ | 13,249 | 8.00 | % | $ | 16,561 | 10.00 | % | ||||||||||||
| Tier 1 Capital (to Risk Weighted Assets) |
||||||||||||||||||||||||
| National Commerce Corporation |
$ | 96,487 | 10.66 | % | $ | 36,205 | 4.00 | % | N/A | N/A | ||||||||||||||
| National Bank of Commerce |
$ | 74,927 | 10.16 | % | $ | 29,499 | 4.00 | % | $ | 44,248 | 6.00 | % | ||||||||||||
| United Legacy Bank |
$ | 18,731 | 11.31 | % | $ | 6,625 | 4.00 | % | $ | 9,937 | 6.00 | % | ||||||||||||
| Tier 1 Capital (to Average Assets) |
||||||||||||||||||||||||
| National Commerce Corporation |
$ | 96,487 | 10.68 | % | $ | 36,137 | 4.00 | % | N/A | N/A | ||||||||||||||
| National Bank of Commerce |
$ | 74,927 | 8.57 | % | $ | 34,972 | 4.00 | % | $ | 43,715 | 5.00 | % | ||||||||||||
| United Legacy Bank |
$ | 18,731 | 8.60 | % | $ | 8,712 | 4.00 | % | $ | 10,890 | 5.00 | % | ||||||||||||
| As of December 31, 2013 |
||||||||||||||||||||||||
| Total Capital (to Risk Weighted Assets) |
||||||||||||||||||||||||
| National Commerce Corporation |
$ | 92,718 | 15.83 | % | $ | 46,847 | 8.00 | % | N/A | N/A | ||||||||||||||
| National Bank of Commerce |
$ | 91,918 | 15.71 | % | $ | 46,803 | 8.00 | % | $ | 58,504 | 10.00 | % | ||||||||||||
| Tier 1 Capital (to Risk Weighted Assets) |
||||||||||||||||||||||||
| National Commerce Corporation |
$ | 85,376 | 14.58 | % | $ | 23,423 | 4.00 | % | N/A | N/A | ||||||||||||||
| National Bank of Commerce |
$ | 84,583 | 14.46 | % | $ | 23,402 | 4.00 | % | $ | 35,103 | 6.00 | % | ||||||||||||
| Tier 1 Capital (to Average Assets) |
||||||||||||||||||||||||
| National Commerce Corporation |
$ | 85,376 | 12.18 | % | $ | 28,043 | 4.00 | % | N/A | N/A | ||||||||||||||
| National Bank of Commerce |
$ | 84,583 | 12.07 | % | $ | 28,042 | 4.00 | % | $ | 35,053 | 5.00 | % | ||||||||||||
In July 2013, the federal banking regulatory agencies issued a final rule that revised their risk-based capital requirements and the method for calculating components of capital and of computing risk-weighted assets to make them consistent with agreements that were reached by the Basel Committee on Banking Supervision and certain provisions of the Dodd-Frank Act. The final rule applies to all depository institutions, top-tier bank holding companies with total consolidated assets of $500 million or more and top-tier savings and loan holding companies. The rule establishes a new common equity Tier 1 minimum capital requirement, increases the minimum capital ratios and assigns a higher risk weight to certain assets based on the risk associated with these assets. The final rule includes transition periods that generally implement the new regulations over a five-year period. These changes are being phased in as of January 2015, and while management continues to evaluate this final rule and its potential impact, preliminary assessments indicate that the Banks and the Company will continue to exceed all regulatory capital requirements under the new rule.
(15) Fair Value Measurements and Disclosures
The Company utilizes fair value measurements to record fair value adjustments to certain assets and liabilities and to determine fair value disclosures. Securities available-for-sale and derivative financial
F-36
Table of Contents
Index to Financial Statements
NATIONAL COMMERCE CORPORATION
Notes to Consolidated Financial Statements (Continued)
(amounts in tables in thousands, except per share data)
(15) Fair Value Measurements and Disclosures (Continued)
instruments are recorded at fair value on a recurring basis. Additionally, from time to time, the Company may be required to record at fair value other assets on a nonrecurring basis, such as impaired loans and other real estate and repossessed assets. These nonrecurring fair value adjustments typically involve application of the lower of cost or market accounting or write-downs of individual assets.
Fair Value Hierarchy
The Company groups assets and liabilities at fair value in three levels, based on the markets in which the assets and liabilities are traded and the reliability of the assumptions used to determine fair value. These levels are:
Level 1 – Valuation is based upon quoted prices for identical instruments traded in active markets.
Level 2 – Valuation is based upon quoted prices for similar instruments in active markets, quoted prices for identical or similar instruments in markets that are not active, and model-based valuation techniques for which all significant assumptions are observable in the market.
Level 3 – Valuation is generated from model-based techniques that use at least one significant assumption not observable in the market. These unobservable assumptions reflect estimates of assumptions that market participants would use in pricing the asset or liability. Valuation techniques include use of option pricing models, discounted cash flow models and similar techniques.
Following is a description of valuation methodologies used for assets and liabilities recorded or disclosed at fair value.
Cash and Cash Equivalents
For disclosure purposes, for cash, due from banks, interest-bearing deposits, and federal funds sold, the carrying amount is a reasonable estimate of fair value.
Securities Available-for-Sale
Securities available-for-sale are recorded at fair value on a recurring basis. Fair value measurement is based upon quoted prices, if available. If quoted prices are not available, fair values are measured using independent pricing models or other model-based valuation techniques such as the present value of future cash flows, adjusted for the security’s credit rating, prepayment assumptions and other factors such as credit loss assumptions. Level 1 securities include those traded on an active exchange, such as the New York Stock Exchange and U.S. Treasury securities that are traded by dealers or brokers in active over-the-counter market funds. Level 2 securities include mortgage-backed securities issued by government sponsored enterprises and municipal bonds. Securities classified as Level 3 include asset-backed securities in less liquid markets.
Other Investments
For disclosure purposes, the carrying amount of other investments approximates their fair value.
Loans and Mortgage Loans Held-for-Sale
The Company does not record loans at fair value on a recurring basis. However, from time to time, a loan is considered impaired and an allowance for loan losses is established. Loans for which it is probable that payment of interest and principal will not be made in accordance with the contractual terms of the loan agreement are considered impaired. Once a loan is identified as individually impaired, management measures impairment using one of three methods, including collateral value, market value of similar debt, and discounted cash flows. Those impaired loans not requiring an allowance represent loans for which the fair value of the expected repayments or collateral exceed the recorded investments in such loans. At December 31, 2014 and 2013, impaired loans were
F-37
Table of Contents
Index to Financial Statements
NATIONAL COMMERCE CORPORATION
Notes to Consolidated Financial Statements (Continued)
(amounts in tables in thousands, except per share data)
(15) Fair Value Measurements and Disclosures (Continued)
Loans and Mortgage Loans Held-for-Sale (Continued)
evaluated based on the fair value of the collateral. Impaired loans where an allowance is established based on the fair value of collateral, or loans that are charged down according to the fair value of collateral, require classification in the fair value hierarchy. When the fair value of the collateral is based on an observable market price, the Company records the impaired loan as nonrecurring Level 2. When the fair value is based on an appraised value, the Company records the impaired loan as nonrecurring Level 3.
For disclosure purposes, the fair value of fixed-rate loans is estimated by discounting the future cash flows using the current rates at which similar loans would be made to borrowers with similar credit ratings. For variable rate loans, the carrying amount is a reasonable estimate of fair value. Mortgage loans held-for-sale are carried at cost, which is a reasonable estimate of fair value.
Bank Owned Life Insurance
For disclosure purposes, the fair value of the cash surrender value of life insurance policies is equivalent to the carrying value.
Other Real Estate
Other real estate properties are adjusted to fair value upon transfer of the loans to other real estate. Subsequently, other real estate assets are carried at the lower of carrying value or fair value. Fair value is based upon independent market prices, appraised values of the collateral or management’s estimation of the value of the collateral. When the fair value of the collateral is based on an observable market price, the Company records the other real estate as nonrecurring Level 2. When fair value is based on an appraised value or management’s estimate of value, the Company records the other real estate or repossessed asset as nonrecurring Level 3.
Deposits
For disclosure purposes, the fair value of demand deposits, NOW and money market accounts, and savings accounts is the amount payable on demand at the reporting date. The fair value of fixed-rate maturity certificates of deposit is estimated by discounting the future cash flows using the rates currently offered for deposits of similar remaining maturities.
Federal Home Loan Bank Advances
For disclosure purposes, the fair value of the FHLB advances is based on the quoted value for similar remaining maturities provided by the FHLB.
Derivative Financial Instruments
Derivative financial instruments are recorded at fair value on a recurring basis. The valuation of the Company’s derivative financial instruments is determined using widely accepted valuation techniques, including discounted cash flow analysis on the expected cash flows of the derivative. This analysis reflects the contractual terms of the derivative, including the period to maturity, and uses observable market-based inputs, including interest rate curves and implied volatilities. The fair value of the interest rate swaps are determined using the market standard methodology of netting the discounted future fixed cash receipts and the discounted expected variable cash payments. The variable cash payments are based on an expectation of future interest rates (forward curves derived from observable market interest rate curves).
The Company incorporates credit valuation adjustments to appropriately reflect both its own nonperformance risk and the respective counterparty’s nonperformance risk in the fair value measurements. In
F-38
Table of Contents
Index to Financial Statements
NATIONAL COMMERCE CORPORATION
Notes to Consolidated Financial Statements (Continued)
(amounts in tables in thousands, except per share data)
(15) Fair Value Measurements and Disclosures (Continued)
Derivative Financial Instruments (Continued)
adjusting the fair value of its derivative contracts for the effect of nonperformance risk, the Company has considered the impact of netting any applicable credit enhancements such as collateral postings, thresholds, mutual puts and guarantees.
Although the Company has determined that the majority of the inputs used to value its derivatives fall within Level 2 of the fair value hierarchy, the credit valuation adjustments associated with its derivatives utilize Level 3 inputs, such as estimates of current credit spreads, to evaluate the likelihood of default by itself or the counterparty. However, as of December 31, 2014 and 2013, the Company has assessed the significance of the impact of the credit valuation adjustments on the overall valuation of its derivative positions and has determined that the credit valuation adjustment is not significant to the overall valuation of its derivatives. As a result, the Company has determined that its derivative valuations are classified in Level 2 of the fair value hierarchy.
Commitments to Extend Credit and Standby Letters of Credit
Because commitments to extend credit and standby letters of credit are generally short-term and made using variable rates, the carrying value and estimated fair value associated with these instruments are immaterial.
Assets and Liabilities Recorded at Fair Value on a Recurring Basis
The table below presents the recorded amount of assets and liabilities measured at fair value on a recurring basis as of December 31, 2014 and 2013.
| December 31, 2014 |
Level 1 | Level 2 | Level 3 | Total | ||||||||||||
| U.S. Treasury securities |
$ | 1,501 | — | — | 1,501 | |||||||||||
| Mortgage-backed securities |
— | 28,750 | — | 28,750 | ||||||||||||
|
|
|
|
|
|
|
|
|
|||||||||
| Municipal securities |
— | 4,681 | — | 4,681 | ||||||||||||
|
|
|
|
|
|
|
|
|
|||||||||
| Total investment securities available-for-sale |
$ | 1,501 | 33,431 | — | 34,932 | |||||||||||
|
|
|
|
|
|
|
|
|
|||||||||
| Derivative assets |
$ | — | 105 | — | 105 | |||||||||||
|
|
|
|
|
|
|
|
|
|||||||||
| Derivative liability |
$ | — | 425 | — | 425 | |||||||||||
|
|
|
|
|
|
|
|
|
|||||||||
| December 31, 2013 |
Level 1 | Level 2 | Level 3 | Total | ||||||||||||
| Mortgage-backed securities |
$ | — | 33,742 | — | 33,742 | |||||||||||
| Municipal securities |
— | 4,270 | — | 4,270 | ||||||||||||
| Investment in mutual fund |
— | 9,967 | — | 9,967 | ||||||||||||
|
|
|
|
|
|
|
|
|
|||||||||
| Total investment securities available-for-sale |
$ | — | 47,979 | — | 47,979 | |||||||||||
|
|
|
|
|
|
|
|
|
|||||||||
| Derivative assets |
$ | — | 493 | — | 493 | |||||||||||
|
|
|
|
|
|
|
|
|
|||||||||
| Derivative liability |
$ | — | 352 | — | 352 | |||||||||||
|
|
|
|
|
|
|
|
|
|||||||||
F-39
Table of Contents
Index to Financial Statements
NATIONAL COMMERCE CORPORATION
Notes to Consolidated Financial Statements (Continued)
(amounts in tables in thousands, except per share data)
(15) Fair Value Measurements and Disclosures (Continued)
Assets Recorded at Fair Value on a Nonrecurring Basis
The Company may be required, from time to time, to measure certain assets at fair value on a nonrecurring basis in accordance with U.S. generally accepted accounting principles. These include assets that are measured at the lower of cost or market that were recognized at fair value below cost at the end of the period. Assets measured at fair value on a nonrecurring basis are included in the table below as of December 31, 2014 and 2013.
| December 31, 2014 |
Level 1 | Level 2 | Level 3 | Total | ||||||||||||
| Other real estate and repossessed assets |
$ | — | — | 1,380 | 1,380 | |||||||||||
| Impaired loans |
— | — | 4,865 | 4,865 | ||||||||||||
| December 31, 2013 |
Level 1 | Level 2 | Level 3 | Total | ||||||||||||
| Other real estate and repossessed assets |
$ | — | — | 845 | 845 | |||||||||||
| Impaired loans |
— | — | 3,371 | 3,371 | ||||||||||||
The carrying amounts and estimated fair values of the Company’s financial instruments at December 31, 2014 and 2013 were as follows:
| Carrying Amount |
Estimated Fair Value | |||||||||||||||
| December 31, 2014 |
Level 1 | Level 2 | Level 3 | |||||||||||||
| Assets: |
||||||||||||||||
| Cash and cash equivalents |
$ | 123,435 | 123,435 | — | — | |||||||||||
| Investment securities available-for-sale |
34,932 | 1,501 | 33,431 | — | ||||||||||||
| Other investments |
5,421 | — | 5,421 | — | ||||||||||||
| Loans, net |
878,919 | — | 873,125 | 4,865 | ||||||||||||
| Mortgage loans held-for-sale |
9,329 | — | 9,329 | — | ||||||||||||
| Bank owned life insurance |
10,641 | — | 10,640 | — | ||||||||||||
| Derivative assets |
105 | — | 105 | — | ||||||||||||
| Liabilities: |
||||||||||||||||
| Deposits |
971,060 | — | 949,621 | — | ||||||||||||
| Federal Home Loan Bank advances |
22,000 | — | 22,677 | — | ||||||||||||
| Derivative liability |
425 | — | 425 | — | ||||||||||||
| Carrying Amount |
Estimated Fair Value | |||||||||||||||
| December 31, 2013 |
Level 1 | Level 2 | Level 3 | |||||||||||||
| Assets: |
||||||||||||||||
| Cash and cash equivalents |
$ | 124,136 | 124,136 | — | — | |||||||||||
| Investment securities available-for-sale |
47,979 | — | 47,979 | — | ||||||||||||
| Other investments |
4,482 | — | 4,482 | — | ||||||||||||
| Loans, net |
572,883 | — | 566,207 | 3,371 | ||||||||||||
| Mortgage loans held-for-sale |
7,159 | — | 7,159 | — | ||||||||||||
| Bank owned life insurance |
8,247 | — | 8,247 | — | ||||||||||||
| Derivative assets |
493 | — | 493 | — | ||||||||||||
| Liabilities: |
||||||||||||||||
| Deposits |
678,031 | — | 674,070 | — | ||||||||||||
| Federal Home Loan Bank advances |
22,000 | — | 22,743 | — | ||||||||||||
| Derivative liability |
352 | — | 352 | — | ||||||||||||
F-40
Table of Contents
Index to Financial Statements
NATIONAL COMMERCE CORPORATION
Notes to Consolidated Financial Statements (Continued)
(amounts in tables in thousands, except per share data)
(15) Fair Value Measurements and Disclosures (Continued)
Limitations
Fair value estimates are made at a specific point in time, based on relevant market information and information about the financial instrument. These estimates do not reflect any premium or discount that could result from offering for sale at one time the Company’s entire holdings of a particular financial instrument. Because no market exists for a significant portion of the Company’s financial instruments, fair value estimates are based on many judgments. These estimates are subjective in nature and involve uncertainties and matters of significant judgment and therefore cannot be determined with precision. Changes in assumptions could significantly affect the estimates.
Fair value estimates are based on existing on- and off-balance sheet financial instruments without attempting to estimate the value of anticipated future business and the value of assets and liabilities that are not considered financial instruments. Significant assets and liabilities that are not considered financial instruments include mortgage banking operations, deferred income taxes and premises and equipment. In addition, the tax ramifications related to the realization of the unrealized gains and losses can have a significant effect on fair value estimates and have not been considered in the estimates.
(16) National Commerce Corporation (Parent Company Only) Financial Information
Balance Sheets
December 31, 2014 and 2013
| 2014 | 2013 | |||||||
| Assets | ||||||||
| Cash and due from banks |
$ | 829 | 805 | |||||
| Investment in subsidiaries |
133,909 | 87,609 | ||||||
| Other assets |
1,557 | 535 | ||||||
|
|
|
|
|
|||||
| Total assets |
$ | 136,295 | 88,949 | |||||
|
|
|
|
|
|||||
| Liabilities and Shareholders’ Equity | ||||||||
| Other liabilities |
$ | 134 | 10 | |||||
|
|
|
|
|
|||||
| Total liabilities |
134 | 10 | ||||||
|
|
|
|
|
|||||
| Commitments |
||||||||
| Shareholders’ equity: |
||||||||
| Common stock |
75 | 5,730 | ||||||
| Additional paid-in capital |
131,455 | 91,774 | ||||||
| Accumulated deficit |
(3,453 | ) | (8,856 | ) | ||||
| Accumulated other comprehensive income |
845 | 291 | ||||||
|
|
|
|
|
|||||
| Total shareholders’ equity attributable to NCC |
128,922 | 88,939 | ||||||
| Noncontrolling interest |
7,239 | — | ||||||
|
|
|
|
|
|||||
| Total shareholders’ equity |
136,161 | 88,939 | ||||||
|
|
|
|
|
|||||
| Total liabilities and shareholders’ equity |
$ | 136,295 | 88,949 | |||||
|
|
|
|
|
|||||
F-41
Table of Contents
Index to Financial Statements
NATIONAL COMMERCE CORPORATION
Notes to Consolidated Financial Statements (Continued)
(amounts in tables in thousands, except per share data)
(16) National Commerce Corporation (Parent Company Only) Financial Information (Continued)
Statements of Earnings
For the Years Ended December 31, 2014, 2013 and 2012
| 2014 | 2013 | 2012 | ||||||||||
| Income |
$ | — | — | — | ||||||||
| Other expense |
458 | 123 | 97 | |||||||||
|
|
|
|
|
|
|
|||||||
| Total expenses |
458 | 123 | 97 | |||||||||
|
|
|
|
|
|
|
|||||||
| Loss before equity in undistributed earnings of subsidiaries |
(458 | ) | (123 | ) | (97 | ) | ||||||
| Equity in undistributed earnings of subsidiaries |
5,764 | 4,079 | 2,117 | |||||||||
| Income tax benefit |
97 | 50 | 37 | |||||||||
|
|
|
|
|
|
|
|||||||
| Net earnings |
$ | 5,403 | 4,006 | 2,057 | ||||||||
|
|
|
|
|
|
|
|||||||
Statements of Cash Flows
For the Years Ended December 31, 2014, 2013 and 2012
| 2014 | 2013 | 2012 | ||||||||||
| Cash flows from operating activities: |
||||||||||||
| Net earnings |
$ | 5,403 | 4,006 | 2,057 | ||||||||
| Adjustments to reconcile net earnings to net cash used by operating activities |
||||||||||||
| Equity in undistributed earnings of subsidiaries |
(5,764 | ) | (4,079 | ) | (2,117 | ) | ||||||
| Depreciation |
1 | — | — | |||||||||
| Deferred income tax expense (benefit) |
162 | (81 | ) | (37 | ) | |||||||
| Change in other assets |
(285 | ) | — | — | ||||||||
| Change in other liabilities |
121 | 10 | (25 | ) | ||||||||
|
|
|
|
|
|
|
|||||||
| Net cash used by operating activities |
(362 | ) | (144 | ) | (122 | ) | ||||||
|
|
|
|
|
|
|
|||||||
| Cash flows from investing activities |
||||||||||||
| Cash paid in acquisition |
(3,201 | ) | — | — | ||||||||
|
|
|
|
|
|
|
|||||||
| Net cash used by financing activities |
(3,201 | ) | — | — | ||||||||
|
|
|
|
|
|
|
|||||||
| Cash flows from financing activities |
||||||||||||
| Proceeds from stock offerings, net of offering expenses of $28 |
2,972 | — | — | |||||||||
| Proceeds from exercise of stock options and warrants |
615 | — | — | |||||||||
|
|
|
|
|
|
|
|||||||
| Net cash provided by financing activities |
3,587 | — | — | |||||||||
|
|
|
|
|
|
|
|||||||
| Net change in cash |
24 | (144 | ) | (122 | ) | |||||||
|
|
|
|
|
|
|
|||||||
| Cash at beginning of year |
805 | 949 | 1,071 | |||||||||
|
|
|
|
|
|
|
|||||||
| Cash at end of year |
$ | 829 | 805 | 949 | ||||||||
|
|
|
|
|
|
|
|||||||
F-42
Table of Contents
Index to Financial Statements
NATIONAL COMMERCE CORPORATION
Notes to Consolidated Financial Statements (Continued)
(amounts in tables in thousands, except per share data)
(17) Segment Reporting
The Company’s three reportable segments represent distinct product lines and are viewed separately for strategic planning purposes and internal reporting. The 2014 totals include the receivable factoring results for four months, as NBC acquired CBI on August 29, 2014. There are no amounts to report for this segment during 2013 and 2012. The following table is a reconciliation of the reportable segment revenues, expenses and profit to the Company’s consolidated totals.
| Retail and Commercial Banking |
Mortgage Division(1) |
Receivables Factoring |
Elimination Entries(2) |
Total | ||||||||||||||||
| Twelve Months Ended December 31, 2014: |
||||||||||||||||||||
| Interest income |
$ | 27,144 | 410 | 4,345 | (557 | ) | 31,342 | |||||||||||||
| Interest expense |
2,746 | 123 | 731 | (731 | ) | 2,869 | ||||||||||||||
|
|
|
|
|
|
|
|
|
|
|
|||||||||||
| Net interest income |
24,398 | 287 | 3,614 | 174 | 28,473 | |||||||||||||||
| Provision for loan and lease losses |
— | — | 804 | 174 | 978 | |||||||||||||||
| Noninterest income |
811 | 4,199 | 22 | — | 5,032 | |||||||||||||||
| Noninterest expense |
18,048 | 3,681 | 1,724 | — | 23,453 | |||||||||||||||
|
|
|
|
|
|
|
|
|
|
|
|||||||||||
| Net earnings before tax & noncontrolling interest |
7,161 | 805 | 1,108 | — | 9,074 | |||||||||||||||
| Income tax expense |
2,627 | 306 | 226 | — | 3,159 | |||||||||||||||
| Noncontrolling interest |
— | — | (512 | ) | — | (512 | ) | |||||||||||||
|
|
|
|
|
|
|
|
|
|
|
|||||||||||
| Net earnings attributable to National Commerce Corporation |
$ | 4,534 | 499 | 370 | — | 5,403 | ||||||||||||||
|
|
|
|
|
|
|
|
|
|
|
|||||||||||
| Total assets as of December 31, 2014 |
$ | 1,099,191 | 9,329 | 105,330 | (75,424 | ) | 1,138,426 | |||||||||||||
|
|
|
|
|
|
|
|
|
|
|
|||||||||||
| Twelve Months Ended December 31, 2013: |
||||||||||||||||||||
| Interest income |
$ | 22,893 | 419 | — | — | 23,312 | ||||||||||||||
| Interest expense |
2,471 | 142 | — | — | 2,613 | |||||||||||||||
|
|
|
|
|
|
|
|
|
|
|
|||||||||||
| Net interest income |
20,422 | 277 | — | — | 20,699 | |||||||||||||||
| Provision for loan and lease losses |
— | — | — | — | — | |||||||||||||||
| Noninterest income |
617 | 4,685 | — | — | 5,302 | |||||||||||||||
| Noninterest expense |
15,819 | 3,866 | — | — | 19,685 | |||||||||||||||
|
|
|
|
|
|
|
|
|
|
|
|||||||||||
| Net earnings before tax & noncontrolling interest |
5,220 | 1,096 | — | — | 6,316 | |||||||||||||||
| Income tax expense |
1,894 | 416 | — | — | 2,310 | |||||||||||||||
| Noncontrolling interest |
— | — | — | — | — | |||||||||||||||
|
|
|
|
|
|
|
|
|
|
|
|||||||||||
| Net earnings attributable to National Commerce Corporation |
$ | 3,326 | 680 | — | — | 4,006 | ||||||||||||||
|
|
|
|
|
|
|
|
|
|
|
|||||||||||
| Total assets as of December 31, 2013 |
$ | 784,622 | 7,159 | — | — | 791,781 | ||||||||||||||
|
|
|
|
|
|
|
|
|
|
|
|||||||||||
F-43
Table of Contents
Index to Financial Statements
NATIONAL COMMERCE CORPORATION
Notes to Consolidated Financial Statements (Continued)
(amounts in tables in thousands, except per share data)
(17) Segment Reporting (Continued)
| Retail and Commercial Banking |
Mortgage Division(1) |
Receivables Factoring |
Elimination Entries(2) |
Total | ||||||||||||||||
| Twelve Months Ended December 31, 2012: |
||||||||||||||||||||
| Interest income |
$ | 19,517 | 435 | — | — | 19,952 | ||||||||||||||
| Interest expense |
3,128 | 152 | — | — | 3,280 | |||||||||||||||
|
|
|
|
|
|
|
|
|
|
|
|||||||||||
| Net interest income |
16,389 | 283 | — | — | 16,672 | |||||||||||||||
| Provision for loan and lease losses |
125 | — | — | — | 125 | |||||||||||||||
| Noninterest income |
760 | 3,905 | — | — | 4,665 | |||||||||||||||
| Noninterest expense |
14,912 | 3,172 | — | — | 18,084 | |||||||||||||||
|
|
|
|
|
|
|
|
|
|
|
|||||||||||
| Net earnings before tax & noncontrolling interest |
2,112 | 1,016 | — | — | 3,128 | |||||||||||||||
| Income tax expense |
685 | 386 | — | — | 1,071 | |||||||||||||||
| Noncontrolling interest |
— | — | — | — | — | |||||||||||||||
|
|
|
|
|
|
|
|
|
|
|
|||||||||||
| Net earnings attributable to National Commerce Corporation |
$ | 1,427 | 630 | — | — | 2,057 | ||||||||||||||
|
|
|
|
|
|
|
|
|
|
|
|||||||||||
| Total assets as of December 31, 2012 |
$ | 679,523 | 13,836 | — | — | 693,359 | ||||||||||||||
|
|
|
|
|
|
|
|
|
|
|
|||||||||||
| (1) | Noninterest income for mortgage division includes intercompany income allocation. |
| (2) | Entry to remove intercompany interest allocated to the receivables factoring segment and other purchase related adjustments. For segment reporting purposes, we allocate a funding cost of Fed Funds plus 2.5% to the factoring segment. |
(18) Goodwill and Intangible Assets
During 2014, the Company recorded goodwill of $23,115,000 associated with the CBI acquisition and $5,719,000 on the United acquisition. In addition to the goodwill recorded for United, the Company recorded a core deposit intangible asset of $1,776,000. The core deposit intangible asset will be amortized using an accelerated method over seven years. At December 31, 2014, the gross amount of recorded core deposit intangibles was $1,776,000 with accumulated amortization of $19,000. The aggregate amount of amortization expense for intangible assets during 2014 was $19,000.
The estimated amortization expense for each of the next five years is as follows:
| 2015 |
$ | 441 | ||
| 2016 |
378 | |||
| 2017 |
314 | |||
| 2018 |
251 | |||
| 2019 |
187 | |||
| Thereafter |
186 | |||
|
|
|
|||
| $ | 1,757 | |||
|
|
|
F-44
Table of Contents
Index to Financial Statements
UNITED GROUP BANKING COMPANY OF FLORIDA, INC. AND SUBSIDIARIES
Unaudited Consolidated Balance Sheets
(In thousands, except per share data)
| September 30, 2014 | December 31, 2013 | |||||||
| (Unaudited) | ||||||||
| Assets | ||||||||
| Cash and due from banks |
$ | 3,984 | $ | 1,908 | ||||
| Interest-bearing deposits with banks |
14,462 | 10,104 | ||||||
|
|
|
|
|
|||||
| Cash and cash equivalents |
18,446 | 12,012 | ||||||
| Investment securities available-for-sale |
41,613 | 42,907 | ||||||
| Other investments |
1,206 | 1,130 | ||||||
| Loans, net of unearned income |
155,908 | 147,265 | ||||||
| Less: allowance for loan losses |
2,337 | 2,243 | ||||||
|
|
|
|
|
|||||
| Loans, net |
153,571 | 145,022 | ||||||
| Premises and equipment, net |
8,326 | 8,452 | ||||||
| Accrued interest receivable |
538 | 562 | ||||||
| Bank owned life insurance |
2,139 | 2,098 | ||||||
| Other real estate |
— | 102 | ||||||
| Other assets |
6,132 | 6,858 | ||||||
|
|
|
|
|
|||||
| Total assets |
$ | 231,971 | $ | 219,143 | ||||
|
|
|
|
|
|||||
| Liabilities and Shareholders’ Equity | ||||||||
| Deposits: |
||||||||
| Noninterest-bearing demand deposits |
$ | 50,684 | $ | 38,542 | ||||
| Interest-bearing demand deposits |
94,993 | 84,837 | ||||||
| Savings deposits |
2,730 | 2,729 | ||||||
| Time |
50,041 | 56,010 | ||||||
|
|
|
|
|
|||||
| Total deposits |
198,448 | 182,118 | ||||||
| Federal Home Loan Bank advances |
4,865 | 4,865 | ||||||
| Short-term borrowings |
— | 5,000 | ||||||
| Accrued interest payable |
25 | 33 | ||||||
| Other liabilities |
315 | 169 | ||||||
|
|
|
|
|
|||||
| Total liabilities |
203,653 | 192,185 | ||||||
|
|
|
|
|
|||||
| Commitments |
||||||||
| Common stock , $.01 par value, 32 million shares authorized, 30,251,341 shares issued and outstanding |
303 | 303 | ||||||
| Additional paid-in capital |
36,372 | 36,290 | ||||||
| Accumulated deficit |
(7,427 | ) | (7,787 | ) | ||||
| Accumulated other comprehensive loss |
(930 | ) | (1,848 | ) | ||||
|
|
|
|
|
|||||
| Total shareholders’ equity |
28,318 | 26,958 | ||||||
|
|
|
|
|
|||||
| Total liabilities and shareholders’ equity |
$ | 231,971 | $ | 219,143 | ||||
|
|
|
|
|
|||||
See accompanying notes to unaudited consolidated financial statements.
F-45
Table of Contents
Index to Financial Statements
UNITED GROUP BANKING COMPANY OF FLORIDA, INC. AND SUBSIDIARIES
Unaudited Consolidated Statements of Operations
(In thousands, except per share data)
| For The Three Months Ended September 30, |
For The Nine Months Ended September 30, |
|||||||||||||||
| 2014 | 2013 | 2014 | 2013 | |||||||||||||
| Interest and dividend income: |
||||||||||||||||
| Interest and fees on loans |
$ | 1,847 | $ | 1,760 | $ | 5,437 | $ | 5,037 | ||||||||
| Interest and dividends on taxable investment securities |
211 | 187 | 684 | 461 | ||||||||||||
| Interest on non-taxable investment securities |
32 | — | 87 | — | ||||||||||||
| Interest on interest-bearing deposits and federal funds sold |
12 | 6 | 34 | 26 | ||||||||||||
|
|
|
|
|
|
|
|
|
|||||||||
| Total interest income |
2,102 | 1,953 | 6,242 | 5,524 | ||||||||||||
| Interest expense: |
||||||||||||||||
| Interest on deposits |
211 | 213 | 661 | 667 | ||||||||||||
| Interest on borrowings |
7 | 1 | 24 | 1 | ||||||||||||
|
|
|
|
|
|
|
|
|
|||||||||
| Total interest expense |
218 | 214 | 685 | 668 | ||||||||||||
| Net interest income |
1,884 | 1,739 | 5,557 | 4,856 | ||||||||||||
| Provision for loan losses |
115 | 80 | 285 | 370 | ||||||||||||
| Net interest income after provision for loan losses |
1,769 | 1,659 | 5,272 | 4,486 | ||||||||||||
| Other income: |
||||||||||||||||
| Service charges and fees on deposit accounts |
60 | 55 | 159 | 160 | ||||||||||||
| Income from bank owned life insurance |
13 | 14 | 41 | 45 | ||||||||||||
| Gain on sale of investment securities available-for-sale |
— | — | 36 | — | ||||||||||||
| Other |
61 | 55 | 194 | 218 | ||||||||||||
|
|
|
|
|
|
|
|
|
|||||||||
| Total other income |
134 | 124 | 430 | 423 | ||||||||||||
|
|
|
|
|
|
|
|
|
|||||||||
| Other expense: |
||||||||||||||||
| Salaries and employee benefits |
841 | 841 | 2,600 | 2,461 | ||||||||||||
| Occupancy and equipment |
271 | 250 | 803 | 756 | ||||||||||||
| Other operating |
554 | 525 | 1,721 | 1,663 | ||||||||||||
|
|
|
|
|
|
|
|
|
|||||||||
| Total other expense |
1,666 | 1,616 | 5,124 | 4,880 | ||||||||||||
|
|
|
|
|
|
|
|
|
|||||||||
| Earnings before income taxes |
237 | 167 | 578 | 29 | ||||||||||||
| Income tax expense |
90 | 71 | 218 | 37 | ||||||||||||
|
|
|
|
|
|
|
|
|
|||||||||
| Net earnings (loss) |
$ | 147 | $ | 96 | $ | 360 | $ | (8 | ) | |||||||
|
|
|
|
|
|
|
|
|
|||||||||
| Basic and diluted net earnings (loss) per common share |
$ | 0.00 | $ | 0.00 | $ | 0.01 | $ | (0.00 | ) | |||||||
|
|
|
|
|
|
|
|
|
|||||||||
See accompanying notes to unaudited consolidated financial statements.
F-46
Table of Contents
Index to Financial Statements
UNITED GROUP BANKING COMPANY OF FLORIDA, INC. AND SUBSIDIARIES
Unaudited Consolidated Statements of Comprehensive Income
(In thousands, except per share data)
| For The Three Months Ended September 30, |
For The Nine Months Ended September 30, |
|||||||||||||||
| 2014 | 2013 | 2014 | 2013 | |||||||||||||
| Net earnings (loss) |
$ | 147 | $ | 96 | $ | 360 | $ | (8 | ) | |||||||
| Other comprehensive (loss) income, net of tax: |
||||||||||||||||
| Unrealized (losses) gains on investment securities available-for-sale: |
||||||||||||||||
| Unrealized (losses) gains arising during the period, net of tax of $99, $154, $565, and $886, respectively |
165 | (255 | ) | 941 | (1,467 | ) | ||||||||||
| Reclassification adjustment for gains included in net earnings, net of tax of $13 during the nine months ended September 30, 2014 |
— | — | (23 | ) | — | |||||||||||
|
|
|
|
|
|
|
|
|
|||||||||
| Other comprehensive (loss) income |
165 | (255 | ) | 918 | (1,467 | ) | ||||||||||
|
|
|
|
|
|
|
|
|
|||||||||
| Comprehensive income / (loss) |
$ | 312 | $ | (159 | ) | $ | 1,278 | $ | (1,475 | ) | ||||||
|
|
|
|
|
|
|
|
|
|||||||||
See accompanying notes to unaudited consolidated financial statements.
F-47
Table of Contents
Index to Financial Statements
UNITED GROUP BANKING COMPANY OF FLORIDA, INC. AND SUBSIDIARIES
Unaudited Consolidated Statements of Changes in Shareholders’ Equity
(In thousands, except per share data)
| Common Stock |
Additional Paid-in Capital |
Accumulated Deficit |
Other Comprehensive (Loss) Income |
Total | ||||||||||||||||
| Balance, December 31, 2013 |
$ | 303 | $ | 36,290 | $ | (7,787 | ) | $ | (1,848 | ) | $ | 26,958 | ||||||||
| Share-based compensation expense |
82 | 82 | ||||||||||||||||||
| Net earnings |
360 | 360 | ||||||||||||||||||
| Change in unrealized gain/loss on securities available-for- sale, net of tax |
— | — | — | 918 | 918 | |||||||||||||||
|
|
|
|
|
|
|
|
|
|
|
|||||||||||
| Balance, September 30, 2014 |
$ | 303 | $ | 36,372 | $ | (7,427 | ) | $ | (930 | ) | $ | 28,318 | ||||||||
|
|
|
|
|
|
|
|
|
|
|
|||||||||||
See accompanying notes to unaudited consolidated financial statements.
F-48
Table of Contents
Index to Financial Statements
UNITED GROUP BANKING COMPANY OF FLORIDA, INC. AND SUBSIDIARIES
Unaudited Consolidated Statements of Cash Flows
(In thousands, except per share data)
| For The Nine Months Ended September 30, |
||||||||
| 2014 | 2013 | |||||||
| Cash flows from operating activities: |
||||||||
| Net earnings (loss) |
$ | 360 | $ | (8 | ) | |||
| Adjustments to reconcile net earnings to net cash provided by operating activities: |
||||||||
| Provision for loan losses |
285 | 370 | ||||||
| Depreciation, amortization and accretion |
251 | 226 | ||||||
| Stock-based compensation |
82 | 82 | ||||||
| Net amortization of securities available for sale |
273 | 542 | ||||||
| Gain on sale of securities available for sale |
(36 | ) | — | |||||
| Loss on sale of foreclosed real estate |
10 | 167 | ||||||
| Write-down of other real estate |
— | 30 | ||||||
| Change in: |
||||||||
| Accrued interest receivable and other assets |
163 | (374 | ) | |||||
| Accrued interest payable and other liabilities |
138 | 112 | ||||||
| Cash surrender value of life insurance |
(41 | ) | (45 | ) | ||||
|
|
|
|
|
|||||
| Net cash provided by operating activities |
1,485 | 1,102 | ||||||
|
|
|
|
|
|||||
| Cash flows from investing activities: |
||||||||
| Change in interest-bearing time deposits in banks |
— | 25 | ||||||
| Purchases of securities available-for-sale |
(4,390 | ) | (5,581 | ) | ||||
| Proceeds from sale of securities available-for-sale |
4,334 | — | ||||||
| Proceeds from calls, maturities and paydowns of securities |
2,583 | 3,476 | ||||||
| (Purchase) redemption of restricted equity securities |
(76 | ) | (120 | ) | ||||
| Proceeds from sale of foreclosed real estate |
92 | 843 | ||||||
| Net increase in loans |
(8,834 | ) | (4,391 | ) | ||||
| Purchases of premises and equipment |
(90 | ) | (256 | ) | ||||
|
|
|
|
|
|||||
| Net cash (used by) provided by investing activities |
(6,381 | ) | (6,004 | ) | ||||
|
|
|
|
|
|||||
| Cash flows from financing activities: |
||||||||
| Net change in demand and savings deposits |
22,299 | 2,394 | ||||||
| Net change in time deposits |
(5,969 | ) | (3,743 | ) | ||||
| Proceeds from Federal Home Loan Bank advances |
— | 3,500 | ||||||
| Proceeds of short-term borrowings |
(5,000 | ) | 4,000 | |||||
| Sale of stock, less offering costs |
— | 334 | ||||||
|
|
|
|
|
|||||
| Net cash provided by (used by) financing activities |
11,330 | 6,485 | ||||||
|
|
|
|
|
|||||
| Net change in cash and cash equivalents |
6,434 | 1,583 | ||||||
| Cash and cash equivalents at beginning of the period |
$ | 12,012 | $ | 16,564 | ||||
|
|
|
|
|
|||||
| Cash and cash equivalents at end of period |
$ | 18,446 | $ | 18,147 | ||||
|
|
|
|
|
|||||
| For The Nine Months Ended September 30, |
||||||||
| 2014 | 2013 | |||||||
| Supplemental disclosure of cash flow information: |
||||||||
| Cash paid during the period for: |
||||||||
| Interest |
$ | 693 | 683 | |||||
| Income taxes |
$ | — | — | |||||
| Non-cash investing and financing activities: |
||||||||
| Transfer of loans to other real estate |
$ | — | 160 | |||||
See accompanying notes to unaudited consolidated financial statements.
F-49
Table of Contents
Index to Financial Statements
UNITED GROUP BANKING COMPANY OF FLORIDA, INC.
Notes to Unaudited Consolidated Financial Statements
(amounts in tables in thousands except per share data)
Note 1 – Basis of Presentation
General
The unaudited consolidated financial statements include the accounts of United Group Banking Company of Florida, Inc. (the “Company”) and its wholly owned subsidiaries, United Legacy Bank (the “Bank”) and RBCF Holdings, Inc. (“RBCF”). The Bank provides a full range of commercial and consumer banking services throughout Central Florida. The Bank is primarily regulated by the Federal Reserve (“Fed”) and the Office of Financial Regulation (“OFR”), and undergoes periodic examinations by these regulatory agencies. The Company is regulated by the Federal Reserve and is also subject to periodic examinations. RBCF was formed to hold and manage some non-performing loans acquired by the Bank.
In the opinion of management, the accompanying unaudited consolidated financial statements contain all adjustments necessary to present fairly United Group Banking Company of Florida’s consolidated balance sheets, and statements of income, comprehensive income, changes in shareholders’ equity and cash flows for the periods presented, and all such adjustments are of a normal recurring nature. All material intercompany transactions are eliminated. The results of operations for the interim periods are not necessarily indicative of the results to be expected for the entire year.
These interim consolidated financial statements have been prepared according to the rules and regulations of the Securities and Exchange Commission and, therefore, certain information and footnote disclosures normally presented in accordance with generally accepted accounting principles in the United States of America (“GAAP”) have been omitted or abbreviated. These financial statements should be read in conjunction with the Company’s audited consolidated financial statements and footnotes contained elsewhere in this prospectus.
Preparation of financial statements in conformity with GAAP requires management to make estimates and assumptions that affect the amounts reported in the consolidated financial statements and accompanying disclosures. These estimates are based on management’s best knowledge of current events and actions the Company may undertake in the future. Estimates are used in accounting for, among other items, the allowance for loan losses, useful lives for depreciation and amortization, fair value of financial instruments, deferred tax assets, and contingencies. Estimates that are particularly susceptible to significant change for the Company include the determination of the allowance for loan losses and the assessment of deferred tax assets and liabilities, and therefore are critical accounting policies. Management does not anticipate any material changes to estimates in the near term. Factors that may cause sensitivity to the aforementioned estimates include but are not limited to: external market factors such as market interest rates and employment rates, changes to operating policies and procedures, and changes in applicable banking regulations and economic conditions. Actual results may ultimately differ from estimates, although management does not generally believe such differences would materially affect the consolidated financial statements in any individual reporting period presented.
Note 2 – Reclassifications
Certain prior period amounts have been reclassified to conform to the presentation used in 2014. These reclassifications had no material effect on the operations, financial condition or cash flows of the Company.
Note 3 – Net Earnings per Common Share
Basic earnings per common share are computed by dividing net income by the weighted-average number of shares of common stock outstanding during the period. Diluted earnings per common share are computed by dividing net income by the effect of the issuance of potential common shares that are dilutive and by the sum of the weighted-average number of shares of common stock outstanding. Anti-dilutive potential common shares are excluded from the diluted earnings per share computation and totaled 1,775,000 for the three and nine months ended September 30, 2013 and 2014. Since all of the Company’s potential common shares are anti-dilutive, basic and diluted shares outstanding are the same.
F-50
Table of Contents
Index to Financial Statements
UNITED GROUP BANKING COMPANY OF FLORIDA, INC.
Notes to Unaudited Consolidated Financial Statements (Continued)
(amounts in tables in thousands except per share data)
Note 3 – Net Earnings per Common Share (Continued)
The reconciliation of the components of the basic and diluted earnings per share is as follows:
| For The Three Months Ended September 30, |
For The Nine Months Ended September 30, |
|||||||||||||||
| 2014 | 2013 | 2014 | 2013 | |||||||||||||
| Net earnings (loss) available to common shareholders |
$ | 147 | 96 | $ | 360 | (8 | ) | |||||||||
|
|
|
|
|
|
|
|
|
|||||||||
| Weighted average common shares outstanding |
30,251,341 | 30,251,341 | 30,251,341 | 30,178,790 | ||||||||||||
| Dilutive effect of stock options |
— | — | — | — | ||||||||||||
|
|
|
|
|
|
|
|
|
|||||||||
| Diluted common shares |
30,251,341 | 30,251,341 | 30,251,341 | 30,178,790 | ||||||||||||
|
|
|
|
|
|
|
|
|
|||||||||
| Basic and diluted earnings (loss) per common share |
$ | 0.00 | $ | 0.00 | $ | 0.01 | $ | (0.00 | ) | |||||||
Note 4 – Investment Securities
Investment securities available-for-sale at September 30, 2014 and December 31, 2013 are as follows:
| September 30, 2014 |
Amortized Cost |
Gross Unrealized Gains |
Gross Unrealized Losses |
Estimated Fair Value |
||||||||||||
| Mortgage-backed securities |
$ | 39,537 | $ | — | $ | (1,681 | ) | $ | 37,856 | |||||||
| Municipal securities |
3,568 | 189 | — | 3,757 | ||||||||||||
|
|
|
|
|
|
|
|
|
|||||||||
| $ | 43,105 | $ | 189 | $ | (1,681 | ) | $ | 41,613 | ||||||||
|
|
|
|
|
|
|
|
|
|||||||||
| December 31, 2013 |
Amortized Cost |
Gross Unrealized Gains |
Gross Unrealized Losses |
Estimated Fair Value |
||||||||||||
| Mortgage-backed securities |
$ | 43,965 | $ | 13 | $ | 2,961 | $ | 41,017 | ||||||||
| Municipal securities |
1,905 | 5 | 21 | 1,890 | ||||||||||||
|
|
|
|
|
|
|
|
|
|||||||||
| $ | 45,870 | $ | 18 | $ | 2,982 | $ | 42,907 | |||||||||
|
|
|
|
|
|
|
|
|
|||||||||
Management evaluates securities for other-than-temporary impairment on a quarterly basis, and more frequently when economic or market concerns warrant such evaluation. Consideration is given to (1) the length of time and the extent to which the fair value has been less than cost, (2) the financial condition and near-term prospects of the issuer and (3) the intent and ability of the Company to retain its investment in the issuer for a period of time sufficient to allow for any anticipated recovery in fair value.
Details concerning investment securities with unrealized losses as of September 30, 2014 and December 31, 2013 are as follows:
| September 30, 2014 | ||||||||||||||||||||||||
| Less than 12 Months | 12 Months or More | Total | ||||||||||||||||||||||
| Fair Value |
Unrealized Losses |
Fair Value |
Unrealized Losses |
Fair Value |
Unrealized Losses |
|||||||||||||||||||
| Mortgage-backed securities |
$ | 2,452 | $ | 14 | $ | 35,404 | $ | 1,667 | $ | 37,856 | $ | 1,681 | ||||||||||||
| Municipal securities |
— | — | — | — | — | — | ||||||||||||||||||
|
|
|
|
|
|
|
|
|
|
|
|
|
|||||||||||||
| $ | 2,452 | $ | 14 | $ | 35,404 | $ | 1,667 | $ | 37,856 | $ | 1,681 | |||||||||||||
F-51
Table of Contents
Index to Financial Statements
UNITED GROUP BANKING COMPANY OF FLORIDA, INC.
Notes to Unaudited Consolidated Financial Statements (Continued)
(amounts in tables in thousands except per share data)
Note 4 – Investment Securities (Continued)
| December 31, 2013 | ||||||||||||||||||||||||
| Less than 12 Months | 12 Months or More | Total | ||||||||||||||||||||||
| Fair Value |
Unrealized Losses |
Fair Value |
Unrealized Losses |
Fair Value |
Unrealized Losses |
|||||||||||||||||||
| Mortgage-backed securities |
$ | 4,171 | $ | 192 | $ | 32,473 | $ | 2,770 | $ | 36,644 | $ | 2,962 | ||||||||||||
| Municipal securities |
1,372 | 21 | — | — | 1,372 | 21 | ||||||||||||||||||
|
|
|
|
|
|
|
|
|
|
|
|
|
|||||||||||||
| $ | 5,543 | $ | 213 | $ | 32,473 | $ | 2,770 | $ | 38,016 | $ | 2,983 | |||||||||||||
As of September 30, 2014 the Company does not consider securities with unrealized losses to be other-than-temporarily impaired. The unrealized losses in each category have occurred as a result of changes in interest rates, market spreads and market conditions subsequent to purchase. The Company has the ability and intent to hold its securities for a period of time sufficient to allow for a recovery in fair value. There were no other-than-temporary impairments charged to earnings during the three and nine month periods ending September 30, 2014 and 2013.
During the nine months ended September 30, 2014, the Company sold investment securities for proceeds of $4,334,300 and realized gross gains of $36,000. During the nine months ended September 30, 2013, there were no sales of investment securities.
The amortized cost and estimated fair value of securities available-for-sale at September 30, 2014, by contractual maturity, are shown below. Expected maturities will differ from contractual maturities because borrowers have the right to call or prepay obligations with or without call or prepayment penalties.
| September 30, 2014 |
Amortized Cost |
Fair Value |
||||||
| Municipal securities: |
||||||||
| 0 to 5 years |
$ | — | $ | — | ||||
| 5 to 10 years |
— | — | ||||||
| Over 10 years |
3,568 | 3,757 | ||||||
| Mortgage-backed securities |
39,537 | 37,856 | ||||||
|
|
|
|
|
|||||
| $ | 43,105 | $ | 41,613 | |||||
|
|
|
|
|
|||||
Note 5 – Loans, Allowance for Loan Losses and Credit Quality
Major classifications of loans at September 30, 2014 and December 31, 2013 are summarized as follows:
| September 30, 2014 |
December 31, 2013 |
|||||||
| Real estate – |
$ | 80,714 | $ | 75,523 | ||||
| Residential |
36,570 | 36,192 | ||||||
| Construction, development, land |
7,587 | 9,548 | ||||||
| Commercial |
24,286 | 18,416 | ||||||
| Consumer and other |
6,799 | 7,581 | ||||||
|
|
|
|
|
|||||
| 155,956 | 147,260 | |||||||
| Deferred loan costs |
(48 | ) | 5 | |||||
| Allowance for loan losses |
(2,337 | ) | (2,243 | ) | ||||
|
|
|
|
|
|||||
| $ | 153,571 | $ | 145,022 | |||||
|
|
|
|
|
|||||
F-52
Table of Contents
Index to Financial Statements
UNITED GROUP BANKING COMPANY OF FLORIDA, INC.
Notes to Unaudited Consolidated Financial Statements (Continued)
(amounts in tables in thousands except per share data)
Note 5 – Loans, Allowance for Loan Losses and Credit Quality (Continued)
The Bank grants loans and extensions of credit to individuals and a variety of businesses and corporations located in its general trade areas throughout Central Florida. Although the Bank has a diversified loan portfolio, a substantial portion of the loan portfolio is collateralized by improved and unimproved real estate and is dependent upon the real estate market. Portfolio segments utilized by the Bank are identified below. Relevant risk characteristics for these portfolio segments generally include debt service coverage, loan-to-value ratios and financial performance on non-consumer loans and credit scores, debt-to-income, collateral type and loan-to-value ratios for consumer loans.
The following tables present the balance in the allowance for loan losses and the recorded investment in loans by portfolio segment and based on impairment method for the periods indicated:
| September 30, 2014 |
December 31, 2013 |
|||||||
| Balance, beginning of period |
$ | 2,243 | $ | 2,286 | ||||
|
|
|
|
|
|||||
| Charge-offs: |
||||||||
| Real estate – commercial |
-0- | -0- | ||||||
| Real estate – residential |
(40 | ) | (190 | ) | ||||
| Real estate – construction, development, land |
-0- | -0- | ||||||
| Commercial |
-0- | (152 | ) | |||||
| Consumer and other |
(170 | ) | (227 | ) | ||||
|
|
|
|
|
|||||
| Total charge offs |
(210 | ) | (569 | ) | ||||
|
|
|
|
|
|||||
| Recoveries: |
||||||||
| Real estate – commercial |
-0- | -0- | ||||||
| Real estate – residential |
19 | 47 | ||||||
| Real estate – construction, development, land |
-0- | -0- | ||||||
| Commercial |
-0- | -0- | ||||||
| Consumer and other |
-0- | -0- | ||||||
|
|
|
|
|
|||||
| Total recoveries |
19 | 47 | ||||||
|
|
|
|
|
|||||
| Net charge-offs |
(191 | ) | (522 | ) | ||||
|
|
|
|
|
|||||
| Provision charged to operations |
285 | 479 | ||||||
|
|
|
|
|
|||||
| Balance, end of period |
$ | 2,337 | $ | 2,243 | ||||
|
|
|
|
|
|||||
F-53
Table of Contents
Index to Financial Statements
UNITED GROUP BANKING COMPANY OF FLORIDA, INC.
Notes to Unaudited Consolidated Financial Statements (Continued)
(amounts in tables in thousands except per share data)
Note 5 – Loans, Allowance for Loan Losses and Credit Quality (Continued)
| Real Estate – Commercial |
Real Estate – Residential |
Real Estate – Construction Development Land |
Commercial | Consumer and Other |
Total | |||||||||||||||||||
| September 30, 2014 |
||||||||||||||||||||||||
| Individually evaluated for impairment |
$ | 91 | $ | 311 | $ | -0- | $ | -0- | $ | -0- | $ | 402 | ||||||||||||
| Collectively evaluated for impairment |
1,118 | 237 | 114 | 364 | 102 | 1,935 | ||||||||||||||||||
|
|
|
|
|
|
|
|
|
|
|
|
|
|||||||||||||
| $ | 1,209 | $ | 548 | $ | 114 | $ | 364 | $ | 102 | $ | 2,337 | |||||||||||||
|
|
|
|
|
|
|
|
|
|
|
|
|
|||||||||||||
| September 30, 2014 |
||||||||||||||||||||||||
| Individually evaluated for impairment |
$ | 1,894 | $ | 2,789 | $ | 648 | $ | 151 | $ | 194 | $ | 5,676 | ||||||||||||
| Collectively evaluated for impairment |
78,820 | 33,781 | 6,939 | 24,135 | 6,605 | 150,280 | ||||||||||||||||||
|
|
|
|
|
|
|
|
|
|
|
|
|
|||||||||||||
| $ | 80,714 | $ | 36,570 | $ | 7,587 | $ | 24,286 | $ | 6,799 | $ | 155,956 | |||||||||||||
|
|
|
|
|
|
|
|
|
|
|
|
|
|||||||||||||
| Real Estate – Commercial |
Real Estate – Residential |
Real Estate – Construction Development Land |
Commercial | Consumer and Other |
Total | |||||||||||||||||||
| December 31, 2013 – |
||||||||||||||||||||||||
| Individually evaluated for impairment |
$ | 91 | $ | 281 | $ | -0- | $ | -0- | $ | -0- | $ | 372 | ||||||||||||
| Collectively evaluated for impairment |
822 | 400 | 94 | 300 | 255 | 1,871 | ||||||||||||||||||
|
|
|
|
|
|
|
|
|
|
|
|
|
|||||||||||||
| $ | 913 | $ | 681 | $ | 94 | $ | 300 | $ | 255 | $ | 2,243 | |||||||||||||
|
|
|
|
|
|
|
|
|
|
|
|
|
|||||||||||||
| December 31, 2013 – |
||||||||||||||||||||||||
| Individually evaluated for impairment |
$ | 1,924 | $ | 2,234 | $ | 1,169 | $ | 151 | $ | 104 | $ | 5,582 | ||||||||||||
| Collectively evaluated for impairment |
73,599 | 33,958 | 8,379 | 18,265 | 7,477 | 141,678 | ||||||||||||||||||
|
|
|
|
|
|
|
|
|
|
|
|
|
|||||||||||||
| $ | 75,523 | $ | 36,192 | $ | 9,548 | $ | 18,416 | $ | 7,581 | $ | 147,260 | |||||||||||||
|
|
|
|
|
|
|
|
|
|
|
|
|
|||||||||||||
The Bank individually evaluates for impairment all loans that are on nonaccrual status. Additionally, all troubled debt restructurings are individually evaluated for impairment. A loan is considered impaired when, based on current events and circumstances it is probable that all amounts due according to the contractual terms of the loan will not be collected. Impaired loans are measured based on the present value of expected future cash flows discounted at the loan’s effective interest rate, at the loan’s observable market price, or the fair value of the collateral if the loan is collateral dependent. Interest payments received on impaired loans are generally applied as a reduction of the outstanding principal balance. During 2013 and the nine months ended September 30, 2014, the Bank did not modify any loans that would be considered a troubled debt restructuring.
F-54
Table of Contents
Index to Financial Statements
UNITED GROUP BANKING COMPANY OF FLORIDA, INC.
Notes to Unaudited Consolidated Financial Statements (Continued)
(amounts in tables in thousands except per share data)
Note 5 – Loans, Allowance for Loan Losses and Credit Quality (Continued)
The following tables present impaired loans by class of loans as of September 30, 2014 and December 31, 2013.
| Recorded Investment |
Unpaid Principal Balance |
Specific Allowance |
Average Recorded Investment |
Interest Income Recognized |
||||||||||||||||
| September 30, 2014 |
||||||||||||||||||||
| Real estate – commercial |
$ | 1,647 | $ | 1,647 | $ | -0- | $ | 727 | $ | 38 | ||||||||||
| Real estate – residential |
1,510 | 1,509 | 1,397 | 11 | ||||||||||||||||
| Real estate – construction, development, land |
648 | 648 | -0- | 826 | 23 | |||||||||||||||
| Commercial |
151 | 151 | -0- | 147 | 3 | |||||||||||||||
| Consumer and other |
194 | 260 | -0- | 99 | 6 | |||||||||||||||
|
|
|
|
|
|
|
|
|
|
|
|||||||||||
| $ | 4,150 | $ | 4,215 | $ | -0- | $ | 3,196 | $ | 81 | |||||||||||
|
|
|
|
|
|
|
|
|
|
|
|||||||||||
| September 30, 2014 |
||||||||||||||||||||
| Real estate – commercial |
$ | 247 | $ | 247 | $ | 91 | $ | 246 | $ | 4 | ||||||||||
| Real estate – residential |
1,279 | 1,313 | 311 | 1,199 | 2 | |||||||||||||||
| Real estate – construction, development, land |
-0- | -0- | -0- | -0- | -0- | |||||||||||||||
| Commercial |
-0- | -0- | -0- | -0- | -0- | |||||||||||||||
| Consumer and other |
-0- | -0- | -0- | -0- | -0- | |||||||||||||||
|
|
|
|
|
|
|
|
|
|
|
|||||||||||
| $ | 1,526 | $ | 1,560 | $ | 402 | $ | 1,445 | $ | 6 | |||||||||||
|
|
|
|
|
|
|
|
|
|
|
|||||||||||
| Totals, September 30, 2014 |
$ | 5,676 | $ | 5,775 | $ | 402 | $ | 4,641 | $ | 87 | ||||||||||
|
|
|
|
|
|
|
|
|
|
|
|||||||||||
| Recorded Investment |
Unpaid Principal Balance |
Specific Allowance |
Average Recorded Investment |
Interest Income Recognized |
||||||||||||||||
| December 31, 2013 – |
||||||||||||||||||||
| Real estate – commercial |
$ | 1,682 | $ | 1,682 | $ | -0- | $ | 1,708 | $ | 24 | ||||||||||
| Real estate – residential |
1,799 | 1,989 | -0- | 2,007 | 8 | |||||||||||||||
| Real estate – construction, development, land |
1,169 | 1,169 | -0- | 1,212 | 22 | |||||||||||||||
| Commercial |
151 | 303 | -0- | 214 | 8 | |||||||||||||||
| Consumer and other |
104 | 328 | -0- | 166 | 15 | |||||||||||||||
|
|
|
|
|
|
|
|
|
|
|
|||||||||||
| $ | 4,905 | $ | 5,471 | $ | -0- | $ | 5,307 | $ | 77 | |||||||||||
|
|
|
|
|
|
|
|
|
|
|
|||||||||||
| December 31, 2013 – |
||||||||||||||||||||
| Real estate – commercial |
$ | 242 | $ | 242 | $ | 91 | $ | 242 | $ | -0- | ||||||||||
| Real estate – residential |
435 | 469 | 281 | 237 | -0- | |||||||||||||||
| Real estate – construction, development, land |
-0- | -0- | -0- | -0- | -0- | |||||||||||||||
| Commercial |
-0- | -0- | -0- | -0- | -0- | |||||||||||||||
| Consumer and other |
-0- | -0- | -0- | -0- | -0- | |||||||||||||||
|
|
|
|
|
|
|
|
|
|
|
|||||||||||
| $ | 677 | $ | 711 | $ | 372 | $ | 479 | $ | -0- | |||||||||||
|
|
|
|
|
|
|
|
|
|
|
|||||||||||
| Totals, December 31, 2013 |
$ | 5,582 | $ | 6,182 | $ | 372 | $ | 5,786 | $ | 77 | ||||||||||
|
|
|
|
|
|
|
|
|
|
|
|||||||||||
F-55
Table of Contents
Index to Financial Statements
UNITED GROUP BANKING COMPANY OF FLORIDA, INC.
Notes to Unaudited Consolidated Financial Statements (Continued)
(amounts in tables in thousands except per share data)
Note 5 – Loans, Allowance for Loan Losses and Credit Quality (Continued)
The following tables present the aging of the recorded investment in past due loans and non-accrual loan balances as of September 30, 2014 and December 31, 2013 by class of loans.
| 30-89 Days Past Due |
Greater Than 90 Days |
Total Past Due |
Current Loans |
Total Loans | Loans > 90 Days and Accruing |
|||||||||||||||||||
| September 30, 2014 – |
||||||||||||||||||||||||
| Real estate – commercial |
$ | -0- | $ | 247 | $ | 247 | $ | 80,467 | $ | 80,714 | $ | -0- | ||||||||||||
| Real estate – residential |
170 | 871 | 1,041 | 35,529 | 36,570 | -0- | ||||||||||||||||||
| Real estate – construction, development, land |
63 | -0- | 63 | 7,524 | 7,587 | -0- | ||||||||||||||||||
| Commercial |
14 | 151 | 165 | 24,121 | 24,286 | -0- | ||||||||||||||||||
| Consumer and other |
254 | 120 | 374 | 6,425 | 6,799 | -0- | ||||||||||||||||||
|
|
|
|
|
|
|
|
|
|
|
|
|
|||||||||||||
| $ | 501 | $ | 1,389 | $ | 1,890 | $ | 154,066 | $ | 155,956 | $ | -0- | |||||||||||||
|
|
|
|
|
|
|
|
|
|
|
|
|
|||||||||||||
| 30-89 Days Past Due |
Greater Than 90 Days |
Total Past Due |
Current Loans |
Total Loans | Loans > 90 Days and Accruing |
|||||||||||||||||||
| December 31, 2013 – |
||||||||||||||||||||||||
| Real estate – commercial |
$ | 294 | $ | 882 | $ | 1,176 | $ | 74,347 | $ | 75,523 | $ | -0- | ||||||||||||
| Real estate – residential |
258 | 1,790 | 2,048 | 34,144 | 36,192 | 445 | ||||||||||||||||||
| Real estate – construction, development, land |
139 | 1,169 | 1,308 | 8,240 | 9,548 | -0- | ||||||||||||||||||
| Commercial |
129 | -0- | 129 | 18,287 | 18,416 | -0- | ||||||||||||||||||
| Consumer and other |
154 | 111 | 265 | 7,316 | 7,581 | 78 | ||||||||||||||||||
|
|
|
|
|
|
|
|
|
|
|
|
|
|||||||||||||
| $ | 974 | $ | 3,952 | $ | 4,926 | $ | 142,334 | $ | 147,260 | $ | 523 | |||||||||||||
|
|
|
|
|
|
|
|
|
|
|
|
|
|||||||||||||
Composition of non-accrual loans disaggregated by class
| September 30, 2014 |
December 31, 2013 |
|||||||
| Real estate – commercial |
$ | 1,098 | $ | 882 | ||||
| Real estate – residential |
2,642 | 2,088 | ||||||
| Real estate – construction, development, land |
648 | 1,169 | ||||||
| Commercial |
151 | -0- | ||||||
| Consumer and other |
194 | 104 | ||||||
|
|
|
|
|
|||||
| $ | 4,733 | $ | 4,243 | |||||
|
|
|
|
|
|||||
The Bank categorizes loans into risk categories based on relevant information about the ability of borrowers to service their debt such as: current financial information, historical payment experience, credit documentation, public information, current economic trends, among other factors. The Bank analyzes loans individually by classifying the loans as to credit risk. This analysis is performed on a continuous basis. The Bank uses the following definitions for its risk ratings:
Special Mention. Weakness exists that could cause future impairment, including the deterioration of financial ratios, past due status and questionable management capabilities. Collateral values generally afford adequate coverage but may not be immediately marketable.
F-56
Table of Contents
Index to Financial Statements
UNITED GROUP BANKING COMPANY OF FLORIDA, INC.
Notes to Unaudited Consolidated Financial Statements (Continued)
(amounts in tables in thousands except per share data)
Note 5 – Loans, Allowance for Loan Losses and Credit Quality (Continued)
Composition of non-accrual loans disaggregated by class (Continued)
Substandard. Specific and well-defined weaknesses exist that may include poor liquidity and deterioration of financial ratios. The loan may be past due and related deposit accounts experiencing overdrafts. Immediate corrective action is necessary.
Doubtful. Specific weaknesses characterized as Substandard that are severe enough to make collection in full unlikely. There is no reliable secondary source of full repayment. Loans classified as doubtful will be placed on non-accrual, analyzed and fully or partially charged-off based on review of collateral and other relevant factors.
Loans not meeting the criteria above that are analyzed individually as part of the above described process are considered to be pass rated loans. As of September 30, 2014 and December 31, 2013, and based on the most recent analysis performed, the risk category of loans by class of loans is as follows:
Credit Exposure Based on Risk Ratings:
| Pass | Special Mention |
Substandard | Doubtful | |||||||||||||
| September 30, 2014 – |
||||||||||||||||
| Real estate – commercial |
$ | 78,977 | $ | 1,490 | $ | 247 | $ | -0- | ||||||||
| Real estate – residential |
33,794 | 134 | 2,642 | -0- | ||||||||||||
| Real estate – construction, development, land |
6,629 | 310 | 648 | -0- | ||||||||||||
| Commercial |
24,135 | -0- | 151 | -0- | ||||||||||||
| Consumer and other |
6,418 | 187 | 194 | -0- | ||||||||||||
|
|
|
|
|
|
|
|
|
|||||||||
| $ | 149,953 | $ | 2,121 | $ | 3,882 | $ | -0- | |||||||||
|
|
|
|
|
|
|
|
|
|||||||||
| Pass | Special Mention |
Substandard | Doubtful | |||||||||||||
| December 31, 2013 – |
||||||||||||||||
| Real estate – commercial |
$ | 72,355 | $ | 2,926 | $ | 242 | $ | -0- | ||||||||
| Real estate – residential |
33,882 | 222 | 2,088 | -0- | ||||||||||||
| Real estate – construction, development, land |
8,205 | 174 | 1,169 | -0- | ||||||||||||
| Commercial |
18,263 | 2 | 151 | -0- | ||||||||||||
| Consumer and other |
7,373 | 104 | 104 | -0- | ||||||||||||
|
|
|
|
|
|
|
|
|
|||||||||
| $ | 140,078 | $ | 3,428 | $ | 3,754 | $ | -0- | |||||||||
|
|
|
|
|
|
|
|
|
|||||||||
Note 6 – Fair Value Measurements and Disclosures
The Company utilizes fair value measurements to record fair value adjustments to certain assets and liabilities and to determine fair value disclosures. Securities available-for-sale are recorded at fair value on a recurring basis. Additionally, from time to time, the Company may be required to record at fair value other assets on a nonrecurring basis, such as impaired loans and other real estate and repossessed assets. These nonrecurring fair value adjustments typically involve application of the lower of cost or market accounting or write-downs of individual assets.
F-57
Table of Contents
Index to Financial Statements
UNITED GROUP BANKING COMPANY OF FLORIDA, INC.
Notes to Unaudited Consolidated Financial Statements (Continued)
(amounts in tables in thousands except per share data)
Note 6 – Fair Value Measurements and Disclosures (Continued)
Fair Value Hierarchy
The Company groups assets and liabilities at fair value in three levels, based on the markets in which the assets and liabilities are traded and the reliability of the assumptions used to determine fair value. These levels are:
Level 1 – Valuation is based upon quoted prices for identical instruments traded in active markets.
Level 2 – Valuation is based upon quoted prices for similar instruments in active markets, quoted prices for identical or similar instruments in markets that are not active, and model-based valuation techniques for which all significant assumptions are observable in the market.
Level 3 – Valuation is generated from model-based techniques that use at least one significant assumption not observable in the market. These unobservable assumptions reflect estimates of assumptions that market participants would use in pricing the asset or liability. Valuation techniques include use of option pricing models, discounted cash flow models and similar techniques.
Following is a description of valuation methodologies used for assets and liabilities recorded or disclosed at fair value.
Cash and Cash Equivalents
For disclosure purposes, for cash, due from banks, and interest-bearing deposits, the carrying amount is a reasonable estimate of fair value.
Securities Available-for-Sale
Securities available-for-sale are recorded at fair value on a recurring basis. Fair value measurement is based upon quoted prices, if available. If quoted prices are not available, fair values are measured using independent pricing models or other model-based valuation techniques such as the present value of future cash flows, adjusted for the security’s credit rating, prepayment assumptions and other factors such as credit loss assumptions.
Other Investments
For disclosure purposes, the carrying amount of other investments approximates their fair value.
Loans
The Company does not record loans at fair value on a recurring basis. However, from time to time, a loan is considered impaired and an allowance for loan losses is established. Loans for which it is probable that payment of interest and principal will not be made in accordance with the contractual terms of the loan agreement are considered impaired. Once a loan is identified as individually impaired, management measures impairment using one of three methods, including collateral value, market value of similar debt, and discounted cash flows. Those impaired loans not requiring an allowance represent loans for which the fair value of the expected repayments or collateral exceed the recorded investments in such loans. At September 30, 2014 and December 31, 2013, impaired loans were evaluated based on the fair value of the collateral. Impaired loans where an allowance is established based on the fair value of collateral, or loans that are charged down according to the fair value of collateral, require classification in the fair value hierarchy. Since the fair value is based generally on appraised values, the Company records impaired loans as nonrecurring Level 3.
For disclosure purposes, the fair value of fixed rate loans is estimated by discounting the future cash flows using the current rates at which similar loans would be made to borrowers with similar credit ratings. For variable rate loans, the carrying amount is a reasonable estimate of fair value.
F-58
Table of Contents
Index to Financial Statements
UNITED GROUP BANKING COMPANY OF FLORIDA, INC.
Notes to Unaudited Consolidated Financial Statements (Continued)
(amounts in tables in thousands except per share data)
Note 6 – Fair Value Measurements and Disclosures (Continued)
Bank Owned Life Insurance
For disclosure purposes, the fair value of the cash surrender value of life insurance policies is equivalent to the carrying value.
Other Real Estate
Other real estate properties are adjusted to fair value upon transfer of the loans to other real estate. Subsequently, other real estate assets are carried at the lower of carrying value or fair value. Fair value is based upon independent market prices, appraised values of the collateral or management’s estimation of the value of the collateral. Since fair value is based on an appraised value or management’s estimate of value, the Company records other real estate or repossessed assets as nonrecurring Level 3.
Deposits
For disclosure purposes, the fair value of demand deposits, NOW and money market accounts, and savings accounts is the amount payable on demand at the reporting date. The fair value of fixed rate maturity certificates of deposit is estimated by discounting the future cash flows using the rates currently offered for deposits of similar remaining maturities.
Federal Home Loan Bank Advances
For disclosure purposes, the fair value of the Federal Home Loan Bank Advances is based on the quoted value for similar remaining maturities provided by the FHLB.
Commitments to Extend Credit and Standby Letters of Credit
Because commitments to extend credit and standby letters of credit are generally short-term and made using variable rates, the carrying value and estimated fair value associated with these instruments are immaterial.
Assets and Liabilities Recorded at Fair Value on a Recurring Basis
The table below presents the recorded amount of assets measured at fair value on a recurring basis as of September 30, 2014 and December 31, 2013.
| September 30, 2014 |
Total carrying value in the consolidated statements of financial condition |
Quoted market prices in an active market (Level 1) |
Internal models with significant observable market parameters (Level 2) |
Internal models with significant unobservable market parameters (Level 3) |
||||||||||||
| Available-for-sale securities |
$ | 41,613 | $ | 0 | $ | 41,613 | $ | 0 | ||||||||
| Cash surrender value of life insurance |
2,139 | 0 | 2,139 | 0 | ||||||||||||
| December 31, 2013 |
||||||||||||||||
| Available-for-sale securities |
$ | 42,907 | 0 | 42,907 | 0 | |||||||||||
| Cash surrender value of life insurance |
2,098 | 0 | 2,098 | 0 | ||||||||||||
F-59
Table of Contents
Index to Financial Statements
UNITED GROUP BANKING COMPANY OF FLORIDA, INC.
Notes to Unaudited Consolidated Financial Statements (Continued)
(amounts in tables in thousands except per share data)
Note 6 – Fair Value Measurements and Disclosures (Continued)
Assets and Liabilities Recorded at Fair Value on a Nonrecurring Basis
The Company may be required, from time to time, to measure certain assets and liabilities at fair value on a nonrecurring basis in accordance with GAAP. These include assets that are measured at the lower of cost or market that were recognized at fair value below cost at the end of the period. Assets measured at fair value on a nonrecurring basis are included in the table below as of September 30, 2014 and December 31, 2013.
| September 30, 2014 |
Total carrying value in the consolidated statements of financial condition |
Quoted market prices in an active market (Level 1) |
Internal models with significant observable market parameters (Level 2) |
Internal models with significant unobservable market parameters (Level 3) |
||||||||||||
| Impaired loans, net of specific reserves |
$ | 5,274 | $ | 0 | $ | 0 | $ | 5,274 | ||||||||
| December 31, 2013 |
||||||||||||||||
| Impaired loans, net of specific reserves |
$ | 5,210 | 0 | 0 | 5,210 | |||||||||||
| Other real estate |
102 | 0 | 0 | 102 | ||||||||||||
The carrying amounts and estimated fair values of the Company’s financial instruments at September 30, 2014 and December 31, 2013 were as follows:
| September 30, 2014 | December 31, 2013 | |||||||||||||||
| Carrying amount |
Fair Value |
Carrying amount |
Fair Value |
|||||||||||||
| Financial assets: |
||||||||||||||||
| Cash and cash equivalents |
$ | 18,446 | 18,446 | $ | 12,012 | 12,012 | ||||||||||
| Securities available for sale |
41,613 | 41,613 | 42,907 | 42,907 | ||||||||||||
| Loans receivable |
153,571 | 153,692 | 145,022 | 145,428 | ||||||||||||
| Accrued interest receivable |
538 | 538 | 562 | 562 | ||||||||||||
| Financial liabilities: |
||||||||||||||||
| Deposits |
198,448 | 198,562 | 182,118 | 182,457 | ||||||||||||
| FHLB advance and debt |
4,865 | 4,865 | 9,865 | 9,865 | ||||||||||||
| Accrued interest payable |
25 | 25 | 33 | 33 | ||||||||||||
Limitations
Fair value estimates are made at a specific point in time, based on relevant market information and information about the financial instrument. These estimates do not reflect any premium or discount that could result from offering for sale at one time the Company’s entire holdings of a particular financial instrument. Because no market exists for a significant portion of the Company’s financial instruments, fair value estimates are based on many judgments. These estimates are subjective in nature and involve uncertainties and matters of significant judgment and therefore cannot be determined with precision. Changes in assumptions could significantly affect the estimates.
Fair value estimates are based on existing on- and off-balance sheet financial instruments without attempting to estimate the value of anticipated future business and the value of assets and liabilities that are not considered financial instruments. Significant assets and liabilities that are not considered financial instruments include deferred income taxes and premises and equipment. In addition, the tax ramifications related to the realization of the unrealized gains and losses can have a significant effect on fair value estimates and have not been considered in the estimates.
F-60
Table of Contents
Index to Financial Statements
UNITED GROUP BANKING COMPANY OF FLORIDA, INC.
Notes to Unaudited Consolidated Financial Statements (Continued)
(amounts in tables in thousands except per share data)
Note 7 – Recently Issued Accounting Pronouncements
In July 2013, the Financial Accounting Standards Board (“FASB”) issued ASU No. 2013-10, Derivatives and Hedging (Topic 815): Inclusion of the Fed Funds Effective Swap Rate (or Overnight Index Swap Rate) as a Benchmark Interest Rate for Hedge Accounting Purposes, which permits the Fed Funds Effective Swap Rate to be used as a U.S. benchmark interest rate for hedge accounting purposes, in addition to the U.S. Treasury and London Interbank Offered Rate. The ASU also amends previous rules by removing the restriction on using different benchmark rates for similar hedges. This amendment applies to all entities that elect to apply hedge accounting of the benchmark interest rate. The amendments in this ASU were effective for qualifying new or redesignated hedging relationships entered into on or after July 17, 2013. The Company has adopted this update, although such adoption had no impact on its financial position or results of operations.
In July 2013, the FASB issued ASU No. 2013-11, Income Taxes (Topic 740): Presentation of an Unrecognized Tax Benefit When a Net Operating Loss Carryforward, a Similar Tax Loss, or a Tax Credit Carryforward Exists, which provides that an unrecognized tax benefit, or a portion thereof, should be presented in the financial statements as a reduction to a deferred tax asset for a net operating loss carryforward, a similar tax loss, or a tax credit carryforward, except to the extent that a net operating loss carryforward, a similar tax loss, or a tax credit carryforward is not available at the reporting date to settle any additional income taxes that would result from disallowance of a tax position, or the tax law does not require the entity to use, and the entity does not intend to use, the deferred tax asset for such purpose, then the unrecognized tax benefit should be presented as a liability. These amendments in this ASU are effective for fiscal years, and interim reporting periods within those years, beginning after December 15, 2013. Early adoption and retrospective application is permitted. The Company has adopted this update, although such adoption had no impact on its financial position or results of operations.
In January 2014, the FASB issued ASU No. 2014-1, Investments-Equity Method and Joint Ventures (Topic 323): Accounting for Investments in Qualified Affordable Housing Projects, which provides guidance on accounting for investments by a reporting entity in flow-through limited liability entities that manage or invest in affordable housing projects that qualify for the low-income housing tax credit. It permits reporting entities to make an accounting policy election to account for their investments in qualified affordable housing projects using the proportional amortization method if certain conditions are met. Under the proportional amortization method, an entity amortizes the initial investment in proportion to the tax credits and other tax benefits received, and recognizes the net investment performance in the income statement as a component of income tax expense (benefit). The amendments are effective for public entities for annual periods and interim reporting periods within those annual periods, beginning after December 15, 2014, and are effective for all entities other than public entities for annual periods beginning after December 15, 2014, and interim reporting periods within annual periods beginning after December 15, 2015. Early adoption is permitted, and retrospective application is required for all periods presented. The Company does not have an investment in a limited partnership and therefore the adoption of this standard is not anticipated to have an impact on its financial position or results of operations.
In January 2014, the FASB issued ASU No. 2014-04, Receivables-Troubled Debt Restructurings by Creditors (Subtopic 310-40): Reclassification of Residential Real Estate Collateralized Consumer Mortgage Loans upon Foreclosure. These amendments are intended to clarify when a creditor should be considered to have received physical possession of residential real estate property collateralizing a consumer mortgage loan such that the loan should be derecognized and the real estate recognized. The amendments clarify that an in substance repossession or foreclosure occurs, and a creditor is considered to have received physical possession of residential real estate property collateralizing a consumer mortgage loan, upon either: (1) the creditor obtaining legal title to the residential real estate property upon completion of residential foreclosure, or (2) the borrower conveying all interest in the residential real estate property to the creditor to satisfy that loan through completion
F-61
Table of Contents
Index to Financial Statements
UNITED GROUP BANKING COMPANY OF FLORIDA, INC.
Notes to Unaudited Consolidated Financial Statements (Continued)
(amounts in tables in thousands except per share data)
Note 7 – Recently Issued Accounting Pronouncements (Continued)
of a deed in lieu of foreclosure or through a similar legal agreement. Additional disclosures about such activities are required by these amendments. The amendments in this ASU become effective for public companies for annual periods and interim periods within those annual periods beginning after December 15, 2014, and early adoption is permitted. The Company is assessing the impact that these amendments will have on its financial position and results of operations, but does not currently anticipate that it will have a material impact.
In May 2014, the FASB issued ASU No. 2014-09, Revenue from Contracts with Customers (Topic 606). These amendments affect any entity that either enters into contracts with customers to transfer goods or services or enters into contracts for the transfer of nonfinancial assets unless those contracts are within the scope of other standards (e.g. insurance contracts or lease contracts). This ASU will supersede the revenue recognition requirements in Topic 605, Revenue Recognition, and most industry-specific guidance, and creates a Topic 606, Revenue from Contracts with Customers. The core principle of the guidance is that an entity should recognize revenue to depict the transfer of promised goods or services to customers in an amount that reflects the consideration to which the entity expects to be entitled in exchange for those goods or services. This ASU also requires additional disclosure about the nature, amount, timing and uncertainty of revenue and cash flows arising from customer contracts, including significant judgments and changes in judgments and assets recognized from costs incurred to obtain or fulfill a contract. This ASU will be effective for annual reporting periods beginning after December 15, 2016, including interim periods within that reporting period. Early adoption is not permitted. The ASU allows for either full retrospective or modified retrospective adoption. The Company is assessing the effects of this ASU, which exclude financial instruments from its scope, but does not anticipate that it will have a material impact on its financial position or results of operations.
In June 2014, the FASB issued ASU No. 2014-12, Compensation—Stock Compensation (Topic 718): Accounting for Share-Based Payments When the Terms of an Award Provide That a Performance Target Could Be Achieved After the Requisite Service Period. The amendments clarify the proper method of accounting for share-based payments when the terms of an award provide that a performance target could be achieved after the requisite service period. This ASU requires that a performance target that affects vesting, and that could be achieved after the requisite service period, be treated as a performance condition. The performance target should not be reflected in estimating the grant-date fair value of the award. Compensation cost should be recognized in the period in which it becomes probable that the performance target will be achieved and should represent the compensation cost attributable to the period(s) for which the requisite service has already been rendered. The amendments in this ASU are effective for annual periods and interim periods within those annual periods beginning after December 15, 2015. Earlier adoption is permitted. None of the Company’s share-based payment awards have service components, so the Company does not believe this ASU will have an impact on its financial position or results of operations.
In August 2014, the FASB issued ASU No. 2014-14 – Receivables – Troubled Debt Restructurings by Creditors (Subtopic 310-40): Classification of Certain Government-Guaranteed Mortgage Loans upon Foreclosure. These amendments address the diversity in practice regarding the classification and measurement of foreclosed loans which were part of a government-sponsored loan guarantee program (e.g. HUD, FHA, VA). The ASU outlines certain criteria that, if met, the loan (residential or commercial) should be derecognized and a separate other receivable should be recorded upon foreclosure at the amount of the loan balance (principal and interest) expected to be recovered from the guarantor. This ASU will be effective for annual reporting periods beginning after December 15, 2014, including interim periods within that reporting period. Early adoption is permitted, provided the entity has adopted ASU 2014-04. The ASU should be adopted either prospectively or on a modified retrospective basis. The Company is assessing the impact that these amendments will have on its financial position and results of operations, but does not currently anticipate that it will have a material impact.
F-62
Table of Contents
Index to Financial Statements
UNITED GROUP BANKING COMPANY OF FLORIDA, INC.
Notes to Unaudited Consolidated Financial Statements (Continued)
(amounts in tables in thousands except per share data)
Note 7 – Recently Issued Accounting Pronouncements (Continued)
In August 2014, the FASB issued ASU No. 2014-15 Presentation of Financial Statements – Going Concern (Subtopic 205-40): Disclosure of Uncertainties about an Entity’s Ability to Continue as a Going Concern. These amendments are intended to reduce diversity in the timing and content of going concern disclosures. This ASU clarifies management’s responsibility to evaluate and provide related disclosures if there are any conditions or events, as a whole, that raise substantial doubt about the entity’s ability to continue as a going concern for one year after the date the financial statements are issued (or, if applicable, available to be issued). The amendments in this ASU are effective for the annual period ending after December 15, 2016, and for annual and interim periods thereafter. Early application is permitted. The Company does not believe this ASU will have an impact on its financial position or results of operations.
F-63
Table of Contents
Index to Financial Statements

To the Board of Directors
United Group Banking Company of Florida, Inc. and Subsidiaries
Longwood, Florida
We have audited the accompanying consolidated financial statements of United Group Banking Company of Florida, Inc. and Subsidiaries, which comprise the consolidated statements of financial condition as of December 31, 2013 and 2012, and the related consolidated statements of income, comprehensive loss, changes in stockholders’ equity, and cash flows for the year then ended, and the related notes to the financial statements.
Management’s Responsibility for the Financial Statements
Management is responsible for the preparation and fair presentation of these consolidated financial statements in accordance with accounting principles generally accepted in the United States of America; this includes the design, implementation, and maintenance of internal control relevant to the preparation and fair presentation of financial statements that are free from material misstatement, whether due to fraud or error.
Auditor’s Responsibility
Our responsibility is to express an opinion on these consolidated financial statements based on our audits. We conducted our audits in accordance with auditing standards generally accepted in the United States of America. Those standards require that we plan and perform the audits to obtain reasonable assurance about whether the consolidated financial statements are free of material misstatement.
An audit involves performing procedures to obtain audit evidence about the amounts and disclosures in the consolidated financial statements. The procedures selected depend on the auditor’s judgment, including the assessment of the risks of material misstatement of the consolidated financial statements, whether due to fraud or error. In making those risk assessments, the auditor considers internal control relevant to the entity’s preparation and fair presentation of the consolidated financial statements in order to design audit procedures that are appropriate in the circumstances, but not for the purpose of expressing an opinion on the effectiveness of the entity’s internal control. Accordingly, we express no such opinion. An audit also includes evaluating the appropriateness of accounting policies used and the reasonableness of significant accounting estimates made by management, as well as evaluating the overall presentation of the consolidated financial statements.
We believe that the audit evidence we have obtained is sufficient and appropriate to provide a basis for our audit opinion.
Opinion
In our opinion, the consolidated financial statements referred to above present fairly, in all material respects, the financial position of United Group Banking Company of Florida, Inc. and Subsidiaries as December 31, 2013 and 2012, and the results of their operations and their cash flows for the years then ended in accordance with accounting principles generally accepted in the United States of America.
/s/ Saltmarsh, Cleaveland & Gund
Orlando, Florida
May 9, 2014

F-64
Table of Contents
Index to Financial Statements
UNITED GROUP BANKING COMPANY OF FLORIDA, INC. AND SUBSIDIARIES
CONSOLIDATED STATEMENTS OF FINANCIAL CONDITION
DECEMBER 31, 2013 AND 2012
| 2013 | 2012 | |||||||
| ASSETS | ||||||||
| Cash and due from banks |
$ | 1,907,555 | $ | 2,508,655 | ||||
| Interest-bearing deposits in banks |
10,078,709 | 14,055,774 | ||||||
|
|
|
|
|
|||||
| Cash and cash equivalents |
11,986,264 | 16,564,429 | ||||||
| Interest-bearing time deposits in banks |
25,200 | 25,124 | ||||||
| Securities available for sale |
42,906,621 | 43,308,367 | ||||||
| Restricted equity stock, at cost |
1,129,550 | 972,650 | ||||||
| Loans receivable, net of allowance for loan losses of $2,243,342 in 2013 and $2,285,887 in 2012 |
145,021,500 | 132,324,491 | ||||||
| Accrued interest receivable |
562,024 | 467,241 | ||||||
| Premises and equipment, net |
8,451,783 | 8,379,231 | ||||||
| Cash surrender value of life insurance |
2,098,360 | 2,038,478 | ||||||
| Foreclosed real estate |
102,197 | 1,101,896 | ||||||
| Deferred income taxes |
6,069,050 | 5,220,830 | ||||||
| Other assets |
790,159 | 651,808 | ||||||
|
|
|
|
|
|||||
| Total Assets |
$ | 219,142,708 | $ | 211,054,545 | ||||
|
|
|
|
|
|||||
| LIABILITIES AND STOCKHOLDERS’ EQUITY | ||||||||
| Liabilities: |
||||||||
| Noninterest-bearing demand deposits |
$ | 38,542,430 | $ | 34,068,032 | ||||
| Interest-bearing demand deposits |
84,836,780 | 84,754,203 | ||||||
| Savings deposits |
2,728,441 | 2,438,423 | ||||||
| Time deposits |
56,010,328 | 61,623,772 | ||||||
|
|
|
|
|
|||||
| Total deposits |
182,117,979 | 182,884,430 | ||||||
| Federal Home Loan Bank advances |
4,865,000 | -0- | ||||||
| Short-term borrowings |
5,000,000 | -0- | ||||||
| Accrued interest payable |
32,660 | 46,975 | ||||||
| Other liabilities |
169,291 | 108,858 | ||||||
|
|
|
|
|
|||||
| Total liabilities |
192,184,930 | 183,040,263 | ||||||
|
|
|
|
|
|||||
| Stockholders’ Equity: |
||||||||
| Common stock, $.01 par value; 32 million shares authorized, 30,251,341 and 29,984,141 shares issued and outstanding |
302,513 | 299,841 | ||||||
| Additional paid-in capital |
36,289,710 | 35,849,192 | ||||||
| Accumulated deficit |
(7,786,288 | ) | (7,867,645 | ) | ||||
| Accumulated other comprehensive loss |
(1,848,157 | ) | (267,106 | ) | ||||
|
|
|
|
|
|||||
| Total stockholders’ equity |
26,957,778 | 28,014,282 | ||||||
|
|
|
|
|
|||||
| Total Liabilities and Stockholders’ Equity |
$ | 219,142,708 | $ | 211,054,545 | ||||
|
|
|
|
|
|||||
The accompanying notes are an integral part of these consolidated financial statements.
F-65
Table of Contents
Index to Financial Statements
UNITED GROUP BANKING COMPANY OF FLORIDA, INC. AND SUBSIDIARIES
CONSOLIDATED STATEMENTS OF INCOME
YEARS ENDED DECEMBER 31, 2013 AND 2012
| 2013 | 2012 | |||||||
| Interest Income: |
||||||||
| Loans receivable and fees on loans |
$ | 6,758,975 | $ | 6,392,778 | ||||
| Investment securities |
671,401 | 607,087 | ||||||
| Other |
80,793 | 104,612 | ||||||
|
|
|
|
|
|||||
| Total interest income |
7,511,169 | 7,104,477 | ||||||
|
|
|
|
|
|||||
| Interest Expense: |
||||||||
| Deposits |
879,619 | 1,263,871 | ||||||
| Borrowings |
7,047 | -0- | ||||||
|
|
|
|
|
|||||
| Total interest expense |
886,666 | 1,263,871 | ||||||
|
|
|
|
|
|||||
| Net interest income |
6,624,503 | 5,840,606 | ||||||
| Provision for Loan Losses |
479,411 | 741,500 | ||||||
|
|
|
|
|
|||||
| Net interest income after provision for loan losses |
6,145,092 | 5,099,106 | ||||||
|
|
|
|
|
|||||
| Noninterest Income: |
||||||||
| Service charges and fees |
436,666 | 453,110 | ||||||
| Gain on sale of securities |
-0- | 827,833 | ||||||
| Earnings on cash surrender value of life insurance |
59,883 | 38,477 | ||||||
| Other income |
78,847 | 59,519 | ||||||
|
|
|
|
|
|||||
| Total noninterest income |
575,396 | 1,378,939 | ||||||
|
|
|
|
|
|||||
| Noninterest Expense: |
||||||||
| Salaries and employee benefits |
3,261,452 | 3,131,700 | ||||||
| Occupancy expense |
585,343 | 566,585 | ||||||
| Equipment expense |
461,714 | 432,381 | ||||||
| Foreclosed real estate and reposessed asset expense |
362,693 | 485,477 | ||||||
| Outside processing and software |
606,633 | 520,542 | ||||||
| Regulatory assessments |
193,192 | 280,692 | ||||||
| Legal and professional fees |
220,676 | 255,912 | ||||||
| Insurance |
134,590 | 139,686 | ||||||
| Telephone |
143,415 | 134,336 | ||||||
| Other operating expenses |
563,739 | 617,499 | ||||||
|
|
|
|
|
|||||
| Total noninterest expense |
6,533,447 | 6,564,810 | ||||||
|
|
|
|
|
|||||
| Loss Before Income Taxes |
187,041 | (86,765 | ) | |||||
| Income Tax (Expense) Benefit |
(105,684 | ) | 449,702 | |||||
|
|
|
|
|
|||||
| Net Income |
$ | 81,357 | $ | 362,937 | ||||
|
|
|
|
|
|||||
The accompanying notes are an integral part of these consolidated financial statements.
F-66
Table of Contents
Index to Financial Statements
UNITED GROUP BANKING COMPANY OF FLORIDA, INC. AND SUBSIDIARIES
CONSOLIDATED STATEMENTS OF COMPREHENSIVE LOSS
YEARS ENDED DECEMBER 31, 2013 AND 2012
| 2013 | 2012 | |||||||
| Net Income |
$ | 81,357 | $ | 362,937 | ||||
|
|
|
|
|
|||||
| Other Comprehensive Loss: |
||||||||
| Change in unrealized gain on securities available for sale, net of income taxes of $(953,903) and $(83,919) |
(1,581,051 | ) | (139,092 | ) | ||||
| Reclassification adjustment for gains included in net income, net of income taxes of $0 and $141,389 |
-0- | 234,345 | ||||||
|
|
|
|
|
|||||
| Other comprehensive loss |
(1,581,051 | ) | (373,437 | ) | ||||
|
|
|
|
|
|||||
| Total Comprehensive Loss |
$ | (1,499,694 | ) | $ | (10,500 | ) | ||
|
|
|
|
|
|||||
The accompanying notes are an integral part of these consolidated financial statements.
F-67
Table of Contents
Index to Financial Statements
UNITED GROUP BANKING COMPANY OF FLORIDA, INC. AND SUBSIDIARIES
CONSOLIDATED STATEMENTS OF CHANGES IN STOCKHOLDERS’ EQUITY
YEARS ENDED DECEMBER 31, 2013 AND 2012
| Common Stock |
Additional Paid-In Capital |
Accumulated Deficit |
Accumulated Other Comprehensive Loss |
Total Stockholders’ Equity |
||||||||||||||||
| Balance January 1, 2012 |
$ | 283,541 | $ | 33,938,379 | $ | (8,230,582 | ) | $ | 106,331 | $ | 26,097,669 | |||||||||
| Net income |
362,937 | 362,937 | ||||||||||||||||||
| Other comprehensive loss |
(373,437 | ) | (373,437 | ) | ||||||||||||||||
| Sale of 1,730,000 shares of common stock, net of offering costs of $227,363 |
17,300 | 1,917,837 | 1,935,137 | |||||||||||||||||
| Acquisition of treasury stock |
(1,000 | ) | (119,000 | ) | (120,000 | ) | ||||||||||||||
| Stock-based compensation |
111,976 | 111,976 | ||||||||||||||||||
|
|
|
|
|
|
|
|
|
|
|
|||||||||||
| Balance, December 31, 2012 |
299,841 | 35,849,192 | (7,867,645 | ) | (267,106 | ) | 28,014,282 | |||||||||||||
| Net income |
81,357 | 81,357 | ||||||||||||||||||
| Other comprehensive loss |
(1,581,051 | ) | (1,581,051 | ) | ||||||||||||||||
| Sale of 267,200 shares of common stock, net of offering costs of $307 |
2,672 | 331,021 | 333,693 | |||||||||||||||||
| Stock-based compensation |
109,497 | 109,497 | ||||||||||||||||||
|
|
|
|
|
|
|
|
|
|
|
|||||||||||
| Balance, December 31, 2013 |
$ | 302,513 | $ | 36,289,710 | $ | (7,786,288 | ) | $ | (1,848,157 | ) | $ | 26,957,778 | ||||||||
|
|
|
|
|
|
|
|
|
|
|
|||||||||||
The accompanying notes are an integral part of these consolidated financial statements.
F-68
Table of Contents
Index to Financial Statements
UNITED GROUP BANKING COMPANY OF FLORIDA, INC. AND SUBSIDIARIES
CONSOLIDATED STATEMENTS OF CASH FLOWS
YEARS ENDED DECEMBER 31, 2013 AND 2012
| 2013 | 2012 | |||||||
| Cash Flows From Operating Activities: |
||||||||
| Net income |
$ | 81,357 | $ | 362,937 | ||||
| Adjustments to reconcile net income to net cash provided by operating activities |
||||||||
| Provision for loan losses |
479,411 | 741,500 | ||||||
| Depreciation and amortization |
305,308 | 292,067 | ||||||
| Deferred income taxes |
105,683 | (449,702 | ) | |||||
| Stock-based compensation |
109,497 | 111,976 | ||||||
| Net amortization of securities available for sale |
638,511 | 790,802 | ||||||
| Gain on sale of securities available for sale |
-0- | (827,833 | ) | |||||
| Loss on sale of foreclosed real estate |
169,607 | 318,148 | ||||||
| Change in – |
||||||||
| Accrued interest receivable |
(94,783 | ) | (11,720 | ) | ||||
| Accrued interest payable |
(14,315 | ) | (15,951 | ) | ||||
| Cash surrender value of life insurance |
(59,882 | ) | (38,478 | ) | ||||
| Other accounts, net |
(77,918 | ) | 828,748 | |||||
|
|
|
|
|
|||||
| Net cash provided by operating activities |
1,642,476 | 2,102,494 | ||||||
|
|
|
|
|
|||||
| Cash Flows From Investing Activities: |
||||||||
| Change in interest-bearing time deposits in banks |
(76 | ) | 2,738,876 | |||||
| Purchase of available-for-sale securities |
(6,974,771 | ) | (125,142,900 | ) | ||||
| Proceeds from sales of available-for-sale securities |
-0- | 116,416,163 | ||||||
| Principal reductions received on available-for-sale securities |
4,203,052 | 5,369,587 | ||||||
| Proceeds from calls and maturities of available-for-sale securities |
-0- | 5,650,000 | ||||||
| Purchase of restricted equity securities |
(156,900 | ) | (219,300 | ) | ||||
| Purchase of bank-owned life insurance |
-0- | (2,000,000 | ) | |||||
| Proceeds from sales of foreclosed real estate |
830,092 | 1,398,998 | ||||||
| Net increase in loans |
(13,176,420 | ) | (18,934,956 | ) | ||||
| Purchase of premises and equipment |
(377,860 | ) | (142,062 | ) | ||||
|
|
|
|
|
|||||
| Net cash used in investing activities |
(15,652,883 | ) | (14,865,594 | ) | ||||
|
|
|
|
|
|||||
| Cash Flows From Financing Activities: |
||||||||
| Net increase in demand and savings deposits |
4,846,993 | 14,127,307 | ||||||
| Net decrease in time deposits |
(5,613,444 | ) | (2,724,162 | ) | ||||
| Net change in borrowings |
9,865,000 | -0- | ||||||
| Sale of stock, less offering costs |
333,693 | 1,935,137 | ||||||
| Acquisition of treasury stock |
-0- | (120,000 | ) | |||||
|
|
|
|
|
|||||
| Net cash provided by financing activities |
9,432,242 | 13,218,282 | ||||||
|
|
|
|
|
|||||
| Net Change in Cash and Cash Equivalents |
(4,578,165 | ) | 455,182 | |||||
| Cash and Cash Equivalents at Beginning of Year |
16,564,429 | 16,109,247 | ||||||
|
|
|
|
|
|||||
| Cash and Cash Equivalents at End of Year |
$ | 11,986,264 | $ | 16,564,429 | ||||
|
|
|
|
|
|||||
| Supplemental Disclosures of Cash Flow Information: |
||||||||
| Interest paid |
$ | 900,981 | $ | 1,279,822 | ||||
|
|
|
|
|
|||||
| Noncash Transactions: |
||||||||
| Loans transferred to foreclosed real estate |
$ | -0- | $ | 1,157,034 | ||||
|
|
|
|
|
|||||
The accompanying notes are an integral part of these consolidated financial statements.
F-69
Table of Contents
Index to Financial Statements
UNITED GROUP BANKING COMPANY OF FLORIDA, INC. AND SUBSIDIARIES
NOTES TO CONSOLIDATED FINANCIAL STATEMENTS
DECEMBER 31, 2013 AND 2012
NOTE 1 – SUMMARY OF SIGNIFICANT ACCOUNTING POLICIES
Nature of Business:
United Group Banking Company of Florida, Inc. (the “Company”) is a registered bank holding company headquartered in Longwood, Florida. The Company owns 100% of United Legacy Bank (the “Bank”) and RBCF Holdings, Inc. (“RBCF”). The Bank is a full-service, FDIC-insured commercial bank providing a full array of banking services to its customers from its four branch offices in Central Florida. RBCF was formed to hold and manage several non-performing loans acquired from the Bank.
Financial Statement Presentation:
The accompanying consolidated financial statements include the financial results of the Company and its subsidiaries for the years ended December 31, 2013 and 2012. All significant intercompany balances and transactions have been eliminated in consolidation.
Use of Estimates in Preparation of Consolidated Financial Statements:
The process of preparing consolidated financial statements in conformity with generally accepted accounting principles requires the use of estimates and assumptions regarding certain types of assets, liabilities, revenues, and expenses. For the Company, such estimates significantly affect the carrying amount of the allowance for loan losses and foreclosed real estate, the amount of the deferred tax assets that are dependent upon future taxable income and the likelihood and timing of realization of such assets, and the factors and amounts entering into the estimate of fair value of financial instruments disclosed in Note 18. All such estimates relate to unsettled transactions and events as of the date of the consolidated financial statements and, accordingly, upon settlement it is likely that actual amounts will differ from currently estimated amounts.
While management uses available information to recognize losses on loans and to determine the carrying value of foreclosed real estate, further reductions in the carrying amounts of loans and foreclosed real estate may be necessary based on changes in local economic conditions. In addition, regulatory agencies, as an integral part of their examination process, periodically review the estimated losses on loans and the carrying value of foreclosed real estate. Such agencies may require the Bank to recognize additional losses based on their judgments about information available to them at the time of their examination. Because of these factors, it is reasonably possible that the estimated losses on loans and the carrying value of foreclosed real estate may change materially in the near term. However, the amount of the change that is reasonably possible cannot presently be estimated.
Cash and Cash Equivalents:
Cash and cash equivalents includes cash and due from banks and interest-bearing deposits in banks.
Securities Available for Sale:
Securities which are used for asset/liability, liquidity, and other funds management purposes, and deemed to have indefinite holding periods, are classified as securities available for sale. These securities are accounted for on a fair value basis with net unrealized gains or losses, net of any associated income tax effect, included in other comprehensive income.
Amortization and accretion of premiums and discounts are recognized as adjustments to interest income. Realized gains and losses are recognized using the specific identification method.
Restricted Equity Securities:
Restricted equity securities consists of stock in the Federal Home Loan Bank of Atlanta (FHLB) and Federal Reserve, which are carried at their cost and are held pursuant to membership requirements of those organizations.
F-70
Table of Contents
Index to Financial Statements
UNITED GROUP BANKING COMPANY OF FLORIDA, INC. AND SUBSIDIARIES
NOTES TO CONSOLIDATED FINANCIAL STATEMENTS (Continued)
DECEMBER 31, 2013 AND 2012
NOTE 1 – SUMMARY OF SIGNIFICANT ACCOUNTING POLICIES (Continued)
Loans Receivable and Allowance for Loan Losses:
Loans are stated at the amount of unpaid principal reduced by an allowance for loan losses and net deferred loan fees. Interest on loans is calculated by using the simple interest method on daily balances of the principal amounts outstanding except for any loans classified as nonaccrual loans. Generally, the accrual of interest for all loan portfolio segments is discontinued at the earlier of when the loan becomes 90 days past due or when future collection of principal or interest in accordance with the contractual terms may be doubtful. Past due status is based on the contractual terms of the loan.
The allowance for loan losses is established through a provision for loan losses charged against operations. Loans are charged against the allowance for loan losses when management believes that the uncollectibility of a loan balance is confirmed. Subsequent recoveries, if any, are credited to the allowance.
The allowance is evaluated on a regular basis by management based on management’s periodic review of the collectibility of the loans in light of historical experience, the nature and volume of the loan portfolio, adverse situations that might affect the borrowers’ ability to repay, estimated value of underlying collateral, and prevailing economic conditions. This evaluation is inherently subjective as it requires estimates that are susceptible to significant revision as more information becomes available.
The allowance consists of specific, general, and when applicable, unallocated components. The specific component relates to loans that are classified as impaired. For such loans, an allowance is established when the present value of the expected future cash flows (or collateral value or observable market price) of the impaired loan is lower than the carrying amount of that loan. The general component covers loans not considered to be impaired, and is based on the Bank’s historical loss experience by portfolio segment adjusted for qualitative factors. Any unallocated component reflects the margin of imprecision inherent in the underlying assumptions used in the methodologies for estimating specific and general losses in the portfolio.
A loan is considered impaired when, based on current information and events, it is probable that the Bank will be unable to collect the scheduled payments of principal or interest when due according to the contractual terms of the loan agreement. Factors considered by management in determining impairment include payment status, collateral value, and the probability of collecting scheduled principal and interest payments when due. Loans that have experienced insignificant payment delays and payment shortfalls generally are not classified as impaired. Management determines the significance of payment delays and payment shortfalls on a case-by-case basis, taking into consideration all of the circumstances surrounding the loan and the borrower, including the length of the delay, the reasons for the delay, the borrower’s prior payment record, and the amount of the shortfall in relation to the principal and interest owed. Impairment is measured on a loan by loan basis for commercial and real estate loans by comparison of the loan balance to either the present value of expected future cash flows discounted at the loan’s effective interest rate, the loan’s obtainable market price, or the fair value of the collateral.
Large groups of smaller balance homogeneous loans may be collectively evaluated for impairment. Accordingly, the Bank may not separately identify individual installment and smaller residential loans for impairment disclosures.
Interest receivable at the time loans are placed on nonaccrual is reversed against interest income. Subsequent collections, if any, of interest on these loans are accounted for on the cash basis or cost recovery method until returned to accrual. Loans are returned to accrual only when contractual amounts are brought current and future payments are reasonably assured.
Loan fees, net of origination costs, are capitalized and amortized as yield adjustments over the respective loan terms.
F-71
Table of Contents
Index to Financial Statements
UNITED GROUP BANKING COMPANY OF FLORIDA, INC. AND SUBSIDIARIES
NOTES TO CONSOLIDATED FINANCIAL STATEMENTS (Continued)
DECEMBER 31, 2013 AND 2012
NOTE 1 – SUMMARY OF SIGNIFICANT ACCOUNTING POLICIES (Continued)
Foreclosed Real Estate:
Foreclosed real estate consists of property acquired through, or in lieu of, foreclosure. These properties, which are held for sale, are initially recorded on an individual basis at fair value less the estimated costs to sell, establishing a new cost basis. Fair value is determined by current independent appraisal of the property by qualified appraisers approved by the Bank. Subsequent write-downs are included in noninterest expense, together with any operating expenses incurred to maintain the property. Subsequent increases in value are added to the carrying amount of the property, but not to exceed the amount recorded initially. Realized gains or losses on disposition are recorded in current operations.
Premises and Equipment:
Premises and equipment are stated at cost, less accumulated depreciation and amortization. Depreciation and amortization are computed on the straight-line method over the estimated useful lives of the assets. Maintenance and repairs are charged to expenses as incurred. Gains and losses on dispositions are reflected in operations.
Advertising Costs:
Advertising costs are expensed as incurred.
Stock-Based Compensation:
The Company records stock-based compensation at the fair value of stock options granted. The Company recognizes stock-based compensation in salaries and employee benefits on a straight-line basis in the accompanying consolidated statements of income over the vesting period.
Income Taxes:
Accounting principles generally accepted in the United States of America prescribe requirements for the recognition of income taxes in financial statements, and the amounts recognized are affected by income tax positions taken by the Company in its consolidated income tax returns. While management believes it has complied with the Internal Revenue Code, the sustainability of some income tax positions taken by the Company in its tax returns may be uncertain. There are minimum thresholds of likelihood that uncertain tax positions are required to meet before being recognized and disclosed in the financial statements. Management does not believe that the Company has any material uncertain tax positions at December 31, 2013.
The Company uses the liability method of accounting for deferred income taxes. This method requires the recognition of deferred tax assets and liabilities for the future tax consequences attributable to differences between the financial statement carrying amounts of existing assets and liabilities and their respective tax bases.
The Company and its subsidiaries file consolidated federal and state income tax returns. Under a tax-sharing arrangement, income tax charges or credits are generally allocated to the Company and the subsidiaries on the basis of their respective taxable income or loss included in the consolidated income tax return as determined by the separate return method.
The Company’s federal income tax returns are subject to examination by the Internal Revenue Service, generally for three years after filing. At December 31, 2013, the tax returns for the years 2010 through 2013 are subject to examination.
Transfers of Financial Assets:
The Bank may periodically buy or sell all or a portion of a loan to or from other financial institutions. Under accounting standards, certain criteria must be met for these transactions to be accounted for as sales instead of
F-72
Table of Contents
Index to Financial Statements
UNITED GROUP BANKING COMPANY OF FLORIDA, INC. AND SUBSIDIARIES
NOTES TO CONSOLIDATED FINANCIAL STATEMENTS (Continued)
DECEMBER 31, 2013 AND 2012
NOTE 1 – SUMMARY OF SIGNIFICANT ACCOUNTING POLICIES (Continued)
Transfers of Financial Assets (Continued):
financing arrangements. These standards require, among other things, additional criteria be met to qualify for sale treatment when a financial asset is sold. Management believes its treatment of transfers of financial assets conforms to the requirements of the standards.
Subsequent Events:
Management has evaluated subsequent events through May 9, 2014, the date which the financial statements were available to be issued.
Reclassifications:
Certain prior period amounts have been reclassified to conform to the current period presentation.
Recent Accounting Pronouncements:
In 2011 and 2012, the Financial Accounting Standards Board (“FASB”) issued several Accounting Standards Updates (“ASU”) relating to the measurement and disclosure requirements for fair value of certain assets and liabilities. ASU 2011-04, which applies to all reporting entities that are required or permitted to measure or disclose the fair value of an asset, a liability, or an instrument classified in a reporting entity’s stockholders’ equity in the financial statements, was expected to result in common fair value measurement and disclosure requirements in GAAP and IFRS. This ASU clarifies the application of existing fair value measurement requirements, and makes certain changes, including the method of measuring the fair value of financial instruments that are managed within a portfolio, the application of premiums and discounts in a fair value measurement, and requires additional disclosures about fair value measurements. ASU 2011-04 became effective for nonpublic companies, for annual periods beginning after December 15, 2011. ASU 2012-04, “Technical Corrections and Improvements” clarified and corrected unintended application of the previous fair value measurement guidance, and requires additional disclosure related to the definition of fair value in an entity’s disclosure. Those amendments to the transitional guidance become effective for nonpublic companies January 1, 2014. Management does not expect the adoption of these pronouncements related to fair value to have a significant impact on the Company’s consolidated financial statements other than to increase financial disclosures already provided.
During 2013, the FASB issued ASU 2013-03 - Financial Instruments (Topic 825): Clarifying the Scope and Applicability of a Particular Disclosure to Nonpublic Entities which is effective upon issuance. The main objective of this ASU is to clarify the scope and applicability of a particular disclosure to nonpublic entities that resulted from the issuance of ASU No. 2011-04, Fair Value Measurement (Topic 820): Amendments to Achieve Common Fair Value Measurement and Disclosure Requirements in U.S. GAAP and IFRSs. Contrary to the stated intent of ASU 2011-04 to exempt all nonpublic entities for a particular disclosure, that ASU’s amendments to Topic 825 suggested that nonpublic entities that have total assets of $100 million or more or that have one or more derivative instruments would not qualify for the intended exemption. The amendments clarify that the requirement to disclose “the level of the fair value hierarchy within which the fair value measurements are categorized in their entirety (Level 1, 2, or 3)” does not apply to nonpublic entities for items that are not measured at fair value in the statement of financial position but for which fair value is disclosed. Management does not expect adoption of this ASU to have a significant impact on the Company’s financial statements.
F-73
Table of Contents
Index to Financial Statements
UNITED GROUP BANKING COMPANY OF FLORIDA, INC. AND SUBSIDIARIES
NOTES TO CONSOLIDATED FINANCIAL STATEMENTS (Continued)
DECEMBER 31, 2013 AND 2012
NOTE 2 – INVESTMENT SECURITIES
All of the mortgage-backed securities (“MBS”) listed below are residential FNMA, FHLMC, and GNMA MBS. The amortized cost and estimated fair value of securities available for sale at December 31, 2013 and 2012, are as follows:
| Amortized Cost |
Gross Unrealized Gains |
Gross Unrealized Losses |
Fair Value |
|||||||||||||
| December 31, 2013 – |
||||||||||||||||
| Mortgage-backed securities |
$ | 43,964,443 | $ | 13,270 | $ | (2,961,209 | ) | $ | 41,016,504 | |||||||
| Municipal bonds |
1,905,393 | 5,358 | (20,634 | ) | 1,890,117 | |||||||||||
|
|
|
|
|
|
|
|
|
|||||||||
| Totals |
$ | 45,869,836 | $ | 18,628 | $ | (2,981,843 | ) | $ | 42,906,621 | |||||||
|
|
|
|
|
|
|
|
|
|||||||||
| December 31, 2012 – |
||||||||||||||||
| Mortgage-backed securities |
$ | 43,736,628 | $ | 14,379 | $ | (442,640 | ) | $ | 43,308,367 | |||||||
|
|
|
|
|
|
|
|
|
|||||||||
There were no sales of securities available for sale during 2013. During 2012, the Bank sold securities available for sale for total proceeds of approximately $116,416,000 resulting in gross gains and losses of approximately $828,000 and $0, respectively.
The following schedule shows those securities with gross unrealized losses at December 31, 2013 and 2012, aggregated by investment category and length of time that the securities have been in a continuous loss position, as well as their estimated fair value:
| Less Than Twelve Months | Over Twelve Months | |||||||||||||||
| Gross Unrealized Losses |
Fair Value |
Gross Unrealized Losses |
Fair Value |
|||||||||||||
| December 31, 2013 – |
||||||||||||||||
| Mortgage-backed securities |
$ | (191,593 | ) | $ | 4,170,967 | $ | (2,769,616 | ) | $ | 32,472,822 | ||||||
| Municipal bonds |
(20,634 | ) | 1,372,462 | -0- | -0- | |||||||||||
|
|
|
|
|
|
|
|
|
|||||||||
| $ | (212,227 | ) | $ | 5,543,429 | $ | (2,769,616 | ) | $ | 32,472,822 | |||||||
|
|
|
|
|
|
|
|
|
|||||||||
| December 31, 2012 – |
||||||||||||||||
| Mortgage-backed securities |
$ | (442,640 | ) | $ | 41,357,447 | $ | -0- | $ | -0- | |||||||
|
|
|
|
|
|
|
|
|
|||||||||
Management evaluates securities for other-than-temporary impairment at least on a quarterly basis, and more frequently when economic or market concerns warrant such evaluation. Consideration is given to (1) the length of time and the extent to which the fair value has been less than cost, (2) the financial condition and near-term prospects of the issuer, and (3) the intent and ability of the Bank to retain its investment in the issuer for a period of time sufficient to allow for any anticipated recovery in fair value.
These unrealized losses relate principally to current interest rates for similar types of securities. In analyzing an issuer’s financial condition, management considers whether the securities are issued by the federal government or its agencies, whether downgrades by bond rating agencies have occurred, and the results of reviews of the issuer’s financial condition. As management has the ability to hold the securities for the foreseeable future, no declines are deemed to be other-than-temporary.
Securities available for sale with an estimated fair value of approximately $3.8 and $2.7 million were pledged as collateral at December 31, 2013 and 2012, respectively, for public funds and customer repurchase agreements.
F-74
Table of Contents
Index to Financial Statements
UNITED GROUP BANKING COMPANY OF FLORIDA, INC. AND SUBSIDIARIES
NOTES TO CONSOLIDATED FINANCIAL STATEMENTS (Continued)
DECEMBER 31, 2013 AND 2012
NOTE 2 – INVESTMENT SECURITIES (Continued)
The scheduled maturities of securities available for sale based on the weighted-average lives of the securities as of December 31, 2013, were as follows:
| Amortized Cost |
Fair Value |
|||||||
| Due from one to five years |
$ | 4,359,445 | $ | 4,372,716 | ||||
| Due from five to ten years |
38,528,785 | 35,671,378 | ||||||
| Due in more than 10 years |
2,981,606 | 2,862,527 | ||||||
|
|
|
|
|
|||||
| $ | 45,869,836 | $ | 42,906,621 | |||||
|
|
|
|
|
|||||
For purposes of the maturity table, mortgage-backed securities, which are not due at a single maturity date, have been allocated over maturity groupings based on the estimated weighted-average lives of the underlying collateral. The mortgage-backed securities may mature earlier than their estimated weighted-average lives because of principal prepayments.
NOTE 3 – LOANS RECEIVABLE AND THE ALLOWANCE FOR LOAN LOSSES
The components of loans at December 31, 2013 and 2012, are as follows:
| 2013 | 2012 | |||||||
| Real estate – |
||||||||
| Commercial |
$ | 75,523,317 | $ | 62,935,853 | ||||
| Residential |
36,192,094 | 36,673,520 | ||||||
| Construction, development, land |
9,548,118 | 9,114,104 | ||||||
| Commercial |
18,415,703 | 16,941,172 | ||||||
| Consumer and other |
7,580,633 | 8,859,117 | ||||||
|
|
|
|
|
|||||
| 147,259,865 | 134,523,766 | |||||||
| Deferred loan costs |
4,977 | 86,612 | ||||||
| Allowance for loan losses |
(2,243,342 | ) | (2,285,887 | ) | ||||
|
|
|
|
|
|||||
| $ | 145,021,500 | $ | 132,324,491 | |||||
|
|
|
|
|
|||||
Each of the Bank’s loan portfolio segments has different risks specific to that segment, as well as differing methods of assessing risk. As shown above, the portfolio segments used by the Bank are commercial real estate loans, residential real estate loans, construction, development and land loans, commercial loans, and consumer and other loans.
Commercial real estate loans are loans made to finance real estate acquisition, improvements to facilities, or the refinancing of prior loans made for such purposes. Typically, these loans are collateralized by first mortgages on underlying commercial property such as office buildings, warehouses, and apartments and are generally restricted to customers and properties within the Bank’s market area. Underwriting standards for this segment consist principally of analysis of the entity’s financial condition, along with analysis of cash flow projected to be available for debt service, and independent appraisal of the property being financed. Repayment of these loans largely depends on the results of operations and management of these properties. In addition to general economic conditions, a declining real estate market further increases the risk of these types of loans since, in the event of payment default, even the underlying real estate collateral might not be sufficient to liquidate the credit. These loans are subject to more risk than residential real estate loans because of the above factors and relatively larger balances of these loans.
Residential real estate loans are loans made to individuals to purchase or refinance their principal residences. Management considers these loans to possess less risk than commercial real estate loans or
F-75
Table of Contents
Index to Financial Statements
UNITED GROUP BANKING COMPANY OF FLORIDA, INC. AND SUBSIDIARIES
NOTES TO CONSOLIDATED FINANCIAL STATEMENTS (Continued)
DECEMBER 31, 2013 AND 2012
NOTE 3 – LOANS RECEIVABLE AND THE ALLOWANCE FOR LOAN LOSSES (Continued)
construction loans because of the nature of the underlying collateral, underwriting standards requiring appraisals and minimum down payments, and relatively short terms. Typically, these loans require payments based on a standard residential loan amortization term, but with a short-term maturity to afford the repricing of the loan – in the case of a fixed rate loan – and re-evaluation of the borrowers’ financial position, credit rating, and collateral value before renewal of the loan. In addition, these loans typically are smaller than either commercial loans or commercial real estate loans. Residential real estate loans include home equity loans.
Construction, development, and land loans are loans made to borrowers to build commercial structures, a primary or secondary residence and, in some cases, to real estate investors to acquire and develop land. These loans are more difficult to evaluate since they are significantly more vulnerable to changes in economic conditions. In addition, these loans possess a higher degree of credit risk since they are made based on estimates of the future worth of a project and the estimated costs required for completion. The Bank limits its overall investment in this portfolio segment due both to management’s assessment of risk and certain percentage guidance set by the regulatory agencies.
Commercial loans consist generally of business loans and lines of credit to companies in the Bank’s market area, and typically, are made for the purpose of providing working capital or funds to acquire and maintain inventory, receivables, and furniture and equipment. Such loans are usually collateralized by the financed assets, although a portion may be made on an unsecured basis and contain the guarantee of the business principals. Underwriting standards for this segment consist principally of financial statement analysis, business history and reputation, analyses of cash flow projection and ability of the borrower to meet prescribed debt service capabilities, collateral values, and creditworthiness and capabilities of guarantors.
Consumer and other loans consist of installment loans made to finance automobiles and other miscellaneous credits. These loans are generally small and of a homogeneous nature.
Allowance for Loan Losses:
Changes in the allowance for loan losses for 2013 and 2012, are as follows:
| 2013 | 2012 | |||||||
| Balance, beginning of year |
$ | 2,285,887 | $ | 2,793,421 | ||||
|
|
|
|
|
|||||
| Charge-offs: |
||||||||
| Real estate – commercial |
-0- | (300,258 | ) | |||||
| Real estate – residential |
(189,820 | ) | (762,212 | ) | ||||
| Real estate – construction, development, land |
-0- | -0- | ||||||
| Commercial |
(151,803 | ) | -0- | |||||
| Consumer and other |
(227,202 | ) | (199,200 | ) | ||||
|
|
|
|
|
|||||
| Total charge offs |
(568,825 | ) | (1,261,670 | ) | ||||
|
|
|
|
|
|||||
| Recoveries: |
||||||||
| Real estate – commercial |
-0- | -0- | ||||||
| Real estate – residential |
46,865 | -0- | ||||||
| Real estate – construction, development, land |
-0- | 69 | ||||||
| Commercial |
4 | -0- | ||||||
| Consumer and other |
-0- | 12,567 | ||||||
|
|
|
|
|
|||||
| Total recoveries |
46,869 | 12,636 | ||||||
|
|
|
|
|
|||||
| Net charge-offs |
(521,956 | ) | (1,249,034 | ) | ||||
|
|
|
|
|
|||||
| Provision charged to operations |
479,411 | 741,500 | ||||||
|
|
|
|
|
|||||
| Balance, end of year |
$ | 2,243,342 | $ | 2,285,887 | ||||
|
|
|
|
|
|||||
F-76
Table of Contents
Index to Financial Statements
UNITED GROUP BANKING COMPANY OF FLORIDA, INC. AND SUBSIDIARIES
NOTES TO CONSOLIDATED FINANCIAL STATEMENTS (Continued)
DECEMBER 31, 2013 AND 2012
NOTE 3 – LOANS RECEIVABLE AND THE ALLOWANCE FOR LOAN LOSSES (Continued)
Allowance for Loan Losses (Continued):
The following tables present the recorded investment in loans and related allowance for loan losses, by portfolio segment, and the impairment method and amounts evaluated for impairment, by portfolio segment at December 31, 2013 and 2012.
| Real Estate - Commercial |
Real Estate - Residential |
Real Estate - Construction Development Land |
Commercial | Consumer and Other |
Total | |||||||||||||||||||
| December 31, 2013 – |
||||||||||||||||||||||||
| Allowance allocated for loans: |
||||||||||||||||||||||||
| Individually evaluated for impairment |
$ | 90,809 | $ | 281,461 | $ | -0- | $ | -0- | $ | -0- | $ | 372,270 | ||||||||||||
| Collectively evaluated for impairment |
821,922 | 399,810 | 94,145 | 300,503 | 254,692 | 1,871,072 | ||||||||||||||||||
|
|
|
|
|
|
|
|
|
|
|
|
|
|||||||||||||
| $ | 912,731 | $ | 681,271 | $ | 94,145 | $ | 300,503 | $ | 254,692 | $ | 2,243,342 | |||||||||||||
|
|
|
|
|
|
|
|
|
|
|
|
|
|||||||||||||
| December 31, 2013 – |
||||||||||||||||||||||||
| Loans: |
||||||||||||||||||||||||
| Individually evaluated for impairment |
$ | 1,924,153 | $ | 2,234,393 | $ | 1,169,270 | $ | 150,763 | $ | 103,780 | $ | 5,582,359 | ||||||||||||
| Collectively evaluated for impairment |
73,599,164 | 33,957,701 | 8,378,848 | 18,264,940 | 7,476,853 | 141,677,506 | ||||||||||||||||||
|
|
|
|
|
|
|
|
|
|
|
|
|
|||||||||||||
| $ | 75,523,317 | $ | 36,192,094 | $ | 9,548,118 | $ | 18,415,703 | $ | 7,580,633 | $ | 147,259,865 | |||||||||||||
|
|
|
|
|
|
|
|
|
|
|
|
|
|||||||||||||
| Real Estate - Commercial |
Real Estate - Residential |
Real Estate - Construction Development Land |
Commercial | Consumer and Other |
Total | |||||||||||||||||||
| December 31, 2012 – |
||||||||||||||||||||||||
| Allowance allocated for loans: |
||||||||||||||||||||||||
| Individually evaluated for impairment |
$ | 89,000 | $ | 179,957 | $ | -0- | $ | -0- | $ | -0- | $ | 268,957 | ||||||||||||
| Collectively evaluated for impairment |
665,354 | 862,968 | 65,935 | 199,476 | 223,197 | 2,016,930 | ||||||||||||||||||
|
|
|
|
|
|
|
|
|
|
|
|
|
|||||||||||||
| $ | 754,354 | $ | 1,042,925 | $ | 65,935 | $ | 199,476 | $ | 223,197 | $ | 2,285,887 | |||||||||||||
|
|
|
|
|
|
|
|
|
|
|
|
|
|||||||||||||
| December 31, 2012 – |
||||||||||||||||||||||||
| Loans: |
||||||||||||||||||||||||
| Individually evaluated for impairment |
$ | 1,993,238 | $ | 3,178,245 | $ | 1,321,180 | $ | 153,030 | $ | 200,911 | $ | 6,846,604 | ||||||||||||
| Collectively evaluated for impairment |
60,942,615 | 33,495,275 | 7,792,924 | 16,788,142 | 8,658,206 | 127,677,162 | ||||||||||||||||||
|
|
|
|
|
|
|
|
|
|
|
|
|
|||||||||||||
| $ | 62,935,853 | $ | 36,673,520 | $ | 9,114,104 | $ | 16,941,172 | $ | 8,859,117 | $ | 134,523,766 | |||||||||||||
|
|
|
|
|
|
|
|
|
|
|
|
|
|||||||||||||
F-77
Table of Contents
Index to Financial Statements
UNITED GROUP BANKING COMPANY OF FLORIDA, INC. AND SUBSIDIARIES
NOTES TO CONSOLIDATED FINANCIAL STATEMENTS (Continued)
DECEMBER 31, 2013 AND 2012
NOTE 3 – LOANS RECEIVABLE AND THE ALLOWANCE FOR LOAN LOSSES (Continued)
Impaired Loans:
The following tables provide information regarding impaired loans at December 31, 2013:
| Recorded Investment |
Unpaid Principal Balance |
Specific Allowance |
Average Recorded Investment |
Interest Income Recognized |
||||||||||||||||
| December 31, 2013 – |
||||||||||||||||||||
| Without a specific allowance recorded: |
||||||||||||||||||||
| Real estate – commercial |
$ | 1,682,375 | $ | 1,682,375 | $ | -0- | $ | 1,707,614 | $ | 23,875 | ||||||||||
| Real estate – residential |
1,798,960 | 1,988,780 | -0- | 2,006,788 | 7,842 | |||||||||||||||
| Real estate – construction, development, land |
1,169,270 | 1,169,270 | -0- | 1,212,629 | 22,296 | |||||||||||||||
| Commercial |
150,763 | 302,566 | -0- | 214,474 | 7,842 | |||||||||||||||
| Consumer and other |
103,780 | 327,984 | -0- | 165,827 | 14,732 | |||||||||||||||
|
|
|
|
|
|
|
|
|
|
|
|||||||||||
| $ | 4,905,148 | $ | 5,470,975 | $ | -0- | $ | 5,307,332 | $ | 76,587 | |||||||||||
|
|
|
|
|
|
|
|
|
|
|
|||||||||||
| December 31, 2013 – |
||||||||||||||||||||
| With a specific allowance recorded: |
||||||||||||||||||||
| Real estate – commercial |
$ | 241,778 | $ | 241,778 | $ | 90,809 | $ | 241,778 | $ | -0- | ||||||||||
| Real estate – residential |
435,433 | 469,157 | 281,461 | 236,946 | -0- | |||||||||||||||
| Real estate – construction, development, land |
-0- | -0- | -0- | -0- | -0- | |||||||||||||||
| Commercial |
-0- | -0- | -0- | -0- | -0- | |||||||||||||||
| Consumer and other |
-0- | -0- | -0- | -0- | -0- | |||||||||||||||
|
|
|
|
|
|
|
|
|
|
|
|||||||||||
| $ | 677,211 | $ | 710,935 | $ | 372,270 | $ | 478,724 | $ | -0- | |||||||||||
|
|
|
|
|
|
|
|
|
|
|
|||||||||||
| Totals, December 31, 2013 |
$ | 5,582,359 | $ | 6,181,910 | $ | 372,270 | $ | 5,786,056 | $ | 76,587 | ||||||||||
|
|
|
|
|
|
|
|
|
|
|
|||||||||||
The following tables provide information regarding impaired loans at December 31, 2012:
| Recorded Investment |
Unpaid Principal Balance |
Specific Allowance |
Average Recorded Investment |
Interest Income Recognized |
||||||||||||||||
| December 31, 2012 – |
||||||||||||||||||||
| Without a specific allowance recorded: |
||||||||||||||||||||
| Real estate – commercial |
$ | 1,756,167 | $ | 2,179,771 | $ | -0- | $ | 2,144,222 | $ | 6,953 | ||||||||||
| Real estate – residential |
3,005,656 | 3,623,575 | -0- | 3,066,032 | 19,147 | |||||||||||||||
| Real estate – construction, development, land |
1,321,180 | 1,321,180 | -0- | 1,460,801 | 8,146 | |||||||||||||||
| Commercial |
153,030 | 153,030 | -0- | 153,476 | 11,216 | |||||||||||||||
| Consumer and other |
200,911 | 258,902 | -0- | 139,086 | -0- | |||||||||||||||
|
|
|
|
|
|
|
|
|
|
|
|||||||||||
| $ | 6,436,944 | $ | 7,536,458 | $ | -0- | $ | 6,963,617 | $ | 45,462 | |||||||||||
|
|
|
|
|
|
|
|
|
|
|
|||||||||||
F-78
Table of Contents
Index to Financial Statements
UNITED GROUP BANKING COMPANY OF FLORIDA, INC. AND SUBSIDIARIES
NOTES TO CONSOLIDATED FINANCIAL STATEMENTS (Continued)
DECEMBER 31, 2013 AND 2012
NOTE 3 – LOANS RECEIVABLE AND THE ALLOWANCE FOR LOAN LOSSES (Continued)
Impaired Loans (Continued):
| Recorded Investment |
Unpaid Principal Balance |
Specific Allowance |
Average Recorded Investment |
Interest Income Recognized |
||||||||||||||||
| December 31, 2012 – |
||||||||||||||||||||
| With a specific allowance recorded: |
||||||||||||||||||||
| Real estate – commercial |
$ | 237,071 | $ | 237,071 | $ | 89,000 | $ | 237,071 | $ | 11,414 | ||||||||||
| Real estate – residential |
172,589 | 206,314 | 179,957 | 172,589 | 3,116 | |||||||||||||||
| Real estate – construction, development, land |
-0- | -0- | -0- | -0- | -0- | |||||||||||||||
| Commercial |
-0- | -0- | -0- | -0- | -0- | |||||||||||||||
| Consumer and other |
-0- | -0- | -0- | -0- | -0- | |||||||||||||||
|
|
|
|
|
|
|
|
|
|
|
|||||||||||
| $ | 409,660 | $ | 443,385 | $ | 268,957 | $ | 409,660 | $ | 14,530 | |||||||||||
|
|
|
|
|
|
|
|
|
|
|
|||||||||||
| Totals, December 31, 2012 |
$ | 6,846,604 | $ | 7,979,843 | $ | 268,957 | $ | 7,373,277 | $ | 59,992 | ||||||||||
|
|
|
|
|
|
|
|
|
|
|
|||||||||||
The Bank made no loan modifications considered troubled debt restructurings during 2013 and 2012.
Past Due and Nonaccrual Loans:
The tables which follow show the age of the recorded balance in past due loans as of December 31, 2013 and 2012:
| 30-89 Days Past Due |
Greater Than 90 Days |
Total Past Due |
Current Loans |
Total Loans |
Loans > 90 Days and Accruing |
|||||||||||||||||||
| December 31, 2013 – |
||||||||||||||||||||||||
| Real estate – commercial |
$ | 293,734 | $ | 882,123 | $ | 1,175,857 | $ | 74,347,460 | $ | 75,523,317 | $ | -0- | ||||||||||||
| Real estate – residential |
257,515 | 1,790,136 | 2,047,651 | 34,144,443 | 36,192,094 | 445,468 | ||||||||||||||||||
| Real estate – construction, development, land |
139,222 | 1,169,270 | 1,308,492 | 8,239,626 | 9,548,118 | -0- | ||||||||||||||||||
| Commercial |
129,099 | -0- | 129,099 | 18,286,604 | 18,415,703 | -0- | ||||||||||||||||||
| Consumer and other |
153,946 | 110,720 | 264,666 | 7,315,967 | 7,580,633 | 78,334 | ||||||||||||||||||
|
|
|
|
|
|
|
|
|
|
|
|
|
|||||||||||||
| $ | 973,516 | $ | 3,952,249 | $ | 4,925,765 | $ | 142,334,100 | $ | 147,259,865 | $ | 523,802 | |||||||||||||
|
|
|
|
|
|
|
|
|
|
|
|
|
|||||||||||||
| December 31, 2012 - |
||||||||||||||||||||||||
| Real estate – commercial |
$ | -0- | $ | -0- | $ | -0- | $ | 62,935,853 | $ | 62,935,853 | $ | -0- | ||||||||||||
| Real estate – residential |
1,075,327 | 1,304,009 | 2,379,336 | 34,294,184 | 36,673,520 | -0- | ||||||||||||||||||
| Real estate – construction, development, land |
297,161 | 1,321,180 | 1,618,341 | 7,495,763 | 9,114,104 | -0- | ||||||||||||||||||
| Commercial |
94,921 | 3,977 | 98,898 | 16,842,274 | 16,941,172 | 3,274 | ||||||||||||||||||
| Consumer and other |
287,130 | 268,402 | 555,532 | 8,303,585 | 8,859,117 | 152,293 | ||||||||||||||||||
|
|
|
|
|
|
|
|
|
|
|
|
|
|||||||||||||
| $ | 1,754,539 | $ | 2,897,568 | $ | 4,652,107 | $ | 129,871,659 | $ | 134,523,766 | $ | 155,567 | |||||||||||||
|
|
|
|
|
|
|
|
|
|
|
|
|
|||||||||||||
F-79
Table of Contents
Index to Financial Statements
UNITED GROUP BANKING COMPANY OF FLORIDA, INC. AND SUBSIDIARIES
NOTES TO CONSOLIDATED FINANCIAL STATEMENTS (Continued)
DECEMBER 31, 2013 AND 2012
NOTE 3 – LOANS RECEIVABLE AND THE ALLOWANCE FOR LOAN LOSSES (Continued)
Past Due and Nonaccrual Loans (Continued):
The following tables present nonaccrual loans by class at December 31, 2013 and 2012:
| 2013 | 2012 | |||||||
| Real estate – commercial |
$ | 882,122 | $ | 610,533 | ||||
| Real estate – residential |
2,087,962 | 1,399,887 | ||||||
| Real estate – construction, development, land |
1,169,270 | 1,321,180 | ||||||
| Commercial |
-0- | 704 | ||||||
| Consumer and other |
103,780 | 200,912 | ||||||
|
|
|
|
|
|||||
| $ | 4,243,134 | $ | 3,533,216 | |||||
|
|
|
|
|
|||||
Credit Quality:
The Bank categorizes loans into various risk rating classifications based on review of current information about the borrowers’ ability to continue to service the debt. This review includes historical and current payment performance, financial information, economic trends, credit ratings, and other data that may become available during the credit review process. Depending on the risk rating classification assigned, loans with outstanding balances in excess of $250,000, as well as commercial loans and commercial real estate loans not part of a homogeneous pool, are analyzed individually. This analysis is performed at least annually. Definitions of the risk rating classifications used by the Bank are as follows.
Pass: Loans in this classification are considered to have an acceptable level of risk. Management does not believe the Bank will incur losses in these loans.
Special Mention: Loans classified as special mention have a potential weakness that deserves management’s close attention and, if left uncorrected, could result in the weakening of the borrowers’ ability to repay the Bank in the future.
Substandard: Loans in this classification are not adequately covered by the net worth and/or current repayment capacity of the borrowers or by the collateral if on a secured basis. Such loans are noted to have a defined weakness that could jeopardize the ultimate liquidation of the debt and are believed to possess a reasonable likelihood of causing loss to the Bank if the weaknesses are not remedied.
Doubtful: Loans classified as doubtful have all of the weaknesses inherent in those loans classified as substandard, in addition to added characteristics that such weaknesses make the collection of the debt in full, on the basis of currently existing facts and conditions, highly unlikely.
F-80
Table of Contents
Index to Financial Statements
UNITED GROUP BANKING COMPANY OF FLORIDA, INC. AND SUBSIDIARIES
NOTES TO CONSOLIDATED FINANCIAL STATEMENTS (Continued)
DECEMBER 31, 2013 AND 2012
NOTE 3 – LOANS RECEIVABLE AND THE ALLOWANCE FOR LOAN LOSSES (Continued)
Credit Quality (Continued):
As of December 31, 2013 and 2012, based on the most recent analysis performed, the risk classifications of loans by segment is as follows:
Credit Exposure Based on Risk Ratings:
| Pass | Special Mention |
Substandard | Doubtful | |||||||||||||
| December 31, 2013 – |
||||||||||||||||
| Loan Category |
||||||||||||||||
| Real estate – commercial |
$ | 72,355,170 | $ | 2,926,369 | $ | 241,778 | $ | -0- | ||||||||
| Real estate – residential |
33,881,783 | 222,349 | 2,087,962 | -0- | ||||||||||||
| Real estate – construction, development, land |
8,205,380 | 173,468 | 1,169,270 | -0- | ||||||||||||
| Commercial |
18,262,904 | 2,036 | 150,763 | -0- | ||||||||||||
| Consumer and other |
7,372,760 | 104,093 | 103,780 | -0- | ||||||||||||
|
|
|
|
|
|
|
|
|
|||||||||
| $ | 140,077,997 | $ | 3,428,315 | $ | 3,753,553 | $ | -0- | |||||||||
|
|
|
|
|
|
|
|
|
|||||||||
| December 31, 2012 – |
||||||||||||||||
| Loan Category |
||||||||||||||||
| Real estate – commercial |
$ | 59,465,915 | $ | 1,703,757 | $ | 1,766,181 | $ | -0- | ||||||||
| Real estate – residential |
33,192,970 | 468,035 | 3,012,515 | -0- | ||||||||||||
| Real estate – construction, development, land |
7,792,924 | -0- | 1,321,180 | -0- | ||||||||||||
| Commercial |
16,784,868 | -0- | 156,304 | -0- | ||||||||||||
| Consumer and other |
8,463,693 | 176,871 | 218,553 | -0- | ||||||||||||
|
|
|
|
|
|
|
|
|
|||||||||
| $ | 125,700,370 | $ | 2,348,663 | $ | 6,474,733 | $ | -0- | |||||||||
|
|
|
|
|
|
|
|
|
|||||||||
The Bank services loans for RBCF. The balance of loans serviced at December 31, 2013 and 2012 was approximately $1.9 and $1.8 million, respectively, with servicing income for 2013 and 2012 of approximately $13,3260,000 and $19,0070, respectively.
NOTE 4 – PREMISES AND EQUIPMENT
Premises and equipment were comprised of the following components at December 31, 2013 and 2012:
| 2013 | 2012 | |||||||
| Land and land improvements |
$ | 6,478,628 | $ | 6,478,628 | ||||
| Buildings and improvements |
1,580,349 | 1,574,046 | ||||||
| Furniture and equipment |
2,688,026 | 2,434,665 | ||||||
| Leasehold improvements |
610,493 | 492,298 | ||||||
|
|
|
|
|
|||||
| 11,357,496 | 10,979,637 | |||||||
| Less: Accumulated depreciation and amortization |
(2,905,713 | ) | (2,600,406 | ) | ||||
|
|
|
|
|
|||||
| $ | 8,451,783 | $ | 8,379,231 | |||||
|
|
|
|
|
|||||
Depreciation and amortization charged against operations was $305,308 and $292,067 for 2013 and 2012, respectively.
Leases:
The Bank leases its Winter Park branch location under a lease expiring in November 2014. This lease has two optional one-year extensions, each extension includes a 2% increase in base rent. The Bank leases its Kissimmee branch location under a lease expiring in January 2016.
F-81
Table of Contents
Index to Financial Statements
UNITED GROUP BANKING COMPANY OF FLORIDA, INC. AND SUBSIDIARIES
NOTES TO CONSOLIDATED FINANCIAL STATEMENTS (Continued)
DECEMBER 31, 2013 AND 2012
NOTE 4 – PREMISES AND EQUIPMENT (Continued)
Leases (Continued):
The Bank leases office equipment under leases expiring through 2015.
Future minimum lease payments under the operating leases in years ending after December 31, 2013, are as follows:
| 2014 |
$ | 354,459 | ||
| 2015 |
97,850 | |||
| 2016 |
3,017 | |||
|
|
|
|||
| Total future minimum lease payments |
$ | 455,326 | ||
|
|
|
The total lease expense charged to operations under all operating leases was $353,937 and $340,095 for 2013 and 2012, respectively.
NOTE 5 – FORECLOSED REAL ESTATE
The Bank owns real estate acquired through foreclosure, or sometimes a deed in lieu of foreclosure, on defaulted loans. Foreclosed real estate at year-end, and activity during 2013 and 2012, follows:
| 2013 | 2012 | |||||||
| Beginning balance |
$ | 1,101,896 | $ | 1,662,008 | ||||
| Transfers in from loans |
-0- | 1,157,034 | ||||||
| Additional write-downs |
-0- | -0- | ||||||
| Sales of properties |
(999,699 | ) | (1,717,146 | ) | ||||
|
|
|
|
|
|||||
| Ending balance |
$ | 102,197 | $ | 1,101,896 | ||||
|
|
|
|
|
|||||
The Bank had other repossessed assets of $470,901 and $471,587 at December 31, 2013 and 2012, respectively, which are included in “other assets” in the consolidated statements of financial condition. Foreclosed real estate and repossessed asset expense as shown on the consolidated statements of income includes realized and unrealized losses, as well as ongoing property and maintenance expenses.
NOTE 6 – TIME DEPOSITS
The aggregate amount of time deposits with a minimum denomination of $100,000 was approximately $43 million and $44 million at December 31, 2013 and 2012, respectively. At December 31, 2013, the scheduled maturities of time deposits are as follows:
| 2014 |
$ | 32,112,431 | ||
| 2015 |
9,653,048 | |||
| 2016 |
10,106,107 | |||
| 2017 |
843,628 | |||
| 2018 |
3,295,114 | |||
|
|
|
|||
| $ | 56,010,328 | |||
|
|
|
NOTE 7 – STOCKHOLDERS’ EQUITY
The payment of dividends by the Bank is subject to regulatory restrictions which require, among other things, that dividends be paid only from net profits of the current and immediately preceding two years. The payment of dividends by the Company is generally dependent upon dividends it receives from the Bank. Accordingly, there can be no assurance that the Bank or the Company will pay dividends in the near future.
F-82
Table of Contents
Index to Financial Statements
UNITED GROUP BANKING COMPANY OF FLORIDA, INC. AND SUBSIDIARIES
NOTES TO CONSOLIDATED FINANCIAL STATEMENTS (Continued)
DECEMBER 31, 2013 AND 2012
NOTE 8 – SHORT-TERM BORROWINGS
The Bank periodically borrows on a short-term basis through the purchase of federal funds. The amount outstanding under this borrowing was $5,000,000 and $0 at December 31, 2013 and 2012, respectively. Related interest expense was $422 and $0 in 2013 and 2012, respectively. Federal funds purchased are on an unsecured basis.
NOTE 9 – FHLB ADVANCES
The Bank has several lines of credit available from the Federal Home Loan Bank, (“FHLB”) under which it may borrow long-term debt under various terms, including maturity, convertibility, and interest rate method. The availability of funds under these borrowings is subject to a pledge of a portion of the Bank’s loan portfolio, limited to 20% of the Bank’s total assets. There are substantial penalties in the event of prepayment. There were no advances at December 31, 2012.
The amounts outstanding under these lines at December 31, 2013, are shown in the table which follows:
| Balance | Fixed Rate | Maturity | ||||||||||
| Fixed rate advance |
$ | 3,000,000 | 0.64 | % | 09/17/2015 | |||||||
| Fixed rate advance |
500,000 | 0.52 | % | 09/26/2015 | ||||||||
| Fixed rate advance |
860,000 | 0.52 | % | 10/16/2015 | ||||||||
| Fixed rate advance |
505,000 | 0.47 | % | 10/29/2015 | ||||||||
|
|
|
|||||||||||
| $ | 4,865,000 | |||||||||||
|
|
|
|||||||||||
NOTE 10 – INCOME TAXES
Components of the deferred income tax expense (benefit) for 2013 and 2012 are as follows:
| 2013 | 2012 | |||||||
| Federal |
$ | 89,916 | $ | (406,321 | ) | |||
| State |
15,768 | (43,381 | ) | |||||
|
|
|
|
|
|||||
| $ | 105,684 | $ | (449,702 | ) | ||||
|
|
|
|
|
|||||
A reconciliation of income tax expense (benefit) that would be expected at the statutory 34% federal income tax rate and the actual income tax for 2013 and 2012 follows:
| 2013 | 2012 | |||||||
| Expected income taxes |
$ | 63,594 | $ | (29,500 | ) | |||
| State income tax |
10,407 | 1,391 | ||||||
| Incentive stock options |
37,229 | 38,072 | ||||||
| Bank-owned life insurance |
(20,360 | ) | (13,679 | ) | ||||
| Other permanent differences |
14,814 | 18,140 | ||||||
| Federal and State tax benefit from release of valuation allowance |
-0- | (464,126 | ) | |||||
|
|
|
|
|
|||||
| $ | 105,684 | $ | (449,702 | ) | ||||
|
|
|
|
|
|||||
F-83
Table of Contents
Index to Financial Statements
UNITED GROUP BANKING COMPANY OF FLORIDA, INC. AND SUBSIDIARIES
NOTES TO CONSOLIDATED FINANCIAL STATEMENTS (Continued)
DECEMBER 31, 2013 AND 2012
NOTE 10 – INCOME TAXES (Continued)
Significant components of deferred tax assets and liabilities at December 31, 2013 and 2012, are as follows:
| 2013 | 2012 | |||||||
| Deferred tax assets: |
||||||||
| Net operating loss carryforward |
$ | 4,164,950 | $ | 4,051,197 | ||||
| Allowance for loan losses |
844,170 | 860,179 | ||||||
| Foreclosed assets |
-0- | 210,442 | ||||||
| Nonaccrual loans |
48,080 | 69,146 | ||||||
| Charitable contributions |
10,163 | 5,161 | ||||||
| Unrealized loss on securities available for sale |
1,115,058 | 161,155 | ||||||
|
|
|
|
|
|||||
| 6,182,421 | 5,357,280 | |||||||
|
|
|
|
|
|||||
| Deferred tax liabilities: |
||||||||
| Accumulated depreciation and amortization |
(113,371 | ) | (112,399 | ) | ||||
| Cash to accrual liability |
-0- | (24,051 | ) | |||||
|
|
|
|
|
|||||
| (113,371 | ) | (136,450 | ) | |||||
|
|
|
|
|
|||||
| $ | 6,069,050 | $ | 5,220,830 | |||||
|
|
|
|
|
|||||
At December 31, 2013, management believes it is more likely than not that future earnings will be sufficient to afford the ultimate realization of the deferred tax assets. During 2012, there was a reduction in the valuation allowance relating to the deferred tax assets of $464,126.
At December 31, 2013, the Company has net operating loss carryforwards of approximately $11.1 million to offset taxable income in future years until its use or expiration in 2030 through 2033. The Company’s ability to utilize these benefits could be limited in the event of a change of control as defined by the Internal Revenue Service.
NOTE 11 – RETIREMENT PLANS
The Bank has established a savings plan under Section 401(k) of the Internal Revenue Code. This plan allows employees to defer up to 15% of their income on a pre-tax basis through contributions to the plan. For every dollar the employee contributes, the Bank may contribute a discretionary matching contribution at the sole option of the Board. A matching contribution of approximately $25,000 was made relating to both periods ending December 31, 2013 and 2012.
NOTE 12 – STOCK-BASED COMPENSATION
The Company’s shareholders have approved a stock option plan for the Bank’s employees. The plan authorizes reserving up to 4,900,000 shares of the Company’s common stock for issuance under the plan. Options issued expire ten years after issuance, if not exercised earlier, and vest over a five-year period. Options granted have an exercise price at least equal to, if not more than, the deemed fair value of an underlying share of stock at the date of issuance.
F-84
Table of Contents
Index to Financial Statements
UNITED GROUP BANKING COMPANY OF FLORIDA, INC. AND SUBSIDIARIES
NOTES TO CONSOLIDATED FINANCIAL STATEMENTS (Continued)
DECEMBER 31, 2013 AND 2012
NOTE 12 – STOCK-BASED COMPENSATION (Continued)
Option activity for 2013 and 2012 is as follows:
| 2013 | 2012 | |||||||||||||||||||||||
| Number | Weighted Average Exercise Price |
Fair Value |
Number | Weighted Average Exercise Price |
Fair Value |
|||||||||||||||||||
| Outstanding at January 1 |
1,775,000 | $ | 1.35 | 0.31 | 1,867,000 | $ | 1.35 | 0.31 | ||||||||||||||||
| Granted |
-0- | -0- | -0- | 63,000 | 1.40 | 0.41 | ||||||||||||||||||
| Forfeited |
-0- | -0- | -0- | (155,000 | ) | 1.35 | 0.31 | |||||||||||||||||
|
|
|
|
|
|
|
|
|
|
|
|
|
|||||||||||||
| Outstanding at December 31 |
1,775,000 | $ | 1.35 | $ | 0.31 | 1,775,000 | $ | 1.35 | $ | 0.31 | ||||||||||||||
|
|
|
|
|
|
|
|
|
|
|
|
|
|||||||||||||
| Exercisable at end of year |
1,014,800 | $ | 1.35 | $ | 0.31 | |||||||||||||||||||
|
|
|
|
|
|
|
|||||||||||||||||||
The Company uses the Black-Scholes option pricing model to estimate the fair value of a stock option granted. Assumptions used in the pricing model for options granted during 2012 were as follows:
| Stock price |
$ | 1.25 | ||
| Average exercise price |
$ | 1.40 | ||
| Expected term before exercise |
6.5 years | |||
| Estimated volatility |
36.00 | % | ||
| Average risk-free interest rate |
1.18 | % | ||
| Average fair value of options granted |
$ | 0.41 |
The expected term of the options is based on management’s estimates, coupled with certain regulatory guidance. The volatility is also based on management’s estimate, coupled with comparison to volatility factors of peer banks, where known. The average risk-free interest rate is based on the U.S. Treasury yield curve for securities with terms similar to the expected term of the options.
The average remaining contractual term is 6.4 years. Stock-based compensation for 2013 and 2012 was $109,497 and $111,976, respectively. At December 31, 2013, there is approximately $158,000 of unrecognized compensation expense relating to nonvested options. This amount will be recognized as expense ratably as these options vest over a weighted average vesting period of 16 months.
NOTE 13 – COMMITMENTS AND CONTINGENCIES
Financial Instruments With Off-Balance-Sheet Risk:
The Bank is a party to financial instruments with off-balance-sheet risk in the normal course of business to meet the financing needs of its customers. These financial instruments include commitments to extend credit and letters of credit. These instruments involve, to varying degrees, elements of credit and interest-rate risk in excess of the amount recognized in the consolidated statements of financial condition.
The Bank’s exposure to credit loss is represented by the contractual amount of these commitments. The Bank follows the same credit policies in making such commitments as it does for on-balance-sheet instruments.
At December 31, the following financial instruments were outstanding whose contract amounts represent credit risk:
| 2013 | 2012 | |||||||
| Commitments to extend credit |
$ | 27,700,000 | $ | 21,700,000 | ||||
|
|
|
|
|
|||||
| Letters of credit |
$ | 233,000 | $ | 106,000 | ||||
|
|
|
|
|
|||||
F-85
Table of Contents
Index to Financial Statements
UNITED GROUP BANKING COMPANY OF FLORIDA, INC. AND SUBSIDIARIES
NOTES TO CONSOLIDATED FINANCIAL STATEMENTS (Continued)
DECEMBER 31, 2013 AND 2012
NOTE 13 – COMMITMENTS AND CONTINGENCIES (Continued)
Financial Instruments With Off-Balance-Sheet Risk (Continued):
Commitments to extend credit represent legally binding agreements to lend to customers with fixed expiration dates or other termination clauses. Since many commitments are expected to expire without being funded, committed amounts do not necessarily represent future liquidity requirements. The amount of collateral obtained, if any, as well as any liability for off-balance-sheet credit losses, is based on management’s credit evaluation in the same manner as though an immediate credit extension were to be granted, weighted by the likelihood of eventual funding. Management believes any liability associated with potential losses on unfunded commitments is not significant.
Stand-by letters of credit are conditional commitments issued by the Bank guaranteeing the performance of a customer to a third party. The decision whether to guarantee such performance and the extent of collateral requirements are made considering the same factors as are considered in credit extension. At December 31, 2013, management believes that eventual performance by the Bank under these guarantees is unlikely.
Accounting standards require guarantors to recognize, at the inception of a guarantee, a liability in an amount equal to the fair value of the obligation undertaken in issuing the guarantee. They further require certain disclosures about the maximum potential payments that might be required, as well as the collateral or other recourse obtainable. For the Company, the amount of the liability related to guarantees outstanding at December 31, 2013 and 2012, is not significant and is recorded as income upon collection of the fee accepted as fair value for the guarantee.
The Company expects no significant losses to be realized in the performance of its obligations under any of the above instruments.
Lines of Credit:
The Bank has unsecured federal funds lines of credit of $12.8 million available from its correspondent banks. Additionally, the Bank has $5 million available on a secured basis.
NOTE 14 – RELATED PARTY TRANSACTIONS
Certain officers and directors, and companies in which they held a 10 percent or more beneficial ownership, were indebted (or, in some cases, guaranteed loans) to the Bank. Amounts due from these parties at December 31, 2013 and 2012, were approximately $13.0 million and $12.3 million, respectively. Such loans were made in the normal course of business at prevailing interest rates and terms.
Principal stockholders, executives, and directors combined with companies in which they hold a least a 10 percent beneficial ownership, maintain substantial deposits with the Bank. Such deposits have been accepted under normal terms and, where interest-bearing, at prevailing rates, and total approximately $11.8 million and $19.2 million at December 31, 2013 and 2012, respectively.
NOTE 15 – CONCENTRATIONS OF CREDIT RISK
The Bank originates loans primarily in Orange, Seminole, and Osceola counties, Florida. In addition, the Bank may occasionally purchase loans. Although the Bank has a diversified loan portfolio, the Bank’s borrowers’ ability to repay their loans is dependent upon numerous factors that might be impacted by the overall economic conditions in the Bank’s market area.
At various times throughout the year, the Bank maintains cash balances with other financial institutions which exceed federally insured limits. The Bank monitors the capital adequacy of these financial institutions on a quarterly basis.
F-86
Table of Contents
Index to Financial Statements
UNITED GROUP BANKING COMPANY OF FLORIDA, INC. AND SUBSIDIARIES
NOTES TO CONSOLIDATED FINANCIAL STATEMENTS (Continued)
DECEMBER 31, 2013 AND 2012
NOTE 16 – REGULATORY MATTERS
The Bank is subject to various regulatory capital requirements administered by the federal banking agencies. Failure to meet minimum capital requirements can initiate certain mandatory – and possibly additional discretionary – actions by regulators that, if undertaken, could have a direct material effect on the Bank’s financial statements. Under capital adequacy guidelines and the regulatory framework for prompt corrective action, the Bank must meet specific capital guidelines that involve quantitative measures of the Bank’s assets, liabilities, and certain off-balance-sheet items as calculated under regulatory accounting practices. The Bank’s capital amounts and classification are also subject to qualitative judgments by the regulators about components, risk weightings, and other factors.
Quantitative measures established by regulation to ensure capital adequacy require the Bank to maintain minimum amounts and ratios of Total and Tier 1 capital to risk-weighted assets, and of Tier 1 capital to average assets. If such minimum amounts and ratios are met, the Bank is considered “adequately capitalized.” If a bank exceeds the requirements of “adequately capitalized,” and meets even more stringent minimum standards, it is considered to be “well capitalized.” Deferred tax assets, the realization of which is dependent upon positive taxable income beyond the next 12 months, are treated as a reduction of assets and equity for purposes of computing regulatory capital ratios. Management believes that as of December 31, 2013, the Bank meets and exceeds all capital adequacy requirements to which it is subject.
As of December 31, 2013, the most recent notification from the Bank’s regulatory agency categorized the Bank as well capitalized under the regulatory framework for prompt corrective action. To be categorized as well capitalized, the Bank must maintain Total risk-based, Tier 1 risk-based, and Tier 1 leverage ratios as set forth in the table which follows. There are no conditions or events since that notification that management believes have changed the institution’s category. The Bank’s actual capital amounts and ratios as of December 31, 2013 and 2012 are presented in the table below:
| Actual | Minimum Capital Requirement: |
Minimum To Be Well Capitalized Under Prompt Corrective Action and Consent Order: |
||||||||||||||||||||||
| Amount | Ratio | Amount | Ratio | Amount | Ratio | |||||||||||||||||||
| As of December 31, 2013: |
||||||||||||||||||||||||
| Total Capital |
$ | 21,681,000 | 13.05 | % | ³$ | 13,288,000 | ³ | 8.00 | % | ³$ | 16,609,000 | ³ | 10.00 | % | ||||||||||
| Tier I Capital |
$ | 19,609,000 | 11.81 | % | ³$ | 6,644,000 | ³ | 4.00 | % | ³$ | 9,966,000 | ³ | 6.00 | % | ||||||||||
| Tier I Capital |
$ | 19,609,000 | 9.23 | % | ³$ | 8,493,000 | ³ | 4.00 | % | ³$ | 10,617,000 | ³ | 5.00 | % | ||||||||||
| As of December 31, 2012: |
||||||||||||||||||||||||
| Total Capital |
$ | 20,302,000 | 12.54 | % | ³$ | 12,956,000 | ³ | 8.00 | % | ³$ | 16,195,000 | ³ | 10.00 | % | ||||||||||
| Tier I Capital |
$ | 18,274,000 | 11.28 | % | ³$ | 6,478,000 | ³ | 4.00 | % | ³$ | 9,717,000 | ³ | 6.00 | % | ||||||||||
| Tier I Capital |
$ | 18,274,000 | 8.97 | % | ³$ | 8,149,000 | ³ | 4.00 | % | ³$ | 10,187,000 | ³ | 5.00 | % | ||||||||||
F-87
Table of Contents
Index to Financial Statements
UNITED GROUP BANKING COMPANY OF FLORIDA, INC. AND SUBSIDIARIES
NOTES TO CONSOLIDATED FINANCIAL STATEMENTS (Continued)
DECEMBER 31, 2013 AND 2012
NOTE 17 – FAIR VALUE MEASUREMENT
Generally accepted accounting principles establish a fair value hierarchy which requires an entity to maximize the use of observable inputs and minimize the use of unobservable inputs when measuring fair value. The accounting standard describes three levels of inputs that may be used to measure fair value:
Level 1: Quoted prices (unadjusted) for identical assets or liabilities in active markets that the entity has the ability to access at the measurement date.
Level 2: Significant other observable inputs other than Level 1 prices, such as quoted prices for similar assets or liabilities; quoted prices in markets that are not active; or other inputs that are observable or can be corroborated by observable market data.
Level 3: Significant unobservable inputs that reflect an entity’s own assumptions that market participants would use in pricing an asset or liability.
The fair value of investment securities are determined by matrix pricing, which is a mathematical technique widely used in the industry to value debt securities without relying exclusively on quoted prices for the specific securities but rather by relying on the securities’ relationship to other benchmark quoted securities (Level 2 inputs).
The carrying amount of cash surrender value of life insurance is based on information received from the insurance carriers indicating the performance of the policies and the amount the Bank would receive if the policies were surrendered.
Assets and liabilities measured at fair value on a recurring basis are summarized below:
| Total carrying value in the consolidated statements of financial condition |
Quoted market prices in an active market (Level 1) |
Internal models with significant observable market parameters (Level 2) |
Internal models with significant unobservable market parameters (Level 3) |
|||||||||||||
| December 31, 2013 – |
||||||||||||||||
| Available-for-sale securities |
$42,907,000 | $-0- | $42,907,000 | $-0- | ||||||||||||
| Cash surrender value of life insurance |
2,098,000 | -0- | 2,098,000 | -0- | ||||||||||||
| December 31, 2012 – |
||||||||||||||||
| Available-for-sale securities |
$43,308,000 | $-0- | $43,308,000 | $-0- | ||||||||||||
| Cash surrender value of life insurance |
2,038,000 | -0- | 2,038,000 | -0- | ||||||||||||
Assets and liabilities measured at fair value on a nonrecurring basis are as follows:
| Total carrying value in the consolidated statements of financial condition |
Quoted market prices in an active market (Level 1) |
Internal models with significant observable market parameters (Level 2) |
Internal models with significant unobservable market parameters (Level 3) |
|||||||||||||
| December 31, 2013 – |
||||||||||||||||
| Impaired loans, net of specific reserves |
$5,210,000 | $-0- | $-0- | $5,210,000 | ||||||||||||
| Foreclosed real estate |
102,000 | -0- | -0- | 102,000 | ||||||||||||
| December 31, 2012 – |
||||||||||||||||
| Impaired loans, net of specific reserves |
$6,578,000 | $-0- | $-0- | $6,578,000 | ||||||||||||
| Foreclosed real estate |
1,102,000 | -0- | -0- | 1,102,000 | ||||||||||||
F-88
Table of Contents
Index to Financial Statements
UNITED GROUP BANKING COMPANY OF FLORIDA, INC. AND SUBSIDIARIES
NOTES TO CONSOLIDATED FINANCIAL STATEMENTS (Continued)
DECEMBER 31, 2013 AND 2012
NOTE 17 – FAIR VALUE MEASUREMENT (Continued)
The fair value of impaired loans with specific allocations of the allowance for loan losses is generally based on recent appraisals. These appraisals may utilize a single valuation approach or a combination of approaches including comparable sales and the income approach.
The fair value of the Bank’s foreclosed real estate is determined using Level 3 inputs which include, among other things, current and prior appraisals, less costs to sell.
NOTE 18 – FAIR VALUE OF FINANCIAL INSTRUMENTS
The tables which follow show the estimated fair value and the related carrying amounts of the Company’s financial instruments at December 31, 2013 and 2012.
The estimated fair value for cash and cash equivalents and interest-bearing time deposits in other banks is considered to approximate their carrying amounts. The estimated fair value for securities available for sale is based on valuation techniques as discussed in Note 17. The estimated fair value for loans is based on interest rates the Bank would have charged borrowers at December 31, 2013 and 2012, for similar loans, maturities and terms.
The estimated fair value for demand and savings deposits is based on their carrying amount. The estimated fair value for time deposits is based on rates the Bank offered at December 31, 2013 and 2012, for deposits of similar remaining maturities. Assets and liabilities of the Company that are not defined as financial instruments, such as premises and equipment, are excluded from these disclosures.
| 2013 | 2012 | |||||||||||||||
| Carrying Amount |
Fair Value |
Carrying Amount |
Fair Value |
|||||||||||||
| Financial assets: |
||||||||||||||||
| Cash and cash equivalents |
$ | 11,986,000 | 11,986,000 | $ | 16,564,000 | 16,564,000 | ||||||||||
| Interest-bearing deposits in other banks |
25,000 | 25,000 | 25,000 | 25,000 | ||||||||||||
| Securities available for sale |
42,907,000 | 42,907,000 | 43,308,000 | 43,308,000 | ||||||||||||
| Loans receivable |
145,022,000 | 145,428,000 | 132,324,000 | 134,830,000 | ||||||||||||
| Accrued interest receivable |
562,000 | 562,000 | 467,000 | 467,000 | ||||||||||||
| Financial liabilities: |
||||||||||||||||
| Deposits |
182,118,000 | 182,457,000 | 182,884,000 | 183,573,000 | ||||||||||||
| FHLB advances and debt |
9,865,000 | 9,865,000 | -0- | -0- | ||||||||||||
| Accrued interest payable |
33,000 | 33,000 | 47,000 | 47,000 | ||||||||||||
Nonfinancial instruments typically not recognized in the consolidated financial statements may nevertheless have value but are not included in the above disclosures. These include, among other items, the estimated earnings power of core deposit accounts, the earnings potential of loan servicing rights, customer goodwill, and similar items.
While these estimates of fair value are based on management’s judgment of the most appropriate factors, there is no assurance that, were the Company to have disposed of such items, the estimated fair values would necessarily have been achieved at that date, since market values may differ depending on various circumstances. The estimated fair values should not necessarily be considered to apply at subsequent dates.
F-89
Table of Contents
Index to Financial Statements
UNITED GROUP BANKING COMPANY OF FLORIDA, INC. AND SUBSIDIARIES
NOTES TO CONSOLIDATED FINANCIAL STATEMENTS (Continued)
DECEMBER 31, 2013 AND 2012
NOTE 19 – PARENT COMPANY ONLY
| December 31, | ||||||||
| 2013 | 2012 | |||||||
| Statements of Financial Condition | ||||||||
| Assets: |
||||||||
| Cash |
$ | 1,735,519 | $ | 1,916,756 | ||||
| Investment in Bank subsidiary |
21,986,031 | 22,713,107 | ||||||
| Investment in non-bank subsidiary |
2,903,255 | 3,129,060 | ||||||
| Deferred income taxes |
332,973 | 255,052 | ||||||
| Other assets |
-0- | 307 | ||||||
|
|
|
|
|
|||||
| Total Assets |
$ | 26,957,778 | $ | 28,014,282 | ||||
|
|
|
|
|
|||||
| Liabilities and Stockholders’ Equity: |
||||||||
| Liabilities |
$ | -0- | $ | -0- | ||||
| Stockholders’ equity |
26,957,778 | 28,014,282 | ||||||
|
|
|
|
|
|||||
| Total Liabililities and Stockholders’ Equity |
$ | 26,957,778 | $ | 28,014,282 | ||||
|
|
|
|
|
|||||
| Year Ended December 31, | ||||||||
| 2013 | 2012 | |||||||
| Statements of Income | ||||||||
| Expense: |
||||||||
| Other expenses |
$ | 215,237 | $ | 100,112 | ||||
|
|
|
|
|
|||||
| Loss before income tax benefit and equity in subsidiaries’ operations |
(215,237 | ) | (100,112 | ) | ||||
| Income tax benefit |
77,921 | 37,672 | ||||||
|
|
|
|
|
|||||
| Loss before equity in subsidiaries’ operations |
(137,316 | ) | (62,440 | ) | ||||
| Equity in income (loss) of subsidiaries’ operations: |
||||||||
| Bank |
444,478 | 623,322 | ||||||
| RBCF |
(225,805 | ) | (197,945 | ) | ||||
|
|
|
|
|
|||||
| Total equity in income of subsidiaries’ operations |
218,673 | 425,377 | ||||||
|
|
|
|
|
|||||
| Net Income |
$ | 81,357 | $ | 362,937 | ||||
|
|
|
|
|
|||||
F-90
Table of Contents
Index to Financial Statements
UNITED GROUP BANKING COMPANY OF FLORIDA, INC. AND SUBSIDIARIES
NOTES TO CONSOLIDATED FINANCIAL STATEMENTS (Continued)
DECEMBER 31, 2013 AND 2012
NOTE 19 – PARENT COMPANY ONLY (Continued)
| Year Ended December 31, | ||||||||
| 2013 | 2012 | |||||||
| Statements of Cash Flows | ||||||||
| Cash Flows from Operating Activities: |
||||||||
| Net income |
$ | 81,357 | $ | 362,937 | ||||
| Adjustments to reconcile net income to net cash used in operating activities: |
||||||||
| Equity in undistributed income of Bank subsidiary |
(444,478 | ) | (623,322 | ) | ||||
| Equity in undistributed losses of non-bank subsidiary |
225,805 | 197,945 | ||||||
| Deferred income tax |
(77,921 | ) | (37,672 | ) | ||||
| Other assets |
307 | (307 | ) | |||||
|
|
|
|
|
|||||
| Net cash used in operating activities |
(214,930 | ) | (100,419 | ) | ||||
|
|
|
|
|
|||||
| Net Cash Flows From Investing Activities: |
||||||||
| Investment in Bank subsidiary |
(300,000 | ) | -0- | |||||
| Investment in non-bank subsidiary |
-0- | (950,000 | ) | |||||
|
|
|
|
|
|||||
| Net cash used in investing activities |
(300,000 | ) | (950,000 | ) | ||||
|
|
|
|
|
|||||
| Net Cash Flows From Financing Activities: |
||||||||
| Sale of common stock, net of offering costs |
333,693 | 1,935,137 | ||||||
| Acquisition of treasury stock |
-0- | (120,000 | ) | |||||
|
|
|
|
|
|||||
| Net cash provided by financing activities |
333,693 | 1,815,137 | ||||||
|
|
|
|
|
|||||
| Net change in cash |
(181,237 | ) | 764,718 | |||||
| Cash at beginning of year |
1,916,756 | 1,152,038 | ||||||
|
|
|
|
|
|||||
| Cash at end of year |
$ | 1,735,519 | $ | 1,916,756 | ||||
|
|
|
|
|
|||||
F-91
Table of Contents
Index to Financial Statements
UNAUDITED CONSOLIDATED BALANCE SHEETS
| June 30, 2014 |
December 31, 2013 |
|||||||
| ASSETS | ||||||||
| CURRENT ASSETS |
||||||||
| Cash |
$ | 266,354 | $ | 611,554 | ||||
| Accounts receivable, less allowance for doubtful accounts of $174,803 and 174,863 |
77,896,083 | 57,912,600 | ||||||
| Prepaid expenses |
85,482 | 21,606 | ||||||
|
|
|
|
|
|||||
| Total current assets |
78,247,919 | 58,545,760 | ||||||
| PREMISES AND EQUIPMENT, NET |
571,383 | 589,649 | ||||||
| OTHER ASSETS |
5,366 | 5,366 | ||||||
|
|
|
|
|
|||||
| TOTAL ASSETS |
$ | 78,824,668 | $ | 59,140,775 | ||||
|
|
|
|
|
|||||
| LIABILITIES AND MEMBERS’ EQUITY | ||||||||
| CURRENT LIABILITIES |
||||||||
| Subordinated debt |
$ | 3,700,000 | $ | 4,000,000 | ||||
| Cash overdraft |
1,528,646 | 1,375,982 | ||||||
| Accrued reserve |
6,136,022 | 3,233,791 | ||||||
| Earned reserve |
921,884 | 767,005 | ||||||
| Carrier payable |
462,857 | — | ||||||
| Accounts payable and accrued liabilities |
312,258 | 267,529 | ||||||
|
|
|
|
|
|||||
| Total current liabilities |
13,061,667 | 9,644,307 | ||||||
| NOTE PAYABLE |
54,256,887 | 38,747,336 | ||||||
| MEMBERS’ EQUITY |
11,506,114 | 10,749,132 | ||||||
|
|
|
|
|
|||||
| TOTAL LIABILITIES AND MEMBERS’ EQUITY |
$ | 78,824,668 | $ | 59,140,775 | ||||
|
|
|
|
|
|||||
See accompanying notes
F-92
Table of Contents
Index to Financial Statements
UNAUDITED CONSOLIDATED STATEMENTS OF OPERATIONS
| For the Three Months Ended June 30, |
For the Six Months Ended June 30, |
|||||||||||||||
| 2014 | 2013 | 2014 | 2013 | |||||||||||||
| Discounts and fees earned |
$ | 3,006,272 | $ | 2,504,019 | $ | 5,605,687 | $ | 4,604,112 | ||||||||
| Operating expenses |
||||||||||||||||
| Salaries and employee benefits |
783,743 | 714,747 | 1,525,211 | 1,383,791 | ||||||||||||
| Bad debt expense |
84,083 | 177,809 | 165,901 | 312,109 | ||||||||||||
| Occupancy and equipment |
59,342 | 47,767 | 117,188 | 102,502 | ||||||||||||
| Other operating |
391,999 | 439,795 | 786,284 | 789,939 | ||||||||||||
|
|
|
|
|
|
|
|
|
|||||||||
| Total operating expenses |
1,319,167 | 1,380,118 | 2,594,584 | 2,588,341 | ||||||||||||
|
|
|
|
|
|
|
|
|
|||||||||
| Income from operations |
1,687,105 | 1,123,901 | 3,011,103 | 2,015,771 | ||||||||||||
| Other income (expense) |
||||||||||||||||
| Interest expense |
(469,296 | ) | (424,860 | ) | (866,747 | ) | (733,174 | ) | ||||||||
| Loss on foreign currency |
(34,364 | ) | (17,527 | ) | (37,374 | ) | (14,652 | ) | ||||||||
|
|
|
|
|
|
|
|
|
|||||||||
| Total other income (expense) |
(503,660 | ) | (442,387 | ) | (904,121 | ) | (747,826 | ) | ||||||||
|
|
|
|
|
|
|
|
|
|||||||||
| Net income |
$ | 1,183,445 | $ | 681,514 | $ | 2,106,982 | $ | 1,267,945 | ||||||||
|
|
|
|
|
|
|
|
|
|||||||||
See accompanying notes
F-93
Table of Contents
Index to Financial Statements
UNAUDITED CONSOLIDATED STATEMENT OF CHANGES IN MEMBERS’ EQUITY
Six Months Ended June 30,
| 2014 | 2013 | |||||||
| Beginning balance |
$ | 10,749,132 | $ | 8,895,146 | ||||
| Net income |
2,106,982 | 1,267,945 | ||||||
| Distributions to members |
(1,350,000 | ) | (885,001 | ) | ||||
|
|
|
|
|
|||||
| Ending balance |
$ | 11,506,114 | $ | 9,278,090 | ||||
|
|
|
|
|
|||||
See accompanying notes
F-94
Table of Contents
Index to Financial Statements
UNAUDITED CONSOLIDATED STATEMENT OF CASH FLOWS
Six Months Ended June 30,
| 2014 | 2013 | |||||||
| CASH FLOWS FROM OPERATING ACTIVITIES: |
||||||||
| Net income |
$ | 2,106,982 | $ | 1,267,945 | ||||
| Adjustments to reconcile net income to net cash used by operations: |
||||||||
| Depreciation and amortization |
32,586 | 33,048 | ||||||
| Bad debt expense |
165,901 | 312,109 | ||||||
| Unrealized (gain) loss on foreign currency |
(11,409 | ) | 8,667 | |||||
| (Increase) decrease in |
||||||||
| Accounts receivable |
(20,155,577 | ) | (21,819,969 | ) | ||||
| Prepaid expenses |
(63,876 | ) | (69,030 | ) | ||||
| Increase (decrease) in |
||||||||
| Accounts payable and accrued liabilities |
62,313 | 74,105 | ||||||
| Accrued reserve |
2,902,420 | 1,026,080 | ||||||
| Earned reserve |
154,708 | (76,322 | ) | |||||
| Carrier payable |
462,857 | — | ||||||
|
|
|
|
|
|||||
| Net cash used by operations |
(14,343,095 | ) | (19,243,367 | ) | ||||
| CASH FLOWS FROM INVESTING ACTIVITIES: |
||||||||
| Purchase of property and equipment |
(14,320 | ) | (7,984 | ) | ||||
| CASH FLOWS FROM FINANCING ACTIVITIES: |
||||||||
| Net borrowing on line of credit |
15,509,551 | 19,426,435 | ||||||
| Principal payments on subordinated debt |
(300,000 | ) | — | |||||
| Distributions to members |
(1,350,000 | ) | (885,001 | ) | ||||
|
|
|
|
|
|||||
| Net provided by financing activities |
13,859,551 | 18,541,434 | ||||||
|
|
|
|
|
|||||
| Net decrease in cash |
(497,864 | ) | (709,917 | ) | ||||
| CASH (CASH OVERDRAFT) |
||||||||
| Beginning of period |
(764,428 | ) | (844,718 | ) | ||||
|
|
|
|
|
|||||
| End of period |
$ | (1,262,292 | ) | $ | (1,554,635 | ) | ||
|
|
|
|
|
|||||
| CASH |
$ | 266,354 | $ | 417,758 | ||||
| CASH OVERDRAFT |
(1,528,646 | ) | (1,972,393 | ) | ||||
|
|
|
|
|
|||||
| Net cash overdraft |
$ | (1,262,292 | ) | $ | (1,554,635 | ) | ||
|
|
|
|
|
|||||
See accompanying notes
F-95
Table of Contents
Index to Financial Statements
NOTES TO THE UNAUDITED CONSOLIDATED FINANCIAL STATEMENTS
As of June 30, 2014 and December 31, 2013 and
Periods Ended June 30, 2014 and 2013
NOTE 1. SIGNIFICANT ACCOUNTING POLICIES
Basis of Presentation and Nature of Business
The financial statements include the accounts of CBI Holding Company, LLC (The Company) and its wholly owned operating company, Corporate Billing, LLC (Corporate Billing). Corporate Billing is a transaction based finance company engaged in the purchasing of accounts receivable at a discount from businesses throughout the United States and parts of Canada. Approximately 44% of Corporate Billing’s business is related to recourse billing, primarily in the transportation industry. The remaining 56% of the business is related to non-recourse billing, primarily in the automotive dealer and distributor industries.
Use of Estimates
The preparation of financial statements in accordance with generally accepted accounting principles requires management to make estimates and assumptions that affect the reported amounts of assets and liabilities, disclosure of contingent assets and liabilities at the date of the financial statements and the reported amounts of revenue and expenses during the period. Actual results could differ from those estimates.
Revenue Recognition
Corporate Billing recognizes revenue as it services and collects the purchased accounts receivable. As of June 30, 2014 and December 31, 2013, there was approximately $1,273,220 and $1,087,744, respectively, in unrecognized income included as a component of the accrued reserve.
Accounts Receivable
Accounts receivable are stated at the amount management expects to collect from outstanding balances. Management provides for probable uncollectible amounts through a charge to earnings and a credit to a valuation allowance based on its assessment of the current status of individual accounts. Balances that are still outstanding after management has used reasonable collection efforts are written off through a charge to the valuation allowance and a credit to accounts receivable. It is at least reasonably possible that the estimate of the valuation allowance will change within the next year.
Premises and Equipment
Premises and equipment are stated at cost. New equipment is capitalized whereas expenditures for repairs and maintenance are charged to expense when incurred. Depreciation is computed using straight-line and accelerated methods.
Income Taxes
The Company is classified as a partnership for income tax purposes. As members individually report their share of taxable income from the Company, no liability for Federal income taxes has been included in the consolidated financial statements.
Fair Value of Financial Instruments
The carrying values of the Company’s financial instruments, including cash, accounts receivable, accounts payable, and accrued liabilities, approximate their fair values.
Principles of Consolidation
The consolidated financial statements include the accounts of the Company and its wholly owned operating company, Corporate Billing. All material intercompany transactions have been eliminated.
F-96
Table of Contents
Index to Financial Statements
CBI HOLDING COMPANY, LLC
NOTES TO THE UNAUDITED CONSOLIDATED FINANCIAL STATEMENTS (Continued)
As of June 30, 2014 and December 31, 2013 and
Periods Ended June 30, 2014 and 2013
NOTE 1. SIGNIFICANT ACCOUNTING POLICIES (Continued)
Subsequent Events
Management has evaluated subsequent events through September 22, 2014, the date which the statements are available for issuance.
NOTE 2. SUBORDINATED DEBT
Subordinated debt is comprised of notes payable to some of the Company’s members as well as companies and trusts all related to the members. The notes bear interest, payable monthly, equal to the greater of 5% or the prime rate plus 1.75%. The notes are due upon demand; however, payment of the notes is subordinate to the line of credit.
NOTE 3. NOTE PAYABLE
Corporate Billing has a $75,000,000 revolving line of credit through First Tennessee Bank National Association acting as administrative agent on behalf of various participating lenders. The note bears interest, payable monthly, at the one month LIBOR plus 3.00% and matures July 31, 2016. The note is secured by substantially all the assets of Corporate Billing, as well as guarantees from the Company and limited guarantees from certain members of the Company.
The loan agreement contains various affirmative covenants including financial reporting requirements, maintaining a minimum tangible net worth, minimum debt to equity and debt service coverage ratios as well as requiring deposit accounts to be maintained with the administrative agent. The loan agreement also contains negative covenants including restricting new indebtedness, limiting the amount of distributions to members, limiting the amount of capital expenditures, and prohibiting the sale of any of its accounts receivable.
NOTE 4. MEMBERS’ EQUITY
The Company is operating as a Limited Liability Company. As such, each member’s liability as a unit holder is limited to their investment in the Company. The Company has two classes of units, common and preferred. Common units are nonvoting units; whereas preferred units are voting units. Profits and losses as well as distributions of cash generated by normal business operations are allocated based upon each member’s common percentage interest.
In the case of special events such as a merger or reorganization, the sale of substantially all assets of the Company or liquidation of the Company, distributions will first be made to preferred unit holders. Preferred unit holders will be entitled to receive their unreturned capital based upon their preferred percentage interest. Special event distributions in excess of the preferred unit holders’ unreturned capital will be allocated based upon each member’s common percentage interest unless special allocations are agreed upon by all members. Members’ equity is comprised of the following:
| June 30, 2014 |
December 31, 2013 |
|||||||
| Preferred |
$ | 4,000,000 | $ | 4,000,000 | ||||
| Common |
7,506,114 | 6,749,132 | ||||||
|
|
|
|
|
|||||
| Total |
$ | 11,506,114 | $ | 10,749,132 | ||||
|
|
|
|
|
|||||
F-97
Table of Contents
Index to Financial Statements
CBI HOLDING COMPANY, LLC
NOTES TO THE UNAUDITED CONSOLIDATED FINANCIAL STATEMENTS (Continued)
As of June 30, 2014 and December 31, 2013 and
Periods Ended June 30, 2014 and 2013
NOTE 5. CONCENTRATIONS
As discussed in NOTE 1, Corporate Billing is engaged in the purchase of accounts receivable at a discount from businesses in the transportation, automotive dealer, heavy duty truck dealer, heavy duty after market distributor and heavy duty truck repair industries; consequently, its ability to collect amounts due from these accounts may be affected by economic fluctuations in these industries. As of June 30, 2014 and December 31, 2013, Corporate Billing’s thirty largest debtors accounted for approximately 19% and 12%, respectively, of the purchased accounts receivable.
The Company maintains cash balances at various financial institutions throughout the United States and Canada. The United States accounts are insured by the Federal Deposit Insurance Corporation (FDIC) up to $250,000. The Canadian account is insured by the Canada Deposit Insurance Corporation (CDIC) up to $100,000 (CAD). As of June 30, 2014 and December 31, 2013, the Company’s cash balances on deposit, per the banks’ records, exceeded the insured limits by $613,896 and $1,061,766, respectively.
NOTE 6. RELATED PARTY TRANSACTIONS
As described in NOTE 2, all of the subordinated debt of the Company is from members or companies and trusts related to the members. During the periods ended June 30, 2014 and 2013, the Company incurred interest expense on the subordinated debt as follows:
| Three Months Ended June 30, 2014 |
Three Months Ended June 30, 2013 |
Six Months Ended June 30, 2014 |
Six Months Ended June 30, 2013 |
|||||||||
| $46,164 | $ | 49,863 | $ | 95,479 | $ | 99,178 | ||||||
NOTE 7. SUPPLEMENTAL CASH FLOW INFORMATION
During the six months ended June 30, 2014 and 2013, the Company paid $835,204 and $679,240, respectively, in interest.
NOTE 8. DERIVATIVES
In the ordinary course of business the Company purchases accounts receivable from companies located in Canada. The purchasing and the subsequent collecting of these receivables is facilitated through the Company’s Canadian bank account. As a result of these activities, the Company’s Canadian denominated accounts receivable and cash are subject to market risk from changes in foreign currency exchange rates. The Company mitigates this risk through the use of derivatives, specifically forward contracts. These contracts typically mature within twelve months. Gains and losses on these contracts are included in the consolidated statement of operations as a component of the gain (loss) on foreign currency. As of June 30, 2014 and December 31, 2013, the Company had contracts in place with a notional value of $1,500,000 Canadian dollars and accrued losses of $12,137 and $29,720, respectively.
F-98
Table of Contents
Index to Financial Statements
| TALLEY, MAULDIN & PEETE, P.C. | ||||
| CERTIFIED PUBLIC ACCOUNTANTS | ||||
| (256) 353-1421 | P.O. BOX 2067 | LARRY D. MAULDIN, CPA | ||
| FAX (256) 353-0961 | 906 WILSON STREET, N.E. | PRESTON E. PEETE, CPA | ||
| EMAIL INFO@TMPCPA.COM | DECATUR, ALABAMA 35602-2067 | |||
| WWW.TMPCPA.COM |
Management and the Board of Managers
CBI Holding Company, LLC
Report on the Financial Statements
We have audited the accompanying financial statements of CBI Holding Company, LLC and subsidiary which comprise the consolidated balance sheet as of December 31, 2013, and the related consolidated statements of operations, changes in members’ equity, and cash flows for the year then ended, and the related notes to the financial statements.
Management’s Responsibility for the Financial Statements
Management is responsible for the preparation and fair presentation of these financial statements in accordance with accounting principles generally accepted in the United States of America; this includes the design, implementation, and maintenance of internal control relevant to the preparation and fair presentation of financial statements that are free from material misstatement, whether due to fraud or error.
Auditor’s Responsibility
Our responsibility is to express an opinion on these financial statements based on our audit. We conducted our audit in accordance with auditing standards generally accepted in the United States of America. Those standards require that we plan and perform the audit to obtain reasonable assurance about whether the financial statements are free of material misstatement.
An audit involves performing procedures to obtain audit evidence about the amounts and disclosures in the financial statements. The procedures selected depend on the auditor’s judgment, including the assessment of the risks of material misstatement of the financial statements, whether due to fraud or error. In making those risk assessments, the auditor considers internal control relevant to the entity’s preparation and fair presentation of the financial statements in order to design audit procedures that are appropriate in the circumstances, but not for the purpose of expressing an opinion on the effectiveness of the entity’s internal control. Accordingly, we express no such opinion. An audit also includes evaluating the appropriateness of accounting policies used and the reasonableness of significant accounting estimates made by management, as well as evaluating the overall presentation of the financial statements.
We believe that the audit evidence we have obtained is sufficient and appropriate to provide a basis for our audit opinion.
Opinion
In our opinion, the financial statements referred to above present fairly, in all material respects, the financial position of CBI Holding Company, LLC and subsidiary as of December 31, 2013, and the results of its operations and its cash flows for the year then ended in accordance with accounting principles generally accepted in the United States of America.
Report on Supplementary Information
Our audit was conducted for the purpose of forming an opinion on the financial statements as a whole. The consolidated schedule of operating expenses, consolidating balance sheet and consolidating statement of operations are presented for purposes of additional analysis and are not a required part of the financial statements. Such information is the responsibility of management and was derived from and relates directly to
F-99
Table of Contents
Index to Financial Statements
the underlying accounting and other records used to prepare the financial statements. The information has been subjected to the auditing procedures applied in the audit of the financial statements and certain additional procedures, including comparing and reconciling such information directly to the underlying accounting and other records used to prepare the financial statements or to the financial statements themselves, and other additional procedures in accordance with auditing standards generally accepted in the United States of America. In our opinion, the information is fairly stated in all material respects in relation to the financial statements as a whole.
/s/ Talley, Mauldin & Peete, P.C.
Decatur, AL
May 30, 2014
MEMBERS OF AMERICAN INSTITUTE OF CERTIFIED PUBLIC ACCOUNTANTS AND ALABAMA SOCIETY OF CERTIFIED PUBLIC ACCOUNTANTS
F-100
Table of Contents
Index to Financial Statements
CONSOLIDATED BALANCE SHEET
December 31, 2013
ASSETS
| CURRENT ASSETS |
||||||||
| Cash |
$ | 611,554 | ||||||
| Accounts receivable, less allowance for doubtful accounts of $174,863 |
57,912,600 | |||||||
| Prepaid expenses |
21,606 | |||||||
|
|
|
|||||||
| Total current assets |
$ | 58,545,760 | ||||||
| PROPERTY AND EQUIPMENT |
||||||||
| Autos |
50,061 | |||||||
| Office equipment, furniture and fixtures |
142,938 | |||||||
| Computer equipment |
48,973 | |||||||
| Computer software |
178,943 | |||||||
| Building and land |
419,435 | |||||||
|
|
|
|||||||
| 840,350 | ||||||||
| Less accumulated depreciation |
250,701 | |||||||
|
|
|
|||||||
| Property and equipment, net |
589,649 | |||||||
| OTHER ASSETS |
||||||||
| Deposits |
5,366 | |||||||
|
|
|
|||||||
| TOTAL ASSETS |
$ | 59,140,775 | ||||||
|
|
|
|||||||
| LIABILITIES AND MEMBERS’ EQUITY | ||||||||
| CURRENT LIABILITIES |
||||||||
| Subordinated debt |
$ | 4,000,000 | ||||||
| Cash overdraft |
1,375,982 | |||||||
| Accrued reserve |
3,233,791 | |||||||
| Earned reserve |
767,005 | |||||||
| Accounts payable |
65,486 | |||||||
| Accrued expenses |
||||||||
| Loss on foreign currency contract |
29,720 | |||||||
| Payroll taxes and withholdings |
10,089 | |||||||
| Salaries and bonuses |
30,000 | |||||||
| Interest |
132,234 | |||||||
|
|
|
|||||||
| Total current liabilities |
$ | 9,644,307 | ||||||
| NOTE PAYABLE |
38,747,336 | |||||||
| MEMBERS’ EQUITY |
10,749,132 | |||||||
|
|
|
|||||||
| TOTAL LIABILITIES AND MEMBERS’ EQUITY |
$ | 59,140,775 | ||||||
|
|
|
|||||||
See accompanying notes
F-101
Table of Contents
Index to Financial Statements
CONSOLIDATED STATEMENT OF OPERATIONS
Year Ended December 31, 2013
| Discounts and fees earned |
$ | 10,000,193 | ||||||
| Operating expenses |
5,164,005 | |||||||
|
|
|
|||||||
| Income from operations |
$ | 4,836,188 | ||||||
| Other income (expense) |
||||||||
| Loss on foreign currency |
(50,963 | ) | ||||||
| Interest expense |
(1,546,239 | ) | ||||||
|
|
|
|||||||
| Total other income (expense) |
(1,597,202 | ) | ||||||
|
|
|
|||||||
| Net income |
$ | 3,238,986 | ||||||
|
|
|
See accompanying notes
F-102
Table of Contents
Index to Financial Statements
CONSOLIDATED STATEMENT OF CHANGES IN MEMBERS’ EQUITY
Year Ended December 31, 2013
| BALANCE, DECEMBER 31, 2012 |
$ | 8,895,146 | ||
| NET INCOME |
3,238,986 | |||
| DISTRIBUTIONS TO MEMBERS |
(1,385,000 | ) | ||
|
|
|
|||
| BALANCE, DECEMBER 31, 2013 |
$ | 10,749,132 | ||
|
|
|
See accompanying notes
F-103
Table of Contents
Index to Financial Statements
CONSOLIDATED STATEMENT OF CASH FLOWS
Year Ended December 31, 2013
| CASH FLOWS FROM OPERATING ACTIVITIES: |
||||||||
| Net income |
$ | 3,238,986 | ||||||
| Adjustments to reconcile net income to net cash used by operations: |
||||||||
| Amortization |
7,847 | |||||||
| Depreciation |
58,781 | |||||||
| Bad debt expense |
620,696 | |||||||
| Unrealized loss on foreign currency |
85,813 | |||||||
| (Increase) decrease in |
||||||||
| Accounts receivable |
(13,099,384 | ) | ||||||
| Prepaid expenses |
(566 | ) | ||||||
| Increase (decrease) in |
||||||||
| Accounts payable |
4,263 | |||||||
| Accrued reserve |
380,869 | |||||||
| Earned reserve |
75,667 | |||||||
| Accrued liabilities |
32,756 | |||||||
|
|
|
|||||||
| Net cash used by operations |
$ | (8,594,272 | ) | |||||
| CASH FLOWS FROM INVESTING ACTIVITIES: |
||||||||
| Purchase of property and equipment |
(12,941 | ) | ||||||
| CASH FLOWS FROM FINANCING ACTIVITIES: |
||||||||
| Net borrowing on line of credit |
10,072,503 | |||||||
| Distributions to members |
(1,385,000 | ) | ||||||
|
|
|
|||||||
| Net provided by financing activities |
8,687,503 | |||||||
|
|
|
|||||||
| Net increase in cash |
80,290 | |||||||
| CASH (CASH OVERDRAFT) |
||||||||
| December 31, 2012 |
(844,718 | ) | ||||||
|
|
|
|||||||
| December 31, 2013 |
$ | (764,428 | ) | |||||
|
|
|
|||||||
| CASH |
$ | 611,554 | ||||||
| CASH OVERDRAFT |
(1,375,982 | ) | ||||||
|
|
|
|||||||
| Net cash overdraft |
$ | (764,428 | ) | |||||
|
|
|
See accompanying notes
F-104
Table of Contents
Index to Financial Statements
NOTES TO THE CONSOLIDATED FINANCIAL STATEMENTS
Year Ended December 31, 2013
NOTE 1. SIGNIFICANT ACCOUNTING POLICIES
Basis of Presentation and Nature of Business
The financial statements include the accounts of CBI Holding Company, LLC (The Company) and its wholly owned operating company, Corporate Billing, LLC (Corporate Billing). Corporate Billing is a transaction based finance company engaged in the purchasing of accounts receivable at a discount from businesses throughout the United States and parts of Canada. Approximately 44% of Corporate Billing’s business is related to recourse billing, primarily in the transportation industry. The remaining 56% of the business is related to non-recourse billing, primarily in the automotive dealer and distributor industries.
Use of Estimates
The preparation of financial statements in accordance with generally accepted accounting principles requires management to make estimates and assumptions that affect the reported amounts of assets and liabilities, disclosure of contingent assets and liabilities at the date of the financial statements and the reported amounts of revenue and expenses during the period. Actual results could differ from those estimates.
Revenue Recognition
Corporate Billing recognizes revenue as it services and collects the purchased accounts receivable. As of December 31, 2013, there was approximately $1,087,744 in unrecognized income included as a component of the accrued reserve.
Accounts Receivable
Accounts receivable are stated at the amount management expects to collect from outstanding balances. Management provides for probable uncollectible amounts through a charge to earnings and a credit to a valuation allowance based on its assessment of the current status of individual accounts. Balances that are still outstanding after management has used reasonable collection efforts are written off through a charge to the valuation allowance and a credit to accounts receivable. It is at least reasonably possible that the estimate of the valuation allowance will change within the next year.
Property and Equipment
Property and equipment are stated at cost. New equipment is capitalized whereas expenditures for repairs and maintenance are charged to expense when incurred. Depreciation is computed using straight-line and accelerated methods. Depreciation expense for the year ended December 31, 2013, was $58,781.
Income Taxes
The Company is classified as a partnership for income tax purposes. As members individually report their share of taxable income from the Company, no liability for Federal income taxes has been included in the consolidated financial statements.
Fair Value of Financial Instruments
The carrying values of the Company’s financial instruments, including cash, accounts receivable, accounts payable, and accrued liabilities, approximate their fair values.
Principles of Consolidation
The consolidated financial statements include the accounts of the Company and its wholly owned operating company, Corporate Billing. All material intercompany transactions have been eliminated.
F-105
Table of Contents
Index to Financial Statements
CBI HOLDING COMPANY, LLC
NOTES TO THE CONSOLIDATED FINANCIAL STATEMENTS (Continued)
Year Ended December 31, 2013
NOTE 1. SIGNIFICANT ACCOUNTING POLICIES (Continued)
Subsequent Events
Management has evaluated subsequent events through May 30, 2014, the date which the statements are available for issuance.
Advertising Costs
During the year ended December 31, 2013, the Company incurred advertising costs in the amount of $130,326. Advertising costs are expensed as incurred.
NOTE 2. SUBORDINATED DEBT
Subordinated debt is comprised of notes payable to some of the Company’s members as well as companies and trusts all related to the members. The notes bear interest, payable monthly, equal to the greater of 5% or the prime rate plus 1.75%. The notes are due upon demand; however, payment of the notes is subordinate to the line of credit.
NOTE 3. NOTE PAYABLE
Corporate Billing has a $75,000,000 revolving line of credit through First Tennessee Bank National Association acting as administrative agent on behalf of various participating lenders. The note bears interest, payable monthly, at the one month LIBOR plus 3.00% and matures July 31, 2016. The note is secured by substantially all the assets of Corporate Billing, as well as guarantees from the Company and limited guarantees from certain members of the Company. As of December 31, 2013, the note had a balance of $38,747,336.
The loan agreement contains various affirmative covenants including financial reporting requirements, maintaining a minimum tangible net worth, minimum debt to equity and debt service coverage ratios as well as requiring deposit accounts to be maintained with the administrative agent. The loan agreement also contains negative covenants including restricting new indebtedness, limiting the amount of distributions to members, limiting the amount of capital expenditures, and prohibiting the sale of any of its accounts receivable.
NOTE 4. MEMBERS’ EQUITY
The Company is operating as a Limited Liability Company. As such, each member’s liability as a unit holder is limited to their investment in the Company. The Company has two classes of units, common and preferred. Common units are nonvoting units; whereas preferred units are voting units. Profits and losses as well as distributions of cash generated by normal business operations are allocated based upon each member’s common percentage interest.
In the case of special events such as a merger or reorganization, the sale of substantially all assets of the Company or liquidation of the Company, distributions will first be made to preferred unit holders. Preferred unit holders will be entitled to receive their unreturned capital based upon their preferred percentage interest. Special event distributions in excess of the preferred unit holders’ unreturned capital will be allocated based upon each member’s common percentage interest. As of December 31, 2013, members’ equity is comprised of the following:
| Preferred |
$ | 4,000,000 | ||
| Common |
6,749,132 | |||
|
|
|
|||
| Total |
$ | 10,749,132 | ||
|
|
|
F-106
Table of Contents
Index to Financial Statements
CBI HOLDING COMPANY, LLC
NOTES TO THE CONSOLIDATED FINANCIAL STATEMENTS (Continued)
Year Ended December 31, 2013
NOTE 5. CONCENTRATIONS
As discussed in NOTE 1, Corporate Billing is engaged in the purchase of accounts receivable at a discount from businesses in the transportation, automotive dealer, heavy duty truck dealer, heavy duty after market distributor and heavy duty truck repair industries; consequently, its ability to collect amounts due from these accounts may be affected by economic fluctuations in these industries. As of December 31, 2013, Corporate Billing’s thirty largest debtors accounted for approximately 12% of the purchased accounts receivable.
The Company maintains cash balances at various financial institutions throughout the United States and Canada. The United States accounts are insured by the Federal Deposit Insurance Corporation (FDIC) up to $250,000. The Canadian account is insured by the Canada Deposit Insurance Corporation (CDIC) up to $100,000 (CAD). As of December 31, 2013, the Company’s cash balances on deposit, per the banks’ records, exceeded the insured limits by $1,061,766.
NOTE 6. RELATED PARTY TRANSACTIONS
As described in NOTE 2, all of the subordinated debt of the Company is from members or companies and trusts related to the members. During the year ended December 31, 2013, the Company incurred $199,452 in interest expense on the subordinated debt.
NOTE 7. SUPPLEMENTAL CASH FLOW INFORMATION
During the year ended December 31, 2013, the Company paid $1,502,154 in interest.
NOTE 8. DERIVATIVES
In the ordinary course of business the Company purchases accounts receivable from companies located in Canada. The purchasing and the subsequent collecting of these receivables is facilitated through the Company’s Canadian bank account. As a result of these activities, the Company’s Canadian denominated accounts receivable and cash are subject to market risk from changes in foreign currency exchange rates. The Company mitigates this risk through the use of derivatives, specifically forward contracts. These contracts typically mature within twelve months. Gains and losses on these contracts are included in the consolidated statement of operations as a component of the gain (loss) on foreign currency. As of December 31, 2013, the Company has a contract in place with a notional value of $1,500,000 Canadian dollars and has an accrued a loss of $29,720.
F-107
Table of Contents
Index to Financial Statements
F-108
Table of Contents
Index to Financial Statements
CONSOLIDATED SCHEDULE OF OPERATING EXPENSES
Year Ended December 31, 2013
| Advertising and business promotion |
$ | 130,326 | ||
| Amortization |
7,847 | |||
| Auto |
35,636 | |||
| Bad debt expense |
620,696 | |||
| Bank service charges |
346,889 | |||
| Collection expense |
15,367 | |||
| Consulting fees |
154,560 | |||
| Contributions |
720 | |||
| Credit services |
73,905 | |||
| Depreciation |
58,781 | |||
| Dues and subscriptions |
44,146 | |||
| Employee education and training |
124 | |||
| Insurance |
148,544 | |||
| Legal and accounting |
129,777 | |||
| Meals and entertainment |
22,370 | |||
| Office supplies and expenses |
65,461 | |||
| Outside commissions |
144,563 | |||
| Postage and freight |
37,335 | |||
| Rent |
23,746 | |||
| Repairs and maintenance |
66,337 | |||
| Salaries, wages and guaranteed payments |
2,591,317 | |||
| Statement processing |
67,928 | |||
| Taxes and licenses |
191,222 | |||
| Telephone |
77,092 | |||
| Travel |
86,418 | |||
| Utilities |
22,898 | |||
|
|
|
|||
| Total operating expenses |
$ | 5,164,005 | ||
|
|
|
F-109
Table of Contents
Index to Financial Statements
CONSOLIDATING BALANCE SHEET
Year Ended December 31, 2013
| CBI Holding | Corporate | |||||||||||||||
| Company, LLC | Billing, LLC | Eliminations | Consolidated | |||||||||||||
| ASSETS |
||||||||||||||||
| Cash |
$ | 7,842 | $ | 603,712 | $ | — | $ | 611,554 | ||||||||
| Accounts receivable, net |
— | 57,912,600 | — | 57,912,600 | ||||||||||||
| Prepaid expenses |
— | 21,606 | — | 21,606 | ||||||||||||
| Property and equipment, net |
288,234 | 301,415 | — | 589,649 | ||||||||||||
| Deposits |
— | 5,366 | — | 5,366 | ||||||||||||
| Investment in Corporate Billing, LLC |
10,453,056 | — | (10,453,056 | ) | — | |||||||||||
|
|
|
|
|
|
|
|
|
|||||||||
| TOTAL ASSETS |
$ | 10,749,132 | $ | 58,844,699 | $ | (10,453,056 | ) | $ | 59,140,775 | |||||||
|
|
|
|
|
|
|
|
|
|||||||||
| LIABILITIES AND EQUITY |
||||||||||||||||
| Subordinated debt |
$ | — | $ | 4,000,000 | $ | — | $ | 4,000,000 | ||||||||
| Cash overdraft |
— | 1,375,982 | — | 1,375,982 | ||||||||||||
| Accrued reserve |
— | 3,233,791 | — | 3,233,791 | ||||||||||||
| Earned reserve |
— | 767,005 | — | 767,005 | ||||||||||||
| Accounts payable |
— | 65,486 | — | 65,486 | ||||||||||||
| Accrued expenses |
— | 202,043 | — | 202,043 | ||||||||||||
| Note payable |
— | 38,747,336 | — | 38,747,336 | ||||||||||||
|
|
|
|
|
|
|
|
|
|||||||||
| TOTAL LIABILITIES |
— | 48,391,643 | — | 48,391,643 | ||||||||||||
| Members’ equity |
10,749,132 | 10,453,056 | (10,453,056 | ) | 10,749,132 | |||||||||||
|
|
|
|
|
|
|
|
|
|||||||||
| TOTAL LIABILITIES AND EQUITY |
$ | 10,749,132 | $ | 58,844,699 | $ | (10,453,056 | ) | $ | 59,140,775 | |||||||
|
|
|
|
|
|
|
|
|
|||||||||
F-110
Table of Contents
Index to Financial Statements
CONSOLIDATING STATEMENT OF OPERATIONS
Year Ended December 31, 2013
| CBI Holding Company, LLC |
Corporate Billing, LLC |
Eliminations | Consolidated | |||||||||||||
| Discounts and fees earned |
$ | — | $ | 10,000,193 | $ | — | $ | 10,000,193 | ||||||||
| Operating expenses |
12,207 | 5,151,798 | — | 5,164,005 | ||||||||||||
|
|
|
|
|
|
|
|
|
|||||||||
| Income (loss) from operations |
(12,207 | ) | 4,848,395 | — | 4,836,188 | |||||||||||
| Other income (expense) |
||||||||||||||||
| Income from subsidiary |
3,251,193 | — | (3,251,193 | ) | — | |||||||||||
| Loss on foreign currency |
— | (50,963 | ) | — | (50,963 | ) | ||||||||||
| Interest expense |
— | (1,546,239 | ) | — | (1,546,239 | ) | ||||||||||
|
|
|
|
|
|
|
|
|
|||||||||
| Net income |
$ | 3,238,986 | $ | 3,251,193 | $ | (3,251,193 | ) | $ | 3,238,986 | |||||||
|
|
|
|
|
|
|
|
|
|||||||||
F-111
Table of Contents
Index to Financial Statements
| TALLEY, MAULDIN & PEETE, P.C. | ||||
| CERTIFIED PUBLIC ACCOUNTANTS | ||||
| (256) 353-1421 | P.O. BOX 2067 | LARRY D. MAULDIN, CPA | ||
| FAX (256) 353-0961 | 906 WILSON STREET, N.E. | PRESTON E. PEETE, CPA | ||
| EMAIL INFO@TMPCPA.COM | DECATUR, ALABAMA 35602-2067 | |||
| WWW.TMPCPA.COM | ||||
Board of Managers
CBI Holding Company, LLC
Report on the Financial Statements
We have audited the accompanying financial statements of CBI Holding Company, LLC and subsidiary which comprise the consolidated balance sheet as of December 31, 2012, and the related consolidated statements of operations, changes in members’ equity, and cash flows for the year then ended, and the related notes to the financial statements.
Management’s Responsibility for the Financial Statements
Management is responsible for the preparation and fair presentation of these financial statements in accordance with accounting principles generally accepted in the United States of America; this includes the design, implementation, and maintenance of internal control relevant to the preparation and fair presentation of financial statements that are free from material misstatement, whether due to fraud or error.
Auditor’s Responsibility
Our responsibility is to express an opinion on these financial statements based on our audit. We conducted our audit in accordance with auditing standards generally accepted in the United States of America. Those standards require that we plan and perform the audit to obtain reasonable assurance about whether the financial statements are free of material misstatement.
An audit involves performing procedures to obtain audit evidence about the amounts and disclosures in the financial statements. The procedures selected depend on the auditor’s judgment, including the assessment of the risks of material misstatement of the financial statements, whether due to fraud or error. In making those risk assessments, the auditor considers internal control relevant to the entity’s preparation and fair presentation of the financial statements in order to design audit procedures that are appropriate in the circumstances, but not for the purpose of expressing an opinion on the effectiveness of the entity’s internal control. Accordingly, we express no such opinion. An audit also includes evaluating the appropriateness of accounting policies used and the reasonableness of significant accounting estimates made by management, as well as evaluating the overall presentation of the financial statements.
We believe that the audit evidence we have obtained is sufficient and appropriate to provide a basis for our audit opinion.
Opinion
In our opinion, the financial statements referred to above present fairly, in all material respects, the financial position of CBI Holding Company, LLC and subsidiary as of December 31, 2012, and the results of its operations and its cash flows for the year then ended in accordance with accounting principles generally accepted in the United States of America.
Report on Supplementary Information
Our audit was conducted for the purpose of forming an opinion on the financial statements as a whole. The consolidated schedule of operating expenses on page 14 is presented for purposes of additional analysis and is not a required part of the financial statements. Such information is the responsibility of management and was
F-112
Table of Contents
Index to Financial Statements
derived from and relates directly to the underlying accounting and other records used to prepare the financial statements. The information has been subjected to the auditing procedures applied in the audit of the financial statements and certain additional procedures, including comparing and reconciling such information directly to the underlying accounting and other records used to prepare the financial statements or to the financial statements themselves, and other additional procedures in accordance with auditing standards generally accepted in the United States of America. In our opinion, the information is fairly stated in all material respects in relation to the financial statements as a whole.
/s/ Talley, Mauldin & Peete, P.C.
Decatur, AL
May 30, 2013
MEMBERS OF AMERICAN INSTITUTE OF CERTIFIED PUBLIC ACCOUNTANTS AND ALABAMA SOCIETY OF CERTIFIED PUBLIC ACCOUNTANTS
F-113
Table of Contents
Index to Financial Statements
CONSOLIDATED BALANCE SHEET
December 31, 2012
| ASSETS | ||||||||
| CURRENT ASSETS |
||||||||
| Cash |
$ | 344,536 | ||||||
| Accounts receivable, less allowance for doubtful accounts of $122,795 |
45,491,979 | |||||||
| Prepaid expenses |
21,040 | |||||||
|
|
|
|||||||
| Total current assets |
$ | 45,857,555 | ||||||
| PROPERTY AND EQUIPMENT |
||||||||
| Autos |
50,061 | |||||||
| Office equipment, furniture and fixtures |
134,954 | |||||||
| Computer equipment |
44,016 | |||||||
| Computer software |
178,943 | |||||||
| Building and land |
419,435 | |||||||
|
|
|
|||||||
| 827,409 | ||||||||
| Less accumulated depreciation |
184,073 | |||||||
|
|
|
|||||||
| Property and equipment, net |
643,336 | |||||||
| OTHER ASSETS |
||||||||
| Deposits |
5,366 | |||||||
|
|
|
|||||||
| TOTAL ASSETS |
$ | 46,506,257 | ||||||
|
|
|
|||||||
| LIABILITIES AND MEMBERS’ EQUITY | ||||||||
| CURRENT LIABILITIES |
||||||||
| Subordinated debt |
$ | 4,000,000 | ||||||
| Cash overdraft |
1,189,254 | |||||||
| Accrued reserve |
2,854,506 | |||||||
| Earned reserve |
691,728 | |||||||
| Accounts payable |
61,223 | |||||||
| Accrued liabilities |
||||||||
| Loss on foreign currency contract |
8,021 | |||||||
| Payroll taxes and withholdings |
23,397 | |||||||
| Salaries and bonuses |
20,000 | |||||||
| Interest |
88,149 | |||||||
|
|
|
|||||||
| Total current liabilities |
$ | 8,936,278 | ||||||
| NOTE PAYABLE |
28,674,833 | |||||||
| MEMBERS’ EQUITY |
8,895,146 | |||||||
|
|
|
|||||||
| TOTAL LIABILITIES AND MEMBERS’ EQUITY |
$ | 46,506,257 | ||||||
|
|
|
|||||||
See accompanying notes
F-114
Table of Contents
Index to Financial Statements
CONSOLIDATED STATEMENT OF OPERATIONS
Year Ended December 31, 2012
| Discounts and fees earned |
$ | 9,198,992 | ||||||
| Operating expenses |
4,497,213 | |||||||
|
|
|
|||||||
| Income from operations |
$ | 4,701,779 | ||||||
| Other income (expense) |
||||||||
| Loss on foreign currency |
(48,778 | ) | ||||||
| Interest expense |
(1,360,804 | ) | ||||||
|
|
|
|||||||
| Total other income (expense) |
(1,409,582 | ) | ||||||
|
|
|
|||||||
| Net income |
$ | 3,292,197 | ||||||
|
|
|
See accompanying notes
F-115
Table of Contents
Index to Financial Statements
CONSOLIDATED STATEMENT OF CHANGES IN MEMBERS’ EQUITY
Year Ended December 31, 2012
| BALANCE, DECEMBER 31, 2011 |
$ | 7,152,949 | ||
| NET INCOME |
3,292,197 | |||
| DISTRIBUTIONS TO MEMBERS |
(1,550,000 | ) | ||
|
|
|
|||
| BALANCE, DECEMBER 31, 2012 |
$ | 8,895,146 | ||
|
|
|
See accompanying notes
F-116
Table of Contents
Index to Financial Statements
CONSOLIDATED STATEMENT OF CASH FLOWS
Year Ended December 31, 2012
| CASH FLOWS FROM OPERATING ACTIVITIES: |
||||||||
| Net income |
$ | 3,292,197 | ||||||
| Adjustments to reconcile net income to net cash used by operations: |
||||||||
| Amortization |
7,847 | |||||||
| Depreciation |
59,204 | |||||||
| Bad debt expense |
348,398 | |||||||
| Unrealized loss on foreign currency |
2,946 | |||||||
| (Increase) decrease in |
||||||||
| Accounts receivable |
2,703,378 | |||||||
| Prepaid expenses |
14,997 | |||||||
| Increase (decrease) in |
||||||||
| Accounts payable |
(282 | ) | ||||||
| Accrued reserve |
(222,143 | ) | ||||||
| Earned reserve |
223,652 | |||||||
| Accrued liabilities |
(41,624 | ) | ||||||
|
|
|
|||||||
| Net cash provided by operations |
$ | 6,388,570 | ||||||
| CASH FLOWS FROM INVESTING ACTIVITIES: |
||||||||
| Purchase of property and equipment |
(62,840 | ) | ||||||
| CASH FLOWS FROM FINANCING ACTIVITIES: |
||||||||
| Net payments on line of credit |
(4,724,645 | ) | ||||||
| Distributions to members |
(1,550,000 | ) | ||||||
|
|
|
|||||||
| Net cash used by financing activities |
(6,274,645 | ) | ||||||
|
|
|
|||||||
| Net increase in cash |
51,085 | |||||||
| CASH (CASH OVERDRAFT) |
||||||||
| December 31, 2011 |
(895,803 | ) | ||||||
|
|
|
|||||||
| December 31, 2012 |
$ | (844,718 | ) | |||||
|
|
|
|||||||
| CASH |
$ | 344,536 | ||||||
| CASH OVERDRAFT |
(1,189,254 | ) | ||||||
|
|
|
|||||||
| Net cash overdraft |
$ | (844,718 | ) | |||||
|
|
|
See accompanying notes
F-117
Table of Contents
Index to Financial Statements
NOTES TO THE CONSOLIDATED FINANCIAL STATEMENTS
Year Ended December 31, 2012
NOTE 1. SIGNIFICANT ACCOUNTING POLICIES
Basis of Presentation and Nature of Business
The financial statements include the accounts of CBI Holding Company, LLC (The Company) and its wholly owned operating company, Corporate Billing, LLC (Corporate Billing). Corporate Billing is a transaction based finance company engaged in the purchasing of accounts receivable at a discount from businesses throughout the United States as well as parts of Canada. Approximately 54% of Corporate Billing’s business is related to recourse billing, primarily in the transportation and telecommunication industries. The remaining 46% of the business is related to non-recourse billing, primarily in the automotive dealer and distributor industries.
Use of Estimates
The preparation of financial statements in accordance with generally accepted accounting principles requires management to make estimates and assumptions that affect the reported amounts of assets and liabilities and disclosure of contingent assets and liabilities at the date of the financial statements and the reported amounts of revenue and expenses during the period. Actual results could differ from those estimates.
Revenue Recognition
Corporate Billing recognizes revenue as it services and collects the purchased accounts receivable. As of December 31, 2012, there was approximately $838,308 in unrecognized income included as a component of the accrued reserve.
Accounts Receivable
Accounts receivable are stated at the amount management expects to collect from outstanding balances. Management provides for probable uncollectible amounts through a charge to earnings and a credit to a valuation allowance based on its assessment of the current status of individual accounts. Balances that are still outstanding after management has used reasonable collection efforts are written off through a charge to the valuation allowance and a credit to accounts receivable. It is at least reasonably possible that the estimate of the valuation allowance will change within the next year.
Property and Equipment
Property and equipment are stated at cost. New equipment is capitalized whereas expenditures for repairs and maintenance are charged to expense when incurred. Depreciation is computed using straight-line and accelerated methods. Depreciation expense for the year ended December 31, 2012, was $59,204.
Income Taxes
The Company is classified as a partnership for income tax purposes. As members individually report their share of taxable income from the Company, no liability for Federal income taxes has been included in the consolidated financial statements.
Fair Value of Financial Instruments
The carrying values of the Company’s financial instruments, including cash, accounts receivable, accounts payable, and accrued liabilities approximate their fair values.
Principles of Consolidation
The consolidated financial statements include the accounts of the Company and its wholly owned operating company, Corporate Billing. All material intercompany transactions have been eliminated.
F-118
Table of Contents
Index to Financial Statements
CBI HOLDING COMPANY, LLC
NOTES TO THE CONSOLIDATED FINANCIAL STATEMENTS (Continued)
Year Ended December 31, 2012
NOTE 1. SIGNIFICANT ACCOUNTING POLICIES (Continued)
Subsequent Events
Management has evaluated subsequent events through May 30, 2013, the date which the statements are available for issuance.
Advertising Costs
During the year ended December 31, 2012, the Company incurred advertising costs in the amount of $68,034. Advertising costs are expensed as incurred.
NOTE 2. SUBORDINATED DEBT
Subordinated debt is comprised of notes payable to some of the Company’s members as well as companies and trusts all related to the members. The notes bear interest, payable monthly, equal to the greater of 5% or the prime rate plus 1.75%. The notes are due upon demand; however, payment of the notes is subordinate to the line of credit.
NOTE 3. NOTE PAYABLE
Corporate Billing has a $65,000,000 revolving line of credit through First Tennessee Bank National Association acting as administrative agent on behalf of various participating lenders. The note bears interest, payable monthly, at the one month LIBOR plus 3.00% and matures November 30, 2014. The note is secured by substantially all the assets of Corporate Billing, as well as guarantees from the Company and certain members of the Company. As of December 31, 2012, the note had a balance of $28,674,833.
The loan agreement contains various affirmative covenants including financial reporting requirements, maintaining a minimum tangible net worth, minimum debt to equity and debt service coverage ratios as well as requiring deposit accounts to be maintained with the administrative agent. The loan agreement also contains negative covenants including restricting new indebtedness, limiting the amount of distributions to members, limiting the amount of capital expenditures, and prohibiting the sale of any of its accounts receivable.
NOTE 4. MEMBERS’ EQUITY
The Company is operating as a Limited Liability Company. As such, each member’s liability as a unit holder is limited to their investment in the Company. The Company has two classes of units, common and preferred. Common units are nonvoting units; whereas preferred units are voting units. Profits and losses as well as distributions of cash generated by normal business operations are allocated based upon each member’s common percentage interest.
In the case of special events such as a merger or reorganization, the sale of substantially all assets of the Company or liquidation of the Company, distributions will first be made to preferred unit holders. Preferred unit holders will be entitled to receive their unreturned capital based upon their preferred percentage interest. Special event distributions in excess of the preferred unit holders’ unreturned capital will be allocated based upon each member’s common percentage interest. As of December 31, 2012, members’ equity is comprised of the following:
| Preferred |
$ | 4,000,000 | ||
| Common |
4,895,146 | |||
|
|
|
|||
| Total |
$ | 8,895,146 | ||
|
|
|
F-119
Table of Contents
Index to Financial Statements
CBI HOLDING COMPANY, LLC
NOTES TO THE CONSOLIDATED FINANCIAL STATEMENTS (Continued)
Year Ended December 31, 2012
NOTE 5. CONCENTRATIONS
As discussed in NOTE 1, Corporate Billing is engaged in the purchase of accounts receivable at a discount from businesses in the transportation, automotive dealer, distributor and telecommunication industries; consequently, its ability to collect amounts due from these accounts may be affected by economic fluctuations in these industries. As of December 31, 2012, Corporate Billing’s thirty largest debtors accounted for approximately 20% of the purchased accounts receivable.
The Company maintains cash balances at various financial institutions throughout the United States and Canada. The United States accounts are insured by the Federal Deposit Insurance Corporation (FDIC) up to $250,000. The Canadian account is insured by the Canada Deposit Insurance Corporation (CDIC) up to $100,000 (CAD). As of December 31, 2012, the Company’s cash balances on deposit, per the banks’ records, exceeded the insured limits by $239,404.
NOTE 6. RELATED PARTY TRANSACTIONS
As described in NOTE 2, all of the subordinated debt of the Company is from members or companies and trusts related to the members. During the year ended December 31, 2012, the Company incurred $200,538 in interest expense on the subordinated debt.
NOTE 7. SUPPLEMENTAL CASH FLOW INFORMATION
During the year ended December 31, 2012, the Company paid $1,401,365 in interest.
NOTE 8. DERIVATIVES
In the ordinary course of business the Company purchases accounts receivable from companies located in Canada. The purchasing and the subsequent collecting of these receivables is facilitated through the Company’s Canadian bank account. As a result of these activities, the Company’s Canadian denominated accounts receivable and cash are subject to market risk from changes in foreign currency exchange rates. The Company mitigates this risk through the use of derivatives, specifically forward contracts. These contracts typically mature within twelve months. Gains and losses on these contracts are included in the consolidated statement of operations as a component of the gain (loss) on foreign currency. As of December 31, 2012, the Company has a contract in place with a notional value of $1,500,000 Canadian dollars and has an accrued a loss of $8,021.
F-120
Table of Contents
Index to Financial Statements
F-121
Table of Contents
Index to Financial Statements
CONSOLIDATED SCHEDULE OF OPERATING EXPENSES
Year Ended December 31, 2012
| Advertising and business promotion |
$ | 68,034 | ||
| Amortization |
7,847 | |||
| Auto |
27,220 | |||
| Bad debt expense |
348,398 | |||
| Bank service charges |
356,155 | |||
| Collection expense |
7,026 | |||
| Consulting fees |
147,550 | |||
| Contributions |
200 | |||
| Credit services |
73,314 | |||
| Depreciation |
59,204 | |||
| Dues and subscriptions |
35,277 | |||
| Employee education and training |
4,969 | |||
| Insurance |
141,503 | |||
| Legal and accounting |
105,962 | |||
| Meals and entertainment |
23,248 | |||
| Office supplies and expenses |
71,661 | |||
| Outside commissions |
186,980 | |||
| Postage and freight |
63,587 | |||
| Rent |
34,600 | |||
| Repairs and maintenance |
63,567 | |||
| Salaries, wages and guaranteed payments |
2,229,255 | |||
| Statement processing |
74,740 | |||
| Taxes and licenses |
164,458 | |||
| Telephone |
88,275 | |||
| Travel |
90,421 | |||
| Utilities |
23,762 | |||
|
|
|
|||
| Total operating expenses |
$ | 4,497,213 | ||
|
|
|
F-122
Table of Contents
Index to Financial Statements
Shares
National Commerce Corporation
Common Stock
PROSPECTUS
, 2015
| Keefe, Bruyette & Woods | ||||
| A Stifel Company | ||||
| Raymond James | Sterne Agee | FIG Partners, LLC |
Until , 2015 (the 25th day after the date of this prospectus), all dealers effecting transactions in our common stock, whether or not participating in this offering, may be required to deliver a prospectus. This delivery requirement is in addition to the obligation of dealers to deliver a prospectus when acting as underwriters and with respect to their unsold allotments or subscriptions.
Table of Contents
Index to Financial Statements
PART II
INFORMATION NOT REQUIRED IN PROSPECTUS
Item 13. Other Expenses of Issuance and Distribution.
The following table sets forth the fees and expenses, other than underwriting commissions, that we expect to pay in connection with the issuance and distribution of our common stock. All amounts shown are estimates except the SEC registration fee and the FINRA filing fee.
| SEC registration fee |
$ | 5,810 | ||
| FINRA filing fee |
8,000 | |||
| NASDAQ Listing fee |
* | |||
| Printing and engraving expenses |
* | |||
| Legal fees and expenses |
* | |||
| Accounting fees and expenses |
* | |||
| Blue Sky fees and expenses |
* | |||
| Transfer agent and registrar fees and expenses |
* | |||
| Miscellaneous |
* | |||
|
|
|
|||
| Total |
$ | * |
| * | To be completed by amendment. |
We will bear all of the expenses shown above.
Item 14. Indemnification of Directors and Officers.
Delaware General Corporation Law
Section 102(b)(7) of the General Corporation Law of the State of Delaware, or the DGCL, permits a corporation to provide in its certificate of incorporation that a director of the corporation shall not be personally liable to the corporation or its stockholders for monetary damages for breach of fiduciary duty as a director, except for liability (i) for any breach of the director’s duty of loyalty to the corporation or its stockholders, (ii) for acts or omissions not in good faith or which involve intentional misconduct or a knowing violation of law, (iii) for payments of unlawful dividends or unlawful stock repurchases, or (iv) for any transactions from which the director derived an improper personal benefit.
Section 145 of the DGCL provides that a corporation has the power to indemnify any person, including directors, officers, employees, and agents, who was or is a party or who is threatened to be made a party to any threatened, pending, or completed action, suit, or proceeding, whether civil, criminal, administrative, or investigative, by reason of the fact that such person is or was a director, officer, employee, or agent of the corporation or is or was serving at the request of the corporation as a director, officer, employee, or agent of another corporation, partnership, joint venture, trust, or other enterprise, against expenses (including attorneys’ fees), judgments, fines, and amounts paid in settlement, actually and reasonably incurred by such person in connection with such suit, action, or proceeding, if such person acted in good faith and in a manner such person reasonably believed to be in, or not opposed to, the best interests of the corporation and, with respect to any criminal action or proceeding, if such person had no reasonable cause to believe his or her conduct was unlawful; provided, that, in the case of any threatened, pending, or completed action by or in the right of the corporation, no indemnification shall be made with respect to any claim, issue, or matter as to which such person shall have been adjudged to be liable to the corporation, unless and only to the extent that a court shall determine that such indemnity is proper. Where a director, officer, employee, or agent is successful on the merits or otherwise in the defense of any action referred to above, the corporation is required under the DGCL to indemnify such person against any expenses (including attorneys’ fees) reasonably incurred by such person in connection with the action.
II-1
Table of Contents
Index to Financial Statements
Certificate of Incorporation and Bylaws
Article 9 of our certificate of incorporation limits the personal liability of our directors to us or our shareowners for monetary damages for breach of fiduciary duty to the extent provided by Section 102(b)(7) of the DGCL.
Pursuant to Article 6 of our bylaws, we will indemnify and hold harmless our directors and officers to the fullest extent permitted by the DGCL, as it now exists or may hereafter be amended, from and against all liability and loss suffered and expenses (including attorneys’ fees) reasonably incurred in connection with any action, suit, or proceeding, whether civil, criminal, administrative, or investigative, by reason of the fact that he or she, or a person for whom he or she is the legal representative, is or was one of our directors or officers or, while a director or officer, is or was serving at our request in any position or capacity for any other entity. Our bylaws further provide for the advancement of expenses to directors or officers in defending any proceeding in advance of its final disposition; provided that, to the extent required by law, such an advancement will be made only upon receipt of an undertaking to repay all amounts advanced if it is ultimately determined by final judicial decision that he or she is not entitled to be indemnified for such expenses. In addition, our bylaws permit our board of directors to provide for indemnification and advancement of expenses to our employees and agents to the extent and in the manner permitted by the DGCL.
Insurance and Contractual Arrangements
Our bylaws authorize us to purchase and maintain insurance on behalf of our directors, officers, employees, and agents, and persons serving at our request in any position or capacity for any other entity, against any liability asserted against or incurred by him or her, or arising out of his or her status as such, whether or not we would have the power or obligation to indemnify such person against the liability.
We maintain standard policies of insurance under which coverage is provided (i) to our directors and officers against loss rising from claims made by reason of breach of duty or other wrongful act, and (ii) to us with respect to payments which may be made by us to such officers and directors pursuant to the above indemnification provisions or otherwise as a matter of law. We currently maintain management liability insurance, excess director and officer liability insurance, and Side A director and officer liability insurance.
Our bylaws also provide that the indemnification rights set forth in the bylaws are not exclusive of other indemnification rights to which an indemnified party may be entitled under any statute, rule of law, provision in our certificate of incorporation or bylaws, agreement, vote of shareowners or disinterested directors, or otherwise. In this regard, we have entered into an indemnification agreement with each of our directors and executive officers that provides a contractual right to indemnification and advancement of expenses. These indemnification agreements require us to indemnify our directors and executive officers to the fullest extent permitted by Delaware law and for certain liabilities incurred as a result of actions brought, or threatened to be brought, against such directors and executive officers in connection with their duties, subject to certain limitations. We also are required to advance expenses to our directors and executive officers upon request to the fullest extent permitted by Delaware law and subject to the same restrictions applicable to indemnification payments. The agreements also contain various covenants by us regarding the maintenance of directors’ and officers’ liability insurance.
We are a party to a registration rights agreement with NBC Holdings, a copy of which is filed as Exhibit 4.2 to this registration statement. This agreement includes indemnification provisions in favor of: (i) NBC Holdings and certain persons to whom NBC Holdings transfers its registrable securities, each, a Holder, (ii) any underwriter participating in a registered offering made pursuant to the agreement, (iii) any officer, partner, manager, director, or controlling person of a Holder or underwriter, and (iv) any representative of a Holder serving on our board of directors, each such person, an Indemnified Party, against certain losses and liabilities (including interest, penalties, and attorneys’ fees) resulting from any breach of a representation or warranty made by us in an underwriting agreement or an untrue statement or omission of material fact in any registration statement or prospectus pursuant to which an Indemnified Party sells shares of our common stock, except to the extent that such liability arose from written information provided to us by the Indemnified Party specifically for
II-2
Table of Contents
Index to Financial Statements
use therein, in which case, if the Indemnified Party is a Holder, such Holder must indemnify us, any participating underwriter, and any of our officers, partners, managers, directors, or controlling persons for liabilities arising from the information from which the breach, misstatement, or omission resulted, in an amount up to the amount of net proceeds received by the Holder in the offering.
In addition, the proposed form of underwriting agreement to be filed as Exhibit 1.1 to this registration statement will provide for indemnification of our directors and officers by the underwriters against certain liabilities.
Item 15. Recent Sales of Unregistered Securities.
On August 8, 2014, the Company closed a private placement commenced in July 2014 with investors in the Vero Beach, Florida area of 163,485 shares of its common stock at $18.35 per share, for a total offering price of $2,999,949.75. No underwriters were involved in the transaction; no underwriting discounts were incurred or commissions paid in connection with the private placement. The Company relied on the exemptions from registration requirements provided by Section 4(a)(2) of the Securities Act of 1933, as amended, and Rule 506(b) of Regulation D promulgated pursuant thereto, for sales of securities to an unlimited number of “accredited investors,” based on the representations made to the Company by the investors as to their status as accredited investors. The Company intends to use the proceeds of the private placement for general corporate purposes.
Item 16. Exhibits and Financial Statement Schedules.
(a) Exhibits: The list of exhibits is set forth beginning on page E-1 of this registration statement and is incorporated herein by reference.
(b) Financial Statement Schedules: No financial statement schedules are provided because the information called for is not applicable or is included in the financial statements or notes thereto.
Item 17. Undertakings.
(a) Insofar as indemnification for liabilities arising under the Securities Act of 1933 may be permitted to directors, officers, and controlling persons of the registrant pursuant to the foregoing provisions, or otherwise, the registrant has been advised that in the opinion of the Securities and Exchange Commission such indemnification is against public policy as expressed in the Act and is, therefore, unenforceable. In the event that a claim for indemnification against such liabilities (other than the payment by the registrant of expenses incurred or paid by a director, officer, or controlling person of the registrant in the successful defense of any action, suit or proceeding) is asserted by such director, officer, or controlling person in connection with the securities being registered, the registrant will, unless in the opinion of its counsel the matter has been settled by controlling precedent, submit to a court of appropriate jurisdiction the question whether such indemnification by it is against public policy as expressed in the Act and will be governed by the final adjudication of such issue.
(b) The undersigned registrant hereby undertakes that:
| (i) | For purposes of determining any liability under the Securities Act of 1933, the information omitted from the form of prospectus filed as part of this registration statement in reliance upon Rule 430A and contained in a form of prospectus filed by us pursuant to Rule 424(b)(1) or (4) or 497(h) under the Securities Act shall be deemed to be part of this registration statement as of the time it was declared effective. |
| (ii) | For the purpose of determining any liability under the Securities Act of 1933, each post-effective amendment that contains a form of prospectus shall be deemed to be a new registration statement relating to the securities offered therein, and the offering of such securities at that time shall be deemed to be the initial bona fide offering thereof. |
II-3
Table of Contents
Index to Financial Statements
SIGNATURES
Pursuant to the requirements of the Securities Act of 1933, National Commerce Corporation has duly caused this registration statement to be signed on its behalf by the undersigned, thereunto duly authorized, in the City of Birmingham, State of Alabama, on February 27, 2015.
| NATIONAL COMMERCE CORPORATION | ||
| /s/ John H. Holcomb, III | ||
| Name: |
John H. Holcomb, III | |
| Title: |
Chairman and Chief Executive Officer | |
Pursuant to the requirements of the Securities Act of 1933, this registration statement has been signed by the following persons in the capacities indicated on February 27, 2015.
| Name and Signature |
Title | |
| /s/ John H. Holcomb, III John H. Holcomb, III |
Chairman, Chief Executive Officer and Director (Principal Executive Officer) | |
| /s/ Richard Murray, IV Richard Murray, IV |
President, Chief Operating Officer and Director | |
| /s/ William E. Matthews, V William E. Matthews, V |
Vice Chairman, Chief Financial Officer and Director (Principal Financial Officer) | |
| /s/ Shelly S. Williams Shelly S. Williams |
Senior Vice President and Chief Accounting Officer (Principal Accounting Officer) | |
| * Bobby A. Bradley |
Director | |
| * R. Holman Head |
Director | |
| * Jerry D. Kimbrough |
Director | |
| * C. Phillip McWane |
Director | |
| * G. Ruffner Page, Jr. |
Director | |
| * W. Stancil Starnes |
Director | |
| * Temple W. Tutwiler, III |
Director | |
II-4
Table of Contents
Index to Financial Statements
| Name and Signature |
Title | |
| * Russell H. Vandevelde, IV |
Director | |
| * Donald F. Wright |
Director | |
| * | Pursuant to the power of attorney previously included in the Registrant’s Registration Statement on Form S-1 filed on January 5, 2015. |
| By: |
/s/ William E. Matthews, V | |
| William E. Matthews, V | ||
| Attorney-In-Fact |
II-5
Table of Contents
Index to Financial Statements
EXHIBIT INDEX
| Exhibit Number |
Description | |
| 1.1* | Form of Underwriting Agreement | |
| 2.1†† | Agreement and Plan of Merger, dated June 6, 2014, by and between National Commerce Corporation and United Group Banking Company of Florida, Inc. (incorporated herein by reference to Exhibit 2.1 to the Company’s Registration Statement on Form S-4 (File No. 333-198219), filed on August 18, 2014) | |
| 2.2†† | Membership Interest Purchase Agreement, dated August 29, 2014, by and among the members of CBI Holding, LLC, National Bank of Commerce and Sexton Investments LLC (incorporated herein by reference to Exhibit 2.2 to Amendment No. 1 to the Company’s Registration Statement on Form S-4 (File No. 333-198219), filed on September 30, 2014) | |
| 3.1 | Certificate of Incorporation of National Commerce Corporation (incorporated herein by reference to Exhibit 3.1 to the Company’s Registration Statement on Form S-4 (File No. 333-198219), filed on August 18, 2014) | |
| 3.1A | Amendment to Certificate of Incorporation of National Commerce Corporation (incorporated herein by reference to Exhibit 3.1A to the Company’s Annual Report on Form 10-K (File No. 000-55336), filed on February 20, 2015) | |
| 3.2 | Bylaws of National Commerce Corporation (incorporated herein by reference to Exhibit 3.2 to the Company’s Registration Statement on Form S-4 (File No. 333-198219), filed on August 18, 2014) | |
| 4.1 | Form of Common Stock Certificate of National Commerce Corporation | |
| 4.2 | Registration Rights Agreement, dated August 15, 2008, by and between Americus Financial Services, Inc. and RMB Holdings, LLC (incorporated herein by reference to Exhibit 4.3 to Amendment No. 1 to the Company’s Registration Statement on Form S-4 (File No. 333-198219), filed on September 30, 2014) | |
| 5.1 | Opinion of Maynard, Cooper & Gale, P.C. regarding legality of securities being registered (including its consent) | |
| 10.1† | National Commerce Corporation 2011 Equity Incentive Plan, as amended and restated on July 17, 2014 (incorporated herein by reference to Exhibit 10.1 to the Company’s Registration Statement on Form S-4 (File No. 333-198219), filed on August 18, 2014) | |
| 10.2† | National Commerce Corporation Deferral of Compensation Plan for Key Employees and Non-Employee Directors, effective December 18, 2014 (incorporated herein by reference to Exhibit 10.1 to the Company’s Current Report on Form 8-K (File No. 000-55336), filed on December 22, 2014) | |
| 10.3† | Form of Performance Share Award under National Commerce Corporation 2011 Equity Incentive Plan (time-based vesting criteria) (incorporated herein by reference to Exhibit 10.3 to the Company’s Registration Statement on Form S-4 (File No. 333-198219), filed on August 18, 2014) | |
| 10.4A† | Form of Performance Share Award under National Commerce Corporation 2011 Equity Incentive Plan (performance-based vesting criteria – 2012 grants) (incorporated herein by reference to Exhibit 10.4A to the Company’s Registration Statement on Form S-4 (File No. 333-198219), filed on August 18, 2014) | |
| 10.4B† | Form of Performance Share Award under National Commerce Corporation 2011 Equity Incentive Plan (performance-based vesting criteria – 2013 and 2014 grants) (incorporated herein by reference to Exhibit 10.4B to the Company’s Registration Statement on Form S-4 (File No. 333-198219), filed on August 18, 2014) | |
E-1
Table of Contents
Index to Financial Statements
| Exhibit Number |
Description | |
| 10.5† | Form of Nonstatutory Stock Option Agreement under National Commerce Corporation 2011 Equity Incentive Plan (incorporated herein by reference to Exhibit 10.5 to the Company’s Registration Statement on Form S-4 (File No. 333-198219), filed on August 18, 2014) | |
| 10.6† | United Group Banking Company of Florida, Inc. Officers’ and Employees’ Stock Option Plan effective March 3, 2010, as amended (incorporated herein by reference to Exhibit 10.6 to the Company’s Registration Statement on Form S-4 (File No. 333-198219), filed on August 18, 2014) | |
| 10.7† | Form of Stock Option Agreement under United Group Banking Company of Florida, Inc. Officers’ and Employees’ Stock Option Plan (incorporated herein by reference to Exhibit 10.7 to the Company’s Registration Statement on Form S-4 (File No. 333-198219), filed on August 18, 2014) | |
| 10.8 | Lease, dated March 8, 2011, by and between Shades Parkway, L.L.C. and National Bank of Commerce (incorporated herein by reference to Exhibit 10.8 to the Company’s Registration Statement on Form S-4 (File No. 333-198219), filed on August 18, 2014) | |
| 10.9 | Amended and Restated Limited Liability Company Agreement, dated September 1, 2014, by and between National Bank of Commerce and Factor, LLC (incorporated herein by reference to Exhibit 10.9 to Amendment No. 1 to the Company’s Registration Statement on Form S-4 (File No. 333-198219), filed on September 30, 2014) | |
| 10.10 | Employment Agreement, dated as of August 30, 2014, by and between Corporate Billing, LLC and James R. Thompson, III | |
| 10.11 | National Commerce Corporation 2015 Incentive Program (incorporated herein by reference to Exhibit 10.1 to the Company’s Current Report on Form 8-K (File No. 000-55336), filed on January 26, 2015) | |
| 10.12 | Form of Indemnification Agreement with directors and executive officers (incorporated herein by reference to Exhibit 10.2 to the Company’s current report on Form 8-K (File No. 000-55336), filed on January 26, 2015) | |
| 21.1** | Subsidiaries of National Commerce Corporation | |
| 23.1 | Consent of Maynard, Cooper & Gale, P.C. (included as part of Exhibit 5.1) | |
| 23.2 | Consent of Porter Keadle Moore, LLC | |
| 23.3 | Consent of Saltmarsh, Cleaveland & Gund, P.A. | |
| 23.4 | Consent of Talley, Mauldin & Peete, P.C. | |
| 24.1** | Power of Attorney | |
| 101* | Interactive Data Files | |
| * | To be filed by amendment. |
| ** | Previously filed. |
| † | Denotes a management compensatory plan, agreement or arrangement. |
| †† | Schedules and exhibits omitted pursuant to Item 601(b)(2) of Regulation S-K. National Commerce Corporation agrees to furnish a copy of any omitted schedule or exhibit to the Securities and Exchange Commission upon request. |
E-2