Attached files
| file | filename |
|---|---|
| EX-21 - EX-21 - MOBILE MINI INC | d852996dex21.htm |
| EX-23.2 - EX-23.2 - MOBILE MINI INC | d852996dex232.htm |
| EX-23.1 - EX-23.1 - MOBILE MINI INC | d852996dex231.htm |
| EX-32.1 - EX-32.1 - MOBILE MINI INC | d852996dex321.htm |
| EX-23.3 - EX-23.3 - MOBILE MINI INC | d852996dex233.htm |
| EX-31.1 - EX-31.1 - MOBILE MINI INC | d852996dex311.htm |
| EX-31.2 - EX-31.2 - MOBILE MINI INC | d852996dex312.htm |
| EXCEL - IDEA: XBRL DOCUMENT - MOBILE MINI INC | Financial_Report.xls |
Table of Contents
UNITED STATES SECURITIES AND EXCHANGE COMMISSION
Washington, D.C. 20549
Form 10-K
ANNUAL REPORT PURSUANT TO SECTION 13 OR 15(d)
OF THE SECURITIES EXCHANGE ACT OF 1934
For the fiscal year ended December 31, 2014
Commission File Number 1-12804

(Exact name of registrant as specified in its charter)
| Delaware | 86-0748362 | |
| (State or other jurisdiction of incorporation or organization) |
(I.R.S. Employer Identification No.) |
4646 E. Van Buren Street, Suite 400
Phoenix, Arizona 85008
(Address of principal executive offices) (Zip Code)
(480) 894-6311
(Registrant’s telephone number, including area code)
Securities registered pursuant to Section 12(b) of the Act:
| Title of each class |
Name of each exchange on which registered | |
| Common Stock, $.01 par value | Nasdaq Global Select Market | |
| Preferred Share Purchase Rights |
Securities registered pursuant to Section 12(g) of the Act:
None
Indicate by check mark if the registrant is a well-known seasoned issuer, as defined in Rule 405 of the Securities Act. Yes þ No ¨
Indicate by check mark if the registrant is not required to file reports pursuant to Section 13 or Section 15(d) of the Act. Yes ¨ No þ
Indicate by check mark whether the registrant (1) has filed all reports required to be filed by Section 13 or 15(d) of the Securities Exchange Act of 1934 during the preceding 12 months (or for such shorter period that the registrant was required to file such reports), and (2) has been subject to such filing requirements for the past 90 days. Yes þ No ¨
Indicate by check mark whether the registrant has submitted electronically and posted on its corporate Web site, if any, every Interactive Data File required to be submitted and posted pursuant to Rule 405 of Regulation S-T (§ 232.405 of this chapter) during the preceding 12 months (or for such shorter period that the registrant was required to submit and post such files). Yes þ No ¨
Indicate by check mark if disclosure of delinquent filers pursuant to Item 405 of Regulation S-K (§ 229.405 of this chapter) is not contained herein, and will not be contained, to the best of registrant’s knowledge, in definitive proxy or information statements incorporated by reference in Part III of this Form 10-K or any amendment to this Form 10-K. ¨
Indicate by check mark whether the registrant is a large accelerated filer, an accelerated filer, a non-accelerated filer, or a smaller reporting company. See the definitions of “large accelerated filer,” “accelerated filer” and “smaller reporting company” in Rule 12b-2 of the Exchange Act. (Check one):
| Large accelerated filer þ |
Accelerated filer ¨ | Non-accelerated filer ¨ | Smaller reporting company ¨ | |||
| (Do not check if a smaller reporting company) | ||||||
Indicate by check mark whether the registrant is a shell company (as defined in Rule 12b-2 of the Act). Yes ¨ No þ
The aggregate market value on June 30, 2014 of the voting common stock held by non-affiliates of the registrant was approximately $2.2 billion.
As of February 20, 2015 there were outstanding 45,848,123 shares of the registrant’s common stock, par value $.01.
DOCUMENTS INCORPORATED BY REFERENCE:
Portions of the Proxy Statement for the registrant’s 2015 Annual Meeting of Stockholders are incorporated herein by reference in Part III of this Form 10-K to the extent stated herein. Certain exhibits are incorporated in Item 15 of this Annual Report by reference to other reports and registration statements of the registrant which have been filed with the Securities and Exchange Commission.
Table of Contents
MOBILE MINI, INC.
2014 FORM 10-K ANNUAL REPORT
2
Table of Contents
Cautionary Statement about Forward Looking Statements
Our discussion and analysis in this Annual Report on Form 10-K, in other reports that we file with the Securities and Exchange Commission, in our press releases and in public statements of our officers and corporate spokespersons contain forward-looking statements. Forward-looking statements give our current expectations or forecasts of future events. You can identify these statements by the fact that they do not relate strictly to historical or current events. They include words such as “may”, “plan”, “seek”, “will”, “expect”, “intend”, “estimate”, “anticipate”, “believe” or “continue” or the negative thereof or variations thereon or similar terminology. These forward-looking statements include statements regarding, among other things, our future actions; financial position; management forecasts; efficiencies; cost savings, synergies and opportunities to increase productivity and profitability; our plans and expectations regarding the acquisition; income and margins; liquidity; anticipated growth; the economy; business strategy; budgets; projected costs and plans and objectives of management for future operations; sales efforts; taxes; refinancing of existing debt; and the outcome of contingencies such as legal proceedings and financial results.
Forward-looking statements may turn out to be wrong. They can be affected by inaccurate assumptions or by known or unknown risks and uncertainties. We undertake no obligation to update or revise any forward-looking statements, whether as a result of new information, future events or otherwise. Important factors that could cause actual results to differ materially from our expectations are disclosed under “Risk Factors” and elsewhere in this Annual Report on Form 10-K, including, without limitation, in conjunction with the forward-looking statements included herein. These are factors that we think could cause our actual results to differ materially from expected and historical results. We could also be adversely affected by other factors besides those listed. All subsequent written and oral forward-looking statements attributable to us, or persons acting on our behalf, are expressly qualified in their entirety by the cautionary statements, factors and risks identified herein.
3
Table of Contents
PART I
| ITEM 1. | BUSINESS. |
Mobile Mini, Inc. — General
We are the world’s leading provider of portable storage solutions, and are committed to providing our customers with superior service and access to a high-quality and diverse fleet. Our mission is to uphold our leadership position in portable storage solutions to customers throughout North America and the United Kingdom (“U.K.”) and we currently are the market leader in virtually all markets served.
Mobile Mini, founded in 1983, focuses on leasing our units, with leasing revenues representing approximately 92.1% of our total revenues for the year ended December 31, 2014. We believe our leasing strategy is highly attractive and provides predictable, recurring revenue. Additionally, our assets have long useful lives, high residual values and low maintenance costs. We also sell new and used units and provide delivery, installation and other ancillary products and services.
On December 10, 2014, we completed the acquisition of Gulf Tanks Holdings, Inc., the parent company of Evergreen Tank Solutions (“ETS”), which we refer to as the “ETS Acquisition”. ETS is the third largest provider of specialty containment solutions in the United States (“U.S.”) and the leading provider in the Gulf Coast. ETS, which had total revenues of approximately $90 million in 2013, will continue to operate as a separate subsidiary of ours under the ETS name, as will its subsidiary, Water Movers, Inc. (“Water Movers”). The acquisition of ETS creates a combined company that is the leading provider of portable storage in North America and the U.K. as well as a leading provider of specialty containment solutions in the petrochemical and industrial segments in the U.S.
Giving effect to the ETS Acquisition, our business is comprised primarily of two product categories:
| • | Portable Storage Solutions |
This product category consists of our container and office product offerings. We offer a wide range of portable storage products in varying lengths and widths with an assortment of differentiated features such as patented locking systems, premium doors, electrical wiring and shelving. Our portable storage units provide secure, accessible temporary storage for a diversified client base of approximately 84,000 customers across various industries, including retail and consumer services, construction, industrial, commercial and governmental. As of December 31, 2014, our portable storage fleet of 213,500 units was offered to our customers through 136 locations in North America and the U.K. Our customers use these products for a wide variety of storage applications, including retail and manufacturing, inventory, maintenance supplies, construction materials and equipment, documents and records, household goods, and as portable offices.
| • | Specialty Containment Solutions |
Our specialty containment products are currently offered through ETS to our customers through 24 locations in North America, and consist primarily of liquid and solid containment units, pumps and filtration equipment. Additionally, we provide an offering to our customers of value-added services designed to enhance the efficiency of managing liquid and solid waste. The client base for our specialty containment products includes customers in specialty industries, including chemical, refinery, oil and natural gas drilling, mining and environmental. ETS offers specialty pump equipment and related services through its Water Movers subsidiary.
Prior to the acquisition of ETS we have reported our business in two business segments, North America and U.K., both of which offer portable storage solutions. As a result of the ETS Acquisition, we have established a new specialty containment reporting segment. The assets and liabilities of ETS are included in Mobile Mini’s December 31, 2014 consolidated balance sheet. Operations related to ETS are included in our consolidated results from the acquisition date of December 10, 2014 through the end of the year. For the year ended December 31, 2014, our business consisted primarily of portable storage solutions.
4
Table of Contents
In the discussions below, we generally refer to our business and assets as either “portable storage” or “specialty containment”.
Industry Overview
Portable Storage Solutions
The temporary storage industry includes two principal sectors, fixed self-storage and portable storage. The fixed self-storage sector consists of permanent structures located away from customer locations to temporarily store excess household goods. We do not participate in the fixed self-storage sector.
The portable storage sector, upon which our business focuses, differs from the fixed self-storage sector, as it brings the storage solution to the customer’s location and addresses the need for secure, temporary storage with immediate access to the storage unit. The advantages of portable storage include convenience, immediate accessibility, and lower price. In contrast to the fixed self-storage sector, the portable storage sector is primarily used by businesses. This sector of the temporary storage industry is highly fragmented and remains primarily local in nature. Portable storage units, such as containers and record vaults, are achieving increased market share compared to other portable options because containers provide ground level access, better protection against wind or water damage, higher security and improved aesthetics, compared to certain other portable storage alternatives such as van trailers. Although there are no published estimates of the size of the portable storage market, we believe the sector is expanding due to the increasing awareness of the advantages of portable storage.
Our portable storage products also serve the modular space industry, which includes mobile offices and other modular structures. We offer steel offices made from converted ISO containers, which we call security offices, as well as combination steel office/storage units and mobile offices in varying lengths and widths to serve the various requirements of our customers. We also offer portable document and record storage units and many of our regular storage units are used for document and record storage.
Our portable storage business is subject to the general health of the economy and we utilize general economic indicators, such as gross domestic product and the industrial capacity utilization index, to assess market trends and determine the direction of our business. Additionally, non-residential construction activity is an important external factor that we monitor. Customers in the construction industry represented approximately 49% of our portable storage leasing revenue for the twelve months ended December 31, 2014.
Specialty Containment Solutions
In the specialty containment sector services industry, we service different markets: the industrial market comprised mainly of chemical facilities and refineries, which we call the “downstream” market and, to a lesser extent, companies engaged in the exploration and production of oil and natural gas, which we call the “upstream” market. Additionally, we serve a diversified group of customers engaged in projects in the construction, pipeline and mining markets. Downstream customers utilize our equipment and services to manage and remove liquid and solid waste generated by ongoing operating activities as well as turn-around projects and large-scale expansion projects, while upstream customers tend to rent steel tanks to store and transport water and propellant used in well hydraulic fracturing (“fracing”). Other customers utilize a wide variety of our products differentiated by the type of project in which they are engaged. The liquid and solid containment industry is highly fragmented.
Competitive Strengths
Our competitive strengths include the following:
Market Leader. We are the world’s largest provider of portable storage solutions, where we maintain strong market positions in virtually all of the markets we serve. In the U.K., we are a market leader and have nearly 100% geographic coverage. As a result of the ETS Acquisition, we are now the largest provider of specialty containment solutions in the Gulf Coast region and the third largest provider in the U.S.
5
Table of Contents
The Mobile Mini brand name is associated with high quality portable storage products, superior customer service and value-added storage solutions. Similarly, within the markets and sectors served, the ETS brand name is associated with high quality containment products and services, and the Water Movers name is associated with exceptional quality pump and filtration equipment and service. We believe we are one of a few competitors in the U.S. and the U.K. who possess the brand awareness, network of locations, customer relationships and infrastructure to compete on a national and regional basis while maintaining a strong local market presence.
Superior, Differentiated Products and Service. We remanufacture used ISO (International Organization for Standardization) containers and have designed and manufactured our own portable storage units which allows us to offer a wide range of products and proprietary features, including features that provide high-levels of security, to better meet our customers’ needs than our competitors. This product differentiation within the portable storage sector allows us to gain market share and charge premium rental rates.
We offer a broad range of specialty containment equipment and value-added services, which enables us to meet customers’ ongoing needs as well as their needs throughout the various life cycles of projects unique to the petrochemical and industrial industry. Our comprehensive turnkey solutions to customers’ containment, storage, pumping and filtration needs drives the creation of strong long-term partnerships with our customers.
Sales and Marketing Emphasis. We target a diverse customer base and, unlike most of our competitors, have developed sophisticated sales and marketing programs enabling us to expand market awareness of our products and generate strong organic growth. We have a dedicated commissioned sales team that is provided with our highly customized contact management system and intensive sales training programs. We manage our salespersons’ effectiveness through extensive sales call monitoring, mentoring and training programs. Our digital advertising includes paid and organic search marketing products, industry targeted content, social messaging, and industry and customer partnerships. External market research vendors are an integral part of our sales and marketing approach. Additionally, our Web site includes value-added features such as product video tours, payment capabilities and real time sales inquiries that enable customers to chat live with salespeople.
National Presence with Local Service. We have invested significant capital developing a national network of locations that serve most major metropolitan areas in the U.S. and the U.K. Our nationwide presence allows us to offer our products to larger customers who wish to centralize the procurement of portable storage on a multi-regional or national basis. We believe we will be able to leverage our national presence and infrastructure in the portable storage U.S. market to facilitate the growth of the specialty containment business.
In the field, our local managers, sales force and delivery drivers develop and maintain critical personal relationships with customers that benefit from access to our wide selection of products.
Geographic and Customer Diversification. Our network of 136 portable storage locations covers nearly all major markets in both the U.S. and U.K., providing us with a broad geographical reach. Additionally, since portable storage units are used in a multitude of applications, we have established strong relationships with a well-diversified base of portable storage customers, ranging from leading Fortune 500 companies to sole proprietorships. The operation of 24 specialty containment locations concentrated in the Gulf Coast region, further diversifies our geographic presence and customer base.
As a combined company, our geographically and industry-diversified customer base reduces our susceptibility to the effects of economic downturns in any individual market and industry in which we operate.
Customer Service Focus. The portable storage industry is particularly service intensive. To position ourselves to understand our customers’ needs, we have sales people at both the national and local level and have trained our sales force to focus on all aspects of customer service from the sales call onward. Our
6
Table of Contents
Customer Relationship Management (“CRM”) system enables us to increase our responsiveness to customer inquiries and to efficiently monitor our sales force’s performance. We use a Net Promoter Score (“NPS”) system to measure customer satisfaction and loyalty through real time surveys conducted by a third party. We utilize customer feedback to drive service improvements across the Company, from our field locations to our corporate headquarters, resulting in proven success as evidenced by our best in class NPS score of 76.1% in 2014. We differentiate ourselves by providing security, convenience, product quality, broad product selection and availability, and customer service. We believe our superior customer service drives customer satisfaction. Approximately 65% of our 2014 portable storage leasing revenues was derived from repeat customers.
Within the specialty containment industry, ETS has leveraged its broad range of products and expertise to differentiate itself from competitors. ETS offers a full suite of the liquid and solid containment equipment required to execute a comprehensive containment solution that often must meet stringent regulatory and technical requirements. In addition ETS offers a proprietary, sophisticated technology platform that provides detailed real-time data capture, tracking and customized reporting capabilities. This technology, which may be integrated with customers’ enterprise systems, is a unique customer service tool that enables us to develop strong, long-term relationships with our larger customers. The average length of relationship for our largest customers is more than seven years. Many of ETS’ customers are large, blue-chip companies.
Customized Management Information Systems. We continue to make significant investments in our management information systems supporting our operations. Our systems enable us to optimize fleet utilization, control pricing, dispatch and track our trucks, capture detailed customer data, easily evaluate and approve credit applications, monitor company results, gain efficiencies in internal control compliance, and support our growth by projecting near-term capital needs. Field employees and decision makers at all levels have access to real-time information about the business. In addition, we are able to capture relevant customer demographic and usage information, which we use to target new customers within our existing and new markets. These capabilities result in a competitive advantage over smaller, less sophisticated local and regional competitors.
Business Strategy
Throughout 2014 and continuing in 2015, our strategic goal has been to accelerate leasing revenue growth and expand our operating margins by leveraging our infrastructure, and driving continuous improvements in efficiency. To achieve these goals, we intend to execute the following strategies:
Focus on Core Leasing Business. Our leasing business provides predictable recurring revenue and high margins. We believe that we can continue to generate substantial demand for our lease units throughout North America and the U.K.
Generate Strong Organic Growth. We focus on increasing market penetration and gaining additional revenues from current customers through sophisticated sales and marketing programs aimed at increasing brand recognition, expanding market awareness of the uses of portable storage and differentiating our superior products from those of our competitors.
Opportunistic Geographic Expansion. We believe we have attractive expansion opportunities and have identified over 50 potential new geographic, or underserved, markets in North America where we believe demand for portable storage units is underdeveloped. In 2014 we executed eight portable storage acquisitions, which have enabled us to enter new markets, as well as establish new customers in existing markets. We expect to continue to execute on opportunistic acquisitions in the future. We also have a proven strategy to enter markets from time to time, by migrating available fleet to new markets that can be serviced by nearby full-service field locations. From these start-up operational yards, we are able to redeploy existing available fleet, allowing for cost effective new location openings with minimal capital expenditures.
Innovative Product Offering. The introduction of new products and features expands the applications and overall market for our portable storage products. For example, over the years we have introduced a
7
Table of Contents
number of innovative products including a 10-foot-wide storage unit, a record storage unit and a 10-by-30-foot steel combination storage/office unit to our fleet. Currently, the 10-foot-wide unit, the record storage unit and the 10-by-30-foot steel combination storage/office unit are exclusively offered by Mobile Mini. We have also made continuous improvements to our patented locking system (for example, making it easier to use in colder climates). Within our specialty containment products, we offer one of the broadest ranges of services and containment equipment in the industry accompanied with an assortment of pumps, filtration units and waste hauling services designed to allow us to partner with customers through every project stage. We constantly evaluate our portfolio of product offerings to ensure our capital is invested in products that provide optimal returns.
Opportunities for Cross-selling and Expansion. The ETS Acquisition presents an opportunity to leverage the combination of Mobile Mini’s national presence and ETS management’s energy sector expertise to grow specialty containment revenue both by providing new products and services to existing Mobile Mini customers, and by expanding the geographic reach of our specialty containment products to serve customers previously outside of ETS’ service area. Additionally, ETS’ significant presence in downstream and industrial markets, particularly in the Gulf Coast region, will allow us to leverage established, long-term relationships to partner with their customer base to meet their portable storage needs.
Increase Fleet Utilization. Maintaining our fleet in a rent-ready condition, and positioning units in areas of high demand will maximize utilization of our existing fleet. Increasing utilization will result in higher margins and reduce capital expenditures to meet growth.
Drive Profitability of Existing Locations. We have established key performance indicators to optimize profitability at individual locations and incentivize local management teams based on the performance of their branch. We also compare results across locations and regions to identify areas of opportunity for growth or for increased efficiencies.
Continuous Improvement in Our Systems. We have made significant investments in our management information systems supporting our operations and believe these systems give us a competitive advantage. We have identified newly available technologies to further increase efficiency and data management. As such, in 2014 we began the process to implement a new Enterprise Resource Planning (“ERP”) system. This investment will result in a scalable platform to support future growth.
Products
We protect our products and brands through the use of trademarks and patents. In particular, we have patented our proprietary tri-cam locking system, our Container Guard Lock and other continued improvements in our locking technology both in the markets in which we operate as well as in Europe and China.
Portable Storage Solutions
We offer customers a wide range of portable storage and office products with an assortment of differentiated features such as patented locking systems, premium and multiple door options and approximately 100 different configuration options. Our portable storage units provide secure, accessible temporary storage. Our principal products are listed below:
| • | Steel Storage Containers. Standard portable storage containers are available in lengths ranging from 5 to 45 feet, widths of either 8 feet or 10 feet and a variety of customization options. Doors can be placed at the front, front and back, or the sides of containers. Other options include partitions and shelving. We also market proprietary portable records storage units. Records storage units feature high-security doors and locks, electrical wiring, shelving, folding work tables and air filtration systems. We believe our steel storage containers are a cost-effective alternative to mass warehouse storage, with a high level of fire and water damage protection. |
| • | Steel Security Office and Steel Combination Offices. We buy and historically have manufactured steel security office/storage combination and security office units that range from 10 to 40 feet in length. We |
8
Table of Contents
| offer these units in various configurations, including office and storage combination units that provide a 10- or 15-foot office with the remaining area available for storage. Our office units provide the advantage of ground accessibility for ease of access and high security in an all-steel design. Our U.K. products include canteen units and drying rooms for the construction industry. For customers with space limitations, the office/canteen units can also be stacked two high with stairs for access to the top unit. These office units are equipped with electrical wiring, heating and air conditioning, phone jacks, carpet or tile, high security doors and windows with security bars or shutters. Some of these offices are also equipped with sinks, hot water heaters, cabinets and restrooms. |
| • | Wood Mobile Offices. We offer wood mobile office units, which range from 8 to 24 feet in width and 20 to 60 feet in length, and which we purchase from manufacturers. These units have a wide range of exterior and interior options, including exterior stairs or ramps, awnings and skirting. These units are equipped with electrical wiring, heating and air conditioning, phone jacks, carpet or tile and windows with security bars. Many of these units contain restrooms. |
Specialty Containment Solutions
We offer one of the broadest ranges of specialty containment equipment and services in the industry accompanied with an assortment of pumps, filtration units and waste hauling services. In addition, we offer ancillary products for rental and for sale to our customers, such as: hoses, pipes, filters and spill containment. Our products and services include those listed below:
| • | Steel Tanks. Our fleet of steel tanks offers flexible sizes and other options such as acid steel tanks, gas buster steel tanks and open top steel tanks. Applications include: temporary storage of water and other liquids, thorough mixing, agitation and circulation of stored liquids with other products, removal of free or entrained gas from fluids circulated in the wellbore — such as mud used during drilling operations, and settling of solids in liquids prior to filtration or discharge. |
| • | Stainless Steel Tank Trailers. Our stainless steel tankers meet department of transportation specifications for use in the storage and transportation of chemical, caustics and other liquids. Stainless steel tanks are offered insulated or non-insulated with level indication and vapor recovery capability. |
| • | Roll-Off Boxes. Utilized for a variety of containment applications where it is necessary to maintain the homogeneity of the contents, our roll-off boxes provide simple, leak-proof storage and transportation of solid industrial byproducts. A roll-tarp or rolling metal lid is provided to protect the contents from the elements during transport. |
| • | Vacuum boxes. Vacuum roll-off boxes are also offered to pair with a vacuum truck to efficiently vacuum liquids, dry materials, and sludge, whereby the contents vacuumed may be collected directly in the roll-off vacuum box, allowing the air-mover truck to remain on-site and in service during vacuum pumping applications. |
| • | Dewatering Boxes. Our dewatering boxes are configured to provide for the draining of excess liquid from slurry or sludge which reduces storage, transportation and disposal costs. Upon completion of dewatering, the container is generally picked up by a roll-off truck for content disposal. Vacuum dewatering boxes are also offered. |
| • | Pumps and Filtration Equipment. We offer a variety of pumps and filtration equipment differentiated by size and power. This equipment is used primarily for liquid circulation and filtration. |
| • | Services. Value-added services performed by our employees include: |
| • | Transportation of containers for waste management between multiple locations or in-plant, |
| • | Waste management oversight and service provision by an on-site dedicated team, |
| • | System design including assessment of pumping, filtration and temporary storage needs, and |
| • | Field services to correctly install and connect customer containment equipment. |
9
Table of Contents
Product Lives and Durability
Portable Storage Solutions
Our steel portable storage containers, steel security offices and wood mobile offices have estimated useful lives of 30, 30, and 20 years, respectively, from the date we build or acquire and remanufacture them, with residual values ranging from 50% for our mobile offices to 55% for our core steel products.
Steel containers have a long useful life with no technical obsolescence. We maintain our steel containers on a regular basis by painting them with rust inhibiting paint, removing rust, and occasionally replacing the wooden floor or a rusted panel. Repainting the outside of storage units is the most common maintenance item. A properly maintained container is essentially in the same condition as when we initially remanufactured it. We lease containers that have been in our lease fleet for various lengths of time at similar rates, without regard to the age of the container. As such, we have no need for a systematic program to sell lease fleet containers as they age. Generally, sales of containers from our fleet occur due to a particular customer need, or due to fleet in excess of demand at a particular location.
Appraisals on our portable storage fleet are conducted on a regular basis by an independent appraiser selected by our lenders. The appraiser does not differentiate in value based upon the age of the container or the length of time it has been in our fleet. The latest orderly liquidation value appraisal in September, 2014 was conducted by AccuVal Associates, Incorporated. Based on the values assigned in this appraisal our portable storage lease fleet net orderly liquidation appraisal value as of December 31, 2014, was approximately $1.1 billion. Our net book value for this fleet as of December 31, 2014 was $965.8 million.
Specialty Containment Solutions
When purchased new, our steel tanks and stainless steel tank trailers have estimated useful lives of 25 years, dewatering and roll-off boxes have useful lives ranging from 15 to 20 years and our pumps and filtration equipment have estimated lives of 7 years. We do not assume any residual value at the end of the assets’ useful lives. There is a limited secondary market for specialty containers.
We have outlined a stringent quality control and maintenance program to ensure that only equipment of the highest quality is released to the field. Each container undergoes a thorough visual inspection, hydro-testing and ultrasonic thickness testing to identify maintenance requirements. Container maintenance include repainting with rust inhibiting paint, replacing interior liners, and repairing valves, gaskets and rails. This periodic maintenance keeps the specialty container in essentially the same condition as when we initially purchased it and is designed to maintain the unit’s value.
We lease specialty containers that have been in our lease fleet for various lengths of time at similar rates, without regard to the age of the container and we have no systematic program in place to sell specialty containers and equipment as they reach a certain age. Generally, sales of containers from our fleet occur due to a particular customer need, or due to damage beyond economical repair.
Depreciation
Our depreciation policy for our leased fleet uses the straight-line method over the units’ estimated useful life, after the date we place the unit in service, and the units are depreciated down to their estimated residual values. Assets obtained through company acquisitions are recorded at their then current fair market value and depreciated to their estimated residual value, if any, over each asset’s estimated remaining life.
Remanufacturing and Manufacturing of Portable Storage Containers
We purchase used ISO containers from leasing companies, shipping lines and brokers. These containers were originally built to ISO standards and are 8 feet wide, up to 9.5 feet high and 20, 40 or 45 feet long. We
10
Table of Contents
generally purchase used ISO containers when they are 10 to 12 years old, a time at which their useful life as an ISO shipping container has normally expired. After acquisition, we remanufacture and modify these ISO containers. Remanufacturing typically involves cleaning, removing rust and dents, repairing floors and sidewalls, painting, adding our signs and further customizing units by adding our proprietary easy opening door system and our patented locking system. Modification typically involves splitting some containers into 5-, 10-, 15-, 20- or 25-foot lengths. The capitalized cost for remanufactured units includes the price we paid for the unit, plus the cost of customizing units and freight charges to our location when the unit is first placed in service. For manufactured units, cost includes our manufacturing cost, customization costs and freight charges to our location when the unit is first placed in service.
We believe we are able to procure ISO containers at competitive prices because of our volume purchasing power. If needed in the manufacturing or remanufacturing process, we purchase raw materials such as steel, vinyl, wood, glass and paint. Typically we do not have long-term contracts with vendors for the supply of any raw materials.
Additionally, we manufacture custom sale orders at our Maricopa, Arizona facility as well as, remanufacture and perform repairs and maintenance on our existing lease fleet.
Lease Fleet Composition
The table below outlines the composition of our portable storage lease fleet at December 31, 2014:
| Lease Fleet | Number of Units | Percentage of Units |
||||||||||
| (In thousands) | ||||||||||||
| Steel storage containers |
$ | 604,547 | 173,674 | 81 | % | |||||||
| Steel security and combination offices |
329,565 | 28,195 | 13 | |||||||||
| Wood mobile offices |
208,529 | 9,481 | 4 | |||||||||
| Other |
5,633 | 2,196 | 2 | |||||||||
|
|
|
|
|
|
|
|||||||
| Portable storage lease fleet |
1,148,274 | 213,546 | 100 | % | ||||||||
|
|
|
|
|
|||||||||
| Accumulated depreciation |
(182,437 | ) | ||||||||||
|
|
|
|||||||||||
| Portable storage lease fleet, net |
$ | 965,837 | ||||||||||
|
|
|
|||||||||||
The table below outlines those transactions that effectively changed the net book value of our portable storage lease fleet from $979.3 million at December 31, 2013 to $965.8 million at December 31, 2014:
| Dollars | Number of Units | |||||||
| (In thousands) | ||||||||
| Portable storage lease fleet at December 2013, net |
$ | 979,276 | 212,898 | |||||
| Purchases and units acquired through acquisitions, including freight: |
||||||||
| Steel storage containers |
14,706 | 6,198 | ||||||
| Steel security and combination offices |
8,769 | 679 | ||||||
| Other |
439 | 328 | ||||||
| Manufactured units: |
||||||||
| Steel security offices |
78 | 19 | ||||||
| Remanufacturing and customization of units purchased or obtained in prior years(1)(2) |
11,972 | 375 | ||||||
| Other(3) |
283 | (187 | ) | |||||
| Sales from lease fleet |
(17,491 | ) | (6,764 | ) | ||||
| Effect of exchange rate changes |
(10,775 | ) | ||||||
| Depreciation |
(21,420 | ) | ||||||
|
|
|
|
|
|||||
| Portable storage lease fleet at December 31, 2014, net |
$ | 965,837 | 213,546 | |||||
|
|
|
|
|
|||||
11
Table of Contents
| (1) | Does not include routine maintenance, which is expensed as incurred. |
| (2) | These units include the net additional units that were the result of splitting steel containers into two or more shorter units, such as splitting a 40-foot container into two 20-foot units, or one 25-foot unit and one 15-foot unit and include units moved from finished goods to lease fleet. |
| (3) | Includes net transfers to and from property, plant and equipment and net non-sale disposals and recoveries of the lease fleet. |
The table below outlines the composition of our specialty containment lease fleet at December 31, 2014 (1):
| Lease Fleet | Number of Units | Percentage of Units |
||||||||||
| (In thousands) | ||||||||||||
| Steel tanks |
$ | 50,843 | 2,825 | 28 | % | |||||||
| Roll-off boxes |
19,820 | 4,375 | 43 | |||||||||
| Vacuum boxes |
7,667 | 967 | 9 | |||||||||
| Stainless steel tank trailers |
23,283 | 577 | 6 | |||||||||
| Dewatering boxes |
3,898 | 570 | 6 | |||||||||
| Pumps and filtration equipment |
11,510 | 951 | 8 | |||||||||
| Other |
5,468 | n/a | ||||||||||
|
|
|
|
|
|
|
|||||||
| Specialty containment lease fleet |
122,489 | 10,265 | 100 | % | ||||||||
|
|
|
|
|
|||||||||
| Accumulated depreciation(2) |
(1,270 | ) | ||||||||||
|
|
|
|||||||||||
| Specialty containment lease fleet, net |
$ | 121,219 | ||||||||||
|
|
|
|||||||||||
| (1) | Assets obtained through the ETS Acquisition were recorded at their estimated fair value at acquisition. The estimated fair values of acquired assets could change as additional information is received regarding the assets. |
| (2) | Accumulated depreciation represents depreciation expense recorded from the ETS Acquisition date through December 31, 2014. |
Field Operations
For the majority of the year ended December 31, 2014, our senior management analyzed and managed our business as two portable storage solutions business segments: North America and the U.K. Our operations across these locations concentrate on the core business of leasing and selling products that are substantially the same in each market. To effectively manage this business across different geographic areas, we divide these business segments into smaller management areas we call divisions, regions and locations. Each of our locations, in their segment, generally has similar economic characteristics covering all products leased or sold, including similar customer base, sales personnel, advertising, yard facilities, general and administrative costs and field operations management.
On December 10, 2014, we completed the ETS Acquisition and established a new business segment. ETS will continue to operate as a separate subsidiary of ours under the ETS name and will be managed separately. Similar to our portable storage segments, ETS branches are arranged into larger groups called areas, each comprised of two to three branches. Further financial information by segment is provided in Note 15 to the Consolidated Financial Statements appearing in Item 8 of this Annual Report on Form 10-K.
12
Table of Contents
Portable Storage Solutions
Within the portable storage business, we locate our field operations in markets with attractive demographics and strong growth prospects. Within each market, we are located in areas that allow for easy delivery of portable storage units to our customers over a wide geographic area. In addition, when cost effective, we seek locations that are visible from high traffic roads in order to advertise our products and our name. Our field locations maintain an inventory of portable storage units available for lease.
Each branch has a manager who has overall supervisory responsibility for all operational activities. Field location managers report to regional managers who each generally oversee multiple locations. Our regional managers, in turn, report to one of our operational senior vice presidents (called a managing director in the U.K.). Performance based incentive bonuses are a substantial portion of the compensation for these senior vice presidents, regional managers and field managers.
Locations have dedicated sales staff and transportation personnel that deliver and pick up portable storage units from customers. The locations have delivery trucks and forklifts to load, transport and unload units and a storage yard staff responsible for unloading and stacking units. Steel units can be stored by stacking them to maximize usable ground area. Our field locations perform preventive maintenance tasks, but outsource major repairs and other maintenance requirements.
Specialty Containment Solutions
A typical ETS branch is strategically located near a major roadway for ease of transportation and consists of an outdoor storage yard with a small office. Area managers are responsible for all aspects of their specific branches as well as coordinating service and fleet allocation to satisfy customer projects. Branches are typically staffed with a branch manager, business development representative, operations manager, several drivers, administrative personnel, and several yard personnel/mechanics.
Each branch is responsible for (i) serving its current customers and targeting potential new customers in the branch’s service area, (ii) dispatching drivers to deliver and pick up equipment, (iii) performing general maintenance and repair, (iv) modifying equipment to meet customized requests, (v) implementing quality and safety programs, and (vi) performing administrative tasks.
Sales and Marketing
Portable Storage Solutions
We approach the market through a hybrid sales model consisting of a dedicated sales staff at our field locations as well as at our National Sales Center (“NSC”). Our NSC handles inbound calls and digital leads from new customers and initiates outbound sales campaigns to new and existing customers not serviced by sales personnel at our field locations. Our sales staff at the NSC work with our local field managers, dispatchers and sales personnel to ensure customers receive integrated first class service from initial call to delivery. Our field location sales staff, NSC and sales management team at our headquarters engage in sales and marketing on a full-time basis. We believe that offering local salesperson presence for customers along with the efficiencies of a centralized sales operation for customers not needing a local sales contact will continue to allow us to provide high levels of customer service and serve all of our customers in a dedicated, efficient manner.
In lieu of maintaining separate sales forces for our various product lines, our sales personnel handle all of our portable storage products. Our sales and marketing force provides information about our products to prospective customers by handling inbound calls and initiating outbound marketing calls. We have ongoing sales and marketing training programs covering all aspects of leasing and customer service. Our field locations communicate with one another and with corporate headquarters through our ERP system and our CRM software,
13
Table of Contents
Salesforce.com®. This centralization of information enables the sales team to share leads and other information and permits management to monitor and review sales and leasing productivity on a location-by-location basis. We improve our sales efforts by recording and rating the sales calls made and received by our trained sales force. Our sales personnel are compensated largely on a commission basis.
Our nationwide presence in the U.S. and the U.K. allows us to offer our products to larger customers who wish to centralize the procurement of portable storage on a multi-regional or national basis. Within our portable storage business, we are well equipped to meet these customers’ needs through our National Account Program, which centralizes and simplifies the procurement, rental and billing process for those customers. Approximately 508 North American customers and 29 U.K. customers currently participate in our National Account Program. We also provide our national account customers with service guarantees, which assure them they will receive the same superior customer service and access to high quality, diverse fleet from any of our field locations. This program has helped us succeed in leveraging customer relationships developed at one location throughout our network system.
We focus a significant portion of our marketing expenditures on digital initiatives for both existing and potential customers. We also use targeted direct email and digital programs to build brand awareness by communicating market specific features and tying them to industry benefits of using portable storage solutions. We have implemented aspects of search engine marketing like remarketing, Pay Per Click (“PPC”), content curation, and organic search best practices to drive our customers to on-line lead generation with real-time access to our CRM. Immediately after completion of the online form, our dedicated sales force will make contact with the customer and complete the request. External market research vendors are an integral part of our sales and marketing approach. Additionally, our Web site includes value-added features such as product video tours, payment capabilities and real time sales inquiries that enable customers to chat live with salespeople.
Specialty Containment Solutions
Each specialty containment branch is responsible for targeting potential new customers in the branch’s service area and to be available to respond to customers 24 hours a day, 365 days a year. The branches are supported by a corporate team, including a sales and marketing department, business development representatives and national account management. ETS branch managers and business development representatives work with customers to design customized solutions and identify new service and product applications. National account management maintains contractual relationships with numerous blue-chip customers and coordinates the provision of services to customers with locations across multiple areas. Our sales personnel are compensated largely on a commission basis.
Additionally, ETS utilizes an advanced prospect and customer management software package across its sales force and branch network, providing enhanced visibility and tracking on all prospective customer accounts. ETS personnel have access to real-time critical customer information regardless of location. This access facilitates targeted marketing and sharing of relevant customer information across the ETS branches.
Customers
Portable Storage Solutions
In 2014, we served approximately 84,000 customers. Our largest and second largest customers accounted for only 4.2% and 0.9%, respectively, of portable storage leasing revenues and the 20 largest customers combined accounted for approximately 9.6% of portable storage leasing revenues. During 2014, approximately 60.2% of our customers rented a single unit. We target customers who we believe can benefit from our portable storage solutions, either for seasonal, temporary or long-term storage needs. Customers use our portable storage units for a wide range of purposes.
14
Table of Contents
Specialty Containment Solutions
Our specialty containment customers are concentrated in the Gulf Coast region of the U.S. and are generally large companies, including blue-chip companies, with whom we have long-term relationships. During the twelve months ended December 31, 2014 (including the period of time prior to the ETS Acquisition), the two largest specialty containment customers accounted for approximately 14.5% and 7.4%, respectively, of specialty containment leasing revenues and the 20 largest customers combined accounted for approximately 49.6% of specialty containment leasing revenues. Generally, our specialty containment customers belong in one of the following three categories:
| • | Downstream customers that focus on refining petroleum crude oil as well as processing and purifying raw natural gas. These customers may also market and distribute products derived from crude oil and natural gas including such products as gasoline, kerosene, jet fuel, diesel oil, lubricants, asphalt, natural gas and hundreds of varieties of petrochemicals. |
| • | Upstream customers focusing on exploration for underground crude oil and natural gas fields. Upstream companies perform such activities as well drilling, operation of producing wells and bringing crude oil and/or raw natural gas to the surface using alternative methods. This category includes companies that perform fracing. |
| • | Diversified customers consist of all other companies to whom we provide products or services. These customers primarily perform pump and filtration activities such as: municipal sewer and water infrastructure, mining pit pump work, pipeline construction and maintenance, non-residential construction and other major projects. |
We estimate that total 2014 ETS revenue (including the portion of the year prior to acquisition) was 53%, 21% and 26% from downstream, upstream and diversified customers, respectively.
Combined Customer Base
The following table provides an overview of our customers and the estimated portion of combined leasing revenue (including the portion of the year prior to acquisition) generated by each customer group:
| Business |
Estimated Percentage |
Representative | ||||
| Construction |
42 | % | General, electrical, plumbing and mechanical contractors, landscapers, residential homebuilders, and equipment rental companies | |||
| Consumer service and retail businesses |
23 | % | Department, drug, grocery and strip mall stores, hotels, restaurants, dry cleaners and service stations | |||
| Industrial and commercial |
22 | % | Major processing plants for organic and inorganic chemicals, refineries, distributors and trucking and utility companies. | |||
| Government and institutions |
4 | % | National, state and local agencies and municipalities, schools, hospitals, medical centers, military, Native American tribal governments and reservations. | |||
| Oil and gas |
4 | % | Companies performing such activities as exploratory well drilling, operation of producing wells and bringing crude oil and/or raw natural gas to the surface using alternative methods (including fracing) | |||
| Other |
5 | % | ||||
|
|
|
|||||
| Total |
100 | % | ||||
|
|
|
|||||
15
Table of Contents
Vehicles
At December 31, 2014, within the portable storage business we had a fleet of 612 delivery trucks, of which 403 were owned and 209 were leased. We use these trucks to deliver and pick up containers at customer locations. Within our specialty containment business, we had a fleet of 133 trucks, of which 128 were owned and 5 were leased. We use these trucks to deliver and pick up containers at customer locations, as well as to provide waste management transportation services.
We supplement our delivery fleet by outsourcing delivery services to independent haulers when appropriate.
Lease Terms
Portable Storage Solutions
Under our portable storage lease agreements, each lease has an original intended length of term at inception. However, if the customer keeps the leased unit beyond the original intended term, the lease continues until cancelled by the customer or the Company. On average, the steel storage units on rent at December 31, 2014, have been in place for 31 months, and the offices on rent at December 31, 2014 have been in place for 17 months. Our leases provide that the customer is responsible for the cost of delivery and pickup. Our leases specify that the customer is liable for any damage done to the unit beyond ordinary wear and tear. However, our customers may purchase a damage waiver from us to avoid this liability in certain circumstances, which provides us with an additional source of recurring revenue. Customer possessions stored within a portable storage unit are the responsibility of that customer.
Specialty Containment Solutions
ETS contracts specify that the customer is responsible for carrying commercial general liability insurance, is liable for any damage to the unit beyond ordinary wear and tear, and for all materials the customer contains in leased equipment. The customer is contractually responsible for the cost of delivery and pickup, as well as thoroughly emptying and cleaning the equipment before return. Rental contracts typically offer daily, weekly or monthly rates. Duration of rental varies widely by application, and the lease continues until the unit is returned clean by the customer.
Competition
In all segments, we face competition from local and regional companies, as well as national companies, in substantially all of our current markets. We compete with several large national and international companies in our mobile office product line. Our competitors include lessors of storage units, mobile offices, van trailers and other structures used for portable storage. We also compete with conventional fixed self-storage facilities. In our portable storage segment, we compete primarily in terms of security, convenience, product quality, broad product selection and availability, lease rates and customer service. In our core portable storage business, our largest competitors are Algeco Scotsman, PODS, Pac-Van, 1-800-PACK-RAT, Haulaway Storage Containers, ModSpace, McGrath RentCorp, Wernick Hire, along with other national, regional and local companies. In our specialty containment business we compete based on factors including: quality and breadth of equipment, technical applications expertise, knowledgeable and experienced sales and service personnel, on-time delivery and proactive logistics management, geographic areas serviced, lease rates and customer service. Our competitors include BakerCorp, Rain For Rent and Adler Tanks.
16
Table of Contents
Employees
As of December 31, 2014, we employed 1,921 full-time employees in the following major categories:
| Management |
248 | |||
| Administrative |
366 | |||
| Sales and marketing |
307 | |||
| Manufacturing and mechanics |
109 | |||
| Drivers, dispatch and yard |
891 |
Of these employees, 307 were employed in the specialty containment business. No employees are currently covered by a collective bargaining agreement, and we have never experienced a work stoppage. However, employees at one location have voted to be represented by a labor union and we have commenced negotiating a collective bargaining agreement with that union. We believe that our relations with our employees are good.
Seasonality
Demand from our portable storage customers is somewhat seasonal. Construction customers typically reflect higher demand during months with more temperate weather, while demand for leases of our portable storage units by large retailers is stronger from September through December because these retailers need to store more inventories for the holiday season. Our retail customers usually return these leased units to us in December and early in the following year. In the specialty containment business, demand from customers is typically higher in the middle of the year from March to October, driven by the timing of customer maintenance projects. The demand for rental of our pumps, may also impacted by weather, specifically when temperatures drop below freezing.
Environmental and Safety
Our operations, and the operations of many of our customers in this segment, are subject to numerous federal and local laws and regulations governing environmental protection and transportation. These laws regulate such issues as wastewater, storm water and the management, storage and disposal of, or exposure to, hazardous substances. We are not aware of any pending environmental compliance or remediation matters that are reasonably likely to have a material adverse effect on our business, financial position or results of operations. However, the failure by us to comply with applicable environmental and other requirements could result in fines, penalties, enforcement actions, third party claims, remediation actions, and could negatively impact our reputation with customers. We have a company-wide focus on safety and have implemented a number of measures to promote workplace safety. Customers are increasingly focused on safety records in their sourcing decisions due to increased regulations to report all incidents that occur at their sites and the costs associated with such incidents.
Access to Information
Our Internet address is www.mobilemini.com. We make available at this address, free of charge, our Annual Report on Form 10-K, quarterly reports on Form 10-Q, current reports on Form 8-K and amendments to those reports filed or furnished pursuant to Section 13(a) or 15(d) of the Securities Exchange Act of 1934, as amended (the “Exchange Act”), as soon as reasonably practicable after we electronically file such material with, or furnish it to, the Securities and Exchange Commission (the “SEC”). In this Form 10-K, we incorporate by reference as identified herein certain information from parts of our proxy statement for the 2015 Annual Meeting of Stockholders, which we will file with the SEC and will be available free of charge on our Web site. Reports of our executive officers, directors and any other persons required to file securities ownership reports under Section 16(a) of the Exchange Act are also available through our Web site. Information contained on our Web site is not part of this Annual Report.
17
Table of Contents
| ITEM 1A. RISK | FACTORS. |
Our business, results of operations and financial condition are subject to numerous risks and uncertainties. Set forth below and elsewhere in this report and in other documents we file with the SEC are descriptions of the risks and uncertainties that could cause our actual results to differ materially from the results contemplated by the forward-looking statements contained in this report. Should any of these risks materialize, our business, results of operations, financial condition and future prospects could be negatively impacted, which in turn could affect the trading value of our securities.
RISKS RELATED TO OUR BUSINESS
We may not be able to successfully integrate the ETS Acquisition, or complete and integrate future acquisitions, which could cause our business to suffer.
The ETS Acquisition may result in additional and unexpected expenses, and the anticipated benefits of the integration may not be realized. In addition, we have assumed the liabilities of ETS. To the extent there are unrecorded liabilities, including current or future environmental-related costs, which we failed to discover during our due diligence investigations and that are not subject to indemnification or reimbursement, our future operations could be materially and adversely affected.
We may not be able to successfully complete future strategic acquisitions if we cannot reach agreement on acceptable terms or for other reasons. We may have to incur debt or issue equity securities to pay for any future acquisition, the issuance of which could involve the imposition of restrictive covenants or be dilutive to our existing stockholders.
In connection with the ETS Acquisition, and potential future acquisitions, we may experience difficulty integrating personnel and operations, which could negatively affect our operating results in the following manner:
| • | key personnel of the acquired company may decide not to work for us; |
| • | we may experience business disruptions as a result of information technology systems conversions; |
| • | we may experience additional financial and accounting challenges and complexities in areas such as tax planning, treasury management, and financial reporting; |
| • | we may be held liable for environmental risks and liabilities as a result of our acquisitions, some of which we may not have discovered during our due diligence; |
| • | we may assume the liabilities of companies we acquire in the future, including liabilities for environmental-related costs, which could materially and adversely affect our business; |
| • | our ongoing core business may be disrupted or receive insufficient management attention; and |
| • | we may not be able to realize anticipated cost savings, reserve synergies or other financial benefits. |
Our operational measures designed to increase revenue while continuing to control operating costs may not generate the improvements and efficiencies we expect and may impact customers.
We responded to the economic slowdown by employing a number of operational measures designed to increase revenue while continuing to pursue our strategy of reducing operating costs where available. Additionally, our hybrid sales strategy is designed to meet customer needs and drive revenue growth but differs from our historic sales structure. No assurance can be given that these strategies will achieve the desired goals and efficiencies in 2015 and beyond. The success of these strategies is dependent on a number of factors that are beyond our control.
18
Table of Contents
Even if we carry out these measures in the manner we currently expect, we may not achieve the improvements or efficiencies we anticipate, or on the timetable we anticipate. There may be unforeseen productivity, revenue or other consequences resulting from our strategies that will adversely affect us. Therefore, there can be no guarantee that our strategies will prove effective in achieving desired profitability or margins.
Additionally, these strategies may have adverse consequences if our cost cutting and operational changes are deemed by customers to adversely impact product quality or service levels.
We face intense competition that may lead to our inability to increase or maintain our prices, which could have a material adverse impact on our results of operations.
The portable storage and mobile office and specialty containment industries are highly competitive and highly fragmented. Many of the markets in which we operate are served by numerous competitors, ranging from national companies like ourselves, to smaller multi-regional companies and small, independent businesses with a limited number of locations. See “Business — Competition.” Some of our principal competitors are less leveraged than we are and may have lower fixed costs and may be better able to withstand adverse market conditions within the industry. Additionally, some of our competitors currently offer products outside of our offerings or may have better brand recognition in some end customer sectors. If these competitors use their brand awareness to enter our product offerings, customers may choose these competitors’ products over ours and we could lose business. Our competitors are competing aggressively on the basis of pricing and may continue to drive down prices. Additionally, general economic factors could drive down market prices. To the extent that we choose to match our competitors’ declining prices, it could harm our results of operations as we would have lower margins. To the extent that we choose not to match or remain within a reasonable competitive distance from our competitors’ pricing, it could also harm our results of operations, as we may lose rental volume.
If we fail to attract and retain key management and personnel, we may be unable to implement our business plan.
One of the most important factors in our ability to profitably execute our business plan is our ability to attract, develop and retain qualified personnel, including our chief executive officer (“CEO”) and operational management. Our success in retaining a CEO and attracting and retaining qualified people is dependent on the resources available in individual geographic areas and the impact on the labor supply due to general economic conditions, as well as our ability to provide a competitive compensation package, including the implementation of adequate drivers of retention and rewards based on performance, and work environment. The departure of any key personnel and our inability to enforce non-competition agreements could have a negative impact on our business.
We may experience difficulties implementing our new global enterprise resource planning system.
We are engaged in a multi-year implementation of a new global ERP. The ERP is designed to accurately maintain the Company’s books and records and provide information important to the operation of the business to the Company’s management team. The Company’s ERP will continue to require significant investment of human and financial resources. In implementing the ERP, we may experience significant delays, increased costs and other difficulties. Any significant disruption or deficiency in the design and implementation of the ERP could adversely affect our ability to process orders, deliver units, send invoices and track payments, fulfill contractual obligations or otherwise operate our business. While we have invested significant resources in planning and project management, significant implementation issues may arise which could significantly impact our operations and financial performance.
19
Table of Contents
We rely heavily on information technology in our operations, and any cyber-security issue, material failure, inadequacy, interruption or breach of security of that technology could harm our ability to effectively operate our business.
We rely heavily on information systems across our operations. Our ability to effectively manage our business depends significantly on the reliability and capacity of these systems. In addition, we utilize third-party cloud providers to host certain of our applications and to store data. Like other companies, our information technology systems may be vulnerable to a variety of interruptions due to our own error or events beyond our control, including, but not limited to, cyber-security breaches, interruptions or delays in service from our third-party cloud providers, natural disasters, terrorist attacks, telecommunications failures, computer viruses, hackers, and other security issues. The failure of these systems to operate effectively, could result in substantial harm or inconvenience to us or our customers. This could include the theft of our intellectual property or trade secrets, or the improper use of personal information or other “identity theft.” Each of these situations or data privacy breaches may cause delays in customer service, reduce efficiency in our operations, require significant capital investments to remediate the problem, or result in negative publicity that could harm our reputation and results.
We intend to continue to launch operations into new geographic markets, which may be costly and may not be successful.
We have in the past, and intend in the future, to expand our operations into new geographic markets, primarily in North America. This expansion could require financial resources that would not therefore be available for other aspects of our business. In addition, this expansion could require the time and attention of management, leaving less time to focus on existing business. If we fail to manage the risks inherent in our geographic expansion, we could incur capital and operating costs without any related increase in revenue, which would harm our operating results.
Unionization by some or all of our employees could cause increases in operating costs.
Four employees at one location have voted to be represented by a labor union and we have commenced negotiating a collective bargaining agreement with that union. None of our employees are presently covered by collective bargaining agreements. From time to time various unions attempt to organize certain of our employees at other locations. We cannot predict the outcome of any continuing or future efforts to organize our employees, the terms of any future labor agreements, or the effect, if any, those agreements might have on our operations or financial performance.
We believe that a unionized workforce would generally increase our operating costs, divert the attention of management from servicing customers and increase the risk of work stoppages, all of which could have a material adverse effect on our business, results of operations or financial condition.
The supply and cost of used ISO containers fluctuates, which can affect our pricing and our ability to grow.
As needed, we purchase, remanufacture and modify used ISO containers in order to expand our lease fleet. If used ISO container prices increase substantially these price increases could increase our expenses and reduce our earnings, particularly if we are not able (due to competitive reasons or otherwise) to raise our rental rates to absorb this increased cost. Conversely, an oversupply of used ISO containers may cause container prices to fall. In such event, competitors may then lower the lease rates on their storage units. As a result, we may need to lower our lease rates to remain competitive. These events would cause our revenues and our earnings to decline.
The supply and cost of raw materials we use in remanufacturing and repairing portable storage units fluctuates and could increase our operating costs.
As needed, we remanufacture and repair portable storage units for our lease fleet and for sale. In these processes, we purchase steel, vinyl, wood, glass and other raw materials from various suppliers. We cannot be
20
Table of Contents
sure that an adequate supply of these materials will continue to be available on terms acceptable to us. The raw materials we use are subject to price fluctuations that we cannot control. Changes in the cost of raw materials can have a significant effect on our operations and earnings. Rapid increases in raw material prices are often difficult to pass through to customers, particularly to leasing customers. If we are unable to pass on these higher costs, our profitability could decline. If raw material prices decline significantly, we may have to write down our raw materials inventory values. If this happens, our results of operations and financial condition could decline.
We are exposed to various possible claims relating to our business and our insurance may not fully protect us.
We are exposed to various possible claims relating to our business. These possible claims include those relating to: (i) personal injury or death caused by containers, offices or trailers rented or sold by us; (ii) motor vehicle accidents involving our vehicles and our employees; (iii) employment-related claims; (iv) property damage, (v) cyber-security breaches, and (vi) commercial claims. Our insurance policies have deductibles or self-insured retentions which would require us to expend amounts prior to taking advantage of coverage limits. Currently, we believe that we have adequate insurance coverage for the protection of our assets and operations. However, our insurance may not fully protect us for certain types of claims, such as claims for punitive damages or for damages arising from intentional misconduct, which are often alleged in third party lawsuits. In addition, we may be exposed to uninsured liability at levels in excess of our policy limits.
If we are found liable for any significant claims that are not covered by insurance, our liquidity and operating results could be materially adversely affected. It is possible that our insurance carrier may disclaim coverage for any class action and derivative lawsuits against us. It is also possible that some or all of the insurance that is currently available to us will not be available in the future on economically reasonable terms or not available at all. In addition, whether we are covered by insurance or not, certain claims may have the potential for negative publicity surrounding such claims, which may lead to lower revenues, as well as additional similar claims being filed.
We may not be able to adequately protect our intellectual property and other proprietary rights that are material to our business.
Our ability to compete effectively depends in part upon protection of our rights in trademarks, copyrights and other intellectual property rights we own or license, including patents to our locking system for our portable storage solutions. Our use of contractual provisions, confidentiality procedures and agreements, and trademark, copyright, unfair competition, trade secret and other laws to protect our intellectual property and other proprietary rights may not be adequate. Litigation may be necessary to enforce our intellectual property rights and protect our proprietary information and patents, or to defend against claims by third parties that our services or our use of intellectual property infringe their intellectual property rights. Any litigation or claims brought by or against us could result in substantial costs and diversion of our resources. A successful claim of trademark, copyright or other intellectual property infringement against us could prevent us from providing services, which could harm our business, financial condition or results of operations. In addition, a breakdown in our internal policies and procedures may lead to an unintentional disclosure of our proprietary, confidential or material non-public information, which could in turn harm our business, financial condition or results of operations.
If we determine that our goodwill or other intangibles assets have become impaired, we may incur significant charges to our pre-tax income.
At December 31, 2014, we had $705.6 million of goodwill on our Consolidated Balance Sheet. In the future, goodwill and intangible assets may increase as a result of future acquisitions. Goodwill and intangible assets are reviewed at least annually for impairment. Impairment may result from, among other things, deterioration in the performance of acquired businesses, adverse market conditions, stock price, and adverse changes in applicable laws or regulations, including changes that restrict the activities of the acquired business.
21
Table of Contents
For more information, see the “Notes to Consolidated Financial Statements” included in our financial statements contained in this Annual Report.
RISKS RELATED TO OUR INDEBTEDNESS, THE ECONOMY, AND GLOBAL CAPITAL AND CREDIT MARKETS
Our business is subject to the general health of the economy, including non-residential spending and energy prices, accordingly any slowdowns or decreases in the U.S. or international economy could materially affect our revenue and operating results.
An economic slowdown in the U.S. or international economy, including non-residential spending and energy prices, may cause substantial volatility in the stock market and layoffs and other restrictions on spending by companies in almost every business sector which could impact our business in a variety of ways, including:
| • | reduction in consumer and business spending, which would result in a reduction in demand for our products; |
| • | a negative impact on the ability of our customers to timely pay their obligations to us or our vendors to timely supply services, thus reducing our cash flow; and |
| • | an increase in payment risk with others we do business with, including financial institutions. |
Without similar changes in expenses, which may be difficult to achieve, our margins will contract if revenue falls, and ultimately may result in having a material adverse effect on our financial condition.
We operate with a high amount of debt and we may incur significant additional indebtedness.
Our operations are capital intensive, and we operate with a high amount of debt relative to our size. At December 31, 2014, we had $200.0 million in aggregate principal amount of 7.875% senior notes due 2020 and $705.5 million of indebtedness under our Credit Agreement. Our substantial indebtedness could have adverse consequences. For example, it could:
| • | require us to dedicate a substantial portion of our cash flow from operations to payments on our indebtedness, which could reduce the availability of our cash flow to fund future working capital, pay dividends, capital expenditures, acquisitions and other general corporate purposes; |
| • | make it more difficult for us to satisfy our obligations with respect to our senior notes; |
| • | expose us to the risk of increased interest rates, as approximately 75.8% of our borrowings are at variable rates of interest; |
| • | require us to sell assets to reduce indebtedness or influence our decisions about whether to do so; |
| • | increase our vulnerability to general adverse economic and industry conditions; |
| • | limit our flexibility in planning for, or reacting to, changes in our business and our industry; |
| • | restrict us from making strategic acquisitions or pursuing business opportunities; and |
| • | limit, along with the financial and other restrictive covenants in our indebtedness, among other things, our ability to borrow additional funds. Failing to comply with those covenants could result in an event of default which, if not cured or waived, could have a material adverse effect on our business, financial condition and results of operations. |
Covenants in our debt instruments restrict or prohibit our ability to engage in or enter into a variety of transactions.
Our revolving credit facility requires us, under certain limited circumstances, to maintain certain financial ratios and limits our ability to make capital expenditures. These covenants and ratios could have an adverse effect
22
Table of Contents
on our business by limiting our ability to take advantage of financing, merger and acquisition or other corporate opportunities and to fund our operations. Breach of a covenant in our debt instruments could cause acceleration of a significant portion of our outstanding indebtedness. Any future debt could also contain financial and other covenants more restrictive than those imposed under the indentures governing the senior notes, and the revolving credit facility.
The indentures governing our 7.875% senior notes contain various covenants that limit our discretion in operating our business. In particular, we are limited in our ability to merge, consolidate or transfer substantially all of our assets, issue preferred stock of subsidiaries and create liens on our assets to secure debt. In addition, if there is a default, and we do not maintain borrowing availability in excess of certain pre-determined levels, we may be unable to incur additional indebtedness, make restricted payments (including paying cash dividends on our capital stock) and redeem or repurchase our capital stock. Our senior notes do not contain financial maintenance covenants and the financial maintenance covenants under our revolving credit facility are not applicable unless we fall below specific borrowing availability levels.
A breach of a covenant or other provision in any debt instrument governing our current or future indebtedness could result in a default under that instrument and, due to cross-default and cross-acceleration provisions, could result in a default under our other debt instruments. Upon the occurrence of an event of default under the revolving credit facility or any other debt instrument, the lenders could elect to declare all amounts outstanding to be immediately due and payable and terminate all commitments to extend further credit. If we were unable to repay those amounts, the lenders could proceed against the collateral granted to them, if any, to secure the indebtedness. If the lenders under our current or future indebtedness accelerate the payment of the indebtedness, we cannot assure you that our assets or cash flow would be sufficient to repay in full our outstanding indebtedness, including the senior notes.
The amount we can borrow under our revolving credit facility depends in part on the value of our lease fleet. If the value of our lease fleet declines under appraisals our lenders receive, the amount we can borrow will similarly decline. We are required to satisfy several covenants with our lenders that are affected by changes in the value of our lease fleet. We would be in breach of certain of these covenants if the value of our lease fleet drops below specified levels. If this happens, we may not be able to borrow the amounts we need to expand our business, and we may be forced to liquidate a portion of our existing fleet.
We may not be able to generate sufficient cash to service all of our debt, and may be forced to take other actions to satisfy our obligations under such indebtedness, which may not be successful.
Our ability to make scheduled payments on or to refinance our obligations under, our debt will depend on our financial and operating performance and that of our subsidiaries, which, in turn, will be subject to prevailing economic and competitive conditions and to the financial and business factors, many of which may be beyond our control. See the table under “Management’s Discussion and Analysis of Financial Condition and Results of Operations — Liquidity and Capital Resources — Contractual Obligations” for disclosure regarding the amount of cash required to service our debt.
We may not maintain a level of cash flow from operating activities sufficient to permit us to pay the principal, premium, if any, and interest on our indebtedness. If our cash flow and capital resources are insufficient to fund our debt service obligations, we may be forced to reduce or delay capital expenditures, sell assets, seek to obtain additional equity capital or restructure our debt. In the future, our cash flow and capital resources may not be sufficient for payments of interest on and principal of our debt, and such alternative measures may not be successful and may not enable us to meet our scheduled debt service obligations. We may not be able to refinance any of our indebtedness or obtain additional financing, particularly because of our anticipated high levels of debt and the debt incurrence restrictions imposed by the agreements governing our debt, as well as prevailing market conditions. In the absence of such operating results and resources, we could face substantial liquidity problems and might be required to dispose of material assets or operations to meet our
23
Table of Contents
debt service and other obligations. The instruments governing our indebtedness restrict our ability to dispose of assets and use the proceeds from any such dispositions. We may not be able to consummate those sales, or if we do, at an opportune time, or the proceeds that we realize may not be adequate to meet debt service obligations when due.
Fluctuations between the British pound and U.S. dollar could adversely affect our results of operations.
We derived approximately 19.5% of our total revenues in 2014 from our operations in the U.K. The financial position and results of operations of our U.K. subsidiaries are measured using the British pound as the functional currency. As a result, we are exposed to currency fluctuations both in receiving cash from our U.K. operations and in translating our financial results back into U.S. dollars. We believe the impact on us of currency fluctuations from an operations perspective is mitigated by the fact that the majority of our expenses, capital expenditures and revenues in the U.K. are in British pounds. We do, however, have significant currency exposure as a result of translating our financial results from British pounds into U.S. dollars for purposes of financial reporting. Assets and liabilities of our U.K. subsidiary are translated at the period end exchange rate in effect at each balance sheet date. Our income statement accounts are translated at the average rate of exchange prevailing during each month. Translation adjustments arising from differences in exchange rates from period to period are included in the accumulated other comprehensive income (loss) in stockholders’ equity. A strengthening of the U.S. dollar against the British pound reduces the amount of income or loss we recognize on a consolidated basis from our U.K. business. We cannot predict the effects of further exchange rate fluctuations on our future operating results. We are also exposed to additional currency transaction risk when our U.S. operations incur purchase obligations in a currency other than in U.S. dollars and our U.K. operations incur purchase obligations in a currency other than in British pounds. As exchange rates vary, our results of operations and profitability may be harmed. We do not currently hedge our currency transaction or translation exposure, nor do we have any current plans to do so. The risks we face in foreign currency transactions and translation may continue to increase as we further develop and expand our U.K. operations. Furthermore, to the extent we expand our business into other countries, we anticipate we will face similar market risks related to foreign currency translation caused by exchange rate fluctuations between the U.S. dollar and the currencies of those countries.
Global capital and credit market conditions could have an adverse effect on our ability to access the capital and credit markets, including our credit facility.
In 2009, due to the disruptions in the global credit markets, liquidity in the debt markets was materially impacted, making financing terms for borrowers less attractive or, in some cases, unavailable altogether. Renewed disruptions in the global credit markets or the failure of additional lending institutions could result in the unavailability of certain types of debt financing, including access to revolving lines of credit. We engage in borrowing and repayment activities under our revolving credit facility on an almost daily basis and have not had any disruption in our ability to access our revolving credit facility as needed. However, future credit market conditions could increase the likelihood that one or more of our lenders may be unable to honor its commitments under our revolving credit facility, which could have an adverse effect on our business, financial condition and results of operations.
Additionally, in the future we may need to raise additional funds to, among other things, fund our existing operations, improve or expand our operations, respond to competitive pressures, or make acquisitions. If adequate funds are not available on acceptable terms, we may be unable to meet our business or strategic objectives or compete effectively. If we raise additional funds by issuing equity securities, stockholders may experience dilution of their ownership interests, and the newly issued securities may have rights superior to those of the common stock. If we raise additional funds by issuing debt, we may be subject to further limitations on our operations arising out of the agreements governing such debt. If we fail to raise capital when needed, our business will be negatively affected.
24
Table of Contents
RISKS RELATED TO GOVERNMENT REGULATIONS
As Department of Transportation regulations increase, our operations could be negatively impacted and competition for qualified drivers could increase.
We operate in the U.S. pursuant to operating authority granted by the U.S. Department of Transportation (“DOT”). Our company drivers must comply with the safety and fitness regulations of the DOT, including those relating to drug and alcohol testing and hours-of-service. Such matters as equipment weight and dimensions also are subject to government regulations. Our safety record could be ranked poorly compared to our peer firms. A poor fleet ranking may result in the loss of customers or difficulty attracting and retaining qualified drivers which could affect our results of operations. Should additional rules be enacted in the future, compliance with such rules could result in additional costs.
We are subject to environmental regulations and could incur costs relating to environmental matters.
Federal, state, local, foreign and provincial laws and regulations regulate such issues as wastewater, storm water, air quality and the management, storage and disposal of, or exposure to, hazardous substances and hazardous and solid wastes. Several aspects of our businesses may involve risks related to environmental and health and safety liability. For example, we own, transport and rent tanks and boxes in which waste materials are placed by our customers. While we have a policy with certain limited exceptions to require customers to return tanks and containers clean of any substances, they may fail to comply with these obligations. Additionally, we provide waste hauling services, which involves environmental risks during transport. While we endeavor to comply with all regulatory requirements, failure to be in compliance with any environmental regulatory requirements may increase our compliance or remediation costs or cause restrictions on our business, either of which could have a material effect on our financial position or results of operations.
We are also required to obtain environmental permits from governmental authorities for certain of our operations. If we violate or fail to obtain or comply with these laws, regulations, or permits, we could be fined or otherwise sanctioned by regulators. We could also become liable if employees or other parties are improperly exposed to hazardous materials.
Under certain environmental laws, we could be held responsible for all of the costs relating to any contamination at, or migration to or from, our or our predecessors’ past or present facilities. These laws often impose liability even if the owner, operator or lessor did not know of, or was not responsible for, the release of such hazardous substances.
Environmental laws are complex, change frequently, and have tended to become more stringent over time. The costs of complying with current and future environmental and health and safety laws, and our liabilities arising from past or future releases of, or exposure to, hazardous substances, may adversely affect our business, results of operations, or financial condition.
Ongoing governmental review of hydraulic fracturing (“fracing”) and its environmental impact could lead to changes to this activity or its substantial curtailment, which could adversely affect our revenue and results of operations.
Approximately 21% of ETS’ leasing revenue for the twelve months ended December 31, 2014 (including the period of time prior to our acquisition), is related to customers involved in the upstream exploration and production of oil and natural gas. A portion of this revenue involves rentals to customers that use the fracing method to extract natural gas. The Environmental Protection Agency is studying the potential adverse effects that fracing may have on the environment and public health, and has issued regulations or guidance regarding certain aspects of the process. Other federal, state and local governments and governmental agencies have also begun to investigate and/or regulate fracing. Additional governmental regulation could result in increased costs of compliance or the curtailment of fracing in the future, which would adversely affect our revenue and results of operations.
25
Table of Contents
Some zoning laws in the U.S. and Canada and temporary planning permission regulations in the U.K. restrict the use of our portable storage and office units and therefore limit our ability to offer our products in all markets.
Most of our customers use our storage units to store their goods on their own properties for various lengths of time. Local zoning laws and temporary planning permission regulations in some of our markets do not allow some of our customers to keep portable storage and office units on their properties or do not permit portable storage units unless located out of sight from the street or may limit the type of product they may use or how long it can be at their locations. If local zoning laws or planning permission regulations in one or more of our markets no longer allow our units to be stored on customers’ sites, our business in that market will suffer.
We face unique regulatory and political challenges presented by international markets.
In connection with our business outside the U.S., we face exposure to additional regulatory requirements, including certain trade barriers, changes in political and economic conditions, and exposure to additional and potentially adverse tax regimes. Our success in the U.K. depends, in part, on our ability to anticipate and effectively manage these and other risks. Our failure to manage these risks may adversely affect our growth, in the U.K. and elsewhere, and lead to increased administrative costs.
RISKS RELATED TO OUR COMMON STOCK
The market price of our common stock has been volatile and may continue to be volatile and the value of your investment may decline.
Volatility may cause wide fluctuations in the price of our common stock on the NASDAQ Global Select Market. The market price of our common stock is likely to be affected by:
| • | changes in general conditions in the economy, geopolitical events or the financial markets; |
| • | variations in our quarterly operating results; |
| • | changes in financial estimates by securities analysts; |
| • | other developments affecting us, our industry, customers or competitors; |
| • | changes in demand for our products or the prices we charge due to changes in economic conditions, competition or other factors; |
| • | general economic conditions in the markets where we operate; |
| • | the cyclical nature of our customers’ businesses, particularly those operating in the construction sectors; |
| • | rental rate changes in response to competitive factors; |
| • | bankruptcy or insolvency of our customers, thereby reducing demand for our used units; |
| • | seasonal rental patterns, with rental activity tending to be lowest in the first quarter of the year; |
| • | acquisitions or divestitures and related costs; |
| • | labor shortages, work stoppages or other labor difficulties; |
| • | possible unrecorded liabilities of acquired companies; |
| • | possible write-offs or exceptional charges due to changes in applicable accounting standards, goodwill impairment, or divestiture or impairment of assets; |
| • | the operating and stock price performance of companies that investors deem comparable to us; and |
| • | the number of shares available for resale in the public markets under applicable securities laws. |
26
Table of Contents
| ITEM 1B. UNRESOLVED | STAFF COMMENTS. |
We have received no written comments regarding our periodic or current reports from the staff of the SEC that were issued 180 days or more preceding the end of our 2014 fiscal year and that remain unresolved.
| ITEM 2. PROPERTIES. |
The location and general character of our principal properties are as follows:
Corporate and administrative:
| • | Our corporate and administrative offices were relocated from Tempe, Arizona to Phoenix, Arizona in February 2015. These leased offices occupy approximately 50,000 square feet of office space, including our NSC. The lease term expires in October 2025. |
| • | Our U.K. headquarters are located in Stockton-on-Tees, United Kingdom, where we lease approximately 10,000 square feet of office space. The lease term expires in July 2017. |
| • | Our specialty containment headquarters are located in Houston, Texas, where we lease approximately 7,000 square feet of office space. The lease term expires in September 2018. |
Portable Storage Locations. The properties we lease for our portable storage field locations are generally located in industrial areas so that we can stack containers, store large amounts of containers and offices and operate our delivery trucks. These properties tend to be one to five acre sites with little development needed for us to use them, other than a paved or hard-packed surface, utilities and proper zoning. In North America we own 3 locations, and in the U.K., we own 2 locations. We lease the remaining locations in which we operate.
Specialty Containment Locations. The properties for specialty containment field locations are typically located near a major roadway for ease of transportation and consist of an outdoor storage yard with a small office. All of our 24 specialty containment locations are leased.
Other. We own a 43-acre facility in Maricopa, Arizona that is primarily used to rebrand, remanufacture and perform major repairs and maintenance on our existing lease fleet and build custom sale units.
We believe that satisfactory alternative properties can be found in all of our markets if we do not renew these existing leased properties.
| ITEM 3. LEGAL | PROCEEDINGS. |
We are party from time to time to various claims and lawsuits that arise in the ordinary course of business, including claims related to employment matters, contractual disputes, personal injuries and property damage. In addition, various legal actions, claims and governmental inquiries and proceedings are pending or may be instituted or asserted in the future against us and our subsidiaries.
Litigation is subject to many uncertainties, and the outcome of the individual litigated matters is not predictable with assurance. It is possible that certain of the actions, claims, inquiries or proceedings, including those discussed above, could be decided unfavorably to us or any of our subsidiaries involved. Although we cannot predict with certainty the ultimate resolution of lawsuits, investigations and claims asserted against us, we do not believe that the ultimate resolution of these claims or lawsuits will have a material adverse effect on our business, financial condition, results of operations or cash flows.
27
Table of Contents
| ITEM 4. | MINE SAFETY DISCLOSURES. |
Not applicable.
PART II
| ITEM 5. | MARKET FOR REGISTRANT’S COMMON EQUITY, RELATED STOCKHOLDER MATTERS AND ISSUER PURCHASES OF EQUITY SECURITIES. |
Common Stock Prices
Our common stock trades on The NASDAQ Global Select Market under the symbol “MINI”. The following are the high and low sale prices for the common stock during the periods indicated as reported by the NASDAQ Stock Market.
| 2013 | 2014 | |||||||||||||||
| High | Low | High | Low | |||||||||||||
| Quarter ended March 31, |
$ | 29.84 | $ | 21.26 | $ | 45.68 | $ | 37.69 | ||||||||
| Quarter ended June 30, |
37.49 | 25.22 | 49.02 | 40.14 | ||||||||||||
| Quarter ended September 30, |
35.80 | 27.53 | 49.68 | 34.97 | ||||||||||||
| Quarter ended December 31, |
41.22 | 32.11 | 45.48 | 34.32 | ||||||||||||
We had 69 holders of record of our common stock on February 20, 2015. The number of beneficial owners is substantially greater than the number of record holders because a large portion of our common stock is held of record in broker “street names.”
Dividend Policy
In November 2013, our Board of Directors (the “Board”) authorized the initiation of a quarterly cash dividend program to all of our common stockholders with the first quarterly common stock cash dividend paid in the first quarter of 2014. Each dividend payment is subject to review and approval by the Board. During fiscal 2014, we paid cash dividends of $0.68 per share for a total of $31.4 million. In addition, our Credit Agreement contains restrictions on the declaration and payment of dividends.
Issuer Purchases of Equity Securities
On November 6, 2013, our Board approved a share repurchase program authorizing up to $125.0 million of our outstanding shares of common stock to be repurchased. The shares may be repurchased from time to time in the open market or in privately negotiated transactions. The share repurchases are subject to prevailing market conditions and other considerations. The share repurchase program does not have an expiration date and may be suspended or terminated at any time by the Board. All shares repurchased are held in treasury.
During fiscal 2014, we purchased approximately 649,000 shares of our common stock at a cost of $25.0 million under the authorized share repurchase program. Approximately $100.0 million is available for repurchase as of December 31, 2014. We did not purchase any shares of our common stock under this program during the quarterly period ended December 31, 2014. During fiscal 2014, we also withheld approximately 25,000 shares of vested stock awards from employees, for an approximate value of $1.0 million, upon vesting of stock awards to satisfy minimum tax withholding obligations, of which approximately 14,000 shares of vested stock awards were withheld in the quarterly period ended December 31, 2014, for an approximate value of $0.5 million. These shares were not acquired pursuant to the share repurchase program.
28
Table of Contents
Stock Performance Graph
The following Performance Graph and related information shall not be deemed “soliciting material” or “filed” with the SEC, nor should such information be incorporated by reference into any future filings under the Securities Act or the Exchange Act, except to the extent that Mobile Mini specifically incorporates it by reference in such filing.
The following graph compares the five-year cumulative total return on our common stock with the cumulative total returns (assuming reinvestment of dividends) on the Standard and Poor’s SmallCap 600 and the NASDAQ US Benchmark TR Index if $100 were invested in our common stock and each index on December 31, 2009.
Comparison of Five Year Cumulative Total Return*
Among Mobile Mini, Inc., the Standard & Poor’s SmallCap 600 and the NASDAQ US Benchmark TR Index
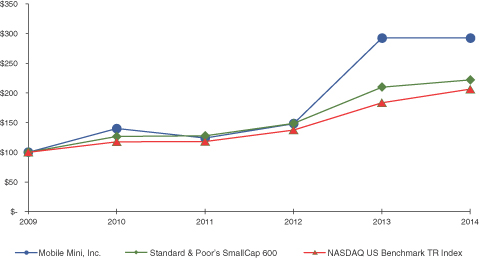
| 2009 | 2010 | 2011 | 2012 | 2013 | 2014 | |||||||||||||||||||
| Mobile Mini, Inc. |
$ | 100.00 | $ | 139.74 | $ | 123.85 | $ | 147.98 | $ | 292.26 | $ | 292.16 | ||||||||||||
| Standard & Poor’s SmallCap 600 |
100.00 | 126.31 | 127.59 | 148.42 | 209.74 | 221.81 | ||||||||||||||||||
| NASDAQ US Benchmark TR Index |
100.00 | 117.55 | 117.91 | 137.29 | 183.26 | 206.09 | ||||||||||||||||||
| * | Total Return based on $100 initial investment and reinvestment of dividends. |
| ITEM 6. | SELECTED FINANCIAL DATA. |
The following selected financial data reflect the results of operations and balance sheet data as of and for the years ended December 31, 2010 through 2014. You should read this material with “Management’s Discussion and Analysis of Financial Condition and Results of Operations” and the financial statements and related footnotes included elsewhere in this Annual Report.
29
Table of Contents
The assets and liabilities of ETS are included in Mobile Mini’s December 31, 2014 consolidated balance sheet. Operations related to ETS are included in our consolidated results from the acquisition date of December 10, 2014 through the end of the year.
| For the Years Ended December 31, | ||||||||||||||||||||
| 2010 | 2011 | 2012 | 2013 | 2014 | ||||||||||||||||
| (In thousands, except per share and operating data) | ||||||||||||||||||||
| Consolidated Statements of Income Data: |
||||||||||||||||||||
| Revenues: |
||||||||||||||||||||
| Leasing |
$ | 293,375 | $ | 314,695 | $ | 339,975 | $ | 366,286 | $ | 410,362 | ||||||||||
| Sales |
32,227 | 41,675 | 37,759 | 38,051 | 31,585 | |||||||||||||||
| Other |
2,517 | 2,700 | 2,162 | 2,149 | 3,527 | |||||||||||||||
|
|
|
|
|
|
|
|
|
|
|
|||||||||||
| Total revenues |
328,119 | 359,070 | 379,896 | 406,486 | 445,474 | |||||||||||||||
|
|
|
|
|
|
|
|
|
|
|
|||||||||||
| Costs and expenses: |
||||||||||||||||||||
| Cost of sales |
21,282 | 26,149 | 23,178 | 25,413 | 21,944 | |||||||||||||||
| Leasing, selling and general expenses |
177,722 | 201,239 | 218,709 | 237,567 | 280,948 | |||||||||||||||
| Restructuring expenses |
4,014 | 1,059 | 7,123 | 2,402 | 3,542 | |||||||||||||||
| Asset impairment charge, net |
— | — | — | 38,705 | 557 | |||||||||||||||
| Depreciation and amortization |
35,453 | 35,432 | 35,982 | 35,432 | 39,334 | |||||||||||||||
|
|
|
|
|
|
|
|
|
|
|
|||||||||||
| Total costs and expenses |
238,471 | 263,879 | 284,992 | 339,519 | 346,325 | |||||||||||||||
|
|
|
|
|
|
|
|
|
|
|
|||||||||||
| Income from operations |
89,648 | 95,191 | 94,904 | 66,967 | 99,149 | |||||||||||||||
| Other income (expense): |
||||||||||||||||||||
| Interest income |
1 | — | 1 | 1 | — | |||||||||||||||
| Interest expense |
(56,011 | ) | (46,120 | ) | (37,268 | ) | (29,467 | ) | (28,729 | ) | ||||||||||
| Debt restructuring/extinguishment expense |
(11,024 | ) | (1,334 | ) | (2,812 | ) | — | — | ||||||||||||
| Deferred financing costs write-off |
(525 | ) | — | (1,889 | ) | — | — | |||||||||||||
| Foreign currency exchange |
(6 | ) | (6 | ) | (4 | ) | (2 | ) | (1 | ) | ||||||||||
|
|
|
|
|
|
|
|
|
|
|
|||||||||||
| Income from continuing operations before income tax provision |
22,083 | 47,731 | 52,932 | 37,499 | 70,419 | |||||||||||||||
| Income tax provision |
8,586 | 16,578 | 18,509 | 12,275 | 26,033 | |||||||||||||||
|
|
|
|
|
|
|
|
|
|
|
|||||||||||
| Income from continuing operations |
13,497 | 31,153 | 34,423 | 25,224 | 44,386 | |||||||||||||||
| Loss from discontinued operation, net of tax |
(252 | ) | (557 | ) | (245 | ) | (1,302 | ) | — | |||||||||||
|
|
|
|
|
|
|
|
|
|
|
|||||||||||
| Net income |
13,245 | 30,596 | 34,178 | 23,922 | 44,386 | |||||||||||||||
| Earnings allocable to preferred stockholders |
(2,502 | ) | (966 | ) | — | — | — | |||||||||||||
|
|
|
|
|
|
|
|
|
|
|
|||||||||||
| Net income available to common stockholders |
$ | 10,743 | $ | 29,630 | $ | 34,178 | $ | 23,922 | $ | 44,386 | ||||||||||
|
|
|
|
|
|
|
|
|
|
|
|||||||||||
| Earnings per Share: |
||||||||||||||||||||
| Basic |
||||||||||||||||||||
| Income from continuing operations |
$ | 0.31 | $ | 0.72 | $ | 0.77 | $ | 0.55 | $ | 0.96 | ||||||||||
| Loss from discontinued operation |
— | (0.01 | ) | — | (0.02 | ) | — | |||||||||||||
|
|
|
|
|
|
|
|
|
|
|
|||||||||||
| Net income |
$ | 0.31 | $ | 0.71 | $ | 0.77 | $ | 0.53 | $ | 0.96 | ||||||||||
|
|
|
|
|
|
|
|
|
|
|
|||||||||||
| Diluted |
||||||||||||||||||||
| Income from continuing operations |
$ | 0.31 | $ | 0.70 | $ | 0.76 | $ | 0.55 | $ | 0.95 | ||||||||||
| Loss from discontinued operation |
(0.01 | ) | (0.01 | ) | — | (0.03 | ) | — | ||||||||||||
|
|
|
|
|
|
|
|
|
|
|
|||||||||||
| Net income |
$ | 0.30 | $ | 0.69 | $ | 0.76 | $ | 0.52 | $ | 0.95 | ||||||||||
|
|
|
|
|
|
|
|
|
|
|
|||||||||||
| Weighted average number of common and common share equivalents outstanding |
||||||||||||||||||||
| Basic |
35,196 | 41,566 | 44,657 | 45,481 | 46,026 | |||||||||||||||
| Diluted |
43,829 | 44,569 | 45,102 | 46,096 | 46,725 | |||||||||||||||
| Other Data: |
||||||||||||||||||||
| Net cash from operating activities |
$ | 60,805 | $ | 84,969 | $ | 90,949 | $ | 116,111 | $ | 120,625 | ||||||||||
| Net cash from investing activities |
5,351 | (12,787 | ) | (29,383 | ) | (6,020 | ) | (446,752 | ) | |||||||||||
| Net cash from financing activities |
(67,731 | ) | (71,063 | ) | (60,719 | ) | (110,345 | ) | 329,780 | |||||||||||
30
Table of Contents
| For the Years Ended December 31, | ||||||||||||||||||||
| 2010 | 2011 | 2012 | 2013 | 2014 | ||||||||||||||||
| (In thousands, except percentages) | ||||||||||||||||||||
| Operating Data (unaudited): |
||||||||||||||||||||
| Number of portable storage locations (at year end) |
120 | 132 | 135 | 136 | 136 | |||||||||||||||
| Number of specialty containment locations (at year end) |
— | — | — | — | 24 | |||||||||||||||
| Portable Storage lease fleet units (at year end) |
244,296 | 236,685 | 233,728 | 212,898 | 213,546 | |||||||||||||||
| Specialty Containment lease fleet units (at year end) |
— | — | — | — | 10,265 | |||||||||||||||
| Portable Storage lease fleet utilization (annual average) |
53.4 | % | 57.1 | % | 60.0 | % | 65.8 | % | 68.6 | % | ||||||||||
| Lease revenue year over year growth (reduction) |
(13.0 | ) | 7.3 | 8.0 | 7.7 | 12.0 | ||||||||||||||
| Operating margin |
27.3 | 26.5 | 25.0 | 16.5 | 22.3 | |||||||||||||||
| Income from continuing operations margin |
4.0 | 8.7 | 9.0 | 6.3 | 10.0 | |||||||||||||||
| For the Years Ended December 31, | ||||||||||||||||||||
| 2010 | 2011 | 2012 | 2013 | 2014 | ||||||||||||||||
| (In thousands) | ||||||||||||||||||||
| Consolidated Balance Sheet Data: |
||||||||||||||||||||
| Lease fleet, net |
$ | 1,024,959 | $ | 1,016,031 | $ | 1,028,773 | $ | 979,276 | $ | 1,087,056 | ||||||||||
| Total assets |
1,715,767 | 1,707,500 | 1,727,560 | 1,677,374 | 2,103,174 | |||||||||||||||
| Total debt |
771,402 | 696,472 | 643,343 | 528,095 | 930,436 | |||||||||||||||
| Convertible preferred stock, at liquidation preference values |
147,427 | — | — | — | — | |||||||||||||||
| Stockholders’ equity |
563,495 | 753,914 | 809,519 | 855,544 | 854,531 | |||||||||||||||
Non-GAAP Data and Reconciliations
EBITDA and Adjusted EBITDA. EBITDA is defined as net income before discontinued operation, net of tax (if applicable), interest expense, income taxes, depreciation and amortization, and debt restructuring or extinguishment expense (if applicable), including any write-off of deferred financing costs. Adjusted EBITDA further excludes certain non-cash expenses, as well as transactions that management believes are not indicative of our ongoing business. Because EBITDA and Adjusted EBITDA, as defined, exclude some but not all items that affect our cash flow from operating activities, they may not be comparable to similarly titled performance measures presented by other companies.
We present EBITDA and Adjusted EBITDA because we believe they provide useful information regarding our ability to meet our future debt payment requirements, capital expenditures and working capital requirements and that they provide an overall evaluation of our financial condition. EBITDA and Adjusted EBITDA have certain limitations as analytical tools and should not be used as substitutes for net income, cash flows, or other consolidated income or cash flow data prepared in accordance with generally accepted accounting principles in the U.S. (“GAAP”).
EBITDA and Adjusted EBITDA margins are calculated as EBITDA and Adjusted EBITDA divided by total revenues expressed as a percentage. The GAAP financial measure that is most directly comparable to EBITDA margin is operating margin, which represents operating income divided by revenues.
31
Table of Contents
| For the Years Ended December 31, | ||||||||||||||||||||
| 2010 | 2011 | 2012 | 2013 | 2014 | ||||||||||||||||
| (In thousands, except percentages) | ||||||||||||||||||||
| Non-GAAP Data: |
||||||||||||||||||||
| EBITDA |
$ | 125,096 | $ | 130,617 | $ | 130,883 | $ | 102,398 | $ | 138,482 | ||||||||||
| EBITDA margin |
38.1 | % | 36.4 | % | 34.5 | % | 25.2 | % | 31.1 | % | ||||||||||
| Adjusted EBITDA |
135,268 | 140,130 | 145,447 | 157,465 | 162,141 | |||||||||||||||
| Adjusted EBITDA margin |
41.2 | % | 39.0 | % | 38.3 | % | 38.7 | % | 36.4 | % | ||||||||||
| Free cash flow |
66,156 | 79,965 | 65,129 | 109,414 | 104,819 | |||||||||||||||
Reconciliation of EBITDA to net cash provided by operating activities, the most directly comparable GAAP measure, is as follows:
| For the Years Ended December 31, | ||||||||||||||||||||
| 2010 | 2011 | 2012 | 2013 | 2014 | ||||||||||||||||
| (In thousands) | ||||||||||||||||||||
| EBITDA |
$ | 125,096 | $ | 130,617 | $ | 130,883 | $ | 102,398 | $ | 138,482 | ||||||||||
| Discontinued operation |
35 | (362 | ) | (11 | ) | (732 | ) | — | ||||||||||||
| Interest paid |
(56,582 | ) | (42,683 | ) | (35,145 | ) | (25,947 | ) | (24,559 | ) | ||||||||||
| Income and franchise taxes paid |
(823 | ) | (816 | ) | (831 | ) | (1,114 | ) | (1,103 | ) | ||||||||||
| Share-based compensation expense |
6,292 | 6,456 | 9,575 | 14,714 | 15,071 | |||||||||||||||
| Asset impairment charge, net |
— | — | — | 38,217 | 557 | |||||||||||||||
| Loss on disposal of discontinued operation |
— | — | — | 1,948 | — | |||||||||||||||
| Gain on sale of lease fleet units |
(10,045 | ) | (13,800 | ) | (11,781 | ) | (9,682 | ) | (5,732 | ) | ||||||||||
| Loss (gain) on disposal of property, plant and equipment |
34 | 91 | (130 | ) | 247 | 348 | ||||||||||||||
| Change in certain assets and liabilities, net of effect of businesses acquired: |
||||||||||||||||||||
| Receivables |
(2,077 | ) | (4,148 | ) | (2,899 | ) | (1,480 | ) | (4,419 | ) | ||||||||||
| Inventories |
2,506 | (1,242 | ) | 1,352 | (393 | ) | 2,680 | |||||||||||||
| Deposits and prepaid expenses |
1,486 | 1,067 | 537 | 653 | (1,416 | ) | ||||||||||||||
| Other assets and intangibles |
(200 | ) | (33 | ) | (161 | ) | 10 | 17 | ||||||||||||
| Accounts payable and accrued liabilities |
(4,917 | ) | 9,822 | (440 | ) | (2,728 | ) | 699 | ||||||||||||
|
|
|
|
|
|
|
|
|
|
|
|||||||||||
| Net cash provided by operating activities |
$ | 60,805 | $ | 84,969 | $ | 90,949 | $ | 116,111 | $ | 120,625 | ||||||||||
|
|
|
|
|
|
|
|
|
|
|
|||||||||||
32
Table of Contents
Reconciliation of net income to EBITDA and Adjusted EBITDA is as follows:
| For the Years Ended December 31, | ||||||||||||||||||||
| 2010 | 2011 | 2012 | 2013 | 2014 | ||||||||||||||||
| (In thousands) | ||||||||||||||||||||
| Net income |
$ | 13,245 | $ | 30,596 | $ | 34,178 | $ | 23,922 | $ | 44,386 | ||||||||||
| Loss from discontinued operation, net of tax |
252 | 557 | 245 | 1,302 | — | |||||||||||||||
| Interest expense |
56,011 | 46,120 | 37,268 | 29,467 | 28,729 | |||||||||||||||
| Income tax provision |
8,586 | 16,578 | 18,509 | 12,275 | 26,033 | |||||||||||||||
| Depreciation and amortization |
35,453 | 35,432 | 35,982 | 35,432 | 39,334 | |||||||||||||||
| Debt restructuring/extinguishment expense |
11,024 | 1,334 | 2,812 | — | — | |||||||||||||||
| Deferred financing costs write-off |
525 | — | 1,889 | — | — | |||||||||||||||
|
|
|
|
|
|
|
|
|
|
|
|||||||||||
| EBITDA |
125,096 | 130,617 | 130,883 | 102,398 | 138,482 | |||||||||||||||
| Share-based compensation expense(1) |
5,883 | 6,438 | 7,151 | 13,956 | 14,490 | |||||||||||||||
| Restructuring expenses(2) |
4,014 | 1,059 | 7,123 | 2,402 | 3,542 | |||||||||||||||
| Acquisition expenses(3) |
— | 610 | 139 | 4 | 5,070 | |||||||||||||||
| Asset impairment charge, net(4) |
— | — | — | 38,705 | 557 | |||||||||||||||
| Other(5) |
275 | 1,406 | 151 | — | — | |||||||||||||||
|
|
|
|
|
|
|
|
|
|
|
|||||||||||
| Adjusted EBITDA |
$ | 135,268 | $ | 140,130 | $ | 145,447 | $ | 157,465 | $ | 162,141 | ||||||||||
|
|
|
|
|
|
|
|
|
|
|
|||||||||||
| EBITDA margin |
38.1 | % | 36.4 | % | 34.5 | % | 25.2 | % | 31.1 | % | ||||||||||
| Adjusted EBITDA, margin |
41.2 | 39.0 | 38.3 | 38.7 | 36.4 | |||||||||||||||
| (1) | Share-based compensation represents non-cash compensation expense associated with the granting of equity instruments. |
| (2) | Restructuring expenses include costs we incurred in connection with the Mobile Storage Group (“MSG”) acquisition, the expenses incurred with the restructuring of our manufacturing operations, and other restructuring initiatives including the termination of our consumer initiative program, transition of key leadership positions, the sale of our Belfast, Northern Ireland location and the realignment of our field management and sales force structures in North America. These initiatives include costs primarily for reductions to workforce, asset relocation costs and lease abandonment costs. |
| (3) | Acquisition expenses represent acquisition activity costs. |
| (4) | Asset impairment charge, net in 2013, primarily represents the non-cash impairment charge for the write-down on certain assets classified as held for sale in the second quarter of 2013. In 2014, represents the additional loss upon completion of sale (offset by gains upon completion of sale) of those assets that were written down to fair value in 2013. |
| (5) | Other includes the cost of one-time expenses in 2010 primarily related to a class action settlement. In 2011, these expenses primarily include start-up costs related to our new locations and asset repositioning expenses. Prior to 2011, start-up costs and repositioning expenses were not as material as we primarily expanded our geographic areas by traditional acquisitions where lease units were already in service and demand for repositioning fleet units was not as strong. In 2012, these expenses relate to estimated losses to our assets due to natural disasters in the southern U.S. |
Free Cash Flow. Free cash flow is defined as net cash provided by operating activities, minus or plus, net cash used in or provided by investing activities, excluding acquisitions and certain transactions. Free cash flow is a non-GAAP financial measure and is not intended to replace net cash provided by operating activities, the most directly comparable financial measure prepared in accordance with GAAP. We present free cash flow because we believe it provides useful information regarding our liquidity and ability to meet our short-term obligations. In particular, free cash flow indicates the amount of cash available after capital expenditures for, among other things, investments in our existing business, debt service obligations, payment of authorized quarterly dividends, repurchase of our common stock and strategic small acquisitions.
33
Table of Contents
Reconciliation of net cash provided by operating activities to free cash flow is as follows:
| For the Years Ended December 31, | ||||||||||||||||||||
| 2010 | 2011 | 2012 | 2013 | 2014 | ||||||||||||||||
| (In thousands) | ||||||||||||||||||||
| Net cash provided by operating activities |
$ | 60,805 | $ | 84,969 | $ | 90,949 | $ | 116,111 | $ | 120,625 | ||||||||||
| Additions to lease fleet |
(15,103 | ) | (29,824 | ) | (43,934 | ) | (28,826 | ) | (27,279 | ) | ||||||||||
| Proceeds from sale of lease fleet units |
28,860 | 36,201 | 29,358 | 35,951 | 23,053 | |||||||||||||||
| Additions to property, plant and equipment |
(8,555 | ) | (11,498 | ) | (12,741 | ) | (15,792 | ) | (15,779 | ) | ||||||||||
| Proceeds from sale of property, plant and equipment |
149 | 117 | 1,497 | 1,970 | 4,199 | |||||||||||||||
|
|
|
|
|
|
|
|
|
|
|
|||||||||||
| Net capital proceeds (expenditures) |
5,351 | (5,004 | ) | (25,820 | ) | (6,697 | ) | (15,806 | ) | |||||||||||
|
|
|
|
|
|
|
|
|
|
|
|||||||||||
| Free cash flow |
$ | 66,156 | $ | 79,965 | $ | 65,129 | $ | 109,414 | $ | 104,819 | ||||||||||
|
|
|
|
|
|
|
|
|
|
|
|||||||||||
| ITEM 7. | MANAGEMENT’S DISCUSSION AND ANALYSIS OF FINANCIAL CONDITION AND RESULTS OF OPERATIONS. |
The following discussion of our financial condition and results of operations should be read together with the consolidated financial statements and the accompanying notes included elsewhere in this Annual Report. This discussion contains forward-looking statements that involve risks and uncertainties. Our actual results may differ materially from those anticipated in those forward-looking statements as a result of certain factors, including, but not limited to, those described under “Item 1A. “Risk Factors.” The tables and information in this “Management’s Discussion and Analysis of Financial Conditions and Results of Operations” section were derived from exact numbers and may have immaterial rounding differences.
Overview
Executive Summary
We are the world’s leading provider of portable storage solutions, maintaining a strong leadership position in virtually all markets served. Our mission is to be the leader in portable storage solutions to customers throughout North America and the U.K. and specialty containment solutions in the U.S. We are committed to providing our customers with superior service and access to a high-quality and diverse fleet. In managing our business, we focus on leasing rather than selling our units, with leasing revenues representing approximately 92.1% of our total revenues for the year ended December 31, 2014. We believe this strategy is highly attractive and provides predictable, recurring revenue. Additionally, our assets have long useful lives, high residual values and low maintenance costs. We also sell new and used units and provide delivery, installation and other ancillary products and value-added services.
On December 10, 2014 we completed the acquisition of Evergreen Tank Solutions, the ETS Acquisition. ETS is the third largest provider of specialty containment solutions in the U.S. and the leading provider in the Gulf Coast region. ETS will continue to operate as a separate subsidiary of ours under the ETS name (as will its own subsidiary, Water Movers), and its operations are included in our 2014 results of operations from December 10, 2014 through the end of the year.
The ETS Acquisition creates a combined company that is the leading provider of portable storage solutions in North America and the U.K. as well as a leading provider of specialty containment solutions in the U.S. petrochemical and industrial segments. In addition, we closed on eight smaller acquisitions in 2014 that are included in our results of operations in 2014 from the date of each acquisition. As of December 31, 2014, we operate our portable storage business from 136 locations throughout North America and in the U.K., and have a portable storage fleet of 213,500 units. Our recently acquired specialty containment business serves customers through 24 locations with a fleet of 10,300 units.
34
Table of Contents
Throughout 2014, our strategic goal has been to grow revenue and expand our operating margins by leveraging our infrastructure, and driving continuous improvements in efficiency. To achieve these objectives we focus on generating growth in our core leasing business through strong organic growth, opportunistic geographic expansion, and innovative product offerings. We also actively manage fleet utilization and seek to control costs.
In 2015, further key initiatives will include a focus on the integration of ETS, as well as opportunities for cross-selling of products and growth by leveraging Mobile Mini’s and ETS’ respective geographic coverage and customer bases. Additionally, in 2015, we will focus on the implementation of a new ERP system to further increase efficiency and data management, and provide a scalable platform for growth.
For the year ended December 31, 2014, our achievements include:
| • | Successfully completed the ETS Acquisition, providing us with another major growth channel, |
| • | Increased year-over-year portable storage solutions rental rates by 7.3%, and yield by 10.5% |
| • | Grew leasing revenues 12.0% year-over-year, 10.6% within portable storage solutions, |
| • | Executed on our geographic expansion strategy with eight portable storage acquisitions and one greenfield, and |
| • | Utilized strong $104.8 million in free cash flow to create and return shareholder value: |
| • | Repurchase of $25.0 million in treasury shares, and |
| • | Paid $31.4 million in shareholder dividends. |
Accounting and Operating Overview
Our principal operating revenues and expenses are:
Revenues:
| • | Leasing revenues include all rent and ancillary revenues we receive for our lease fleet. |
| • | Sales revenues consists primarily of sales of new and used portable storage products. |
Costs and expenses:
| • | Cost of sales is the cost, less accumulated depreciation, of the units that were sold during the reported period and includes both our cost to buy, transport, remanufacture and modify used containers and our cost to manufacture portable storage units and other structures. |
| • | Leasing, selling and general expenses include, among other expenses, payroll and payroll related costs, advertising and other marketing expenses, real property lease expenses, commissions, repair and maintenance costs of our lease fleet and transportation equipment, share-based compensation expense and corporate expenses for both our leasing and sales activities. |
| • | Depreciation and amortization includes depreciation on our lease fleet, our property, plant and equipment, and amortization of definite-lived intangible assets |
We are a capital-intensive business. Therefore in addition to focusing on GAAP measurements, we focus on EBITDA, Adjusted EBITDA, and free cash flow to measure our operating results. EBITDA eliminates the effect of financing transactions that we enter into and Adjusted EBITDA further excludes certain non-cash expenses, as well as transactions that management believes are not indicative of our ongoing business. We present EBITDA and Adjusted EBITDA because we believe they provide useful information regarding our ability to meet our future debt payment requirements, capital expenditures and working capital requirements and that they provide an overall evaluation of our financial condition. We also review these measures as a percentage of revenue, which we refer to as margin. We review free cash flow because we believe it provides useful information
35
Table of Contents
regarding our liquidity and ability to meet our short-term obligations. In particular, free cash flow indicates the amount of cash available after capital expenditures for, among other things, investments in our existing business, debt service obligations, payment of authorized quarterly dividends, repurchase of our common stock and strategic small acquisitions. EBITDA, Adjusted EBITDA and the resultant margins, as well as free cash flow are non-GAAP financial measures. As such, we include in this Annual Report on Form 10-K reconciliations to their most directly comparable GAAP financial measures. These reconciliations and a description of the limitations of these measures are included in “Item 6. Selected Financial Data”.
Results of Operations
Twelve Months Ended December 31, 2014, Compared to Twelve Months Ended December 31, 2013
The following table sets forth for each of the periods indicated our statements of operations data and expresses revenue and expense data as percentage of total revenues for the periods presented:
| Years Ended December 31, |
Percent of Revenue Years Ended December 31, |
Increase (Decrease) 2014 versus 2013 |
||||||||||||||||||||||
| 2013 | 2014 | 2013 | 2014 | |||||||||||||||||||||
| (In thousands, except percentages) | ||||||||||||||||||||||||
| Revenues: |
||||||||||||||||||||||||
| Leasing |
$ | 366,286 | $ | 410,362 | 90.1 | % | 92.1 | % | $ | 44,076 | 12.0 | % | ||||||||||||
| Sales |
38,051 | 31,585 | 9.4 | 7.1 | (6,466 | ) | (17.0 | ) | ||||||||||||||||
| Other |
2,149 | 3,527 | 0.5 | 0.8 | 1,378 | 64.1 | ||||||||||||||||||
|
|
|
|
|
|
|
|
|
|
|
|||||||||||||||
| Total revenues |
406,486 | 445,474 | 100.0 | 100.0 | 38,988 | 9.6 | ||||||||||||||||||
|
|
|
|
|
|
|
|
|
|
|
|||||||||||||||
| Costs and expenses: |
||||||||||||||||||||||||
| Cost of sales |
25,413 | 21,944 | 6.3 | 4.9 | (3,469 | ) | (13.7 | ) | ||||||||||||||||
| Leasing, selling and general expenses |
237,567 | 280,948 | 58.4 | 63.1 | 43,381 | 18.3 | ||||||||||||||||||
| Restructuring expenses |
2,402 | 3,542 | 0.6 | 0.8 | 1,140 | 47.5 | ||||||||||||||||||
| Asset impairment charge, net |
38,705 | 557 | 9.5 | 0.1 | (38,148 | ) | (98.6 | ) | ||||||||||||||||
| Depreciation and amortization |
35,432 | 39,334 | 8.7 | 8.8 | 3,902 | 11.0 | ||||||||||||||||||
|
|
|
|
|
|
|
|
|
|
|
|||||||||||||||
| Total costs and expenses |
339,519 | 346,325 | 83.5 | 77.7 | 6,806 | 2.0 | ||||||||||||||||||
|
|
|
|
|
|
|
|
|
|
|
|||||||||||||||
| Income from operations |
66,967 | 99,149 | 16.5 | 22.3 | 32,182 | 48.1 | ||||||||||||||||||
| Other income (expense): |
||||||||||||||||||||||||
| Interest income |
1 | — | — | — | (1 | ) | (100.0 | ) | ||||||||||||||||
| Interest expense |
(29,467 | ) | (28,729 | ) | (7.2 | ) | (6.4 | ) | 738 | (2.5 | ) | |||||||||||||
| Foreign currency exchange |
(2 | ) | (1 | ) | — | — | 1 | (50.0 | ) | |||||||||||||||
|
|
|
|
|
|
|
|
|
|
|
|||||||||||||||
| Income from continuing operations before income tax provision |
37,499 | 70,419 | 9.3 | 15.8 | 32,920 | 87.8 | ||||||||||||||||||
| Income tax provision |
12,275 | 26,033 | 3.0 | 5.8 | 13,758 | 112.1 | ||||||||||||||||||
|
|
|
|
|
|
|
|
|
|
|
|||||||||||||||
| Income from continuing operations |
25,224 | 44,386 | 6.3 | 10.0 | 19,162 | 76.0 | ||||||||||||||||||
| Loss from discontinued operation, net of tax |
(1,302 | ) | — | (0.3 | ) | — | 1,302 | (100.0 | ) | |||||||||||||||
|
|
|
|
|
|
|
|
|
|
|
|||||||||||||||
| Net income |
$ | 23,922 | $ | 44,386 | 6.0 | % | 10.0 | % | $ | 20,464 | 85.5 | |||||||||||||
|
|
|
|
|
|
|
|
|
|
|
|||||||||||||||
36
Table of Contents
| Years Ended December 31, |
Percent of Revenue Years Ended December 31, |
Increase (Decrease) 2014 versus 2013 |
||||||||||||||||||||||
| 2013 | 2014 | 2013 | 2014 | |||||||||||||||||||||
| (In thousands, except percentages) | ||||||||||||||||||||||||
| EBITDA |
$ | 102,398 | $ | 138,482 | 25.2 | % | 31.1 | % | $ | 36,084 | 35.2 | % | ||||||||||||
| Adjusted EBITDA |
157,465 | 162,141 | 38.7 | 36.4 | 4,676 | 3.0 | ||||||||||||||||||
| Free Cash Flow |
109,414 | 104,819 | 26.9 | 23.5 | (4,595 | ) | (4.2 | ) | ||||||||||||||||
Revenues. The following table depicts revenue by type of business for the twelve month periods ended December 31:
| Portable Storage | Specialty Containment |
|||||||||||||||||||
| 2013 | 2014 | Increase (Decrease) 2014 versus 2013 |
2014 | |||||||||||||||||
| (In thousands, except percentages) | ||||||||||||||||||||
| Revenues: |
||||||||||||||||||||
| Leasing |
$ | 366,286 | $ | 404,939 | $ | 38,653 | 10.6 | % | $ | 5,423 | ||||||||||
| Sales |
38,051 | 31,423 | (6,628 | ) | (17.4 | ) | 162 | |||||||||||||
| Other |
2,149 | 2,681 | 532 | 24.8 | 846 | |||||||||||||||
|
|
|
|
|
|
|
|
|
|||||||||||||
| Total revenues |
$ | 406,486 | $ | 439,043 | $ | 32,557 | 8.0 | $ | 6,431 | |||||||||||
|
|
|
|
|
|
|
|
|
|||||||||||||
Total revenues in 2014 increased $39.0 million, or 9.6%, to $445.5 million from $406.5 million in 2013. Of this total increase, $6.4 million is attributable to our newly acquired specialty containment business. Leasing, our primary revenue focus, accounted for approximately 92.1% of total revenues during 2014, and increased $44.1 million, or 12.0%. Of this increase $5.4 million is attributable to the specialty product business. The $38.7 million, or 10.6% increase in portable storage leasing revenue was driven by a 10.5% increase in yield (leasing revenues divided by average units on rent). The increase in yield reflects a rate increase of 7.3% over 2013. Average units on rent of approximately 147,000 is consistent with the prior year. Our sales of portable storage units decreased $6.6 million to $31.4 million in 2014 from $38.1 million in 2013. The decrease from the prior year primarily relates to a large sale to the U.K. military in 2013 that did not recur in 2014.
Costs and expenses. The following table depicts costs and expenses by type of business for the twelve month periods ended December 31:
| Portable Storage | Specialty Containment |
|||||||||||||||||||
| 2013 | 2014 | Increase (Decrease) 2014 versus 2013 |
2014 | |||||||||||||||||
| (In thousands, except percentages) | ||||||||||||||||||||
| Costs and expenses: |
||||||||||||||||||||
| Cost of sales |
$ | 25,413 | $ | 21,838 | $ | (3,575 | ) | (14.1 | )% | $ | 106 | |||||||||
| Leasing, selling and general expenses |
237,567 | 277,594 | 40,027 | 16.8 | 3,354 | |||||||||||||||
| Restructuring expenses |
2,402 | 3,542 | 1,140 | 47.5 | — | |||||||||||||||
| Asset impairment charge, net |
38,705 | 557 | (38,148 | ) | (98.6 | ) | — | |||||||||||||
| Depreciation and amortization |
35,432 | 37,460 | 2,028 | 5.7 | 1,874 | |||||||||||||||
|
|
|
|
|
|
|
|
|
|||||||||||||
| Total costs and expenses |
$ | 339,519 | $ | 340,991 | $ | 1,472 | 0.4 | $ | 5,334 | |||||||||||
|
|
|
|
|
|
|
|
|
|||||||||||||
Cost of sales is the cost related to our sales revenue only. Within the portable storage business, cost of sales was $25.4 million and $21.8 million in 2013 and 2014, respectively. As a percentage of sales revenue, portable storage cost of sales was 69.5% and 66.8% in 2014 and 2013, respectively. This increase in cost of sales as a
37
Table of Contents
percentage of revenue is largely due to continued right-sizing of our fleet, including selling under-utilized fleet at a lower profit. Cost of sales related to our specialty containment products was $0.1 million.
Within the portable storage business, leasing, selling and general expenses increased $40.0 million, or 16.8%; and as a percentage of total portable storage revenues increased to 63.2% from 58.4% in 2013. Included in the 2014 amount is $5.1 million of expenses related to acquisitions, primarily the ETS Acquisition. Excluding the acquisition-related expenses, portable storage leasing, selling and general expenses increased $34.9 million, or 14.7%, and as a percentage of total portable storage revenue grew from 58.4% to 62.1%. The $34.9 million increase primarily corresponds to increased business levels to support the 8.0% growth in total revenue. In addition, within this business, repairs and maintenance costs related to our fleet increased $10.3 million to $27.0 million from $16.8 million, due primarily to our focus on bringing our lease fleet to a rent-ready state.
Also within the portable storage business, repairs and maintenance as a percentage of leasing revenue increased to 6.7% in 2014 as compared to 4.6% in 2013. Other increases in leasing, selling and general expenses for 2014 include: (i) an 8.8% increase in payroll-related costs (including share-based compensation expense) from $100.2 million to $109.1 million, (ii) a 16.9% increase in transportation costs from $40.6 million to $47.4 million, as we continue to focus on repositioning our fleet to high utilization markets and (iii) an increase in professional fees and service contracts of $3.4 million, or 35.6% from $9.6 million to $13.0 million due to upgraded technology, network and telephone systems, increased marketing research, and non-capitalizable expenses associated with our ERP implementation.
Specialty containment leasing, selling and general expense was $3.4 million for the period from the ETS Acquisition date of December 10, 2014 through the end of the year. As a percentage of specialty containment revenues, leasing, selling and general expense was 52.2%.
Restructuring expenses for 2014 were $3.5 million, compared to $2.4 million in 2013. The 2014 amount includes the sale of our Belfast, North Ireland location that management determined was nonstrategic. In addition, we made other organization changes in North America. In 2013, these charges primarily consist of reductions in our workforce and lease abandonment costs.
For 2013, the asset impairment charge, net was $38.7 million and primarily relates to the write-down of certain assets to fair value and classified as held for sale, less subsequent recovery of assets sold in excess of the fair values. Asset impairment charge, net of recoveries, was $0.6 million for 2014 and relates to gains and losses on the impaired assets upon completion of sale, or other disposal.
Depreciation and amortization expenses increased $3.9 million in 2014, as compared to the prior year, of which $1.9 million relates to the specialty containment business. Within the portable storage business, the $2.0 million increase in 2014 as compared to 2013 relates largely to transportation equipment acquired through capital leases to support new locations.
Adjusted EBITDA. Adjusted EBITDA increased $4.7 million, or 3.0%, to $162.1 million, compared to $157.5 million in 2013. Of this increase, $1.7 million related to our portable storage business and $3.0 million related to our specialty containment business. Adjusted EBITDA margins were 38.7% and 36.4% for 2013 and 2014, respectively. Excluding specialty containment business, our Adjusted EBITDA margin was 36.3%.
Interest Expense. Interest expense decreased $0.7 million, or 2.5%, to $28.7 million in 2014. Although we borrowed funds under our Credit Agreement to facilitate the ETS Acquisition, resulting in a balance of $705.5 million as of December 31, 2014, our average debt outstanding throughout 2014 decreased $49.6 million, or 8.4%, as compared to 2013. This decrease is principally due to the use of operating cash flow to reduce our debt prior to the ETS Acquisition. The annual weighted average interest rate on our debt was 4.8% for 2014, compared to 4.5% for 2013, excluding the amortizations of debt issuance and other costs. Taking into account the amortization of debt issuance costs, the annual weighted average interest rate was 5.3% in 2014 and 5.0% in 2013.
38
Table of Contents
Provision for income taxes. Our annual effective tax rate was 37.0% for 2014, compared to 32.7% for 2013. Our 2013 tax rate reflected a corporate income tax rate reduction authorized by the U.K.’s government in July 2013. This rate reduction resulted in a $1.9 million tax benefit that lowered our 2013 effective tax rate. Excluding the rate reduction benefit, the 2013 effective tax rate would have been approximately 37.6%. The remaining difference in our effective tax rate in 2014, as compared to 2013 is due primarily to a shift in the percentage of our pre-tax profit attributable to the U.K., which is taxed at a lower rate than North America. See Note 8 to the Consolidated Financial Statements for a further discussion on income taxes.
At December 31, 2014, we had a federal net operating loss carryforward of approximately $356.5 million, which expires, if unused, from 2025 to 2034. In addition, we had net operating loss carryforwards in the various states in which we operate. Over the past three years, we have had $118.1 million of federal taxable income. We believe, based on internal projections, that we will generate sufficient taxable income needed to realize the corresponding federal and state deferred tax assets to the extent they are recorded as deferred tax assets in our balance sheet.
Net income. Income from continuing operations in 2014 increased to $44.4 million, compared to $25.2 million in 2013. Excluding restructuring expenses, acquisition expenses and asset impairment charges, income from continuing operations increased $1.1 million due primarily to the reduced interest expense and the ETS Acquisition.
Loss from discontinued operation, net of tax, was $1.3 million in 2013, of which $1.2 million resulted from the sale of our Netherlands operation in December 2013.
39
Table of Contents
Twelve Months Ended December 31, 2013, Compared to Twelve Months Ended December 31, 2012
| Years Ended December 31, |
Percent of Revenue Years Ended December 31, |
Increase (Decrease) 2013 versus 2012 |
||||||||||||||||||||||
| 2012 | 2013 | 2012 | 2013 | |||||||||||||||||||||
| (In thousands, except percentages) | ||||||||||||||||||||||||
| Revenues: |
||||||||||||||||||||||||
| Leasing |
$ | 339,975 | $ | 366,286 | 89.5 | % | 90.1 | % | $ | 26,311 | 7.7 | % | ||||||||||||
| Sales |
37,759 | 38,051 | 9.9 | 9.4 | 292 | 0.8 | ||||||||||||||||||
| Other |
2,162 | 2,149 | 0.6 | 0.5 | (13 | ) | (0.6 | ) | ||||||||||||||||
|
|
|
|
|
|
|
|
|
|
|
|||||||||||||||
| Total revenues |
379,896 | 406,486 | 100.0 | 100.0 | 26,590 | 7.0 | ||||||||||||||||||
|
|
|
|
|
|
|
|
|
|
|
|||||||||||||||
| Costs and expenses: |
||||||||||||||||||||||||
| Cost of sales |
23,178 | 25,413 | 6.1 | 6.3 | 2,235 | 9.6 | ||||||||||||||||||
| Leasing, selling and general expenses |
218,709 | 237,567 | 57.6 | 58.4 | 18,858 | 8.6 | ||||||||||||||||||
| Merger and restructuring expenses |
7,123 | 2,402 | 1.9 | 0.6 | (4,721 | ) | (66.3 | ) | ||||||||||||||||
| Asset impairment charge, net |
— | 38,705 | — | 9.5 | 38,705 | n/a | ||||||||||||||||||
| Depreciation and amortization |
35,982 | 35,432 | 9.5 | 8.7 | (550 | ) | (1.5 | ) | ||||||||||||||||
|
|
|
|
|
|
|
|
|
|
|
|||||||||||||||
| Total costs and expenses |
284,992 | 339,519 | 75.0 | 83.5 | 54,527 | 19.1 | ||||||||||||||||||
|
|
|
|
|
|
|
|
|
|
|
|||||||||||||||
| Income from operations |
94,904 | 66,967 | 25.0 | 16.5 | (27,937 | ) | (29.4 | ) | ||||||||||||||||
| Other income (expense): |
||||||||||||||||||||||||
| Interest income |
1 | 1 | — | — | — | — | ||||||||||||||||||
| Interest expense |
(37,268 | ) | (29,467 | ) | (9.8 | ) | (7.2 | ) | 7,801 | (20.9 | ) | |||||||||||||
| Debt restructuring expense |
(2,812 | ) | — | (0.7 | ) | — | 2,812 | (100.0 | ) | |||||||||||||||
| Deferred financing costs write-off |
(1,889 | ) | — | (0.5 | ) | — | 1,889 | (100.0 | ) | |||||||||||||||
| Foreign currency exchange |
(4 | ) | (2 | ) | — | — | 2 | (50.0 | ) | |||||||||||||||
|
|
|
|
|
|
|
|
|
|
|
|||||||||||||||
| Income from continuing operations before income tax provision |
52,932 | 37,499 | 13.9 | 9.3 | (15,433 | ) | (29.2 | ) | ||||||||||||||||
| Income tax provision |
18,509 | 12,275 | 4.9 | 3.0 | (6,234 | ) | (33.7 | ) | ||||||||||||||||
|
|
|
|
|
|
|
|
|
|
|
|||||||||||||||
| Income from continuing operations |
34,423 | 25,224 | 9.0 | 6.3 | (9,199 | ) | (26.7 | ) | ||||||||||||||||
| Loss from discontinued operation, net of tax |
(245 | ) | (1,302 | ) | (0.1 | ) | (0.3 | ) | (1,057 | ) | 431.4 | |||||||||||||
|
|
|
|
|
|
|
|
|
|
|
|||||||||||||||
| Net income |
$ | 34,178 | $ | 23,922 | 8.9 | % | 6.0 | % | $ | (10,256 | ) | (30.0 | ) | |||||||||||
|
|
|
|
|
|
|
|
|
|
|
|||||||||||||||
| Years Ended December 31, |
Percent of Revenue Years Ended December 31, |
Increase (Decrease) 2013 versus 2012 |
||||||||||||||||||||||
| 2012 | 2013 | 2012 | 2013 | |||||||||||||||||||||
| (In thousands, except percentages) | ||||||||||||||||||||||||
| EBITDA |
$ | 130,883 | $ | 102,398 | 34.5 | % | 25.2 | % | $ | (28,485 | ) | (21.8 | )% | |||||||||||
| Adjusted EBITDA |
145,447 | 157,465 | 38.3 | 38.7 | 12,018 | 8.3 | ||||||||||||||||||
| Free Cash Flow |
65,129 | 109,414 | 17.1 | 26.9 | 44,285 | 68.0 | ||||||||||||||||||
40
Table of Contents
Revenues. Total revenues in 2013 increased $26.6 million, or 7.0%, to $406.5 million from $379.9 million in 2012. Leasing, our primary revenue focus, accounted for approximately 90.1% of total revenues during 2013. Leasing revenues in 2013 increased $26.3 million, or 7.7%, to $366.3 million from $340.0 million in 2012. This increase in leasing revenues was driven by an increase in the number of units on rent, increased rental rates and higher trucking and ancillary revenues. Yield (leasing revenues divided by average units on rent) increased 4.1% and includes a rental rate increase of 2.9% over 2012. Our sales of portable storage and office units increased $0.3 million to $38.1 million in 2013 from $37.8 million in 2012. Other revenues are primarily related to transportation charges for the delivery of units sold and the sale of ancillary products and represented 0.5% and 0.6% of total revenues in 2013 and 2012, respectively.
Costs and expenses. Cost of sales is the cost related to our sales revenue only. Cost of sales was 66.8% and 61.4% of sales revenue in 2013 and 2012, respectively. The increase in cost of sales was primarily related to the U.K. military sale in the first quarter of 2013, which was at a lower than average selling margin.
Leasing, selling and general expenses increased $18.9 million, or 8.6%, to $237.6 million in 2013 from $218.7 million in 2012. Leasing, selling and general expenses, as a percentage of total revenues, were 58.4% and 57.6% in 2013 and 2012, respectively. Our consumer initiative program that was terminated in August 2012 accounted for $4.5 million in 2012. Excluding the consumer initiative program, leasing, selling and general expenses would have increased $23.4 million, or 10.9%, compared to 2012. This increase is primarily due to variable costs associated with an increased level of business activity. Excluding the consumer initiative program, the major increases in leasing, selling and general expenses for 2013 were: (i) payroll related costs (including stock compensation expense of $6.8 million) increased $12.9 million as a result of hiring additional yard drivers and administrative personnel to support increased leasing activity and annual merit increases, (ii) investments in repairs and maintenance of our lease fleet and delivery equipment increased $6.3 million, and (iii) transportation costs increased $3.0 million, as a result of our fleet repositioning to high utilization markets and incremental costs as a result of our increased delivery activity.
Restructuring expenses for 2013 were $2.4 million, compared to $7.1 million in 2012. In 2012, these costs included the consumer initiative program that was terminated in August 2012 (approximately $0.7 million) and the transition of our former President and Chief Executive Officer in December 2012 (approximately $5.1 million). Other costs in 2013 and 2012 primarily represented costs associated with reductions in our workforce, lease abandonment costs and continuing MSG merger expenses.
Asset impairment charge, net for 2013 was $38.7 million and relates to the write-down of certain assets to fair value and classified as held for sale in the second quarter of 2013, less subsequent recovery of assets sold in excess of the fair values. See Note 16 to the Consolidated Financial Statements for a further discussion on asset impairment.
Depreciation and amortization expenses remained relatively the same at $35.4 million in 2013 and $36.0 million in 2012. Our depreciation expense relates to property, plant and equipment, primarily trucks, forklifts and trailers to support the lease fleet, the customized ERP, CRM and other systems to enhance our reporting environment together with our lease fleet depreciation expense.
Adjusted EBITDA. Adjusted EBITDA increased $12.0 million, or 8.3%, to $157.5 million, compared to $145.4 million in 2012. Adjusted EBITDA margins were 38.7% and 38.3% of total revenues for 2013 and 2012, respectively. Expenses prior to terminating our consumer initiative program adversely impacted Adjusted EBITDA in 2012 by approximately $4.2 million. Excluding this charge, Adjusted EBITDA in 2012 would be approximately $149.6 million.
Interest expense. Interest expense decreased $7.8 million, or 20.9%, to 29.5 million in 2013 from $37.3 million in 2012. The decrease in interest expense is attributable to a lower average amount of debt outstanding in 2013 compared to 2012, principally due to the use of operating cash flow to reduce our debt over
41
Table of Contents
the past year as well as a lower weighted average interest rate. In August 2012, we redeemed $150.0 million aggregate principal balance outstanding of our 6.875% senior notes due 2015 (the “2015 Notes”) by drawing down funds under our lower variable interest rate Credit Agreement. Our average annual debt outstanding decreased $92.6 million, or 13.6%, compared to the same period last year. The annual weighted average interest rate on our debt was 4.5% for 2013, compared to 5.0% for 2012, excluding the amortizations of debt issuance and other costs. Taking into account the amortizations of debt issuance and other costs, the annual weighted average interest rate was 5.0% in 2013 and 5.5% in 2012.
Other expenses. Debt restructuring expense in 2012 was $2.8 million and related to the redemption of the 2015 Notes, representing the redemption premiums and the write-off of the unamortized original issuance discount related to such redeemed notes.
Deferred financing costs write-off in 2012 of $1.9 million represents the unamortized deferred financing costs associated with the redemption of the 2015 Notes in August 2012 and a portion of the deferred financing costs associated with our prior $850.0 million credit agreement, which was replaced in February 2012 with our $900.0 million Credit Agreement.
Provision for income taxes. Our annual effective tax rate was 32.7% for 2013, compared to 35.0% for 2012. In July 2013 and 2012, the U.K’s government authorized reductions in the corporate income tax rates. This change reduced our deferred tax liability in the U.K. by approximately $1.9 million and $1.2 million in 2013 and 2012, respectively. Our 2013 consolidated tax provision includes the enacted tax rates for our operations in the U.S., Canada and the U.K. See Note 8 to the Consolidated Financial Statements for a further discussion on income taxes.
Net income. Net income from continuing operations in 2013 decreased 26.7% to $25.2 million, compared to $34.4 million in 2012. Net income in 2013 was negatively impacted by $38.7 million (approximately $25.0 million after tax) related to the asset impairment charge discussed above. Net income includes a reduction in the U.K. corporate tax rates of $1.9 million and $1.2 million in 2013 and 2012, respectively. Net income in 2012 was also negatively impacted by $4.7 million (approximately $2.9 million after tax), respectively, related to debt restructuring expense and deferred financing costs write-off discussed below. Net income results also include restructuring expenses of $2.4 million and $7.1 million (approximately $1.5 million and $4.4 million after tax) for 2013 and 2012, respectively.
Loss from discontinued operation, net of tax, was $1.3 million in 2013, of which $1.2 million resulted from the sale, and $0.2 million in 2012 and represents our Netherlands operation that was sold in December 2013.
LIQUIDITY AND CAPITAL RESOURCES
Leasing is a capital-intensive business that requires us to acquire assets before they generate revenues, cash flow and earnings. The assets that we lease have very long useful lives and require relatively little maintenance expenditures. Most of the capital we have deployed in our leasing business historically has been used to expand our operations geographically, to execute opportunistic acquisitions, to increase the number of units available for lease at our existing locations, and to add to the mix of products we offer. During recent years, our operations have generated annual cash flow that exceeds our pre-tax earnings, particularly due to cash flow from operations and the deferral of income taxes caused by accelerated depreciation of our fixed assets in our tax return filings. Our free cash flow was $65.1 million, $109.4 million and $104.8 million for the years ended December 31, 2012, 2013 and 2014, respectively. Excluding $5.1 million in acquisition-related costs, free cash flow was $109.9 million in 2014. In addition to free cash flow, our principal current source of liquidity is our Credit Agreement described below.
Revolving Credit Facility. On February 22, 2012, we entered into our $900.0 million Credit Agreement with Deutsche Bank AG New York Branch and other lenders party thereto. On December 10, 2014, we amended our Credit Agreement to increase the credit facility to $1.0 billion. The Credit Agreement provides for a five-
42
Table of Contents
year, revolving credit facility and matures on February 22, 2017. The obligations of us and our subsidiary guarantors under the Credit Agreement are secured by a blanket lien on substantially all of our assets. We funded the December 10, 2014 ETS Acquisition with funds drawn on our Credit Agreement. At December 31, 2014, we had $705.5 million of borrowings outstanding and $286.9 million of additional borrowing availability under the Credit Agreement. We were in compliance with the terms of the Credit Agreement as of December 31, 2014 and were above the minimum borrowing availability threshold and therefore not subject to any financial maintenance covenants.
Amounts borrowed under the Credit Agreement and repaid or prepaid during the term may be reborrowed. Outstanding amounts under the Credit Agreement bear interest at our option at either: (i) LIBOR plus a defined margin, or (ii) the Agent bank’s prime rate plus a margin. The applicable margin for each type of loan is based on an availability-based pricing grid and ranges from 1.75% to 2.25% for LIBOR loans and 0.75% to 1.25% for base rate loans at each measurement date. Based on the pricing grid at December 31, 2014, the applicable margins are 2.00% for LIBOR loans and 1.00% for base rate loans and will be remeasured at the end of the next measurement date, which is within 10 days following the end of each fiscal quarter.
Availability of borrowings under the Credit Agreement is subject to a borrowing base calculation based upon a valuation of our eligible accounts receivable, eligible container fleet (including containers held for sale, work-in-process and raw materials) and machinery and equipment, each multiplied by an applicable advance rate or limit. The lease fleet is appraised at least once annually by a third-party appraisal firm and up to 90% of the net orderly liquidation value, as defined in the Credit Agreement, is included in the borrowing base to determine how much we may borrow under the Credit Agreement.
The Credit Agreement provides for U.K. borrowings, which are, at our option, denominated in either Pounds Sterling or Euros, by our U.K. subsidiary based upon a U.K. borrowing base; Canadian borrowings, which are denominated in Canadian dollars, by our Canadian subsidiary based upon a Canadian borrowing base; and U.S. borrowings, which are denominated in U.S. dollars, based upon a U.S. borrowing base along with any Canadian assets not included in the Canadian subsidiary.
The Credit Agreement also contains customary negative covenants, including covenants that restrict our ability to, among other things: (i) allow certain liens to attach to the Company or its subsidiary assets; (ii) repurchase or pay dividends or make certain other restricted payments on capital stock and certain other securities, prepay certain indebtedness or make acquisitions or other investments subject to Payment Conditions (as defined in the Credit Agreement); and (iii) incur additional indebtedness or engage in certain other types of financing transactions. Payment Conditions allow restricted payments and acquisitions to occur without financial covenants as long as we have $250.0 million of pro forma excess borrowing availability under the Credit Agreement. We must also comply with specified financial maintenance covenants and affirmative covenants only if we fall below $100.0 million of borrowing availability levels.
We believe our cash provided by operating activities will provide for our normal capital needs for the next twelve months. If not, we have sufficient borrowings available under our Credit Agreement to meet any additional funding requirements. We monitor the financial strength of our lenders on an ongoing basis using publicly-available information. Based upon that information, we do not presently believe that there is a likelihood that any of our lenders will be unable to honor their respective commitments under the Credit Agreement.
Senior Notes. At December 31, 2014, we had outstanding $200.0 million aggregate principal amount of 7.875% senior notes due 2020 (the “2020 Notes” or the “Senior Notes”). Interest on the 2020 Notes is payable semiannually in arrears on June 1 and December 1 of each year.
Operating Activities. Net cash provided by operating activities was $120.6 million in 2014, compared to $116.1 million in 2013, an increase of $4.5 million. Net cash from operating activities in 2014 includes a reduction of $5.1 million due to acquisition-related expenses. Although net income was $20.5 million
43
Table of Contents
greater in the current year than in the prior year, non-cash add backs decreased from $96.4 million to $80.7 million, or $15.7 million. Non-cash items in the prior year include a $38.2 million asset impairment charge, $11.0 million in deferred taxes, $35.6 million in depreciation and amortization and $14.7 million of share-based compensation expense. These addbacks were partially offset by a net reduction to cash of $3.2 million related to other non-cash income statement items. Non-cash items in the current year include $25.4 million in deferred taxes, $39.3 million of depreciation and amortization, $15.1 million of share-based compensation and a net addition of $0.9 million related to other non-cash income statement items. The change in working capital accounts was consistent for both 2014 and 2013.
The $25.2 million increase in cash provided by operating activities in 2013 compared to 2012 was primarily attributable to an increase in net income after giving effect to non-cash items, partially offset by an increase in working capital.
Cash provided by operating activities is enhanced by the deferral of most income taxes due to the rapid tax depreciation rate of our assets and our federal and state net operating loss carryforwards. At December 31, 2014, we had a federal net operating loss carryforward of approximately $356.5 million and a net deferred tax liability of $231.5 million.
Investing Activities. Net cash used in investing activities was $446.8 million in 2014 compared to $6.0 million in 2013 and $29.4 million in 2012. In 2014, we made payments for acquisitions, primarily the ETS Acquisition, of $430.9 million as compared to payments for acquisitions of $3.6 million in 2012. We did not acquire any businesses in 2013.
Net capital expenditures for our lease fleet was $4.2 million in 2014 compared to cash proceeds from sale of lease fleet units, net of expenditures for our lease fleet of $7.1 million in 2013 and net capital expenditures for our lease fleet of $14.6 million in 2012. Lease fleet capital expenditures decreased in 2014 and 2013 from 2012 levels as we alternatively invested in our existing fleet through normal repairs and maintenance, which is expensed as incurred. Proceeds from sale of lease fleet units in 2014 decreased 35.9%, compared to 2013 and increased 22.5% in 2013 compared to 2012. The $36.0 million in proceeds from sale of lease fleet units in 2013 includes a bulk sale to the U.K. military of approximately $4.3 million and approximately $7.8 million from the impaired assets held for sale. Additions to the lease fleet primarily include remanufacturing of acquisition units and manufactured steel offices and other steel units for higher utilization markets. During the past several years, we have continued the customization of our fleet, enabling us to differentiate our products from our competitors’ products, and we have complimented our lease fleet by adding steel security offices. Capital expenditures for property, plant and equipment, net of proceeds from any sale of property, plant and equipment, were $11.6 million in 2014, $13.8 million in 2013 and $11.2 million in 2012. The expenditures for property, plant and equipment in 2014, 2013 and 2012 were primarily for replacement of our transportation equipment and upgrades to technology equipment.
The amount of cash that we use during any period in investing activities is almost entirely within management’s discretion. We have no contracts or other arrangements pursuant to which we are required to purchase a fixed or minimum amount of goods or services in connection with any portion of our business. Maintenance capital expenditures includes expenses such as the cost to replace old forklifts, trucks and trailers that we use to move and deliver our products to our customers, and for replacements to enhance our computer information and communication systems. Our maintenance capital expenditures were approximately $3.3 million in 2014, $8.3 million in 2013 and $5.5 million in 2012. In addition, we financed equipment through capital lease obligations, primarily for transportation related equipment, of $16.5 million, $8.5 million and $0.3 million in 2014, 2013 and 2012, respectively. We anticipate our near term investing activities will be primarily focused on supporting growth through the addition of transportation equipment, remanufacturing of lease fleet units, and additional lease fleet. In addition, we may invest in opportunistic acquisitions. Also, in the near term we will be developing and implementing our new ERP.
44
Table of Contents
Financing Activities. Net cash provided by financing activities was $329.8 million in 2014, compared to net cash used by financing activities of $110.3 million in 2013 and $60.7 million in 2012. In December 2014, we financed the ETS Acquisition by borrowing under our Credit Agreement, resulting in net borrowings of $386.2 million in 2014. In 2013, net repayments under our Credit Agreement were $123.1 million. In 2012, we had net borrowings under our Credit Agreement of $52.8 million. In 2012, borrowings under the Credit Agreement were utilized to redeem the $150.0 million aggregate principal amount of the 2015 Notes. In connection with the redemption of the 2015 Notes in 2012, we incurred approximately $2.6 million in redemption premiums. Additionally, we incurred financing costs of approximately $8.1 million for the Credit Agreement entered into on February 22, 2012. In 2014, we paid cash dividends of $31.4 million to our stockholders and purchased shares of our common stock of $26.0 million (primarily under our share repurchase program). We received $3.6 million, $13.8 million and $3.6 million from the exercises of employee stock options in 2014, 2013 and 2012, respectively. As of December 31, 2014, we had $705.5 million of borrowings outstanding under our Credit Agreement and approximately $286.9 million of additional borrowings were available to us under such agreement.
Contractual Obligations and Commitments
Our contractual obligations primarily consist of our outstanding balance under the Credit Agreement, $200.0 million aggregate principal amount of the 2020 Notes and obligations under capital leases. We also have operating lease commitments for: (i) real estate properties for the majority of our locations with remaining lease terms typically ranging from one to ten years (ii) delivery, transportation and yard equipment, typically under a five-year lease with purchase options at the end of the lease term at a stated or fair market value price, and (iii) office related equipment. At December 31, 2014, primarily in connection with securing our insurance policies, we provided certain insurance carriers and others with approximately $7.5 million in letters of credit. We currently do not have any obligations under purchase agreements or commitments.
The table below provides a summary of our contractual commitments as of December 31, 2014. The operating lease amounts include certain real estate leases that expire in 2015, but have lease renewal options that we currently anticipate exercising in 2015 at the end of the initial lease period. These renewal amounts have been included in the schedule below.
| Total | Less Than 1 Year |
1-3 Years | 3-5 Years | More than 5 Years |
||||||||||||||||
| (In thousands, except per share and operating data) | ||||||||||||||||||||
| Revolving credit facility |
$ | 705,518 | $ | — | $ | 705,518 | $ | — | $ | — | ||||||||||
| Interest payment obligations under our revolving credit facility(1) |
45,777 | 15,259 | 30,518 | — | — | |||||||||||||||
| Senior Notes |
200,000 | — | — | — | 200,000 | |||||||||||||||
| Interest payment obligations under our Senior Notes(2) |
86,625 | 15,750 | 31,500 | 31,500 | 7,875 | |||||||||||||||
| Obligations under capital leases |
24,918 | 3,465 | 6,977 | 6,235 | 8,241 | |||||||||||||||
| Interest payment obligations under our capital leases(3) |
2,512 | 679 | 993 | 596 | 244 | |||||||||||||||
| Operating leases(4) |
63,752 | 19,290 | 25,391 | 9,298 | 9,773 | |||||||||||||||
|
|
|
|
|
|
|
|
|
|
|
|||||||||||
| Total contractual obligations |
$ | 1,129,102 | $ | 54,443 | $ | 800,897 | $ | 47,629 | $ | 226,133 | ||||||||||
|
|
|
|
|
|
|
|
|
|
|
|||||||||||
| (1) | Scheduled interest rate obligations under our Credit Agreement, which is subject to a variable rate of interest, were calculated using our weighted average rate of 2.2% at December 31, 2014. |
| (2) | Scheduled interest rate obligations under our Senior Notes were calculated using the stated rate of 7.875%. |
| (3) | Scheduled interest rate obligations under capital leases were calculated using imputed rates primarily ranging from 1.8% to 12.7%. |
| (4) | Operating lease obligations include operating commitments and restructuring related commitments and are net of sub-lease income. For further discussion see Note 12 to our Consolidated Financial Statements. |
45
Table of Contents
Off-Balance Sheet Transactions
We do not maintain any off-balance sheet transactions, arrangements, obligations or other relationships with unconsolidated entities or others that are reasonably likely to have a material current or future effect on our financial condition, changes in financial condition, revenues or expenses, results of operations, liquidity, capital expenditures or capital resources.
Seasonality
Demand from our portable storage customers is somewhat seasonal. Construction customers typically reflect higher demand during months with more temperate weather, while demand for leases of our portable storage units by large retailers is stronger from September through December because these retailers need to store more inventories for the holiday season. Our retail customers usually return these leased units to us in December and early in the following year. In the specialty containment business, demand from customers is typically higher in the middle of the year from March to October, driven by the timing of customer maintenance projects. The demand for rental of our pumps, may also impacted by weather, specifically when temperatures drop below freezing.
Critical Accounting Policies, Estimates and Judgments
Our significant accounting policies are disclosed in Note 2 to our Consolidated Financial Statements. The following discussion addresses our most critical accounting policies, some of which require significant judgment.
Our consolidated financial statements have been prepared in accordance with GAAP. The preparation of these consolidated financial statements requires us to make estimates and assumptions that affect the reported amounts of assets, liabilities, revenues and expenses during the reporting period. These estimates and assumptions are based upon expert information, our evaluation of historical results and anticipated future events, and these estimates may change as additional information becomes available. The SEC defines critical accounting policies as those that are, in management’s view, most important to our financial condition and results of operations and those that require significant judgments and estimates. Management believes that our most critical accounting policies relate to:
Revenue Recognition. Leasing revenue is generated from the direct lease of our fleet to our customers, including ancillary revenue such as fleet delivery and pickup. We enter into contracts with our customers to lease equipment based on a monthly rate for our portable storage fleet and a daily, weekly or monthly rate for our specialty containment fleet. Revenues from leasing are recognized ratably over the leased period. When a customer keeps the leased unit beyond the original intended term, the lease continues until cancelled by the customer or the Company. Customers may utilize our equipment delivery and pick-up services in conjunction with the leasing of equipment, but it is not required. Transportation revenue pursuant to the pick up or delivery of a leased unit is recognized in leasing revenue upon completion of the service. When customers are billed in advance, we defer recognition of revenue and record unearned leasing revenue at the end of the reporting period. If equipment is returned prior to the end of the contractually obligated period, the excess, if any, between the amount the customer is contractually required to pay, over the cumulative amount of revenue recognized to date, is recognized as incremental revenue upon return.
Sales revenue is primarily generated by the sale of new and used units. We recognize revenues from sales of units upon delivery when the risk of loss passes, the price is fixed and determinable and collectability is reasonably assured. We sell our products pursuant to sales contracts stating the fixed sales price.
Share-Based Compensation. We calculate the fair value of stock options using the Black-Scholes-Merton option pricing valuation model, which incorporates various assumptions including volatility, expected life and risk-free interest rates. The fair value of nonvested share-awards is estimated as the closing price of our common stock on the date of grant. Compensation related to service-based awards are recognized on a straight-line basis over the vesting period, which is generally three to five years. Compensation expense related to performance-
46
Table of Contents
based awards is recognized over the implicit service period of the award based on management’s estimate of the probability of the performance criteria being satisfied, adjusted at each balance sheet date. Expense related to performance-based awards that have multiple vesting dates, is recognized using the accelerated attribution approach, whereby each vesting tranche is treated as a separate award for purposes of determining the implicit service period. Share-based compensation expense is reduced for forfeitures which are estimated at the time of grant based on historical experience, and revised in subsequent periods if actual forfeitures differ from estimates.
Receivables and Allowance for Doubtful Accounts. Receivables are stated net of an allowance for doubtful accounts, which is reviewed monthly for adequacy. We estimate the amount of customer receivables that are uncollectible and record an estimated provision for bad debts through a charge to operations. The provision is based on historical collection experience and evaluation of past-due accounts. Specific accounts are written off against the allowance when management determines the account is uncollectible.
If we were to increase the factors used for our reserve estimates by 25% for our portable storage business, it would have the following approximate effect on our net income and diluted EPS as follows:
| Years Ended December 31, |
||||||||
| 2013 | 2014 | |||||||
| (In thousands except per share data) |
||||||||
| Continuing Operations: |
||||||||
| As reported: |
||||||||
| Net income |
$ | 25,224 | $ | 44,386 | ||||
| Diluted EPS |
0.55 | 0.95 | ||||||
| As adjusted for change in estimates: |
||||||||
| Net income |
$ | 24,818 | $ | 43,947 | ||||
| Diluted EPS |
0.54 | 0.94 | ||||||
Purchase Accounting. We account for acquisitions under the acquisition method. Under the acquisition method of accounting, the Company records assets acquired and liabilities assumed at their estimated fair market value on the date of acquisition. Goodwill is measured as the excess of the fair value of the consideration transferred over the fair value of the identifiable net assets. Estimated fair values of acquired assets and liabilities is provisional and could change as additional information is received. The Company finalizes valuations as soon as practicable, but not later than one-year from the acquisition date. Any subsequent changes to purchase price allocations results in a corresponding adjustment to goodwill.
The determination of the fair value of intangible assets requires the use of significant judgment with regard to (i) the fair value; and (ii) whether such intangibles are amortizable or non-amortizable and, if amortizable, the period and the method by which the intangible asset will be amortized. We estimate the fair value of acquisition-related intangible assets principally based on projections of cash flows that will arise from identifiable intangible assets of acquired businesses. The projected cash flows are discounted to determine the present value of the assets at the dates of acquisition.
Goodwill. Purchase prices of acquired businesses have been allocated to the assets and liabilities acquired based on the estimated fair values on the respective acquisition dates. Based on these values, the excess purchase prices over the fair value of the net assets acquired is recorded as goodwill. Immediately prior to December 10, 2014, all of our goodwill was allocated between two reporting units, our portable storage operations in North America and the U.K. Of the $705.6 million total goodwill at December 31, 2014, $459.2 million relates to the portable storage North America segment, $64.4 million relates to the portable storage U.K. segment and $182.0 million relates to the specialty containment segment.
47
Table of Contents
We assess the impairment of goodwill on an annual basis at December 31, or whenever events or changes in circumstances indicate that the carrying value may not be recoverable. Some factors we consider important which could trigger an impairment review include the following:
| • | significant under-performance relative to historical, expected or projected future operating results; |
| • | significant changes in the manner of our use of the acquired assets or the strategy for our overall business; |
| • | our market capitalization relative to net book value; and |
| • | significant negative industry or general economic trends. |
In assessing the fair value of the reporting units, we consider both the market approach and the income approach. Under the market approach, the fair value of the reporting unit is based on quoted market prices of companies comparable to the reporting unit being valued. Under the income approach, the fair value of the reporting unit is based on the present value of estimated cash flows. The income approach is dependent on a number of significant management assumptions, including estimated future revenue growth rates, gross margins on sales, operating margins, capital expenditures, tax payments and discount rates. Each approach is given equal weight in arriving at the fair value of the reporting unit. As of December 31, 2014, we assessed qualitative factors and determined it is more likely than not each of our reporting units assigned goodwill had estimated fair values greater than the respective reporting unit’s individual net asset carrying values; therefore, the two step impairment test was not required.
If the two step impairment test is necessary, we are required to determine the implied fair value of the goodwill and compare it to the carrying value of the goodwill. We would assign the fair value of the reporting units to the respective assets and liabilities of each reporting unit as if the reporting units had been acquired in separate and individual business combinations and the fair value of the reporting units was the price paid to acquire the reporting units. The excess of the fair value of the reporting units over the amounts assigned to their respective assets and liabilities is the implied fair value of goodwill.
Impairment of Long-Lived Assets (Other than Goodwill). Our lease fleet, property, plant and equipment, and finite-lived intangibles are reviewed for impairment whenever events or changes in circumstances indicate the carrying amount of such assets may be impaired. If this review indicates the carrying value of these assets will not be recoverable, as measured based on estimated undiscounted cash flows over their remaining life, the carrying amount would be adjusted to fair value. The cash flow estimates contain management’s best estimates using appropriate and customary assumptions and projections at the time of evaluation.
In the second quarter of 2013, we conducted an assessment of the lease fleet and determined that certain of these units were either non-core to our leasing strategy or were uneconomic to repair. In connection with this evaluation, we determined to place these assets for sale, resulting in a non-cash impairment charge on long-lived assets of $37.6 million in the second quarter of 2013. As these assets have been sold or otherwise disposed of, additional adjustments have been made to the impairment charge resulting in total asset impairment charges, net of recoveries, of $38.7 million in 2013 and $0.6 million in 2014. See Note 16 to the accompanying Consolidated Financial Statements for a further discussion on the asset impairment. There were no indicators of further impairment at December 31, 2013 or at December 31, 2014. No impairment charges were recognized in 2012.
Lease Fleet. Lease fleet is capitalized at cost and depreciated over the estimated useful life of the unit using the straight-line method. Lease fleet is depreciated whether or not it is out on rent. Capitalized cost of our lease fleet includes the price we pay to acquire the unit and freight charges to the location when the unit is first placed in service, and when applicable, the cost of our manufacturing or remanufacturing, which includes the cost of customizing units. Ordinary repair and maintenance costs are charged to operations as incurred.
48
Table of Contents
The table below depicts the estimated useful lives and residual values (presented as a percentage of capitalized cost) for our major categories of portable storage lease fleet.
| Residual Value as Percentage of Original Cost |
Useful Life in Years |
|||||||
| Portable Storage: |
||||||||
| Steel storage containers |
55 | % | 30 | |||||
| Steel security and combination offices |
55 | 30 | ||||||
| Wood mobile offices |
50 | 20 | ||||||
We periodically review our depreciable lives and residual values against various factors, including the results of our lenders’ independent appraisal of our lease fleet, practices of the competitors in comparable industries, profit margins we achieve on sales of depreciated units and lease rates we obtain on older units. If we were to change our depreciation policy on our steel units from a 55% residual value and a 30-year life to a lower or higher residual value and a shorter or longer useful life, such change could have a positive, negative or neutral effect on our earnings, with the actual effect determined by the change. For example, a change in our estimates used in our residual values and useful life within the portable storage business would have the following approximate effect on our net income and diluted EPS as reflected in the table below.
| Residual Value as Percentage of Original Cost |
Useful Life in Years |
2013 | 2014 | |||||||||||||
| (in thousands except per share data) |
||||||||||||||||
| Continuing Operations: |
||||||||||||||||
| As reported: |
55.0 | % | 30 | |||||||||||||
| Net income |
$ | 25,224 | $ | 44,386 | ||||||||||||
| Diluted EPS |
0.55 | 0.95 | ||||||||||||||
| As adjusted for change in estimates: |
70.0 | % | 20 | |||||||||||||
| Net income |
$ | 25,224 | $ | 44,386 | ||||||||||||
| Diluted EPS |
0.55 | 0.95 | ||||||||||||||
| As adjusted for change in estimates: |
62.5 | % | 25 | |||||||||||||
| Net income |
$ | 25,224 | $ | 44,386 | ||||||||||||
| Diluted EPS |
0.55 | 0.95 | ||||||||||||||
| As adjusted for change in estimates: |
50.0 | % | 20 | |||||||||||||
| Net income |
$ | 18,876 | $ | 38,581 | ||||||||||||
| Diluted EPS |
0.41 | 0.83 | ||||||||||||||
| As adjusted for change in estimates: |
47.5 | % | 35 | |||||||||||||
| Net income |
$ | 25,224 | $ | 44,386 | ||||||||||||
| Diluted EPS |
0.55 | 0.95 | ||||||||||||||
| As adjusted for change in estimates: |
40.0 | % | 40 | |||||||||||||
| Net income |
$ | 25,224 | $ | 44,386 | ||||||||||||
| Diluted EPS |
0.55 | 0.95 | ||||||||||||||
| As adjusted for change in estimates: |
30.0 | % | 25 | |||||||||||||
| Net income |
$ | 16,972 | $ | 36,839 | ||||||||||||
| Diluted EPS |
0.37 | 0.79 | ||||||||||||||
| As adjusted for change in estimates: |
25.0 | % | 25 | |||||||||||||
| Net income |
$ | 15,702 | $ | 35,678 | ||||||||||||
| Diluted EPS |
0.34 | 0.76 | ||||||||||||||
49
Table of Contents
Depreciation for our specialty containment lease fleet was recognized only subsequent to the ETS Acquisition date of December 10, 2014. For more information about the lease fleet purchased in conjunction with the ETS Acquisition see Note 3 to the accompanying Consolidated Financial Statements. The table below depicts the estimated useful lives for our major categories of specialty containment lease fleet when purchased new. We estimate zero residual value for our specialty containment fleet.
| Useful Life in Years | ||
| Specialty Containment |
||
| Steel tanks |
25 | |
| Roll-off boxes |
15-20 | |
| Vacuum boxes |
20 | |
| Stainless steel tank trailers |
25 | |
| De-watering boxes |
20 | |
| Pumps and filtration equipment |
7 |
Insurance Reserves. We maintain insurance coverage for our operations and employees with appropriate aggregate, per occurrence and deductible limits as we reasonably determine is necessary or prudent considering current operations and historical experience. The majority of these coverages have large deductible programs which allow for potential improved cash flow benefits based on our loss control efforts. Generally we do not know the full amount of our exposure for group health or other types of claims incurred during the fiscal period in which the claims are made. The estimated expense to accrue involves management judgment.
Our employee group health insurance program is a self-insured program with individual and aggregate stop loss limits. We expense health insurance claims up to the calculated maximum liability. The Company accrues for incurred medical claims based on a variety of factors including the number of employees enrolled in the plan, and actual historical claim experience. Our workers’ compensation, auto and general liability insurance are purchased under large deductible programs. For these types of claims we expense the deductible portion of individual claim and accrue for claims incurred but not yet paid based on a combination of factors including company-specific claim development experience, and a year-end independent actuarial review of historical loss data. For more information regarding our insurance policies see Note 12 to the accompanying Consolidated Financial Statements
General Litigation. We are a party to various claims and litigation in the normal course of business. Management’s current estimated range of liability related to various claims and pending litigation is based on claims for which our management can determine that it is probable that a liability has been incurred and the amount of loss can be reasonably estimated. Because of the uncertainties related to both the probability of incurred and possible range of loss on pending claims and litigation, management must use considerable judgment in making reasonable determination of the liability that could result from an unfavorable outcome. As additional information becomes available, we will assess the potential liability related to our pending litigation and revise our estimates. Such revisions in our estimates of the potential liability could materially impact our results of operation. We do not anticipate the resolution of such matters known at this time will have a material adverse effect on our business or consolidated financial position.
Income Taxes. In preparing our consolidated financial statements, we recognize income taxes in each of the jurisdictions in which we operate. For each jurisdiction, we estimate the actual amount of taxes currently payable or receivable as well as deferred tax assets and liabilities attributable to temporary differences between the financial statement carrying amounts of existing assets and liabilities and their respective tax bases. Deferred income tax assets and liabilities are measured using enacted tax rates expected to apply to taxable income in the years in which these temporary differences are expected to be recovered or settled. The effect on deferred tax assets and liabilities of a change in tax rates is recognized in income in the period that includes the enactment date.
50
Table of Contents
A valuation allowance is provided for those deferred tax assets for which it is more likely than not that the related benefits will not be realized. In determining the amount of the valuation allowance, we consider estimated future taxable income as well as feasible tax planning strategies in each jurisdiction. If we determine that we will not realize all or a portion of our deferred tax assets, we will increase our valuation allowance with a charge to income tax expense. Conversely, if we determine that we will ultimately be able to realize all or a portion of the related benefits for which a valuation allowance has been provided, all or a portion of the related valuation allowance will be reduced with a credit to income tax expense.
At December 31, 2014, we had a $1.1 million valuation allowance and $142.6 million of gross deferred tax assets included within the net deferred tax liability on our balance sheet. The majority of the deferred tax asset relates to federal net operating loss carryforwards that have future expiration dates. Management currently believes that adequate future taxable income will be generated through future operations, or through available tax planning strategies to recover these assets. However, given that these federal net operating loss carryforwards that give rise to the deferred tax asset expire over 10 years beginning in 2025, there could be changes in management’s judgment in future periods with respect to the recoverability of these assets. As of December 31, 2014, management believes that it is more likely than not that the unreserved portion of these deferred tax assets will be recovered.
At December 31, 2014, we had approximately $0.5 million of cash related to foreign operations that we assert will be permanently reinvested to continue to grow operations in the U.K. This investment will be in the form of capital expenditures as well as ongoing debt service. If these funds, or any of the $37.0 million of aggregated undistributed earnings at December 31, 2014 are repatriated, we would need to accrue and pay income taxes at that time. Currently, we do not intend to repatriate any of these funds or undistributed earnings.
Recent Accounting Pronouncements
Presentation of an Unrecognized Tax Benefit When a Net Operating Loss Carryforward, a Similar Tax Loss, or a Tax Credit Carryforward Exists. In July 2013, the Financial Accounting Standards Board (“FASB”) issued accounting guidance on the financial statement presentation of an unrecognized tax benefit when a net operating loss carryforward, a similar tax loss, or a tax credit carryforward exists. The guidance is effective prospectively for fiscal years, and interim periods within those years, beginning after December 15, 2013, with an option for early adoption. The Company adopted this guidance in January 2014. The adoption of this amendment did not have a material impact on its consolidated financial statements and related disclosures.
Reporting Discontinued Operations and Disclosures of Disposals of Components of an Entity. In April 2014, the FASB issued the accounting guidance on reporting discontinued operations and disclosures of disposals of components of an entity. The new guidance raises the threshold for a disposal to qualify as a discontinued operation and requires new disclosures of both discontinued operations and certain other disposals that do not meet the definition of a discontinued operation. The guidance is effective for fiscal years beginning after December 15, 2014. Early adoption is permitted, but only for disposals that have not been reported in financial statements previously issued. The Company does not expect the adoption of the guidance will have a material impact on its consolidated financial statements and related disclosures.
Revenue from Contracts with Customers. In May 2014, FASB issued the accounting standard on revenue from contracts with customers. The standard provides a single model for revenue arising from contracts with customers and supersedes current revenue recognition guidance. The standard requires an entity to recognize the amount of revenue to which it expects to be entitled for the transfer of goods or services. The standard is effective for annual and interim periods beginning after December 15, 2016. Early adoption is not permitted. The revenue recognition standard permits the use of either the retrospective or cumulative effect transition method. The Company is evaluating the impact, if any, of the adoption of the standard to its financial statements and related disclosures. The Company has not yet selected a transition method nor determined the effect of the standard on its ongoing financial reporting.
51
Table of Contents
| ITEM 7A. | QUANTITATIVE AND QUALITATIVE DISCLOSURES ABOUT MARKET RISK. |
The following table sets forth the scheduled maturities and the total fair value of our debt portfolio as of December 31, 2014:
| Principal Maturing in the Twelve Months Ended December 31, | Total at December 31, 2014 |
Total Fair Value at December 31, 2014 |
||||||||||||||||||||||||||||||
| 2015 | 2016 | 2017 | 2018 | 2019 | Thereafter | |||||||||||||||||||||||||||
| (In thousands, except percentages) | ||||||||||||||||||||||||||||||||
| Debt: |
||||||||||||||||||||||||||||||||
| Fixed rate |
$ | 3,465 | $ | 3,563 | $ | 3,414 | $ | 3,041 | $ | 3,194 | $ | 208,241 | $ | 224,918 | $ | 230,918 | ||||||||||||||||
| Average interest rate |
7.30 | % | ||||||||||||||||||||||||||||||
| Floating rate |
$ | — | $ | — | $ | 705,518 | $ | — | $ | — | $ | — | $ | 705,518 | $ | 705,518 | ||||||||||||||||
| Average interest rate |
2.16 | % | ||||||||||||||||||||||||||||||
| Operating leases |
$ | 19,290 | $ | 14,887 | $ | 10,504 | $ | 6,158 | $ | 3,140 | $ | 9,773 | $ | 63,752 | ||||||||||||||||||
Impact of Foreign Currency Rate Changes. We currently have operations outside the U.S., and we bill those customers primarily in their local currency, which is subject to foreign currency rate changes. Our operations in Canada are billed in the Canadian dollar and operations in the U.K. are billed in Pound Sterling. We are exposed to foreign exchange rate fluctuations as the financial results of our non-U.S. operations are translated into U.S. dollars. The impact of foreign currency rate changes has historically been insignificant with our Canadian operations, but we have more exposure to volatility with our U.K. operations. In order to help minimize our exchange rate gain and loss volatility, we finance our U.K. entities through our revolving lines of credit, which allows us, at our option, to borrow funds locally in Pound Sterling denominated debt.
52
Table of Contents
| ITEM 8. | FINANCIAL STATEMENTS AND SUPPLEMENTARY DATA. |
INDEX TO CONSOLIDATED FINANCIAL STATEMENTS AND SCHEDULE
53
Table of Contents
Report of Independent Registered Public Accounting Firm
The Board of Directors and Stockholders
Mobile Mini, Inc.
We have audited the accompanying consolidated balance sheets of Mobile Mini, Inc. and subsidiaries (the Company) as of December 31, 2014 and 2013, and the related consolidated statements of income, comprehensive income, stockholders’ equity, and cash flows for the years then ended. These consolidated financial statements are the responsibility of the Company’s management. Our responsibility is to express an opinion on these consolidated financial statements based on our audits.
We conducted our audits in accordance with the auditing standards of the Public Company Accounting Oversight Board (United States). Those standards require that we plan and perform the audit to obtain reasonable assurance about whether the financial statements are free of material misstatement. An audit includes examining, on a test basis, evidence supporting the amounts and disclosures in the financial statements, assessing the accounting principles used and significant estimates made by management, as well as evaluating the overall financial statement presentation. We believe that our audit provides a reasonable basis for our opinion.
In our opinion, the consolidated financial statements referred to above present fairly, in all material respects, the financial position of Mobile Mini, Inc. as of December 31, 2014 and 2013 and the results of their operations and their cash flows for the years then ended, in conformity with U.S. generally accepted accounting principles.
We also have audited, in accordance with the standards of the Public Company Accounting Oversight Board (United States), the Company’s internal control over financial reporting as of December 31, 2014, based on criteria established in Internal Control-Integrated Framework (1992) issued by the Committee of Sponsoring Organizations of the Treadway Commission and our report dated February 27, 2015 expressed an unqualified opinion on the effectiveness of the Company’s internal control over financial reporting.
/s/ KPMG LLP
Phoenix, Arizona
February 27, 2015
54
Table of Contents
Report of Independent Registered Public Accounting Firm
The Board of Directors and Stockholders of Mobile Mini, Inc.
We have audited the accompanying consolidated statements of income, comprehensive income, stockholders’ equity, and cash flows of Mobile Mini, Inc. (Mobile Mini, Inc. or the Company) for the year ended December 31, 2012. These financial statements are the responsibility of the Company’s management. Our responsibility is to express an opinion on these financial statements based on our audit.
We conducted our audit in accordance with the standards of the Public Company Accounting Oversight Board (United States). Those standards require that we plan and perform the audit to obtain reasonable assurance about whether the financial statements are free of material misstatement. An audit includes examining, on a test basis, evidence supporting the amounts and disclosures in the financial statements. An audit also includes assessing the accounting principles used and significant estimates made by management, as well as evaluating the overall financial statement presentation. We believe that our audit provides a reasonable basis for our opinion.
In our opinion, the financial statements referred to above present fairly, in all material respects, the consolidated results of Mobile Mini, Inc.’s operations and its cash flows for the year ended December 31, 2012, in conformity with U.S. generally accepted accounting principles.
/s/ Ernst & Young LLP
Phoenix, Arizona
March 1, 2013, except for Note 17 (Discontinued Operation), as to which the date is February 14, 2014
55
Table of Contents
MOBILE MINI, INC.
(In thousands except par value data)
| December 31, | ||||||||
| 2013 | 2014 | |||||||
| ASSETS | ||||||||
| Cash and cash equivalents |
$ | 1,256 | $ | 3,739 | ||||
| Receivables, net of allowance for doubtful accounts of $2,093 and $2,442 at December 31, 2013 and December 31, 2014, respectively |
53,104 | 81,031 | ||||||
| Inventories |
18,744 | 16,736 | ||||||
| Lease fleet, net |
979,276 | 1,087,056 | ||||||
| Property, plant and equipment, net |
85,153 | 113,175 | ||||||
| Assets held for sale |
980 | — | ||||||
| Deposits and prepaid expenses |
6,116 | 8,586 | ||||||
| Deferred financing costs, net and other assets |
10,977 | 8,858 | ||||||
| Intangibles, net |
2,546 | 78,385 | ||||||
| Goodwill |
519,222 | 705,608 | ||||||
|
|
|
|
|
|||||
| Total assets |
$ | 1,677,374 | $ | 2,103,174 | ||||
|
|
|
|
|
|||||
| LIABILITIES AND STOCKHOLDERS’ EQUITY | ||||||||
| Liabilities: |
||||||||
| Accounts payable |
$ | 18,862 | $ | 22,933 | ||||
| Accrued liabilities |
65,308 | 63,727 | ||||||
| Lines of credit |
319,314 | 705,518 | ||||||
| Obligations under capital leases |
8,781 | 24,918 | ||||||
| Senior Notes |
200,000 | 200,000 | ||||||
| Deferred income taxes |
209,565 | 231,547 | ||||||
|
|
|
|
|
|||||
| Total liabilities |
821,830 | 1,248,643 | ||||||
|
|
|
|
|
|||||
| Commitments and contingencies |
||||||||
| Stockholders’ equity: |
||||||||
| Preferred stock $.01 par value, 20,000 shares authorized, none issued |
— | — | ||||||
| Common stock: $.01 par value, 95,000 shares authorized 48,810 issued and 46,626 outstanding at December 31, 2013 and 49,015 issued and 46,157 outstanding at December 31, 2014 |
488 | 490 | ||||||
| Additional paid-in capital |
550,387 | 569,083 | ||||||
| Retained earnings |
359,778 | 380,504 | ||||||
| Accumulated other comprehensive loss |
(15,440 | ) | (29,870 | ) | ||||
| Treasury stock, at cost, 2,184 and 2,858 shares at December 31, 2013 and 2014, respectively |
(39,669 | ) | (65,676 | ) | ||||
|
|
|
|
|
|||||
| Total stockholders’ equity |
855,544 | 854,531 | ||||||
|
|
|
|
|
|||||
| Total liabilities and stockholders’ equity |
$ | 1,677,374 | $ | 2,103,174 | ||||
|
|
|
|
|
|||||
See accompanying notes.
56
Table of Contents
MOBILE MINI, INC.
CONSOLIDATED STATEMENTS OF INCOME
(In thousands except per share data)
| For the Years Ended December 31, | ||||||||||||
| 2012 | 2013 | 2014 | ||||||||||
| Revenues: |
||||||||||||
| Leasing |
$ | 339,975 | $ | 366,286 | $ | 410,362 | ||||||
| Sales |
37,759 | 38,051 | 31,585 | |||||||||
| Other |
2,162 | 2,149 | 3,527 | |||||||||
|
|
|
|
|
|
|
|||||||
| Total revenues |
379,896 | 406,486 | 445,474 | |||||||||
|
|
|
|
|
|
|
|||||||
| Costs and expenses: |
||||||||||||
| Cost of sales |
23,178 | 25,413 | 21,944 | |||||||||
| Leasing, selling and general expenses |
218,709 | 237,567 | 280,948 | |||||||||
| Restructuring expenses |
7,123 | 2,402 | 3,542 | |||||||||
| Asset impairment charge, net |
— | 38,705 | 557 | |||||||||
| Depreciation and amortization |
35,982 | 35,432 | 39,334 | |||||||||
|
|
|
|
|
|
|
|||||||
| Total costs and expenses |
284,992 | 339,519 | 346,325 | |||||||||
|
|
|
|
|
|
|
|||||||
| Income from operations |
94,904 | 66,967 | 99,149 | |||||||||
| Other income (expense): |
||||||||||||
| Interest income |
1 | 1 | — | |||||||||
| Interest expense |
(37,268 | ) | (29,467 | ) | (28,729 | ) | ||||||
| Debt restructuring/extinguishment expense |
(2,812 | ) | — | — | ||||||||
| Deferred financing costs write-off |
(1,889 | ) | — | — | ||||||||
| Foreign currency exchange |
(4 | ) | (2 | ) | (1 | ) | ||||||
|
|
|
|
|
|
|
|||||||
| Income from continuing operations before income tax provision |
52,932 | 37,499 | 70,419 | |||||||||
| Income tax provision |
18,509 | 12,275 | 26,033 | |||||||||
|
|
|
|
|
|
|
|||||||
| Income from continuing operations |
34,423 | 25,224 | 44,386 | |||||||||
| Loss from discontinued operation, net of tax |
(245 | ) | (1,302 | ) | — | |||||||
|
|
|
|
|
|
|
|||||||
| Net income |
$ | 34,178 | $ | 23,922 | $ | 44,386 | ||||||
|
|
|
|
|
|
|
|||||||
| Earnings per Share: |
||||||||||||
| Basic |
||||||||||||
| Income from continuing operations |
$ | 0.77 | $ | 0.55 | $ | 0.96 | ||||||
| Loss from discontinued operation |
— | (0.02 | ) | — | ||||||||
|
|
|
|
|
|
|
|||||||
| Net income |
$ | 0.77 | $ | 0.53 | $ | 0.96 | ||||||
|
|
|
|
|
|
|
|||||||
| Diluted |
||||||||||||
| Income from continuing operations |
$ | 0.76 | $ | 0.55 | $ | 0.95 | ||||||
| Loss from discontinued operation |
— | (0.03 | ) | — | ||||||||
|
|
|
|
|
|
|
|||||||
| Net income |
$ | 0.76 | $ | 0.52 | $ | 0.95 | ||||||
|
|
|
|
|
|
|
|||||||
| Weighted average number of common and common share equivalents outstanding: |
||||||||||||
| Basic |
44,657 | 45,481 | 46,026 | |||||||||
| Diluted |
45,102 | 46,096 | 46,725 | |||||||||
| Cash dividends declared per share |
$ | — | $ | — | $ | 0.68 | ||||||
See accompanying notes.
57
Table of Contents
MOBILE MINI, INC.
CONSOLIDATED STATEMENTS OF COMPREHENSIVE INCOME
(In thousands)
| For the Years Ended December 31, | ||||||||||||
| 2012 | 2013 | 2014 | ||||||||||
| Net income |
$ | 34,178 | $ | 23,922 | $ | 44,386 | ||||||
| Other comprehensive income (loss): |
||||||||||||
| Foreign currency translation adjustment, net of income tax expense (benefit) of $64, ($194) and ($213) in 2012, 2013, 2014, respectively |
7,987 | 2,377 | (14,430 | ) | ||||||||
|
|
|
|
|
|
|
|||||||
| Other comprehensive income (loss) |
7,987 | 2,377 | (14,430 | ) | ||||||||
|
|
|
|
|
|
|
|||||||
| Comprehensive income |
$ | 42,165 | $ | 26,299 | $ | 29,956 | ||||||
|
|
|
|
|
|
|
|||||||
See accompanying notes.
58
Table of Contents
MOBILE MINI, INC.
CONSOLIDATED STATEMENTS OF STOCKHOLDERS’ EQUITY
For the years ended December 31, 2012, 2013 and 2014
(In thousands)
| Additional Paid-In Capital |
Retained Earnings |
Accumulated Other Comprehensive Income (Loss) |
Total Stockholders’ Equity |
|||||||||||||||||||||||||||||
| Common Stock | Treasury Stock | |||||||||||||||||||||||||||||||
| Shares | Amount | Shares | Amount | |||||||||||||||||||||||||||||
| Balance at January 1, 2012 |
45,612 | $ | 478 | $ | 508,936 | $ | 309,604 | $ | (25,804 | ) | 2,175 | $ | (39,300 | ) | $ | 753,914 | ||||||||||||||||
| Net income |
— | — | — | 34,178 | — | — | — | 34,178 | ||||||||||||||||||||||||
| Other comprehensive income |
— | — | — | — | 7,987 | — | — | 7,987 | ||||||||||||||||||||||||
| Exercise of stock options |
309 | 3 | 3,642 | — | — | — | — | 3,645 | ||||||||||||||||||||||||
| Tax shortfall on equity award transactions |
— | — | (3 | ) | — | — | — | — | (3 | ) | ||||||||||||||||||||||
| Restricted stock grants, net |
115 | 1 | (1 | ) | — | — | — | — | — | |||||||||||||||||||||||
| Share-based compensation |
— | — | 9,798 | — | — | — | — | 9,798 | ||||||||||||||||||||||||
|
|
|
|
|
|
|
|
|
|
|
|
|
|
|
|
|
|||||||||||||||||
| Balance at December 31, 2012 |
46,036 | 482 | 522,372 | 343,782 | (17,817 | ) | 2,175 | (39,300 | ) | 809,519 | ||||||||||||||||||||||
| Net income |
— | — | — | 23,922 | — | — | — | 23,922 | ||||||||||||||||||||||||
| Common stock dividends declared |
— | — | — | (7,926 | ) | — | — | — | (7,926 | ) | ||||||||||||||||||||||
| Other comprehensive income |
— | — | — | — | 2,377 | — | — | 2,377 | ||||||||||||||||||||||||
| Exercise of stock options |
647 | 6 | 13,812 | — | — | — | — | 13,818 | ||||||||||||||||||||||||
| Tax shortfall on equity award transactions |
— | — | (837 | ) | — | — | — | — | (837 | ) | ||||||||||||||||||||||
| Purchase of treasury stock |
(9 | ) | — | — | — | — | 9 | (369 | ) | (369 | ) | |||||||||||||||||||||
| Restricted stock grants, net |
(48 | ) | — | — | — | — | — | — | — | |||||||||||||||||||||||
| Share-based compensation |
— | — | 15,040 | — | — | — | — | 15,040 | ||||||||||||||||||||||||
|
|
|
|
|
|
|
|
|
|
|
|
|
|
|
|
|
|||||||||||||||||
| Balance at December 31, 2013 |
46,626 | 488 | 550,387 | 359,778 | (15,440 | ) | 2,184 | (39,669 | ) | 855,544 | ||||||||||||||||||||||
| Net income |
— | — | — | 44,386 | — | — | — | 44,386 | ||||||||||||||||||||||||
| Common stock dividends declared |
— | — | — | (23,660 | ) | — | — | — | (23,660 | ) | ||||||||||||||||||||||
| Other comprehensive income |
— | — | — | — | (14,430 | ) | — | — | (14,430 | ) | ||||||||||||||||||||||
| Exercise of stock options |
164 | 2 | 3,640 | — | — | — | — | 3,642 | ||||||||||||||||||||||||
| Tax shortfall on equity award transactions |
— | — | (15 | ) | — | — | — | — | (15 | ) | ||||||||||||||||||||||
| Purchase of treasury stock |
(674 | ) | — | — | — | — | 674 | (26,007 | ) | (26,007 | ) | |||||||||||||||||||||
| Restricted stock grants, net |
41 | — | — | — | — | — | — | — | ||||||||||||||||||||||||
| Share-based compensation |
— | — | 15,071 | — | — | — | — | 15,071 | ||||||||||||||||||||||||
|
|
|
|
|
|
|
|
|
|
|
|
|
|
|
|
|
|||||||||||||||||
| Balance at December 31, 2014 |
46,157 | $ | 490 | $ | 569,083 | $ | 380,504 | $ | (29,870 | ) | 2,858 | $ | (65,676 | ) | $ | 854,531 | ||||||||||||||||
|
|
|
|
|
|
|
|
|
|
|
|
|
|
|
|
|
|||||||||||||||||
See accompanying notes.
59
Table of Contents
MOBILE MINI, INC.
CONSOLIDATED STATEMENTS OF CASH FLOWS
(In thousands)
| For the Years Ended December 31, | ||||||||||||
| 2012 | 2013 | 2014 | ||||||||||
| Cash Flows from Operating Activities: |
||||||||||||
| Net income |
$ | 34,178 | $ | 23,922 | $ | 44,386 | ||||||
| Adjustments to reconcile net income to net cash provided by operating activities: |
||||||||||||
| Debt restructuring expense |
2,812 | — | — | |||||||||
| Deferred financing costs write-off |
1,889 | — | — | |||||||||
| Asset impairment charge, net |
— | 38,217 | 557 | |||||||||
| Provision for doubtful accounts |
2,179 | 2,160 | 2,778 | |||||||||
| Amortization of deferred financing costs |
3,217 | 2,811 | 2,829 | |||||||||
| Amortization of debt issuance discount |
49 | — | — | |||||||||
| Amortization of long-term liabilities |
167 | 169 | 88 | |||||||||
| Share-based compensation expense |
9,575 | 14,714 | 15,071 | |||||||||
| Depreciation and amortization |
36,187 | 35,626 | 39,334 | |||||||||
| Loss on disposal of discontinued operation |
— | 1,948 | — | |||||||||
| Gain on sale of lease fleet units |
(11,781 | ) | (9,682 | ) | (5,732 | ) | ||||||
| (Gain) loss on disposal of property, plant and equipment |
(130 | ) | 247 | 348 | ||||||||
| Deferred income taxes |
18,107 | 11,012 | 25,424 | |||||||||
| Tax shortfall on equity award transactions |
(3 | ) | (837 | ) | (15 | ) | ||||||
| Foreign currency loss |
5 | 1 | 1 | |||||||||
| Changes in certain assets and liabilities, net of effect of businesses acquired: |
||||||||||||
| Receivables |
(5,078 | ) | (3,640 | ) | (7,197 | ) | ||||||
| Inventories |
1,352 | (393 | ) | 2,680 | ||||||||
| Deposits and prepaid expenses |
537 | 653 | (1,416 | ) | ||||||||
| Other assets and intangibles |
(161 | ) | 10 | 17 | ||||||||
| Accounts payable |
(1,884 | ) | 337 | (723 | ) | |||||||
| Accrued liabilities |
(268 | ) | (1,164 | ) | 2,195 | |||||||
|
|
|
|
|
|
|
|||||||
| Net cash provided by operating activities |
90,949 | 116,111 | 120,625 | |||||||||
|
|
|
|
|
|
|
|||||||
| Cash Flows from Investing Activities: |
||||||||||||
| Proceeds from sale of discontinued operation |
— | 677 | — | |||||||||
| Cash paid for businesses acquired, net of cash acquired |
(3,563 | ) | — | (430,946 | ) | |||||||
| Additions to lease fleet, excluding acquisitions |
(43,934 | ) | (28,826 | ) | (27,279 | ) | ||||||
| Proceeds from sale of lease fleet units |
29,358 | 35,951 | 23,053 | |||||||||
| Additions to property, plant and equipment, excluding acquisitions |
(12,741 | ) | (15,792 | ) | (15,779 | ) | ||||||
| Proceeds from sale of property, plant and equipment |
1,497 | 1,970 | 4,199 | |||||||||
|
|
|
|
|
|
|
|||||||
| Net cash used in investing activities |
(29,383 | ) | (6,020 | ) | (446,752 | ) | ||||||
|
|
|
|
|
|
|
|||||||
| Cash Flows from Financing Activities: |
||||||||||||
| Net borrowings (repayments) under lines of credit |
97,242 | (123,076 | ) | 386,204 | ||||||||
| Redemption of 6.875% senior notes due 2015 |
(150,000 | ) | — | — | ||||||||
| Redemption premiums of 6.875% senior notes due 2015 |
(2,579 | ) | — | — | ||||||||
| Deferred financing costs |
(8,075 | ) | — | (719 | ) | |||||||
| Proceeds from issuance of note payable |
398 | — | — | |||||||||
| Principal payments on notes payable |
(403 | ) | (310 | ) | — | |||||||
| Principal payments on capital lease obligations |
(947 | ) | (408 | ) | (1,956 | ) | ||||||
| Issuance of common stock |
3,645 | 13,818 | 3,642 | |||||||||
| Dividend payments |
— | — | (31,384 | ) | ||||||||
| Purchase of treasury stock |
— | (369 | ) | (26,007 | ) | |||||||
|
|
|
|
|
|
|
|||||||
| Net cash (used in) provided by financing activities |
(60,719 | ) | (110,345 | ) | 329,780 | |||||||
|
|
|
|
|
|
|
|||||||
| Effect of exchange rate changes on cash |
(1,770 | ) | (427 | ) | (1,170 | ) | ||||||
|
|
|
|
|
|
|
|||||||
| Net (decrease) increase in cash |
(923 | ) | (681 | ) | 2,483 | |||||||
| Cash and cash equivalents at beginning of year |
2,860 | 1,937 | 1,256 | |||||||||
|
|
|
|
|
|
|
|||||||
| Cash and cash equivalents at end of year |
$ | 1,937 | $ | 1,256 | $ | 3,739 | ||||||
|
|
|
|
|
|
|
|||||||
| Supplemental Disclosure of Cash Flow Information: |
||||||||||||
| Cash paid during the year for interest |
$ | 35,145 | $ | 25,947 | $ | 24,559 | ||||||
| Cash paid during the year for income and franchise taxes |
831 | 1,114 | 1,103 | |||||||||
| Equipment acquired through capital lease obligations |
300 | 8,547 | 16,508 | |||||||||
See accompanying notes.
60
Table of Contents
MOBILE MINI, INC.
NOTES TO CONSOLIDATED FINANCIAL STATEMENTS
| (1) | Mobile Mini, Organization and Description of Business |
Mobile Mini, Inc., a Delaware corporation, is a leading provider of portable storage and specialty containment solutions. In these notes, the terms “Mobile Mini” and the “Company” refer to Mobile Mini, Inc. In November 2014, the Company entered into a Stock Purchase Agreement to acquire Gulf Tanks Holdings (“GTH”), Inc., the parent company of Houston, Texas-based Evergreen Tank Solutions (“ETS”). The transaction, referred to as the “ETS Acquisition,” closed on December 10, 2014. See additional information regarding the acquisition in Note 3.
At December 31, 2014, Mobile Mini has a fleet of portable storage and office units operating throughout the U.S., Canada and the U.K. The Company has a diversified customer base for the portable storage and office products, including large and small retailers, construction companies, medical centers, schools, utilities, distributors, the military, hotels, restaurants, entertainment complexes and households. These customers use the products for a wide variety of applications, including the storage of retail and manufacturing inventory, construction materials and equipment, documents and records and other goods. The ETS Acquisition resulted in a fleet of specialty containment products, including liquid and solid containment units, serving a specialty sector in the industry. Specialty products are leased primarily to chemical, refinery, oil and natural gas drilling, mining and environmental service customers.
Basis of Presentation and Consolidation
The consolidated financial statements include the accounts of Mobile Mini and its wholly owned subsidiaries. The Company does not have any subsidiaries in which it does not own 100% of the outstanding stock. All significant intercompany balances and transactions have been eliminated.
Use of Estimates
The preparation of financial statements in conformity with U.S. generally accepted accounting principles (“GAAP”) requires management to make estimates and assumptions that affect the amounts reported in the accompanying consolidated financial statements and the notes to those statements. Actual results could differ from those estimates. The most significant estimates included within the financial statements are the allowance for doubtful accounts, the estimated useful lives and residual values on the lease fleet, rental equipment and property, plant and equipment, goodwill and other asset impairments and certain accrued liabilities.
Discontinued Operation
In December 2013, the Company sold the subsidiary comprising its Netherlands operation. The Netherlands operation is reflected as discontinued operation for all periods presented. See Note 17.
| (2) | Summary of Significant Accounting Policies |
Cash Equivalents
The Company considers all highly liquid instruments with insignificant interest rate risk and with maturities of three months or less at purchase to be cash equivalents.
Receivables and Allowance for Doubtful Accounts
Receivables are stated net of an allowance for doubtful accounts, which is reviewed monthly for adequacy. The Company estimates the amount of customer receivables that are uncollectible and records an estimated provision for bad debts through a charge to operations. The provision is based on historical collection experience
61
Table of Contents
MOBILE MINI, INC.
NOTES TO CONSOLIDATED FINANCIAL STATEMENTS — (Continued)
and evaluation of past-due accounts. Specific accounts are written off against the allowance when management determines the account is uncollectible. The Company requires a security deposit on most leased office units to cover the cost of damages or unpaid balances, if any.
The information presented in the table below reflects the continuing operations of the Company for the periods presented.
| For the Years Ended December 31, | ||||||||||||
| 2012 | 2013 | 2014 | ||||||||||
| (In thousands) | ||||||||||||
| Allowance for doubtful accounts |
||||||||||||
| Balance at beginning of year |
$ | 2,509 | $ | 2,666 | $ | 2,093 | ||||||
| Provision charged to expense |
2,193 | 2,151 | 2,778 | |||||||||
| Write-offs |
(2,036 | ) | (2,724 | ) | (2,429 | ) | ||||||
|
|
|
|
|
|
|
|||||||
| Balance at end of year |
$ | 2,666 | $ | 2,093 | $ | 2,442 | ||||||
|
|
|
|
|
|
|
|||||||
Concentration of Credit Risk
Financial instruments which potentially expose the Company to concentrations of credit risk consist primarily of receivables. Concentration of credit risk with respect to receivables is limited due to the Company’s large number of customers spread over a broad geographic area in many industry sectors. No single customer accounts for more than 10.0% of our receivables at December 31, 2013 and 2014. Receivables related to sold units are generally secured by the product sold to the customer. The Company typically has the right to repossess leased portable storage units, including any customer goods contained in the unit, following non-payment of rent.
Inventories
Inventories are valued at the lower of cost (principally on a standard cost basis which approximates the first-in, first-out (FIFO) method) or market. Market is the lower of replacement cost or net realizable value.
Raw materials principally consist of raw steel, wood, glass, paint, vinyl and other assembly components used in manufacturing and remanufacturing processes, and to a lesser extent, parts used for internal maintenance and ancillary items held for sale in our specialty containment segment. Work-in-process primarily represents partially assembled units pre-sold or for use as fleet. Finished portable storage units primarily represent purchased or assembled containers held in inventory until the container is either sold as is, remanufactured and sold, or remanufactured and deployed as lease fleet.
Inventories at December 31 consisted of the following:
| 2013 | 2014 | |||||||
| (In thousands) | ||||||||
| Raw materials and supplies |
$ | 16,586 | $ | 14,241 | ||||
| Work-in-process |
197 | 201 | ||||||
| Finished portable storage units |
1,961 | 2,294 | ||||||
|
|
|
|
|
|||||
| Inventories |
$ | 18,744 | $ | 16,736 | ||||
|
|
|
|
|
|||||
62
Table of Contents
MOBILE MINI, INC.
NOTES TO CONSOLIDATED FINANCIAL STATEMENTS — (Continued)
Lease fleet
Lease fleet is capitalized at cost and depreciated over the estimated useful life of the unit using the straight-line method. Lease fleet is depreciated whether or not it is out on rent. Capitalized cost of lease fleet includes the price paid to acquire the unit and freight charges to the location when the unit is first placed in service, and when applicable, the cost of manufacturing or remanufacturing, which includes the cost of customizing units. Ordinary repair and maintenance costs are charged to operations as incurred.
Management periodically reviews depreciable lives and residual values against various factors, including the results of its lenders’ independent appraisal of lease fleet, practices of the competitors in comparable industries, profit margins achieved on sales of depreciated units and lease rates obtained on older units.
Property, Plant and Equipment
Property, plant and equipment are stated at cost, net of accumulated depreciation. Depreciation is provided using the straight-line method over the assets’ estimated useful lives. The Company’s depreciation expense related to property, plant and equipment for 2012, 2013 and 2014 was $12.2 million, $12.7 million and $15.1 million, respectively. Normal repairs and maintenance to property, plant and equipment are expensed as incurred. When property or equipment is retired or sold, the net book value of the asset, reduced by any proceeds, is charged to gain or loss on the disposal of property, plant and equipment and is included in leasing, selling and general expenses in the Consolidated Statements of Income.
Property, plant and equipment at December 31 consisted of the following:
| Residual Value as Percentage of Original Cost |
Useful Life in Years |
2013 | 2014 | |||||||||||||
| (In thousands) | ||||||||||||||||
| Land |
$ | 11,124 | $ | 10,920 | ||||||||||||
| Vehicles and machinery |
0 - 55 | % | 5 to 30 | 88,686 | 114,150 | |||||||||||
| Buildings and improvements(1) |
0 - 25 | 3 - 30 | 18,477 | 19,365 | ||||||||||||
| Office fixtures and equipment |
0 | 3 to 5 | 33,017 | 33,942 | ||||||||||||
|
|
|
|
|
|||||||||||||
| Property, plant and equipment |
151,304 | 178,377 | ||||||||||||||
| Accumulated depreciation |
(66,151 | ) | (65,202 | ) | ||||||||||||
|
|
|
|
|
|||||||||||||
| Property, plant and equipment, net |
$ | 85,153 | $ | 113,175 | ||||||||||||
|
|
|
|
|
|||||||||||||
| (1) | Improvements made to leased properties are depreciated over the lesser of the estimated useful life or the remaining term of the respective lease. |
Capitalized Software Development Costs
The Company capitalizes qualifying computer software costs incurred during the application development state for internally developed software. Additionally, the Company capitalizes qualifying costs incurred for upgrades and enhancements to existing software that result in additional functionality. Costs related to preliminary project planning activities, post-implementation activities, maintenance and minor modifications are expensed as incurred. Internal-use software is amortized on a straight line basis over its estimated useful life. Capitalized software development costs are included in property, plant and equipment. In 2013 and 2014 the Company capitalized $0.9 million and $2.2 million, respectively.
63
Table of Contents
MOBILE MINI, INC.
NOTES TO CONSOLIDATED FINANCIAL STATEMENTS — (Continued)
Deferred Financing Costs
Deferred financing costs consists of the costs of obtaining long-term financing, including the Company’s credit agreement (See Note 5). These costs are amortized over the term of the related debt, using the straight-line method, which approximates the effective interest method. Amortization expense for deferred financing costs was approximately $3.2 million, $2.8 million and $2.8 million in 2012, 2013 and 2014, respectively. In addition, in 2012, the Company wrote off $1.9 million of deferred financing costs related to the redemption of our 6.875% senior notes due 2015 and a portion of deferred financing costs related to our prior credit agreement. As of December 31, 2014, $5.7 million of the total $8.7 million unamortized deferred financing costs, related to the Company’s credit agreement. The annual amortization of remaining deferred financing costs is expected to be as follows:
| 2015 |
$ | 3,134 | ||
| 2016 |
3,134 | |||
| 2017 |
937 | |||
| 2018 |
498 | |||
| 2019 |
498 | |||
| Thereafter |
456 | |||
|
|
|
|||
| Total |
$ | 8,657 | ||
|
|
|
Goodwill
For acquired businesses, the Company records assets acquired and liabilities assumed at their estimated fair values on the respective acquisition dates. Based on these values, the excess purchase prices over the fair value of the net assets acquired is recorded as goodwill. Immediately prior to December 10, 2014, all of the Company’s goodwill was allocated between two reporting units, portable storage operations in North America and the U.K. In conjunction with the ETS Acquisition on December 10, 2014 the Company recorded $182.0 million of goodwill. Of the $705.6 million total goodwill at December 31, 2014, $459.2 million relates to the portable storage North America segment, $64.4 million relates to the portable storage U.K. segment and $182.0 million relates to the specialty containment segment.
Management assesses the impairment of goodwill on an annual basis at December 31, or whenever events or changes in circumstances indicate that the carrying value may not be recoverable.
Some factors management considers important which could indicate an impairment review include the following:
| • | significant under-performance relative to historical, expected or projected future operating results; |
| • | significant changes in the manner of the Company’s use of the acquired assets or the strategy for the overall business; |
| • | market capitalization relative to net book value; and |
| • | significant negative industry or general economic trends. |
In assessing the fair value of the reporting units, management considers both the market approach and the income approach. Under the market approach, the fair value of the reporting unit is based on quoted market prices of companies comparable to the reporting unit being valued. Under the income approach, the fair value of the reporting unit is based on the present value of estimated cash flows. The income approach is dependent on a
64
Table of Contents
MOBILE MINI, INC.
NOTES TO CONSOLIDATED FINANCIAL STATEMENTS — (Continued)
number of significant management assumptions, including estimated future revenue growth rates, gross margins on sales, operating margins, capital expenditures, tax payments and discount rates. Each approach is given equal weight in arriving at the fair value of the reporting unit. As of December 31, 2014, management assessed qualitative factors and determined it is more likely than not each of the reporting units assigned goodwill had estimated fair values greater than the respective reporting unit’s individual net asset carrying values; therefore, the two step impairment test was not required.
If the two step impairment test is necessary, management is required to determine the implied fair value of the goodwill and compare it to the carrying value of the goodwill. The fair value of the reporting units would be assigned to the respective assets and liabilities of each reporting unit as if the reporting units had been acquired in separate and individual business combinations and the fair value of the reporting units was the price paid to acquire the reporting units. The excess of the fair value of the reporting units over the amounts assigned to their respective assets and liabilities is the implied fair value of goodwill.
The following table shows the activity and balances related to goodwill from January 1, 2013 to December 31, 2014:
| (In thousands) | ||||
| Balance at January 1, 2013(1) |
$ | 518,308 | ||
| Foreign currency(2) |
921 | |||
| Adjustments |
(7 | ) | ||
|
|
|
|||
| Balance at December 31, 2013(1) |
519,222 | |||
| ETS Acquisition |
181,972 | |||
| Other acquisitions |
8,840 | |||
| Foreign currency(2) |
(4,426 | ) | ||
|
|
|
|||
| Balance at December 31, 2014(1) |
$ | 705,608 | ||
|
|
|
|||
| (1) | Includes accumulated amortization of $2.0 million and accumulated impairment of $12.5 million. |
| (2) | Represents foreign currency translation adjustments related to the U.K. reporting unit. |
Intangibles
Intangible assets are amortized over the estimated useful life of the asset utilizing a method which reflects the estimated pattern in which the economic benefits will be consumed. Customer relationships, trade names and trademarks are amortized using an accelerated method while other intangibles are amortized using the straight-line method.
The following table reflects balances related to intangible assets for the years ended December 31:
| 2013 | 2014 | |||||||||||||||||||||||||||
| Estimated Useful Life |
Gross Carrying Amount |
Accumulated Amortization |
Net Carrying Amount |
Gross Carrying Amount |
Accumulated Amortization |
Net Carrying Amount |
||||||||||||||||||||||
| (In thousands) | ||||||||||||||||||||||||||||
| Customer relationships |
11 - 20 | $ | 21,988 | $ | (19,530 | ) | $ | 2,458 | $ | 91,990 | $ | (20,484 | ) | $ | 71,506 | |||||||||||||
| Trade names/trademarks |
1 - 5 | 917 | (917 | ) | — | 6,065 | (919 | ) | 5,146 | |||||||||||||||||||
| Non-compete agreements |
2 - 5 | 97 | (53 | ) | 44 | 1,772 | (78 | ) | 1,694 | |||||||||||||||||||
| Other |
1 - 19 | 61 | (17 | ) | 44 | 61 | (22 | ) | 39 | |||||||||||||||||||
|
|
|
|
|
|
|
|
|
|
|
|
|
|||||||||||||||||
| Total |
$ | 23,063 | $ | (20,517 | ) | $ | 2,546 | $ | 99,888 | $ | (21,503 | ) | $ | 78,385 | ||||||||||||||
|
|
|
|
|
|
|
|
|
|
|
|
|
|||||||||||||||||
65
Table of Contents
MOBILE MINI, INC.
NOTES TO CONSOLIDATED FINANCIAL STATEMENTS — (Continued)
Amortization expense for amortizable intangibles was approximately $2.2 million, $1.6 million and $1.6 million in 2012, 2013 and 2014, respectively. See information regarding intangibles acquired in conjunction with company acquisitions in Note 3. Based on the carrying value at December 31, 2014, future amortization of intangible assets is expected to be as follows for the years ended December 31 (in thousands):
| 2015 |
$ | 5,876 | ||
| 2016 |
5,940 | |||
| 2017 |
5,911 | |||
| 2018 |
5,961 | |||
| 2019 |
6,001 | |||
| Thereafter |
48,696 | |||
|
|
|
|||
| Total |
$ | 78,385 | ||
|
|
|
Impairment of Long-Lived Assets (Other than Goodwill)
Mobile Mini reviews long-lived assets such as lease fleet, property, plant and equipment, and intangibles, for impairment whenever events or changes in circumstances indicate the carrying amount of such assets may be impaired. (See potential impairment indicators under “Goodwill” above). If this review indicates the carrying value of these assets will not be recoverable, as measured based on estimated undiscounted cash flows over their remaining life, the carrying amount would be adjusted to fair value. The cash flow estimates contain management’s best estimates, using appropriate and customary assumptions and projections at the time of evaluation.
In the second quarter of 2013, management conducted an assessment of the lease fleet and determined that certain of these units were either non-core to their leasing strategy or were uneconomic to repair. In connection with this evaluation, management determined to place the assets for sale, resulting in a non-cash impairment charge on long-lived assets of $37.6 million in the second quarter of 2013. As these assets have been sold or otherwise disposed of, additional adjustments have been made to the impairment charge resulting in total asset impairment charges of $38.7 million in 2013 and $0.6 million in 2014. There were no indicators of further impairment at December 31, 2013 or at December 31, 2014. No impairment charges were recognized in 2012. (See Note 16).
Purchase Accounting
Mobile Mini accounts for acquisitions under the acquisition method. Under the acquisition method of accounting, the price paid by the Company is allocated to the assets acquired and liabilities assumed based upon the estimated fair values at the closing date. Goodwill is measured as the excess of the fair value of the consideration transferred over the fair value of the identifiable net assets. Estimated fair values of acquired assets and liabilities is provisional and could change as additional information is received. The Company finalizes valuations as soon as practicable, but not later than one-year from the acquisition date. Any subsequent changes to purchase price allocations results in a corresponding adjustment to goodwill.
The determination of the fair value of intangible assets requires the use of significant judgment with regard to (i) the fair value; and (ii) whether such intangibles are amortizable or non-amortizable and, if amortizable, the period and the method by which the intangible asset will be amortized. Fair values are estimated for acquisition-related intangible assets principally based on projections of cash flows that will arise from identifiable intangible assets of acquired businesses. The projected cash flows are discounted to determine the present value of the assets at the dates of acquisition.
66
Table of Contents
MOBILE MINI, INC.
NOTES TO CONSOLIDATED FINANCIAL STATEMENTS — (Continued)
Revenue Recognition
Leasing revenue is generated from the direct lease of the Company’s fleet to its customers, including ancillary revenue such as fleet delivery and pickup. The Company enters into contracts with its customers to lease equipment based on a monthly rate for our portable storage fleet and a daily, weekly or monthly rate for our specialty containment fleet. Revenues from leasing are recognized ratably over the leased period. When a customer keeps the leased unit beyond the original intended term, the lease continues until cancelled by the customer or the Company. Customers may utilize the Company’s equipment delivery and pick-up services in conjunction with the leasing of equipment, but it is not required. Transportation revenue pursuant to the pick up or delivery of a leased unit is recognized in leasing revenue upon completion of the service. When leases are billed in advance, recognition of revenue is deferred and unearned leasing revenue is recorded at the end of reporting period. If equipment is returned prior to the contractually obligated period, the excess, if any, between the amount the customer is contractually required to pay over the cumulative amount of revenue recognized to date, is recognized as incremental revenue upon return.
Sales revenue is primarily generated by the sale of new and used units. Sales revenue is recognized upon delivery when the risk of loss passes, the price is fixed and determinable and collectability is reasonably assured. The majority of our units are sold pursuant to sales contracts stating the fixed sales price.
Cost of Sales
Cost of sales in the Company’s consolidated statements of income includes the costs for units it sells, and to a lesser extent the costs of parts and supplies sold to specialty containment customers. Similar costs associated with units that the Company leases are capitalized in the balance sheet under “Lease fleet”.
Advertising Costs
All non-direct-response advertising costs are expensed as incurred. Yellow page advertising is capitalized when paid and amortized over the period in which the benefit is derived. At December 31, 2013 and 2014, prepaid advertising costs were approximately $0.2 million and less than $50,000, respectively. The amortization period of the prepaid balance never exceeds 12 months. Advertising expense was $12.3 million, $5.8 million and $5.2 million in 2012, 2013 and 2014, respectively.
Income Taxes
The Company recognizes income taxes in each of the jurisdictions in which it operates. For each jurisdiction, management estimates the actual amount of taxes currently payable or receivable as well as deferred tax assets and liabilities attributable to temporary differences between the financial statement carrying amounts of existing assets and liabilities and their respective tax bases. Deferred income tax assets and liabilities are measured using enacted tax rates expected to apply to taxable income in the years in which these temporary differences are expected to be recovered or settled. The effect on deferred tax assets and liabilities of a change in tax rates is recognized in income in the period that includes the enactment date.
A valuation allowance is provided for those deferred tax assets for which it is more likely than not that the related benefits will not be realized. In determining the amount of the valuation allowance, management considers estimated future taxable income as well as feasible tax planning strategies in each jurisdiction. If it is determined that the Company will not realize all or a portion of its deferred tax assets, the valuation allowance is increased with a charge to income tax expense. Conversely, if it is determined that the Company will ultimately be able to realize all or a portion of the related benefits for which a valuation allowance has been provided, all or a portion of the related valuation allowance will be reduced with a credit to income tax expense.
67
Table of Contents
MOBILE MINI, INC.
NOTES TO CONSOLIDATED FINANCIAL STATEMENTS — (Continued)
Earnings per Share
Basic earnings per share (“EPS”) is calculated by dividing net income by the weighted average number of common shares outstanding during the period. Diluted EPS is calculated under the treasury stock method. Potential common shares included restricted common stock, which is subject to risk of forfeiture, incremental shares of common stock issuable upon the exercise of stock options and vesting of nonvested share-awards.
The following table is a reconciliation of net income and weighted-average shares of common stock outstanding for purposes of calculating basic and diluted EPS for the years ended December 31:
| Twelve Months Ending | ||||||||||||
| 2012 | 2013 | 2014 | ||||||||||
| (In thousands, except per share data) | ||||||||||||
| Numerator: |
||||||||||||
| Income from continuing operations |
$ | 34,423 | $ | 25,224 | $ | 44,386 | ||||||
| Loss on discontinued operation, net of tax |
(245 | ) | (1,302 | ) | — | |||||||
|
|
|
|
|
|
|
|||||||
| Net income |
$ | 34,178 | $ | 23,922 | $ | 44,386 | ||||||
|
|
|
|
|
|
|
|||||||
| Basic EPS Denominator: |
||||||||||||
| Common shares outstanding beginning of year |
44,432 | 45,194 | 46,084 | |||||||||
| Weighted shares issued (repurchased) during the period |
225 | 287 | (58 | ) | ||||||||
|
|
|
|
|
|
|
|||||||
| Total weighted average shares outstanding |
44,657 | 45,481 | 46,026 | |||||||||
|
|
|
|
|
|
|
|||||||
| Diluted EPS Denominator: |
||||||||||||
| Common shares outstanding beginning of year |
44,432 | 45,194 | 46,084 | |||||||||
| Weighted shares issued (repurchased) during the period |
225 | 287 | (58 | ) | ||||||||
| Dilutive effect of stock options and nonvested share awards during the period |
445 | 615 | 699 | |||||||||
|
|
|
|
|
|
|
|||||||
| Total weighted average shares outstanding |
45,102 | 46,096 | 46,725 | |||||||||
|
|
|
|
|
|
|
|||||||
| Earnings per share: |
||||||||||||
| Basic: |
||||||||||||
| Income from continuing operations |
$ | 0.77 | $ | 0.55 | $ | 0.96 | ||||||
| Loss from discontinued operation |
— | (0.02 | ) | — | ||||||||
|
|
|
|
|
|
|
|||||||
| Net income |
$ | 0.77 | $ | 0.53 | $ | 0.96 | ||||||
|
|
|
|
|
|
|
|||||||
| Diluted: |
||||||||||||
| Income from continuing operations |
$ | 0.76 | $ | 0.55 | $ | 0.95 | ||||||
| Loss from discontinued operation |
— | (0.03 | ) | — | ||||||||
|
|
|
|
|
|
|
|||||||
| Net income |
$ | 0.76 | $ | 0.52 | $ | 0.95 | ||||||
|
|
|
|
|
|
|
|||||||
Basic weighted average number of common shares outstanding does not include nonvested share-awards that had not vested of 0.8 million, 0.5 million and 0.3 million shares in 2012, 2013 and 2014, respectively.
68
Table of Contents
MOBILE MINI, INC.
NOTES TO CONSOLIDATED FINANCIAL STATEMENTS — (Continued)
The following table represents the number of stock options and nonvested share-awards that were issued or outstanding but excluded in calculating diluted EPS because their effect would have been anti-dilutive for the years ended December 31:
| Twelve Months Ending | ||||||||||||
| 2012 | 2013 | 2014 | ||||||||||
| (In thousands) | ||||||||||||
| Stock options |
1,006 | 1,741 | 751 | |||||||||
| Nonvested share-awards |
228 | 1 | 465 | |||||||||
|
|
|
|
|
|
|
|||||||
| Total |
1,234 | 1,742 | 1,216 | |||||||||
|
|
|
|
|
|
|
|||||||
Fair Value of Financial Instruments
The Company defines fair value as the price that would be received from selling an asset or paid to transfer a liability in an orderly transaction between market participants. Fair value is a market-based measurement that should be determined based on assumptions that market participants would use in pricing an asset or liability. As a basis for considering such assumptions, the Company adopted the suggested accounting guidance for the three levels of inputs that may be used to measure fair value:
Level 1 — Observable input such as quoted prices in active markets for identical assets or liabilities;
Level 2 — Observable inputs, other than Level 1 inputs in active markets, that are observable either directly or indirectly; and
Level 3 — Unobservable inputs for which there is little or no market data, which require the reporting entity to develop its own assumptions.
The carrying amounts of cash, receivables, accounts payable and accrued liabilities approximate fair values based on their short-term nature. The fair values of the Company’s revolving credit facility and capital leases are estimated using discounted cash flow analyses, based on the Company’s current incremental borrowing rates for similar types of borrowing arrangements. Based on the borrowing rates currently available to the Company for bank loans with similar terms and average maturities, the fair value of the Company’s revolving credit facility debt and capital leases at December 31, 2013 and 2014 approximated their respective book values and are considered Level 2 in the fair value hierarchy.
The fair value of the Company’s $200.0 million aggregate principal amount of 7.875% senior notes due 2020 (the “2020 Notes” or the “Senior Notes”) is based on their latest sales price at the end of each period obtained from a third-party institution and is considered Level 2 in the fair value hierarchy described in Note 2, as there is not an active market for these notes.
The carrying value and the fair value of the Company’s Senior Notes are as follows:
| 2013 | 2014 | |||||||
| (In thousands) | ||||||||
| Carrying value |
$ | 200,000 | $ | 200,000 | ||||
| Fair value |
217,300 | 206,000 | ||||||
At December 31, 2013 and 2014, the Company did not have any financial instruments required to be recorded at fair value on a recurring basis.
69
Table of Contents
MOBILE MINI, INC.
NOTES TO CONSOLIDATED FINANCIAL STATEMENTS — (Continued)
Derivatives
In the normal course of business, the Company’s operations are exposed to fluctuations in interest rates. The Company has in the past, and may again in the future, addressed a portion of these risks through a controlled program of risk management that includes the use of derivative financial instruments. The objective of controlling these risks is to limit the impact of fluctuations in interest rates on earnings. At December 31, 2013 and 2014, the Company did not have any derivative agreements.
Share-Based Compensation
The Company calculates the fair value of stock options using the Black-Scholes-Merton option pricing valuation model, which incorporates various assumptions including volatility, expected life and risk-free interest rates. The fair value of nonvested share-awards is estimated as the closing price of our common stock on the date of grant. Compensation related to service-based awards are recognized on a straight-line basis over the vesting period. Compensation expense related to performance-based awards is recognized over the implicit service period of the award based on management’s estimate of the probability of the performance criteria being satisfied, adjusted at each balance sheet date. Expense related to performance-based awards that have multiple vesting dates, is recognized using the accelerated attribution approach, whereby each vesting tranche is treated as a separate award for purposes of determining the implicit service period. Share based compensation expense is reduced for estimated forfeitures which are estimated at the time of grant based on historical experience, and revised in subsequent periods if actual forfeitures differ from estimates.
Foreign Currency Translation and Transactions
For Mobile Mini’s non-U.S. operations, the local currency is the functional currency. All assets and liabilities are translated into U.S. dollars at period-end exchange rates and all income statement amounts are translated at the average exchange rate for each month within the year.
Impact of Recently Issued Accounting Standards
Presentation of an Unrecognized Tax Benefit When a Net Operating Loss Carryforward, a Similar Tax Loss, or a Tax Credit Carryforward Exists. In July 2013, the Financial Accounting Standards Board (“FASB”) issued accounting guidance on the financial statement presentation of an unrecognized tax benefit when a net operating loss carryforward, a similar tax loss, or a tax credit carryforward exists. The guidance is effective prospectively for fiscal years, and interim periods within those years, beginning after December 15, 2013, with an option for early adoption. The Company adopted this guidance in January 2014. The adoption of this amendment did not have a material impact on its consolidated financial statements and related disclosures.
Reporting Discontinued Operations and Disclosures of Disposals of Components of an Entity. In April 2014, the FASB issued the accounting guidance on reporting discontinued operations and disclosures of disposals of components of an entity. The new guidance raises the threshold for a disposal to qualify as a discontinued operation and requires new disclosures of both discontinued operations and certain other disposals that do not meet the definition of a discontinued operation. The guidance is effective for fiscal years beginning after December 15, 2014. Early adoption is permitted, but only for disposals that have not been reported in financial statements previously issued. The Company does not expect the adoption of the guidance will have a material impact on its consolidated financial statements and related disclosures.
Revenue from Contracts with Customers. In May 2014, FASB issued the accounting standard on revenue from contracts with customers. The standard provides a single model for revenue arising from contracts with customers and supersedes current revenue recognition guidance. The standard requires an entity to recognize the
70
Table of Contents
MOBILE MINI, INC.
NOTES TO CONSOLIDATED FINANCIAL STATEMENTS — (Continued)
amount of revenue to which it expects to be entitled for the transfer of goods or services. The standard is effective for annual and interim periods beginning after December 15, 2016. Early adoption is not permitted. The revenue recognition standard permits the use of either the retrospective or cumulative effect transition method. The Company is evaluating the impact, if any, of the adoption of the standard to its financial statements and related disclosures. The Company has not yet selected a transition method nor determined the effect of the standard on its ongoing financial reporting.
| (3) | Acquisitions |
On December 10, 2014, Mobile Mini acquired all of the outstanding equity interests of GTH, the parent company of ETS, referred to as the ETS Acquisition. The acquisition results in significant growth opportunities for all product lines by leveraging Mobile Mini’s national presence and infrastructure, and ETS’ customer relationships. Further, the combination diversifies the Company’s end market exposure and is expected to result in modest cost synergies. As a result of the ETS Acquisition, included in the Company’s consolidated statements of operations for the twelve months ended December 31, 2014 is $6.4 million of revenues and $1.1 million of income from continuing operations before income tax provision. Direct expenses of $5.0 million related to the ETS Acquisition were recognized in the fourth quarter of 2014.
Mobile Mini, GTH and GTH’s stockholders have each made customary representations, warranties and covenants in the Stock Purchase Agreement. The parties have also agreed to provide customary indemnities, and Mobile Mini has paid a portion of the purchase price into escrow to secure the indemnification obligations of GTH’s stockholders, which are subject to customary limitations.
Also in 2014, Mobile Mini completed eight other acquisitions of portable storage businesses through both asset purchase and stock purchase agreements. The purchased assets and assumed liabilities were recorded at their estimated fair value at the date of acquisition. Five of these acquisitions expanded the Company’s existing operations in North Dakota, North Carolina, Texas, Tennessee, Florida and South Carolina markets. The other three acquisitions created new locations for the Company in the Danbury, Connecticut, Fort Wayne, Indiana and Buffalo, New York metropolitan areas. The Company did not acquire any businesses in 2013.
The accompanying consolidated financial statements include the operations of the acquired businesses from the date of acquisition. The aggregate purchase price for the assets acquired and the liabilities assumed were recorded based on their estimated fair values at the date of each acquisition. For the purposes of the unaudited pro forma condensed combined financial information, valuations were performed based on available information. At this time the fair values of assets purchased and liabilities assumed are still subject to uncertainty, as substantial amounts of ETS data must be thoroughly analyzed before more precise valuations can be determined. In addition, lease fleet and property, plant and equipment were valued based on assumed fleet condition. If our assumptions prove to be inaccurate, preliminary valuations may change.
71
Table of Contents
MOBILE MINI, INC.
NOTES TO CONSOLIDATED FINANCIAL STATEMENTS — (Continued)
The components of the purchase price and net assets acquired for 2014 acquisitions, are as follows:
| 2014 | ||||||||||||
| ETS Acquisition |
Other Acquisitions |
Total | ||||||||||
| (In thousands) | ||||||||||||
| Purchase Price, net of cash acquired: |
||||||||||||
| Cash |
$ | 410,345 | $ | 23,299 | $ | 433,644 | ||||||
| Cash acquired |
(2,698 | ) | — | (2,698 | ) | |||||||
|
|
|
|
|
|
|
|||||||
| Total |
$ | 407,647 | $ | 23,299 | $ | 430,946 | ||||||
|
|
|
|
|
|
|
|||||||
| Net Assets Acquired: |
||||||||||||
| Lease fleet |
$ | 121,620 | $ | 12,713 | $ | 134,333 | ||||||
| Property, plant and equipment |
14,814 | 338 | 15,152 | |||||||||
| Intangible assets(1): |
||||||||||||
| Customer relationships |
69,200 | 1,350 | 70,550 | |||||||||
| Trade names/trademarks |
5,200 | — | 5,200 | |||||||||
| Non-compete agreements |
1,500 | 204 | 1,704 | |||||||||
| Goodwill(2) |
181,972 | 8,840 | 190,812 | |||||||||
| Deferred tax asset, net |
2,217 | — | 2,217 | |||||||||
| Other assets(3) |
26,054 | 538 | 26,592 | |||||||||
| Other liabilities |
(14,930 | ) | (684 | ) | (15,614 | ) | ||||||
|
|
|
|
|
|
|
|||||||
| Total |
$ | 407,647 | $ | 23,299 | $ | 430,946 | ||||||
|
|
|
|
|
|
|
|||||||
| (1) | The following table reflects the estimated fair values and useful lives of intangible assets related to the ETS Acquisition identified based on our preliminary purchase accounting assessments: |
| Estimated Life (Years) | ||
| Customer relationships |
15 - 20 | |
| Trade names/trademarks |
5 - 10 | |
| Non-compete agreements |
5 |
| (2) | All of the goodwill related to the ETS Acquisition was assigned to our specialty containment solutions segment. The goodwill arising from the acquisition consists largely of ETS’ going-concern value, the value of ETS’ assembled workforce, new customer relationships expected to arise from the acquisition, and operational synergies and economies of scale that we expect to realize from the acquisition. Goodwill from other acquisitions relates to the North America portable storage segment. None of the goodwill assigned to ETS will be amortizable for tax purposes, while all of the goodwill from the other acquisitions will be deductible for tax purposes. |
| (3) | Included in other assets for the ETS Acquisition are accounts receivables with contractual amounts totaling $24.9 million. The Company estimates that $0.6 million will be uncollectible, and has valued acquired accounts receivable at $24.3 million. |
72
Table of Contents
MOBILE MINI, INC.
NOTES TO CONSOLIDATED FINANCIAL STATEMENTS — (Continued)
Supplemental Pro Forma Information
The unaudited pro forma financial information is presented for informational purposes only and is not indicative, and should not be relied on as being indicative, of the results of operations that would have been achieved if the acquisition had actually taken place at the beginning of each of the periods presented. The pro forma financial information reflects only the ETS Acquisition, as the remaining acquisitions would not have a material effect on reported results of operations. The following table summarizes the Company’s unaudited consolidated statements of income as if the ETS Acquisition occurred on January 1, 2013:
| Years Ended December 31, | ||||||||
| 2013 | 2014 | |||||||
| (In thousands) | ||||||||
| Revenues: |
||||||||
| Mobile Mini’s historic revenues |
$ | 406,486 | $ | 445,474 | ||||
| ETS’ historic revenues(1) |
92,057 | 101,603 | ||||||
|
|
|
|
|
|||||
| Pro forma revenues |
$ | 498,543 | $ | 547,077 | ||||
|
|
|
|
|
|||||
| Net income |
||||||||
| Mobile Mini’s historic net income |
$ | 23,922 | $ | 44,386 | ||||
| ETS’ historic net income (loss)(1) |
(10,332 | ) | (25,862 | ) | ||||
| Pro forma adjustments(2) |
6,956 | 22,601 | ||||||
|
|
|
|
|
|||||
| Pro forma net income |
$ | 20,546 | $ | 41,125 | ||||
|
|
|
|
|
|||||
| Average diluted weighted shares outstanding |
46,096 | 46,725 | ||||||
| Pro forma diluted earnings per share |
$ | 0.45 | $ | 0.88 | ||||
| (1) | ETS historic information for the year ended December 31, 2014, consists of revenues and net loss prior to the acquisition date of December 10, 2014. Revenues and net income (loss) after the acquisition date are included in Mobile Mini’s historic information for the year ended December 31, 2014. |
73
Table of Contents
MOBILE MINI, INC.
NOTES TO CONSOLIDATED FINANCIAL STATEMENTS — (Continued)
| (2) | Pro forma adjustments consist of the following: |
| Years Ended December 31, | ||||||||
| 2013 | 2014 | |||||||
| (In thousands) | ||||||||
| Pro forma increases (decreases) to income from continuing operations before income tax provisions: |
||||||||
| Record the net impact to depreciation resulting from fair value mark-ups, offset by changes to the estimated remaining lives, for acquired lease fleet and property, plant and equipment |
$ | 3,799 | $ | 3,953 | ||||
| Remove historic gains recognized on the sale of used lease fleet and property, plant and equipment |
(1,707 | ) | (2,195 | ) | ||||
| Eliminate historic ETS amortization of intangible assets |
3,233 | 3,387 | ||||||
| Recognize amortization for intangible assets acquired |
(4,818 | ) | (5,027 | ) | ||||
| Recognize increased interest expense on amounts borrowed to fund the acquisition, including acquisition costs |
(9,078 | ) | (8,531 | ) | ||||
| Eliminate historic ETS interest expense on debt instruments retired upon acquisition |
19,882 | 22,655 | ||||||
| Eliminate acquisition costs |
— | 15,295 | ||||||
|
|
|
|
|
|||||
| Total |
11,311 | 29,537 | ||||||
| Increase in income tax provision related to pro forma adjustments |
4,355 | 6,936 | ||||||
|
|
|
|
|
|||||
| Total pro forma adjustments |
$ | 6,956 | $ | 22,601 | ||||
|
|
|
|
|
|||||
74
Table of Contents
MOBILE MINI, INC.
NOTES TO CONSOLIDATED FINANCIAL STATEMENTS — (Continued)
| (4) | Lease Fleet |
The Company’s depreciation expense related to its lease fleet for 2012, 2013 and 2014 was $21.6 million, $21.2 million and $22.7 million, respectively. At December 31, 2013 and 2014, all of the Company’s lease fleet units were pledged as collateral under the Credit Agreement.
Lease fleet at December 31 consisted of the following:
| Residual Value as Percentage of Original Cost(1) |
Useful Life in Years |
2013 | 2014 | |||||||||||
| (In thousands) | ||||||||||||||
| Portable Storage: |
||||||||||||||
| Steel storage containers |
55 | % | 30 | $ | 600,475 | $ | 604,547 | |||||||
| Steel security and combinations offices |
55 | % | 30 | 328,849 | 329,565 | |||||||||
| Wood mobile offices |
50 | % | 20 | 210,057 | 208,529 | |||||||||
| Other |
5,928 | 5,633 | ||||||||||||
|
|
|
|
|
|||||||||||
| Total |
1,145,309 | 1,148,274 | ||||||||||||
| Accumulated depreciation |
(166,033 | ) | (182,437 | ) | ||||||||||
|
|
|
|
|
|||||||||||
| Total portable storage fleet, net |
$ | 979,276 | $ | 965,837 | ||||||||||
|
|
|
|
|
|||||||||||
| Specialty Containment: |
||||||||||||||
| Steel tanks |
25 | $ | 50,843 | |||||||||||
| Roll-off boxes |
15 - 20 | 19,820 | ||||||||||||
| Stainless steel tank trailers |
25 | 7,667 | ||||||||||||
| Vacuum boxes |
20 | 23,283 | ||||||||||||
| De-watering boxes |
20 | 3,898 | ||||||||||||
| Pumps and filtration equipment |
7 | 11,510 | ||||||||||||
| Other |
5,468 | |||||||||||||
|
|
|
|||||||||||||
| Total |
122,489 | |||||||||||||
| Accumulated depreciation |
(1,270 | ) | ||||||||||||
|
|
|
|||||||||||||
| Total specialty containment fleet, net |
$ | 121,219 | ||||||||||||
|
|
|
|||||||||||||
| Total lease fleet, net |
$ | 1,087,056 | ||||||||||||
|
|
|
|||||||||||||
| (1) | Specialty containment fleet has been assigned zero residual value. |
| (5) | Lines of Credit |
On February 22, 2012, the Company entered into a $900.0 million ABL Credit Agreement with Deutsche Bank AG New York Branch and other lenders party thereto (the “Credit Agreement”). In December 2014, the Company entered into an amendment to the Credit Agreement to increase the facility to $1.0 billion. All other material terms of the Credit Agreement remained substantially the same. The Credit Agreement provides for a five-year, revolving credit facility and all amounts outstanding under the Credit Agreement are due on February 22, 2017. The obligations of Mobile Mini and its subsidiary guarantors under the Credit Agreement are secured by a blanket lien on substantially all of its assets.
Amounts borrowed under the Credit Agreement and repaid or prepaid during the term may be reborrowed. Outstanding amounts under the Credit Agreement bear interest at the Company’s option at either: (i) LIBOR plus a defined margin, or (ii) the Agent bank’s prime rate plus a margin. The applicable margin for each type of loan
75
Table of Contents
MOBILE MINI, INC.
NOTES TO CONSOLIDATED FINANCIAL STATEMENTS — (Continued)
is based on an availability-based pricing grid and ranges from 1.75% to 2.25% for LIBOR loans and 0.75% to 1.25% for base rate loans at each measurement date. As of December 31, 2014, the applicable margins are 2.00% for LIBOR loans and 1.00% for base rate loans and will be remeasured at the end of the next measurement date, which is within 10 days following the end of each fiscal quarter.
Availability of borrowings under the Credit Agreement is subject to a borrowing base calculation based upon a valuation of the Company’s eligible accounts receivable, eligible container fleet (including containers held for sale, work-in-process and raw materials) and machinery and equipment, each multiplied by an applicable advance rate or limit. The lease fleet is appraised at least once annually by a third-party appraisal firm and up to 90% of the net orderly liquidation value, as defined in the Credit Agreement, is included in the borrowing base to determine how much the Company may borrow under the Credit Agreement.
The Credit Agreement provides for U.K. borrowings, which are, at the Company’s option, denominated in either Pounds Sterling or Euros, by its U.K. subsidiary based upon a U.K. borrowing base; Canadian borrowings, which are denominated in Canadian dollars, by its Canadian subsidiary based upon a Canadian borrowing base; and U.S. borrowings, which are denominated in U.S. dollars, by the Company based upon a U.S. borrowing base along with any Canadian assets not included in the Canadian subsidiary.
The Credit Agreement also contains customary negative covenants, including covenants that restrict the Company’s ability to, among other things: (i) allow certain liens to attach to the Company or its subsidiary assets; (ii) repurchase or pay dividends or make certain other restricted payments on capital stock and certain other securities, prepay certain indebtedness or make acquisitions or other investments subject to Payment Conditions (as defined in the Credit Agreement); and (iii) incur additional indebtedness or engage in certain other types of financing transactions. Payment Conditions allow restricted payments and acquisitions to occur without financial covenants as long as the Company has $250.0 million of pro forma excess borrowing availability under the Credit Agreement. The Company must also comply with specified financial maintenance covenants and affirmative covenants only if the Company falls below $100.0 million of borrowing availability levels with set permitted values for the Debt Ratio and Fixed Charge Coverage Ratio (as defined in the Credit Agreement). The Company was in compliance with the terms of the Credit Agreement as of December 31, 2014 and was above the minimum borrowing availability threshold and therefore not subject to any financial maintenance covenants.
The weighted average interest rate under the lines of credit was approximately 2.2% in both 2013 and 2014. The average outstanding balance was approximately $386.6 million and $323.6 million during 2013 and 2014, respectively. During December 2014, the Company borrowed approximately $410 million under the Credit Agreement to fund the ETS Acquisition and associated expenses. At December 31, 2014, the Company had approximately $705.5 million of borrowings outstanding and $286.9 million of additional borrowing availability under the Credit Agreement, based upon borrowing base calculations as of such date.
| (6) | Obligations Under Capital Leases |
At December 31, 2013 and 2014, obligations under capital leases for certain transportation, technology and office related equipment were $8.8 million and $24.9 million, respectively. Certain of the lease agreements provide the Company with a purchase option at the end of the lease term. The leases have been capitalized using interest rates primarily ranging from approximately 1.8% to 12.7%. The leases are secured by the equipment under lease. Assets recorded under capital lease obligations totaled approximately $10.2 million as of December 31, 2013 and $24.6 million as of December 31, 2014. Related accumulated amortization totaled approximately $1.1 million as of December 31, 2013 and $2.1 million as of December 31, 2014. The assets acquired under capital leases and related accumulated amortization is included in property, plant and equipment, net, in the Consolidated Balance Sheets. The related amortization is included in depreciation and amortization expense in the Consolidated Statements of Income.
76
Table of Contents
MOBILE MINI, INC.
NOTES TO CONSOLIDATED FINANCIAL STATEMENTS — (Continued)
Future minimum capital lease payments at December 31, 2014 are as follows (in thousands):
| 2015 |
$ | 4,144 | ||
| 2016 |
4,118 | |||
| 2017 |
3,852 | |||
| 2018 |
3,380 | |||
| 2019 |
3,450 | |||
| Thereafter |
8,486 | |||
|
|
|
|||
| Total |
27,430 | |||
| Amount representing interest |
(2,512 | ) | ||
|
|
|
|||
| Present value of minimum lease payments |
$ | 24,918 | ||
|
|
|
| (7) | Debt Issuances |
On November 23, 2010, the Company issued $200.0 million aggregate principal amount of the 2020 Notes. The 2020 Notes were issued by the Company at an initial offering price of 100% of their face value. The 2020 Notes have a ten-year term and mature on December 1, 2020 and bear interest at a rate of 7.875% per year. Interest is payable semiannually in arrears on June 1 and December 1 of each year. The 2020 Notes are senior unsecured obligations of the Company and are unconditionally guaranteed on a senior unsecured basis by all of our domestic subsidiaries.
Future Debt Obligations
The scheduled maturity for debt obligations under Mobile Mini’s Credit Agreement, obligations under capital leases and Senior Notes for balances outstanding at December 31, 2014 are as follows (in thousands):
| 2015 |
$ | 3,465 | ||
| 2016 |
3,563 | |||
| 2017 |
708,932 | |||
| 2018 |
3,041 | |||
| 2019 |
3,194 | |||
| Thereafter |
208,241 | |||
|
|
|
|||
| Total |
$ | 930,436 | ||
|
|
|
| (8) | Income Taxes |
Income before taxes from continuing operations for the years ended December 31 consisted of the following:
| For the Years Ended December 31, | ||||||||||||
| 2012 | 2013 | 2014 | ||||||||||
| (In thousands) | ||||||||||||
| U.S. |
$ | 44,157 | $ | 30,528 | $ | 52,944 | ||||||
| Foreign |
8,775 | 6,971 | 17,475 | |||||||||
|
|
|
|
|
|
|
|||||||
| Total |
$ | 52,932 | $ | 37,499 | $ | 70,419 | ||||||
|
|
|
|
|
|
|
|||||||
77
Table of Contents
MOBILE MINI, INC.
NOTES TO CONSOLIDATED FINANCIAL STATEMENTS — (Continued)
The provision for income taxes from continuing operations for the years ended December 31 consisted of the following:
| For the Years Ended December 31, | ||||||||||||
| 2012 | 2013 | 2014 | ||||||||||
| (In thousands) | ||||||||||||
| Current: |
||||||||||||
| U.S. Federal |
$ | — | $ | — | $ | — | ||||||
| State |
388 | 934 | 827 | |||||||||
| Foreign |
— | — | — | |||||||||
|
|
|
|
|
|
|
|||||||
| Total current |
388 | 934 | 827 | |||||||||
|
|
|
|
|
|
|
|||||||
| Deferred |
||||||||||||
| U.S. Federal |
15,419 | 11,483 | 21,510 | |||||||||
| State |
1,553 | 1,100 | 2,019 | |||||||||
| Foreign |
1,149 | (1,242 | ) | 1,677 | ||||||||
|
|
|
|
|
|
|
|||||||
| Total deferred |
18,121 | 11,341 | 25,206 | |||||||||
|
|
|
|
|
|
|
|||||||
| Total provision for income taxes |
$ | 18,509 | $ | 12,275 | $ | 26,033 | ||||||
|
|
|
|
|
|
|
|||||||
The components of the net deferred tax liability at December 31 are approximately as follows:
| 2013 | 2014 | |||||||
| (In thousands) | ||||||||
| Deferred tax assets: |
||||||||
| Net operating loss carryforwards |
$ | 94,346 | $ | 122,041 | ||||
| Deferred revenue and expenses |
11,280 | 13,310 | ||||||
| Accrued compensation and other benefits |
1,411 | 1,438 | ||||||
| Allowance for doubtful accounts |
615 | 1,034 | ||||||
| Other |
4,745 | 4,812 | ||||||
|
|
|
|
|
|||||
| Total deferred tax assets |
112,397 | 142,635 | ||||||
| Valuation allowance |
(1,126 | ) | (1,126 | ) | ||||
|
|
|
|
|
|||||
| Net deferred tax assets |
111,271 | 141,509 | ||||||
|
|
|
|
|
|||||
| Deferred tax liabilities |
||||||||
| Accelerated tax depreciation |
(302,597 | ) | (333,042 | ) | ||||
| Accelerated tax amortization |
(13,474 | ) | (36,150 | ) | ||||
| Other |
(4,765 | ) | (3,864 | ) | ||||
|
|
|
|
|
|||||
| Total deferred tax liabilities |
(320,836 | ) | (373,056 | ) | ||||
|
|
|
|
|
|||||
| Net deferred tax liabilities |
$ | (209,565 | ) | $ | (231,547 | ) | ||
|
|
|
|
|
|||||
A deferred U.S. tax liability has not been provided on the undistributed earnings of certain foreign subsidiaries because it is Mobile Mini’s intent to permanently reinvest such earnings. Undistributed earnings of foreign subsidiaries, which have been or are intended to be permanently invested, aggregated approximately $25.5 million and $37.0 million as of December 31, 2013 and 2014, respectively. A net deferred tax liability of approximately $14.4 million and $16.2 million related to the Company’s U.K. operations has been combined with the net deferred tax liabilities of its U.S. operations in the Consolidated Balance Sheets at December 31, 2013 and 2014, respectively. In connection with the ETS Acquisition, the Company acquired $2.2 million of net
78
Table of Contents
MOBILE MINI, INC.
NOTES TO CONSOLIDATED FINANCIAL STATEMENTS — (Continued)
deferred tax assets. This primarily consisted of deferred tax liabilities of $53.0 million related to accelerated tax depreciation and amortization along with deferred tax asset for federal and state net operating losses of $55.2 million. A reconciliation of the U.S. federal statutory rate to Mobile Mini’s effective tax rate for the years ended December 31 is as follows:
| For the Years Ended December 31, | ||||||||||||
| 2012 | 2013 | 2014 | ||||||||||
| U.S. federal statutory rate |
35.0 | % | 35.0 | % | 35.0 | % | ||||||
| State taxes, net of federal benefit |
3.5 | 3.5 | 3.9 | |||||||||
| Nondeductible expenses and other |
1.4 | 1.4 | 1.2 | |||||||||
| Adjustment of net deferred tax liability for enacted tax rate change |
(2.1 | ) | (4.9 | ) | — | |||||||
| Foreign rate differential |
(2.8 | ) | (2.3 | ) | (3.1 | ) | ||||||
|
|
|
|
|
|
|
|||||||
| Effective tax rate |
35.0 | % | 32.7 | % | 37.0 | % | ||||||
|
|
|
|
|
|
|
|||||||
At December 31, 2014, Mobile Mini had U.S. federal net operating loss carryforwards on its federal tax return of approximately $356.5 million, which expire if unused from 2025 to 2034. At December 31, 2014, the Company had net operating loss carryforwards on the various states’ tax returns in which it operates totaling $172.3 million, which expire if unused from 2015 to 2034. At December 31, 2013 and 2014, the Company’s net operating losses carrying forward for tax return purposes include $14.2 million and $16.6 million of excess tax benefits from employee stock awards. Additional paid in capital will be increased by an equivalent amount if and when such excess tax benefits are realized. In connection with the ETS Acquisition, Mobile Mini acquired U.S. federal net operating loss carryforwards of approximately $151.3 million and various state net operating loss carryforwards of $47.5 million.
For income tax purposes, deductible compensation related to share-based awards is based on the value of the award when realized, which may be different than the compensation expense recognized by us in our financial statements, which is based on the award value on the date of grant. The difference between the value of the award upon grant, and the value of the award when ultimately realized, creates either additional tax benefits or a tax shortfall.
Tax benefits resulting from tax deductions in excess of the compensation cost recognized for share-based awards (“excess tax benefits”) are recognized as increases to additional paid in capital and as financing cash flows, only if an incremental income tax benefit would be realized after considering all other tax attributes presently available to us. We have not recognized excess tax benefits in 2012, 2013 or 2014, because we have not paid U.S. federal income taxes in those years.
Tax shortfalls, which occur when the tax deduction for share-based awards is less than the compensation cost recognized, are recorded as a reduction to additional paid in capital to the extent that, cumulatively, the shortfalls do not exceed the cumulative excess tax benefits recognized (including excess tax benefits not yet recognized in additional paid in capital). Should cumulative tax shortfalls exceed cumulative excess tax benefits, the difference would be reflected as additional tax expense in our financial statements.
Because we have not paid U.S. taxes in 2012, 2013 and 2014 we have recognized tax shortfalls as a reduction to our net deferred tax liability and presented these shortfalls as a reduction to operating cash flows. When we are in a position to remit taxes, the shortfalls will offset excess tax benefits, and the net difference will be recognized as a financing cash flow.
Management evaluates the ability to realize its deferred tax assets on a quarterly basis and adjusts the amount of its valuation allowance if necessary. Over the past three years, Mobile Mini has generated $118.1
79
Table of Contents
MOBILE MINI, INC.
NOTES TO CONSOLIDATED FINANCIAL STATEMENTS — (Continued)
million of federal taxable income. Management currently believes that adequate future taxable income will be generated through future operations, or through available tax planning strategies to recover the unreserved portion of these deferred tax assets.
Mobile Mini adopted a two-step approach to recognizing and measuring uncertain tax positions. The first step is to evaluate the tax position for recognition by determining if the weight of available evidence indicates that it is more likely than not that the position will be sustained on audit, including resolution of related appeals or litigation process, if any. The second step is to measure the tax benefit as the largest amount that is more than 50% likely of being realized upon ultimate settlement.
The Company files U.S. federal tax returns, U.S. state tax returns, and foreign tax returns. The Company has identified its U.S. Federal tax return as its “major” tax jurisdiction. For the U.S. Federal return, the Company’s tax years for 2011, 2012 and 2013 are subject to tax examination by the U.S. Internal Revenue Service through September 15, 2015, 2016 and 2017, respectively. No reserves for uncertain income tax positions have been recorded. The Company does not anticipate that the total amount of unrecognized tax benefit related to any particular tax position will change significantly within the next 12 months.
In July 2013, the U.K.’s government authorized a reduction in the corporate income tax rate to 20% from the statutory rate of 23% authorized in 2012. This rate reduction only affected the Company’s U.K. operations and reduced the Company’s deferred tax liability in the U.K. by approximately $1.9 million in 2013. The tax reduction is reflected at the enacted rate in effect at the estimated date such amounts will be payable.
The Company’s policy for recording interest and penalties associated with audits is to record such items as a component of income before taxes. Penalties and associated interest costs, if any, are recorded in leasing, selling and general expenses in its Consolidated Statements of Income.
As a result of stock ownership changes during the years presented, it is possible that the Company has undergone a change in ownership for federal income tax purposes, which can limit the amount of net operating loss currently available as a deduction. Management has determined that even if such an ownership change has occurred, it would not impair the realization of the deferred tax asset resulting from the federal net operating loss carryover.
Mobile Mini paid income taxes of approximately $0.8 million in 2012, $1.1 million in 2013 and $1.1 million in 2014. These amounts are lower than the recorded expense in the years due to net operating loss carryforwards and general business credit utilization.
| (9) | Transactions with Related Persons |
With the ETS Acquisition, the Company acquired its subsidiary, Water Movers, which has two real property leases with an entity partly owned by Michael Watts, a member of our Board. These leases began in 2013, prior to the ETS Acquisition, and expire in 2023. Rental payments under these leases are currently $17,660 per month. Any future renewals of these leases will be approved by the Board as related party transactions. It is Mobile Mini’s intention not to enter into any additional related person transactions.
| (10) | Share-Based Compensation |
The Company has historically awarded stock options and nonvested share-awards for employees and non-employee directors as a means of attracting and retaining quality personnel and to align employee performance with stockholder value. Stock option plans are approved by the Company’s stockholders and administered by the stock compensation committee of the board of directors (“Board”). The current plan allows for a variety of equity programs designed to provide flexibility in implementing equity and cash awards, including incentive stock
80
Table of Contents
MOBILE MINI, INC.
NOTES TO CONSOLIDATED FINANCIAL STATEMENTS — (Continued)
options, nonqualified stock options, nonvested share-awards, restricted stock units, stock appreciation rights, performance stock, performance units and other stock-based awards. Participants may be granted any one of the equity awards or any combination. The Company does not award stock options with an exercise price below the market price of the underlying securities on the date of award. As of December 31, 2014, 2.9 million shares remain available for future grants. Generally stock options have contractual terms of ten years.
Service-based awards. The Company grants share-based compensation awards that vest over time subject to the employee rendering service to the Company over the vesting period. The majority of the service–based awards vest in equal annual installments over a period of three to five years. The expense for service-based awards is expensed ratably over the full service period of the grant.
Performance-based awards. Certain executive officers have been granted stock options and nonvested share-awards with vesting contingent upon the achievement of certain performance criteria related to operating performance of the Company, in addition to the fulfillment of service requirements. Performance-based awards generally vest over a three to four year period. Expense related to performance-based awards that have multiple vesting dates, is recognized using the accelerated attribution approach, whereby each vesting tranche is treated as a separate award for purposes of determining the implicit service period. The accelerated attribution approach generally results in a higher expense during the earlier years of vesting.
Generally, performance-based share awards vest annually contingent on annual operating performance criteria, however, there is also a cumulative performance objective. Performance shares that do not vest in any given year due to failure to achieve an annual performance target may nevertheless vest at the end of the cumulative year grant period if certain cumulative targets are met. In the past three years, the Company has recognized the full expense for all awards. However, should cumulative targets not be achieved in the future, awards may be forfeited resulting in a reduction to future expense. As of December 31, 2014 approximately 793,000 performance-based stock options and 26,000 performance-based non-vested share awards remain unvested. No performance-based awards were issued in 2014.
Non-employee director awards. Each non-employee director serving on the Company’s Board receives an automatic award of shares of Mobile Mini’s common stock annually. These awards vest 100% when granted. For the years ended December 31, 2012, 2013 and 2014, $0.6 million, $0.6 million and $0.9 million, respectively, of expense was recognized related to these grants.
Share-based compensation expense. Share-based compensation related to the vesting of options and nonvested share-awards was approximately $9.6 million, $14.7 million and $15.1 million for 2012, 2013 and 2014, respectively.
The following table summarizes the Company’s share-based compensation for the years ended December 31:
| For the Years Ended December 31, | ||||||||||||
| 2012 | 2013 | 2014 | ||||||||||
| (In thousands) | ||||||||||||
| Share-based compensation expense included: |
||||||||||||
| Leasing, selling and general expenses |
$ | 7,151 | $ | 13,956 | $ | 14,490 | ||||||
| Restructuring expenses |
2,424 | 758 | 581 | |||||||||
|
|
|
|
|
|
|
|||||||
| Share-based compensation expense |
9,575 | 14,714 | 15,071 | |||||||||
| Amount capitalized |
223 | 326 | — | |||||||||
|
|
|
|
|
|
|
|||||||
| Total share-based compensation |
$ | 9,798 | $ | 15,040 | $ | 15,071 | ||||||
|
|
|
|
|
|
|
|||||||
81
Table of Contents
MOBILE MINI, INC.
NOTES TO CONSOLIDATED FINANCIAL STATEMENTS — (Continued)
As of December 31, 2014, total unrecognized compensation cost related to stock option awards was approximately $9.4 million and the related weighted-average period over which it is expected to be recognized is approximately 1.2 years. As of December 31, 2014, the unrecognized compensation cost related to nonvested share-awards was approximately $8.2 million, which is expected to be recognized over a weighted-average period of approximately 2.5 years.
Stock options. The fair value of each stock option award is estimated on the date of the grant using the Black-Scholes option pricing model which requires the input of assumptions. Management estimates the risk-free interest rate based on the U.S. Treasury security rate in effect at the time of the grant. The expected life of the options, volatility and dividend rates are estimated based on the Company’s historical data. The following are the key assumptions used for the period noted:
| 2013 | 2014 | |||
| Risk-free interest rate |
0.7% - 1.5% | 1.5% - 1.7% | ||
| Expected life of the options (years) |
6.0 - 7.0 | 5.0 | ||
| Expected stock price volatility |
41.1% - 46.3% | 35.4% - 38.4% | ||
| Expected dividend rate |
0.0% - 1.8% | 1.5% - 1.8% |
The following table summarizes stock option activity for the years ended December 31 (share amounts in thousands):
| 2012 | 2013 | 2014 | ||||||||||||||||||||||
| Number of Shares |
Weighted Average Exercise Price |
Number of Shares |
Weighted Average Exercise Price |
Number of Shares |
Weighted Average Exercise Price |
|||||||||||||||||||
| Options outstanding, beginning of year |
1,394 | $ | 18.39 | 1,099 | $ | 20.02 | 2,519 | $ | 29.80 | |||||||||||||||
| Granted |
65 | 21.13 | 2,214 | 31.26 | 365 | 46.83 | ||||||||||||||||||
| Canceled/Expired |
(51 | ) | 26.61 | (147 | ) | 15.90 | (71 | ) | 40.63 | |||||||||||||||
| Exercised |
(309 | ) | 11.81 | (647 | ) | 21.35 | (164 | ) | 22.18 | |||||||||||||||
|
|
|
|
|
|
|
|||||||||||||||||||
| Options outstanding, end of year |
1,099 | 20.02 | 2,519 | 29.80 | 2,649 | 32.33 | ||||||||||||||||||
|
|
|
|
|
|
|
|||||||||||||||||||
| Options exercisable, end of year |
755 | 20.42 | 193 | 21.51 | 854 | 29.32 | ||||||||||||||||||
| Options and awards available for grant, end of year |
1,361 | 3,239 | 2,902 | |||||||||||||||||||||
A summary of stock options outstanding as of December 31, 2014, is as follows:
| Number of Shares |
Weighted Average Exercise Price |
Weighted Average Remaining Contractual Terms |
Aggregate Intrinsic Value |
|||||||||||||
| (In thousands) | (In years) | (In thousands) | ||||||||||||||
| Outstanding |
2,649 | $ | 32.33 | 8.12 | $ | 23,653 | ||||||||||
| Vested and expected to vest |
2,571 | 32.15 | 8.10 | 23,958 | ||||||||||||
| Exercisable |
854 | 29.32 | 7.56 | 9,594 | ||||||||||||
The aggregate intrinsic value of options exercised during the period ended December 31, 2012, 2013 and 2014 was $2.7 million, $9.0 million and $2.9 million, respectively.
82
Table of Contents
MOBILE MINI, INC.
NOTES TO CONSOLIDATED FINANCIAL STATEMENTS — (Continued)
The weighted average fair value of stock options granted was $8.56, $10.59 and $10.46 for the period ended December 31, 2012, 2013 and 2014, respectively.
Nonvested share-awards. The fair value of nonvested share-awards is estimated as the closing price of our common stock on the date of grant. A summary of nonvested share-awards activity is as follows (share amounts in thousands):
| Shares | Weighted Average Grant Date Fair Value |
|||||||
| Nonvested at January 1, 2012 |
1,180 | $ | 16.20 | |||||
| Awarded |
261 | 19.67 | ||||||
| Released |
(453 | ) | 16.05 | |||||
| Forfeited |
(145 | ) | 16.77 | |||||
|
|
|
|||||||
| Nonvested at December 31, 2012 |
843 | 17.27 | ||||||
| Awarded |
153 | 30.21 | ||||||
| Released |
(252 | ) | 19.15 | |||||
| Forfeited |
(202 | ) | 15.64 | |||||
|
|
|
|||||||
| Nonvested at December 31, 2013 |
542 | 20.65 | ||||||
| Awarded |
143 | 39.77 | ||||||
| Released |
(240 | ) | 20.93 | |||||
| Forfeited |
(102 | ) | 22.09 | |||||
|
|
|
|||||||
| Nonvested at December 31, 2014 |
343 | 27.99 | ||||||
|
|
|
|||||||
The total fair value of nonvested share-awards that vested in 2013 and 2014 were $4.8 million and $5.0 million, respectively.
| (11) Benefit | Plans |
In 1995, the Company established a contributory retirement plan in the U.S., the 401(k) Plan, covering eligible employees. The 401(k) Plan is designed to provide tax-deferred retirement benefits to employees in accordance with the provisions of Section 401(k) of the Internal Revenue Code.
The 401(k) Plan provides that each participant may annually contribute a fixed amount or a percentage of his or her salary, not to exceed the statutory limit. Mobile Mini may make a qualified non-elective contribution in an amount it determines. Under the terms of the 401(k) Plan, Mobile Mini may also make discretionary profit sharing contributions. Profit sharing contributions are allocated among participants based on their annual compensation. Each participant has the right to direct the investment of their funds among certain named plans. Mobile Mini contributes 25% of its employees’ contributions up to an annual maximum of $1 thousand per employee. The Company has a Registered Retirement Savings Plan regulated by Canadian law, where the Company makes matching contributions to its Canadian employees.
In the U.K., the Company’s employees are covered by one of two separate defined contribution programs. The employees become eligible to participate in the programs once any initial employment probationary period is completed. The plans are designed as retirement benefit programs into that which the Company pays a contribution of either 5% or 7% of the employees’ annual salary into the plan. Depending on the plan, employees contribute either 0% or 2.5% of their annual salary into the plan and have the right to make further contributions
83
Table of Contents
MOBILE MINI, INC.
NOTES TO CONSOLIDATED FINANCIAL STATEMENTS — (Continued)
if they so elect. The participants have the right to direct the investment of their funds among certain named plans. Annual charges are deducted from each employee’s fund to cover the administrative costs of these programs.
Mobile Mini made contributions to the U.S., Canadian and U.K. plans of approximately $0.4 million, $0.5 million and $0.7 million in 2012, 2013 and 2014, respectively. The Company incurred approximately $34,000 in each of the three years ending December 31, 2012, 2013 and 2014, for administrative costs for these programs.
| (12) Commitments | and Contingencies |
Leases
The Company leases its corporate offices and other properties and operating equipment from third parties under noncancelable operating leases. Rent expense under these agreements was approximately $20.7 million, $21.2 million and $21.3 million for the years ended December 31, 2012, 2013 and 2014, respectively.
As of December 31, 2014, contractual commitments associated with lease obligations are as follows:
| Operating Lease Commitments |
Restructuring Related Lease Commitments |
Sub-lease Income |
Total | |||||||||||||
| (In thousands) | ||||||||||||||||
| 2015 |
$ | 19,011 | $ | 522 | $ | (243 | ) | $ | 19,290 | |||||||
| 2016 |
14,583 | 454 | (150 | ) | 14,887 | |||||||||||
| 2017 |
10,187 | 394 | (77 | ) | 10,504 | |||||||||||
| 2018 |
5,886 | 272 | — | 6,158 | ||||||||||||
| 2019 |
3,117 | 23 | — | 3,140 | ||||||||||||
| Thereafter |
9,773 | — | — | 9,773 | ||||||||||||
|
|
|
|
|
|
|
|
|
|||||||||
| Total |
$ | 62,557 | $ | 1,665 | $ | (470 | ) | $ | 63,752 | |||||||
|
|
|
|
|
|
|
|
|
|||||||||
Future minimum lease payments under restructured non-cancelable operating leases as of December 31, 2014, are included in accrued liabilities in the Consolidated Balance Sheet. See Note 14 for a further discussion on restructuring related commitments.
Insurance
The Company maintains insurance coverage for its operations and employees with appropriate aggregate, per occurrence and deductible limits as the Company reasonably determines is necessary or prudent with current operations and historical experience. The majority of these coverages have large deductible programs which allow for potential improved cash flow benefits based on its loss control efforts.
The Company’s employee group health insurance program is a self-insured program with individual and aggregate stop loss limits. The insurance provider is responsible for funding all claims in excess of the calculated monthly maximum liability. This calculation is based on a variety of factors including the number of employees enrolled in the plan. This plan allows for some cash flow benefits while guarantying a maximum premium liability. Actual results may vary from estimates based on the Company’s actual experience at the end of the plan policy periods based on the carrier’s loss predictions and its historical claims data.
The Company’s worker’s compensation, auto and general liability insurance are purchased under large deductible programs. The Company’s current per incident deductibles are: worker’s compensation $250,000, auto $500,000 and general liability $100,000. The Company expenses the deductible portion of the individual
84
Table of Contents
MOBILE MINI, INC.
NOTES TO CONSOLIDATED FINANCIAL STATEMENTS — (Continued)
claims. However, the Company generally does not know the full amount of its exposure to a deductible in connection with any particular claim during the fiscal period in which the claim is incurred and for which it must make an accrual for the deductible expense. The Company makes these accruals based on a combination of the claims development experience of its staff and its insurance companies, and, at year end, the accrual is reviewed and adjusted, in part, based on an independent actuarial review of historical loss data and using certain actuarial assumptions followed in the insurance industry. A high degree of judgment is required in developing these estimates of amounts to be accrued, as well as in connection with the underlying assumptions. In addition, the Company’s assumptions will change as its loss experience is developed. All of these factors have the potential for significantly impacting the amounts the Company has previously reserved in respect of anticipated deductible expenses and the Company may be required in the future to increase or decrease amounts previously accrued. Under the Company’s various insurance programs, it has collective reserves recorded in accrued liabilities of $3.8 million and $3.3 million at December 31, 2013 and 2014, respectively.
As of December 31, 2014, in connection with the issuance of our insurance policies, Mobile Mini has provided its various insurance carriers approximately $7.5 million in letters of credit.
In 2014 ETS maintained its own insurance for employee group health, workers’ compensation, auto and general liability. There were no outstanding claims related to ETS that required a reserve at December 31, 2014.
General Litigation
The Company is a party to various claims and litigation in the normal course of business. Management’s current estimated range of liability related to various claims and pending litigation is based on claims for which our management can determine that it is probable that a liability has been incurred and the amount of loss can be reasonably estimated. Because of the uncertainties related to both the probability of incurred and possible range of loss on pending claims and litigation, management must use considerable judgment in making reasonable determination of the liability that could result from an unfavorable outcome. As additional information becomes available, management will assess the potential liability related to our pending litigation and revise our estimates. Such revisions in the Company’s estimates of the potential liability could materially impact our results of operation. Management does not anticipate the resolution of such matters known at this time will have a material adverse effect on the Company’s business or consolidated financial position.
| (13) Stockholders’ | Equity |
Dividends
On November 6, 2013, the Company’s Board authorized the initiation of a quarterly cash dividend to all the Company’s common stockholders and declared the first quarterly cash dividend of $0.17 per share of common stock, payable on March 20, 2014. During fiscal 2014, the Company paid cash dividends of $.68 per share for a total of $31.4 million. Each future quarterly dividend payment is subject to review and approval by the Board. In addition, the Company’s Credit Agreement contains restrictions on the declaration and payment of dividends.
Treasury stock
On November 6, 2013, the Board approved a share repurchase program authorizing up to $125.0 million of the Company’s outstanding shares of common stock to be repurchased. The shares may be repurchased from time to time in the open market or in privately negotiated transactions. The share repurchases are subject to prevailing market conditions and other considerations. The share repurchase program does not have an expiration date and may be suspended or terminated at any time by the Board. All shares repurchased are held in treasury.
85
Table of Contents
MOBILE MINI, INC.
NOTES TO CONSOLIDATED FINANCIAL STATEMENTS — (Continued)
During fiscal 2014, the Company purchased approximately 649,000 shares of its common stock at a cost of $25 million under the authorized share repurchase program and approximately $100 million is available for repurchase as of December 31, 2014. In addition, the Company withheld approximately 25,000 shares of stock from employees, for an approximate value of $1.0 million, upon vesting of share awards to satisfy minimum tax withholding obligations. These shares were not acquired pursuant to the share repurchase program.
| (14) Restructuring | Costs |
The Company has undergone restructuring actions to align its business operations, including the termination of its consumer initiative program in August 2012 and the transition of key leadership positions in 2012 and 2013. The Company’s U.K. operations restructured one of their locations at the end of 2013 and additionally sold the Belfast, North Ireland location in the second quarter of 2014. In addition, the Company’s field management and sales force structures in North America were realigned in 2014 along with other organizational changes. The majority of accrued restructuring obligations were related to the Company’s operations in North America.
The following table details accrued restructuring obligations (included in accrued liabilities in the Consolidated Balance Sheets) and related activity for the years ended December 31, 2012, 2013 and 2014:
| Severance and Benefits |
Lease Abandonment Costs |
Other Costs |
Total | |||||||||||||
| (In thousands) | ||||||||||||||||
| Accrued obligations as of January 1, 2012 |
$ | — | $ | 2,129 | $ | — | $ | 2,129 | ||||||||
| Restructuring expense |
5,976 | 1,007 | 140 | 7,123 | ||||||||||||
| Settlement of obligations |
(3,433 | ) | (1,566 | ) | (140 | ) | (5,139 | ) | ||||||||
|
|
|
|
|
|
|
|
|
|||||||||
| Accrued obligations as of December 31, 2012 |
2,543 | 1,570 | — | 4,113 | ||||||||||||
| Restructuring expense |
1,787 | 475 | 140 | 2,402 | ||||||||||||
| Settlement of obligations |
(3,717 | ) | (982 | ) | (140 | ) | (4,839 | ) | ||||||||
|
|
|
|
|
|
|
|
|
|||||||||
| Accrued obligations as of December 31, 2013 |
613 | 1,063 | — | 1,676 | ||||||||||||
| Restructuring expense |
1,826 | 318 | 1,398 | 3,542 | ||||||||||||
| Settlement of obligations |
(1,998 | ) | (705 | ) | (1,398 | ) | (4,101 | ) | ||||||||
|
|
|
|
|
|
|
|
|
|||||||||
| Accrued obligations as of December 31, 2014 |
$ | 441 | $ | 676 | $ | — | $ | 1,117 | ||||||||
|
|
|
|
|
|
|
|
|
|||||||||
The majority of accrued obligations are expected to be paid out through the year 2015, with the exception of a lease that will continue into the first quarter of 2019.
The following amounts are included in restructuring expense for the years ended December 31:
| 2012 | 2013 | 2014 | ||||||||||
| (In thousands) | ||||||||||||
| Severance and benefits |
$ | 5,976 | $ | 1,787 | $ | 1,826 | ||||||
| Lease abandonment costs |
1,007 | 475 | 318 | |||||||||
| Other costs(1) |
140 | 140 | 1,398 | |||||||||
|
|
|
|
|
|
|
|||||||
| Restructuring expenses |
$ | 7,123 | $ | 2,402 | $ | 3,542 | ||||||
|
|
|
|
|
|
|
|||||||
| (1) | Other costs for 2014 include the sale of the Company’s Belfast, Northern Ireland location. |
86
Table of Contents
MOBILE MINI, INC.
NOTES TO CONSOLIDATED FINANCIAL STATEMENTS — (Continued)
| (15) Segment | Reporting |
Prior to the ETS Acquisition, the Company’s operations were comprised of two reportable segments: North America and the U.K., both of which offer portable storage solutions. Discrete financial data on each of the Company’s products is not available and it would be impractical to collect and maintain financial data in such a manner. As a result of the ETS Acquisition, the Company established a new specialty containment reporting segment. The assets and liabilities of ETS are included in Mobile Mini’s December 31, 2014 consolidated balance sheet and operations related to ETS are included in Mobile Mini’s consolidated results from the acquisition date of December 10, 2014 through the end of the year.
The results for each segment are reviewed discretely by senior management. Within their segment, locations generally have similar economic characteristics covering all products leased or sold, including customer base, sales personnel, advertising, yard facilities, general and administrative costs and field operations management.
All of the Company’s locations operate in their local currency and, although the Company is exposed to foreign exchange rate fluctuation in other foreign markets where the Company leases and sells its products, the Company does not believe such exposure will have a significant impact on its results of operations.
The following tables set forth certain information regarding each of the Company’s segments for the years ended December 31, 2012, 2013 and 2014 (1).
| For the Year Ended December 31, 2012 | ||||||||||||||||||||
| Portable Storage | ||||||||||||||||||||
| North America |
United Kingdom |
Total | Specialty Containment |
Consolidated | ||||||||||||||||
| (In thousands) | ||||||||||||||||||||
| Revenues: |
||||||||||||||||||||
| Leasing |
$ | 278,330 | $ | 61,645 | $ | 339,975 | $ | — | $ | 339,975 | ||||||||||
| Sales |
33,845 | 3,914 | 37,759 | — | 37,759 | |||||||||||||||
| Other |
1,901 | 261 | 2,162 | — | 2,162 | |||||||||||||||
|
|
|
|
|
|
|
|
|
|
|
|||||||||||
| Total revenues |
314,076 | 65,820 | 379,896 | — | 379,896 | |||||||||||||||
|
|
|
|
|
|
|
|
|
|
|
|||||||||||
| Costs and expenses: |
||||||||||||||||||||
| Cost of sales |
20,631 | 2,547 | 23,178 | — | 23,178 | |||||||||||||||
| Leasing, selling and general expenses |
175,506 | 43,203 | 218,709 | — | 218,709 | |||||||||||||||
| Restructuring expenses |
6,755 | 368 | 7,123 | — | 7,123 | |||||||||||||||
| Asset impairment charge, net |
— | — | — | — | — | |||||||||||||||
| Depreciation and amortization |
28,359 | 7,623 | 35,982 | — | 35,982 | |||||||||||||||
|
|
|
|
|
|
|
|
|
|
|
|||||||||||
| Total costs and expenses |
231,251 | 53,741 | 284,992 | — | 284,992 | |||||||||||||||
|
|
|
|
|
|
|
|
|
|
|
|||||||||||
| Income from operations |
$ | 82,825 | $ | 12,079 | $ | 94,904 | $ | — | $ | 94,904 | ||||||||||
|
|
|
|
|
|
|
|
|
|
|
|||||||||||
| Interest expense |
$ | 35,423 | $ | 1,845 | $ | 37,268 | $ | — | $ | 37,268 | ||||||||||
| Income tax provision |
17,234 | 1,275 | 18,509 | — | 18,509 | |||||||||||||||
87
Table of Contents
MOBILE MINI, INC.
NOTES TO CONSOLIDATED FINANCIAL STATEMENTS — (Continued)
| For the Year Ended December 31, 2013 | ||||||||||||||||||||
| Portable Storage | ||||||||||||||||||||
| North America |
United Kingdom |
Total | Specialty Containment |
Consolidated | ||||||||||||||||
| (In thousands) | ||||||||||||||||||||
| Revenues: |
||||||||||||||||||||
| Leasing |
$ | 299,676 | $ | 66,610 | $ | 366,286 | $ | — | $ | 366,286 | ||||||||||
| Sales |
29,809 | 8,242 | 38,051 | — | 38,051 | |||||||||||||||
| Other |
1,767 | 382 | 2,149 | — | 2,149 | |||||||||||||||
|
|
|
|
|
|
|
|
|
|
|
|||||||||||
| Total revenues |
331,252 | 75,234 | 406,486 | — | 406,486 | |||||||||||||||
|
|
|
|
|
|
|
|
|
|
|
|||||||||||
| Costs and expenses: |
||||||||||||||||||||
| Cost of sales |
19,128 | 6,285 | 25,413 | — | 25,413 | |||||||||||||||
| Leasing, selling and general expenses |
190,337 | 47,230 | 237,567 | — | 237,567 | |||||||||||||||
| Restructuring expenses |
2,141 | 261 | 2,402 | — | 2,402 | |||||||||||||||
| Asset impairment charge, net |
32,157 | 6,548 | 38,705 | — | 38,705 | |||||||||||||||
| Depreciation and amortization |
28,614 | 6,818 | 35,432 | — | 35,432 | |||||||||||||||
|
|
|
|
|
|
|
|
|
|
|
|||||||||||
| Total costs and expenses |
272,377 | 67,142 | 339,519 | — | 339,519 | |||||||||||||||
|
|
|
|
|
|
|
|
|
|
|
|||||||||||
| Income from operations |
$ | 58,875 | $ | 8,092 | $ | 66,967 | $ | — | $ | 66,967 | ||||||||||
|
|
|
|
|
|
|
|
|
|
|
|||||||||||
| Interest expense |
$ | 28,348 | $ | 1,119 | $ | 29,467 | $ | — | $ | 29,467 | ||||||||||
| Income tax provision |
12,258 | 17 | 12,275 | — | 12,275 | |||||||||||||||
| For the Year Ended December 31, 2014 | ||||||||||||||||||||
| Portable Storage | ||||||||||||||||||||
| North America |
United Kingdom |
Total | Specialty Containment |
Consolidated | ||||||||||||||||
| (In thousands) | ||||||||||||||||||||
| Revenues: |
||||||||||||||||||||
| Leasing |
$ | 323,236 | $ | 81,703 | $ | 404,939 | $ | 5,423 | $ | 410,362 | ||||||||||
| Sales |
26,834 | 4,588 | 31,422 | 163 | 31,585 | |||||||||||||||
| Other |
2,274 | 407 | 2,681 | 846 | 3,527 | |||||||||||||||
|
|
|
|
|
|
|
|
|
|
|
|||||||||||
| Total revenues |
352,344 | 86,698 | 439,042 | 6,432 | 445,474 | |||||||||||||||
|
|
|
|
|
|
|
|
|
|
|
|||||||||||
| Costs and expenses: |
||||||||||||||||||||
| Cost of sales |
18,251 | 3,587 | 21,838 | 106 | 21,944 | |||||||||||||||
| Leasing, selling and general expenses |
221,405 | 56,189 | 277,594 | 3,354 | 280,948 | |||||||||||||||
| Restructuring expenses |
1,915 | 1,627 | 3,542 | — | 3,542 | |||||||||||||||
| Asset impairment charge, net |
433 | 124 | 557 | — | 557 | |||||||||||||||
| Depreciation and amortization |
30,670 | 6,790 | 37,460 | 1,874 | 39,334 | |||||||||||||||
|
|
|
|
|
|
|
|
|
|
|
|||||||||||
| Total costs and expenses |
272,674 | 68,317 | 340,991 | 5,334 | 346,325 | |||||||||||||||
|
|
|
|
|
|
|
|
|
|
|
|||||||||||
| Income from operations |
$ | 79,670 | $ | 18,381 | $ | 98,051 | $ | 1,098 | $ | 99,149 | ||||||||||
|
|
|
|
|
|
|
|
|
|
|
|||||||||||
| Interest expense |
$ | 27,816 | $ | 905 | $ | 28,721 | $ | 8 | $ | 28,729 | ||||||||||
| Income tax provision |
21,580 | 4,042 | 25,622 | 411 | 26,033 | |||||||||||||||
| (1) | Includes revenues in the U.S. of $307.1 million, $324.9 million and $353.2 million for the fiscal years 2012, 2013 and 2014, respectively. |
88
Table of Contents
MOBILE MINI, INC.
NOTES TO CONSOLIDATED FINANCIAL STATEMENTS — (Continued)
The tables below represent the Company’s long-lived assets which consist of lease fleet and property, plant and equipment (1).
| Portable Storage | ||||||||||||||||||||
| North America |
United Kingdom |
Total | Specialty Containment |
Consolidated | ||||||||||||||||
| (In thousands) | ||||||||||||||||||||
| As of December 31: |
||||||||||||||||||||
| 2013 |
$ | 902,183 | $ | 162,246 | $ | 1,064,429 | $ | — | $ | 1,064,429 | ||||||||||
| 2014 |
907,672 | 157,167 | 1,064,839 | 135,392 | 1,200,231 | |||||||||||||||
| (1) | Includes long-lived assets of $884.3 million and $1,029.9 million in the U.S. for the fiscal years 2013 and 2014, respectively. |
| (16) Assets | Held for Sale |
In the second quarter of 2013, the Company conducted field inspections of lease fleet units and other assets. A review was performed to determine the economic feasibility to repair certain assets. The analysis included the determination of fair market value of those assets using a cash flow analysis, less the cost of liquidation, and the current net carrying value. The Company’s senior management reviewed the analysis, the fair value of the assets, the current economy, along with present and projected utilization levels, and determined to place the assets for sale that were deemed to be either non-core to the Company’s leasing strategy or uneconomic to repair. In connection with this action, the Company recorded an asset impairment charge of $40.2 million in the second quarter of 2013, of which $39.6 million was non-cash. Realized gains and losses resulting from the subsequent sale of these assets are recorded as a decrease or an increase to the original impairment charge in the statements of income and the proceeds associated with the disposal of these assets, excluding inventories, is recorded as investing activities in statements of cash flows. All of the assets were sold as of June 30, 2014.
The following table sets forth the information on the assets classified as held for sale in 2013 and the subsequent changes to the assets’ fair value as of December 31, 2014:
| North America |
U.K. | Total | ||||||||||
| (In thousands) | ||||||||||||
| Balance at December 31, 2013 |
$ | 904 | $ | 76 | $ | 980 | ||||||
| Sale proceeds |
(310 | ) | (183 | ) | (493 | ) | ||||||
| Additional net loss upon sale |
(433 | ) | (124 | ) | (557 | ) | ||||||
| Other changes, net |
(161 | ) | 230 | 69 | ||||||||
| Effect of exchange rate changes |
— | 1 | 1 | |||||||||
|
|
|
|
|
|
|
|||||||
| Balance at December 31, 2014 |
$ | — | $ | — | $ | — | ||||||
|
|
|
|
|
|
|
|||||||
89
Table of Contents
MOBILE MINI, INC.
NOTES TO CONSOLIDATED FINANCIAL STATEMENTS — (Continued)
| (17) Discontinued | Operation |
In December 2013, the Company entered into a share sale and purchase agreement with Caru Group B.V. to sell Mobile Mini Holding B.V., comprising the Company’s Netherlands operation. In connection with this transaction, the Company recorded a $1.2 million after-tax loss on the sale in 2013. The transaction closed on December 31, 2013, and the Company received proceeds of $0.7 million. The results of operations of our Netherlands business are reported within discontinued operation in the consolidated financial statements. Summarized results of the Company’s Netherlands operation are as follows:
| Years Ended December 31, | ||||||||
| 2012 | 2013 | |||||||
| (In thousands) | ||||||||
| Revenues |
$ | 1,363 | $ | 1,895 | ||||
| Loss from operations, including loss on disposition of $1.9 million |
$ | (216 | ) | $ | (2,101 | ) | ||
| Other expenses |
(72 | ) | (64 | ) | ||||
| Income tax benefit |
43 | 863 | ||||||
|
|
|
|
|
|||||
| Loss from discontinued operations, net of tax |
$ | (245 | ) | $ | (1,302 | ) | ||
|
|
|
|
|
|||||
Summarized results of the Netherlands cash flow activities are as follows:
| Years Ended December 31, | ||||||||
| 2012 | 2013 | |||||||
| (In thousands) | ||||||||
| Net cash used in operating activities |
$ | (466 | ) | $ | (861 | ) | ||
| Net cash (used in) provided by investing activities |
(95 | ) | 896 | |||||
90
Table of Contents
MOBILE MINI, INC.
NOTES TO CONSOLIDATED FINANCIAL STATEMENTS — (Continued)
| (18) Selected | Consolidated Quarterly Financial Data (unaudited) |
The following table sets forth certain unaudited selected consolidated financial information for each of the four quarters in the years ended December 31, 2013 and 2014. In management’s opinion, this unaudited consolidated quarterly selected information has been prepared on the same basis as the audited consolidated financial statements and includes all necessary adjustments, consisting only of normal recurring adjustments, which management considers necessary for a fair presentation when read in conjunction with the Consolidated Financial Statements and notes. The Company believes these comparisons of consolidated quarterly selected financial data are not necessarily indicative of future performance. The Company sold its Netherlands operation on December 31, 2013, and as a result, this operation is reflected as a discontinued operation in the 2013 quarterly tables below.
Quarterly EPS may not total to the fiscal year EPS due to the weighted average number of shares outstanding at the end of each period reported and rounding.
| First Quarter |
Second Quarter |
Third Quarter |
Fourth Quarter |
|||||||||||||
| (In thousands) | ||||||||||||||||
| 2013 |
||||||||||||||||
| Leasing revenue |
$ | 84,875 | $ | 88,032 | $ | 95,559 | $ | 97,820 | ||||||||
| Total revenues |
97,512 | 97,135 | 105,040 | 106,799 | ||||||||||||
| Gross profit on sales |
3,745 | 3,142 | 2,977 | 2,774 | ||||||||||||
| Income (loss) from operations |
27,012 | (15,006 | ) | 27,001 | 27,960 | |||||||||||
| Income (loss) from continuing operations |
12,119 | (14,319 | ) | 14,332 | 13,092 | |||||||||||
| Earnings (loss) per share: |
||||||||||||||||
| Basic |
0.27 | (0.32 | ) | 0.31 | 0.29 | |||||||||||
| Diluted |
0.26 | (0.31 | ) | 0.31 | 0.28 | |||||||||||
| Net income (loss) |
12,042 | (14,381 | ) | 14,303 | 11,958 | |||||||||||
| First Quarter |
Second Quarter |
Third Quarter |
Fourth Quarter |
|||||||||||||
| (In thousands) | ||||||||||||||||
| 2014 |
||||||||||||||||
| Leasing revenue |
$ | 94,080 | $ | 98,041 | $ | 104,798 | $ | 113,443 | ||||||||
| Total revenues |
102,404 | 106,533 | 113,322 | 123,215 | ||||||||||||
| Gross profit on sales |
2,313 | 2,603 | 2,714 | 2,011 | ||||||||||||
| Income from operations |
18,482 | 21,695 | 30,171 | 28,801 | ||||||||||||
| Net income |
7,440 | 9,263 | 14,820 | 12,863 | ||||||||||||
| Earnings per share: |
||||||||||||||||
| Basic |
0.16 | 0.20 | 0.32 | 0.28 | ||||||||||||
| Diluted |
0.16 | 0.20 | 0.32 | 0.28 | ||||||||||||
91
Table of Contents
MOBILE MINI, INC.
NOTES TO CONSOLIDATED FINANCIAL STATEMENTS — (Continued)
| (19) Condensed | Consolidating Financial Information for Guarantors |
The following tables reflect the condensed consolidating financial information of the Company’s subsidiary guarantors of the Senior Notes and its non-guarantor subsidiaries. Separate financial statements of the subsidiary guarantors are not presented because the guarantee by each 100% owned subsidiary guarantor is full and unconditional, joint and several, subject to customer exceptions, and management has determined that such information is not material to investors.
MOBILE MINI, INC.
CONDENSED CONSOLIDATING BALANCE SHEETS
As of December 31, 2013
(In thousands)
| Guarantors | Non- Guarantors |
Eliminations | Consolidated | |||||||||||||
| ASSETS | ||||||||||||||||
| Cash and cash equivalents |
$ | (190 | ) | $ | 1,446 | $ | — | $ | 1,256 | |||||||
| Receivables, net |
35,378 | 17,726 | — | 53,104 | ||||||||||||
| Inventories |
16,855 | 1,889 | — | 18,744 | ||||||||||||
| Lease fleet, net |
817,945 | 161,331 | — | 979,276 | ||||||||||||
| Property, plant and equipment, net |
66,376 | 18,777 | — | 85,153 | ||||||||||||
| Assets held for sale |
800 | 180 | — | 980 | ||||||||||||
| Deposits and prepaid expenses |
4,711 | 1,405 | — | 6,116 | ||||||||||||
| Deferred financing costs, net and other assets |
10,976 | 1 | — | 10,977 | ||||||||||||
| Intangibles, net |
1,260 | 1,286 | — | 2,546 | ||||||||||||
| Goodwill |
445,131 | 74,091 | — | 519,222 | ||||||||||||
| Intercompany receivables |
153,885 | 32,560 | (186,445 | ) | — | |||||||||||
|
|
|
|
|
|
|
|
|
|||||||||
| Total assets |
$ | 1,553,127 | $ | 310,692 | $ | (186,445 | ) | $ | 1,677,374 | |||||||
|
|
|
|
|
|
|
|
|
|||||||||
| LIABILITIES AND STOCKHOLDERS’ EQUITY | ||||||||||||||||
| Liabilities: |
||||||||||||||||
| Accounts payable |
$ | 10,334 | $ | 8,528 | $ | — | $ | 18,862 | ||||||||
| Accrued liabilities |
58,595 | 6,713 | — | 65,308 | ||||||||||||
| Lines of credit |
307,008 | 12,306 | — | 319,314 | ||||||||||||
| Obligations under capital leases |
8,781 | — | — | 8,781 | ||||||||||||
| Senior Notes |
200,000 | — | — | 200,000 | ||||||||||||
| Deferred income taxes |
196,164 | 14,390 | (989 | ) | 209,565 | |||||||||||
| Intercompany payables |
— | 134 | (134 | ) | — | |||||||||||
|
|
|
|
|
|
|
|
|
|||||||||
| Total liabilities |
780,882 | 42,071 | (1,123 | ) | 821,830 | |||||||||||
|
|
|
|
|
|
|
|
|
|||||||||
| Commitments and contingencies |
||||||||||||||||
| Stockholders’ equity: |
||||||||||||||||
| Common stock |
488 | 18,436 | (18,436 | ) | 488 | |||||||||||
| Additional paid-in capital |
550,387 | 167,730 | (167,730 | ) | 550,387 | |||||||||||
| Retained earnings |
261,039 | 97,895 | 844 | 359,778 | ||||||||||||
| Accumulated other comprehensive loss |
— | (15,440 | ) | — | (15,440 | ) | ||||||||||
| Treasury stock, at cost |
(39,669 | ) | — | — | (39,669 | ) | ||||||||||
|
|
|
|
|
|
|
|
|
|||||||||
| Total stockholders’ equity |
772,245 | 268,621 | (185,322 | ) | 855,544 | |||||||||||
|
|
|
|
|
|
|
|
|
|||||||||
| Total liabilities and stockholders’ equity |
$ | 1,553,127 | $ | 310,692 | $ | (186,445 | ) | $ | 1,677,374 | |||||||
|
|
|
|
|
|
|
|
|
|||||||||
92
Table of Contents
MOBILE MINI, INC.
NOTES TO CONSOLIDATED FINANCIAL STATEMENTS — (Continued)
MOBILE MINI, INC.
CONDENSED CONSOLIDATING BALANCE SHEETS
As of December 31, 2014
(In thousands)
| Guarantors | Non- Guarantors |
Eliminations | Consolidated | |||||||||||||
| ASSETS | ||||||||||||||||
| Cash and cash equivalents |
$ | 2,977 | $ | 762 | $ | — | $ | 3,739 | ||||||||
| Receivables, net |
62,033 | 18,998 | — | 81,031 | ||||||||||||
| Inventories |
15,371 | 1,365 | — | 16,736 | ||||||||||||
| Lease fleet, net |
934,433 | 152,623 | — | 1,087,056 | ||||||||||||
| Property, plant and equipment, net |
95,509 | 17,666 | — | 113,175 | ||||||||||||
| Deposits and prepaid expenses |
7,375 | 1,211 | — | 8,586 | ||||||||||||
| Deferred financing costs, net and other assets |
8,858 | — | — | 8,858 | ||||||||||||
| Intangibles, net |
77,629 | 756 | — | 78,385 | ||||||||||||
| Goodwill |
635,943 | 69,665 | — | 705,608 | ||||||||||||
| Intercompany receivables |
145,018 | 33,971 | (178,989 | ) | — | |||||||||||
|
|
|
|
|
|
|
|
|
|||||||||
| Total assets |
$ | 1,985,146 | $ | 297,017 | $ | (178,989 | ) | $ | 2,103,174 | |||||||
|
|
|
|
|
|
|
|
|
|||||||||
| LIABILITIES AND STOCKHOLDERS’ EQUITY | ||||||||||||||||
| Liabilities: |
||||||||||||||||
| Accounts payable |
$ | 14,803 | $ | 8,130 | $ | — | $ | 22,933 | ||||||||
| Accrued liabilities |
56,104 | 7,623 | — | 63,727 | ||||||||||||
| Lines of credit |
702,135 | 3,383 | — | 705,518 | ||||||||||||
| Obligations under capital leases |
24,760 | 158 | — | 24,918 | ||||||||||||
| Senior Notes |
200,000 | — | — | 200,000 | ||||||||||||
| Deferred income taxes |
215,184 | 17,367 | (1,004 | ) | 231,547 | |||||||||||
| Intercompany payables |
— | 94 | (94 | ) | — | |||||||||||
|
|
|
|
|
|
|
|
|
|||||||||
| Total liabilities |
1,212,986 | 36,755 | (1,098 | ) | 1,248,643 | |||||||||||
|
|
|
|
|
|
|
|
|
|||||||||
| Commitments and contingencies |
||||||||||||||||
| Stockholders’ equity: |
||||||||||||||||
| Common stock |
490 | 18,388 | (18,388 | ) | 490 | |||||||||||
| Additional paid-in capital |
569,083 | 160,347 | (160,347 | ) | 569,083 | |||||||||||
| Retained earnings |
268,263 | 111,397 | 844 | 380,504 | ||||||||||||
| Accumulated other comprehensive loss |
— | (29,870 | ) | — | (29,870 | ) | ||||||||||
| Treasury stock, at cost |
(65,676 | ) | — | — | (65,676 | ) | ||||||||||
|
|
|
|
|
|
|
|
|
|||||||||
| Total stockholders’ equity |
772,160 | 260,262 | (177,891 | ) | 854,531 | |||||||||||
|
|
|
|
|
|
|
|
|
|||||||||
| Total liabilities and stockholders’ equity |
$ | 1,985,146 | $ | 297,017 | $ | (178,989 | ) | $ | 2,103,174 | |||||||
|
|
|
|
|
|
|
|
|
|||||||||
93
Table of Contents
MOBILE MINI, INC.
NOTES TO CONSOLIDATED FINANCIAL STATEMENTS — (Continued)
MOBILE MINI, INC.
CONDENSED CONSOLIDATING STATEMENTS OF INCOME
For the Year Ended December 31, 2012
(In thousands)
| Guarantors | Non- Guarantors |
Eliminations | Consolidated | |||||||||||||
| Revenues: |
$ | 272,530 | $ | 67,445 | $ | — | $ | 339,975 | ||||||||
| Leasing |
32,794 | 4,965 | — | 37,759 | ||||||||||||
| Sales |
1,871 | 291 | — | 2,162 | ||||||||||||
|
|
|
|
|
|
|
|
|
|||||||||
| Other |
307,195 | 72,701 | — | 379,896 | ||||||||||||
|
|
|
|
|
|
|
|
|
|||||||||
| Total revenues |
||||||||||||||||
| Costs and expenses: |
||||||||||||||||
| Cost of sales |
19,836 | 3,342 | — | 23,178 | ||||||||||||
| Leasing, selling and general expenses |
170,240 | 48,469 | — | 218,709 | ||||||||||||
| Restructuring expenses |
6,755 | 368 | — | 7,123 | ||||||||||||
| Depreciation and amortization |
27,784 | 8,198 | — | 35,982 | ||||||||||||
|
|
|
|
|
|
|
|
|
|||||||||
| Total costs and expenses |
224,615 | 60,377 | — | 284,992 | ||||||||||||
|
|
|
|
|
|
|
|
|
|||||||||
| Income from operations |
82,580 | 12,324 | — | 94,904 | ||||||||||||
| Other income (expense): |
||||||||||||||||
| Interest income |
591 | — | (590 | ) | 1 | |||||||||||
| Interest expense |
(34,624 | ) | (3,234 | ) | 590 | (37,268 | ) | |||||||||
| Dividend income |
865 | — | (865 | ) | — | |||||||||||
| Debt restructuring expense |
(2,812 | ) | — | — | (2,812 | ) | ||||||||||
| Deferred financing costs write-off |
(1,889 | ) | — | — | (1,889 | ) | ||||||||||
| Foreign currency exchange |
— | (4 | ) | — | (4 | ) | ||||||||||
|
|
|
|
|
|
|
|
|
|||||||||
| Income from continuing operations before income tax provision |
44,711 | 9,086 | (865 | ) | 52,932 | |||||||||||
| Income tax provision |
17,448 | 1,153 | (92 | ) | 18,509 | |||||||||||
|
|
|
|
|
|
|
|
|
|||||||||
| Income from continuing operations |
27,263 | 7,933 | (773 | ) | 34,423 | |||||||||||
| Loss from discontinued operation, net of tax |
— | (245 | ) | — | (245 | ) | ||||||||||
|
|
|
|
|
|
|
|
|
|||||||||
| Net income |
$ | 27,263 | $ | 7,688 | $ | (773 | ) | $ | 34,178 | |||||||
|
|
|
|
|
|
|
|
|
|||||||||
MOBILE MINI, INC.
CONDENSED CONSOLIDATING STATEMENTS OF COMPREHENSIVE INCOME
For the Year Ended December 31, 2012
(In thousands)
| Guarantors | Non- Guarantors |
Eliminations | Consolidated | |||||||||||||
| Net income |
$ | 27,263 | $ | 7,688 | $ | (773 | ) | $ | 34,178 | |||||||
| Other comprehensive income : |
||||||||||||||||
| Foreign currency translation adjustment, net of income tax expense of $64 |
— | 7,987 | — | 7,987 | ||||||||||||
|
|
|
|
|
|
|
|
|
|||||||||
| Other comprehensive income |
— | 7,987 | — | 7,987 | ||||||||||||
|
|
|
|
|
|
|
|
|
|||||||||
| Comprehensive income |
$ | 27,263 | $ | 15,675 | $ | (773 | ) | $ | 42,165 | |||||||
|
|
|
|
|
|
|
|
|
|||||||||
94
Table of Contents
MOBILE MINI, INC.
NOTES TO CONSOLIDATED FINANCIAL STATEMENTS — (Continued)
MOBILE MINI, INC.
CONDENSED CONSOLIDATING STATEMENTS OF INCOME
For the Year Ended December 31, 2013
(In thousands)
| Guarantors | Non- Guarantors |
Eliminations | Consolidated | |||||||||||||
| Revenues: |
$ | 293,878 | $ | 72,408 | $ | — | $ | 366,286 | ||||||||
| Leasing |
29,310 | 8,741 | — | 38,051 | ||||||||||||
| Sales |
1,751 | 398 | — | 2,149 | ||||||||||||
|
|
|
|
|
|
|
|
|
|||||||||
| Other |
324,939 | 81,547 | — | 406,486 | ||||||||||||
|
|
|
|
|
|
|
|
|
|||||||||
| Total revenues |
||||||||||||||||
| Costs and expenses: |
||||||||||||||||
| Cost of sales |
18,784 | 6,629 | — | 25,413 | ||||||||||||
| Leasing, selling and general expenses |
185,834 | 51,733 | — | 237,567 | ||||||||||||
| Restructuring expenses |
2,140 | 262 | — | 2,402 | ||||||||||||
| Asset impairment charge, net |
32,156 | 6,549 | — | 38,705 | ||||||||||||
| Depreciation and amortization |
28,084 | 7,348 | — | 35,432 | ||||||||||||
|
|
|
|
|
|
|
|
|
|||||||||
| Total costs and expenses |
266,998 | 72,521 | — | 339,519 | ||||||||||||
|
|
|
|
|
|
|
|
|
|||||||||
| Income from operations |
57,941 | 9,026 | — | 66,967 | ||||||||||||
| Other income (expense): |
||||||||||||||||
| Interest income |
250 | — | (249 | ) | 1 | |||||||||||
| Interest expense |
(27,726 | ) | (1,990 | ) | 249 | (29,467 | ) | |||||||||
| Dividend income |
274 | — | (274 | ) | — | |||||||||||
| Foreign currency exchange |
— | (2 | ) | — | (2 | ) | ||||||||||
|
|
|
|
|
|
|
|
|
|||||||||
| Income from continuing operations before income tax provision |
30,739 | 7,034 | (274 | ) | 37,499 | |||||||||||
| Income tax provision |
12,355 | (35 | ) | (45 | ) | 12,275 | ||||||||||
|
|
|
|
|
|
|
|
|
|||||||||
| Income from continuing operations |
18,384 | 7,069 | (229 | ) | 25,224 | |||||||||||
| Loss from discontinued operation, net of tax |
(1,229 | ) | (73 | ) | — | (1,302 | ) | |||||||||
|
|
|
|
|
|
|
|
|
|||||||||
| Net income |
$ | 17,155 | $ | 6,996 | $ | (229 | ) | $ | 23,922 | |||||||
|
|
|
|
|
|
|
|
|
|||||||||
MOBILE MINI, INC.
CONDENSED CONSOLIDATING STATEMENTS OF COMPREHENSIVE INCOME
For the Year Ended December 31, 2013
(In thousands)
| Guarantors | Non- Guarantors |
Eliminations | Consolidated | |||||||||||||
| Net income |
$ | 17,155 | $ | 6,996 | $ | (229 | ) | $ | 23,922 | |||||||
| Other comprehensive income : |
||||||||||||||||
| Foreign currency translation adjustment, net of income tax benefit of $194 |
— | 2,377 | — | 2,377 | ||||||||||||
|
|
|
|
|
|
|
|
|
|||||||||
| Other comprehensive income |
— | 2,377 | — | 2,377 | ||||||||||||
|
|
|
|
|
|
|
|
|
|||||||||
| Comprehensive income |
$ | 17,155 | $ | 9,373 | $ | (229 | ) | $ | 26,299 | |||||||
|
|
|
|
|
|
|
|
|
|||||||||
95
Table of Contents
MOBILE MINI, INC.
NOTES TO CONSOLIDATED FINANCIAL STATEMENTS — (Continued)
MOBILE MINI, INC.
CONDENSED CONSOLIDATING STATEMENTS OF INCOME
For the Year Ended December 31, 2014
(In thousands)
| Guarantors | Non- Guarantors |
Eliminations | Consolidated | |||||||||||||
| Revenues: |
||||||||||||||||
| Leasing |
$ | 323,563 | $ | 86,799 | $ | — | $ | 410,362 | ||||||||
| Sales |
26,524 | 5,061 | — | 31,585 | ||||||||||||
| Other |
3,112 | 415 | — | 3,527 | ||||||||||||
|
|
|
|
|
|
|
|
|
|||||||||
| Total revenues |
353,199 | 92,275 | — | 445,474 | ||||||||||||
|
|
|
|
|
|
|
|
|
|||||||||
| Costs and expenses: |
||||||||||||||||
| Cost of sales |
17,887 | 4,057 | — | 21,944 | ||||||||||||
| Leasing, selling and general expenses |
220,951 | 59,997 | — | 280,948 | ||||||||||||
| Restructuring expenses |
1,915 | 1,627 | — | 3,542 | ||||||||||||
| Asset impairment charge, net |
416 | 141 | — | 557 | ||||||||||||
| Depreciation and amortization |
32,007 | 7,327 | — | 39,334 | ||||||||||||
|
|
|
|
|
|
|
|
|
|||||||||
| Total costs and expenses |
273,176 | 73,149 | — | 346,325 | ||||||||||||
|
|
|
|
|
|
|
|
|
|||||||||
| Income from operations |
80,023 | 19,126 | — | 99,149 | ||||||||||||
| Other income (expense): |
||||||||||||||||
| Interest income |
81 | — | (81 | ) | — | |||||||||||
| Interest expense |
(27,229 | ) | (1,581 | ) | 81 | (28,729 | ) | |||||||||
| Dividend income |
— | — | — | — | ||||||||||||
| Foreign currency exchange |
— | (1 | ) | — | (1 | ) | ||||||||||
|
|
|
|
|
|
|
|
|
|||||||||
| Income from continuing operations before income tax provision |
52,875 | 17,544 | — | 70,419 | ||||||||||||
| Income tax provision |
21,991 | 4,042 | — | 26,033 | ||||||||||||
|
|
|
|
|
|
|
|
|
|||||||||
| Net income |
$ | 30,884 | $ | 13,502 | $ | — | $ | 44,386 | ||||||||
|
|
|
|
|
|
|
|
|
|||||||||
MOBILE MINI, INC.
CONDENSED CONSOLIDATING STATEMENTS OF COMPREHENSIVE INCOME
For the Year Ended December 31, 2014
(In thousands)
| Guarantors | Non- Guarantors |
Eliminations | Consolidated | |||||||||||||
| Net income |
$ | 30,884 | $ | 13,502 | $ | — | $ | 44,386 | ||||||||
| Other comprehensive income : |
||||||||||||||||
| Foreign currency translation adjustment, net of income tax benefit of $213 |
— | (14,430 | ) | — | (14,430 | ) | ||||||||||
|
|
|
|
|
|
|
|
|
|||||||||
| Other comprehensive loss |
— | (14,430 | ) | — | (14,430 | ) | ||||||||||
|
|
|
|
|
|
|
|
|
|||||||||
| Comprehensive income (loss) |
$ | 30,884 | $ | (928 | ) | $ | — | $ | 29,956 | |||||||
|
|
|
|
|
|
|
|
|
|||||||||
96
Table of Contents
MOBILE MINI, INC.
NOTES TO CONSOLIDATED FINANCIAL STATEMENTS — (Continued)
MOBILE MINI, INC.
CONDENSED CONSOLIDATING STATEMENTS OF CASH FLOWS
For the Year Ended December 31, 2012
(In thousands)
| Guarantors | Non- Guarantors |
Eliminations | Consolidated | |||||||||||||
| Cash Flows from Operating Activities: |
||||||||||||||||
| Net income |
$ | 27,263 | $ | 7,688 | $ | (773 | ) | $ | 34,178 | |||||||
| Adjustments to reconcile net income to net cash provided by operating activities: |
||||||||||||||||
| Debt restructuring expense |
2,812 | — | — | 2,812 | ||||||||||||
| Deferred financing costs |
1,889 | — | — | 1,889 | ||||||||||||
| Provision for doubtful accounts |
1,618 | 561 | — | 2,179 | ||||||||||||
| Amortization of deferred financing costs |
3,144 | 73 | — | 3,217 | ||||||||||||
| Amortization of debt issuance discount |
49 | — | — | 49 | ||||||||||||
| Amortization of long-term liabilities |
156 | 11 | — | 167 | ||||||||||||
| Share-based compensation expense |
9,003 | 572 | — | 9,575 | ||||||||||||
| Depreciation and amortization |
27,784 | 8,403 | — | 36,187 | ||||||||||||
| Gain on sale of lease fleet units |
(10,430 | ) | (1,351 | ) | — | (11,781 | ) | |||||||||
| Gain on disposal of property, plant and equipment |
(87 | ) | (43 | ) | — | (130 | ) | |||||||||
| Deferred income taxes |
17,074 | 1,111 | (78 | ) | 18,107 | |||||||||||
| Tax shortfall on equity award transactions |
(3 | ) | — | — | (3 | ) | ||||||||||
| Foreign currency loss |
— | 5 | — | 5 | ||||||||||||
| Changes in certain assets and liabilities, net of effect of businesses acquired: |
||||||||||||||||
| Receivables |
(2,369 | ) | (2,709 | ) | — | (5,078 | ) | |||||||||
| Inventories |
1,787 | (435 | ) | — | 1,352 | |||||||||||
| Deposits and prepaid expenses |
807 | (270 | ) | — | 537 | |||||||||||
| Other assets and intangibles |
(10,125 | ) | 9,964 | — | (161 | ) | ||||||||||
| Accounts payable |
338 | (2,222 | ) | — | (1,884 | ) | ||||||||||
| Accrued liabilities |
(980 | ) | 712 | — | (268 | ) | ||||||||||
| Intercompany |
9,806 | (9,765 | ) | (41 | ) | — | ||||||||||
|
|
|
|
|
|
|
|
|
|||||||||
| Net cash provided by operating activities |
79,536 | 12,305 | (892 | ) | 90,949 | |||||||||||
|
|
|
|
|
|
|
|
|
|||||||||
| Cash Flows from Investing Activities: |
||||||||||||||||
| Cash paid for businesses, net of cash acquired |
(3,563 | ) | — | — | (3,563 | ) | ||||||||||
| Additions to lease fleet |
(24,967 | ) | (18,967 | ) | — | (43,934 | ) | |||||||||
| Proceeds from sale of lease fleet units |
25,310 | 4,048 | — | 29,358 | ||||||||||||
| Additions to property, plant and equipment |
(8,229 | ) | (4,512 | ) | — | (12,741 | ) | |||||||||
| Proceeds from sale of property, plant and equipment |
1,025 | 472 | — | 1,497 | ||||||||||||
|
|
|
|
|
|
|
|
|
|||||||||
| Net cash used in investing activities |
(10,424 | ) | (18,959 | ) | — | (29,383 | ) | |||||||||
|
|
|
|
|
|
|
|
|
|||||||||
| Cash Flows from Financing Activities: |
||||||||||||||||
| Net borrowings under lines of credit |
88,414 | 8,828 | — | 97,242 | ||||||||||||
| Redemption of 6.875% senior notes due 2015 |
(150,000 | ) | — | — | (150,000 | ) | ||||||||||
| Redemption premiums of 6.875% senior notes due 2015 |
(2,579 | ) | — | — | (2,579 | ) | ||||||||||
| Deferred financing costs |
(8,075 | ) | — | — | (8,075 | ) | ||||||||||
| Proceeds from issuance of note payable |
398 | — | — | 398 | ||||||||||||
| Principal payments on notes payable |
(403 | ) | — | — | (403 | ) | ||||||||||
| Principal payments on capital lease obligations |
(947 | ) | — | — | (947 | ) | ||||||||||
| Issuance of common stock |
3,645 | — | — | 3,645 | ||||||||||||
| Intercompany |
— | (869 | ) | 869 | — | |||||||||||
|
|
|
|
|
|
|
|
|
|||||||||
| Net cash (used in) provided by financing activities |
(69,547 | ) | 7,959 | 869 | (60,719 | ) | ||||||||||
|
|
|
|
|
|
|
|
|
|||||||||
| Effect of exchange rate changes on cash |
— | (1,793 | ) | 23 | (1,770 | ) | ||||||||||
|
|
|
|
|
|
|
|
|
|||||||||
| Net decrease in cash |
(435 | ) | (488 | ) | — | (923 | ) | |||||||||
| Cash and cash equivalents at beginning of year |
1,444 | 1,416 | — | 2,860 | ||||||||||||
|
|
|
|
|
|
|
|
|
|||||||||
| Cash and cash equivalents at end of year |
$ | 1,009 | $ | 928 | $ | — | $ | 1,937 | ||||||||
|
|
|
|
|
|
|
|
|
|||||||||
97
Table of Contents
MOBILE MINI, INC.
NOTES TO CONSOLIDATED FINANCIAL STATEMENTS — (Continued)
MOBILE MINI, INC.
CONDENSED CONSOLIDATING STATEMENTS OF CASH FLOWS
For the Year Ended December 31, 2013
(In thousands)
| Guarantors | Non- Guarantors |
Eliminations | Consolidated | |||||||||||||
| Cash Flows from Operating Activities: |
||||||||||||||||
| Net income |
$ | 17,155 | $ | 6,996 | $ | (229 | ) | $ | 23,922 | |||||||
| Adjustments to reconcile net income to net cash provided by operating activities: |
||||||||||||||||
| Asset impairment charge, net |
31,310 | 6,907 | — | 38,217 | ||||||||||||
| Provision for doubtful accounts |
1,256 | 904 | — | 2,160 | ||||||||||||
| Amortization of deferred financing costs |
2,749 | 62 | — | 2,811 | ||||||||||||
| Amortization of long-term liabilities |
162 | 7 | — | 169 | ||||||||||||
| Share-based compensation expense |
13,991 | 723 | — | 14,714 | ||||||||||||
| Depreciation and amortization |
28,084 | 7,542 | — | 35,626 | ||||||||||||
| Loss (gain) on disposal of discontinued operation |
2,042 | (94 | ) | — | 1,948 | |||||||||||
| Gain on sale of lease fleet units |
(8,035 | ) | (1,647 | ) | — | (9,682 | ) | |||||||||
| Loss on disposal of property, plant and equipment |
237 | 10 | — | 247 | ||||||||||||
| Deferred income taxes |
11,918 | (440 | ) | (466 | ) | 11,012 | ||||||||||
| Tax shortfall on equity award transactions |
(837 | ) | — | — | (837 | ) | ||||||||||
| Foreign currency loss |
— | 1 | — | 1 | ||||||||||||
| Changes in certain assets and liabilities, net of effect of businesses acquired: |
||||||||||||||||
| Receivables |
(1,996 | ) | (3,592 | ) | 1,948 | (3,640 | ) | |||||||||
| Inventories |
(358 | ) | (35 | ) | — | (393 | ) | |||||||||
| Deposits and prepaid expenses |
572 | 81 | — | 653 | ||||||||||||
| Other assets and intangibles |
(364 | ) | 374 | — | 10 | |||||||||||
| Accounts payable |
(212 | ) | 549 | — | 337 | |||||||||||
| Accrued liabilities |
(2,321 | ) | 1,157 | — | (1,164 | ) | ||||||||||
| Intercompany |
(21,506 | ) | 22,440 | (934 | ) | — | ||||||||||
|
|
|
|
|
|
|
|
|
|||||||||
| Net cash provided by operating activities |
73,847 | 41,945 | 319 | 116,111 | ||||||||||||
|
|
|
|
|
|
|
|
|
|||||||||
| Cash Flows from Investing Activities: |
||||||||||||||||
| Proceeds from sale of discontinued operation |
— | 677 | — | 677 | ||||||||||||
| Additions to lease fleet |
(15,623 | ) | (13,203 | ) | — | (28,826 | ) | |||||||||
| Proceeds from sale of lease fleet units |
27,437 | 8,514 | — | 35,951 | ||||||||||||
| Additions to property, plant and equipment |
(12,887 | ) | (2,905 | ) | — | (15,792 | ) | |||||||||
| Proceeds from sale of property, plant and equipment |
1,900 | 70 | — | 1,970 | ||||||||||||
|
|
|
|
|
|
|
|
|
|||||||||
| Net cash provided by (used in) investing activities |
827 | (6,847 | ) | — | (6,020 | ) | ||||||||||
|
|
|
|
|
|
|
|
|
|||||||||
| Cash Flows from Financing Activities: |
||||||||||||||||
| Net repayments under lines of credit |
(88,604 | ) | (34,472 | ) | — | (123,076 | ) | |||||||||
| Principal payments on notes payable |
(310 | ) | — | — | (310 | ) | ||||||||||
| Principal payments on capital lease obligations |
(408 | ) | — | — | (408 | ) | ||||||||||
| Issuance of common stock |
13,818 | — | — | 13,818 | ||||||||||||
| Purchase of treasury stock |
(369 | ) | — | — | (369 | ) | ||||||||||
| Intercompany |
— | (279 | ) | 279 | — | |||||||||||
|
|
|
|
|
|
|
|
|
|||||||||
| Net cash used in financing activities |
(75,873 | ) | (34,751 | ) | 279 | (110,345 | ) | |||||||||
|
|
|
|
|
|
|
|
|
|||||||||
| Effect of exchange rate changes on cash |
— | 171 | (598 | ) | (427 | ) | ||||||||||
|
|
|
|
|
|
|
|
|
|||||||||
| Net (decrease) increase in cash |
(1,199 | ) | 518 | — | (681 | ) | ||||||||||
| Cash and cash equivalents at beginning of year |
1,009 | 928 | — | 1,937 | ||||||||||||
|
|
|
|
|
|
|
|
|
|||||||||
| Cash and cash equivalents at end of year |
$ | (190 | ) | $ | 1,446 | $ | — | $ | 1,256 | |||||||
|
|
|
|
|
|
|
|
|
|||||||||
98
Table of Contents
MOBILE MINI, INC.
NOTES TO CONSOLIDATED FINANCIAL STATEMENTS — (Continued)
MOBILE MINI, INC.
CONDENSED CONSOLIDATING STATEMENTS OF CASH FLOWS
For the Year Ended December 31, 2014
(In thousands)
| Guarantors | Non- Guarantors |
Eliminations | Consolidated | |||||||||||||
| Cash Flows from Operating Activities: |
||||||||||||||||
| Net income |
$ | 30,884 | $ | 13,502 | $ | — | $ | 44,386 | ||||||||
| Adjustments to reconcile net income to net cash provided by operating activities: |
||||||||||||||||
| Asset impairment charge, net |
416 | 141 | — | 557 | ||||||||||||
| Provision for doubtful accounts |
2,157 | 621 | — | 2,778 | ||||||||||||
| Amortization of deferred financing costs |
2,769 | 60 | — | 2,829 | ||||||||||||
| Amortization of long-term liabilities |
86 | 2 | — | 88 | ||||||||||||
| Share-based compensation expense |
14,369 | 702 | — | 15,071 | ||||||||||||
| Depreciation and amortization |
32,007 | 7,327 | — | 39,334 | ||||||||||||
| (Gain) loss on sale of lease fleet units |
(6,436 | ) | 704 | — | (5,732 | ) | ||||||||||
| Loss on disposal of property, plant and equipment |
28 | 320 | — | 348 | ||||||||||||
| Deferred income taxes |
21,398 | 4,026 | — | 25,424 | ||||||||||||
| Tax shortfall on equity award transactions |
(15 | ) | — | — | (15 | ) | ||||||||||
| Foreign currency loss |
— | 1 | — | 1 | ||||||||||||
| Changes in certain assets and liabilities, net of effect of businesses acquired: |
||||||||||||||||
| Receivables |
(4,113 | ) | (3,084 | ) | — | (7,197 | ) | |||||||||
| Inventories |
2,258 | 422 | — | 2,680 | ||||||||||||
| Deposits and prepaid expenses |
(1,533 | ) | 117 | — | (1,416 | ) | ||||||||||
| Investment in subsidiaries |
4,823 | — | (4,823 | ) | — | |||||||||||
| Other assets and intangibles |
66 | (49 | ) | — | 17 | |||||||||||
| Accounts payable |
(926 | ) | 203 | — | (723 | ) | ||||||||||
| Accrued liabilities |
850 | 1,345 | — | 2,195 | ||||||||||||
| Intercompany |
1,711 | (1,711 | ) | — | — | |||||||||||
|
|
|
|
|
|
|
|
|
|||||||||
| Net cash provided by operating activities |
100,799 | 24,649 | (4,823 | ) | 120,625 | |||||||||||
|
|
|
|
|
|
|
|
|
|||||||||
| Cash Flows from Investing Activities: |
||||||||||||||||
| Cash paid for businesses, net of cash acquired |
(430,946 | ) | — | — | (430,946 | ) | ||||||||||
| Additions to lease fleet |
(16,525 | ) | (10,754 | ) | — | (27,279 | ) | |||||||||
| Proceeds from sale of lease fleet units |
19,214 | 3,839 | — | 23,053 | ||||||||||||
| Additions to property, plant and equipment |
(11,793 | ) | (3,986 | ) | — | (15,779 | ) | |||||||||
| Proceeds from sale of property, plant and equipment |
3,688 | 511 | — | 4,199 | ||||||||||||
|
|
|
|
|
|
|
|
|
|||||||||
| Net cash (used in) provided by investing activities |
(436,362 | ) | (10,390 | ) | — | (446,752 | ) | |||||||||
|
|
|
|
|
|
|
|
|
|||||||||
| Cash Flows from Financing Activities: |
||||||||||||||||
| Net borrowings (repayments) under lines of credit |
395,127 | (8,923 | ) | — | 386,204 | |||||||||||
| Deferred financing costs |
(719 | ) | — | — | (719 | ) | ||||||||||
| Principal payments on capital lease obligations |
(1,929 | ) | (27 | ) | — | (1,956 | ) | |||||||||
| Issuance of common stock |
3,642 | — | — | 3,642 | ||||||||||||
| Dividend payments |
(31,384 | ) | — | — | (31,384 | ) | ||||||||||
| Purchase of treasury stock |
(26,007 | ) | — | — | (26,007 | ) | ||||||||||
| Repayment of investment |
— | (4,823 | ) | 4,823 | — | |||||||||||
|
|
|
|
|
|
|
|
|
|||||||||
| Net cash provided by (used in) financing activities |
338,730 | (13,773 | ) | 4,823 | 329,780 | |||||||||||
|
|
|
|
|
|
|
|
|
|||||||||
| Effect of exchange rate changes on cash |
— | (1,170 | ) | — | (1,170 | ) | ||||||||||
|
|
|
|
|
|
|
|
|
|||||||||
| Net increase (decrease) in cash |
3,167 | (684 | ) | — | 2,483 | |||||||||||
| Cash and cash equivalents at beginning of year |
(190 | ) | 1,446 | — | 1,256 | |||||||||||
|
|
|
|
|
|
|
|
|
|||||||||
| Cash and cash equivalents at end of year |
$ | 2,977 | $ | 762 | $ | — | $ | 3,739 | ||||||||
|
|
|
|
|
|
|
|
|
|||||||||
99
Table of Contents
MOBILE MINI, INC.
NOTES TO CONSOLIDATED FINANCIAL STATEMENTS — (Continued)
| (20) | Subsequent Events |
In January 2015 the Company purchased $15.0 million of its outstanding stock under the current stock purchase program authorized by the Company’s board of directors. Additionally, on January 21, 2015, the board of directors authorized and declared a cash dividend to all the Company’s common stockholders of $0.187 per share of common stock, payable on March 19, 2015 to stockholders of record as of the close of business March 5, 2015. Each future quarterly dividend payment is subject to review and approval by the Board.
100
Table of Contents
| ITEM 9. | CHANGES IN AND DISAGREEMENTS WITH ACCOUNTANTS ON ACCOUNTING AND FINANCIAL DISCLOSURE. |
None.
| ITEM 9A. | CONTROLS AND PROCEDURES. |
Controls and Procedures
As of the end of the period covered by this Annual Report, we carried out an evaluation, under the supervision and with the participation of our management, including our Chief Executive Officer and our Chief Financial Officer, of the effectiveness of the design and operation of our disclosure controls and procedures (as such term is defined in Rules 13a-15(e) and 15d-15(e) under the Exchange Act. Based on that evaluation, our Chief Executive Officer and our Chief Financial Officer concluded that, as of the end of the period covered by this Annual Report on Form 10-K, the Company’s disclosure controls and procedures, were effective such that the information relating to the Company required to be disclosed in our SEC reports (i) is recorded, processed, summarized and reported within the time periods specified in the SEC’s rules and forms and (ii) is accumulated and communicated to the Company’s management, including our Chief Executive Officer and our Chief Financial Officer, as appropriate, to allow timely decisions regarding required disclosure.
Report of Management on Internal Control Over Financial Reporting
Our management is responsible for establishing and maintaining adequate internal control over financial reporting for the company. Internal control over financial reporting is a process to provide reasonable assurance regarding the reliability of our financial reporting for external purposes in accordance with accounting principles generally accepted in the United States of America. Internal control over financial reporting includes maintaining records that in reasonable detail accurately and fairly reflect our transactions; providing reasonable assurance that transactions are recorded as necessary for preparation of our financial statements; providing reasonable assurance that receipts and expenditures of company assets are made in accordance with management authorization; and providing reasonable assurance that unauthorized acquisition, use, or disposition of company assets that could have a material effect on our financial statements would be prevented or detected on a timely basis. Because of its inherent limitations, internal control over financial reporting is not intended to provide absolute assurance that a misstatement of our financial statements would be prevented or detected.
Management conducted an evaluation of the effectiveness of the Company’s internal control over financial reporting based on the 1992 framework in Internal Control — Integrated Framework issued by the Committee of Sponsoring Organizations of the Treadway Commission. Based on this evaluation, management concluded that the Company’s internal control over financial reporting was effective, subject to the limitation below, as of December 31, 2014.
In December 2014, we completed the acquisition of Gulf Tanks Holdings, Inc., the parent company of ETS. Consistent with the published guidance of the Securities and Exchange Commission, our management excluded the operations of this acquisition, which operates in the U.S., from the scope of its assessment of internal control over financial reporting as of December 31, 2014. Total assets for this business represented approximately 19.6% of the total consolidated assets of Mobile Mini, Inc. as of December 31, 2014, and total revenues for this business represented approximately 1.4% of the consolidated revenues of Mobile Mini, Inc. for the twelve months ended December 31, 2014.
Our internal control over financial reporting as of December 31, 2014 has been audited by KPMG LLP, an independent registered public accounting firm, as stated in their report which is included herein.
101
Table of Contents
Report of Independent Registered Public Accounting Firm
The Board of Directors and Stockholders
Mobile Mini, Inc.
We have audited Mobile Mini, Inc. and subsidiaries’ (the Company) internal control over financial reporting as of December 31, 2014, based on criteria established in Internal Control — Integrated Framework (1992) issued by the Committee of Sponsoring Organizations of the Treadway Commission (COSO). The Company’s management is responsible for maintaining effective internal control over financial reporting and for its assessment of the effectiveness of internal control over financial reporting, included in the accompanying “Report of Management on Internal Control Over Financial Reporting.” Our responsibility is to express an opinion on the Company’s internal control over financial reporting based on our audit.
We conducted our audit in accordance with the standards of the Public Company Accounting Oversight Board (United States). Those standards require that we plan and perform the audit to obtain reasonable assurance about whether effective internal control over financial reporting was maintained in all material respects. Our audit included obtaining an understanding of internal control over financial reporting, assessing the risk that a material weakness exists and testing and evaluating the design and operating effectiveness of internal control based on the assessed risk. Our audit also included performing such other procedures as we considered necessary in the circumstances. We believe that our audit provides a reasonable basis for our opinion.
A company’s internal control over financial reporting is a process designed to provide reasonable assurance regarding the reliability of financial reporting and the preparation of financial statements for external purposes in accordance with generally accepted accounting principles. A company’s internal control over financial reporting includes those policies and procedures that (1) pertain to the maintenance of records that, in reasonable detail, accurately and fairly reflect the transactions and dispositions of the assets of the company; (2) provide reasonable assurance that transactions are recorded as necessary to permit preparation of financial statements in accordance with generally accepted accounting principles, and that receipts and expenditures of the company are being made only in accordance with authorizations of management and directors of the company; and (3) provide reasonable assurance regarding prevention or timely detection of unauthorized acquisition, use, or disposition of the company’s assets that could have a material effect on the financial statements.
Because of its inherent limitations, internal control over financial reporting may not prevent or detect misstatements. Also, projections of any evaluation of effectiveness to future periods are subject to the risk that controls may become inadequate because of changes in conditions, or that the degree of compliance with the policies or procedures may deteriorate.
In our opinion, the Company maintained, in all material respects, effective internal control over financial reporting as of December 31, 2014, based on criteria established in Internal Control-Integrated Framework (1992) issued by COSO.
The Company acquired Gulf Tanks Holdings, Inc. during 2014, and management excluded from its assessment of the effectiveness of the Company’s internal control over financial reporting as of December 31, 2014, the Gulf Tanks Holding’s internal control over financial reporting associated with total assets of $411,791 thousand and total revenues of $6,432 thousand included in the consolidated financial statements of Mobile Mini, Inc. and subsidiaries as of and for the year ended December 31, 2014. Our audit of internal control over financial reporting of Mobile Mini, Inc. and subsidiaries also excluded an evaluation of the internal control over financial reporting of Gulf Tanks Holdings, Inc.
We also have audited, in accordance with the standards of the Public Company Accounting Oversight Board (United States), the consolidated balance sheets of Mobile Mini, Inc. and subsidiaries as of December 31, 2014 and 2013, and the related consolidated statements of income, comprehensive income, stockholders’ equity, and cash flows for the years then ended and our report dated February 27, 2015 expressed an unqualified opinion on those consolidated financial statements.
/s/ KPMG LLP
Phoenix, Arizona
February 27, 2015
102
Table of Contents
Changes in Internal Control Over Financial Reporting
Under the supervision and with the participation of our management, including our Principal Executive Officer and Principal Financial Officer, we conducted an evaluation of any changes in our internal control over financial reporting (as such term is defined in Rules 13a-15(f) and 15d-15(f) under the Exchange Act) that occurred during our most recently completed fiscal quarter. Based on that evaluation, our Principal Executive Officer and Principal Financial Officer concluded that there has not been any change in our internal control over financial reporting during that quarter that has materially affected, or is reasonably likely to materially affect, our internal control over financial reporting. We intend to implement the new “Internal Control — Integrated Framework,” issued in May 2013 by the Committee of Sponsoring Organizations of the Treadway Commission, during our fiscal year 2015.
| ITEM 9B. | OTHER INFORMATION. |
None.
PART III
| ITEM 10. | DIRECTORS, EXECUTIVE OFFICERS AND CORPORATE GOVERNANCE. |
Executive Officers of Mobile Mini, Inc.
Set forth below is information respecting the name, age and position with Mobile Mini of our 2014 executive officers. Information with respect to our directors and the nomination process is incorporated herein by reference to information included in the Proxy Statement for our 2015 Annual Meeting of Stockholders, to be filed with the SEC no later than 120 days following our fiscal year end (the “2015 Proxy Statement”).
Erik Olsson has served as our President and Chief executive Officer and a member of the Board since March 2013. Mr. Olsson served as President, Chief Executive Officer and a Director of RSC Holdings, Inc., a North American equipment rental provider (“RSC”), and certain of its subsidiaries from 2006 to 2012. Mr. Olsson joined RSC in 2001 as Chief Financial Officer and became Chief Operating Officer in 2005. During the 13 years prior to 2001, Mr. Olsson held a number of senior financial management positions in various global businesses at Atlas Copco Group in Sweden, Brazil and the United States, including his last assignment from 1998 to 2000 as Chief Financial Officer for Milwaukee Electric Tool Corporation in Milwaukee, Wisconsin. He is also a Director of Ritchie Bros. Auctioneers Incorporated, the world’s largest industrial auctioneer. Age 52.
Mark E. Funk has served as our Executive Vice President and Chief Financial Officer since November 2008. Prior to joining us, he was with Deutsche Bank Securities Inc. from September 1988 to November 2008, most recently as Managing Director in its Structured Debt Group, where he had worked on numerous high profile transactions. During his tenure at Deutsche Bank, Mr. Funk worked in their New York, London, Chicago and Los Angeles offices. Prior to joining Deutsche Bank, Mr. Funk passed the certified public accountant examination and was a senior auditor with KPMG. Mr. Funk earned a Bachelor of Science in Business Administration from California State University Long Beach and an MBA from University of California, Los Angeles. Age 52.
Kelly Williams has served as our Executive Vice President, Operations since June 2014. He joined Mobile Mini in July 2013 and has previously served as our Senior Vice President, Western Division and Regional Manager. Prior to joining us, Mr. Williams spent eight years in the equipment rental industry, including at RSC Holdings Inc., as a Vice President, Regional Vice President, Regional Sales Director, Regional Fleet Director and District Manager. He has also spent ten years in the car rental business in various leadership roles. Mr. Williams earned a Bachelor of Arts degree from Anderson University. Age 44.
Lynn M. Courville has served as Senior Vice President, Human Resources since August 2013. Ms. Courville joined Mobile Mini in March 2012 as Vice President of Human Resources and Employee Engagement. Prior to joining us, she was Director of Human Resources for National Construction Rentals from
103
Table of Contents
March 2009 to March 2012 and Senior Director of Human Resources for Mobile Storage Group from July 2004 to September 2008. Ms. Courville held various human resources positions for RSC Holdings from September 1993 to June 2004. Ms. Courville is a certified Senior Professional in Human Resources. She earned a Bachelor of Science in Human Services Administration from California State University, Fullerton and an MBA from Western International University. Age 51.
Ruth L. Hunter has served as our Senior Vice President of Sales and Marketing since October 2013. Prior to joining us, she worked at GE Capital for over 20 years. A graduate of GE’s Financial Management Program, Ms. Hunter had progressive roles in finance, sales and marketing. Most recently, she served as Commercial Development Leader for GE Capital Americas and Commercial Excellence and Access GE Leader for GE Australia & New Zealand. Ms. Hunter is a graduate from the University of Toronto, with a Bachelor of Commerce. She has been a CFA Charterholder since 2004. Age 45.
Christopher J. Miner has served as Senior Vice President and General Counsel since December 2008. He joined Mobile Mini in June 2008 as Vice President and General Counsel. He was previously a partner at DLA Piper from 2007 to 2008 and advised numerous corporate and financial institution clients on merger, acquisition and capital markets transactions. Prior to that, he was a partner at Squire, Sanders & Dempsey, which he joined in 2004. He was an attorney in New York and Europe with Davis Polk & Wardwell from 1999 to 2004 where he specialized in corporate and securities law. Mr. Miner received a B.A. and a J.D. from Brigham Young University. Age 43.
Audra L. Taylor has served as our Vice President and Chief Accounting Officer since September 2013. Prior to joining us, she served as Vice President of Finance of LifeLock, Inc. from May 2013 until September 2013. She was Vice President and Controller of RSC Holdings, Inc. from November 2011 until August 2012 and from March 2000 to November 2011, Ms. Taylor was the Chief Financial Officer and Chief Operating Officer at McMurry, Inc. Ms. Taylor holds a degree in accounting from Ferris State University and is a registered Certified Public Accountant. Age 44.
Information regarding our audit committee and our audit committee financial experts is incorporated herein by reference to information included in the 2015 Proxy Statement.
Information required by Item 405 of Regulation S-K is incorporated herein by reference to information included in the 2015 Proxy Statement.
We have adopted a Code of Business Conduct and Ethics that applies to our employees generally, and a Supplemental Code of Ethics applicable to our Chief Financial Officer and Senior Financial Officers in compliance with applicable rules of the SEC that applies to our principal executive officer, our principal financial officer, and our principal accounting officer or controller, or persons performing similar functions. A copy of these Codes is available free of charge on the “Investors” section of our Web site at www.mobilemini.com. We intend to satisfy any disclosure requirement under Item 5.05 of Form 8-K regarding an amendment to, or waiver from, a provision of the Supplemental Code of Ethics by posting such information on our Web site at the address and location specified above.
| ITEM 11. | EXECUTIVE COMPENSATION. |
Information with respect to executive compensation is incorporated herein by reference to information included in the 2015 Proxy Statement.
104
Table of Contents
| ITEM 12. | SECURITY OWNERSHIP OF CERTAIN BENEFICIAL OWNERS AND MANAGEMENT AND RELATED STOCKHOLDER MATTERS. |
Equity Compensation Plan Information
We maintain the 1999 Stock Option Plan (the “1999 Plan”) and the 2006 Equity Incentive Plan (the “2006 Plan”), pursuant to which we may grant equity awards to eligible persons. The 1999 Plan expired in 2009 and no additional options may be granted thereunder and outstanding options continue to be subject to the terms of the 1999 Plan until their exercise or termination. The following table summarizes our equity compensation plan information as of December 31, 2014. Information is included for both equity compensation plans approved by our stockholders and equity plans not approved by our stockholders.
| Plan Category |
Common Shares to be Issued Upon Exercise of Outstanding Options, Warrants and Rights (a) |
Weighted Average Exercise Price of Outstanding Options, Warrants and Rights (b) |
Common Shares Remaining Available for Future Issuance Under Equity Compensation Plans (Excluding Shares Reflected in Column (a) (c) |
|||||||||
| (In thousands) | (In thousands) | |||||||||||
| Equity compensation plans approved by Mobile Mini Stockholders(1) |
649 | $ | 35.03 | 2,902 | ||||||||
| Equity compensation plans not approved by Mobile Mini Stockholders(2) |
2,000 | 31.45 | — | |||||||||
|
|
|
|
|
|
|
|||||||
| Totals |
2,649 | $ | 32.33 | 2,902 | ||||||||
|
|
|
|
|
|
|
|||||||
| (1) | Of these shares, options to purchase 28,650 shares were outstanding under the 1999 Plan and options to purchase 620,449 shares were outstanding under the 2006 Plan. |
| (2) | Reflects shares subject to an outstanding stock option agreement awarded as a non-plan based inducement grant in connection with the hiring of Mr. Olsson as the Company’s President and Chief Executive Officer. This grant was made pursuant to NASDAQ rule 5635(c)(4). |
On December 31, 2014, the closing price of Mobile Mini’s common stock as reported by The NASDAQ Stock Market was $40.51.
The information set forth in our 2015 Proxy Statement under the headings “Security Ownership of Certain Beneficial Owners and Management” is incorporated herein by reference.
| ITEM 13. | CERTAIN RELATIONSHIPS AND RELATED TRANSACTIONS, AND DIRECTOR INDEPENDENCE. |
The information set forth in our 2015 Proxy Statement under the caption “Transactions with Related Persons” and information relating to director independence is incorporated herein by reference.
| ITEM 14. | PRINCIPAL ACCOUNTING FEES AND SERVICES. |
The information set forth in our 2015 Proxy Statement under the caption “Audit Committee Disclosure” is incorporated herein by reference.
105
Table of Contents
PART IV
| ITEM 15. | EXHIBITS AND FINANCIAL STATEMENT SCHEDULES. |
(a) Financial Statements:
(1) The financial statements required to be included in this Annual Report are included in Item 8 of this Annual Report.
(2) All schedules have been omitted because they are not applicable or because the information is included elsewhere in this report.
| Exhibit Number |
Description | |
| 2.1 | Agreement and Plan of Merger, dated as of February 22, 2008, among Mobile Mini, Inc., Cactus Merger Sub, Inc., MSG WC Holdings Corp., and Welsh, Carson, Anderson & Stowe X, L.P. (Incorporated by reference to Exhibit 2.1 to the Registrant’s Report on Form 8-K filed on February 28, 2008). | |
| 2.2+ | Stock Purchase Agreement dated as of November 13, 2014 by and among Mobile Mini, Inc., each Seller listed on Annex A thereto, Gulf Tanks Holdings, Inc. and Odyssey Investment Partners, LLC. (Incorporated by reference to Exhibit 2.1 to the Registrant’s Report on Form 8-K filed on December 11, 2014). | |
| 3.1 | Amended and Restated Certificate of Incorporation of Mobile Mini, Inc. (Incorporated by reference to Exhibit 3.1 to the Registrant’s Report on Form 10-K for the fiscal year ended December 31, 1997). | |
| 3.2 | Certificate of Amendment, dated July 20, 2000, to the Amended and Restated Certificate of Incorporation of the Registrant. (Incorporated by reference to Exhibit 3.1A to the Registrant’s Report on Form 10-Q for the quarter ended June 30, 2000). | |
| 3.3 | Certificate of Designation, Preferences and Rights of Series C Junior Participating Preferred Stock of Mobile Mini, Inc., dated December 17, 1999. (Incorporated by reference to Exhibit A to Exhibit 1 to the Registrant’s Registration Statement on Form 8-A filed on December 13, 1999). | |
| 3.4 | Certificate of Amendment of the Amended and Restated Certificate of Incorporation of Mobile Mini, Inc., dated June 26, 2008. (Incorporated by reference to Exhibit 3.2 to the Registrant’s Report on Form 8-K filed on July 1, 2008). | |
| 3.5 | Certificate of Designation of Mobile Mini, Inc. Series A Convertible Redeemable Participating Preferred Stock, dated June 27, 2008. (Incorporated by reference to Exhibit 3.1 to the Registrant’s Report on Form 8-K filed on July 1, 2008). | |
| 3.6 | Second Amended and Restated Bylaws of Mobile Mini, Inc., effective as of March 10, 2014. (Incorporated by reference to Exhibit 3.1 to the Registrant’s Report on Form 8-K filed on March 13, 2014). | |
| 4.1 | Form of Common Stock Certificate. (Incorporated by reference to Exhibit 4.1 of the Registrant’s Report on Form 10-K for the fiscal year ended December 31, 2003). | |
| 4.2 | Rights Agreement, dated as of December 9, 1999, between Mobile Mini, Inc. and Norwest Bank Minnesota, NA, as Rights Agent. (Incorporated by reference to the Registrant’s Registration Statement on Form 8-A filed on December 13, 1999). | |
| 4.3 | Indenture, dated as of November 23, 2010, among the Registrant, the Guarantor parties thereto, Law Debenture Trust Company of New York, as trustee, and Deutsche Bank Trust Company Americas, as paying agent, registrar and transfer agent. (Incorporated by reference to Exhibit 4.1 to the Registrant’s Report on Form 8-K filed on November 29, 2010). | |
106
Table of Contents
| Exhibit Number |
Description | |
| 10.1† | Mobile Mini, Inc. Amended and Restated 1999 Stock Option Plan (as amended through March 25, 2003). (Incorporated by reference to Appendix B of the Registrant’s Definitive Proxy Statement for its 2003 annual meeting of shareholders, filed on April 11, 2003 under cover of Schedule 14A). | |
| 10.2† | Form of Stock Option Grant Agreement. (Incorporated by reference to Exhibit 10.2.1 of the Registrant’s Report on Form 10-K for the fiscal year ended December 31, 2004). | |
| 10.3† | Mobile Mini, Inc. Amended and Restated 2006 Equity Incentive Plan. (Effective July 24, 2013). (Incorporated by reference to Exhibit A of the Registrant’s Definitive Proxy Statement for its 2013 annual meeting of shareholders filed on June 14, 2013 under cover of Schedule 14A). | |
| 10.4† | Employment Agreement dated as of September 30, 2008 by and between Mobile Mini, Inc. and Lawrence Trachtenberg. (Incorporated by reference to Exhibit 10.1 to the Registrant’s Report on Form 8-K filed on September 30, 2008). | |
| 10.5† | Employment Agreement dated as of October 15, 2008 by and between Mobile Mini, Inc. and Mark E. Funk. (Incorporated by reference to Exhibit 10.1 to the Registrant’s Report on Form 8-K filed on October 17, 2008). | |
| 10.6† | 2009 Amendment to Amended and Restated Employment Agreement effective as of January 1, 2009 by and between Mobile Mini, Inc. and Mark E. Funk. (Incorporated by reference to Exhibit 10.11 of the Registrant’s Report on Form 10-K for the fiscal year ended December 31, 2009). | |
| 10.7† | 2012 Amendment to Employment Agreement effective December 21, 2012 by and between Mobile Mini, Inc. and Mark E. Funk. (Incorporated by reference to Exhibit 10.10 of the Registrant’s Report on Form 10-K for the fiscal year ended December 31, 2012). | |
| 10.8† | Employment Agreement dated as of December 22, 2009 by and between Mobile Mini, Inc. and Christopher J. Miner. (Incorporated by reference to Exhibit 99.1 to the Registrant’s Report on Form 8-K filed on December 24, 2009). | |
| 10.9† | Amendment No. 1 to Employment Agreement effective December 21, 2012 by and between Mobile Mini, Inc. and Christopher J. Miner. (Incorporated by reference to Exhibit 10.14 of the Registrant’s Report on Form 10-K for the fiscal year ended December 31, 2012). | |
| 10.10† | Form of Indemnification Agreement between the Registrant and its Directors and Executive Officers. (Incorporated by reference to Exhibit 10.20 to the Registrant’s Report on Form 10-Q for the quarter ended June 30, 2004). | |
| 10.11 | ABL Credit Agreement, dated February 22, 2012, between Mobile Mini, Deutsche Bank AG New York Branch and other lenders party thereto. (Incorporated by reference to Exhibit 10.1 to the Registrant’s Report on Form 8-K filed on February 28, 2012). | |
| 10.12++ | Schedules to the ABL Credit Agreement, dated February 22, 2012, between Mobile Mini, Deutsche Bank AG New York Branch and other Lenders party thereto. (Incorporated by reference to Exhibit 10.2 to the Registrant’s Report on Form 10-Q for the quarter ended March 31, 2012). | |
| 10.13† | Executive Employment Agreement, dated March 18, 2013, by and between Mobile Mini, Inc. and Erik Olsson. (Incorporated by reference to Exhibit 10.1 to the Registrant’s Report on Form 8-K filed on March 20, 2013). | |
| 10.14† | Employment Agreement, dated April 5, 2013, by and between Mobile Mini, Inc. and Phillip Hobson. (Incorporated by reference to Exhibit 10.2 to the Registrant’s Report on Form 8-K filed on April 9, 2013). | |
107
Table of Contents
| Exhibit Number |
Description | |
| 10.15† | Form of Stock Option Agreement between Mobile Mini, Inc. and Erik Olsson. (Incorporated by reference to Exhibit 99.2 to the Registrant’s Registration Statement on Form S-8 filed on May 10, 2013). | |
| 10.16† | Employment Agreement dated September 3, 2013, by and between Mobile Mini, Inc. and Ruth Hunter. (Incorporated by reference to Exhibit 10.1 of the Registrant’s Report on Form 10-Q for the quarter ended March 31, 2014). | |
| 10.17† | Amended and Restated Employment Agreement between Mobile Mini, Inc. and Kelly Williams, dated June 4, 2014. (Incorporated by reference to Exhibit 10.1 to the Registrant’s Current Report on Form 8-K filed June 10, 2014). | |
| 10.18 | Incremental Credit Agreement dated as of December 10, 2014, to the existing ABL Credit Agreement, dated as of February 22, 2012, among Mobile Mini, the other borrowers and guarantors arty thereto, the lenders from time to time party thereto and the Administrative Agent. (Incorporated by reference to Exhibit 10.1 to the Registrant’s Report on Form 8-K filed on December 11, 2014). | |
| 21* | Subsidiaries of Mobile Mini, Inc. | |
| 23.1* | Consent of Independent Registered Public Accounting Firm. | |
| 23.2* | Consent of former Independent Registered Public Accounting Firm. | |
| 23.3* | Consent of Independent Valuation Firm. | |
| 24* | Power of Attorney (included on signature page) | |
| 31.1* | Certification of Chief Executive Officer pursuant to Item 601(b)(31) of Regulation S-K. | |
| 31.2* | Certification of Chief Financial Officer pursuant to Item 601(b)(31) of Regulation S-K. | |
| 32.1** | Certification of Chief Executive Officer and Chief Financial Officer pursuant to Item 601(b)(32) of Regulation S-K. | |
| 101.INS* | XBRL Instance Document. | |
| 101.SCH* | XBRL Taxonomy Extension Schema Document. | |
| 101.CAL* | XBRL Taxonomy Extension Calculation Linkbase Document. | |
| 101.DEF* | XBRL Taxonomy Extension Definition Linkbase Document. | |
| 101.LAB* | XBRL Taxonomy Extension Labels Linkbase Document. | |
| 101.PRE* | XBRL Taxonomy Extension Presentation Linkbase Document. | |
| * | Filed herewith. |
| ** | Furnished herewith. |
| + | The schedules and exhibits in this exhibit have been omitted pursuant to Item 601(b)(2) of Regulation S-K. Mobile Mini agrees to furnish supplementally a copy of such schedules and exhibits, or any section thereof, to the SEC upon request |
| ++ | Certain confidential information contained in this exhibit was omitted by means of redacting a portion of the text and replacing it with an asterisk. This exhibit has been filed separately with the Secretary of the SEC without the redaction pursuant to Confidential Treatment Request under Rule 406 of the Securities Act. |
| † | Management contract or compensatory arrangement |
108
Table of Contents
SIGNATURES
Pursuant to the requirements of Section 13 or 15(d) of the Securities Exchange Act of 1934, the registrant has duly caused this Annual Report to be signed on its behalf by the undersigned, thereunto duly authorized.
| MOBILE MINI, INC. | ||||||
| Date: February 27, 2015 | By: | /s/ Erik Olsson | ||||
| Erik Olsson President | ||||||
KNOW ALL MEN BY THESE PRESENTS, that each person whose signature appears below constitutes and appoints Mark Funk his true and lawful attorneys-in-fact and agent, with full power of substitution and resubstitution, for him and in his name, place and stead, in any and all capacities, to sign any and all amendments to this Annual Report, and to file the same, with all exhibits thereto, and other documents in connection therewith with the Securities and Exchange Commission, granting unto said attorneys-in-fact and agents, and each of them, full power and authority to do and perform each and every act and thing requisite and necessary to be done in and about the premises, and fully and to all intents and purposes as he might or could do in person hereby ratifying and confirming all that said attorney-in-fact and agents, or his substitute or substitutes, may lawfully do or cause to be done by virtue hereof.
Pursuant to the requirements of the Securities Exchange Act of 1934, this Annual Report has been signed by the following persons on behalf of the registrant and in the capacities and on the dates indicated.
| Date: February 27, 2015 | By: | /s/ Erik Olsson | ||||
| Erik Olsson President, Chief Executive Officer and Director (Principal Executive Officer) | ||||||
| Date: February 27, 2015 | By: | /s/ Mark E. Funk | ||||
| Mark E. Funk Executive Vice President and Chief Financial Officer (Principal Financial Officer) | ||||||
| Date: February 27, 2015 | By: | /s/ Audra L. Taylor | ||||
| Audra L. Taylor Vice President and Chief Accounting Officer (Principal Accounting Officer) | ||||||
| Date: February 27, 2015 | By: | /s/ Michael L. Watts | ||||
| Michael L. Watts Chairman of the Board and Director | ||||||
| Date: February 27, 2015 | By: | /s/ Sara R. Dial | ||||
| Sara R. Dial, Director | ||||||
| Date: February 27, 2015 | By: | /s/ Jeffrey S. Goble | ||||
| Jeffrey S. Goble, Director | ||||||
| Date: February 27, 2015 | By: | /s/ James J. Martell | ||||
| James J. Martell, Director | ||||||
109
Table of Contents
| Date: February 27, 2015 | By: | /s/ Stephen A McConnell | ||||
| Stephen A McConnell, Director | ||||||
| Date: February 27, 2015 | By: | /s/ Frederick G. McNamee, III | ||||
| Frederick G. McNamee, III, Director | ||||||
| Date: February 27, 2015 | By: | /s/ Kimberly J. McWaters | ||||
| Kimberly J. McWaters, Director | ||||||
| Date: February 27, 2015 | By: | /s/ Lawrence Trachtenberg | ||||
| Lawrence Trachtenberg, Director | ||||||
110
Table of Contents
INDEX TO EXHIBITS FILED HEREWITH
| Exhibit Number |
Description | |
| 21 | Subsidiaries of Mobile Mini, Inc. | |
| 23.1 | Consent of Independent Registered Public Accounting Firm. | |
| 23.2 | Consent of former Independent Registered Public Accounting Firm. | |
| 23.3 | Consent of Independent Valuation Firm. | |
| 24 | Power of Attorney (included on signature page) | |
| 31.1 | Certification of Chief Executive Officer pursuant to Item 601(b)(31) of Regulation S-K. | |
| 31.2 | Certification of Chief Financial Officer pursuant to Item 601(b)(31) of Regulation S-K. | |
| 32.1 | Certification of Chief Executive Officer and Chief Financial Officer pursuant to Item 601(b)(32) of Regulation S-K. | |
| 101.INC | XBRL Instance Document. | |
| 101.SCH | XBRL Taxonomy Extension Schema Document. | |
| 101.CAL | XBRL Taxonomy Extension Calculation Linkbase Document. | |
| 101.DEF | XBRL Taxonomy Extension Definition Linkbase Document. | |
| 101.LAB | XBRL Taxonomy Extension Labels Linkbase Document. | |
| 101.PRE | XBRL Taxonomy Extension Presentation Linkbase Document. | |
111