Attached files
| file | filename |
|---|---|
| 8-K - 8-K - LOCAL Corp | d879771d8k.htm |
| EX-99.1 - EX-99.1 - LOCAL Corp | d879771dex991.htm |
Exhibit 99.2
|
|

Exhibit 99.2
Quarterly Earnings Summary
|
|
Forward looking statement
This Q4-2014 Quarterly Earnings Summary contains forward looking statements which are made pursuant to the Safe Harbor provisions of section 21-E of the Securities Exchange Act of 1934. Investors are cautioned that statements which are not strictly historical statements, including statements concerning future expected financial performance.
The forward looking statements include, but are not limited to, any statements containing the words “expect”, “anticipate”, “estimates”, “believes”, “should”, “could”, “may”, “possibly”, and similar expressions and the negatives thereof. These forward looking statements involve a number of risks and uncertainties that could cause actual results to differ materially from the forward looking
statements. Those risks and uncertainties are detailed in the company’s filings from time to time with the Securities and Exchange Commission. The information contained in the forward looking statements is provided as of the date first set forth above and the company disclaims any obligation to update such statements.
This document includes the non-GAAP financial measure of “Adjusted EBITDA” . See page 12 for a note regarding the Company’s use of Non-GAAP financial measures and slide 10 for a reconciliation of GAAP to non-GAAP.
Quarterly earnings summary: Q4 2014 2
|
|
Key takeaways
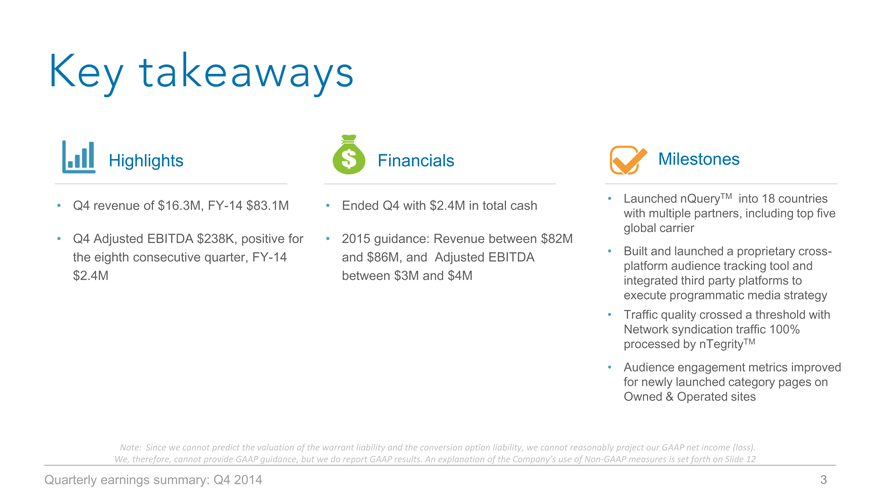
Highlights
Q4 revenue of $16.3M, FY-14 $83.1M
Q4 Adjusted EBITDA $238K, positive for the eighth consecutive quarter, FY-14 $2.4M
Financials
Ended Q4 with $2.4M in total cash
2015 guidance: Revenue between $82M and $86M, and Adjusted EBITDA between $3M and $4M
Milestones
Launched nQueryTM into 18 countries with multiple partners, including top five global carrier Built and launched a proprietary cross-platform audience tracking tool and integrated third party platforms to execute programmatic media strategy Traffic quality crossed a threshold with Network syndication traffic 100% processed by nTegrityTM
Audience engagement metrics improved for newly launched category pages on Owned & Operated sites
Note: Since we cannot predict the valuation of the warrant liability and the conversion option liability, we cannot reasonably project our GAAP net income (loss). We, therefore, cannot provide GAAP guidance, but we do report GAAP results. An explanation of the Company’s use of Non GAAP measures is set forth on Slide 12
Quarterly earnings summary: Q4 2014 3
|
|
Financials & key metrics at a glance
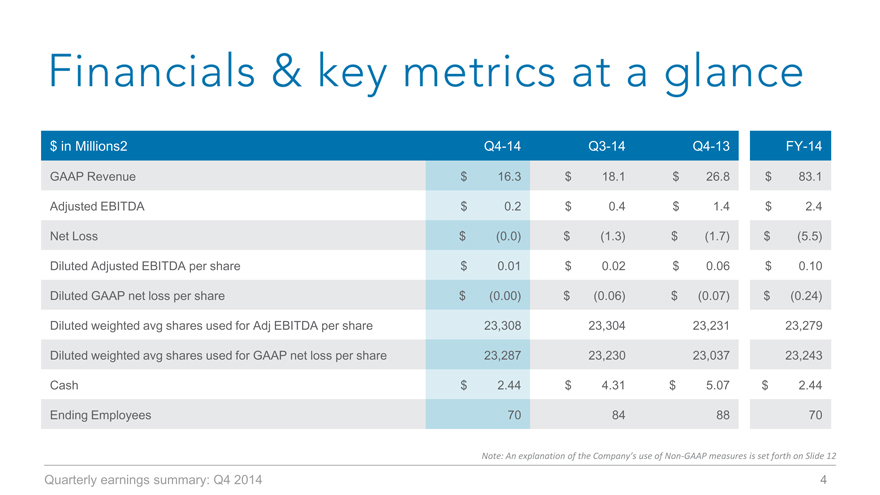
$ in Millions2 Q4-14 Q3-14 Q4-13 FY-14
GAAP Revenue $ 16.3 $ 18.1 $ 26.8 $ 83.1
Adjusted EBITDA $ 0.2 $ 0.4 $ 1.4 $ 2.4
Net Loss $ (0.0) $ (1.3) $ (1.7) $ (5.5)
Diluted Adjusted EBITDA per share $ 0.01 $ 0.02 $ 0.06 $ 0.10
Diluted GAAP net loss per share $ (0.00) $ (0.06) $ (0.07) $ (0.24)
Diluted weighted avg shares used for Adj EBITDA per share 23,308 23,304 23,231 23,279
Diluted weighted avg shares used for GAAP net loss per share 23,287 23,230 23,037 23,243
Cash $ 2.44 $ 4.31 $ 5.07 $ 2.44
Ending Employees 70 84 88 70
Note: An explanation of the Company’s use of Non GAAP measures is set forth on Slide 12
Quarterly earnings summary: Q4 2014 4
|
|
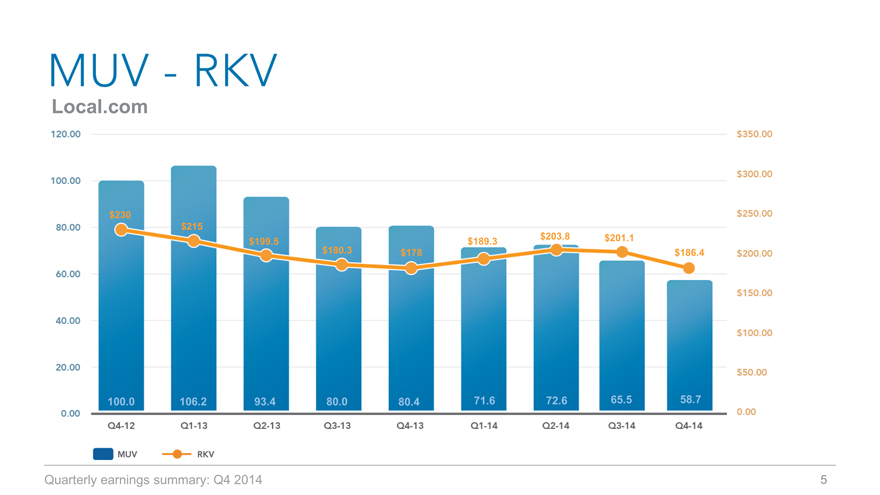
Muv—rkv
Local.com
$230 $215 $203.8 $201.1 $199.5 $180.3 $189.3 $178 $186.4
100.0 106.2 93.4 80.0 80.4 71.6 72.6 65.5 58.7
Quarterly earnings summary: Q4 2014 5
|
|
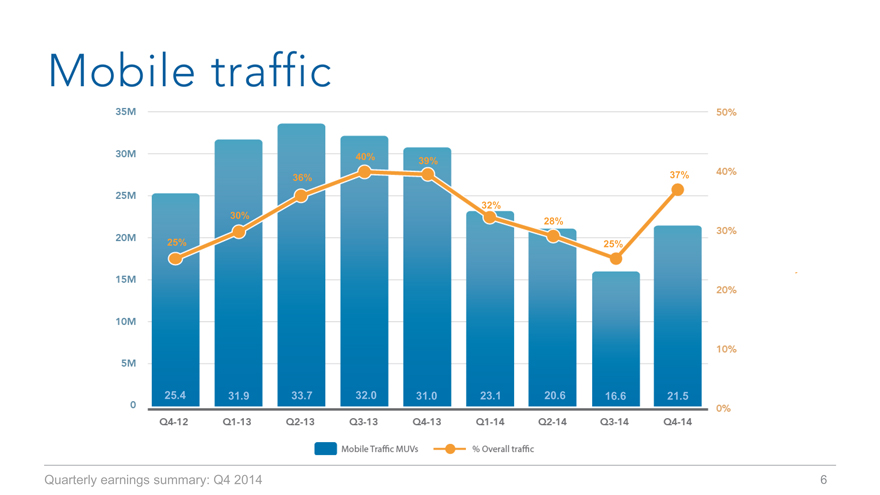
Mobile traffic
40% 39%
36% 37%
32% 30%
28%
25% 25%
25.4 31.9 33.7 32.0 31.0 23.1 20.6 16.6 21.5
Quarterly earnings summary: Q4 2014 6
|
|
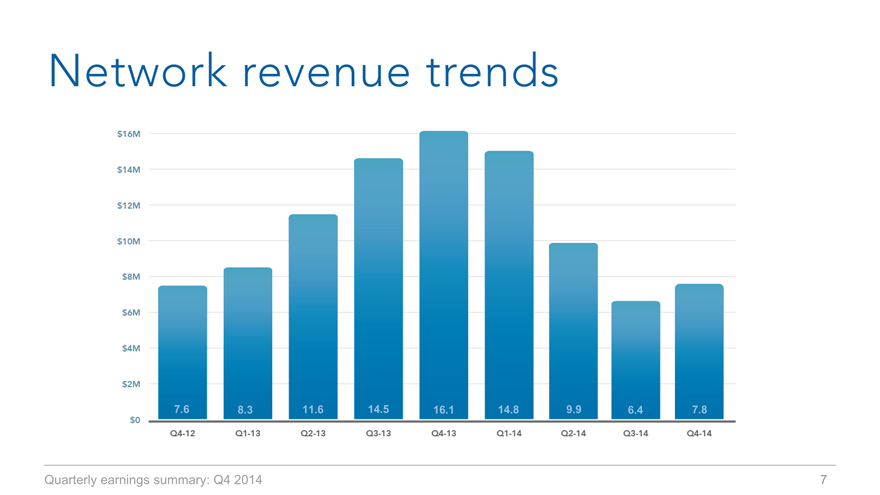
Network revenue trends
7.6 8.3 11.6 14.5 16.1 14.8 9.9 6.4 7.8
Quarterly earnings summary: Q4 2014 7
|
|
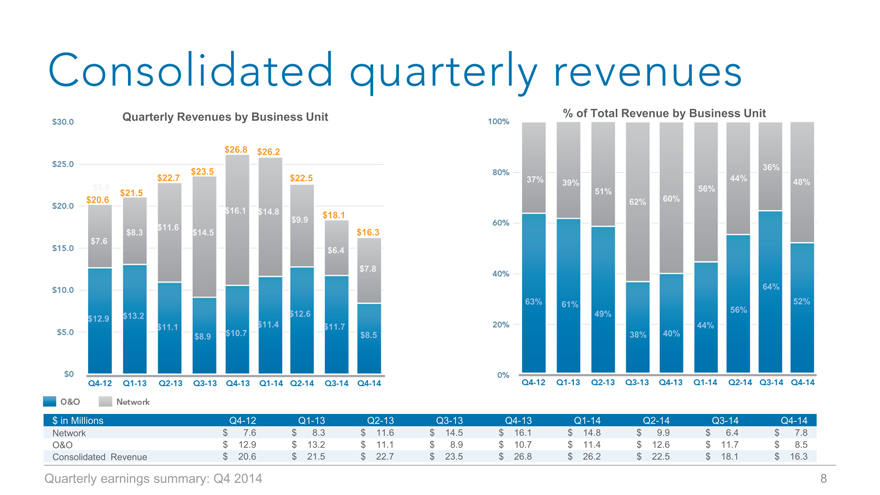
Consolidate quarterly revenues
Quarterly Revenues by Business Unit % of Total Revenue by Business Unit
$26.8 $26.2
36%
$23.5
$22.7 $22.5 37% 44%
39% 48%
$5.0 56%
$20.6 $21.5 51% 60%
62%
$16.1 $14.8
$18.1
$11.6 $9.9
$8.3 $14.5 $16.3
$7.6
$6.4
$7.8
64%
63% 61% 52%
56%
$13.2 $12.6 49%
$12.9
$11.1 $11.4 $11.7 44%
$8.9 $10.7 $8.5 38% 40%
$ in Millions Q4-12 Q1-13 Q2-13 Q3-13 Q4-13 Q1-14 Q2-14 Q3-14 Q4-14
Network $ 7.6 $ 8.3 $ 11.6 $ 14.5 $ 16.1 $ 14.8 $ 9.9 $ 6.4 $ 7.8
O&O $ 12.9 $ 13.2 $ 11.1 $ 8.9 $ 10.7 $ 11.4 $ 12.6 $ 11.7 $ 8.5
Consolidated Revenue $ 20.6 $ 21.5 $ 22.7 $ 23.5 $ 26.8 $ 26.2 $ 22.5 $ 18.1 $ 16.3
Quarterly earnings summary: Q4 2014 8
|
|
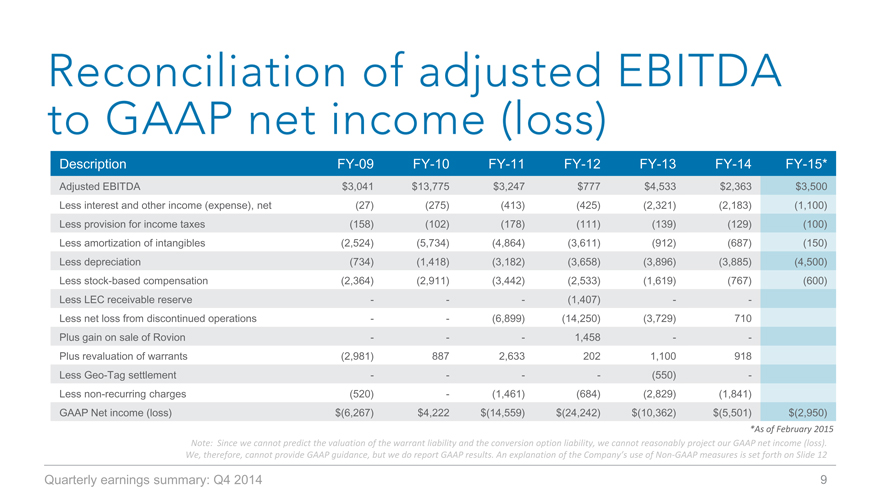
Reconciliation of adjusted ebitda to gaap net income (loss)
Description FY-09 FY-10 FY-11 FY-12 FY-13 FY-14 FY-15*
Adjusted EBITDA $3,041 $13,775 $3,247 $777 $4,533 $2,363 $3,500
Less interest and other income (expense), net (27) (275) (413) (425) (2,321) (2,183) (1,100)
Less provision for income taxes (158) (102) (178) (111) (139) (129) (100)
Less amortization of intangibles (2,524) (5,734) (4,864) (3,611) (912) (687) (150)
Less depreciation (734) (1,418) (3,182) (3,658) (3,896) (3,885) (4,500)
Less stock-based compensation (2,364) (2,911) (3,442) (2,533) (1,619) (767) (600)
Less LEC receivable reserve ——— (1,407) ——
Less net loss from discontinued operations —— (6,899) (14,250) (3,729) 710
Plus gain on sale of Rovion ——— 1,458 ——
Plus revaluation of warrants (2,981) 887 2,633 202 1,100 918
Less Geo-Tag settlement ———— (550) —
Less non-recurring charges (520) — (1,461) (684) (2,829) (1,841)
GAAP Net income (loss) $(6,267) $4,222 $(14,559) $(24,242) $(10,362) $(5,501) $(2,950)
*As of February 2015
Note: Since we cannot predict the valuation of the warrant liability and the conversion option liability, we cannot reasonably project our GAAP net income (loss).
We, therefore, cannot provide GAAP guidance, but we do report GAAP results. An explanation of the Company’s use of Non GAAP measures is set forth on Slide 12
Quarterly earnings summary: Q4 2014 9
|
|
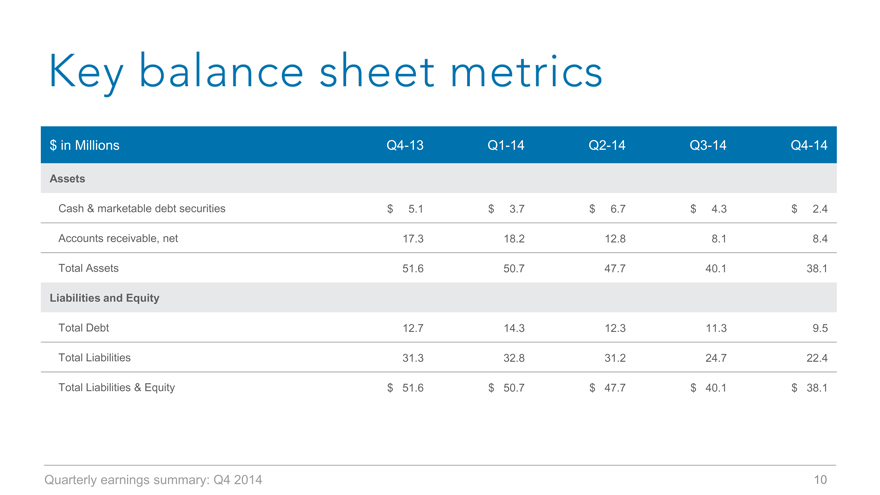
Key balance sheet metrics
$ in Millions Q4-13 Q1-14 Q2-14 Q3-14 Q4-14
Assets
Cash & marketable debt securities $ 5.1 $ 3.7 $ 6.7 $ 4.3 $ 2.4
Accounts receivable, net 17.3 18.2 12.8 8.1 8.4
Total Assets 51.6 50.7 47.7 40.1 38.1
Liabilities and Equity
Total Debt 12.7 14.3 12.3 11.3 9.5
Total Liabilities 31.3 32.8 31.2 24.7 22.4
Total Liabilities & Equity $ 51.6 $ 50.7 $ 47.7 $ 40.1 $ 38.1
Quarterly earnings summary: Q4 2014 10
|
|
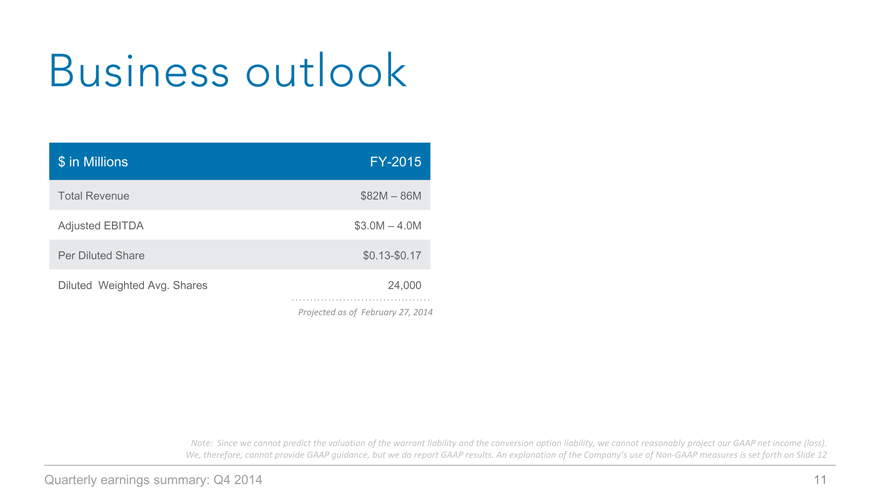
Business outlook
$ in Millions FY-2015
Total Revenue $82M – 86M
Adjusted EBITDA $3.0M – 4.0M
Per Diluted Share $0.13-$0.17
Diluted Weighted Avg. Shares 24,000
Projected as of February 27, 2014
Note: Since we cannot predict the valuation of the warrant liability and the conversion option liability, we cannot reasonably project our GAAP net income (loss).
We, therefore, cannot provide GAAP guidance, but we do report GAAP results. An explanation of the Company’s use of Non GAAP measures is set forth on Slide 12
Quarterly earnings summary: Q4 2014 11
|
|
Use of non-gaap measures
This press release includes the non-GAAP financial measures of “Adjusted EBITDA” and “free cash flow.” Adjusted EBITDA is defined as net income (loss) excluding: provision for income taxes; interest and other income (expense), net; depreciation; amortization; stock based compensation charges; gain or loss on derivatives’ revaluation; net income (loss) from discontinued operations; accrued lease liability/asset; and severance charges. Adjusted EBITDA is reconciled to net income (loss) which we believe is the most comparable GAAP measure. Free cash flow is defined as net cash provided by operating activities less capital expenditures. Free cash flow is reconciled to net cash provided by operating activities which we believe is the most comparable GAAP measure. Adjusted EBITDA and free cash flow, as defined above, are not measurements under GAAP. A reconciliation of net income (loss) to Adjusted EBITDA and free cash flow to net cash provided by operating activities is set forth at the end of this press release.
Management believes that Adjusted EBITDA provides useful information to investors about the company’s performance because it eliminates the effects of period-to-period changes in income from interest on the company’s cash, expense from the company’s financing transactions and the costs associated with income tax expense, capital investments, stock-based compensation expense, net income (loss) from discontinued operations, derivatives’ revaluation charges; accrued lease liability/asset; and severance charges which are not directly attributable to the underlying performance of the company’s business operations. Management uses Adjusted EBITDA in evaluating the overall performance of the company’s business operations.
Management also believes free cash flow to be a liquidity measure that provides useful information to management and investors about the amount of cash generated by the business that, after the acquisition of property and equipment, including information technology infrastructure and land and buildings, can be used for strategic opportunities, including investing in our business, making strategic acquisitions, and strengthening the balance sheet. Analysis of free cash flow also facilitates management’s comparisons of our operating results to competitors’ operating results.
A limitation of non-GAAP Adjusted EBITDA is that it excludes items that often have a material effect on the company’s net income (loss) and earnings per common share calculated in accordance with GAAP. Therefore, management compensates for this limitation by using Adjusted EBITDA in conjunction with net income (loss) and net income (loss) per share measures. The company believes that Adjusted EBITDA provides investors with an additional tool for evaluating the company’s core performance, which management uses in its own evaluation of overall performance, and as a base-line for assessing the future earnings potential of the company.
A limitation of using free cash flow versus the GAAP measure of net cash provided by operating activities as a means for evaluating the company is that free cash flow does not represent the total increase or decrease in the cash balance from operations for the period because it excludes cash used for capital expenditures during the period. The company believes that free cash flow provides investors with an additional tool in evaluating the company’s liquidity.
While the GAAP results are more complete, the company prefers to allow investors to have this supplemental metric since, with reconciliation to GAAP, it may provide greater insight into the company’s financial results. The non-GAAP measures should be viewed as a supplement to, and not as a substitute for, or superior to the GAAP measures.
Quarterly earnings summary: Q4 2014 12
|
|
THANK YOU
Fred Thiel Ken Cragun
Chairman & CEO CFO
fred@local.com kcragun@local.com
Local Corporation | 7555 Irvine Center Drive | Irvine CA 92618 | 949.784.0800 | www.localcorporation.com
Quarterly earnings summary: Q4 2014 13