Attached files
| file | filename |
|---|---|
| EXCEL - IDEA: XBRL DOCUMENT - Hub Group, Inc. | Financial_Report.xls |
| EX-21 - EX-21 - Hub Group, Inc. | hubg-ex21_20141231515.htm |
| EX-32.1 - EX-32.1 - Hub Group, Inc. | hubg-ex321_20141231519.htm |
| EX-23.1 - EX-23.1 - Hub Group, Inc. | hubg-ex231_20141231516.htm |
| EX-10.6 - EX-10.6 - Hub Group, Inc. | hubg-ex106_20141231514.htm |
| EX-31.2 - EX-31.2 - Hub Group, Inc. | hubg-ex312_20141231518.htm |
| EX-31.1 - EX-31.1 - Hub Group, Inc. | hubg-ex311_20141231517.htm |
| EX-10.5 - EX-10.5 - Hub Group, Inc. | hubg-ex105_20141231513.htm |
UNITED STATES
SECURITIES AND EXCHANGE COMMISSION
Washington, D.C. 20549
FORM 10-K
(Mark One)
|
x |
Annual Report Pursuant to Section 13 or 15(d) of the Securities Exchange Act of 1934 |
For the fiscal year ended December 31, 2014
OR
|
¨ |
Transition Report Pursuant to Section 13 or 15(d) of the Securities Exchange Act of 1934 |
Commission File No. 0-27754
HUB GROUP, INC.
(Exact name of registrant as specified in its charter)
|
Delaware |
|
36-4007085 |
|
(State or other jurisdiction of incorporation of organization) |
|
(I.R.S. Employer Identification No.) |
2000 Clearwater Drive
Oak Brook, Illinois 60523
(Address and zip code of principal executive offices)
(630) 271-3600
(Registrant’s telephone number, including area code)
Securities registered pursuant to Section 12(b) of the Act: None
Securities registered pursuant to Section 12(g) of the Act:
Class A Common Stock, $.01 par value
(Title of Class)
Indicate by check mark if the Registrant is a well-known seasoned issuer, as defined in Rule 405 of the Securities Act. Yes x No ¨
Indicate by check mark if Registrant is not required to file reports pursuant to Section 13 or Section 15(d) of the Act. Yes ¨ No x
Indicate by check mark whether the Registrant (1) has filed all reports required to be filed by Section 13 or 15(d) of the Securities Exchange Act of 1934 during the preceding 12 months (or for such shorter period that the Registrant was required to file such reports), and (2) has been subject to such filing requirements for the past 90 days. Yes x No ¨
Indicate by check mark whether the registrant has submitted electronically and posted on its corporate Web site, if any, every Interactive Data File required to be submitted and posted pursuant to Rule 405 of Regulation S-T (§ 229.405 of this chapter) during the preceding 12 months (or for such shorter period that the registrant was required to submit and post such files). Yes x No ¨
Indicate by check mark if disclosure of delinquent filers pursuant to Item 405 of Regulation S-K is not contained herein, and will not be contained, to the best of Registrant’s knowledge, in definitive proxy or information statements incorporated by reference in Part III of this Form 10-K or any amendment to this Form 10-K. x
Indicate by check mark whether the registrant is a large accelerated filer, an accelerated filer, a non-accelerated filer or a smaller reporting company. See definitions of “large accelerated filer”, “accelerated filer” and “smaller reporting company” in Rule 12b-2 of the Exchange Act. (Check one):
|
Large Accelerated Filer |
|
x |
|
Accelerated Filer |
|
¨ |
|
|
|
|
|
|||
|
Non-Accelerated Filer |
|
¨ |
|
Smaller Reporting Company |
|
¨ |
Indicate by check mark whether the registrant is a shell company (as defined in Rule 12b-2 of the Exchange Act). Yes ¨ No x
The aggregate market value of the Registrant’s voting stock held by non-affiliates on June 30, 2014 , based upon the last reported sale price on that date on the NASDAQ Global Select Market of $50.40 per share, was $1,778,865,682.
On February 18, 2015, the Registrant had 36,204,899 outstanding shares of Class A Common Stock, par value $.01 per share, and 662,296 outstanding shares of Class B Common Stock, par value $.01 per share.
Documents Incorporated by Reference
The Registrant’s definitive Proxy Statement for the Annual Meeting of Stockholders to be held on May 8, 2015 (the “Proxy Statement”) is incorporated by reference in Part III of this Form 10-K to the extent stated herein. Except with respect to information specifically incorporated by reference in this Form 10-K, the Proxy Statement is not deemed to be filed as a part hereof.
PART I
FORWARD LOOKING STATEMENTS
The information contained in this annual report contains forward-looking statements within the meaning of the Private Securities Litigation Reform Act of 1995. Words such as “expects,” “hopes,” “believes,” “intends,” “estimates,” “anticipates,” “predicts,” “projects,” “potential,” “may,” “could,” “might,” “should,” and variations of these words and similar expressions are intended to identify these forward-looking statements. In particular, information appearing under “Business,” “Risk Factors,” and “Management’s Discussion and Analysis of Financial Condition and Results of Operations” includes forward-looking statements. Forward-looking statements are inherently uncertain and subject to risks. Such statements should be viewed with caution. Actual results or experience could differ materially from the forward-looking statements as a result of many factors. All forward-looking statements are based upon information available to us on the date of this report. Except as required by law, we expressly disclaim any obliations to publicly release any revisions to forward-looking statements to reflect events after the date of this annual report. Factors that could cause our actual results to differ materially, in addition to those set forth under Items 1A “Risk Factors,” include:
|
· |
the degree and rate of market growth in the domestic intermodal, truck brokerage and logistics markets served by us; |
|
· |
deterioration in our relationships with existing railroads or adverse changes to the railroads’ operating rules; |
|
· |
changes in rail service conditions or adverse weather conditions; |
|
· |
further consolidation of railroads; |
|
· |
the impact of competitive pressures in the marketplace, including entry of new competitors, direct marketing efforts by the railroads or marketing efforts of asset-based carriers; |
|
· |
changes in rail, drayage and trucking company capacity; |
|
· |
railroads moving away from ownership of intermodal assets; |
|
· |
equipment shortages or equipment surplus; |
|
· |
changes in the cost of services from rail, drayage, truck or other vendors; |
|
· |
increases in costs for independent contractors due to regulatory, judicial and legal changes; |
|
· |
labor unrest in the rail, drayage or trucking company communities; |
|
· |
general economic and business conditions; |
|
· |
inability to successfully protect our data against cyber attacks; |
|
· |
significant deterioration in our customers’ financial condition, particularly in the retail, consumer products and durable goods sectors; |
|
· |
fuel shortages or fluctuations in fuel prices; |
|
· |
increases in interest rates; |
|
· |
changes in homeland security or terrorist activity; |
|
· |
difficulties in maintaining or enhancing our information technology systems; |
|
· |
changes to or new governmental regulations; |
|
· |
significant increases to employee health insurance costs; |
|
· |
loss of several of our largest customers and Mode agents; |
|
· |
inability to recruit and retain key personnel and Mode sales agents and IBOs; |
|
· |
inability to recruit and maintain drivers and owner-operators; |
|
· |
changes in insurance costs and claims expense; |
|
· |
changes to current laws which will aid union organizing efforts; and |
|
· |
inability to identify, close and successfully integrate any future business combinations. |
1
|
Item 1. |
BUSINESS |
General
Hub Group, Inc. (“Company”, “we”, “us” or “our”) is a Delaware corporation that was incorporated on March 8, 1995. We are one of North America’s leading asset-light freight transportation management companies. We offer comprehensive intermodal, truck brokerage and logistics services. Since our founding in 1971, we have grown to become one of the largest intermodal marketing companies (“IMC”) in the United States and one of the largest truck brokers. Through our network, we have the ability to arrange for the movement of freight in and out of every major city in the United States, Canada and Mexico. We utilize an asset-light strategy in order to minimize our investment in equipment and facilities and reduce our capital requirements. We arrange freight movement for our customers through transportation carriers and equipment providers.
In April 2011, we acquired all of the capital stock of Exel Transportation Services, Inc. (“ETS”). ETS is now our wholly-owned subsidiary, operating independently and renamed Mode Transportation, LLC (“Mode”). Mode has approximately 233 agents, consisting of 103 sales/operating agents, known as Independent Business Owners (“IBOs”), who sell and operate the business throughout North America and 130 sales only agents. Mode also has a company managed operation and corporate offices in Dallas, TX, a temperature protected services division operated out of our Oak Brook, IL headquarters and corporate offices in Memphis, TN.
We report two distinct business segments. The first segment is “Mode,” which includes the acquired Mode business only. The second segment is “Hub,” which is all business other than Mode. Both segments offer intermodal, truck brokerage and logistics services. “Hub Group” includes both segments.
Hub operates through a network of operating centers throughout the United States, Canada and Mexico. Each operating center is strategically located in a market with a significant concentration of shipping customers and one or more railheads. Hub services a large and diversified customer base in a broad range of industries, including consumer products, retail and durable goods.
Mode markets and operates its freight transportation services primarily through its network of IBOs who enter into contracts with Mode. Mode’s company managed operation includes a business arranging for the transportation of raw materials and finished products for a major food producer and, to a lesser extent, other highway brokerage, intermodal and logistics operations.
Services Provided
Our transportation services for both the Hub and the Mode segments can be broadly placed into the following categories:
Intermodal. As an IMC, we arrange for the movement of our customers’ freight in containers and trailers, typically over long distances of 750 miles or more. We contract with railroads to provide transportation for the long-haul portion of the shipment and with local trucking companies, known as “drayage companies,” for pickup and delivery. As part of our intermodal services, we negotiate rail and drayage rates, electronically track shipments in transit, consolidate billing and handle claims for freight loss or damage on behalf of our customers.
We use our network to access containers and trailers owned by leasing companies, railroads and steamship lines. We are able to track trailers and containers entering a service area and reuse that equipment to fulfill the customers’ outbound shipping requirements. This effectively allows us to “capture” containers and trailers and keep them within our network. As of December 31, 2014, we owned a total of 22,449 53’ private containers. In addition to the containers we own, we had exclusive access to approximately 5,892 rail-owned containers for our dedicated use on the Union Pacific (“UP”) and the Norfolk Southern (“NS”) rails as of December 31, 2014.
Our subsidiary, Hub Group Trucking, Inc. has grown substantially and during 2014, accounted for approximately 70% of Hub’s drayage needs by assisting us in providing reliable, cost effective intermodal services to our customers. Hub Group Trucking has terminals in Atlanta, Birmingham, Charlotte, Chattanooga, Chicago, Cleveland, Columbus (OH), Dallas, Hammond (IN), Harrisburg, Huntsville, Indianapolis, Jacksonville, Kalamazoo, Kansas City, Milwaukee, Memphis, Nashville, Newark, Los Angeles, Philadelphia, Portland (OR), Salt Lake City, Savannah, Seattle, St. Louis, Stockton, and Titusville (FL) metro areas. As of December 31, 2014, Hub Group Trucking leased or owned 1,218 tractors, leased or owned 448 trailers, employed 1,063 drivers and contracted with 1,759 owner-operators.
Truck Brokerage (Highway Services). We are one of the largest truck brokers in the United States, providing customers with another option for their transportation needs. We match the customers’ needs with carriers’ capacity to provide the most effective service and price combination. We have contracts with a substantial base of carriers allowing us to meet the varied needs of our customers. As part of the truck brokerage services, we negotiate rates, track shipments in transit and handle claims for freight loss and damage on behalf of our customers.
2
Logistics and Other Services. Hub’s logistics business operates under the name of Unyson Logistics. Unyson Logistics is comprised of a network of logistics professionals dedicated to developing, implementing and operating customized logistics solutions. Unyson offers a wide range of transportation management services and technology solutions including shipment optimization, load consolidation, mode selection, carrier management, load planning and execution and web-based shipment visibility. Unyson Logistics operates throughout North America, providing operations through its main operating location in St. Louis with additional support locations in the Boston, Chicago, Cleveland and Minneapolis metro areas. Certain Mode agents provide logistics services. Our multi-modal transportation capabilities through both the Hub and Mode segments include small parcel, heavyweight, expedited, less-than-truckload, truckload, intermodal and railcar.
Hub and Mode Network
Hub’s entire network is interactively connected through Hub’s proprietary Network Management System and Mode’s network is connected through its third party transportation management system. This enables us to move freight into and out of every major city in the United States, Canada and Mexico.
In a typical intermodal transaction, the customer contacts one of Hub’s intermodal operating centers or a Mode IBO to place an order. The operating center/IBO determines the price, obtains the necessary intermodal equipment, arranges for it to be delivered to the customer by a drayage company and, after the freight is loaded, arranges for the transportation of the container or trailer to the rail ramp. Relevant information is entered into our system by the assigned operating center/IBO. Our predictive track and trace technology then monitors the shipment to ensure that it arrives as scheduled and alerts the customer service personnel if there are service delays. The operating center/IBO then arranges for and confirms delivery by a drayage company at destination. After unloading, the empty equipment is made available for reloading by the operating center/IBO for the delivery market.
We provide truck brokerage services to our customers in a similar manner. In a typical truck brokerage transaction, the customer contacts one of Hub’s highway operating centers or a Mode IBO to obtain a price quote for a particular freight movement. The customer then provides appropriate shipping information to the Hub operating center/IBO. The operating center/IBO makes the delivery appointment and arranges with the appropriate carrier to pick up the freight. Once it receives confirmation that the freight has been picked up, the operating center/IBO monitors the movement of the freight until it reaches its destination and the delivery has been confirmed. If the carrier notifies us that after delivering the load it will need additional freight, we may notify other operating centers or IBOs. Although under no obligation to do so, those parties may then attempt to secure additional freight for the carrier.
Marketing and Customers
We believe that fostering long-term customer relationships is critical to our success. Through these long-term relationships, we are able to better understand our customers’ needs and tailor our transportation services to the specific customer, regardless of the customer’s size or volume. Hub currently has full-time marketing representatives at various operating centers and sales offices with primary responsibility for servicing local, regional and national accounts. These sales representatives directly or indirectly report to our Chief Marketing Officer. This model allows us to provide Hub customers with both a local marketing contact and access to our competitive rates as a result of being a large, multinational transportation service provider. Mode IBOs and sales agents are located throughout North America and also enjoy local marketing advantages with access to the Hub network and carrier base. Mode IBOs may act to both generate business and to perform the transportation brokerage services. Mode sales agents are focused entirely on the sales effort and utilize an IBO to service the freight.
The Mode acquisition diversifies Hub Group’s customer base with more small and medium sized customers, as Hub has traditionally focused to a significant degree on larger national accounts. Mode IBOs and sales agents are often able to devote more attention to smaller and medium sized shippers and develop long-term relationships with them.
Our marketing efforts have produced a large, diverse customer base, with no one customer representing more than 10% of our total revenue in 2014 in either reporting segment. We service customers in a wide variety of industries, including consumer products, retail and durable goods.
3
Management Information Systems
A primary component of our business strategy is the continued improvement of our core transportation management systems and other technology to ensure that we remain a leader among transportation providers in information technology. Our Network Management System, which is proprietary software, continues to be the basis of our technology for our intermodal and brokerage business. This proprietary software is running on a combination of platforms which includes the IBM iSeries and Microsoft Windows Server environments located at a secure offsite data center. Also a critical part of conducting business is transmitting data to and from our customers, rail providers, and drayage providers. In 2014, we successfully completed an upgrade and migration for all EDI transmissions for intermodal, brokerage, and logistics. This robust integration platform will now serve as our primary communication mechanism. We will continue to offer solutions via our internet based applications at www.hubgroup.com. These solutions offer customers the ability to receive pricing information, place orders, track shipments, and review historical shipment information. In addition, drayage carriers can provide status information, view paperwork requirements and facilitate invoicing. Also new in 2014 and focused on timely communication accessible from a mobile device is our first mobile application, currently being used in Hub Group Trucking as an additional communication mechanism.
Our Unyson business uses highly customized software that includes planning and execution solutions. This solution has enabled us to provide complex supply chain planning and logistics management, modeling, optimization and monitoring for our customers. We are now looking to leverage additional software solutions with more robust and modern capabilities in these areas. This will included sophisticated optimization, customer centric solutions to solve complex supply chain challenges, mobile solutions for carriers and customers, and modern capabilities when interacting via the internet. The beginning of the transformation is now visible with the recent completion and deployment of www.unyson.com.
Mode Transportation utilizes a best in class third party transportation management system to manage its business. This includes providing multi modal solutions, timely information about the status of shipments, business intelligence solutions to better understand outcomes and opportunities as well as the facilitation of customer billing. Our transportation providers also take advantage of a robust portal that allows the exchange of information about available loads, available capacity, and event status information. In addition, we leverage an industry leading solution to provide EDI connectivity between thousands of trading partners from customers to each of the major rail carriers as well as numerous trucking companies. This allows us to provide seamless integration in a timely fashion as we continue to grow our transportation network.
Relationship with Railroads
A key element of our business strategy is to strengthen our close working relationship with the major intermodal railroads in the United States. Due to our size and relative importance, some railroads have dedicated support personnel to focus on our day-to-day service requirements. On a regular basis, our senior executives and each of the railroads meet to discuss major strategic issues concerning intermodal transportation.
We have relationships with each of the following major railroads:
|
Burlington Northern Santa Fe |
|
Florida East Coast |
|
Canadian National |
|
Kansas City Southern |
|
Canadian Pacific |
|
Norfolk Southern |
|
CSX |
|
Union Pacific |
|
Ferromex |
|
|
We also have relationships with each of the following major service providers: APL, CMA CGM (America) Inc., COSCO (China Ocean Shipping (Group) Company), Evergreen Shipping Agency (America) Corp., Express System Intermodal Inc., Domestic Intermodal America, Hamburg Sud Group, Hanjin Shipping, Hapag-Lloyd (America) Inc., Hyundai Merchant Marine, K-Line America, Maersk Sea-Land, Mitsui O.S.K. Lines (America) Inc., NYK (Nippon Usen Kaisha) Line, Triton Overseas Transport, Yang Ming (America) Corp., and Zim Integrated Shipping Services.
Transportation rates are market driven. We sometimes negotiate with the railroads or other major service providers on a route or customer specific basis. Consistent with industry practice, some of the rates we negotiate are special commodity quotations (“SCQs”), which provide discounts from published price lists based on competitive market factors and are designed by the railroads or major service providers to attract new business or to retain existing business. SCQ rates are generally issued for the account of a single IMC. SCQ rates apply to specific customers in specified shipping lanes for a specific period of time, usually up to 12 months.
4
Relationship with Drayage Companies
Hub has a “Quality Drayage Program,” under which participants commit to provide high quality drayage service along with clean and safe equipment, maintain a defined on-time performance level and follow specified procedures designed to minimize freight loss and damage. We negotiate drayage rates for transportation between specific origin and destination points.
We also provide drayage services with our own drayage operations, which we operate through our subsidiary Hub Group Trucking. Our drayage operations employ their own drivers and also contract with owner-operators who supply their own trucks.
Relationship with Trucking Companies
Our truck brokerage operation has a large number of active trucking companies that we use to transport freight. The Hub operating centers and Mode IBOs deal daily with these carriers on an operational level. Our corporate headquarters handles the administrative and regulatory aspects of the trucking company relationship. Our relationships with these trucking companies are important since these relationships determine pricing, load coverage and overall service.
Risk Management and Insurance
We require all drayage companies participating in Hub’s Quality Drayage Program to carry at least $1.0 million in general liability insurance, $1.0 million in truckman’s auto liability insurance and a minimum of $100,000 in cargo insurance. Railroads, which are self-insured, provide limited cargo protection, generally up to $250,000 per shipment. To cover freight loss or damage when a carrier’s liability cannot be established or a carrier’s insurance is insufficient to cover the claim, we carry our own cargo insurance with a limit of $1.0 million per container or trailer and a limit of $20.0 million in the aggregate. We also carry general liability insurance with limits of $1.0 million per occurrence and $2.0 million in the aggregate with a companion $45.0 million umbrella policy on this general liability insurance.
We maintain separate insurance policies to cover potential exposure from our company-owned drayage operations. We carry commercial general liability insurance with a limit of $1.0 million per occurrence, subject to a $2.0 million policy aggregate limit, and trucker’s automobile liability insurance with a limit of $1.0 million per occurrence. Additionally, we have an umbrella excess liability policy with a limit of $19.0 million. We also maintain motor truck cargo liability insurance with a limit of $1.0 million per occurrence.
Government Regulation
Hub Group, Inc. and various subsidiaries, including Mode Transportation, LLC, are licensed by the Department of Transportation as brokers in arranging for the transportation of general commodities by motor vehicle. To the extent that the Hub operating centers and Mode IBOs perform truck brokerage services, they do so under these licenses. The Department of Transportation prescribes qualifications for acting in this capacity, including a $75,000 surety bond that we have posted. In addition, Hub and Mode each have customs bonds. To date, compliance with these regulations has not had a material adverse effect on our results of operations or financial condition. However, the transportation industry is subject to legislative or regulatory changes that can affect the economics of the industry by requiring changes in operating practices or influencing the demand for, and cost of providing, transportation services.
Custom-Trade Partnership Against Terrorism
We achieved Custom-Trade Partnership Against Terrorism (C-TPAT) certification in 2013 and validation in 2014. C-TPAT is a voluntary supply chain security program led by the U.S. Customs and Border Protection focused on improving the security of private companies’ supply chains with respect to terrorism. Companies who achieve C-TPAT certification must have a documented process for determining and alleviating risks throughout their international supply chain. This certification allows us to be considered low risk, resulting in expedited processing of our customers’ cargo, including fewer customs examinations.
Competition
The transportation services industry is highly competitive. We compete against other IMCs, as well as logistics companies, third party brokers, trucking companies and railroads that market their own intermodal services. Several larger trucking companies have entered into agreements with railroads to market intermodal services nationwide. Competition is based primarily on freight rates, quality of service, reliability, transit time and scope of operations. Several transportation service companies and trucking companies, and all of the major railroads, have substantially greater financial and other resources than we do.
5
General
Employees: As of December 31, 2014, Hub Group had 2,568 employees consisting of 2,443 Hub employees, or 1,380 employees excluding drivers, and 125 Mode employees. We are not a party to any collective bargaining agreements and consider our relationship with our employees to be satisfactory.
As of December 31, 2014, Mode had 103 IBOs (sales/operating agents) and 130 sales only agents. Nearly all of the sales agents and IBOs are under contract with Mode.
Other: No material portion of our operations is subject to renegotiation of profits or termination of contracts at the election of the federal government. Our business is seasonal to the extent that certain customer groups, such as retail, are seasonal.
Periodic Reports
Our annual report to the Securities and Exchange Commission (“SEC”) on Form 10-K, our quarterly reports on Form 10-Q and current reports on Form 8-K, and amendments to such reports, are available free of charge on our website at www.hubgroup.com as soon as reasonably practicable after we electronically file or furnish such reports to the SEC. Information on our website does not constitute part of this annual report on Form 10-K. In addition, the SEC maintains a website (http://www.sec.gov) that contains our annual, quarterly, and current reports, proxy and information statements, and other information we electronically file with, or furnish to, the SEC. Any materials we file with, or furnish to, the SEC may also be read and/or copied at the SEC’s Public Reference Room at 100 F Street, N.E., Washington, D.C. 20549. Information on the operation of the Public Reference Room may be obtained by calling the SEC at 1-800-SEC-0330.
|
Item 1A. |
RISK FACTORS |
Because our business is concentrated on intermodal marketing, any decrease in demand for intermodal transportation services compared to other transportation services could have an adverse effect on our results of operations.
We derived 62% of our revenue from our intermodal services in 2014, 64% in 2013 and 65% in 2012. As a result, any decrease in demand for intermodal transportation services compared to other transportation services could have an adverse effect on our results of operations.
Because we depend on railroads for our operations, our operating results and financial condition are likely to be adversely affected by any reduction or deterioration in rail service.
We depend on the major railroads in the United States for virtually all of the intermodal services we provide. In many markets, rail service is limited to one or a few railroads. Consequently, a reduction in, or elimination of, rail service to a particular market is likely to adversely affect our ability to provide intermodal transportation services to some of our customers. In addition, the railroads are relatively free to adjust shipping rates up or down as market conditions permit. Rate increases would result in higher intermodal transportation costs, reducing the attractiveness of intermodal transportation compared to truck or other transportation modes, which could cause a decrease in demand for our services. Further, our ability to continue to expand our intermodal transportation business is dependent upon the railroads’ ability to increase capacity for intermodal freight and provide consistent and reliable service. Our business could also be adversely affected by a work stoppage at one or more railroads or by adverse weather conditions or other factors that hinder the railroads’ ability to provide reliable transportation services. In the past, there have been service issues when railroads have merged. As a result, we cannot predict what effect, if any, further consolidations among railroads may have on intermodal transportation services or our results of operations.
Because our relationships with the major railroads are critical to our ability to provide intermodal transportation services, our business may be adversely affected by any change to those relationships.
We have important relationships with certain major U.S. railroads. To date, the railroads have chosen to rely on us, other IMCs and other intermodal competitors to market their intermodal services rather than fully developing their own marketing capabilities. If one or more of the major railroads were to decide to reduce their dependence on us, the volume of intermodal shipments we arrange would likely decline, which could adversely affect our results of operations and financial condition.
6
Because we rely on drayage companies in our intermodal operations, our ability to expand our business or maintain our profitability may be adversely affected by a shortage of drivers and drayage capacity.
In certain markets we serve, we use third-party drayage companies for pickup and delivery of some or all of our intermodal containers. Most drayage companies operate relatively small fleets and have limited access to capital for fleet expansion. In some of our markets, there are a limited number of drayage companies that can meet our quality standards. This could limit our ability to expand our intermodal business or require us to establish more of our own drayage operations in some markets, which could increase our operating costs and could adversely affect our profitability and financial condition. Also, the trucking industry chronically experiences a shortage of available drivers, which may limit the ability of third-party drayage companies to expand their fleets. This shortage also may require them to increase drivers’ compensation, thereby increasing our cost of providing drayage services to our customers. Therefore, the driver shortage could also adversely affect our profitability and limit our ability to expand our intermodal business.
Because we depend on trucking companies for our truck brokerage services, our ability to maintain or expand our truck brokerage business may be adversely affected by a shortage of trucking capacity.
We derived 19% of our revenue from our truck brokerage services in both 2014 and 2013 and 21% in 2012. We depend upon various third-party trucking companies for the transportation of our customers’ loads. Particularly during periods of economic expansion, trucking companies may be unable to expand their fleets due to capital constraints or chronic driver shortages, and these trucking companies also may raise their rates. If we face insufficient capacity among our third-party trucking companies, we may be unable to maintain or expand our truck brokerage business. Also, we may be unable to pass rate increases on to our customers, which could adversely affect our profitability.
Because we depend on less than truckload companies for our logistic services, our ability to maintain or expand our logistics business may be adversely affected by a shortage of less than truckload capacity.
We derived 19% of our revenue from our logistics services in 2014, 17% in 2013 and 14% in 2012. We depend on various less than truckload companies for the transportation of our customers’ freight. As many of our logistic contracts have a gain share component, changes in less than truckload rates due to these trucking companies being unable to expand their fleets or chronic driver shortages, may affect our profitability and our ability to retain our customers.
Because we use a significant number of independent contractors, such as owner operators, in our businesses, legislative, judicial and regulatory authorities could take actions or render decisions that change the independent contractor classification, which could have a significant impact on our gross margin and operating income.
We do business with a large number of independent contractors, such as Mode Sales Independent Business Owners and Operations Independent Business Owners and Hub Group Trucking owner-operators, consistent with longstanding industry practices. Legislative, judicial, and regulatory (including tax) authorities could take actions or render decisions that could affect the independent contractor classifications. Class action and individual lawsuits have been filed against us and others in our industries, challenging the independent contractor classifications. See Item 3 - Legal Proceedings for further discussion and see Note 15 to the consolidated financial statements under “Legal Matters” for a description of material pending litigation and regulatory matters affecting us and certain risks to our business presented by such matters. If current independent contractors are determined to be employees, then we may incur legal liabilities associated with that determination, such as liability for unpaid wages, overtime, employee health insurance and taxes. If we were to change how we treat independent contractors or reclassify independent contractors to employees, then we would likely incur expenses associated with that reclassification and could incur additional ongoing expenses. The costs associated with these matters could have a material adverse effect on results of operations and our financial position.
We depend on third parties for equipment essential to operate our business, and if we fail to secure sufficient equipment, we could lose customers and revenue.
We depend on third parties for transportation equipment, such as tractors, containers, chassis and trailers, necessary for the operation of our business. Our industry has experienced equipment shortages in the past, particularly during the peak shipping season in the fall. A substantial amount of intermodal freight originates at or near the major West Coast ports, which have historically had the most severe equipment shortages. If we cannot secure sufficient transportation equipment at a reasonable price from third parties to meet our customers’ needs, our customers may seek to have their transportation needs met by other providers. This could have an adverse effect on our business, results of operations and financial position.
7
Our business could be adversely affected by strikes or work stoppages by draymen, truckers, port workers and railroad workers.
There has been labor unrest, including strikes and work stoppages, among workers at various transportation providers and in industries affecting the transportation industry, such as port workers. We could lose business due to any significant work stoppage or slowdown and, if labor unrest results in increased rates for transportation providers such as draymen, we may not be able to pass these cost increases on to our customers. Strikes among longshoreman and clerical workers at ports in the past few years have slowed down the ports for a time, creating a major impact on the transportation industry. West coast longshoremen have been operating without a union contract since the summer of 2014, and a risk of labor unrest and labor slowdowns continues though the parties recently reached a tentative agreement that still must be approved by the union membership. Work stoppages occurring among owner-operators in a specific market have increased our operating costs periodically over the past several years. In the past several years, there have been strikes involving railroad workers. Future strikes by railroad workers in the United States, Canada or anywhere else that our customers’ freight travels by railroad would impact our operations. Any significant work stoppage, slowdown or other disruption involving ports, railroads, truckers or draymen could adversely affect our business and results of operations.
Losing one or more key Mode IBOs or sales agents could have an adverse effect on revenue and net income.
Certain Mode IBOs and sales agents represent a large portion of Mode’s overall revenues. Traditionally, transportation agents have shifted from company to company, although most companies, including Mode, attempt to address this situation contractually. If one or more large IBOs or sales agents were to terminate their relationship with Mode, there could be an adverse effect on Mode’s business and results of operations.
Our results of operations are susceptible to changes in general economic conditions and cyclical fluctuations.
Economic recession, customers’ business cycles, changes in fuel prices and supply, interest rate fluctuations, increases in fuel or energy taxes and other general economic factors affect the demand for transportation services and the operating costs of railroads, trucking companies and drayage companies. We have little or no control over any of these factors or their effects on the transportation industry. Increases in the operating costs of railroads, trucking companies or drayage companies can be expected to result in higher freight rates. Our operating margins could be adversely affected if we were unable to pass through to our customers the full amount of higher freight rates. Economic recession or a downturn in customers’ business cycles also may have an adverse effect on our results of operations and growth by reducing demand for our services. Therefore, our results of operations, like the entire freight transportation industry, are cyclical and subject to significant period-to-period fluctuations.
Relatively small increases in our transportation costs that we are unable to pass through to our customers are likely to have a significant effect on our gross margin and operating income.
Transportation costs represented 90% of our consolidated revenue in 2014 and 89% in both 2013 and 2012. Because transportation costs represent such a significant portion of our costs, even relatively small increases in these transportation costs, if we are unable to pass them through to our customers, are likely to have a significant effect on our gross margin and operating income. Transportation costs may increase if we are unable to sign on owner-operators or recruit employee drivers as this may increase driver costs or force us to use more expensive purchased transportation.
Our business could be adversely affected by heightened security measures, actual or threatened terrorist attacks, efforts to combat terrorism, military action against a foreign state or other similar event.
We cannot predict the effects on our business of heightened security measures, actual or threatened terrorist attacks, efforts to combat terrorism, military action against a foreign state or other similar events. It is possible that one or more of these events could be directed at U.S. or foreign ports, borders, railroads or highways. Heightened security measures or other events are likely to slow the movement of freight through U.S. or foreign ports, across borders or on U.S. or foreign railroads or highways and could adversely affect our business and results of operations. Any of these events could also negatively affect the economy and consumer confidence, which could cause a downturn in the transportation industry.
8
If we fail to maintain and enhance our information technology systems, or if we fail to successfully implement new technology or enhancements, we may be at a competitive disadvantage and lose customers.
Hub Group’s information technology systems are critical to our operations and our ability to compete effectively as an IMC, truck broker and logistics provider. We expect our customers to continue to demand more sophisticated information technology applications from their suppliers. If we do not continue to enhance Hub Group’s Network Management System and the logistics software we use to meet the increasing demands of our customers, we may be placed at a competitive disadvantage and could lose customers. Information technology enhancements are also costly and challenging to implement and failure to successfully implement these enhancements could adversely affect our results of operations and financial condition.
Our information technology systems are subject to risks that we cannot control and the inability to use our information technology systems could materially adversely affect our business.
Our information technology systems are dependent upon global communications providers, web browsers, telephone systems and other aspects of the Internet infrastructure that have experienced significant system failures and electrical outages in the past. Our systems are susceptible to outages from fire, floods, power loss, telecommunications failures, break-ins and similar events. Our servers are vulnerable to computer viruses, break-ins and similar disruptions from unauthorized tampering with our computer systems. The occurrence of any of these events could disrupt or damage our information technology systems and inhibit our internal operations, our ability to provide services to our customers and the ability of our customers and vendors to access our information technology systems. This could result in a loss of customers or a reduction in demand for our services.
Disruptions and other damages to our information technology and other networks and operations and breaches in data security could adversely affect our business.
Our current operations reside on multiple technology platforms. The size and complexity of our computer systems make them potentially vulnerable to breakdown, malicious intrusion and random attack. Failure to prevent or mitigate data loss or other security breaches could expose us or our vendors or customers to a risk of loss or misuse of such information, adversely affect our operating results, result in litigation or potential liability for us and otherwise harm our business. Likewise, data privacy breaches by employees and others who access our systems may pose a risk that sensitive customer or vendor data may be exposed to unauthorized persons or to the public, adversely impacting our customer service, employee relationships and our reputation. While we believe that we have taken appropriate security measures to protect our data and information technology systems and prevent data loss, there can be no assurance that our efforts may not prevent breakdowns or breaches in our systems that could have an adverse effect on our business.
The transportation industry is subject to government regulation, and regulatory changes could have a material adverse effect on our operating results or financial condition.
Hub Group, Inc. and various subsidiaries, including Mode Transportation, LLC, are licensed by the Department of Transportation as motor carrier freight brokers. The Department of Transportation prescribes qualifications for acting in this capacity, including surety bond requirements. Our Hub Group Trucking subsidiary is licensed by the Department of Transportation to act as a motor carrier. To date, compliance with these regulations has not had a material adverse effect on our results of operations or financial condition. However, the transportation industry is subject to legislative or regulatory changes, including potential limits on carbon emissions under climate change legislation and Department of Transportation regulations regarding, among other things, driver breaks and “restart” rules, that can affect the economics of the industry by requiring changes in operating practices or influencing the demand for, and cost of providing, transportation services. We may become subject to new or more restrictive regulations relating to fuel emissions or limits on vehicle weight and size. Future laws and regulations may be more stringent and require changes in operating practices, influence the demand for transportation services or increase the cost of providing transportation services, any of which could adversely affect our business and results of operations.
We are not able to accurately predict how new governmental laws and regulations, or changes to existing laws and regulations, will affect the transportation industry generally, or us in particular. Although government regulation that affects us and our competitors may simply result in higher costs that can be passed along to customers, that may not be the case.
9
Antidumping and Other Duties Could be Imposed on Us and Our Suppliers
We import 53 foot intermodal containers manufactured in China. A petition has been filed requesting the United States Government to impose antidumping duties on these containers. Under United States law, an antidumping duty may be imposed on any imports if two conditions are met. First, the Department of Commerce must decide that the imports are being sold in the United States at less than fair value. Second, the International Trade Commission (the “ITC”) must determine that the United States industry is materially injured, threatened with material injury or materially retarded by reason of the imports. The ITC’s determination of material injury or retardation involves a two-prong inquiry: first, whether the industry is materially injured or retarded, and second, whether the dumping, not other factors, caused the injury or retardation. The ITC is required to analyze the volume of imports, the effect of imports on United States prices for like merchandise, and the effects the imports have on United States producers of like products, taking into account many factors, including lost sales, market share, profits, productivity, return on investment, and utilization of production capacity. If antidumping or other increased duties are imposed on these containers, this could adversely affect our results of operations.
Our operations may be subject to various environmental laws and regulations, the violation of which could result in substantial fines or penalties.
From time to time, we arrange for the movement of hazardous materials at the request of our customers. As a result, we may be subject to various environmental laws and regulations relating to the handling of hazardous materials. If we are involved in a spill or other accident involving hazardous materials, or if we are found to be in violation of applicable laws or regulations, we could be subject to substantial fines or penalties and to civil and criminal liability, any of which could have an adverse effect on our business and results of operations.
We derive a significant portion of our revenue from our largest customers and the loss of several of these customers could have a material adverse effect on our revenue and business.
For Hub Group’s consolidated revenue, our largest 20 customers accounted for approximately 36% of our revenue in 2014 and 34% in both 2013 and 2012. A reduction in or termination of our services by several of our largest customers could have a material adverse effect on our revenue and business.
Insurance and claims expenses could significantly reduce our earnings.
Our future insurance and claims expenses might exceed historical levels, which could reduce our earnings. If the number or severity of claims increases, our operating results could be adversely affected. We maintain insurance with licensed insurance companies. Our insurance and claims expense could increase when our current coverage expires. If these expenses increase, and we are unable to offset the increase with higher freight rates, our earnings could be materially and adversely affected.
Our success depends upon our ability to recruit and retain key personnel including Mode Sales Agents and IBOs.
Our success depends upon attracting and retaining the services of our management team, Mode Sales Agents and IBOs as well as our ability to attract and retain a sufficient number of other qualified personnel to run our business. There is substantial competition for qualified personnel in the transportation services industry. As all key personnel devote their full time to our business, the loss of any member of our management team, key Mode Sales Agents or IBOs or other key persons could have an adverse effect on us. We do not have written employment agreements with any of our executive officers and do not maintain key man insurance on any of our executive officers. Nearly all Mode Sales Agents and IBOs are under contract with Mode.
Our growth could be adversely affected if we are not able to identify, successfully acquire and integrate future acquisition prospects.
We believe that future acquisitions and/or the failure to make such acquisitions could significantly impact financial results. Financial results most likely to be impacted include, but are not limited to, revenue, gross margin, salaries and benefits, selling general and administrative expenses, depreciation and amortization, interest expense, net income and our debt level.
10
An economic downturn could materially adversely affect our business.
Our operations and performance depend significantly on economic conditions. Uncertainty about global economic conditions poses a risk as consumers and businesses may postpone spending in response to tighter credit, negative financial news and/or declines in income or asset values, which could have a material negative effect on demand for transportation services. We are unable to predict the likely duration and severity of disruptions in the financial markets and the adverse global economic conditions, and if the current uncertainty continues or economic conditions further deteriorate, our business and results of operations could be materially and adversely affected. Other factors that could influence demand include fluctuations in fuel costs, labor costs, consumer confidence, and other macroeconomic factors affecting consumer spending behavior. There could be a number of follow-on effects from a credit crisis on our business, including the insolvency of key transportation providers and the inability of our customers to obtain credit to finance development and/or manufacture products resulting in a decreased demand for transportation services. Our revenues and gross margins are dependent upon this demand, and if demand for transportation services declines, our revenues and gross margins could be adversely affected.
Although we believe we have adequate liquidity and capital resources to fund our operations internally, our inability to access the capital markets on favorable terms, or at all, may adversely affect our ability to engage in strategic transactions. The inability to obtain adequate financing from debt or capital sources could force us to self-fund strategic initiatives or even forgo certain opportunities, which in turn could potentially harm our performance.
Uncertainty about global economic conditions could also increase the volatility of our stock price.
We are exposed to credit risk and fluctuations in the market values of our investment portfolio.
Although we have not recognized any material losses on our cash and cash equivalents, future declines in their market values could have a material adverse effect on our financial condition and operating results. The value or liquidity of our cash and cash equivalents could decline, which could have a material adverse effect on our financial condition and operating results.
|
Item 1B. |
UNRESOLVED STAFF COMMENTS |
None.
Item 1C.EXECUTIVE OFFICERS OF THE REGISTRANT
In reliance on General Instruction G to Form 10-K, information on executive officers of the Registrant is included in this Part I. The table sets forth certain information as of February 1, 2015 with respect to each person who is an executive officer of the Company.
|
Name |
|
Age |
|
Position |
|
|
|
|
||
|
David P. Yeager |
|
61 |
|
Chairman of the Board of Directors and Chief Executive Officer |
|
|
|
|
||
|
Mark A. Yeager |
|
50 |
|
Vice Chairman of the Board of Directors, President and Chief Operating Officer |
|
|
|
|
||
|
Terri A. Pizzuto |
|
56 |
|
Executive Vice President, Chief Financial Officer and Treasurer |
|
|
|
|
||
|
Daniel W. Burke |
|
51 |
|
Chief Intermodal Officer |
|
|
|
|
|
|
|
Christopher R. Kravas |
|
49 |
|
Chief Marketing Officer |
|
|
|
|
|
|
|
David L. Marsh |
|
47 |
|
Chief Supply Chain Officer |
|
|
|
|
||
|
James J. Damman |
|
57 |
|
President – Mode Transportation |
|
|
|
|
||
|
James B. Gaw |
|
64 |
|
Executive Vice President-Sales |
|
|
|
|
||
|
|
|
|
|
|
11
David P. Yeager has served as our Chairman of the Board since November 2008 and as Chief Executive Officer since March 1995. From March 1995 through November 2008, Mr. Yeager served as Vice Chairman of the Board. From October 1985 through December 1991, Mr. Yeager was President of Hub Chicago. From 1983 to October 1985, he served as Vice President, Marketing of Hub Chicago. Mr. Yeager founded the St. Louis Hub in 1980 and served as its President from 1980 to 1983. Mr. Yeager founded the Pittsburgh Hub in 1975 and served as its President from 1975 to 1977. Mr. Yeager received a Masters in Business Administration degree from the University of Chicago in 1987 and a Bachelor of Arts degree from the University of Dayton in 1975. Mr. Yeager is the brother of Mark A. Yeager.
Mark A. Yeager has served as Vice Chairman of the Board since November 2008. He became the President of the Company in January 2005 and has been our Chief Operating Officer and a Director since May 2004. From July 1999 to December 2004, Mr. Yeager was President-Field Operations. From November 1997 through June 1999, Mr. Yeager was Division President, Secretary and General Counsel. From March 1995 to November 1997, Mr. Yeager was Vice President, Secretary and General Counsel. From May 1992 to March 1995, Mr. Yeager served as our Vice President-Quality. Prior to joining us in 1992, Mr. Yeager was an associate at the law firm of Grippo & Elden from January 1991 through May 1992 and an associate at the law firm of Sidley & Austin from May 1989 through January 1991. Mr. Yeager received a Juris Doctor degree from Georgetown University in 1989 and a Bachelor of Arts degree from Indiana University in 1986. Mr. Yeager is the brother of David P. Yeager.
Terri A. Pizzuto has been our Executive Vice President, Chief Financial Officer and Treasurer since March 2007. Prior to this promotion, Ms. Pizzuto was Vice President of Finance from July 2002 through February 2007. Prior to joining us, Ms. Pizzuto was a partner in the Assurance and Business Advisory Group at Arthur Andersen LLP. Ms. Pizzuto worked for Arthur Andersen LLP for 22 years holding various positions and serving numerous transportation companies. Ms. Pizzuto received a Bachelor of Science in Accounting from the University of Illinois in 1981. Ms. Pizzuto is a CPA and a member of the American Institute of Certified Public Accountants.
Daniel W. Burke became our Chief Intermodal Officer in May of 2014 with responsibility for Hub Group’s intermodal operations and drayage subsidiary, Hub Group Trucking. Previously, Mr. Burke served as President of Hub Group Trucking and has been with the company since October 2010. Prior to joining Hub Group, Mr. Burke held various senior management positions at the Santa Fe Railway and the Burlington Northern Santa Fe primarily in the Intermodal and Automotive business units. Additionally, he was an equity owner in an intermodal services company that provided a variety of terminal services such as ramp operations, gate operations, container and chassis maintenance, crane maintenance and fleet maintenance. Dan earned a Bachelor of Science degree in Marketing from Eastern Illinois University.
Christopher R. Kravas became our Chief Marketing Officer in May of 2014 overseeing the company’s sales, corporate marketing and customer service organizations. Previously, Mr. Kravas served as Chief Intermodal Officer since October 2007. Prior to this promotion, Mr. Kravas was Executive Vice President-Strategy and Yield Management from December 2003 through September 2007. From February 2002 through November 2003, Mr. Kravas served as President of Hub Highway Services. From February 2001 through December 2001, Mr. Kravas was Vice President-Enron Freight Markets. Mr. Kravas joined Enron after it acquired Webmodal, an intermodal business he founded. Mr. Kravas was Chief Executive Officer of Webmodal from July 1999 through February 2001. From 1989 through June 1999 Mr. Kravas worked for the Burlington Northern Santa Fe Railway in various positions in the intermodal business unit and finance department. Mr. Kravas received a Bachelor of Arts degree in 1987 from Indiana University and a Masters in Business Administration in 1994 from the University of Chicago.
David L. Marsh was named our Chief Supply Chain Officer in May 2014 with responsibility for Unyson Logistics and Hub Highway. Previously, Mr. Marsh served as Chief Marketing Officer since October 2007. Prior to this promotion, Mr. Marsh was Executive Vice President-Highway from February 2004 through September 2007. Mr. Marsh previously served as President of Hub Ohio from January 2000 through January 2004. Mr. Marsh joined us in March 1991 and became General Manager with Hub Indianapolis in 1993, a position he held through December 1999. Prior to joining Hub Group, Mr. Marsh worked for Carolina Freight Corporation, a less than truckload carrier, starting in January 1990. Mr. Marsh received a Bachelor of Science degree in Marketing and Physical Distribution from Indiana University-Indianapolis in December 1989. Mr. Marsh has been a member of the American Society of Transportation and Logistics, the Indianapolis Traffic Club, the Council for Logistics Management and served as an advisor to the Indiana University-Indianapolis internship program for transportation and logistics. Mr. Marsh was honored as the Indiana Transportation Person of the Year in 1999.
12
James J. Damman assumed the role of President of Mode Transportation, following the acquisition of Exel Transportation Services from Deutsche Post DHL in April 2011. Prior to this transaction, Mr. Damman served as a President of Exel Transportation Services and President of Technology, Aerospace and Service Logistics Americas for DHL/Exel. Before Exel, he served as a President of Transentric LLC, a supply chain technology provider. Prior to this, Mr. Damman held senior executive roles in operations, marketing, sales and customer service with the Union Pacific Railroad. Mr. Damman has been in Transportation and Supply Chain Management since 1980, holding various executive and management positions. Mr. Damman received a Bachelor of Science degree in Business from Central Michigan University in 1980 and a Master of Business Administration from Southern Illinois University at Edwardsville in 1986.
James B. Gaw has been our Executive Vice President-Sales since February 2004. From December 1996 through January 2004, Mr. Gaw was President of Hub North Central, located in Milwaukee. From 1990 through late 1996, he was Vice President and General Manager of Hub Chicago. Mr. Gaw joined Hub Chicago as Sales Manager in 1988. Mr. Gaw’s entire career has been spent in the transportation industry, including 13 years of progressive leadership positions at Itofca, an intermodal marketing company, and Flex Trans. Mr. Gaw received a Bachelor of Science degree from Elmhurst College in 1973.
Directors of the Registrant
In addition to David P. Yeager and Mark A. Yeager, the following four individuals are also on our Board of Directors: Gary D. Eppen – currently retired and formerly the Ralph and Dorothy Keller Distinguished Service Professor of Operations Management and Deputy Dean for part-time Masters in Business Administration Programs at The University of Chicago Booth School of Business; Charles R. Reaves – Chief Executive Officer of Reaves Enterprises, Inc., a real estate development company, Martin P. Slark – Chief Executive Officer of Molex Incorporated, a manufacturer of electronic, electrical and fiber optic interconnection products and systems, and Jonathan P. Ward – Operating Partner at Kohlberg & Co., a leading U.S. private equity firm.
|
Item 2. |
PROPERTIES |
We directly, or indirectly through our subsidiaries, operate 36 offices throughout the United States, Canada and Mexico, including our headquarters in Oak Brook, Illinois and our Company-owned drayage operations located throughout the United States. Hub operates out of 35 of the 36 offices. Mode has a company managed operation and corporate offices in Dallas, TX, a temperature protected services division operated out of our Oak Brook, IL headquarters and corporate offices in Memphis, TN. All of our office space except for our corporate headquarters is leased. Most office leases have initial terms of more than one year, and many include options to renew. While some of our leases expire in the near term, we do not believe that we will have difficulty in renewing them or in finding alternative office space. We believe that our offices are adequate for the purposes for which they are currently used.
|
Item 3. |
LEGAL PROCEEDINGS |
We are a party to litigation incident to our business, including claims for personal injury and/or property damage, bankruptcy preference claims, claims regarding freight lost or damaged in transit, improperly shipped or improperly billed. Some of the lawsuits to which we are party are covered by insurance and are being defended by our insurance carriers. Some of the lawsuits are not covered by insurance and we defend those ourselves. We do not believe that the outcome of this litigation will have a materially adverse effect on our financial position or results of operations. See Item 1 Business—Risk Management and Insurance and see Note 15 to the consolidated financial statements under “Legal Matters”.
|
Item 4. |
MINE SAFETY DISCLOSURES |
Not applicable
13
PART II
|
Item 5. |
MARKET FOR REGISTRANTS COMMON EQUITY AND RELATED SHAREHOLDER MATTERS AND ISSUER PURCHASES OF EQUITY SECURITIES |
Our Class A Common Stock (“Class A Common Stock”) trades on the NASDAQ Global Select Market tier of the NASDAQ Stock Market under the symbol “HUBG.” There is no established trading market for shares of our Class B Common Stock (the “Class B Common Stock” together with the Class A Common Stock, the “Common Stock”). Set forth below are the high and low closing prices for shares of the Class A Common Stock for each full quarterly period in 2014 and 2013.
|
|
2014 |
|
|
2013 |
|
||||||||
|
|
High |
|
Low |
|
|
High |
|
Low |
|
||||
|
|
|
|
|
|
|
|
|
|
|
|
|
|
|
|
First Quarter |
$ |
43.09 |
|
$ |
38.17 |
|
|
$ |
41.18 |
|
$ |
33.10 |
|
|
|
|
|
|
|
|
|
|
|
|
|
|
|
|
|
Second Quarter |
$ |
50.63 |
|
$ |
39.13 |
|
|
$ |
39.78 |
|
$ |
34.50 |
|
|
|
|
|
|
|
|
|
|
|
|
|
|
|
|
|
Third Quarter |
$ |
51.47 |
|
$ |
39.14 |
|
|
$ |
40.67 |
|
$ |
35.71 |
|
|
|
|
|
|
|
|
|
|
|
|
|
|
|
|
|
Fourth Quarter |
$ |
41.40 |
|
$ |
32.69 |
|
|
$ |
40.37 |
|
$ |
34.85 |
|
On February 18, 2015, there were approximately 413 stockholders of record of the Class A Common Stock and, in addition, there were an estimated 8,557 beneficial owners of the Class A Common Stock whose shares were held by brokers and other fiduciary institutions. On February 18, 2015, there were 10 holders of record of our Class B Common Stock.
We were incorporated in 1995 and have never paid cash dividends on either the Class A Common Stock or the Class B Common Stock. The declaration and payment of dividends are subject to the discretion of the Board of Directors. Any determination as to the payment of dividends will depend upon our results of operations, capital requirements and financial condition of the Company, and such other factors as the Board of Directors may deem relevant. Accordingly, there can be no assurance that the Board of Directors will declare or pay cash dividends on the shares of Common Stock in the future. Our certificate of incorporation requires that any cash dividends must be paid equally on each outstanding share of Class A Common Stock and Class B Common Stock. Our credit facility prohibits us from paying dividends on the Common Stock if there has been, or immediately following the payment of a dividend there would be, a default or an event of default under the credit facility. We are currently in compliance with the covenants contained in the credit facility.
See Note 16 to the consolidated financial statements for information on share repurchases.
14
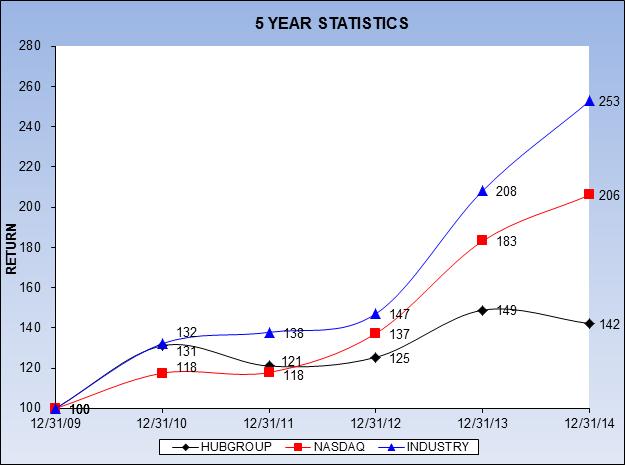
Performance Graph
The following line graph compares the Company’s cumulative total stockholder return on its Class A Common Stock since December 31, 2009 with the cumulative total return of the Nasdaq Stock Market Index (NQUSBT) and the Nasdaq Trucking and Transportation Index (NQUSB27707). These comparisons assume the investment of $100 on December 31, 2009 in each index and in the Company’s Class A Common Stock and the reinvestment of dividends.
15
|
Item 6. |
SELECTED FINANCIAL DATA |
Selected Financial Data
(in thousands except per share data)
|
|
Years Ended December 31, |
|
|||||||||||||||||
|
|
2014 |
|
|
2013 |
|
|
2012 |
|
|
2011 (1) |
|
|
2010 |
|
|||||
|
Statement of Income Data: |
|
|
|
|
|
|
|
|
|
|
|
|
|
|
|
|
|
|
|
|
Revenue |
$ |
3,571,126 |
|
|
$ |
3,373,898 |
|
|
$ |
3,124,108 |
|
|
$ |
2,751,534 |
|
|
$ |
1,833,737 |
|
|
Gross margin |
|
370,435 |
|
|
|
371,023 |
|
|
|
356,066 |
|
|
|
312,548 |
|
|
|
213,433 |
|
|
Operating income |
|
83,877 |
|
|
|
113,747 |
|
|
|
112,360 |
|
|
|
94,459 |
|
|
|
69,882 |
|
|
Income from operations before taxes |
|
81,867 |
|
|
|
112,555 |
|
|
|
111,257 |
|
|
|
94,297 |
|
|
|
70,093 |
|
|
Net income |
|
51,558 |
|
|
|
69,110 |
|
|
|
67,953 |
|
|
|
58,178 |
|
|
|
43,458 |
|
|
Basic earnings per common share |
|
|
|
|
|
|
|
|
|
|
|
|
|
|
|
|
|
|
|
|
Income from operations |
$ |
1.41 |
|
|
$ |
1.88 |
|
|
$ |
1.83 |
|
|
$ |
1.58 |
|
|
$ |
1.17 |
|
|
Diluted earnings per common share |
|
|
|
|
|
|
|
|
|
|
|
|
|
|
|
|
|
|
|
|
Income from operations |
$ |
1.40 |
|
|
$ |
1.87 |
|
|
$ |
1.83 |
|
|
$ |
1.57 |
|
|
$ |
1.16 |
|
|
|
As of December 31, |
|
|||||||||||||||||
|
|
2014 |
|
|
2013 |
|
|
2012 |
|
|
2011 |
|
|
2010 |
|
|||||
|
Balance Sheet Data: |
|
|
|
|
|
|
|
|
|
|
|
|
|
|
|
|
|
|
|
|
Total assets |
$ |
1,212,127 |
|
|
$ |
1,047,943 |
|
|
$ |
919,853 |
|
|
$ |
842,684 |
|
|
$ |
629,407 |
|
|
Long-term debt, including capital lease |
|
88,397 |
|
|
|
24,952 |
|
|
|
21,099 |
|
|
|
23,436 |
|
|
|
- |
|
|
Stockholders' equity |
|
600,784 |
|
|
|
561,527 |
|
|
|
500,897 |
|
|
|
438,865 |
|
|
|
376,300 |
|
|
(1) |
Includes the results of operations of Mode Transportation, LLC from April 1, 2011, the date of its acquisition by Hub Group. |
|
Item 7. |
MANAGEMENT’S DISCUSSION AND ANALYSIS OF FINANCIAL |
|
|
CONDITION AND RESULTS OF OPERATIONS |
EXECUTIVE SUMMARY
Hub Group, Inc. (“we”, “us” or “our”) reports two distinct business segments, Hub and Mode. The Mode segment includes only the business we acquired on April 1, 2011. The Hub segment includes all businesses other than Mode. Hub Group (as opposed to just Hub), refers to the consolidated results for the whole company, including both the Mode and Hub segments. For the segment financial results, refer to Note 5 to the consolidated financial statements.
We are one of the largest intermodal marketing companies (“IMC”) in the United States and a full service transportation provider offering intermodal, truck brokerage and logistics services. We operate through a nationwide network of operating centers and independent business owners.
We also arrange for the transportation of freight by truck, providing customers with another option for their transportation needs. We match the customers’ needs with carriers’ capacity to provide the most effective service and price combinations. As part of our truck brokerage services, we negotiate rates, track shipments in transit and handle claims for freight loss or damage on behalf of our customers.
Our logistics service consists of complex transportation management services, including load consolidation, mode optimization and carrier management. These service offerings are designed to take advantage of the increasing trend for shippers to outsource all or a greater portion of their transportation needs.
Hub has full time marketing representatives throughout North America who service local, regional and national accounts. We believe that fostering long-term customer relationships is critical to our success and allows us to better understand our customers’ needs and specifically tailor our transportation services to them.
Hub’s yield management group works with pricing and operations to enhance Hub’s customer margins. We are working on margin enhancement projects including matching up inbound and outbound loads, reducing empty miles, improving our recovery of accessorial costs, efficiently using our dray network and reviewing and improving low margin loads.
16
Hub’s top 50 customers represent approximately 64% of the Hub segment revenue for the year ended December 31, 2014. We use various performance indicators to manage our business. We closely monitor margin and gains and losses for our top 50 customers. We also evaluate on-time performance, cost per load and daily sales outstanding by customer account. Vendor cost changes and vendor service issues are also monitored closely.
Mode has approximately 233 agents, consisting of 103 sales/operating agents, known as Independent Business Owners (“IBOs”), who sell and operate the business throughout North America and 130 sales only agents. Mode also has a company managed operation and corporate offices in Dallas, a temperature protected services division, Temstar, located in Oak Brook, IL and corporate offices in Memphis. Mode’s top 20 customers represent approximately 35% of the Mode segment revenue for the year ended December 31, 2014. We closely monitor revenue and margin for these customers. We believe Mode brings us highly complementary service offerings, more scale and a talented sales channel that allows us to better reach small and midsize customers.
RESULTS OF OPERATIONS
Year Ended December 31, 2014 Compared to Year Ended December 31, 2013
The following table summarizes our revenue by segment and business line (in thousands):
|
|
Twelve Months |
|
|
Twelve Months |
|
||||||||||||||||||||
|
|
Ended December 31, 2014 |
|
|
Ended December 31, 2013 |
|
||||||||||||||||||||
|
|
|
|
|
|
|
|
Inter- |
|
Hub |
|
|
|
|
|
|
|
|
Inter- |
|
Hub |
|
||||
|
|
|
|
|
|
|
|
Segment |
|
Group |
|
|
|
|
|
|
|
|
Segment |
|
Group |
|
||||
|
|
Hub |
|
Mode |
|
Elims |
|
Total |
|
|
Hub |
|
Mode |
|
Elims |
|
Total |
|
||||||||
|
Intermodal |
$ |
1,815,842 |
|
$ |
466,859 |
|
$ |
(79,406 |
) |
$ |
2,203,295 |
|
|
$ |
1,818,162 |
|
$ |
389,186 |
|
$ |
(46,401 |
) |
$ |
2,160,947 |
|
|
Truck brokerage |
|
338,590 |
|
|
335,587 |
|
|
(946 |
) |
|
673,231 |
|
|
|
333,027 |
|
|
311,930 |
|
|
(1,453 |
) |
|
643,504 |
|
|
Logistics |
|
568,367 |
|
|
128,685 |
|
|
(2,452 |
) |
|
694,600 |
|
|
|
448,574 |
|
|
122,043 |
|
|
(1,170 |
) |
|
569,447 |
|
|
Total revenue |
$ |
2,722,799 |
|
$ |
931,131 |
|
$ |
(82,804 |
) |
$ |
3,571,126 |
|
|
$ |
2,599,763 |
|
$ |
823,159 |
|
$ |
(49,024 |
) |
$ |
3,373,898 |
|
Revenue
Hub Group’s revenue increased 6% to $3.6 billion in 2014 from $3.4 billion in 2013.
The Hub segment revenue increased 5% to $2.7 billion. Hub segment intermodal revenue was flat at $1.8 billion. Price and mix combined were up but were offset by a 2% decline in loads. Hub segment truck brokerage revenue increased 2% to $339 million. Price, fuel and mix were up 12% offset by a volume decline of 10%. Length of haul increased 7%. Hub segment logistics revenue increased 27% to $568 million related primarily to growth from existing customers.
Mode’s revenue increased 13% to $931.1 million in 2014 from $823.2 million in 2013. Mode’s intermodal revenue increased 20% primarily due to a 17% increase in volume. Mode’s truck brokerage revenue increased 8% due to truckload capacity and increased rates. Mode’s logistic revenue increased 5% due to an increase in both loads and rates across multiple business lines.
17
The following is a summary of operating results for our business segments (in thousands):
|
|
Twelve Months |
|
|
Twelve Months |
|
||||||||||||||||||||
|
|
Ended December 31, 2014 |
|
|
Ended December 31, 2013 |
|
||||||||||||||||||||
|
|
|
|
|
|
|
|
Inter- |
|
Hub |
|
|
|
|
|
|
|
|
Inter- |
|
Hub |
|
||||
|
|
|
|
|
|
|
|
Segment |
|
Group |
|
|
|
|
|
|
|
|
Segment |
|
Group |
|
||||
|
|
Hub |
|
Mode |
|
Elims |
|
Total |
|
|
Hub |
|
Mode |
|
Elims |
|
Total |
|
||||||||
|
Revenue |
$ |
2,722,799 |
|
$ |
931,131 |
|
$ |
(82,804 |
) |
$ |
3,571,126 |
|
|
$ |
2,599,763 |
|
$ |
823,159 |
|
$ |
(49,024 |
) |
$ |
3,373,898 |
|
|
Transportation costs |
|
2,461,144 |
|
|
822,351 |
|
|
(82,804 |
) |
|
3,200,691 |
|
|
|
2,325,512 |
|
|
726,387 |
|
|
(49,024 |
) |
|
3,002,875 |
|
|
Gross margin |
|
261,655 |
|
|
108,780 |
|
|
- |
|
|
370,435 |
|
|
|
274,251 |
|
|
96,772 |
|
|
- |
|
|
371,023 |
|
|
|
|
|
|
|
|
|
|
|
|
|
|
|
|
|
|
|
|
|
|
|
|
|
|
|
|
|
Costs and expenses: |
|
|
|
|
|
|
|
|
|
|
|
|
|
|
|
|
|
|
|
|
|
|
|
|
|
|
Salaries and benefits |
|
122,097 |
|
|
14,383 |
|
|
- |
|
|
136,480 |
|
|
|
120,478 |
|
|
14,863 |
|
|
- |
|
|
135,341 |
|
|
Agent fees and commissions |
|
45 |
|
|
61,996 |
|
|
- |
|
|
62,041 |
|
|
|
1,372 |
|
|
54,417 |
|
|
- |
|
|
55,789 |
|
|
General and administrative |
|
51,108 |
|
|
6,906 |
|
|
- |
|
|
58,014 |
|
|
|
50,484 |
|
|
6,288 |
|
|
- |
|
|
56,772 |
|
|
Depreciation and amortization |
|
6,238 |
|
|
1,561 |
|
|
- |
|
|
7,799 |
|
|
|
4,326 |
|
|
2,144 |
|
|
- |
|
|
6,470 |
|
|
Driver settlements and related costs |
|
10,343 |
|
|
- |
|
|
- |
|
|
10,343 |
|
|
|
- |
|
|
- |
|
|
- |
|
|
- |
|
|
Impairment of software |
|
11,881 |
|
|
- |
|
|
- |
|
|
11,881 |
|
|
|
- |
|
|
- |
|
|
- |
|
|
- |
|
|
Impairment of trade name |
|
- |
|
|
- |
|
|
- |
|
|
- |
|
|
|
2,904 |
|
|
- |
|
|
- |
|
|
2,904 |
|
|
Total costs and expenses |
|
201,712 |
|
|
84,846 |
|
|
- |
|
|
286,558 |
|
|
|
179,564 |
|
|
77,712 |
|
|
- |
|
|
257,276 |
|
|
|
|
|
|
|
|
|
|
|
|
|
|
|
|
|
|
|
|
|
|
|
|
|
|
|
|
|
Operating income |
$ |
59,943 |
|
$ |
23,934 |
|
$ |
- |
|
$ |
83,877 |
|
|
$ |
94,687 |
|
$ |
19,060 |
|
$ |
- |
|
$ |
113,747 |
|
Transportation Costs
Hub Group’s transportation costs increased 6.6% to $3.2 billion in 2014 from $3.0 billion in 2013. Transportation costs in 2014 consisted of purchased transportation costs of $2.8 billion and equipment and driver related costs of $425.9 million compared to 2013 costs of purchased transportation of $2.6 billion and equipment and driver related costs of $380.6 million.
The Hub segment transportation costs increased 5.8% to $2.5 billion in 2014 from $2.3 billion in 2013. Hub segment transportation costs in 2014 consisted of $2.04 billion in purchased transportation costs up from $1.95 billion in 2013. The 4.6% increase was due to higher rail and truck costs due to price increases and higher volumes. Equipment and driver related costs increased 12.1% to $421.7 million in 2014 from $376.3 million in 2013 due primarily to an increase in equipment depreciation and lease costs due to an increase in our tractor and container fleet size and higher driver and maintenance costs due to our change in driver model in California and a larger tractor fleet.
The Mode segment transportation costs increased 13.2% to $822.4 million in 2014 from $726.4 million in 2013. Mode segment transportation costs are primarily purchased transportation costs which increased due to higher volume and slight price increases.
Gross Margin
Hub Group’s gross margin decreased 0.2% to $370.4 million in 2014 from $371.0 million in 2013. Hub Group’s gross margin as a percentage of sales decreased to 10.4% in 2014 from 11.0% in 2013.
The Hub segment gross margin decreased 4.6% to $261.7 million. Hub’s $12.6 million gross margin decrease came primarily from intermodal. Intermodal margin declined primarily due to higher transportation costs related to a challenging intermodal operating environment. The first quarter weather related gross margin impact in intermodal was approximately $2.2 million and included a couple of percentage points of lost volume, sub optimization of the network, slower box turns, increased equipment and accessorial costs, higher fuel and accident costs. The second quarter was impacted by the unfavorable timing of cost increases and worse equipment utilization year over year due to rail service issues. Rail service continued to deteriorate year over year in the third quarter, further impacting equipment utilization. Slower train speeds and late trains hurt our fleet utilization by 1.4 days and caused us to incur higher repositioning and accessorial costs as well as more empty miles. Gross margin was also negatively impacted in the third quarter due to increased costs associated with chassis shortages and insufficient gate reservations. Higher drayage costs also negatively impacted intermodal margin in the third quarter as a result of our business model change in California from independent contractors to employee drivers. In the fourth quarter, gross margin continued to be impacted by the same challenges we experienced in the third quarter. Intermodal margin declined in the fourth quarter due to rail service issues and higher drayage costs. Poor rail execution hurt our fleet utilization by 1.6 days, and caused us to incur more empty miles and increased our accessorial costs. Truck
18
brokerage margin declined because of lower value added services. Logistics margin helped offset a small portion of these declines with an increase in margin due to growth with existing customers. As a percentage of Hub segment revenue, gross margin decreased to 9.6% in 2014 from 10.5% in 2013. This decrease is due to lower yield across all business lines.
Mode’s gross margin increased 12.4% to $108.8 million in 2014 from $96.8 million in 2013 due to growth in intermodal and highway. Mode’s gross margin as a percentage of revenue decreased to 11.7% in 2014 from 11.8% in 2013.
CONSOLIDATED OPERATING EXPENSES
The following table presents certain items in the Consolidated Statements of Income as a percentage of revenue:
|
|
|
|
|
|
|
|
|
|
|
Twelve Months Ended |
|
|||||
|
|
December 31, |
|
|||||
|
|
2014 |
|
|
2013 |
|
||
|
|
|
|
|
|
|
|
|
|
Revenue |
|
100.0% |
|
|
|
100.0% |
|
|
|
|
|
|
|
|
|
|
|
Transportation costs |
|
89.6 |
|
|
|
89.0 |
|
|
|
|
|
|
|
|
|
|
|
Gross margin |
|
10.4 |
|
|
|
11.0 |
|
|
|
|
|
|
|
|
|
|
|
Costs and expenses: |
|
|
|
|
|
|
|
|
Salaries and benefits |
|
3.8 |
|
|
|
4.0 |
|
|
Agent fees and commissions |
|
1.8 |
|
|
|
1.6 |
|
|
General and administrative |
|
1.6 |
|
|
|
1.7 |
|
|
Depreciation and amortization |
|
0.2 |
|
|
|
0.2 |
|
|
Driver settlements and related costs |
|
0.3 |
|
|
|
0.0 |
|
|
Impairment of software |
|
0.3 |
|
|
|
0.0 |
|
|
Impairment of trade name |
|
0.0 |
|
|
|
0.1 |
|
|
Total costs and expenses |
|
8.0 |
|
|
|
7.6 |
|
|
|
|
|
|
|
|
|
|
|
Operating income |
|
2.4 |
|
|
|
3.4 |
|
Salaries and Benefits
Hub Group’s salaries and benefits increased to $136.5 million in 2014 from $135.3 million in 2013. As a percentage of revenue, Hub Group’s salaries and benefits decreased to 3.8% in 2014 from 4.0% in 2013.
The Hub segment salaries and benefits increase of $1.6 million was due primarily to increases in salaries of $4.8 million, employee benefits of $1.0 million and compensation related to restricted stock awards of $0.3 million partially offset by decreases in bonuses of $3.7 million and commissions of $0.9 million.
Mode’s salaries and benefits expense decreased to $14.4 million in 2014 from $14.9 million in 2013. The decrease was due primarily to decreases in bonuses of $0.5 million, and salaries of $0.1 million partially offset by increases in compensation related to restricted stock awards of $0.2 million.
Hub’s headcount as of December 31, 2014 and 2013 was 1,380 and 1,334, respectively, which excludes drivers, as driver costs are included in transportation costs. As of December 31, 2014 and 2013, Mode had 125 and 126 employees, respectively.
Agent Fees and Commissions
Hub Group’s agent fees and commissions increased to $62.0 million in 2014 from $55.8 million in 2013. As a percentage of revenue, these expenses increased to 1.8% in 2014 from 1.6% in 2013. The increase in the expense and the decrease in the percentage of revenue was primarily related to Mode’s increase in gross margin.
The Mode segment agent fees and commissions expense increase of $7.6 million was primarily due to the increase in gross margin.
19
General and Administrative
Hub Group’s general and administrative expenses increased to $58.0 million in 2014 from $56.8 million in 2013. As a percentage of revenue, these expenses decreased to 1.6% in 2014 from 1.7% in 2013.
The Hub segment increase of $0.6 million was due primarily to increases in travel and entertainment expense of $0.7 million, consultant expense of $0.6 million, repairs and maintenance expense of $0.6 million, outside sales commissions of $0.5 million, general insurance expense of $0.4 million, temporary labor expense of $0.2 million, training expense of $0.2 million and office expense of $0.1 million. These increases were partially offset by decreases in rent of $1.9 million due to the move to our new corporate headquarters in 2013, a decrease in loss on sale of fixed assets in 2014 of $0.3 million, decrease in bad debt expense of $0.3 million and other taxes of $0.2 million.
Mode’s general and administrative expenses increased to $6.9 million in 2014 from $6.3 million in 2013. The increase was primarily due to a lower gain on the sale of equipment in 2014 as compared to 2013 of $0.5 million and increases in repairs and maintenance of $0.3 and consultant expense of $0.2 million. These increases were partially offset by a decrease in bad debt expense of $0.2 million and also a decrease in travel and entertainment expense of $0.1 million.
Depreciation and Amortization
Hub Group’s depreciation and amortization increased to $7.8 million in 2014 from $6.5 million in 2013. This expense as a percentage of revenue remained constant at 0.2% in both 2014 and 2013.
The Hub segment’s depreciation expense increased to $6.2 million in 2014 from $4.3 million in 2013. This increase was related primarily to depreciation for the new corporate headquarters and more depreciation related to computer software.
Mode’s depreciation expense decreased to $1.6 million in 2014 from $2.1 million in 2013. The decrease in expense was primarily related to less depreciation related to computer software.
Driver Settlements and Related Costs
Driver settlements and related costs include $9.3 million in settlements for individual drivers and $1.0 million of related legal, communication and implementation costs. See Note 15 of the notes to unaudited consolidated financial statements for more details.
Impairment of Software
In 2014, the Hub segment recorded a charge of $11.9 million related to the write-off of software development costs as a result of our decision to terminate a long-term technology project. See Note 4 of the notes to consolidated financial statements for more details.
Impairment of Trade Name
In 2013, the Hub segment incurred a $2.9 million expense associated with changing the Comtrak Logistics trade name to Hub Group Trucking. See Note 6 to the consolidated financial statements for information on this impairment charge.
Other Income (Expense)
Hub Group’s interest expense increased to $1.8 million in 2014 from $1.2 million in 2013 due primarily to the increased interest expense related to higher debt.
Provision for Income Taxes
The provision for income taxes decreased to $30.3 million in 2014 from $43.4 million in 2013 primarily due to the decrease in our pretax income. Our effective tax rate was 37.0% in 2014 and 38.6% in 2013. The rate decrease was primarily due to the effect of state tax apportionment changes on our deferred tax assets and liabilities.
Net Income
Net income decreased to $51.6 million in 2014 from $69.1 million in 2013 due primarily to the driver settlements and related costs and the software impairment charge.
20
Year Ended December 31, 2013 Compared to Year Ended December 31, 2012
The following table summarizes our revenue by segment and business line (in thousands):
|
|
Twelve Months |
|
|
Twelve Months |
|
|||||||||||||||||||||||||||||||||||||
|
|
Ended December 31, 2013 |
|
|
Ended December 31, 2012 |
|
|||||||||||||||||||||||||||||||||||||
|
|
|
|
|
|
|
|
Inter- |
|
Hub |
|
|
|
|
|
|
|
|
Inter- |
|
Hub |
|
|||||||||||||||||||||
|
|
|
|
|
|
|
|
Segment |
|
Group |
|
|
|
|
|
|
|
|
Segment |
|
Group |
|
|||||||||||||||||||||
|
|
Hub |
|
Mode |
|
Elims |
|
Total |
|
|
Hub |
|
Mode |
|
Elims |
|
Total |
|
|||||||||||||||||||||||||
|
Intermodal |
$ |
1,818,162 |
|
$ |
389,186 |
|
$ |
(46,401 |
) |
$ |
2,160,947 |
|
|
$ |
1,731,487 |
|
$ |
354,662 |
|
$ |
(43,863 |
) |
$ |
2,042,286 |
|
|||||||||||||||||
|
Truck brokerage |
|
333,027 |
|
|
311,930 |
|
|
(1,453 |
) |
|
643,504 |
|
|
|
335,213 |
|
|
318,848 |
|
|
(2,945 |
) |
|
651,116 |
|
|||||||||||||||||
|
Logistics |
|
448,574 |
|
|
122,043 |
|
|
(1,170 |
) |
|
569,447 |
|
|
|
325,589 |
|
|
106,418 |
|
|
(1,301 |
) |
|
430,706 |
|
|||||||||||||||||
|
Total revenue |
$ |
2,599,763 |
|
$ |
823,159 |
|
$ |
(49,024 |
) |
$ |
3,373,898 |
|
|
$ |
2,392,289 |
|
$ |
779,928 |
|
$ |
(48,109 |
) |
$ |
3,124,108 |
|
|||||||||||||||||
Revenue
Hub Group’s revenue increased 8% to $3.4 billion in 2013 from $3.1 billion in 2012.
The Hub segment revenue increased 8.7% to $2.6 billion. Hub segment intermodal revenue increased 5% to $1.8 billion due to a 4% increase in loads. Price was up, but was offset by the impact of lower fuel surcharges. Hub segment truck brokerage revenue decreased slightly to $333 million due primarily to a 5% increase in loads partially offset by unfavorable mix, which was primarily due to a 6% decrease in length of haul. Hub segment logistics revenue increased 38% to $449 million related primarily to growth from new customers that were onboarded in the first half of 2013.
Mode’s revenue increased 5.5% to $823.2 million in 2013 from $779.9 million in 2012. Mode’s intermodal revenue increased 10% primarily due to a 13% increase in volume. Mode’s truck brokerage revenue declined 2%. Mode’s logistic revenue increased 15% due primarily to an increase in less than truckload business.
The following is a summary of operating results for our business segments (in thousands):
|
|
Twelve Months |
|
|
Twelve Months |
|
|||||||||||||||||||||||||||||||||||||
|
|
Ended December 31, 2013 |
|
|
Ended December 31, 2012 |
|
|||||||||||||||||||||||||||||||||||||
|
|
|
|
|
|
|
|
Inter- |
|
Hub |
|
|
|
|
|
|
|
|
Inter- |
|
Hub |
|
|||||||||||||||||||||
|
|
|
|
|
|
|
|
Segment |
|
Group |
|
|
|
|
|
|
|
|
Segment |
|
Group |
|
|||||||||||||||||||||
|
|
Hub |
|
Mode |
|
Elims |
|
Total |
|
|
Hub |
|
Mode |
|
Elims |
|
Total |
|
|||||||||||||||||||||||||
|
Revenue |
$ |
2,599,763 |
|
$ |
823,159 |
|
$ |
(49,024 |
) |
$ |
3,373,898 |
|
|
$ |
2,392,289 |
|
$ |
779,928 |
|
$ |
(48,109 |
) |
$ |
3,124,108 |
|
|||||||||||||||||
|
Transportation costs |
|
2,325,512 |
|
|
726,387 |
|
|
(49,024 |
) |
|
3,002,875 |
|
|
|
2,128,942 |
|
|
687,209 |
|
|
(48,109 |
) |
|
2,768,042 |
|
|||||||||||||||||
|
Gross margin |
|
274,251 |
|
|
96,772 |
|
|
- |
|
|
371,023 |
|
|
|
263,347 |
|
|
92,719 |
|
|
- |
|
|
356,066 |
|
|||||||||||||||||
|
|
|
|
|
|
|
|
|
|
|
|
|
|
|
|
|
|
|
|
|
|
|
|
|
|
|
|||||||||||||||||
|
Costs and expenses: |
|
|
|
|
|
|
|
|
|
|
|
|
|
|
|
|
|
|
|
|
|
|
|
|
|
|||||||||||||||||
|
Salaries and benefits |
|
120,478 |
|
|
14,863 |
|
|
- |
|
|
135,341 |
|
|
|
113,855 |
|
|
15,288 |
|
|
- |
|
|
129,143 |
|
|||||||||||||||||
|
Agent fees and commissions |
|
1,372 |
|
|
54,417 |
|
|
- |
|
|
55,789 |
|
|
|
1,900 |
|
|
53,212 |
|
|
- |
|
|
55,112 |
|
|||||||||||||||||
|
General and administrative |
|
50,484 |
|
|
6,288 |
|
|
- |
|
|
56,772 |
|
|
|
45,411 |
|
|
7,421 |
|
|
- |
|
|
52,832 |
|
|||||||||||||||||
|
Depreciation and amortization |
|
4,326 |
|
|
2,144 |
|
|
- |
|
|
6,470 |
|
|
|
4,448 |
|
|
2,171 |
|
|
- |
|
|
6,619 |
|
|||||||||||||||||
|
Impairment of trade name |
|
2,904 |
|
|
- |
|
|
- |
|
|
2,904 |
|
|
|
- |
|
|
- |
|
|
- |
|
|
- |
|
|||||||||||||||||
|
Total costs and expenses |
|
179,564 |
|
|
77,712 |
|
|
- |
|
|
257,276 |
|
|
|
165,614 |
|
|
78,092 |
|
|
- |
|
|
243,706 |
|
|||||||||||||||||
|
|
|
|
|
|
|
|
|
|
|
|
|
|
|
|
|
|
|
|
|
|
|
|
|
|
|
|||||||||||||||||
|
Operating income |
$ |
94,687 |
|
$ |
19,060 |
|
$ |
- |
|
$ |
113,747 |
|
|
$ |
97,733 |
|
$ |
14,627 |
|
$ |
- |
|
$ |
112,360 |
|
|||||||||||||||||
Transportation Costs
Hub Group’s transportation costs increased 8.5% to $3.0 billion in 2013 from $2.8 billion in 2012. Transportation costs in 2013 consisted of purchased transportation costs of $2.6 billion and equipment and driver related costs of $380.6 million compared to 2012 costs of purchased transportation of $2.4 billion and equipment and driver related costs of $330.1 million.
The Hub segment transportation costs increased 9.2% to $2.3 billion in 2013 from $2.1 billion in 2012. Hub segment transportation costs in 2013 consisted of $1.95 billion in purchased transportation costs up from $1.80 billion in 2012. The 8.0% increase was due to higher rail and truck costs due to price increases and higher volumes. Equipment and driver related costs increased 16.2% to $376.3 million in 2013 from $324.0 million in 2012 due primarily to an increase of 317 drivers.
21
The Mode segment transportation costs increased 5.7% to $726.4 million in 2013 from $687.2 million in 2012. Mode segment transportation costs are primarily purchased transportation costs which increased due to higher volume and slight price increases.
Gross Margin
Hub Group’s gross margin increased 4.2% to $371.0 million in 2013 from $356.1 million in 2012. Hub Group’s gross margin as a percentage of sales decreased to 11.0% in 2013 from 11.4% in 2012.
The Hub segment gross margin increased 4.1% to $274.3 million. Logistics and intermodal gross margin increased, but were partially offset by a decline in truck brokerage margin. Logistics’ gross margin was up due to new customer growth. Intermodal gross margin was up as a 4% increase in loads and modest price increases were partially offset by higher transportation costs and unfavorable mix. Truck brokerage gross margin was down because of unfavorable traffic mix, primarily less high value added services.
Mode’s gross margin increased 4.4% to $96.8 million in 2013 from $92.7 million in 2012 due to growth in intermodal and logistics. Mode’s gross margin as a percentage of revenue decreased to 11.8% in 2013 from 11.9% in 2012.
CONSOLIDATED OPERATING EXPENSES
The following table presents certain items in the Consolidated Statements of Income as a percentage of revenue:
|
|
|
|
|
|
|
|
|
|
|
Twelve Months Ended |
|
|||||
|
|
December 31, |
|
|||||
|
|
2013 |
|
|
2012 |
|
||
|
|
|
|
|
|
|
|
|
|
Revenue |
|
100.0% |
|
|
|
100.0% |
|
|
|
|
|
|
|
|
|
|
|
Transportation costs |
|
89.0 |
|
|
|
88.6 |
|
|
|
|
|
|
|
|
|
|
|
Gross margin |
|
11.0 |
|
|
|
11.4 |
|
|
|
|
|
|
|
|
|
|
|
Costs and expenses: |
|
|
|
|
|
|
|
|
Salaries and benefits |
|
4.0 |
|
|
|
4.1 |
|
|
Agent fees and commissions |
|
1.6 |
|
|
|
1.8 |
|
|
General and administrative |
|
1.7 |
|
|
|
1.7 |
|
|
Depreciation and amortization |
|
0.2 |
|
|
|
0.2 |
|
|
Impairment of trade name |
|
0.1 |
|
|
- |
|
|
|
Total costs and expenses |
|
7.6 |
|
|
|
7.8 |
|
|
|
|
|
|
|
|
|
|
|
Operating income |
|
3.4 |
|
|
|
3.6 |
|
Salaries and Benefits
Hub Group’s salaries and benefits increased to $135.3 million in 2013 from $129.1 million in 2012. As a percentage of revenue, Hub Group’s salaries and benefits decreased to 4.0% in 2013 from 4.1% in 2012.
The Hub segment salaries and benefits increase of $6.6 million was due to increases in salaries of $6.6 million, compensation related to restricted stock awards of $0.9 million, employee benefits of $0.6 million, payroll taxes of $0.4 million, partially offset by decreases in bonuses of $1.7 million and commissions of $0.2 million.
Mode’s salaries and benefits expense decreased to $14.9 million in 2013 from $15.3 million in 2012. The decrease was due to decreases in salaries of $0.5 million and employee benefits of $0.2 million, partially offset by increases in compensation related to restricted stock awards of $0.2 million and bonuses of $0.1 million.
Hub’s headcount as of December 31, 2013 and 2012 was 1,334 and 1,224, respectively, which excludes drivers, as driver costs are included in transportation costs. As of December 31, 2013 and 2012, Mode had 126 and 131 employees, respectively.
22
Agent Fees and Commissions
Hub Group’s agent fees and commissions increased to $55.8 million in 2013 from $55.1 million in 2012. As a percentage of revenue, these expenses decreased to 1.6% in 2013 from 1.8% in 2012. The increase in the expense and the decrease in the percentage of revenue was primarily related to Mode’s increase in gross margin.
The Hub segment agent fees and commissions expense decrease of $0.5 million was due to a smaller Hub agent program.
The Mode segment agent fees and commissions expense increase of $1.2 million was primarily due to the increase in gross margin.
General and Administrative
Hub Group’s general and administrative expenses increased to $56.8 million in 2013 from $52.8 million in 2012. As a percentage of revenue, these expenses remained consistent at 1.7% in 2013 and 2012.
The Hub segment increase of $5.1 million was due primarily to increases in professional fees of $1.6 million primarily associated with an unsuccessful acquisition, rent expense of $1.1 million, general insurance expense of $0.8 million and bad debt expense of $0.6 million.
Mode’s general and administrative expenses decreased to $6.3 million in 2013 from $7.4 million in 2012. The decrease was primarily due to a decrease in outside consultant expense of $0.7 million, additional gains on the sale of equipment of $0.6 million and decreases in rent, telephone and office expense of $0.1 million each. These decreases were partially offset by an increase in bad debt expense of $0.5 million.
Depreciation and Amortization
Hub Group’s depreciation and amortization decreased to $6.5 million in 2013 from $6.6 million in 2012. This expense as a percentage of revenue remained constant at 0.2% in both 2013 and 2012.
The Hub segment’s depreciation expense decreased slightly to $4.3 million in 2013 from $4.4 million in 2012.
Mode’s depreciation expense remained consistent at $2.2 million in both 2013 and 2012.
Impairment of Trade Name
In 2013, the Hub segment incurred a $2.9 million expense associated with changing the Comtrak Logistics trade name to Hub Group Trucking. This expense as a percentage of revenue was 0.1% in 2013. See Note 6 to the consolidated financial statements for information on this impairment charge.
Other Income (Expense)
Hub Group’s interest expense remained consistent at $1.2 million in both 2013 and 2012.
Provision for Income Taxes
The provision for income taxes increased slightly to $43.4 million in 2013 from $43.3 million in 2012 due to our increase in pretax income partially offset by a decrease in our effective tax rate. Our effective tax rate was 38.6% in 2013 and 38.9% in 2012. The rate decrease was primarily due to the benefit from a state tax incentive granted in connection with relocating our corporate headquarters partially offset by an increase in our state income tax effective rate.
Net Income
Net income increased to $69.1 million in 2013 from $68.0 million in 2012 due primarily to higher gross margin at both the Hub and Mode segments.
Earnings Per Common Share
Basic earnings per share increased to $1.88 in 2013 from $1.83 in 2012. Basic earnings per share increased due to the increase in net income and a decrease in the number of outstanding basic shares.
23
Diluted earnings per share increased to $1.87 in 2013 from $1.83 in 2012. Diluted earnings per share increased due to the increase in net income and a decrease in the number of outstanding diluted shares.
LIQUIDITY AND CAPITAL RESOURCES
During 2014, we funded operations, capital expenditures, capital leases, purchase of treasury stock and stock buy backs related to employee withholding upon vesting of restricted stock through cash flows from operations, cash on hand and proceeds from the issuance of long-term debt. We believe that our cash, cash flow from operations and borrowings available under our Credit Agreement will be sufficient to meet our cash needs for at least the next twelve months.
Cash provided by operating activities for the year ended December 31, 2014 was approximately $98.5 million, which resulted primarily from income of $51.6 million adjusted for non-cash charges of $73.9 million partially offset by the change in operating assets and liabilities of $27.0 million. The $18.9 million decrease in cash flow provided by operating activities for 2014 compared to 2013 was primarily attributed to the decrease in net income of $17.6 million, a larger use of cash for prepaid taxes offset by higher add backs of non-cash items such as the impairment of software and higher depreciation expense.
Cash provided by operating activities was approximately $117.4 million and $92.9 million for the years ended December 31, 2013 and 2012, respectively. The cash provided by operating activities in 2013 resulted primarily from income of $69.1 million adjusted for non-cash charges of $48.1 million and the change in operating assets and liabilities of $0.2 million. The $24.5 million increase in cash flow provided by operating activities for 2013 compared to 2012 was primarily attributed to the timing of payments to our transportation providers which resulted in a $20.2 million increase in cash flow.
Net cash used in investing activities for the year ended December 31, 2014 was $118.6 million which includes proceeds from the sale of equipment of $0.6 million. Capital expenditures of $119.2 million included tractor purchases of $59 million, container purchases of $39 million, payments for our new headquarters in Oak Brook of $8 million and the remainder was related primarily to technology. Capital expenditures increased by approximately $8 million in 2014 as compared to 2013. The 2014 increase was due to additional tractor purchases of $44 million and technology and other purchases of $2 million partially offset by approximately $20 million less of container purchases and $18 million less spent on construction costs for our new headquarters.
Net cash used in investing activities for the year ended December 31, 2013 was $109.1 million as compared to $56.4 million in 2012. The increase of $53 million in 2013 was due primarily to the purchase of containers and the construction of our new headquarters.
We have not finalized our capital expenditures for 2015. Estimated capital expenditures for 2015 are estimated to be between $60 million and $80 million relating primarily to the purchase of tractors, containers and technology, including satellite tracking units. We have not made a decision on our new container order.
Net cash provided by financing activities for the year ended December 31, 2014 was $60.8 million. We used $18.0 million to purchase treasury stock, $7.3 million for repayment of long term debt, $3.2 million of cash for stock tendered for payments of withholding taxes and $2.5 million for capital lease payments. These payments were offset by proceeds from the issuance of debt of $91.1 million and excess tax benefits from share-based compensation of $0.7 million as a financing cash in-flow. The $70.9 million increase in cash provided by financing activities for 2014 compared to 2013 was primarily due to the increase of $81.9 million in debt issuance which was partially offset by the $6.4 million increase in debt payments. In January 2015, we entered into agreements to finance tractors for $2.2 million using secured debt with a five year term at an interest rate of 2.26% and containers for $7.0 million using secured debt with a five year term at an interest rate of 1.72%.
The net cash used in financing activities for the year ended December 31, 2013 was $10.1 million. We used $13.8 million to purchase treasury stock, $2.6 million of cash for stock tendered for payments of withholding taxes, $2.3 million for capital lease payments, and $0.9 million for repayment of long term debt. These payments were offset by proceeds from the issuance of debt of $9.1 million, excess tax benefits from share-based compensation of $0.3 million and proceeds from stock options exercised of $0.1 million as a financing cash in-flow. The $4.7 million increase in cash used by financing activities for 2013 compared to 2012 was primarily due to the $9.1 million in new debt issuance which was slightly offset by the $2.6 million increase in the purchase of treasury stock.
Cash paid for income taxes of $20.2 million was less than our income tax expense of $30.3 million primarily due to timing differences between our tax returns and financial statements. The two largest timing differences in 2014 relate to depreciation for tractors and containers and the amortization of purchased intangibles. In 2015, we expect our cash paid for taxes to be closer to our income tax expense due to the likely elimination of federal bonus depreciation for fixed asset purchases.
24
See Note 10 of the consolidated financial statements for details related to interest rates and commitment fees.
We have standby letters of credit that expire in 2015. As of December 31, 2014, our letters of credit were $6.1 million.
Our unused and available borrowings under our bank revolving line of credit were $43.9 million as of December 31, 2014 and $44.8 million as of December 31, 2013. We believe our line of credit is adequate to meet our cash needs. We were in compliance with our debt covenants as of December 31, 2014.
CONTRACTUAL OBLIGATIONS
Aggregated information about our obligations and commitments to make future contractual payments, such as debt and lease agreements, and contingent commitments as of December 31, 2014 is presented in the following table (in thousands).
Future Payments Due:
|
|
|
|
|
|
Operating |
|
|
|
|
|
|
|
|
|
|
|
|
|
|
|
|
Leases and |
|
|
Long |
|
|
|
|
|
||
|
|
Capital |
|
|
Other |
|
|
Term |
|
|
|
|
|
|||
|
|
Lease |
|
|
Commitments |
|
|
Debt |
|
|
Total |
|
||||
|
2015 |
$ |
3,179 |
|
|
$ |
9,686 |
|
|
$ |
19,619 |
|
|
$ |
32,484 |
|
|
2016 |
|
3,188 |
|
|
|
7,476 |
|
|
|
20,023 |
|
|
|
30,687 |
|
|
2017 |
|
3,179 |
|
|
|
5,676 |
|
|
|
20,209 |
|
|
|
29,064 |
|
|
2018 |
|
3,179 |
|
|
|
3,926 |
|
|
|
19,668 |
|
|
|
26,773 |
|
|
2019 |
|
3,179 |
|
|
|
2,820 |
|
|
|
12,560 |
|
|
|
18,559 |
|
|
2020 and thereafter |
|
5,037 |
|
|
|
7,361 |
|
|
|
- |
|
|
|
12,398 |
|
|
|
$ |
20,941 |
|
|
$ |
36,945 |
|
|
$ |
92,079 |
|
|
$ |
149,965 |
|
|
|
|
|
|
|
|
|
|
|
|
|
|
|
|
|
|
In January 2015 we entered into an agreement to finance tractors for $2.2 million using secured debt with a five year term at an interest rate of 2.26% and we entered into an agreement to finance containers for $7.0 million using secured debt with a five year term at an interest rate of 1.72%. Monthly payments of $0.2 million begin in February 2015.
Deferred Compensation
Under our Nonqualified Deferred Compensation Plan (the “Plan”), participants can elect to defer certain compensation. Payments under the Plan are due as follows (in thousands):
Future Payments Due:
|
2015 |
$ |
2,011 |
|
|
2016 |
|
1,890 |
|
|
2017 |
|
948 |
|
|
2018 |
|
1,196 |
|
|
2019 |
|
1,070 |
|
|
2020 and thereafter |
|
15,262 |
|
|
|
$ |
22,377 |
|
CRITICAL ACCOUNTING POLICIES
The preparation of financial statements in conformity with U.S. generally accepted accounting principles requires management to make estimates and assumptions. In certain circumstances, those estimates and assumptions can affect amounts reported in the accompanying consolidated financial statements. We have made our best estimates and judgments of certain amounts included in the financial statements, giving due consideration to materiality. We do not believe there is a great likelihood that materially different amounts would be reported related to the accounting policies described below. However, application of these accounting policies involves the exercise of judgment and use of assumptions as to future uncertainties and, as a result, actual results could differ from these estimates. The following is a brief discussion of the more significant accounting policies and estimates. These critical accounting policies are further discussed in Note 1 of the consolidated financial statements.
25
Allowance for Uncollectible Trade Accounts Receivable
We extend credit to customers after a review of each customer’s credit history. An allowance for uncollectible trade accounts has been established through an analysis of the accounts receivable aging, an assessment of collectability based on historical trends and an evaluation based on current economic conditions. Annually we review, in hindsight, the percentage of receivables that are collected that aged over one year, those that are not one year old and the accounts that went into bankruptcy. Due primarily to the difference in customer mix, the percentage of receivables collected in the Hub segment has been higher than the Mode segment although both have been over 98%. We reserve for accounts less than one year old based on specifically identified uncollectible balances and our historic collection percentage. In establishing a reserve for certain account balances specifically identified as uncollectible, we consider the aging of the customer receivables, the specific details as to why the receivable has not been paid, the customer’s current and projected financial results, the customer’s ability to meet and sustain their financial commitments, the positive or negative effects of the current and projected industry outlook and the general economic conditions. Once a receivable ages over one year our collection percentage is much lower for both the Hub and Mode segments, thus a separate calculation is done for open receivables that have aged over one year. We also review our collection percentage after a company has gone into bankruptcy. Although these collection percentages may change both negatively and positively, since only a small portion of our receivables are aged over one year or are involved in a bankruptcy case, a large change in the either of those collection percentages would not have a material impact on our financial statements. Our level of reserves for customer accounts receivable fluctuate depending upon all the factors mentioned above. Historically, our reserve for uncollectible accounts has approximated actual accounts written off and we do not expect the reserve for uncollectible accounts to change significantly relative to our accounts receivable balance. The allowance for uncollectible accounts is reported on the balance sheet in net accounts receivable. Recoveries of receivables previously charged off are recorded when received.
Revenue Recognition
Revenue is recognized at the time 1) persuasive evidence of an arrangement exists, 2) services have been rendered, 3) the sales price is fixed and determinable and 4) collectability is reasonably assured. Revenue and related transportation costs are recognized based on relative transit time. For transportation services not completed at the end of a reporting period, we use a percentage of completion method to allocate the appropriate revenue to each separate reporting period. Further, in most cases, we report revenue on a gross basis because we are the primary obligor and are responsible for providing the service desired by the customer. The customer views us as responsible for fulfillment including the acceptability of the service. Service requirements may include, for example, on-time delivery, handling freight loss and damage claims, setting up appointments for pick up and delivery and tracing shipments in transit. We have discretion in setting sales prices and as a result, our earnings vary. In addition, we have the discretion to select our vendors from multiple suppliers for the services ordered by our customers. Finally, we have credit risk for our receivables. These three factors, discretion in setting prices, discretion in selecting vendors and credit risk, further support reporting revenue on the gross basis.
Valuation of Finite-Lived Intangibles and Fixed Assets
Our fixed assets consist of equipment, computer software and hardware as well as our corporate headquarters. Our finite-lived intangibles consist of customer and agency relationships. We evaluate the potential impairment of finite-lived intangible assets and fixed assets when impairment indicators exist. In the third quarter of 2014, the Hub segment recorded a full write-off of $11.9 million related to software development costs as a result of our decision to terminate a long-term technology project. Upon deployment of the software in the third quarter, we discovered that the software did not properly integrate with our current systems or meet the criteria for which it was designed. We did not believe the software could be cost effectively salvaged and it had no value on the open market. This charge is included in Impairment of software in the Consolidated Statements of Income and Comprehensive Income. We currently have no other software projects of this nature that are at risk for impairment.
Equipment
We operate tractors and utilize containers and chassis in connection with our business. This equipment may be purchased or leased as part of an operating or capital lease. In addition, we rent equipment from third parties and various railroads under short term rental arrangements. Equipment which is purchased is depreciated on the straight line method over the estimated useful life. Our equipment leases have five to ten year terms and, in some cases, contain renewal options.
New Pronouncements
In May 2014, the Financial Accounting Standards Board (“FASB”) issued Update No. 2014-09—Revenue from Contracts with Customers (Topic 606). This Standard provides guidance on how to recognize revenue to depict the transfer of promised goods or services to customers in an amount that reflects the consideration to which the entity expects to be entitled in exchange for those goods or services. For public organizations, the guidance in the update is effective for annual reporting periods beginning after December 15, 2016, including interim reporting periods within that reporting period. The update provides two transition methods to the new
26
guidance: a retrospective approach and a modified retrospective approach. Early application is not permitted. We plan to adopt this standard January 1, 2017, as required. We are currently evaluating the transition method and effect this update will have on our consolidated financial statements.
In April 2014, the Financial Accounting Standards Board (“FASB”) issued an update to Topic 360 – Property, Plant and Equipment and Topic 205 – Presentation of Financial Statements: Reporting Discontinued Operations and Disclosures of Disposals of Components of an Entity. The amendments in the update change the requirements for reporting discontinued operations in Subtopic 25-20. The guidance is effective for annual reporting periods beginning after December 15, 2014, including interim reporting periods within that reporting period and is to be applied prospectively. We adopted this standard January 1, 2015, as required. We do not expect this new guidance to have a significant impact on our consolidated financial statements.
OUTLOOK, RISKS AND UNCERTAINTIES
Business Combinations/Divestitures
We believe that any future acquisitions that we may make could significantly impact financial results. Financial results most likely to be impacted include, but are not limited to, revenue, gross margin, salaries and benefits, selling general and administrative expenses, depreciation and amortization, interest expense, net income and our debt level.
Revenue
We believe that the performance of the railroads and a severe or prolonged slow-down of the economy are the most significant factors that could negatively influence our revenue growth rate. Should there be further consolidation in the rail industry causing a service disruption, we believe our intermodal business would likely be negatively impacted. Should there be a significant service disruption, we expect that there may be some customers who would switch from using our intermodal service to other transportation services. We expect that these customers may choose to continue to utilize other services even when intermodal service levels are restored. Other factors that could negatively influence our growth rate include, but are not limited to, the elimination of fuel surcharges, the entry of new competitors, the loss of Mode IBOs and or sales agents, poor customer retention, inadequate drayage service and inadequate equipment supply.
Gross Margin
We expect fluctuations in gross margin as a percentage of revenue from quarter-to-quarter caused by various factors including, but not limited to, changes in the transportation business mix, changes in logistics services between transactional business and management fee business, insurance costs, driver recruiting costs, driver compensation changes, impact of CSA (Compliance Safety Accountability) and other regulations on drayage costs, trailer and container capacity, vendor cost increases, fuel costs, equipment utilization, intermodal industry growth, intermodal industry service levels, accessorials, competitive pricing and accounting estimates.
In 2014 the Hub segment’s intermodal gross margin was negatively impacted by rail service challenges and higher drayage costs. Rail service challenges through 2014 severely impacted volume and operating costs, resulting in a decline in Hub’s intermodal margins. This negative impact is beyond the Company’s control and is expected to persist until the rail service is normalized. We expect rail service to gradually improve during 2015 and to be back to normalized levels in the second half of 2015. Also, the change in driver model in California from independent contractors to employee drivers in September 2014 resulted in volume decline and unusually high costs, particularly during the second half of 2014. Because not all the independent contractors accepted the Company’s job offers, we were short drivers in California. In order to fill the gap and ensure we met customer expectations during peak times, we incurred significant cost to relocate drivers and to use third party drayage carriers. The future impact of the driver model change is difficult to estimate.
Salaries and Benefits
We estimate that salaries and benefits as a percentage of revenue could fluctuate from quarter-to-quarter as there are timing differences between volume increases and changes in levels of staffing. Factors that could affect the percentage from staying in the recent historical range include, but are not limited to, revenue growth rates significantly higher or lower than forecasted, a management decision to invest in additional personnel to stimulate new or existing businesses, changes in customer requirements, changes in our operating structure, severance, how well we perform against our EPS goals, and changes in railroad intermodal service levels which could result in a lower or higher cost of labor per move.
27
Agent Fees and Commissions
Agent fees and commissions are directly related to the gross margin earned by the agents. This expense will fluctuate as Mode’s gross margin fluctuates.
General and Administrative
We believe there are several factors that could cause general and administrative expenses to fluctuate as a percentage of revenue. As customer expectations and the competitive environment require the development of web-based business interfaces and the restructuring of our information systems and related platforms, we believe there could be significant expenses incurred, some of which would not be capitalized. Other factors that could cause selling, general and administrative expense to fluctuate include, but are not limited to, changes in insurance premiums, claim expense, bad debt expense and professional services expense.
Depreciation and Amortization
We estimate that depreciation and amortization of property and equipment will increase slightly due to technology related additions.
Impairment of Property and Equipment, Goodwill and Indefinite-Lived Intangibles
On an ongoing basis, we assess the realizability of our assets. If, at any point during the year, we determine that an impairment exists, the carrying amount of the asset is reduced by the estimated impairment with a corresponding charge to earnings which we estimate could have a material adverse impact on earnings.
Other Income (Expense)
We expect interest expense to increase in 2015 because we financed our 2014 tractor and container purchases with debt. Factors that could cause a change in interest income include, but are not limited to, change in interest rates, change in investments, funding working capital needs, funding capital expenditures, funding an acquisition and purchase of treasury stock. See Notes 10 and 18 of the consolidated financial statements for additional information regarding new debt.
Provision for Income Taxes
Based on current tax legislation, we estimate that our effective tax rate will be 38.5% in 2015.
Leasing on Owner-Operators
Our drivers are comprised of 62% independent contractors and 38% employees. We had difficulties signing on owner-operators in recent months but more success recruiting employee drivers. If this trend continues, the Company may have to recruit more employee drivers in certain markets.
Item 7A. QUANTITATIVE AND QUALITATIVE DISCLOSURES ABOUT MARKET RISK
We are exposed to market risk related to changes in interest rates on our bank line of credit which may adversely affect our results of operations and financial condition. Although we conduct business in foreign countries, international operations are not material to our consolidated financial position, results of operations, or cash flows. Additionally, foreign currency transaction gains and losses were not material to our results of operations for the year ended December 31, 2014. Accordingly, we are not currently subject to material foreign currency exchange rate risks from the effects that exchange rate movements of foreign currencies would have on our future costs or on future cash flows we would receive from our foreign investment. To date, we have not entered into any foreign currency forward exchange contracts or other derivative financial instruments to hedge the effects of adverse fluctuations in foreign currency exchange rates. We do not use financial instruments for trading purposes.
The Company has both fixed and variable rate debt as described in Note 10 to the Consolidated Financial Statements. Any material increase in market interest rates would not have a material impact on the results of operations for the year ended December 31, 2014.
As of December 31, 2014 and 2013, other than our outstanding letters of credit, the Company had no outstanding obligations under its bank line of credit arrangement.
28
|
Item 8. |
FINANCIAL STATEMENTS AND SUPPLEMENTARY DATA |
INDEX TO FINANCIAL STATEMENTS
AND FINANCIAL STATEMENT SCHEDULE
|
|
30 |
|
|
|
|
|
|
Consolidated Balance Sheets – December 31, 2014 and December 31, 2013 |
|
31 |
|
|
|
|
|
|
32 |
|
|
|
|
|
|
|
33 |
|
|
|
|
|
|
|
34 |
|
|
|
|
|
|
|
35 |
|
|
|
|
|
|
|
S-1 |
|
29
REPORT OF INDEPENDENT REGISTERED PUBLIC ACCOUNTING FIRM
The Board of Directors and Stockholders of Hub Group, Inc.:
ERNST & YOUNG LLP
Chicago, Illinois
February 27, 2015
30
HUB GROUP, INC.
CONSOLIDATED BALANCE SHEETS
(in thousands, except share amounts)
|
|
December 31, |
|
|||||
|
|
2014 |
|
|
2013 |
|
||
|
ASSETS |
|
|
|
|
|
|
|
|
CURRENT ASSETS: |
|
|
|
|
|
|
|
|
Cash and cash equivalents |
$ |
109,769 |
|
|
$ |
68,964 |
|
|
Accounts receivable trade, net |
|
401,803 |
|
|
|
371,528 |
|
|
|
24,886 |
|
|
|
26,569 |
|
|
|
Prepaid taxes |
|
14,937 |
|
|
|
409 |
|
|
Deferred taxes |
|
4,816 |
|
|
|
5,826 |
|
|
Prepaid expenses and other current assets |
|
14,355 |
|
|
|
12,738 |
|
|
TOTAL CURRENT ASSETS |
|
570,566 |
|
|
|
486,034 |
|
|
|
|
|
|
|
|
|
|
|
Restricted investments |
|
21,944 |
|
|
|
20,754 |
|
|
Property and equipment, net |
|
338,327 |
|
|
|
260,400 |
|
|
Other intangibles, net |
|
14,434 |
|
|
|
15,729 |
|
|
Goodwill, net |
|
262,813 |
|
|
|
263,032 |
|
|
Other assets |
|
4,043 |
|
|
|
1,994 |
|
|
TOTAL ASSETS |
$ |
1,212,127 |
|
|
$ |
1,047,943 |
|
|
|
|
|
|
|
|
|
|
|
LIABILITIES AND STOCKHOLDERS' EQUITY |
|
|
|
|
|
|
|
|
CURRENT LIABILITIES: |
|
|
|
|
|
|
|
|
Accounts payable trade |
$ |
256,345 |
|
|
$ |
232,350 |
|
|
Accounts payable other |
|
21,333 |
|
|
|
24,957 |
|
|
Accrued payroll |
|
16,192 |
|
|
|
17,000 |
|
|
Accrued other |
|
43,523 |
|
|
|
42,834 |
|
|
Current portion of capital lease |
|
2,504 |
|
|
|
2,413 |
|
|
Current portion of long term debt |
|
19,619 |
|
|
|
1,771 |
|
|
TOTAL CURRENT LIABILITIES |
|
359,516 |
|
|
|
321,325 |
|
|
|
|
|
|
|
|
|
|
|
Long term debt |
|
72,460 |
|
|
|
6,475 |
|
|
Non-current liabilities |
|
22,929 |
|
|
|
22,304 |
|
|
Long term portion of capital lease |
|
15,937 |
|
|
|
18,477 |
|
|
Deferred taxes |
|
140,501 |
|
|
|
117,835 |
|
|
|
|
|
|
|
|
|
|
|
STOCKHOLDERS' EQUITY: |
|
|
|
|
|
|
|
|
Preferred stock, $.01 par value; 2,000,000 shares authorized; no shares issued or outstanding in 2014 and 2013 |
- |
|
|
- |
|
||
|
Common stock |
|
|
|
|
|
|
|
|
Class A: $.01 par value; 97,337,700 shares authorized and 41,224,792 shares issued in 2014 and 2013; 36,247,324 shares outstanding in 2014 and 36,626,384 shares outstanding in 2013 |
|
412 |
|
|
|
412 |
|
|
Class B: $.01 par value; 662,300 shares authorized; 662,296 shares issued and outstanding in 2014 and 2013 |
|
7 |
|
|
|
7 |
|
|
Additional paid-in capital |
|
171,235 |
|
|
|
167,357 |
|
|
Purchase price in excess of predecessor basis, net of tax benefit of $10,306 |
|
(15,458 |
) |
|
|
(15,458 |
) |
|
Retained earnings |
|
589,809 |
|
|
|
538,251 |
|
|
Accumulated other comprehensive loss |
|
(77 |
) |
|
|
(85 |
) |
|
Treasury stock; at cost, 4,977,468 shares in 2014 and 4,598,408 shares in 2013 |
|
(145,144 |
) |
|
|
(128,957 |
) |
|
TOTAL STOCKHOLDERS' EQUITY |
|
600,784 |
|
|
|
561,527 |
|
|
TOTAL LIABILITIES AND STOCKHOLDERS' EQUITY |
$ |
1,212,127 |
|
|
$ |
1,047,943 |
|
The accompanying notes to consolidated financial statements are an integral part of these statements.
31
HUB GROUP, INC.
CONSOLIDATED STATEMENTS OF INCOME
AND COMPREHENSIVE INCOME
(in thousands, except per share amounts)
|
|
Years Ended December 31, |
|
|||||||||
|
|
2014 |
|
|
2013 |
|
|
2012 |
|
|||
|
|
|
|
|
|
|
|
|
|
|
|
|
|
Revenue |
$ |
3,571,126 |
|
|
$ |
3,373,898 |
|
|
$ |
3,124,108 |
|
|
Transportation costs |
|
3,200,691 |
|
|
|
3,002,875 |
|
|
|
2,768,042 |
|
|
Gross margin |
|
370,435 |
|
|
|
371,023 |
|
|
|
356,066 |
|
|
|
|
|
|
|
|
|
|
|
|
|
|
|
Costs and expenses: |
|
|
|
|
|
|
|
|
|
|
|
|
Salaries and benefits |
|
136,480 |
|
|
|
135,341 |
|
|
|
129,143 |
|
|
Agent fees and commissions |
|
62,041 |
|
|
|
55,789 |
|
|
|
55,112 |
|
|
General and administrative |
|
58,014 |
|
|
|
56,772 |
|
|
|
52,832 |
|
|
Depreciation and amortization |
|
7,799 |
|
|
|
6,470 |
|
|
|
6,619 |
|
|
Driver settlements and related costs |
|
10,343 |
|
|
|
- |
|
|
|
- |
|
|
Impairment of software |
|
11,881 |
|
|
|
- |
|
|
|
- |
|
|
Impairment of trade name |
|
- |
|
|
|
2,904 |
|
|
- |
|
|
|
Total costs and expenses |
|
286,558 |
|
|
|
257,276 |
|
|
|
243,706 |
|
|
|
|
|
|
|
|
|
|
|
|
|
|
|
Operating income |
|
83,877 |
|
|
|
113,747 |
|
|
|
112,360 |
|
|
|
|
|
|
|
|
|
|
|
|
|
|
|
Other income (expense): |
|
|
|
|
|
|
|
|
|
|
|
|
Interest expense |
|
(1,785 |
) |
|
|
(1,246 |
) |
|
|
(1,207 |
) |
|
Interest and dividend income |
|
32 |
|
|
|
82 |
|
|
|
134 |
|
|
Other, net |
|
(257 |
) |
|
|
(28 |
) |
|
|
(30 |
) |
|
Total other expense |
|
(2,010 |
) |
|
|
(1,192 |
) |
|
|
(1,103 |
) |
|
|
|
|
|
|
|
|
|
|
|
|
|
|
Income before provision for income taxes |
|
81,867 |
|
|
|
112,555 |
|
|
|
111,257 |
|
|
|
|
|
|
|
|
|
|
|
|
|
|
|
Provision for income taxes |
|
30,309 |
|
|
|
43,445 |
|
|
|
43,304 |
|
|
|
|
|
|
|
|
|
|
|
|
|
|
|
Net income |
$ |
51,558 |
|
|
$ |
69,110 |
|
|
$ |
67,953 |
|
|
|
|
|
|
|
|
|
|
|
|
|
|
|
Other comprehensive income (loss): |
|
|
|
|
|
|
|
|
|
|
|
|
Foreign currency translation adjustments |
|
8 |
|
|
|
(86 |
) |
|
|
(3 |
) |
|
|
|
|
|
|
|
|
|
|
|
|
|
|
Total comprehensive income |
$ |
51,566 |
|
|
$ |
69,024 |
|
|
$ |
67,950 |
|
|
|
|
|
|
|
|
|
|
|
|
|
|
|
Basic earnings per common share |
$ |
1.41 |
|
|
$ |
1.88 |
|
|
$ |
1.83 |
|
|
|
|
|
|
|
|
|
|
|
|
|
|
|
Diluted earnings per common share |
$ |
1.40 |
|
|
$ |
1.87 |
|
|
$ |
1.83 |
|
|
|
|
|
|
|
|
|
|
|
|
|
|
|
Basic weighted average number of shares outstanding |
|
36,590 |
|
|
|
36,829 |
|
|
|
37,053 |
|
|
Diluted weighted average number of shares outstanding |
|
36,732 |
|
|
|
36,982 |
|
|
|
37,185 |
|
The accompanying notes to consolidated financial statements are an integral part of these statements.
32
HUB GROUP, INC
CONSOLIDATED STATEMENTS OF STOCKHOLDERS’ EQUITY
(in thousands, except shares)
|
|
|
|
|
|
|
|
|
|
|
|
|
|
Purchase Price |
|
|
|
|
|
|
|
|
|
|
|
|
|
|
|
|
|
|
|
|
|
|
|
|
Class A & B |
|
|
|
|
|
|
of Excess of |
|
|
|
|
|
|
Accumulated |
|
|
|
|
|
|
|
|
|
|
|
|
|
|||||||
|
|
Common Stock |
|
|
Additional |
|
|
Predecesser |
|
|
|
|
|
|
Other |
|
|
Treasury |
|
|
|
|
|
|||||||||||||
|
|
Shares |
|
|
|
|
|
|
Paid-in |
|
|
Basis, Net |
|
|
Retained |
|
|
Comprehensive |
|
|
Stock |
|
|
|
|
|
||||||||||
|
|
Issued |
|
|
Amount |
|
|
Capital |
|
|
of Tax |
|
|
Earnings |
|
|
Income |
|
|
Shares |
|
|
Amount |
|
|
Total |
|
|||||||||
|
Balance December 31, 2011 |
|
41,887,088 |
|
|
$ |
419 |
|
|
$ |
168,800 |
|
|
$ |
(15,458 |
) |
|
$ |
401,188 |
|
|
$ |
4 |
|
|
|
(4,364,532 |
) |
|
$ |
(116,088 |
) |
|
$ |
438,865 |
|
|
Purchase of treasury shares |
|
- |
|
|
|
- |
|
|
|
- |
|
|
|
- |
|
|
|
- |
|
|
|
- |
|
|
|
(347,592 |
) |
|
|
(11,208 |
) |
|
|
(11,208 |
) |
|
Stock tendered for payments of withholding taxes |
|
- |
|
|
|
- |
|
|
|
- |
|
|
|
- |
|
|
|
- |
|
|
|
- |
|
|
|
(55,463 |
) |
|
|
(1,812 |
) |
|
|
(1,812 |
) |
|
Issuance of restricted stock awards, net of forfeitures |
|
- |
|
|
|
- |
|
|
|
(7,148 |
) |
|
|
- |
|
|
|
- |
|
|
|
- |
|
|
|
273,180 |
|
|
|
7,148 |
|
|
|
- |
|
|
Share-based compensation expense |
|
- |
|
|
|
- |
|
|
|
6,539 |
|
|
|
- |
|
|
|
- |
|
|
|
- |
|
|
|
- |
|
|
|
- |
|
|
|
6,539 |
|
|
Exercise of non-qualified options |
|
- |
|
|
|
- |
|
|
|
(920 |
) |
|
|
- |
|
|
|
- |
|
|
|
- |
|
|
|
37,100 |
|
|
|
989 |
|
|
|
69 |
|
|
Tax benefit of share-based compensation plans |
|
- |
|
|
|
- |
|
|
|
494 |
|
|
|
- |
|
|
|
- |
|
|
|
- |
|
|
|
- |
|
|
|
- |
|
|
|
494 |
|
|
Net income |
|
- |
|
|
|
- |
|
|
|
- |
|
|
|
- |
|
|
|
67,953 |
|
|
|
- |
|
|
|
- |
|
|
|
- |
|
|
|
67,953 |
|
|
Foreign currency translation adjustment |
|
- |
|
|
|
- |
|
|
|
- |
|
|
|
- |
|
|
|
- |
|
|
|
(3 |
) |
|
|
- |
|
|
|
- |
|
|
|
(3 |
) |
|
Balance December 31, 2012 |
|
41,887,088 |
|
|
$ |
419 |
|
|
$ |
167,765 |
|
|
$ |
(15,458 |
) |
|
$ |
469,141 |
|
|
$ |
1 |
|
|
|
(4,457,307 |
) |
|
$ |
(120,971 |
) |
|
$ |
500,897 |
|
|
|
|
|
|
|
|
|
|
|
|
|
|
|
|
|
|
|
|
|
|
|
|
|
|
|
|
|
|
|
|
|
|
|
|
|
|
|
Purchase of treasury shares |
|
- |
|
|
|
- |
|
|
|
- |
|
|
|
- |
|
|
|
- |
|
|
|
- |
|
|
|
(377,906 |
) |
|
|
(13,791 |
) |
|
|
(13,791 |
) |
|
Stock tendered for payments of withholding taxes |
|
- |
|
|
|
- |
|
|
|
- |
|
|
|
- |
|
|
|
- |
|
|
|
- |
|
|
|
(75,995 |
) |
|
|
(2,634 |
) |
|
|
(2,634 |
) |
|
Issuance of restricted stock awards, net of forfeitures |
|
- |
|
|
|
- |
|
|
|
(7,990 |
) |
|
|
- |
|
|
|
- |
|
|
|
- |
|
|
|
296,300 |
|
|
|
7,990 |
|
|
|
- |
|
|
Share-based compensation expense |
|
- |
|
|
|
- |
|
|
|
7,667 |
|
|
|
- |
|
|
|
- |
|
|
|
- |
|
|
|
- |
|
|
|
- |
|
|
|
7,667 |
|
|
Exercise of non-qualified options |
|
- |
|
|
|
- |
|
|
|
(408 |
) |
|
|
- |
|
|
|
- |
|
|
|
- |
|
|
|
16,500 |
|
|
|
449 |
|
|
|
41 |
|
|
Tax benefit of share-based compensation plans |
|
- |
|
|
|
- |
|
|
|
323 |
|
|
|
- |
|
|
|
- |
|
|
|
- |
|
|
|
- |
|
|
|
- |
|
|
|
323 |
|
|
Net income |
|
- |
|
|
|
- |
|
|
|
- |
|
|
|
- |
|
|
|
69,110 |
|
|
|
- |
|
|
|
- |
|
|
|
- |
|
|
|
69,110 |
|
|
Foreign currency translation adjustment |
|
- |
|
|
|
- |
|
|
|
- |
|
|
|
- |
|
|
|
- |
|
|
|
(86 |
) |
|
|
- |
|
|
|
- |
|
|
|
(86 |
) |
|
Balance December 31, 2013 |
|
41,887,088 |
|
|
$ |
419 |
|
|
$ |
167,357 |
|
|
$ |
(15,458 |
) |
|
$ |
538,251 |
|
|
$ |
(85 |
) |
|
|
(4,598,408 |
) |
|
$ |
(128,957 |
) |
|
$ |
561,527 |
|
|
|
|
|
|
|
|
|
|
|
|
|
|
|
|
|
|
|
|
|
|
|
|
|
|
|
|
|
|
|
|
|
|
|
|
|
|
|
Purchase of treasury shares |
|
- |
|
|
|
- |
|
|
|
- |
|
|
|
- |
|
|
|
- |
|
|
|
- |
|
|
|
(501,271 |
) |
|
|
(18,024 |
) |
|
|
(18,024 |
) |
|
Stock tendered for payments of withholding taxes |
|
- |
|
|
|
- |
|
|
|
- |
|
|
|
- |
|
|
|
- |
|
|
|
- |
|
|
|
(80,772 |
) |
|
|
(3,195 |
) |
|
|
(3,195 |
) |
|
Issuance of restricted stock awards, net of forfeitures |
|
- |
|
|
|
- |
|
|
|
(5,032 |
) |
|
|
- |
|
|
|
- |
|
|
|
- |
|
|
|
202,983 |
|
|
|
5,032 |
|
|
|
- |
|
|
Share-based compensation expense |
|
- |
|
|
|
- |
|
|
|
8,258 |
|
|
|
- |
|
|
|
- |
|
|
|
- |
|
|
|
- |
|
|
|
- |
|
|
|
8,258 |
|
|
Tax benefit of share-based compensation plans |
|
- |
|
|
|
- |
|
|
|
652 |
|
|
|
- |
|
|
|
- |
|
|
|
- |
|
|
|
- |
|
|
|
- |
|
|
|
652 |
|
|
Net income |
|
- |
|
|
|
- |
|
|
|
- |
|
|
|
- |
|
|
|
51,558 |
|
|
|
- |
|
|
|
- |
|
|
|
- |
|
|
|
51,558 |
|
|
Foreign currency translation adjustment |
|
- |
|
|
|
- |
|
|
|
- |
|
|
|
- |
|
|
|
- |
|
|
|
8 |
|
|
|
- |
|
|
|
- |
|
|
|
8 |
|
|
Balance December 31, 2014 |
|
41,887,088 |
|
|
$ |
419 |
|
|
$ |
171,235 |
|
|
$ |
(15,458 |
) |
|
$ |
589,809 |
|
|
$ |
(77 |
) |
|
|
(4,977,468 |
) |
|
$ |
(145,144 |
) |
|
$ |
600,784 |
|
The accompanying notes to consolidated financial statements are an integral part of these statements.
33
HUB GROUP, INC.
CONSOLIDATED STATEMENTS OF CASH FLOWS
(in thousands)
|
|
Years Ended December 31, |
|
|||||||||
|
|
2014 |
|
|
2013 |
|
|
2012 |
|
|||
|
Cash flows from operating activities: |
|
|
|
|
|
|
|
|
|
|
|
|
Net Income |
$ |
51,558 |
|
|
$ |
69,110 |
|
|
$ |
67,953 |
|
|
Adjustments to reconcile net income to net cash provided by operating activities: |
|
|
|
|
|
|
|
|
|
|
|
|
Depreciation and amortization |
|
29,380 |
|
|
|
21,302 |
|
|
|
21,575 |
|
|
Impairment of software |
|
11,881 |
|
|
|
- |
|
|
- |
|
|
|
Impairment of trade name |
|
- |
|
|
|
2,904 |
|
|
- |
|
|
|
Deferred taxes |
|
24,501 |
|
|
|
16,438 |
|
|
|
8,786 |
|
|
Compensation expense related to share-based compensation plans |
|
8,258 |
|
|
|
7,667 |
|
|
|
6,539 |
|
|
(Gain) loss on sale of assets |
|
(46 |
) |
|
|
(167 |
) |
|
|
108 |
|
|
Excess tax benefits from share based compensation |
|
- |
|
|
|
(13 |
) |
|
|
(29 |
) |
|
Changes in operating assets and liabilities: |
|
|
|
|
|
|
|
|
|
|
|
|
Restricted investments |
|
(1,190 |
) |
|
|
(3,536 |
) |
|
|
(2,895 |
) |
|
Accounts receivable, net |
|
(28,621 |
) |
|
|
(25,420 |
) |
|
|
(22,429 |
) |
|
Prepaid taxes |
|
(14,533 |
) |
|
|
(308 |
) |
|
|
2,253 |
|
|
Prepaid expenses and other current assets |
|
(1,621 |
) |
|
|
(2,137 |
) |
|
|
(1,562 |
) |
|
Other assets |
|
(2,047 |
) |
|
|
(682 |
) |
|
|
459 |
|
|
Accounts payable |
|
20,370 |
|
|
|
27,635 |
|
|
|
7,438 |
|
|
Accrued expenses |
|
367 |
|
|
|
1,736 |
|
|
|
2,779 |
|
|
Non-current liabilities |
|
284 |
|
|
|
2,888 |
|
|
|
1,942 |
|
|
|
98,541 |
|
|
|
117,417 |
|
|
|
92,917 |
|
|
|
|
|
|
|
|
|
|
|
|
|
|
|
|
Cash flows from investing activities: |
|
|
|
|
|
|
|
|
|
|
|
|
Proceeds from sale of equipment |
|
612 |
|
|
|
1,837 |
|
|
|
1,071 |
|
|
Purchases of property and equipment |
|
(119,171 |
) |
|
|
(110,917 |
) |
|
|
(56,882 |
) |
|
Cash used in acquisitions, net of cash acquired |
|
- |
|
|
- |
|
|
|
(550 |
) |
|
|
Net cash used in investing activities |
|
(118,559 |
) |
|
|
(109,080 |
) |
|
|
(56,361 |
) |
|
|
|
|
|
|
|
|
|
|
|
|
|
|
Cash flows from financing activities: |
|
|
|
|
|
|
|
|
|
|
|
|
Proceeds from issuance of debt |
|
91,084 |
|
|
|
9,120 |
|
|
- |
|
|
|
Repayments of long term debt |
|
(7,251 |
) |
|
|
(874 |
) |
|
- |
|
|
|
Proceeds from stock options exercised |
|
- |
|
|
|
41 |
|
|
|
69 |
|
|
Stock tendered for payments of withholding taxes |
|
(3,195 |
) |
|
|
(2,634 |
) |
|
|
(1,812 |
) |
|
Purchase of treasury stock |
|
(18,024 |
) |
|
|
(13,791 |
) |
|
|
(11,208 |
) |
|
Capital lease payments |
|
(2,449 |
) |
|
|
(2,329 |
) |
|
|
(2,454 |
) |
|
Excess tax benefits from share-based compensation |
|
652 |
|
|
|
336 |
|
|
|
523 |
|
|
Net cash provided by (used in) financing activities |
|
60,817 |
|
|
|
(10,131 |
) |
|
|
(14,882 |
) |
|
|
|
|
|
|
|
|
|
|
|
|
|
|
|
|
|
|
|
|
|
|
|
|
|
|
|
Effect of exchange rate changes on cash and cash equivalents |
|
6 |
|
|
|
(2 |
) |
|
|
(5 |
) |
|
|
|
|
|
|
|
|
|
|
|
|
|
|
Net increase (decrease) in cash and cash equivalents |
|
40,805 |
|
|
|
(1,796 |
) |
|
|
21,669 |
|
|
Cash and cash equivalents beginning of the year |
|
68,964 |
|
|
|
70,760 |
|
|
|
49,091 |
|
|
Cash and cash equivalents end of the year |
$ |
109,769 |
|
|
$ |
68,964 |
|
|
$ |
70,760 |
|
|
|
|
|
|
|
|
|
|
|
|
|
|
|
Supplemental disclosures of cash paid for: |
|
|
|
|
|
|
|
|
|
|
|
|
Interest |
$ |
1,532 |
|
|
$ |
1,201 |
|
|
$ |
1,200 |
|
|
Income taxes |
$ |
20,189 |
|
|
$ |
29,728 |
|
|
$ |
28,638 |
|
The accompanying notes to consolidated financial statements are an integral part of these statements.
34
HUB GROUP, INC.
NOTES TO CONSOLIDATED FINANCIAL STATEMENTS
NOTE 1. Description of Business and Summary of Significant Accounting Policies
Business: Hub Group, Inc. (“we”, “us” or “our”) provides intermodal transportation services utilizing primarily third party arrangements with railroads. Drayage can be provided by our subsidiary, Hub Group Trucking, Inc., or a third party company. We also arrange for transportation of freight by truck and perform logistics services. Transportation services are provided through our legacy business and our acquisition, Mode Transportation, LLC. We report two distinct business segments. The first segment is Mode, which includes the Mode business we acquired on April 1, 2011. The other segment is Hub, which is all business other than Mode. “Hub Group” includes both segments.
Principles of Consolidation: The consolidated financial statements include our accounts and all entities in which we have more than a 50% equity ownership or otherwise exercise unilateral control. All significant intercompany balances and transactions have been eliminated.
Cash and Cash Equivalents: We consider as cash equivalents all highly liquid instruments with an original maturity of three months or less. As of December 31, 2014 and 2013, our cash and temporary investments were with high quality financial institutions in DDAs (Demand Deposit Accounts).
Accounts Receivable and Allowance for Uncollectible Accounts: In the normal course of business, we extend credit to customers after a review of each customer’s credit history. An allowance for uncollectible trade accounts has been established through an analysis of the accounts receivable aging, an assessment of collectability based on historical trends and an evaluation based on current economic conditions. To be more specific, we reserve a portion of every account balance that has aged over one year, a portion of receivables for customers in bankruptcy and certain account balances specifically identified as uncollectible. On an annual basis, we perform a hindsight analysis on Hub and Mode separately to determine each segment’s experience in collecting account balances over one year old and account balances in bankruptcy. We then use this hindsight analysis to establish our reserves for receivables over one year and in bankruptcy. In establishing a reserve for certain account balances specifically identified as uncollectible, we consider the aging of the customer receivables, the specific details as to why the receivable has not been paid, the customer’s current and projected financial results, the customer’s ability to meet and sustain their financial commitments, the positive or negative effects of the current and projected industry outlook and the general economic conditions. The allowance for uncollectible accounts is reported on the balance sheet in net accounts receivable. Our reserve for uncollectible accounts was approximately $7.0 million and $7.4 million as of December 31, 2014 and 2013, respectively. Receivables are written off once collection efforts have been exhausted. Recoveries of receivables previously charged off are recorded when received.
Property and Equipment: Property and equipment are stated at cost. Depreciation of property and equipment is computed using the straight-line method at rates adequate to depreciate the cost of the applicable assets over their expected useful lives: building and improvements, up to 40 years; leasehold improvements, the shorter of useful life or lease term; computer equipment and software, up to 5 years; furniture and equipment, up to 10 years; and transportation equipment up to 15 years. Direct costs related to internally developed software projects are capitalized and amortized over their expected useful life on a straight-line basis not to exceed 5 years. Interest is capitalized on qualifying assets under development for internal use. Maintenance and repairs are charged to operations as incurred and major improvements are capitalized. The cost of assets retired or otherwise disposed of and the accumulated depreciation thereon are removed from the accounts with any gain or loss realized upon sale or disposal charged or credited to operations. We review long-lived assets for impairment when events or changes in circumstances indicate the carrying amount of an asset may not be recoverable. In the event that the undiscounted future cash flows resulting from the use of the asset group is less than the carrying amount, an impairment loss equal to the excess of the assets carrying amount over its fair value, less cost to dispose, is recorded.
Goodwill and Other Intangibles: Goodwill represents the excess of purchase price over the fair market value of net assets acquired in connection with our business combinations. Goodwill and intangible assets that have indefinite useful lives are not amortized but are subject to annual impairment tests.
We test goodwill for impairment annually in the fourth quarter or when events or changes in circumstances indicate the carrying value of this asset might exceed the current fair value. We test goodwill for impairment at the reporting unit level. We assess qualitative factors such as current company performance and overall economic factors to determine if it is more-likely-than-not that the goodwill might be impaired and whether it is necessary to perform the quantitative goodwill impairment test. In the quantitative goodwill test, a company compares the carrying value of a reporting unit to its fair value. If the carrying value of the reporting unit exceeds the estimated fair value, a second step is performed, which compares the implied fair value of goodwill to the carrying value, to determine the amount of impairment. In 2014 and 2013, we performed the qualitative assessment on both the Hub and Mode reporting units. No impairment charge was recognized based on the results of the goodwill impairment tests.
35
On January 1, 2013, we adopted the FASB’s new accounting guidance regarding indefinite-lived intangibles which permits an entity to first assess qualitative factors to determine whether it is more likely than not that the fair value of the indefinite lived intangible asset is less than its carrying amount as a basis for determining whether it is necessary to perform the quantitative test discussed above. As a result of our impairment analysis, we recorded an impairment charge of $2.9 million in the fourth quarter of 2013, which is included in the Impairment of Trade Name line item in the Consolidated Statements of Income and Comprehensive Income. See Note 6 to the consolidated financial statements for information on this impairment charge.
We evaluate the potential impairment of finite-lived acquired intangible assets when impairment indicators exist. If the carrying value is no longer recoverable based upon the undiscounted future cash flows of the asset, the amount of the impairment is the difference between the carrying amount and the fair value of the asset.
Concentration of Credit Risk: Our financial instruments that are exposed to concentrations of credit risk consist primarily of cash and cash equivalents and accounts receivable. We place our cash and temporary investments with high quality financial institutions in DDAs (Demand Deposit Accounts). We primarily serve customers located throughout the United States with no significant concentration in any one region. No one customer accounted for more than 10% of revenue in 2014, 2013 or 2012. We review a customer’s credit history before extending credit. In addition, we routinely assess the financial strength of our customers and, as a consequence, believe that our trade accounts receivable risk is limited.
Revenue Recognition: Revenue is recognized at the time 1) persuasive evidence of an arrangement exists, 2) services have been rendered, 3) the sales price is fixed and determinable and 4) collectability is reasonably assured. Revenue and related transportation costs are recognized based on relative transit time. Further, in most cases, we report our revenue on a gross basis because we are the primary obligor as we are responsible for providing the service desired by the customer. Our customers view us as responsible for fulfillment including the acceptability of the service. Services requirements may include, for example, on-time delivery, handling freight loss and damage claims, setting up appointments for pick up and delivery and tracing shipments in transit. We have discretion in setting sales prices and as a result, the amount we earn varies. In addition, we have the discretion to select our vendors from multiple suppliers for the services ordered by our customers. Finally, we have credit risk for our receivables. These three factors, discretion in setting prices, discretion in selecting vendors and credit risk, further support reporting revenue on a gross basis for most of our revenue.
Provision for Income Taxes: Deferred income taxes are recognized for the future tax effects of temporary differences between financial and income tax reporting using tax rates in effect for the years in which the differences are expected to reverse. We believe that it is more likely than not that our deferred tax assets will be realized based on future taxable income projections with the exception of $0.1 million related to state tax net operating losses for which a valuation allowance has been established. In the event the probability of realizing the remaining deferred tax assets do not meet the more likely than not threshold in the future, a valuation allowance would be established for the deferred tax assets deemed unrecoverable.
Tax liabilities are recorded when, in management’s judgment, a tax position does not meet the more likely than not threshold for recognition as prescribed by the guidance. For tax positions that meet the more likely than not threshold, a tax liability may be recorded depending on management’s assessment of how the tax position will ultimately be settled. We recognize interest expense and penalties related to income tax liabilities in our provision for income taxes.
Earnings Per Common Share: Basic earnings per common share are based on the average quarterly weighted average number of Class A and Class B shares of common stock outstanding. Diluted earnings per common share are adjusted for the assumed exercise of dilutive stock options and for restricted stock which are both computed using the treasury stock method.
Stock Based Compensation: Share-based compensation includes the restricted stock awards expected to vest based on the grant date fair value. Compensation expense is amortized straight-line over the vesting period including an estimate of forfeitures and is included in salaries and benefits. We present excess tax benefits resulting from the exercise of share-based compensation as financing cash in-flows and as operating cash out-flows in the Consolidated Statements of Cash Flows.
New Pronouncements: In May 2014, the Financial Accounting Standards Board (“FASB”) issued Update No. 2014-09—Revenue from Contracts with Customers (Topic 606). This Standard provides guidance on how to recognize revenue to depict the transfer of promised goods or services to customers in an amount that reflects the consideration to which the entity expects to be entitled in exchange for those goods or services. For public organizations, the guidance in the update is effective for annual reporting periods beginning after December 15, 2016, including interim reporting periods within that reporting period. The update provides two transition methods to the new guidance: a retrospective approach and a modified retrospective approach. Early application is not permitted. We plan to adopt this standard January 1, 2017, as required. We are currently evaluating the transition method and effect this update will have on our consolidated financial statements.
36
In April 2014, the Financial Accounting Standards Board (“FASB”) issued an update to Topic 360 – Property, Plant and Equipment and Topic 205 – Presentation of Financial Statements: Reporting Discontinued Operations and Disclosures of Disposals of Components of an Entity. The amendments in the update change the requirements for reporting discontinued operations in Subtopic 25-20. The guidance is effective for annual reporting periods beginning after December 15, 2014, including interim reporting periods within that reporting period and is to be applied prospectively. We adopted this standard January 1, 2015, as required. We do not expect this new guidance to have a significant impact on our consolidated financial statements.
Use of Estimates: The preparation of financial statements in conformity with U.S. generally accepted accounting principles requires us to make estimates and assumptions that affect the reported amounts of assets and liabilities and disclosure of contingent assets and liabilities at the date of the financial statements and the reported amounts of revenue and expense during the reporting period. Significant estimates include the allowance for doubtful accounts, revenue, the cost of transportation, commission expense and useful lives of equipment. Actual results could differ from those estimates.
Reclassifications: Certain prior year immaterial amounts have been reclassified in the segment footnote to conform with the current year presentation.
NOTE 2. Capital Structure
We have authorized common stock comprised of Class A Common Stock and Class B Common Stock. The rights of holders of Class A Common Stock and Class B Common Stock are identical, except each share of Class B Common Stock entitles its holder to approximately 80 votes, while each share of Class A Common Stock entitles its holder to one vote. We have authorized 2,000,000 shares of preferred stock.
NOTE 3. Earnings Per Share
The following is a reconciliation of our earnings per share (in thousands, except for per share data):
|
|
Years Ended, December 31, |
|
|||||||||
|
|
2014 |
|
|
2013 |
|
|
2012 |
|
|||
|
|
|
|
|
|
|
|
|
|
|
|
|
|
Net income for basic and diluted earnings per share |
$ |
51,558 |
|
|
$ |
69,110 |
|
|
$ |
67,953 |
|
|
|
|
|
|
|
|
|
|
|
|
|
|
|
Weighted average shares outstanding - basic |
|
36,590 |
|
|
|
36,829 |
|
|
|
37,053 |
|
|
|
|
|
|
|
|
|
|
|
|
|
|
|
Dilutive effect of stock options and restricted stock |
|
142 |
|
|
|
153 |
|
|
|
132 |
|
|
|
|
|
|
|
|
|
|
|
|
|
|
|
Weighted average shares outstanding - diluted |
|
36,732 |
|
|
|
36,982 |
|
|
|
37,185 |
|
|
|
|
|
|
|
|
|
|
|
|
|
|
|
Earnings per share - basic |
$ |
1.41 |
|
|
$ |
1.88 |
|
|
$ |
1.83 |
|
|
|
|
|
|
|
|
|
|
|
|
|
|
|
Earnings per share - diluted |
$ |
1.40 |
|
|
$ |
1.87 |
|
|
$ |
1.83 |
|
NOTE 4. Impairment of Software
In the third quarter of 2014, the Hub segment recorded a full write-off of $11.9 million related to software development costs as a result of our decision to terminate a long-term technology project. Upon deployment in the third quarter of 2014, it was discovered that the software did not properly integrate with our current systems or meet the criteria for which it was designed. We do not believe the software can be cost effectively salvaged and it has no value on the open market. This charge is included in Impairment of software in the Consolidated Statements of Income and Comprehensive Income.
NOTE 5. Business Segments
We now report two distinct business segments. The first segment is Mode, which includes the Mode business we acquired on April 1, 2011. The second segment is Hub, which is all business other than Mode.
37
Hub offers comprehensive intermodal, truck brokerage and logistics services. Our employees operate the freight through a network of operating centers located in the United States, Canada and Mexico. Each operating center is strategically located in a market with a significant concentration of shipping customers and one or more railheads. Hub has full time employees located throughout the United States, Canada and Mexico.
Mode markets and operates its freight transportation services, consisting of intermodal, truck brokerage and logistics, primarily through agents who enter into contractual arrangements with Mode.
The following is a summary of operating results, which includes the results of operations of the Mode segment for the years ended December 31, 2014, 2013 and 2012, and certain other financial data for our business segments (in thousands):
|
|
Twelve Months |
|
|
Twelve Months |
|
||||||||||||||||||||||
|
|
Ended December 31, 2014 |
|
|
Ended December 31, 2013 |
|
||||||||||||||||||||||
|
|
|
|
|
|
|
|
Inter- |
|
Hub |
|
|
|
|
|
|
|
|
Inter- |
|
Hub |
|
||||||
|
|
|
|
|
|
|
|
Segment |
|
Group |
|
|
|
|
|
|
|
|
Segment |
|
Group |
|
||||||
|
|
Hub |
|
Mode |
|
Elims |
|
Total |
|
|
Hub |
|
Mode |
|
Elims |
|
Total |
|
||||||||||
|
Revenue |
$ |
2,722,799 |
|
$ |
931,131 |
|
$ |
(82,804 |
) |
$ |
3,571,126 |
|
|
$ |
2,599,763 |
|
$ |
823,159 |
|
$ |
(49,024 |
) |
$ |
3,373,898 |
|
||
|
Transportation costs |
|
2,461,144 |
|
|
822,351 |
|
|
(82,804 |
) |
|
3,200,691 |
|
|
|
2,325,512 |
|
|
726,387 |
|
|
(49,024 |
) |
|
3,002,875 |
|
||
|
Gross margin |
|
261,655 |
|
|
108,780 |
|
|
- |
|
|
370,435 |
|
|
|
274,251 |
|
|
96,772 |
|
|
- |
|
|
371,023 |
|
||
|
|
|
|
|
|
|
|
|
|
|
|
|
|
|
|
|
|
|
|
|
|
|
|
|
|
|
||
|
Costs and expenses: |
|
|
|
|
|
|
|
|
|
|
|
|
|
|
|
|
|
|
|
|
|
|
|
|
|
||
|
Salaries and benefits |
|
122,097 |
|
|
14,383 |
|
|
- |
|
|
136,480 |
|
|
|
120,478 |
|
|
14,863 |
|
|
- |
|
|
135,341 |
|
||
|
Agent fees and commissions |
|
45 |
|
|
61,996 |
|
|
- |
|
|
62,041 |
|
|
|
1,372 |
|
|
54,417 |
|
|
- |
|
|
55,789 |
|
||
|
General and administrative |
|
51,108 |
|
|
6,906 |
|
|
- |
|
|
58,014 |
|
|
|
50,484 |
|
|
6,288 |
|
|
- |
|
|
56,772 |
|
||
|
Depreciation and amortization |
|
6,238 |
|
|
1,561 |
|
|
- |
|
|
7,799 |
|
|
|
4,326 |
|
|
2,144 |
|
|
- |
|
|
6,470 |
|
||
|
Driver settlements and related costs |
|
10,343 |
|
|
- |
|
|
- |
|
|
10,343 |
|
|
|
- |
|
|
- |
|
|
- |
|
|
- |
|
||
|
Impairment of software |
|
11,881 |
|
|
- |
|
|
- |
|
|
11,881 |
|
|
|
- |
|
|
- |
|
|
- |
|
|
- |
|
||
|
Impairment of trade name |
|
- |
|
|
- |
|
|
- |
|
|
- |
|
|
|
2,904 |
|
|
- |
|
|
- |
|
|
2,904 |
|
||
|
Total costs and expenses |
|
201,712 |
|
|
84,846 |
|
|
- |
|
|
286,558 |
|
|
|
179,564 |
|
|
77,712 |
|
|
- |
|
|
257,276 |
|
||
|
|
|
|
|
|
|
|
|
|
|
|
|
|
|
|
|
|
|
|
|
|
|
|
|
|
|
||
|
Operating income |
$ |
59,943 |
|
$ |
23,934 |
|
$ |
- |
|
$ |
83,877 |
|
|
|
94,687 |
|
|
19,060 |
|
|
- |
|
|
113,747 |
|
||
|
|
|
|
|
|
|
|
|
|
|
|
|
|
|
|
|
|
|
|
|
|
|
|
|
|
|
||
|
Capital expenditures |
$ |
118,640 |
|
$ |
531 |
|
$ |
- |
|
$ |
119,171 |
|
|
$ |
109,412 |
|
$ |
1,505 |
|
$ - |
|
$ |
110,917 |
|
|||
|
|
|
|
|
|
|
|
|
|
|
|
|
|
|
|
|
|
|
|
|
|
|
|
|
|
|||
|
|
|
|
|
|
|
|
|
|
|
|
|
|
|
|
|
|
|
|
|
|
|
|
|
|
|||
|
|
Twelve Months |
|
||||||||||
|
|
Ended December 31, 2012 |
|
||||||||||
|
|
|
|
|
|
|
|
Inter- |
|
Hub |
|
||
|
|
|
|
|
|
|
|
Segment |
|
Group |
|
||
|
|
Hub |
|
Mode |
|
Elims |
|
Total |
|
||||
|
Revenue |
$ |
2,392,289 |
|
$ |
779,928 |
|
$ |
(48,109 |
) |
$ |
3,124,108 |
|
|
Transportation costs |
|
2,128,942 |
|
|
687,209 |
|
|
(48,109 |
) |
|
2,768,042 |
|
|
Gross margin |
|
263,347 |
|
|
92,719 |
|
|
- |
|
|
356,066 |
|
|
|
|
|
|
|
|
|
|
|
|
|
|
|
|
Costs and expenses: |
|
|
|
|
|
|
|
|
|
|
|
|
|
Salaries and benefits |
|
113,855 |
|
|
15,288 |
|
|
- |
|
|
129,143 |
|
|
Agent fees and commissions |
|
1,900 |
|
|
53,212 |
|
|
- |
|
|
55,112 |
|
|
General and administrative |
|
45,411 |
|
|
7,421 |
|
|
- |
|
|
52,832 |
|
|
Depreciation and amortization |
|
4,448 |
|
|
2,171 |
|
|
- |
|
|
6,619 |
|
|
Total costs and expenses |
|
165,614 |
|
|
78,092 |
|
|
- |
|
|
243,706 |
|
|
|
|
|
|
|
|
|
|
|
|
|
|
|
|
Operating income |
$ |
97,733 |
|
$ |
14,627 |
|
$ |
- |
|
$ |
112,360 |
|
|
|
|
|
|
|
|
|
|
|
|
|
|
|
|
Capital expenditures |
$ |
54,266 |
|
$ |
2,616 |
|
$ |
- |
|
$ |
56,882 |
|
38
|
|
As of December 31, 2014 |
|
|
As of December 31, 2013 |
|
||||||||||||||||||||
|
|
|
|
|
|
|
|
Inter- |
|
Hub |
|
|
|
|
|
|
|
|
Inter- |
|
Hub |
|
||||
|
|
|
|
|
|
|
|
Segment |
|
Group |
|
|
|
|
|
|
|
|
Segment |
|
Group |
|
||||
|
|
Hub |
|
Mode |
|
Elims |
|
Total |
|
|
Hub |
|
Mode |
|
Elims |
|
Total |
|
||||||||
|
Total assets |
$ |
1,030,722 |
|
$ |
189,787 |
|
$ |
(8,382 |
) |
$ |
1,212,127 |
|
|
$ |
887,848 |
|
$ |
164,071 |
|
$ |
(3,976 |
) |
$ |
1,047,943 |
|
|
Goodwill |
|
233,424 |
|
|
29,389 |
|
|
- |
|
|
262,813 |
|
|
|
233,643 |
|
|
29,389 |
|
|
- |
|
|
263,032 |
|
The following tables summarize our revenue by segment and business line (in thousands):
|
|
Twelve Months |
|
|
Twelve Months |
|
||||||||||||||||||||
|
|
Ended December 31, 2014 |
|
|
Ended December 31, 2013 |
|
||||||||||||||||||||
|
|
|
|
|
|
|
|
Inter- |
|
Hub |
|
|
|
|
|
|
|
|
Inter- |
|
Hub |
|
||||
|
|
|
|
|
|
|
|
Segment |
|
Group |
|
|
|
|
|
|
|
|
Segment |
|
Group |
|
||||
|
|
Hub |
|
Mode |
|
Elims |
|
Total |
|
|
Hub |
|
Mode |
|
Elims |
|
Total |
|
||||||||
|
Intermodal |
$ |
1,815,842 |
|
$ |
466,859 |
|
$ |
(79,406 |
) |
$ |
2,203,295 |
|
|
$ |
1,818,162 |
|
$ |
389,186 |
|
$ |
(46,401 |
) |
$ |
2,160,947 |
|
|
Truck brokerage |
|
338,590 |
|
|
335,587 |
|
|
(946 |
) |
|
673,231 |
|
|
|
333,027 |
|
|
311,930 |
|
|
(1,453 |
) |
|
643,504 |
|
|
Logistics |
|
568,367 |
|
|
128,685 |
|
|
(2,452 |
) |
|
694,600 |
|
|
|
448,574 |
|
|
122,043 |
|
|
(1,170 |
) |
|
569,447 |
|
|
Total revenue |
$ |
2,722,799 |
|
$ |
931,131 |
|
$ |
(82,804 |
) |
$ |
3,571,126 |
|
|
$ |
2,599,763 |
|
$ |
823,159 |
|
$ |
(49,024 |
) |
$ |
3,373,898 |
|
|
|
Twelve Months |
|
||||||||||
|
|
Ended December 31, 2012 |
|
||||||||||
|
|
|
|
|
|
|
|
Inter- |
|
Hub |
|
||
|
|
|
|
|
|
|
|
Segment |
|
Group |
|
||
|
|
Hub |
|
Mode |
|
Elims |
|
Total |
|
||||
|
Intermodal |
$ |
1,731,487 |
|
$ |
354,662 |
|
$ |
(43,863 |
) |
$ |
2,042,286 |
|
|
Truck brokerage |
|
335,213 |
|
|
318,848 |
|
|
(2,945 |
) |
|
651,116 |
|
|
Logistics |
|
325,589 |
|
|
106,418 |
|
|
(1,301 |
) |
|
430,706 |
|
|
Total revenue |
$ |
2,392,289 |
|
$ |
779,928 |
|
$ |
(48,109 |
) |
$ |
3,124,108 |
|
NOTE 6. Goodwill and Other Intangible Assets
In accordance with the FASB issued guidance in the Intangibles-Goodwill and Other Topic of the Codification, we completed the required annual impairment tests. We performed a qualitative assessment on both the Hub segment goodwill and the Mode segment goodwill. No impairment charges were recognized based on the results of the annual goodwill assessments and there were no accumulated impairment losses of goodwill at the beginning of the period.
The following table presents the carrying amount of goodwill (in thousands):
|
|
|
|
|
|
|
|
Hub Group |
|
|
|
|
Hub |
|
Mode |
|
Total |
|
|||
|
Balance at January 1, 2013 |
$ |
233,862 |
|
$ |
29,389 |
|
$ |
263,251 |
|
|
Other |
|
(219 |
) |
- |
|
|
(219 |
) |
|
|
Balance at December 31, 2013 |
|
233,643 |
|
|
29,389 |
|
|
263,032 |
|
|
Other |
|
(219 |
) |
- |
|
|
(219 |
) |
|
|
Balance at December 31, 2014 |
$ |
233,424 |
|
$ |
29,389 |
|
$ |
262,813 |
|
The changes noted as “other” in the table above for both 2014 and 2013 refer to the amortization of the income tax benefit of tax goodwill in excess of financial statement goodwill.
39
In December 2013, we decided to change our branding strategy for Comtrak Logistics which resulted in us retiring the Comtrak name. We decided to change the name of Comtrak to Hub Group Trucking, Inc. as we believe the name change will allow us to benefit from the valuable Hub Group name with customers, vendors and drivers. In conjunction with the strategy, the Comtrak name will no longer be used, resulting in no fair value and a write off of the asset. We recorded an impairment charge of $2.9 million in the fourth quarter of 2013, which is included in the Impairment of trade name line item in the Consolidated Statements of Income and Comprehensive Income.
The components of the “Other intangible assets” are as follows (in thousands):
|
|
|
|
|
|
|
|
Accumulated |
|
Net |
|
|
|
||
|
|
Gross |
|
Accumulated |
|
Impairment |
|
Carrying |
|
|
|
||||
|
As of December 31, 2014: |
Amount |
|
Amortization |
|
Loss |
|
Value |
|
|
Life |
||||
|
|
|
|
|
|
|
|
|
|
|
|
|
|
|
|
|
Hub |
|
|
|
|
|
|
|
|
|
|
|
|
|
|
|
Customer relationships |
$ |
5,181 |
|
$ |
(2,909 |
) |
$ |
- |
|
$ |
2,272 |
|
|
7-15 years |
|
Trade name |
|
2,904 |
|
|
- |
|
|
(2,904 |
) |
|
- |
|
|
Indefinite |
|
Relationships with owner operators |
|
1,179 |
|
|
(1,179 |
) |
|
- |
|
|
- |
|
|
2-6 years |
|
Information technology |
|
500 |
|
|
(500 |
) |
|
- |
|
|
- |
|
|
6 years |
|
Backlog/open orders |
|
20 |
|
|
(20 |
) |
|
- |
|
|
- |
|
|
1 month |
|
Hub Total |
$ |
9,784 |
|
$ |
(4,608 |
) |
$ |
(2,904 |
) |
$ |
2,272 |
|
|
|
|
|
|
|
|
|
|
|
|
|
|
|
|
|
|
|
|
Mode |
|
|
|
|
|
|
|
|
|
|
|
|
|
|
|
Agency/customer relationships |
$ |
15,362 |
|
$ |
(3,200 |
) |
$ |
- |
|
$ |
12,162 |
|
|
18 years |
|
|
|
|
|
|
|
|
|
|
|
|
|
|
|
|
|
|
|
|
|
|
|
|
|
|
|
|
|
|
|
|
|
Hub Group Total |
$ |
25,146 |
|
$ |
(7,808 |
) |
$ |
(2,904 |
) |
$ |
14,434 |
|
|
|
40
|
|
|
|
|
|
|
|
Accumulated |
|
Net |
|
|
|
||
|
|
Gross |
|
Accumulated |
|
Impairment |
|
Carrying |
|
|
|
||||
|
As of December 31, 2013: |
Amount |
|
Amortization |
|
Loss |
|
Value |
|
|
Life |
||||
|
|
|
|
|
|
|
|
|
|
|
|
|
|
|
|
|
Hub |
|
|
|
|
|
|
|
|
|
|
|
|
|
|
|
Customer relationships |
$ |
5,181 |
|
$ |
(2,467 |
) |
$ |
- |
|
$ |
2,714 |
|
|
7-15 years |
|
Trade name |
|
2,904 |
|
|
- |
|
|
(2,904 |
) |
|
- |
|
|
Indefinite |
|
Relationships with owner operators |
|
1,179 |
|
|
(1,179 |
) |
|
- |
|
|
- |
|
|
2-6 years |
|
Information technology |
|
500 |
|
|
(500 |
) |
|
- |
|
|
- |
|
|
6 years |
|
Backlog/open orders |
|
20 |
|
|
(20 |
) |
|
- |
|
|
- |
|
|
1 month |
|
Hub Total |
$ |
9,784 |
|
$ |
(4,166 |
) |
$ |
(2,904 |
) |
$ |
2,714 |
|
|
|
|
|
|
|
|
|
|
|
|
|
|
|
|
|
|
|
|
Mode |
|
|
|
|
|
|
|
|
|
|
|
|
|
|
|
Agency/customer relationships |
$ |
15,362 |
|
$ |
(2,347 |
) |
$ |
- |
|
$ |
13,015 |
|
|
18 years |
|
|
|
|
|
|
|
|
|
|
|
|
|
|
|
|
|
|
|
|
|
|
|
|
|
|
|
|
|
|
|
|
|
Hub Group Total |
$ |
25,146 |
|
$ |
(6,513 |
) |
$ |
(2,904 |
) |
$ |
15,729 |
|
|
|
The above intangible assets are amortized using the straight-line method. Amortization expense, excluding impairment, for each of the years ended December 31, 2014, 2013 and 2012 was $1.3 million, $1.4 million and $1.6 million, respectively. The remaining weighted average life of all definite lived intangible assets as of December 31, 2014 was 5.42 years and 14.25 years for Hub and Mode, respectively. Amortization expense for the next five years is as follows (in thousands):
|
|
|
|
|
|
|
|
Hub Group |
|
|
|
|
Hub |
|
Mode |
|
Total |
|
|||
|
2015 |
$ |
442 |
|
$ |
853 |
|
$ |
1,295 |
|
|
2016 |
|
442 |
|
|
853 |
|
|
1,295 |
|
|
2017 |
|
442 |
|
|
853 |
|
|
1,295 |
|
|
2018 |
|
395 |
|
|
853 |
|
|
1,248 |
|
|
2019 |
|
255 |
|
|
853 |
|
|
1,108 |
|
NOTE 7. Income Taxes
The following is a reconciliation of our effective tax rate to the federal statutory tax rate:
|
|
Years Ended December 31, |
|
|
|||||||||
|
|
2014 |
|
|
2013 |
|
|
2012 |
|
|
|||
|
U.S. federal statutory rate |
|
35.0 |
|
% |
|
35.0 |
|
% |
|
35.0 |
|
% |
|
State taxes, net of federal benefit |
|
2.9 |
|
|
3.2 |
|
|
2.9 |
|
|
||
|
State incentives |
|
(0.8 |
) |
|
(0.6) |
|
|
- |
|
|
||
|
State law changes |
|
(0.9 |
) |
|
0.1 |
|
|
0.3 |
|
|
||
|
Nondeductible expenses |
|
0.9 |
|
|
0.8 |
|
|
0.5 |
|
|
||
|
Other |
|
(0.1 |
) |
|
0.1 |
|
|
0.2 |
|
|
||
|
Net effective rate |
|
37.0 |
|
% |
|
38.6 |
|
% |
|
38.9 |
|
% |
41
The following is a summary of our provision for income taxes (in thousands):
|
|
Years Ended December 31, |
|
|||||||||
|
|
2014 |
|
|
2013 |
|
|
2012 |
|
|||
|
Current |
|
|
|
|
|
|
|
|
|
|
|
|
Federal |
$ |
5,939 |
|
|
$ |
22,880 |
|
|
$ |
30,375 |
|
|
State and local |
|
445 |
|
|
|
3,817 |
|
|
|
4,331 |
|
|
Foreign |
|
249 |
|
|
|
205 |
|
|
|
47 |
|
|
|
|
6,633 |
|
|
|
26,902 |
|
|
|
34,753 |
|
|
|
|
|
|
|
|
|
|
|
|
|
|
|
Deferred |
|
|
|
|
|
|
|
|
|
|
|
|
Federal |
|
23,600 |
|
|
|
15,920 |
|
|
|
7,865 |
|
|
State and local |
|
191 |
|
|
|
627 |
|
|
|
693 |
|
|
Foreign |
|
(115 |
) |
|
|
(4 |
) |
|
|
(7 |
) |
|
|
|
23,676 |
|
|
|
16,543 |
|
|
|
8,551 |
|
|
|
|
|
|
|
|
|
|
|
|
|
|
|
Total provision |
$ |
30,309 |
|
|
$ |
43,445 |
|
|
$ |
43,304 |
|
The following is a summary of our deferred tax assets and liabilities (in thousands):
|
|
December 31, |
|
|||||
|
|
2014 |
|
|
2013 |
|
||
|
Reserve for uncollectible accounts receivable |
$ |
2,101 |
|
|
$ |
2,398 |
|
|
Accrued compensation |
|
7,161 |
|
|
|
8,175 |
|
|
Other reserves |
|
2,036 |
|
|
|
2,356 |
|
|
Current deferred tax assets |
|
11,298 |
|
|
|
12,929 |
|
|
|
|
|
|
|
|
|
|
|
Accrued compensation |
|
6,829 |
|
|
|
5,919 |
|
|
Other reserves |
|
764 |
|
|
|
545 |
|
|
Operating loss carryforwards |
|
1,387 |
|
|
|
883 |
|
|
Less valuation allowance |
|
(108 |
) |
|
|
(108 |
) |
|
Non-current deferred tax assets |
|
8,872 |
|
|
|
7,239 |
|
|
Total deferred tax assets |
$ |
20,170 |
|
|
$ |
20,168 |
|
|
|
|
|
|
|
|
|
|
|
Prepaids |
$ |
(1,551 |
) |
|
$ |
(2,473 |
) |
|
Other receivables |
|
(4,931 |
) |
|
|
(4,630 |
) |
|
Current deferred tax liabilities |
|
(6,482 |
) |
|
|
(7,103 |
) |
|
|
|
|
|
|
|
|
|
|
Property and equipment |
|
(67,726 |
) |
|
|
(45,185 |
) |
|
Goodwill |
|
(81,647 |
) |
|
|
(79,889 |
) |
|
Non-current deferred tax liabilities |
|
(149,373 |
) |
|
|
(125,074 |
) |
|
Total deferred tax liabilities |
$ |
(155,855 |
) |
|
$ |
(132,177 |
) |
We are subject to income taxation in the U.S., numerous state jurisdictions, Mexico and Canada. Because income tax return formats vary among the states, we file both unitary and separate company state income tax returns. Our state tax net operating losses of $1.4 million expire between December 31, 2015 and December 31, 2034. Management believes it is more likely than not that the deferred tax assets will be realized with the exception of $0.1 million related to state tax net operating losses for which a valuation allowance has been established.
42
As of December 31, 2014 and December 31, 2013, the amount of unrecognized tax benefits was $1.1 million and $0.5 million, respectively. Of these amounts, our income tax provision would decrease $0.7 million and $0.3 million respectively, if recognized. A reconciliation of the beginning and ending amount of unrecognized tax benefits is as follows (in thousands):
|
Balance at January 1, 2013 |
$ |
783 |
|
|
Additions for tax positions taken in prior years |
|
17 |
|
|
Reductions for tax positions taken in prior years |
|
(184 |
) |
|
Reductions as a result of a lapse of the applicable statute of limitations |
|
(157 |
) |
|
Balance at December 31, 2013 |
$ |
459 |
|
|
Additions for tax positions taken in prior years |
|
231 |
|
|
Additions for tax positions related to the current year |
|
587 |
|
|
Reductions as a result of a lapse of the applicable statute of limitations |
|
(212 |
) |
|
Balance at December 31, 2014 |
$ |
1,065 |
|
We estimate it is reasonably possible that our reserve could either increase or decrease by $0.3 million during the next twelve months.
We recognize interest expense and penalties related to income tax liabilities in our provision for income taxes. In our 2014 provision for income taxes we recognized approximately one thousand dollars of net interest expense related to income tax liabilities and income tax penalties.
In 2014, the IRS closed their examination of our 2011 and 2012 tax years with no changes. Also in 2014, Illinois closed audits of our 2009 through 2011 tax years, Massachusetts closed audits of our 2010 through 2012 tax years and Texas closed audits of refund claims that we submitted for tax years 2007 through 2009. We received $0.3 million net after offsetting small settlement payments against the refunds. Although no other material examinations are currently in effect, tax years 2011 through 2013 generally remain open to examination by the major tax jurisdictions to which we are subject.
NOTE 8. Fair Value Measurement
The carrying value of cash and cash equivalents, accounts receivable, accounts payable and long term debt materially approximated fair value as of December 31, 2014 and 2013 due to their short-term nature.
We consider as cash equivalents all highly liquid instruments with an original maturity of three months or less. As of December 31, 2014 and 2013, our cash and temporary investments were with high quality financial institutions in Demand Deposit Accounts.
Restricted investments included $21.9 million and $20.8 million as of December 31, 2014 and 2013, respectively, of mutual funds which are reported at fair value.
The fair value measurement of these securities is based on quoted prices in active markets for identical assets which are defined as “Level 1” of the fair value hierarchy in the Fair Value Measurements and Disclosures Topic of the Codification.
NOTE 9. Property and Equipment
Property and equipment consist of the following (in thousands):
|
|
December 31, |
|
|||||
|
|
2014 |
|
|
2013 |
|
||
|
Land |
$ |
9,855 |
|
|
$ |
9,855 |
|
|
Building and improvements |
|
35,212 |
|
|
|
35,212 |
|
|
Leasehold improvements |
|
4,241 |
|
|
|
4,245 |
|
|
Computer equipment and software |
|
70,719 |
|
|
|
74,751 |
|
|
Furniture and equipment |
|
12,931 |
|
|
|
12,729 |
|
|
Transportation equipment |
|
346,055 |
|
|
|
236,900 |
|
|
|
|
479,013 |
|
|
|
373,692 |
|
|
Less: Accumulated depreciation and amortization |
|
(140,686 |
) |
|
|
(113,292 |
) |
|
Property and Equipment, net |
$ |
338,327 |
|
|
$ |
260,400 |
|
43
The increase in transportation equipment to $346.1 million in 2014 from $236.9 million in 2013 was due primarily to the purchase of tractors and containers.
Included in the transportation equipment is a capital lease obligation entered into for $26.4 million in 2011. The balances as of December 31, 2014 and 2013, net of accumulated amortization, were $17.4 million and $20.0 million, respectively.
Depreciation and amortization expense related to property and equipment was $28.3 million, $20.2 million and $19.6 million for 2014, 2013 and 2012, respectively, which includes $2.6 million of amortization expense associated with a capital lease for each of the years ending 2014, 2013 and 2012. This amortization expense is included in transportation costs. Transportation equipment depreciation is included in transportation costs.
NOTE 10. Long-Term Debt and Financing Arrangements
In December 2013, we amended our Credit Agreement to reduce the interest rate and commitment fees and extend the term until December 2018. The maximum unsecured borrowing capacity remained at $50.0 million. The interest rate under the Credit Agreement ranges from LIBOR plus 1.00% to 1.75% or Prime to Prime plus 0.75%. The commitment fees charged on the unused line of credit are between 0.10% and 0.25% per annum. The financial covenants require a total leverage ratio of not more than 3.0 to 1.0 and an interest coverage ratio of not less than 2.0 to 1.0.
We have standby letters of credit that expire in 2015. As of December 31, 2014, our letters of credit were $6.1 million.
Our unused and available borrowings under our bank revolving line of credit were $43.9 million as of December 31, 2014 and $44.8 million as of December 31, 2013. We were in compliance with our debt covenants as of December 31, 2014.
We have entered into various Equipment Notes (“Notes”) for the purchase of tractors and containers. The Notes are secured by the underlying equipment financed in the agreements.
Our outstanding debt is as follows (in thousands):
|
|
Period Ended |
|
|||||
|
|
December 31, |
|
|
December 31, |
|
||
|
|
2014 |
|
|
2013 |
|
||
|
Secured Equipment Notes due in December 2019 with monthly principal and interest payments of $0.2 million commencing in January 2015; interest is paid monthly at a fixed annual rate of 2.24% |
$ |
13,387 |
|
|
$ |
- |
|
|
|
|
|
|
|
|
|
|
|
Secured Equipment Notes due in November 2019 with monthly principal and interest payments of $0.5 million commencing in December 2014; interest is paid monthly at a fixed annual rate of 2.05% |
|
28,429 |
|
|
|
- |
|
|
|
|
|
|
|
|
|
|
|
Secured Equipment Notes due in September 2019 with monthly principal and interest payments of $0.4 million commencing in September 2014; interest is paid monthly at a fixed annual rate of 2.15% |
|
22,772 |
|
|
|
- |
|
|
|
|
|
|
|
|
|
|
|
Secured Equipment Notes due in February 2019 with monthly principal and interest payments of $0.4 million commencing in January 2014; interest is paid monthly at a fixed annual rate between 1.87% and 1.93% |
|
21,016 |
|
|
|
- |
|
|
|
|
|
|
|
|
|
|
|
Secured Equipment Notes due in June 2018 with quarterly principal and interest payments of $0.5 million commencing in August 2013; interest is paid quarterly at a fixed annual rate between 1.9% and 2.0% |
|
6,475 |
|
|
|
8,246 |
|
|
|
|
92,079 |
|
|
|
8,246 |
|
|
|
|
|
|
|
|
|
|
|
Less current portion |
|
(19,619 |
) |
|
|
(1,771 |
) |
|
Total long-term debt |
$ |
72,460 |
|
|
$ |
6,475 |
|
44
Aggregate principal payments, in thousands, due subsequent to December 31, 2014, are as follows:
|
2015 |
$ |
19,619 |
|
|
2016 |
|
20,023 |
|
|
2017 |
|
20,209 |
|
|
2018 |
|
19,668 |
|
|
2019 |
|
12,560 |
|
|
|
$ |
92,079 |
|
In 2011, we entered into a lease agreement for 3,126 chassis for a period of 10 years. We are accounting for this lease as a capital lease. Interest on this capital lease obligation is based on interest rates that approximate currently available interest rates; therefore, indebtedness under this capital lease obligation approximates fair value.
We paid interest of $0.8 million, $0.9 million and $1.0 million in 2014, 2013 and 2012, respectively, related to this capital lease.
NOTE 11. Leases, User Charges and Commitments
Minimum annual capital and operating lease payments, as of December 31, 2014, under non-cancelable leases, principally for containers, chassis, other equipment and real estate, as well as other commitments are payable as follows (in thousands):
Future Payments Due:
|
|
|
|
|
|
Operating |
|
|
|
|
|
|
|
|
|
|
|
|
Leases and |
|
|
|
|
|
|
|
|
Capital |
|
|
Other |
|
|
|
|
|
||
|
|
Lease |
|
|
Commitments |
|
|
Total |
|
|||
|
2015 |
$ |
3,179 |
|
|
$ |
9,686 |
|
|
$ |
12,865 |
|
|
2016 |
|
3,188 |
|
|
|
7,476 |
|
|
|
10,664 |
|
|
2017 |
|
3,179 |
|
|
|
5,676 |
|
|
|
8,855 |
|
|
2018 |
|
3,179 |
|
|
|
3,926 |
|
|
|
7,105 |
|
|
2019 |
|
3,179 |
|
|
|
2,820 |
|
|
|
5,999 |
|
|
2020 and thereafter |
|
5,037 |
|
|
|
7,361 |
|
|
|
12,398 |
|
|
|
$ |
20,941 |
|
|
$ |
36,945 |
|
|
$ |
57,886 |
|
|
Less: Imputed interest |
|
(2,500 |
) |
|
|
|
|
|
|
|
|
|
Net capital lease liability |
$ |
18,441 |
|
|
|
|
|
|
|
|
|
Total rental expense included in general and administrative expense, which relates primarily to real estate, was approximately $8.1 million in 2014, $10.1 million in 2013 and $8.8 million in 2012. Many of the real estate leases contain renewal options and escalation clauses which require payments of additional rent to the extent of increases in the related operating costs. We straight-line rental expense in accordance with the FASB guidance in the Leases Topic of the Codification.
We incur rental expense for our leased containers, tractors and trailers that are included in transportation costs and totaled $13.1 million, $10.2 million, and $9.3 million for 2014, 2013 and 2012, respectively.
We incur user charges for use of a fleet of rail owned chassis, chassis under capital lease and dedicated rail owned containers on the Union Pacific and Norfolk Southern railroads which are included in transportation costs. Such charges were $67.8 million, $69.1 million and $67.0 million for 2014, 2013 and 2012, respectively. As of December 31, 2013, we have the ability to return the majority of the containers and pay for the rail owned chassis only when we are using them under these agreements. As a result, no minimum commitments related to these rail owned chassis and containers have been included in the table above.
NOTE 12. Guarantees
As a recruiting tool for our owner-operators, we are guaranteeing certain owner-operators’ lease payments for tractors. The guarantees expire at various dates through 2020.
45
The potential maximum exposure under these lease guarantees was approximately $27.2 million and $39.0 million as of December 31, 2014 and 2013, respectively. The potential maximum exposure represents the amount of the remaining lease payments on all outstanding guaranteed leases as of December 31, 2014 and 2013. However, upon default, we have the option to purchase the tractors. We could then sell the tractors and use the proceeds to recover all or a portion of the amounts paid under the guarantees. Alternatively, we can contract with another owner operator who would assume the lease or continue to operate the leased tractor in our company fleet. There were no material defaults during the years ended December 31, 2014 and 2013 and no potential material defaults.
We had a liability of approximately $0.3 million at December 31, 2014 and $0.7 million as of December 31, 2013, representing the fair value for estimated defaults of the guarantees, based on a discounted cash-flow analysis which is included in current and non-current liabilities in our Consolidated Balance Sheets. We are amortizing the amounts over the remaining lives of the respective guarantees.
NOTE 13. Stock-Based Compensation Plans
In 1996, we adopted a Long-Term Incentive Plan (the “1996 Incentive Plan”). The number of shares of Class A Common Stock reserved for issuance under the 1996 Incentive Plan was 1,800,000. In 1997, we adopted a second Long-Term Incentive Plan (the “1997 Incentive Plan”). The number of shares of Class A Common Stock reserved for issuance under the 1997 Incentive Plan was 600,000. In 1999 we adopted a third Long-Term Incentive Plan (the “1999 Incentive Plan”). The number of shares of Class A Common Stock reserved for issuance under the 1999 Incentive Plan was 2,400,000. In 2002, we adopted a fourth Long-Term Incentive Plan (the “2002 Incentive Plan”). The number of shares of Class A Common Stock reserved for issuance under the 2002 Incentive Plan was 2,400,000. In 2003, we amended our 2002 Incentive Plan to add an additional 2,000,000 shares of Class A Common Stock that are reserved for issuance. In 2007, we amended our 2002 Incentive Plan to add an additional 1,000,000 shares of Class A Common Stock that are reserved for issuance. Under the 2002 Incentive Plan, stock options, stock appreciation rights, restricted stock, restricted stock units and performance units may be granted for the purpose of attracting and motivating our key employees and non-employee directors. We have not granted any stock options since 2003 and have no stock options outstanding. Restricted stock vests over a three to five year period. As of December 31, 2014, 726,640 shares were available for future grant. When stock options are exercised, either new shares are issued or shares are issued out of treasury.
Share-based compensation expense for 2014, 2013 and 2012 was $8.3 million, $7.7 million and $6.5 million or $5.2 million, $4.6 million and $4.0 million, net of taxes, respectively.
Intrinsic value for stock options is defined as the difference between the current market value and the grant price. There were no options exercised during the year ended December 31, 2014. The total intrinsic value of options exercised during the years ended December 31, 2013 and 2012 was $0.6 million and $1.2 million, respectively. Cash received from stock options exercised during the years ended December 31, 2013 and 2012 was $0.04 million and $0.07 million, respectively. The tax benefit realized for tax deductions from stock options exercised for the years ended December 31, 2013 and 2012 was $0.2 million and $0.5 million, respectively.
The following table summarizes the non-vested restricted stock activity for the year ended December 31, 2014:
|
|
|
|
Weighted |
|
|
|
|
|
|
Average |
|
|
|
|
|
|
Grant Date |
|
|
|
Non-vested restricted stock |
Shares |
|
Fair Value |
|
|
|
|
|
|
|
|
|
|
Non-vested January 1, 2014 |
761,702 |
|
$ |
33.09 |
|
|
Granted |
293,910 |
|
$ |
39.66 |
|
|
Vested |
(236,015) |
|
$ |
32.01 |
|
|
Forfeited |
(90,927) |
|
$ |
35.39 |
|
|
Non-vested at December 31, 2014 |
728,670 |
|
$ |
35.81 |
|
46
The following table summarizes the restricted stock granted during the respective years:
|
Restricted stock grants |
2014 |
|
|
2013 |
|
|
2012 |
|
|||
|
|
|
|
|
|
|
|
|
|
|
|
|
|
Employees |
|
273,910 |
|
|
|
280,900 |
|
|
|
276,017 |
|
|
Outside directors |
|
20,000 |
|
|
|
20,000 |
|
|
|
20,000 |
|
|
Total |
|
293,910 |
|
|
|
300,900 |
|
|
|
296,017 |
|
|
|
|
|
|
|
|
|
|
|
|
|
|
|
Weighted average grant date fair value |
$ |
39.66 |
|
|
$ |
34.64 |
|
|
$ |
32.62 |
|
|
|
|
|
|
|
|
|
|
|
|
|
|
|
Vesting period |
3-5 years |
|
|
3-5 years |
|
|
3-5 years |
|
|||
The fair value of non-vested restricted stock is equal to the market price of our stock at the date of grant.
The total fair value of restricted shares vested during the years ended December 31, 2014, 2013 and 2012 was $9.4 million, $7.5 million and $5.4 million, respectively.
As of December 31, 2014, there was $19.0 million of unrecognized compensation cost related to non-vested share-based compensation that is expected to be recognized over a weighted average period of 2.77 years.
During January 2015, we granted 252,869 shares of restricted stock to certain employees and 22,000 shares of restricted stock to outside directors with a weighted average grant date fair value of $37.31. The stock vests over a three to five year period.
NOTE 14. Employee Benefit Plans
We had one profit-sharing plan and trust as of December 31, 2014, 2013 and 2012, all under section 401(k) of the Internal Revenue Code. At our discretion, we partially match qualified contributions made by employees to the plan. We incurred expense of $1.9 million, $1.8 million and $1.6 million related to these plans in 2014, 2013, and 2012, respectively.
In January 2005, we established the Hub Group, Inc. Nonqualified Deferred Compensation Plan (the “Plan”) to provide added incentive for the retention of certain key employees. Under the Plan, participants can elect to defer certain compensation. Accounts will grow on a tax-deferred basis to the participant. Restricted investments included in the Consolidated Balance Sheets represent the fair value of the mutual funds and other security investments related to the Plan as of December 31, 2014 and 2013. Both realized and unrealized gains and losses are included in income and expense and offset the change in the deferred compensation liability. We provide a 50% match on the first 6% of employee compensation deferred under the Plan, with a maximum match equivalent to 3% of base salary. In addition, we have a legacy deferred compensation plan. There are no new contributions being made into this legacy plan.
We incurred expense of $0.3 million, $0.4 million and $0.3 million related to the employer match for these plans in 2014, 2013 and 2012, respectively. The liabilities related to these plans as of December 31, 2014 and 2013 were $22.4 million and $21.5 million, respectively.
NOTE 15. Legal Matters
We are a party to litigation incident to our business, including claims for personal injury and/or property damage, bankruptcy preference claims, and claims regarding freight lost or damaged in transit, improperly shipped or improperly billed. Some of the lawsuits to which we are party are covered by insurance and are being defended by our insurance carriers. Some of the lawsuits are not covered by insurance and we defend those ourselves. We do not believe that the outcome of this litigation will have a materially adverse effect on our financial position or results of operations.
47
On January 25, 2013, a complaint was filed in the U.S. District Court for the Eastern District of California (Sacramento Division) by Salvador Robles against our subsidiary, Comtrak Logistics, Inc., now known as Hub Group Trucking, Inc. Mr. Robles drove a truck for Hub Group Trucking in California, first as an independent contractor and then as an employee. The action seeks class certification on behalf of a class comprised of present and former California-based truck drivers for Hub Group Trucking who were classified as independent contractors, from January 2009 to the present. The complaint alleges Hub Group Trucking has misclassified such drivers as independent contractors and that such drivers were employees. The complaint asserts various violations of the California Labor Code and claims that Hub Group Trucking has engaged in unfair competition practices. The complaint seeks, among other things, declaratory and injunctive relief, compensatory damages and attorney’s fees. In May 2013, the complaint was amended to add similar claims based on Mr. Robles’ status as an employed company driver. These additional claims are only on behalf of Mr. Robles and not a putative class. In August 2013, the district court stayed proceedings in the case pending decisions by the Court of Appeals for the 9th Circuit to decide whether the claims in two cases raising some similar claims should be dismissed on federal preemption grounds. In July 2014, the Court of Appeals ruled that the claims in those cases were not preempted. The case is now proceeding.
Two other complaints alleging substantially similar claims were filed in the Superior Court of the State of California for the County of San Bernardino. On July 24, 2014, Carlos Barillas filed a complaint against Hub Group Trucking seeking class certification. On October 1, 2014, Jorge Cabrera filed a complaint against Hub Group Trucking and Hub Group, Inc. on behalf of himself individually and not on behalf of a class. On November 24, 2014, Hub Group Trucking removed both cases to federal court in Los Angeles. By agreement of the parties, on December 19, 2014 the Barillas case was dismissed and we expect the claims of Mr. Barillas to be added to the Robles case. On February 6, 2015 the Cabrera case was dismissed with prejudice pursuant to a settlement between parties.
The Company believes that the California independent contractor truck drivers were properly classified as independent contractors at all times. Nevertheless, because lawsuits are expensive, time-consuming and could interrupt our business operations, we decided to make settlement offers to individual drivers with respect to the claims alleged in these lawsuits, without admitting liability. As of February 11, 2015, 92% of the drivers have accepted the settlement offers. Though counsel for Mr. Robles has threatened to challenge the enforceability of these settlements, we believe they are valid and enforceable. In the third quarter of 2014, driver settlements and related costs include $9.3 million in settlements for individual drivers and $1.0 million of related legal, communication and implementation costs.
On September 12, 2014, a complaint was filed in the U.S. District Court for the Northern District of Illinois (Eastern Division) by Christian Lubinski against Hub Group Trucking. The action seeks class certification on behalf of a class comprised of present and former owner-operators providing delivery services in Illinois for Hub Group Trucking. The complaint alleges Hub Group Trucking has misclassified such drivers as independent contractors and that such drivers are employees. The complaint alleges that Hub Group Trucking has made illegal deductions from the drivers’ pay and has failed to properly compensate the drivers for all hours worked, reimburse business expenses, pay employment taxes, and provide workers’ compensation and other employment benefits. The complaint asserts various violations of the Illinois Wage Payment and Collections Act and claims that Hub Group Trucking has been unjustly enriched. The complaint seeks, among other things, monetary damages for the relevant statutory period and attorneys’ fees. On October 24, 2014, the Lubinski case was transferred to the U.S. District Court for the Western District of Tennessee (Western Division), in Memphis.
We cannot reasonably estimate at this time the possible loss or range of loss, if any, that may arise from the remaining unresolved claims in the Robles, Barillas and Lubinski lawsuits.
NOTE 16. Stock Buy Back Plans
In November 2012, our Board of Directors authorized the purchase of up to $25.0 million of our Class A Common Stock. This authorization expired December 31, 2013. We purchased 377,906 shares during the year ended December 31, 2013.
On October 22, 2014, our Board of Directors authorized the purchase of up to $75.0 million of our Class A Common Stock. This authorization expires December 31, 2015. We purchased 501,271 shares under this authorization during the year ended December 31, 2014.
We purchased 80,772 shares for $3.2 million and 75,995 shares for $2.6 million during the years ended December 31, 2014 and 2013, respectively, related to employee withholding upon vesting of restricted stock.
48
The following table displays the number of shares purchased during 2014 and the maximum value of shares that may yet be purchased under the plan:
|
|
|
|
|
|
|
|
|
|
|
|
|
|
Maximum Value of |
|
|
|
|
Total |
|
|
|
|
|
|
Total Number of |
|
|
Shares that May Yet |
|
|||
|
|
Number of |
|
|
Average |
|
|
Shares Purchased as |
|
|
Be Purchased Under |
|
||||
|
|
Shares |
|
|
Price Paid |
|
|
Part of Publicly |
|
|
the Plan |
|
||||
|
|
Purchased |
|
|
Per Share |
|
|
Announced Plan |
|
|
(in 000’s) |
|
||||
|
October 22 to October 31 |
|
310,982 |
|
|
$ |
35.22 |
|
|
|
310,982 |
|
|
$ |
64,047 |
|
|
November 1 to November 30 |
|
190,289 |
|
|
$ |
37.16 |
|
|
|
190,289 |
|
|
$ |
56,977 |
|
|
December 1 to December 31 |
|
- |
|
|
$ |
- |
|
|
|
- |
|
|
$ |
56,977 |
|
|
Total |
|
501,271 |
|
|
$ |
35.96 |
|
|
|
501,271 |
|
|
$ |
56,977 |
|
This table excludes 80,772 shares we purchased for $3.2 million during the year ended December 31, 2014 related to employee withholding upon vesting of restricted stock.
NOTE 17. Selected Quarterly Financial Data (Unaudited)
The following table sets forth the selected quarterly financial data for each of the quarters in 2014 (in thousands, except per share amounts):
|
|
Quarter Ended |
|
|||||||||||||
|
|
March 31, |
|
|
June 30, |
|
|
September 30, |
|
|
December 31, |
|
||||
|
|
2014 |
|
|
2014 |
|
|
2014 |
|
|
2014 |
|
||||
|
Year Ended December 31, 2014: |
|
|
|
|
|
|
|
|
|
|
|
|
|
|
|
|
Revenue |
$ |
848,449 |
|
|
$ |
893,930 |
|
|
$ |
913,386 |
|
|
$ |
915,361 |
|
|
Gross margin |
|
88,744 |
|
|
|
98,585 |
|
|
|
93,196 |
|
|
|
89,910 |
|
|
Operating income |
|
20,496 |
|
|
|
30,927 |
|
|
|
7,677 |
|
|
|
24,777 |
|
|
Net income |
|
12,035 |
|
|
|
18,676 |
|
|
|
4,491 |
|
|
|
16,356 |
|
|
Basic earnings per share |
$ |
0.33 |
|
|
$ |
0.51 |
|
|
$ |
0.12 |
|
|
$ |
0.45 |
|
|
Diluted earnings per share |
$ |
0.33 |
|
|
$ |
0.51 |
|
|
$ |
0.12 |
|
|
$ |
0.45 |
|
The following table sets forth the selected quarterly financial data for each of the quarters in 2013 (in thousands, except per share amounts):
|
|
Quarter Ended |
|
|||||||||||||
|
|
March 31, |
|
|
June 30, |
|
|
September 30, |
|
|
December 31, |
|
||||
|
|
2013 |
|
|
2013 |
|
|
2013 |
|
|
2013 |
|
||||
|
Year Ended December 31, 2013: |
|
|
|
|
|
|
|
|
|
|
|
|
|
|
|
|
Revenue |
$ |
768,980 |
|
|
$ |
836,685 |
|
|
$ |
882,981 |
|
|
$ |
885,252 |
|
|
Gross margin |
|
87,338 |
|
|
|
95,473 |
|
|
|
93,124 |
|
|
|
95,088 |
|
|
Operating income |
|
24,737 |
|
|
|
30,464 |
|
|
|
31,295 |
|
|
|
27,251 |
|
|
Net income |
|
15,364 |
|
|
|
18,610 |
|
|
|
18,600 |
|
|
|
16,536 |
|
|
Basic earnings per share |
$ |
0.42 |
|
|
$ |
0.50 |
|
|
$ |
0.50 |
|
|
$ |
0.45 |
|
|
Diluted earnings per share |
$ |
0.42 |
|
|
$ |
0.50 |
|
|
$ |
0.50 |
|
|
$ |
0.45 |
|
NOTE 18. Subsequent Events
In January 2015 we entered into an agreement to finance tractors for $2.2 million using secured debt with a five year term at an interest rate of 2.26% and we entered into an agreement to finance containers for $7.0 million using secured debt with a five year term at an interest rate of 1.72%. Monthly payments of $0.2 million begin in February 2015.
49
|
Item 9. |
CHANGES IN AND DISAGREEMENTS WITH ACCOUNTANTS ON ACCOUNTING AND FINANCIAL DISCLOSURE |
None.
|
Item 9A. |
CONTROLS AND PROCEDURES |
MANAGEMENT’S REPORT ON DISCLOSURE CONTROLS AND PROCEDURES
As of December 31, 2014, an evaluation was carried out under the supervision and with the participation of our management, including our Chief Executive Officer and Chief Financial Officer, of the effectiveness of our disclosure controls and procedures as defined in Rule 13a-15(f) and Rule 15d-15(f) under the Securities Exchange Act of 1934. Based upon this evaluation, the Chief Executive Officer and Chief Financial Officer concluded that these disclosure controls and procedures were effective.
No significant changes were made in our internal control over financial reporting during the fourth quarter of 2014 that has materially affected, or is reasonably likely to materially affect, our internal control over financial reporting.
Because of its inherent limitations, internal control over financial reporting may not prevent or detect misstatements. Also, projections of any evaluation of effectiveness to future periods are subject to the risk that controls may become inadequate because of changes in conditions, or that the degree of compliance with the policies or procedures may deteriorate.
MANAGEMENT’S ANNUAL REPORT ON INTERNAL CONTROL OVER FINANCIAL REPORTING
Our management is responsible for establishing and maintaining adequate controls over financial reporting as defined in Rule 13a-15(f) of the Exchange Act. Under the supervision and with the participation of our management, including our Chief Executive Officer and our Chief Financial Officer, we conducted an evaluation of the effectiveness of our internal control over financial reporting as of December 31, 2014. Based on criteria established in Internal Control—Integrated Framework issued by the Committee of Sponsoring Organizations of the Treadway Commission (2013 framework) (the COSO criteria), management believes our internal control over financial reporting was effective as of December 31, 2014.
Management believes, however, that a control system, no matter how well designed and operated, cannot provide absolute assurance that the objectives of the control system are met, and no evaluation controls can provide absolute assurance that all control issues and instances of fraud, if any, within the Company have been detected.
Ernst & Young LLP, an independent registered public accounting firm, who audited and reported on the consolidated financial statements, included in this report, has issued an attestation report on the Company’s internal control over financial reporting.
50
REPORT OF INDEPENDENT REGISTERED PUBLIC ACCOUNTING FIRM ON INTERNAL CONTROL OVER FINANCIAL REPORTING
The Board of Directors and Stockholders of Hub Group, Inc.:
|
We have audited Hub Group, Inc.’s internal control over financial reporting as of December 31, 2014, based on criteria established in Internal Control—Integrated Framework issued by the Committee of Sponsoring Organizations of the Treadway Commission (2013 framework) (the COSO criteria). Hub Group, Inc.’s management is responsible for maintaining effective internal control over financial reporting, and for its assessment of the effectiveness of internal control over financial reporting included in the accompanying Management’s Annual Report on Internal Control Over Financial Reporting. Our responsibility is to express an opinion on the company’s internal control over financial reporting based on our audit. |
|
We conducted our audit in accordance with the standards of the Public Company Accounting Oversight Board (United States). Those standards require that we plan and perform the audit to obtain reasonable assurance about whether effective internal control over financial reporting was maintained in all material respects. Our audit included obtaining an understanding of internal control over financial reporting, assessing the risk that a material weakness exists, testing and evaluating the design and operating effectiveness of internal control based on the assessed risk, and performing such other procedures as we considered necessary in the circumstances. We believe that our audit provides a reasonable basis for our opinion. |
|
A company’s internal control over financial reporting is a process designed to provide reasonable assurance regarding the reliability of financial reporting and the preparation of financial statements for external purposes in accordance with generally accepted accounting principles. A company’s internal control over financial reporting includes those policies and procedures that (1) pertain to the maintenance of records that, in reasonable detail, accurately and fairly reflect the transactions and dispositions of the assets of the company; (2) provide reasonable assurance that transactions are recorded as necessary to permit preparation of financial statements in accordance with generally accepted accounting principles, and that receipts and expenditures of the company are being made only in accordance with authorizations of management and directors of the company; and (3) provide reasonable assurance regarding prevention or timely detection of unauthorized acquisition, use, or disposition of the company’s assets that could have a material effect on the financial statements. |
|
Because of its inherent limitations, internal control over financial reporting may not prevent or detect misstatements. Also, projections of any evaluation of effectiveness to future periods are subject to the risk that controls may become inadequate because of changes in conditions, or that the degree of compliance with the policies or procedures may deteriorate. |
|
In our opinion, Hub Group, Inc. maintained, in all material respects, effective internal control over financial reporting as of December 31, 2014, based on the COSO criteria. |
|
We also have audited, in accordance with the standards of the Public Company Accounting Oversight Board (United States), the consolidated balance sheets of Hub Group, Inc. as of December 31, 2014 and 2013, and the related consolidated statements of income and comprehensive income, stockholders’ equity and cash flows for each of the three years in the period ended December 31, 2014 of Hub Group, Inc. and our report dated February 27, 2015 expressed an unqualified opinion thereon. |
Ernst & Young LLP
Chicago, Illinois
February 27, 2015
51
Item 9B. OTHER INFORMATION
None.
PART III
|
Item 10. |
DIRECTORS, EXECUTIVE OFFICERS AND CORPORATE GOVERNANCE |
A list of our executive officers and biographical information appears in Part I of this report. Information about our directors, and additional information about our executive officers, may be found under the caption "Election of Directors" in our proxy statement for the 2015 annual meeting of stockholders to be held May 8, 2015 (the "Proxy Statement"). Information about our Audit Committee may be found under the captions "Meetings and Committees of the Board " and "Audit Committee Report” in the Proxy Statement. Information about the procedures by which security holders may recommend nominees to the Board may be found under the caption "Nomination of Directors" in the Proxy Statement. That information is incorporated herein by reference.
The information in the Proxy Statement set forth under the captions "Section 16(a) Beneficial Ownership Reporting Compliance" and "Code of Ethics" is incorporated herein by reference.
|
Item 11. |
EXECUTIVE COMPENSATION |
The section entitled “Compensation of Directors and Executive Officers” appearing in our Proxy Statement sets forth certain information with respect to the compensation of our management and is incorporated herein by reference.
|
Item 12. |
SECURITY OWNERSHIP OF CERTAIN BENEFICIAL OWNERS AND MANAGEMENT AND RELATED STOCKHOLDER MATTERS |
The section entitled “Ownership of the Capital Stock of the Company” appearing in our Proxy Statement sets forth certain information with respect to the ownership of our Common Stock and is incorporated herein by reference.
Equity Compensation Plan Information
The following chart contains certain information regarding the Company’s Long-Term Incentive Plans:
|
Plan Category |
|
Number of securities |
|
|
Weighted-average |
|
|
Number of securities |
|
|||
|
Equity compensation plans approved by security holders |
|
|
— |
|
|
$ |
— |
|
|
|
726,640 |
|
|
Equity compensation plans not approved by security holders |
|
|
— |
|
|
|
— |
|
|
|
— |
|
|
Total |
|
|
— |
|
|
$ |
— |
|
|
|
726,640 |
|
|
Item 13. |
CERTAIN RELATIONSHIPS AND RELATED TRANSACTIONS, AND DIRECTOR INDEPENDENCE |
The sections entitled “Review of Related Party Transactions,” Transactions with Related Persons” and “Meetings and Committees of the Board” appearing in our Proxy Statement set forth certain information with respect to certain business relationships and transactions between us and our directors and officers and the independence of our directors and is incorporated herein by reference.
|
Item 14. |
PRINCIPAL ACCOUNTANT FEES AND SERVICES |
The section entitled “Principal Accountant Fees and Services” appearing in our Proxy Statement sets forth certain information with respect to certain fees we have paid to our principal accountant for services and is incorporated herein by reference
52
PART IV
|
Item 15. |
EXHIBITS AND FINANCIAL STATEMENT SCHEDULES |
(a) Financial Statements
The following consolidated financial statements of the Registrant are included under Item 8 of this Form 10-K:
Report of Independent Registered Public Accounting Firm
Consolidated Balance Sheets - December 31, 2014 and December 31, 2013
Consolidated Statements of Income and Comprehensive Income - Years ended December 31, 2014, December 31, 2013 and December 31, 2012
Consolidated Statements of Stockholders’ Equity - Years ended December 31, 2014, December 31, 2013 and December 31, 2012
Consolidated Statements of Cash Flows - Years ended December 31, 2014, December 31, 2013 and December 31, 2012
Notes to Consolidated Financial Statements
(b) Financial Statement Schedules
The following financial statement schedules of Hub Group, Inc. are filed as part of this report and should be read in conjunction with the consolidated financial statements of Hub Group, Inc.:
|
|
|
Page |
|
II. Valuation and qualifying accounts and reserves |
|
S-1 |
All other schedules are omitted because they are not required, are not applicable, or the required information is shown in the consolidated financial statements or notes thereto.
(c) Exhibits
The exhibits included as part of this Form 10-K are set forth in the Exhibit Index immediately preceding such Exhibits and are incorporated herein by reference.
53
SIGNATURES
Pursuant to the requirements of Section 13 or 15(d) of the Securities Exchange Act of 1934, the registrant has duly caused this report to be signed on its behalf by the undersigned, thereunto duly authorized.
|
Date: February 27, 2015 |
|
HUB GROUP, INC. |
||
|
|
|
|
||
|
|
|
By |
|
/s/ DAVID P. YEAGER |
|
|
|
|
|
David P. Yeager |
|
|
|
|
|
Chairman and Chief Executive Officer |
Pursuant to the requirements of the Securities Exchange Act of 1934, this report has been signed below by the following persons in the capacities and on the dates indicated:
|
|
|
Title |
|
Date |
|
|
|
|
|
|
|
/s/ David P. Yeager
David P. Yeager |
|
Chairman and Chief Executive Officer |
|
February 27, 2015 |
|
|
|
|
||
|
/s/ Mark A. Yeager
Mark A. Yeager |
|
Vice Chairman, President and Chief Operating Officer |
|
February 27, 2015 |
|
|
|
|
||
|
/s/ Terri A. Pizzuto
Terri A. Pizzuto |
|
Executive Vice President, Chief Financial Officer and Treasurer (Principal Financial and Accounting Officer) |
|
February 27, 2015 |
|
|
|
|
||
|
/s/ Charles R. Reaves
Charles R. Reaves |
|
Director |
|
February 27, 2015 |
|
|
|
|
||
|
/s/ Martin P. Slark
Martin P. Slark |
|
Director |
|
February 27, 2015 |
|
|
|
|
||
|
/s/ Gary D. Eppen
Gary D. Eppen |
|
Director |
|
February 27, 2015 |
|
|
|
|
||
|
/s/ Jonathan P. Ward
Jonathan P. Ward |
|
Director |
|
February 27, 2015 |
HUB GROUP, INC.
VALUATION AND QUALIFYING ACCOUNTS AND RESERVES
Allowance for uncollectible trade accounts
|
|
Balance at |
|
|
Charged to |
|
|
Charged to |
|
|
|
|
|
|
Balance at |
|
||||
|
Year Ended |
Beginning of |
|
|
Costs & |
|
|
Other |
|
|
|
|
|
|
End of |
|
||||
|
December 31: |
Year |
|
|
Expenses |
|
|
Accounts (1) |
|
|
Deductions (2) |
|
|
Year |
|
|||||
|
|
|
|
|
|
|
|
|
|
|
|
|
|
|
|
|
|
|
|
|
|
2014 |
$ |
7,446,000 |
|
|
$ |
129,000 |
|
|
$ |
(565,000 |
) |
|
$ |
(20,000 |
) |
|
$ |
6,990,000 |
|
|
2013 |
$ |
6,689,000 |
|
|
$ |
662,000 |
|
|
$ |
142,000 |
|
|
$ |
(47,000 |
) |
|
$ |
7,446,000 |
|
|
2012 |
$ |
7,730,000 |
|
|
$ |
208,000 |
|
|
$ |
(623,000 |
) |
|
$ |
(626,000 |
) |
|
$ |
6,689,000 |
|
Deferred tax valuation allowance
|
|
Balance at |
|
|
Charged to |
|
|
Balance at |
|
|||
|
Year Ended |
Beginning of |
|
|
Costs & |
|
|
End of |
|
|||
|
December 31: |
Year |
|
|
Expenses |
|
|
Year |
|
|||
|
|
|
|
|
|
|
|
|
|
|
|
|
|
2014 |
$ |
108,000 |
|
|
$ |
- |
|
|
$ |
108,000 |
|
|
2013 |
$ |
122,000 |
|
|
$ |
(14,000 |
) |
|
$ |
108,000 |
|
|
2012 |
$ |
108,000 |
|
|
$ |
14,000 |
|
|
$ |
122,000 |
|
|
(1) |
Expected customer account adjustments charged to revenue and write-offs, net of recoveries. |
|
(2) |
Represents bad debt recoveries. |
S-1
INDEX TO EXHIBITS
|
Number |
|
Exhibit |
|
3.1 |
|
Amended and Restated Certificate of Incorporation of the Registrant (incorporated by reference to Exhibit 3.1 to the Registrant’s quarterly report on Form 10-Q filed July 23, 2007, File No. 000-27754) |
|
3.2 |
|
By-Laws of the Registrant (incorporated by reference to Exhibit 3.2 to the Registrant’s registration statement on Form S-1, File No. 33-90210) |
|
10.1 |
|
Amended and Restated Limited Partnership Agreement of Hub City Canada, L.P. (incorporated by reference to Exhibit 10.2 to the Registrants report on Form 10-K dated March 26, 1997 and filed March 27, 1997, File No 000-27754) |
|
10.2 |
|
Stockholders’ Agreement (incorporated by reference to Exhibit 10.7 to the Registrant’s report on Form 10-K dated March 26, 1997 and filed March 27, 1997, File No. 000-27754) |
|
10.3* |
|
Hub Group’s Nonqualified Deferred Compensation Plan Basic Plan Document as amended and restated as of January 1, 2008 (incorporated by reference to Exhibit 10.4 to the Registrant’s report on Form 10-K dated February 21, 2008 and filed February 22, 2008, File No. 000-27754) |
|
10.4* |
|
Hub Group’s Nonqualified Deferred Compensation Plan Adoption Agreement as amended and restated as of January 1, 2008 (incorporated by reference to Exhibit 10.5 to the Registrant’s report on Form 10-K dated February 21, 2008 and filed February 22, 2008, File No. 000-27754) |
|
10.5* |
|
Description of Executive Officer cash compensation for 2015 |
|
10.6 |
|
Director compensation for 2015 |
|
10.7* |
|
Hub Group’s 2002 Long Term Incentive Plan (as amended and restated effective May 7, 2007) (incorporated by reference from Appendix B to the Registrant’s definitive proxy statement on Schedule 14A dated and filed March 26, 2007) |
|
10.8 |
|
Amended and Restated Credit Agreement, dated December 12, 2013, among the Registrant and Hub City Terminals, Inc., as borrowers, Comtrak Logistics, Inc. and Mode Transportation, LLC, as guarantors, and Bank of Montreal and BMO Harris Bank, N.A. (incorporated by reference to Exhibit 10.1 to the Registrant’s report on Form 8-K dated December 12, 2013 and filed December 13, 2013, File No. 000-27754) |
|
10.9 |
|
Lease Agreement dated as of May 10, 2005, between Banc of America Leasing & Capital, LLC and Hub City Terminals, Inc., with form of Schedule thereto (incorporated by reference to Exhibit 10.1 to the Registrant’s report on Form 8-K dated May 10, 2005 and filed May 16, 2005, File No. 000-27754) |
|
10.10 |
|
Guaranty of Corporation, dated as of May 10, 2005, made by Registrant to, and for the benefit of, Banc of America Leasing & Capital, LLC (incorporated by reference to Exhibit 10.2 to the Registrant’s report on Form 8-K dated May 10, 2005 and filed May 16, 2005, File No. 000-27754) |
|
10.11 |
|
Form of Terms of Restricted Stock Award under Hub Group, Inc. 2002 Long-Term Incentive Plan (incorporated by reference to Exhibit 10.2 to the Registrant’s report on Form 8-K dated May 22, 2006 and filed May 26, 2006, File No. 000-27754) |
|
14 |
|
Hub Group’s Code of Business Conduct and Ethics (incorporated by reference from Exhibit 99.2 to the Registrant’s report on Form 10-K dated March 12, 2003 and filed on March 13, 2003, File No. 000-27754) |
|
21 |
|
Subsidiaries of the Registrant |
|
23.1 |
|
Consent of Ernst & Young LLP |
|
31.1 |
|
Certification of David P. Yeager, Chairman and Chief Executive Officer, Pursuant to Rule 13a-14(a) promulgated under the Securities Exchange Act of 1934 |
|
31.2 |
|
Certification of Terri A. Pizzuto, Executive Vice President, Chief Financial Officer and Treasurer, Pursuant to Rule 13a-14(a) promulgated under the Securities Exchange Act of 1934 |
|
32.1 |
|
Certification of David P. Yeager and Terri A. Pizzuto, Chief Executive Officer and Chief Financial Officer respectively, Pursuant to 18 U.S.C. Section 1350 |
|
Number |
|
Exhibit |
|
101 |
|
The following financial statements from our Annual Report on Form 10-K for the year ended December 31, 2014, filed on February 27, 2015, formatted in XBRL: (i) Consolidated Balance Sheets as of December 31, 2014 and 2013, (ii) Consolidated Statements of Income and Comprehensive Income for the years ended December 31, 2014, 2013, and 2012, (iii) Consolidated Statements of Cash Flows for the years ended December 31, 2014, 2013, and 2012, (iv) Consolidated Statements of Stockholders’ Equity for the years ended 2014, 2013, and 2012, and (v) the Notes to the Consolidated Financial Statements. |
|
· |
Management contract or compensatory plan or arrangement. |