Attached files
| file | filename |
|---|---|
| EX-99.3 - EXHIBIT 99.3 - UIL HOLDINGS CORP | ex99_3.htm |
| EX-99.1 - EXHIBIT 99.1 - UIL HOLDINGS CORP | ex99_1.htm |
| 8-K - UIL HOLDINGS CORPORATION 8-K 2-24-2015 - UIL HOLDINGS CORP | form8k.htm |
Exhibit 99.2

FY ‘14 Earnings * FY & 4Q ‘14 Earnings PresentationFebruary 27, 2015 Exhibit 99.2

FY ‘14 Earnings * Forward Looking Statements Certain statements contained herein, regarding matters that are not historical facts, are forward-looking statements (as defined in the Private Securities Litigation Reform Act of 1995). These include statements regarding management’s intentions, plans, beliefs, expectations or forecasts for the future. Such forward-looking statements are based on our expectations and involve risks and uncertainties; consequently, actual results may differ materially from those expressed or implied in the statements. Such risks and uncertainties include, but are not limited to, general economic conditions, conditions in the debt and equity markets, legislative and regulatory changes, changes in demand for electricity, gas and other products and services, unanticipated weather conditions, changes in accounting principles, policies or guidelines, and other economic, competitive, governmental, and technological factors affecting the operations, markets, products and services of our subsidiaries. All such factors are difficult to predict, contain uncertainties that may materially affect our actual results and are beyond our control. You should not place undue reliance on the forward-looking statements, each speaks only as of the date hereof and we undertake no obligation to revise or update such statements to reflect events or circumstances after the date hereof or to reflect the occurrence of unanticipated events or circumstances. New factors emerge from time to time and it is not possible for us to predict all such factors, nor can we assess the impact of each such factor on the business or the extent to which any factor, or combination of factors, may cause actual results to differ materially from those contained in any forward-looking statements. The foregoing and other factors are discussed and should be reviewed in our Annual Report on Form 10-K for the year ended December 31, 2014, and other subsequent filings with the Securities and Exchange Commission. UIL Holdings believes that a breakdown presented on a net income and per share basis is useful in understanding the change in the consolidated results of operations for UIL Holdings from one reporting period to another. UIL Holdings presents such per share amounts by taking the net income determined in accordance with generally accepted accounting principles (GAAP), and then dividing the results by the average number of diluted shares of UIL Holdings common stock outstanding for the periods presented. Any such amounts provided are provided for informational purposes only and are not intended to be used to calculate "Pro-forma" amounts.UIL Holdings also believes presenting earnings excluding certain non-recurring items, as well as earnings per share (EPS) information by line of business, including as presented above in the net income discussion and in the earnings guidance section, are useful in understanding and evaluating actual and projected financial performance and contribution of UIL’s businesses. EPS by business is calculated by taking the pre-tax amounts determined in accordance with GAAP of each line of business, and applying the effective statutory federal and state tax rate and then dividing the results by the average number of diluted shares of UIL common stock outstanding for the periods presented. Total consolidated EPS is a GAAP-basis presentation. James TorgersonPresident and Chief Executive OfficerRichard NicholasExecutive Vice President and Chief Financial Officer Visit our website at www.UIL.com

FY ‘14 Earnings * FY & 4Q ‘14 Earnings Summary ’14 consolidated net income was $109.6M, or $1.92 per diluted share, in ’14, compared to $115.3M, or $2.18 per diluted share, in ’13Consolidated net income was $32.3M, or $0.56 per diluted share, for the 4Q ‘14, compared to $40.4M, or $0.71 per diluted share, for the same period in ‘13Consolidated earnings for ’14 and ‘13 reflect non-recurring after-tax items, as follows:Acquisition-related expenses recorded in ‘14 associated with the now-terminated proposed acquisition of Philadelphia Gas WorksReserves recorded in ‘14 and ‘13 related to the transmission ROE proceedings pending at the FERCRegulatory write-off associated with certain Generation Service Charge revenues and expenses recorded in ‘14Electric distribution rate case disallowances recorded in ’13Excluding non-recurring items, consolidated earnings were:

FY ‘14 Earnings * Strategic Initiatives Pursue utility growth Gas distribution expansionElectric and gas distribution infrastructure replacements & improvementsElectric and gas transmission initiativesRegulated distribution resourcesOther business development opportunitiesUnregulated distribution resources Public policy enabling investments/opportunitiesPursue opportunistic M&A

FY ‘14 Earnings * $4.2B 10-yr Capital Expenditure Plan Amounts may not add due to rounding 2015P-2024P

FY ‘14 Earnings * Rate Base Growth * Includes Distributed Energy Resources** Includes 338(h)(10) electionAmounts may not add due to rounding ‘15-’19 Rate Base CAGR 7.7% Gas Distribution:8.0%Electric Transmission:7.1%Electric Distribution*:7.7% $M

FY ‘14 Earnings * Successfully converted 16,266 households & businesses in ’14: 102% of ‘14 goalNatural gas is more cost effective than home heating oil and the benefits of natural gas remain advantageous for our customersCurrent home heating oil prices will make it more challenging to get customers to switch to natural gasComprehensive Energy Strategy (CES) goals were set when the price advantage of natural gas was 60-75% of home heating oil; home heating oil prices have declined since then ‘15 target is to convert at least 12,000 households & businesses* Acquisition Nov. ‘10 Gas Heating Customers # of Conversions

FY ‘14 Earnings * Regulatory Update CT’s CES - Settlement Settlement approved by PURA on 1/14/15A portion of non-firm margin will be used to offset CIACCustomer aggregation methodology defined by proposing a two-mile radius to group customers into potential gas expansion projectsStreamlines certain reporting requirementsGeneration Service Charge – UI*Final decision issued on 11/12/14 allowed for partial recovery of certain revenues and expenses relating to the period from ‘04 through ‘13UI filed an appeal on 12/23/14CNG Rate Case AppealFinal decision issued on 1/22/14 ordered a private letter ruling (PLR) request on 338 (h)(10) issue CT OCC filed an appeal of PURA’s rate case decision, including the PLR requirementAt PURA’s request, CNG and CT OCC entered into settlement discussions, which are ongoing * An after-tax write-off of $2.3M was recorded in 4Q ‘14

FY ‘14 Earnings * Transmission ROE Proceeding Challenge to Transmission (T) Base ROE: “206” complaints filed at the FERC claiming that the current approved base ROE of 11.14% on T investments is not just and reasonable 10.57% base ROE10.57% base ROE 10/16/14 and forward (subject to 2nd & 3rd Complaints)11.74% cap on total company T ROE 2nd & 3rd Complaints consolidated for hearing purposes; different time frames for ROE analysis remainTestimony filedHearings to begin in June ‘15ALJ decision should be rendered within 12 months of the commencement of hearing procedures, or by 11/30/15Decision by FERC estimated by 9/30/16 After-tax reserves of $1.5M & $3.4M were recorded in ’13 & ’14, respectively

FY ‘14 Earnings * FY & 4Q ‘14 Financial Results by Segment
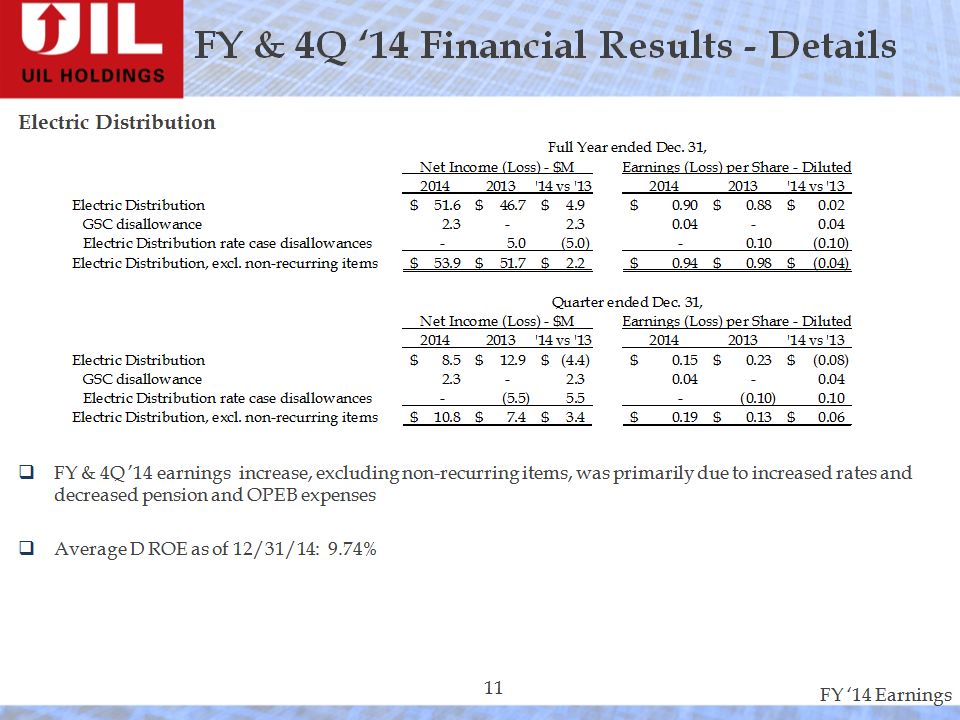
FY ‘14 Earnings * Electric DistributionFY & 4Q ’14 earnings increase, excluding non-recurring items, was primarily due to increased rates and decreased pension and OPEB expenses Average D ROE as of 12/31/14: 9.74% FY & 4Q ‘14 Financial Results - Details
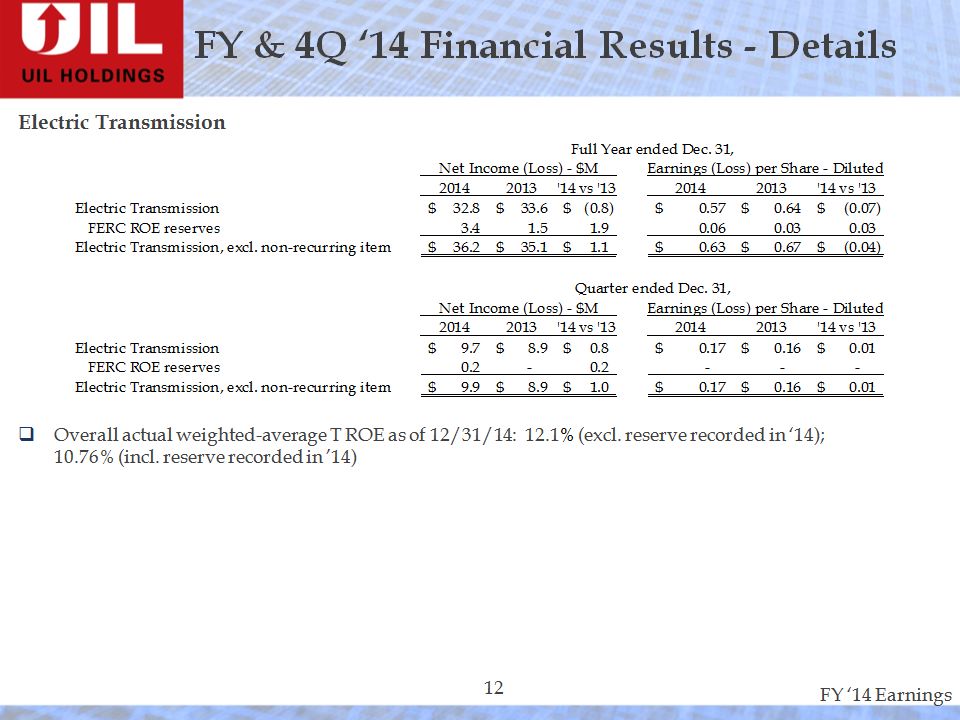
FY ‘14 Earnings * FY & 4Q ‘14 Financial Results - Details Electric TransmissionOverall actual weighted-average T ROE as of 12/31/14: 12.1% (excl. reserve recorded in ‘14); 10.76% (incl. reserve recorded in ’14)

FY ‘14 Earnings * Gas DistributionFY ’14 earnings increase was primarily due to increased rates at CNG, increased normalized usage per customer (NUPC), customer growth and colder weather, partially offset by increased uncollectible expense and increased corporate charges4Q ‘14 earnings decrease was primarily due to warmer weather in the 4Q ’14 compared to the 4Q ‘13, increased uncollectible expense and increased corporate charges, partially offset by increased rates and increased NUPCWeighted average heating degree days compared to normal & same periods in ‘13 FY & 4Q ‘14 Financial Results - Details

FY & 4Q ‘14 Financial Results - Details Gas Distribution – cont.Sales volumes have increased due to increased NUPCImpact of weather, NUPC and customer growth – 4Q & FY ‘14 compared to the same periods in ’13Avg. ROEs* as of 12/31/14: SCG 8.47%, CNG 9.86%Avg. weather normalized ROEs* as of 12/31/14: SCG 7.90%, CNG 9.64% * Including impact of 338(h)(10)
FY ‘14 Earnings * FY & 4Q ‘14 Financial Results - Details Gas Distribution – cont.Sales volumes have increased due to increased NUPCImpact of weather, NUPC and customer growth – 4Q & FY ‘14 compared to the same periods in ’13Avg. ROEs* as of 12/31/14: SCG 8.52%, CNG 9.86%Avg. weather normalized ROEs* as of 12/31/14: SCG 7.96%, CNG 9.64% * Including impact of 338(h)(10)

FY ‘14 Earnings * CorporateFY ’14 decrease in costs, excluding non-recurring acquisition-related expenses, was primarily due to an increase in the return on shared capital assets FY & 4Q ‘14 Financial Results - Details

FY ‘14 Earnings * 2015 Earnings Guidance

FY ‘14 Earnings * 2015 Earnings Guidance Assumptions Electric Distribution (including GenConn)Retail revenue increase from the 2nd year of rates that went into effect from its ‘13 rate case proceedingIncreases in pension and postretirement costs of approx. $6.0M, pre-tax, or $0.06 per diluted share, primarily driven by a decrease in the discount rateHigher allocation of UIL corporate charges for earned returns on shared capital assets of approx. $6.1M, pre-tax, or $0.06 per diluted share, (while unfavorable for electric distribution, there is an earnings offset in UIL corporate) Electric TransmissionPrimarily driven by increased rate base and earnings from increased investments in the NEEWS transmission projectsExcludes any further potential impacts from the ROE proceedings pending at the FERC
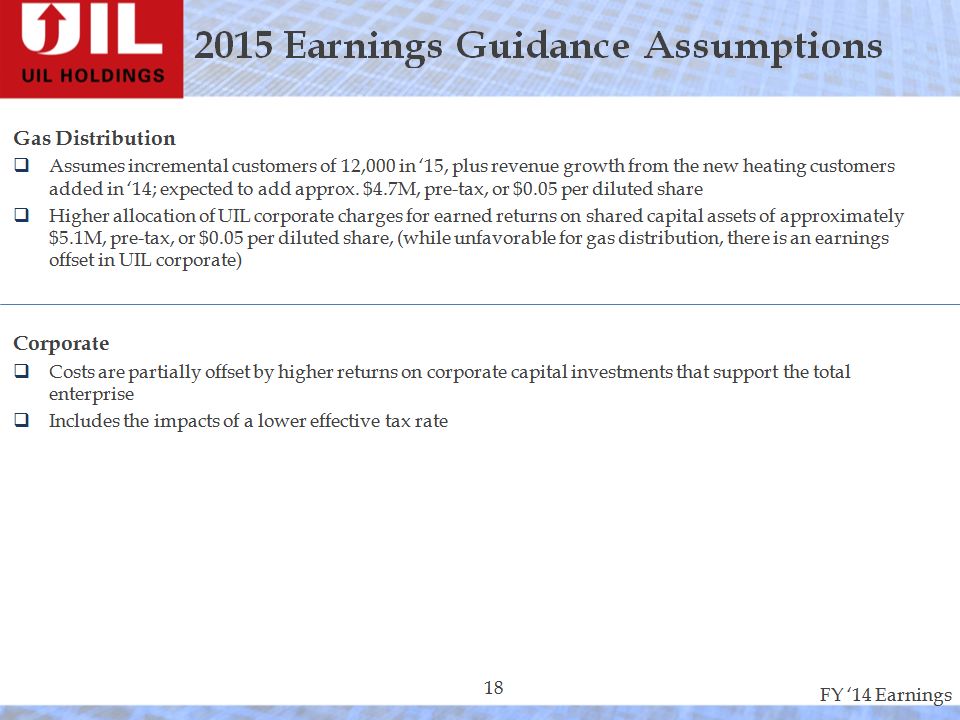
FY ‘14 Earnings * 2015 Earnings Guidance Assumptions Gas DistributionAssumes incremental customers of 12,000 in ‘15, plus revenue growth from the new heating customers added in ‘14; expected to add approx. $4.7M, pre-tax, or $0.05 per diluted share Higher allocation of UIL corporate charges for earned returns on shared capital assets of approximately $5.1M, pre-tax, or $0.05 per diluted share, (while unfavorable for gas distribution, there is an earnings offset in UIL corporate) CorporateCosts are partially offset by higher returns on corporate capital investments that support the total enterpriseIncludes the impacts of a lower effective tax rate

FY ‘14 Earnings * Questions