Attached files
| file | filename |
|---|---|
| EX-31.2 - EX-31.2 - SYNAGEVA BIOPHARMA CORP | d856934dex312.htm |
| EX-31.1 - EX-31.1 - SYNAGEVA BIOPHARMA CORP | d856934dex311.htm |
| EX-21.1 - EX-21.1 - SYNAGEVA BIOPHARMA CORP | d856934dex211.htm |
| EX-32.1 - EX-32.1 - SYNAGEVA BIOPHARMA CORP | d856934dex321.htm |
| EX-23.1 - EX-23.1 - SYNAGEVA BIOPHARMA CORP | d856934dex231.htm |
| EX-10.19 - EX-10.19 - SYNAGEVA BIOPHARMA CORP | d856934dex1019.htm |
| EXCEL - IDEA: XBRL DOCUMENT - SYNAGEVA BIOPHARMA CORP | Financial_Report.xls |
Table of Contents
UNITED STATES
SECURITIES AND EXCHANGE COMMISSION
Washington, D.C. 20549
FORM 10-K
(Mark One)
| þ | ANNUAL REPORT PURSUANT TO SECTION 13 OR 15(d) OF THE SECURITIES EXCHANGE ACT OF 1934 |
For the fiscal year ended December 31, 2014
or
| ¨ | TRANSITION REPORT PURSUANT TO SECTION 13 OR 15(d) OF THE SECURITIES EXCHANGE ACT OF 1934 |
SYNAGEVA BIOPHARMA CORP.
(Exact Name of Registrant as Specified in Charter)
| Delaware | 0-23155 | 56-1808663 | ||
| (State or Other Jurisdiction of Incorporation) |
(Commission File Number) |
(I.R.S. Employer Identification No.) |
33 Hayden Avenue,
Lexington, Massachusetts 02421
(Address of Principal Executive Offices) (Zip Code)
Registrant’s telephone number, including area code: (781) 357-9900
Securities registered pursuant to Section 12(b) of the Act:
| Title of each class |
Name of each exchange on which registered | |
| Common Stock, $0.001 par value | Nasdaq Global Select Market |
Securities registered pursuant to Section 12(g) of the Act:
None.
Indicate by check mark if the registrant is a well-known seasoned issuer, as defined in Rule 405 of the Securities Act. Yes þ No ¨
Indicate by check mark if the registrant is not required to file reports pursuant to Section 13 or Section 15(d) of the Act. Yes ¨ No þ
Indicate by check mark whether the registrant (1) has filed all reports required to be filed by Section 13 or 15(d) of the Securities Exchange Act of 1934 during the preceding 12 months (or for such shorter period that the registrant was required to file such reports), and (2) has been subject to such filing requirements for the past 90 days. Yes þ No ¨
Indicate by check mark whether the registrant has submitted electronically and posted on its corporate Web site, if any, every Interactive Data File required to be submitted and posted pursuant to Rule 405 of Regulation S-T (§ 232.405 of this chapter) during the preceding 12 months (or for such shorter period that the registrant was required to submit and post such files). Yes þ No ¨
Indicate by check mark if disclosure of delinquent filers pursuant to Item 405 of Regulation S-K (§ 229.405 of this chapter) is not contained herein, and will not be contained, to the best of registrant’s knowledge, in definitive proxy or information statements incorporated by reference in Part III of this Form 10-K or any amendment to this Form 10-K. þ
Indicate by check mark whether the registrant is a large accelerated filer, an accelerated filer, a non-accelerated filer, or a smaller reporting company. See the definitions of “large accelerated filer,” “accelerated filer” and “smaller reporting company” in Rule 12b-2 of the Exchange Act. (Check one):
| Large accelerated filer þ | Accelerated filer ¨ | Non-accelerated filer ¨ | Smaller reporting company ¨ | |||
| (Do not check if a smaller reporting company) |
Indicate by check mark whether the registrant is a shell company (as defined in Rule 12b-2 of the Exchange Act). Yes ¨ No þ
The aggregate market value of the voting stock held by non-affiliates of the registrant (based on the last sale price of such stock as reported by The NASDAQ Stock Market, LLC on its NASDAQ Global Select Market on June 30, 2014) was approximately $2.3 billion. The number of shares of the registrant’s common stock outstanding as of February 20, 2015 was 36,958,276.
Documents Incorporated by Reference
Portions of the registrant’s definitive proxy statement to be used in connection with its 2014 annual meeting of stockholders are incorporated by reference into Part III.
Table of Contents
| PART I | ||||||
| Item 1. |
4 | |||||
| Item 1A. |
19 | |||||
| Item 1B. |
38 | |||||
| Item 2. |
38 | |||||
| Item 3. |
38 | |||||
| Item 4. |
38 | |||||
| PART II | ||||||
| Item 5. |
Market for Registrant’s Common Equity, Related Stockholder Matters and Issuer Purchases of Equity Securities | 39 | ||||
| Item 6. |
41 | |||||
| Item 7. |
Management’s Discussion and Analysis of Financial Condition and Results of Operations |
42 | ||||
| Item 7A. |
55 | |||||
| Item 8. |
55 | |||||
| Item 9. |
Changes in and Disagreements with Accountants on Accounting and Financial Disclosure |
55 | ||||
| Item 9A. |
55 | |||||
| Item 9B. |
56 | |||||
| PART III | ||||||
| Item 10. |
57 | |||||
| Item 11. |
57 | |||||
| Item 12. |
Security Ownership of Certain Beneficial Owners and Management and Related Stockholder Matters | 57 | ||||
| Item 13. |
Certain Relationships and Related Transactions, and Director Independence |
57 | ||||
| Item 14. |
57 | |||||
| PART IV | ||||||
| Item 15. |
58 | |||||
| 59 | ||||||
2
Table of Contents
FORWARD-LOOKING STATEMENTS
This Annual Report on Form 10-K contains forward-looking statements within the meaning of Section 27A of the Securities Act of 1933, as amended (the Securities Act) and Section 21E of the Securities and Exchange Act of 1934, as amended (the Exchange Act). These statements include, but are not limited to, statements regarding our development programs, our capabilities, our goals, the expected timeline for achievement of our clinical milestones, the expected properties and benefits of our product candidates, the timing of, and potential results from, clinical and other studies, the expected timing and content of regulatory actions, the size of the market for our products and our financial results. Any statements about our expectations, beliefs, plans, objectives, assumptions or future events or performance are not historical facts and may be forward-looking. These statements often, but not always, include the use of words or phrases such as “anticipate,” “estimate,” “plan,” “project,” “continuing,” “ongoing,” “expect,” “management believes,” “we believe,” “we intend” and similar words or phrases. Accordingly, these statements involve estimates, assumptions and uncertainties that could cause actual results to differ materially from those expressed or implied in them. Any forward-looking statements are qualified in their entirety by reference to the factors discussed in this report or incorporated by reference.
Because the risk factors discussed in this Annual Report on Form 10-K, and other risk factors of which we are not aware, could cause actual results or outcomes to differ materially from those expressed in any forward-looking statements made by or on behalf of us, you should not place undue reliance on any such forward-looking statements. These statements are subject to risks and uncertainties, known and unknown, which could cause actual results and developments to differ materially from those expressed or implied in such statements. We have included important factors in the cautionary statements included in this report, particularly under Item 1A “Risk Factors” that we believe could cause actual results or events to differ materially from the forward-looking statements that we make. These and other risks may also be detailed and modified or updated in our reports and other documents filed with the Securities and Exchange Commission (SEC) from time to time under the Securities Act and/or the Exchange Act. You are encouraged to read these filings as they are made.
Further, any forward-looking statement speaks only as of the date on which it is made, and we undertake no obligation to update any forward-looking statement or statements to reflect events or circumstances after the date on which such statement is made or to reflect the occurrence of unanticipated events. New factors emerge from time to time, and it is not possible for us to predict which factors will arise. In addition, we cannot assess the impact of each factor on our business or the extent to which any factor, or combination of factors, may cause actual results to differ materially from those contained in any forward-looking statements.
NOTE REGARDING COMPANY REFERENCES
All references in this Annual Report on Form 10-K to “we,” “us” and “our” refer to Synageva BioPharma Corp. and its consolidated subsidiaries unless the context requires otherwise. Synageva BioPharma™ and Kanuma™ are trademarks of Synageva BioPharma Corp. FUZEON® , is a registered trademark of Hoffmann-La Roche, Inc.
3
Table of Contents
| ITEM 1. | OUR BUSINESS |
Overview
We are a biopharmaceutical company focused on the discovery, development and commercialization of therapeutic products for patients with rare diseases. We have a pipeline of protein therapeutic programs for rare diseases with unmet medical need which are at various stages of development. We are planning for a global launch of our lead product, sebelipase alfa for lysosomal acid lipase deficiency (LAL Deficiency). Kanuma™ is the proposed brand name for sebelipase alfa.
We have an active investigational new drug application (IND) with the U.S. Food & Drug Administration (FDA) to evaluate our second program, SBC-103, a first-mover enzyme replacement therapy program for mucopolysaccharidosis IIIB (MPS IIIB, also known as Sanfilippo B syndrome). We have begun dosing patients with MPS IIIB in a Phase 1/2 study investigating intravenous administration of SBC-103 and plan to report preliminary data from this study in the second half of 2015.
Our third pipeline program, SBC-105, is a first-mover enzyme therapy in preclinical development for rare disorders of calcification, including the first planned target indication for generalized calcification in infants (GACI). We have additional first-mover and potentially bio-superior protein therapeutic pipeline programs for other rare diseases at different stages of preclinical development. We own the worldwide commercial rights to all of our pipeline programs.
In addition to progressing our current programs, we continue to build our global commercial and medical affairs infrastructure, expand our manufacturing capabilities and accelerate the development and commercialization of rare disease programs using our proprietary technology platform and other technologies. We are focused on hiring and retaining a highly skilled team that has extensive experience and specific skill sets relating to the selection, development and commercialization of therapies for life-threatening rare diseases.
Sebelipase alfa (Kanuma™) and LAL Deficiency
Disease Overview
LAL Deficiency is a serious, underdiagnosed rare disease that manifests with significant morbidity and early mortality. LAL Deficiency is caused by genetic mutations that result in decreased LAL enzyme activity in the lysosomes across multiple body tissues, leading to the buildup of fatty material in the liver, blood vessel walls and other tissues. LAL Deficiency causes progressive and multisystemic organ damage including hepatic cirrhosis and accelerated atherosclerosis that can lead to sudden and unpredictable clinical complications. LAL Deficiency often manifests in childhood but can be diagnosed at all ages with a simple blood test. Infants presenting with LAL Deficiency show very rapid disease progression, with death usually occurring in the first six months of life.
Based on prevalence estimates published in the medical literature, we estimate there are at least 3,000 children and adults with LAL Deficiency in North America, South America, Europe, Japan and parts of the Middle East (the “major reimbursable markets”). The physician target audience for LAL Deficiency consists of pediatric hepatologists and gastroenterologists, as well as lipidologists.
About Kanuma
Kanuma is a recombinant form of the human LAL enzyme that we are developing as an enzyme replacement therapy for LAL Deficiency. Kanuma has been granted orphan designation by the FDA, the European Medicines Agency (EMA), and the Japanese Ministry of Health, Labour and Welfare. Additionally, Kanuma received fast track designation by the FDA, and Breakthrough Therapy designation by the FDA for LAL Deficiency presenting in infants.
We have submitted a Biologics License Application (BLA) to the FDA and a Marketing Authorization Application (MAA) to the EMA for Kanuma as a treatment for patients with LAL Deficiency. The FDA has accepted for review the BLA for Kanuma for the treatment of LAL Deficiency. The FDA granted our request for Priority Review, which shortens the regulatory review period and is reserved for investigational therapies that treat serious
4
Table of Contents
conditions and, if approved, would provide a significant improvement in safety or effectiveness compared to available therapies. The FDA established a target action date of September 8, 2015 under the Prescription Drug User Fee Act (PDUFA). The EMA validated the MAA and granted our request for accelerated assessment, which has the potential to shorten the EMA’s regulatory review time.
Clinical Development
The BLA and MAA included data from a global, randomized, double-blind, placebo-controlled Phase 3 trial of Kanuma in children and adults with LAL Deficiency, a Phase 2/3 trial of Kanuma in infants with LAL Deficiency and an ongoing Phase 1/2 extension trial of Kanuma. Patients in these trials, combined with patients in other ongoing clinical trials with Kanuma, represent the largest patient population studied to date for this rare, devastating disease.
| • | Phase 3 Trial of Kanuma in Children and Adults with LAL Deficiency |
In November 2014, data from our Phase 3, global, randomized, double-blind, placebo-controlled trial evaluating Kanuma in children andadults with LAL Deficiency was presented during the American Association for the Study of Liver Diseases (AASLD) meeting. The data, which was presented by a principal investigator at the AASLD meeting, described the impact of Kanuma on a broad range of important disease-related abnormalities, and provided new insights into the severity of patients’ liver disease and dyslipidemia at baseline. The investigator also presented data demonstrating sustained reductions in alanine aminotransferase (ALT), the study’s primary endpoint and a marker of liver injury, and further improvements in low-density (LDL) cholesterol at week 36 from the ongoing open-label extension period of the study.
Trial design and baseline characteristics. The Phase 3 trial enrolled 66 children and adults with LAL Deficiency. Patients enrolled in the trial were randomized on a one-to-one basis to every other week infusions of Kanuma (1 mg/kg) or placebo for the double-blind treatment period of 20 weeks. LAL Deficiency patients enrolled in the trial presented with multiple clinically important abnormalities at baseline. The median age of patients enrolled in the trial was 13 years of age (range 4-58) and fibrosis and/or cirrhosis was documented in 100% (32/32) of patients who had baseline biopsies. Data from the oral presentation further revealed that of the patients who had biopsies at baseline, 47% (15/32) had bridging fibrosis (defined as Ishak score 3 or 4) and an additional 31% (10/32) of patients had cirrhosis.
Dyslipidemia was also common at baseline, with median LDL cholesterol levels of 204 mg/dL, which is in the very high category (greater than 190 mg/dL), despite 39% (26/66) of patients already receiving lipid-lowering medications, and abnormally low median HDL cholesterol levels of 32.5 mg/dL,. Data showed that 58% (38/66) of patients had LDL cholesterol levels at baseline in the very high category (greater than 190 mg/dL) despite 24% (9/38) of these patients receiving lipid-lowering medications.
Impact on disease-related abnormalities. The trial met the primary endpoint with 31% (11/36) of Kanuma patients reaching normalization of ALT (defined as 34-43 U/L, depending on age and gender) compared with 7% (2/30) of placebo patients (p=0.027). All Kanuma patients showed a decrease in ALT with mean changes in ALT of -57.9 U/L and -6.7 U/L in the Kanuma and placebo arms, respectively. In addition, treatment with Kanuma showed significant improvements in multiple disease-related parameters of dyslipidemia and liver injury (Table 1).
Table 1: Phase 3 trial efficacy at 20 weeks
| Efficacy Endpoint |
Kanuma (n=36) |
Placebo (n=30) | p-value | |||||||||
| ALT normalizationa |
31 | % | 7 | % | 0.027 | |||||||
| Relative reduction in LDL-C |
-28 | % | -6 | % | <0.001 | |||||||
| Relative reduction in non-HDL-C |
-28 | % | -7 | % | <0.001 | |||||||
| Aspartate transaminase (AST) normalization |
42 | % | 3 | % | <0.001 | |||||||
| Relative reduction in triglycerides |
-25 | % | -11 | % | 0.038 | |||||||
| Relative increase in HDL-C |
20 | % | -0.3 | % | <0.001 | |||||||
| Relative reduction in hepatic fat fraction |
-32 | % | -4 | % | <0.001 | |||||||
| Improvement in steatosis |
63 | % | 40 | % | 0.422 | |||||||
| Reduction in liver volume |
-10.3 | % | -2.7 | % | 0.007 | b | ||||||
5
Table of Contents
| a | Primary endpoint |
| b | Cannot be interpreted as significant due to the lack of statistical significance from the prior test under the pre-specified fixed sequence testing methodology |
Safety overview. The Kanuma and placebo arms had a similar number of patients with reported adverse events. Most adverse events during the double-blind treatment period were mild and unrelated to Kanuma. The adverse events occurring in three or more Kanuma treated patients, and which occurred more commonly in treated than placebo patients, were headache (28% versus 20%), pyrexia or increased body temperature (25% versus 23%), oropharyngeal pain (17% versus 3%), nasopharyngitis (11% versus 10%), abdominal pain (8% versus 3%), constipation (8% versus 3%), nausea (8% versus 7%) and asthenia (8% versus 3%). Serious adverse events were reported in two Kanuma-treated patients and one placebo patient (Table 2). One patient experienced a serious adverse event described as an atypical infusion related reaction following treatment with Kanuma and discontinued from the double-blind portion of the clinical trial. The other Kanuma treated patient experienced gastritis, which was moderate in severity and unrelated to Kanuma.
Two patients in the Kanuma arm and four patients in the placebo arm experienced infusion-associated reactions during the double-blind portion of the study (Table 2). Six percent (2/35) of Kanuma treated patients were anti-drug antibody positive at more than one time point during the double-blind treatment period with no apparent effect on safety or efficacy measures.
Table 2: Phase 3 trial safety at 20 weeks
| Event type |
Kanuma (n=36) # patients (%) |
Placebo (n=30) # patients (%) | ||
| Adverse Events (AEs) |
31 (86%) | 28 (93%) | ||
| Serious Adverse Events (SAEs) |
2 (5.6%) | 1 (3.3%) | ||
| Infusion-Associated Reactions (IARs) |
2 (6%) | 4 (13%) |
Results from open-label extension period. Sixty-five of the 66 patients enrolled in the study have entered into a long-term, open-label extension period of the study. Data presented at the meeting demonstrated that placebo patients from the double-blind 20-week period of the study who entered the extension period of the study experienced a similar response to Kanuma as those patients initially treated during the double-blind 20-week period, namely, reductions in ALT and LDL cholesterol. In addition, patients from the Kanuma treatment arm of the double-blind 20-week period who entered the extension period of the study experienced sustained reductions in ALT and further reductions in LDL cholesterol at week 36. The safety profile in the open-label period was consistent with that observed during the double-blind period. One serious adverse event was observed (gastroenteritis) in the open-label period, which was unrelated to Kanuma.
| • | Phase 2/3 Trial with Kanuma in Infants with LAL Deficiency |
The Phase 2/3 trial of Kanuma in infants with LAL Deficiency is an ongoing, open-label multicenter study. Infants with growth failure or other evidence of rapidly progressive disease before six months of age were eligible to enroll and receive weekly infusions with Kanuma (1-3 mg/kg). The primary endpoint of the trial is survival at 12 months of age. In a natural history study, failure to thrive, liver complications and early mortality were confirmed in infants with LAL Deficiency. The median age (range) for infants at symptom onset, diagnosis, and death was 1.0 month (0-6.0), 2.6 months (1.0-17.7), and 3.7 months (1.4-46.3), respectively. Growth failure and aggressive liver disease contributed to early mortality. Transaminase levels (ALT and/or AST), abnormal at diagnosis, markedly increased with disease progression. Hematopoietic stem cell transplants were performed in 10 infants; seven of these 10 infants died before nine months of age and three infants died between 26.9-46.3 months of age.
Data from the nine infants enrolled in the clinical trial were presented in the North American Society for Pediatric Gastroenterology, Hepatology and Nutrition (NASPGHAN) annual meeting in October 2014. Patients with previous hematopoietic stem cell or liver transplant were excluded from this study. The median age of infants at first infusion with Kanuma was 3.0 months. The median baseline liver function tests (ALT and AST of 145 IU/L and 125 IU/L, respectively) revealed underlying liver dysfunction and high baseline ferritin levels (median 586 ug/L) indicated macrophage activation. Diarrhea and vomiting, hepatomegaly, splenomegaly, and adrenal calcification were also common.
6
Table of Contents
Six infants met the primary endpoint of survival at 12 months of age and five infants continue on treatment with Kanuma. In addition to improved survival relative to the historical cohort, all infants demonstrated improved weight gain, improvement of gastrointestinal symptoms, and reductions in hepatosplenomegaly. Rapid improvements in biochemical and hematological markers including ALT, AST, hemoglobin, and bilirubin were also observed. Four infants died during the study. Three infants died shortly after the start of the study, unrelated to Kanuma, and one infant who met the primary endpoint of survival at 12 months of age subsequently died at 15 months of age, and this was considered unlikely related to Kanuma.
Adverse events with Kanuma were mostly mild to moderate. Serious adverse events were mainly related to central line infections or hospitalizations for treatment with antibiotics. One patient experienced three related serious adverse events that included fever, malaise, and tachycardia developed during the infusion of Kanuma. Four infants developed anti-drug antibodies All four infants continue on infusions with Kanuma.
| • | Ongoing Phase 1/2 Extension Trial of Kanuma in Adults with LAL Deficiency |
Nine adults with LAL Deficiency enrolled in the initial Phase 1/2 trial with Kanuma. After completing the initial four-week portion of the trial, patients were allowed to continue treatment with Kanuma as part of a long-term, open-label extension study. Eight of nine patients enrolled in the extension study and continue treatment with Kanuma. The ninth patient did not enter the extension study and, after 10 months without treatment, experienced progression of liver disease requiring an urgent liver transplant.
Six of the eight patients enrolled in the ongoing Phase 1/2 extension study, who completed two years of treatment, continued to demonstrate sustained reductions in the biomarkers of liver damage (both ALT and AST), frequently into the normal range, from the pre-treatment baseline to two years of the extension study. Patients also maintained improvements in dyslipidemia associated with LAL Deficiency, with decreases in LDL and triglycerides and increases in HDL from the pre-treatment baseline to two years of the extension study.
Most adverse events through the two years of the extension study were mild and unrelated to Kanuma. Infusion associated reactions were uncommon, generally mild and gastrointestinal in nature (diarrhea, abdominal cramping). Two serious adverse events (cholecystitis/cholelithiasis) considered unlikely related to Kanuma occurred in one patient and this patient continues treatment with Kanuma in the study.
Updated data from this ongoing Phase 1/2 trial presented at the NASPGHAN meeting include pre-treatment and post-Kanuma treatment liver biopsies obtained from two patients. Compared to historical pre-treatment biopsies, biopsies obtained after more than 18 months of treatment with Kanuma showed less steatosis and fibrosis based on assessments performed by local pathologists. One patient had a pre-treatment biopsy at 17 years of age with notable steatosis assessed visually and extensive fibrosis with numerous fibrous bridges and initial nodulations. A subsequent liver biopsy conducted one and a half years after treatment with Kanuma at 22 years of age showed substantial decreases in steatosis with less fibrosis localized to periportal areas associated with some septa. A second patient had a pre-treatment liver biopsy at 37 years of age revealing significant steatosis and fibrosis. A subsequent liver biopsy conducted two years after treatment with Kanuma at 44 years of age showed mild steatosis with no significant fibrosis.
| • | Additional Studies |
We recently initiated a multicenter study to characterize and identify patients with LAL Deficiency in high risk patient populations. This study expands upon our ongoing efforts to improve disease understanding by inviting physicians to participate in a global, multicenter trial. LAL Deficiency disease manifestations can resemble other more common conditions, and given the historically limited disease awareness, misdiagnosis or delayed diagnosis can occur. The purpose of the study is to determine the frequency of LAL Deficiency in patients considered to be at high risk of having LAL Deficiency and may include patients misdiagnosed with nonalcoholic steatohepatitis (NASH), non-alcoholic fatty liver disease (NAFLD), familial hypercholesterolemia (FH) or metabolic syndromes, among others. The study is designed to enroll 10,000 at-risk patients across approximately 100 clinical trial sites in 12 countries. These at-risk patients include non-obese patients greater than two years of age with persistent, unexplained elevated transaminases, cryptogenic cirrhosis, or presumed FH including patients who have not been found to have disease-causing mutations in the low-density lipoprotein receptor, Apo-B and PCSK-9 genes. The first patient has been enrolled and we expect to complete the study during 2016.
7
Table of Contents
We continue to progress additional clinical trials to expand the clinical experience with Kanuma in LAL Deficiency. The data from these trials, although not included in our regulatory submissions for Kanuma for LAL Deficiency, may contribute safety data to these submissions. Eligible patients may include those who were not able to enroll into one of the previously completed studies based on completion of enrollment, age, disease presentation, previous treatment by hematopoietic stem cell or liver transplantation, or disease characteristics that would have precluded participation in a placebo-controlled study.
Additional studies may be initiated in order to further evaluate safety and efficacy and additional patients may also receive treatment under expanded access or compassionate use mechanisms unless or until we receive marketing approval of Kanuma.
Natural History and Observational Studies
Unlike most common diseases where clinical familiarity exists, many aspects of the clinical presentation, disease progression (including mortality and key morbidities) and response to treatment are poorly understood for rare diseases. Two key factors are responsible for these differences. First, a physician’s clinical experience is often limited due to the rarity of the disease. Secondly, the historical absence of any effective therapy reduces the interest and research funding available to support coordinated investigation of the disease. The development of a new potential therapy requires accurate knowledge of the natural course of the disease to support patient diagnosis and endpoint selection and to provide historical data on mortality and morbidity. These are required to inform the evaluation and care of patients and to provide a reference for efficacy studies of enzyme replacement or other novel therapies. In order to understand the natural course of LAL Deficiency in support of our Kanuma development program, we conducted two clinical studies in approximately 20 countries that required us to review the case records of patients with LAL Deficiency.
A poster at the LDN WORLD Symposium in February 2014 described the natural history of infants with LAL Deficiency. Thirty-five infants who fulfilled the eligibility criteria with a clinical diagnosis of LAL Deficiency presenting in infants were enrolled in the study and all thirty-five died. The median age (range) for patients at symptom onset, diagnosis, and death was 1.0 month (0—6.0), 2.6 months (1.0—17.7), and 3.7 months (1.4—46.3), respectively. Growth failure and aggressive liver disease contributed to early mortality. Transaminase levels (ALT and/or AST), abnormal at diagnosis, markedly increased with disease progression. Hematopoietic stem cell transplants were performed in 10 infants; seven of these 10 infants died before nine months of age and the other three infants died between 26.9-46.3 months of age.
A poster at the LDN WORLD Symposium in February 2014 described the results from an observational study designed to characterize the clinical presentation and progression of LAL Deficiency presenting in children and adults. The study consisted of a retrospective chart review and a single prospective evaluation. Forty-eight patients with a confirmed diagnosis of LAL Deficiency enrolled in the study. Results from the multinational study indicate that most LAL Deficiency cases were diagnosed as children (median age at diagnosis 9.5 years; range 1.2 to 46.1 years). Elevated serum transaminases (ALT and AST) and LDL cholesterol levels were common, persistent, and frequently present from early childhood.
A majority of patients (44/48) had ALT above the age and gender-specific upper limit of normal at the first recorded value. Six of 48 patients required a liver transplant, including four patients who required a liver transplant before 18 years of age. Only nine patients identified were over the age of 40 and two of these nine patients required liver transplantation. Of the 31 patients who had a liver biopsy performed, steatosis, fibrosis, and cirrhosis were documented in 27 (87%), 16 (52%), and 5 (16%) patients, respectively.
Despite the use of lipid lowering therapy (median age at initiation was 11.3 years), dyslipidemia persisted, and LDL values remained elevated ( > 150mg/dl) from early childhood at multiple time points in a high proportion of patients. Most LDL values (270/306) were greater than 100 mg/dL. Twenty-seven of 48 patients had at least one LDL value of greater than 100 mg/dL while receiving lipid lowering therapy.
Regulatory
We have submitted a BLA to the FDA and an MAA to the EMA for Kanuma as a treatment for patients with LAL Deficiency. The FDA has accepted for review the BLA for Kanuma for the treatment of LAL Deficiency. The FDA
8
Table of Contents
granted our request for Priority Review, which shortens the regulatory review period and is reserved for investigational therapies that treat serious conditions and, if approved, would provide a significant improvement in safety or effectiveness compared to available therapies. The FDA established a target action date of September 8, 2015 under the PDUFA. The EMA validated the MAA and granted our request for accelerated assessment, which has the potential to shorten the EMA’s regulatory review time.
Kanuma has been granted orphan drug designation by the FDA, and we are conducting our ongoing clinical trials in the U.S. under an active IND. The FDA may grant orphan drug designation to a product that treats a rare disease, which the FDA defines as a condition that affects fewer than 200,000 Americans. As a result of the orphan drug designation, we are eligible to receive a number of benefits, including access to grant funding for clinical trials, tax credits, waiver of the FDA filing and registration fees, and seven years of market exclusivity if approval is received. Additionally, due to the severity of LAL Deficiency, the FDA granted Kanuma Fast Track Designation and, in 2013, FDA granted Breakthrough Therapy designation for LAL Deficiency presenting in infants. The Breakthrough Therapy designation is intended to expedite the development and review of drugs for serious or life-threatening conditions. The criteria for Breakthrough Therapy designation require preliminary clinical evidence that demonstrates the drug may have substantial improvement on at least one clinically significant endpoint over available therapy. A Breakthrough Therapy designation conveys all of the Fast Track Designation features, as well as more intensive FDA guidance on an efficient drug development program. FDA’s decision to grant Breakthrough Therapy designation for LAL Deficiency in infants, but not in children and adults, reflects FDA’s view that the data available for LAL Deficiency in infants demonstrated preliminary evidence of clinical benefit sufficient for Breakthrough Therapy designation in infants, but that more data would be required for Breakthrough Therapy designation for LAL Deficiency in children and adults.
Kanuma has also been granted orphan drug designation by the EMA, and we have received regulatory clearance in key countries in the European Union (EU) to conduct clinical trials in patients with LAL Deficiency. The EMA’s orphan drug designation is given to therapies that treat rare diseases, defined as conditions that affect no more than five in 10,000 persons in the EU. As a result of the EMA orphan drug designation, we are eligible to receive access to protocol assistance, direct access to centralized marketing authorization, up to 10 years of marketing exclusivity if approval is received, fee reductions or exemptions, and other national incentives. Under the EU Pediatric Regulations established in 2007, Kanuma may be eligible for an additional two years of market exclusivity.
Kanuma has also been granted orphan drug designation by the Japanese Ministry of Health, Labour and Welfare, and we have received regulatory clearance in Japan to conduct clinical trials in patients with LAL Deficiency. As stipulated in Article 77-2 of the Pharmaceutical Affairs Law of Japan, a drug must meet the following conditions in order to be considered for orphan drug designation in Japan: the drug should be used to treat a disease that affects less than 50,000 people in Japan; the drug treats a disease or condition for which there are no other treatments available in Japan, or the proposed drug is clinically superior to drugs already available on the Japanese market; and the applicant should have a clear product development plan and scientific rationale to support the necessity of the drug in Japan. Specific measures to support the development of orphan drugs include prioritized consultation regarding clinical development and priority review of applications, reduced application fees, extended registration validity period, financial assistance to help cover research and development expenditures, and tax incentives.
Medical Education
LAL Deficiency is a rare disorder that falls within the scope of pediatric hepatologists and gastroenterologists, as well as lipidologists. Liver complications such as fibrosis, cirrhosis and liver failure dominate LAL Deficiency in children and adults, and patients’ symptoms may resemble those with other, more common diseases such as non-alcoholic fatty liver disease or non-alcoholic steatohepatitis. Similar to other lysosomal storage disorders (LSDs), increased disease awareness and improvements in diagnosis supported by the patient and physician communities are critical for identifying patients and facilitating treatment. We are engaging the physician and patient communities to establish a disease registries that will encourage involvement of all parties to raise awareness of and interest in LAL Deficiency. These include metabolic, hepatic, and lipid physician specialists and patient groups such as LAL Solace, National Organization for Rare Disorders, Eurordis and CLIMB. We expect that the diagnosis of LAL Deficiency patients begins with the specialists’ clinical diagnosis aided by the use of differentiating biochemical markers, including abnormal lipid profile and confirmed by a simple blood test for the LAL enzyme.
9
Table of Contents
Commercialization
We are developing marketing, sales and distribution capabilities to support the commercialization of Kanuma if it is approved. We have hired country managers, medical science liaisons and reimbursement specialists in the major reimbursable markets and we believe we have the necessary infrastructure in place to support the global commercial launch of Kanuma.
Our commercial strategy for Kanuma will focus on: (i) continuing to raise disease awareness, (ii) facilitating diagnosis, (iii) supporting treatment, and (iv) facilitating third party reimbursement. By aligning resources against these imperatives, we believe that our commercial footprint will be efficient and scaled to a highly specialized market niche. Similar to other companies with such specialized call points, our current plans for resourcing the commercialization effort for Kanuma include a small number of highly specialized field-based representatives supported by a specialized organization in-house. In the U.S., we plan to supplement our internal field team with a contract sales organization to support the launch of Kanuma. The past experience of members of our management team in leading commercial efforts for ultra-rare products highlights the value of recruiting professionals who have experience with these specialized and focused physician and patient communities. The planned commercial organization is being developed to initially address the needs and opportunities for the major reimbursable markets.
SBC-103 for MPS IIIB
Our second pipeline program is an enzyme replacement therapy for an LSD called MPS IIIB. The mucopolysaccharidoses (MPS) consist of a group of rare LSDs caused by a deficiency of enzymes needed to break down complex sugars called glycosaminoglycans. The MPS III syndromes (also known as Sanfilippo syndromes) share complications with other MPS diseases but represent a clinically distinct subset with marked central nervous system degeneration. MPS IIIB, also known as Sanfilippo B syndrome, is caused by a decrease in alpha-N-acetyl-glucosaminidase (NAGLU) enzyme activity which leads to the buildup of abnormal amounts of heparan sulfates (HS) in the brain and other organs. The accumulation of abnormal HS, particularly in the central nervous system, leads to severe cognitive decline, behavioral problems, speech loss, increasing loss of mobility, and premature death. Based on published incidence data in the medical literature, we estimate there are approximately 2,000 MPS IIIB patients in the major reimbursable markets.
SBC-103 is a recombinant form of the natural human NAGLU enzyme we are developing as an enzyme replacement therapy for MPS IIIB. In December 2014, we announced that the IND application to FDA to evaluate SBC-103 as a treatment for MPS IIIB is active. We have begun dosing patients with MPS IIIB in a Phase 1/2 study investigating intravenous administration of SBC-103 and plan to report preliminary data from this study in the second half of 2015. SBC-103 has been granted orphan designation by the FDA and the EMA and Fast Track designation from the FDA.
The Phase 1/2 trial will enroll approximately nine patients, two years of age or greater but less than 12 years of age, with definitive diagnosis of MPS IIIB and developmental delay. Patients will be treated in one of three different dosing cohorts (0.3 mg/kg, 1.0 mg/kg or 3.0 mg/kg) with every other week intravenous administrations of SBC-103 for 24 weeks. Patients who meet qualifying criteria may continue therapy with SBC-103 for an extended treatment period that will last up to 128 weeks. The primary endpoint of the trial is safety and tolerability of intravenous administration of SBC-103 in patients with MPS IIIB. The study will also determine the effects of dosing with SBC-103 on the onset, magnitude, and reversibility of changes in levels of total HS in cerebral spinal fluid (CSF), serum, and urine as well as measure the effects of neurocognitive and developmental function and change in brain structures as assessed by magnetic resonance imaging. Exploratory biomarkers, SBC-103 concentration in CSF, MPS IIIB disease characteristics, symptoms, and quality of life will also be measured.
The advancement of SBC-103 towards the clinic is supported by preclinical studies demonstrating that intravenously administered SBC-103 is able to cross the blood-brain barrier and reduce HS storage in the brain, liver and kidney in an MPS IIIB animal model. These studies include a mouse model of MPS IIIB, an in vitro model of the blood-brain barrier, and a non-human primate study.
We recently completed a study assessing the integrity of the blood-brain barrier and other disease abnormalities in patients with MPS IIIB and plan to report data during the first quarter of 2015. We are also conducting natural history
10
Table of Contents
studies in MPS IIIB. These include a retrospective natural history study of deceased MPS IIIB patients that began in July 2013 and a prospective, longitudinal natural history study in living MPS IIIB patients that began in September 2014. Natural history studies can help build an understanding of the etiology, manifestations and progression of disease and provide insights into biomarkers and other measures of clinical outcome.
SBC-105 for GACI and other rare disorders of calcification
SBC-105 is our third pipeline program and a first-mover enzyme replacement therapy in preclinical development for rare disorders of calcification, including the first planned indication for GACI. Patients with GACI suffer from calcification of the medium and large arteries leading to arterial narrowing and heart failure. The disease predominantly affects infants and children, and most patients with the disease die in early infancy. Based on published data, twe estimate that GACI affects approximately 2,000 to 3,000 patients in the major reimbursable markets.
In healthy individuals, an enzyme called ectonucleotide pyrophosphatase/phosphodiesterase-1 (ENPP1) generates pyrophosphate (PPi), which is a potent inhibitor of tissue calcification. Due to inherited mutations of ENPP1, patients with GACI have low levels of PPi, which results in increased calcification of the arteries and other tissues. SBC-105 is a recombinant enzyme that replaces the mutated ENPP1 enzyme and increases production of PPi. In a preclinical mouse model of GACI, SBC-105 improved survival, tissue calcification, and biomarkers associated with GACI. With additional preclinical development data and regulatory feedback, we plan to advance this program into the clinic in 2016.
Given the desired characteristics of SBC-105, manufacturing has been focused on a cell culture based platform. While the majority of our pipeline products are produced in our egg white (EW) platform, we continue to expand our knowledge and capabilities in multi-platform production. This multiple manufacturing platform capability will enable a diverse approach to manufacturing and development for future Synageva pipeline programs
Beyond GACI, SBC-105 may have broader medical utility in other rare disorders of calcification including hypophosphatemic rickets and pseudoxanthoma elasticum, where low PPi levels contribute to pathological calcification with increased morbidity and mortality.
Other pipeline programs include potentially bio-superior treatments in addition to novel first-mover programs
We continue to explore opportunities that leverage our proprietary EW manufacturing platform and other capabilities to create potentially bio-superior treatments for patient populations where there is still unmet medical need. We have recently produced enzymes targeting Hunter Syndrome, Fabry Disease and Pompe Disease with expression levels and activity that support further preclinical development. Combined, these diseases affect well-defined patient populations in excess of 10,000 individuals worldwide.
In addition, we have additional first-mover protein therapeutic pipeline programs for other rare diseases at different stages of preclinical development.
Our preclinical development efforts planned for this year are designed to help generate proof of concept data including the potential for improved product characteristics. With respect to pipeline products and other product candidates, we may elect to utilize our own commercial capabilities to market and sell a product for which we obtain regulatory approval.
We also may enter into strategic transactions to supplement or partner our technologies and resources. When identifying strategic transactions, we seek to leverage our expertise in both product development for rare diseases and production technologies.
Our Proprietary Manufacturing Platform
Our proprietary expression platform is an important element of our business, and has been used to manufacture most of our investigational products, including Kanuma and SBC-103. Our expression platform is an integrated
11
Table of Contents
approach using recombinant DNA technology for the creation, optimization and scalable production of protein therapeutics. This mature platform, encompassing over 15 years of research and clinical development, has shown the ability to overcome challenges previously encountered in manufacturing proteins using other platforms.
The foundation of our platform is an integrated system of proprietary vectors and methods that allow the generation of genetically modified hens which produce high levels of therapeutic protein in EW. Expression is achieved using our proprietary vectors that allow targeted expression in EW-producing cells. The EW matrix facilitates bulk storage of unpurified EW prior to purification for prolonged periods and is one of a number of manufacturing advantages of our platform over traditional protein manufacturing technologies. Our expression system yields consistent expression levels and quality of protein within production lines and through multiple generations.
Our proprietary technology may allow for the production of proteins with glycosylation patterns that are suitable for a number of diseases without a requirement for additional processes either during manufacturing (inhibition of specific glycosylation enzymes) or post purification (enzymatic removal of terminal sugars) to modify terminal glycan structures impacting biodistribution. Furthermore, our expression system can produce proteins with ‘human like’ glycan structures and does not incorporate non-human sugars into glycans.
We have demonstrated our platform’s ability to produce a wide array of investigational therapeutic proteins, including therapeutic enzymes, cytokines, monoclonal antibodies and fusion proteins. From 2004 to 2008, we manufactured investigational products using our expression system to supply Phase 1 and Phase 2 multinational clinical studies in the U.S., EU, and India, which included more than 250 patients. In addition, this expression system has been used in the manufacturing of clinical Phase 1/2 and Phase 3 materials to support the development of Kanuma and Phase 1/2 materials to support SBC-103. Within the Kanuma clinical development program hundreds of infusions or doses have been provided to pediatric and adult patients in global trials using clinical materials manufactured from our platform. The regulatory clearance for these studies followed substantial review by global regulatory authorities of detailed information related to the manufacturing platform and the expression system. This platform is covered by a comprehensive intellectual property portfolio owned by, or exclusively licensed to us and, we believe the platform provides us with expanded freedom to operate compared to other systems.
We have and continue to investigate the potential to manufacture investigational therapeutic proteins using other platform technologies, such as cell culture, in our process to find the right strategic manufacturing solution for each product candidate.
We currently rely on our manufacturing facilities for the production of products utilized in our clinical and preclinical activities, as discussed in further detail in “Item 2. Properties.” We also depend on third party providers for other services in the manufacturing process, including product purification, product finishing, packaging, vialing, labeling and testing. We have entered into commercial service and supply agreements with third party providers to produce commercial product in preparation for the potential approval of Kanuma.
FUZEON
On November 2, 2011, Trimeris, Inc., a Delaware corporation incorporated in 1993 (Trimeris), closed a merger transaction (the “Reverse Merger”) with Synageva BioPharma Corp., a privately held Delaware corporation incorporated (Private Synageva), pursuant to an Agreement and Plan of Merger and Reorganization (the “Merger Agreement”). Pursuant to the Merger Agreement, Private Synageva became a wholly owned subsidiary of Trimeris and the former stockholders of Private Synageva received shares of Trimeris that constituted a majority of the outstanding shares of Trimeris. In connection with the Reverse Merger, Trimeris changed its name to Synageva BioPharma Corp.
As part of the Reverse Merger, we acquired the rights to a royalty stream related to FUZEON®, an HIV fusion inhibitor, developed by Trimeris in collaboration with F. Hoffmann-La Roche Ltd. (Roche). The FDA approved the use of FUZEON in combination with other anti-HIV drugs for the treatment of HIV-1 infection in treatment-experienced patients with evidence of HIV-1 replication despite ongoing anti-HIV therapy. After the FDA granted accelerated approval, commercial sales of FUZEON began in March 2003. Full approval was granted by the FDA in October 2004. Roche also filed an application for European marketing approval of FUZEON in September 2002 and was granted marketing approval under exceptional circumstances by the European Agency for the Evaluation of Medicinal Products in May 2003.
12
Table of Contents
We granted Roche an exclusive license to manufacture and sell FUZEON worldwide, and we receive royalties from Roche on net sales of FUZEON. Royalties from sales of FUZEON have shown a general declining trend from 2007 through 2014. Although royalties from the sale of FUZEON is currently our largest source of revenue, we do not consider the sales of FUZEON to be material to our business strategy.
Patents and Proprietary Rights
We seek to aggressively protect the proprietary technology that is important to our business, including pursuing patents that cover our product candidates and compositions, their methods of use and the processes for their manufacture, as well as any other relevant inventions and improvements that are commercially important to the development of our business. We also rely on trade secrets and other know-how that may be important to the development of our business.
Our patent portfolio is currently composed of over 200 issued patents and 150 patent applications in the major reimbursable markets, which includes patents and patent applications that we own as well as license from other parties. These patents and patent applications are directed to various aspects of our manufacturing expression platform, product candidate pipeline and other product candidates that we are no longer developing.
Patents relating to Kanuma will expire between 2021 and 2031. In March 2014, the U.S. Patent and Trademark Office (USPTO) issued U.S. Patent No. 8,663,631 relating to methods of treating LAL Deficiency. On February 11, 2015, the European Patent Office issued European Patent No. EP2613798 B1 relating to the treatment of LAL Deficiency. On February 13, 2015, the Japanese Patent Office issued Japanese Patent No. 5693728 relating to the treatment of LAL Deficiency. These patents expire in 2031, not including any extensions. Related patents are pending in other regions outside the U.S. These patents and patent applications complement our existing and planned global patent portfolio relating to our LAL Deficiency program, which includes intellectual property directed to composition of matter, methods of use, and manufacturing.
Patent applications relating to our SBC-103 program are currently pending in the USPTO and regions outside the U.S. If they were to issue, patents granted on these pending patent applications will expire in 2032, not including extensions.
In September 2014, the U.S. Patent and Trademark Office issued U.S. 8,846,603 relating to our SBC-105 program, which will expire in 2031, not including any extension. Related patents are pending in regions outside the U.S. If they were to issue, patents granted on these pending patent applications will expire in 2031, not including extensions.
In addition, our patents directed to aspects of our manufacturing platform will expire between 2025 and 2027. If they were to issue, patents granted on pending patent applications directed to aspects of our manufacturing platform will expire between 2025 and 2035. We continue to develop new intellectual property based on ongoing research to improve and enhance our expression platform.
While there can be no assurance that patent applications relating to our product candidates will ultimately issue or what the scope of the claims of such patent applications will cover if they were to issue, we expect to rely heavily on orphan drug exclusivity for our product candidates, including Kanuma, which generally grants seven years of marketing exclusivity under the Federal Food, Drug, and Cosmetic Act, and up to 10 years of marketing exclusivity in Europe. In addition, we continue to pursue intellectual property protection for our product candidates in the form of patent applications that have been and will continue to be filed in the U.S. and internationally.
The term of individual patents depends upon the legal term of the patents in the countries in which they are obtained. In most countries in which we file, the patent term is 20 years from the date of filing the non-provisional application. In the U.S., a patent’s term may be lengthened by patent term adjustment, which compensates a patentee for administrative delays by the USPTO in granting a patent, or may be shortened if a patent is terminally disclaimed over an earlier-filed patent. Additional patent term extension can be granted for time spent in clinical development and regulatory review in certain jurisdictions as well.
13
Table of Contents
University of Georgia Research Foundation
Our patent rights include an exclusive, worldwide, sublicensable license to patents rights owned by University of Georgia Research Foundation (UGARF) to develop, make, use and commercialize the avian transgenesis technology. Under the license, which was initially executed in 1996 and amended in 2007 and 2013, we paid UGARF an upfront license fee and issued shares of our common stock in return for worldwide exclusive rights under the license. Additionally, UGARF is eligible to receive low single digit royalties on net sales of products covered under the license. This license agreement covers patents and patent applications pending worldwide that are the basis of our expression platform. The UGARF license is effective until the last to expire of the licensed patents. Patents exclusively licensed from UGARF relating to various aspects of our expression platform will expire between 2017 and 2024. UGARF can terminate the license or, at UGARF’s discretion, convert the license into a non-exclusive license, if we materially breach the agreement, make any materially false reports to UGARF, or fail to pay any required consideration under the agreement. We have the right to terminate the agreement upon 60 days’ prior written notice to UGARF.
Shire Human Genetics Therapies
In April 2013, we entered into a settlement agreement with Shire Human Genetics Therapies, Inc. and its affiliates (Shire) and Cincinnati Children’s Hospital Research Foundation, an operating division of Children’s Hospital Medical Center, and its affiliates, under which the parties settled the outstanding Kanuma patent-related issues between them, including revocation actions in the United Kingdom and France and an outstanding opposition in the European Patent Office. Simultaneously with the execution of the settlement agreement, we entered into a sublicense agreement with Shire under which we received exclusive, worldwide rights to multiple patents and patent applications owned by Cincinnati Children’s Hospital Research Foundation and its affiliates, which had been exclusively licensed to, or co-owned with, Shire. The patents and patent applications relate to the use of LAL including for the treatment of LAL Deficiency and atherosclerosis. These additional patents and patent applications complement our existing and planned patent portfolio directed to our LAL Deficiency program including patents and patent applications for composition of matter, methods of use, and manufacturing. In exchange for the settlement and the rights acquired from Shire, we paid an upfront payment and will be obligated to make two sales-based milestones (each a low single-digit million dollar payment), and low, single-digit percentage tiered royalty payments on sales of Kanuma in the U.S. and certain countries in Europe. The patents relating to Kanuma that are subject to our obligation to make tiered royalty payments are expected to expire in 2021, not including any patent term extension.
University of Minnesota
In 2009, we entered into an exclusive license agreement, with the right to grant sublicenses, with the University of Minnesota that relates to compositions and methods useful for generating transgenic Gallus. In exchange for the license, which is effective until the last to expire of the licensed patents, we paid the University of Minnesota an upfront license fee. In addition, University of Minnesota is entitled to minimal annual royalties which are creditable against low single digit royalties on net sales of products covered under the license. The patents included in this license agreement expire between 2016 and 2017. The University of Minnesota may terminate the agreement for our failure to timely cure any material breach or failure to perform any obligations under the agreement. We may terminate the agreement upon 90 days’ prior written notice.
Pangenix
In 2000, we entered into a non-exclusive, sublicensable license agreement with Pangenix that relates to patents directed to compositions and methods useful for generating transgenic Gallus. In exchange for the license granted by Pangenix, which is effective until the last to expire of the licensed patents, Pangenix received an upfront license fee and is entitled to receive minimum annual royalties creditable against low single digit royalties on net sales of products covered under the license. The patents included in this license agreement are set to expire between 2013 and 2015. Pangenix may terminate the agreement for our failure to timely cure any material breach or failure to perform our obligations under the agreement. We may terminate upon 60 days’ notice to Pangenix.
14
Table of Contents
Roche
On May 25, 2011, Trimeris and Roche entered into the Amended and Restated License Agreement (the Roche License Agreement), effective as of January 1, 2011, pursuant to which Roche has an exclusive license to manufacture and sell FUZEON worldwide and we receives royalty payments equal to 16% of worldwide net sales of FUZEON occurring from and after January 1, 2011. Under the Roche License Agreement, Roche may deduct from its royalty payments to us 50% of any royalties paid to third parties which are reasonably required to allow Roche to sell FUZEON in a given country, including royalties paid to Novartis Vaccines and Diagnostics, Inc. (Novartis) pursuant to a settlement agreement between Roche and Novartis related to the manufacture, sale and offer of FUZEON. To calculate the royalty revenue, a 5.5% distribution charge is deducted from Roche’s reported net sales, and we receive a 16% royalty on the adjusted net sales amount.
Competition
Our industry is highly competitive and subject to rapid and significant technological change. Our potential competitors include large pharmaceutical and biotechnology companies and specialty pharmaceutical companies, academic institutions, government agencies, and research institutions. The market for enzyme replacement therapies is becoming increasingly competitive and technologies such as gene therapy, chaperones, fusion proteins and others could compete against existing enzyme replacement therapies. Key competitive factors affecting the commercial success of our product candidates are likely to be efficacy, safety and tolerability profile, reliability and durability of response, convenience of dosing, and price and reimbursement.
We are not aware of direct competitors to Kanuma for LAL Deficiency. For SBC-103 for MPS IIIB, we are aware that BioMarin Pharmaceutical Inc. has selected a drug development candidate for the treatment of MPS IIIB as an enzyme replacement therapy and it is in preclinical development. In addition, uniQure B.V. has a gene-therapy program that is in Phase 1 clinical trials for the treatment of MPS IIIB. We are not aware of direct competitors to SBC-105.
Government Regulation
The preclinical studies and clinical testing, manufacture, labeling, storage, record keeping, advertising, promotion, export, and marketing, among other things, of our product candidates and future products, are subject to extensive regulation by governmental authorities in the U.S. and other countries. In the U.S., pharmaceutical products are regulated by the FDA under the Federal Food, Drug, and Cosmetic Act and other laws, including, in the case of biologics, the Public Health Service Act. We expect Kanuma to be regulated by the FDA as a drug and biologic. Biologics require the submission of a BLA and approval by the FDA prior to being marketed in the U.S. Biologics derived from transgenic sources also require submission and approval by FDA of a New Animal Drug Application (NADA) prior to being marketed in the U.S. Manufacturers of biologics may also be subject to state regulation. Failure to comply with FDA requirements, both before and after product approval, may subject us and/or our partners, contract manufacturers, and suppliers to administrative or judicial sanctions, including FDA refusal to approve applications, warning letters, product recalls, product seizures, total or partial suspension of production or distribution, fines and/or criminal prosecution.
The steps required before a biologic may be approved for marketing of an indication in the U.S. generally include:
| • | preclinical laboratory tests and animal tests; |
| • | validation of manufacturing processes and analytical methods; |
| • | submission to the FDA of an IND for human clinical testing, which must become effective before human clinical trials may commence; |
| • | adequate and well-controlled human clinical trials to establish the safety and efficacy of the product; |
| • | submission to the FDA of a BLA or supplemental BLA; |
| • | FDA pre-approval inspection of product manufacturers; and |
| • | FDA review and approval of the BLA or supplemental BLA. |
15
Table of Contents
Preclinical studies include laboratory evaluation as well as animal studies to assess the potential safety and efficacy of the product candidate. Many preclinical safety studies must be conducted in compliance with FDA regulations regarding good laboratory practices (GLPs). The results of the preclinical tests, together with manufacturing information and analytical data, are submitted to the FDA as part of an IND, which must become effective before human clinical trials may be commenced. The IND becomes effective 30 days after receipt by the FDA, unless the FDA before that time raises concerns about the drug candidate or the conduct of the trials as outlined in the IND. The IND sponsor and the FDA must resolve any outstanding concerns before clinical trials can proceed. Submission of an IND does not guarantee FDA authorization to commence clinical trials.
Clinical trials involve the administration of the investigational product to healthy volunteers or to patients, under the supervision of qualified principal investigators. Each clinical study at each clinical site must be reviewed and approved by an independent institutional review board or ethics committee, and often other local clinical research review committees, prior to the recruitment of subjects.
Clinical trials are typically conducted in three sequential phases, but the phases may overlap and different trials may be initiated with the same drug candidate within the same phase of development in similar or differing patient populations. Phase 1 studies may be conducted in a limited number of patients, but are sometimes conducted in healthy volunteer subjects. Phase 1 studies are typically intended and designed to evaluate safety, and may also be used to evaluate pharmacokinetics and activity.
Phase 2 usually involves studies in a larger, but still limited, patient population to evaluate preliminarily the efficacy of the drug candidate for specific, targeted indications and to determine optimal dosing and regimens and to identify possible short-term adverse effects and safety risks.
Phase 3 trials are undertaken to confirm clinical efficacy safety within an expanded patient population at multiple clinical study sites. Phase 1, Phase 2, or Phase 3 testing might not be completed successfully within any specific time period, if at all, with respect to any of our product candidates. Results from one trial are not necessarily predictive of results from later trials. Furthermore, the FDA may require that clinical trials be suspended at any time on various grounds, including a finding that the subjects or patients are being exposed to an unacceptable health risk.
The results of the preclinical studies and clinical trials, together with other detailed information, including information on the manufacture and control of the product, are submitted to the FDA as part of a BLA requesting approval to market the product candidate for a proposed indication. Under the Prescription Drug User Fee Act, as amended, the fees payable to the FDA for reviewing a BLA, as well as annual fees for commercial manufacturing establishments and for approved products, can be substantial. The BLA review fee for fiscal year 2015 exceeds $2.3 million, although BLAs for drugs designated as orphan drugs are exempt from such fees. Establishment and product fees are subject to certain limited deferrals, waivers, and reductions that may be available. Similar fees may be required for marketing applications submitted in other countries. Each BLA submitted to the FDA for approval is reviewed for administrative completeness and reviewability within 60 days following submission of the application. If the FDA finds the filing complete, the FDA will “accept” the BLA for filing, thus triggering a full review of the application. The FDA may refuse to file any BLA that it deems incomplete or not properly reviewable at the time of submission. The FDA’s established goal is to review 90% of priority BLA applications in six months of the 60 day filing date and 90% of standard BLA applications in 10 months of the 60 day filing date, whereupon a review decision is to be made. The FDA, however, may not approve a drug within these established goals and its review goals are subject to change from time to time. Further, the outcome of the review, even if generally favorable, may not be an actual approval but an “action letter” that describes additional work that must be done before the application can be approved. In addition, the FDA may grant approval for indications that are not as broad as intended or entirely different than those indications for which the sponsor first sought approval. Before approving a BLA, the FDA may inspect the facilities at which the product is manufactured or tested and will not approve the product unless compliance with current good manufacturing processes (cGMP) is satisfactory. Additionally, the FDA may inspect the facilities at which certain nonclinical testing is conducted or sites involved in clinical trials as well as the sponsor and will not approve the product unless compliance with good laboratory practice (GLP) and good clinical practice (GCP) is satisfactory. The FDA may deny approval of a BLA if applicable statutory or regulatory criteria are not satisfied, or may require additional testing or information, which can delay the approval process. FDA approval of any application may include many delays or never
16
Table of Contents
be granted. If a product is approved, the approval will impose limitations on the indicated uses for which the product may be marketed, may require that warning statements be included in the product labeling, may require that additional studies be conducted following approval as a condition of the approval, and may impose restrictions and conditions on product distribution, prescribing, or dispensing in the form of a risk management plan, or otherwise limit the scope of any approval. Marketing a product for other indicated uses or making certain manufacturing or other changes requires FDA review and approval of a BLA supplement or new BLA. Further post-marketing testing and surveillance to monitor the safety or efficacy of a product is required. Also, product approvals may be withdrawn if compliance with regulatory standards is not maintained or if safety or manufacturing problems occur following initial marketing. In addition, new government requirements may be established that could delay or prevent regulatory approval of our product candidates under development.
As part of the Patient Protection and Affordable Care Act of 2010 under the subtitle of Biologics Price Competition and Innovation Act of 2009 (“BPCI”), a statutory pathway has been created for licensure, or approval, of biological products that are biosimilar to, and possibly interchangeable with, earlier biological products licensed under the Public Health Service Act. Also under the BPCI, innovator manufacturers of original reference biological products are granted a 12 year period of exclusivity from the date of approval of its biological product before biosimilar competition can enter the market in the U.S. under this statutory pathway. The objectives of the BPCI are conceptually similar to those of the Drug Price Competition and Patent Term Restoration Act of 1984, commonly referred to as the “Hatch-Waxman Act,” which established abbreviated pathways for the approval of drug products. The implementation of an abbreviated approval pathway for biological products is under the direction of the FDA and is currently being developed. The approval of a biologic product biosimilar to one of our products could have a material adverse impact on our business as it may be significantly less costly to bring to market and may be priced significantly lower than our products.
Both before and after the FDA approves a product, the manufacturer and the holder or holders of the BLA for the product are subject to comprehensive regulatory oversight. For example, quality control and manufacturing procedures must conform, on an ongoing basis, to cGMP requirements, and the FDA periodically inspects manufacturing facilities to assess compliance with cGMP. Accordingly, manufacturers must continue to spend time, money and effort to maintain cGMP compliance. In addition, pharmacovigilance and other requirements will be continuously monitored through inspections of the BLA holder or its contracted agents by the FDA. Similar requirements and inspectional obligations exist with other worldwide regulatory authorities.
Orphan Drug Act
The Orphan Drug Act provides incentives to manufacturers to develop and market drugs for rare diseases and conditions affecting fewer than 200,000 persons in the U.S. at the time of application for orphan drug designation. The first developer to receive FDA marketing approval for an orphan drug is entitled to a seven year exclusive marketing period in the U.S. for that product. However, a drug that the FDA considers to be clinically superior to, or different from, another approved orphan drug, even though for the same indication, may also obtain approval in the U.S. during the seven year exclusive marketing period. In addition, holders of exclusivity for orphan drugs are expected to assure the availability of sufficient quantities of their orphan drugs to meet the needs of patients. Failure to do so could result in the withdrawal of marketing exclusivity for the drug.
Legislation similar to the Orphan Drug Act has been enacted in other countries outside the U.S., including in the EU. The orphan legislation in the EU is available for therapies addressing chronic debilitating or life-threatening conditions that affect five or fewer out of 10,000 persons or are financially not viable to develop. The market exclusivity period is for 10 years, although that period can be reduced to six years if, at the end of the fifth year, available evidence establishes that the product is sufficiently profitable not to justify maintenance of market exclusivity. The market exclusivity may be extended to 12 years if sponsors complete a pediatric investigation plan agreed upon with the relevant committee of the EMA.
17
Table of Contents
Other Healthcare Laws and Compliance Requirements
If we obtain regulatory approval for any of our product candidates, we may be subject to various federal and state laws targeting fraud and abuse in the healthcare industry. These laws may impact, among other things, our proposed sales, marketing and education programs. In addition, we may be subject to patient privacy regulation by both the federal government and the states in which we conduct our business. The laws that may affect our ability to operate include:
| • | the federal Anti-Kickback Statute, which prohibits, among other things, persons from knowingly and willfully soliciting, receiving, offering or paying remuneration, directly or indirectly, to induce, or in return for, the purchase or recommendation of an item or service reimbursable under a federal healthcare program, such as the Medicare and Medicaid programs; |
| • | federal civil and criminal false claims laws and civil monetary penalty laws, which prohibit, among other things, individuals or entities from knowingly presenting, or causing to be presented, claims for payment from Medicare, Medicaid, or other third-party payers that are false or fraudulent; |
| • | the federal Health Insurance Portability and Accountability Act of 1996, or HIPAA, which created new federal criminal statutes that prohibit executing a scheme to defraud any healthcare benefit program and making false statements relating to healthcare matters; |
| • | the federal transparency laws, including the federal Physician Payment Sunshine Act, that requires drug manufacturers to disclose payments and other transfers of value provided to physicians and teaching hospitals; |
| • | HIPAA, as amended by the Health Information Technology and Clinical Health Act, or HITECH, and its implementing regulations, which imposes certain requirements relating to the privacy, security and transmission of individually identifiable health information; and |
| • | state law equivalents of each of the above federal laws, such as anti-kickback and false claims laws which may apply to items or services reimbursed by any third-party payer, including commercial insurers, and state laws governing the privacy and security of health information in certain circumstances, many of which differ from each other in significant ways and may not have the same effect, thus complicating compliance efforts. |
The Healthcare Reform Law broadened the reach of the fraud and abuse laws by, among other things, amending the intent requirement of the federal Anti-Kickback Statute and the applicable criminal healthcare fraud statutes. Under the statutory amendment, a person or entity no longer needs to have actual knowledge of this statute or specific intent to violate it in order to have committed a violation. In addition, the Healthcare Reform Law provides that the government may assert that a claim including items or services resulting from a violation of the federal Anti-Kickback Statute constitutes a false or fraudulent claim for purposes of the civil False Claims Act or the civil monetary penalties statute. Many states have adopted laws similar to the federal Anti-Kickback Statute, some of which apply to the referral of patients for healthcare items or services reimbursed by any source, not only the Medicare and Medicaid programs. We are also subject to the Foreign Corrupt Practices Act (FCPA), which prohibits improper payments or offers of payments to foreign governments and their officials for the purpose of obtaining or retaining business.
Foreign Regulation
In addition to regulations in the U.S., we are subject to a variety of foreign regulatory requirements governing human clinical trials, marketing approval for drugs, and fraud and abuse in the healthcare industry. The foreign regulatory approval process includes all of the risks associated with FDA approval set forth above, as well as additional country-specific regulations. Similarly, if our operations are found to be in violation of any foreign laws and regulations covering fraud and abuse, we would be subject to penalties and risks similar to those described above. Whether or not we obtain FDA approval for a product, we must obtain approval of a product by the comparable regulatory authorities of foreign countries before we can commence clinical trials or marketing of the product in those countries. The approval process varies from country to country, and the time may be longer or shorter than that required for FDA approval. The requirements governing the conduct of clinical trials, product licensing, pricing, and reimbursement vary greatly from country to country.
18
Table of Contents
Employees
As of December 31, 2014, we had 282 full-time employees. Approximately 168 were primarily engaged in research and development activities and 114 were primarily engaged in commercial, general and administrative activities. None of our employees are subject to a collective bargaining agreement, and we believe our employee relations to be good.
Available Information
Our internet website address is http://www.synageva.com. Through our website, we make available, free of charge, our annual reports on Form 10-K, quarterly reports on Form 10-Q, current reports on Form 8-K, any amendments to those reports, proxy and registration statements, and all of our insider Section 16 reports, as soon as reasonably practicable after such material is electronically filed with, or furnished to, the SEC. These SEC reports can be accessed through the “Investor Relations” section of our website. Additionally, our Board of Directors adopted a Code of Business Conduct and Ethics applicable to the Board of Directors, our officers and all other employees. The Code of Business Conduct and Ethics is available on our web site. We intend to disclose on our website any amendments or waivers to our Code of Business Conduct and Ethics that are required to be disclosed pursuant to SEC rules.
We use our internet website as a means of disclosing material non-public information and for complying with our disclosure obligations under Regulation Fair Disclosure promulgated by the SEC. These disclosures are included on our website in the “Investors & Media” section. Accordingly, investors should monitor this portion of our website, in addition to following our press releases, SEC filings and public conference calls and webcasts.
The information found on our website is not part of this or any other report we file with, or furnish to, the SEC. Paper copies of our SEC reports are available free of charge upon request in writing to Investor Relations, Synageva BioPharma Corp., 33 Hayden Avenue, Lexington MA 02421.
| ITEM 1A. | RISK FACTORS |
RISK FACTORS
Investing in our securities involves risk. Prior to making a decision about investing in our securities, you should carefully consider the specific risk factors discussed below and all of the other information contained or incorporated by reference in this Annual Report on Form 10-K. The risks and uncertainties we have described are not the only ones we face. Additional risks and uncertainties not presently known to us or that we currently deem immaterial may also affect our operations. If any of these risks were to occur, our business, financial condition or results of operations would likely suffer. In that event, the trading price of our common stock could decline, and you could lose all or part of your investment.
Risks Related to Research, Development and Commercialization of Product Candidates
We are largely dependent on the success of Kanuma. All of our product candidates, including Kanuma, are still in development. Preclinical and clinical trials of our product candidates may not be successful.
Our business prospects are largely dependent upon the successful development and commercialization of Kanuma. Before we can commercialize any of our product candidates, including Kanuma, we need to:
| • | conduct substantial research and development; |
| • | undertake preclinical and clinical testing and other costly and time consuming measures; |
| • | scale-up and transfer manufacturing processes while maintaining consistent product quality; and |
| • | pursue and obtain marketing and manufacturing approvals and, in some jurisdictions, pricing and reimbursement approvals. |
19
Table of Contents
This process involves a high degree of risk and takes many years. Our product development efforts with respect to a product candidate may fail for many reasons, including:
| • | failure of the product candidate in preclinical studies; |
| • | failure to obtain, or delays in obtaining, the required regulatory approvals to initiate or continue clinical studies for the product candidate; |
| • | failure of later trials to confirm positive results from earlier preclinical studies or clinical trials; |
| • | delays or difficulty enrolling patients in clinical trials, particularly for disease indications with small patient populations; |
| • | failure to identify a sufficient number of patients who meet the clinical trial enrollment criteria and/or who would support commercial launch and subsequent commercialization efforts; |
| • | patients exhibiting adverse reactions to the product candidate or indications of other safety concerns; |
| • | insufficient clinical trial data to support the safety, effectiveness or superiority of the product candidate; |
| • | inability to produce proteins with favorable or superior characteristics using our proprietary EW manufacturing platform; |
| • | failure to obtain, or delays in obtaining, the required regulatory approvals for the product candidate, or the facilities or processes used to manufacture the product candidate; or |
| • | changes in the regulatory or pricing and reimbursement environments could make development of a new product or further development of an existing product for a new indication no longer desirable. |
Few research and development projects result in commercial products, and success in preclinical studies or clinical trials often is not replicated in later studies.
We may decide to abandon development of a product candidate or service at any time, or we may be required to expend considerable resources repeating clinical trials or conducting additional trials, either of which would increase costs of development and delay any revenue from those programs. In addition, a regulatory authority may delay or deny an approval because it is not satisfied with the design, conduct, or results of clinical trials or due to its assessment of the data we supply.
We have neither obtained marketing approval, nor commercialized any of our current product candidates.
We recently submitted a BLA to the FDA and an MAA to the EMA for Kanuma as a treatment for patients with LAL Deficiency, but we have neither obtained marketing approval nor commercialized any of our current product candidates and do not know if or when we will receive marketing approval or generate revenue from the direct sale of an approved product, including Kanuma. We have only limited clinical experience. Our limited experience might prevent us from successfully designing or implementing a clinical trial for any of these indications. We may not be able to demonstrate that our product candidates meet the appropriate standards for regulatory approval, including because we may be unsuccessful in convincing regulatory authorities of the adequacy of the design of our trials or the sufficiency of the data generated from our clinical and other studies. If we are not successful in conducting and managing our preclinical development activities or clinical trials or obtaining regulatory approvals, we might not be able to commercialize our lead programs, or might be significantly delayed in doing so, which will materially harm our business.
If our preclinical or clinical studies do not produce positive results or are delayed or if serious side effects are identified during drug development, we may experience delays, incur additional costs, receive a narrow label, or ultimately be unable to obtain regulatory approval and commercialize our product candidates.
Before obtaining regulatory approval for the sale of our product candidates, we must conduct, at our own expense, extensive preclinical tests to demonstrate the safety of our product candidates in animals, and clinical trials to demonstrate the safety and efficacy of our product candidates in humans. Preclinical and clinical testing is expensive, difficult to design and implement and can take many years to complete. A failure of one or more preclinical studies or clinical trials can occur at any stage of testing. We may experience numerous events during, or as a result of,
20
Table of Contents
preclinical testing and the clinical trial process, including for potential new indications, which could delay or prevent our receipt of regulatory approval for, or the commercialization of, our product candidates, including:
| • | our preclinical tests or clinical trials may produce negative or inconclusive results, and we may decide or regulators may require us, to conduct additional preclinical testing prior to initiating clinical trials, or to suspend ongoing studies; |
| • | we may decide, or regulators may require us, to change the design of our preclinical studies or clinical trials in ways that may slow their progress, delay the initiation of clinical trials, or we may abandon projects that we expect to be promising; |
| • | a regulatory authority or institutional review board may not authorize us to commence a clinical trial or conduct a clinical trial at a prospective trial site; |
| • | conditions imposed on us by the FDA or any non-U.S. regulatory authority regarding the scope or design of our clinical trials may require us to resubmit our clinical trial protocols to these authorities or to institutional review boards or ethics committees for re-review due to changes in the regulatory environment; |
| • | the number of patients required for clinical trials may be larger than we anticipate or are able to enroll, or participants may drop out of, or not qualify for, clinical trials at a higher rate than we anticipate; |
| • | our third-party contractors or clinical investigators may fail to comply with regulatory requirements or fail to meet their contractual obligations to us in a timely manner or at all; |
| • | we might have to suspend or terminate one or more of our clinical trials if we, a regulatory authority or an institutional review board or ethics committee determine that the participants are being exposed to unacceptable health risks; |
| • | a regulatory authority or institutional review board or ethics committee may require that we hold, suspend or terminate clinical research for various reasons, including noncompliance with regulatory requirements; |
| • | a regulatory authority may require that we conduct additional clinical research to provide additional information regarding the efficacy or safety of Kanuma; |
| • | the cost of our clinical trials may be greater than we anticipate; |
| • | the supply or quality of our product candidates or other materials necessary to conduct our clinical trials may be insufficient or inadequate or we may not be able to reach agreements on acceptable terms with prospective contract manufacturing organizations; |
| • | we may not be able to produce, or sufficiently test, comparable or consistent drug materials derived from different manufacturing facilities operated by us or from processes run by third party manufacturers which could impact our ability or timing with respect to receiving regulatory approval for our product candidates; |
| • | we may not be able to reach agreements on acceptable terms with prospective clinical research organizations; |
| • | if approved, we may not be able to reach agreements on acceptable terms with commercial distributors and other logistics providers; or |
| • | the effects of our product candidates may not be the desired effects, may include undesirable side effects, or the product candidates may have other unexpected characteristics. |
We may obtain approval for indications that are not as broad as intended or entirely different than those indications for which we sought approval. For example, even though we met the pre-specified primary and six secondary endpoints in the Phase 3 clinical trial for children and adults, potential regulatory approval could be limited to the treatment of LAL Deficiency only in infants, and that would represent a small portion of the total LAL Deficiency patient population. If we are required to conduct additional clinical trials or other testing of our product candidates beyond those that we currently contemplate or are unable to successfully complete our clinical trials or other testing or if the results of these trials or tests are not positive or are only modestly positive or if there are safety concerns, we may:
| • | be delayed in obtaining, or may not be able to obtain, marketing approval for one or more of our product candidates; |
| • | incur substantial additional costs in conducting such additional clinical trials or other testing; |
21
Table of Contents
| • | obtain regulatory approval for only a narrower indication or an indication that might be otherwise qualified or constrained; or |
| • | have the product removed from the market after obtaining marketing approval. |
Our product development costs will also increase if we experience delays in testing or approvals. We do not know whether any preclinical tests or clinical trials will be initiated as planned, will need to be restructured or will be completed on schedule, if at all. Due to the limited term of a patent, significant preclinical or clinical trial delays could also shorten the period of time from marketing approval to patent expiration, during which we may benefit from patent protection of our product candidates. Such delays could allow our competitors to bring products to market before we do and impair our ability to commercialize our products or product candidates.
We may find it difficult to enroll patients in our clinical trials.
Potential patients for our product candidates may not be adequately diagnosed or identified with the diseases being targeted by our product candidates. Kanuma is being developed to treat LAL Deficiency, which is very rare. Based on prevalence estimates published in the medical literature, we estimate there are at least 3,000 children and adults with LAL Deficiency in the major reimbursable markets. In addition, we are recruiting patients to enroll in our Phase 1/2 trial for MPS IIIB. We may not be able to initiate or continue clinical trials if we are unable to locate a sufficient number of eligible patients to participate in the clinical trials required by the FDA or other non-U.S. regulatory agencies. In addition, the process of finding and diagnosing patients may prove costly. Our inability to enroll a sufficient number of patients for any of our current or future clinical trials would result in significant delays or may require us to abandon one or more clinical trials altogether.
The results of our clinical trials may not prove sufficient to obtain regulatory approval of our product candidates, and subsequent trials may fail to replicate promising data seen in earlier preclinical studies and clinical trials.
Promising results in our preclinical studies or clinical trials may not be replicated in ongoing and future studies or trials, and final data analysis may differ from interim data analysis. Even though we have reported positive top-line results from our Phase 3 clinical trial in children and adults with LAL Deficiency and our Phase 2/3 trial in infants with LAL Deficiency, and even if our other clinical trials for Kanuma are conducted and completed as planned, the results may not prove sufficient to obtain regulatory approval or result in a restricted product label that could negatively impact commercialization. Success in preclinical testing does not ensure success in clinical trials, and success in early stage clinical trials does not ensure success in later clinical trials. This can be due to a variety of reasons, including variations in patient populations, or the inability of certain patients to complete all assessments required by the clinical trial protocol, adjustments to clinical trial protocols or designs as compared to earlier testing or trials, variations in the data that could produce inconclusive or uninterpretable results, or the use of additional trial sites or investigators. Clinical trial data are subject to differing interpretations, and regulatory agencies may not concur with our analysis of clinical trial data or its implications, which may result in delays in the regulatory approval process. Ongoing and future studies, including for new indications, may, for example, indicate safety concerns that regulatory authorities view as unacceptable. Final data analysis of our completed, ongoing and future clinical trials may fail to demonstrate that our product candidates are sufficiently safe and effective for pursued or new indications. Any such failure could cause us to abandon a product candidate, substantially delay development of other product candidates, or require substantial expenditures to conduct additional trials. Both preclinical and clinical data are often susceptible to varying interpretations that may delay, limit or prevent initiation of clinical trials, regulatory approvals or commercialization. Any delay in, or termination of, our clinical trials would delay our obtaining regulatory approval of the affected product candidate and, consequently, our ability to commercialize that product candidate and potentially our other product candidates. Development and commercialization of therapies for rare diseases requires expenditure of significant funds with no assurance of success.
22
Table of Contents
A regulatory authority may deny or delay approval of our product candidates, including Kanuma, because it is not satisfied with the structure or conduct of our clinical trials or due to its assessment of the data we supply, or may determine to approve our product candidates for use in narrow patient populations.
A regulatory authority may not agree with the design or endpoints of our clinical trials. We sought advice from EMA for our Kanuma development plan, including the Phase 3 clinical trial design for Kanuma in children and adults with LAL Deficiency and EMA was supportive of our plan in principle. We did not seek a special protocol assessment with the FDA and do not have agreement with the FDA regarding the design or primary endpoint utilized in the Phase 3 clinical trial. Accordingly, we believe that we will need to demonstrate efficacy based on a totality of evidence including success on multiple endpoints in our clinical studies to support a favorable risk-benefit profile and provide substantial evidence of efficacy of Kanuma for the treatment of LAL Deficiency, including data from the Phase 3 clinical trial in children and adults, the Phase 2/3 open-label trial in infants with LAL Deficiency, as well as from the natural history studies for LAL Deficiency. Based on FDA feedback, it will be essential to link the primary endpoint for the Phase 3 clinical trial, ALT normalization, to other evidence of clinical benefit. We also will need to provide evidence to the FDA demonstrating that ALT normalization, alone or in combination with other endpoints, is reasonably likely to predict clinical benefit. If we are unable to do so, even though we met the pre-specified primary endpoint and six secondary endpoints in the Phase 3 clinical trial and the primary endpoint in the Phase 2/3 study in infants, we may not receive regulatory approval or we may receive narrower labeling with respect to the total LAL Deficiency patient population, unless and until we successfully complete additional clinical trials, if ever. In addition, regulatory authorities may not believe that we have provided sufficient safety data or adequately demonstrated clinical benefit in the patient population studied in the clinical trial. Clinical data is subject to varied interpretations, and regulatory authorities may disagree with our assessments of data. In any such case, a regulatory authority could insist that we provide additional data or conduct additional clinical studies, which could substantially delay or even prevent commercialization efforts, particularly if we are required to conduct additional pre-approval clinical studies. A positive opinion by the Committee for Medicinal Products for Human Use (CHMP) is required for EMA approval and requires agreement among a majority of CHMP members, each of whom may have differing opinions on the strength of the evidence we may provide.
Priority review for our drug product candidates may not actually lead to a faster review process, if at all.
The FDA has accepted for review the BLA for Kanuma for the treatment of LAL Deficiency. The FDA granted our request for Priority Review, which shortens the regulatory review period. The FDA established a target action date of September 8, 2015 under the PDUFA. The FDA review timeline for first cycle review could be longer and the FDA could issue a complete response letter requiring additional data to be submitted.
Because FDA also requires parallel approval of a New Animal Drug Application (NADA) for transgenic products such as Kanuma, this could create delays in the review and approval process for the BLA. A lengthier review process will delay revenue from the sale of products and will increase the capital necessary to fund our product development programs. In addition, Kanuma received Fast Track Designation by the FDA, and Breakthrough Therapy designation by the FDA for LAL Deficiency presenting in infants. The practical implications of Fast Track and Breakthrough Therapy designation on the regulatory review and approval process cannot be determined at this time and may not lead to a faster review or approval. In addition, the approval of the NADA and BLA will require successful completion of inspections and resolution of any significant issues raised during these inspections.
We also recently submitted an MAA to the EMA for Kanuma as a treatment for patients with LAL Deficiency. The EMA recently validated the MAA and granted our request for accelerated assessment, which has the potential to shorten the EMA’s regulatory review time. However, the review timelines to reach a CHMP opinion and EMA action will depend in part on how efficiently we respond to questions which stop the clock during the review. In addition, the approval of the MAA will require successful completion of inspections and resolution of any significant issues raised during these inspections.
23
Table of Contents
Our product candidates, including Kanuma, if approved by any regulatory authorities could be subject to labeling and other restrictions, and we will be subject to ongoing regulatory obligations, oversight and continued regulatory review, which may result in significant additional expense.
Any regulatory approvals that we obtain for our product candidates will be subject to limitations on the approved indicated uses or patient population for which the product may be recommended for use or marketed, or to the conditions of approval, including a possible risk evaluation and mitigation strategy or post-marketing commitments, requirements, or follow-up measures. In addition, if the FDA, EMA or other regulatory authorities approve a product candidate, the manufacturing processes, labeling, packaging, distribution, storage, adverse event reporting, dispensation, distribution, advertising, promotion and recordkeeping for the product will be subject to extensive and ongoing regulatory requirements. These requirements will include submissions of safety and other post-marketing information and reports, ongoing maintenance of product registration, as well as continued compliance with current good manufacturing practices (cGMPs), good clinical practices (GCPs) and good laboratory practices (GLPs). If we do not comply with the applicable regulations and requirements, the range of possible sanctions includes issuance of adverse publicity, product recalls or seizures, fines, total or partial suspensions of production and/or distribution, suspension of marketing applications, and enforcement actions, including injunctions and civil or criminal prosecution. The FDA and comparable international regulatory agencies can withdraw a product’s approval under some circumstances, such as the failure to comply with regulatory requirements or unexpected safety issues.
Regulatory approvals could also contain requirements for potentially costly post-marketing testing, including Phase 4 clinical trials and extraordinary requirements for surveillance to monitor the safety and efficacy of the drug product. Post-marketing studies and/or post-market surveillance may suggest that a product causes undesirable side effects which present an increased risk to the patient. If data we collect from post-marketing studies suggest that one of our approved products may present a risk to safety, the regulatory authorities could withdraw our product approval, suspend production or place other labeling or marketing restrictions on our products. If regulatory sanctions are applied or if regulatory approval is delayed or withdrawn, the value of our Company and our business, financial condition and operating results will be adversely affected.
If the market opportunities for our product candidates are smaller than we believe they are, our revenues may be adversely affected and our business may suffer.
We focus our research and product development on treatments for rare diseases. Our projections of both the number of people who have these diseases, as well as the subset of people with these diseases who have the potential to benefit from treatment with our product candidates, are based on estimates. In addition, the awareness of LAL Deficiency among treating health care providers is low. Currently, most reported estimates of the prevalence of these diseases are based on studies of small subsets of the population of specific geographic areas, which are then extrapolated to estimate the prevalence of the diseases in the broader world population. Based on prevalence estimates published in the medical literature, we estimate there are at least 3,000 children and adults with LAL Deficiency in the major reimbursable markets. In addition, there is no prevalent population for infants with LAL Deficiency, since these infants almost never survive beyond the first year of life. These estimates may prove to be incorrect and new studies may change the estimated prevalence of these diseases. If the estimates are incorrect, and the prevalence rate is lower than we anticipate, or if an approved indication is limited in any way, our commercial business may suffer.
The commercial success of any product candidate that we may develop, including Kanuma, will depend upon the degree of market acceptance by physicians, patients, third party payors and others in the medical community.
Any future product that we may bring to the market, including Kanuma, may not gain market acceptance by physicians, patients, third party payors and others in the medical community. If our products do not achieve an adequate level of acceptance, we may not generate significant product revenue and may not become profitable. The degree of market acceptance of these product candidates, if approved for commercial sale, will depend on a number of factors, including:
| • | the prevalence and severity of any side effects of the product, including any limitations or warnings contained in a product’s approved labeling; |
| • | the perception of clinical benefit, safety, and potential advantages over alternative treatments; |
24
Table of Contents
| • | relative convenience and ease of administration; |
| • | the willingness of the target patient population to try new therapies and of physicians to prescribe these therapies; |
| • | the strength of marketing and distribution support and timing of market introduction of competitive products; |
| • | publicity concerning our products or competing products and treatments; and |
| • | sufficient third party insurance coverage or reimbursement in the countries or geographies where patients live. |
Even if a potential product displays a favorable efficacy and safety profile in preclinical and clinical trials, market acceptance of the product will not be known until after it is launched. Our efforts to educate the medical community and third party payors on the benefits of the product candidates may require significant resources and may never be successful. Such efforts to educate the marketplace may require more resources than are required by the conventional technologies marketed by our competitors.
Uncertainties relating to third-party reimbursement and health care reform measures could limit payments or reimbursements for future products that we may develop could materially adversely affect our business.
In the U.S. and elsewhere, sales of prescription drugs depend in part on the consumers’ ability to obtain reimbursement for the cost of the drugs from third-party payors, such as private and government insurance programs. Third-party payors are increasingly challenging the prices charged for medical products and services, including those related to rare diseases, in an effort to promote cost containment measures and alternative health care delivery systems. Our prospects for achieving profitability will depend heavily upon the availability of adequate reimbursement for the use of our approved product candidates from governmental and other third party payors, both in the U.S. and in other markets. Reimbursement by a third party payor may depend upon a number of factors, including the third party payor’s determination that use of a product is:
| • | a covered benefit under its health plan; |
| • | safe, effective and medically necessary; |
| • | appropriate for the specific patient; |
| • | cost-effective; and |
| • | neither experimental nor investigational. |
Obtaining reimbursement approval for a product from each governmental or other third party payor is a time consuming and costly process that could require us to provide supporting scientific, clinical and cost effectiveness data for the use of our products to each payor. We may not be able to provide data sufficient to gain acceptance with respect to reimbursement or might need to conduct post-marketing studies in order to demonstrate the cost-effectiveness of any future products to such payors’ satisfaction. Such studies might require us to commit a significant amount of management time and financial and other resources. Even when a payor determines that a product is eligible for reimbursement, the payor may impose coverage limitations that preclude payment for some uses that are approved by the FDA or non-U.S. regulatory authorities. In addition, there is a risk that full reimbursement may not be available for high priced products. Moreover, eligibility for coverage does not imply that any product will be reimbursed in all cases or at a rate that allows us to make a profit or even cover our costs. Interim payments for new products, if applicable, may also not be sufficient to cover costs and may not be made permanent. Third party payors may attempt to contain health care costs by demanding price discounts or rebates and limiting both the types and variety of drugs that they will cover and the amounts that they will pay for drugs. As a result, they may not cover or provide adequate payment for our products. Our products might not ultimately be considered cost-effective. Adequate third-party reimbursement might not be available to enable us to maintain price levels sufficient to realize an appropriate return on our investment in product development.
Reimbursement rates vary according to the use of the drug and the clinical setting in which it is used, may be based on payments allowed for lower-cost products that already are reimbursed, may be incorporated into existing payments for other products or services and may reflect budgetary constraints and/or imperfections in the data used to calculate these rates. Net prices for products are reduced by mandatory discounts or rebates required by government
25
Table of Contents
health care programs and privately-negotiated discounts. The U.S. federal government, state governments and private payors frequently pursue actions against pharmaceutical and biotechnology companies alleging that the companies have overstated prices in order to inflate reimbursement rates. Any such action could adversely affect the pricing of and revenues from our products.
Specialty pharmaceuticals are drugs that are prescribed by specialist physicians to treat rare or life-threatening conditions and typically address smaller patient populations. Each of our product candidates is a specialty pharmaceutical product. The increasing availability and use of innovative specialty pharmaceuticals, combined with their relative higher cost as compared to other types of pharmaceutical products, is beginning to generate significant third party payor interest in developing cost-containment strategies targeted to this sector. The increasing use of health technology assessments in markets around the world and the financial challenges faced by many governments may lead to significant adverse effects on our business.
Any legislation or regulatory changes or relaxation of laws that restrict imports of drugs from other countries also could reduce the net price we receive for our products.
We are subject to regulations regarding the manufacturing of therapeutic proteins and, if we are unable to comply, or if we or any third party provider fails to provide sufficient quantities of material, we may experience delays and incur additional costs.
We and our third party suppliers are subject to ongoing periodic unannounced inspections by the FDA, corresponding state agencies or non-U.S. regulatory authorities to ensure strict compliance with cGMPs and other government regulations and corresponding foreign standards. The cGMP requirements govern manufacturing, quality control and documentation policies and procedures. Complying with cGMP and non-U.S. regulatory requirements will require that we expend time, money, and effort in production, recordkeeping, and quality control to assure that the product candidate or any approved product meets applicable specifications and other requirements. We and our contract manufacturers and testing laboratories must also pass pre-approval inspections prior to regulatory approvals. Failure to pass a pre-approval inspection might significantly delay regulatory approval of our product candidates. If we or our contract manufacturers or testing laboratories fail to comply with these requirements, we would be subject to possible regulatory action and might be limited in the jurisdictions in which we are permitted to sell our products. As a result, our business, financial condition, and results of operations might be materially harmed.
We currently manufacture the therapeutic protein product candidates that we are developing using both internal resources and external contract manufacturers; however, we have limited experience in manufacturing or procuring products in commercial quantities and our manufacturing system has never been utilized to produce a product approved by regulatory authorities for commercial use. We may not be able to manufacture enough product to conduct clinical trials or for later commercialization at an acceptable cost or at all. We may also experience shortages in supply of our products which would have a material adverse impact on our business, financial condition and financial operations. We may not be able to produce, or sufficiently test comparable drug materials derived from different manufacturing facilities operating by us or from processes run by our third party manufacturing partners, which could impact our ability or timing with respect to receiving regulatory approval for our product candidates. In addition, a number of other factors could cause production interruptions at our facilities or the facilities of our third-party providers, including equipment malfunctions, facility or product contamination, labor problems, raw material shortages or contamination, natural disasters, disruption in utility services, terrorist activities, human error or disruptions in the operations of our suppliers. Our product candidates are biologics and are very difficult to manufacture. We employ multiple steps to attempt to control the manufacturing processes. Problems with these manufacturing processes, even minor deviations from the normal process, could result in product defects, contamination or manufacturing failures that result in lot failures, product recalls, product liability claims and insufficient material for clinical trials or commercial use. Certain of the raw materials required in the manufacturing and the formulation of our product candidates are derived from biological sources, including egg white and human serum albumin. Such raw materials are difficult to procure and may be subject to contamination or recall. Also, some countries in which we may operate could restrict the use of certain biologically derived substances in the manufacture of drugs. A material shortage, contamination, recall, or restriction on the use of certain biologically derived substances in the manufacture of our products could adversely impact or disrupt manufacturing or could result in a withdrawal of our product candidates or any approved products. As a result, our business, financial condition, and results of operations might be materially harmed.
26
Table of Contents
Our current and anticipated future reliance on a limited number of third parties to complete the manufacturing process for our products exposes us to certain risks.
We currently rely on third parties to complete the manufacturing process, including purifying, finishing, filling, labeling and testing our products. We have recently entered into agreements with third parties related to these steps for the commercial supply of Kanuma, and as we do not have experience in producing Kanuma for commercial use, we may experience unanticipated delays or issues in this process. Our reliance on a limited number of third-party manufacturers exposes us to the following risks:
| • | We might be unable to identify or enter into agreements with manufacturers for clinical or commercial supply on acceptable terms or at all because the number of potential manufacturers is limited and the FDA and other regulatory authorities must approve any replacement contractor. This approval would generally require new testing and compliance inspections. In addition, a new manufacturer would have to be educated in, or develop substantially equivalent processes for, production of our products prior to receipt of FDA approval, if any. |
| • | Our third-party manufacturers might be unable to formulate and manufacture the relevant drugs in the volume and of the quality required to meet our clinical and commercial needs, if any. |
| • | Our third-party contract manufacturers might not perform as agreed or might not remain in the contract manufacturing business for the time required to supply possible clinical trials or to successfully produce, store and distribute our products. |
| • | Drug manufacturers are subject to ongoing periodic unannounced inspections by regulatory authorities, corresponding state agencies and non-U.S. regulatory authorities to ensure strict compliance with cGMP, and other government regulations and corresponding foreign standards. We do not have complete or direct control over third-party manufacturers’ compliance with these regulations and standards. |
| • | If any third-party manufacturer makes improvements in the manufacturing process for the relevant products, we might not own, or might have to share, the intellectual property rights to the innovation with our licensors. |
| • | We might compete with other companies for access to these manufacturers’ facilities and might be subject to manufacturing delays if the manufacturers give other clients higher priority than us. |
Each of these risks could delay our clinical trials or the approval, if any, of our product candidates by the FDA or the commercialization of our product candidates and could result in higher costs or deprive us of potential product revenues. As a result, our business, financial condition, and results of operations might be materially harmed.
Even if we obtain regulatory approval for our product candidates, if we are unable to successfully develop internal and external commercialization capabilities, we will be unable to successfully commercialize them.
We currently have limited internal capabilities for the commercialization of any product candidates that may be approved. In order to commercialize a product if approved, we must develop our sales, marketing, contracting, distribution and reimbursement capabilities. We will need to commit significant time and financial and managerial resources to develop a medical affairs team, a marketing and sales force with technical expertise, and sufficient distribution capabilities.
Factors that may inhibit our efforts to develop our commercialization capabilities include:
| • | our inability to recruit and retain adequate numbers of effective medical and commercial personnel or manage a potential substantial increase in our number of full-time employees in a short period; |
| • | our inability to train sales personnel, who may have limited experience with us or our future products, to deliver a consistent message regarding the underlying disease that complies with regulatory requirements and be effective (after regulatory approval) in convincing physicians to prescribe our future products; |
| • | our inability to equip medical and sales personnel with effective materials, including medical and sales literature to help them educate physicians and other healthcare providers regarding applicable rare diseases and our future products; |
| • | our inability to develop or obtain sufficient operational functions to support our commercial activities; and |
| • | unforeseen costs and expenses associated with creating and sustaining an independent sales and marketing organization. |
27
Table of Contents
If we are not successful in building a medical affairs and sales, marketing and other commercial infrastructure, we will have difficulty commercializing any future products, which would adversely affect our business and financial condition.
In addition, we plan to rely on third parties to help distribute our future products to patients. We expect that we will need to contract with third-party logistics companies to warehouse and distribute any approved products, and coordinate prescription intake and distribution, reimbursement adjudication, patient financial support, and ongoing compliance support. This distribution network will require significant coordination with our sales and marketing and finance organizations. If we are unable to effectively establish and manage the distribution process, the commercial launch and sales of any future products we may commercialize, will be delayed or severely compromised and our results of operations may be harmed.
We may be subject, directly or indirectly, to healthcare fraud and abuse laws, false claims laws, and health information privacy and security laws. If we are unable to comply, or have not fully complied, with such laws, we could face substantial penalties and it could affect our ability to develop, market and sell our potential products.
Our operations may be directly, or indirectly through our customers, subject to various federal and state fraud and abuse laws, including, without limitation, the federal Anti-Kickback Statute, the federal False Claims Act, and physician sunshine laws and regulations. The laws and regulations concerning promotion and marketing of drug products and dialogistic tests may impact, among other things, our disease awareness and education programs, as well as our proposed sales and marketing activities for any of our products that might receive regulatory approval, including Kanuma. In addition, we may be subject to patient privacy regulation by both the federal government and the states in which we conduct our business. The laws that may affect our ability to operate include, but are not necessarily limited to:
| • | federal healthcare program anti-kickback law, which prohibits, among other things, persons from soliciting, receiving or providing remuneration, directly or indirectly, to induce either the referral of an individual for a healthcare item or service, or the purchasing or ordering of an item or service, for which payment may be made under a federal healthcare program such as Medicare or Medicaid; |
| • | federal false claims law, which prohibits, among other things, individuals or entities from knowingly presenting or causing to be presented, claims for payment by government funded programs such as Medicare or Medicaid that are false or fraudulent, and which may apply to us by virtue of statements and representations made to customers or third parties; |
| • | the federal Health Insurance Portability and Accountability Act of 1996 (HIPAA) and the Health Information Technology and Clinical Health (HITECH) Act, which prohibit executing a scheme to defraud healthcare programs; impose requirements relating to the privacy, security, and transmission of individually identifiable health information; and require notification to affected individuals and regulatory authorities of certain breaches of security of individually identifiable health information; |
| • | the federal physician sunshine requirements under the health care reform laws requires manufacturers of drugs, devices, biologics, and medical supplies to report annually to the U.S. Department of Health and Human Services information related to payments and other transfers of value to physicians, other healthcare providers, and teaching hospitals, and ownership and investment interests held by physicians and other healthcare providers and their immediate family members and applicable group purchasing organizations; and |
| • | state laws comparable to each of the above federal laws, such as, for example, anti-kickback and false claims laws applicable to commercial insurers and other non-federal payors, requirements for mandatory corporate regulatory compliance programs, and laws relating to patient data privacy and security. Similar strict restrictions are imposed on the promotion and marketing of drug products in the EU and other countries. Violations of the rules governing the promotion of drug products in the EU could be penalized by administrative measures, fines and imprisonment. In addition, many countries have strict data privacy laws and violators could be subject to administrative measures and fines. |
Interactions between pharmaceutical companies and physicians are also governed by strict laws, regulations, industry self-regulation codes of conduct and physicians’ codes of professional conduct in the individual EU member states. The provision of any inducements to physicians to prescribe, recommend, endorse, order, purchase, supply, use
28
Table of Contents
or administer a drug product is prohibited. A number of EU member states have introduced additional rules requiring pharmaceutical companies to publicly disclose their interactions with physicians and to obtain approval from employers, professional organizations and/or competent authorities before entering into agreements with physicians. Violations of these rules could lead to the imposition of fines or imprisonment.
Laws, including those governing promotion, marketing and anti-kickback provisions, industry regulations and professional codes of conduct are often strictly enforced. Increasing regulatory scrutiny of the promotional activities of pharmaceutical companies has been observed in the U.S. and a number of EU member states. We are also subject to the Foreign Corrupt Practices Act, the U.K. Bribery Act, and other anti-corruption laws and regulations pertaining to our efforts in this area. For example, the Bribery Act in the United Kingdom entered into force in July 2011 applies to any company incorporated in or “carrying on business” in the United Kingdom, regardless of the country in which the alleged bribery activity occurs and even if the inappropriate activity is undertaken by our international distribution partners.
Risks Related to Intellectual Property and Orphan Drug Exclusivity
If we infringe the rights of third parties we might have to forgo selling our future products, pay damages, or defend litigation.
If our product candidates, methods, processes, or other technologies infringe the proprietary rights of other parties, we could incur substantial costs and might have to:
| • | obtain rights or licenses from such third parties, which might not be available on commercially reasonable terms, if at all; |
| • | abandon an infringing product candidate; |
| • | redesign products or processes to avoid infringement; |
| • | stop using the subject matter claimed in the patents held by others; |
| • | pay damages; and/or |
| • | engage in litigation or administrative proceedings which might be costly whether we win or lose, and which could result in a substantial diversion of financial and management resources. |
Any of these events could substantially harm our earnings, financial condition, and operations.
Our business depends on protecting our intellectual property.
We and our licensors are pursuing intellectual property protection for Kanuma and other product candidates in the form of patent applications that have been and will continue to be filed in the U.S. and in other countries; however, there can be no assurance that patents will issue with the scope for which they are originally filed, if at all.
If we and our licensors do not obtain protection for our respective intellectual property rights and our products are not, or are no longer, protected by regulatory exclusivity protection, such as orphan drug protection, our competitors might be able to develop and commercialize competing drugs.
Our success, competitive position, and future revenues, if any, depend in part on our ability and the abilities of our licensors to obtain and maintain patent protection for our products, methods, processes, and other technologies, to preserve our trade secrets, to prevent third parties from infringing on our proprietary rights, and to operate without infringing on the proprietary rights of third parties. We currently hold various issued patents and exclusive licenses to issued patents and own and have exclusive licenses to various patent applications, in each case in the U.S. as well as rights under foreign patents and patent applications. We anticipate filing additional patent applications both in the U.S. and in other countries, as appropriate. However, the patent process is subject to numerous risks and uncertainties, and there can be no assurance that we will be successful in protecting our products by obtaining and defending patents. These risks and uncertainties include the following:
| • | our patent rights might be challenged, invalidated, or circumvented, or otherwise might not provide any competitive advantage; |
29
Table of Contents
| • | our competitors, many of which have substantially greater resources than we do and many of which might make significant investments in competing technologies, might seek, or might already have obtained, patents that will limit, interfere with, make obsolete, or eliminate our ability to make, use, and sell our potential products either in the U.S. or in international markets; |
| • | governments may adopt regulations requiring compulsory licensing of IP rights, and governments or courts may render decisions enforcing those regulations; |
| • | as a matter of public policy regarding worldwide health concerns, there might be significant pressure on the U.S. government and other international governmental bodies to limit the scope of patent protection both inside and outside the U.S. for disease treatments that prove successful; and |
| • | countries other than the U.S. might have less restrictive patent laws than the U.S., giving foreign competitors the ability to exploit these laws to create, develop, and market competing products. |
In addition, the USPTO and patent offices in other jurisdictions have often required that patent applications concerning pharmaceutical and/or biotechnology-related inventions be limited or narrowed substantially to cover only the specific innovations exemplified in the patent application, thereby limiting the scope of protection against competitive challenges. Thus, even if we or our licensors are able to obtain patents, the patents might be substantially narrower than anticipated.
Patent and other intellectual property protection is crucial to the success of our business and prospects, and there is a risk that such protections will prove inadequate. Our business and prospects might be materially harmed if these protections prove insufficient.
On September 16, 2011, the Leahy-Smith America Invents Act, or the Leahy-Smith Act, was signed into law. The Leahy-Smith Act includes a number of significant changes to United States patent law, including provisions that affect the way patent applications will be prosecuted and may also affect patent litigation. The USPTO has issued regulations and procedures to govern administration of the Leahy-Smith Act, but many of the substantive changes to patent law associated with the Leahy-Smith Act have only recently become effective. Accordingly, it is not clear what, if any, impact the Leahy-Smith Act will have on the operation of our business. However, the Leahy-Smith Act and its implementation could increase the uncertainties and costs surrounding the prosecution of our patent applications and the enforcement or defense of our issued patents, all of which could have a material adverse effect on our business and financial condition.
We rely on trade secret protections through confidentiality agreements with our employees and third parties, and the breach of these agreements could adversely affect our business and prospects.
We rely on trade secrets, which we seek to protect, in part, through confidentiality and non-disclosure agreements with our employees, collaborators, suppliers, and other parties. There can be no assurance that these agreements will not be breached, that we would have adequate remedies for any such breach, or that our trade secrets will not otherwise become known to or independently developed by our competitors. We might be involved from time to time in litigation to determine the enforceability, scope, and validity of our proprietary rights. Any such litigation could result in substantial cost and divert management’s attention from operations. If any of these events occurs, or we otherwise lose protection for our trade secrets or proprietary know-how, the value of this information may be greatly reduced.
We are dependent on certain license relationships.
We have licensed technology that is related to our proprietary expression technology from the University of Georgia, University of Minnesota and Pangenix. In addition, we obtained exclusive worldwide rights to multiple patents and patent applications relating to the use of LAL for the treatment of LAL Deficiency and atherosclerosis from Shire Human Genetics Therapies, Inc. and its affiliates and Cincinnati Children’s Hospital Research Foundation. We might enter into additional licenses in the future. Licenses to which we are a party contain, and we expect that any future licenses will contain, provisions requiring up-front, milestone, and royalty payments to licensors and other conditions to maintaining the license rights. If we fail to comply with our obligations under any such license, the applicable licensor may have the right to terminate the license on relatively short notice and as a result, we may not be able to commercialize product candidates or technologies that were covered by the applicable license. Also, the milestone and other payments associated with these licenses will make it less profitable for us to develop our product candidates.
30
Table of Contents
We expect to rely on orphan drug exclusivity for Kanuma and SBC-103. A competitor may receive orphan drug marketing authorization prior to us for the same indication for which we are seeking approval.
Approval of Kanuma and SBC-103 as orphan drugs would grant us seven years of marketing exclusivity under the Federal Food, Drug, and Cosmetic Act, and up to 10 years of marketing exclusivity in Europe. While the orphan drug designation for Kanuma and SBC-103 will provide market exclusivity in the U.S., Europe and Japan, we will not be able to rely on market exclusivity to prevent other companies from obtaining regulatory approval in these territories for the same active ingredient for the same indication beyond that timeframe. Furthermore, the marketing exclusivity in Europe can be reduced from 10 years to six years if the initial designation criteria have significantly changed since the market authorization of the orphan drug or orphan exclusivity may be revoked if we cannot reliably supply the market. Even if we have orphan drug designation for a particular drug indication, we cannot guarantee that another company also with orphan drug designation will not receive marketing authorization for the same indication before we do. If that were to happen, our applications for that indication may not be approved until the competing company’s period of exclusivity has expired. Also, we cannot guarantee that another company with orphan drug designation will not receive marketing authorization for the same indication at the same time we do. In this case, both companies would receive market exclusivity, which could have a material adverse effect on sales in that market. Even if we are the first to obtain marketing authorization for an orphan drug indication, there are circumstances under which a competing product may be approved for the same indication during the seven-year period of marketing exclusivity in the U.S., such as if the later product is shown to be clinically superior to our product, or if the later product is a different drug than Kanuma or SBC-103. Further, the seven-year marketing exclusivity in the U.S. would not prevent competitors from obtaining approval of the same compound for other indications or the use of other types of drugs for the same use as the orphan drug.
Risks Related to our Business Operations and Industry
We face significant competition from other pharmaceutical and biotechnology companies. Our operating results will suffer if we fail to compete effectively.
The pharmaceutical and biotechnology industries are intensely competitive and subject to rapid and significant technological change. Our competitors include organizations such as major multinational pharmaceutical companies, established biotechnology companies and specialty pharmaceutical and generic drug companies. Many competitors have greater financial and other resources than we have, such as larger research and development staff, more extensive marketing, distribution, sales and manufacturing organizations and experience, more extensive clinical trial and regulatory experience, expertise in prosecution of intellectual property rights and access to development resources like personnel and technology. As a result, these companies may develop or improve existing technologies that make our manufacturing technology or product candidates obsolete or they may obtain regulatory approval more rapidly than we are able to and may be more effective in selling and marketing their products.
If we are unable to retain and recruit qualified scientists and advisors, or if any of our key executives, key employees or key consultants discontinues his or her employment or consulting relationship with us, it may delay our development efforts or otherwise harm our business.
The loss of any of our key executives, employees or key consultants could impede the achievement of our research, development and commercial objectives. Furthermore, recruiting and retaining qualified scientific personnel to perform research and development work in the future is critical to our success. We must also recruit and retain personnel experienced in manufacturing, marketing, selling, distributing, supporting and otherwise commercializing approved therapeutic products. We may be unable to attract and retain personnel on acceptable terms given the competition among biotechnology, biopharmaceutical, and health care companies, universities, and non-profit research institutions for experienced scientists and other disciplines. Competition for employees may impact our ability to recruit and retain qualified personnel in the future. Certain of our officers, directors, scientific advisors, and/or consultants may from time to time serve as officers, directors, scientific advisors, and/or consultants of other biopharmaceutical or biotechnology companies. We do not maintain “key man” insurance policies on any of our officers or employees. We currently have employment contracts with our Chief Executive Officer, Sanj K. Patel, and other executive officers which provide for certain severance benefits. Consistent with our current employment policies, all of our employees are employed “at will” and, therefore, each employee may leave our employment at any time. If
31
Table of Contents
we are unable to retain our existing employees, including qualified scientific personnel, and attract additional qualified candidates, our business and results of operations could be adversely affected. We are not aware of any key personnel who intend to retire or otherwise leave us in the near future.
We may pursue rapid expansion of our workforce or diversify our business strategy through mergers, acquisitions, licensing arrangements or other contractual arrangements with third parties which may require substantial resources and substantial amounts of time from members of our senior management and involve numerous risks.
We may spend substantial resources to hire additional employees or pursue acquisitions of new technologies or businesses that we would expect to be complementary to our current technologies or business focus through mergers, acquisitions, licensing arrangements or other contractual arrangements with third parties. Acquisitions of technologies, companies or product rights involve numerous risks, including potential difficulties in the integration of acquired operations such as retaining key employees of an acquired business, integrating research and development programs, not meeting financial objectives, increased costs, undisclosed liabilities not covered by insurance or terms of acquisition, and diversion of management’s attention and resources in connection with an acquisition. We cannot ensure that we will be successful in identifying, executing, and integrating acquisitions in the future.
If we fail to manage projected growth, our results and operations may be adversely affected.
With our growth and preparation for a potential commercial launch of Kanuma for the treatment of LAL Deficiency and the continued progress of our preclinical-stage programs, we will be required to retain existing and add required new qualified and experienced personnel in the commercial, regulatory, manufacturing, quality, program management, clinical and medical areas over the next several years. Also, as our preclinical pipeline diversifies through internal discoveries, or the acquisition or in-licensing of new molecules, we will need to hire additional scientists to supplement our existing scientific expertise over the next several years.
Our staff, financial resources, systems, procedures or controls may be inadequate to support our expanding operations and our management may be unable to take advantage of future market opportunities or manage successfully our relationships with third parties if we are unable to adequately manage our anticipated growth and the integration of new personnel.
Our operations are subject to the economic, political, legal and business conditions in the countries in which we do business, and our failure to operate successfully or adapt to changes in these conditions could cause our operations to be limited or disrupted.
We have expanded our operations outside of the United States and expect to continue to do so in the future. Our current operations in foreign countries subject us to certain risks that could cause our operations to be limited or disrupted, including volatility in international economies, inflation, political instability, difficulties enforcing contractual and intellectual property rights, changes in laws, regulations or enforcement practices with respect to our business, compliance with tax, privacy, employment and labor laws, costs and difficulties in recruiting and retaining qualified managers and employees to manage and operate the business in local jurisdictions and costs and difficulties in managing and monitoring international operations.
We are exposed to product liability and preclinical and clinical liability risks which could place a substantial financial burden upon us, should we be sued, if we do not have adequate liability insurance or general insurance coverage for such a claim.
Our business exposes us to potential product liability and other liability risks that are inherent in the testing, manufacturing and marketing of products like ours. Foreign regulations or clinical sites may require us, as sponsor, to be liable for medical outcomes even if an adverse event is not directly related to our product candidate. In addition, the use in our clinical trials of pharmaceutical formulations and products that our potential collaborators may develop and the subsequent sale of these formulations or products by us or our potential collaborators may cause us to bear a portion or all of the product liability risks. As is common for companies sponsoring such clinical testing, we carry
32
Table of Contents
product liability insurance. This insurance may in some instances may be insufficient to offset a negative judgment or settlement payment. As a result, a successful liability claim or series of claims brought against us could have a material adverse effect on our business, financial condition and results of operations.
Security breaches and other disruptions could compromise our information and expose us to liability, which would cause our business and reputation to suffer.
In the ordinary course of our business, we collect and store sensitive data, including intellectual property, our proprietary business information and data about our patients, suppliers, and business partners, and personally identifiable information. The secure maintenance of this information is critical to our operations and business strategy. Despite our security measures, our information technology and infrastructure may be vulnerable to attacks by hackers or breached due to employee error, malfeasance or other disruptions. Any such breach could compromise our networks and the information stored there could be accessed, publicly disclosed, lost or stolen. Any such access, disclosure or other loss of information could result in legal claims or proceedings, liability under laws that protect the privacy of personal information, disrupt our operations, and damage our reputation which could adversely affect our business.
If we do not achieve our projected development and commercialization goals in the time frames we expect and announce, the credibility of our management and our organizational competence may be adversely affected.
For planning purposes, we estimate the timing of the accomplishment of various scientific, preclinical, clinical, regulatory, market launch and commercialization goals, which we sometimes refer to as milestones. These milestones may include the commencement or completion of scientific, preclinical and clinical studies, the submission of regulatory filings and eventual product launch.
From time to time, we may publicly announce the estimated timing of some of these milestones. All of these milestones will be based on a variety of assumptions. The actual timing of these milestones can vary dramatically compared to our estimates, in many cases for reasons beyond our control. For example, clinical trials may be delayed due to factors such as regulatory agency approval, institutional review board approvals, qualification of clinical sites, scheduling conflicts with participating clinicians and clinical institutions and the rate of patient enrollment. In most circumstances, we rely on academic institutions, major medical institutions, governmental research organizations (U.S. or internationally based), clinical research organizations or contract manufacturing organizations to conduct, supervise or monitor some or all aspects of clinical trials involving our product candidates. We will have limited control over the timing and other aspects of these clinical trials.
If we do not meet the milestones as publicly announced (or as projected by various analysts who follow us), our stockholders or potential stockholders may lose confidence in our ability to meet overall product development and commercialization goals and, as a result, the price of our common stock may decline.
Our success will depend in part on relationships with third parties. Any adverse changes in these relationships could adversely affect our business, financial condition, or results of operations.
Our success will be dependent on our ability to maintain and renew business relationships with third parties and to establish new business relationships. There can be no assurance that our management will be able to maintain such business relationships, or enter into or maintain new business contracts and other business relationships, on acceptable terms, if at all. The failure to maintain important business relationships could have a material adverse effect on our business, financial condition, or results of operations.
Our charter documents and indemnification agreements require us to indemnify our directors and officers to the fullest extent permitted by law, which may obligate us to make substantial payments and to incur significant insurance-related expenses.
Our charter documents require us to indemnify our directors and officers to the fullest extent permitted by law. This could require us, with some legally prescribed exceptions, to indemnify our directors and officers against any and all expenses, judgments, penalties, fines, and amounts reasonably paid in defense or settlement of an action, suit, or proceeding brought against any of them by reason of the fact that he or she is or was our director or officer. In addition,
33
Table of Contents
expenses incurred by a director or officer in defending any such action, suit, or proceeding must be paid by us in advance of the final disposition of that action, suit or proceeding if we receive an undertaking by the director or officer to repay us if it is ultimately determined that he or she is not entitled to be indemnified. We have also entered into indemnification agreements with each of our directors and officers. In furtherance of these indemnification obligations, we maintain directors’ and officers’ insurance in the amount of $30,000,000. For future renewals, if we are able to retain coverage, we may be required to pay a higher premium for our directors’ and officers’ insurance than in the past and/or the amount of its insurance coverage may be decreased.
Risks Related to FUZEON Revenue
We derive a significant portion of our income from royalties on sales of FUZEON. If FUZEON sales continue to decline, our business could suffer.
Royalties on sales of FUZEON are currently a significant source of revenue for us. FUZEON competes with numerous existing therapies for the treatment of HIV. From 2010 through 2014, overall FUZEON net sales reported by Roche have shown a general declining trend, from $88.4 million in 2010 to $39.1 million in 2014. We cannot predict if or when sales levels for FUZEON will stabilize.
Uncertainties relating to third-party reimbursement and health care reform measures could limit payments or reimbursements for FUZEON, which could adversely affect our business.
Currently, because of the high cost of the treatment of HIV, many state legislatures are reassessing reimbursement policies for this therapy. If third-party payor reimbursements for FUZEON are limited or reduced, our results of operations will be adversely affected. In addition, emphasis in the U.S. on the reduction of the overall costs of health care through managed care has increased and will continue to increase the pressure to reduce the prices of pharmaceutical products.
The wholesale acquisition cost of a one-year supply of FUZEON in the U.S. is approximately $35,000. A high drug price could also negatively affect patients’ ability to receive reimbursement coverage for FUZEON from third-party payors, such as private or government insurance programs. If Roche is unable to obtain and maintain reimbursement from a significant number of third-party payors, it would have a material adverse effect on our business, financial condition and results of operations.
Currently, FUZEON is covered by Medicaid in all 50 states in the U.S. In addition, the AIDS Drug Assistance Programs in all 50 states and a majority of private insurers provide some amount of access to FUZEON. However, there are reimbursement challenges remaining. Some of the payors require patients to meet minimum medical requirements, such as maintaining certain cell levels associated with HIV, to receive reimbursement. Other payors limit the number of patients to which they will provide reimbursement for FUZEON, and other payors may require co-payments by the patient in order to receive reimbursement for FUZEON that are significantly higher than those required for other anti-HIV drugs.
Several major pharmaceutical companies have offered to sell their anti-HIV drugs at or below cost to certain countries in Africa and Least Developed Countries (as defined by the United Nations), which could adversely affect the reimbursement climate of, and the prices that may be charged for, HIV medications in the U.S. and the rest of the world. Third-party payors could exert pressure for price reductions in the U.S. and the rest of the world based on these lower costs offered in Africa and Least Developed Countries. This price pressure could limit the price that Roche would be able to charge for FUZEON, thereby adversely affecting our results of operations.
If the sale of FUZEON infringes the proprietary rights of third parties, we may need to obtain licenses, pay damages or defend litigation.
If the sale of FUZEON infringes the proprietary rights of third parties, we could incur substantial costs and may have to:
| • | obtain licenses, which might not be available on commercially reasonable terms, if at all; |
| • | pay damages; and/or |
34
Table of Contents
| • | engage in litigation or administrative proceedings which might be costly whether we win or lose, and which could result in a substantial diversion of financial and management resources. |
Any of these events could substantially harm our earnings, financial condition, and operations.
On November 20, 2007, Novartis Vaccines and Diagnostics, Inc. (Novartis) filed a lawsuit against us and Roche and certain of its affiliated entities, alleging infringement of Novartis’s U.S. Patent No. 7,285,271 (the 271 Patent), related to the manufacture, sale and offer for sale of FUZEON. On September 23, 2010, we entered into a settlement agreement (the Settlement Agreement) with Roche and Novartis settling the lawsuit and the lawsuit was dismissed with prejudice from the Eastern District of North Carolina on September 28, 2010. Under the terms of the Settlement Agreement, we, in collaboration with Roche, have the right to continue to sell FUZEON under a license to the 271 Patent in exchange for the payment of royalties to Novartis on net sales of FUZEON. We will share responsibility for payment of these royalties equally with Roche.
We rely on Roche to timely deliver important financial information relating to sales of FUZEON. In the event that this information is inaccurate, incomplete, or not timely, we will not be able to meet our financial reporting obligations as required by the SEC.
Under the Amended and Restated Agreement by and between Roche and Trimeris, Inc., a Delaware corporation incorporated in 1993 (Trimeris), effective as of January 1, 2011 (the Roche License Agreement), Roche has exclusive control over the flow of information relating to sales of FUZEON that we require to meet our SEC reporting obligations. Roche is required under the Roche License Agreement to provide us with timely and accurate financial data related to sales of FUZEON so that we may meet our reporting requirements under federal securities laws. In the event that Roche fails to provide us with timely and accurate information, we may incur significant liability with respect to the federal securities laws, our disclosure controls and procedures under the Sarbanes-Oxley Act of 2002 (Sarbanes-Oxley) may be inadequate, and we may be forced to restate our financial statements, any of which could adversely affect the market price of our common stock.
Risks Relating to Our Financial Position and Capital Requirements
We may be unable to raise the substantial additional capital that we will need to further develop and commercialize our products.
As is typical of biotechnology companies at our stage of development, our operations consume substantial amounts of cash and we will need substantial additional funds to further develop and commercialize our products.
While we will need to seek additional funding, we may not be able to obtain financing on acceptable terms, or at all. In addition, the terms of our financings may be dilutive to, or otherwise adversely affect, holders of our common stock. We may also seek additional funds through arrangements with collaborators or other third parties. These arrangements would generally require us to relinquish rights to some of our technologies, product candidates or products, and we may not be able to enter into such agreements, on acceptable terms, if at all. If we are unable to obtain additional funding on a timely basis, we may be required to curtail or terminate some or all of our development programs, including some or all of our product candidates.
We have incurred significant losses since our inception and anticipate that we will continue to incur losses for the foreseeable future. We are a company with limited historical revenues, which makes it difficult to assess our future viability.
We are a clinical-stage biopharmaceutical company. Biopharmaceutical product development is a highly speculative undertaking and involves a substantial degree of risk. We have incurred significant losses since our inception, and at December 31, 2014, we had an accumulated deficit of approximately $446.9 million. We expect our expenses to increase in connection with our efforts to seek approval for and commercialize Kanuma and our research and development of our other product candidates, including but not limited to, SBC-103 and SBC-105. As a result, we expect to continue to incur significant research and development and other expenses related to our ongoing operations for the foreseeable future. If any of our product candidates fail in clinical trials or do not gain regulatory approval, or if any of our product candidates, if approved, fail to achieve market acceptance, we may never become profitable. Even if
35
Table of Contents
we achieve profitability in the future, we may not be able to sustain profitability in subsequent periods. Our prior losses, combined with expected future losses, have had and will continue to have an adverse effect on our stockholders’ equity and working capital.
Our ability to use net operating loss carry forwards to reduce future tax payments may be limited if there is or has been a change in ownership of Synageva, or if taxable income does not reach sufficient levels
Utilization of our net operating loss (NOL) and research and development (R&D) credit carry forwards to reduce future tax payments depends in part on whether taxable income reaches sufficient levels prior to the expiration of these deferred tax assets. Our federal NOL carryforwards begin to expire in 2018 and our state NOL carryforwards began to expire in 2014. We have federal orphan drug credits and federal and state research tax credit carryforwards, which begin expiring in 2018 and 2023, respectively. Utilization of these deferred tax assets also may be subject to a substantial annual limitation under Section 382 of the Internal Revenue Code of 1986, as amended (the “Code”) due to ownership change limitations that have occurred previously or that could occur in the future. These ownership changes may limit the amount of NOL and R&D credit carry forwards that can be utilized annually to offset future taxable income and tax, respectively. As part of the merger of Trimeris and Synageva BioPharma Corp., a privately held Delaware corporation in 2011, we acquired federal tax attributes that are significantly limited under Section 382 of the Code.
A valuation allowance of $185.2 million and $128.8 million has been established at December 31, 2014 and 2013, respectively, to offset our potential deferred tax assets.
We may have exposure to additional tax liabilities which could have a material impact on our results of operations and financial position.
As a result of our international operations, we are subject to income taxes, as well as non-income based taxes, in both the United States and various foreign jurisdictions. Significant judgment is required in determining our worldwide tax liabilities. Although we believe our estimates are reasonable, the ultimate outcome with respect to the taxes we owe may differ from the amounts recorded in our financial statements. If the Internal Revenue Service, or other taxing authority, disagrees with the positions we take, we could have additional tax liability, and this could have a material impact on our results of operations and financial position. In addition, the United States government and other governments are considering and may adopt tax reform measures that significantly increase our worldwide tax liabilities which could materially harm our business, financial condition and results of operations.
Our management is required to devote substantial time to comply with public company regulations.
As a public company, we incur significant legal, accounting and other expenses. Sarbanes-Oxley and rules implemented by the SEC and the NASDAQ Global Select Market impose various requirements on public companies, including those related to corporate governance practices. Our management and other personnel will need to devote substantial time to these requirements.
Sarbanes-Oxley requires, among other things, that we maintain effective internal controls for financial reporting and disclosure controls and procedures. In particular, we are required to perform system and process evaluation and testing of our internal controls over financial reporting to allow management and our independent registered public accounting firm to report on the effectiveness of our internal controls over financial reporting, as required by Section 404 of Sarbanes-Oxley (Section 404). We will incur substantial accounting and related expenses to comply with Section 404. We may need to hire additional accounting and financial staff to satisfy the ongoing requirements of Section 404. Moreover, if we are not able to comply with the requirements of Section 404, or if we or our independent registered public accounting firm identifies deficiencies in our internal controls over financial reporting that are deemed to be material weaknesses, the market price of our stock could decline and we could be subject to sanctions or investigations by the NASDAQ Global Select Market, the SEC, or other regulatory authorities.
36
Table of Contents
Risks Related to Ownership of Our Common Stock
The market price and trading volume of our common stock may be volatile.
The market price of our common stock could fluctuate significantly for many reasons, including the following factors:
| • | announcements of preclinical, clinical or regulatory developments or technological innovations by us or our competitors; |
| • | changes in our relationship with our licensors and other strategic partners; |
| • | our quarterly operating results; |
| • | declines in sales of FUZEON; |
| • | developments in patent or other technology ownership rights; |
| • | public concern regarding the safety of our products; |
| • | additional funds may not be available on terms that are favorable to us and, in the case of equity financings, may result in dilution to our stock holders; |
| • | government regulation of drug pricing; and |
| • | general changes in the economy, the financial markets or the pharmaceutical or biotechnology industries. |
Additional factors beyond our control may also have an impact on the price of our stock. For example, to the extent that other large companies within our industry experience declines in their stock price, our stock price may decline as well. In addition, when the market price of a company’s common stock drops significantly, stockholders often institute securities class action lawsuits against the company. A lawsuit against us could cause us to incur substantial costs and could divert the time and attention of our management and other resources.
Future sales of substantial amounts of our common stock, or the perception that such sales could occur, could adversely affect the market price of our common stock.
Future sales into the public market of substantial amounts of our common stock, or securities convertible or exchangeable into shares of our common stock, including shares of our common stock issued upon exercise of options and warrants, or perceptions that such sales could occur, could adversely affect the market price of our common stock and our ability to raise capital in the future.
Ownership of our common stock is highly concentrated, and it may prevent you and other stockholders from influencing significant corporate decisions and may result in conflicts of interest that could cause our stock price to decline.
Our executive officers and directors, together with their respective affiliates, beneficially own and control a significant portion of our common stock. Accordingly, these executive officers, directors and their affiliates, acting individually or as a group, have substantial influence over the outcome of a corporate action requiring stockholder approval, including the election of directors, any merger, consolidation or sale of all or substantially all of our assets or any other significant corporate transaction. These stockholders may also exert influence in delaying or preventing a change in control, even if such change in control would benefit our other stockholders. In addition, the significant concentration of stock ownership may adversely affect the market value of our common stock due to investors’ perception that conflicts of interest may exist or arise.
Anti-takeover provisions in our charter and bylaws may prevent or frustrate attempts by stockholders to change the board of directors or current management and could make a third-party acquisition of us difficult.
Our certificate of incorporation and bylaws contain provisions that may discourage, delay or prevent a merger, acquisition or other change in control that stockholders may consider favorable, including transactions in which stockholders might otherwise receive a premium for their shares. These provisions could limit the price that investors might be willing to pay in the future for shares of our common stock.
37
Table of Contents
We have never declared or paid dividends on our common stock and do not anticipate paying dividends in the foreseeable future.
Our business requires significant funding, and we do not anticipate paying any cash dividends on our common stock in the foreseeable future.
We have broad discretion in how we use our resources, and we may not use our cash and investments effectively or in ways with which you agree.
Our management has broad discretion as to the application of our resources. Our stockholders may not agree with the manner in which our management chooses to allocate and spend our cash, cash equivalents and investments. Moreover, our management may use our resources for corporate purposes that may not increase the market price of our common stock.
| ITEM 1B. | UNRESOLVED STAFF COMMENTS |
None.
| ITEM 2. | PROPERTY AND FACILITIES |
The following table contains information about our currently occupied significant leased properties:
| Location |
Approximate Square Feet |
Use |
Lease Expiration Date |
|||||||
| Lexington, Massachusetts |
81,000 | Corporate headquarters, office and laboratory | 2019 | |||||||
| Several locations in and around Athens, Georgia |
97,800 | Office, manufacturing and laboratory | 2015-2024 | |||||||
| Holden, Massachusetts |
39,000 | Manufacturing and laboratory | 2020 | |||||||
We believe that our administrative office space is adequate to meet our current needs. We also believe that our research and development facilities and our manufacturing facilities, together with third party manufacturing facilities, are adequate for our on-going activities. In addition to the locations above, we also maintain small offices in a variety of locations around the world.
| ITEM 3. | LEGAL PROCEEDINGS |
From time to time we may be involved in legal proceedings arising in the ordinary course of business. We believe there is no litigation currently pending that could have, individually or in the aggregate, a material adverse effect on our results of operations, financial condition or cash flows.
| ITEM 4. | MINE SAFETY DISCLOSURES |
Not applicable.
38
Table of Contents
| ITEM 5. | MARKET FOR REGISTRANT’S COMMON EQUITY, RELATED STOCKHOLDER MATTERS AND ISSUER PURCHASES OF EQUITY SECURITIES. |
Information About Our Common Stock
Our common stock trades on the Nasdaq Global Select Market under the symbol “GEVA.” Set forth below are the high and low sales prices for our common stock for each full quarterly period within the most two recent fiscal years.
| High | Low | |||||||
| Year Ended December 31, 2014 |
||||||||
| First Quarter |
$ | 118.42 | $ | 64.58 | ||||
| Second Quarter |
$ | 104.80 | $ | 73.16 | ||||
| Third Quarter |
$ | 90.45 | $ | 62.76 | ||||
| Fourth Quarter |
$ | 96.04 | $ | 64.85 | ||||
| Year Ended December 31, 2013 |
||||||||
| First Quarter |
$ | 55.99 | $ | 46.26 | ||||
| Second Quarter |
$ | 54.91 | $ | 38.79 | ||||
| Third Quarter |
$ | 63.39 | $ | 42.70 | ||||
| Fourth Quarter |
$ | 69.69 | $ | 45.51 | ||||
The closing price as of February 20, 2015 was $102.45.
Holders
The number of record holders of our common stock as of February 20, 2015 was 63.
Dividend Policy
We have never declared or paid any cash dividends on our common stock. We currently intend to retain earnings, if any, to support our business strategy and do not anticipate paying cash dividends in the foreseeable future. Payment of future dividends, if any, will be at the sole discretion of our board of directors after taking into account various factors, including our financial condition, operating results, capital requirements and any plans for expansion.
Repurchases
We did not repurchase any shares of our equity securities during the year ended December 31, 2014.
Securities Authorized for Issuance Under Equity Compensation Plans
The following table sets forth information about our equity compensation plans as of December 31, 2014, including the number of shares of our common stock issuable upon exercise of all outstanding options, the weighted-average exercise price of all outstanding options and the number of shares available for future issuance under our equity compensation plans (share amounts in thousands).
| Plan Category |
(a) Number of securities to be issued upon exercise of outstanding options, warrants and rights |
(b) Weighted- average exercise price of outstanding options, warrants and rights |
(c) Number of securities remaining available for future issuance under equity compensation plans (excluding securities reflected in column (a)) |
|||||||||
| Equity Compensation Plans Approved by Stockholders |
3,286 | $ | 53.71 | 1,365 | ||||||||
| Equity Compensation Plans Not Approved by Stockholders |
— | — | — | |||||||||
39
Table of Contents
Synageva’s Stock Performance
The following graph compares cumulative total return of our common stock with the cumulative total return of (i) the NASDAQ Global Select Index, and (ii) the NASDAQ Biotechnology Index. The graph assumes (a) $100 was invested on December 31, 2009 in each of our Common Stock, the stocks comprising the NASDAQ Global Select Index and the stocks comprising the NASDAQ Biotechnology Index, and (b) the reinvestment of dividends. The comparisons shown in the graph are based on historical data and the stock price performance shown in the graph is not necessarily indicative of, or intended to forecast, future performance of our stock. Prior to the Reverse Merger on November 2, 2011, the stock of Trimeris traded under the symbol “TRMS” on the Nasdaq Global Market and any comparison with any comparison with Trimeris’ historical stock prices may not be meaningful.
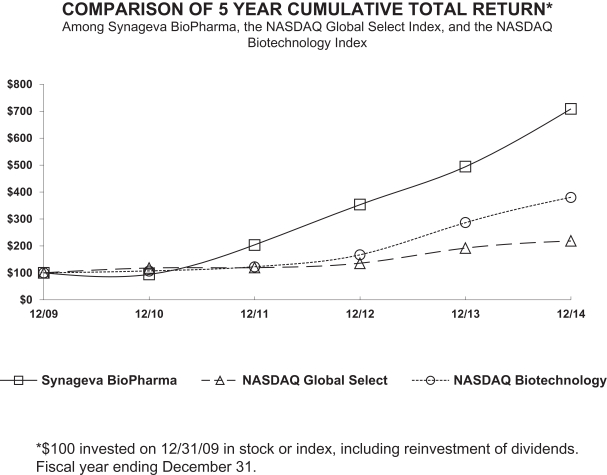
Cumulative Total Return
| 12/09 | 12/10 | 12/11 | 12/12 | 12/13 | 12/14 | |||||||||||||||||||
| Synageva BioPharma Corp. |
100.00 | 93.89 | 203.28 | 353.36 | 494.05 | 708.32 | ||||||||||||||||||
| NASDAQ Global Select |
100.00 | 117.75 | 119.47 | 135.27 | 191.69 | 218.59 | ||||||||||||||||||
| NASDAQ Biotechnology |
100.00 | 106.73 | 122.40 | 166.72 | 286.55 | 379.71 | ||||||||||||||||||
40
Table of Contents
| ITEM 6. | SELECTED FINANCIAL DATA. |
The following Selected Financial Data should be read in conjunction with “Management’s Discussion and Analysis of Financial Condition and Results of Operations” included in Item 7 beginning on page 42 and the consolidated financial statements and related notes thereto beginning on page 58 of this Annual Report on Form 10-K.
| Years Ended December 31, | ||||||||||||||||||||
| 2014 | 2013 | 2012 | 2011 | 2010 | ||||||||||||||||
| (in thousands, except per share amounts) | ||||||||||||||||||||
| Consolidated Statement of Operations Data: |
||||||||||||||||||||
| Revenues: |
||||||||||||||||||||
| Royalty revenue |
$ | 6,000 | $ | 7,042 | $ | 7,023 | $ | 1,083 | $ | — | ||||||||||
| Collaboration and license revenue |
492 | 6,332 | 7,931 | 1,016 | 595 | |||||||||||||||
|
|
|
|
|
|
|
|
|
|
|
|||||||||||
| Total revenue |
6,492 | 13,374 | 14,954 | 2,099 | 595 | |||||||||||||||
| Costs and expenses: |
||||||||||||||||||||
| Research and development |
142,638 | 79,644 | 37,347 | 17,346 | 9,866 | |||||||||||||||
| Selling, general and administrative |
54,498 | 27,560 | 17,396 | 9,268 | 3,852 | |||||||||||||||
| Amortization of developed technology |
1,489 | 2,073 | 3,232 | 504 | — | |||||||||||||||
|
|
|
|
|
|
|
|
|
|
|
|||||||||||
| Total costs and expenses |
198,625 | 109,277 | 57,975 | 27,118 | 13,718 | |||||||||||||||
|
|
|
|
|
|
|
|
|
|
|
|||||||||||
| Loss from operations |
(192,133 | ) | (95,903 | ) | (43,021 | ) | (25,019 | ) | (13,123 | ) | ||||||||||
| Other (expense) income, net |
(238 | ) | 159 | — | (259 | ) | 2,295 | |||||||||||||
| Interest income (expense), net |
263 | 342 | 72 | (28 | ) | 4 | ||||||||||||||
|
|
|
|
|
|
|
|
|
|
|
|||||||||||
| Loss before provision for income taxes |
(192,108 | ) | (95,402 | ) | (42,949 | ) | (25,306 | ) | (10,824 | ) | ||||||||||
| Provision for income taxes |
540 | 48 | — | — | — | |||||||||||||||
|
|
|
|
|
|
|
|
|
|
|
|||||||||||
| Net loss |
$ | (192,648 | ) | $ | (95,450 | ) | $ | (42,949 | ) | $ | (25,306 | ) | $ | (10,824 | ) | |||||
|
|
|
|
|
|
|
|
|
|
|
|||||||||||
| Basic and diluted net income per share(1) |
$ | (5.89 | ) | $ | (3.40 | ) | $ | (1.90 | ) | $ | (8.58 | ) | $ | (338.25 | ) | |||||
|
|
|
|
|
|
|
|
|
|
|
|||||||||||
| Weighted average shares used in basic and diluted per share computations(1) |
32,719 | 28,087 | 22,579 | 2,950 | 32 | |||||||||||||||
|
|
|
|
|
|
|
|
|
|
|
|||||||||||
| (1) | Per share computations for fiscal 2011 are based on (i) Private Synageva’s historic common stock balances (excluding preferred stock) up to the Reverse Merger date and (ii) post-Reverse Merger common stock from the Reverse Merger date to year end. For fiscal 2010, per share computations are based on Private Synageva’s historic common stock balances. |
| As of December 31, | ||||||||||||||||||||
| 2014 | 2013 | 2012 | 2011 | 2010 | ||||||||||||||||
| (in thousands) | ||||||||||||||||||||
| Consolidated Balance Sheet Data: |
||||||||||||||||||||
| Cash, cash equivalents, and short-term investments |
$ | 446,908 | $ | 408,733 | $ | 218,953 | $ | 60,232 | $ | 14,715 | ||||||||||
| Working capital |
432,589 | 402,803 | 212,028 | 56,393 | 14,285 | |||||||||||||||
| Total assets |
504,203 | 447,949 | 243,256 | 83,298 | 16,982 | |||||||||||||||
| Long-term debt |
— | — | — | — | — | |||||||||||||||
| Accumulated deficit |
(446,887 | ) | (254,239 | ) | (158,789 | ) | (115,840 | ) | (90,534 | ) | ||||||||||
| Total stockholders’ equity |
473,239 | 430,201 | 230,177 | 74,048 | 15,403 | |||||||||||||||
41
Table of Contents
| ITEM 7. | MANAGEMENT’S DISCUSSION AND ANALYSIS OF FINANCIAL CONDITION AND RESULTS OF OPERATIONS. |
This discussion of our financial condition and results of operations should be read together with the consolidated financial statements and notes contained elsewhere in this report. Certain statements in this section are forward-looking. While we believe these statements are accurate, our business is dependent on many factors, some of which are discussed in the sections entitled “Risk Factors” and “Business”. Many of these factors are beyond our control and any of these and other factors could cause actual results to differ materially from the forward-looking statements made in this report. We undertake no obligation to release publicly the results of any revisions to the statements contained in this report to reflect events or circumstances that occur subsequent to the date of this report.
Overview
We are a biopharmaceutical company focused on the discovery, development, and commercialization of therapeutic products for patients with rare diseases. Our pipeline programs consists of protein therapeutics for rare diseases with unmet medical need at various stages of development including the lead program, Kanuma™ (sebelipase alfa) for lysosomal acid lipase deficiency (LAL Deficiency), SBC-103 for mucopolysaccharidosis IIIB (MPS IIIB, also known as Sanfilippo B syndrome), and SBC-105 for generalized arterial calcification of infancy (GACI) and other rare calcification diseases. In addition, we have protein therapeutic programs for other rare diseases that are currently at different stages of preclinical development, including potentially bio-superior programs. We own the worldwide commercial rights to all of our pipeline programs.
Financial Operations Overview
General
Our future operating results will depend on the progress of drug candidates currently in our research and development pipeline. The results of our operations will vary significantly from year-to-year and quarter-to-quarter and will depend largely on, among other factors, the cost and outcome of any preclinical development or clinical trials then being conducted and efforts for registration and commercialization of our products.
A discussion of certain risks and uncertainties that could affect our capital requirements and ability to raise additional funds is set forth under the section entitled “Risk Factors” in this Annual Report on Form 10-K.
Revenue
Royalty Revenue
Royalty revenues are recognized in the period earned, based on contract terms when reported sales are reliably measurable and collectability is reasonably assured. Royalty revenue relates to amounts earned from the sale of FUZEON by Hoffman-La Roche, Inc. (Roche). The FUZEON royalty stream was acquired in the Reverse Merger in the fourth quarter of fiscal 2011.
Collaboration and License Revenue
Collaboration and license revenue relates to revenue from the licensing of our intellectual property. In 2013 and 2012, revenues were primarily driven by our collaboration agreements with Mitsubishi Tanabe Corporation (Mitsubishi Tanabe) whereby we utilized our proprietary expression technology in two development programs, in exchange for upfront license payments and funded development. Under the first agreement, which was entered into in August 2011, we received an upfront license payment of $3.0 million and on-going funding of development costs. Additionally, we entered into a second agreement in March 2012, where we received an upfront license payment of $9.0 million and on-going funding of development costs. Both programs were completed in the fourth quarter of 2013. We recognized revenue under a proportional performance method.
Research and Development
We expense research and development costs as incurred. Research and development expense consists of costs incurred to discover, research and develop drug candidates, including personnel, stock-based compensation expense
42
Table of Contents
and facility-related expenses, outside contracted services including clinical trial costs, manufacturing and process development costs, research costs, medical affairs and regulatory costs outside consulting services, research license fees, depreciation and amortization of lab facilities, lab supplies and other external costs. We accrue costs for clinical trial activities based upon estimates of the services received and related expenses incurred that have yet to be invoiced by the vendors that perform the services.
Selling, General and Administrative
Selling, general and administrative expense consists primarily of salaries, stock-based compensation expense and other related costs for personnel in commercial, executive, business development, finance, human resource, legal, information technology, and support personnel functions. Other costs include facility costs not otherwise included in research and development expense, insurance, and professional fees for legal, accounting and commercial services.
Amortization of Developed Technology
We provide for the cost of amortization of developed technology, computed using an accelerated method based on the undiscounted cash flows received from the FUZEON royalty stream, in proportion to the estimated total undiscounted cash flows.
Other Expense (Income), net
Other expense includes our pro-rata portion of the net loss associated with an equity method investment. Other income primarily relates to the recognition of income related grants from the Massachusetts Life Sciences Center (MLSC) based on projected hiring in the Commonwealth of Massachusetts. We recognize the grant ratably over the five year commitment period.
Interest Income, net
Interest income relates to interest earned on our cash equivalent and short-term investment balances.
Provision for Income Taxes
Provision for income taxes is comprised of the taxes currently payable as a result of foreign operations. We have certain international subsidiaries that are profitable on a stand-alone basis. Accordingly, a tax provision is reflected for the taxes incurred in such jurisdictions based on intercompany service arrangements.
Results of Operations
Years Ended December 31, 2014 and 2013
Revenues
The following table presents total revenue for the years ended December 31, 2014 and 2013, respectively (in thousands):
| Year Ended December, |
||||||||||||||||
| 2014 | 2013 | $ Change | % Change | |||||||||||||
| Royalty revenue |
$ | 6,000 | $ | 7,042 | $ | (1,042 | ) | (15 | )% | |||||||
| Collaboration and license revenue |
492 | 6,332 | (5,840 | ) | (92 | ) | ||||||||||
|
|
|
|
|
|
|
|||||||||||
| Total revenue |
$ | 6,492 | $ | 13,374 | $ | (6,882 | ) | (51 | )% | |||||||
|
|
|
|
|
|
|
|||||||||||
Total revenues decreased by approximately $6.9 million for the year ended December 31, 2014, as compared to the prior year. The decrease related to lower collaboration and license and royalty revenues. In the prior year, collaboration and license revenue was driven by the Mitsubishi Tanabe collaboration programs. The programs were completed in the fourth quarter of 2013, and as a result, collaboration and licensing revenue was lower in 2014.
43
Table of Contents
Royalty revenue, which is generated by sales of FUZEON, decreased $1.0 million for the year ended December 31, 2014, as compared to the prior year. FUZEON royalty revenues are unpredictable, as we are not marketing the product and inconsistent sales in certain regions can cause period to period variability. In general, we have seen a trend of decreasing royalties related to FUZEON which we expect to continue in 2015.
Research and Development Expenses
Research and development expenses for the years ended December 31, 2014 and 2013 are summarized as follows (in thousands):
| Year Ended December 31, |
||||||||||||||||
| 2014 | 2013 | $ Change | % Change | |||||||||||||
| Compensation and benefits-related |
$ | 26,281 | $ | 17,692 | $ | 8,589 | 49 | % | ||||||||
| Clinical trials, external manufacturing and toxicology studies |
66,556 | 40,488 | 26,068 | 64 | ||||||||||||
| Other development related external services |
24,382 | 7,046 | 17,336 | 246 | ||||||||||||
| Facilities and related |
13,237 | 8,332 | 4,905 | 59 | ||||||||||||
| Stock-based compensation expense |
8,694 | 3,586 | 5,108 | 142 | ||||||||||||
| Loss on impairment of equity method investment |
3,488 | — | 3,488 | — | ||||||||||||
| Acquired in-process research and development |
— | 2,500 | (2,500 | ) | — | |||||||||||
|
|
|
|
|
|
|
|||||||||||
| Total research and development expense |
$ | 142,638 | $ | 79,644 | $ | 62,994 | 79 | % | ||||||||
|
|
|
|
|
|
|
|||||||||||
Research and development expense increased by approximately $63.0 million to $142.6 million for the year ended December 31, 2014 as compared to $79.6 million for the prior year. The increase in total research and development expense is due to increased clinical trial costs, external manufacturing fees, toxicology studies and other development related external services associated with on-going development of Kanuma, SBC-103, SBC-105 and our pipeline programs, as well as higher compensation expense from hiring additional staff to move our programs forward. Also contributing to the period-over-period increase in research and development expense was higher facilities and related costs of $4.9 million primarily related to increased depreciation expense for our manufacturing and lab facilities fixed asset additions, as well as higher costs to operate our facilities. For the year ended December 31, 2014, research and development expense includes $8.7 million of stock-based compensation expense, compared to $3.6 million in the prior year. In 2014 we recorded a loss on impairment of an equity method investment of $3.5 million, the result of writing the asset down to its fair value (see Note 2 for additional information). In 2013, in-process research and development expense relates to an upfront license payment made to Shire Human Genetics Therapies, Inc. and its affiliates (“Shire”) to sublicense multiple patent and patent applications relating to the use of LAL for the treatment of LAL Deficiency and atherosclerosis, which complement our intellectual property portfolio covering our LAL Deficiency program.
We expect our investment in research and development to continue to increase as development activities for Kanuma, SBC-103, SBC-105 and our other pipeline programs continue.
Selling, General and Administrative Expenses
Selling, general and administrative expenses for the year ended December 31, 2014 and 2013 are summarized as follows (in thousands):
| Year Ended December 31, |
||||||||||||||||
| 2014 | 2013 | $ Change | % Change | |||||||||||||
| Compensation and benefits-related |
$ | 21,738 | $ | 11,584 | $ | 10,154 | 88 | % | ||||||||
| External and professional services |
18,779 | 9,405 | 9,374 | 100 | ||||||||||||
| Facilities related and other |
2,345 | 970 | 1,375 | 142 | ||||||||||||
| Stock-based compensation expense |
11,636 | 5,601 | 6,035 | 108 | ||||||||||||
|
|
|
|
|
|
|
|||||||||||
| Total selling, general and administrative expense |
$ | 54,498 | $ | 27,560 | $ | 26,938 | 98 | % | ||||||||
|
|
|
|
|
|
|
|||||||||||
44
Table of Contents
Selling, general and administrative expense increased by approximately $26.9 million to $54.5 million for the year ended December 31, 2014 as compared to $27.6 million for the prior year. The increase was primarily due to higher compensation-related expenses and external service costs. Compensation related costs, including stock-based compensation, increased $16.2 million as we continued to expand our resources to support our international organization and commercial preparations for Kanuma. External service costs contributed $9.4 million to the period-over-period increase in expense and were primarily due to increased consulting, external commercial and marketing costs, patent and legal fees and accounting and other professional service costs. We expect selling, general and administrative expense to continue to increase as we continue commercial preparations and support expanded research operations.
Amortization of Developed Technology
Costs recognized for the amortization of developed technology for the year ended December 31, 2014 and 2013 are summarized as follows (in thousands):
| Year Ended December 31, |
||||||||||||||||
| 2014 | 2013 | $ Change | % Change | |||||||||||||
| Amortization of developed technology |
$ | 1,489 | $ | 2,073 | $ | (584 | ) | (28 | )% | |||||||
|
|
|
|
|
|
|
|||||||||||
In fiscal 2014, we recognized $1.5 million of amortization related to the developed technology acquired in the Reverse Merger, compared to $2.1 million in the prior year. Amortization of developed technology is computed using an accelerated method based on the undiscounted actual cash flows received from the FUZEON royalty stream, in proportion to the estimated total undiscounted cash flows from the asset. In conjunction with expected cash flows, our amortization model assumed a larger proportion of expense in the periods following the Reverse Merger in 2011, thus the decrease in 2014 as compared to the prior year.
Other (Expense) Income, net
| Year Ended December 31, |
||||||||||||||||
| 2014 | 2013 | $ Change | % Change | |||||||||||||
| Other (expense) income, net |
$ | (238 | ) | $ | 159 | $ | (397 | ) | (250 | )% | ||||||
|
|
|
|
|
|
|
|||||||||||
In 2014, other expense was comprised primarily of the Company’s pro-rata portion of the net loss associated with an equity method investment, which totaled $0.6 million. Other income primarily included approximately $0.3 million related to a 2014 and 2013 grant from the MLSC based on hiring in the Commonwealth of Massachusetts. We recognize income related to the grant over the five year commitment period, once the commitment is met for the applicable year. In the prior year, we recognized $0.2 million related to a 2013 grant from the MLSC.
Interest Income, Net
| Year Ended December 31, |
||||||||||||||||
| 2014 | 2013 | $ Change | % Change | |||||||||||||
| Interest income, net |
$ | 263 | $ | 342 | $ | (79 | ) | (23 | )% | |||||||
|
|
|
|
|
|
|
|||||||||||
Interest income, net of $0.3 million primarily related to interest earned on our short-term investment balance. Our investments include U.S. treasury securities and money market funds, with a weighted average maturity of one year or less. In 2014, interest expense totaled $0.2 million and related to interest expense associated with our capital lease obligation.
45
Table of Contents
Provision for income taxes
| Year Ended December 31, |
||||||||||||||||
| 2014 | 2013 | $ Change | % Change | |||||||||||||
| Provision for income taxes |
$ | 540 | $ | 48 | $ | 492 | 1025 | % | ||||||||
|
|
|
|
|
|
|
|||||||||||
Our provision for income taxes is comprised of the taxes currently payable as a result of foreign operations and certain other federal taxes, and totaled approximately $0.5 million and $0.1 million for fiscal 2014 and 2013, respectively. As we are in a full valuation allowance, we do recognize any benefit from U.S. operating losses in our income statement or balance sheet.
Years Ended December 31, 2013 and 2012
Revenues
The following table presents total revenue for the years ended December 31, 2013 and 2012, respectively (in thousands):
| Year Ended December, |
||||||||||||||||
| 2013 | 2012 | $ Change | % Change | |||||||||||||
| Royalty revenue |
$ | 7,042 | $ | 7,023 | $ | 19 | 0 | % | ||||||||
| Collaboration and license revenue |
6,332 | 7,931 | (1,599 | ) | (20 | ) | ||||||||||
|
|
|
|
|
|
|
|||||||||||
| Total revenue |
$ | 13,374 | $ | 14,954 | $ | (1,580 | ) | (11 | )% | |||||||
|
|
|
|
|
|
|
|||||||||||
Total revenues decreased by approximately $1.6 million for the year ended December 31, 2013, as compared to the prior year. The decrease in revenues was primarily the result of lower revenue related to the Mitsubishi Tanabe collaboration programs.
Royalty revenue of $7.0 million was consistent with fiscal 2012 and relates to the royalty payment earned from Roche, based on total worldwide net sales of FUZEON. In addition, FUZEON royalty revenues are unpredictable, as we are not marketing the product and inconsistent sales in certain regions can cause period to period variability. Fiscal 2013 royalty revenues benefited from a higher than usual second quarter royalty totaling $2.9 million; however, royalties decreased in the second half of 2013 by $1.7 million when compared to the prior year. Collaboration and license revenue for the year ended December 31, 2013 primarily relates to revenue recognized from development programs with Mitsubishi Tanabe. For the year ended December 31, 2013, we recognized $2.0 million and $4.1 million related to the first and second Mitsubishi Tanabe programs, respectively. In fiscal 2012, we recognized $1.9 million and $6.0 million related to the first and second programs, respectively. In fiscal 2012, we performed a greater percentage of the projected hours, particularly related to the second Mitsubishi Tanabe program, for which we received an upfront payment of $9.0 million. As we approached the end of both projects in 2013 and our level of hours and effort decreased, collaboration and license revenue were lower compared to the prior year. As of December 31, 2013, we had completed the development effort for both projects and all of the related deferred revenue was recognized.
46
Table of Contents
Research and Development Expenses
Research and development expenses for the years ended December 31, 2013 and 2012 are summarized as follows (in thousands):
| Year Ended December 31, |
||||||||||||||||
| 2013 | 2012 | $ Change | % Change | |||||||||||||
| Compensation and benefits-related |
$ | 17,692 | $ | 10,339 | $ | 7,353 | 71 | % | ||||||||
| Clinical trials, external manufacturing and toxicology studies |
40,488 | 18,275 | 22,213 | 122 | ||||||||||||
| Other development related external services |
7,046 | 3,492 | 3,554 | 102 | ||||||||||||
| Facilities and related |
8,332 | 3,465 | 4,867 | 140 | ||||||||||||
| Stock-based compensation expense |
3,586 | 1,432 | 2,154 | 150 | ||||||||||||
| Acquired in-process research and development |
2,500 | 344 | 2,156 | 627 | ||||||||||||
|
|
|
|
|
|
|
|||||||||||
| Total research and development expense |
$ | 79,644 | $ | 37,347 | $ | 42,297 | 113 | % | ||||||||
|
|
|
|
|
|
|
|||||||||||
Research and development expense increased by approximately $42.3 million to $79.6 million for the year ended December 31, 2013 as compared to $37.3 million for fiscal 2012. The increase in total research and development expense is due to increased clinical trial costs, external manufacturing fees, toxicology studies and other development related external services associated with on-going development of Kanuma, SBC-103 and our pipeline programs, as well as higher compensation expense from hiring additional staff to move our programs forward. Also contributing to the period-over-period increase in research and development expense was higher in-process research and development of $2.2 million and higher facilities and other expenses of $4.9 million. In-process research and development expense relates to an upfront license payment made to Shire to sublicense multiple patent and patent applications relating to the use of LAL for the treatment of LAL Deficiency and atherosclerosis, which complement our intellectual property portfolio covering our LAL Deficiency program. Higher facilities expenses primarily relate to increased depreciation expense related to manufacturing and lab facilities fixed asset additions, as well as higher costs to operate our facilities. For the year ended December 31, 2013, research and development expense includes $3.6 million of stock-based compensation expense, compared to $1.4 million in the prior year.
Selling, General and Administrative Expenses
Selling, general and administrative expenses for the year ended December 31, 2013 and 2012 are summarized as follows (in thousands):
| Year Ended December 31, |
||||||||||||||||
| 2013 | 2012 | $ Change | % Change | |||||||||||||
| Compensation and benefits-related |
$ | 11,584 | $ | 7,537 | $ | 4,047 | 54 | % | ||||||||
| External and professional services |
9,405 | 5,545 | 3,860 | 70 | ||||||||||||
| Facilities related and other |
970 | 775 | 195 | 25 | ||||||||||||
| Stock-based compensation expense |
5,601 | 3,539 | 2,062 | 58 | ||||||||||||
|
|
|
|
|
|
|
|||||||||||
| Total selling, general and administrative expense |
$ | 27,560 | $ | 17,396 | $ | 10,164 | 58 | % | ||||||||
|
|
|
|
|
|
|
|||||||||||
Selling, general and administrative expense increased by approximately $10.2 million to $27.6 million for the year ended December 31, 2013 as compared to $17.4 million for fiscal 2012. The increase was primarily due to higher compensation-related expenses and external service costs. Compensation related costs, including stock-based compensation, increased $6.1 million as we continued to expand our resources to support our international organization and commercial preparations. External service costs contributed $3.9 million to the period-over-period increase in expense and were primarily due to increased consulting, accounting, patent and external commercial related costs.
47
Table of Contents
Amortization of Developed Technology
Costs recognized for the amortization of developed technology for the year ended December 31, 2013 and 2012 are summarized as follows (in thousands):
| Year Ended December 31, |
||||||||||||||||
| 2013 | 2012 | $ Change | % Change | |||||||||||||
| Amortization of developed technology |
$ | 2,073 | $ | 3,232 | $ | (1,159 | ) | (36 | )% | |||||||
|
|
|
|
|
|
|
|||||||||||
In fiscal 2013, we recognized $2.1 million of amortization related to the developed technology acquired in the Reverse Merger, compared to $3.2 million in fiscal 2012. Amortization of developed technology is computed using an accelerated method based on the undiscounted actual cash flows received from the FUZEON royalty stream, in proportion to the estimated total undiscounted cash flows from the asset. In conjunction with expected cash flows, our amortization model assumed a larger proportion of expense in the periods immediately following the Reverse Merger, thus the decrease in 2013 as compared to fiscal 2012.
Other Income, Net
| Year Ended December 31, |
||||||||||||||||
| 2013 | 2012 | $ Change | % Change | |||||||||||||
| Other income, net |
$ | 159 | $ | — | $ | 159 | — | % | ||||||||
|
|
|
|
|
|
|
|||||||||||
In fiscal 2013 we recognized $0.2 million related to a 2013 grant from the MLSC based on projected hiring in the Commonwealth of Massachusetts. We recognize income related to the grant over the five year commitment period, once the commitment is met for the applicable year.
Interest Income, Net
| Year Ended December 31, |
||||||||||||||||
| 2013 | 2012 | $ Change | % Change | |||||||||||||
| Interest income, net |
$ | 342 | $ | 72 | $ | 270 | 375 | % | ||||||||
|
|
|
|
|
|
|
|||||||||||
Interest income increased $0.3 million, primarily related to interest earned on our increased short-term investment balance. Our investments include U.S. treasury securities and money market funds, with a weighted average maturity of one year or less.
Provision for income taxes
| Year Ended December 31, |
||||||||||||||||
| 2013 | 2012 | $ Change | % Change | |||||||||||||
| Provision for income taxes |
$ | 48 | $ | — | $ | 48 | — | % | ||||||||
|
|
|
|
|
|
|
|||||||||||
Our provision for income taxes is comprised of the taxes currently payable as a result of foreign operations, and totaled less than $0.1 million for fiscal 2013. As we are in a full valuation allowance, we do recognize any benefit from U.S. operating losses in our income statement or balance sheet.
Liquidity and Capital Resources
Sources of Liquidity
We have financed our operations to date primarily from the proceeds of the sale of stock, and to a lesser extent, license and royalty fees, upfront cash payments and research and development funding from collaborators, government grants and licensors. We completed a total of five equity financings from 2012 to 2014, resulting in the issuance of
48
Table of Contents
approximately 14.0 million shares of common stock and the receipt of approximately $674.8 million of net proceeds. In addition, in January of 2015, we raised another $308.7 million in net proceeds through the sale of 3.5 million shares of common stock.
We intend to use our cash, cash equivalents and investments for general corporate purposes, which may include funding the global launch of Kanuma, expanding our global awareness and commercial and manufacturing efforts, expanding our infrastructure, including commercial and manufacturing to benefit Kanuma and the rest of our pipeline, supporting the Phase 1/2 clinical trial for SBC-103, accelerating our early-stage programs into the clinic, including SBC-105 and potentially bio-superior treatments in addition to novel first-mover programs. We may acquire new technologies or businesses that are complementary to our current technologies and business focus.
We are unsure when we will generate significant revenue from the direct sale of products currently in development, if ever. We receive royalties from the sale of FUZEON by Roche, which are generally expected to continue to decrease over time. As of December 31, 2014, our principal sources of liquidity consisted of cash and cash equivalents and short-term investments of approximately $446.9 million (which excludes the proceeds from the January 2015 offering). Our cash equivalents are highly liquid investments with a maturity of three months or less at date of purchase and consist of U.S. treasury bills and amounts held in money market funds.
Cash Flows
The use of our cash flows for operations has primarily consisted of salaries and wages for our employees, facility and facility-related costs for our office, laboratory, and manufacturing facilities, fees paid in connection with preclinical studies, clinical studies, outsourced manufacturing, laboratory supplies, consulting fees and commercial, legal and accounting fees. We expect that costs associated with clinical studies and manufacturing costs as well as commercial costs will increase in future periods as Kanuma approaches commercialization and our other clinical and preclinical candidates move forward in development.
Net cash used in operating activities was $150.1 million for the year ended December 31, 2014, and was primarily the result of a net loss of $192.6 million, the drivers of which are discussed in further detail in “Results of Operations.” In addition, non-cash items and changes in certain operating assets and liabilities affected operating cash during year ended December 31, 2014. Non-cash items include depreciation of fixed assets of $4.6 million, amortization of developed technology of $1.5 million, stock-based compensation of $20.3 million, and the amortization of premium on available for sale investments of $3.8 million. Non-cash items also include an impairment loss of $3.5 million on an equity method investment and $0.6 million of expense related to our pro-rata portion of an equity method investment’s net loss. Changes in operating assets and liabilities resulted in a net source of cash of $8.2 million, which was primarily the result of decreased accounts receivable of $0.4 million and a net increase in accounts payable, accrued expenses and other liabilities of $11.2 million from December 31, 2013. These changes were partially offset by net increased prepaid expenses and other assets of $3.4 million from December 31, 2013. The increases in prepaid and other assets, as well as accrued expenses and other liabilities were primarily driven by clinical, toxicology and manufacturing activities, the details of which are disclosed in further detail in Note 4, “Supplemental Balance Sheet Information” of the Consolidated Financial Statements included in this Annual Report on Form 10-K.
Net cash used in operating activities was $75.0 million for the year ended December 31, 2013, and was primarily the result of a net loss of $95.4 million. In addition, non-cash items and changes in certain operating assets and liabilities affected operating cash during year ended December 31, 2013. Non-cash items include depreciation of fixed assets of $3.5 million, amortization of developed technology of $2.1 million, stock-based compensation of $9.2 million, and the amortization of premium on available for sale investments of $2.5 million. Cash used for in-process research and development of $2.5 million is presented as an adjustment to cash flows from operating activities and classified as a cash use from investing activities. Changes in operating assets and liabilities resulted in a net source of cash of $0.7 million, which was primarily the result of decreased accounts receivable of $1.2 million and a net increase in accounts payable, accrued expenses, other liabilities and deferred rent of $7.7 million from December 31, 2012. These changes were partially offset by net increased prepaid expenses and other assets of $3.1 million and decreased deferred revenue of $5.2 million from December 31, 2012. The decrease in deferred revenue in the period was primarily the result of the recognition of the remaining deferred revenue related to the Mitsubishi Tanabe development programs.
49
Table of Contents
We expect to continue to use cash in operations as we continue to seek to advance Kanuma toward commercialization, and our pipeline programs through preclinical testing and clinical development. In addition, in the future, we may owe royalties and other contingent payments to our licensors based on the achievement of developmental milestones, product sales, and other specified objectives.
Net cash used in investing activities totaled $44.6 million in the year ended December 31, 2014 and was primarily a result of the purchase of available-for-sale investments of $508.2 million, partially offset by cash received from the maturity of available for sale investments totaling $486.7 million. Cash flows used for investing activities includes $6.1 million related to our purchase of an equity method investment, disclosed in further detail in Note 2, “Summary of Significant Accounting Policies” of the Consolidated Financial Statements included in this Annual Report on Form 10-K. Cash flows used for investing activities also included $16.8 million for capital expenditures and $0.2 million of restricted cash related to security deposits on properties. Capital expenditures primarily relate to leasehold improvements at our production, lab and office locations. Cash used for capital expenditures in the statement of cash flows does not include $2.4 million for amounts that were incurred by our landlord related to the construction of our new Bogart, GA manufacturing facility, where we have been deemed the “accounting owner” based on the applicable lease accounting guidance. See Note 3 “Property and Equipment” of the Consolidated Financial Statements included in this Annual Report on Form 10-K, for additional information.
Net cash used in investing activities totaled $173.1 million in the year ended December 31, 2013 and was primarily a result of the purchase of available-for-sale investments of $426.0 million, partially offset by cash received from the maturity of available for sale investments totaling $272.0 million. Other uses of cash for investing activities included $14.6 million for capital expenditures, $1.9 million of restricted cash related to security deposits on properties and $2.5 million of in-process research and development costs, as discussed in the “Results of Operations—Research and Development Expenses.” The restricted cash outlay relates to deposits associated with construction activities at our new Bogart, GA facility and a long-term letter of credit associated with our headquarters in Lexington, MA. Capital expenditures of $14.6 million primarily relate to leasehold improvements at our production, lab and office locations. Cash used for capital expenditures in the statement of cash flows does not include $1.7 million for amounts that were incurred by our landlord related to the construction of our new Bogart, GA manufacturing facility, where we have been deemed the “accounting owner” based on the applicable lease accounting guidance.
Financing activities provided cash of approximately $215.4 million in the year ended December 31, 2014, resulting from net cash received in secondary offerings of $200.9 million and proceeds from the exercise of stock options of $14.6 million. Cash used in operating activities included $0.2 million related to payments of principle on our lease financing obligation.
Financing activities provided cash of approximately $286.4 million in the year ended December 31, 2013, resulting from net cash received in secondary offerings of $281.2 million and proceeds from the exercise of stock options of $5.2 million.
Funding Requirements
We have incurred significant losses since our inception. At December 31, 2014, we had an accumulated deficit of approximately $446.9 million. Our cash and cash equivalents and investments balance at December 31, 2014 totaled $446.9 million and we raised another $308.7 million through the January 2015 offering of our common stock. We expect to use our existing cash and cash equivalents and investments to continue our research and development programs and commercialization activities and to fulfill our planned operating goals. In particular, our currently planned operating and capital requirements include the need for working capital to support Kanuma, SBC-103, SBC-105 and the other preclinical candidates that we are seeking to develop, and to fund our commercial and medical affair costs and general and administrative expenses as we approach commercialization of Kanuma. We expect that our current funding position will enable us to sustain operations into at least 2017.
Our ability to finance our operations into the future and to generate revenues will depend heavily on our ability to obtain regulatory approval for Kanuma and to successfully clinically develop, manufacture and commercialize Kanuma. We expect that our sources of cash flows from operations for the foreseeable future will be quarterly royalty payments from Roche based on sales of FUZEON and additional collaboration revenues, if any. Net sales of FUZEON by Roche are generally expected to continue to decline in the future.
50
Table of Contents
There are a number of factors that may adversely affect our planned future capital requirements and accelerate our need for additional financing, many of which are beyond our control, including the following:
| • | unanticipated costs in our research and development programs; |
| • | the timing, receipt and amount of payments, if any, from current and potential future collaborators; |
| • | the timing of regulatory approval and future product revenues, if any; |
| • | the timing and amount of contingent milestone payments, if any, from future investments, acquisitions, or license agreements, as applicable; |
| • | the timing and amount of payments due to licensors of patent rights and technology used in our product candidates; and |
| • | unplanned costs to prepare, file, prosecute, maintain and enforce patent claims and other patent-related costs, including costs related to litigation and contested proceedings, and technology license fees. |
We may seek additional funding through debt or equity financings. The fundraising environment for life science companies, in general, is highly volatile. Due to this and various other factors, additional funding may not be available on acceptable terms, if at all. In addition, the terms of any financing may be dilutive or otherwise adversely affect other rights of our stockholders. We also may seek additional funds through arrangements with collaborators, licensees or other third parties. These arrangements would generally require us to relinquish or encumber rights to some of our technologies or product candidates, and we may not be able to enter into such arrangements on acceptable terms, if at all. If we are unable to obtain additional funding on a timely basis, whether through sales of debt or equity or through third-party collaboration or license arrangements, we may be required to curtail or terminate some or all of our development programs, including some or all of our product candidates.
Contractual Obligations and Requirements
As of December 31, 2014, our contractual obligations consisted primarily of operating and capital leases for our headquarters and manufacturing facilities, contractual purchase obligations and to a lesser extent, royalty payments on licensed technology.
Our contractual obligations were as follows at December 31, 2014 (in thousands):
| Total | Less than 1 year |
1-3 years | 3-5 years | More than 5 years |
||||||||||||||||
| Operating leases(1) |
$ | 10,995 | $ | 2,160 | $ | 4,409 | $ | 4,377 | $ | 49 | ||||||||||
| Capital lease obligations, including interest(2) |
4,498 | 439 | 905 | 941 | 2,213 | |||||||||||||||
| Purchase obligations(3) |
68,724 | 60,483 | 8,241 | — | — | |||||||||||||||
| Royalty payments(4) |
60 | 20 | 40 | — | — | |||||||||||||||
|
|
|
|
|
|
|
|
|
|
|
|||||||||||
| $ | 84,277 | $ | 63,102 | $ | 13,595 | $ | 5,318 | $ | 2,262 | |||||||||||
|
|
|
|
|
|
|
|
|
|
|
|||||||||||
| (1) | Represents minimum lease payments for operating leases, including leases with remaining lease terms of under one year. See Item 2.—Properties and Facilities and Note 12 of the Consolidated Financial Statements included in this Annual Report on Form 10-K for additional information about our leases. |
| (2) | Represents minimum lease payments for our capital lease related to our Bogart, GA manufacturing facility lease. See Item 2.—Properties and Facilities and Note 12 of the Consolidated Financial Statements included in this Annual Report on Form 10-K for additional information about our leases. |
| (3) | Purchase obligations primarily represent our estimate of amounts that will be paid to third parties, assuming continued development of Kanuma and our pipeline, relating to contractual arrangements existing as of December 31, 2014. For the avoidance of doubt, the purchase obligations herein are dependent upon the third party providing goods or services under the contract and are cancelable. Amounts above do not include purchase obligations under commercial manufacturing and supply agreements that were entered subsequent to December 31, 2014. |
| (4) | The royalty payments listing above represent amounts expected to be owed through December 31, 2015 to the University of Minnesota. |
51
Table of Contents
Off-Balance Sheet Arrangements
As of December 31, 2014, we did not have any off-balance sheet arrangements as defined in Item 303(a)(4)(ii) of SEC Regulation S-K.
Critical Accounting Estimates and Judgments
The significant accounting policies and basis of preparation of our consolidated financial statements are described in Note 2, “Summary of Significant Accounting Policies” of the Consolidated Financial Statements included in this Annual Report on Form 10-K. Under accounting principles generally accepted in the United States, we are required to make estimates and assumptions that affect the reported amounts of assets, liabilities, revenues, expenses and disclosure of contingent assets and liabilities in our financial statements. Actual results could differ from those estimates.
We believe the judgments, estimates and assumptions associated with the following critical accounting policies have the greatest potential impact on our consolidated financial statements:
| • | Revenue recognition; |
| • | Research and development expenses; |
| • | Impairment of long-lived assets; |
| • | Amortization of developed technology; |
| • | Stock-based compensation expense; and |
| • | Income taxes |
The methods, estimates, and judgments we use in applying our most critical accounting policies have a significant impact on the results reported in our consolidated financial statements. We evaluate our estimates and judgments on an ongoing basis. We base our estimates on historical experience and on assumptions that we believe to be reasonable under the circumstances. Our experience and assumptions form the basis for our judgments about the carrying value of assets and liabilities that are not readily apparent from other sources. Actual results may vary from what we anticipated, and different assumptions or estimates about the future could materially change our reported results.
Revenue Recognition
Our business strategy includes entering into collaborative agreements with biotechnology and pharmaceutical companies. Revenue under collaborations may include the receipt of non-refundable license fees, payments based on achievement of development objectives, reimbursement of research and development costs and royalties on product sales.
We recognize revenue when all of the following criteria are met: persuasive evidence of an arrangement exists, services are performed or products are delivered, the fee is fixed and determinable, and collection is reasonably assured. Determination of whether persuasive evidence exists and whether delivery has occurred or services have been rendered are based on our judgment regarding the fixed nature of the fee charged for deliverables and the collectability of those fees. Should changes in conditions cause us to determine these criteria are not met for future transactions, revenue recognized could be adversely affected.
Royalty Revenue
Royalty revenues are recognized in the period earned, based on contract terms when reported sales are reliably measurable and collectability is reasonably assured. Following the Reverse Merger, we received royalties due to the Roche License Agreement. As part of the Roche License Agreement, Roche has an exclusive license to manufacture and sell FUZEON worldwide and we receive royalty payments equal to 16% of worldwide net sales of FUZEON occurring from and after January 1, 2011. Under the Roche License Agreement, Roche may deduct from its royalty payments to us 50% of any royalties paid to third parties which are reasonably required to allow Roche to sell FUZEON in a given country, including royalties paid to Novartis Vaccines and Diagnostics, Inc. (Novartis). To calculate the royalty revenue paid to us, a 5.5% distribution charge is deducted from Roche’s reported net sales, and we receive a 16% royalty on the adjusted net sales amount.
52
Table of Contents
Collaboration and License Revenue
We recognize revenue related to collaboration and license agreements in accordance with the provisions of ASC Topics 605-25 “Revenue Recognition—Multiple Element Arrangements” (ASC Topic 605-25). We determine the selling price of a deliverable using the hierarchy as prescribed in ASC Topic 605-25 based on VSOE, third party evidence (TPE), or BESP. VSOE is based on the price charged when the element sold separately and is the price actually charged for that deliverable. TPE is determined based on third party evidence for a similar deliverable when sold separately and BESP is the price which we would transact a sale if the elements of the collaboration and license agreements were sold on a stand-alone basis. We evaluate the above noted hierarchy when determining the fair value of a deliverable. The process for determining VSOE, TPE, or BESP involves significant judgment on our part and can include considerations of multiple factors such as estimated direct expenses and other costs and available data.
We evaluate all deliverables within an arrangement to determine whether or not they provided value on a stand-alone basis. Based on this evaluation, the deliverables are separated into units of accounting. The arrangement consideration that is fixed and determinable at the inception of the arrangement is allocated to the separate units of accounting based on the estimated selling price. We may exercise significant judgment in determining whether a deliverable is a separate unit of accounting as well as in estimating the selling prices of such units of accounting.
Whenever we determine that an arrangement should be accounted for as a single unit of accounting, we must determine the period over which the performance obligations will be performed and revenue will be recognized. Revenue will be recognized using either a proportional performance or straight-line method. We recognize revenue using the proportional performance method provided that we can reasonably estimate the level of effort required to complete the performance obligations under an arrangement and such performance obligations are provided on a best-efforts basis. Direct labor hours or full-time equivalents are typically used as the measure of performance. Revenue recognized under the relative performance method would be determined by multiplying the total payments under the contract, excluding royalties and payments contingent upon achievement of substantive milestones, by the ratio of level of effort incurred to date to estimated total level of effort required to complete the performance obligations under the arrangement. Revenue is limited to the lesser of the cumulative amount of payments received or the cumulative amount of revenue earned, as determined using the relative performance method, as of each reporting period.
Significant management judgment is required in determining the level of effort required under an arrangement and the period over which we are expected to complete its performance obligations under an arrangement.
Effective January 1, 2011, we adopted ASU No. 2010-17, “Milestone Method of Revenue Recognition”, which provides guidance on revenue recognition using the milestone method. Under the milestone method, a payment that is contingent upon the achievement of a substantive milestone is recognized in its entirety in the period in which the milestone is achieved. A milestone is an event (i) that can be achieved based in whole or in part on either our performance or on the occurrence of a specific outcome resulting from our performance, (ii) for which there is substantive uncertainty at the date the arrangement is entered into that the event will be achieved and (iii) that would result in additional payments being due. The determination that a milestone is substantive is subject to considerable judgment and is made at the inception of the arrangement. Milestones are considered substantive when the consideration earned from the achievement of the milestone is (i) commensurate with either our performance to achieve the milestone or the enhancement of value of the item delivered as a result of a specific outcome resulting from our performance to achieve the milestone, (ii) relates solely to past performance and (iii) is reasonable relative to all deliverables and payment terms in the arrangement. The adoption of this standard did not impact our financial position or our results of operations for any prior period.
Research and Development
Research and development expenses primarily consist of internal personnel expense for discovery research, pre-clinical and clinical operations, manufacturing development, medical affairs and regulatory functions as well as fees for clinical and non-clinical studies, materials and supplies, facilities, depreciation, third-party costs for contracted services, manufacturing process improvement and testing costs, and other research and development related costs. Clinical development and manufacturing costs are a significant component of our research and development expenses. We contract with third parties that perform various clinical trial activities and outsourced manufacturing activities on
53
Table of Contents
our behalf in the ongoing development of our product candidates. The financial terms of these contracts are subject to negotiations and may vary from contract to contract and may result in uneven payment flow. Research and development costs are expensed as incurred if no planned alternative future use exists for the technology and if the payment is not payment for future services. We defer and capitalize our nonrefundable advance payments that are for research and development activities until the related goods are delivered or the related services are performed.
Impairment of Other Long-Lived Assets
We continually evaluate whether events or circumstances have occurred that indicate that the estimated remaining useful life of long-lived assets and intangible assets may warrant revision or if events or circumstances indicate that the carrying value of these assets may be impaired. To assess whether assets have been impaired, the estimated undiscounted future cash flows for the estimated remaining useful life of the assets are compared to the carrying value. To the extent that the future cash flows are less than the carrying value, the assets are written down to the estimated fair value, based on the discounted cash flows of the asset.
We assess potential other-than-temporary impairments in equity method investments in accordance with ASC 323-10, “Investments—Equity Method and Joint Ventures.” Equity method investments are reviewed for impairment whenever events or changes in circumstances indicate that the carrying amount of an investment might not be recoverable. To evaluate potential other-than-temporary impairments, we: i) determine when an investment is considered impaired; ii) evaluate whether the impairment is other-than-temporary, and iii) measure and recognize the other-than-temporary impairment. Once an equity method investment is deemed to be other-than-temporarily impaired, it is recorded at its fair value. An impairment charge is measured as the difference between the carrying amount of the asset and the fair value.
Amortization of Developed Technology
We provide for amortization of developed technology, computed using an accelerated method according to the undiscounted expected cash flows to be received from the underlying assets, over an estimated useful life of 10 years.
Share Based Compensation
We have one plan from which equity awards can be granted, the 2014 Equity Incentive Plan (2014 Plan). The 2014 Plan was approved by our stockholders at our annual meeting, held in June 2014. The 2014 Plan replaced the 2005 Stock Plan. To date, share based compensation issued under the 2014 Plan consists of incentive and non-qualified stock options and restricted stock units.
Compensation expense for our share-based awards is recognized based on the estimated fair value of the awards on the grant date. The fair value of each stock option grant is estimated on the date of grant using the Black-Scholes option-pricing model. The expected life assumption is based on our historical experience of exercises, management’s expectations based on the length of time that an employee will stay at the Company, the vesting period of four years and the contractual term of ten years. We estimate volatility using a blended approach encompassing: (i) historical experience and peer group (including industry, size, life cycle and financial leverage), and (ii) implied volatility from publicly traded options with the longest available contractual terms. The risk-free interest rate is based on the U.S. Treasury zero coupon rate with a remaining term approximating the expected term used as the input to the Black-Scholes option pricing model.
Income Taxes
Deferred income taxes are provided for the net tax effects of temporary differences between the carrying amounts of assets and liabilities for financial reporting purposes and the amounts used for income tax purposes and operating loss carryforwards and credits. Valuation allowances are recorded to reduce the net deferred tax assets to amounts we believe are more-likely-than-not to be realized.
54
Table of Contents
| ITEM 7A. | QUANTITATIVE AND QUALITATIVE DISCLOSURES ABOUT MARKET RISK. |
Interest Rate Risk
The primary objective of our investment activities is to preserve our capital to fund operations, while at the same time maximizing the income we receive from our investments without significantly increasing risk. Our exposure to market risk for changes in interest rates relates primarily to the increase or decrease in the amount of interest income we can earn on our investment portfolio. Our risk associated with fluctuating interest income is limited to our investments in interest rate-sensitive financial instruments. Under our current policies, we do not use interest rate derivative instruments to manage this exposure to interest rate changes. We seek to ensure the safety and preservation of our invested principal by limiting default risk, market risk and reinvestment risk. We mitigate default risk by investing in treasury-backed money market funds and short-term treasury securities. In accordance with our investment policy, we do not invest in auction rate securities. We estimate that a hypothetical 50 and 100-basis point movement in market interest rates would impact the fair value of our December 31, 2014 investment portfolio by $0.8 million and $1.6 million, respectively. While changes in interest rates may affect the fair value of our investment portfolio, any gains or losses are not recognized in our statement of operations until the investment is sold prior to maturity or if a reduction in fair value is determined to be a permanent impairment. We do not use derivative financial instruments in our investment portfolio.
Foreign Exchange Market Risk
As we expand internationally, we face exposure to movements in the foreign currency exchange rates of local currencies, including the British Pound, Euro, Swiss Franc, Japanese Yen, Mexican Peso and Brazilian Real against the U.S. dollar. Cash held and transacted in foreign currencies is not currently material to our operations, and as a result, we believe our exposure to foreign exchange risk is insignificant.
| ITEM 8. | FINANCIAL STATEMENTS AND SUPPLEMENTARY DATA. |
Our consolidated financial statements and supplementary data required in this Item 8 are set forth beginning on page 50 of this report.
| ITEM 9. | CHANGES IN AND DISAGREEMENTS WITH ACCOUNTANTS ON ACCOUNTING AND FINANCIAL DISCLOSURE. |
None.
| ITEM 9A. | CONTROLS AND PROCEDURES. |
Conclusion Regarding the Effectiveness of Disclosure Controls and Procedures
Under the supervision and with the participation of our management, including our principal executive officer and principal financial officer, we conducted an evaluation of our disclosure controls and procedures, as such term is defined under Rule 13a-15(e) promulgated under the Securities Exchange Act of 1934, as amended, or Exchange Act. Based on this evaluation, our principal executive officer and our principal financial officer concluded that our disclosure controls and procedures were effective as of the end of the period covered by this Annual Report.
Management’s Report on Internal Control over Financial Reporting
Our management is responsible for establishing and maintaining adequate internal control over financial reporting as defined in Rules 13a-15(f) and 15d-15(f) under the Exchange Act. Our internal control over financial reporting is a process designed to provide reasonable assurance regarding the reliability of financial reporting and the preparation of financial statements for external purposes in accordance with generally accepted accounting principles. Because of its inherent limitations, internal control over financial reporting may not prevent or detect misstatements. Also, projections of any evaluation of effectiveness to future periods are subject to the risk that controls may become inadequate because of changes in conditions, or that the degree of compliance with the policies or procedures may deteriorate.
55
Table of Contents
Management utilized the criteria set forth in “Internal Control-Integrated Framework (2013)” issued by the Committee of Sponsoring Organizations of the Treadway Commission to conduct an assessment of the effectiveness of our internal control over financial reporting as of December 31, 2014. Based on the assessment, management has concluded that, as of December 31, 2014, our internal control over financial reporting is effective.
PricewaterhouseCoopers LLP, our independent registered public accounting firm, which audited our financial statements for the fiscal year ended December 31, 2014, has issued an attestation report on our internal control over financial reporting, as stated in its report which is included herein.
Changes in Internal Control over Financial Reporting
There have not been any changes in the Company’s internal control over financial reporting during the quarter ended December 31, 2014, that have materially affected, or are reasonably likely to materially affect, the Company’s internal control over financial reporting.
| ITEM 9B. | OTHER INFORMATION. |
None.
56
Table of Contents
| ITEM 10. | DIRECTORS, EXECUTIVE OFFICERS AND CORPORATE GOVERNANCE. |
The information required by Item 10 is incorporated by reference from our definitive Proxy Statement to be filed by us with the SEC within 120 days after the end of the fiscal year covered by this Annual Report on Form 10-K.
| ITEM 11. | EXECUTIVE COMPENSATION. |
The information required by Item 11 is incorporated by reference from our definitive Proxy Statement to be filed by us with the SEC within 120 days after the end of the fiscal year covered by this Annual Report on Form 10-K.
| ITEM 12. | SECURITY OWNERSHIP OF CERTAIN BENEFICIAL OWNERS AND MANAGEMENT AND RELATED STOCKHOLDER MATTERS. |
The information required by Item 12 is incorporated by reference from our definitive Proxy Statement to be filed by us with the SEC within 120 days after the end of the fiscal year covered by this Annual Report on Form 10-K.
| ITEM 13. | CERTAIN RELATIONSHIPS AND RELATED TRANSACTIONS, AND DIRECTOR INDEPENDENCE. |
The information required by Item 13 is incorporated by reference from our definitive Proxy Statement to be filed by us with the SEC within 120 days after the end of the fiscal year covered by this Annual Report on Form 10-K.
| ITEM 14. | PRINCIPAL ACCOUNTANT FEES AND SERVICES. |
The information required by Item 14 is incorporated by reference from our definitive Proxy Statement to be filed by us with the SEC within 120 days after the end of the fiscal year covered by this Annual Report on Form 10-K.
57
Table of Contents
| ITEM 15. | EXHIBITS, FINANCIAL STATEMENT SCHEDULES. |
The following documents are filed as part of this report:
2. Financial Statement Schedules
All financial statement schedules required under Regulation S-X are omitted, as the required information is not applicable.
3. Exhibits
The Exhibits filed as part of this Form 10-K are listed on the Exhibit Index immediately preceding such Exhibits and are incorporated by reference. We have identified in the Exhibit Index each management contract and compensation plan or arrangement filed as an exhibit to this Annual Report on Form 10-K in response to Item 15(b) of Form 10-K.
58
Table of Contents
Pursuant to the requirements of Section 13 or 15(d) of the Securities Exchange Act of 1934, the registrant has duly caused this report to be signed on its behalf by the undersigned, thereunto duly authorized.
Date: February 26, 2015
| SYNAGEVA BIOPHARMA CORP. | ||
| By: | /s/ Sanj K. Patel | |
| Sanj K. Patel | ||
| President and Chief Executive Officer | ||
Pursuant to the requirements of the Securities Exchange Act of 1934, this report has been signed below by the following persons on behalf of the Registrant in the capacities and on the dates indicated.
| SIGNATURES |
TITLE |
DATE | ||
| /s/ Sanj K. Patel Sanj K. Patel |
President and Chief Executive Officer |
February 26, 2015 | ||
| /s/ Carsten Boess Carsten Boess |
Senior Vice President, Chief Financial Officer (Principal Financial Officer) |
February 26, 2015 | ||
| /s/ Chris Heberlig Chris Heberlig |
Senior Vice President, Finance and Business Operations (Principal Accounting Officer) |
February 26, 2015 | ||
| /s/ Felix J. Baker Felix J. Baker |
Director |
February 26, 2015 | ||
| /s/ Stephen R. Biggar Stephen R. Biggar |
Director |
February 26, 2015 | ||
| /s/ Stephen R. Davis Stephen R. Davis |
Director |
February 26, 2015 | ||
| /s/ Thomas R. Malley Thomas R. Malley |
Director |
February 26, 2015 | ||
| /s/ Barry Quart Barry Quart |
Director |
February 26, 2015 | ||
| /s/ Thomas J. Tisch Thomas J. Tisch |
Director |
February 26, 2015 | ||
| /s/ Peter Wirth Peter Wirth |
Director |
February 26, 2015 | ||
59
Table of Contents
Report of Independent Registered Public Accounting Firm
To the Board of Directors and Stockholders
of Synageva BioPharma Corp.:
In our opinion, the accompanying consolidated balance sheets and the related consolidated statements of operations, of comprehensive loss, of changes in stockholders’ equity, and of cash flows present fairly, in all material respects, the financial position of Synageva BioPharma Corp. and its subsidiaries at December 31, 2014 and 2013, and the results of their operations and their cash flows for each of the three years in the period ended December 31, 2014 in conformity with accounting principles generally accepted in the United States of America. Also in our opinion, the Company maintained, in all material respects, effective internal control over financial reporting as of December 31, 2014, based on criteria established in Internal Control—Integrated Framework (2013) issued by the Committee of Sponsoring Organizations of the Treadway Commission (COSO). The Company’s management is responsible for these financial statements, for maintaining effective internal control over financial reporting and for its assessment of the effectiveness of internal control over financial reporting, included in Management’s Report on Internal Control over Financial Reporting appearing under Item 9A. Our responsibility is to express opinions on these financial statements and on the Company’s internal control over financial reporting based on our integrated audits. We conducted our audits in accordance with the standards of the Public Company Accounting Oversight Board (United States). Those standards require that we plan and perform the audits to obtain reasonable assurance about whether the financial statements are free of material misstatement and whether effective internal control over financial reporting was maintained in all material respects. Our audits of the financial statements included examining, on a test basis, evidence supporting the amounts and disclosures in the financial statements, assessing the accounting principles used and significant estimates made by management, and evaluating the overall financial statement presentation. Our audit of internal control over financial reporting included obtaining an understanding of internal control over financial reporting, assessing the risk that a material weakness exists, and testing and evaluating the design and operating effectiveness of internal control based on the assessed risk. Our audits also included performing such other procedures as we considered necessary in the circumstances. We believe that our audits provide a reasonable basis for our opinions.
A company’s internal control over financial reporting is a process designed to provide reasonable assurance regarding the reliability of financial reporting and the preparation of financial statements for external purposes in accordance with generally accepted accounting principles. A company’s internal control over financial reporting includes those policies and procedures that (i) pertain to the maintenance of records that, in reasonable detail, accurately and fairly reflect the transactions and dispositions of the assets of the company; (ii) provide reasonable assurance that transactions are recorded as necessary to permit preparation of financial statements in accordance with generally accepted accounting principles, and that receipts and expenditures of the company are being made only in accordance with authorizations of management and directors of the company; and (iii) provide reasonable assurance regarding prevention or timely detection of unauthorized acquisition, use, or disposition of the company’s assets that could have a material effect on the financial statements.
Because of its inherent limitations, internal control over financial reporting may not prevent or detect misstatements. Also, projections of any evaluation of effectiveness to future periods are subject to the risk that controls may become inadequate because of changes in conditions, or that the degree of compliance with the policies or procedures may deteriorate.
/s/ PricewaterhouseCoopers LLP
Boston, Massachusetts
February 26, 2015
60
Table of Contents
Synageva BioPharma Corp.
December 31, 2014 and 2013
(In thousands, except per share amounts)
| 2014 | 2013 | |||||||
| Assets |
||||||||
| Current assets: |
||||||||
| Cash and cash equivalents |
$ | 82,653 | $ | 62,137 | ||||
| Short-term investments |
364,255 | 346,596 | ||||||
| Accounts receivable |
986 | 1,373 | ||||||
| Prepaid expenses and other current assets |
9,938 | 6,617 | ||||||
|
|
|
|
|
|||||
| Total current assets |
457,832 | 416,723 | ||||||
| Property and equipment, net |
31,559 | 17,213 | ||||||
| Developed technology, net |
2,003 | 3,491 | ||||||
| Goodwill |
8,535 | 8,535 | ||||||
| Other assets |
4,274 | 1,987 | ||||||
|
|
|
|
|
|||||
| Total assets |
$ | 504,203 | $ | 447,949 | ||||
|
|
|
|
|
|||||
| Liabilities and Stockholders’ Equity |
||||||||
| Current liabilities: |
||||||||
| Accounts payable |
$ | 2,625 | $ | 2,427 | ||||
| Accrued expenses |
21,710 | 11,121 | ||||||
| Deferred revenue |
— | 232 | ||||||
| Other current liabilities |
908 | 140 | ||||||
|
|
|
|
|
|||||
| Total current liabilities |
25,243 | 13,920 | ||||||
| Other long term liabilities |
5,721 | 3,828 | ||||||
|
|
|
|
|
|||||
| Total liabilities |
$ | 30,964 | $ | 17,748 | ||||
|
|
|
|
|
|||||
| Commitments and contingencies (Note 10) |
||||||||
| Stockholders’ equity: |
||||||||
| Common stock, par value $0.001; 60,000 shares authorized at December 31, 2014 and 2013, respectively; 33,370 and 30,768 shares issued and outstanding at December 31, 2014 and 2013, respectively |
33 | 31 | ||||||
| Additional paid-in capital |
920,333 | 684,468 | ||||||
| Accumulated other comprehensive loss |
(240 | ) | (59 | ) | ||||
| Accumulated deficit |
(446,887 | ) | (254,239 | ) | ||||
|
|
|
|
|
|||||
| Total stockholders’ equity |
$ | 473,239 | $ | 430,201 | ||||
|
|
|
|
|
|||||
| Total liabilities and stockholders’ equity |
$ | 504,203 | $ | 447,949 | ||||
|
|
|
|
|
|||||
The accompanying notes are an integral part of these financial statements.
61
Table of Contents
Synageva BioPharma Corp.
Consolidated Statements of Operations
Years Ended December 31, 2014, 2013 and 2012
(In thousands, except per share amounts)
| 2014 | 2013 | 2012 | ||||||||||
| Revenues: |
||||||||||||
| Royalty revenue |
$ | 6,000 | $ | 7,042 | $ | 7,023 | ||||||
| Collaboration and license revenue |
492 | 6,332 | 7,931 | |||||||||
|
|
|
|
|
|
|
|||||||
| Total revenue |
6,492 | 13,374 | 14,954 | |||||||||
| Costs and expenses: |
||||||||||||
| Research and development |
142,638 | 79,644 | 37,347 | |||||||||
| Selling, general and administrative |
54,498 | 27,560 | 17,396 | |||||||||
| Amortization of developed technology |
1,489 | 2,073 | 3,232 | |||||||||
|
|
|
|
|
|
|
|||||||
| Total costs and expenses |
198,625 | 109,277 | 57,975 | |||||||||
|
|
|
|
|
|
|
|||||||
| Loss from operations |
(192,133 | ) | (95,903 | ) | (43,021 | ) | ||||||
| Other (expense) income, net |
(238 | ) | 159 | — | ||||||||
| Interest income, net |
263 | 342 | 72 | |||||||||
|
|
|
|
|
|
|
|||||||
| Loss before provision for income taxes |
(192,108 | ) | (95,402 | ) | (42,949 | ) | ||||||
| Provision for income taxes |
540 | 48 | — | |||||||||
|
|
|
|
|
|
|
|||||||
| Net loss |
$ | (192,648 | ) | $ | (95,450 | ) | $ | (42,949 | ) | |||
|
|
|
|
|
|
|
|||||||
| Basic and diluted net loss per share |
$ | (5.89 | ) | $ | (3.40 | ) | $ | (1.90 | ) | |||
|
|
|
|
|
|
|
|||||||
| Weighted average shares used in basic and diluted per share computations |
32,719 | 28,087 | 22,579 | |||||||||
|
|
|
|
|
|
|
|||||||
The accompanying notes are an integral part of these financial statements.
62
Table of Contents
Synageva BioPharma Corp.
Consolidated Statements of Comprehensive Loss
Years Ended December 31, 2014, 2013 and 2012
(In thousands)
| 2014 | 2013 | 2012 | ||||||||||
| Net loss |
$ | (192,648 | ) | $ | (95,450 | ) | $ | (42,949 | ) | |||
| Other comprehensive loss: |
||||||||||||
| Fair market value adjustments of available for sale securities |
(75 | ) | (37 | ) | 15 | |||||||
| Foreign currency translation adjustments |
(106 | ) | (28 | ) | (5 | ) | ||||||
|
|
|
|
|
|
|
|||||||
| Total other comprehensive (loss) gain |
(181 | ) | (65 | ) | 10 | |||||||
|
|
|
|
|
|
|
|||||||
| Comprehensive loss |
$ | (192,829 | ) | $ | (95,515 | ) | $ | (42,939 | ) | |||
|
|
|
|
|
|
|
|||||||
The accompanying notes are an integral part of these financial statements.
63
Table of Contents
Synageva BioPharma Corp.
Statements of Changes in Stockholders’ Equity
Years Ended December 31, 2014, 2013 and 2012
(In thousands)
| Common Stock | Additional Paid-In Capital |
Accumulated Deficit |
Accumulated Other Comprehensive Income (Loss) |
Total Stockholder’s Equity |
||||||||||||||||||||
| Shares | Amount | |||||||||||||||||||||||
| Balances December 31, 2011 |
17,582 | $ | 18 | $ | 189,874 | $ | (115,840 | ) | $ | (4 | ) | $ | 74,048 | |||||||||||
|
|
|
|
|
|
|
|
|
|
|
|
|
|||||||||||||
| Issuance of common stock |
6,366 | 6 | 192,730 | — | — | 192,736 | ||||||||||||||||||
| Exercise of stock options |
519 | 0 | 1,361 | — | — | 1,361 | ||||||||||||||||||
| Stock-based compensation expense |
— | — | 4,971 | — | — | 4,971 | ||||||||||||||||||
| Fair market value adjustments of available for sale investments |
— | — | — | — | 15 | 15 | ||||||||||||||||||
| Cumulative translation adjustment |
— | — | — | — | (5 | ) | (5 | ) | ||||||||||||||||
| Net loss |
— | — | — | (42,949 | ) | — | (42,949 | ) | ||||||||||||||||
|
|
|
|
|
|
|
|
|
|
|
|
|
|||||||||||||
| Balances December 31, 2012 |
24,467 | $ | 24 | $ | 388,936 | $ | (158,789 | ) | $ | 6 | $ | 230,177 | ||||||||||||
|
|
|
|
|
|
|
|
|
|
|
|
|
|||||||||||||
| Issuance of common stock |
5,636 | 6 | 281,187 | — | — | 281,193 | ||||||||||||||||||
| Exercise of stock options |
665 | 1 | 5,158 | — | — | 5,159 | ||||||||||||||||||
| Stock-based compensation expense |
— | — | 9,187 | — | — | 9,187 | ||||||||||||||||||
| Fair market value adjustments of available for sale investments |
— | — | — | — | (37 | ) | (37 | ) | ||||||||||||||||
| Cumulative translation adjustment |
— | — | — | — | (28 | ) | (28 | ) | ||||||||||||||||
| Net loss |
— | — | — | (95,450 | ) | — | (95,450 | ) | ||||||||||||||||
|
|
|
|
|
|
|
|
|
|
|
|
|
|||||||||||||
| Balances December 31, 2013 |
30,768 | $ | 31 | $ | 684,468 | $ | (254,239 | ) | $ | (59 | ) | $ | 430,201 | |||||||||||
|
|
|
|
|
|
|
|
|
|
|
|
|
|||||||||||||
| Issuance of common stock |
2,000 | 2 | 200,923 | — | — | 200,925 | ||||||||||||||||||
| Exercise of stock options |
602 | 0 | 14,612 | — | — | 14,612 | ||||||||||||||||||
| Stock-based compensation expense |
— | — | 20,330 | — | — | 20,330 | ||||||||||||||||||
| Fair market value adjustments of available for sale investments |
— | — | — | — | (75 | ) | (75 | ) | ||||||||||||||||
| Cumulative translation adjustment |
— | — | — | — | (106 | ) | (106 | ) | ||||||||||||||||
| Net loss |
— | — | — | (192,648 | ) | — | (192,648 | ) | ||||||||||||||||
|
|
|
|
|
|
|
|
|
|
|
|
|
|||||||||||||
| Balances December 31, 2014 |
33,370 | $ | 33 | $ | 920,333 | $ | (446,887 | ) | $ | (240 | ) | $ | 473,239 | |||||||||||
|
|
|
|
|
|
|
|
|
|
|
|
|
|||||||||||||
The accompanying notes are an integral part of these financial statements.
64
Table of Contents
Synageva BioPharma Corp.
Consolidated Statements of Cash Flows
Years Ended December 31, 2014, 2013 and 2012
(In thousands)
| 2014 | 2013 | 2012 | ||||||||||
| Cash flows from operating activities |
||||||||||||
| Net Loss |
$ | (192,648 | ) | $ | (95,450 | ) | $ | (42,949 | ) | |||
| Adjustments: |
||||||||||||
| Depreciation and amortization |
6,071 | 5,566 | 4,272 | |||||||||
| Stock compensation expense |
20,330 | 9,187 | 4,971 | |||||||||
| Amortization of premium on investments |
3,798 | 2,486 | 310 | |||||||||
| Impairment of equity method investment |
3,488 | — | — | |||||||||
| Loss on equity method investment |
616 | — | — | |||||||||
| Acquired in-process research and development |
— | 2,500 | 344 | |||||||||
| Changes in assets and liabilities, net of acquisition: |
||||||||||||
| Accounts receivable |
387 | 1,226 | (388 | ) | ||||||||
| Prepaid expenses, other current assets, and other assets |
(3,392 | ) | (3,076 | ) | (1,324 | ) | ||||||
| Accounts payable |
32 | (149 | ) | 1,069 | ||||||||
| Accrued expenses, other current and non-current liabilities |
11,426 | 7,867 | 109 | |||||||||
| Deferred revenue |
(232 | ) | (5,159 | ) | 2,651 | |||||||
|
|
|
|
|
|
|
|||||||
| Net cash used in operating activities |
(150,124 | ) | (75,002 | ) | (30,935 | ) | ||||||
|
|
|
|
|
|
|
|||||||
| Cash flows from investing activities |
||||||||||||
| Purchase of available for sale investments |
(508,232 | ) | (425,999 | ) | (195,365 | ) | ||||||
| Proceeds from sales and maturities of available for sale investments |
486,700 | 271,950 | — | |||||||||
| Purchase of equity method investment |
(6,104 | ) | — | — | ||||||||
| Capital expenditures |
(16,766 | ) | (14,621 | ) | (3,746 | ) | ||||||
| Purchase of in-process research and development and other assets |
— | (2,500 | ) | (394 | ) | |||||||
| Restricted cash |
(216 | ) | (1,935 | ) | — | |||||||
|
|
|
|
|
|
|
|||||||
| Net cash used in investing activities |
(44,618 | ) | (173,105 | ) | (199,505 | ) | ||||||
|
|
|
|
|
|
|
|||||||
| Cash flows from financing activities |
||||||||||||
| Proceeds from issuance of common stock, net of issuance costs |
200,925 | 281,193 | 192,736 | |||||||||
| Proceeds from exercise of stock options |
14,612 | 5,159 | 1,361 | |||||||||
| Payments for lease financing obligation (Note 3) |
(173 | ) | — | — | ||||||||
|
|
|
|
|
|
|
|||||||
| Net cash provided by financing activities |
215,364 | 286,352 | 194,097 | |||||||||
|
|
|
|
|
|
|
|||||||
| Effect of exchange rate on cash |
(106 | ) | 9 | (6 | ) | |||||||
|
|
|
|
|
|
|
|||||||
| Net increase (decrease) in cash and equivalents |
20,516 | 38,254 | (36,349 | ) | ||||||||
| Cash and equivalents at the beginning of period |
62,137 | 23,883 | 60,232 | |||||||||
|
|
|
|
|
|
|
|||||||
| Cash and equivalents at the end of period |
$ | 82,653 | $ | 62,137 | $ | 23,883 | ||||||
|
|
|
|
|
|
|
|||||||
| Capitalization of leasehold improvements related to facility lease obligation (Note 3) |
$ | 2,388 | $ | 1,713 | — | |||||||
| Capital expenditures incurred but not yet paid |
321 | 360 | — | |||||||||
The accompanying notes are an integral part of these financial statements.
65
Table of Contents
Synageva BioPharma Corp.
Notes to Consolidated Financial Statements
(In thousands, except for per share amounts and as otherwise disclosed)
| 1. | Nature of the Business |
Synageva BioPharma Corp. (Synageva or the Company) is a biopharmaceutical company focused on the discovery, development, and commercialization of therapeutic products for patients with rare diseases. The Company has a pipeline of protein therapeutic programs for rare diseases with unmet medical need which are currently at various stages of development. Synageva is currently planning for a global launch of our lead program, sebelipase alfa for lysosomal acid lipase deficiency (LAL Deficiency). Kanuma™ is the proposed brand name for sebelipase alfa. The Company also has an active investigational new drug application (IND) with the U.S. Food & Drug Administration (FDA) to evaluate its second program, SBC-103 a first-mover program for mucopolysaccharidosis IIIB (MPS IIIB, also known as Sanfilippo B syndrome). The Company is currently dosing patients with MPS IIIB in a Phase 1/2 study investigating intravenous administration of SBC-103 and plans to report preliminary data from this study in the second half of 2015. The Company’s third pipeline program, SBC-105, is a first-mover enzyme therapy in preclinical development for rare disorders of calcification, including the first planned indication for generalized calcification in infants (GACI). Synageva has additional first-mover and potentially bio-superior protein therapeutic pipeline programs for other rare diseases at different stages of preclinical development. Synageva owns the worldwide commercial rights to all of its pipeline programs.
The Company’s business is subject to risks including those common to companies in the biopharmaceutical industry, such as the successful development of products, patient enrollment, clinical trial uncertainty, regulatory approval, manufacturing and supply disruption, fluctuations in operating results and financial risks, potential need for additional funding, protection of proprietary technology and patent risks, compliance with government regulations, dependence on key personnel, competition, appropriate commercial infrastructure, technological and medical risks and management of growth.
The Company has incurred losses since inception and at December 31, 2014, had an accumulated deficit of $446.9 million. The Company expects to incur losses over the next several years as it continues to expand its drug discovery, development efforts and commercial activities. As a result of continuing losses, the Company may seek additional funding through a combination of public or private financing, collaborative relationships, licensing or other arrangements. The Company may not be able to obtain financing on acceptable terms, or at all, and the Company may not be able to enter into new collaboration or license agreements. If the Company is unable to obtain additional funding on a timely basis, it may be required to curtail or terminate some or all of its development programs and commercialization plans, including some or all of its product candidates.
Through December 31, 2014, the Company has funded its operations primarily from proceeds of the sale of stock, and to a lesser extent, royalty income and collaboration agreements. In March 2014, the Company completed an offering of 2.0 million shares of common stock and received net proceeds of approximately $200.9 million. In addition to this financing, the Company received aggregate net proceeds of approximately $473.9 million from public equity offerings in fiscal 2013 and 2012. In January 2015, the Company completed an offering of 3.5 million shares of common stock and received net proceeds of $308.7 million. The proceeds from the January 2015 offering are not included in the consolidated financials as of December 31, 2014, as the offering occurred subsequent to year end.
| 2. | Summary of Significant Accounting Policies |
Basis of Presentation
Use of Estimates
The preparation of financial statements in conformity with accounting principles generally accepted in the United States of America (GAAP) requires management to make estimates and assumptions that affect the reported amounts of assets and liabilities and the disclosure of contingent assets and liabilities at the date of the financial statements and the reported amounts of revenues and expenses during the reporting period. Actual results could differ from those estimates.
66
Table of Contents
Principles of Consolidation
Synageva’s consolidated financial statements include the accounts of Synageva and its wholly owned subsidiaries. All intercompany accounts and transactions have been eliminated in consolidation.
Reverse Merger
On November 2, 2011, Trimeris, Inc., a Delaware corporation (Trimeris), closed a merger transaction (the Reverse Merger) with Synageva BioPharma Corp., a privately held Delaware corporation (Private Synageva), pursuant to an Agreement and Plan of Merger and Reorganization, dated as of June 13, 2011 (the Merger Agreement), by and among Trimeris, Private Synageva and Tesla Merger Sub, Inc., a wholly owned subsidiary of Trimeris (Merger Sub). Pursuant to the Merger Agreement, Private Synageva became a wholly owned subsidiary of Trimeris through a merger of Merger Sub with and into Private Synageva, and the former stockholders of Private Synageva received shares of Trimeris that constituted a majority of the outstanding shares of Trimeris. In connection with the Reverse Merger, Trimeris changed its name to Synageva BioPharma Corp.
The Reverse Merger was accounted for as a reverse acquisition under which Private Synageva was considered the acquirer of Trimeris.
Cash and Cash Equivalents
The Company considers all highly liquid investments with a remaining maturity at the date of purchase of 90 days or less to be cash equivalents. At December 31, 2014 and 2013, substantially all cash equivalents were U.S. treasury bills and amounts held in money market accounts at commercial banks.
Investments
All of the Company’s investments were classified as available-for-sale at December 31, 2014 and 2013. The principal amounts of short-term investments are summarized in the tables below:
| Less Than 12 Months to Maturity | ||||||||||||||||
| Amortized Cost |
Unrealized Gains |
Unrealized (Losses) |
Fair Value | |||||||||||||
| Balance at December 31, 2014: |
||||||||||||||||
| U.S. Treasury securities |
$ | 364,352 | $ | — | $ | (97 | ) | $ | 364,255 | |||||||
|
|
|
|
|
|
|
|
|
|||||||||
| Total |
$ | 364,352 | $ | — | $ | (97 | ) | $ | 364,255 | |||||||
| Balance at December 31, 2013: |
||||||||||||||||
| U.S. Treasury securities |
$ | 346,618 | $ | — | $ | (22 | ) | $ | 346,596 | |||||||
|
|
|
|
|
|
|
|
|
|||||||||
| Total |
$ | 346,618 | $ | — | $ | (22 | ) | $ | 346,596 | |||||||
|
|
|
|
|
|
|
|
|
|||||||||
The following table presents information about the Company’s financial assets and liabilities measured at fair value on a recurring basis as of December 31, 2014:
| December 31, 2014 |
Quoted Price in Active Markets (Level 1) |
Significant Other Observable Inputs (Level 2) |
Significant Unobservable Inputs (Level 3) |
|||||||||||||
| Assets |
||||||||||||||||
| Cash equivalents |
||||||||||||||||
| Money market fund |
$ | 71,226 | $ | — | $ | 71,226 | $ | — | ||||||||
| US treasury securities |
— | — | — | — | ||||||||||||
| Marketable securities |
||||||||||||||||
| US treasury securities |
364,255 | — | 364,255 | — | ||||||||||||
|
|
|
|
|
|
|
|
|
|||||||||
| Total |
$ | 435,481 | $ | — | $ | 435,481 | $ | — | ||||||||
|
|
|
|
|
|
|
|
|
|||||||||
67
Table of Contents
Level 1 inputs are quoted prices in active markets for identical assets or liabilities and consist of cash on deposit. Items classified as Level 2 within the valuation hierarchy consist of U.S. government-related debt securities and money market funds. We estimate the fair values of these marketable securities by taking into consideration valuations obtained from third-party pricing sources. These pricing sources utilize industry standard valuation models, including both income and market-based approaches, for which all significant inputs are observable, either directly or indirectly, to estimate fair value. These inputs include market pricing based on real-time trade data for the same or similar securities, issuer credit spreads, benchmark yields, and other observable inputs. We validate the prices provided by our third-party pricing sources by understanding the models used, obtaining market values from other pricing sources and analyzing pricing data in certain instances.
The following table presents information about the Company’s financial assets and liabilities measured at fair value on a recurring basis as of December 31, 2013:
| December 31, 2013 |
Quoted Price in Active Markets (Level 1) |
Significant Other Observable Inputs (Level 2) |
Significant Unobservable Inputs (Level 3) |
|||||||||||||
| Assets |
||||||||||||||||
| Cash equivalents |
||||||||||||||||
| Money market fund |
$ | 27,899 | $ | 27,899 | $ | — | $ | — | ||||||||
| US treasury securities |
21,021 | — | 21,021 | — | ||||||||||||
| Marketable securities |
||||||||||||||||
| US treasury securities |
346,596 | — | 346,596 | — | ||||||||||||
|
|
|
|
|
|
|
|
|
|||||||||
| Total |
$ | 395,516 | $ | 27,899 | $ | 367,617 | $ | — | ||||||||
|
|
|
|
|
|
|
|
|
|||||||||
Impairment of Other Long-Lived Assets
The Company continually evaluates whether events or circumstances have occurred that indicate that the estimated remaining useful life of long-lived assets and intangible assets may warrant revision or if events or circumstances indicate that the carrying value of these assets may be impaired. To assess whether assets have been impaired, the estimated undiscounted future cash flows for the estimated remaining useful life of the assets are compared to the carrying value. To the extent that the future cash flows are less than the carrying value, the assets are written down to the estimated fair value, based on the discounted cash flows of the asset.
Other-than-Temporary Impairment
The Company assesses other-than-temporary impairment in equity method investments in accordance with ASC 323-10, “Investments—Equity Method and Joint Ventures.” Equity method investments are reviewed for impairment whenever events or changes in circumstances indicate that the carrying amount of an investment might not be recoverable. To evaluate potential other-than-temporary impairments, the Company: i) determines when an investment is considered impaired; ii) evaluates whether the impairment is other-than-temporary, and iii) measures and recognizes the other-than-temporary impairment. Once an equity method investment is deemed to be other-than-temporarily impaired, it is recorded at its fair value. An impairment charge is measured as the difference between the carrying amount of the asset and the fair value. As part of the Company’s impairment assessment at year end, it evaluated the strategic equity method investment made in 2014 (described below).
Equity Method Investment
During the second quarter of 2014, Synageva made a strategic investment in a privately-held biotechnology company focused on the development of targeted treatments for liver diseases. Under the terms of the agreement, Synageva made an initial $5.0 million non-refundable payment, which in part was used to fund preclinical development through proof of concept for an undisclosed initial program. The Company has the option to fund further preclinical development, and, upon achievement of certain development milestones for the initial program, the option to acquire the company for $28.5 million plus additional payments based on achievement of development, regulatory and revenue milestones.
68
Table of Contents
Synageva determined that this investment represents a variable interest in a variable interest entity (VIE). Variable interests in VIEs are investments or other interests that absorb portions of a VIEs expected losses or receive portions of the entity’s expected returns. According to the accounting guidance, a variable interest holder must evaluate whether it is the VIE’s primary beneficiary, to determine whether consolidation accounting is required. Only one entity can be the primary beneficiary. The Company evaluated the applicable criteria and determined that, while it may be in a position to benefit most significantly from the investment, it does not have the power to direct the activities that most significantly impact the economic performance of the VIE. The Company believes those powers reside with the management of the VIE. Therefore, the Company is not required to consolidate the VIE in its financial statements at this time. The consolidation assessment could change if significant changes to the relationship occur in the future, such as if the option to acquire is exercised. The Company also evaluated whether its involvement in the VIE provides it with “significant influence” over the investment, which determines whether to account for the investment under the equity or cost methods. The Company’s ownership percentage at the onset of the arrangement was approximately 12%, which is below the 20% presumed percentage of significant influence. However, because of the continued involvement in reviewing the progress of the development program, the Company determined that it does have a significant level of influence, as defined by the accounting guidance.
The initial $5.0 million investment was comprised of a $1.5 million upfront cash payment and $3.5 million cash payment for Series A-1 Preferred Stock. In addition, the Company capitalized $0.6 million of direct costs associated with the investment. Additional funding of $2.0 million was made during 2014 for additional Series A-1 Preferred Stock. The $6.1 million equity method investment was adjusted based on the Company’s pro-rata share of the investment’s net income or net loss and totaled $5.5 million after accounting for Synageva’s pro-rata share of the investments net loss throughout the year.
At year end, the Company evaluated the strategic equity method investment and determined that the asset was other-than-temporarily impaired, and that the estimated fair value of the investment was less than the carrying value of the investment. The Company determined the fair value of the asset to be $2.0 million, based on a discounted cash flows analysis of the asset. As such, the Company wrote down the asset to its fair value, resulting in incremental expense of $3.5 million for the year ended December 31, 2014. As of December 31, 2014, the equity method investment totaled $2.0 million and is included in other assets in our accompanying consolidated balance sheets. The Company has recorded approximately $3.5 million of research and development expense related to the impairment, and $0.6 million of “other expense” related to its pro rata portion of the VIEs operating losses since the investment was made. The remaining $2.0 million balance for the equity method investment represents the Company’s current maximum exposure to loss related to the asset.
Amortization of Developed Technology
The Company provides for amortization of developed technology, computed using an accelerated method based on the undiscounted cash flows received from the FUZEON royalty stream, in proportion to the estimated total undiscounted cash flows, as discussed in further in Note 5, “Goodwill and Intangible Assets, net”.
Goodwill
The difference between the purchase price and the fair value of assets acquired and liabilities assumed in a business combination is allocated to goodwill. Goodwill is not amortized; however, it is required to be tested for impairment annually. Furthermore, testing for impairment is required on an interim basis if an event or circumstance indicates that it is more likely than not an impairment loss has been incurred. An impairment loss would be recognized to the extent that the carrying amount of goodwill exceeds its implied fair value. Absent an event that indicates a specific impairment may exist, the Company has selected December 31 as the date for performing the annual goodwill impairment test.
The Company adopted ASU No. 2011-08, Intangibles-Goodwill and Other (Topic 350): Testing Goodwill for Impairment, during fiscal 2012, which allows companies to perform a simplified goodwill impairment test. Entities are no longer required to calculate the fair value of the reporting unit unless the qualitative factors indicate that it is more likely than not that a reporting unit’s fair value is less than its carrying amount. We evaluated our goodwill using the simplified approach, and our goodwill was not impaired as of December 31, 2014.
69
Table of Contents
Revenue Recognition
The Company’s business strategy may include entering into collaborative agreements with biotechnology and pharmaceutical companies. Revenue under collaborations may include the receipt of non-refundable license fees, payments based on achievement of development objectives, reimbursement of research and development costs and royalties on product sales.
The Company recognizes revenue when all of the following criteria are met: persuasive evidence of an arrangement exists, services are performed or products are delivered, the fee is fixed and determinable, and collection is reasonably assured. Determination of whether persuasive evidence exists and whether delivery has occurred or services have been rendered are based on management’s judgment regarding the fixed nature of the fee charged for deliverables and the collectability of those fees. Should changes in conditions cause management to determine these criteria are not met for future transactions, revenue recognized could be adversely affected.
Collaboration and License Revenue
The Company recognizes revenue related to collaboration and license agreements in accordance with the provisions of ASC Topics 605-25 “Revenue Recognition—Multiple Element Arrangements” (ASC Topic 605-25). The Company determines the selling price of a deliverable using the hierarchy as prescribed in ASC Topic 605-25 based on VSOE, third party evidence “TPE,” or BESP. VSOE is based on the price charged when the element sold separately and is the price actually charged for that deliverable. TPE is determined based on third party evidence for a similar deliverable when sold separately and BESP is the price which the Company would transact a sale if the elements of the collaboration and license agreements were sold on a stand-alone basis. The Company evaluates the above noted hierarchy when determining the fair value of a deliverable. The process for determining VSOE, TPE, or BESP involves significant judgment on the part of the Company and can include considerations of multiple factors such as estimated direct expenses and other costs and available data. ASC 605-25 is effective prospectively for new arrangements or upon material modification of existing arrangements.
The Company evaluates all deliverables within an arrangement to determine whether or not they provided value on a stand-alone basis. Based on this evaluation, the deliverables are separated into units of accounting. The arrangement consideration that is fixed and determinable at the inception of the arrangement is allocated to the separate units of accounting based on the estimated selling price. The Company may exercise significant judgment in determining whether a deliverable is a separate unit of accounting as well as in estimating the selling prices of such units of accounting.
Whenever the Company determines that an arrangement should be accounted for as a single unit of accounting, it must determine the period over which the performance obligations will be performed and revenue will be recognized. Revenue will be recognized using either a proportional performance or straight-line method. The Company recognizes revenue using the proportional performance method provided that the Company can reasonably estimate the level of effort required to complete its performance obligations under an arrangement and such performance obligations are provided on a best-efforts basis. Direct labor hours or full-time equivalents are typically used as the measure of performance. Revenue recognized under the relative performance method would be determined by multiplying the total payments under the contract, excluding royalties and payments contingent upon achievement of substantive milestones, by the ratio of level of effort incurred to date to estimated total level of effort required to complete the Company’s performance obligations under the arrangement. Revenue is limited to the lesser of the cumulative amount of payments received or the cumulative amount of revenue earned, as determined using the relative performance method, as of each reporting period.
Significant management judgment is required in determining the level of effort required under an arrangement and the period over which the Company is expected to complete its performance obligations under an arrangement
The Company applies the guidance pursuant to ASU No. 2010-17, Revenue Recognition—Milestone Method, for all sales-based, commercial and research and development milestones achieved. Under the milestone method, a payment that is contingent upon the achievement of a substantive milestone is recognized in its entirety in the period in which the milestone is achieved. A milestone is an event (i) that can be achieved based in whole or in part on either our performance or on the occurrence of a specific outcome resulting from our performance, (ii) for which there is substantive uncertainty at the date the arrangement is entered into that the event will be achieved and (iii) that would result in additional payments being due. The determination that a milestone is substantive is
70
Table of Contents
subject to considerable judgment and is made at the inception of the arrangement. Milestones are considered substantive when the consideration earned from the achievement of the milestone is (i) commensurate with either the Company’s performance to achieve the milestone or the enhancement of value of the item delivered as a result of a specific outcome resulting from our performance to achieve the milestone, (ii) relates solely to past performance and (iii) is reasonable relative to all deliverables and payment terms in the arrangement. The adoption of this standard in fiscal 2011 has not impacted our financial position or results of operations.
See Note 9, “License Agreements and Collaborations,” for additional information on specific arrangements. Collaboration and license revenue totaled approximately $0.5 million, $6.3 million and $7.9 million for the years ended December 31, 2014, 2013 and 2012, respectively. The Company’s collaboration with Mitsbushi Tanabe was completed in 2013.
Royalty Revenue
Royalty revenues are recognized in the period earned, based on contract terms when reported sales are reliably measurable and collectability is reasonably assured. Following the merger with Trimeris, we received royalties due to the Development and License Agreement with Roche (the “Roche License Agreement”). As part of the Roche License Agreement, Roche has an exclusive license to manufacture and sell FUZEON worldwide and the Company receives royalty payments equal to 16% of worldwide net sales of FUZEON occurring from and after January 1, 2011. Under the Roche License Agreement, Roche may deduct from its royalty payments to us 50% of any royalties paid to third parties which are reasonably required to allow Roche to sell FUZEON in a given country, including royalties paid to Novartis Vaccines and Diagnostics, Inc. (Novartis).” To calculate the royalty revenue paid to Synageva, a 5.5% distribution charge is deducted from Roche’s reported net sales, and Synageva receives a 16% royalty on the adjusted net sales amount. Revenue from royalties totaled $6.0 million, $7.0 million, and $7.0 million for the year ended December 31, 2014, 2013 and 2012, respectively. These royalties represent the royalty payment earned from Roche based on total worldwide net sales of FUZEON since the closing of the Reverse Merger in November 2011.
Reimbursement of Costs
Reimbursement of research and development costs by third party collaborators is recognized as revenue provided the Company has determined that it is acting primarily as a principal in the transaction according to the provisions outlined in the Financial Accounting Standards Board (FASB) Codification Topic 605-45, Revenue Recognition, Principal Agent Considerations, the amounts are determinable and collection of the related receivable is reasonably assured.
Deferred Revenue
Amounts received prior to satisfying the above revenue recognition criteria are recorded as deferred revenue in the accompanying consolidated balance sheets. Amounts not expected to be recognized within twelve months from the balance sheet date would be classified as long-term deferred revenue.
Research and Development
Research and development expenses primarily consist of internal personnel expense for discovery research, pre-clinical and clinical operations, manufacturing development, medical affairs and regulatory functions as well as fees for, clinical and non-clinical studies, materials and supplies, facilities, depreciation, third-party costs for contracted services, manufacturing process improvement and testing costs, and other research and development related costs. Clinical development and manufacturing costs are a significant component of our research and development expenses. We contract with third parties that perform various clinical trial activities and outsourced manufacturing activities on our behalf in the ongoing development of our product candidates. The financial terms of these contracts are subject to negotiations and may vary from contract to contract and may result in uneven payment flow. Research and development costs are expensed as incurred if no planned alternative future use exists for the technology and if the payment is not payment for future services. The Company defers and capitalizes its nonrefundable advance payments that are for research and development activities until the related goods are delivered or the related services are performed.
71
Table of Contents
Segment Reporting
The Company is managed and operated as one business, focused on the discovery, development, and commercialization of therapeutic products for patients with rare diseases for which there is a high unmet medical need. The entire business is managed by a single management team with reporting to the chief executive officer. The Company does not operate separate lines of business or separate business entities with respect to its products or product candidates. Accordingly, the Company does not prepare discrete financial information with respect to separate product areas or by location and only has one reportable segment.
Legal, Intellectual Property (IP) and Patent Costs
The Company accrues estimated liabilities for loss contingencies when it is probable that a liability has been incurred and the amount of the claim assessment or damages can be reasonably estimated. Synageva expenses legal fees, IP-related and patent costs as they are incurred.
Income Taxes
Deferred income taxes are provided for the net tax effects of temporary differences between the carrying amounts of assets and liabilities for financial reporting purposes and the amounts used for income tax purposes and operating loss carryforwards and credits. Valuation allowances are recorded to reduce the net deferred tax assets to amounts the Company believes are more-likely-than-not to be realized.
Stock-Based Compensation
The Company’s share-based compensation awards to employees, including grants of employee stock options, are valued at fair value on the date of grant, and are expensed over the requisite service period. The requisite service period is the period during which an employee is required to provide service in exchange for an award, which generally is the vesting period.
Concentration of Credit Risk and Other Risks and Uncertainties
Financial instruments that potentially subject the Company to credit risk consist principally of cash, cash equivalents and U.S. treasury securities. The Company places its cash and cash equivalents in bank deposits, money market funds, and U.S. treasury bills which are maintained at several financial institutions. Deposits in these institutions may exceed the amount of insurance provided on such deposits. Management believes it has established guidelines relative to credit quality, diversification and maturities that maintain security and liquidity.
The Company is subject to risks and uncertainties common to the biotechnology industry. Such risks and uncertainties include, but are not limited to: (a) results from current and planned clinical trials, (b) scientific data collected on the Company’s technologies currently in preclinical research and development, (c) decisions made by the FDA or other regulatory bodies with respect to the initiation of human clinical trials, (d) decisions made by the FDA or other regulatory bodies with respect to approval and commercial sale of any of the Company’s proposed products, (e) the commercial acceptance of any products approved for sale and the ability of the Company to manufacture, distribute and sell for a profit any products approved for sale, (f) the Company’s ability to obtain the necessary patents and proprietary rights to effectively protect its technologies, (g) the outcome of any collaborations or alliances entered into by the Company in the future with pharmaceutical or other biotechnology companies, (h) dependence on key personnel, (i) competition with better capitalized companies and (j) ability to raise additional funds.
Basic and Diluted Net Loss per Common Share
Basic net loss per common share has been computed by dividing net loss by the weighted average number of shares outstanding during the period. Diluted net income per share, if applicable, has been computed by dividing diluted net income by the diluted number of shares outstanding during the period. Except where the result would be antidilutive to loss from continuing operations, diluted net loss per share has been computed assuming the conversion of convertible obligations and the elimination of the related interest expense, the exercise of stock options and warrants, as well as their related income tax effects.
72
Table of Contents
The following table sets forth the computation of basic and diluted net loss per common share:
| Years Ended December 31, | ||||||||||||
| 2014 | 2013 | 2012 | ||||||||||
| Numerator: |
||||||||||||
| Net loss |
$ | (192,648 | ) | $ | (95,450 | ) | $ | (42,949 | ) | |||
| Denominator |
||||||||||||
| Weighted average common shares |
||||||||||||
| Denominator for basic calculation |
32,719 | 28,087 | 22,579 | |||||||||
| Denominator for diluted calculation |
32,719 | 28,087 | 22,579 | |||||||||
| Net loss per share: |
||||||||||||
| Basic |
$ | (5.89 | ) | $ | (3.40 | ) | $ | (1.90 | ) | |||
| Diluted |
$ | (5.89 | ) | $ | (3.40 | ) | $ | (1.90 | ) | |||
The Company’s potential dilutive stock options have been excluded from the computation of diluted net loss per share as the effect would be to reduce the net loss per share. Therefore, the weighted-average common stock outstanding used to calculate both basic and diluted net loss per share are the same. The following shares of potentially dilutive securities have been excluded from the computations of diluted weighted average shares outstanding as the effect of including such securities would be antidilutive:
| As of December 31, | ||||||||||||
| 2014 | 2013 | 2012 | ||||||||||
| Common stock equivalents |
3,286 | 2,710 | 2,529 | |||||||||
|
|
|
|
|
|
|
|||||||
Recently Issued and Proposed Accounting Pronouncements
In August 2014, the FASB issued Accounting Standards Update No. 2014-15, Disclosure of Uncertainties about an Entity’s Ability to Continue as a Going Concern (ASU 2014-15). ASU 2014-15 requires management to assess an entity’s ability to continue as a going concern, and to provide related footnote disclosures in certain circumstances. The standard is effective for public entities for annual and interim periods beginning after December 15, 2016, with early adoption permitted. We are currently evaluating the provisions of ASU 2014-15 and assessing the impact, if any, it may have on our financial position, results of operations or cash flows.
In May 2014, the FASB and the International Accounting Standards Board (IASB) jointly issued Accounting Standards Update No. 2014-09, Revenue from Contracts with Customers (ASU 2014-09), a comprehensive new revenue recognition standard that will supersede nearly all existing revenue recognition guidance. The objective of ASU 2014-09 is that a company will recognize revenue when it transfers promised goods or services to customers in an amount that reflects the consideration to which the entity expects to be entitled in exchange for those goods or services. ASU 2014-09 will be effective for the first quarter of 2017. An entity can elect to adopt ASU 2014-09 using one of two methods, either full retrospective adoption to each prior reporting period, or recognizing the cumulative effect of adoption at the date of initial application. The Company is in the process of evaluating the new standard and does not know the effect, if any, ASU 2014-09 will have on the Consolidated Financial Statements or which adoption method will be used.
Accumulated Other Comprehensive Loss
The following table summarizes the changes in accumulated other comprehensive loss, net of tax by component:
| Unrealized Loss on Available for Sale Securities |
Translation Adjustments |
Total | ||||||||||
| Balance, as of December 31, 2013 |
$ | (22 | ) | $ | (37 | ) | $ | (59 | ) | |||
| Other comprehensive loss before reclassifications |
(75 | ) | (106 | ) | (181 | ) | ||||||
|
|
|
|
|
|
|
|||||||
| Net current period other comprehensive loss |
$ | (75 | ) | $ | (106 | ) | $ | (181 | ) | |||
|
|
|
|
|
|
|
|||||||
| Balance, as of December 31, 2014 |
$ | (97 | ) | $ | (143 | ) | $ | (240 | ) | |||
73
Table of Contents
| 3. | Property and Equipment |
Property and equipment are recorded at cost and are depreciated and amortized using the straight-line method over the assets’ expected useful lives. Property and equipment held under capital leases and leasehold improvements are amortized over the shorter of the lease term or the estimated useful life of the related asset. Upon retirement or sale, the cost of the assets disposed of and the related accumulated depreciation are removed from the accounts and any resulting gain or loss is credited or charged to income. Repairs and maintenance costs are expensed as incurred.
| Asset Classification | Estimated Useful Life | |
| Computer hardware and software |
3 years | |
| Vehicles |
5 years | |
| Furniture and fixtures |
5-7 years | |
| Lab and facility equipment |
5-7 years | |
| Leasehold improvements and fixed assets under financing lease |
shorter of estimated useful life or lease term |
Occupancy Arrangements
Bogart, GA Manufacturing Facility Lease and Buildout
In October 2013, the Company entered into a lease agreement for two 35,000 square foot shell buildings on twelve acres in Bogart, Georgia. The landlord’s construction of the shell buildings was completed late in the second quarter of 2014. In conjunction with the construction, the Company built out the shell buildings to its specifications.
The landlord construction and tenant improvements were made in accordance with the Company’s plans and included substantial outfitting of the building. The scope of the improvements did not qualify as “normal tenant improvements” under the lease accounting guidance. Accordingly, for accounting purposes, the Company was deemed the owner of the buildings during the construction period. As construction progressed, the Company recorded the project construction costs incurred as an asset, along with a corresponding facility lease obligation, on the balance sheet for the total amount of project costs incurred whether funded by the Company or the landlord. At the time the Company began occupying the facilities in the third quarter of 2014, it had recorded total leasehold improvements for the Bogart facility of $14.4 million, $4.1 million of which related to landlord funded construction. The Company is amortizing the facility lease obligation using the effective interest method, and reduced the facility lease obligation by $0.2 million related to payments made in the period.
Lexington, MA Headquarters
On February 20, 2014, the Company entered into a lease amendment to expand the currently leased corporate headquarters located at 33 Hayden Avenue, Lexington, Massachusetts by 29,316 rentable square feet. The Company began occupying the expanded space in June 2014 upon the completion of landlord building modifications. The total combined leased space, including the additional space, totals 80,872 square feet. The initial term of the amendment begins upon the Company occupying the additional space, through December 2019, concurrent with the original lease.
The following summarizes our property and equipment balances as of December 31, 2014 and 2013:
| December 31, | ||||||||
| 2014 | 2013 | |||||||
| Laboratory equipment |
$ | 8,528 | $ | 6,228 | ||||
| Leasehold improvements |
28,876 | 13,923 | ||||||
| Computer, software and other |
3,449 | 2,048 | ||||||
| Construction in process |
— | 1,713 | ||||||
|
|
|
|
|
|||||
| 40,853 | 23,912 | |||||||
| Less: Accumulated depreciation |
(9,294 | ) | (6,699 | ) | ||||
|
|
|
|
|
|||||
| $ | 31,559 | $ | 17,213 | |||||
|
|
|
|
|
|||||
74
Table of Contents
Depreciation expense was $4.6 million, $3.5 million and $1.0 million for fiscal years 2014, 2013, and 2012, respectively.
| 4. | Supplemental Balance Sheet Data |
Prepaid expenses and other current assets consist of the following:
| December 31, | ||||||||
| 2014 | 2013 | |||||||
| Prepaid clinical, manufacturing, and scientific costs |
$ | 4,081 | $ | 3,960 | ||||
| Interest receivable |
1,018 | 859 | ||||||
| Prepaid insurance |
1,238 | 958 | ||||||
| Other |
3,601 | 840 | ||||||
|
|
|
|
|
|||||
| $ | 9,938 | $ | 6,617 | |||||
|
|
|
|
|
|||||
Other non-current assets consist of the following:
| December 31, | ||||||||
| 2014 | 2013 | |||||||
| Restricted cash |
$ | 2,151 | $ | 1,935 | ||||
| Equity method investment |
$ | 2,000 | — | |||||
| Other |
123 | 52 | ||||||
|
|
|
|
|
|||||
| $ | 4,274 | $ | 1,987 | |||||
|
|
|
|
|
|||||
Restricted cash relates to deposits associated with construction activities at our new Bogart, GA facility and a long-term letter of credit associated with our headquarters in Lexington, MA.
Accrued expenses consist of the following:
| December 31, | ||||||||
| 2014 | 2013 | |||||||
| Accrued compensation and benefits |
$ | 6,093 | $ | 3,244 | ||||
| Clinical, manufacturing and scientific costs |
12,140 | 6,587 | ||||||
| Professional fees |
1,131 | 568 | ||||||
| Other |
2,346 | 722 | ||||||
|
|
|
|
|
|||||
| $ | 21,710 | $ | 11,121 | |||||
|
|
|
|
|
|||||
| 5. | Goodwill and Intangible Assets, net |
In fiscal 2011, we acquired $8.5 million of goodwill in the Reverse Merger. We have not recognized any impairment charges, nor have we acquired additional goodwill in any of the periods presented. The Company performed its annual goodwill assessment as of December 31, 2014, and notes that its goodwill is not impaired as of December 31, 2014.
Intangible assets, net of accumulated amortization is as follows (in thousands):
| As of December 31, 2014 | ||||||||||||||||
| Initial Estimated Life |
Cost | Accumulated Amortization |
Net | |||||||||||||
| Developed Technology |
10 years | $ | 9,300 | $ | (7,297 | ) | $ | 2,003 | ||||||||
The developed technology asset represents the present value of the estimated future FUZEON royalty stream. Amortization expense totaled $1.5 million, $2.1 million and $3.2 million for fiscal 2014, 2013 and 2012, respectively. The developed technology asset acquired in the Reverse Merger with Trimeris is being amortized over the estimated life of the royalty stream, in proportion to the related royalty revenue. As a result, the estimated
75
Table of Contents
level of amortization expense is weighted toward the earlier years. Assuming no change to our estimates of the Roche royalty stream, the Company expects amortization expense to approximate the following:
| Fiscal Year |
Amortization (in thousands) |
|||
| 2015 |
$ | 747 | ||
| 2016 |
490 | |||
| 2017 |
318 | |||
| 2018 |
207 | |||
| 2019 and beyond |
241 | |||
| 6. | Share Based Payments |
The 2014 Equity Incentive Plan (2014 Plan) was approved by the Company’s stockholders at the Company’s annual meeting, held June 4, 2014. The 2014 Plan replaced the Company’s 2005 Stock Plan as the equity compensation plan from which the Company may make equity based awards to employees, directors and consultants. The 2014 Plan provides for the issuance of up to 2.5 million shares of the Company’s common stock, plus up to 1.0 million of additional shares if awards under the 2005 Stock Plan are cancelled or expire. Shares subject to outstanding awards under the 2005 Stock Plan and 2014 Plan totaled 1.8 million and 1.3 million, respectively, as of December 31, 2014. At December 31, 2014, there were 1.4 million shares remaining available for grant under the 2014 Plan.
The Company uses the Black-Scholes option pricing model to measure the fair value of its option awards. The fair value of each stock option grant was estimated on the date of grant using the Black-Scholes option-pricing model. The expected life assumption is based on the limited exercise historical experience at the Company, management’s expectations based on the length of time that an employee will stay at the Company, the vesting period of four years and the contractual term of ten years. The Company estimates volatility using a blended approach encompassing: (i) historical experience and peer group (including industry, size, life cycle and financial leverage), and (ii) implied volatility from publicly traded options with the longest available contractual terms. The risk-free interest rate is based on the U.S. Treasury zero coupon rate with a remaining term approximating the expected term used as the input to the Black-Scholes option pricing model.
The weighted average assumptions used in the option pricing model for stock option grants were as follows:
| Year Ended December 31, |
||||||||||||
| 2014 | 2013 | 2012 | ||||||||||
| Expected dividend yield |
None | None | None | |||||||||
| Weighted average volatility in stock price |
66 | % | 58 | % | 50 | % | ||||||
| Weighted average risk-free interest rate |
1.91 | % | 1.39 | % | 0.88 | % | ||||||
| Expected life of stock awards-years |
6 years | 6 years | 6 years | |||||||||
The Company also maintains an Employee Stock Purchase Plan (the ESPP), which allows eligible employees to use payroll deductions to purchase shares of the Company’s common stock at a discount of 15% to the lesser of the fair market value of the Company’s stock on (i) the date on which an employee elects to participate in the ESPP and (ii) the closing price on the last day of the ESPP option period. The plan is considered a compensatory employee stock purchase plan, results in incremental stock-based compensation expense in future periods. Option periods under the ESPP run from January 1 to June 30 and July 1 to December 31 of each year.
The assumptions used to estimate the per share fair value of stock purchase rights granted under the ESPP were as follows:
| Year Ended December 31, | ||||
| 2014 | 2013 | |||
| Expected volatility |
43.4-59.0% | 38.5-49.6% | ||
| Dividend yield |
0.0% | 0.0% | ||
| Expected life |
6 months | 6 months | ||
| Risk-free interest rate |
0.07-.10% | 0.09-.12% | ||
76
Table of Contents
A summary of stock option and restricted stock unit activity under all equity plans for the years ended December 31, 2014, 2013 and 2012 is a follows:
| Stock Options | Restricted Stock Units | |||||||||||||||
| Shares | Weighted Average Exercise Price |
Shares | Weighted Average Grant Date Fair Value |
|||||||||||||
| Outstanding at December 31, 2011 |
2,371 | $ | 15.34 | — | $ | — | ||||||||||
|
|
|
|
|
|||||||||||||
| Granted |
820 | 43.90 | — | — | ||||||||||||
| Exercised |
(519 | ) | 2.62 | — | — | |||||||||||
| Canceled or expired |
(143 | ) | 53.83 | — | — | |||||||||||
|
|
|
|
|
|||||||||||||
| Outstanding at December 31, 2012 |
2,529 | $ | 25.06 | — | $ | — | ||||||||||
| Granted |
1,119 | 45.31 | — | — | ||||||||||||
| Exercised |
(660 | ) | 7.52 | — | — | |||||||||||
| Canceled or expired |
(278 | ) | 60.80 | — | — | |||||||||||
|
|
|
|
|
|||||||||||||
| Outstanding at December 31, 2013 |
2,710 | $ | 34.05 | — | $ | — | ||||||||||
| Granted |
1,397 | 80.78 | 30 | 63.11 | ||||||||||||
| Exercised |
(592 | ) | 23.91 | — | — | |||||||||||
| Canceled or expired |
(259 | ) | 63.30 | — | — | |||||||||||
|
|
|
|
|
|||||||||||||
| Outstanding at December 31, 2014 |
3,256 | $ | 53.62 | 30 | $ | 63.11 | ||||||||||
|
|
|
|
|
|||||||||||||
| Exercisable at December 31, 2014 |
1,150 | $ | 34.15 | — | — | |||||||||||
| Exercisable and expected to vest at December 31, 2014 |
2,940 | $ | 52.48 | 30 | $ | 63.11 | ||||||||||
The weighted average grant date fair value of options granted in 2014, 2013 and 2012 was $48.52, $23.41 and $20.38, respectively. The total intrinsic value of stock options exercised during the years ended December 31, 2014, 2013 and 2012 was $37.4 million, $28.3 million and $21.2 million, respectively.
Stock options outstanding and currently exercisable at December 31, 2014, under all equity plans, are as follows:
| Options Outstanding | Options Exercisable | |||||||||||||||||||
| Range of Exercise Prices |
Number Outstanding |
Weighted Average Remaining Contractual Life (yrs) |
Weighted Average Exercise Price |
Number Exercisable |
Weighted Average Exercise Price |
|||||||||||||||
| $0.61-$0.95 |
72 | 4.4 | $ | 0.94 | 72 | $ | 0.94 | |||||||||||||
| $1.10-$1.70 |
103 | 6.4 | 1.70 | 68 | 1.70 | |||||||||||||||
| $3.52-$8.73 |
28 | 6.7 | 8.71 | 10 | 8.67 | |||||||||||||||
| $10.10-$20.60 |
33 | 4.7 | 13.66 | 33 | 13.67 | |||||||||||||||
| $23.00-$45.50 |
1,390 | 7.6 | 36.37 | 785 | 35.05 | |||||||||||||||
| $45.51-$69.50 |
527 | 8.2 | 59.11 | 155 | 56.60 | |||||||||||||||
| $69.51-$94.79 |
891 | 9.4 | 80.35 | 26 | 80.35 | |||||||||||||||
| $94.80-$194.00 |
212 | 9.6 | 96.06 | 1 | 97.93 | |||||||||||||||
|
|
|
|
|
|||||||||||||||||
| 3,256 | 8.2 | $ | 53.62 | 1,150 | $ | 34.15 | ||||||||||||||
|
|
|
|
|
|||||||||||||||||
As of December 31, 2014, the unamortized compensation expense related to outstanding unvested options approximated $70.0 million and is expected to be recognized over a weighted average period of 2.7 years. The unamortized compensation expense related to outstanding unvested restricted stock units (RSUs) approximated $1.8 million and is expected to be recognized over a weighted average period of 3.7 years.
The aggregate intrinsic value of options and RSUs outstanding and options exercisable at December 31, 2014 is approximately $130.9 million and $67.3 million, respectively, which represents the total intrinsic value (the excess of the fair value of the Company’s stock on December 31, 2014 over the exercise price, multiplied by the number of in-the-money awards) that would have been received by the award holders had all award holders exercised their awards on December 31, 2014.
77
Table of Contents
The Company recognized stock-based compensation expense on all stock option awards as follows:
| Year Ended December 31, | ||||||||||||
| 2014 | 2013 | 2012 | ||||||||||
| Research and development |
$ | 8,694 | $ | 3,586 | $ | 1,432 | ||||||
| Selling, general and administrative |
11,636 | 5,601 | 3,539 | |||||||||
|
|
|
|
|
|
|
|||||||
| $ | 20,330 | $ | 9,187 | $ | 4,971 | |||||||
|
|
|
|
|
|
|
|||||||
| 7. | Defined Contribution Plan |
The Company has a defined contribution plan that is intended to qualify under Section 401(k) of the Internal Revenue Code of 1986, as amended (the “Code”). All employees, except part-time employees, are eligible to participate in the plan. Participants may contribute through payroll deductions, amounts not to exceed Internal Revenue Code limitations. During the years ended December 31, 2014, 2013 and 2012, the Company recognized expense for 401(k) matching contributions of $1.1 million, $0.5 million and $0.2 million, respectively.
| 8. | Income Taxes |
For financial reporting purposes, loss before income taxes includes the following components for the year ended December 31:
| Year Ended December 31, | ||||||||||||
| 2014 | 2013 | 2012 | ||||||||||
| U.S. pretax loss |
$ | (37,256 | ) | $ | (95,588 | ) | $ | (43,032 | ) | |||
| Non-U.S. pretax (loss) income |
(154,852 | ) | 186 | 83 | ||||||||
|
|
|
|
|
|
|
|||||||
| Loss before provision for income taxes |
$ | (192,108 | ) | $ | (95,402 | ) | $ | (42,949 | ) | |||
The components of the income tax provision are as follows:
| Year Ended December 31, | ||||||||||||
| 2014 | 2013 | 2012 | ||||||||||
| Domestic |
||||||||||||
| Current |
$ | 332 | $ | — | $ | — | ||||||
| Deferred |
— | — | — | |||||||||
|
|
|
|
|
|
|
|||||||
| 332 | — | — | ||||||||||
| Foreign |
||||||||||||
| Current |
208 | 48 | — | |||||||||
| Deferred |
— | — | — | |||||||||
|
|
|
|
|
|
|
|||||||
| 208 | 48 | — | ||||||||||
| Total |
||||||||||||
| Current |
540 | 48 | $ | — | ||||||||
| Deferred |
— | — | — | |||||||||
|
|
|
|
|
|
|
|||||||
| $ | 540 | $ | 48 | $ | — | |||||||
78
Table of Contents
The Company’s effective tax rate differs from that based on the federal statutory rate due to the following:
| Years Ended December 31, | ||||||||||||
| 2014 | 2013 | 2012 | ||||||||||
| Federal tax at statutory rate |
(34.0 | )% | (34.0 | )% | (34.0 | )% | ||||||
| State income taxes |
0.3 | (3.8 | ) | (2.7 | ) | |||||||
| State rate changes |
— | 0.2 | 5.0 | |||||||||
| Federal and state credits |
(18.2 | ) | (22.2 | ) | (36.7 | ) | ||||||
| Foreign rate differential |
20.7 | — | — | |||||||||
| Nondeductible 162(m) compensation |
0.1 | 2.9 | — | |||||||||
| Expiration of state NOLs |
— | — | 25.9 | |||||||||
| Stock-based compensation |
0.7 | 0.6 | 0.8 | |||||||||
| Valuation allowance |
29.5 | 55.7 | 41.6 | |||||||||
| Other |
1.2 | 0.7 | 0.1 | |||||||||
|
|
|
|
|
|
|
|||||||
| Provision for income taxes |
0.3 | % | 0.1 | % | — | |||||||
|
|
|
|
|
|
|
|||||||
Significant components of the Company’s net deferred tax asset as December 31, 2014 and 2013 are as follows:
| 2014 | 2013 | |||||||
| Deferred tax assets: |
||||||||
| Net operating losses |
$ | 43,740 | $ | 42,962 | ||||
| Capitalized research and development |
20,838 | 23,822 | ||||||
| Tax credit carryforwards |
108,590 | 57,155 | ||||||
| Deferred revenue |
— | 87 | ||||||
| Accrued expenses |
586 | 210 | ||||||
| Depreciation and amortization |
2,660 | 1,787 | ||||||
| Stock-based compensation |
7,602 | 3,411 | ||||||
| Other |
1,967 | 11 | ||||||
|
|
|
|
|
|||||
| 185,983 | 129,445 | |||||||
| Deferred tax liabilities: |
||||||||
| Acquired intangibles |
(742 | ) | (655 | ) | ||||
|
|
|
|
|
|||||
| Valuation allowance |
(185,241 | ) | (128,790 | ) | ||||
|
|
|
|
|
|||||
| Net deferred tax asset |
$ | — | $ | — | ||||
|
|
|
|
|
|||||
At December 31, 2014, the Company had federal and state net operating loss carry forwards of $131.8 million and $108.9 million, respectively, which expire at various times through 2034. The Company has federal orphan drug credits and federal and state research tax credit carryforwards of $110.3 million, available to reduce future tax liabilities. The federal orphan drug credits and federal and state research tax credits expire at various times through 2034. Approximately $52.9 million of the federal and state net operating loss carryforwards relate to deductions from stock option compensation, which are tracked separately and not included in the Company’s deferred tax asset in accordance with ASC 718. The future benefit from these deductions will be recorded as a credit to additional paid in capital to the extent they reduce taxes payable.
Utilization of the net operating loss (NOL) and research and development (R&D) credit carry forwards may be subject to a substantial annual limitation under Section 382 of the Code due to ownership change limitations that have occurred previously or that could occur in the future. These ownership changes may limit the amount of NOL and R&D credit carry forwards that can be utilized annually to offset future taxable income and tax, respectively. As part of the Reverse Merger, the Company acquired federal tax attributes that are significantly limited under Section 382 of the Code. There also could be additional ownership changes in the future which may result in additional limitations on the utilization of NOL carryforwards and credits.
79
Table of Contents
Management has evaluated the positive and negative evidence bearing upon the realizability of its deferred tax assets, and has determined that it is more-likely-than-not that the Company will not recognize the benefits of its deferred tax asset. Accordingly, a valuation allowance of $185.2 million and $128.8 million has been established at December 31, 2014 and 2013, respectively. The increase in the valuation allowance is due to the increase in the deferred tax assets described above. The Company did not release any portion of its valuation allowance in 2014.
The Company files tax returns as prescribed by the tax laws of the jurisdictions in which it operates. In the normal course of business the Company is subject to examination by federal and state jurisdictions, where applicable. There are currently no pending tax examinations.
Below is a table of the earliest tax years that remain subject to examination by jurisdictions:
| Earliest Tax Year Subject to Examination |
||||
| Jurisdiction |
||||
| U.S Federal |
2011 | |||
| State of Georgia |
2011 | |||
| State of Florida |
2012 | |||
| State of California |
2012 | |||
| State of Texas |
2012 | |||
| Commonwealth of Massachusetts |
2011 | |||
All years including and subsequent to the above years remain open to examination by the taxing authorities. Also, tax attributes carrying forward from years prior to 2011 are subject to adjustment by the Internal Revenue Service if they have been or will be used in a future period. The resolution of any tax matters is not expected to have a material effect on the Company’s financial statements. The Company’s policy is to record interest and penalties related to income taxes as part of the tax provision. There were no uncertain tax positions in 2014 and 2013.
Unrecognized Deferred Tax Liability Related to Investments in Foreign Subsidiaries
U.S. income and foreign withholding taxes have not been recognized on the excess of the amount for financial reporting over the tax basis of investments in foreign subsidiaries that is indefinitely reinvested outside the United States. This amount becomes taxable upon a repatriation of assets from the subsidiary or a sale or liquidation of the subsidiary. The amount of such temporary differences were immaterial as of December 31, 2014. In general, it is the practice and intention of the Company to reinvest the earnings of its non-U.S. subsidiaries in those operations.
Uncertain Tax Positions
Under the authoritative guidance on accounting for and disclosure of uncertainty in tax positions, the Company is required to determine whether a tax position of the Company is more likely than not to be sustained upon examination, including resolution of any related appeals of litigation processes, based on the technical merits of the position. The Company has not recorded any amounts for unrecognized tax benefits as of December 31, 2014 and 2013.
Massachusetts Life Sciences Center
In 2013, the Company received a grant totaling $0.7 million from the Massachusetts Life Sciences Center (MLSC) based on projected hiring in the state of Massachusetts in 2013. The Company recognizes the grant ratably to other income over the five year commitment period, once it is probable that the hiring commitment has been met for the applicable year. The Company recognized $0.1 million in 2014, related to the award.
In 2014, the Company received a grant totaling $0.9 million from the MLSC based on projected hiring in the state of Massachusetts in 2014. The Company recognizes the grant ratably to other income over the five year commitment period, once it is probable that the hiring commitment has been met for the applicable year. The Company recognized $0.2 million in 2014, related to the award.
80
Table of Contents
| 9. | License Agreements and Collaborations |
Collaborations
In August 2011, the Company entered into a collaboration agreement with Mitsubishi Tanabe Pharma Corporation (Mitsubishi Tanabe) whereby the Company utilizes its proprietary expression technology for the development of a certain targeted compound. The agreement included an upfront development payment to the Company of $3.0 million and on-going reimbursement or funding of development costs, estimated during the initial development period to be approximately $1.5 million.
In March 2012, the Company entered into a second agreement with Mitsubishi Tanabe to develop a second protein therapeutic. The agreement included an upfront license payment to the Company of $9.0 million and on-going reimbursement or funding of development costs, estimated during the initial development period to be approximately $0.8 million.
The Company evaluated the collaboration agreements in order to determine whether the deliverables at the inception of the agreements: (i) the upfront license payments, (ii) the research services during the development periods, and (iii) the JSC’s participation should be accounted for as a single unit or multiple units of accounting. The Company concluded that the upfront license payments do not have standalone value to Mitsubishi Tanabe because (i) Mitsubishi Tanabe does not have the ability to transfer or sublicense and (ii) the activities to be conducted during the development period are highly dependent on the Company’s unique knowledge and understanding of its proprietary technology which is critical to optimizing the compounds. The Company determined that the JSC is a deliverable through the development period. In both agreements, the Company concluded that there are two units of accounting which are being delivered over the same performance period. Under both agreements, we recognized revenue using the proportional performance method, which resulted in both upfront payments and reimbursed research and development payments being recognized over the development term which is our performance period. We measure our proportional performance based on the development hours incurred to date compared to the estimated total development hours.
Revenue recognized under the first and second Mitsubishi Tanabe development programs totaled $2.0 million and $4.1 million for the year ended December 31, 2013, respectively. Revenue was recognized using the proportional performance method. As of December 31, 2013, the Company had completed its obligations under the arrangements and had recognized all remaining deferred revenue balances associated with the programs.
Roche Collaboration
The Roche License Agreement
On May 25, 2011, Trimeris entered into the Roche License Agreement with Roche, pursuant to which Roche has an exclusive license to manufacture and sell FUZEON worldwide and the Company receives royalty payments equal to 16% of worldwide net sales of FUZEON occurring from and after January 1, 2011. The Roche License Agreement superseded and replaced the Prior Roche Agreements. Under the Roche License Agreement, Roche may deduct from its royalty payments to us 50% of any royalties paid to third parties which are reasonably required to allow Roche to sell FUZEON in a given country, including royalties paid to Novartis Vaccines and Diagnostics, Inc. (Novartis).” To calculate the royalty revenue paid to Synageva, a 5.5% distribution charge is deducted from Roche’s reported net sales, and Synageva receives a 16% royalty on the adjusted net sales amount. We recognized royalty revenue of $6.0 million, $7.0 million and $7.0 million for the years ended December 31, 2014, 2013 and 2012, respectively.
Roche may terminate the Roche License Agreement as a whole or for a particular country or countries in its sole discretion with advance notice. The Roche License Agreement will effectively terminate upon expiration of the last relevant patent covering FUZEON, which is expected to occur in 2021.
FUZEON is manufactured and distributed by Roche through Roche’s sales and distribution network throughout the world in countries where regulatory approval has been received. Roche has control over all aspects of the commercialization of FUZEON, including, but not limited to, pricing, sales force activities and promotional activities.
81
Table of Contents
| 10. | Commitments and Contingencies |
Occupancy Arrangements
The Company leases office, laboratory and manufacturing and research facility space under operating and capital lease agreements expiring through 2024. Certain of the leases provide for options by the Company to extend the lease for multiple periods and also provide for annual minimum increases in rent, usually based on a consumer price index or annual minimum increases.
The following is a schedule by years of future minimum rental payments required under lease agreements that have initial or remaining non-cancelable lease terms in excess of one year as of December 31, 2014:
| Year Ending December 31, |
Operating Leases |
Capital Leases |
||||||
| 2015 |
$ | 2,160 | $ | 439 | ||||
| 2016 |
2,222 | 448 | ||||||
| 2017 |
2,187 | 457 | ||||||
| 2018 |
2,187 | 466 | ||||||
| 2019 |
2,190 | 475 | ||||||
| 2020 and beyond |
49 | 2,213 | ||||||
|
|
|
|
|
|||||
| Total minimum lease payments |
$ | 10,995 | $ | 4,498 | ||||
|
|
|
|||||||
| Less amount representing interest |
(619 | ) | ||||||
|
|
|
|||||||
| Present value of obligations under capital leases (1) |
$ | 3,879 | ||||||
|
|
|
|||||||
| (1) | The Company’s capital lease obligation relates to the construction of a manufacturing facility in Bogart, GA. Upon the completion of the landlord construction in 2014, the Company had recorded leasehold improvements and a facility lease obligation totaling $4.1 million. The current portion of capital lease obligation was $0.4 million as of December 31, 2014. |
Rental expense for the years ended December 31, 2014, 2013 and 2012 approximated $2.1 million, $1.6 million and $1.0 million, respectively.
UGARF License Agreement
On April 5, 2007, the Company amended and restated its technology license agreement with the University of Georgia Research Foundation (UGARF). In consideration for exclusive worldwide rights to the same patents, know-how and related technology under the original agreement, the Company provided nine thousand shares of its common stock to UGARF in addition to sublicense royalties, if applicable, and product royalties to be payable upon future commercialization and sale of any products subject to the license. On December 3, 2013, Synageva amended and restated license agreement with UGARF again to restate and clarify certain provisions, rights and obligations under the original amended and restated license agreement. No payments have been made to UGARF in fiscal 2014, 2013 and 2012.
Shire Human Genetics Therapies
In 2013, we entered into a settlement agreement with Shire Human Genetics Therapies, Inc. and its affiliates (Shire) and Cincinnati Children’s Hospital Research Foundation, an operating division of Children’s Hospital Medical Center, and their respective affiliates under which the parties settled the outstanding Kanuma patent-related issues between them, including the revocation actions in the United Kingdom and France and the outstanding opposition in the European Patent Office. Simultaneously with the execution of the settlement agreement, we entered into a sublicense agreement with Shire under which we received exclusive, worldwide rights to multiple patents and patent applications owned by Cincinnati Children’s Hospital Research Foundation and its affiliates. In exchange for the settlement and the rights acquired from Shire, we paid an upfront payment of $2.5 million, and will be obligated to make two sales-based milestones (each a low single-digit million dollar payment), and low, single-digit percentage tiered royalty payments on sales of Kanuma in the U.S. and certain countries in Europe. We recognized the $2.5 million upfront license payment as in-process research and development expense in the second quarter of fiscal 2013.
82
Table of Contents
Other Licensing Agreements
The Company has licensing and sponsored research agreements with certain scientific and research institutions. The Company incurred expenses under these agreements of less than $0.1 million for the years ended December 31, 2014, 2013 and 2012. At December 31, 2014, the Company had approximately $0.1 million of potential milestone payments or other commitments payable over the next four years under agreements that are cancelable by either party under certain circumstances. These agreements also specify the payment of certain percentage royalties based on net sales of developed technologies.
| 11. | Quarterly Financial Data (Unaudited) |
The following tables present quarterly consolidated statement of operations data for fiscal 2014 and 2013. The below data is unaudited but, in our opinion, reflects all adjustments necessary for a fair presentation of this data in accordance with GAAP.
| Three Months Ended | ||||||||||||||||
| March 31, 2014 |
June 30, 2014 |
September 30, 2014 |
December 31, 2014 |
|||||||||||||
| (unaudited) | ||||||||||||||||
| Revenue |
$ | 1,586 | $ | 2,343 | $ | 1,326 | $ | 1,237 | ||||||||
| Loss from operations |
(36,476 | ) | (50,313 | ) | (48,038 | ) | (57,306 | ) | ||||||||
| Net loss |
(36,424 | ) | (50,240 | ) | (48,319 | ) | (57,665 | ) | ||||||||
| Loss per share, basic and diluted |
$ | (1.16 | ) | $ | (1.52 | ) | $ | (1.46 | ) | $ | (1.73 | ) | ||||
| Weighted average shares outstanding, basic and diluted |
31,338 | 33,057 | 33,173 | 33,260 | ||||||||||||
| Three Months Ended | ||||||||||||||||
| March 31, 2013 |
June 30, 2013 |
September 30, 2013 |
December 31, 2013 |
|||||||||||||
| (unaudited) | ||||||||||||||||
| Revenue |
$ | 5,118 | $ | 3,413 | $ | 1,369 | $ | 3,474 | ||||||||
| Loss from operations |
(14,573 | ) | (22,190 | ) | (28,196 | ) | (30,944 | ) | ||||||||
| Net loss |
(14,484 | ) | (22,107 | ) | (28,123 | ) | (30,736 | ) | ||||||||
| Loss per share, basic and diluted |
$ | (0.54 | ) | $ | (0.81 | ) | $ | (1.02 | ) | $ | (1.00 | ) | ||||
| Weighted average shares outstanding, basic and diluted |
26,826 | 27,280 | 27,491 | 30,751 | ||||||||||||
| 12. | Subsequent Events |
Underwritten Public Offering
On January 6, 2015, we announced the pricing of a $325.0 million underwritten public offering of approximately 3.5 million shares of common stock at a price of $94.19. The Company received net proceeds of approximately $308.7 million from this offering.
83
Table of Contents
EXHIBIT LIST
| Exhibit Number |
Description | |||
| 3.1 | Fifth Amended and Restated Certificate of Incorporation of the Registrant, as amended, incorporated by reference to the Company’s Quarterly Report on Form 10-Q for the quarter ended September 30, 2005 filed with the SEC on November 8, 2005, as amended by the Company’s Current Report on Form 8-K filed with the SEC on November 3, 2011. | |||
| 3.2 | Second Amended and Restated Bylaws of the Registrant, incorporated by reference to the Company’s Quarterly Report on Form 10-Q for the quarter ended September 30, 2005 filed with the SEC on November 8, 2005. | |||
| 4.1 | Specimen certificate for shares of Common Stock, incorporated by reference to the Company Registration Statement on Form S-3 (File No. 333-178653) initially filed with the SEC on December 21, 2011. | |||
| 4.2 | Description of Capital Stock (contained in the Fifth Amended and Restated Certificate of Incorporation of Synageva BioPharma Corp., filed as Exhibit 3.1), incorporated by reference to the Company’s Quarterly Report on Form 10-Q for the quarter ended September 30, 2005 filed with the SEC on November 8, 2005, as amended by the Company’s Current Report on Form 8-K filed with the SEC on November 3, 2011. | |||
| 10.1 | Form of Indemnification Agreement between Synageva BioPharma Corp. and its directors, incorporated by reference to the Company’s Quarterly Report on Form 10-Q filed with the SEC on November 14, 2011. | |||
| 10.2 | Form of Indemnification Agreement between Synageva BioPharma Corp. and its officers, incorporated by reference to the Company’s Quarterly Report on Form 10-Q filed with the SEC on November 14, 2011. | |||
| 10.3 | Amended and Restated Registration Rights Agreement dated April 1, 2009, between the Company and the investors signatory to the agreement, as amended through January 4, 2012, incorporated by reference to the Company’s Current Report on Form 8-K filed with the SEC on January 4, 2012. | |||
| 10.4 | Amendment, dated May 1, 2014 to Amended and Restated Information and Registration Rights Agreement, dated April 1, 2009, between the Company and the investors who are signatories to the agreement, incorporated by reference to the Company’s Quarterly Report on Form 10-Q filed with the SEC on May 1, 2014. | |||
| 10.5 | Registration Rights Agreements, dated May 1, 2014, between the Company and the investors who are signatories to the agreement, incorporated by reference to the Company’s Quarterly Report on Form 10-Q filed with the SEC on May 1, 2014. | |||
| 10.6 | Non-Exclusive Sub-License Agreement, between Abbey BioPharma Corp. (a wholly owned subsidiary of Synageva BioPharma Corp.) (f/k/a AviGenics, Inc.) and Pangenix, dated April 1, 2003, incorporated by reference to the Company’s Quarterly Report on Form 10-Q filed with the SEC on November 14, 2011.† | |||
| 10.7 | Exclusive Sublicense Agreement, between Shire AG and Synageva BioPharma Corp., dated April 5, 2013, incorporated by reference to the Company’s Quarterly Report on Form 10-Q filed with the SEC on May 7, 2013.† | |||
| 10.8 | Second Amended and Restated License Agreement between Synageva BioPharma Corp. and the University of Georgia Research Foundation, Inc., effective as of December 3, 2013, incorporated by reference to the Company’s Annual Report on Form 10-K filed with the SEC on March 3, 2014.† | |||
| 10.9 | License Agreement between The Regents of the University of California and Hoffman-La Roche Inc. and Trimeris, Inc. for Method for Preventing and Treating a Viral Condition by Inhibiting Membrane Fusion, dated June 27, 2005, incorporated by reference to the Company’s Current Report on Form 8-K filed with the SEC on June 27, 2005.† | |||
| 10.10 | Exclusive Patent License Agreement, between Abbey BioPharma Corp. (a wholly owned subsidiary of Synageva BioPharma Corp.) (f/k/a Synageva BioPharma Corp.) and the University of Minnesota, dated May 13, 2009, incorporated by reference to the Company’s Quarterly Report on Form 10-Q filed with the SEC on November 14, 2011.† | |||
84
Table of Contents
| Exhibit Number |
Description | |||
| 10.11 | Amended and Restated Agreement among Trimeris, Inc., F. Hoffmann-La Roche Ltd and Hoffmann-La Roche Inc., dated May 25, 2011, incorporated by reference to the Company’s Current Report on Form 8-K filed with the SEC on May 25, 2011. | |||
| 10.12 | Trimeris, Inc. Amended and Restated Stock Incentive Plan, incorporated by reference to the Company’s Quarterly Report on Form 10-Q for the quarter ended September 30, 2006 filed with the SEC on November 13, 2006.* | |||
| 10.14 | Synageva BioPharma Corp. 2005 Stock Plan, as amended, incorporated by reference to the Company’s Registration Statement on Form S-8 filed with the SEC on June 26, 2013.* | |||
| 10.15 | Synageva BioPharma Corp. 2005 Stock Plan-form of Option Agreement, incorporated by reference to the Company’s Annual Report on Form 10-K filed with the SEC on March 22, 2013.* | |||
| 10.16 | Trimeris, Inc. 2007 Stock Incentive Plan, incorporated by reference to the Company’s Definitive Proxy Statement on Schedule 14A filed with the SEC on March 16, 2010.* | |||
| 10.17 | Trimeris, Inc. 2007 Stock Incentive Plan—form of Option Agreement, incorporated by reference to the Company’s Annual Report on Form 10-K, filed with the SEC on March 17, 2008.* | |||
| 10.18 | Synageva BioPharma Corp. 2014 Equity Incentive Plan, incorporated by reference to the Company’s Current Report on Form 8-K filed with the SEC on June 9, 2014. | |||
| 10.19 | Synageva BioPharma Corp. 2014 Equity Incentive Plan—form of Option Agreement, filed herewith. | |||
| 10.20 | Synageva BioPharma Corp. Employee Stock Purchase Plan, as amended, incorporated by reference to the Company’s Registration Statement on Form S-8 filed with the SEC on December 7, 2012.* | |||
| 10.21 | Employment Agreement between Synageva BioPharma Corp. and Sanj K. Patel, effective as of November 2, 2011, incorporated by reference to the Company’s Current Report on Form 8-K filed with the SEC on November 10, 2011.* | |||
| 10.22 | Employment Agreement between Synageva BioPharma Corp. and Carsten Boess, effective as of November 2, 2011, incorporated by reference to the Company’s Current Report on Form 8-K filed with the SEC on November 10, 2011.* | |||
| 10.23 | Employment Agreement between Synageva BioPharma Corp. and Anthony Quinn, effective as of November 2, 2011, incorporated by reference to the Company’s Current Report on Form 8-K filed with the SEC on November 10, 2011.* | |||
| 10.24 | Employment Agreement between Synageva BioPharma Corp. and Glen Williams, effective as of September 24, 2012; incorporated by reference to the Company’s Annual Report on Form 10-K Filed with the SEC on March 14, 2013. | |||
| 10.25 | Employment Agreement between Synageva BioPharma Corp. and Mark Goldberg, effective as of November 2, 2011, incorporated by reference to the Company’s Current Report on Form 8-K filed with the SEC on November 10, 2011.* | |||
| 10.26 | Employment Agreement, effective as of September 22, 2014, between Synageva BioPharma Corp. and Robert Bazemore, incorporated by reference to the Company’s Current Report on Form 8-K filed with the SEC on September 22, 2014. | |||
| 10.27 | Lease, between Abbey BioPharma Corp. (f/k/a Synageva BioPharma Corp.) and One Ledgemont LLC, dated April 8, 2010, incorporated by reference to the Company’s Quarterly Report on Form 10-Q filed with the SEC on November 14, 2011. | |||
| 10.28 | Lease Agreement between Synageva BioPharma Corp. and Barrett Investment Properties, LLC, dated January 23, 2012, incorporated by reference to the Company’s Annual Report on Form 10-K filed with the SEC on March 22, 2012. | |||
85
Table of Contents
| Exhibit Number |
Description | |||
| 10.29 | Lease, between Synageva BioPharma Corp. and the Trustees of Hayden Office Trust, dated January 15, 2013, incorporated by reference to the Company’s Quarterly Report on Form 10-Q filed with the SEC on May 7, 2013.† | |||
| 10.30 | First Amendment to Lease, by and between Synageva BioPharma Corp. and the Trustees of Hayden Office Trust, dated January 15, 2013, incorporated by reference to the Company’s Quarterly Report on Form 10-Q filed with the SEC on May 1, 2014. | |||
| 10.31 | Agreement to Lease, between Synageva BioPharma Corp. and Jarrell Realty, LLC, dated August 30, 2012, incorporated by reference to the Company’s Annual Report on Form 10-K filed with the SEC on March 3, 2014. † | |||
| 10.32 | Lease, between Synageva BioPharma Corp. and RP Gateway, LLC, dated October 22, 2013, incorporated by reference to the Company’s Annual Report on Form 10-K filed with the SEC on March 3, 2014. † | |||
| 10.33 | Biopharmaceutical Services Agreement between Synageva BioPharma Corp. and Cytovance Biologics, Inc., effective February 28, 2012, incorporated by reference to the Company’s Quarterly Report on Form 10-Q filed with the SEC on May 9, 2012. † | |||
| 10.34 | Amendment to the Biopharmaceutical Services Agreement between Synageva BioPharma Corp. and Cytovance Biologics, Inc., effective April 27, 2012, incorporated by reference to the Company’s Quarterly Report on Form 10-Q filed with the SEC on May 9, 2012. | |||
| 10.35 | Bioprocessing Services Agreement, between Synageva BioPharma Corp. and FUJIFILM Diosynth Biotechnologies U.S.A. Inc., dated January 22, 2013, incorporated by reference to the Company’s Quarterly Report on Form 10-Q filed with the SEC on May 7, 2013.† | |||
| 21.1 | Subsidiaries of the Registrant. | |||
| 23.1 | Consent of PricewaterhouseCoopers LLP, an independent registered public accounting firm. | |||
| 31.1 | Rule 13a-14(a) Certification by Sanj K. Patel as Chief Executive Officer. | |||
| 31.2 | Rule 13a-14(a) Certification by Carsten Boess as Chief Financial Officer. | |||
| 32.1 | Section 1350 Certification by Sanj K. Patel as Chief Executive Officer and Carsten Boess as Chief Financial Officer. | |||
| 101.INS | XBRL Instance Document. | |||
| 101.SCH | XBRL Taxonomy Extension Schema Document. | |||
| 101.CAL | XBRL Taxonomy Calculation Linkbase Document. | |||
| 101.DEF | XBRL Taxonomy Extension Definition Linkbase Document. | |||
| 101.LAB | XBRL Taxonomy Label Linkbase Document. | |||
| 101.PRE | XBRL Taxonomy Presentation Linkbase Document. | |||
| * | Management contract or compensatory plan or arrangement required to be filed as an exhibit to this form pursuant to Item 15(a) of this report. |
| † | Confidential treatment has been granted by the Securities and Exchange Commission for portions of this exhibit. |
86