Attached files
| file | filename |
|---|---|
| 8-K - 8-K - LTC PROPERTIES INC | a15-5432_18k.htm |
| EX-99.1 - EX-99.1 - LTC PROPERTIES INC | a15-5432_1ex99d1.htm |
Exhibit 99.2
|
|
Supplemental Operating and Financial Data December 31, 2014 (Unaudited) Assisted Living Property – Upper Arlington, OH Operated by Sunrise Senior Living |
|
|
Table of Contents 2 CORPORATE Company Information 3 Additional Information 4 Forward-Looking Statements & Non-GAAP Information 5 Real Estate Activities 6-9 Real Estate Portfolio Summary 10 Real Estate Portfolio Metrics 11 Real Estate Portfolio Diversification 12-14 Proforma Top Ten Operators 15 Proforma Real Estate Portfolio Maturity 16 Enterprise Value 17 Debt Maturity 18 Financial Data Summary 19-20 Consolidated Statements of Income 21 Consolidated Balance Sheets . 22 Funds from Operations . 23-24 Glossary . 25-27 |
|
|
3 Company Information CORPORATE Wendy Simpson Boyd Hendrickson Edmund King Chairman Lead Director James Pieczynski Devra Shapiro Timothy Triche, MD Wendy Simpson Pam Kessler Clint Malin Chairman, Chief Executive Officer and President Executive Vice President, CFO, and Secretary Executive Vice President and Chief Investment Officer Brent Chappell Cece Chikhale Mark Hemingway Senior VP, Investment and Portfolio Management Vice President, Controller and Treasurer Vice President of Marketing Peter Lyew Vice President and Director of Taxes Corporate Office Investor Relations www.LTCreit.com 2829 Townsgate Road, Suite 350 Investor.Relations@LTCreit.com (805) 981-8655 phone Westlake Village, CA 91361 (805) 981-8655 (805) 981-8663 fax Board of Directors Management Contact Information Company Founded in 1992, LTC Properties, Inc. ("LTC") is a self-administered real estate investment trust that primarily invests in senior housing and long-term care properties through facility lease transactions, mortgage loans, and other investments. Our primary objectives are to sustain and enhance stockholder equity value and provide current income for distribution to stockholders through real estate investments in long-term care and other health care related properties leased to qualified, experienced operators. To meet these objectives, we attempt to invest in properties that provide opportunity for additional value and current returns to our stockholders and diversify our investment portfolio by geographic location, operator, and form of investment. For more information on LTC, visit the Company’s website at www.LTCreit.com . |
|
|
4 CORPORATE Additional Information Crowell, Weedon, & Co. J.J. B. Hilliard, W.L. Lyons, Inc. JMP Securities, LLC Doug Christopher, CFA John Roberts Peter Martin KeyBanc Capital Markets, Inc. Mizuho Securities USA Inc. MLV & Co LLC Jordan Sadler Rich Anderson Paul Morgan RBC Capital Markets Corporation Stifel, Nicolaus & Company, Inc. Wells Fargo Securities, LLC Mike Carroll Dan Bernstein Todd Stender Any opinions, estimates, or forecasts regarding LTC's performance made by the analysts listed above do not represent the opinions, estimates, or forecasts of LTC or its management. Analyst Coverage |
|
|
5 Forward-Looking Statements This supplemental information contains forward-looking statements within the meaning of Section 27A of the Securities Act of 1933, as amended, and Section 21E of the Securities Exchange Act of 1934, as amended, adopted pursuant to the Private Securities Litigation Reform Act of 1995. Statements that are not purely historical may be forward-looking. You can identify some of the forward-looking statements by their use of forward-looking words, such as ‘‘believes,’’ ‘‘expects,’’ ‘‘may,’’ ‘‘will,’’ ‘‘should,’’ ‘‘seeks,’’ ‘‘approximately,’’ ‘‘intends,’’ ‘‘plans,’’ ‘‘estimates’’ or ‘‘anticipates,’’ or the negative of those words or similar words. Forward- looking statements involve inherent risks and uncertainties regarding events, conditions and financial trends that may affect our future plans of operation, business strategy, results of operations and financial position. A number of important factors could cause actual results to differ materially from those included within or contemplated by such forward-looking statements, including, but not limited to, the status of the economy, the status of capital markets (including prevailing interest rates), and our access to capital; the income and returns available from investments in health care related real estate, the ability of our borrowers and lessees to meet their obligations to us, our reliance on a few major operators; competition faced by our borrowers and lessees within the health care industry, regulation of the health care industry by federal, state and local governments, (including as a result of the Patient Protection and Affordable Care Act of 2010 and the Health Care and Education Reconciliation Act of 2010), changes in Medicare and Medicaid reimbursement amounts (including due to federal and state budget constraints), compliance with and changes to regulations and payment policies within the health care industry, debt that we may incur and changes in financing terms, our ability to continue to qualify as a real estate investment trust, the relative illiquidity of our real estate investments, potential limitations on our remedies when mortgage loans default, and risks and liabilities in connection with properties owned through limited liability companies and partnerships. For a discussion of these and other factors that could cause actual results to differ from those contemplated in the forward-looking statements, please see the discussion under ‘‘Risk Factors’’ and other information contained in our Annual Report on Form 10-K for the fiscal year ended December 31, 2014 and in our publicly available filings with the Securities and Exchange Commission. We do not undertake any responsibility to update or revise any of these factors or to announce publicly any revisions to forward-looking statements, whether as a result of new information, future events or otherwise. Non-GAAP Information This supplemental information contains certain non-GAAP information including EBITDA, normalized EBITDA, FFO, normalized FFO, normalized interest coverage ratio, and normalized fixed charges coverage ratio. A reconciliation of this non-GAAP information is provided on pages 20, 23, and 24 of this supplemental information, and additional information is available under the “Non-GAAP Financial Measures” subsection under the “Selected Financial Data” section of our website at www.LTCreit.com. CORPORATE |
|
|
6 Real Estate Activities REAL ESTATE PORTFOLIO (dollar amounts in thousands) ACQUISITIONS See page 7 for Development activities. Simultaneous with the purchase, we made a development commitment totaling $12.2 million, including the land purchase, and added the property into a master lease. The property was included in a master lease at an incremental initial cash yield of 6.5% and we provided the lessee with contingent earn-out payments totaling up to $4,000 as a lease inducement. Subsequent to December 31, 2014, we purchased a parcel of land and existing improvements to complete construction of a memory care property and entered into a master lease which provides for our payment of a lease inducement of up to $1,589. Subsequent to December 31, 2014, we purchased and equipped the property for a total of $13,946 by exercising our right under a $10,600 mortgage loan. The property was added to an existing master lease at a lease rate of 10.3%, which was the interest rate in effect on the loan, and provided the lessee a lease inducement in an amount of $1,054. See page 7 for Lease-up activities. Subsequent to December 31, 2014, we purchased a parcel of land to develop a combination assisted living and memory care property. We added the land to the master lease discussed in (4) above and provided an additional lease inducement payment of up to $2,363. LOAN ORIGINATIONS Represents year-to-date mortgage interest income. We expect mortgage interest income, assuming no loan modifications, to be $228 for 2015. Date # of Properties # Beds/Units Location Operator Date of Construction Purchase Price 10/22/2014 1 UDP (1)(2) 66 units Burr Ridge, IL Under Development Property 2014-2016 1,400 $ 12/5/2014 1 MC (3) 48 units Castle Rock, CO Senior Lifestyle 2012 9,800 2 114 units 11,200 $ 2/6/2015 1 UDP (1)(4) 56 units Corpus Christi, TX Under Development Property 2015 7,195 $ 2/19/2015 1 SNF (5) 106 beds Slinger, WI Fundamental 2014 13,946 2/20/2015 1 UDP (1)(6) 89 units Murrells Inlet, SC Under Development Property 2015-2016 2,490 3 145 units/106 beds 23,631 $ Property Type Date # of Properties Property Type # Beds/Units Location Borrower Operator Origination 7/31/14 1 ALF 100 units Phoenix, AZ GrayHC-PVRE Gray Health Care 3,027 $ N/A N/A 96 $ (1) 7.0% 1/30/15 1 SNF 157 beds Grand Blanc, MI Affiliates of Madison Healthcare Prestige Healthcare 11,000 $ - $ 9,500 $ - $ 9.4% Interest Rate 2014 Annual Revenue Development Funding Funded to Date |
|
|
7 Real Estate Activities REAL ESTATE PORTFOLIO (dollar amounts in thousands) Includes purchase of land and existing improvements, if applicable, and development commitment. Commitment is part of the total loan commitment secured by 15 properties in Michigan operated by Prestige Healthcare. Subsequent to December 31, 2014, we amended the loan to provide an additional $20.0 million loan proceeds for the redevelopment projects at two of the properties securing the loan. Subsequent to December 31, 2014, we purchased a parcel of land and existing improvements to complete construction of a memory care property. Subsequent to December 31, 2014, we purchased a parcel of land to develop a combination assisted living and memory care property. DEVELOPMENT LEASE-UP Subsequent to December 31, 2014, we purchased and equipped the property securing the mortgage loan for a total of $13,946 by exercising our right under this loan. Project Type # of Projects Property Type # Beds/ Units 4Q14 2012 Expansion/Renovation Fort Collins, CO 2 ALF/MC 8.30% - 8,000 $ 453 $ 5,095 $ 2,905 $ 4Q14 2013 Renovation St. Petersburg, FL 1 SNF 8.75% - 500 354 500 - 4Q14 2013 Renovation Hillview/Lauderdale, TN 2 SNF 7.00% - 2,200 183 2,161 39 5 - 10,700 $ 990 $ 7,756 $ 2,944 $ 1Q15 2013 Development Westminster, CO 1 MC 9.25% 60 units 10,703 $ 2,517 $ 9,181 $ 1,522 $ - (2) 2013 Renovation Various cities in MI 15 SNF 9.41% - 12,000 (2) 1,824 3,337 8,663 - (2) 2015 Redevelopment Richmond, MI 1 SNF 9.41% - 10,000 (2) - - 10,000 - (2) 2015 Redevelopment Rochester Hills, MI 1 SNF 9.41% - 10,000 (2) - - 10,000 4Q15 2015 Development Corpus Christi, TX 1 MC 8.75% 56 units 12,179 - 7,195 (3) 4,984 19 116 units 54,882 $ 4,341 $ 19,713 $ 35,169 $ 2Q16 2014 Development Burr Ridge, IL 1 MC 9.30% 66 units 12,248 $ 2,057 $ 2,057 $ 10,191 $ 2Q16 2015 Development Murrells Inlet, SC 1 ALF/MC 8.75% 89 units 16,535 - 2,490 (4) 14,045 2 155 units 28,783 $ 2,057 $ 4,547 $ 24,236 $ Total 26 WA 9.02% 271 units 94,365 $ 7,388 $ 32,016 $ 62,349 $ x Estimated Rent Inception Date Commitment Year Location Approximate Cash Lease Yield Investment Commitment (1) 4Q14 Funding Total Funded to Date Remaining Commitment Date Opened Occupancy at Dec 31, 2014 Commitment Year Project Type Location # of Projects Property Type Approximate Cash Lease/Loan Yield # Beds/Units Feb-14 56% 2012 Redevelopment Slinger, WI 1 SNF (1) 10.08% 106 beds 10,600 $ - $ - $ Aug-14 50% 2013 Development Littleton, CO 1 MC 9.25% 60 units 9,931 159 9,689 Nov-14 21% 2012 Development Cold Spring, KY 1 SNF 8.50% 143 beds 23,500 4,971 20,904 Dec-14 44% 2012 Development Frisco, TX 1 ALF/MC 9.25% 80 units 5,800 352 5,691 Dec-14 17% 2013 Development Aurora, CO 1 MC 9.25% 48 units 9,622 1,860 8,744 5 188 units/249 beds 59,453 $ 7,342 $ 45,028 $ Total Commitment 4Q14 Funding Total Funded to Date |
|
|
8 REAL ESTATE PORTFOLIO Rendering Real Estate Activities Lease-Up in Slinger, WI The Pavilion at Glacier Valley 106-bed skilled nursing property Certificate of Occupancy – February 14, 2014 Operated by Fundamental |
|
|
9 REAL ESTATE PORTFOLIO Real Estate Activities Rendering Development in Westminster, CO Green Ridge Place 60-unit memory care property To be operated by Anthem Memory Care |
|
|
10 Real Estate Portfolio Summary REAL ESTATE PORTFOLIO (dollar amounts in thousands) Real Estate Snapshot – Owned and Loan Portfolio Includes rental income and interest income from mortgage loans and excludes rental income from properties sold and interest income from loans that paid off during the year ended December 31, 2014. Includes two MC developments with a total of 126 units. Includes one school property and five parcels of land held-for-use. Type of Property Gross Investments Investment Type Skilled Nursing 97 $ 633,052 56.7% $ 52,259 $ 14,595 59.4% Real Property 949,838 $ 85.0% Assisted Living 92 415,520 37.2% 37,847 985 34.5% Loans Receivable 167,329 15.0% Range of Care 8 46,217 4.1% 5,332 282 5.0% Total 1,117,167 $ 100.0% Under Development (2) - 11,495 1.0% - - - Other (3) 1 10,883 1.0% 1,294 - 1.1% Total 198 $ 1,117,167 100.0% $ 96,732 $15,862 100.0% # of Properties Gross Investment % of Revenues % For the Year Ended December 31, 2014 % of Investments Rental Income (1) Interest Income (1) |
|
|
11 Same Property Portfolio Statistics (1) Real Estate Portfolio Metrics REAL ESTATE PORTFOLIO Stabilized Property Portfolio Quality Mix Owned Properties Payor Source (1) Private Pay Medicare Medicaid (1) Quality mix for our skilled nursing portfolio, for the twelve months presented, is 25.6% Private Pay, 27.9% Medicare, and 46.5% Medicaid. For the Twelve Months Ended September 30, 2014 55.4% 16.5% 28.1% |
|
|
LTC owns or holds mortgages on 198 properties, two parcels of land under development, and five parcels of land held-for-use in 29 states. 12 Real Estate Portfolio Diversification REAL ESTATE PORTFOLIO WA ME 1 5 NV WY MI IL AR LA KY WV ND NY 33 2 1 2 3 5 1 2 3 2 2 2 2 1 6 21 3 5 4 8 11 4 5 2 6 1 4 2 12 7 3 1 1 1 1 1 1 1 2 1 1 OR CA AZ NM TX UT ID MT SD NE KS OK MS MN WI FL AL GA SC TN MO IA IN OH PA NJ NC VA CO Skilled Nursing Properties (Total: 97) Assisted Living Properties (Total: 92) Schools (Total: 1) Range of Care Properties (Total: 8) Under Development Properties (Total: 2) 1 15 Land Held-For-Use (Total: 5) 5 1 1 |
|
|
13 Real Estate Portfolio Diversification REAL ESTATE PORTFOLIO State Diversification By Property Type - Owned and Loan Portfolio The MSA rank by population as of July 1, 2013, as estimated by the United States Census Bureau. Due to master leases with properties in multiple states, revenue by state is not available. (dollar amounts in thousands) State (2) # of Props SNF % ALF % ROC % UDP % OTH % Gross Investment % Texas 55 193,087 $ 30.5% 43,458 $ 10.5% 2,994 $ 6.5% - $ - - $ - 239,539 $ 21.5% Michigan 15 127,725 20.2% - - - - - - 1,613 14.8% 129,338 11.6% Colorado 15 6,038 1.0% 92,394 22.2% 2,007 4.3% 9,420 81.9% - - 109,859 9.8% Ohio 13 54,000 8.5% 44,647 10.7% - - - - - - 98,647 8.8% Florida 13 35,361 5.6% 35,650 8.6% - - - - - - 71,011 6.4% New Jersey 5 - - 61,397 14.8% - - - - 9,270 85.2% 70,667 6.3% California 5 20,649 3.2% 28,070 6.8% 2,311 5.0% - - - - 51,030 4.6% New Mexico 7 50,622 8.0% - - - - - - - - 50,622 4.5% Arizona 6 36,091 5.7% 3,016 0.7% - - - - - - 39,107 3.5% Kansas 8 14,111 2.2% 17,145 4.1% - - - - - - 31,256 2.8% All Others 56 95,368 15.1% 89,743 21.6% 38,905 84.2% 2,075 18.1% - - 226,091 20.2% Total 198 633,052 $ 100.0% 415,520 $ 100.0% 46,217 $ 100.0% 11,495 $ 100.0% 10,883 $ 100.0% 1,117,167 $ 100.0% |
|
|
14 Proforma Real Estate Portfolio Diversification REAL ESTATE PORTFOLIO Operator Diversification – Owned and Loan Portfolio We have investments in 29 states leased or mortgaged to 36 different operators. Includes annualized GAAP rent for leased properties and twelve months interest income from properties secured by mortgage loans. Proforma includes rents from re-leased properties formerly operated by Enlivant as of January 1, 2015. Effective January 1, 2015, Senior Lifestyle Management began operating 13 properties formerly operated by Enlivant. (dollar amounts in thousands) Operators (1) Annual Income (2) % Gross Investment % Brookdale Senior Living 37 15,606 $ 13.1% 123,984 $ 11.1% Prestige Healthcare 17 13,172 11.1% 141,527 12.7% Senior Care Centers 9 12,336 10.4% 115,039 10.3% Preferred Care 29 10,635 8.9% 83,402 7.5% Senior Lifestyle Management (3) 17 8,458 7.1% 57,349 5.1% Carespring Health Care Management 3 7,778 6.5% 75,716 6.8% Juniper Communities 6 7,030 5.9% 87,088 7.8% Traditions Senior Management 5 6,810 5.7% 63,402 5.7% Fundamental 5 4,970 4.2% 45,221 4.0% Sunrise Senior Living 6 4,614 3.9% 37,659 3.4% All Others 64 27,455 23.2% 286,780 25.6% 198 118,864 $ 100.0% 1,117,167 $ 100.0% # of Properties |
|
|
15 Proforma Top Ten Operators REAL ESTATE PORTFOLIO Brookdale Senior Living (NYSE: BKD) operates more than 1,150 independent living, assisted living, and memory care communities and continuing care retirement centers, with the ability to serve approximately 110,000 residents. As of December 31, 2014 , the LTC portfolio consisted of 37 assisted living properties in nine states with a gross investment balance of $12 4.0 million. Prestige Healthcare (privately held) provides skilled nursing, assisted living, and independent living services, and other rehabilitative and hea lthcare services at 35 facilities in seven s tates. As of December 31, 2014 , the LTC portfolio consisted of 15 skilled nursing properties and five parcels of land held - for - use in Michigan and two range of care properties in South Carolina with a gross investment balance of $ 141.5 million. Senior Car e Centers (privately held) provides skilled nursing care, memory care, assisted living, and i ndependent living services in 80 facilities exclusively in Texas. As of December 31, 2014 , the LTC portfolio consisted of nine skilled nursing properties in Texas with a gross investment balance of $ 115.0 million. Preferred Care (privately held) operates 108 facilities comprised of skilled nursing, assisted living, and independent living facilities, as well as five specialty care f acilities, in 12 states. As of De cember 31, 2014 , the LTC portfolio consisted of 27 skilled nursing and two range of care properties in six states with a g ross investment balance of $83.4 million. They also operate one skilled nursing facility under a sub - lease with another lessee in our portfolio which is not included in the Preferred Care annual income . Senior Lifestyle (privately held) manages 167 communities consisting of independent living, assisted living, memory care, skilled nursing and rehab ilitative , affordable senior apartments, and short term stays i n 27 states. As of proforma December 31, 2014, the LTC portfolio consisted of 17 assisted living properties in seven states, with a gross inv estment balance of $57.3 million. Carespring Health Care Man agement (privately held) provides skilled nursing, assisted living, and independent living services, and other rehabilitative and hea lthcare services at 11 facilities in two states. As of December 31, 2014 , the LTC portfolio consisted of three skilled nur sing properties in two states wi th a gross investment balance of $7 5.7 million. Juniper Communities (privately held) operates 20 facilities comprised of skilled nursing, assisted living, memory care, and independent living fa cilities in four states. As of December 31, 2014 , the LTC portfolio consisted of six assisted living and memory care properties in three states with a gross investment balan ce of $87.1 million. Traditions Senior Management (privately held) operate 2 8 facil ities consisting of independent living, assisted living, and skilled nursing facilities in eight states. As of December 31, 2014 , the LTC portfolio consisted of four skilled nursing properties and one range of care property in three states with a gross investment balance of $6 3. 4 million. They also operate two skilled nursing properties under a sub - lease with Preferred Care, Inc. which is not included in the Traditions Senior Management annual income . Fundamental (privately held) includes skilled nursing facilities, assisted living facilities, long term acute care hospitals, hospices, outpatient c linics, behavioral health services and other healthcare services at 77 locations in 9 states. As of Decembe r 31, 2014 , the LTC portfolio consisted of five skilled nursing properties in three states, with a gross investment balance of $45.2 million. Sunrise Senior Living ( privately held), through its subsidiaries, operates 302 communities in the United States, C anada, and the United Kingdom. Sunrise offers a full range of senior living services, including independent living, assisted living, memory care, as well as nursing and rehabilitative services. As of December 31, 2014 , the LTC portfolio consisted of six assisted living properties in t wo states, with a gross investment balance of $ 37.7 million. |
|
|
16 Proforma Real Estate Portfolio Maturity (dollar amounts in thousands) Includes annualized GAAP rent for leased properties and twelve months interest income from properties secured by mortgage loans. Proforma includes rents from re-leased properties formerly operated by Enlivant as of January 1, 2015. (As a % of Total Annual Income(1)) REAL ESTATE PORTFOLIO % of Total % of Total Annual Income (1) % of Total 2015 - $ - 282 $ 1.8% 282 0.2% 2016 3,097 3.0% 426 2.7% 3,523 3.0% 2017 1,653 1.6% 965 6.1% 2,618 2.2% 2018 10,666 10.4% 973 6.1% 11,639 9.8% 2019 1,596 1.5% 233 1.5% 1,829 1.5% 2020 13,631 13.2% - - 13,631 11.5% 2021 18,365 17.8% - - 18,365 15.5% 53,994 52.5% 12,983 81.8% 66,977 56.3% Total 103,002 $ 100.0% 15,862 $ 100.0% 118,864 $ 100.0% Year Rental Income (1) Interest Income (1) Thereafter |
|
|
17 Enterprise Value FINANCIAL We amended our Unsecured Credit Agreement increasing the commitment to $400,000 with the opportunity to increase the credit line up to $600,000. The maturity of the facility was also extended to October 14, 2018. Includes amortization of debt issue cost. Non-traded shares. Two million shares outstanding with a face rate of 8.5% and a liquidation value of $19.25 per share, convertible into common stock on a one-for-one basis. Our Series C preferred stock is not redeemable by us. Traded on NYSE. Closing price of our common stock as reported by the NYSE on December 31, 2014, the last trading day of fourth quarter 2014. Normalized EBITDA for the twelve months ended December 31, 2014. See page 20 for reconciliation of normalized EBITDA. (amounts in thousands, except per share amounts and number of shares) Capitalization Bank borrowings (1) - $ Senior unsecured notes -weighted average rate 4.8% (2) 281,633 Total debt 281,633 15% 12/31/14 No. of shares Preferred stock - Series C (3) 38,500 2% Common stock (4) 35,480,261 43.17 $ (5) 1,531,683 83% Total equity 1,570,183 85% 1,851,816 $ 100% Less: Cash and cash equivalents (25,237) 1,826,579 $ Debt to Enterprise Value 15.4% Debt & Preferred to Enterprise Value 17.5% Debt to Normalized EBITDA (6) 2.6x Enterprise Value At December 31, 2014 Debt Equity Closing Price Total Market Value |
|
|
18 Debt Maturity FINANCIAL (dollar amounts in thousands) During 2014, we amended our Unsecured Credit Agreement increasing the commitment to $400,000 with the opportunity to increase the credit line up to $600,000. The maturity of the facility was also extended to October 14, 2018. Reflects scheduled principal payments. $ - $ 29,166 $ 29,166 - 26,667 26,667 - 26,167 26,167 - 28,167 28,167 - 25,666 25,666 - 32,160 32,160 - 32,160 32,160 - 81,480 81,480 $ - $ 281,633 $ 281,633 Year Unsecured Line of Credit (1) Senior Unsecured Notes (2) Total 2020 2017 2016 2015 2019 2018 Total Thereafter 2021 |
|
|
19 Financial Data Summary FINANCIAL (dollar amounts in thousands) Balance Sheet, Leverage Ratios and Coverage Ratios 12/31/14 12/31/13 12/31/12 12/31/11 Balance Sheet: Gross real estate assets $1,117,167 $1,104,732 $940,176 $779,033 Net real estate assets 892,179 884,361 740,846 599,916 Gross asset value 1,190,807 1,151,781 988,922 826,214 Total debt 281,633 278,835 303,935 159,200 Total liabilities 305,698 298,972 326,484 178,387 Preferred stock 38,500 38,500 38,500 38,500 Total equity 660,121 632,438 463,108 468,710 Leverage Ratios: Debt to gross asset value 23.7% 24.2% 30.7% 19.3% Debt & preferred stock to gross asset value 26.9% 27.6% 34.6% 23.9% Debt to total enterprise value 15.4% 18.1% 21.6% 14.1% Debt & preferred stock to total enterprise value 17.5% 20.6% 24.3% 17.5% Coverage Ratios: Debt to normalized EBITDA 2.6x 2.9x 3.7x 2.1x Normalized EBITDA / interest incurred 7.3x 7.7x 8.3x 11.7x Normalized EBITDA / fixed charges 6.0x 6.1x 6.2x 6.3x For the Year Ended |
|
|
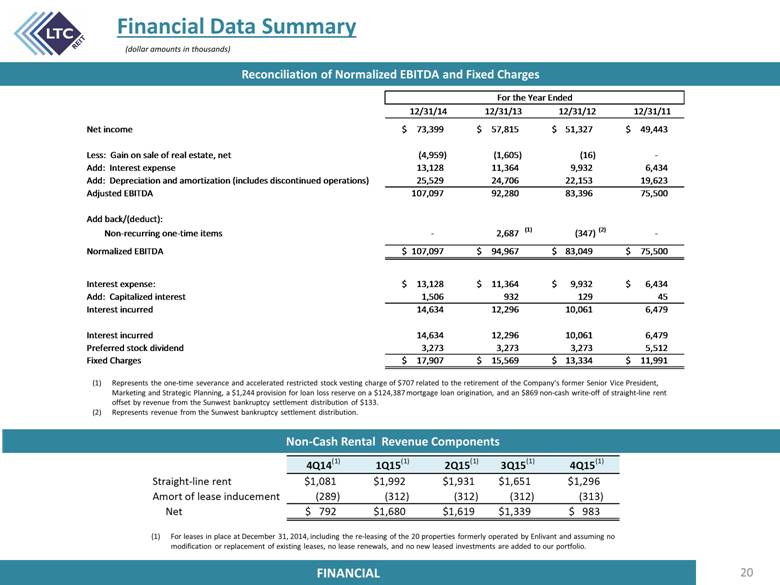
20 Financial Data Summary FINANCIAL FINANCIAL (dollar amounts in thousands) Non-Cash Rental Revenue Components For leases in place at December 31, 2014, including the re-leasing of the 20 properties formerly operated by Enlivant and assuming no modification or replacement of existing leases, no lease renewals, and no new leased investments are added to our portfolio. Reconciliation of Normalized EBITDA and Fixed Charges Represents the one-time severance and accelerated restricted stock vesting charge of $707 related to the retirement of the Company’s former Senior Vice President, Marketing and Strategic Planning, a $1,244 provision for loan loss reserve on a $124,387 mortgage loan origination, and an $869 non-cash write-off of straight-line rent offset by revenue from the Sunwest bankruptcy settlement distribution of $133. Represents revenue from the Sunwest bankruptcy settlement distribution. Net income 73,399 $ 57,815 $ 51,327 $ 49,443 $ Less: Gain on sale of real estate, net (4,959) (1,605) (16) - Add: Interest expense 13,128 11,364 9,932 6,434 Add: Depreciation and amortization (includes discontinued operations) 25,529 24,706 22,153 19,623 Adjusted EBITDA 107,097 92,280 83,396 75,500 Add back/(deduct): Non-recurring one-time items - 2,687 (1) (347) (2) - Normalized EBITDA 107,097 $ 94,967 $ 83,049 $ 75,500 $ Interest expense: 13,128 $ 11,364 $ 9,932 $ 6,434 $ Add: Capitalized interest 1,506 932 129 45 Interest incurred 14,634 12,296 10,061 6,479 Interest incurred 14,634 12,296 10,061 6,479 Preferred stock dividend 3,273 3,273 3,273 5,512 Fixed Charges 17,907 $ 15,569 $ 13,334 $ 11,991 $ For the Year Ended 12/31/14 12/31/13 12/31/12 12/31/11 |
|
|
Consolidated Statements of Income 21 FINANCIAL FINANCIAL (amounts in thousands, except per share amounts) 2014 2013 2014 2013 Revenues Rental income 26,474 $ 25,259 $ 101,849 $ 98,166 $ Interest income from mortgage loans 4,108 3,103 16,553 6,298 Interest and other income 173 231 559 510 Total revenues 30,755 28,593 118,961 104,974 Expenses Interest expense 3,683 2,852 13,128 11,364 Depreciation and amortization 6,594 6,237 25,529 24,389 (Recovery) provisions for doubtful accounts (46) 2,139 32 2,180 General and administrative expenses 3,343 2,715 11,832 11,636 Total expenses 13,574 13,943 50,521 49,569 Operating Income 17,181 14,650 68,440 55,405 Gain on sale of real estate, net 3,819 - 4,959 - Income from continuing operations 21,000 14,650 73,399 55,405 Discontinued operations: Income from discontinued operations - - - 805 Gain on sale of real estate, net - - - 1,605 Net income from discontinued operations - - - 2,410 Net Income 21,000 14,650 73,399 57,815 Income allocated to participating securities (138) (99) (481) (383) Income allocated to preferred stockholders (819) (819) (3,273) (3,273) Net income available to common stockholders 20,043 $ 13,732 $ 69,645 $ 54,159 $ Basic earnings per common share: $0.58 $0.40 $2.01 $1.64 Diluted earnings per common share: $0.57 $0.40 $1.99 $1.63 Weighted average shares used to calculate earnings per common share: Basic 34,678 34,555 34,617 33,111 Diluted 36,698 34,582 36,640 33,142 (unaudited) (audited) Three Months Ended Twelve Months Ended December 31, December 31, |
|
|
Consolidated Balance Sheets 22 FINANCIAL FINANCIAL (audited, amounts in thousands) December 31, 2013 December 31, 2013 ASSETS LIABILITIES Real estate investments: Bank borrowings - $ 21,000 $ Land 80,024 $ 80,993 $ Senior unsecured notes 281,633 255,800 Buildings and improvements 869,814 856,624 Bonds payable - 2,035 Accumulated depreciation and amortization (223,315) (218,700) Accrued interest 3,556 3,424 Net real estate property 726,523 718,917 Earn-out liabilities 3,258 - Mortgage loans receivable, net of loan loss Accrued expenses and other liabilities 17,251 16,713 reserves: 2014 - $1,673; 2013 - $1,671 165,656 165,444 Total liabilities 305,698 298,972 Real estate investments, net 892,179 884,361 EQUITY Other assets: Stockholders' equity: Cash and cash equivalents 25,237 6,778 Preferred stock (1) 38,500 38,500 Debt issue costs, net 3,782 2,458 Common stock (2) 355 347 Interest receivable 597 702 Capital in excess of par value 717,396 688,654 Straight-line rent receivable, net of allowance for Cumulative net income 855,247 781,848 doubtful accounts: 2014 - $731; 2013 - $1,541 32,651 29,760 Other comprehensive income 82 117 Prepaid expenses and other assets 9,931 6,756 Cumulative distributions (951,459) (877,028) Notes receivable 1,442 595 Total equity 660,121 632,438 Total assets 965,819 $ 931,410 $ Total liabilities and equity 965,819 $ 931,410 $ (1) Preferred stock $0.01 par value; 15,000 shares authorized; shares issued and outstanding: 2014 - 2,000; 2013 - 2,000 (2) Common stock $0.01 par value; 60,000 shares authorized; shares issued and outstanding: 2014 - 35,480; 2013 - 34,746 December 31, 2014 December 31, 2014 |
|
|
Funds from Operations 23 FINANCIAL FINANCIAL (unaudited, amounts in thousands, except per share amounts) Reconciliation of Normalized FFO, Normalized AFFO, and Normalized FAD Comprised of a $1,244 provision for loan loss reserve on a $124,387 mortgage loan origination and an $869 non-cash write-off of straight-line rent offset by revenue from the Sunwest bankruptcy settlement distribution of $133. Represents the one-time severance and accelerated restricted stock vesting charge of $707 related to the retirement of the Company’s former Senior Vice President, Marketing and Strategic Planning and (1) above. 2014 2013 2014 2013 Net income available to common stockholders 20,043 $ 13,732 $ 69,645 $ 54,159 $ Add: Depreciation and amortization (includes discontinued operations) 6,594 6,237 25,529 24,706 Less: Gain on sale of real estate, net (3,819) - (4,959) (1,605) FFO available to common stockholders 22,818 19,969 90,215 77,260 Add: Non-recurring one-time items - 1,980 (1) - 2,687 (2) Normalized FFO available to common stockholders 22,818 21,949 90,215 79,947 Less: Non-cash rental income (792) (790) (2,161) (3,295) Normalized adjusted FFO (AFFO) 22,026 21,159 88,054 76,652 Add: Non-cash compensation charges 927 541 3,253 2,134 Add: Non-cash interest related to earn-out liabilities 18 - 18 256 Less: Capitalized interest (290) (214) (1,506) (932) Normalized funds available for distribution (FAD) 22,681 $ 21,486 $ 89,819 $ 78,110 $ $0.64 $0.57 $2.55 $2.29 $0.64 $0.62 $2.55 $2.37 $0.62 $0.60 $2.49 $2.27 $0.64 $0.61 $2.54 $2.31 Diluted FFO available to common stockholders per share Diluted normalized FFO available to common stockholders per share Diluted normalized AFFO per share Diluted normalized FAD per share Twelve Months Ended December 31, December 31, Three Months Ended |
|
|
Funds from Operations 24 FINANCIAL FINANCIAL Reconciliation of Normalized FFO Per Share (unaudited, amounts in thousands, except per share amounts) 2013 2013 Normalized FFO available to common stockholders $ 22,818 $ 21,949 $ 90,215 $ 79,947 Effect of dilutive securities: Participating securities 138 99 481 383 Convertible preferred securities 819 819 3,273 3,273 Diluted normalized FFO available to common stockholders $ 23,775 $ 22,867 $ 93,969 $ 83,603 34,678 34,555 34,617 33,111 Effect of dilutive securities: Stock options 20 27 23 31 Participating securities 242 196 226 200 Convertible preferred securities 2,000 2,000 2,000 2,000 Shares for diluted FFO per share 36,940 36,778 36,866 35,342 $0.66 $0.64 $2.61 $2.41 $0.64 $0.62 $2.55 $2.37 Diluted normalized FFO per share Shares for basic FFO per share Basic normalized FFO per share 2014 2014 Three Months Ended December 31, Twelve Months Ended December 31, |
|
|
25 GLOSSARY Glossary Adjusted Funds From Operations (“AFFO”): FFO excluding the effects of straight - line rent and amortization of lease inducement . Assisted Living Properties (“ALF”) : The ALF portfolio consists of assisted living, independent living, and/or memory care properties. (See Independent Living and Memory Care) Assisted living properties are s enior housing properties serving elderly persons who require assistance with activities of daily living, but do not require the co nstant supervision skilled nursing properties provide. Services are usually available 24 hours a day and include personal supervision and assistance with eating , bathing, grooming and administering medication. The facilities provide a combination of hous ing, supportive services, personalized assistance and health care designed to respond to individual needs . Contractual Lease Rent: Rental revenue as defined by the lease agreement between us and the operator for the lease year . EBITDA: Earnings before interest, taxes, depreciation and amortization . Funds Available for Distribution (“FAD”): A FFO excluding the effects of n on - cash compensation charges , capitalized interest and non - cash interest charges. Funds From Operations (“FFO”): A s defined by the National Association of Real Estate Investment Trusts (“NAREIT”), net income available to common stockholder s (compute d in accordance with U.S. GAAP) excluding gains or losses on the sale of real estate and impairment write - downs of depreciable real estate plus real estate depreciation and amortization, and after adjustments for unconsolidated partnerships and joint ventu res. GAAP Lease Yield: GAAP rent divided by the sum of the p urchase p rice and transaction costs. GAAP Rent: Total rent we will receive as a fixed amount over the life of the lease and recognize d evenly over that life. GAAP rent recorded in the early years of a lease is higher than the cash rent received and during the later years of the lease , the cash rent received is higher than GAAP rent recognized . GAAP rent is commonly referred to as strai ght - line rental income. Gross Asset Value: Represents total assets plus accumu lated depreciation and loan loss reserves . Gross Investment: Original price paid for an asset plus capital improvements funded by LTC , without any deprec i ation deductions. Gross Investment is commonly referred to as undepreciated book value. Independent Living Properties (“ILF”) : Senior housing properties offer ing a sense of community and numerous levels of service, such as laundry, housekeeping, dining options/meal plan s, exercise and wellness programs, transportation , social , cultural and recreational activities , on - site security and emergency response programs. Many offer on - site conveniences like beauty/barber shops, fitness facilities, game rooms, libraries and acti vity centers. ILFs are also known as retirement communities or senior apartments . Interest Income: Represents interest income from mortgage loans. Licensed Beds/Units: The number of beds and/or units tha t an operator is authorized to operate at senior housing and long - term care propert ies . Licensed b eds and/or u nits may differ from the number of beds and/or units in service at any given time. |
|
|
26 GLOSSARY Glossary Memory Care Properties (“MC”) : Senior housing properties offering specialized options for seniors with Alzheimer’s disease and other forms of dementia. The se facilities offer dedicated care and specialized programming for various conditions relating to memory loss in a secured envir o nment that is typically smaller in scale and more residential in nature than traditional assisted living facilities. These facilities have staff available 24 hours a day to respond to the unique needs of their residents. Metropolitan Statistical Areas ( “ MSA ” ) : Based on the U.S. Census Bureau, MSA is a geographic entity defined by the Office of Management and Budget (OMB) for use by Federal statistical agencies in collecting, tabulating, and publishing Federal statistics. A metro area contains a core urban area of 50,00 0 or more population. Micropolitan Statistical Areas ( “ Micro - SA ” ) : Based on the U.S. Census Bureau, Micro - SA is a geographic entity defined by the Office of Manageme nt and Budget (OMB) for use by Federal statistical agencies in collecting, tabulating, and publishing Federal statistics. A micro area contains an urban core of at least 10,000 (but less than 50,000) population. Net Rea l Estate Assets: G ross real estate investment less accumulated depreciation. Net Real Estate Asset is commonly referred to as Net Book Value (“NBV”) . Non - cash Rental I ncome: Straight - line rental income and amortization of lease inducement. Non - cash C ompens ation C harges: Vesting expense relating to stock option s and restricted stock. Normalized AFFO: A FFO adjusted for non - recurring, infrequent or unusual items . Normalized EBITDAR Coverage: The trailing twelve month’s earnings from the operator financial statements adjusted for non - recurring, infrequent, or unusual items and before interest, taxes, depreciation, amortization, and rent divided by the operator’s contractual lease rent. Manag ement fees are imputed at 5% of revenues. Normalized EBITDARM Coverage: The trailing twelve month’s earnings from the operator financial statements adjusted for non - recurring, infrequent, or unusual items and before interest, taxes, depreciation, amortiz ation, rent, and management fees divided by the operator’s contractual lease rent. Normalized FAD: FAD adjusted for non - recurring, infrequent or unusual items . Normalized FFO: FF O adjusted for non - recurring, infrequent or unusual items. Occupancy: The weighted average percentage of all beds and/or units that are occupied at a given time. The calculation uses the trailing twelve months and is based on licensed beds and/or units which may differ from the number of beds and/or units in service at any given time. Operator Financial Statements: Property level operator financial statements which are unaudited and have not been independently verified by us. Private Pay: Private pay includes private insurance, HMO, VA, and other payors . |
|
|
27 GLOSSARY Glossary Glossary Purchase Price: Represents the fair value price of an as set that is exchanged in an orderly transaction between market participants at the measurement date. An orderly transaction is a transaction that assumes exposure to the market for a period prior to the measurement date to allow for marketing activities t hat are usual and customary for transactions involving such assets; it is not a forced transaction (for example, a forced liquidation or di stress sale). Quality Mix: LTC revenue by operator underlying payor source for the quarter presented. LTC is not a Medicaid or a Medicare recipient. Statistics represent LTC's rental revenues times operators' underlying payor source revenue percentage. Underlying payor source revenue percentage is calculated from prope rty level operator financial statements which are unaudited and have not been independently verified by us. Range of Care ( “ ROC ” ): Range of care properties consist of properties providing skilled nursing and any combination of assisted living, independent living and/or memory care services. Rental Income: Represents GAAP rent net of amortized lease inducement cost . Same Property Portfolio (“SPP”) : S ame property statistics allow for the comparative evaluation of performance across a consistent population of LTC’s leased property portfolio . Our SPP is comprised of s tabilized properties owned and operated throughout the duration of the quarter - over - quarter comparison periods presented (excluding assets sold and assets held - for - sale) . Accordingly, a leased property must be owned and stabilized for a mi nimum of 1 5 months to be included in our SSP. School : An institution for educatin g students which include s a charter school . Charter schools provide an alternative to the traditional public school and are generally autonomous entities authorized by the state or locality to conduct operations independent from the surrounding public school district. Laws vary by state, but generally charters are granted by state boards of education either directly or in conjunction with local school districts or public universities. Operators are granted charters to establish and operate schools based on the goals and objectives set forth in the charter. Upon receipt of a char ter, schools receive an annuity from the state for each student enrolled. Skilled Nursing Properties (“SNF”) : Senior housing properties providing restorative, rehabilitative and nursing care for people not requiring the more extensive and sophisticated treatment available at acute care hospitals. Many SNF s provide ancillary services that include occupational, speech, physical, respiratory and IV t herapies, as well as sub - acute care services which are paid either by the patient, the patient’s family, private health insurance, or through the fede ral Medicare or state Medicaid programs. Stabilized: Properties are generally considered sta bilized upon the earlier of achieving certain occupancy thresholds ( e.g. 80% for SNF s and 90% for ALF s ) and, as applicable, 12 months from the date of acquisition or, in the event of a de novo development, redevelopment , major renovations or addition, 24 months from the date the property is first placed in or returned to service. Under Development Properties (“UDP”): Development project s to construct senior housing propert ies . |