Attached files
| file | filename |
|---|---|
| EXCEL - IDEA: XBRL DOCUMENT - INFORMATICA CORP | Financial_Report.xls |
| EX-21.1 - SUBSIDIARIES OF THE REGISTRANT - INFORMATICA CORP | infa-20141231x10kxex211.htm |
| EX-10.8 - INFORMATICA CORPORATION 2009 EQUITY INCENTIVE PLAN PSU AGREEMENT AND NOTICE - INFORMATICA CORP | infa-20141231x10kxex108.htm |
| EX-31.1 - CERTIFICATION OF CHIEF EXECUTIVE OFFICER PURSUANT TO SECTION 302 - INFORMATICA CORP | infa-20141231x10kxex311.htm |
| EX-23.1 - CONSENT OF INDEPENDENT REGISTERED PUBLIC ACCOUNTING FIRM - INFORMATICA CORP | infa-20141231x10kxex231.htm |
| EX-10.19 - OFFER LETTER TO NAMED EXECUTIVE OFFICER - INFORMATICA CORP | infa-20141231x10kxex1019.htm |
| EX-31.2 - CERTFICATION OF CHIEF FINANCIAL OFFICER PURSUANT TO SECTION 302 - INFORMATICA CORP | infa-20141231x10kxex312.htm |
| EX-32.1 - CERTIFICATIONS OF CEO AND CFO PURSUANT TO SECTION 906 - INFORMATICA CORP | infa-20141231x10kxex321.htm |
UNITED STATES SECURITIES AND EXCHANGE COMMISSION
Washington, D.C. 20549
__________________
FORM 10-K
___________________
þ Annual report pursuant to Section 13 or 15(d) of the Securities Exchange Act of 1934
For the year ended December 31, 2014
or
þ Transition report pursuant to Section 13 or 15(d) of the Securities Exchange Act of 1934
Commission File Number: 0-25871
INFORMATICA CORPORATION
(Exact name of registrant as specified in its charter)
Delaware | 77-0333710 | |||
(State or other jurisdiction of incorporation or organization) | (I.R.S. Employer Identification No.) | |||
2100 Seaport Boulevard
Redwood City, California 94063
(Address of principal executive offices and zip code)
(650) 385-5000
(Registrant’s telephone number, including area code)
Securities registered pursuant to Section 12(b) of the Act:
Title of each class | Name of exchange on which registered | |||
Common Stock, par value $0.001 per share | The NASDAQ Stock Market LLC | |||
(NASDAQ Global Select Market) | ||||
Securities registered pursuant to Section 12(g) of the Act: None
Indicate by check mark if the registrant is a well-known seasoned issuer, as defined in Rule 405 of the Securities Act. Yes þ No ¨
Indicate by check mark if the registrant is not required to file reports pursuant to Section 13 or Section 15(d) of the Securities Exchange Act of 1934 (the “Exchange Act”). Yes ¨ No þ
Indicate by check mark whether the registrant (1) has filed all reports required to be filed by Section 13 or 15(d) of the Exchange Act during the preceding 12 months (or for such shorter period that the registrant was required to file such reports) and (2) has been subject to such filing requirements for the past 90 days.
Yes þ No ¨
Indicate by check mark whether the Registrant has submitted electronically and posted on its corporate website, if any, every Interactive Data File required to be submitted and posted pursuant to Rule 405 of Regulation S-T (§232.405 of this chapter) during the preceding 12 months (or for such shorter period that the Registrant was required to submit and post such files). Yes þ No ¨
Indicate by check mark if disclosure of delinquent filers pursuant to Item 405 of Regulation S-K is not contained herein, and will not be contained, to the best of registrant’s knowledge, in definitive proxy or information statements incorporated by reference in Part III of this Form 10-K or any amendment to this Form 10-K. þ
Indicate by check mark whether the registrant is a large accelerated filer, an accelerated filer, a non-accelerated filer, or a smaller reporting company. See the definitions of “large accelerated filer,” “accelerated filer,” and “smaller reporting company” in Rule 12b-2 of the Exchange Act.
Large accelerated filer þ Accelerated filer ¨ Non-accelerated filer ¨ Smaller reporting company ¨
Indicate by check mark whether the registrant is a shell company (as defined in Rule 12b-2 of the Exchange Act). Yes ¨ No þ
The aggregate market value of the voting stock held by non-affiliates of the Registrant as of June 30, 2014 was approximately $3,876,880,000 (based on the last reported sale price on June 30, 2014 for the Registrant's common stock, as reported on the NASDAQ Global Select Market).
As of January 30, 2015, there were approximately 109,432,000 shares of the registrant’s Common Stock outstanding.
DOCUMENTS INCORPORATED BY REFERENCE
Portions of the registrant’s Proxy Statement for the registrant’s 2015 Annual Meeting of Stockholders are incorporated by reference into Part III of this Form 10-K to the extent stated herein. The Proxy Statement will be filed within 120 days of the registrant’s year ended December 31, 2014.
INFORMATICA CORPORATION
TABLE OF CONTENTS
Page No. | |||
PART I | |||
PART II | |||
PART III | |||
PART IV | |||
2
PART I
ITEM 1. BUSINESS
Overview
Informatica Corporation is the leading independent provider of enterprise data integration software and services. Organizations around the world rely on Informatica to realize their information potential and drive top business imperatives.
We believe data is one of an organization’s most strategic assets, and our vision is to empower the data-centric world. We address the growing challenge organizations face with data, including data that is fragmented across and beyond the enterprise and data of varying quality. We have developed, and continue to innovate, solutions for a wide range of enterprises, regardless of which technology platform, application, or database a customer chooses and whether the data resides on-premise or in the cloud. Our solutions enable a wide variety of complex, enterprise-wide data integration initiatives through technologies including data integration, data quality, big data, master data management, data security, data exchange, and data preparation. We have built our platform and products on the Informatica Vibe architecture. Vibe is an embeddable virtual data machine that allows companies to access, aggregate, and manage data regardless of data type, source, volume, compute platform or user. Vibe enables companies to map data once, and deploy anywhere, providing our customers with the agility to avoid costly and time-consuming hand coding, recoding or redevelopment as data technologies evolve.
We are focused on growing across all data initiatives, advancing our technology leadership, and expanding our geographic presence and capabilities across all major regions. We believe we can expand our business by leveraging our success, knowledge, and the strength of our proven products that have helped our customers deploy thousands of large data management implementations.
We are organized and operate in a single segment. See Note 17. Significant Customer Information and Segment Information of Notes to Consolidated Financial Statements in Part II, Item 8 of this Report, which is incorporated herein by reference.
Products
We provide data integration software and services. Our products enable organizations to gain a competitive advantage in the global information economy by empowering them to access, integrate, and trust their information assets. These products comprise a comprehensive, unified, open, and economical data integration platform that enables business and IT executives, architects, and managers to provide trusted, relevant data to the business - when and where it is needed. The Informatica Platform, powered by Vibe virtual data machine, handles most types of data integration and data management projects required to support business goals.
The following products are included in the Informatica Platform:
Data Integration. Our enterprise data integration family of products includes Informatica PowerCenter, Informatica PowerExchange and Informatica Data Integration Hub. We also offer Informatica PowerCenter Express, an entry-level data integration and profiling edition for departments or small to mid-market business, and Informatica Cloud Data Integration solutions.
Informatica PowerCenter integrates data from virtually any business system, in almost any format, and quickly delivers that data throughout the enterprise to improve operational efficiency. Highly scalable and high-performance, PowerCenter serves as the foundation for all data integration projects. PowerCenter is available in a variety of editions. Additionally, many options are available to extend Informatica PowerCenter’s core data integration capabilities. Informatica PowerExchange is a family of data access products that enable IT organizations to access mission-critical data and deliver it throughout the enterprise without having to develop custom data access programs. Informatica Data Integration Hub simplifies application-to-application data integration with a publish-and-subscribe model that allows IT organizations to publish once and support one-to-many consuming applications.
Informatica Cloud Data Integration provides easy to use cloud data integration applications and integration platform as a service (“iPaaS”) that allow organizations to combine the enterprise-class benefits of the Informatica Platform with the cost and usability advantages of the latest cloud computing applications platforms. We offer Cloud integration applications, which are purpose-built, multi-tenant cloud services that allow users to integrate data across cloud-based applications, on-premise systems, databases, files and social data sources, as well as Cloud Connectors to connect to a wide variety of on-premise and cloud-based applications, including enterprise applications, databases, flat files, file feeds, and social networking sites.
Data Quality. Informatica Data Quality products deliver pervasive data quality to stakeholders, projects, and data domains, on premise or in the cloud, using a comprehensive and unified platform. Our Data Quality family of products includes a variety of Data Quality editions and data-as-a-service offerings such as contact validation.
Big Data Solutions. Informatica's Big Data Solutions includes data integration and data quality capabilities available on Hadoop. Our Big Data Solutions family of products includes Informatica Big Data Solution that provides a safe and efficient way
3
to integrate all types of data on Hadoop at any scale without having to learn Hadoop; Big Data Parsing that processes virtually all file formats natively on Hadoop with scale and efficiency and addresses the variety and complexity of data sources, including logs, industry standards, documents, and binary or hierarchical data; and Vibe Data Stream that manages small pieces of data as they flow in at high rates and accumulate quickly into large volumes.
Master Data Management. Informatica Master Data Management (“MDM”) products deliver consolidated and reliable business-critical data - also known as master data - to improve business operations. Informatica MDM identifies all business-critical master data as well as the relationships between master data that is stored in different formats and multiple systems across the enterprise. Our MDM family of products includes MDM, Product Information Management (“PIM”), Identity Resolution and Cloud MDM.
Data Security Group. Data Security Group ("DSG") products are designed to help IT organizations to cost-effectively manage every phase of the data lifecycle, by handling data growth, safely retiring legacy systems and applications, optimizing test data management, and protecting sensitive data. Informatica DSG products include Data Archive, Data Subset, Persistent Data Masking, Dynamic Data Masking and ILM Nearline. In 2015 we plan to release Secure@Source, a new product that enables customers to discover and classify sensitive data and assess risks associated with data proliferation.
Data Exchange. Informatica B2B Data Exchange offers a comprehensive technology infrastructure for multi-enterprise data integration, partner management, and business event monitoring, allowing organizations to aggregate, exchange and share data. Our data exchange products also include Data Transformation for converting structured and unstructured data to and from more broadly consumable data formats to support business-to-business and multi-enterprise transactions, as well as HParser, a data transformation (data handler) environment optimized for Hadoop.
Data Preparation. Our newest solution to deliver data integration for next-generation analytics, Informatica Rev offers an intuitive user experience, optimized for business users to bring together data for business decision making in visualization tools. Informatica Rev empowers business users to be self-sufficient in data integration and preparation for analytics, with capabilities for users to merge data from multiple sources and prepare it for analysis.
Other Solutions. We also provide a variety of other data integration software solutions, including Informatica Complex Event Processing, Informatica Data Replication, Informatica Procurement, and Informatica Ultra Messaging.
In addition, Informatica Communities, created in 2001, has grown to over 130,000 members in more than 190 countries using our products as a platform on which to build or customize a specific data integration solution. These developers extend Informatica's presence and profile in the broad data integration market and provide a network of knowledge that can be shared to amplify our brand and its influence. Also, the Informatica Marketplace, created in 2010, has grown to host over 1,500 free and paid apps and services from partners and individual developers with downloads of Marketplace solutions ranging from approximately 11,000 - 15,000 each month. The Informatica Marketplace provides vendors, partners and individual developers with a central location to contribute and procure apps and services across all areas of data management, including data integration, data quality, master data management, and information security. These solutions are developed for both on-premise and cloud use cases and include data models, mappings, mapplets, tools, utilities, packaged services, methodologies, connectors and other useful resources. The solutions contributed to the Marketplace are evaluated for quality and value by us before becoming publicly available.
Services
We offer a comprehensive set of services, including product-related customer support, consulting services, and education services.
We provide technical customer support for Informatica software deployments through support centers in the United States, the United Kingdom, and India, as well as staff in Brazil, Canada, China, Germany, Ireland, Japan, the Netherlands, Spain, and South Korea for both regional installations as well as geographically dispersed projects. Informatica’s Global Customer Support offers a well-engineered and comprehensive set of support programs tailored to fit customer needs. Customers and partners can access our 24x7 technical support over the phone using toll-free lines, via email, and online through Informatica’s Web portal “http://mysupport.informatica.com.”
Our consulting services are focused on helping customers to become agile data-driven enterprises, both tactically and strategically. Our services include initial configuration of the Informatica Platform, knowledge transfer to customers and partners, designing and implementing custom data integration solutions, project audit, and performance tuning, and helping customers implement enterprise-wide integration strategies such as integration competency centers or leadership lean integration practices. Our consulting strategy is to provide specialized expertise on our products to enable our customers and partners to successfully implement and sustain business solutions using our integration platform. Our Professional Services consultants use a services methodology called Informatica Velocity to guide the successful implementation of our software. Our services
4
methodology reflects the best practices that Informatica has developed and refined through hundreds of successful projects. We have professional services staff in 19 countries.
Informatica University offers a comprehensive role-based curriculum of product and solution oriented education offerings to enable our worldwide customers and strategic partners to build proficiency in using our products. Informatica University delivers education services in more than 45 countries with over 60 course offerings through instructor led, virtual academy, and onDemand delivery options to make training accessible, flexible and cost effective. We have established the Informatica Certified Professional Program for PowerCenter, Informatica Data Quality, Informatica MDM and Informatica DSG, which has created a database of expert professionals with verifiable skills in the design and administration of Informatica-based systems.
Customers
Our customers represent a wide range of corporations and governmental and educational institutions. Our targeted markets include automotive, energy and utilities, entertainment/media, financial services, healthcare, insurance, manufacturing, public sector, retail, services, technology, telecommunications, and travel/transportation. Financial services remains our largest vertical industry sector. No single customer accounted for 10% or more of our total revenues in 2014, 2013, or 2012.
Sales, Marketing, and Distribution
We market and sell software and services through both our direct sales force and indirect channel partners. As of December 31, 2014, we employed 1,183 people in our sales and marketing organization worldwide. Over the past several years, we have expanded our presence and capabilities in a number of geographic regions. We currently have a direct sales presence in over 20 countries and an indirect presence, through distributors and partners, in over 80 countries. We market and sell our software and services through our sales operations in North and Latin America (including Brazil, Canada, Mexico, and the United States), Europe, Middle East and Africa (including Belgium, Denmark, France, Germany, Ireland, Israel, Italy, the Netherlands, Russia, South Africa, Spain, Sweden, Switzerland, Turkey, United Arab Emirates, and the United Kingdom), and Asia-Pacific (including Australia, China, Hong Kong, India, Japan, South Korea, Singapore, and Taiwan).
Sales and marketing programs are focused on creating awareness of Informatica and its products and services, generating interest among new customers as well as interest in new products within existing customers, documenting compelling customer references, and creating up-sell/cross-sell opportunities for our products. These programs are targeted at chief information officers and other key executives of specific functional areas such as marketing, sales, service, finance, human resources, manufacturing, distribution, and procurement as well as enterprise architects and other key IT professionals focused on data integration. Our marketing personnel engage in a variety of activities, including positioning our software products and services, conducting public relations programs, establishing and maintaining relationships with industry analysts, producing online campaigns, web content, and collateral that describes our products, services, and solutions, and generating qualified sales leads. Additionally, we utilize sales specialists and domain experts to facilitate our sales and marketing efforts and expand our customer opportunities.
Our global sales process consists of several phases: lead generation, opportunity qualification, needs assessment, product demonstration, proposal generation, and contract negotiation. Although the typical sales cycle requires three to nine months, some sales cycles have lasted substantially longer. In a number of instances, our relationships with systems integrators and other strategic partners have reduced sales cycles by generating qualified sales leads, making initial customer contacts, assessing needs prior to our introduction to the customers, and endorsing our products to the customers before their product selection. Also, partners have assisted in the creation of presentations and demonstrations, which we believe enhances our overall value proposition and competitive position.
In addition to our direct sales efforts, we distribute our products through systems integrators, resellers, distributors, and OEM partners in the United States and internationally. Systems integrators typically have expertise in vertical or functional markets. In some cases, they resell our products, bundling them with their broader service offerings. In other cases, they refer sales opportunities to our direct sales force for our products. Distributors sublicense our products and provide service and support within their territories. OEMs embed portions of our technology in their product offerings.
Partners
We maintain relationships with a variety of strategic partners to jointly develop, market, sell, recommend, and/or implement our solutions. We also have relationships with distributors and channel partners who resell and sublicense in various regions and industries, including the United States, Canada, Europe, Middle East, Africa, Asia-Pacific, and Latin America, and provide services and support within their territories.
Informatica’s partners include industry leaders in enterprise software, computer hardware, and systems integration. We offer a comprehensive strategic partner program for major companies in these areas so that they can provide sales and marketing leverage,
5
have access to required technology, and can furnish complementary products and services to our joint customers. As of December 31, 2014, more than 500 companies helped market, resell, implement, or offer Informatica's solution around the world.
Research and Development
As of December 31, 2014, we employed 1,237 people in our research and development organization and have 19 development centers in 10 countries. This team is responsible for the design, development, release and maintenance of our products. The group is organized into four disciplines: development, quality assurance, documentation, and product management. Members from each discipline, along with product marketing, form focus teams that work closely with sales, marketing, services, customers, and prospects to better understand market needs and user requirements. These teams utilize a well-defined agile software development methodology that we believe enables us to deliver products that satisfy real business needs for the global market while also meeting commercial quality expectations and minimizing schedule risk.
When appropriate, we also use third parties to expand the capacity and technical expertise of our internal research and development team. On occasion, we have licensed third-party technology. We believe this approach shortens time to market without compromising competitive position or product quality, and we plan to continue drawing on third-party resources as needed in the future.
Approximately 30% of Informatica’s research and development team is based in the United States and the remainder is based in Australia, Canada, Germany, India, Ireland, Israel, the Netherlands, Russia, and the United Kingdom. Our international development effort is intended to both increase development productivity and deliver innovative product capabilities. Our research and development expenditures, which are expensed as incurred, were $193.9 million in 2014, $165.9 million in 2013, and $143.6 million in 2012.
Competition
The market for our products is highly competitive, quickly evolving, and subject to rapidly changing technology, which may expand the alternatives to our customers for their data integration requirements. Our competitors may be able to respond more quickly to new or emerging technologies, technological trends, changes in customer requirements and industry consolidation. Moreover, competition from new and emerging technologies and changes in technological trends, particularly the shift to cloud-based solutions, has increased market confusion about the benefits of our products compared to other solutions. We must compete effectively, particularly on the basis of functionality and price, against a variety of different vendors offering existing data integration software products, vendors of new and emerging technologies, and hand-coded, custom-built data integration solutions.
We believe we currently compete on the basis of the breadth and depth of our products’ functionality as well as on the basis of price. Additionally, we compete on the basis of certain other factors, including neutrality, dependability, user efficiency, quality of products, services, support, and versatility. We believe that we currently compete favorably with respect to these factors. For a further discussion on competition, see “Risk Factors — If we do not compete effectively, our revenues may not grow and could decline” in Part I, Item 1A of this Report.
Seasonality and Backlog
Our business is influenced by seasonal factors, largely due to customer buying patterns. Generally, demand for our software products and services is highest in the fourth quarter and lowest in the first quarter of each year. The first and fourth quarters of 2013 and 2014 followed these seasonal trends. However, recent changes in our worldwide sales, marketing and field operations and continued macroeconomic trends make our future results more difficult to predict based on historical seasonality.
Our potential future revenues include backlog consisting primarily of (1) product orders (primarily perpetual licenses) that have not shipped as of the end of a given quarter, (2) product orders received from certain distributors, resellers, OEMs, and end users not included in deferred revenues, where revenue is recognized after cash receipt (collectively (1) and (2) above are referred as “aggregate backlog”), and (3) deferred revenues. See "Potential Future Revenues (New Orders, Backlog, and Deferred Revenue)" in Management's Discussion and Analysis of Financial Condition and Results of Operations in Part II, Item 7 of this Report, which is incorporated herein by reference.
Intellectual Property and Other Proprietary Rights
Our success depends in part upon our proprietary technology. We rely on a combination of patent, copyright, trademark and trade secret rights, confidentiality procedures, and licensing arrangements to establish and protect our proprietary rights. As part of our confidentiality procedures, we generally enter into non-disclosure agreements with our employees, distributors, and corporate partners and into license agreements with respect to our software, documentation, and other proprietary information. In addition, we have over 80 patents issued in a variety of jurisdictions. Our issued patents are scheduled to expire at various times through
6
May 2033. Where appropriate, we have also entered into patent cross-license agreements with third parties, thereby acquiring additional intellectual property rights which preserve our ability to pursue normal business activity and minimize our risks in entering new and adjacent technology markets.
Nonetheless, our intellectual property rights may not be successfully asserted in the future or may be invalidated, circumvented, or challenged. In addition, the laws of various foreign countries where our products are distributed do not protect our intellectual property rights to the same extent as U.S. laws. Our inability to protect our proprietary information could harm our business. For a further discussion of our intellectual property rights, see "Risk Factors - If we are not able to adequately protect our proprietary rights, third parties could develop and market products that are equivalent to our own, which would harm our sales efforts" in Part I, Item 1A of this Report.
Employees
As of December 31, 2014, we had a total of 3,664 employees, including 1,237 in research and development, 1,183 in sales and marketing, 826 in consulting, customer support, and education services, and 418 in general and administrative services. None of our employees is represented by a labor union. We have not experienced any work stoppages, and we consider employee relations to be good.
Additional Information
Informatica's corporate headquarters are located at 2100 Seaport Boulevard, Redwood City, California 94063, and the telephone number at that location is (650) 385-5000. We can also be reached at our Web site at www.informatica.com; however, the information in, or that can be accessed through, our Web site is not part of this Report. Informatica was incorporated in California in February 1993 and reincorporated in Delaware in April 1999.
Copies of annual reports on Form 10-K, quarterly reports on Form 10-Q, current reports on Form 8-K, and amendments to these reports pursuant to Section 13(a) or 15(d) of the Securities Exchange Act of 1934, as amended (the "Exchange Act") are available, free of charge, on Informatica's Web site as soon as reasonably practicable after we file such material electronically with the Securities and Exchange Commission ("SEC"). The SEC also maintains a Web site that contains our SEC filings. The address of the site is www.sec.gov. The public may also read and copy any materials we file with the SEC at the SEC's Public Reference Room at 100 F Street, NE, Washington DC, 20549. The public may obtain information on the operation of the Public Reference Room by calling the SEC at 1-800-SEC-0330.
ITEM 1A. RISK FACTORS
In addition to the other information contained in this Annual Report on Form 10-K, we have identified the following risks and uncertainties that may have a material adverse effect on our business, financial condition, or results of operation. Investors should carefully consider the risks described below before making an investment decision. The trading price of our common stock could decline due to any of these risks, and investors may lose all or part of their investment.
If we do not compete effectively, our revenues may not grow and could decline.
The market for our products is highly competitive, quickly evolving, and subject to rapidly changing technology, which may expand the alternatives available to our current and potential customers for their data integration requirements. Our competition consists of hand-coded, custom-built data integration solutions developed in-house by various companies in the industry segments that we target, large vendors of data integration software products (such as IBM, Microsoft, Oracle, SAP, and SAS Institute), certain privately held companies, alternate technologies, and open source solutions. From time to time, we compete with business intelligence and analytics vendors that offer, or may develop, products with functionalities that compete with our products.
Many of our competitors have longer operating histories, substantially greater financial, technical, marketing, and other resources, greater name recognition, specialized sales or domain expertise, broader product portfolios and stronger customer relationships than we do and may be able to exert greater influence on customer purchasing decisions. Our competitors may be able to respond more quickly than we can to new or emerging technologies, technological trends and changes in customer requirements. Our current and potential competitors may develop and market new technologies that render our existing or future products obsolete, unmarketable, or less competitive. In addition, new products or enhancements of existing products that we introduce may not adequately address or respond to new or emerging technologies, technological trends or changes in customer requirements. Moreover, competition from new and emerging technologies and changes in technological trends, particularly the shift to cloud-based solutions, has increased market confusion about the benefits of our products compared to other solutions. Also, new or emerging technologies, technological trends or changes in customer requirements may result in certain of our strategic partners becoming potential competitors in the future.
7
We believe we currently compete on the basis of the breadth and depth of our products' functionality, as well as on the basis of price. We may have difficulty competing on the basis of price in circumstances where our competitors develop and market products with similar or superior functionality and pursue an aggressive pricing strategy. For example, some of our competitors may provide guarantees of prices and product implementation, offer data integration products at no cost in order to charge a premium for additional functionality, or bundle data integration and data quality products at no cost to the customer or at deeply discounted prices for promotional purposes or as a long-term pricing strategy. These difficulties may increase as larger companies target the data integration markets. A customer may be unwilling to pay a separate cost for our data integration products if the customer has a bundled pricing arrangement with a larger company that offers a wider variety of products than us. As a result, increased competition, alternate pricing models and bundling strategies could seriously impede our ability to sell additional products and services on terms favorable to us.
In addition, consolidation among vendors in the software industry is continuing at a rapid pace. Our current and potential competitors may make additional strategic acquisitions, consolidate their operations, or establish cooperative relationships among themselves or with other solution providers, thereby increasing their ability to provide a broader suite of software products or solutions and more effectively address the needs of our current and prospective customers. Such acquisitions could cause customers to defer their purchasing decisions. Our current and potential competitors may also establish or strengthen cooperative relationships with our current or future strategic partners, thereby limiting our ability to sell products through these channels. If any of this were to occur, our ability to market and sell our software products would be impaired. In addition, competitive pressures could reduce our market share or require us to reduce our prices, either of which could harm our business, results of operations, and financial condition.
Furthermore, during periods of U.S. or global economic uncertainty, our customers' capital spending may be significantly reduced. As a result, there is significantly increased competition for the allocation of IT budget dollars, and other IT implementations may take priority over the use of our products and services.
Our success depends upon the introduction of new products, the integration of acquired products, and the enhancement of existing products.
Rapid technological changes, including changes in customer requirements and preferences, are characteristic in the software industry. In particular, in the market for enterprise data integration software and services, especially for broader data integration initiatives, we have experienced increased competition from new and emerging technologies and increased market confusion from our customers or prospective customers about the benefits of our products compared to other solutions. In order to address the expanding data integration needs of our customers and prospective customers, and to respond to rapid technological changes, technological trends and customer concerns, we introduce new products and technology enhancements on a regular basis, including products we acquire. For example, recently we launched Informatica Rev to empower business users to be self-sufficient in data integration and preparation for analytics, and in 2015 we plan to release Secure@Source, a new product that enables customers to discover and classify sensitive data and assess risks associated with data proliferation. We intend to continue increasing our investments to develop new products and product enhancements. The introduction of new products, integration of acquired products and enhancement of existing products, is a complex and costly process involving inherent risks, such as:
• | the failure to accurately anticipate the impact of new and emerging technologies or changes in technological trends; |
• | the failure to accurately anticipate changes in customer requirements and preferences; |
• | delays in completion, launch, delivery, or availability; |
• | delays in customer adoption or market acceptance; |
• | delays in customer purchases in anticipation of products not yet released; |
• | product quality issues, including the possibility of defects and the costs of remediating any such defects; |
• | market confusion based on changes to the product packaging and pricing as a result of a new product release; |
• | market confusion based on the introduction of new and emerging technologies by us and our competitors or changes in technological trends, particularly the shift to cloud-based solutions; |
• | interoperability and integration issues between our existing products and newly acquired products or technologies, and the costs of remediating any such issues; |
• | interoperability and integration issues with third-party technologies and the costs of remediating any such issues; |
• | customer issues with migrating or upgrading from previous product versions and the costs of remediating any such issues; |
• | loss of existing customers that choose a competitor's product instead of upgrading or migrating to the new or enhanced product; and |
• | loss of maintenance revenues from existing customers that do not upgrade or migrate. |
8
We devote significant resources to the development of new products, the acquisition of products, and the enhancement of existing products, as well as to the integration of these products with each other. In addition, as we develop new products, particularly those based on new or emerging technologies, we may need to develop sales and marketing strategies that differ from the strategies we currently utilize, which may result in increased levels of investment and additional costs. For example, we are continuing to evolve our business model to increase subscription revenue and aggressively investing in our go-to-market strategies for our newer products. We will offer certain of our newer products, such as Informatica Rev and Secure@Source, as well as enhancements for our Informatica Cloud products, on a subscription basis. In addition, we intend to significantly expand our subscription sales force and increase sales specialist staffing and marketing efforts. These go-to-market strategies and efforts, which may differ from those we utilize for our traditional perpetual licensed-based model for our on-premise software products, may be temporarily disruptive and result in reduced sales productivity in addition to increased costs. As a result of the risks involved, we cannot predict the impact on our overall sales from new or enhanced products, and we may not generate sufficient revenues from these products to justify their costs, which would adversely affect our competitive position and results of operations.
We may experience fluctuations in our quarterly operating results, especially in the amount of license revenues we recognize, which could cause our stock price to decline.
Our quarterly operating results, including our software revenues and particularly our license revenues, have fluctuated in the past and may do so in the future. These fluctuations have caused our stock price to decline and could cause our stock price to significantly fluctuate or decline in the future. Our license revenues, which are primarily sold on a perpetual license basis, are difficult to forecast accurately and are vulnerable to short-term shifts in customer demand. Also, we may experience order deferrals by customers in anticipation of future new product introductions or product enhancements, as well as a result of their particular budgeting and purchase cycles. The continued global economic and geopolitical uncertainty is also likely to cause further customer order deferrals or reductions, stricter customer purchasing controls and approval processes, and adversely affect budgeting and purchase cycles. By comparison, our short-term expenses are relatively fixed and based in part on our expectations of future revenues. In addition, our backlog of license orders at the end of a given fiscal period has tended to vary. Furthermore, we generally recognize a substantial portion of our license revenues in the last month of each quarter and, sometimes in the last few weeks or days of each quarter. As a result, we cannot predict the adverse impact caused by cancellations or delays in prospective orders until the end of each quarter. Moreover, the expansion of our product portfolio through the introduction of new products and enhancements has increased the complexity and size of our transactions. The likelihood of an adverse impact may be greater if we experience increased average transaction sizes due to a mix of relatively larger deals in our sales pipeline.
Due to the difficulty we experience in predicting our quarterly license revenues, we believe that quarter-to-quarter comparisons of our operating results are not necessarily a good indication of our future performance. In addition, a number of the other factors discussed in this section may cause fluctuations in our quarterly operating results. Our future operating results or forecasts of future operating results could fail to meet the expectations of stock analysts and investors. If any of these happen, the price of our common stock would likely fall.
If we are unable to accurately forecast sales and trends in our business, we may fail to meet expectations and our stock price could decline.
We use a “pipeline” system, a common industry practice, to forecast sales and trends in our business. Our sales personnel monitor the status of all potential sales of our products and estimate when a customer will make a purchase decision and the potential dollar amount of the sale. We aggregate these estimates periodically in order to generate a sales pipeline. We assess the pipeline at various points in time to look for trends in our business. While this pipeline analysis may provide us with some guidance in business planning and budgeting, these pipeline estimates are necessarily speculative. Our pipeline estimates may not consistently correlate to revenues in a particular quarter or over a longer period of time, particularly in a weak or uncertain global macroeconomic environment. In addition, our pipeline estimates can prove to be unreliable in a particular quarter or over a longer period of time, in part because both the “conversion rate” of the pipeline into actual sales and the quality and timing of pipeline generation can be very difficult to estimate. For example, in the second and third quarters of 2012, continued changes in our sales organization and challenges in our sales execution generally, together with the macroeconomic uncertainty in Europe, adversely affected our pipeline management capabilities, the reliability of our pipeline estimates, and, consequently, our pipeline conversion rate. In particular, in the third quarter of 2012, our pipeline conversion rate was significantly lower as compared to the second quarter of 2012. In addition, further sales execution challenges adversely affected our pipeline conversion rate in certain geographies and vertical industry sectors in 2014 as compared to 2013. While we have made further changes to our sales, marketing and field operations organizations, including the implementation of pipeline generation initiatives, more rigorous sales planning and process measures; in the near term, such actions may decrease the predictive value of our pipeline in assessing near term trends in our business or in comparison to historical trends.
The conversion of the sales pipeline into actual license or subscription sales may also be affected by the tendency of some of our customers to wait until the end of a fiscal period in the hope of obtaining more favorable terms, which can also impede our
9
ability to negotiate, execute and deliver on these contracts in a timely manner. Because we have historically recognized a substantial portion of our license revenues in the last month of each quarter and sometimes in the last few weeks of each quarter, we may not be able to adjust our cost structure in a timely manner in response to variations in the pipeline conversion rate. In addition, for newly acquired companies, we have limited ability to predict how their pipelines will convert into sales or revenues following acquisition. Any change in the conversion rate of the pipeline into customer sales or in the pipeline itself could cause us to improperly budget for future expenses that are in line with our expected future revenues, which would adversely affect our operating margins and results of operations and could cause the price of our common stock to decline.
A reduction in our sales pipeline and pipeline conversion rate could adversely affect the growth of our company and the price of our common stock.
In the past and recently, we have experienced a reduced conversion rate of our overall license pipeline, primarily as a result of general economic slowdowns and general macroeconomic uncertainty, which caused the amount of customer purchases to be reduced, deferred, or cancelled. Although the size of our sales pipeline and our pipeline conversion rate generally have increased as a result of our additional investments in sales personnel and a gradually improving IT spending environment, they are not consistent on a quarter-to-quarter basis. The recent global economic recession and continued macroeconomic uncertainty has had and will continue to have an adverse effect on our pipeline conversion rate in the near future. For example, our pipeline conversion rate decreased in certain geographies and vertical industry sectors in 2011, 2012 and 2014. If we are unable to continue to increase the size of our sales pipeline and our pipeline conversion rate, our results of operations could fail to meet the expectations of stock analysts and investors, which could cause the price of our common stock to decline.
We have expanded our international operations and opened new sales offices in other countries. We have experienced and may continue to experience various leadership transitions in our worldwide sales organization. We have also continued to make investments in our sales specialists and domain experts, and implemented changes in our worldwide sales, marketing and field operations to address recent sales execution challenges and improve performance, particularly with respect to our pipeline generation and management capabilities, the reliability of our pipeline estimates and our pipeline conversion rates. As a result of our international expansion and these changes, as well as the increase in our direct sales headcount in the United States, our sales and marketing expenses have increased. As our products become more complex and we target new customers for our software and services, we expect to broaden our go-to-market initiatives and, as a result, our expenses may increase. We expect these investments to increase our revenues, sales productivity, and eventually our profitability. However, if we experience an increase in sales personnel turnover, do not achieve expected increases in our sales pipeline, experience a decline in our sales pipeline conversion ratio, or do not achieve increases in productivity and efficiencies from our new sales personnel as they gain more experience, then we may not achieve our expected increases in revenue, sales productivity, and profitability.
The loss of our key personnel, an increase in our sales force personnel turnover rate or decrease in sales force productivity, or the inability to attract and retain additional personnel could adversely affect our ability to grow our company successfully and may negatively impact our results of operations.
We believe our success depends upon our ability to attract and retain highly skilled personnel and key members of our management team. Historically, there has been a significant level of competition to attract these individuals, and we have recently experienced significant changes in our senior management team. For example, we recently announced the appointment of a new chief financial officer in October 2014. We also announced the appointment of a new chief marketing officer in 2012, and a new chief product officer in 2013 and, in 2014, the promotion of our senior vice president of EMEA sales to be our new executive vice president of worldwide field operations and the transition of our former chief financial officer to his new role as chief customer officer and executive vice president, operations strategy. As new senior personnel join our company and become familiar with our business strategy and systems, or as existing senior personnel assume new roles within the company, their integration or transition could result in disruption to our ongoing operations.
The market for talent has become increasingly competitive and hiring has become more difficult and costly, and our personnel-related costs are likely to increase as we compete to attract and retain employees. Our employees are increasingly becoming more attractive to other companies. Many of our competitors have greater financial and other resources than us for attracting experienced personnel. Our plan for continued growth requires us to add personnel to meet our growth objectives and places increased importance on our ability to attract, train, and retain new personnel, in particular, new sales personnel. In addition, we intend to significantly expand our subscription sales force and increase sales specialist staffing and marketing efforts around our newer products. Continued leadership transitions in our worldwide sales, marketing and field operations, particularly in EMEA, may adversely affect our ability to manage and grow our business. For example, changes we implemented in customer segmentation in 2012 and sales territories adversely affected the quality of our pipeline estimates in 2012. In addition, the leadership transition in our EMEA sales organization adversely affected our pipeline management capabilities in 2012 and 2013. As we continue to implement further changes to our worldwide sales, marketing and field operations organizations, including the implementation of more rigorous sales planning and process measures and continued investment in sales specialists and domain experts, we may experience increased
10
sales force turnover and additional disruption to our ongoing operations, and we may not experience the increases in sales force productivity that we anticipate, particularly in EMEA. These changes may also take longer to implement than expected, which may adversely affect our sales force productivity. If we are unable to effectively attract and train new personnel on a timely basis, or if we experience an increase in the level of turnover, our results of operations may be negatively affected.
Furthermore, from time to time, we have experienced an increased level of turnover in our direct sales force, particularly in the first quarter of a year. Such increase in the turnover rate affects our ability to generate software revenues. Although we have hired replacements in our sales force and are continuing to hire additional sales personnel to grow our business, we typically experience lower productivity from newly hired sales personnel for a period of six to twelve months. We continue to invest in training for our sales personnel, including updates to cover new, acquired, or enhanced products, as we broaden our product platform. In addition, we periodically make adjustments to our sales organization in response to a variety of internal and external factors, such as market opportunities, competitive threats, management changes, product introductions or enhancements, acquisitions, sales performance, increases in sales headcount and cost levels. Such adjustments may be temporarily disruptive and result in reduced productivity. If we are unable to effectively attract, train and retain new sales personnel, particularly sales specialists or domain experts, or if we experience an increase in the level of sales force turnover or decrease in sales force productivity, our ability to generate license revenues and our growth rate may be negatively affected.
We currently do not have any key-man life insurance relating to our key personnel, and the employment of the key personnel in the United States is at will and not subject to employment contracts.
We have relied on our ability to grant equity awards as one mechanism for recruiting and retaining highly skilled talent. If we are unable to grant such awards, we may not be able to attract and retain outstanding and highly skilled individuals in the extremely competitive labor markets in which we compete.
Our subscription offering strategy may not be successful and may adversely affect our profitability.
We offer a variety of subscription offerings, including cloud data integration products and services that provide our customers with functionality within a cloud-based IT environment, and data-as-a-service offerings that we manage and offer via a subscription-based model. Our strategy and business model for these subscription offerings, which differs from our traditional perpetual license-based model for our on-premise software products, continue to evolve. For example, we are aggressively investing in our go-to-market strategies for our newer products. We will offer certain of our newer products, such as Informatica Rev and Secure@Source, as well as enhancements for our Informatica Cloud products, on a subscription basis. In addition, we intend to significantly expand our subscription sales force and increase sales specialist staffing and marketing efforts. These go-to-market strategies and efforts, which may differ from those we utilize traditionally for our on-premise software products, may be temporarily disruptive and result in reduced sales productivity in addition to increased costs. The market for subscription-based offerings, particularly for cloud-based solutions, is not as mature as the market for on-premise software products and it may not develop as anticipated. In addition, market acceptance of subscription-based offerings, particularly cloud-based solutions, may be affected by a variety of factors, including the data security, privacy, cost, reliability, performance and perceived value associated with such offerings. Many customers have invested substantial resources on traditional, perpetually licensed, on-premise software solutions and they may be unwilling or reluctant to migrate to cloud-based solutions or other subscription offerings. We may not be able to compete effectively or generate significant demand for or revenues from our subscription offerings. Also, demand for our subscription offerings may unfavorably impact demand for certain of our other products and services. In addition, our subscription offering strategy will require continued investment in product development and operations, including cloud-based IT infrastructure. We may incur costs at a higher than expected rate as we expand our subscription business, adversely affecting our profitability. In addition, we will incur costs associated with the investments in our subscription business in advance of our ability to recognize the revenue associated with our subscription offerings, which will have an adverse impact on our margins.
Subscription offerings may increase the difficulty of evaluating our future financial position.
With our subscription offerings, we generally recognize revenue from customers ratably over the terms of their subscription agreements. As a result, most of the subscription revenue we report in each quarter is the result of subscription agreements entered into during previous quarters. Consequently, a decline in subscriptions in any one quarter may not affect our results in that quarter, but could reduce revenue in future quarters. We may not be able to adjust our cost structure in response to changes in revenue. Accordingly, the effect of significant downturns in sales of our subscription offerings may not be fully reflected in our results of operations until future periods. Also, as revenue from new customers is recognized over the term of their subscription, it is difficult for us to rapidly increase revenue through additional sales in any period. In addition, if we sell certain elements of our subscription-based offerings together with our perpetual license-based products, we may not be able to recognize the revenue associated with the perpetually licensed products up-front, and we may be required to recognize such revenue ratably over the term of the subscription agreement. The timing of such revenue recognition may make it more difficult to forecast sales and trends in our business, particularly changes in revenue, and could have a potentially negative impact on our financial performance.
11
Furthermore, our customers have no obligation to renew their subscriptions after the expiration of their initial subscription period, and in fact, some customers have elected not to renew. As a result, we may not be able to accurately predict future renewal rates, and our customers’ renewal rates may decline or fluctuate as a result of a number of factors, including satisfaction with our subscription offerings, the prices of our subscription offerings and the prices offered by competitors, the perceived information security of our systems, reductions in customers’ spending levels and general economic conditions. If our customers do not renew their subscriptions, or if they renew on less favorable terms, our revenue may decline.
As a result of our lengthy sales cycles, our expected revenues are susceptible to fluctuations, which could cause us to fail to meet expectations, resulting in a decline in the price of our common stock.
Due to the expense, broad functionality, and company-wide deployment of our products, our customers' decisions to purchase our products typically require the approval of their executive decision makers. Also, macroeconomic uncertainty and global economic conditions can adversely affect the buying patterns of our customers and prospective customers, including the size of transactions, and lengthen our sales cycle. For example, in the second and third quarters of 2012, the macroeconomic uncertainty in Europe contributed to a delay in customer purchasing decisions and stricter customer purchasing controls and approval processes in EMEA. We experienced similar delays in customer purchasing decisions and increased approval processes in financial services and public sector transactions in North America in the second quarter of 2014. In addition, we frequently must educate our potential customers about the full benefits of our products, which also can require significant time. These trends toward greater customer executive level involvement or stricter customer purchasing controls and approval processes and increased customer education efforts are likely to increase, particularly as we expand our market focus to broader data integration initiatives and experience increased competition from new or emerging technologies. Further, our sales cycle may lengthen as we continue to focus our sales efforts on large corporations. In addition, the purchase of our products may be delayed, or our sales cycle may become more complex, due to potential conflicts in our sales channels and sales processes if we increasingly sell our subscription-based offerings together with our perpetual license-based products. As a result of these factors, the length of time from our initial contact with a customer to the customer's decision to purchase our products typically ranges from three to nine months. We are subject to a number of significant risks as a result of our lengthy sales cycle that could delay, reduce or otherwise adversely affect the purchase of our products, including:
• | changes in our customers' budgetary constraints and internal acceptance review procedures; |
• | the timing of our customers' budget cycles; |
• | the seasonality of technology purchases, which historically has resulted in stronger sales of our products in the fourth quarter of the year, especially when compared to lighter sales in the first quarter of the year; |
• | our customers' concerns about the introduction of our products; |
• | market confusion over the introduction of new or emerging technologies by us or our competitors or changes in technological trends, particularly the shift to cloud-based solutions; or |
• | potential downturns in general economic or political conditions or potential tightening of credit markets that could occur during the sales cycle. |
If our sales cycles lengthen unexpectedly, they could adversely affect the timing of our revenues or increase costs, which may independently cause fluctuations in our revenues and results of operations, adversely affecting the price of our common stock. Finally, if we are unsuccessful in closing sales of our products after spending significant funds and management resources, our operating margins and results of operations could be adversely impacted, and the price of our common stock could decline.
We may experience fluctuations in foreign currency exchange rates that could adversely impact our results of operations.
Our international sales and operations expose us to fluctuations in foreign currency exchange rates. An unfavorable change in the exchange rate of foreign currencies against the U.S. dollar would result in lower revenues when translated into U.S. dollars, although operating expenses would be lower as well. On occasion exchange rates have been particularly volatile and have affected quarterly revenue and profitability. Recent fluctuations in foreign currency exchange rates may negatively affect our revenues in the near term. For example, the recent strength of the U.S. dollar negatively affected our reported revenue for the fourth quarter of 2014, and we expect current exchange rate conditions to adversely impact our revenue growth for the first quarter and full year of 2015. As our international operations grow, if the current dramatic fluctuations in foreign currency exchange rates continue or increase, the effect of changes in foreign currency exchange rates could become material to revenue, operating expenses, and income.
Our international operations expose us to increased risks that could limit our future growth.
We have significant operations outside the United States, including sales and professional services operations, software development centers and customer support centers. We have recently expanded our presence and capabilities in a number of major
12
geographic regions, including Canada, Mexico, South America, Europe and the Middle East and Asia-Pacific, and we plan to continue such expansion. Our international operations are subject to numerous risks, including:
• | general economic and political conditions in these foreign markets; |
• | fluctuations in exchange rates between the U.S. dollar and foreign currencies; |
• | slower or impaired collections on accounts receivable; |
• | increased operating costs and wage inflation, particularly in India and Brazil; |
• | greater difficulty in protecting our ownership rights to intellectual property developed in foreign countries, which may have laws that materially differ from those in the United States; |
• | higher risk of unexpected changes in regulatory practices, tariffs, and tax laws and treaties; |
• | greater risk of a failure of our employees to comply with both U.S. and foreign laws, including antitrust regulations, the U.S. Foreign Corrupt Practices Act, the U.K. Bribery Act of 2010, and any trade regulations ensuring fair trade practices; |
• | increased expenses, delays and our limited experience in developing, testing and marketing localized versions of our products; |
• | increased competition from companies in the industry segments that we target or other vendors of data integration software products that are more established in a particular region than us; |
• | potential conflicts with our established distributors in countries in which we elect to establish a direct sales presence, or the inability to enter into or maintain strategic distributor relationships with companies in certain international markets where we do not have a local presence; |
• | our limited experience in establishing a sales, marketing and support presence and the appropriate internal systems, processes, and controls, particularly in Brazil, Russia, and Asia-Pacific (especially China, Japan, South Korea, and Taiwan); |
• | difficulties in recruiting, training, managing, and retaining our international staff, particularly our international sales management and sales personnel, which have adversely affected our ability to increase sales productivity, and the costs and expenses associated with such activities; |
• | differing business practices, which may require us to enter into software license agreements that include non-standard terms related to payment, maintenance rates, warranties, or performance obligations that may affect our ability to recognize revenue ratably; and |
• | communication delays between our main development and support center in California and our international development and support centers, which may delay the development, testing, release or support of new and existing products, and communication delays between our U.S. headquarters and our shared services center in India. |
These factors and other factors could harm our ability to gain future international revenues and, consequently, materially impact our business, results of operations, and financial condition. The expansion of our existing international operations and entry into additional international markets will require significant management attention and financial resources. Our failure to manage our international operations and the associated risks effectively could limit the future growth of our business.
Continued uncertainty in the U.S. and global economies, particularly Europe, along with uncertain geopolitical conditions, could negatively affect sales of our products and services and could harm our operating results, which could result in a decline in the price of our common stock.
As our business has grown, we have become increasingly subject to the risks arising from adverse changes in the domestic and global economies, particularly Europe. Revenues from Europe, the Middle East, and Africa (“EMEA”) accounted for approximately 23% and 22% of our total revenues in 2014 and 2013, respectively. We have experienced the adverse effect of economic slowdowns in the past, which resulted in a significant reduction in capital spending by our customers, as well as longer sales cycles and the deferral or delay of purchases of our products.
Uncertainty in the macroeconomic environment and associated global economic conditions, as well as geopolitical conditions, have resulted in extreme volatility in credit, equity, and foreign currency markets. In particular, economic concerns continue with respect to the European sovereign debt markets and potential ramifications of any U.S. debt, income tax and budget issues, including future delays in approving the U.S. budget or reductions in government spending. Such uncertainty and associated conditions have also resulted in volatility in various vertical markets, particularly the financial services and public sectors, which are typically two of the larger vertical sectors that we serve. For example, in 2010 and through the first three quarters of 2012, we experienced a decline in European public sector transactions, and we continue to expect uncertainty in Europe at least until the sovereign debt issues are resolved. In addition, we experienced a decline in financial services and public sector transactions in the second quarter of 2014 as compared to both the first quarter of 2014 and the second quarter of 2013. We expect financial services and public
13
sector transactions to continue to be volatile in the near term, particularly in North America, and as a result, growth in our business becomes more dependent on growth in other sectors in the U.S. and internationally.
These conditions have also adversely affected the buying patterns of our customers and prospective customers, including the size of transactions and length of sales cycles, and have adversely affected our overall pipeline conversion rate as well as our revenue growth expectations. For example, in the second and third quarters of 2012, the macroeconomic uncertainty in Europe contributed to a delay in customer purchasing decisions, stricter customer purchasing controls and approval processes, and a decline in our pipeline conversion rate. In addition, in the third quarter of 2013, we experienced weaker than expected results in Asia-Pacific. Furthermore, in the second quarter of 2014, we had fewer transactions over $1 million in the financial services and public sectors as compared to the first quarter of 2014. We expect these conditions, together with our recent sales execution challenges and our worldwide sales leadership transitions, will continue to adversely affect our results in the near term. If macroeconomic or geopolitical conditions continue to deteriorate or if the pace of recovery is slower or more uneven, our overall results of operations could be adversely affected, we may not be able to grow at the rates we have experienced in the past and we could fail to meet the expectations of stock analysts and investors, which could cause the price of our common stock to decline.
We continue to invest in our international operations. There are significant risks with overseas investments, and our growth prospects in these regions are uncertain. Increased volatility, further declines in the European credit, equity and foreign currency markets or geopolitical conditions could cause delays in or cancellations of European orders. For example, recent events in the Ukraine and Russia may adversely affect transactions in Eastern Europe, and could adversely affect greater EMEA transactions as well as U.S. and European public sector transactions if the geopolitical conditions do not stabilize in the future. Deterioration of economic or geopolitical conditions in the countries in which we do business could also cause slower or impaired collections on accounts receivable. In addition, we could experience delays in the payment obligations of our worldwide reseller customers if they experience weakness in the end-user market, which would increase our credit risk exposure and harm our financial condition.
We rely on our relationships with our strategic partners. If we do not establish, maintain and strengthen these relationships, our ability to generate revenue and control expenses could be adversely affected, which could cause a decline in the price of our common stock.
We believe that our ability to increase the sales of our products depends in part upon establishing, maintaining and strengthening relationships with our current strategic partners and any future strategic partners. In addition to our direct sales force, we rely on established relationships with a variety of strategic partners, such as systems integrators, resellers, and distributors, for marketing, licensing, implementing, and supporting our products in the United States and internationally. We also rely on relationships with strategic technology partners, such as enterprise application providers, database vendors, data quality vendors, and enterprise information integration vendors, for the promotion and implementation of our products. In addition, as we develop new products, particularly those based on new or emerging technologies, we may need to establish relationships with new strategic partners, including those that may differ from the types of strategic partners we currently have. We may not be able to successfully establish such relationships, which may adversely affect the market acceptance of our products. In addition, given our limited history with our newer strategic partners, we cannot be certain these relationships will result in significant increases in sales of our products, particularly our newer products.
Our strategic partners offer products from several different companies, including, in some cases, products that compete with our products. We have limited control, if any, as to whether these strategic partners devote adequate resources to promoting, selling, and implementing our products as compared to our competitors' products. Also, new or emerging technologies, technological trends or changes in customer requirements may result in certain of our strategic partners becoming potential competitors in the future. In addition, from time to time our strategic partners have acquired, and will likely continue to acquire, competitors of ours. Such consolidation makes it critical that we continue to develop, maintain and strengthen our relationships with other strategic partners. We may not be able to strengthen such relationships and successfully generate additional revenue.
In addition, we may not be able to maintain strategic partnerships or attract sufficient additional strategic partners who have the ability to market our products effectively, are qualified to provide timely and cost-effective customer support and service, or have the technical expertise and personnel resources necessary to implement our products for our customers. In particular, if our strategic partners do not devote sufficient resources to implement our products, we may incur substantial additional costs associated with hiring and training additional qualified technical personnel to implement solutions for our customers in a timely manner. Furthermore, our relationships with our strategic partners may not generate enough revenue to offset the significant resources used to develop these relationships. If we are unable to leverage the strength of our strategic partnerships to generate additional revenues, our revenues and the price of our common stock could decline.
Acquisitions present many risks, which could adversely affect our business, operating results and financial condition.
From time to time, we evaluate potential acquisitions in complementary businesses, products, or technologies. For example, we acquired StrikeIron in 2014, Active Endpoints in 2013, and Data Scout and TierData in 2012. Also, in the fourth quarter of
14
2012, we completed the takeover offer for Heiler Software, a publicly-traded German company. The squeeze-out of the remaining shareholders was effective in the second quarter of 2013, increasing our ownership to 100 percent. Certain minority shareholders of Heiler Software have initiated appraisal proceedings before the Stuttgart District Court for review of the adequacy of the cash compensation paid in connection with the squeeze-out. These proceedings may result in an increase of the cash compensation to be paid to minority shareholders if the court finds that the valuation underlying the cash compensation was too low.
Acquisitions involve a number of risks, including:
• | the failure to capture the value of the business we acquired, including the loss of any key personnel, customers and business relationships, including strategic partnerships, or the failure of the transaction to advance our business strategy as anticipated; |
• | the difficulties in and costs associated with successfully integrating or incorporating the acquired company's products, technologies, services, employees, customers, partners, business operations and administrative systems with ours, particularly when the acquired company operates in international jurisdictions; |
• | the disruption of our ongoing business and the diversion of management's attention by transition or integration issues; |
• | any difficulties in consolidating the acquired company's financial results with ours, in particular as a result of different accounting principles or financial reporting standards, and the adverse consequences to us of any delay in obtaining the necessary financial information for such consolidation, any unanticipated change in financial information previously reported to us, or the impact the acquired company's financial performance has on our financial performance as a result of such consolidation; |
• | the failure to accurately predict how the acquired company's pipeline will convert into sales or revenues following the acquisition, as conversion rates post-acquisition may be quite different from the acquired company's historical conversion rates and can be affected by changes in business practices that we implement; |
• | any inability to generate revenue from the acquired company's products in an amount sufficient to offset the associated acquisition and maintenance costs, including addressing issues related to the availability of offerings on multiple platforms and from cross-selling and up-selling our products to the acquired company's installed customer base or the acquired company's products to our installed customer base; and |
• | the failure to adequately identify or assess significant problems, liabilities or other issues, including issues with the acquired company's technology or intellectual property, product quality, data security, privacy practices, accounting practices, employees, customers or partners, regulatory compliance, or legal or financial contingencies, particularly when the acquired company operates in international jurisdictions. |
We may not be successful in overcoming these risks or any other problems encountered in connection with our acquisitions. To the extent that we are unable to successfully manage these risks, our business, operating results, or financial condition could be adversely affected, and the price of our common stock could decline.
In addition, the consideration paid in connection with an acquisition also affects our financial results. If we should proceed with one or more significant acquisitions in which the consideration includes cash, we could be required to use a substantial portion of our available cash to consummate any such acquisition. To the extent that we issue shares of stock or other rights to purchase stock, existing stockholders may be diluted and earnings per share may decrease. In addition, acquisitions may result in our incurring additional taxes, unforeseen or higher than expected costs, debt, material one-time write-offs, or purchase accounting adjustments including the write-down of deferred revenue and restructuring charges. They may also result in recording goodwill and other intangible assets in our financial statements which may be subject to future impairment charges or ongoing amortization costs, thereby reducing future earnings. In addition, from time to time, we may enter into negotiations for acquisitions or investments that are not ultimately consummated. Such negotiations could result in significant diversion of management time, as well as incurring expenses that may impact operating results.
A network or data security incident may compromise the integrity of our products or allow unauthorized access to our network or our customers' data, harm our reputation, create additional liability and adversely impact our financial results.
We make significant efforts to maintain the security and integrity of our product source code and computer systems. However, the threats to network and data security are increasingly diverse and sophisticated. In addition to traditional computer “hackers,” malicious code (such as viruses and worms), employee theft or misuse, and denial of service attacks, sophisticated nation-state and nation-state supported actors now engage in intrusions and attacks (including advanced persistent threat intrusions), and fundamental software vulnerabilities add to the risks to our products and computer systems, including our internal network, and the information they store and process. Despite significant efforts to create security barriers to such threats, it is virtually impossible for us to entirely mitigate these risks. Like all software products, our software is vulnerable to such incidents. The impact of such an incident could disrupt the proper functioning of our software products, cause errors in the output of our customers' work, allow unauthorized access to sensitive, proprietary or confidential information of ours or our customers and other destructive outcomes.
15
If this were to occur, our reputation may suffer, customers may stop buying our products, we could face lawsuits and potential liability and our financial performance could be negatively affected. In addition, as we continue to devote more resources to evaluate our systems and products for security vulnerabilities, the cost of addressing these vulnerabilities could reduce our operating margins. If we do not address security vulnerabilities or otherwise provide adequate security features in our products, certain customers, particularly government and other public sector customers, may delay or stop purchasing our products. Furthermore, the risks related to network or security incidents will increase as we continue to develop our cloud products and services, which may store, transmit and process our customers' sensitive, proprietary or confidential data, including personal or identifying information, in cloud-based IT environments. We also work with third party vendors to process credit card payments by our customers. Unauthorized access or security incidents, including the unauthorized disclosure of sensitive, proprietary or confidential data, such as credit card information, could expose us to loss of this data, litigation, indemnity obligations and significant other liabilities, which may adversely affect our business. In addition, we also have acquired a number of companies, products, services and technologies over the years. As a result, we may inherit additional IT security issues when we integrate these acquisitions.
If our products are unable to interoperate with hardware and software technologies developed and maintained by third parties that are not within our control, our ability to develop and sell our products to our customers could be adversely affected, which would result in harm to our business and operating results.
Our products are designed to interoperate with and provide access to a wide range of third-party developed and maintained hardware and software technologies, which are used by our customers. The future design and development plans of the third parties that maintain these technologies are not within our control and may not be in line with our future product development plans. We may also rely on such third parties, particularly certain third-party developers of database and application software products, to provide us with access to these technologies so that we can properly test and develop our products to interoperate with the third-party technologies. These third parties may in the future refuse or otherwise be unable to provide us with the necessary access to their technologies. In addition, these third parties may decide to design or develop their technologies in a manner that would not be interoperable with our own. The continued consolidation in the enterprise software market may heighten these risks. Furthermore, our expanding product line, including our combination of products delivered on a comprehensive, unified and open data integration platform makes maintaining interoperability more difficult as various products may have different levels of interoperability and compatibility, which may change from version to version. If any of the situations described above were to occur, we would not be able to continue to market our products as interoperable with such third-party hardware and software, which could adversely affect our ability to successfully sell our products to our customers.
If our products and services do not achieve and/or maintain broad market acceptance, our revenues and revenue growth rate may be adversely affected.
Historically, a significant portion of our revenues have been derived from sales of our traditional data integration products, such as PowerCenter and PowerExchange, and related services. We expect sales of our traditional data integration products and services to comprise a significant portion of our revenues for the foreseeable future. If these products and services do not maintain market acceptance, our revenues may decrease.
In addition to our traditional data integration and data quality products, we have expanded our platform to include products and services in the emerging market for broader data integration initiatives, such as cloud data integration, data-as-a-service, big data, MDM, data security, data exchange, and data preparation, among others. The market for our broader data integration products and services remains relatively new and continues to change, and efforts to expand beyond our traditional data integration products may not succeed and may not result in significant revenue. For example, we recently announced that we are increasing our investments to develop new products that continue to expand our offerings beyond our traditional data integration products. Our newer products may not achieve market acceptance if our customers or prospective customers:
• | do not fully value the benefits of using our products; |
• | do not achieve favorable results using our products; |
• | use their budgets for other products that have priority over our products; |
• | defer or decrease product purchases due to macroeconomic uncertainty or global economic conditions; |
• | experience technical difficulties in implementing our products; or |
• | use alternative methods to solve the problems addressed by our products. |
Market acceptance of our products may also be affected if, among other things, competition substantially increases in the data integration market or transactional applications suppliers integrate their products to such a degree that the utility of the functionality that our products and services provide is minimized or rendered unnecessary. Market acceptance of our products may also be affected by customer confusion surrounding the introduction of new and emerging technologies by us and our competitors or changes in technological trends, particularly the shift to cloud-based solutions, and confusion about the benefits of our products compared to other solutions. In addition, in order to enable our sales personnel and our external distribution channels to sell these
16
newer products effectively, we have continued to invest resources and incur additional costs in training programs on new product functionalities, key differentiators, and key business values. If these newer products do not achieve market acceptance, our revenues could be adversely affected and our revenue growth rate, profitability and stock price could decline.
If we are unable to successfully respond to technological advances and evolving industry standards, we could experience a reduction in our future product sales, which would cause our revenues to decline.
The market for our products is characterized by continuing technological development, the emergence of new technologies, evolving industry standards, changing customer needs, and frequent new product introductions and enhancements. The introduction of products by our direct competitors or others incorporating new technologies, the emergence of new industry standards, or changes in customer requirements could render our existing products obsolete, unmarketable, or less competitive. In addition, industry-wide adoption or increased use of hand-coding, open source standards or other uniform open standards across heterogeneous applications could minimize the importance of the integration functionality of our products and materially adversely affect the competitiveness and market acceptance of our products. Furthermore, the standards on which we choose to develop new products or enhancements may not allow us to compete effectively for business opportunities.
Our success depends upon our ability to enhance existing products, to respond to changing customer requirements, and to develop and introduce in a timely manner new products that keep pace with technological and competitive developments and emerging industry standards. We have in the past experienced delays in releasing new products and product enhancements and may experience similar delays in the future. As a result, in the past, some of our customers deferred purchasing our products until the next upgrade was released. Future delays or problems in the installation or implementation of our new releases may cause customers to forgo purchases of our products and purchase those of our competitors instead. Additionally, even if we are able to develop new products and product enhancements, we cannot ensure that they will achieve market acceptance.
Any significant defect, error or performance failure in our software or services could cause us to lose revenue and expose us to product liability claims.
The software and services we offer are inherently complex and, despite extensive testing and quality control, have in the past and may in the future contain defects or errors, especially when first introduced, or not perform as contemplated. These defects, errors or performance failures could cause damage to our reputation, loss of customers or revenue, product returns, order cancellations, service terminations, or lack of market acceptance of our software and services. As the use of our software and services, including software or services recently acquired or developed, expands to more sensitive, secure, or mission critical uses by our customers, we may be subject to increased scrutiny, potential reputational risk, or potential liability should our software or services fail to perform as contemplated in such deployments. We have in the past and may in the future need to issue corrective releases of our software or services to fix these defects, errors or performance failures, which could require us to allocate significant research and development and customer support resources to address these problems.
Our license agreements with our customers typically contain provisions designed to limit our exposure to potential product liability claims. However, the limitation of liability provisions contained in our license agreements may not be effective as a result of existing or future national, federal, state, or local laws or ordinances or unfavorable judicial decisions. Although we have not experienced any product liability claims to date, the sale and support of our products entail the risk of such claims, which could be substantial in light of the use of our products in enterprise-wide environments. In addition, our insurance against product liability may not be adequate to cover a potential claim.
We are currently facing and may face future intellectual property infringement claims that could be costly to defend and result in our loss of significant rights.
As is common in the software industry, we have received and may continue from time to time receive notices from third parties claiming infringement by our products of third-party patent and other proprietary rights. As the number of software products in our target markets increases and the functionality of these products further overlaps, we may become increasingly subject to claims by a third party that our technology infringes such party's proprietary rights. In addition, there is a growing occurrence of patent suits being brought by organizations that use patents to generate revenue without manufacturing, promoting, or marketing products or investing in research and development in bringing products to market. These organizations have been increasingly active in the enterprise software market and have targeted whole industries as defendants. For example, in 2007, JuxtaComm Technologies filed a complaint alleging patent infringement against us and various defendants, and in 2008 and 2010, Data Retrieval Technologies LLC filed complaints alleging patent infringement against us and another company. While we settled both these matters, we continue to defend ourselves against additional claims of patent infringement. For example, in September 2013, Protegrity filed a complaint alleging patent infringement against us.
Any claims, with or without merit, could be time consuming, result in costly litigation, cause product shipment delays, or require us to enter into royalty or licensing agreements, any of which could adversely affect our business, financial condition, and
17
operating results. Although we do not believe that we are currently infringing any proprietary rights of others, additional legal action claiming patent infringement could be commenced against us. We may not prevail in such litigation given the complex technical issues and inherent uncertainties in patent litigation. The potential effects on our business that may result from third-party infringement claims include the following:
• | we could be and have been obligated to incur significant legal costs and expenses defending the patent infringement suit; |
• | we may be forced to enter into royalty or licensing agreements, which may not be available on terms favorable to us; |
• | we may be required to indemnify our customers or obtain replacement products or functionality for our customers; |
• | we may be forced to significantly increase our development efforts and resources to redesign our products as a result of these claims; and |
• | we may be forced to discontinue the sale of some or all of our products. |
If we are not able to adequately protect our proprietary rights, third parties could develop and market products that are equivalent to our own, which would harm our sales efforts.
Our success depends upon our proprietary technology. We believe that our product development, product enhancements, name recognition, and the technological and innovative skills of our personnel are essential to establishing and maintaining a technology leadership position. We rely on a combination of patent, copyright, trademark, and trade secret rights, confidentiality procedures, and licensing arrangements to establish and protect our proprietary rights.
However, these legal rights and contractual agreements may provide only limited protection. Our pending patent applications may not be allowed or our competitors may successfully challenge the validity or scope of any of our issued patents or any future issued patents. Our patents alone may not provide us with any significant competitive advantage, and third parties may develop technologies that are similar or superior to our technology or design around our patents. Third parties could copy or otherwise obtain and use our products or technology without authorization or develop similar technology independently. We cannot easily monitor any unauthorized use of our products, and, although we are unable to determine the extent to which piracy of our software products exists, software piracy is a prevalent problem in our industry in general. We may be forced to initiate litigation to protect our proprietary rights. Litigating claims related to the enforcement of proprietary rights is very expensive and can be burdensome in terms of management time and resources, which could adversely affect our business and operating results. In addition, the risk of not adequately protecting our proprietary technology and our exposure to competitive pressures may be increased if a competitor should resort to unlawful means in competing against us.
We have entered into agreements with many of our customers and partners that require us to place the source code of our products into escrow. Such agreements generally provide that such parties will have a limited, non-exclusive right to use such code if: there is a bankruptcy proceeding by or against us; we cease to do business; or we fail to meet our support obligations. Although our agreements with these third parties limit the scope of rights to use of the source code, we may be unable to effectively control such third parties' actions.
Furthermore, effective protection of intellectual property rights is unavailable or limited in various foreign countries. The protection of our proprietary rights may be inadequate and our competitors could independently develop similar technology, duplicate our products, or design around any patents or other intellectual property rights we hold.
A portion of our revenue is generated by sales to government entities, which are subject to a number of challenges and risks.
Sales to U.S. and foreign federal, state, and local governmental agency end-customers have accounted for a portion of our revenue, and we may in the future increase sales to government entities. However, government entities have recently announced reductions in, or experienced increased pressure to reduce, government spending. In particular, such measures have adversely affected European public sector transactions. Furthermore, the continued U.S. debt, income tax and budget issues, including future delays in approving the U.S. budget or reductions in government spending, may adversely impact future U.S. public sector transactions. Such budgetary constraints or shifts in spending priorities of government entities may adversely affect sales of our products and services to such entities. We expect these conditions to continue to adversely affect public sector transactions in the near-term.
In addition, sales to government entities are subject to a number of risks. Selling to government entities can be highly competitive, expensive and time consuming, often requiring significant upfront time and expense without any assurance that we will successfully sell our products to such governmental entity. Government entities may require contract terms that differ from our standard arrangements. Government contracts may require the maintenance of certain security clearances for facilities and employees which can entail administrative time and effort possibly resulting in additional costs and delays. In addition, government demand and payment for our products may be more volatile as they are affected by public sector budgetary cycles, funding authorizations, and the potential for funding reductions or delays, making the time to close such transactions more difficult to
18
predict. This risk is enhanced as the size of such sales to the government entities increases. As the use of our products, including products recently acquired or developed, expands to more sensitive, secure or mission critical uses by our government customers, we may be subject to increased scrutiny, potential reputational risk, or potential liability should our products fail to perform as contemplated in such deployments or should we not comply with the terms of our government contracts or government contracting requirements.
Most of our sales to government entities have been made indirectly through providers that sell our products. Government entities may have contractual or other legal rights to terminate contracts with our providers for convenience or due to a default, and any such termination may adversely impact our future results of operations. For example, if the provider receives a significant portion of its revenue from sales to such governmental entity, the financial health of the provider could be substantially harmed, which could negatively affect our future sales to such provider. Governments routinely audit and investigate government contractors, and we may be subject to such audits and investigations. If an audit or investigation uncovers improper or illegal activities, including any misuse of confidential or classified information by our employees, we may be subject to civil or criminal penalties and administrative sanctions, including termination of contracts, forfeiture of profits, suspension of payments, fines, and suspension or prohibition from doing business with such government entity. In addition, we could suffer serious reputational harm if allegations of impropriety were made against us or our employees or should our products not perform as contemplated in government deployments.
We recognize revenue from specific customers at the time we receive payment for our products, and if these customers do not make timely payment, our revenues could decrease.
Based on limited credit history, we recognize revenue from direct end users, resellers, distributors, and OEMs that have not been deemed creditworthy when we receive payment for our products and when all other criteria for revenue recognition have been met, rather than at the time of sale. We have seen certain customers lengthen their payment cycles as a result of the continued difficult macroeconomic environment. As our business grows, if these customers and partners do not make timely payment for our products, our revenues could decrease. If our revenues decrease, the price of our common stock may fall.
We rely on a number of different distribution channels to sell and market our products. Any conflicts that we may experience within these various distribution channels could result in confusion for our customers and a decrease in revenue and operating margins.
We have a number of relationships with resellers, systems integrators, and distributors that assist us in obtaining broad market coverage for our products and services. Although our discount policies, sales commission structure, and reseller licensing programs are intended to support each distribution channel with a minimum level of channel conflicts, we may not be able to minimize these channel conflicts in the future. Any channel conflicts that we may experience could result in confusion for our customers and a decrease in revenue and operating margins.
Our effective tax rate is difficult to project, and changes in such tax rate or adverse results of tax examinations could adversely affect our operating results.
We are a United States-based multinational company subject to tax in multiple U.S. and foreign tax jurisdictions. A significant portion of our foreign earnings for the current year were earned by our Netherlands and other European subsidiaries. Our results of operations would be adversely affected to the extent that our geographical mix of income becomes more weighted toward jurisdictions with higher tax rates and would be favorably affected to the extent the relative geographic mix shifts to lower tax jurisdictions. Any change in our mix of earnings is dependent upon many factors and is therefore difficult to predict.
The process of determining our anticipated tax liabilities involves many calculations and estimates that are inherently complex and make the ultimate tax obligation determination uncertain. As part of the process of preparing our consolidated financial statements, we are required to estimate our income taxes in each of the jurisdictions in which we operate prior to the completion and filing of tax returns for such periods. This process requires estimating both our geographic mix of income and our current tax exposures in each jurisdiction where we operate. These estimates involve complex issues, require extended periods of time to resolve, and require us to make judgments, such as anticipating the outcomes of audits with tax authorities and the positions that we will take on tax returns prior to actually preparing the returns. We also determine the need to record deferred tax liabilities and the recoverability of deferred tax assets. A valuation allowance is established to the extent recovery of deferred tax assets is not likely based on our estimation of future taxable income and other factors in each jurisdiction.
Furthermore, our overall effective income tax rate and tax expenses may be affected by various factors in our business, including acquisitions, changes in our legal structure, changes in the geographic mix of income and expenses, changes in valuation allowances, and changes in applicable tax laws and accounting pronouncements. For example, in December 2014, the federal research and development tax credit was reinstated retroactively to January 1, 2014. Due to the timing of the enactment, we recognized the entire federal research and development credits benefit for the year in the fourth quarter of 2014. Moreover, several
19
countries in which we operate are considering legislation which could impact the taxation of our foreign earnings. Further, the geographic mix of income and expense is impacted by the fluctuation in exchange rates between the U.S. dollar and the functional currencies of our subsidiaries.
We are under examination by various taxing authorities covering the past several years. We may receive additional assessments from domestic and foreign tax authorities that might exceed amounts reserved by us. In the event we are unsuccessful in reducing the amount of such assessment, our business, financial condition, or results of operations could be adversely affected. Specifically, if additional taxes and/or penalties are assessed as a result of these audits, there could be a material effect on our income tax provision, operating expenses, and net income in the period or periods when that determination is made.
As our business expands, we are subject to increasingly complex regulatory and compliance obligations and differing business practices, both foreign and domestic, which may strain our resources and divert management's attention.
During the past few years, our organizational structure has increased in complexity due to compliance with financial reporting obligations, tax regulations and tax accounting requirements, acquisitions, and other regulatory and compliance requirements, including compliance with the rules and regulations related to the Sarbanes-Oxley Act of 2002 and anti-corruption and anti-bribery laws such as the U.S. Foreign Corrupt Practices Act (the “FCPA”) and the UK Bribery Act of 2010 (the “UK Bribery Act”). In addition, new or changing rules and regulations, including those relating to corporate governance, securities laws and public disclosure, often create uncertainty for public companies, increasing legal and financial compliance costs and making some activities more time consuming. These practices may evolve over time upon new guidance from regulatory or governing bodies, resulting in continued uncertainty regarding compliance and higher costs to adopt or modify our practices accordingly. Also, as we expand internationally, we become subject to the various rules and regulations of foreign jurisdictions. If we are unable to effectively comply with the rules and regulations applicable to us, particularly those relating to financial reporting, investors may lose confidence in our ability to manage our compliance obligations, which would have an adverse effect on our stock price. Furthermore, we continue to develop our cloud products and services, which may store, transmit and process our customers' sensitive, proprietary or confidential data, including personal or identifying information, in cloud-based IT environments. These new cloud products and services may expose us to higher regulation than our traditional on-premise products and services, particularly with respect to privacy and data security. Privacy laws are changing and evolving globally, and many countries have more stringent data protection laws than those in the U.S. As a result, new cloud products and services may increase our liability exposure, compliance requirements and costs associated with privacy and data security issues. Our efforts to comply with all of these requirements may result in an increase in expenses and a diversion of management's time and attention from other business activities. If our efforts to comply differ from those intended by regulatory or governing bodies, such authorities may initiate proceedings against us and our business may be harmed.
Further, we have expanded our presence in the Asia-Pacific region, where business practices can differ from those in other regions of the world and can create internal control risks. To address potential risks, we recognize revenue on transactions derived in this region (except for direct sales in Japan and Australia) only when the cash has been received and all other revenue recognition criteria have been met. We also provide business practices training to our sales teams. Overall, the combination of increased structural complexity and the ever-increasing regulatory complexity make it more critical for us to attract and retain qualified and technically competent employees in the United States and internationally.
We may not be able to successfully manage the growth of our business if we are unable to scale our operations and improve our internal systems, processes, and controls.
We continue to experience growth in our customer base and operations, which may place a strain on our management, administrative, operational and financial infrastructure. We anticipate that additional investments in our infrastructure will be necessary to scale our operations and increase productivity. These additional investments will increase our costs, and may adversely affect our operating margins if we are unable to sufficiently increase revenues to cover these additional costs. If we are unable to successfully scale our operations and increase productivity, we may be unable to execute our business strategies. Also, we have substantial real estate commitments, both leased and owned, in the United States and internationally. Our business has grown in recent years through internal expansion and through acquisitions, and we expect such growth to continue. As a result, we may need to enter into additional lease commitments, expand existing facilities, or purchase new facilities or undeveloped real estate, which may adversely affect our cash flows and results of operations. For example, in February 2012 we purchased the property associated with our former corporate headquarters in Redwood City, California, for approximately $148.6 million, which reflects a purchase price of $153.2 million less a rent credit of $4.6 million. We relocated our corporate headquarters to these facilities in the third quarter of 2013.
In advance of our relocation, we also moved our existing data center from our corporate headquarters to an external third party facility. We also utilize other third party data center facilities to host certain of our services, systems and data. If any of these third party facilities become unavailable due to outages, interruptions or other unanticipated problems, or because they are no
20
longer available on commercially reasonable terms or prices, our costs may increase and our operations may be impaired, which would adversely affect our business.
In addition, we need to continue to improve our internal systems, processes, and controls to effectively manage our operations and growth, including our international growth into new geographies, particularly the Asia-Pacific and Latin American markets. We are continually investing resources to upgrade and improve our internal systems, processes and controls in order to meet the growing requirements of our business. For example, we have recently upgraded our human resources information systems and our enterprise resource planning systems. Upgrades or improvements to our internal systems, processes, and controls may require us to implement incremental reconciliation or additional reporting measures to evaluate the effectiveness of such upgrade or improvement, or to adopt new processes or procedures in connection with the upgrade or improvement. We may not be able to successfully implement upgrades and improvements to our systems, processes, and controls in an efficient or timely manner, and we may discover deficiencies in existing systems, processes, and controls, which could adversely affect our business. We have licensed technology and utilized support services from various third parties to help us implement upgrades and improvements. We may experience difficulties in managing upgrades and improvements to our systems, processes, and controls or in connection with third-party software, which could disrupt existing customer relationships, causing us to lose customers, limit us to smaller deployments of our products, or increase our technical support costs. The support services available for such third-party technology also may be negatively affected by mergers and consolidation in the software industry, and support services for such technology may not be available to us in the future. In addition, we use both on-premise and cloud resources, and any security or other flaws in such resources could have a negative impact on our internal systems, processes, or controls.
We may also need to realign resources from time to time to more efficiently address market or product requirements. To the extent any realignment requires changes to our internal systems, processes, and controls or organizational structure, we could experience disruption in customer relationships, increases in cost, and increased employee turnover. Furthermore, as we expand our geographic presence and capabilities, we may also need to implement additional or enhance our existing systems, processes and controls to ensure compliance with U.S. and international laws.
Changes in existing financial accounting standards or practices may adversely affect our results of operations.
We prepare our consolidated financial statements in accordance with accounting principles generally accepted in the United States of America (“GAAP”). Changes in existing accounting rules or practices, including the possible conversion to unified international accounting standards, new accounting pronouncements, or varying interpretations of current accounting pronouncements could have a significant adverse effect on our results of operations or the manner in which we conduct our business. For example, the adoption of Financial Accounting Standards Board's (“FASB”) Accounting Standards Codification 718, Stock Compensation, has had a significant adverse impact on our consolidated results of operations as it has increased our operating expenses and the number of diluted shares outstanding and reduced our operating income and diluted earnings per share. Further, we may not be able to accurately forecast the effect of stock-based compensation on our operating income, net income, and earnings per share because the underlying assumptions, including volatility, interest rate, and expected life, of the Black-Scholes-Merton option pricing model could vary over time.
In addition, the FASB is currently working together with the International Accounting Standards Board (“IASB”) to converge certain accounting principles and facilitate more comparable financial reporting between companies who are required to follow GAAP and those who are required to follow International Financial Reporting Standards (“IFRS”). These projects may result in different accounting principles under GAAP, which may have a material impact on the way in which we report financial results in areas including, but not limited to, principles for revenue recognition and lease accounting. For example, the FASB issued a new financial accounting standard for revenue recognition in May 2014 - Accounting Standards Update ( ASU) 2014-09, "Revenue from Contracts with Customers (Topic 606)" - that supersedes nearly all existing U.S. GAAP revenue recognition guidance. The standard will be effective for us in the first quarter of 2017 and early adoption is not permitted. Although we are currently in the process of evaluating the impact of ASU 2014-09 on our consolidated financial statements, it could change the way we account for certain of our sales transactions and may require the implementation of additional systems prior to our adoption of this accounting standard that may result in additional operating costs. Adoption of the standard could have a significant impact on our financial statements and may retroactively affect the accounting treatment of transactions completed before adoption. Furthermore, a change in accounting principles from GAAP to IFRS may have a material impact on our financial statements. A change in existing financial accounting standards or practices may even retroactively adversely affect previously reported transactions. It is not clear if we have the proper systems and controls in place to accommodate such changes.
Our business could be negatively affected as a result of activist stockholders.
An activist investor, Elliott Associates and its affiliates, recently took an ownership position in our common stock and initiated communications with us. Responding to actions by an activist stockholder can be costly and time-consuming, disrupt our operations and divert the attention of management and our employees. Additionally, perceived uncertainties as to our future direction as a
21
result of stockholder activism or changes to the composition of our board of directors may lead to the perception of a change in the direction of our business or other instability, which may be exploited by our competitors, cause concern to our current or potential customers, and make it more difficult to attract and retain qualified personnel. If customers choose to delay, defer or reduce transactions with us or do business with our competitors instead of us because of any such issues, then our business, operating results, and financial condition would be adversely affected. In addition, our stock price may experience periods of increased volatility as a result of stockholder activism.
The price of our common stock fluctuates as a result of factors other than our operating results, such as volatility in the capital markets and the actions of our competitors and securities analysts, as well as developments in our industry and changes in accounting rules.
The market price for our common stock has experienced significant fluctuations and may continue to fluctuate significantly. The market price for our common stock may be affected by a number of factors other than our operating results, including:
• | volatility in the capital markets; |
• | the announcement of new products or product enhancements by our competitors; |
• | quarterly variations in our competitors' results of operations; |
• | changes in earnings estimates and recommendations by securities analysts; |
• | developments in our industry; and |
• | changes in accounting rules. |
After periods of volatility in the market price of a particular company's securities, securities class action litigation has often been brought against that particular company. Such actions could cause the price of our common stock to decline.
Our credit agreement contains certain restrictions that may limit our ability to operate our business.
In September 2014, we entered into a credit agreement for an unsecured revolving credit facility in an amount of up to $220.0 million, with an option for us to request to increase the revolving loan commitments or to enter into tranches of term loans by an aggregate amount of up to $30.0 million with new or additional commitments, for a total credit facility of up to $250.0 million. No amounts were outstanding under the credit agreement as of December 31, 2014. The credit agreement contains affirmative and negative covenants, including covenants that may limit or restrict our and our subsidiaries' ability to, among other things, incur indebtedness, grant liens, merge or consolidate, dispose of assets, make investments, make acquisitions, enter into hedging agreements, enter into certain transactions with affiliates, pay dividends or make distributions, repurchase stock, enter into restrictive agreements and enter into sale and leaseback transactions, in each case subject to customary exceptions for a credit facility of this size and type. We are also required to maintain compliance with a consolidated leverage ratio and a consolidated interest coverage ratio. We were in compliance with all covenants under the credit agreement as of December 31, 2014. Our ability to comply with these covenants is dependent on our future performance, which will be subject to many factors, some of which are beyond our control, including prevailing economic conditions. The breach of any of these covenants for any reason could result in an event of default under our credit facility. The credit agreement also contains events of default that, include among other things, non-payment defaults, inaccuracy of representations and warranties, covenant defaults, cross default to material indebtedness, bankruptcy and insolvency defaults, material judgment defaults, ERISA defaults and a change of control default. If such an event of default occurs, all of our outstanding debt thereunder, if any, could become immediately due and payable, which could result in a default under any other outstanding debt that we may have incurred and could lead to an acceleration of the obligations related to such other outstanding debt. The existence of such a default could preclude us from borrowing funds under our credit facility. Any such default under our credit facility, if not cured or waived, could have a material adverse effect on us. If our cash is utilized to repay any outstanding debt, depending on the amount of debt outstanding, we could experience an immediate and significant reduction in working capital available to operate our business. Even if we are able to comply with all of the applicable covenants under our credit facility, the restrictions on our ability to operate our business could adversely affect our business by, among other things, limiting our ability to take advantage of financings, mergers, acquisitions, investments and other corporate opportunities that may be beneficial to the business.
Our investment portfolio is subject to credit and liquidity risks and fluctuations in the market value of our investments and interest rates, which may result in impairment or loss of value of our investments, an inability to sell our investments or a decline in interest income.
We maintain an investment portfolio, which consists primarily of certificates of deposit, commercial paper, corporate notes and bonds, money market funds, time deposits, municipal securities, U.S. government and agency notes and bonds, and equity securities. Although we follow an established investment policy, which specifies credit quality standards for our investments and limits the amount of credit exposure to any single issue, issuer, or type of investment, and other criteria in order to help mitigate our exposure to interest rate and credit risk, the assets in our investment portfolio may lose value or become impaired, or our
22
interest income may decline. We may be required to record impairment charges for other-than-temporary declines in fair market value in our investments. Future fluctuations in economic and market conditions could adversely affect the market value of our investments, and we could record additional impairment charges and lose some of the principal value of investments in our portfolio. A total loss of an investment or a significant decline in the value of our investment portfolio could adversely affect our operating results and financial condition. For information regarding interest rate risk, see “Quantitative and Qualitative Disclosures About Market Risk” in Part II, Item 7A of this Report.
In addition, from time to time we make strategic investments in private companies. Our strategic investments in private companies are subject to risk of loss of investment capital. For example, we realized a $2.0 million loss on an equity interest during the fourth quarter of 2014. Some of these investments may have been made to further our strategic objectives and support our key business initiatives. Our strategic investments in private companies are inherently risky because the markets for the technologies they have under development are typically in the early stages and may never materialize. We could lose the value of our entire investment in these companies.
Business interruptions could adversely affect our business.
Our operations are vulnerable to interruption by fire, earthquake, power loss, telecommunications or network failure, and other events beyond our control. We have prepared a detailed disaster recovery plan which includes the use of internal and external resources and will continue to expand the scope over time. Disasters or disruptions, such as the March 2011 earthquake and tsunami off the coast of Japan and the December 2006 earthquake off the coast of Taiwan, can negatively affect our operations given necessary interaction among our international facilities. For example, the December 2006 Taiwan earthquake resulted in a major fiber outage, which affected network connectivity in some of our facilities in Asia-Pacific. In the event such an earthquake or any other natural disaster or man-made failure occurs, it could disrupt the operations of our affected facilities and recovery of our resources. In addition, we do not carry sufficient business interruption insurance to compensate us for losses that may occur, and any losses or damages incurred by us could have a material adverse effect on our business.
Delaware law and our certificate of incorporation and bylaws contain provisions that could deter potential acquisition bids, which may adversely affect the market price of our common stock, discourage merger offers, and prevent changes in our management or Board of Directors.
Our basic corporate documents and Delaware law contain provisions that might discourage, delay, or prevent a change in the control of Informatica or a change in our management. For example, our bylaws provide that we have a classified board of directors, with each class of directors subject to re-election every three years. A classified board has the effect of making it more difficult for third parties to elect their representatives on our board of directors and gain control of Informatica. Our bylaws also contain advance notice procedures for stockholders to nominate candidates for election as directors or bring matters before a meeting of stockholders. These provisions, among others, could discourage proxy contests and make it more difficult for our stockholders to elect directors and take other corporate actions. The existence of these provisions could limit the price that investors might be willing to pay in the future for shares of our common stock.
ITEM 1B. UNRESOLVED STAFF COMMENTS
Not applicable.
ITEM 2. PROPERTIES
Our corporate headquarters are located in two buildings totaling approximately 290,000 square feet in Redwood City, California, which we purchased in February 2012 and relocated to in the third quarter of 2013. Corporate headquarters are the principal facilities for our administrative, sales, marketing, product development, customer support, and services groups. We also own the associated 11.6 acres of land on which the buildings are located. Prior to the relocation, from January 2005 through August 2013, our corporate headquarters were located in a leased facility in Redwood City, California totaling approximately 159,000 square feet.
We also occupy additional leased facilities in the United States, including offices located in Alpharetta, Georgia; Austin and Plano, Texas; Boston, Massachusetts; Chicago and Naperville, Illinois; New York, New York; Raleigh and Cary, North Carolina; and Reston, Virginia, which are primarily used for sales, marketing, services, and to a lesser degree, product development. Leased facilities located outside of the United States and used primarily for sales, marketing, customer support, and services include offices in Melbourne and Sydney, Australia; Sao Paulo, Brazil; Toronto, Canada; Beijing, China; Paris, France; Frankfurt, Maxdorf, and Stuttgart, Germany; Mumbai, India; Dublin, Ireland; Tel Aviv, Israel; Milan, Italy; Tokyo, Japan; Nieuwegein, the Netherlands; Lisbon, Portugal; Singapore; Seoul, South Korea; Barcelona and Madrid, Spain; and London and Maidenhead, United Kingdom.
23
We also lease facilities in Shelton, Connecticut and facilities outside of United States including Hyderabad, India, Canberra City, Australia, Toronto, Canada, and St. Petersburg and Kazan, Russia where our offices are primarily used for product development. We also lease a facility in Bangalore, India, which is used primarily for product development, customer support, professional services, finance, and other operations.
These leased facilities expire at various times through 2024. We are continually evaluating the adequacy of existing facilities and additional facilities in new cities, and we believe that, if needed, suitable additional space will be available in the future on commercially reasonable terms as needed.
For additional information, see Note 14. Commitments and Contingencies of Notes to Consolidated Financial Statements in Part II, Item 8 of this Report.
ITEM 3. LEGAL PROCEEDINGS
The information set forth in Note 15. Litigation of Notes to Consolidated Financial Statements in Part II, Item 8 of this Report is incorporated herein by reference.
ITEM 4. MINE SAFETY DISCLOSURES
Not applicable.
PART II
ITEM 5. MARKET FOR REGISTRANT'S COMMON EQUITY, RELATED STOCKHOLDER MATTERS, AND ISSUER PURCHASES OF EQUITY SECURITIES
Price Range of Common Stock
Our common stock is listed on the NASDAQ Global Select Market under the symbol “INFA.” The price range per share in the table below reflects the highest and lowest sale prices for our stock as reported by the NASDAQ Global Select Market during the last two years.
High | Low | ||||||
Year Ended December 31, 2014 | |||||||
Fourth quarter | $ | 39.26 | $ | 31.26 | |||
Third quarter | $ | 36.24 | $ | 29.87 | |||
Second quarter | $ | 39.93 | $ | 34.62 | |||
First quarter | $ | 43.79 | $ | 37.01 | |||
Year Ended December 31, 2013 | |||||||
Fourth quarter | $ | 42.00 | $ | 36.32 | |||
Third quarter | $ | 41.49 | $ | 34.40 | |||
Second quarter | $ | 37.49 | $ | 30.27 | |||
First quarter | $ | 39.87 | $ | 29.39 | |||
Holders of Record
At January 30, 2015, there were approximately 75 stockholders of record of our common stock, and the closing price per share of our common stock was $41.69. Since many of our shares of common stock are held by brokers and other institutions on behalf of stockholders, we are unable to estimate the total number of stockholders represented by these record holders.
Dividends
We have never declared or paid cash dividends on our common stock. Because we currently intend to retain all future earnings to finance future growth, we do not anticipate paying any cash dividends in the near future.
24
Purchases of Equity Securities by the Issuer and Affiliated Purchasers
The following table provides information about the repurchase of our common stock for the quarter ended December 31, 2014.
Period | Total Number of Shares Purchased | Average Price Paid Per Share | Total Number of Shares Purchased as Part of Publicly Announced Plans or Programs | Approximate Dollar Value of Shares That May Yet Be Purchased Under the Plans or Programs (in thousands) | |||||||||
October 1 — October 31 | |||||||||||||
From employees (1) | — | — | — | — | |||||||||
Repurchase program (2) | 182,300 | $ | 35.06 | 182,300 | $ | 170,745 | |||||||
November 1 — November 30 | |||||||||||||
From employees (1) | 32,398 | $ | 35.65 | — | — | ||||||||
Repurchase program (2) | 221,800 | $ | 36.04 | 221,800 | $ | 162,751 | |||||||
December 1 — December 31 | |||||||||||||
From employees (1) | — | — | — | — | |||||||||
Repurchase program (2) | — | — | — | $ | 162,751 | ||||||||
Total | 436,498 | $ | 35.60 | 404,100 | |||||||||
____________
(1) | The repurchases from employees represent shares cancelled in settlement of employee minimum statutory tax withholding obligations due upon the vesting of restricted stock units. |
(2) | We repurchased shares in the fourth quarter of 2014 under our ongoing stock repurchase program. This program does not have a specific expiration date and authorizes repurchases in the open market. In each of January, July, and October of 2014, the Board of Directors approved the repurchase of up to an additional $100 million of our outstanding common stock, with such authorizations aggregating to $300 million. As of December 31, 2014, we had $162.8 million remaining under the program for future share repurchases. In January 2015, we announced that the Board of Directors approved an additional $337 million to augment its existing authorization under the our stock repurchase program. Subsequently in February 2015, we entered into separate accelerated stock repurchase ("ASR") agreements with two financial institutions to repurchase an aggregate of $300 million of our common stock. Under the terms of the ASR agreements, we paid an aggregate of $300 million in cash and received an initial delivery of approximately 5.7 million shares on February 4, 2015. The final number of shares to be repurchased will be based on our volume-weighted average stock price less an agreed upon discount during the term of the transactions. This final settlement of shares is expected to occur no later than the second quarter of 2015. We currently intend to utilize the $200 million authorization remaining after the ASR to repurchase shares of our outstanding common stock in the second half of 2015. For further information about the ASR, see the Note 20. Subsequent Event of Notes to Consolidated Financial Statements in Part II, Item 8 of this Report. For further information about our stock repurchase program, see the subsection Stock Repurchase Plan in Note 7. Stockholders' Equity of Notes to Consolidated Financial Statements in Part II, Item 8 of this Report. |
25
Five-Year Performance Graph: 2010-2014
The following performance graph shall not be deemed “filed” for purposes of Section 18 of the Securities Exchange Act of 1934, as amended, or otherwise subject to the liabilities under that Section, and shall not be deemed to be incorporated by reference into any filing of Informatica under the Securities Act of 1933, as amended, or the Exchange Act.
The following graph compares the cumulative total return to stockholders of Informatica's common stock with the cumulative total return of the NASDAQ Stock Market (U.S.) Index and the NASDAQ U.S. Benchmark Computer Services TR Index.
The graph assumes that $100 was invested on January 1, 2010 in Informatica's common stock and in each of the indices discussed above, including reinvestment of dividends. Historic stock performance is not necessarily indicative of future stock price performance.
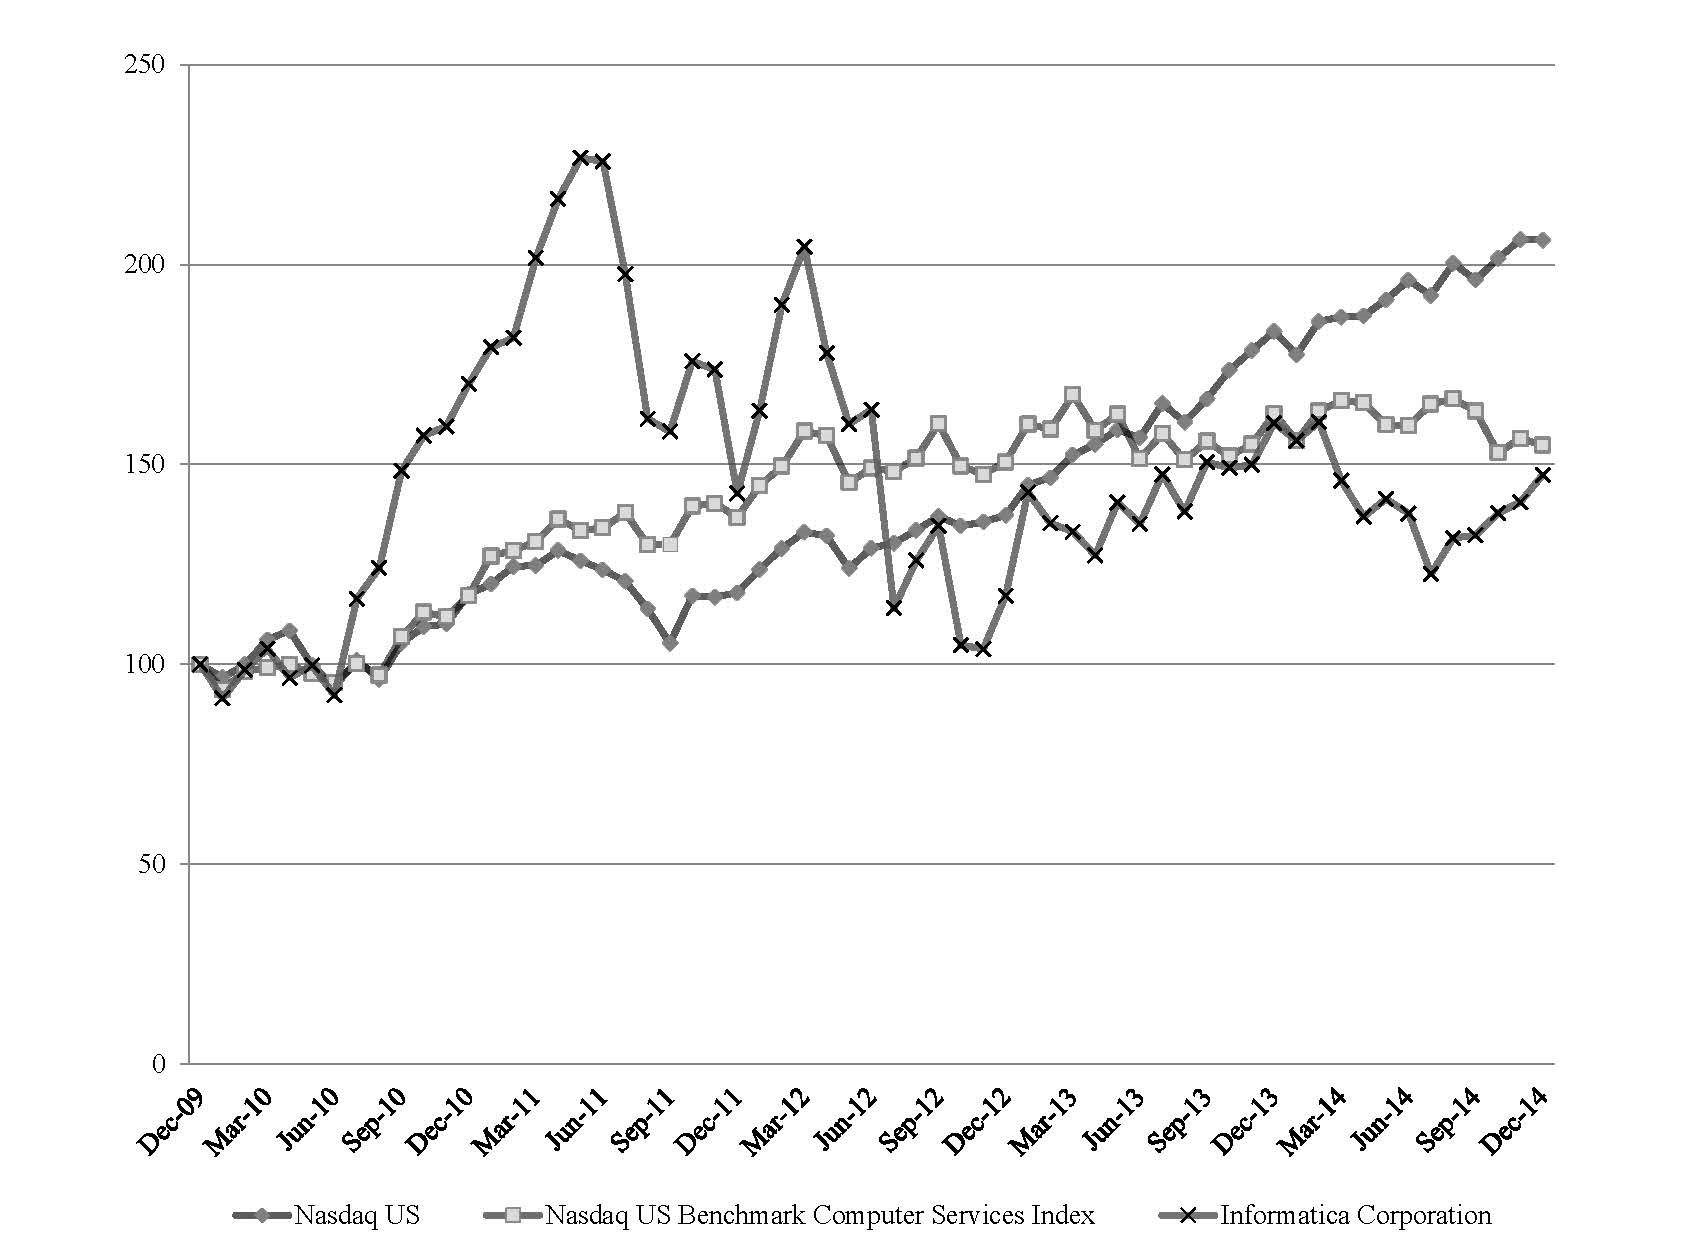
26
ITEM 6. SELECTED FINANCIAL DATA
The following selected consolidated financial data is qualified in its entirety by, and should be read in conjunction with the consolidated financial statements and the notes thereto included in Part II, Item 8 and Management's Discussion and Analysis of Financial Condition and Results of Operations included in Part II, Item 7 of this Report. The selected consolidated statements of income data and consolidated balance sheet data as of and for each of the five years in the period ended December 31, 2014, have been derived from our audited consolidated financial statements.
Years Ended December 31, | |||||||||||||||||||
2014 | 2013 | 2012 | 2011 | 2010 | |||||||||||||||
(In thousands, except per share data) | |||||||||||||||||||
Selected Consolidated Statements of Income Data: | |||||||||||||||||||
Revenues: | |||||||||||||||||||
Software | $ | 457,364 | $ | 413,738 | $ | 350,175 | $ | 372,229 | $ | 307,113 | |||||||||
Service | 590,590 | 534,433 | 461,396 | 411,550 | 342,963 | ||||||||||||||
Total revenues | 1,047,954 | 948,171 | 811,571 | 783,779 | 650,076 | ||||||||||||||
Cost of revenues: | |||||||||||||||||||
Software | 13,048 | 9,838 | 7,844 | 8,121 | 6,526 | ||||||||||||||
Service | 171,657 | 149,136 | 122,798 | 115,831 | 98,561 | ||||||||||||||
Amortization of acquired technology | 13,141 | 22,307 | 21,980 | 19,503 | 13,342 | ||||||||||||||
Total cost of revenues | 197,846 | 181,281 | 152,622 | 143,455 | 118,429 | ||||||||||||||
Gross profit | 850,108 | 766,890 | 658,949 | 640,324 | 531,647 | ||||||||||||||
Operating expenses: | |||||||||||||||||||
Research and development | 193,866 | 165,875 | 143,607 | 132,528 | 106,043 | ||||||||||||||
Sales and marketing | 397,024 | 374,315 | 305,682 | 278,073 | 245,498 | ||||||||||||||
General and administrative | 82,684 | 77,641 | 63,616 | 57,373 | 46,273 | ||||||||||||||
Amortization of intangible assets | 5,943 | 7,729 | 6,578 | 7,717 | 9,539 | ||||||||||||||
Facilities restructuring and facility lease termination costs (benefit), net | — | — | 710 | (1,094 | ) | 1,133 | |||||||||||||
Acquisitions and other charges | 1,103 | 2,467 | 2,797 | 1,029 | 1,326 | ||||||||||||||
Total operating expenses | 680,620 | 628,027 | 522,990 | 475,626 | 409,812 | ||||||||||||||
Income from operations | 169,488 | 138,863 | 135,959 | 164,698 | 121,835 | ||||||||||||||
Interest and other income (expense), net | 805 | 1,859 | 1,808 | 1,930 | (686 | ) | |||||||||||||
Income before income taxes | 170,293 | 140,722 | 137,767 | 166,628 | 121,149 | ||||||||||||||
Income tax provision | 56,206 | 54,327 | 44,585 | 49,133 | 34,825 | ||||||||||||||
Net income | $ | 114,087 | $ | 86,395 | $ | 93,182 | $ | 117,495 | $ | 86,324 | |||||||||
Basic net income per common share | $ | 1.04 | $ | 0.80 | $ | 0.86 | $ | 1.13 | $ | 0.93 | |||||||||
Diluted net income per common share | $ | 1.03 | $ | 0.78 | $ | 0.83 | $ | 1.05 | $ | 0.83 | |||||||||
Shares used in computing basic net income per common share | 109,199 | 108,146 | 107,874 | 103,956 | 92,361 | ||||||||||||||
Shares used in computing diluted net income per common share | 110,960 | 111,394 | 112,089 | 112,540 | 109,083 | ||||||||||||||
December 31, | |||||||||||||||||||
2014 | 2013 | 2012 | 2011 | 2010 | |||||||||||||||
(In thousands) | |||||||||||||||||||
Selected Consolidated Balance Sheet Data: | |||||||||||||||||||
Cash and cash equivalents | $ | 368,531 | $ | 297,818 | $ | 190,127 | $ | 316,835 | $ | 208,899 | |||||||||
Short-term investments | $ | 353,130 | $ | 379,616 | $ | 345,478 | $ | 285,579 | $ | 262,047 | |||||||||
Working capital | $ | 537,740 | $ | 505,386 | $ | 389,534 | $ | 469,861 | $ | 169,253 | |||||||||
Total assets | $ | 1,829,586 | $ | 1,723,021 | $ | 1,512,217 | $ | 1,380,748 | $ | 1,189,641 | |||||||||
Total Informatica Corporation stockholders’ equity | $ | 1,288,951 | $ | 1,235,750 | $ | 1,103,105 | $ | 992,203 | $ | 644,982 | |||||||||
27
ITEM 7. MANAGEMENT’S DISCUSSION AND ANALYSIS OF FINANCIAL CONDITION AND RESULTS OF OPERATIONS
This Annual Report on Form 10-K includes “forward-looking statements” within the meaning of the federal securities laws, particularly statements referencing our expectations relating to new product introductions, software revenues, service revenues, international revenues, potential future revenues, cost of software revenues, cost of service revenues, amortization of acquired technology, operating expenses, amortization of intangible assets, the sufficiency of our cash balances and cash flows for the next 12 months, our stock repurchase programs, investment and potential investments of cash or stock to acquire or invest in complementary businesses, products, or technologies, the impact of recent changes in accounting standards, market risk sensitive instruments, contractual obligations, and assumptions underlying any of the foregoing. In some cases, forward-looking statements can be identified by the use of terminology such as “may,” “will,” “expects,” “intends,” “plans,” “anticipates,” “estimates,” “potential,” or “continue,” or the negative thereof, or other comparable terminology. Although we believe that the expectations reflected in the forward-looking statements contained herein are reasonable, these expectations or any of the forward-looking statements could prove to be incorrect, and actual results could differ materially from those projected or assumed in the forward-looking statements. Our future financial condition and results of operations, as well as any forward-looking statements, are subject to risks and uncertainties, including but not limited to the factors set forth in this Report under Part I, Item 1A. Risk Factors. All forward-looking statements and reasons why results may differ included in this Report are made as of the date of the filing of this Report, and we assume no obligation to update any such forward-looking statements or reasons why actual results may differ.
The following discussion should be read in conjunction with our consolidated financial statements and notes thereto appearing in Part II, Item 8 of this Report.
Overview
We are the leading independent provider of enterprise data integration software and services. We believe data is one of an organization’s most strategic assets, and our solutions enable a wide variety of complex, enterprise-wide data integration initiatives. Our diverse product portfolio centers on data: we offer a variety of solutions, both on-premise and in the cloud, for data integration, data quality, big data, master data management (MDM), data security, data exchange, and data preparation, among others.
We generate revenues from the sale of software and services. We receive software revenues from licensing our products under perpetual licenses directly to end users and indirectly through our partners. We also receive an increasing amount of software revenues from our customers and partners under subscription-based licenses for a variety of our cloud and data-as-a-service offerings. We receive service revenues from maintenance and support services, and professional services, consisting of consulting and education services, that we perform for customers that license our products either directly or indirectly. Historically, purchasing patterns in the software industry have followed quarterly and seasonal trends that we expect to continue. We typically receive a substantial portion of our new license orders in the last month of each quarter and sometimes in the last few weeks or days of each quarter, though such fluctuations are mitigated somewhat by recognition of backlog orders. Moreover, demand for our software products and services is generally highest in the fourth quarter and lowest in the first quarter of each year.
We license our software and provide services to end-user customers in a wide variety of industries located in over 80 countries, including automotive, energy and utilities, entertainment/media, financial services, healthcare, insurance, manufacturing, public sector, retail, services, technology, telecommunications, and travel/transportation. In 2014, our largest vertical industry sectors for new license orders were financial services, healthcare and the public sector. Approximately 66% and 68% of our total revenue in 2014 and 2013, respectively, was from North America, which includes the U.S. and Canada. Historically, most of our international revenue has been generated in Europe, the Middle East and Africa (EMEA). On occasion, foreign currency exchange rates have been particularly volatile and have affected our financial results. Recent fluctuations in foreign currency exchange rates may negatively affect our revenues in the near term, and we expect current exchange rate conditions to adversely impact our revenue growth for the first quarter and full year of 2015. Our strategic partners include systems integrators, resellers and distributors, original equipment manufacturers (OEMs), and strategic technology partners, including enterprise application providers, database vendors, and enterprise information integration vendors.
Our total revenues for 2014 and 2013 were approximately $1.048 billion and $948.2 million, respectively, representing year-over-year growth of 11%. Our software revenues increased by 11% from $413.7 million in 2013 to $457.4 million in 2014, due to a 6% increase in license revenues and a 49% increase in subscription revenues. Service revenues increased by 11% from $534.4 million to $590.6 million, due to a 12% growth in maintenance revenues and a 7% increase in consulting and education services. For 2014 and 2013, our income from operations calculated in accordance with U.S. generally accepted accounting principles (GAAP) was $169.5 million and $138.9 million, respectively. Our non-GAAP income from operations was $249.0 million and $233.0 million in 2014 and 2013, respectively. For 2014 and 2013, our GAAP net income was $114.1 million and $86.4 million,
28
respectively. Our non-GAAP net income was $176.9 million and $160.7 million in 2014 and 2013, respectively. See the below for a reconciliation of GAAP to non-GAAP financial measures.
We believe that recent trends in technology are enhancing our growth opportunities. In particular, the continued adoption of cloud services, the diversity of customer, social and mobile interaction data, the richness of big data and the vulnerabilities in securing data are redefining business computing. We are focused on four distinct market opportunities for long-term growth aligned with these trends: cloud integration, MDM, data integration for next-generation analytics and data security. Our growth strategies include expanding to more cloud ecosystems and delivering more types of cloud services; offering more MDM solutions for critical business priorities, the cloud and big data; delivering more productivity tools for big data for IT developers and more data preparation capabilities for business users; and to secure more types of data and offer innovative security intelligence capabilities. Recently, we launched Informatica Rev to empower business users to be self-sufficient in data integration and preparation for analytics, and in 2015 we plan to release Secure@Source, a new product that enables customers to discover and classify sensitive data and assess risks associated with data proliferation.
We are continuing to evolve our business model to increase subscription revenue and aggressively investing in our go-to-market strategies for our newer products, while remaining committed to delivering innovative solutions. We will offer our newer products, such as Informatica Rev and Secure@Source, as well as innovations in Informatica Cloud, on a subscription basis. We will continue to offer our established on-premise products as licensed software. In addition, we intend to significantly expand our subscription sales force and increase sales specialist staffing and marketing efforts.
While we believe that these recent technological trends and growth strategies will present significant opportunities, they also pose significant challenges and risks. Key factors that we believe affect our ability to achieve our strategic plans and grow our business include, among others:
• | competing effectively, particularly on the basis of functionality and price, against a variety of different vendors offering existing data integration software products, vendors of new and emerging technologies, and hand-coded, custom-built data integration solutions; |
• | introducing new products and services and enhancements to existing products and services on a regular basis, including integrating acquired products and services, to address the needs of our customers and to respond to rapid technological changes; |
• | accurately forecasting sales and trends in our business, including the quality and timing of sales pipeline generation, the size of our sales pipeline and the conversion of the sales pipeline into actual sales, and the length of our sales cycle; |
• | attracting, training and retaining our key personnel, especially our sales force, as well as maintaining appropriate levels of sales force productivity and turnover rates; and |
• | continuing to evolve our strategy and business model for our subscription offerings. |
Furthermore, we continue to invest in our international operations, which involve significant financial and operational risks including exposure to foreign currency exchange rate fluctuations and macroeconomic or geopolitical conditions.
To address these key factors, and other challenges and risks, we focus on a number of actions, including devoting significant resources to the research and development of products and services; broadening our distribution capability worldwide; enabling our sales force and distribution channel, including by investing in training programs and new product functionalities, key differentiators, and key business values; aligning our worldwide field and marketing operations with company-wide initiatives; implementing pipeline generation and pipeline management initiatives and more rigorous sales planning and processes; strengthening our strategic partnerships; and strategic acquisitions of complementary businesses, products, and technologies. If we are unable to execute these actions or otherwise successfully address any significant challenges and risks, we may not be able to continue to grow our business or achieve our long-term growth plans.
For further discussion regarding these and related risks, see Risk Factors in Part I, Item 1A of this Report.
Critical Accounting Policies and Estimates
Our consolidated financial statements are prepared in accordance with generally accepted accounting principles (“GAAP”) in the United States, which require us to make estimates, judgments, and assumptions. We believe that the estimates, judgments, and assumptions upon which we rely are reasonable based upon information available to us at the time that these assumptions, judgments, and estimates are made. These estimates, judgments, and assumptions can affect the reported amounts of assets and liabilities as of the date of the financial statements as well as the reported amounts of revenues and expenses during the periods presented. Any material differences between these estimates and actual results will impact our consolidated financial statements. On a regular basis, we evaluate our estimates, judgments, and assumptions and make changes accordingly. We also discuss our critical accounting estimates with the Audit Committee of the Board of Directors. We believe that the estimates, judgments, and assumptions involved in the accounting for revenue recognition, income taxes, business combinations, impairment of goodwill
29
and intangible assets, stock-based compensation, and allowance for doubtful accounts have the greatest potential impact on our consolidated financial statements, so we consider these to be our critical accounting policies. We discuss below the critical accounting estimates associated with these policies. Historically, our estimates, judgments, and assumptions relative to our critical accounting policies have not differed materially from actual results. See Note 2. Summary of Significant Accounting Policies of Notes to Consolidated Financial Statements in Part II, Item 8 of this Report for further information on our significant accounting policies.
Revenue Recognition
The basis for recognizing our revenue is determined by ASC 985-605, Software Revenue Recognition, ASC 605-25, Multiple Element Arrangements, ASC 605-35, Revenue Recognition for Construction-Type and Production-Type Contracts, and the Securities and Exchange Commission's Staff Accounting Bulletin (“SAB”) Topic 13, Revenue Recognition, which is discussed in the subsection Revenue Recognition in Note 2. Summary of Significant Accounting Policies of Notes to Consolidated Financial Statements in Part II, Item 8 of this Report. The accounting rules related to revenue recognition are complex and require management to make significant judgments.
We derive revenues from sales of software licenses, subscription-based licenses for a variety of cloud and data-as-a-service offerings, maintenance and support services (which entitle the customer to receive product support and unspecified software updates), and professional services, consisting of consulting and education services. We recognize revenue applying the basic revenue recognition criteria when persuasive evidence of an arrangement exists, delivery has occurred, the fee is fixed or determinable, and collection is probable. In applying these criteria to sales transactions, we must exercise judgment and use estimates to determine the amount of software and services revenue to be recognized at each period.
We enter into multiple element arrangements that contain software and software-related elements, such as software licenses, subscription-based licenses for data-as-a-service offerings, maintenance and support, consulting, and education services. We use the residual method to allocate revenue to the software license and recognize license revenue upon delivery when vendor-specific objective evidence (“VSOE”) of fair value exists for all undelivered elements of the arrangement. If VSOE does not exist for any undelivered software product element of the arrangement, all revenue is deferred until all elements have been delivered, or VSOE is established. If VSOE does not exist for any undelivered services elements of the arrangement, all revenue is recognized ratably over the period that the services are expected to be performed. We are required to exercise judgment in determining if VSOE exists for each undelivered element.
We enter into multiple element arrangements that contain both software, such as software licenses, and deliverables not within the scope of ASC 985-605, such as cloud offerings. We first allocate the total arrangement consideration based on the relative selling prices of the software group of elements as a whole, and to the elements not within the scope of ASC 985-605. The allocation of arrangement consideration is based on the selling price hierarchy, which includes (i) VSOE if available, (ii) third party evidence ("TPE") if VSOE is not available, or (iii) estimated selling price ("ESP") if neither VSOE nor TPE is available. We then further allocate consideration within the software group to the respective elements within that group following the guidance in ASC 985-605. Revenue allocated to each element is then recognized when the basic revenue recognition criteria are met for each element as described above.
We establish VSOE for each element based on the price charged when an element is sold separately. In certain limited instances, we are not able to establish VSOE for all deliverables in an arrangement with multiple elements. This may be due to the infrequent selling of each element separately, not pricing products or services within a narrow range, or only having a limited sales history.
For multiple element arrangements that contain both software and deliverables not within the scope of ASC 985-605, when VSOE cannot be established for deliverables not within the scope of ASC 985-605, we attempt to establish a selling price based on TPE. TPE is determined based on competitor prices for similar deliverables when sold separately. When we are unable to establish a selling price using VSOE or TPE, we use ESP in our allocation of the arrangement consideration. We determine ESP by reviewing historical transactions, including transactions whereby the deliverable was sold on a standalone basis and considering several other external and internal factors including, but not limited to, pricing practices including discounting levels dependent on the size of transactions, whether an order represents an upgrade of a previous order and the type of customer. The determination of ESP is made through consultation with our management, taking into consideration our pricing practices and go-to-market strategy. As our, or our competitors’, pricing and go-to-market strategies evolve, we may modify our pricing practices in the future, which could result in changes to our determination of VSOE, TPE and ESP. As a result, our future revenue recognition for multiple-element arrangements could differ materially from our results in the current period. Selling prices are analyzed on a quarterly basis or more frequently if we experience significant changes in our selling prices.
Subscription revenues, primarily consisting of revenues from customers and partners under subscription-based licenses for a variety of cloud, and data-as-a-service offerings, are recognized ratably over the subscription term.
30
Maintenance revenues, which consist of fees for ongoing support and product updates, if and when available, are recognized ratably over the term of the contract, typically one year.
Consulting revenues are primarily related to configuration, installation, and implementation of our products. These services are generally performed on a time-and-materials basis and, accordingly, revenues are recognized as the services are performed. Occasionally, contracts are on a fixed-fee basis and, accordingly, revenues are recognized on a proportional performance model based on actual services performed. If uncertainty exists about our ability to complete the project, our ability to collect the amounts due, or in the case of fixed-fee consulting arrangements, our ability to estimate the remaining costs to be incurred to complete the project, revenue is deferred until the uncertainty is resolved. Consulting services, if included as part of the software arrangement, generally do not require significant modification or customization of the software and are not considered essential to the functionality of the software. If, in our judgment, the software arrangement includes significant modification or customization of the software, then software license revenue is recognized as the consulting services revenue is recognized.
Education service revenues are generated from classes offered at our headquarters, sales and training offices, customer locations, and on-line. Revenues are recognized as the classes are delivered.
We recognize revenues net of applicable sales taxes, financing charges that we have absorbed, and amounts retained by our resellers and distributors, if any. Our agreements do not permit returns, and historically we have not had any significant returns or refunds; therefore, we have not established a sales return reserve at this time.
Accounting for Income Taxes
We use the asset and liability method of accounting for income taxes in accordance with ASC 740, Income Taxes. Under this method, income tax expenses or benefits are recognized for the amount of taxes payable or refundable for the current year. In addition, deferred tax assets and liabilities are recognized for the expected future tax consequences of events that have been recognized in our consolidated financial statements or tax returns. The measurement of current and deferred tax assets and liabilities is based on provisions of currently enacted tax laws. The effects of any future changes in tax laws or rates have not been taken into account.
A two-step approach is applied pursuant to ASC 740 in the recognition and measurement of uncertain tax positions taken or expected to be taken in a tax return. The first step is to determine if the weight of available evidence indicates that it is more likely than not that the tax position will be sustained in an audit, including resolution of any related appeals or litigation processes. The second step is to measure the tax benefit as the largest amount that is more than 50% likely to be realized upon ultimate settlement. We recognize interest and penalties related to uncertain tax positions in our income tax provision line of our consolidated statements of income.
As part of the process of preparing consolidated financial statements, we estimate our income taxes and tax contingencies in each of the tax jurisdictions in which we operate prior to the completion and filing of tax returns for such periods. This process involves estimating actual current tax expense together with assessing temporary differences resulting from differing treatment of items, such as deferred revenue, for tax and accounting purposes. These differences result in net deferred tax assets and liabilities. We must then assess the likelihood that the deferred tax assets will be realizable, and to the extent we believe that a deferred tax asset is not likely to be realized, we must establish a valuation allowance. In assessing the need for any additional valuation allowance, we considered all the evidence available to us, both positive and negative, including historical levels of income, legislative developments, expectations and risks associated with estimates of future taxable income, and ongoing prudent and feasible tax planning strategies.
Business Combinations
We record the acquired tangible and intangible assets and liabilities assumed based on their estimated fair values at the acquisition date. Goodwill as of the acquisition date is measured as the excess of consideration transferred and the net of the acquisition fair values of the assets acquired and the liabilities assumed. The valuation process requires management to make significant estimates and assumptions, especially at the acquisition date with respect to intangible assets, support obligations assumed, estimated restructuring liabilities, and pre-acquisition contingencies.
Although we believe the estimates and assumptions that we have made are reasonable and appropriate, they are based in part on historical experience and information obtained from management of the acquired companies and are inherently uncertain. The following are some of the examples of critical estimates that we have applied in our acquisitions:
• | future expected cash flows from software license sales, subscriptions, support agreements, consulting contracts, other customer contracts, and acquired developed technologies and patents; |
31
• | expected costs to develop the in-process research and development into commercially viable products and estimated cash flows from the projects when completed; |
• | the acquired company's brand and competitive position as well as assumptions about the period of time the acquired brand will continue to be used in the combined company's product portfolio; and |
• | discount rates. |
Unanticipated events and circumstances may occur that may affect the accuracy of our estimates and assumptions.
In connection with our acquisitions, we estimate the fair value of the support obligations assumed. The estimated fair value of the support obligations is determined utilizing a cost build-up approach. The cost build-up approach determines fair value by estimating the costs related to fulfilling the obligations plus a normal profit margin. The estimated costs to fulfill the support obligations are based on the historical costs related to fulfilling the obligations. The sum of these costs and operating profit approximates, in theory, the amount that we would be required to pay a third party to assume the support obligations.
We expense transaction costs and restructuring expenses related to the acquisition as incurred and identify pre-acquisition contingencies and determine their respective fair values as of the end of the measurement period. We record any adjustments to pre-acquisition contingencies in our operating results in the period in which the adjustment is determined. Furthermore, any adjustments to estimates of acquisition related tax contingencies are recorded to goodwill during the measurement period and in our operating results after the conclusion of the measurement period. Moreover, we identify in-process research and development costs, determine their respective fair values and classify them as an indefinite lived intangible asset until the asset is put to use or deemed to be impaired.
Accounting for Impairment of Goodwill and Intangible Assets
We assess goodwill for impairment annually on October 31 of each year and whenever an event or changes in circumstances indicate that the carrying value of the asset may not be recoverable. Consistent with our determination that we have only one reporting segment, we have determined that there is only one reporting unit and test goodwill for impairment at the entity level. We test goodwill using the two-step process in accordance with ASC 350, Intangibles - Goodwill and Other. In the first step, we compare the carrying amount of the reporting unit to the fair value based on quoted market prices of our common stock. If the fair value of the reporting unit exceeds the carrying value, goodwill is not considered impaired and no further testing is required. If the carrying value of the reporting unit exceeds the fair value, goodwill is potentially impaired and the second step of the impairment test must be performed. In the second step, we would compare the implied fair value of the goodwill, as defined by ASC 350, to its carrying amount to determine the amount of impairment loss, if any. We performed our annual goodwill impairment tests on October 31, 2014, 2013, and 2012 and concluded that there was no impairment.
We evaluate intangible assets, other than goodwill, for impairment whenever events or changes in circumstances indicate that the carrying value of these assets may not be recoverable. Recoverability of these assets is measured by comparison of the carrying amount of an asset to the future undiscounted cash flows attributable to that asset. We measure any amount of impairment based on the difference between the carrying value and the fair value of the impaired asset. We did not recognize any impairment charges of intangible assets in 2014, 2013, and 2012.
We have made assumptions and estimates about future values and remaining useful lives which are complex and often subjective. They can be affected by a variety of factors, including external factors such as industry and economic trends, and internal factors such as changes in our business strategy and our internal forecasts. Although we believe that the assumptions and estimates that we have made are reasonable and appropriate, different assumptions and estimates could materially impact our reported financial results.
Stock-based Compensation
We account for stock-based compensation in accordance with the provisions of ASC 718, Stock Compensation. Stock-based awards granted include stock options, restricted stock units ("RSUs"), performance-based restricted stock units ("PRSUs"), and stock purchased under our Employee Stock Purchase Plan ("ESPP"). Stock-based compensation expense is measured at the grant date based on the fair value of the awards. Stock-based compensation expense for stock options and RSUs is recognized as an expense ratably on a straight line basis over its requisite service period. Stock-based compensation for PRSUs is recognized as an expense using the accelerated method which recognizes a larger portion of the expense during the beginning of the requisite service period than in the end of the requisite service period. It requires a certain amount of judgment to select the appropriate fair value model and calculate the fair value of stock-based awards, including estimating stock price volatility and expected life. Further, estimates of forfeiture rates could impact stock-based compensation expense from one period to the next.
We have estimated the expected volatility as an input into the Black-Scholes-Merton valuation formula when assessing the fair value of options granted. Our current estimate of volatility is based upon a blend of average historical and market-based
32
implied volatilities of our stock price. To the extent that the volatility rate in our stock price increases in the future, our estimates of the fair value of options granted will increase accordingly. We derived our expected life of the options that we granted in 2014 from the historical option exercises, post-vesting cancellations, and estimates concerning future exercises and cancellations for vested and unvested options that remain outstanding. In addition, we apply an expected forfeiture rate in determining the amount of stock-based compensation. We use historical forfeitures to estimate our future forfeiture rates.
We recognize the stock-based compensation expense for PRSUs by estimating the number of PRSUs that we ultimately expect to vest, which requires that we use judgment to determine the probability of achieving certain performance criteria, as defined in the PRSU agreements. Changes in our estimates related to probability of achieving certain performance criteria and number of PRSUs expected to vest could significantly affect the stock-based compensation expense from one period to the next.
We believe that the estimates that we have used for the calculation of the variables to arrive at stock-based compensation expense are reasonable and appropriate. The assumptions entered into the option valuation model we use to fair value our stock-based awards are subjective estimates, and changes to these estimates will cause the fair value of our stock-based awards and related stock-based compensation expense that we record to vary. We will continue to monitor the historical performance of these variables and will modify our methodology and assumptions in the future as needed.
See Note 8. Stock-based Compensation of Notes to Consolidated Financial Statements in Part II, Item 8 of this Report for a description of the Company's stock-based compensation plans and more information on the assumptions used to calculate the fair value of stock-based compensation.
Allowance for Doubtful Accounts
We make estimates as to the overall collectability of accounts receivable and provide an allowance for accounts receivable considered uncollectible. We specifically analyze accounts receivable based on historical bad debt experience, customer concentrations, customer credit-worthiness, the age of the receivable, current economic trends, and changes in customer payment terms when evaluating the adequacy of the allowance for doubtful accounts. We record the adjustment in general and administrative expense.
Recent Accounting Pronouncements
For recent accounting pronouncements, see Note 2. Summary of Significant Accounting Policies of Notes to Consolidated Financial Statements in Part II, Item 8 of this Report.
33
Results of Operations
The following table presents certain financial data as a percentage of total revenues:
Years Ended December 31, | ||||||||
2014 | 2013 | 2012 | ||||||
Revenues: | ||||||||
Software | 44 | % | 44 | % | 43 | % | ||
Service | 56 | 56 | 57 | |||||
Total revenues | 100 | 100 | 100 | |||||
Cost of revenues: | ||||||||
Software | 1 | 1 | 1 | |||||
Service | 17 | 16 | 15 | |||||
Amortization of acquired technology | 1 | 2 | 3 | |||||
Total cost of revenues | 19 | 19 | 19 | |||||
Gross profit | 81 | 81 | 81 | |||||
Operating expenses: | ||||||||
Research and development | 18 | 17 | 17 | |||||
Sales and marketing | 38 | 40 | 38 | |||||
General and administrative | 8 | 8 | 8 | |||||
Amortization of intangible assets | 1 | 1 | 1 | |||||
Facilities restructuring and facility lease termination costs | — | — | — | |||||
Acquisitions and other charges | — | — | — | |||||
Total operating expenses | 65 | 66 | 64 | |||||
Income from operations | 16 | 15 | 17 | |||||
Interest and other income (expense), net | — | — | — | |||||
Income before income taxes | 16 | 15 | 17 | |||||
Income tax provision | 5 | 6 | 6 | |||||
Net income | 11 | % | 9 | % | 11 | % | ||
Revenues
Our total revenues increased to $1.05 billion in 2014 compared to $948.2 million in 2013, and $811.6 million in 2012, representing an increase of $99.8 million (or 11%) in 2014 from 2013 and an increase of $136.6 million (or 17%) in 2013 from 2012. The increase in 2014 from 2013 was primarily due to an increase in license revenues, subscription revenues and maintenance revenues. The increase in license revenues resulted from an increase in the number of transactions in 2014 compared to 2013, offset by a decrease in the average transaction size of license orders. The increase in subscription revenues was due to growth in the installed customer base and higher customer demand of subscription offerings, and the maintenance revenues growth was attributable to the increased size of our installed customer base.
The increase in 2013 from 2012 was primarily due to an increase in license revenues resulting from increases in average transaction size and the number of transactions in 2013 as compared to 2012, as well as an increase in maintenance revenues as a result of growth in our installed customer base.
The average transaction amount for orders greater than $100,000 in 2014, including upgrades, for which we charge customers an additional fee, decreased to $468,000 from $484,000 in 2013 and increased from $451,000 in 2012, respectively. The number of transactions greater than $1.0 million increased to 98 in 2014 from 89 in 2013 and 65 in 2012. We offer two types of upgrades to our license products: (1) upgrades that are not part of the post-contract services for which we charge customers an additional fee, and (2) upgrades that are part of the post-contract services that we provide to our customers at no additional charge, when and if available.
34
The following table and discussion compare our revenues for the three years ended December 31, 2014 (in thousands, except percentages):
Percentage Change | |||||||||||||||||
Years Ended December 31, | 2013 to 2014 | 2012 to 2013 | |||||||||||||||
2014 | 2013 | 2012 | |||||||||||||||
Software revenues: | |||||||||||||||||
License | $ | 387,660 | $ | 367,074 | $ | 320,982 | 6 | % | 14 | % | |||||||
Subscription | 69,704 | 46,664 | 29,193 | 49 | % | 60 | % | ||||||||||
Total software revenues | 457,364 | 413,738 | 350,175 | 11 | % | 18 | % | ||||||||||
Service revenues: | |||||||||||||||||
Maintenance | 456,718 | 409,325 | 360,769 | 12 | % | 13 | % | ||||||||||
Consulting and education | 133,872 | 125,108 | 100,627 | 7 | % | 24 | % | ||||||||||
Total service revenues | 590,590 | 534,433 | 461,396 | 11 | % | 16 | % | ||||||||||
Total revenues | $ | 1,047,954 | $ | 948,171 | $ | 811,571 | 11 | % | 17 | % | |||||||
Software Revenues
Our software revenues were $457.4 million (or 44% of total revenues) in 2014 compared to $413.7 million (or 44% of total revenues) in 2013, and $350.2 million (or 43% of total revenues) in 2012, representing an increase of $43.6 million (or 11%) in 2014 from 2013, and an increase of $63.6 million (or 18%) in 2013 from 2012.
License Revenues
Our license revenues were $387.7 million (or 37% of total revenues) in 2014 compared to $367.1 million (or 39% of total revenues) in 2013, and $321.0 million (or 40% of total revenues) in 2012, representing an increase of $20.6 million (or 6%) in 2014 from 2013, and an increase of $46.1 million (or 14%) in 2013 from 2012. The increase in license revenues in 2014 from 2013 was primarily due to an increase in the number of transactions in 2014 compared to 2013, offset by a decrease in the average transaction size of license orders. The increase in license revenues in 2013 from 2012 was primarily due to an increase in the number of transactions and the average transaction size of license orders.
We expect our license revenues to increase in absolute amounts in 2015 from the 2014 levels primarily due to broader adoption of our software products. Furthermore, we expect our license revenues to decrease slightly as a percentage of total revenue due to growth in our subscription revenues.
Subscription Revenues
Subscription revenues, which primarily represent revenues from customers and partners under subscription-based licenses for a variety of cloud and data-as-a-service offerings, increased to $69.7 million (or 7% of total revenues) in 2014 compared to $46.7 million (or 5% of total revenues) in 2013, and $29.2 million (or 4% of total revenues) in 2012. The increases in subscription revenues of $23.0 million (or 49%) in 2014 from 2013, and $17.5 million (or 60%) in 2013 from 2012 were primarily due to an increase in the installed base of subscription customers and higher customer demand.
We expect our subscription revenues to increase in absolute amounts in 2015 from the 2014 levels primarily due to our growing installed customer base. Furthermore, we expect our subscription revenues to increase as a percentage of total revenue due to an anticipated increase in demand for our subscription offerings.
Service Revenues
Our service revenues were $590.6 million (or 56% of total revenues) in 2014 compared to $534.4 million (or 56% of total revenues) in 2013, and $461.4 million (or 57% of total revenues) in 2012, representing growth of $56.2 million (or 11%) in 2014 from 2013, and $73.0 million (or 16%) in 2013 from 2012.
35
Maintenance Revenues
Maintenance revenues increased to $456.7 million (or 44% of total revenues) in 2014 from $409.3 million (or 43% of total revenues) in 2013, and $360.8 million (or 44% of total revenues) in 2012, representing growth of $47.4 million (or 12%) in 2014 from 2013, and $48.6 million (or 13%) in 2013 from 2012. The increases in maintenance revenues in 2014 and 2013 were primarily due to the increasing size of our installed customer base.
We expect maintenance revenues to increase in absolute amounts in 2015 from the 2014 levels due to our growing installed customer base. Furthermore, we expect maintenance revenues to be relatively consistent with or decrease slightly as a percent of total revenue due to the expected increase in subscription revenues.
Consulting and Education Revenues
Consulting and education revenues increased to $133.9 million (or 13% of total revenues) in 2014 from $125.1 million (or 13% of total revenues) in 2013, and $100.6 million (or 12% of total revenues) in 2012, representing growth of $8.8 million (or 7%) in 2014 from 2013, and $24.5 million (or 24%) in 2013 from 2012. The increases in consulting and education revenues were primarily due to higher customer demand for consulting services, offset by a decrease in education classes offered.
We expect our consulting and education revenues to increase in absolute amounts in 2015 from the 2014 levels due to an anticipated increase in demand for consulting services, and to be relatively consistent as a percentage of total revenues.
International Revenues
Our international revenues were $359.8 million (or 34% of total revenues) in 2014, $305.5 million (or 32% of total revenues) in 2013, and $287.4 million (or 35% of total revenues) in 2012. The increase of $54.3 million (or 18%) in 2014 from 2013 was primarily due to increases in license, maintenance and consulting revenues in Latin America, EMEA and Asia-Pacific, as well as increases in subscription revenues in EMEA due to broader adoption of our software products and an increase in our installed customer base, offset by decreases in education revenue in EMEA due to a decrease in education classes offered. The increase of $18.1 million (or 6%) in 2013 from 2012 was primarily due to increases in maintenance revenues in EMEA, Asia-Pacific and Latin America due to an increase in our installed customer base; increases in consulting revenues in EMEA and Latin America, partially offset by a decrease in Asia-Pacific; and increases in subscription revenues in EMEA and Asia-Pacific due to broader adoption of our software products. Conversely, license revenues decreased in EMEA, partially offset by an increase in Asia-Pacific.
We expect our international revenues as a percentage of total revenues in 2015 to be relatively consistent with the comparable 2014 levels, subject to foreign currency exchange rates. See the Risk Factors in Part I, Item 1A of this Report for further discussion on risks related to fluctuations in foreign currency exchange rates.
Potential Future Revenues (New Orders, Backlog, and Deferred Revenues)
Our potential future revenues include backlog consisting primarily of (1) product orders (primarily perpetual licenses) that have not shipped as of the end of a given quarter, (2) product orders received from certain distributors, resellers, OEMs, and end users not included in deferred revenues, where revenue is recognized after cash receipt (collectively (1) and (2) above are referred as “aggregate backlog”), and (3) deferred revenues. Our deferred revenues consist primarily of the following: (1) maintenance revenues that we recognize over the term of the contract, typically one year, (2) subscription offerings that are recognized over the period of performance as services are provided, (3) license product orders that have shipped but where the terms of the license agreement contain acceptance language or other terms that require that the license revenues be deferred until all revenue recognition criteria are met or recognized ratably over an extended period, and (4) consulting and education services revenues that have been prepaid but for which services have not yet been performed.
We typically ship products shortly after the receipt of an order, which is common in the software industry, and historically our backlog of license orders awaiting shipment at the end of any given quarter has varied. Aggregate backlog and deferred revenues at December 31, 2014 were approximately $374.9 million compared to $343.2 million at December 31, 2013. The increase in 2014 was primarily due to an increase in deferred maintenance revenues and deferred subscription revenues. The international portion of aggregate backlog and deferred revenues may fluctuate with changes in foreign currency exchange rates. Aggregate backlog and deferred revenues as of any particular date are not necessarily indicative of future results.
36
Cost of Revenues
The following table sets forth, for the periods indicated, our cost of revenues (in thousands, except percentages):
Percentage Change | |||||||||||||||||
Years Ended December 31, | 2013 to 2014 | 2012 to 2013 | |||||||||||||||
2014 | 2013 | 2012 | |||||||||||||||
Cost of software revenues | $ | 13,048 | $ | 9,838 | $ | 7,844 | 33 | % | 25 | % | |||||||
Cost of service revenues | 171,657 | 149,136 | 122,798 | 15 | % | 21 | % | ||||||||||
Amortization of acquired technology | 13,141 | 22,307 | 21,980 | (41 | )% | 1 | % | ||||||||||
Total cost of revenues | $ | 197,846 | $ | 181,281 | $ | 152,622 | 9 | % | 19 | % | |||||||
Cost of software revenues, as a percentage of software revenues | 3 | % | 2 | % | 2 | % | 1 | % | — | % | |||||||
Cost of service revenues, as a percentage of service revenues | 29 | % | 28 | % | 27 | % | 1 | % | 1 | % | |||||||
Cost of Software Revenues
Our cost of software revenues is a combination of costs of license and subscription revenues. Cost of license revenues consists primarily of software royalties, product packaging, documentation, and production costs. Cost of subscription revenues consists primarily of fees paid to third party vendors for hosting services related to our subscription services and royalties paid to postal authorities and other vendors that provide content for our data-as-a-service offerings. Cost of software revenues was $13.0 million (or 3% of software revenues) in 2014, $9.8 million (or 2% of software revenues) in 2013, and $7.8 million (or 2% of software revenues) in 2012. The increase of $3.2 million (or 33%) in 2014 from 2013 was primarily due to a $3.1 million increase in software royalties and a $0.1 million increase in fees paid to third party vendors for hosting services in 2014 compared to 2013.
The increase of $2.0 million (or 25%) in 2013 from 2012 was primarily due to a $1.1 million increase in software royalties and a $0.9 million increase in fees paid to third party vendors for hosting services in 2013 compared to 2012.
We expect that our cost of software revenues as a percentage of software revenues in 2015 to be relatively consistent with 2014 levels.
Cost of Service Revenues
Our cost of service revenues is a combination of costs of maintenance, consulting and education services revenues. Our cost of maintenance revenues consists primarily of costs associated with customer service personnel expenses and royalty fees for maintenance related to third-party software providers. Cost of consulting revenues consists primarily of personnel costs and expenses incurred in providing consulting services at customers’ facilities. Cost of education services revenues consists primarily of the costs of providing education classes and materials at our headquarters, sales and training offices, and customer locations.
Cost of service revenues was $171.7 million (or 29% of service revenues) in 2014, $149.1 million (or 28% of service revenues) in 2013, and $122.8 million (or 27% of service revenues) in 2012. The increase of $22.5 million (or 15%) in 2014 from 2013 was primarily due to an $11.0 million increase in personnel related costs (including stock-based compensation), an $8.3 million increase in subcontractor services, and a $3.2 million increase in general overhead costs.
The increase of $26.3 million (or 21%) in 2013 from 2012 was primarily due to a $17.8 million increase in personnel related costs (including stock-based compensation), a $7.1 million increase in subcontractor services, and a $1.4 million increase in general overhead costs.
We expect that our cost of service revenues, in absolute dollars, to increase in 2015 from the 2014 levels, mainly due to headcount increases to support and deliver increased service revenues. We expect, however, the cost of service revenues as a percentage of service revenues in 2015 to remain relatively consistent with 2014 levels.
37
Amortization of Acquired Technology
The following table sets forth, for the periods indicated, our amortization of acquired technology (in thousands, except percentages):
Percentage Change | |||||||||||||||||
Years Ended December 31, | 2013 to 2014 | 2012 to 2013 | |||||||||||||||
2014 | 2013 | 2012 | |||||||||||||||
Amortization of acquired technology | $ | 13,141 | $ | 22,307 | $ | 21,980 | (41 | )% | 1 | % | |||||||
Amortization of acquired technology is the amortization of technologies acquired through business acquisitions and technology licenses. Amortization of acquired technology totaled $13.1 million, $22.3 million, and $22.0 million in 2014, 2013, and 2012, respectively. The $9.2 million (or 41%) decrease in 2014 from 2013 was primarily due to a $6.5 million decrease in amortization of certain acquired technologies that were fully amortized in 2013 and during 2014, and a $2.8 million decrease in amortization of certain acquired technologies which were amortized using a method based on expected cash flows. Generally cash flows decline over time after an initial ramp up after the technology is first acquired. These decreases were partially offset by amortization related to technologies acquired in 2014.
We expect the amortization of acquired technology to be approximately $10.4 million in 2015 before the effect of any potential future acquisitions subsequent to December 31, 2014.
Operating Expenses
Research and Development
The following table sets forth, for the periods indicated, our research and development expenses (in thousands, except percentages):
Percentage Change | |||||||||||||||||
Years Ended December 31, | 2013 to 2014 | 2012 to 2013 | |||||||||||||||
2014 | 2013 | 2012 | |||||||||||||||
Research and development | $ | 193,866 | $ | 165,875 | $ | 143,607 | 17 | % | 16 | % | |||||||
Our research and development expenses consist primarily of salaries and other personnel-related expenses, consulting services, facilities, and related overhead costs associated with the development of new products, enhancement and localization of existing products, quality assurance, and development of documentation for our products. Research and development expenses were $193.9 million (or 18% of total revenues), $165.9 million (or 17% of total revenues), and $143.6 million (or 17% of total revenues) for the years ended December 31, 2014, 2013, and 2012, respectively. All software development costs have been expensed in the period incurred since the costs incurred subsequent to the establishment of technological feasibility have not been significant.
The $28.0 million (or 17%) increase in 2014 from 2013 was primarily due to a $24.7 million increase in personnel-related costs (including stock-based compensation) as a result of increased headcount and a $3.3 million increase in general overhead costs. Research and development headcount increased from 1,086 at the end of 2013 to 1,237 at the end of 2014. A portion of the $24.7 million increase is related to investments in our new products, Informatica Rev and Secure@Source.
The $22.3 million (or 16%) increase in 2013 from 2012 was primarily due to a $18.6 million increase in personnel-related costs (including stock-based compensation) as a result of increased headcount and a $3.7 million increase in general overhead costs.
We expect research and development expenses as a percentage of total revenues in 2015 to be relatively consistent with, or increase slightly from, the comparable 2014 levels.
38
Sales and Marketing
The following table sets forth, for the periods indicated, our sales and marketing expenses (in thousands, except percentages):
Percentage Change | |||||||||||||||||
Years Ended December 31, | 2013 to 2014 | 2012 to 2013 | |||||||||||||||
2014 | 2013 | 2012 | |||||||||||||||
Sales and marketing | $ | 397,024 | $ | 374,315 | $ | 305,682 | 6 | % | 22 | % | |||||||
Our sales and marketing expenses consist primarily of personnel costs, including commissions and bonuses, as well as costs of public relations, seminars, marketing programs, lead generation, travel, and trade shows. Sales and marketing expenses were $397.0 million (or 38% of total revenues), $374.3 million (or 40% of total revenues), and $305.7 million (or 38% of total revenues) for 2014, 2013, and 2012, respectively.
The $22.7 million (or 6%) increase from 2013 to 2014 was primarily due to a $17.5 million increase in personnel-related costs, a $2.7 million increase in general overhead costs, and a $2.5 million increase in outside services. Personnel-related costs include salaries, employee benefits, sales commissions, and stock-based compensation. Sales and marketing headcount increased from 1,060 at the end of 2013 to 1,183 at the end of 2014.
The $68.6 million (or 22%) increase from 2012 to 2013 was primarily due to a $61.5 million increase in personnel-related costs, a $5.0 million increase in general overhead costs, and a $2.1 million increase in outside services. Personnel-related costs include salaries, employee benefits, sales commissions, and stock-based compensation. Sales and marketing headcount increased from 968 at the end of 2012 to 1,060 at the end of 2013.
We expect sales and marketing expenses as a percentage of total revenues in 2015 to be relatively consistent with, or increase slightly from, 2014 levels. The sales and marketing expenses as a percentage of total revenues may fluctuate from one period to the next due to the timing of hiring new sales and marketing personnel, our spending on marketing programs, and the level of the commission expenditures, in each period.
General and Administrative
The following table sets forth, for the periods indicated, our general and administrative expenses (in thousands, except percentages):
Percentage Change | |||||||||||||||||
Years Ended December 31, | 2013 to 2014 | 2012 to 2013 | |||||||||||||||
2014 | 2013 | 2012 | |||||||||||||||
General and administrative | $ | 82,684 | $ | 77,641 | $ | 63,616 | 6 | % | 22 | % | |||||||
Our general and administrative expenses consist primarily of personnel costs for finance, human resources, legal, and general management, as well as professional service expenses associated with recruiting, legal, tax and accounting services. General and administrative expenses were $82.7 million (or 8% of total revenues), $77.6 million (or 8% of total revenues), and $63.6 million (or 8% of total revenues) for the years ended December 31, 2014, 2013, and 2012, respectively.
General and administrative expenses increased by $5.0 million (or 6%) in 2014 from 2013 due to a $6.3 million increase in personnel-related costs (including stock-based compensation) and a $0.9 million increase in outside services, partially offset by a $2.2 million decrease in facilities related expenses primarily related to the corporate headquarters move that was completed in September 2013. The increase in personnel-related costs of $6.3 million was due to headcount growth in 2014 from 2013 and an increase of $0.8 million in stock-based compensation. General and administrative headcount increased from 378 at the end of 2013 as compared to 418 at the end of 2014.
General and administrative expenses increased by $14.0 million (or 22%) in 2013 from 2012 due to a $10.0 million increase in personnel-related costs (including stock-based compensation) and a $4.0 million increase in general overhead and facilities costs. The increase in personnel-related costs of $10.0 million was due to headcount growth in 2013 from 2012 and an increase of $3.3 million in stock-based compensation.
39
We expect general and administrative expenses as a percentage of total revenues in 2015 to be relatively consistent with the 2014 levels.
Amortization of Intangible Assets
The following table sets forth, for the periods indicated, our amortization of intangible assets (in thousands, except percentages):
Percentage Change | |||||||||||||||||
Years Ended December 31, | 2013 to 2014 | 2012 to 2013 | |||||||||||||||
2014 | 2013 | 2012 | |||||||||||||||
Amortization of intangible assets | $ | 5,943 | $ | 7,729 | $ | 6,578 | (23 | )% | 17 | % | |||||||
Amortization of intangible assets is the amortization of customer relationships and vendor relationships acquired, trade names, covenants not to compete, and patents through prior business acquisitions. Amortization of intangible assets was $5.9 million (or 1% of total revenues), $7.7 million (or 1% of total revenues), and $6.6 million (or 1% of total revenues) for the years ended December 31, 2014, 2013, and 2012, respectively.
The decrease of $1.8 million (or 23%) in 2014 in amortization of intangible assets compared to 2013 was primarily due to a $1.6 million decrease in amortization of certain intangibles which were fully amortized in 2013 and during 2014 and a $1.4 million decrease in amortization of certain intangibles which are amortized using a method based on expected cash flows. Generally cash flows decline over time after an initial ramp up after the intangible assets are first acquired. They were partially offset by a $1.2 million increase in amortization of intangible assets from the acquisition of StrikeIron in 2014. The increase of $1.2 million (or 17%) in 2013 in amortization of intangible assets compared to 2012 was primarily due to increases in amortization of intangible assets from the acquisitions of Heiler Software in late 2012 and Active Endpoints in 2013.
We expect amortization of the remaining intangible assets to be approximately $4.3 million in 2015, before the impact of any amortization for any possible intangible assets acquired as part of any potential future acquisitions.
Facilities Restructuring and Facility Lease Termination Costs, Net
The following table sets forth, for the periods indicated, our facilities restructuring and facility lease termination costs, net (in thousands, except percentages):
Percentage Change | |||||||||||||||||
Years Ended December 31, | 2013 to 2014 | 2012 to 2013 | |||||||||||||||
2014 | 2013 | 2012 | |||||||||||||||
Facilities restructuring and facility lease termination costs, net | $ | — | $ | — | $ | 710 | — | % | (100 | )% | |||||||
In February 2012, we purchased the property associated with our former corporate headquarters in Redwood City, California. The purchase of the buildings discharged our future lease obligations that were previously accounted for under the 2001 and 2004 Restructuring Plans. During 2012, we reversed the existing accrued facilities restructuring liability of $20.6 million and recorded a corresponding facilities restructuring benefit on the consolidated statements of income in accordance with ASC 420, Exit or Disposal Cost Obligations. We also recorded a charge of approximately $21.2 million representing the cost to terminate the operating lease included in facility lease termination costs, net in the consolidated statements of income.
In 2012, we recorded net facilities restructuring and facility lease termination costs of $0.7 million for accretion charges related to the 2004 Restructuring Plan of $0.1 million and an expense of $21.2 million related to the net cost to settle an existing lease obligation, partially offset by a benefit as a result of the reversal of the existing accrued facilities restructuring liability of $20.6 million. There were no further activities after the first quarter of 2012.
40
Acquisitions and Other Charges
The following table sets forth, for the periods indicated, our acquisitions and other charges (in thousands, except percentages):
Percentage Change | |||||||||||||||||
Years Ended December 31, | 2013 to 2014 | 2012 to 2013 | |||||||||||||||
2014 | 2013 | 2012 | |||||||||||||||
Acquisitions and other charges | $ | 1,103 | $ | 2,467 | $ | 2,797 | (55 | )% | (12 | )% | |||||||
In 2014, acquisition and other charges of $1.1 million primarily consisted of legal, accounting, tax, bankers' and other professional service fees.
In 2013, acquisition and other charges of $2.5 million primarily consisted of $2.9 million in charges for legal, accounting, tax, bankers' and other professional services fees, and $1.2 million of severance liabilities to former employees of acquirees. This was partially offset by $1.6 million net benefit for earn-out related adjustments and accretion charges associated with prior acquisitions.
Interest and Other Expense, Net
The following table sets forth, for the periods indicated, our interest and other expense, net (in thousands, except percentages):
Percentage Change | |||||||||||||||||
Years Ended December 31, | 2013 to 2014 | 2012 to 2013 | |||||||||||||||
2014 | 2013 | 2012 | |||||||||||||||
Interest income | $ | 4,646 | $ | 3,486 | $ | 3,993 | 33 | % | (13 | )% | |||||||
Interest expense | (487 | ) | (462 | ) | (497 | ) | 5 | % | (7 | )% | |||||||
Other expense, net | (3,354 | ) | (1,165 | ) | (1,688 | ) | (188 | )% | 31 | % | |||||||
Interest and other expense, net | $ | 805 | $ | 1,859 | $ | 1,808 | (57 | )% | 3 | % | |||||||
Interest and other expense, net consists primarily of interest income earned on our cash, cash equivalents, and short-term investments, as well as foreign exchange transaction gains and losses, and interest expenses. Interest and other expense, net were $0.8 million, $1.9 million, and $1.8 million in 2014, 2013, and 2012, respectively. The decrease in income of $1.1 million (or 57%) in 2014 from 2013 was primarily due to a $2.0 million realized loss on investment in equity interest in 2014 and a $0.2 million increase in foreign exchange losses. These amounts were partially offset by a $1.2 million increase in interest income due to higher cash and investment balances.
Income Tax Provision
The following table sets forth, for the periods indicated, our provision for income taxes (in thousands, except percentages):
Percentage Change | |||||||||||||||||
Years Ended December 31, | 2013 to 2014 | 2012 to 2013 | |||||||||||||||
2014 | 2013 | 2012 | |||||||||||||||
Income tax provision | $ | 56,206 | $ | 54,327 | $ | 44,585 | 3 | % | 22 | % | |||||||
Effective tax rate | 33 | % | 39 | % | 32 | % | (6 | )% | 7 | % | |||||||
Our effective tax rates were 33%, 39%, and 32% for 2014, 2013, and 2012, respectively. The effective tax rate of 33% for 2014 was lower than the federal statutory rate of 35% primarily due to the benefits of foreign earnings in lower-tax jurisdictions, the domestic manufacturing deduction pursuant to Section 199 of Internal Revenue Code, and federal research and development credits, partially offset by nondeductible stock-based compensation, state income taxes, and the accrual of reserves related to
41
uncertain tax positions. In December 2014, the federal research and development credit was reinstated retroactively to January 1, 2014. Due to the timing of the enactment, we recognized the entire federal research and development credit benefit for the year in the fourth quarter of 2014.
The higher tax rate for 2013 was primarily attributable to non-deductible stock-based compensation, state income taxes, the accrual of reserves related to uncertain tax positions and acquisition integration-related income tax expenses resulted in higher taxes in our foreign earnings partially offset by the domestic manufacturing deduction and the recognition of the 2012 and 2013 federal research and development credits.
The effective tax rate of 32% for 2012 differed from the federal statutory rate of 35% primarily due to benefits of foreign earnings in lower-tax jurisdictions, the domestic manufacturing deduction and the benefit of foreign tax credits, partially offset by non-deductible stock-based compensation, state income taxes, acquisition related items, and the accrual of reserves related to uncertain tax positions. Due to the expiration of the research and development credit in 2012, we were unable to recognize any benefit during 2012. This credit was reinstated retroactively in January 2013. Due to the timing of the enactment, we recognized the entire benefit of the 2012 credit in the first quarter of 2013.
We are a U.S.-based multinational corporation subject to tax in various U.S. and foreign tax jurisdictions. This fact causes our effective tax rate to be sensitive to our geographic mix of earnings. A significant portion of our foreign earnings for the current year were earned by the Netherlands and other European subsidiaries. Our results of operations will continue to be adversely affected to the extent that our geographic mix of earnings becomes more weighted toward jurisdictions with higher tax rates, and will be favorably affected to the extent the relative geographic mix shifts to lower tax jurisdictions. Any change in our mix of earnings is dependent upon many factors and is therefore difficult to predict.
Our effective tax rate in 2015 will be highly dependent on the result of our global operations, the execution of business combinations, the outcome of various tax audits and any changes in applicable tax laws. For example, our effective tax rate has historically benefited from the federal research and development tax credit. Further, the geographic mix of earnings is impacted by the fluctuation in currency exchange rates between the U.S. dollar and the functional currencies of our foreign subsidiaries.
Non-GAAP Financial Measures
To supplement Informatica's condensed consolidated financial statements prepared and presented on a GAAP basis, Informatica uses non-GAAP financial measures of income from operations, percentage of income from operations to total revenues, net income and net income per share. These measures are adjusted from income from operations, percentage of income from operations to total revenues, net income or net income per share prepared in accordance with GAAP to exclude the charges and expenses discussed above. The presentation of these non-GAAP financial measures is not meant to be considered in isolation or as a substitute for, or superior to, income from operations, net income or net income per share prepared in accordance with GAAP. For the years ended December 31, 2014, 2013, and 2012, the GAAP and non-GAAP financial measures were as follows (in thousands, except for percentages and per share amounts):
Years Ended December 31, | |||||||||||
2014 | 2013 | 2012 | |||||||||
(Unaudited) | |||||||||||
Income from operations | $ | 169,488 | $ | 138,863 | $ | 135,959 | |||||
Non-GAAP income from operations | $ | 249,037 | $ | 232,979 | $ | 212,329 | |||||
Percentage of income from operations to total revenues | 16 | % | 15 | % | 17 | % | |||||
Non-GAAP percentage of income from operations to total revenues | 24 | % | 25 | % | 26 | % | |||||
Net income | $ | 114,087 | $ | 86,395 | $ | 93,182 | |||||
Non-GAAP net income | $ | 176,932 | $ | 160,746 | $ | 147,145 | |||||
Diluted net income per share | $ | 1.03 | $ | 0.78 | $ | 0.83 | |||||
Non-GAAP diluted net income per share | $ | 1.59 | $ | 1.44 | $ | 1.31 | |||||
We believe the disclosure of such non-GAAP financial measures is appropriate to enhance an overall understanding of its financial performance, its financial and operational decision making and as a means to evaluate period to period comparisons. These adjustments to the Company's GAAP results are made with the intent of providing both management and investors a more complete understanding of the Company's performance, by excluding certain expenses and expenditures, such as non-cash charges and discrete charges that are infrequent in nature, that may not be indicative of its underlying operating results. In addition, we
42
believe that these non-GAAP financial measures are useful to investors because they allow for greater transparency into the indicators used by management as a basis for its financial and operational decision making. We believe that the disclosure of these non-GAAP financial measures provides consistency and comparability of its recent financial results with its historical financial results, as well as to the operating results of other companies in our industry, many of which present non-GAAP financial measures to investors. In addition, we believe that both management and investors benefit from referring to these non-GAAP financial measures when planning, analyzing and forecasting future periods.
There are limitations in using non-GAAP financial measures because non-GAAP financial measures are not prepared in accordance with GAAP, do not reflect a comprehensive system of accounting, may have a material impact on our reported financial results, and exclude some recurring expenses, particularly stock-based compensation. We believe that stock-based compensation will continue to be a significant recurring expense for the foreseeable future and such stock-based compensation is an important part of our employees' compensation, which can impact their performance. Our non-GAAP financial measures may differ from those of other companies in our industry due to potential differences in their financing and accounting methods, the book value of their assets, their capital structures, the method by which their assets were acquired and the manner in which they define non-GAAP measures. Furthermore, the items we exclude in our non-GAAP financial measures may differ from the components our peer companies exclude when they report their non-GAAP measures. In addition, they are subject to inherent limitations as they reflect the exercise of judgments by management about which charges are excluded from the non-GAAP financial measures. Management compensates for these limitations by providing specific information regarding the GAAP amounts excluded from non-GAAP measures and evaluating non-GAAP measures together with the corresponding measures calculated in accordance with GAAP.
Reconciliation of GAAP Financial Measures to Non-GAAP Financial Measures
The following tables are a reconciliation of our non-GAAP financial measures to their most directly comparable GAAP measure (in thousands, except percentages):
Years Ended December 31, | |||||||||||
2014 | 2013 | 2012 | |||||||||
(Unaudited) | |||||||||||
Total revenues | $ | 1,047,954 | $ | 948,171 | $ | 811,571 | |||||
Income from operations | $ | 169,488 | $ | 138,863 | $ | 135,959 | |||||
Percentage of income from operations to total revenues | 16 | % | 15 | % | 17 | % | |||||
Plus: | |||||||||||
Amortization of acquired technology | 13,141 | 22,307 | 21,980 | ||||||||
Amortization of intangible assets | 5,943 | 7,729 | 6,578 | ||||||||
Facilities restructuring and facility lease termination costs | — | — | 710 | ||||||||
Pre-occupancy building operating expense | — | 4,409 | 1,502 | ||||||||
Acquisitions and other charges | 1,103 | 2,467 | 2,797 | ||||||||
Stock-based compensation | 59,362 | 57,204 | 42,803 | ||||||||
Non-GAAP income from operations | $ | 249,037 | $ | 232,979 | $ | 212,329 | |||||
Non-GAAP percentage of income from operations to total revenues | 24 | % | 25 | % | 26 | % | |||||
43
Years Ended December 31, | |||||||||||
2014 | 2013 | 2012 | |||||||||
(Unaudited) | |||||||||||
Net income | $ | 114,087 | $ | 86,395 | $ | 93,182 | |||||
Plus: | |||||||||||
Amortization of acquired technology | 13,141 | 22,307 | 21,980 | ||||||||
Amortization of intangible assets | 5,943 | 7,729 | 6,578 | ||||||||
Facilities restructuring and facility lease termination costs | — | — | 710 | ||||||||
Pre-occupancy building operating expense | — | 4,409 | 1,502 | ||||||||
Acquisitions and other charges | 1,103 | 2,467 | 2,797 | ||||||||
Stock-based compensation | 59,362 | 57,204 | 42,803 | ||||||||
Loss on investment in equity interest | 1,998 | — | — | ||||||||
Income tax adjustments | (18,702 | ) | (19,765 | ) | (22,407 | ) | |||||
Non-GAAP net income | $ | 176,932 | $ | 160,746 | $ | 147,145 | |||||
Diluted net income per share: | |||||||||||
Diluted GAAP net income per share | $ | 1.03 | $ | 0.78 | $ | 0.83 | |||||
Plus: | |||||||||||
Amortization of acquired technology | 0.12 | 0.20 | 0.20 | ||||||||
Amortization of intangible assets | 0.05 | 0.07 | 0.06 | ||||||||
Facilities restructuring and facility lease termination costs | — | — | 0.01 | ||||||||
Pre-occupancy building operating expense | — | 0.04 | 0.01 | ||||||||
Acquisitions and other charges | 0.01 | 0.02 | 0.02 | ||||||||
Stock-based compensation | 0.53 | 0.51 | 0.38 | ||||||||
Loss on investment in equity interest | 0.02 | — | — | ||||||||
Income tax adjustments | (0.17 | ) | (0.18 | ) | (0.20 | ) | |||||
Diluted Non-GAAP net income per share | $ | 1.59 | $ | 1.44 | $ | 1.31 | |||||
Our non-GAAP financial measures may exclude items such as the following:
Amortization of acquired technology and intangible assets. We incur amortization of acquired technology and intangible assets in connection with acquisitions of certain businesses and technologies. Amortization of acquired technology and intangible assets is inconsistent in amount and frequency and is significantly affected by the timing and size of our acquisitions. Investors should note that the use of acquired technology and intangible assets contributed to our revenues earned during the periods presented and will contribute to our future period revenues as well. Amortization of purchased intangible assets will recur in future periods.
Facilities restructuring and facility lease termination costs. In 2012, we recorded net facilities restructuring and facility lease termination costs of $0.7 million for accretion charges related to the 2004 Restructuring Plan and an expense related to the net cost to settle an existing lease obligation, partially offset by a benefit as a result of the reversal of the existing accrued facilities restructuring liability. There were no further activities after the first quarter of 2012.
Pre-occupancy building operating expense. We exclude expense from operating current headquarters buildings purchased in February 2012 prior to occupancy in September 2013.
Acquisition and other charges. We exclude certain expense items resulting from acquisitions including the following, when applicable: (1) legal, accounting, tax, bankers' and other professional service fees to the extent associated with acquisitions; and (ii) changes in fair value and other adjustments of contingent consideration, adjustments related to hold-back, and severance liabilities to former employees of acquirees. We consider these adjustments, to some extent, to be unpredictable and dependent on the frequency and size of acquisitions that occur during a given period. Furthermore, acquisitions result in non-continuing operating expenses, which would not otherwise have been incurred by us in the normal course of our organic business operations, with respect to each acquisition.
44
Stock-based compensation. We exclude stock-based compensation expenses from non-GAAP measures primarily because these are non-cash expenses and management finds it useful to exclude certain non-cash charges to assess the appropriate level of various operating expenses to assist in budgeting, planning and forecasting future periods. Moreover, Informatica believes that it enhances comparability with similar companies' operating results by excluding stock compensation in its non-GAAP financial measures because of the different types of stock-based awards that companies may grant and because ASC 718 (“Stock Compensation”) allows companies to use different valuation methodologies and subjective assumptions.
Loss on investment in equity interest. We excluded a realized loss related to an investment in an equity interest.
Income tax adjustments. The income tax effects that are excluded from the non-GAAP measures relate to the tax impact on the difference between GAAP and non-GAAP expenses, primarily relate to stock-based compensation, amortization of acquired technology and intangible assets, and acquisition and other charges for GAAP and non-GAAP measures.
Liquidity and Capital Resources
We have funded our operations primarily through cash flows from operations and equity and debt offerings in the past. As of December 31, 2014, we had $721.7 million in available cash and cash equivalents and short-term investments. Our primary sources of cash are the collection of accounts receivable from our customers and proceeds from the exercise of stock options and stock purchased under our employee stock purchase plan. In addition, as of December 31, 2014, we had $220.0 million available for borrowing under the credit agreement discussed below. Our uses of cash include payroll and payroll-related expenses and operating expenses such as marketing programs, travel, professional services, and facilities and related costs. We have also used cash to purchase property and equipment, repurchase common stock from the open market to reduce the dilutive impact of stock option issuances, and acquire businesses and technologies to expand our product offerings. In February 2012, we purchased the property associated with our former corporate headquarters located in Redwood City, California, for approximately $148.6 million in cash.
Approximately 32% of our cash, cash equivalents, and short-term investments are held by our foreign subsidiaries. Our intent is to indefinitely reinvest our earnings from foreign operations and current plans do not anticipate that we will need funds generated from foreign operations to fund our domestic operations. In the event funds from foreign operations are needed to fund operations in the U.S. and if U.S. tax has not already been previously accrued, we would be required to accrue and pay additional U.S. taxes in order to repatriate these funds.
The following table summarizes our cash flows for 2014, 2013, and 2012 (in thousands):
Years Ended December 31, | ||||||||||||
2014 | 2013 | 2012 | ||||||||||
Cash provided by operating activities | $ | 233,191 | $ | 201,150 | $ | 200,501 | ||||||
Cash used in investing activities | $ | (56,036 | ) | $ | (71,440 | ) | $ | (290,098 | ) | |||
Cash used in financing activities | $ | (90,315 | ) | $ | (23,781 | ) | $ | (37,784 | ) | |||
Operating Activities: Cash provided by operating activities in 2014 was $233.2 million, representing an increase of $32.0 million from 2013. This increase resulted primarily from a $27.7 million increase in net income, an $18.3 million increase in adjustments for non-cash expenses, a $4.0 million increase in net cash inflow from accounts payable and other accrued liabilities, and a $1.3 million decrease in net cash outflow from accounts receivable. These were partially offset by a $10.8 million increase in net cash outflow from income taxes payable, a $7.8 million decrease in net cash inflow from deferred revenues and a $0.7 million increase in net cash outflow from prepaid expenses and other assets. We recognized excess tax benefits from stock-based compensation of $3.8 million during the year ended December 31, 2014. This amount is recorded as a use of cash in operating activities and an offsetting amount is recorded as a source of cash provided by financing activities. We made net cash payments for taxes in different jurisdictions of $58.5 million during the year ended December 31, 2014. Our “days sales outstanding” in accounts receivable increased from 67 days at December 31, 2013 to 71 days at December 31, 2014 due to higher amount of billings which occurred toward the end of 2014 compared to 2013.
Cash provided by operating activities in 2013 was $201.2 million, representing an increase of $0.6 million from 2012. This increase resulted primarily from a $24.0 million decrease in net cash outflow from accrued facilities restructuring charges, a $16.1 million increase in net cash inflow from accounts payable and other accrued liabilities, an $11.4 million increase in net cash inflow from deferred revenues and an $8.0 million increase in net cash inflow from income taxes payable. These were partially offset by a $40.7 million increase in net cash outflow from accounts receivable, a $10.2 million decrease in net cash inflow from prepaid expenses and other assets, a $6.8 million decrease in net income, and a $1.2 million decrease in adjustments for non-cash expenses. We recognized excess tax benefits from stock-based compensation of $27.5 million during the year ended December 31, 2013. This amount is recorded as a use of cash in operating activities and an offsetting amount is recorded as a source of cash provided
45
by financing activities. We made net cash payments for taxes in different jurisdictions of $42.7 million during the year ended December 31, 2013. Our “days sales outstanding” in accounts receivable was 67 days at both December 31, 2013 and December 31, 2012.
Cash provided by operating activities in 2012 was $200.5 million, representing an increase of $26.0 million from 2011. This increase resulted primarily from a $37.0 million increase in net cash inflow from accounts receivable, a $30.8 million increase in net cash inflow from prepaid expenses and other assets, a $14.6 million increase in adjustments for non-cash expenses, and a $0.3 million increase in net cash inflow from deferred revenues. These were partially offset by a $24.3 million decrease in net income, an $11.5 million increase in net cash outflow from accounts payable and other accrued liabilities, an $11.3 million decrease in net cash inflow from income taxes payable, and a $9.6 million increase in net cash outflow from accrued facilities restructuring charges. We recognized excess tax benefits from stock-based compensation of $17.0 million during the year ended December 31, 2012. This amount is recorded as a use of cash in operating activities and an offsetting amount is recorded as a source of cash provided by financing activities. We made net cash payments for taxes in different jurisdictions of $31.2 million during the year ended December 31, 2012. Our “days sales outstanding” in accounts receivable decreased from 71 days at December 31, 2011 to 67 days at December 31, 2012 due to stronger collections in the fourth quarter of 2012, compared to 2011.
Investing Activities: Net cash used in investing activities was $56.0 million in 2014 due to $260.9 million of purchases of investments; $54.6 million and $4.0 million, net of cash acquired, used to acquire StrikeIron and Proact, respectively; $21.0 million in purchases of property and equipment; $0.3 million in purchase of an investment in equity interest; and $0.3 million payment to license patents. These cash outflows were partially offset by the maturities of investments of $221.0 million and sales of investments of $64.1 million.
Certain reclassifications have been made within the consolidated statement of cash flows to conform to the current year presentation. See Note 2. Summary of Significant Accounting Policies of Notes to Consolidated Financial Statements in Part II, Item 8 of this Report for more information.
Net cash used in investing activities was $71.4 million in 2013 due to $367.8 million of purchases of investments, $26.5 million in purchases of property and equipment; $7.5 million used for acquisitions of businesses, net of cash acquired; and $2.4 million used for purchases of an investment in equity interest and developed technology. These amounts were partially offset by cash provided from the maturities of investments of $249.3 million and sales of investments of $83.5 million.
Net cash used in investing activities was $290.1 million in 2012. In February 2012, we purchased the property associated with our former corporate headquarters located in Redwood City, California, for approximately $148.6 million in cash, of which $127.5 million was capitalized under property and equipment in the consolidated balance sheet, and approximately $21.2 million was recorded in our consolidated statement of income as the net cost to terminate the facility lease. We relocated our corporate headquarters to the purchased property in the third quarter of 2013. We also used cash in purchases of investments of $266.1 million and acquisitions of businesses of $90.5 million, net of cash acquired. These amounts were partially offset by cash provided from the maturities of investments of $199.5 million and sales of investments of $8.9 million.
We have identified our investment portfolio as “available for sale,” and our investment objectives are to preserve principal and provide liquidity while maximizing yields without significantly increasing risk. We may sell an investment at any time if the credit rating of the investment declines, the yield on the investment is no longer attractive, or we need additional cash. We invest only in money market funds, time deposits, and marketable debt securities. We believe that the purchase, maturity, or sale of our investments has no material impact on our overall liquidity.
We acquire property and equipment in our normal course of business. The amount and timing of these purchases and the related cash outflows in future periods depend on a number of factors, including the hiring of employees, the rate of upgrade of computer hardware and software used in our business, as well as our business outlook.
We have used cash to acquire businesses and technologies that enhance and expand our product offerings, and we anticipate that we will continue to do so in the future. Due to the nature of these transactions, it is difficult to predict the amount and timing of such cash requirements to complete such transactions. We may be required to raise additional funds to complete future acquisitions. In addition, we may be obligated to pay certain variable and deferred earn-out payments based upon achievement of certain performance targets.
In June 2014, we acquired StrikeIron for approximately $54.6 million in cash. Approximately $8.3 million of the consideration otherwise payable to former StrikeIron stockholders was placed into an escrow and held as partial security for certain indemnification obligations. The escrow will remain in place until September 2015.
46
In February 2013, we acquired Active Endpoints for approximately $10.0 million in cash. Approximately $1.5 million of the consideration otherwise payable to former Active Endpoints stockholders was placed into an escrow and held as partial security for certain indemnification obligations. The entire escrow fund was released in the second quarter of 2014.
In 2012, we completed a takeover offer and acquired a majority interest in Heiler Software for an aggregate amount of $82.1 million, net of cash acquired. As of December 31, 2012, we held approximately 97.7% of the outstanding shares of Heiler Software. The squeeze-out of the remaining shareholders of Heiler Software was effective in the second quarter of 2013, increasing our ownership of Heiler Software to 100 percent. Also in 2012, we acquired DataScout Solutions Group Limited and TierData, Inc. for an aggregate amount of $8.4 million, net of cash acquired. Approximately $1.4 million of the consideration otherwise payable to former Data Scout shareholders was held as partial security for certain indemnification obligations, and was subsequently released in the first quarter of 2014. Approximately $1.4 million of the consideration otherwise payable to former TierData stockholders was held as partial security for certain indemnification obligations, and was subsequently released in the first quarter of 2014.
In 2010, we made a $1.5 million investment in a privately-held company, and from 2011 to 2012, we made additional investments in that company of $0.6 million. During 2014, we realized a loss of $2.0 million on investment in that company. During 2013, we made a $2.0 million investment in another privately-held company and an additional investment of $0.3 million in that company in 2014. The carrying value of these investments was $2.3 million at December 31, 2014.
Financing Activities: Net cash used in financing activities in 2014 was $90.3 million due to repurchases and retirement of our common stock of $141.2 million, withholding taxes for restricted stock units net share settlement of $7.9 million, payment of contingent consideration in connection with acquisitions of $3.1 million, and payment of issuance costs on our credit facility of $0.9 million. These amounts were partially offset by $59.0 million of proceeds received from the issuance of common stock to option holders and participants of our ESPP program and $3.8 million of excess tax benefits from stock-based compensation.
Net cash used in financing activities in 2013 was $23.8 million due to repurchases and retirement of our common stock of $92.1 million, payment of contingent consideration in connection with acquisitions of $4.2 million, purchase of Heiler Software securities of $6.4 million, and withholding taxes for restricted stock units net share settlement of $7.3 million. These amounts were partially offset by $58.7 million of proceeds received from the issuance of common stock to option holders and participants of our ESPP program and $27.5 million of excess tax benefits from stock-based compensation.
Net cash used in financing activities in 2012 was $37.8 million due to repurchases and retirement of our common stock of $81.0 million, payment of contingent consideration in connection with acquisitions of $8.1 million, and withholding taxes for restricted stock units net share settlement of $6.7 million. These amounts were offset by $41.4 million of proceeds received from the issuance of common stock to option holders and participants of our ESPP program and $17.0 million of excess tax benefits from stock-based compensation.
We receive cash from the exercise of common stock options and the sale of common stock under our employee stock purchase plan (“ESPP”). Although we expect to continue to receive some proceeds from the issuance of common stock to option holders and participants of ESPP in future periods, the timing and amount of such proceeds are difficult to predict and are contingent on a number of factors, including the price of our common stock, the number of employees participating in our stock option plans and our employee stock purchase plan, and overall market conditions.
Our Board of Directors has approved a stock repurchase program for the repurchase of our common stock. Purchases can be made from time to time in the open market and will be funded from our available cash. The primary purpose of these programs is to enhance shareholder value, including to partially offset the dilutive impact of stock based incentive plans. The number of shares to be purchased and the timing of purchases are based on several factors, including the price of our common stock, our liquidity and working capital needs, general business and market conditions, and other investment opportunities. The repurchased shares are retired and reclassified as authorized and unissued shares of common stock. We may continue to repurchase shares from time to time, as determined by management as authorized by the Board of Directors. In each of January, July, and October of 2014, the Board of Directors approved the repurchase of up to an additional $100 million of our outstanding common stock, with such authorizations aggregating to $300 million. As of December 31, 2014, $162.8 million remained available for share repurchases under this program. In January 2015, we announced that the Board of Directors approved an additional of $337 million to augment its existing authorization under the Company's stock repurchase program. Subsequently in February 2015, we entered into initiated two separate accelerated stock repurchase (“ASR”) agreements with two financial institutions to repurchase an aggregate of $300 million of our common stock. Under the terms of the ASR agreements, we paid an aggregate of $300 million in cash and received an initial delivery of approximately 5.7 million shares on February 4, 2015. The final number of shares to be repurchased will be based on our volume-weighted average stock price less an agreed upon discount during the term of the transactions. This final settlement of shares is expected to occur no later than the second quarter of 2015. We currently intend to utilize the $200 million authorization remaining after the ASR to repurchase shares of our outstanding common stock in the second half of 2015. For
47
further information about the ASR, see Note 20. Subsequent Event of Notes to Consolidated Financial Statements in Part II, Item 8 of this Report. See Part II, Item 5 of this Report for information regarding the number of shares purchased under the stock repurchase program.
We believe that our cash balances and the cash flows generated by operations will be sufficient to satisfy our anticipated cash needs for working capital and capital expenditures for at least the next 12 months. However, we may be required to raise or desire additional funds for selective purposes, such as acquisitions or other investments in complementary businesses, products, or technologies, and may raise such additional funds through public or private equity or debt financing or from other sources.
Credit Agreement
In September 2014, we entered into a Credit Agreement (the “Credit Agreement”) that matures in September 2019. This Credit Agreement replaces the former agreement that matured on September 29, 2014. The Credit Agreement provides for an unsecured revolving credit facility in an amount of up to $220.0 million, with an option for us to request to increase the revolving loan commitments or to enter into tranches of term loans in an aggregate amount of up to $30.0 million, for a total credit facility of up to $250.0 million. The revolving credit facility has sublimits for swingline loans up to $10.0 million available on a same day basis and for the issuance of standby letters of credit in a face amount up to $20.0 million. No amounts were borrowed in 2014 and 2013 or outstanding under the Credit Agreement as of December 31, 2014, and a total of $220.0 million remained available for borrowing. The Credit Agreement contains customary representations and warranties, covenants and events of default, including the requirement to maintain a maximum consolidated leverage ratio of 2.75 to 1.00 and a minimum consolidated interest coverage ratio of 3.50 to 1.00. We were in compliance with all covenants under the Credit Agreement as of December 31, 2014. For further information, see Note 6. Borrowings of Notes to Consolidated Financial Statements in Part II, Item 8 of this Report.
Contractual Obligations and Operating Leases
The following table summarizes our significant contractual obligations, including future minimum lease payments at December 31, 2014, under non-cancelable operating leases with original terms in excess of one year, and the effect of such obligations on our liquidity and cash flows in the future periods (in thousands):
Payment Due by Period | |||||||||||||||||||
Total | 2015 | 2016 and 2017 | 2018 and 2019 | 2020 and Beyond | |||||||||||||||
Operating lease payments | $ | 51,997 | $ | 11,709 | $ | 18,059 | $ | 13,866 | $ | 8,363 | |||||||||
The above commitment table does not include approximately $30.4 million of long-term income tax liabilities recorded in accordance with ASC 740, Income Taxes. We are unable to make a reasonably reliable estimate of the timing of these potential future payments in individual years beyond 12 months due to uncertainties in the timing of tax audit outcomes. As a result, this amount is not included in the table above. For further information, see Note 12. Income Taxes of Notes to Consolidated Financial Statements in Part II, Item 8 of this Report.
Contractual Obligations
Purchase orders or contracts for the purchase of certain goods and services are not included in the preceding table. We cannot determine the aggregate amount of such purchase orders that represent contractual obligations because purchase orders may represent authorizations to purchase rather than binding agreements. For the purposes of this table, contractual obligations for purchase of goods or services are defined as agreements that are enforceable and legally binding and that specify all significant terms, including fixed or minimum quantities to be purchased; fixed, minimum, or variable price provisions; and the approximate timing of the transaction. Our purchase orders are based on our current needs and are fulfilled by our vendors within short time horizons. We also enter into contracts for outsourced services; however, the obligations under these contracts were not significant and the contracts generally contain clauses allowing for cancellation without significant penalty. Contractual obligations that are contingent upon the achievement of certain milestones are not included in the table above.
We estimate the expected timing of payment of the obligations discussed above based on current information. Timing of payments and actual amounts paid may be different depending on the time of receipt of goods or services or changes to agreed-upon amounts for some obligations.
Operating Leases
We lease certain office facilities and equipment under non-cancelable operating leases, which expire at various dates through 2024.
48
The expected timing of payment of the obligations discussed above is estimated based on current information. Timing of payments and actual amounts paid may be different.
Off-Balance Sheet Arrangements
We do not have any off-balance sheet financing arrangements, transactions, or relationships with “special purpose entities.”
ITEM 7A. QUANTITATIVE AND QUALITATIVE DISCLOSURES ABOUT MARKET RISK
Foreign Currency Exchange Rate Risk
We market and sell our software and services through our direct sales force and indirect channel partners in North America, EMEA, Asia-Pacific, and Latin America. Accordingly, we are subject to exposure from adverse movements in foreign currency exchange rates. The functional currency of our foreign subsidiaries is their local currencies, except for Informatica Cayman Ltd., which uses the Euro as its functional currency. Our exposure to foreign exchange risk is related to the magnitude of foreign net profits and losses denominated in foreign currencies, in particular the Indian rupee, Euro and British pound sterling, as well as our net position of monetary assets and monetary liabilities held by our foreign subsidiaries in their non-functional currencies. These exposures have the potential to produce either gains or losses within our consolidated results. Our foreign operations, however, in most instances act as a natural hedge since both operating expenses as well as revenues are generally denominated in their respective local currency. In these instances, although an unfavorable change in the exchange rate of foreign currencies against the U.S. dollar will result in lower revenues when translated into U.S. dollars, the operating expenses will be lower as well.
Our earnings and cash flows are subject to fluctuations due to changes in foreign currency exchange rates. We use derivative instruments to manage our exposure to fluctuations in certain foreign currency exchange rates which exist as part of ongoing business operations.
Cash Flow Hedge Activities
We enter into certain cash flow hedge programs in an attempt to reduce the impact of certain foreign currency fluctuations. These contracts are designated and documented as cash flow hedges. The purpose of these programs is to reduce the volatility of identified cash flow and expenses caused by movement in certain foreign currency exchange rates, in particular, the Indian rupee. Under these programs, the effective portion of the gain or loss on the derivative instrument is reported as a component of other comprehensive income (loss) and is reclassified into earnings in the same period or periods during which the hedged forecasted transaction affects earnings.
As of December 31, 2014, the remaining open foreign exchange contracts, carried at fair value, are hedging Indian rupee expenses and have a maturity of thirteen months or less. These foreign exchange contracts mature monthly as the foreign currency denominated expenses are paid and any gain or loss is offset against operating expense.
The table below presents the notional amounts of the foreign exchange forward contracts that we committed to purchase in 2014 for Indian rupees, which were outstanding as of December 31, 2014 (in thousands):
Notional Amount Purchased | ||||||
Functional currency | Foreign Amount | USD Equivalent | ||||
Indian rupee | 2,974,415 | $ | 45,914 | |||
2,974,415 | $ | 45,914 | ||||
When the forecasted transaction occurs, we reclassify the effective portion related gain or loss on the cash flow hedge from accumulated other comprehensive income to cost of service revenues and operating expenditures. If the hedge program becomes ineffective or if the underlying forecasted transaction does not occur for any reason, or it becomes probable that it will not occur, we reclassify the gain or loss on the related cash flow hedge from accumulated other comprehensive income (loss) to other income (expense) in the consolidated statements of income. For the year-ended December 31, 2014, there was an insignificant amount of gain reclassified into earnings as a result of the discontinuance of cash flow hedges when it was no longer probable that the original forecasted transactions would occur by the end of the originally specified time period.
49
Balance Sheet Hedge Activities
We also enter into foreign exchange contracts to hedge net monetary assets and liabilities that are denominated in currencies other than the functional currency of our subsidiaries. The notional amounts of foreign currency contracts open at year end in U.S. dollar equivalents were to buy $10.6 million and $2.6 million at December 31, 2014 and 2013, respectively. The notional amounts of foreign currency contracts open at year end in U.S. dollar equivalents were to sell $57.1 million at December 31, 2014. There was no open foreign currency contracts to sell at December 31, 2013. These foreign exchange contracts are carried at fair value and either did not or no longer qualify for hedge accounting treatment and are not designated as hedging instruments. Changes in the value of the foreign exchange contracts are recognized in other income (expense) and offset the foreign currency gain or loss on the underlying net monetary assets or liabilities.
The table below presents the notional amount of the non-designated foreign currency contracts as of December 31, 2014 (in thousands):
Foreign Amount | USD Equivalent | ||||||||||||
Functional currency | Notional Amount Sold | Notional Amount Purchased | Notional Amount Sold | Notional Amount Purchased | |||||||||
Euro | 47,196 | — | $ | 57,101 | $ | — | |||||||
Indian rupee | — | 688,585 | — | 10,594 | |||||||||
47,196 | 688,585 | $ | 57,101 | $ | 10,594 | ||||||||
See Note 2. Summary of Significant Accounting Policies, Note 9. Accumulated Other Comprehensive Loss, Note 10. Derivative Financial Instruments, and Note 14. Commitments and Contingencies of Notes to Consolidated Financial Statements in Part II, Item 8 of this Report for a further discussion.
Interest Rate Risk
Our exposure to market risk for changes in interest rates relates primarily to our investment portfolio. We do not use derivative financial instruments in our investment portfolio. The primary objective of our investment activities is to preserve principal while maximizing yields without significantly increasing risk. Our investment policy specifies credit quality standards for our investments and limits the amount of credit exposure to any single issue, issuer, or type of investment. Our investments consist of certificates of deposit, commercial paper, corporate notes and bonds, money market funds, time deposits, municipal securities, and U.S. government and agency notes and bonds. All investments are carried at market value, which approximates cost. See Note 3. Cash, Cash Equivalents, and Short-Term Investments of Notes to Consolidated Financial Statements in Part II, Item 8 of this Report.
The following table presents the fair value of cash equivalents and short-term investments that are subject to interest rate risk and the average interest rate as of December 31, 2014 and 2013 (dollars in thousands):
December 31, | |||||||
2014 | 2013 | ||||||
Cash equivalents and short-term investments | $ | 368,474 | $ | 413,862 | |||
Average rate of return | 0.5 | % | 0.5 | % | |||
Our cash equivalents and short-term investments are subject to interest rate risk and will decline in value if market interest rates increase. As of December 31, 2014, we had net unrealized loss of $0.2 million associated with these securities. If market interest rates were to change immediately and uniformly by 100 basis points from levels as of December 31, 2014, the fair market value of the portfolio would change by approximately $2.5 million. Additionally, we have the ability to hold our investments until maturity and, therefore, we would not necessarily expect to realize an adverse impact on income or cash flows. At this time, we do not expect a significant change in our average rate of return in 2015.
ITEM 8. FINANCIAL STATEMENTS AND SUPPLEMENTARY DATA
The following consolidated financial statements, and the related notes thereto, of Informatica Corporation and the Reports of Independent Registered Public Accounting Firm are filed as a part of this Report.
50
REPORT OF INDEPENDENT REGISTERED PUBLIC ACCOUNTING FIRM
The Board of Directors and Stockholders of Informatica Corporation
We have audited Informatica Corporation's internal control over financial reporting as of December 31, 2014, based on criteria established in Internal Control - Integrated Framework issued by the Committee of Sponsoring Organizations of the Treadway Commission (2013 framework) (the COSO criteria). Informatica Corporation's management is responsible for maintaining effective internal control over financial reporting, and for its assessment of the effectiveness of internal control over financial reporting included in the accompanying Report of Management on Internal Control over Financial Reporting. Our responsibility is to express an opinion on the company's internal control over financial reporting based on our audit.
We conducted our audit in accordance with the standards of the Public Company Accounting Oversight Board (United States). Those standards require that we plan and perform the audit to obtain reasonable assurance about whether effective internal control over financial reporting was maintained in all material respects. Our audit included obtaining an understanding of internal control over financial reporting, assessing the risk that a material weakness exists, testing and evaluating the design and operating effectiveness of internal control based on the assessed risk, and performing such other procedures as we considered necessary in the circumstances. We believe that our audit provides a reasonable basis for our opinion.
A company's internal control over financial reporting is a process designed to provide reasonable assurance regarding the reliability of financial reporting and the preparation of financial statements for external purposes in accordance with generally accepted accounting principles. A company's internal control over financial reporting includes those policies and procedures that (1) pertain to the maintenance of records that, in reasonable detail, accurately and fairly reflect the transactions and dispositions of the assets of the company; (2) provide reasonable assurance that transactions are recorded as necessary to permit preparation of financial statements in accordance with generally accepted accounting principles, and that receipts and expenditures of the company are being made only in accordance with authorizations of management and directors of the company; and (3) provide reasonable assurance regarding prevention or timely detection of unauthorized acquisition, use or disposition of the company's assets that could have a material effect on the financial statements.
Because of its inherent limitations, internal control over financial reporting may not prevent or detect misstatements. Also, projections of any evaluation of effectiveness to future periods are subject to the risk that controls may become inadequate because of changes in conditions, or that the degree of compliance with the policies or procedures may deteriorate.
In our opinion, Informatica Corporation maintained, in all material respects, effective internal control over financial reporting as of December 31, 2014, based on the COSO criteria.
We also have audited, in accordance with the standards of the Public Company Accounting Oversight Board (United States), the consolidated balance sheets of Informatica Corporation as of December 31, 2014 and 2013, and the related consolidated statements of income, comprehensive income, stockholders' equity, and cash flows for each of the three years in the period ended December 31, 2014 of Informatica Corporation and our report dated February 26, 2015 expressed an unqualified opinion thereon.
/s/ ERNST & YOUNG LLP
San Francisco, California
February 26, 2015
51
REPORT OF INDEPENDENT REGISTERED PUBLIC ACCOUNTING FIRM
The Board of Directors and Stockholders of Informatica Corporation
We have audited the accompanying consolidated balance sheets of Informatica Corporation as of December 31, 2014 and 2013, and the related consolidated statements of income, comprehensive income, stockholders' equity, and cash flows for each of the three years in the period ended December 31, 2014. Our audits also included the financial statement schedule listed in the Index at Item 15(a). These financial statements and schedule are the responsibility of the Company's management. Our responsibility is to express an opinion on these financial statements and schedule based on our audits.
We conducted our audits in accordance with the standards of the Public Company Accounting Oversight Board (United States). Those standards require that we plan and perform the audit to obtain reasonable assurance about whether the financial statements are free of material misstatement. An audit includes examining, on a test basis, evidence supporting the amounts and disclosures in the financial statements. An audit also includes assessing the accounting principles used and significant estimates made by management, as well as evaluating the overall financial statement presentation. We believe that our audits provide a reasonable basis for our opinion.
In our opinion, the financial statements referred to above present fairly, in all material respects, the consolidated financial position of Informatica Corporation at December 31, 2014 and 2013, and the consolidated results of its operations and its cash flows for each of the three years in the period ended December 31, 2014, in conformity with U.S. generally accepted accounting principles. Also, in our opinion, the related financial statement schedule, when considered in relation to the basic financial statements taken as a whole, presents fairly in all material respects the information set forth therein.
We also have audited, in accordance with the standards of the Public Company Accounting Oversight Board (United States), Informatica Corporation's internal control over financial reporting as of December 31, 2014, based on criteria established in Internal Control - Integrated Framework issued by the Committee of Sponsoring Organizations of the Treadway Commission (2013 framework) and our report dated February 26, 2015 expressed an unqualified opinion thereon.
/s/ ERNST & YOUNG LLP
San Francisco, California
February 26, 2015
52
INFORMATICA CORPORATION
CONSOLIDATED BALANCE SHEETS
(In thousands, except par value)
December 31, | |||||||
2014 | 2013 | ||||||
Assets | |||||||
Current assets: | |||||||
Cash and cash equivalents | $ | 368,531 | $ | 297,818 | |||
Short-term investments | 353,130 | 379,616 | |||||
Accounts receivable, net of allowances of $3,465 and $4,135, respectively | 235,705 | 204,374 | |||||
Deferred tax assets | 46,867 | 32,898 | |||||
Prepaid expenses and other current assets | 25,447 | 34,541 | |||||
Total current assets | 1,029,680 | 949,247 | |||||
Property and equipment, net | 159,708 | 157,308 | |||||
Goodwill | 551,196 | 523,142 | |||||
Other intangible assets, net | 43,161 | 41,625 | |||||
Long-term deferred tax assets | 32,032 | 44,865 | |||||
Other assets | 13,809 | 6,834 | |||||
Total assets | $ | 1,829,586 | $ | 1,723,021 | |||
Liabilities and Stockholders' Equity | |||||||
Current liabilities: | |||||||
Accounts payable | $ | 12,009 | $ | 9,257 | |||
Accrued liabilities | 60,404 | 54,740 | |||||
Accrued compensation and related expenses | 88,336 | 80,496 | |||||
Income taxes payable | 6,895 | 14,184 | |||||
Deferred revenues | 324,296 | 285,184 | |||||
Total current liabilities | 491,940 | 443,861 | |||||
Long-term deferred revenues | 14,679 | 12,938 | |||||
Long-term income taxes payable | 30,350 | 29,878 | |||||
Other liabilities | 3,666 | 594 | |||||
Total liabilities | 540,635 | 487,271 | |||||
Commitments and contingencies (Note 14) | |||||||
Stockholders' equity: | |||||||
Common stock, $0.001 par value; 200,000 shares authorized; 108,704 shares and | |||||||
108,643 shares issued and outstanding at December 31, 2014 and 2013, respectively | 109 | 109 | |||||
Additional paid-in capital | 773,419 | 805,728 | |||||
Accumulated other comprehensive loss | (31,789 | ) | (3,212 | ) | |||
Retained earnings | 547,212 | 433,125 | |||||
Total stockholders’ equity | 1,288,951 | 1,235,750 | |||||
Total liabilities and stockholders' equity | $ | 1,829,586 | $ | 1,723,021 | |||
See accompanying notes to consolidated financial statements.
53
INFORMATICA CORPORATION
CONSOLIDATED STATEMENTS OF INCOME
(In thousands, except per share data)
Years Ended December 31, | |||||||||||
2014 | 2013 | 2012 | |||||||||
Revenues: | |||||||||||
Software | $ | 457,364 | $ | 413,738 | $ | 350,175 | |||||
Service | 590,590 | 534,433 | 461,396 | ||||||||
Total revenues | 1,047,954 | 948,171 | 811,571 | ||||||||
Cost of revenues: | |||||||||||
Software | 13,048 | 9,838 | 7,844 | ||||||||
Service | 171,657 | 149,136 | 122,798 | ||||||||
Amortization of acquired technology | 13,141 | 22,307 | 21,980 | ||||||||
Total cost of revenues | 197,846 | 181,281 | 152,622 | ||||||||
Gross profit | 850,108 | 766,890 | 658,949 | ||||||||
Operating expenses: | |||||||||||
Research and development | 193,866 | 165,875 | 143,607 | ||||||||
Sales and marketing | 397,024 | 374,315 | 305,682 | ||||||||
General and administrative | 82,684 | 77,641 | 63,616 | ||||||||
Amortization of intangible assets | 5,943 | 7,729 | 6,578 | ||||||||
Facilities restructuring and facility lease termination costs | — | — | 710 | ||||||||
Acquisitions and other charges | 1,103 | 2,467 | 2,797 | ||||||||
Total operating expenses | 680,620 | 628,027 | 522,990 | ||||||||
Income from operations | 169,488 | 138,863 | 135,959 | ||||||||
Interest income | 4,646 | 3,486 | 3,993 | ||||||||
Interest expense | (487 | ) | (462 | ) | (497 | ) | |||||
Other expense, net | (3,354 | ) | (1,165 | ) | (1,688 | ) | |||||
Income before income taxes | 170,293 | 140,722 | 137,767 | ||||||||
Income tax provision | 56,206 | 54,327 | 44,585 | ||||||||
Net income | $ | 114,087 | $ | 86,395 | $ | 93,182 | |||||
Basic net income per common share | $ | 1.04 | $ | 0.80 | $ | 0.86 | |||||
Diluted net income per common share | $ | 1.03 | $ | 0.78 | $ | 0.83 | |||||
Shares used in computing basic net income per common share | 109,199 | 108,146 | 107,874 | ||||||||
Shares used in computing diluted net income per common share | 110,960 | 111,394 | 112,089 | ||||||||
See accompanying notes to consolidated financial statements.
54
INFORMATICA CORPORATION
CONSOLIDATED STATEMENTS OF COMPREHENSIVE INCOME
(In thousands)
Years Ended December 31, | |||||||||||
2014 | 2013 | 2012 | |||||||||
Net income | $ | 114,087 | $ | 86,395 | $ | 93,182 | |||||
Other comprehensive income (loss): | |||||||||||
Change in foreign currency translation adjustment, net of tax benefit (expense) of $664, $(172) and $(144) | (28,433 | ) | 5,133 | 3,363 | |||||||
Available-for-sale investments: | |||||||||||
Change in net unrealized gain (loss), net of tax benefit (expense) of $111, $126 and $(244) | (181 | ) | (205 | ) | 398 | ||||||
Less: reclassification adjustment for net (gain) loss included in net income, net of tax benefit (expense) of $(7), $16 and $(19) | (11 | ) | 26 | (31 | ) | ||||||
Net change, net of tax benefit (expense) of $118, $110 and $(225) | (192 | ) | (179 | ) | 367 | ||||||
Cash flow hedges: | |||||||||||
Change in unrealized gain (loss), net of tax benefit (expense) of $(483), $794 and $226 | 787 | (1,295 | ) | (368 | ) | ||||||
Net gain from discontinuance of cash flow hedges, net of tax expense of $(3), $- and $- | 6 | — | — | ||||||||
Less: | |||||||||||
Reclassification adjustment for net (gain) loss included in net income, net of tax benefit (expense) of $(453), $710 and $865 | (739 | ) | 1,159 | 1,410 | |||||||
Reclassification for net gain into earnings related to discontinuance of cash flow hedges, net of tax expense of $(3), $- and $- | (6 | ) | — | — | |||||||
Net change, net of tax benefit (expense) of $(30), $84 and $(639) | 48 | (136 | ) | 1,042 | |||||||
Total other comprehensive income (loss), net of tax effect | (28,577 | ) | 4,818 | 4,772 | |||||||
Total comprehensive income, net of tax effect | $ | 85,510 | $ | 91,213 | $ | 97,954 | |||||
See accompanying notes to consolidated financial statements.
55
INFORMATICA CORPORATION
CONSOLIDATED STATEMENTS OF STOCKHOLDERS’ EQUITY
(In thousands)
Common Stock | Additional Paid-in Capital | Accumulated Other Comprehensive Loss | Retained Earnings | Total Informatica Corporation Stockholders' Equity | Non-controlling Interest | Total Equity | ||||||||||||||||||||||||
Shares | Amount | |||||||||||||||||||||||||||||
Balances, December 31, 2011 | 106,946 | $ | 107 | $ | 751,350 | $ | (12,802 | ) | $ | 253,548 | $ | 992,203 | $ | — | $ | 992,203 | ||||||||||||||
Common stock options exercised | 1,884 | 2 | 25,241 | — | — | 25,243 | — | 25,243 | ||||||||||||||||||||||
Common stock issued under employee stock purchase plan | 528 | — | 16,108 | — | — | 16,108 | — | 16,108 | ||||||||||||||||||||||
Restricted stock units vested | 535 | — | — | — | — | — | — | — | ||||||||||||||||||||||
Withholding taxes related to restricted stock units net share settlement | (157 | ) | — | (6,686 | ) | — | — | (6,686 | ) | — | (6,686 | ) | ||||||||||||||||||
Stock-based compensation | — | — | 42,803 | — | — | 42,803 | — | 42,803 | ||||||||||||||||||||||
Tax benefit of stock-based compensation | — | — | 16,463 | — | — | 16,463 | — | 16,463 | ||||||||||||||||||||||
Repurchase and retirement of common stock | (2,435 | ) | (2 | ) | (80,981 | ) | — | — | (80,983 | ) | — | (80,983 | ) | |||||||||||||||||
Acquisition | — | — | — | — | — | — | 2,418 | 2,418 | ||||||||||||||||||||||
Net income | — | — | — | — | 93,182 | 93,182 | — | 93,182 | ||||||||||||||||||||||
Other comprehensive income | — | — | — | 4,772 | — | 4,772 | — | 4,772 | ||||||||||||||||||||||
Balances, December 31, 2012 | 107,301 | 107 | 764,298 | (8,030 | ) | 346,730 | 1,103,105 | 2,418 | 1,105,523 | |||||||||||||||||||||
Common stock options exercised | 2,671 | 3 | 40,708 | — | — | 40,711 | — | 40,711 | ||||||||||||||||||||||
Common stock issued under employee stock purchase plan | 652 | 1 | 17,957 | — | — | 17,958 | — | 17,958 | ||||||||||||||||||||||
Restricted stock units vested | 711 | — | — | — | — | — | — | — | ||||||||||||||||||||||
Withholding taxes related to restricted stock units net share settlement | (204 | ) | — | (7,342 | ) | — | — | (7,342 | ) | — | (7,342 | ) | ||||||||||||||||||
Stock-based compensation | — | — | 56,091 | — | — | 56,091 | — | 56,091 | ||||||||||||||||||||||
Tax benefit of stock-based compensation | — | — | 26,082 | — | — | 26,082 | — | 26,082 | ||||||||||||||||||||||
Repurchase and retirement of common stock | (2,488 | ) | (2 | ) | (92,066 | ) | — | — | (92,068 | ) | — | (92,068 | ) | |||||||||||||||||
Acquisition | — | — | — | — | — | — | (2,418 | ) | (2,418 | ) | ||||||||||||||||||||
Net income | — | — | — | — | 86,395 | 86,395 | — | 86,395 | ||||||||||||||||||||||
Other comprehensive income | — | — | — | 4,818 | — | 4,818 | — | 4,818 | ||||||||||||||||||||||
Balances, December 31, 2013 | 108,643 | 109 | 805,728 | (3,212 | ) | 433,125 | 1,235,750 | — | 1,235,750 | |||||||||||||||||||||
Common stock options exercised | 2,942 | 3 | 38,912 | — | — | 38,915 | — | 38,915 | ||||||||||||||||||||||
Common stock issued under employee stock purchase plan | 667 | 1 | 20,107 | — | — | 20,108 | — | 20,108 | ||||||||||||||||||||||
Restricted stock units vested | 743 | — | — | — | — | — | — | — | ||||||||||||||||||||||
Withholding taxes related to restricted stock units net share settlement | (217 | ) | — | (7,927 | ) | — | — | (7,927 | ) | — | (7,927 | ) | ||||||||||||||||||
Stock-based compensation | — | — | 59,362 | — | — | 59,362 | — | 59,362 | ||||||||||||||||||||||
Tax benefit of stock-based compensation | — | — | (1,520 | ) | — | — | (1,520 | ) | — | (1,520 | ) | |||||||||||||||||||
Repurchase and retirement of common stock | (4,074 | ) | (4 | ) | (141,243 | ) | — | — | (141,247 | ) | — | (141,247 | ) | |||||||||||||||||
Net income | — | — | — | — | 114,087 | 114,087 | — | 114,087 | ||||||||||||||||||||||
Other comprehensive income | — | — | — | (28,577 | ) | — | (28,577 | ) | — | (28,577 | ) | |||||||||||||||||||
Balances, December 31, 2014 | 108,704 | $ | 109 | $ | 773,419 | $ | (31,789 | ) | $ | 547,212 | $ | 1,288,951 | $ | — | $ | 1,288,951 | ||||||||||||||
See accompanying notes to consolidated financial statements.
56
INFORMATICA CORPORATION
CONSOLIDATED STATEMENTS OF CASH FLOWS
(In thousands)
Years Ended December 31, | |||||||||||
2014 | 2013 | 2012 | |||||||||
Operating activities: | |||||||||||
Net income | $ | 114,087 | $ | 86,395 | $ | 93,182 | |||||
Adjustments to reconcile net income to net cash provided by operating activities: | |||||||||||
Depreciation and amortization | 19,107 | 14,978 | 12,284 | ||||||||
Stock-based compensation | 59,362 | 57,204 | 42,803 | ||||||||
Deferred income taxes | (1,398 | ) | (24,067 | ) | (4,651 | ) | |||||
Tax benefits from stock-based compensation | 373 | 26,082 | 16,463 | ||||||||
Excess tax benefits from stock-based compensation | (3,831 | ) | (27,495 | ) | (17,021 | ) | |||||
Amortization of intangible assets and acquired technology | 19,084 | 30,036 | 28,558 | ||||||||
Loss on investment in equity interest | 1,998 | — | — | ||||||||
Other operating activities, net | — | (352 | ) | (854 | ) | ||||||
Changes in operating assets and liabilities: | |||||||||||
Accounts receivable | (30,721 | ) | (32,009 | ) | 8,723 | ||||||
Prepaid expenses and other assets | (233 | ) | 418 | 10,593 | |||||||
Accounts payable | 988 | 979 | (1,416 | ) | |||||||
Accrued expenses and other liabilities | 16,900 | 12,860 | (866 | ) | |||||||
Income taxes payable | (1,292 | ) | 9,596 | 1,553 | |||||||
Accrued facilities restructuring charges | — | — | (23,977 | ) | |||||||
Deferred revenues | 38,767 | 46,525 | 35,127 | ||||||||
Net cash provided by operating activities | 233,191 | 201,150 | 200,501 | ||||||||
Investing activities: | |||||||||||
Purchases of property and equipment | (21,045 | ) | (26,508 | ) | (141,610 | ) | |||||
Purchases of investments | (260,933 | ) | (367,834 | ) | (266,088 | ) | |||||
Investment in equity interest, net | (282 | ) | (2,001 | ) | (257 | ) | |||||
Maturities of investments | 220,991 | 249,294 | 199,535 | ||||||||
Sales of investments | 64,147 | 83,473 | 8,864 | ||||||||
Business acquisitions, net of cash acquired | (58,614 | ) | (7,464 | ) | (90,542 | ) | |||||
Purchase of developed technology and patent license | (300 | ) | (400 | ) | — | ||||||
Net cash used in investing activities | (56,036 | ) | (71,440 | ) | (290,098 | ) | |||||
Financing activities: | |||||||||||
Net proceeds from issuance of common stock | 59,023 | 58,669 | 41,351 | ||||||||
Repurchases and retirement of common stock | (141,247 | ) | (92,068 | ) | (80,983 | ) | |||||
Withholding taxes related to restricted stock units net share settlement | (7,927 | ) | (7,342 | ) | (6,686 | ) | |||||
Payment of contingent consideration | (3,061 | ) | (4,170 | ) | (8,050 | ) | |||||
Payment of issuance costs on credit facility | (934 | ) | — | — | |||||||
Excess tax benefits from stock-based compensation | 3,831 | 27,495 | 17,021 | ||||||||
Purchase of acquiree stock and noncontrolling interest | — | (6,365 | ) | (437 | ) | ||||||
Net cash used in financing activities | (90,315 | ) | (23,781 | ) | (37,784 | ) | |||||
Effect of foreign exchange rate changes on cash and cash equivalents | (16,127 | ) | 1,762 | 673 | |||||||
Net increase (decrease) in cash and cash equivalents | 70,713 | 107,691 | (126,708 | ) | |||||||
Cash and cash equivalents at beginning of the year | 297,818 | 190,127 | 316,835 | ||||||||
Cash and cash equivalents at end of the year | $ | 368,531 | $ | 297,818 | $ | 190,127 | |||||
Supplemental disclosures: | |||||||||||
Income taxes paid, net of refunds | $ | 58,522 | $ | 42,717 | $ | 31,218 | |||||
Supplemental disclosures of non-cash investing and financing activities: | |||||||||||
Unrealized gain (loss) on investments | $ | (192 | ) | $ | (179 | ) | $ | 367 | |||
See accompanying notes to consolidated financial statements.
57
INFORMATICA CORPORATION
NOTES TO CONSOLIDATED FINANCIAL STATEMENTS
Note 1. Organization and Business
Informatica Corporation (“Informatica” or the “Company”) was incorporated in California in February 1993 and reincorporated in Delaware in April 1999. The Company is the leading independent provider of enterprise data integration software and services. The Company's solutions enable a wide variety of complex, enterprise-wide data integration initiatives through technologies including cloud data integration, data quality, big data, master data management, data security, data exchange, and data preparation.
Note 2. Summary of Significant Accounting Policies
Principles of Consolidation
The consolidated financial statements include the accounts of the Company and its wholly-owned and majority-owned subsidiaries. All intercompany accounts and transactions have been eliminated.
Use of Estimates
The Company's consolidated financial statements are prepared in accordance with generally accepted accounting principles (“GAAP”) in the United States, which require the Company to make certain estimates, judgments, and assumptions. For example, the Company makes estimates, judgments, and assumptions in determining vendor-specific objective evidence ("VSOE") and, estimated selling price ("ESP") used in revenue recognition, the realizability of deferred tax assets, uncertain tax positions, fair value of acquired tangible and intangible assets and liabilities assumed during acquisitions, the number of reporting segments, the recoverability of intangible assets and their useful lives, the fair value of stock options and forfeiture estimates used in calculating stock-based compensations, number of performance-based restricted stock units that the Company expects to vest, and the collectability of accounts receivable. The Company believes that the estimates, judgments, and assumptions upon which it relies are reasonable based upon information available to it at the time that these estimates, judgments, and assumptions are made. These estimates, judgments, and assumptions can affect the reported amounts of assets and liabilities as of the date of the financial statements as well as the reported amounts of revenues and expenses during the periods presented. Any material differences between these estimates and actual results will impact the Company's consolidated financial statements. In many cases, the accounting treatment of a particular transaction is specifically dictated by GAAP and does not require management's judgment in its application. There are also areas in which management's judgment in selecting any available alternative would not produce a materially different result.
Reclassifications
Certain reclassifications have also been made within the consolidated balance sheet as of December 31, 2013 to conform to the current year presentation. The Company reclassified $0.9 million out of accounts payable and into accrued liabilities and $9.2 million out of accrued liabilities into accrued compensation and related expenses. Total current liabilities as of December 31, 2013 did not change as a result of these reclassifications.
Certain reclassifications have also been made within the consolidated statement of cash flows to conform to the current year presentation. A change was made to present redemptions by issuers of debt securities held by the Company as part of net cash provided by maturities of investments to reflect that these redemptions are an acceleration of the maturity of the debt investment. Redemptions were previously presented as part of net cash provided by sales of investments. This change in presentation did not affect total net cash used in investing activities and conforming changes have been made for all prior periods presented. Net cash provided by redemptions of $61 million and $110 million were reclassified from sales of investments to maturities of investments for the years ended December 31, 2013 and 2012, respectively.
Revenue Recognition
The Company derives its revenues from sales of software licenses, subscription-based licenses for a variety of cloud, and data-as-a-service offerings, maintenance and support services, and professional services, consisting of consulting and education services. The Company recognizes revenue in accordance with Financial Accounting Standards Board (“FASB”) Accounting Standards Codification (“ASC”) 985-605, Software Revenue Recognition, ASC 605-25, Multiple Element Arrangements, ASC 605-35, Revenue Recognition for Construction-Type and Production-Type Contracts, the Securities and Exchange Commission's Staff Accounting Bulletin Topic 13, Revenue Recognition, and other authoritative accounting literature.
58
Revenue is recognized when persuasive evidence of an arrangement exists, delivery has occurred, the fee is fixed or determinable, and collection is probable.
Multiple Element Arrangements
The Company enters into multiple element arrangements that contain software and software-related elements, such as software licenses, subscription-based licenses, maintenance and support, consulting, and education services. The Company uses the residual method to allocate revenue to the software license and recognize license revenue upon delivery when vendor-specific objective evidence (“VSOE”) of fair value exists for all undelivered elements of the arrangement. If VSOE does not exist for any undelivered software product element of the arrangement, all revenue is deferred until all elements have been delivered, or VSOE is established. If VSOE does not exist for any undelivered services elements of the arrangement, all revenue is recognized ratably over the period that the services are expected to be performed.
The Company enters into multiple element arrangements that contain both software, such as software licenses, and deliverables not within the scope of ASC 985-605, such as cloud offerings. The Company first allocates the total arrangement consideration based on the relative selling prices of the software group of elements as a whole, and to the elements not within the scope of ASC 985-605. The allocation of arrangement consideration is based on the selling price hierarchy, which includes (i) VSOE if available, (ii) third party evidence (“TPE”) if VSOE is not available, or (iii) estimated selling price (“ESP”) if neither VSOE nor TPE is available. The Company then further allocates consideration within the software group to the respective elements within that group following the guidance in ASC 985-605. Revenue allocated to each element is then recognized when the basic revenue recognition criteria are met for each element as described above.
The Company establishes VSOE for each element based on the price charged when an element is sold separately. In certain limited instances, the Company is not able to establish VSOE for all deliverables in an arrangement with multiple elements. This may be due to the infrequent selling of each element separately, not pricing products or services within a narrow range, or only having a limited sales history.
For multiple element arrangements that contain both software and deliverables not within the scope of ASC 985-605, when VSOE cannot be established for deliverables not within the scope of ASC 985-605, the Company attempts to establish a selling price based on TPE. TPE is determined based on competitor prices for similar deliverables when sold separately. When the Company is unable to establish a selling price using VSOE or TPE, the Company uses ESP in the allocation of the arrangement consideration. The Company determines ESP by reviewing historical transactions, including transactions whereby the deliverable was sold on a standalone basis and considering several other external and internal factors including, but not limited to, pricing practices including discounting levels dependent on the size of transactions, whether an order represents an upgrade of a previous order and the type of customer. The determination of ESP is made through consultation with the Company's management, taking into consideration the Company's pricing practices and go-to-market strategy.
Software
Under ASC 985-605, revenue is recognized when persuasive evidence of an arrangement exists, delivery has occurred, the fee is fixed or determinable, and collection is probable.
Persuasive evidence of an arrangement exists. The Company determines that persuasive evidence of an arrangement exists when it has a written contract, signed by both the customer and the Company, and written purchase authorization.
Delivery has occurred. Software is considered delivered when title to the physical software media passes to the customer or, in the case of electronic delivery, when the customer has been provided with the access codes to download and operate the software.
Fee is fixed or determinable. The Company considers arrangements with extended payment terms not to be fixed or determinable. The Company also consider factors including financing arrangements, the category of customer (end-user customer, distributor, or reseller), rights of return or refund, and history of enforcing terms and conditions of customer contracts. If the license fee in an arrangement is not fixed or determinable, revenue is recognized as payments become due or upon cash receipt, whichever is earlier. The Company's standard agreements do not contain product return rights.
Collection is probable. The Company first assesses the credit-worthiness and collectability at a country level based on the country's overall economic climate and general business risk. Then, for the customers in the countries that are deemed credit-worthy, it assesses credit and collectability based on their payment history and credit profile. When a customer is not deemed credit-worthy, revenue is recognized at the time that payment is received.
59
The Company requires evidence of sell-through from resellers and distributors for order acceptance. The Company then recognizes revenue from resellers and distributors upon shipment if all other revenue recognition criteria are met, which in substantially all cases is when cash is collected or when the reseller or distributor is deemed credit-worthy based on their payment history and credit profile to conclude that collectability is probable.
The Company also enters into Original Equipment Manufacturer (“OEM”) arrangements that provide for license fees based on inclusion of technology and/or products in the OEM's products. These arrangements provide for fixed and irrevocable royalty payments. The Company recognizes royalty payments as revenues based on the royalty report that it receives from the OEMs. In the case of OEMs with fixed royalty payments, revenue is recognized upon execution of the agreement, delivery of the software, and when all other criteria for revenue recognition have been met.
Multiple contracts with a single counterparty executed within close proximity of each other are evaluated to determine if the contracts should be combined and accounted for as a single arrangement. The Company recognizes revenues net of applicable sales taxes, financing charges absorbed by the Company, and amounts retained by our resellers and distributors, if any.
Subscription revenues, primarily consisting of revenues from customers and partners under subscription-based licenses for a variety of cloud and data-as-a-service offerings, are recognized ratably over the subscription term.
Services
The Company recognizes maintenance revenues, which consist of fees for ongoing support and product updates, if and when available, ratably over the term of the contract, typically one year.
Consulting revenues are primarily related to configuration, installation, and implementation of our products. These services are generally performed on a time-and-materials basis and, accordingly, revenues are recognized as the services are performed. Occasionally, contracts are on a fixed-fee basis and, accordingly, revenues are recognized on a proportional performance model based on actual services performed. If uncertainty exists about the Company's ability to complete the project, ability to collect the amounts due, or in the case of fixed-fee consulting arrangements, ability to estimate the remaining costs to be incurred to complete the project, revenue is deferred until the uncertainty is resolved. Consulting services, if included as part of the software arrangement, generally do not require significant modification or customization of the software and are not considered essential to the functionality of the software. If, in the Company's judgment, the software arrangement includes significant modification or customization of the software, then software license revenue is recognized as the consulting services revenue is recognized.
Education service revenues are generated from classes offered at our headquarters, sales and training offices, customer locations, and on-line. Revenues are recognized as the classes are delivered.
Deferred Revenues
Deferred revenues include deferred license, subscription, maintenance, consulting, and education revenues. For customers not deemed credit-worthy, the Company's practice is to net unpaid deferred revenue for that customer against the related receivable balance.
Cash and Cash Equivalents
The Company considers highly liquid investment securities with maturities of 90 days or less at the date of purchase to be cash equivalents. Cash equivalents include money market funds, time deposits, and marketable debt securities. Cash and cash equivalents outside of marketable debt securities are stated at cost, which approximates fair value.
Investments
Investments are comprised of time deposits and marketable debt securities. The Company's marketable debt securities consist primarily of certificates of deposit, commercial paper, corporate notes and bonds, U.S. government and agency notes and bonds, and municipal securities with original maturities beyond 90 days. The Company's marketable debt securities are classified as available-for-sale and are reported at fair value, with unrealized gains and losses, net of tax, reported as a separate component of accumulated other comprehensive income (loss) in stockholders' equity. The Company classifies all available-for-sale marketable debt securities, including those with original maturity dates greater than one year, as short-term investments. Realized gains or losses and permanent declines in value, if any, on available-for-sale securities are reported in other income (expense) as incurred.
60
The Company recognizes realized gains and losses upon sales of investment and reclassifies unrealized gains and losses out of accumulated other comprehensive income (loss) into earnings using the specific identification method.
In accordance with ASC 320, Investments - Debt and Equity Securities, the Company periodically evaluates the investments for other-than-temporary impairment. The Company considers factors such as the length of time and extent to which the investment has been in a continuous unrealized loss position, the financial condition and near-term prospects of the issuer, and the Company's intent to sell, or whether it is more likely than not the Company will be required to sell the investment before recovery of the investment's amortized cost basis. The Company also considers industry analysts' reports and credit ratings in evaluating for other-than-temporary impairment. If the Company believes that an other-than-temporary decline exists, the Company will write down the investment to its fair value. During 2014, 2013, and 2012, the Company did not consider any of its short-term investments to be other-than-temporarily impaired.
The Company also has investments in privately-held companies that are accounted for under the cost method and included in other non-current assets. The Company periodically evaluates these investments for other-than-temporary impairment. During 2014, the Company realized a loss of $2.0 million on the investment in a privately-held company. During 2013 and 2012, the Company did not consider these investments to be other-than-temporarily impaired.
Allowance for Doubtful Accounts
The Company makes estimates as to the overall collectability of accounts receivable and provides an allowance for accounts receivable considered uncollectible. The Company specifically analyzes its accounts receivable based on historical bad debt experience, customer concentrations, customer credit-worthiness, the age of the receivable, current economic trends, and changes in its customer payment terms when evaluating the adequacy of the allowance for doubtful accounts. The Company records the adjustment in general and administrative expense. At December 31, 2014 and 2013, the Company's allowance for doubtful accounts was $3.5 million and $4.1 million, respectively.
Property and Equipment
Property and equipment are stated at cost, net of accumulated depreciation. Depreciation is calculated using the straight-line method over the estimated useful lives of the assets. Building, building improvements, and site improvements are amortized over the estimated useful life of 25 years, 10-15 years and 15 years, respectively. Leasehold improvements are amortized over the shorter of the lease term or the estimated useful life of the asset, which range from one to ten years. Computers and equipment and furniture and fixtures are stated at cost and depreciated using the straight-line method over the estimated useful lives of the assets, generally one to five years.
Software Development Costs
The Company accounts for software development costs in accordance with ASC 985-20, Costs of Software to Be Sold, Leased, or Marketed. Software development costs are expensed as incurred until the establishment of technological feasibility, at which time those costs are capitalized until the product is available for general release to customers and amortized over the estimated life of the product. Technological feasibility is established upon completion of a working model. To date, costs incurred subsequent to the establishment of technological feasibility have not been significant, and all software development costs have been charged to research and development expense in the accompanying consolidated statements of income.
Pursuant to ASC 350-40, Internal - Use Software, the Company capitalizes certain costs relating to software acquired, developed, or modified solely to meet the Company's internal requirements and for which there are no substantive plans to market the software. The Company capitalized $1.2 million of internal use software costs for the year ended December 31, 2014. There was a negligible amount capitalized during the year ended December 31, 2013. These capitalized costs are depreciated on a straight-line basis over the estimated useful life.
Business Combinations
The Company records the acquired tangible and intangible assets and liabilities assumed based on their estimated fair values at the acquisition date. Goodwill as of the acquisition date is measured as the excess of consideration transferred and the net of the acquisition fair values of the assets acquired and the liabilities assumed. The valuation process requires management to make significant estimates and assumptions, especially at the acquisition date with respect to intangible assets, support obligations assumed, estimated restructuring liabilities, and pre-acquisition contingencies.
61
In connection with the measurement process for acquisitions, the Company estimates the fair value of the support obligations assumed. The estimated fair value of the support obligations is determined utilizing a cost build-up approach by estimating the costs related to fulfilling the obligations plus a normal profit margin. The estimated costs to fulfill the support obligations are based on the historical costs related to fulfilling the obligations. The sum of these costs and operating profit approximates, in theory, the amount that we would be required to pay a third party to assume the support obligations.
The Company expenses transaction costs and restructuring expenses related to the acquisition as incurred. Additionally, the Company identifies pre-acquisition contingencies and determines their respective fair values as of the end of the purchase price allocation period. Any adjustments to pre-acquisition contingencies are recorded in the Company's operating results in the period in which the adjustment is determined. Furthermore, any adjustments to estimates of acquisition related tax contingencies are recorded to goodwill during the measurement period, and in the Company's operating results after the conclusion of the measurement period. Moreover, the Company identifies in-process research and development costs and classifies them as an indefinite lived intangible asset until the asset is put to use or deemed to be impaired.
Goodwill and Indefinite-Lived Intangible Assets
The Company tests goodwill and intangible assets with indefinite useful lives for impairment annually on October 31 of each year and whenever events or changes in circumstances indicate that the carrying value of the asset may not be recoverable in accordance with ASC 350, Intangibles - Goodwill and Other. While the Company is permitted to conduct a qualitative assessment to determine whether it is necessary to perform a two-step quantitative goodwill impairment test, for its annual goodwill impairment test in the fourth quarter of 2014, the Company performed a quantitative test for its reporting unit.
Consistent with the Company's assessment that it has only one reporting segment, the Company has determined that it has only one reporting unit and tests goodwill for impairment at the entity level. The Company tests its goodwill using the two-step process in accordance with ASC 350. In the first step, the Company compares the carrying amount of the reporting unit to the fair value based on quoted market prices of the Company's common stock. If the fair value of the reporting unit exceeds the carrying value, goodwill is not considered impaired and no further testing is required. If the carrying value of the reporting unit exceeds the fair value, goodwill is potentially impaired and the second step of the impairment test must be performed. In the second step, the Company compares the implied fair value of the goodwill, as defined by ASC 350, to its carrying amount to determine the impairment loss, if any. Recoverability of indefinite-lived intangible assets is measured by comparison of the carrying amount of the asset to the future undiscounted cash flows attributable to that asset.
The Company performed its annual goodwill and indefinite-lived intangible assets impairment tests as of October 31, 2014, 2013, and 2012 and concluded that there was no impairment.
Impairment of Long-Lived Assets
The Company evaluates long-lived assets, which includes amortized intangible assets and tangible assets, for impairment whenever events or changes in circumstances indicate that the carrying value of these assets may not be recoverable. Recoverability of these assets is measured by comparison of the carrying amount of an asset to the future undiscounted cash flows attributable to that asset. The Company measures any amount of impairment based on the difference between the carrying value and the fair value of the impaired asset. The Company did not recognize any impairment charges of long-lived assets in 2014, 2013, or 2012.
62
Fair Value Measurement of Financial Assets and Liabilities
The following table summarizes financial assets and financial liabilities that the Company measures at fair value on a recurring basis as of December 31, 2014 (in thousands):
Total | Quoted Prices in Active Markets for Identical Assets (Level 1) | Significant Other Observable Inputs (Level 2) | Significant Unobservable Inputs (Level 3) | ||||||||||||
Assets: | |||||||||||||||
Money market funds (i) | $ | 15,344 | $ | 15,344 | $ | — | $ | — | |||||||
Time deposits (ii) | 26,395 | 26,395 | — | — | |||||||||||
Marketable debt securities (ii) | 326,735 | — | 326,735 | — | |||||||||||
Total money market funds, time deposits, and marketable debt securities | 368,474 | 41,739 | 326,735 | — | |||||||||||
Foreign currency derivatives (iii) | 310 | — | 310 | — | |||||||||||
Total assets | $ | 368,784 | $ | 41,739 | $ | 327,045 | $ | — | |||||||
Liabilities: | |||||||||||||||
Foreign currency derivatives (v) | $ | 915 | $ | — | $ | 915 | $ | — | |||||||
Total liabilities | $ | 915 | $ | — | $ | 915 | $ | — | |||||||
The following table summarizes financial assets and financial liabilities that the Company measures at fair value on a recurring basis as of December 31, 2013 (in thousands):
Total | Quoted Prices in Active Markets for Identical Assets (Level 1) | Significant Other Observable Inputs (Level 2) | Significant Unobservable Inputs (Level 3) | ||||||||||||
Assets: | |||||||||||||||
Money market funds (i) | $ | 21,893 | $ | 21,893 | $ | — | $ | — | |||||||
Time deposits (ii) | 21,585 | 21,585 | — | — | |||||||||||
Marketable debt securities (ii) | 370,384 | — | 370,384 | — | |||||||||||
Total money market funds, time deposits, and marketable debt securities | 413,862 | 43,478 | 370,384 | — | |||||||||||
Foreign currency derivatives (iii) | 284 | — | 284 | — | |||||||||||
Total assets | $ | 414,146 | $ | 43,478 | $ | 370,668 | $ | — | |||||||
Liabilities: | |||||||||||||||
Foreign currency derivatives (iv) | $ | 1,024 | $ | — | $ | 1,024 | $ | — | |||||||
Acquisition-related contingent consideration (iv) | 3,071 | — | — | 3,071 | |||||||||||
Total liabilities | $ | 4,095 | $ | — | $ | 1,024 | $ | 3,071 | |||||||
___________________
(i) | Included in cash and cash equivalents on the consolidated balance sheets. |
(ii) | Included in either cash and cash equivalents or short-term investments on the consolidated balance sheets. |
(iii) | Included in prepaid expenses and other current assets on the consolidated balance sheets. |
(iv) | Included in accrued liabilities on the consolidated balance sheets. |
(v) | Included in accrued and other liabilities on the consolidated balance sheets. |
63
Money Market Funds, Time Deposits, and Marketable Debt Securities
The Company uses a market approach for determining the fair value of all its Level 1 and Level 2 money market funds, time deposits, and marketable debt securities.
To value its money market funds and time deposits, the Company values the funds at $1 stable net asset value, which is the market pricing convention for identical assets that the Company has the ability to access.
The Company's marketable debt securities consist of certificates of deposit, commercial paper, corporate notes and bonds, municipal securities, and U.S. government and agency notes and bonds. To value its certificates of deposit and commercial paper, the Company uses mathematical calculations to arrive at fair value for these securities, which generally have short maturities and infrequent secondary market trades. For example, in the absence of any observable transactions, the Company may accrete from purchase price at purchase date to face value at maturity. In the event that a transaction is observed on the same security in the marketplace, and the price on that subsequent transaction clearly reflects the market price on that day, the Company will adjust the price to the observed transaction price and follow a revised accretion schedule to determine the daily price.
To determine the fair value of its corporate notes and bonds, municipal securities, and U.S. government and agency notes and bonds, the Company uses a third party pricing source for each security. If the market price is not available from the third party source, pricing from the Company's investment custodian is used.
Foreign Currency Derivatives and Hedging Instruments
The Company uses the income approach to value the derivatives using observable Level 2 market inputs at the measurement date and standard valuation techniques to convert future amounts to a single present value amount, assuming that participants are motivated but not compelled to transact. Level 2 inputs are limited to quoted prices that are observable for the derivative assets and liabilities. The Company records its derivative assets and liabilities at gross in its consolidated balance sheet and uses mid-market pricing as a practical expedient for fair value measurements. Key inputs for foreign currency derivatives are the spot rates, forward rates, interest rates, and credit derivative market rates. The spot rate for each currency is the same spot rate used for all balance sheet translations at the measurement date and is sourced from the Federal Reserve Bulletin. The following values are interpolated from commonly quoted intervals available from Bloomberg: forward points and the London Interbank Offered Rate (“LIBOR”) used to discount and determine the fair value of assets and liabilities. Credit default swap spread curves identified per counterparty at month end in Bloomberg are used to discount derivative assets for counterparty non-performance risk, all of which have terms of thirteen months or less. The Company discounts derivative liabilities to reflect the Company’s own potential non-performance risk to lenders and has used the spread over LIBOR on its most recent corporate borrowing rate.
The counterparties associated with the Company’s foreign currency forward contracts are large credit-worthy financial institutions, and the derivatives transacted with these entities are relatively short in duration; therefore, the Company does not consider counterparty concentration and non-performance to be material risks at this time. Both the Company and the counterparties are expected to perform under the contractual terms of the instruments.
There were no transfers between Level 1 and Level 2 categories during the years ended December 31, 2014 and 2013.
See Note 9. Accumulated Other Comprehensive Loss, Note 10. Derivative Financial Instruments, and Note 14. Commitments and Contingencies of Notes to Consolidated Financial Statements for a further discussion.
Acquisition-related Contingent Consideration
The Company estimated the fair value of the acquisition-related contingent consideration using a probability-weighted discounted cash flow model. This fair value measure was based on significant inputs not observed in the market and thus represented a Level 3 instrument. Level 3 instruments are valued based on unobservable inputs that are supported by little or no market activity and reflect the Company's own assumptions in measuring fair value. There were no transfers into or out of the Level 3 category during the years ended December 31, 2014 and 2013. The change in fair value of acquisition-related contingent consideration is included in acquisitions and other charges in the consolidated statements of income.
64
The changes in the acquisition-related contingent consideration liability for the year ended December 31, 2014 consisted of the following (in thousands):
December 31, 2014 | |||
Beginning balance as of December 31, 2013 | $ | 3,071 | |
Change in fair value of contingent consideration | (10 | ) | |
Payment of contingent consideration | (3,061 | ) | |
Ending balance as of December 31, 2014 | $ | — | |
Fair Value of Assets and Liabilities on a Nonrecurring Basis
The Company has direct investments in privately held companies accounted for under the cost method, which are periodically assessed for other-than-temporary impairment. The carrying value of these investments was $2.3 million and $4.1 million at December 31, 2014 and 2013, respectively. If it is determined that an other-than-temporary impairment has occurred, the Company writes down the investment to its fair value. The Company estimates fair value of cost method investments considering available information such as pricing in recent rounds of financing, current cash positions, earnings and cash flow forecasts, recent operational performance, and any other readily available data. During 2014, the Company made an additional investment of $0.3 million in a privately-held company, and realized a $2.0 million loss on investments in equity interest of another company. During 2013 and 2012, the Company did not consider these investments to be other-than-temporarily impaired based on the information available at those periods.
Fair Value of Financial Instruments, Concentrations of Credit Risk, and Credit Evaluations
The fair value of the Company's cash, cash equivalents, short-term investments, accounts receivable, and accounts payable approximates their respective carrying amounts due to their short-term maturity.
Financial instruments, which subject the Company to concentrations of credit risk, consist primarily of cash, cash equivalents, investments in time deposits and marketable debt securities, and trade accounts receivable. The Company maintains its cash and cash equivalents and investments with financial institutions with high credit standing.
The Company performs ongoing credit evaluations of its customers and generally does not require collateral. The Company makes judgments as to its ability to collect outstanding receivables and provide allowances for the portion of receivables when collection becomes doubtful. Provisions are made based upon a specific review of all significant outstanding invoices. For those invoices not specifically reviewed, provisions are provided at differing rates, based upon the age of the receivable. In determining these percentages, the Company analyzes its historical collection experience and current economic trends. If the historical data it uses to calculate the allowance for doubtful accounts does not reflect the future ability to collect outstanding receivables, additional provisions for doubtful accounts may be needed and the future results of operations could be materially affected. The Company evaluates its counterparties associated with the Company's foreign exchange forward contracts at least quarterly as part of its cash flow hedge program. Since all these counterparties are large credit-worthy commercial banking institutions, the Company does not consider counterparty non-performance to be a material risk.
Stock-based Compensation
The Company accounts for stock-based compensation in accordance with the provisions of ASC 718, Stock Compensation. Stock-based awards granted include stock options, restricted stock units (“RSUs”), performance-based restricted stock units (“PRSUs”), and stock purchased under the Company's Employee Stock Purchase Plan. Stock-based compensation expense for stock options, RSUs, and stock purchased under the Employee Stock Purchase Plan is measured at the grant date based on the fair value of the awards and is recognized as an expense ratably on a straight line basis over the requisite service period. See Note 8. Stock-based Compensation for a description of the Company's stock-based compensation plans and more information on the assumptions used to calculate the fair value of stock-based awards.
Stock-based compensation expense is recognized for PRSUs based on the probability of achieving certain performance criteria, as defined in the PRSU agreements. The Company estimates the number of PRSUs ultimately expected to vest and recognizes expense using the graded vesting attribution method over the requisite service period.
65
Shipping and Handling Costs
Shipping and handling costs in connection with our packaged software products are not material and are expensed as incurred in cost of software revenues in the Company's consolidated statements of income.
Advertising Expense
Advertising costs are expensed as incurred. Advertising expenses were not significant for the years ended December 31, 2014, 2013, and 2012.
Income Taxes
The Company uses the asset and liability method of accounting for income taxes in accordance with ASC 740, Income Taxes. Under this method, income tax expenses or benefits are recognized for the amount of taxes payable or refundable for the current year. In addition, deferred tax assets and liabilities are recognized for the expected future tax consequences of events that have been recognized in the Company's consolidated financial statements or tax returns. The measurement of current and deferred tax assets and liabilities is based on provisions of currently enacted tax laws. The effects of future changes in tax laws or rates are not contemplated.
A two-step approach is applied pursuant to ASC 740 in the recognition and measurement of uncertain tax positions taken or expected to be taken in a tax return. The first step is to determine if the weight of available evidence indicates that it is more likely than not that the tax position will be sustained in an audit, including resolution of any related appeals or litigation processes. The second step is to measure the tax benefit as the largest amount that is more than 50% likely to be realized upon ultimate settlement. We recognize interest and penalties related to uncertain tax positions in our income tax provision line of our consolidated statements of income.
As part of the process of preparing consolidated financial statements, we estimate our income taxes and tax contingencies in each of the tax jurisdictions in which we operate prior to the completion and filing of tax returns for such periods. This process involves estimating actual current tax expense together with assessing temporary differences resulting from differing treatment of items, such as deferred revenue, for tax and accounting purposes. These differences result in net deferred tax assets and liabilities. We must then assess the likelihood that the deferred tax assets will be realizable, and to the extent we believe that a deferred tax asset is not likely to be realized, we must establish a valuation allowance. In assessing the need for any additional valuation allowance, we considered all the evidence available to us, both positive and negative, including historical levels of income, legislative developments, expectations and risks associated with estimates of future taxable income, and ongoing prudent and feasible tax planning strategies.
Foreign Currency Translation
The Company translates the assets and liabilities of its non-U.S. dollar functional currency subsidiaries into U.S. dollars using exchange rates in effect at the end of each period. Revenue and expenses for these subsidiaries are translated using rates that approximate those in effect during the period. Gains and losses from these translations are recognized in cumulative translation adjustments included in accumulated other comprehensive loss in stockholders’ equity.
Reporting Segments
ASC 280, Segment Reporting, establishes standards for the manner in which public companies report information about operating segments in annual and interim financial statements. It also establishes standards for related disclosures about products and services, geographic areas, and major customers. The method for determining the information to report is based on the way management organizes the operating segments within the Company for making operating decisions and assessing financial performance.
The Company's chief operating decision maker is the chief executive officer, who reviews financial information presented on a consolidated basis, accompanied by disaggregated information about revenues by revenue stream and geographic region for purposes of making operating decisions and assessing financial performance. On this basis, the Company is organized and operates in a single segment: the design, development, marketing, and sales of software solutions.
66
Recent Accounting Pronouncements
In March 2013, the FASB issued Accounting Standards Update (“ASU”) 2013-05, Foreign Currency Matters (Topic 830): Parent's Accounting for the Cumulative Translation Adjustment upon Derecognition of Certain Subsidiaries or Groups of Assets within a Foreign Entity or of an Investment in a Foreign Entity. ASU 2013-05 clarifies that the cumulative translation adjustment (“CTA”) should be released into net income upon the occurrence of certain qualifying events. The Company adopted ASU 2013-05 prospectively as required on January 1, 2014. Adoption of ASU 2013-05 did not impact the Company's consolidated financial statements and disclosures.
In July 2013, the FASB issued ASU 2013-11, Income Taxes (Topic 740): Presentation of an Unrecognized Tax Benefit When a Net Operating Loss Carryforward, a Similar Tax Loss, or a Tax Credit Carryforward Exists, which clarifies that an unrecognized tax benefit should be presented in the financial statements as a reduction to a deferred tax asset for a net operating loss carryforward, a similar tax loss, or a tax credit carryforward if such settlement is required or expected in the event the uncertain tax position is disallowed. In situations where a net operating loss carryforward, a similar tax loss, or a tax credit carryforward is not available or the tax law of the jurisdiction does not require, and the entity does not intend to use the deferred tax asset for such purpose, the unrecognized tax benefit should be presented in the financial statements as a liability and should not be combined with deferred tax assets. The Company adopted ASU 2013-11 prospectively as required on January 1, 2014. Adoption of ASU 2013-11 did not have a material impact to the Company's consolidated financial statements and disclosures.
In May 2014, the FASB issued ASU 2014-09, Revenue from Contracts with Customers (Topic 606), to supersede nearly all existing revenue recognition guidance under U.S. GAAP. The core principle of ASU 2014-09 is to recognize revenue to depict the transfer of promised goods or services to customers in an amount that reflects the consideration to which the entity expects to be entitled in exchange for those good and services. The standard will be effective for the Company in the first quarter of 2017. ASU 2014-09 allows for two methods of adoption: (a) "full retrospective" adoption, meaning the standard is applied to all periods presented, or (b) "modified retrospective" adoption, meaning the cumulative effect of applying ASU 2014-09 is recognized as an adjustment to the 2017 opening retained earnings balance. Early adoption is not permitted. The Company has not yet selected a transition method and is currently evaluating the impact of its pending adoption of ASU 2014-09 on its consolidated financial statements and disclosures.
In June 2014, the FASB issued ASU 2014-12, Accounting for Share-Based Payments When the Terms of an Award Provide That a Performance Target Could Be Achieved after the Requisite Service Period. ASU 2014-12 requires that a performance target that affects vesting and could be achieved after the requisite service period be treated as a performance condition. ASU 2014-12 is effective for the Company in its first quarter of 2016 with early adoption permitted. The Company does not expect its pending adoption of ASU 2014-12 to have a material impact on its consolidated financial statements and disclosures.
In August 2014, the FASB issued ASU 2014-15, Disclosure of Uncertainties about an Entity’s Ability to Continue as a Going Concern, to provide guidance on management’s responsibility in evaluating whether there is substantial doubt about a company’s ability to continue as a going concern and to provide related footnote disclosures. ASU 2014-15 is effective for the Company in the first quarter of 2017 with early adoption permitted. The Company does not expect its pending adoption of ASU 2014-15 to have an impact on its consolidated financial statements and disclosures.
Note 3. Cash, Cash Equivalents, and Short-Term Investments
Cash consists of deposits with financial institutions. Cash equivalents include money market funds, time deposits, and marketable debt securities. Investments are comprised of time deposits and marketable debt securities. The Company's marketable debt securities consist primarily of certificates of deposit, commercial paper, corporate notes and bonds, U.S. government and agency notes and bonds, and municipal securities with original maturities beyond 90 days. Realized gains or losses and other-than-temporary impairments, if any, on available-for-sale securities are reported in other income or expense as incurred. The Company recognizes realized gains and losses upon sales of investment and reclassifies unrealized gains and losses out of accumulated other comprehensive income into earnings using the specific identification method. Realized gains recognized for the years ended December 31, 2014, 2013 and 2012 was negligible.
67
The following table summarizes the Company’s cash, cash equivalents, and short-term investments as of December 31, 2014 (in thousands):
Cost | Gross Unrealized Gains | Gross Unrealized Losses | Estimated Fair Value | ||||||||||||
Cash | $ | 353,187 | $ | — | $ | — | $ | 353,187 | |||||||
Cash equivalents: | |||||||||||||||
Money market funds | 15,344 | — | — | 15,344 | |||||||||||
Total cash equivalents | 15,344 | — | — | 15,344 | |||||||||||
Total cash and cash equivalents | 368,531 | — | — | 368,531 | |||||||||||
Short-term investments: | |||||||||||||||
Certificates of deposit | 1,920 | — | — | 1,920 | |||||||||||
Commercial paper | 1,996 | — | — | 1,996 | |||||||||||
Corporate notes and bonds | 196,401 | 84 | (371 | ) | 196,114 | ||||||||||
Federal agency notes and bonds | 51,987 | 13 | (44 | ) | 51,956 | ||||||||||
Time deposits | 26,395 | — | — | 26,395 | |||||||||||
Municipal notes and bonds | 74,639 | 128 | (18 | ) | 74,749 | ||||||||||
Total short-term investments | 353,338 | 225 | (433 | ) | 353,130 | ||||||||||
Total cash, cash equivalents, and short-term investments | $ | 721,869 | $ | 225 | $ | (433 | ) | $ | 721,661 | ||||||
The following table summarizes the Company’s cash, cash equivalents, and short-term investments as of December 31, 2013 (in thousands):
Cost | Gross Unrealized Gains | Gross Unrealized Losses | Estimated Fair Value | ||||||||||||
Cash | $ | 263,572 | $ | — | $ | — | $ | 263,572 | |||||||
Cash equivalents: | |||||||||||||||
Money market funds | 21,893 | — | — | 21,893 | |||||||||||
U.S. government notes and bonds | 12,353 | — | — | 12,353 | |||||||||||
Total cash equivalents | 34,246 | — | — | 34,246 | |||||||||||
Total cash and cash equivalents | 297,818 | — | — | 297,818 | |||||||||||
Short-term investments: | |||||||||||||||
Certificates of deposit | 960 | — | — | 960 | |||||||||||
Commercial paper | 12,738 | — | — | 12,738 | |||||||||||
Corporate notes and bonds | 175,446 | 220 | (220 | ) | 175,446 | ||||||||||
Federal agency notes and bonds | 64,863 | 31 | (69 | ) | 64,825 | ||||||||||
Time deposits | 21,585 | — | — | 21,585 | |||||||||||
Municipal notes and bonds | 103,923 | 153 | (14 | ) | 104,062 | ||||||||||
Total short-term investments | 379,515 | 404 | (303 | ) | 379,616 | ||||||||||
Total cash, cash equivalents, and short-term investments | $ | 677,333 | $ | 404 | $ | (303 | ) | $ | 677,434 | ||||||
See Note 2. Summary of Significant Accounting Policies of Notes to Consolidated Financial Statements for further information regarding the fair value of the Company's financial instruments.
68
The following table summarizes the fair value and gross unrealized losses related to the Company's short-term investments, aggregated by investment category that have been in a continuous unrealized loss position for less than twelve months, at December 31, 2014 (in thousands):
Less Than 12 months | |||||||
Fair Value | Gross Unrealized Losses | ||||||
Corporate notes and bonds | $ | 105,704 | $ | (259 | ) | ||
Federal agency notes and bonds | 34,434 | (44 | ) | ||||
Municipal notes and bonds | 13,120 | (18 | ) | ||||
Total | $ | 153,258 | $ | (321 | ) | ||
The following table summarizes the fair value and gross unrealized losses related to the Company's short-term investments, aggregated by investment category that have been in a continuous unrealized loss position for greater than twelve months, at December 31, 2014 (in thousands):
Greater Than 12 months | |||||||
Fair Value | Gross Unrealized Losses | ||||||
Corporate notes and bonds | $ | 7,598 | $ | (112 | ) | ||
Total | $ | 7,598 | $ | (112 | ) | ||
The changes in value of these investments are primarily related to changes in interest rates and are considered to be temporary in nature.
The following table summarizes the cost and estimated fair value of the Company’s short-term investments by contractual maturity at December 31, 2014 (in thousands):
Cost | Fair Value | ||||||
Due within one year | $ | 190,404 | $ | 190,484 | |||
Due in one year to two years | 112,364 | 112,237 | |||||
Due after two years | 50,570 | 50,409 | |||||
Total | $ | 353,338 | $ | 353,130 | |||
69
Note 4. Property and Equipment
The following table summarizes the cost of property and equipment and related accumulated depreciation at December 31, 2014 and 2013 (in thousands):
Estimated | December 31, | |||||||||
Useful Lives | 2014 | 2013 | ||||||||
Land | N/A | $ | 20,637 | $ | 20,637 | |||||
Buildings | 25 years | 105,725 | 105,725 | |||||||
Site improvements | 15 years | 1,247 | 1,199 | |||||||
Building improvements | 10-15 years | 11,434 | 11,246 | |||||||
Total land and buildings | 139,043 | 138,807 | ||||||||
Computer and equipment | 1-5 years | 67,819 | 62,423 | |||||||
Furniture and fixtures | 3-5 years | 10,206 | 8,287 | |||||||
Leasehold improvements | 1-10 years | 23,802 | 14,454 | |||||||
Total property and equipment | 240,870 | 223,971 | ||||||||
Less: Accumulated depreciation and amortization | (81,162 | ) | (66,663 | ) | ||||||
Total property and equipment, net | $ | 159,708 | $ | 157,308 | ||||||
Depreciation and amortization expense was $19.1 million, $15.0 million, and $12.3 million in 2014, 2013, and 2012, respectively.
Note 5. Intangible Assets and Goodwill
The carrying amounts of the intangible assets other than goodwill as of December 31, 2014 and 2013 are as follows (in thousands, except years):
December 31, 2014 | December 31, 2013 | Weighted Average Useful Life (Years) | |||||||||||||||||||||||
Cost | Accumulated Amortization | Net | Cost | Accumulated Amortization | Net | ||||||||||||||||||||
Developed and core technology | $ | 145,929 | $ | (112,169 | ) | $ | 33,760 | $ | 130,744 | $ | (99,026 | ) | $ | 31,718 | 6 | ||||||||||
Other intangible assets: | |||||||||||||||||||||||||
Customer relationships | 45,178 | (39,766 | ) | 5,412 | 41,683 | (35,216 | ) | 6,467 | 5 | ||||||||||||||||
All other (i) | 19,145 | (15,156 | ) | 3,989 | 17,205 | (13,765 | ) | 3,440 | 4-9 | ||||||||||||||||
Total other intangible assets | 64,323 | (54,922 | ) | 9,401 | 58,888 | (48,981 | ) | 9,907 | |||||||||||||||||
Total intangible assets, net | $ | 210,252 | $ | (167,091 | ) | $ | 43,161 | $ | 189,632 | $ | (148,007 | ) | $ | 41,625 | |||||||||||
____________________
(i) | All other includes vendor relationships, trade names, covenants not to compete, and patents. |
Total amortization expense related to intangible assets was $19.1 million, $30.0 million, and $28.6 million for the years ended December 31, 2014, 2013, and 2012, respectively. Of the $19.1 million amortization of intangible assets recorded in 2014, $5.9 million was recorded in operating expenses and $13.1 million was recorded in cost of revenues. Of the $30.0 million amortization of intangible assets recorded in 2013, $7.7 million was recorded in operating expenses and $22.3 million was recorded in cost of revenues. Of the $28.6 million amortization of intangible assets recorded in 2012, $6.6 million was recorded in operating expenses and $22.0 million was recorded in cost of revenues. Certain intangible assets were recorded in foreign currencies; and therefore, the gross carrying amount and accumulated amortization are subject to foreign currency translation adjustments.
70
As of December 31, 2014, the amortization expense related to identifiable intangible assets in future periods is expected to be as follows (in thousands):
Acquired Technology | Other Intangible Assets | Total Intangible Assets | |||||||||
2015 | $ | 10,382 | $ | 4,302 | $ | 14,684 | |||||
2016 | 8,899 | 2,449 | 11,348 | ||||||||
2017 | 6,881 | 1,152 | 8,033 | ||||||||
2018 | 4,762 | 729 | 5,491 | ||||||||
2019 | 2,335 | 449 | 2,784 | ||||||||
Thereafter | 501 | 320 | 821 | ||||||||
Total expected amortization expense | $ | 33,760 | $ | 9,401 | $ | 43,161 | |||||
The changes in the carrying amount of goodwill for the years ended December 31, 2014 and 2013 are as follows (in thousands):
December 31, | |||||||
2014 | 2013 | ||||||
Beginning balance | $ | 523,142 | $ | 510,121 | |||
Goodwill from acquisitions | 38,776 | 7,110 | |||||
Subsequent goodwill adjustments | (10,722 | ) | 5,911 | ||||
Ending balance | $ | 551,196 | $ | 523,142 | |||
During the year ended December 31, 2014, the Company recorded subsequent goodwill net reductions of $10.7 million primarily related to foreign currency translation adjustments. During the year ended December 31, 2013, the Company recorded subsequent goodwill adjustments of $5.9 million which consist of a $2.8 million measurement period adjustment related to Heiler Software accrued liabilities and foreign currency translation adjustments of $4.0 million, partially offset by income tax related balance sheet adjustments of $0.9 million within the measurement period related to prior acquisitions. The goodwill is partially deductible for tax purposes. See Note 19. Acquisitions for further discussion of goodwill from acquisitions.
Note 6. Borrowings
Credit Agreement
On September 26, 2014, the Company entered into a Credit Agreement (the “Credit Agreement”) that matures on September 26, 2019. The Credit Agreement replaces the former agreement that matured on September 29, 2014. The Credit Agreement provides for an unsecured revolving credit facility in an amount of up to $220.0 million, with an option for the Company to request to increase the revolving loan commitments or to enter into tranches of term loans in an aggregate amount of up to $30.0 million, for a total credit facility of up to $250.0 million. The revolving credit facility has sublimits for swingline loans available on a same day basis of up to $10.0 million and for the issuance of standby letters of credit in a face amount up to $20.0 million. No amounts were outstanding under the Credit Agreements as of December 31, 2014 and 2013, and a total of $220.0 million remained available for borrowing.
Revolving loans accrue interest at a per annum rate based on either, at the Company's election, (i) the base rate plus a margin ranging from 0.50% to 1.00% depending on the Company's consolidated leverage ratio, or (ii) LIBO rate (based on 1-, 2-, 3-, or 6-month interest periods) plus a margin ranging from 1.50% to 2.00% depending on the Company's consolidated leverage ratio. The base rate is equal to the highest of (i) JPMorgan Chase Bank, N.A.'s prime rate, (ii) the federal funds rate plus a margin equal to 0.50%, and (iii) LIBO rate for a 1-month interest period plus a margin equal to 1.00%. Swingline loans accrue interest at a per annum rate based on the base rate plus the applicable margin for base rate loans. Revolving loans may be borrowed, repaid and reborrowed until September 26, 2019, at which time all amounts borrowed must be repaid. Swingline loans shall be repaid on the 15th day of a calendar month, or the last day of a calendar month, or September 26, 2019, whichever is earlier.
71
Accrued interest on the revolving loans is payable (i) quarterly in arrears with respect to base rate loans, (ii) at the end of each interest rate period (or at each 3- month interval in the case of loans with interest periods greater than 3 months) with respect to LIBO rate loans, and (iii) the day that the borrowing is required to be repaid with respect to swingline loans. The Company is also obligated to pay other customary closing fees, arrangement fees, administrative fees, commitment fees, and letter of credit fees. A quarterly commitment fee is applied to the average daily unborrowed amount under the credit facility at a per annum rate ranging from 0.225% to 0.35% depending on the Company's consolidated leverage ratio. The Company may prepay the loans or terminate or reduce the commitments in whole or in part at any time, without premium or penalty, subject to certain conditions including minimum amounts in the case of commitment reductions and reimbursement of certain costs in the case of prepayments of LIBO rate loans.
The Credit Agreement contains customary representations and warranties, covenants, and events of default, including the requirement to maintain a maximum consolidated leverage ratio of 2.75 to 1.00 and a minimum consolidated interest coverage ratio of 3.50 to 1.00. The occurrence of an event of default could result in the acceleration of the obligations under the Credit Agreement. Under certain circumstances, a default interest rate will apply on all obligations during the existence of a payment default under the Credit Agreement at a per annum rate equal to 2.00% above the applicable interest rate for any overdue principal and 2.00% above the rate applicable to base rate loans for any other overdue amounts. The Company was in compliance with all covenants under the Credit Agreement as of December 31, 2014.
Note 7. Stockholders' Equity
Preferred Stock
The Company is authorized to issue 2.0 million shares of preferred stock with a par value of $0.001 per share of which 200,000 shares have been designated as Series A preferred stock. The Company may issue preferred stock from time to time in one or more series. The Board of Directors is authorized to provide for the rights, preferences, privileges, and restrictions of the shares of such series. As of December 31, 2014 and 2013, no shares of preferred stock had been issued.
Common Stock
The Company has authorized 200 million shares of common stock with a par value of $0.001 per share. Each share of common stock has the right to one vote. The holders of common stock are also entitled to receive dividends whenever funds are legally available and when declared by the Board of Directors, subject to the rights of holders of all classes of stock having priority rights as to dividends. No cash dividends have been declared or paid through December 31, 2014.
Stock Repurchase Plan
The Company's Board of Directors has approved a stock repurchase program for the Company to repurchase its common stock. The primary purpose of the program is to enhance shareholder value, including to offset the dilutive impact of stock based incentive plans. The number of shares to be purchased and the timing of the purchases are based on several factors, including the price of the Company's common stock, the Company's liquidity and working capital needs, general business and market conditions, and other investment opportunities. These purchases can be made from time to time in the open market and are funded from the Company's available working capital. In each of January, July, and October of 2014, the Board of Directors approved the repurchase of up to an additional $100 million of the Company's outstanding common stock, with such authorizations aggregating to $300 million. As of December 31, 2014, $162.8 million remained available for repurchase under this program. For further information about additional repurchases after December 31, 2014, see Note 20. Subsequent Event of Notes to Consolidated Financial Statements in Part II, Item 8 of this Report.
This repurchase program does not have an expiration date. Repurchased shares are retired and reclassified as authorized and unissued shares of common stock. The Company may continue to repurchase shares from time to time, as determined by management under programs approved by the Board of Directors.
The Company repurchased approximately 4,074,000 shares for $141.2 million, 2,488,000 shares for $92.1 million, and 2,435,000 shares for $81.0 million in 2014, 2013, and 2012, respectively.
72
Note 8. Stock-based Compensation
Summary of Plans
1999 Stock Incentive Plan
The Company's stockholders approved the 1999 Stock Incentive Plan (the “1999 Incentive Plan”) in April 1999 under which 2,600,000 shares were reserved for issuance. In addition, any shares not issued under the 1996 Stock Plan were also available for grant. The number of shares reserved under the 1999 Incentive Plan automatically increased annually beginning on January 1, 2000 by the lesser of 16,000,000 shares or 5% of the total amount of fully diluted shares of common stock outstanding as of such date. Under the 1999 Incentive Plan, eligible employees, officers, and directors may be granted stock options, stock appreciation rights, restricted shares, and stock units. The exercise price for incentive stock options and non-qualified options may not be less than 100% and 85%, respectively, of the fair value of the Company's common stock at the option grant date. Options granted are exercisable over a maximum term of seven to ten years from the date of the grant and generally vest ratably over a period of four years, with options for new employees generally including a 1-year cliff period. This plan expired in March 2009. No further shares will be awarded from this plan. As of December 31, 2014, there were approximately 500,000 options outstanding under the 1999 Incentive Plan.
2009 Equity Incentive Plan
The Company's stockholders approved the 2009 Equity Incentive Plan (the “2009 Incentive Plan”) in April 2009 under which 9,000,000 shares have been reserved for issuance. In May 2011, the Company's stockholders approved amendments to the 2009 Equity Incentive Plan to increase the number of shares reserved for issuance by 2,500,000 and to increase the ratio by which full value awards count against the share reserve from 1.52 to 2.37. In May 2012, the Company's stockholders approved an amendment to the 2009 Equity Incentive Plan to increase the number of shares reserved for issuance by 5,000,000. In May 2013, the Company's stockholders approved an amendment to the 2009 Equity Incentive Plan to increase the number of shares reserved for issuance by 4,000,000. In May 2014, the Company's stockholders approved an amendment to the 2009 Equity Incentive Plan to increase the number of shares reserved for issuance by 6,300,000. Under the 2009 Incentive Plan, eligible employees, officers, and directors may be granted stock options (incentive and non-qualified), stock appreciation rights, restricted stock, restricted stock units (“RSUs”), performance shares and performance units. The exercise price for incentive stock options and non-qualified options may not be less than 100% and 85%, respectively, of the fair value of the Company's common stock at the option grant date. Certain employees and non-employee directors may elect to defer the delivery of vested RSUs, and settlement of such RSUs will be in shares of common stock at the end of the elected deferral period.
As of December 31, 2014, there were approximately 7,121,000 shares available for grant and 10,216,000 options, RSUs and PRSUs outstanding under the 2009 Incentive Plan. For purposes of the share reserve, the grant of a RSU is deemed an award for 1.52 or 2.37 shares of authorized common stock for each one share of authorized common stock subject to such award. The ratio by which an RSU counts against the share reserve is based upon the ratio effective on the date of grant. If a share that was subject to an award and is returned to the 2009 Incentive Plan, the Company would credit the 2009 Incentive Plan reserve by the same ratio as it was originally issued. These returned shares would be available for issuance under the 2009 Incentive Plan. Of the approximately 2,489,000 unvested RSUs, 2,421,000 RSUs were granted at the 2.37 ratio, and approximately 68,000 were granted at the 1.52 ratio. All 517,000 PRSUs outstanding were granted at the 2.37 ratio.
Stock Options and Restricted Stock Units
The Company grants stock options which are exercisable over a maximum term of seven to ten years for employees and five to seven years for directors from the date of the grant. These grants generally vest ratably over a period of four years for employees and one to three years for directors. Options granted to new employees generally include a 1-year cliff period.
The Company also grants RSUs to its employees and directors which vest over four years with annual vesting dates for employees and one to three years for directors. Upon vesting of restricted stock, the recipient has the option to settle minimum withholding taxes by electing to have the Company withhold otherwise deliverable shares having a fair market value equal to the required tax obligations (“net-settlement”). The net-settlement shares are then immediately cancelled and retired. Shares are issued on the vesting dates net of the minimum statutory tax withholding requirements to be paid by the Company on behalf of its employees. As a result, the actual number of shares issued will be fewer than the actual number of RSUs outstanding.
73
Employee Stock Purchase Plan
The Company's stockholders approved the Employee Stock Purchase Plan (“ESPP”) in May 2008 under which 8,850,000 shares have been reserved for issuance. Under the ESPP, eligible employees may elect to contribute from 1% to 20% or a lesser percentage that the Compensation Committee of the Board of Directors (“Compensation Committee”) may establish from time to time of their eligible compensation. Currently, the Compensation Committee established the maximum contribution percentage at 10%. The purchase price is 85% of the lower of the closing price of the Common Stock on the NASDAQ Global Select Market at the beginning or end of the six-month offering period. As of December 31, 2014, the Company had approximately 5,506,000 shares available for future issuance under the ESPP.
Summary of Assumptions
The fair value of each option award is estimated on the date of grant using the Black-Scholes-Merton option pricing model that uses the assumptions in the following table. The Company has consistently used a blend of average historical and market-based implied volatilities for calculating the expected volatilities for employee stock options, and uses market-based implied volatilities for its ESPP. The expected term of ESPP is based on the contractual terms. The expected term of options granted to employees is derived from the historical option exercises, post-vesting cancellations, and estimates concerning future exercises and cancellations for vested and unvested options that remain outstanding. The risk-free interest rate for the expected term of the option and ESPP is based on the U.S. Treasury yield curve in effect at the time of grant. The Company recognizes its stock-based compensation related to options using a straight-line method over the vesting term of the awards.
The fair value of RSUs and PRSUs is the grant date closing price of our common stock. The Company recognizes expense related to RSUs using a straight-line method over the vesting term of the awards. The Company recognizes expense for PRSUs based on the probability of achieving certain performance criteria, as defined in the PRSU agreements, and uses the graded vesting attribution method over the requisite service period.
The Company records stock-based compensation for options, RSUs, and PRSUs granted net of estimated forfeiture rates. ASC 718, Stock Compensation, requires the Company to estimate forfeiture rates at the time of grant and revise those estimates in subsequent periods if actual forfeitures differ from those estimates. The Company uses historical forfeitures to estimate its future forfeiture rates. The Company's forfeiture rates for stock options, RSUs and PRSUs were 10% for 2014, 2013, and 2012.
The fair value of the Company's stock-based awards was estimated based on the following assumptions:
Years Ended December 31, | |||||||||||
2014 | 2013 | 2012 | |||||||||
Option grants: | |||||||||||
Expected volatility | 35 - 40 | % | 41 - 43 | % | 39 - 48 | % | |||||
Weighted-average volatility | 39 | % | 41 | % | 44 | % | |||||
Expected dividends | — | — | — | ||||||||
Expected term of options (in years) | 3.5 | 3.3 | 3.3 | ||||||||
Risk-free interest rate | 1.1 | % | 0.7 | % | 0.5 | % | |||||
ESPP: | |||||||||||
Expected volatility | 30 - 36 | % | 37 - 42 | % | 43 - 53 | % | |||||
Weighted-average volatility | 32 | % | 40 | % | 49 | % | |||||
Expected dividends | — | — | — | ||||||||
Expected term of ESPP (in years) | 0.5 | 0.5 | 0.5 | ||||||||
Risk-free interest rate | 0.1 | % | 0.1 | % | 0.1 | % | |||||
74
The allocation of the stock-based compensation, net of estimated income tax benefit, is as follows (in thousands):
Years Ended December 31, | |||||||||||
2014 | 2013 | 2012 | |||||||||
Cost of service revenues | $ | 5,935 | $ | 5,525 | $ | 4,349 | |||||
Research and development | 20,255 | 19,002 | 14,919 | ||||||||
Sales and marketing | 19,062 | 19,323 | 13,518 | ||||||||
General and administrative | 14,110 | 13,354 | 10,017 | ||||||||
Total stock-based compensation | 59,362 | 57,204 | 42,803 | ||||||||
Estimated tax benefit of stock-based compensation | (16,632 | ) | (15,934 | ) | (10,994 | ) | |||||
Total stock-based compensation, net of estimated tax benefit | $ | 42,730 | $ | 41,270 | $ | 31,809 | |||||
Stock Option Activity
A summary of stock option activity through December 31, 2014 is presented below (in thousands, except per share amounts):
Number of Shares | Weighted- Average Exercise Price Per Share | Weighted Average Remaining Contractual Term (Years) | Aggregate Intrinsic Value | |||||||||
Outstanding at December 31, 2011 | 10,229 | $ | 19.37 | 3.50 | $ | 218,839 | ||||||
Granted | 2,844 | 38.81 | ||||||||||
Exercised | (1,884 | ) | 13.40 | |||||||||
Forfeited or expired | (495 | ) | 36.72 | |||||||||
Outstanding at December 31, 2012 | 10,694 | $ | 24.79 | 3.50 | $ | 104,404 | ||||||
Granted | 2,267 | 37.34 | ||||||||||
Exercised | (2,671 | ) | 15.24 | |||||||||
Forfeited or expired | (866 | ) | 40.67 | |||||||||
Outstanding at December 31, 2013 | 9,424 | $ | 29.05 | 3.48 | $ | 127,697 | ||||||
Granted | 1,738 | 37.05 | ||||||||||
Exercised | (2,942 | ) | 13.23 | |||||||||
Forfeited or expired | (1,034 | ) | 40.45 | |||||||||
Outstanding at December 31, 2014 | 7,186 | $ | 35.82 | 4.25 | $ | 31,514 | ||||||
Exercisable at December 31, 2014 | 4,215 | $ | 34.84 | 3.41 | $ | 26,168 | ||||||
The fair value of options vesting during the years ended December 31, 2014, 2013, and 2012 was approximately $17.4 million, $18.5 million, and $15.6 million, respectively. As of December 31, 2014, there were a total of approximately 2,971,000 unvested options with a fair value of $33.4 million and weighted average exercise price of $37.22 and weighted average grant-date fair value of $11.25. The Company expects to recognize the fair value of the unvested shares over a weighted-average period of 2.51 years.
75
Restricted Stock Unit Activity
The Company started granting RSUs in 2009. A summary of RSU activity through December 31, 2014 is presented below (in thousands, except per share amounts):
Number of Shares | Weighted- Average Grant Date Fair Value | |||||
Outstanding at December 31, 2011 | 1,611 | |||||
Awarded | 1,095 | $ | 40.13 | |||
Released | (535 | ) | $ | 30.55 | ||
Forfeited | (244) | $ | 39.30 | |||
Outstanding at December 31, 2012 | 1,927 | |||||
Awarded | 835 | $ | 35.50 | |||
Released | (711) | $ | 33.31 | |||
Forfeited | (258) | $ | 39.91 | |||
Outstanding at December 31, 2013 | 1,793 | |||||
Awarded | 1,671 | $ | 35.88 | |||
Released | (616) | $ | 38.29 | |||
Forfeited | (335) | $ | 37.56 | |||
Outstanding at December 31, 2014 | 2,513 | |||||
The fair value of RSUs released during the years ended December 31, 2014, 2013 and 2012 was approximately $21.9 million, $25.4 million and $22.5 million, respectively. As of December 31, 2014, there were approximately 24,000 vested deferred RSUs outstanding and not yet released included in the RSU activity above. As of December 31, 2014, there were a total of approximately 2,489,000 unvested RSUs with a fair value of $91.9 million. The Company expects to recognize the fair value of the unvested RSUs over a weighted-average period of 2.68 years.
Performance-Based Restricted Stock Unit Activity
The Company started granting PRSUs in 2012. During the first quarter of 2014, the Company granted approximately 223,000 target PRSUs. The performance period for the target number of PRSUs granted in 2014 is the 2014 year. If certain performance goals are met, PRSUs would become eligible to vest, and vest ratably over two or four years on the annual anniversary dates of the grant, contingent upon the recipient’s continued service to the Company. Certain participants have the ability to receive up to 125% to 150% of the target number of shares originally granted. The weighted-average grant date fair value of 2014 PRSUs was $38.25 per share.
The performance period for the 649,900 target number of PRSUs granted in 2013 was the 2013 year. Certain participants had the ability to receive up to 110% to 125% of the target number of PRSUs originally granted. In the first quarter of 2014, the Compensation Committee certified actual performance achievement for PRSUs granted in 2013, and as a result, 507,000 shares became eligible to vest. The achieved PRSUs vest ratably over four years on the annual anniversary dates of the grant, contingent upon the recipient's continued service to the Company. The weighted-average grant date fair value of 2013 PRSUs was $37.42 per share.
The performance period for the 224,000 target number of PRSUs granted in 2012 was the 2012 year. Certain participants had the ability to receive up to 150% of the target number of PRSUs originally granted. In the first quarter of 2013, the Compensation Committee certified the actual performance achievement of participants for PRSUs granted in 2012. The performance metrics were not achieved, and therefore no PRSUs became eligible to vest. All 224,000 target PRSUs granted were cancelled. The Company did not record any stock-based compensation related to these performance awards.
76
A summary of PRSU activity granted in 2013, certified and actually achieved through December 31, 2014 is presented below (in thousands):
Number of Shares | ||
Outstanding at December 31, 2013 | — | |
Achieved | 507 | |
Released | (127 | ) |
Forfeited | (74 | ) |
Outstanding at December 31, 2014 | 306 | |
The fair value of PRSUs released during the year ended December 31, 2014 was approximately $4.9 million.
As of December 31, 2014, the PSRUs granted in 2014 had not been certified by the Compensation Committee of the Board of Directors as achieved. A summary of PRSU activity through December 31, 2014 is presented below (in thousands):
Number of Shares | ||
Outstanding at December 31, 2013 | — | |
Granted | 223 | |
Forfeited | (12 | ) |
Outstanding at December 31, 2014 | 211 | |
As of December 31, 2014, there was approximately 517,000 unvested PRSUs with a fair value of $19.5 million. The Company expects to recognize the fair value of the unvested PRSUs over a weighted-average period of 1.20 years. In the first quarter of 2015, the Compensation Committee certified actual performance achievement for PRSUs granted in 2014, and as a result, 138,000 shares out of the 211,000 shares became eligible to vest.
Disclosures Pertaining to All Stock-based Compensation Plans
The weighted-average fair value of options granted during 2014, 2013, and 2012 was $11.02, $8.96, and $12.06, respectively. No options were granted with exercise prices less than fair value at the date of grant in 2014, 2013, and 2012. The total intrinsic value of options exercised for the years ended, December 31, 2014, 2013, and 2012 was $70.5 million, $58.4 million, and $53.5 million, respectively. The weighted average grant date fair value of unvested RSUs for the years ended December 31, 2014, 2013, and 2012 was $36.93, $38.50, and $38.08, respectively. The RSUs granted in 2014 vest in 2015 through 2018. The weighted-average grant date fair value of unvested PRSUs for the year ended December 31, 2014 was $37.76. The weighted-average grant date fair value of employee stock purchase shares granted under the ESPP for the years ended December 31, 2014, 2013, and 2012 was $8.21, $10.01, and $9.93, respectively. The total intrinsic value of stock purchase shares granted under the ESPP exercised during the years ended December 31, 2014, 2013, and 2012 was $3.9 million, $6.5 million, and $2.8 million, respectively. Upon the exercise of options and stock purchase shares granted under the ESPP, the Company issues new common stock from its authorized shares.
Cash received from option exercises and ESPP contributions under all stock-based compensation arrangements for the years ended December 31, 2014, 2013, and 2012 were $59.0 million, $58.7 million, and $41.4 million, respectively. The total realized tax benefits attributable to stock options exercised and restricted stock units vested were $0.4 million, $26.1 million, and $16.5 million for the years ended December 31, 2014, 2013, and 2012, respectively. The gross excess tax benefits from stock-based compensation for the years ended December 31, 2014, 2013, and 2012 were $3.8 million, $27.5 million, and $17.0 million, respectively, as reported on the consolidated statements of cash flows in the financing activities section, which represent a reduction in income taxes otherwise payable during the periods. These amounts are related to the actual gross tax benefits in excess of the expected tax benefits for stock options exercised in 2014, 2013, and 2012.
77
Note 9. Accumulated Other Comprehensive Loss
The following table summarizes the changes in accumulated balances for each component of other comprehensive income (loss), for the year ended December 31, 2014, net of taxes (in thousands):
Cumulative Translation Adjustments | Net Unrealized Gain (Loss) on Available-for-Sale Investments | Net Unrealized Gain (Loss) on Cash Flow Hedges | Total | |||||||||||||
Accumulated other comprehensive income (loss) as of December 31, 2013 | $ | (2,879 | ) | $ | 63 | $ | (396 | ) | $ | (3,212 | ) | |||||
Other comprehensive income (loss): | ||||||||||||||||
Other comprehensive income (loss) before reclassifications, net of tax benefit (expense) of $664, $111 and $(483) | (28,433 | ) | (181 | ) | 787 | (27,827 | ) | |||||||||
Net gain from discontinuance of cash flow hedges, net of tax expense of $-, $- and $(3) | — | — | 6 | 6 | ||||||||||||
Net gain reclassified from accumulated other comprehensive income (loss), net of tax expense of $ —, $(7) and $(453) | — | (11 | ) | (i) | (739 | ) | (ii) | (750 | ) | |||||||
Net gain reclassified into earnings related to discontinuance of cash flow hedges, net of tax expense of $-, $- and $(3) | — | — | (6 | ) | (iii) | (6 | ) | |||||||||
Total other comprehensive income (loss), net of tax effect (iv) | (28,433 | ) | (192 | ) | 48 | (28,577 | ) | |||||||||
Accumulated other comprehensive loss as of December 31, 2014 | $ | (31,312 | ) | $ | (129 | ) | $ | (348 | ) | $ | (31,789 | ) | ||||
(i) | The before-tax gain of $18 was included in other expense, net on the consolidated statements of income. |
(ii) | The before-tax gain of $287 and $905 were included in cost of service revenues and operating expenses, primarily research and development expense, respectively on the consolidated statements of income. |
(iii) | The before-tax gain of $2 and $7 were included in cost of service revenues and operating expenses, primarily research and development expense, respectively on the consolidated statements of income. |
(iv) | The tax expense related to the net gain reclassified from accumulated other comprehensive income (loss) was included in income tax provision on the consolidated statements of income. |
78
The following table summarizes the changes in accumulated balances for each component of other comprehensive income (loss), for the year ended December 31, 2013, net of taxes (in thousands):
Cumulative Translation Adjustments | Net Unrealized Gain (Loss) on Available-for-Sale Investments | Net Unrealized Loss on Cash Flow Hedges | Total | |||||||||||||
Accumulated other comprehensive income (loss) as of December 31, 2012 | $ | (8,012 | ) | $ | 242 | $ | (260 | ) | $ | (8,030 | ) | |||||
Other comprehensive income (loss): | ||||||||||||||||
Other comprehensive income (loss) before reclassifications, net of tax benefit (expense) of $(172), $126 and $794 | 5,133 | (205 | ) | (1,295 | ) | 3,633 | ||||||||||
Net loss reclassified from accumulated other comprehensive income (loss), net of tax benefit of $ —, $16 and $710 | — | 26 | (i) | 1,159 | (ii) | 1,185 | ||||||||||
Total other comprehensive income (loss), net of tax effect (iii) | 5,133 | (179 | ) | (136 | ) | 4,818 | ||||||||||
Accumulated other comprehensive income (loss) as of December 31, 2013 | $ | (2,879 | ) | $ | 63 | $ | (396 | ) | $ | (3,212 | ) | |||||
____________________
(i) | The before-tax loss of $42 was included in other expense, net on the consolidated statements of income. |
(ii) | The before-tax loss of $441 and $1,428 were included in cost of service revenues and operating expenses, primarily research and development expense, respectively on the consolidated statements of income. |
(iii) | The tax benefit related to the net loss reclassified from accumulated other comprehensive income (loss) was included in income tax provision on the consolidated statements of income. |
The Company did not have any other-than-temporary gain or loss reflected in accumulated other comprehensive income (loss) as of December 31, 2014 and 2013.
The Company determines the basis of the cost of a security sold and the amount reclassified out of other comprehensive income into statement of income based on specific identification.
See Note 2. Summary of Significant Accounting Policies, Note 10. Derivative Financial Instruments, and Note 14. Commitments and Contingencies of Notes to Consolidated Financial Statements for a further discussion.
Note 10. Derivative Financial Instruments
The Company’s earnings and cash flows are subject to fluctuations due to changes in foreign currency exchange rates. The Company uses derivative instruments to manage its exposures to fluctuations in certain foreign currency exchange rates which exist as part of ongoing business operations. The Company and its subsidiaries do not enter into derivative contracts for speculative purposes.
Cash Flow Hedges
The Company enters into certain cash flow hedge programs in an attempt to reduce the impact of certain foreign currency fluctuations. These contracts are designated and documented as cash flow hedges. The purpose of these programs is to reduce the volatility of identified cash flow and expenses caused by movement in certain foreign currency exchange rates, in particular, the Indian rupee. The Company is currently using foreign exchange forward contracts to hedge the foreign currency anticipated expenses of its subsidiary in India.
79
The Company releases the amounts accumulated in other comprehensive income into earnings in the same period or periods during which the forecasted hedge transaction affects earnings. The Company will reclassify all amounts accumulated in other comprehensive income into earnings within the next twelve months. During 2014, an insignificant amount of gain was reclassified into earnings as a result of the discontinuance of cash flow hedges when it was not probable that the original forecasted transactions would occur by the end of the originally specified time period.
The Company has forecasted the amount of its anticipated foreign currency expenses based on its historical performance and its projected financial plan. As of December 31, 2014, the remaining open foreign exchange contracts, carried at fair value, are hedging Indian rupee expenses and have a maturity of thirteen months or less. These foreign exchange contracts mature monthly as the foreign currency denominated expenses are paid and any gain or loss is offset against expense. Once the hedged item is recognized, the cash flow hedge is de-designated and subsequent changes in value are recognized in other income (expense) to offset changes in the value of the resulting foreign currency monetary assets or liabilities.
The notional amounts of these foreign exchange forward contracts in U.S. dollar equivalents were to buy $45.9 million and $30.1 million of Indian rupees as of December 31, 2014 and 2013, respectively.
Balance Sheet Hedges
Balance sheet hedges consist of cash flow hedge contracts that have been de-designated and non-designated balance sheet hedges. These foreign exchange contracts are carried at fair value and either did not or no longer qualify for hedge accounting treatment and are not designated as hedging instruments. Changes in the value of the foreign exchange contracts are recognized in other income (expense) and offset the foreign currency gain or loss on the underlying net monetary assets or liabilities. The notional amounts of foreign currency contracts open at year end in U.S. dollar equivalents were to buy $10.6 million and $2.6 million at December 31, 2014 and 2013, respectively. The notional amounts of foreign currency contracts open at year end in U.S. dollar equivalents were to sell $57.1 million at December 31, 2014. There was no open foreign currency contracts to sell at December 31, 2013.
The following table reflects the fair value amounts for the foreign exchange contracts designated and not designated as hedging instruments at December 31, 2014 and 2013 (in thousands):
December 31, 2014 | December 31, 2013 | ||||||||||||||
Fair Value Derivative Assets (i) | Fair Value Derivative Liabilities (ii) | Fair Value Derivative Assets (i) | Fair Value Derivative Liabilities (iii) | ||||||||||||
Derivatives designated as hedging instruments | $ | 141 | $ | 761 | $ | 284 | $ | 830 | |||||||
Derivatives not designated as hedging instruments | 169 | 154 | — | 194 | |||||||||||
Total fair value of derivative instruments | $ | 310 | $ | 915 | $ | 284 | $ | 1,024 | |||||||
____________________
(i) | Included in prepaid expenses and other current assets on the consolidated balance sheets. |
(ii) | Included in accrued liabilities and other liabilities on the consolidated balance sheets. |
(iii) | Included in accrued liabilities on the consolidated balance sheets. |
The Company presents its derivative assets and derivative liabilities at gross fair values in the consolidated balance sheets. However, under the master netting arrangements with the respective counterparties of the foreign exchange contracts, subject to applicable requirements, the Company is allowed to net settle transactions of the same currency with a single net amount payable by one party to the other. The derivatives held by the Company are not subject to any credit contingent features negotiated with its counterparties. The Company is not required to pledge nor is entitled to receive cash collateral related to the above contracts.
80
The following table sets forth the offsetting of derivative asset as of December 31, 2014 and 2013 (in thousands):
Gross Amounts Not Offset in the Consolidated Balance Sheets | |||||||||||||||||||||||
Gross Amounts of Recognized Assets | Gross Amounts Offset in the Consolidated Balance Sheets | Net Amounts of Assets Presented in the Consolidated Balance Sheets | Financial Instruments (i) | Cash Collateral | Net Amount | ||||||||||||||||||
As of December 31, | |||||||||||||||||||||||
2014: | |||||||||||||||||||||||
Foreign exchange contracts | $ | 310 | $ | — | $ | 310 | $ | (62 | ) | $ | — | $ | 248 | ||||||||||
As of December 31, | |||||||||||||||||||||||
2013: | |||||||||||||||||||||||
Foreign exchange contracts | $ | 284 | $ | — | $ | 284 | $ | (268 | ) | $ | — | $ | 16 | ||||||||||
____________________
(i) | The balances at December 31, 2014 and 2013 were related to derivative liabilities which are allowed to net settled against derivative assets in accordance with the master netting agreements. |
The following table sets forth the offsetting of derivative liabilities as of December 31, 2014 and 2013 (in thousands):
Gross Amounts Not Offset in the Consolidated Balance Sheets | |||||||||||||||||||||||
Gross Amounts of Recognized Liabilities | Gross Amounts Offset in the Consolidated Balance Sheets | Net Amounts of Liabilities Presented in the Consolidated Balance Sheets | Financial Instruments (ii) | Cash Collateral | Net Amount | ||||||||||||||||||
As of December 31, | |||||||||||||||||||||||
2014: | |||||||||||||||||||||||
Foreign exchange contracts | $ | 915 | $ | — | $ | 915 | $ | (62 | ) | $ | — | $ | 853 | ||||||||||
As of December 31, | |||||||||||||||||||||||
2013: | |||||||||||||||||||||||
Foreign exchange contracts | $ | 1,024 | $ | — | $ | 1,024 | $ | (268 | ) | $ | — | $ | 756 | ||||||||||
____________________
(ii) | The balances at December 31, 2014 and 2013 were related to derivative assets which are allowed to net settled against derivative liabilities in accordance with the master netting agreements. |
The Company evaluates prospectively as well as retrospectively the effectiveness of its hedge programs using statistical analysis. Prospective testing is performed at the inception of the hedge relationship and quarterly thereafter. Retrospective testing is performed on a quarterly basis. In October 2013, the Company changed its effectiveness assessment method from the spot to spot price method to include time value in the assessment. Prospectively, the Company includes all changes in value that are
81
effective including changes in time value to accumulated other comprehensive income. The Company no longer records amounts as an excluded component of the hedge relationship.
The before-tax effects of derivative instruments designated as cash flow hedges on the accumulated other comprehensive income (loss) and consolidated statements of income for the years ended December 31, 2014, 2013, and 2012 are as follows (in thousands):
Years Ended December 31, | |||||||||||
2014 | 2013 | 2012 | |||||||||
Amount of gain (loss) recognized in other comprehensive income (effective portion) | $ | 1,270 | $ | (2,089 | ) | $ | (594 | ) | |||
Amount of gain (loss) reclassified from accumulated other comprehensive income to cost of service revenues and operating expenses (effective portion) | $ | 1,192 | $ | (1,869 | ) | $ | (2,275 | ) | |||
Amount of gain recognized in income on derivatives for the amount excluded from effectiveness testing located in operating expenses | $ | — | $ | 728 | $ | 1,227 | |||||
Amount of loss on derivatives due to hedge ineffectiveness recognized in cost of service revenues and operating expenses | $ | 135 | $ | — | $ | — | |||||
The before-tax loss recognized in other expense, net for non-designated foreign currency forward contracts for the years ended December 31, 2014, 2013, and 2012 is as follows (in thousands):
Years Ended December 31, | |||||||||||
2014 | 2013 | 2012 | |||||||||
Loss recognized in interest and other expense, net | $ | (152 | ) | $ | (161 | ) | $ | (904 | ) | ||
See Note 2. Summary of Significant Accounting Policies and Note 9. Accumulated Other Comprehensive Loss, and Note 14. Commitments and Contingencies of Notes to Consolidated Financial Statements for a further discussion.
Note 11. Employee 401(K) Plan
The Company's employee savings and retirement plan (the “Plan”) is qualified under Section 401 of the Internal Revenue Code. The Plan is available to all regular employees on the Company's U.S. payroll and provides employees with tax deferred salary deductions and alternative investment options. Employees may contribute up to 50% of their salary up to the statutory prescribed annual limit. The Company matches 50% of the contribution made by an employee, up to a maximum of $4,000 per calendar year. Contributions made by the Company vest 100% upon contribution. The Company contributed $5.2 million, $4.5 million, and $3.6 million for the years ended December 31, 2014, 2013, and 2012 respectively. In addition, the Plan provides for discretionary contributions at the discretion of the Board of Directors. No discretionary contributions have been made by the Company to date.
82
Note 12. Income Taxes
The federal, state, and foreign income tax provisions for the years ended December 31, 2014, 2013, and 2012 are summarized as follows (in thousands):
Years Ended December 31, | |||||||||||
2014 | 2013 | 2012 | |||||||||
Current tax provision: | |||||||||||
Federal | $ | 39,903 | $ | 65,344 | $ | 35,481 | |||||
State | 7,982 | 10,167 | 4,337 | ||||||||
Foreign | 9,704 | 2,882 | 9,417 | ||||||||
Total current tax provision | 57,589 | 78,393 | 49,235 | ||||||||
Deferred tax provision: | |||||||||||
Federal | (859 | ) | (24,469 | ) | (3,044 | ) | |||||
State | 1,686 | (3,334 | ) | 597 | |||||||
Foreign | (2,210 | ) | 3,737 | (2,203 | ) | ||||||
Total deferred tax provision | (1,383 | ) | (24,066 | ) | (4,650 | ) | |||||
Total provision for income taxes | $ | 56,206 | $ | 54,327 | $ | 44,585 | |||||
The components of income before income taxes attributable to domestic and foreign operations are as follows (in thousands):
Years Ended December 31, | |||||||||||
2014 | 2013 | 2012 | |||||||||
Domestic | $ | 128,857 | $ | 118,939 | $ | 87,981 | |||||
Foreign | 41,436 | 21,783 | 49,786 | ||||||||
Income before income taxes | $ | 170,293 | $ | 140,722 | $ | 137,767 | |||||
A reconciliation of the provision computed at the statutory federal income tax rate to the Company's income tax provision is as follows (in thousands):
Years Ended December 31, | |||||||||||
2014 | 2013 | 2012 | |||||||||
Income tax provision computed at federal statutory tax rate | $ | 59,603 | $ | 49,253 | $ | 48,218 | |||||
State taxes, net of federal benefit | 5,970 | 4,208 | 3,276 | ||||||||
Foreign earnings taxed at different rates | (4,292 | ) | 5,395 | (9,557 | ) | ||||||
Stock-based compensation | 4,475 | 3,397 | 3,270 | ||||||||
Return to provision true-up | (2,238 | ) | (668 | ) | 92 | ||||||
Research and development tax credits | (2,707 | ) | (3,715 | ) | — | ||||||
Domestic manufacturing deduction | (4,025 | ) | (3,150 | ) | (2,100 | ) | |||||
Other | (580 | ) | (393 | ) | 1,386 | ||||||
Total provision for income taxes | $ | 56,206 | $ | 54,327 | $ | 44,585 | |||||
The higher tax rate for 2013 was primarily attributable to non-deductible stock-based compensation, state income taxes, the accrual of reserves related to uncertain tax positions and acquisition integration related income tax expenses resulted in higher taxes in our foreign earnings partially offset by the domestic manufacturing deduction pursuant to Section 199 of the Internal Revenue Code and the recognition of the 2012 and 2013 federal research and development credits.
83
Significant components of the Company's deferred tax assets are as follows (in thousands):
December 31, | |||||||
2014 | 2013 | ||||||
Deferred tax assets: | |||||||
Net operating loss carryforwards | $ | 28,168 | $ | 23,710 | |||
Tax credits carryforwards | 9,883 | 10,131 | |||||
Deferred revenue | 18,198 | 19,240 | |||||
Reserves and accrued costs not currently deductible | 15,984 | 15,097 | |||||
Depreciable assets | 7,767 | 6,450 | |||||
Stock-based compensation | 23,814 | 20,149 | |||||
Other | 2,100 | 381 | |||||
Valuation allowance | (8,298 | ) | (4,552 | ) | |||
Total deferred tax assets | 97,616 | 90,606 | |||||
Deferred tax liabilities: | |||||||
Non-deductible intangible assets (i) | (18,717 | ) | (12,887 | ) | |||
Total deferred tax liabilities | (18,717 | ) | (12,887 | ) | |||
Net deferred tax assets | $ | 78,899 | $ | 77,719 | |||
__________________
(i) | The Company included approximately $44 thousand of long-term deferred tax liabilities in other liabilities on the consolidated balance sheet as of December, 31, 2013. |
ASC 740, Income Taxes, provides for the recognition of deferred tax assets if realization of such assets is more likely than not. In assessing the need for any additional valuation allowance in 2014, the Company considered all available evidence both positive and negative, including historical levels of income, legislative developments, expectations and risks associated with estimates of future taxable income, and ongoing prudent and feasible tax planning strategies. As a result of this analysis for the year ended December 31, 2014, it was considered more likely than not that our deferred tax assets would be realized except for any increase to the deferred tax asset related to the California research and development credit and operating losses incurred in certain foreign jurisdictions. A valuation allowance of $5.6 million has been recorded against this portion of the credit, even though this tax attribute has an indefinite life.
As of December 31, 2014, the Company had U.S. federal and state net operating loss carryforwards of approximately $71.4 million and $2.2 million, respectively. If not utilized, the federal and state net operating loss carryforwards will start to expire in 2015. The Company has state research and development tax credit carryforwards of approximately $6.2 million that do not expire. The utilization of the Company's U.S. net operating losses is subject to various limitations under Section 382 and similar state tax provisions. The Company does not anticipate any expiration of the U.S. net operating loss carryforwards prior to their utilization.
As of December 31, 2014, the Company’s international subsidiaries had combined net operating loss carryforwards of $2.7 million that do not expire. The Company believed that it is more likely than not that the benefit from some of these net operating loss carryforwards will not be realized and provided a full valuation allowance relating to these net operating loss carryforwards.
The Company has not provided for U.S. federal and foreign withholding taxes on $128.2 million of undistributed earnings from its foreign subsidiaries as of December 31, 2014 because the Company intends to indefinitely reinvest such earnings offshore. The Company makes the determination of whether to accrue taxes on such earnings on an entity by entity basis. The residual tax liability if such earnings were remitted may be reduced by foreign tax credits and other tax adjustments. It is not practicable to determine the tax liability that might be incurred if these earnings were repatriated.
84
A reconciliation of the beginning and ending amount of the unrecognized tax benefits is as follows (in thousands):
December 31, | |||||||||||
2014 | 2013 | 2012 | |||||||||
Beginning balance | $ | 29,174 | $ | 21,079 | $ | 16,298 | |||||
Additions for tax positions of prior years | 2,283 | 672 | 2,407 | ||||||||
Reductions for tax positions of prior years | (636 | ) | (668 | ) | (475 | ) | |||||
Additions based on tax positions related to the current year | 5,429 | 9,671 | 4,335 | ||||||||
Reductions due to lapse of statute of limitations | (2,893 | ) | (1,580 | ) | (1,486 | ) | |||||
Reductions due to settlements | (162 | ) | — | — | |||||||
Ending balance | $ | 33,195 | $ | 29,174 | $ | 21,079 | |||||
The unrecognized tax benefits, if recognized, would impact the income tax provision by $27.1 million, $25.9 million, and $18.9 million for the years ended December 31, 2014, 2013, and 2012, respectively. The unrecognized tax benefits were $33.2 million, $29.2 million, and $21.1 million as of December 31, 2014, 2013, and 2012, respectively. The Company has elected to include interest and penalties as a component of income tax expense. Accrued interest and penalties at December 31, 2014 and 2013 were approximately $2.1 million and $3.2 million, respectively. The Company does not anticipate that the amount of existing unrecognized tax benefits will significantly increase or decrease within the next 12 months.
The Company files income tax returns in the U.S. federal jurisdiction and in various U.S. states and foreign jurisdictions. As of December 31, 2014, the Company is in various stages of examinations and appeals in connection with its taxes in U.S. states and foreign jurisdictions, which generally span tax years 2004 through 2012.
Although the outcome of any tax audit is uncertain, the Company believes that it has adequately provided in its financial statements for any additional taxes that it may be required to pay as a result of such examinations. The Company regularly assesses the likelihood of outcomes resulting from these examinations to determine the adequacy of its provision for income taxes, and believes the reserve to be reasonable. If tax payments are ultimately proved to be unnecessary, the reversal of these tax liabilities would result in tax benefits in the period when the Company concluded such determination. However, if an ultimate tax assessment exceeds its estimate of tax liabilities, an additional tax provision might be required.
85
Note 13. Net Income per Common Share
Basic net income per share is computed using the weighted-average number of common shares outstanding during the period. Diluted net income per share reflects the potential dilution of securities by adding other common stock equivalents, primarily stock options and restricted stock units, to the weighted-average number of common shares outstanding during the period, if dilutive. Potentially dilutive securities have been excluded from the computation of diluted net income per share if their inclusion is anti-dilutive.
The calculation of basic and diluted net income per share is as follows (in thousands, except per share amounts):
Years Ended December 31, | |||||||||||
2014 | 2013 | 2012 | |||||||||
Net income | $ | 114,087 | $ | 86,395 | $ | 93,182 | |||||
Weighted-average shares of common stock used to compute basic net income per share | 109,199 | 108,146 | 107,874 | ||||||||
Effect of dilutive common stock equivalents: | |||||||||||
Dilutive effect of employee stock options | 1,004 | 2,925 | 3,863 | ||||||||
Dilutive effect of unvested restricted stock units | 757 | 323 | 352 | ||||||||
Weighted-average shares of common stock used to compute diluted net income per share | 110,960 | 111,394 | 112,089 | ||||||||
Net income per share-basic | $ | 1.04 | $ | 0.80 | $ | 0.86 | |||||
Net income per share-diluted | $ | 1.03 | $ | 0.78 | $ | 0.83 | |||||
Weighted average stock options and restricted stock units excluded from calculation due to anti-dilutive effect | 5,166 | 5,666 | 3,844 | ||||||||
Note 14. Commitments and Contingencies
Lease Obligations
The Company leases certain office facilities under various non-cancelable operating leases, which expire at various dates through 2024 and require the Company to pay operating costs, including property taxes, insurance, and maintenance. Rental expense was $14.7 million, $16.3 million, and $15.1 million in 2014, 2013, and 2012, respectively.
Future minimum lease payments as of December 31, 2014 under non-cancelable operating leases with original terms in excess of one year are summarized as follows (in thousands):
Operating Leases | |||
2015 | $ | 11,709 | |
2016 | 9,733 | ||
2017 | 8,326 | ||
2018 | 7,697 | ||
2019 | 6,169 | ||
Thereafter | 8,363 | ||
Total future minimum operating lease payments | $ | 51,997 | |
Warranties
The Company generally provides a warranty for its software products and services to its customers for a period of three to six months and accounts for its warranties. The Company’s software products’ media are generally warranted to be free from defects in materials and workmanship under normal use, and the products are also generally warranted to substantially perform as described in certain Company documentation and the product specifications. The Company’s services are generally warranted
86
to be performed in a professional manner and to materially conform to the specifications set forth in a customer’s signed contract. In the event there is a failure of such warranties, the Company generally will correct or provide a reasonable work-around or replacement product. To date, the Company’s product warranty expense has not been significant. The warranty accrual as of December 31, 2014 and 2013 was not material.
Indemnification
The Company's software license agreements generally include certain provisions for indemnifying the customer against losses, expenses, liabilities, and damages that may be awarded against the customer in the event the Company’s software is found to infringe upon a patent, copyright, trademark, or other proprietary right of a third party. The agreements generally limit the scope of and remedies for such indemnification obligations in a variety of industry-standard respects, including but not limited to certain time and scope limitations and a right to replace an infringing product with a non-infringing product.
The Company believes its internal development processes and other policies and practices limit its exposure related to these indemnification provisions. In addition, the Company requires its employees to sign a proprietary information and inventions agreement, which assigns the rights to its employees’ development work to the Company. To date, the Company has not had to reimburse any of its customers for any losses related to these indemnification provisions, and no material claims against the Company are outstanding as of December 31, 2014. The Company cannot determine the maximum amount of potential future payments, if any, related to such indemnification provisions due to the limited and infrequent history of prior indemnification claims.
As permitted under Delaware law, the Company has agreements whereby the Company indemnifies its officers and directors for certain events or occurrences while the officer or director is, or was serving, at our request, in such capacity. The maximum potential amount of future payments the Company could be required to make under these indemnification agreements is unlimited; however, the Company has director and officer insurance coverage that reduces the Company's exposure and enables the Company to recover a portion of any future amounts paid. The Company believes the estimated fair value of these indemnification agreements in excess of applicable insurance coverage is minimal.
The Company accrues for loss contingencies when available information indicates that it is probable that an asset has been impaired or a liability has been incurred and the amount of the loss can be reasonably estimated in accordance with ASC 450, Contingencies.
Derivative Financial Instruments
The Company uses derivative instruments to manage its exposure to fluctuations in certain foreign currency exchange rates which exist as part of ongoing business operations. See Note 2. Summary of Significant Accounting Policies, Note 9. Accumulated Other Comprehensive Loss, and Note 10. Derivative Financial Instruments of Notes to Consolidated Financial Statements for a further discussion.
Note 15. Litigation
The Company is a party to various legal proceedings and claims arising from the normal course of its business activities, including proceedings and claims related to patents and other intellectual property related matters. The Company reviews the status of each matter and records a provision for a liability when it is considered both probable that a liability has been incurred and the amount of the loss can be reasonably estimated. These provisions are reviewed quarterly and adjusted as additional information becomes available. If both of the criteria are not met, the Company assesses whether there is at least a reasonable possibility that a loss, or additional losses, may be incurred. If there is a reasonable possibility that a material loss may be incurred, the Company discloses the estimate of the possible loss, range of loss, or a statement that such an estimate cannot be made.
Litigation is subject to inherent uncertainties. Were an unfavorable outcome to occur, there exists the possibility of a material adverse impact on the Company's financial position and results of operation for the period in which the unfavorable outcome occurred, and potentially in future periods.
87
Note 16. Related Party Transaction
Mark A. Bertelsen, a director of the Company since September 2002, serves as a member of Wilson Sonsini Goodrich & Rosati (“WSGR”), our principal outside legal counsel. Fees paid by the Company to WSGR for legal services rendered for the years ended December 31, 2014, 2013, and 2012 were $1.0 million, $1.9 million, and $1.0 million, respectively. The Company believes that the services rendered by WSGR were provided on terms no more or less favorable than those with unrelated parties.
Note 17. Significant Customer Information and Segment Information
The Company is organized and operates in a single segment: the design, development, marketing, and sales of software solutions. The Company’s chief operating decision maker is its Chief Executive Officer, who reviews financial information presented on a consolidated basis for purposes of making operating decisions and assessing financial performance. The Company markets its products and services in the United States and in foreign countries through its direct sales force and indirect distribution channels.
No customer accounted for more than 10% of revenue in 2014, 2013, and 2012. At December 31, 2014 and 2013, no customer accounted for more than 10% of the accounts receivable balance. North America revenues include the United States and Canada. Revenue from international customers (defined as those customers outside of North America) accounted for 34%, 32% and 35% of total revenues in 2014, 2013, and 2012, respectively.
Total revenue by geographic region is summarized as follows (in thousands):
Years Ended December 31, | |||||||||||
2014 | 2013 | 2012 | |||||||||
Revenues: | |||||||||||
North America | $ | 688,186 | $ | 642,707 | $ | 524,191 | |||||
Europe, the Middle East, and Africa | 241,785 | 211,504 | 202,861 | ||||||||
Other | 117,983 | 93,960 | 84,519 | ||||||||
Total revenues | $ | 1,047,954 | $ | 948,171 | $ | 811,571 | |||||
Property and equipment, net by geographic region is summarized as follows (in thousands):
December 31, | |||||||
2014 | 2013 | ||||||
Property and equipment, net: | |||||||
North America | $ | 143,482 | $ | 147,460 | |||
Europe, the Middle East, and Africa | 10,902 | 4,907 | |||||
Other | 5,324 | 4,941 | |||||
Total property and equipment, net | $ | 159,708 | $ | 157,308 | |||
The Company derives revenues from sales of software licenses, subscription-based licenses for a variety of cloud and data-as-a-service offerings, maintenance and support services, and professional services, consisting of consulting and education services. It is impracticable to disaggregate software license and subscription revenues by product. The Company's disaggregated revenue information is as follows (in thousands):
Years Ended December 31, | |||||||||||
2014 | 2013 | 2012 | |||||||||
Software revenues: | |||||||||||
License | $ | 387,660 | $ | 367,074 | $ | 320,982 | |||||
Subscription | 69,704 | 46,664 | 29,193 | ||||||||
Total software revenues | 457,364 | 413,738 | 350,175 | ||||||||
Service revenues: | |||||||||||
Maintenance | 456,718 | 409,325 | 360,769 | ||||||||
Consulting and education | 133,872 | 125,108 | 100,627 | ||||||||
Total service revenues | 590,590 | 534,433 | 461,396 | ||||||||
Total revenues | $ | 1,047,954 | $ | 948,171 | $ | 811,571 | |||||
88
Note 18. Selected Quarterly Financial Information (Unaudited)
Three Months Ended | |||||||||||||||
December 31, 2014 | September 30, 2014 | June 30, 2014 | March 31, 2014 | ||||||||||||
(In thousands, except per share data) | |||||||||||||||
Total revenues | $ | 303,744 | $ | 250,400 | $ | 250,713 | $ | 243,097 | |||||||
Gross profit | $ | 252,390 | $ | 200,320 | $ | 201,634 | $ | 195,764 | |||||||
Income from operations | $ | 65,440 | $ | 33,405 | $ | 33,826 | $ | 36,817 | |||||||
Net income | $ | 43,592 | $ | 22,813 | $ | 22,829 | $ | 24,853 | |||||||
Net income per common share: | |||||||||||||||
Basic | $ | 0.40 | $ | 0.21 | $ | 0.21 | $ | 0.23 | |||||||
Diluted | $ | 0.40 | $ | 0.21 | $ | 0.20 | $ | 0.22 | |||||||
Shares used in computing net income per common share: | |||||||||||||||
Basic | 108,663 | 109,231 | 109,739 | 109,164 | |||||||||||
Diluted | 109,988 | 110,314 | 111,601 | 111,935 | |||||||||||
Three Months Ended | |||||||||||||||
December 31, 2013 | September 30, 2013 | June 30, 2013 | March 31, 2013 | ||||||||||||
(In thousands, except per share data) | |||||||||||||||
Total revenues | $ | 276,038 | $ | 235,394 | $ | 222,439 | $ | 214,300 | |||||||
Gross profit | $ | 228,794 | $ | 189,838 | $ | 177,854 | $ | 170,404 | |||||||
Income from operations | $ | 61,027 | $ | 27,206 | $ | 25,931 | $ | 24,699 | |||||||
Net income | $ | 39,918 | $ | 10,404 | $ | 18,166 | $ | 17,907 | |||||||
Net income per common share: | |||||||||||||||
Basic | $ | 0.37 | $ | 0.10 | $ | 0.17 | $ | 0.17 | |||||||
Diluted | $ | 0.36 | $ | 0.09 | $ | 0.16 | $ | 0.16 | |||||||
Shares used in computing net income per common share: | |||||||||||||||
Basic | 108,462 | 108,305 | 108,138 | 107,669 | |||||||||||
Diluted | 111,457 | 111,501 | 111,344 | 111,263 | |||||||||||
Note 19. Acquisitions
Acquisitions in 2014:
Proact Business Transformation Inc.
In November 2014, the Company acquired assets of Proact Business Transformation Inc. (“Proact”) for $4.0 million in cash. Proact provides enterprise architecture business transformation solutions including frameworks, methods, and industry reference models to assist with strategic planning of clients' information technology needs. The purchase was accounted for using the acquisition method. Total assets acquired were approximately $4.0 million of which approximately $2.7 million and $1.3 million was allocated to goodwill and identifiable intangible assets, respectively. The goodwill is deductible for tax purposes.
89
StrikeIron
In June 2014, the Company acquired all outstanding shares of StrikeIron, Inc. (“StrikeIron”), for aggregate consideration of approximately $54.6 million. StrikeIron provides cloud-based data-as-a-service for email and contact validation, and will enable the Company to enhance its cloud-based product portfolio. The goodwill is not deductible for tax purposes.
Approximately $8.3 million of the consideration otherwise payable to former StrikeIron stockholders was placed into an escrow fund and held as partial security for the indemnification obligations of the former StrikeIron stockholders. The escrow fund will remain in place until September 2015.
The following table summarizes the fair value of assets acquired and liabilities assumed of $50.5 million and the acquiree's transaction related costs and debt settlement of $4.1 million, which were paid by the Company (in thousands):
Assumed liabilities, net of assets | $ | (3,499 | ) |
Identifiable intangible assets: | |||
Developed and core technology | 13,900 | ||
Customer relationships | 3,500 | ||
Covenants not to compete | 450 | ||
Trade names | 40 | ||
Total identifiable net assets | 14,391 | ||
Goodwill | 36,116 | ||
Total assets acquired and liabilities assumed | 50,507 | ||
Acquiree's transaction related costs and debt settlement | 4,138 | ||
Total | $ | 54,645 | |
Acquisition in 2013:
Active Endpoints
In February 2013, the Company acquired Active Endpoints, Inc. (“Active Endpoints”), a privately-held company, for approximately $10.0 million in cash. Active Endpoints designs, markets, and supports on-premise and cloud based process automation software solutions. Total assets acquired and liabilities assumed were approximately $10.0 million of which approximately $7.1 million was allocated to goodwill, $3.8 million was allocated to identifiable intangible assets, and $0.9 million to net liabilities assumed. The goodwill is not deductible for tax purposes.
Approximately $1.5 million of the consideration otherwise payable to former Active Endpoints stockholders was placed into an escrow and held as partial security for certain indemnification obligations. The entire escrow fund was released in the second quarter of 2014.
Heiler Software AG
In November 2012, the Company acquired a majority interest in the shares of Heiler Software, a publicly-traded German company, at the end of the initial acceptance period of the takeover offer. The Company purchased the majority interest for approximately $101.9 million. Heiler Software provides enterprise product information management, MDM and procurement solutions that enable retailers, distributors and manufacturers to manage product information across channels and data sources. As of December 31, 2012, the Company held approximately 97.7 percent of the outstanding shares of Heiler Software. During December 2012 and the first half of 2013, the Company acquired other shareholders' interest in Heiler Software for approximately $6.8 million, which extinguished recorded liabilities to noncontrolling shareholders. Total cash consideration was approximately $108.7 million. The squeeze-out of the remaining shareholders was effective in the second quarter of 2013, increasing the Company's ownership in Heiler Software to 100 percent.
The fair value of the noncontrolling interest in Heiler Software at the acquisition date was $2.9 million. The valuation techniques and significant inputs used to measure the fair value of the noncontrolling interest included quoted market prices.
90
The following table summarizes the fair value of assets acquired and liabilities assumed at the acquisition date (in thousands):
Net tangible assets | $ | 16,400 | |
Identifiable intangible assets: | |||
Developed and core technology | 16,586 | ||
Customer relationships | 5,339 | ||
Contract backlog | 648 | ||
Trade names | 298 | ||
In-process research and development | 3,784 | ||
Noncontrolling interest | (2,861 | ) | |
Total identifiable net assets | 40,194 | ||
Goodwill | 61,660 | ||
Total cash consideration | $ | 101,854 | |
During the first quarter of 2013, the Company recorded $2.8 million of additional accrued liabilities during the measurement period. The goodwill is not deductible for tax purposes.
The Company’s business combinations completed in 2014 and 2013, either individually or in aggregate, did not have a material impact on the Company’s consolidated financial statements, and therefore pro forma disclosures have not been presented. The Company included the financial results of these acquired companies in its consolidated financial statements from their respective acquisition dates.
Note 20. Subsequent Event
In February 2015, the Company entered into two separate accelerated share repurchase ("ASR") agreements with two financial institutions to repurchase an aggregate of $300 million of the Company's common stock. Under the ASR agreements, the Company paid an aggregate of $300 million in cash and received an initial delivery of approximately 5.7 million shares on February 4, 2015. The final number of shares the Company will repurchase under the ASR agreements will be based generally upon the daily volume-weighted average price of the Company’s common stock during the repurchase period, less an agreed upon discount during the term of the transactions. The final settlement of the ASR agreements is expected to occur no later than the second quarter of 2015.
91
ITEM 9. CHANGES IN AND DISAGREEMENTS WITH ACCOUNTANTS ON ACCOUNTING AND FINANCIAL DISCLOSURE
Not applicable.
ITEM 9A. CONTROLS AND PROCEDURES
(a) Evaluation of disclosure controls and procedures. Our management evaluated, with the participation of our Chief Executive Officer and our Chief Financial Officer, the effectiveness of our disclosure controls and procedures as of the end of the period covered by this Report. Based on this evaluation, our Chief Executive Officer and our Chief Financial Officer have concluded that our disclosure controls and procedures, as defined in Rules 13a-15(e) and 15d-15(e) under the Securities Exchange Act of 1943, were effective at the reasonable assurance level to ensure that information we are required to disclose in reports that we file or submit under the Securities Exchange Act of 1934 (1) is recorded, processed, summarized, and reported within the time periods specified in Securities and Exchange Commission rules and forms, and (2) is accumulated and communicated to Informatica's management, including our Chief Executive Officer and our Chief Financial Officer, as appropriate to allow timely decisions regarding required disclosure. Our disclosure controls and procedures are designed to provide reasonable assurance that such information is accumulated and communicated to our management. Our disclosure controls and procedures include components of our internal control over financial reporting. Management's assessment of the effectiveness of our internal control over financial reporting is expressed at the level of reasonable assurance because a control system, no matter how well designed and operated, can provide only reasonable, but not absolute, assurance that the control system's objectives will be met.
(b) Management's annual report on internal control over financial reporting. Management of Informatica is responsible for establishing and maintaining adequate internal control over financial reporting as defined in Rules 13a-15(f) and 15d-15(f) under the Securities Exchange Act of 1934. Informatica's internal control over financial reporting is designed to provide reasonable assurance regarding the reliability of financial reporting and the preparation of financial statements for external purposes in accordance with generally accepted accounting principles. Internal control over financial reporting includes those policies and procedures that:
• | pertain to the maintenance of records that, in reasonable detail, accurately and fairly reflect the transactions and dispositions of the assets of the company; |
• | provide reasonable assurance that transactions are recorded as necessary to permit preparation of financial statements in accordance with generally accepted accounting principles, and that receipts and expenditures of the company are being made only in accordance with authorizations of management and directors of the company; and |
• | provide reasonable assurance regarding prevention or timely detection of unauthorized acquisition, use or disposition of the company's assets that could have a material effect on the financial statements. |
Because of its inherent limitations, internal control over financial reporting may not prevent or detect misstatements due to human error, or the improper circumvention or overriding of internal controls. In addition, projections of any evaluation of effectiveness to future periods are subject to the risk that controls may become inadequate because of changes in conditions and that the degree of compliance with the policies or procedures may change over time.
Management assessed the effectiveness of Informatica's internal control over financial reporting as of December 31, 2014. In making this assessment, management used the criteria set forth in the Internal Control-Integrated Framework (2013 framework) issued by the Committee of Sponsoring Organizations of the Treadway Commission (COSO).
Based on its assessment of internal control over financial reporting, management has concluded that, as of December 31, 2014, Informatica's internal control over financial reporting was effective to provide reasonable assurance regarding the reliability of financial reporting and the preparation of financial statements for external purposes in accordance with generally accepted accounting principles.
Informatica's independent registered public accounting firm, Ernst & Young LLP, has issued an attestation report on the effectiveness of Informatica's internal control over financial reporting, included in Part II, Item 8 of this Report.
(c) Change in internal control over financial reporting. There were no changes in our internal controls over financial reporting that occurred during the fourth quarter of 2014 that have materially affected, or are reasonably likely to materially affect, our internal control over financial reporting.
ITEM 9B. OTHER INFORMATION
Not applicable.
92
PART III
ITEM 10. DIRECTORS, EXECUTIVE OFFICERS, AND CORPORATE GOVERNANCE
Executive Officers of the Registrant
The following table sets forth certain information concerning our executive officers as of February 1, 2015:
Name | Age | Position(s) |
Sohaib Abbasi | 58 | Chairman of the Board, Chief Executive Officer and President |
Michael Berry | 51 | Executive Vice President and Chief Financial Officer |
Margaret Breya | 53 | Executive Vice President and Chief Marketing Officer |
Anil Chakravarthy | 47 | Executive Vice President and Chief Product Officer |
Ivan Chong | 47 | Executive Vice President and Chief Strategy Officer |
Earl Fry | 56 | Executive Vice President, Operations Strategy and Chief Customer Officer |
Charles Race | 43 | Executive Vice President, Worldwide Field Operations |
Jo Stoner | 44 | Executive Vice President and Chief Human Resources Officer |
Our executive officers are appointed by, and serve at the discretion of, the Board of Directors. There is no family relationship between any of our executive officers or directors.
Sohaib Abbasi has been our President and Chief Executive Officer since July 2004 and a member of our Board of Directors since February 2004. From 2001 to 2003, Mr. Abbasi was Senior Vice President, Oracle Tools Division and Oracle Education at Oracle Corporation, which he joined in 1982. From 1994 to 2000, he was Senior Vice President Oracle Tools Product Division at Oracle Corporation. Mr. Abbasi graduated with honors from the University of Illinois at Urbana-Champaign in 1980, where he earned both a B.S. and an M.S. degree in computer science. Mr. Abbasi serves on the board of directors of Red Hat, Inc.
Michael Berry joined Informatica as our Executive Vice President and Chief Financial Officer in November 2014. Prior to joining Informatica, Mr. Berry served as Chief Financial Officer at IO Data Centers from October 2013 to October 2014. Prior to joining IO, Mr. Berry served as Executive Vice President and Chief Financial Officer at SolarWinds, Inc. from November 2011 to October 2013, after joining SolarWinds as Senior Vice President and Chief Financial Officer in March 2010. Mr. Berry was also Executive Vice President, Finance and Accounting, and Chief Financial Officer of i2 Technologies, Inc., from August 2005 to January 2010. Prior to i2, Mr. Berry held various positions at The Reynolds and Reynolds Company, Inc., including as Senior Vice President of Solutions Management, Development and Operations and Senior Vice President of Services. Mr. Berry holds a B.A. degree in finance from Augsburg College and a M.B.A. degree in finance from the University of St. Thomas.
Margaret Breya joined Informatica in December 2012 as our Executive Vice President and Chief Marketing Officer. Prior to joining Informatica, Ms. Breya held various positions at Hewlett-Packard from November 2010 to December 2012, most recently as Senior Vice President of Marketing Services. Ms. Breya also served as Executive Vice President and General Manager at SAP from January 2008 to November 2010. In addition, Ms. Breya served as Executive Vice President, General Manager and Chief Marketing Officer at Business Objects, Chief Marketing Officer and Chief Strategy Officer at BEA Systems, and in various positions at Sun Microsystems, including as Senior Vice President of Marketing. Ms. Breya holds a B.S. degree in electrical engineering from the University of Illinois and a M.B.A. degree from the University of Oregon. Ms. Breya serves on the board of directors of Jive Software, Inc.
Anil Chakravarthy joined Informatica in September 2013 as our Executive Vice President and Chief Product Officer. Prior to joining Informatica, Mr. Chakravarthy held various positions at Symantec Corporation from May 2004 to September 2013, most recently as Executive Vice President of Information Security. Prior to Symantec, Mr. Chakravarthy also led product management for enterprise security services at VeriSign from December 2001 to May 2004. Mr. Chakravarthy received a Bachelor of Technology in Computer Science and Engineering from the Institute of Technology, Varanasi, India, and received his M.S. and Ph.D. from the Massachusetts Institute of Technology.
Ivan Chong joined Informatica in October 1997 with responsibilities overseeing product management for Informatica's flagship product PowerCenter. In February 2005, Mr. Chong became Vice President of Product Marketing. In January 2007, Mr. Chong
93
was promoted to Senior Vice President and General Manager for Informatica Data Quality. In January 2010, Mr. Chong was promoted to Executive Vice President. Mr. Chong became our Chief Strategy Officer in October 2013. Prior to joining Informatica, Mr. Chong worked at NetGravity, an Internet advertising startup and had various product management roles at Oracle Corporation within the Oracle Tools Division. Mr. Chong holds both an M.S. degree and a B.S. degree from MIT's Department of Electrical Engineering and Computer Science.
Earl Fry joined Informatica as the Chief Financial Officer and Senior Vice President in December 1999. In July 2002, Mr. Fry became Secretary. In August 2003, Mr. Fry was promoted to Executive Vice President. In January 2010, Mr. Fry was promoted to Chief Administrative Officer and Executive Vice President, Global Customer Support. In November 2014, Mr. Fry assumed his new role as Executive Vice President, Operations Strategy and Chief Customer Officer. Prior to joining Informatica, Mr. Fry served as Vice President and Chief Financial Officer at Omnicell Technologies, Inc. and as Vice President and Chief Financial Officer at C*ATS Software, Inc. Mr. Fry holds a B.B.A. degree in accounting from the University of Hawaii and an M.B.A. degree from Stanford University. Mr. Fry serves on the Board of Directors of Central Pacific Financial Corporation.
Charles Race joined Informatica in February 2005 with responsibilities of developing and leading sales teams across EMEA. In January 2009, Mr. Race became Vice President of Northern Europe for Informatica. In January 2012, Mr. Race was promoted to Senior Vice President, Global Sales Strategy, and later served as Senior Vice President, EMEA Field Operations. In July 2014, Mr. Race was promoted to Executive Vice President, Worldwide Field Operations. Mr. Race also held a variety of leadership roles at Hummingbird, uSwitch, Phillips and Rolls-Royce Industrial Power. He graduated from the University of York with a degree in Computer Science.
Jo Stoner joined Informatica in March 2001 with responsibilities overseeing human resources operations in EMEA. In November 2002, Ms. Stoner became Human Resources Director for Americas and Asia-Pacific. In November 2003, Ms. Stoner was promoted to Senior Vice President, Global Human Resources. In May 2014, Ms. Stoner was promoted to Executive Vice President and Chief Human Resources Officer. Prior to joining Informatica, Ms. Stoner held various HR management roles at British Telecom and startup FirstMark Communications. Ms. Stoner received her undergraduate degree in Industrial Economics with honors from the University of Nottingham in England, and holds a postgraduate HR certification from the Chartered Institute of Personnel and Development.
Information with respect to our Directors, our Code of Business Conduct, and corporate governance matters is included under the caption “Proposal One - Election of Directors” in the Proxy Statement for the 2015 Annual Meeting of Stockholders, which proxy statement will be filed within 120 days of our year ended December 31, 2014 (the “2015 Proxy Statement”), and is incorporated herein by reference. Information regarding delinquent filers pursuant to Item 405 of Regulation S-K is included under the caption “Section 16(a) Beneficial Ownership Reporting Compliance” in the 2015 Proxy Statement and is incorporated herein by reference.
ITEM 11. EXECUTIVE COMPENSATION
The information required by this item is included under the captions, “Election of Directors - Director Compensation,” "Compensation Committee Interlocks and Insider Participation," and “Executive Officer Compensation” in the 2015 Proxy Statement and is incorporated herein by reference.
ITEM 12. SECURITY OWNERSHIP OF CERTAIN BENEFICIAL OWNERS AND MANAGEMENT AND RELATED STOCKHOLDER MATTERS
The information required by this item is included under the captions “Security Ownership of Principal Stockholders and Management” and “Equity Compensation Plan Information” in the 2015 Proxy Statement and is incorporated herein by reference.
ITEM 13. CERTAIN RELATIONSHIPS AND RELATED TRANSACTIONS, AND DIRECTOR INDEPENDENCE
The information required by this item is included under the captions “Transactions with Management” and “Election of Directors” in the 2015 Proxy Statement and is incorporated herein by reference.
ITEM 14. PRINCIPAL ACCOUNTANT FEES AND SERVICES
The information required by this item is included under the proposal “Ratification of Appointment of Independent Registered Public Accounting Firm” in the 2015 Proxy Statement and is incorporated herein by reference.
94
PART IV
ITEM 15. EXHIBITS and FINANCIAL STATEMENT SCHEDULES
(a) | The following documents are filed as part of this Annual Report on Form 10-K: |
1. | Consolidated Financial Statements: |
Reference is made to the Index to consolidated financial statements of Informatica Corporation under Item 8 of Part II hereof.
2. | Financial Statement Schedule: |
The following schedule is included herein:
Valuation and Qualifying Accounts (Schedule II)
All other schedules are omitted because they are not applicable or the amounts are immaterial or the required information is presented in the consolidated financial statements and notes thereto in Part II, Item 8 above.
Schedule II - Valuation and Qualifying Accounts
(In thousands)
Description | Balance at Beginning of Period | Charged to Costs and Expenses | Additions | Deductions | Balance at End of Period | ||||||||||||||||||||
Provision for Doubtful Accounts: | |||||||||||||||||||||||||
Year ended December 31, 2014 | $ | 4,135 | $ | (369 | ) | $ | 217 | $ | (518 | ) | $ | 3,465 | |||||||||||||
Year ended December 31, 2013 | $ | 5,460 | $ | (1,157 | ) | $ | 6 | $ | (174 | ) | $ | 4,135 | |||||||||||||
Year ended December 31, 2012 | $ | 4,001 | $ | 428 | $ | 1,139 | $ | (108 | ) | $ | 5,460 | ||||||||||||||
3. | Exhibits |
See Exhibit Index immediately following the signature page of this Form 10-K.
95
SIGNATURES
Pursuant to the requirements of Section 13 or 15(d) of the Securities Exchange Act of 1934, the registrant has duly caused this report to be signed on its behalf by the undersigned, thereunto duly authorized.
February 26, 2015
INFORMATICA CORPORATION | |||
By: | /s/ SOHAIB ABBASI | ||
Sohaib Abbasi | |||
Chief Executive Officer, President, and Chairman of the Board | |||
Pursuant to the requirements of the Securities Exchange Act of 1934, this report has been signed below by the following persons on behalf of the registrant and in the capacities and on the dates indicated.
Signature | Title | Date | |
/s/ SOHAIB ABBASI | Chief Executive Officer, President, and Chairman of the Board of Directors (Principal Executive Officer) | February 26, 2015 | |
Sohaib Abbasi | |||
/s/ MICHAEL BERRY | Chief Financial Officer and Executive Vice President (Principal Financial and Accounting Officer) | February 26, 2015 | |
Michael Berry | |||
/s/ MARK BERTELSEN | Director | February 26, 2015 | |
Mark Bertelsen | |||
/s/ AMY CHANG | Director | February 26, 2015 | |
Amy Chang | |||
/s/ MARK GARRETT | Director | February 26, 2015 | |
Mark Garrett | |||
/s/ GERALD HELD | Director | February 26, 2015 | |
Gerald Held | |||
/s/ HILARIE KOPLOW-MCADAMS | Director | February 26, 2015 | |
Hilarie Koplow-McAdams | |||
/s/ CHARLES ROBEL | Director | February 26, 2015 | |
Charles Robel | |||
/s/ BROOKE SEAWELL | Director | February 26, 2015 | |
Brooke Seawell | |||
/s/ GEOFFREY SQUIRE | Director | February 26, 2015 | |
Geoffrey Squire | |||
96
INFORMATICA CORPORATION
EXHIBITS TO ANNUAL REPORT ON FORM 10-K
For the year ended December 31, 2014
Exhibit Number | Document |
3.1 | Amended and Restated Certificate of Incorporation of Informatica Corporation (incorporated by reference to Exhibit 3.2 to Amendment No. 1 of the Company's Registration Statement on Form S-1 filed on April 8, 1999, Commission File No. 333-72677). |
3.2 | Certificate of Amendment to the Company's Amended and Restated Certificate of Incorporation to increase the aggregate number of shares of the Company's common stock authorized for issuance from 100,000,000 to 200,000,000 shares (incorporated by reference to Exhibit 3.4 to the Company's Quarterly Report on Form 10-Q filed on August 14, 2000, Commission File No. 0-25871). |
3.3 | Amended and Restated Bylaws of Informatica Corporation (incorporated by reference to the Company's Current Report on Form 8-K filed on March 15, 2011, Commission File No. 0-25871). |
4.1 | Reference is made to Exhibits 3.1 through 3.3. |
10.1* | Form of Indemnification Agreement between the Company and each of its executive officers and directors (incorporated by reference to Exhibit 10.1 to the Company's Annual Report on Form 10-K filed on February 25, 2011, Commission File No. 0-25871). |
10.2* | 2009 Equity Incentive Plan, as amended (incorporated by reference to Exhibit 10.1 to the Company's Quarterly Report on Form 10-Q filed on August 7, 2014, Commission File No. 0-25871). |
10.3* | Form of 2009 Equity Incentive Plan Stock Option Award Agreement and Notice of Stock Option Award (incorporated by reference to Exhibit 10.13 to the Company's Annual Report on Form 10-K filed on February 25, 2011, Commission File No. 0-25871). |
10.4* | Form of 2009 Equity Incentive Plan Stock Option Award Agreement and Notice of Stock Option Award for Non-Employee Directors (incorporated by reference to Exhibit 10.5 to the Company's Annual Report on Form 10-K filed on February 25, 2011, Commission File No. 0-25871). |
10.5* | Form of 2009 Equity Incentive Plan RSU Award Agreement and Notice of RSU Award (incorporated by reference to Exhibit 10.4 to the Company's Annual Report on Form 10-K filed on February 25, 2011, Commission File No. 0-25871). |
10.6* | Form of 2009 Equity Incentive Plan RSU Award Agreement and Notice of RSU Award for Executive Officers (incorporated by reference to Exhibit 10.1 to the Company's Quarterly Report on Form 10-Q filed on November 7, 2011, Commission File No. 0-25871). |
10.7* | Form of 2009 Equity Incentive Plan RSU Award Agreement and Notice of RSU Award for Non-Employee Directors (incorporated by reference to Exhibit 10.1 to the Company's Quarterly Report on Form 10-Q filed on August 8, 2011, Commission File No. 0-25871). |
10.8* | Form of 2009 Equity Incentive Plan Performance-Based RSU Award Agreement and Notice of RSU Award. |
10.9* | Employee Stock Purchase Plan (incorporated by reference to Exhibit 10.1 to the Company's Current Report on Form 8-K filed on May 29, 2008, Commission File No. 0-25871). |
10.10 | Siperian, Inc. 2003 Equity Incentive Plan (incorporated by reference to Exhibit 4.5 to the Company's Registration Statement on Form S-8 filed on February 11, 2010, Commission File No. 333-164875). |
10.11* | 1999 Stock Incentive Plan, as amended (incorporated by reference to Exhibit 10.4 of the Company's Annual Report on Form 10-K filed on February 28, 2008, Commission File No. 0-25871). |
10.12* | Form of Letter Agreement Regarding Equity Award Change of Control Vesting between the Company and its Non-Employee Directors (incorporated by reference to Exhibit 10.13 to the Company's Annual Report on Form 10-K filed on February 25, 2011, Commission File No. 0-25871). |
10.13* | Employment Agreement dated July 19, 2004 between the Company and Sohaib Abbasi (incorporated by reference to Exhibit 10.26 of the Company's Quarterly Report on Form 10-Q filed on August 5, 2004, Commission File No. 0-25871). |
10.14* | Amendment to Sohaib Abbasi Employment Agreement dated December 31, 2008 (incorporated by reference to Exhibit 10.20 to the Company's Annual Report on Form 10-K filed on February 26, 2009, Commission File No. 0-25871). |
10.15* | Second Amendment to Sohaib Abbasi Employment Agreement dated April 28, 2010 (incorporated by reference to Exhibit 10.1 to the Company's Quarterly Report on Form 10-Q filed on August 5, 2010, Commission File No. 0-25871). |
10.16* | Form of Amended and Restated Executive Severance Agreement between the Company and each of its executive officers (other than the Chief Executive Officer) (incorporated by reference to Exhibit 10.2 to the Company's Quarterly Report on Form 10-Q filed on August 5, 2010, Commission File No. 0-25871). |
97
Exhibit Number | Document |
10.17* | Offer Letter for Margaret Breya dated November 25, 2012 (incorporated by reference to the Company's Annual Report on Form 10-K filed on February 28, 2013, Commission File No. 0-25871). |
10.18* | Offer Letter for Anil Chakravarthy dated August 4, 2013 (incorporated by reference to Exhibit 10.1 to the Company's Quarterly Report on Form 10-Q filed on November 7, 2013, Commission File No. 0-25871). |
10.19* | Offer Letter for Michael Berry dated October 13, 2014. |
10.20* | Description of 2014 Corporate Bonus Plan (incorporated by reference to the Company's Current Report on Form 8-K filed on January 27, 2014, Commission File No. 0-25871). |
10.21* | Description of 2015 Corporate Bonus Plan (incorporated by reference to the Company's Current Report on Form 8-K filed on February 9, 2015, Commission File No. 0-25871). |
10.22 | Credit Agreement, dated as September 26, 2014, by and among Informatica Corporation, each of the lenders party thereto from time to time, JPMorgan Chase Bank, N.A., as Administrative Agent, Bank of America, N.A., as Syndication Agent, and J.P. Morgan Securities LLC and Merrill Lynch, Pierce, Fenner & Smith Inc., as Joint Bookrunners and Joint Lead Arrangers. (incorporated by reference to Exhibit 10.1 to the Company's Quarterly Report on Form 10-Q filed on November 6, 2014, Commission File No. 0-25871). |
10.23 | Purchase and Sale Agreement between Informatica Corporation and VII Pacific Shores Investors, L.L.C., dated as of November 17, 2011, as amended (incorporated by reference to Exhibit 10.28 to the Company's Annual Report on Form 10-K filed on February 24, 2012, Commission File No. 0-25871). |
21.1 | List of Subsidiaries. |
23.1 | Consent of Independent Registered Public Accounting Firm. |
31.1 | Certification of Chief Executive Officer pursuant to Section 302 of the Sarbanes-Oxley Act of 2002. |
31.2 | Certification of Chief Financial Officer pursuant to Section 302 of the Sarbanes-Oxley Act of 2002. |
32.1 ** | Certification of Chief Executive Officer and Chief Financial Officer pursuant to 18 U.S.C. Section 1350, as adopted pursuant to Section 906 of the Sarbanes-Oxley Act of 2002. |
101.INS | XBRL Instance. |
101.SCH | XBRL Taxonomy Extension Schema. |
101.CAL | XBRL Taxonomy Extension Calculation Linkbase. |
101.LAB | XBRL Taxonomy Extension Label Linkbase. |
101.PRE | XBRL Taxonomy Extension Presentation Linkbase. |
101.DEF | XBRL Taxonomy Extension Definition Linkbase. |
____________________
* | Indicates management contract or compensatory plan or arrangement. |
** | Furnished, not filed. |
98