Attached files
| file | filename |
|---|---|
| EXCEL - IDEA: XBRL DOCUMENT - INFINITY PROPERTY & CASUALTY CORP | Financial_Report.xls |
| EX-21 - EXHIBIT 21 - INFINITY PROPERTY & CASUALTY CORP | ipcc-123114exhibit21.htm |
| EX-32 - EXHIBIT 32 - INFINITY PROPERTY & CASUALTY CORP | ipcc-123114exhibit32.htm |
| EX-31.1 - EXHIBIT 31.1 - INFINITY PROPERTY & CASUALTY CORP | ipcc-123114exhibit311.htm |
| EX-31.2 - EXHIBIT 31.2 - INFINITY PROPERTY & CASUALTY CORP | ipcc-123114exhibit312.htm |
| EX-10.25 - EXHIBIT 10.25 - INFINITY PROPERTY & CASUALTY CORP | ipcc-123114exhibit1025.htm |
| EX-10.24 - EXHIBIT 10.24 - INFINITY PROPERTY & CASUALTY CORP | ipcc-123114exhibit1024.htm |
| EX-23 - EXHIBIT 23 - INFINITY PROPERTY & CASUALTY CORP | ipcc-123114exhibit23.htm |
UNITED STATES
SECURITIES AND EXCHANGE COMMISSION
Washington, D.C. 20549
________________________________
FORM 10-K
________________________________
(Mark One)
ý | ANNUAL REPORT PURSUANT TO SECTION 13 OR 15(d) OF THE SECURITIES EXCHANGE ACT OF 1934 |
For the fiscal year ended December 31, 2014 | |
OR
¨ | TRANSITION REPORT PURSUANT TO SECTION 13 OR 15(d) OF THE SECURITIES EXCHANGE ACT OF 1934 |
For the transition period from to | |
Commission file number 0-50167
________________________________
INFINITY PROPERTY AND CASUALTY CORPORATION
(Exact name of registrant as specified in its charter)
________________________________
OHIO | 03-0483872 | |
(State or other jurisdiction of incorporation or organization) | (I.R.S. Employer Identification No.) | |
3700 COLONNADE PARKWAY SUITE 600 BIRMINGHAM, ALABAMA | 35243 | |
(Address of principal executive offices) | (Zip Code) | |
(205) 870-4000
(Registrant’s telephone number, including area code)
Securities registered pursuant to Section 12(g) of the Act: None
Securities registered pursuant to Section 12(b) of the Act: | Name of each exchange on which registered: | |
Common Stock, no par value | NASDAQ Global Select Market | |
(Title of class)
Indicate by check mark whether the registrant is a well-known seasoned issuer, as defined in Rule 405 of the Securities Act. ý Yes ¨ No
Indicate by check mark whether the registrant is not required to file reports pursuant to Section 13 or Section 15(d) of the Act. ¨ Yes ý No
Note – Checking the box above will not relieve any registrant required to file reports pursuant to Section 13 or 15(d) of the Act from their obligations under those Sections.
Indicate by check mark whether the registrant (1) has filed all reports required to be filed by Section 13 or 15(d) of the Securities Exchange Act of 1934 during the preceding 12 months (or for such shorter period that the Registrant was required to file such reports), and (2) has been subject to such filing requirements for the past 90 days. ý Yes ¨ No
Indicate by check mark whether the registrant has submitted electronically and posted on its corporate Web site, if any, every Interactive Data File required to be submitted and posted pursuant to Rule 405 of Regulation S-T (§ 232.405 of this chapter) during the preceding 12 months (or for such shorter period that the registrant was required to submit and post such files). ý Yes ¨ No
Indicate by check mark if disclosure of delinquent filers pursuant to Item 405 of Regulation S-K is not contained herein, and will not be contained, to the best of registrant’s knowledge, in definitive proxy or information statements incorporated by reference in Part III of this Form 10-K or any amendment to this Form 10-K. ý
Indicate by check mark whether the registrant is a large accelerated filer, an accelerated filer, a non-accelerated filer, or a smaller reporting company. See the definitions of “large accelerated filer,” “accelerated filer” and “smaller reporting company” in Rule 12b-2 of the Exchange Act.
Large accelerated filer | ý | Accelerated filer | ¨ | |||
Non-accelerated filer | o (Do not check if a smaller reporting company) | Smaller reporting company | ¨ | |||
As of June 30, 2014, the aggregate market value of the voting Common Stock held by non-affiliates of the registrant was $746,839,380 based on the last sale price of Common Stock on that date as reported by The NASDAQ Global Select Market.
As of February 13, 2015, there were 11,473,967 shares of the registrant’s Common Stock outstanding.
________________________________
DOCUMENTS INCORPORATED BY REFERENCE
Portions of the registrant’s proxy statement for the annual meeting of shareholders to be held on May 19, 2015, are incorporated by reference in Part III hereof.
INFINITY PROPERTY AND CASUALTY CORPORATION 10-K
INDEX TO ANNUAL REPORT
ON FORM 10-K
Page | ||
PART I | ||
Item 1 - | ||
Item 1A - | ||
Item 1B - | ||
Item 2 - | ||
Item 3 - | ||
Item 4 - | ||
PART II | ||
Item 5 - | ||
Item 6 - | ||
Item 7 - | ||
Item 7A - | ||
Item 8 - | ||
Item 9 - | ||
Item 9A - | ||
Item 9B - | ||
PART III | ||
Item 10 - | ||
Item 11 - | ||
Item 12 - | ||
Item 13 - | ||
Item 14 - | ||
PART IV | ||
Item 15 - | ||
INFINITY PROPERTY AND CASUALTY CORPORATION 10-K
CAUTIONARY STATEMENT REGARDING FORWARD-LOOKING STATEMENTS
This Annual Report on Form 10-K contains certain “forward-looking statements” which anticipate results based on our estimates, assumptions and plans that are subject to uncertainty. These statements are made subject to the safe-harbor provisions of the Private Securities Litigation Reform Act of 1995. All statements in this report not dealing with historical results or current facts are forward-looking and are based on estimates, assumptions and projections. Statements which include the words “assumes,” “believes,” “seeks,” “expects,” “may,” “should,” “intends,” “likely,” “targets,” “plans,” “anticipates,” “estimates” or the negative version of those words and similar statements of a future or forward-looking nature identify forward-looking statements. Examples of such forward-looking statements include statements relating to expectations concerning market conditions, premium growth, earnings, investment performance, expected losses, rate changes and loss experience.
The primary events or circumstances that could cause actual results to differ materially from what we expect include determinations with respect to reserve adequacy, realized gains or losses on the investment portfolio (including other-than-temporary impairments for credit losses), loss cost trends and competitive conditions in our key Focus States. We undertake no obligation to publicly update or revise any of the forward-looking statements. For a more detailed discussion of some of the foregoing risks and uncertainties that could cause actual results to differ from those contained in the forward-looking statements, see “Risk Factors” contained in Item 1A.
PART I
ITEM 1
Business
Introduction
We are a holding company that provides, through our subsidiaries, personal automobile insurance with a focus on the nonstandard market. Our headquarters is located in Birmingham, Alabama. We employed approximately 2,200 people at December 31, 2014.
We file our Annual Reports on Form 10-K, Quarterly Reports on Form 10-Q, Current Reports on Form 8-K and other reports as required with the United States Securities and Exchange Commission (“SEC”). Any of these documents may be read and copied at the SEC’s Public Reference Room at 100 F Street NE, Washington, D.C. 20549. Information regarding the operation of the SEC Public Reference Room may be obtained by calling 1-800-SEC-0330. Our filed documents may also be accessed via the SEC Internet site at http://www.sec.gov. All of our SEC filings, news releases and other information may also be accessed free of charge on our website at http://www.infinityauto.com. Information on our website is not part of this Form
10-K.
Please see Note 1 to the Consolidated Financial Statements for additional information regarding our history and organization. References to "we" or "us", unless the context requires otherwise, include the combined operations of our subsidiaries. Unless indicated otherwise, the financial information we present in this report is on a GAAP basis. Schedules may not foot due to rounding.
The Personal Automobile Market
Personal auto insurance is the largest line of property and casualty insurance, accounting for approximately 36%, or $175 billion, of the estimated $480 billion of annual industry premium. Personal auto insurance is comprised of preferred, standard and nonstandard risks. Nonstandard auto insurance is intended for drivers who, due to factors such as their driving record, age or vehicle type, represent a higher than normal risk. As a result, customers who purchase nonstandard auto insurance generally pay a higher premium for similar coverage than the drivers qualifying for standard or preferred policies. While there is no established industry-recognized distinction between nonstandard risks and all other personal auto risks, we believe that nonstandard auto risks constitute approximately 20% of the personal automobile insurance market, with this percentage fluctuating according to competitive conditions in the market. Independent agents sell approximately 27% of all personal automobile insurance. The remainder is sold by captive agents or directly by insurance companies to their customers. We believe that, relative to the standard and preferred auto insurance market, independent agents sell a disproportionately larger portion of nonstandard auto insurance.
The personal auto insurance industry is cyclical, characterized by periods of price competition and excess capacity followed by periods of higher premium rates and shortages of underwriting capacity. We believe that the current competitive environment differs by state.
Industry-wide, rates increased 4.7% during 2012, 3.3% in 2013 and 4.7% in 2014. Our filed average rate adjustments on our personal auto business were 8.3%, 6.7% and 6.8% for 2012, 2013 and 2014, respectively.
The personal auto insurance industry is highly competitive and, except for regulatory considerations, there are relatively few barriers to entry. We generally compete with other insurers based on price, coverage offered, claims handling, customer service, agent commission, geographic coverage and financial strength ratings. We compete with both large national writers and smaller regional companies. In 2013, the five largest automobile insurance companies accounted for approximately 54% of the industry’s net written premium and the largest ten accounted for approximately 71% (2014 industry data is not yet available). Approximately 320 insurance groups and unaffiliated insurance companies compete in the personal auto insurance industry according to SNL Financial, an industry news source. Some of these groups specialize in nonstandard auto insurance while others insure a broad spectrum of personal auto insurance risks.
Our Strategy
We offer personal and commercial automobile insurance primarily in four "Focus States": Arizona, California, Florida and Texas. Our target customers are urban and Hispanic drivers. This narrow geographic and demographic focus allows us to concentrate our efforts and resources on providing competitively priced products to underserved segments while generating adequate returns for our shareholders.
Operations
We are organized along functional responsibilities with the following centralized departments: product management, marketing, claims, customer service, accounting, treasury, human resources and information technology resources. Frequent executive team meetings, which include the Chief Executive Officer, the Chief Financial Officer, the Chief Legal Officer, the Chief Marketing Officer and the Chief Product Management Officer, allow for sharing of information among functional departments and for setting policies and making key strategic decisions.
We estimate that approximately 80% of our personal auto business in 2014 was nonstandard auto insurance. Based on data published by A.M. Best, we believe that we are the second largest provider of nonstandard auto coverage through independent agents in the United States. We also write standard and preferred personal auto insurance, mono-line commercial auto insurance and classic collector automobile insurance.
Presented below is our summarized historical financial data ($ in thousands):
Twelve months ended December 31, | |||||||||||
2014 | 2013 | 2012 | |||||||||
Gross written premium | $ | 1,360,870 | $ | 1,339,819 | $ | 1,254,929 | |||||
Net written premium | 1,347,604 | 1,329,892 | 1,247,198 | ||||||||
Net earnings | 57,201 | 32,633 | 24,319 | ||||||||
As of December 31, | |||||||
2014 | 2013 | ||||||
Total assets | $ | 2,384,812 | $ | 2,317,265 | |||
Total liabilities | 1,687,153 | 1,660,507 | |||||
Total shareholders’ equity | 697,659 | 656,758 | |||||
2
We have a history of underwriting results that outperform the industry. The following table compares our statutory combined ratio, net of fees, in past years with those of the private passenger auto industry. The statutory combined ratio is the sum of the loss ratio (the ratio of losses and loss adjustment expenses (“LAE”) to net earned premium) and the expense ratio (when calculated on a statutory accounting basis, the ratio of underwriting expenses, net of fees, to net written premium). Underwriting results are generally considered profitable when the combined ratio is under 100%; when the ratio is over 100%, underwriting results are generally considered unprofitable. We have consistently performed better than the industry as shown below:
2014 | 2013 | 2012 | 2011 | 2010 | 2010-2014 | 2005-2014 | ||||||||||||||
Infinity | 93.6 | % | 96.0 | % | 98.3 | % | 95.8 | % | 88.4 | % | 94.7 | % | 92.5 | % | ||||||
Industry (a) | 102.2 | % | 101.6 | % | 102.1 | % | 102.0 | % | 101.0 | % | 101.8 | % | 100.0 | % | ||||||
Percentage point difference from industry | 8.6 | % | 5.6 | % | 3.8 | % | 6.2 | % | 12.6 | % | 7.1 | % | 7.5 | % | ||||||
________________
(a) | We obtained the private passenger auto industry combined ratios for 2005 through 2013 from A.M. Best. A.M. Best data is not available for 2014. The industry combined ratio for 2014 is an estimate based on data obtained from Conning Research and Consulting. |
Products
Personal Automobile is our primary insurance product. It provides coverage to individuals for liability to others for bodily injury and property damage and for physical damage to an insured's own vehicle from collision and various other perils. In addition, many states require policies to provide for first party personal injury protection, frequently referred to as no-fault coverage.
Commercial Vehicle provides coverage to businesses for liability to others for bodily injury and property damage and for physical damage to vehicles from collision and various other perils. With our mono-line commercial automobile insurance product, we primarily target businesses with fleets of 20 or fewer vehicles and average 1.8 vehicles per policy. We avoid businesses that are involved in what we consider to be hazardous operations or interstate commerce.
Classic Collector provides protection for classic collectible automobiles. Our Classic Collector program provides coverage to individuals with classic or antique automobiles for liability to others for bodily injury and property damage and for physical damage to an insured's own vehicle from collision and various other perils.
Our three product groups contributed the following percentages of total gross written premium:
Twelve months ended December 31, | ||||||||
2014 | 2013 | 2012 | ||||||
Personal Automobile | 91 | % | 93 | % | 93 | % | ||
Commercial Vehicle | 8 | % | 6 | % | 6 | % | ||
Classic Collector | 1 | % | 1 | % | 1 | % | ||
Total | 100 | % | 100 | % | 100 | % | ||
Distribution and Marketing
We distribute our products primarily through a network of approximately 11,800 independent agencies and brokers in 15,500 locations. Of the locations that produced premium in 2014, approximately 2,160 wrote renewal only business. In 2014, eight independent agencies each accounted for between 1.2% and 7.3% of our gross written premium and 15% of the agency force produced 80% of our gross written premium. Countrywide, our top 10 independent agents and brokers produced 21% of our gross written premium. In California, Infinity’s largest state by premium volume, 52 independent agents and brokers produced 50% of gross written premium (which represents 25% countrywide). Our largest broker in California produced 15% of gross written premium in the state.
We foster agent relationships by providing them with access to our Internet web-based software applications along with programs and services designed to strengthen and expand their marketing, sales and service capabilities. Our Internet-based software applications provide many of our agents with e-signature capabilities and real-time underwriting, claims and policy information. We believe the array of services offered to our agents adds significant value to the agents' businesses. For example, “Easy Street” is our incentive-based program through which agents receive assistance in critical areas such as training, advertising and promotion. In 2014 we spent $6.4 million on co-op advertising and promotions.
3
In 2014 we also wrote $70.2 million of business sold directly to the consumer through sales centers and via the Internet.
We are licensed to write insurance in all 50 states and the District of Columbia, but we focus our operations in targeted urban
areas identified in selected Focus States that we believe offer the greatest opportunity for premium growth and profitability.
We classify the states in which we operate into two categories:
• | “Focus States” – These states include Arizona, California, Florida and Texas. |
• | “Other States” – Includes Georgia, Nevada and Pennsylvania where we began offering renewals only as of |
January 1, 2015, as well as nine states where we are currently running off our writings.
We continually evaluate our market opportunities; thus, the Focus States and Other States may change over time as new market
opportunities arise, as the allocation of resources changes or as regulatory environments change.
Total gross written premium was as follows ($ in thousands):
Twelve months ended December 31, | |||||||||||
Personal Auto Insurance | 2014 | 2013 | 2012 | ||||||||
Focus States: | |||||||||||
California | 45.9 | % | 44.8 | % | 45.4 | % | |||||
Florida | 32.8 | % | 32.2 | % | 26.3 | % | |||||
Texas | 4.6 | % | 4.0 | % | 4.9 | % | |||||
Arizona | 1.3 | % | 1.8 | % | 3.0 | % | |||||
Total Focus States | 84.6 | % | 82.7 | % | 79.6 | % | |||||
Other States | 6.4 | % | 9.9 | % | 13.3 | % | |||||
Total Personal Auto | 91.0 | % | 92.6 | % | 92.9 | % | |||||
Commercial Vehicle | 8.0 | % | 6.4 | % | 6.1 | % | |||||
Classic Collector | 1.1 | % | 1.0 | % | 1.0 | % | |||||
Total all states and all lines | 100.0 | % | 100.0 | % | 100.0 | % | |||||
Total - all states and all lines | $ | 1,360,870 | $ | 1,339,819 | $ | 1,254,929 | |||||
We implement our distribution and marketing efforts with a focus on maintaining a low cost structure. Controlling expenses allows us to price competitively and achieve better underwriting returns. Over the five years ended 2013, years for which industry data are available from A.M. Best, our statutory ratio of underwriting expenses to premium written has averaged 19.6%, which is 7.4 points better than the independent agency segment of the private passenger automobile industry average of 27.0% for the same period.
Claims Handling
We strive for accuracy, consistency and fairness in our claim resolutions. Our claims organization employs approximately 1,275 people, has several field locations in each of our Focus States and provides a 24-hour, seven days per week toll-free service for our customers to report claims. We predominantly use our own local adjusters and appraisers, who typically respond to claims within 24 hours of a report.
We are committed to the field handling of claims and we believe that it provides, when compared to alternative methods, better service to our customers and better control of the claim resolution process. We open claims branch offices in urban areas where the volume of business will support them. Customer interactions can occur with generalists (initial and continuing adjusters) and specialists (staff appraisers, field casualty representatives and special investigators) based on local market volume, density and performance.
In addition to the use of field claims handling, we use centralized claims call centers to receive initial reports of losses and to adjust simple property damage claims.
Ratings
A.M. Best has assigned our insurance company subsidiaries a group financial strength rating of “A” (Excellent). A.M. Best assigns “A” ratings to insurers that, in A.M. Best's opinion, “have an excellent ability to meet their ongoing insurance obligations.” A.M. Best bases our rating on factors that concern policyholders and not upon factors concerning investor protection.
4
Regulatory Environment
Our insurance company subsidiaries are subject to regulation and supervision by insurance departments of the jurisdictions in which they are domiciled or licensed to transact business. State insurance departments have broad administrative power relating to licensing insurers and agents, regulating premium rates and policy forms, establishing reserve and investment requirements, prescribing statutory accounting methods and the form and content of statutory financial reports, and regulating methods and processes of how an insurer conducts its business. Examples of the latter include the establishment in California of auto rating factor and rate approval regulations, proscription on credit based insurance scoring, prohibition of certain business practices with auto body repair shops, and attempts to set uniform auto body repair shop parts and labor rates.
Under state insolvency and guaranty laws, regulated insurers can be assessed or required to contribute to state guaranty funds to cover policyholder losses resulting from insurer insolvencies. Many states also require insurers, as a condition of doing business in the state, to participate in various assigned risk pools, reinsurance facilities or underwriting associations, which provide insurance coverage to individuals who otherwise are unable to purchase that coverage in the voluntary market. Participation in these involuntary plans is generally in proportion to voluntary writings of related lines of business in that state. The underwriting results of these plans traditionally have been unprofitable. The amount of premium we might be required to assume in a given state in connection with an involuntary plan may be reduced because of credit we may receive for nonstandard policies that we voluntarily write. Many states also have laws and regulations that limit an insurer's ability to exit a market. For example, certain states limit an automobile insurer's ability to cancel and non-renew policies.
State insurance departments that have jurisdiction over our insurance subsidiaries may conduct routine, on-site visits and examinations of our subsidiaries' affairs. At December 31, 2014, our insurance subsidiaries were involved in routine market conduct examinations in California and Florida. As of February 26, 2015, these examinations have not been concluded. These examinations have from time to time given rise to, and are likely to give rise to in the future, regulatory orders requiring remedial, injunctive or other action on the part of an insurance subsidiary or the assessment of substantial fines or other penalties against our insurance subsidiaries.
The insurance laws of the states of domicile of our insurance subsidiaries contain provisions to the effect that the acquisition or change of control of a domestic insurer or of any entity that controls a domestic insurer cannot be consummated without the prior approval of the relevant insurance regulator. In addition, certain state insurance laws contain provisions that require pre-acquisition notification to state agencies of a change in control with respect to a non-domestic insurance company licensed to do business in that state. Such approval requirements may deter, delay or prevent certain transactions affecting the ownership of our common stock.
We are a holding company with no business operations of our own. Consequently, our ability to pay dividends to shareholders and meet our debt payment obligations is largely dependent on dividends or other distributions from our insurance company subsidiaries, current investments and cash held. State insurance laws restrict the ability of our insurance company subsidiaries to declare shareholder dividends. These subsidiaries may not make an “extraordinary dividend” until thirty days after the applicable commissioner of insurance has received notice of the intended dividend and has either not objected or has approved the payment of the extraordinary dividend within the 30-day period. An extraordinary dividend is defined as any dividend or distribution that, together with other distributions made within the preceding twelve months, exceeds the greater of 10% of the insurer's surplus as of the preceding December 31st, or the insurer's net income for the twelve-month period ending the preceding December 31st, in each case determined in accordance with statutory accounting practices. In addition, an insurer's remaining surplus after payment of a cash dividend to shareholder affiliates must be both reasonable in relation to its outstanding liabilities and adequate to its financial needs.
If a shareholder dividend does not rise to the statutory level of an extraordinary dividend, then it is an “ordinary dividend.” While an insurance company’s ability to pay an ordinary dividend does not require the approval of a state insurance department, it must file a 10-day notice of ordinary dividend with the appropriate insurance departments. Insurance companies that fail to notify an insurance department of the payment of an ordinary dividend are assessed administrative fines.
State insurance laws require our subsidiaries to maintain specified levels of statutory capital and surplus. Generally, the net admitted assets of insurance companies that, subject to other applicable insurance laws and regulations, are available for transfer to the parent company cannot include the net admitted assets required to meet the minimum statutory surplus requirements of the states where the companies are licensed. In addition, for competitive reasons, our insurance company subsidiaries need to maintain adequate financial strength ratings from independent rating agencies. Both of these factors may limit the ability of our insurance subsidiaries to declare and pay dividends.
5
INFINITY PROPERTY AND CASUALTY CORPORATION 10-K
ITEM 1A
Risk Factors
Our business operations face a number of risks. The risks below should be read and considered with other information provided in this report and in other reports and materials we have filed with the SEC. In addition to these risks, other risks and uncertainties not presently known to us or that we currently believe to be immaterial may also adversely affect our business.
If we fail to price accurately the risks we underwrite, profitability may be affected.
Our profitability depends on our ability to set premium rates accurately. Inflationary pressures on medical care, auto parts and repair services costs complicate pricing with accuracy. Accurate pricing is also dependent on the availability of sufficient, reliable data on which to project both severity and frequency trends and timely recognition of changes in loss cost trends. This process poses more of a challenge in markets where we have less pricing experience. We could under-price risks, which could negatively affect our profit margins, or overprice risks, which could reduce sales volume and competitiveness. Either scenario could adversely affect profitability.
Because of the significant concentration of our business in California and Florida, negative developments in the regulatory, legal or economic conditions in these states may adversely affect our profitability.
California and Florida personal auto business represented 79% of our total gross written premium in 2014. In 2014 our two largest urban zones, one in California and one in Florida, represented 52% of total gross written premium and approximately 88% of total underwriting profits. As we cease writing new business in Georgia, Nevada and Pennsylvania in 2015, our personal auto business may become further concentrated in these states and within our two largest urban zones. Consequently, the dynamic nature of regulatory, legal, competitive and economic conditions in these states affects our revenues and profitability. Further, both California and Florida have regulations that limit the after-tax return on underwriting profit allowed for an insurer. These conditions could negatively affect premium revenue and make it more expensive or less profitable for us to conduct business in these states.
We rely upon a limited number of independent agents to generate a substantial portion of our business. If we were unable to retain or increase the level of business that these independent agents place with us or increase the level of business generated by other agents, our revenues would be negatively affected.
Approximately 15% of our 11,800 independent agencies and brokers accounted for approximately 80% of our gross written premium in 2014. Further, in California, our most profitable state, 52 agencies and brokers produced 50% of our premium in the state, which is 25% of our premium nationwide. Some of our current agencies may merge or be acquired and the surviving entity may reduce the number of insurers with which business is placed. We must compete with other insurance carriers for the business of these agents in an increasingly competitive marketplace. Some competitors offer more advanced systems to quote and process business, a larger variety of products, lower prices for insurance coverage, higher commissions or more attractive cash and non-cash incentives.
If we fail to establish accurate loss reserves, our financial position and results of operations may be affected.
Our loss reserves are our best estimate of the amounts that will be paid for losses incurred as well as losses incurred but not reported. The accuracy of these estimates depends on a number of factors, including but not limited to the availability of sufficient and reliable historical data, inflationary pressures on medical and auto repair costs, changes in regulation, changes in frequency and severity trends and changes in our claims settlement practices. Because of the inherent uncertainty involved in the practice of establishing loss reserves, ultimate losses paid could vary materially from recorded reserves and may adversely affect our operating results.
We are vulnerable to a reduction in business written through the independent agent distribution channel.
Reliance on the independent agency as our primary distribution channel makes us vulnerable to the growing popularity of direct to consumer distribution channels, particularly the Internet. Approximately 73% of all personal automobile insurance sold in the United States is sold direct or through captive agents (agents employed by one company or selling only one company's products) and approximately 27% is sold by independent agents. A material reduction in business generated through the independent agency channel could negatively affect our revenues and growth opportunities.
6
Judicial, regulatory and legislative changes or challenges to prevailing insurance industry practices are ongoing, some of which could adversely affect our operating results.
Political, judicial, economic and financial developments occasionally lead to challenges or changes to established industry practices. Recent examples include challenges to (i) the use of credit and other rating factors in making risk selection and pricing decisions; and (ii) the use of automated databases in the adjustment of claims. Some result in class action litigation, regulatory sanctions and substantial fines or penalties. It is difficult to predict the outcome or impact of current challenges or to identify others that might be brought in the future.
The failure to maintain or to develop further reliable, efficient and secure information technology systems would be disruptive to our operations and diminish our ability to compete successfully.
We are highly dependent on efficient and uninterrupted performance of our information technology and business systems. These systems quote, process and service our business, and perform actuarial functions necessary for pricing and product development. These systems must also be able to undergo periodic modifications and improvements without interruptions or untimely delays in service. This capability is crucial to meeting growing customer demands for user friendly, online capabilities and convenient, quality service. We are undergoing fundamental changes and improvements to our policy services platform. A failure or delay to achieve these improvements could interrupt certain processes or degrade business operations and could place us at a competitive disadvantage. Additionally, failure to maintain secure systems could result in unauthorized access to or theft of sensitive customer data.
The inability to recruit, develop and retain key personnel could prevent us from executing our key business and financial objectives.
Successful execution of our key business and financial objectives will depend, in part, upon the continued services of our Chief Executive Officer, James Gober, along with our ability to retain and develop key personnel and to attract new talent. The highly competitive nature of the industry, along with the advantages that larger, better-known firms possess in the recruiting process, poses a challenge. The loss of key personnel or the inability to attract and retain new talent could hinder us in meeting or exceeding our business and financial objectives.
Extra-contractual losses arising from bad faith claims could materially reduce our profitability.
In California and Florida, the judicial climate, case law or statutory framework are often viewed as unfavorable toward an insurer in litigation brought against it by policyholders and third-party claimants. This tends to increase our exposure to extra-contractual losses, or monetary damages beyond policy limit, in what are known as “bad faith” claims, for which reinsurance may be unavailable. Such claims have in the past, and may in the future, result in losses to us that materially reduce our profitability.
Our goodwill may be at risk for impairment if actual results regarding growth and profitability vary from our estimates.
At December 31, 2014, we had $75.3 million, or approximately $6.56 per share, of goodwill. In accordance with the Goodwill topic of the FASB Accounting Standards Codification, we perform impairment test procedures for goodwill on an annual basis. These procedures require us to calculate the fair value of goodwill, compare the result to our carrying value and record the amount of any shortfall as an impairment charge.
We use a variety of methods to test goodwill for impairment, including estimates of future discounted cash flows and comparisons of our market value to our major competitors. Our cash flow projections rely on assumptions that are subject to uncertainty, including premium growth, loss and loss adjustment expense ratios, interest rates and capital requirements. If actual results differ significantly from these assumptions, the fair value of our goodwill could fall below our carrying value and we could be required to record an impairment charge.
INFINITY PROPERTY AND CASUALTY CORPORATION 10-K
ITEM 1B
Unresolved Staff Comments
None.
ITEM 2
Properties
Our insurance subsidiaries lease 461,717 square feet of office and warehouse space in numerous cities throughout the United States. All of these leases expire within 7 years. The most significant leased office spaces are located in Birmingham, Alabama and suburban Los Angeles, California. See Note 14 – Commitments and Contingencies of the Notes to Consolidated Financial Statements for further information about leases. We own a 33,515 square foot call center in McAllen, Texas, a 50,900 square foot call center in Tucson, Arizona, and two properties in Birmingham, Alabama - a 116,433 square foot call center and a 62,808 square foot warehouse.
ITEM 3
Legal Proceedings
See Note 13 – Legal and Regulatory Proceedings of the Notes to the Consolidated Financial Statements for a discussion of our material Legal Proceedings. Except for those legal proceedings disclosed in Note 13 to the Consolidated Financial Statements, we believe that none of the legal proceedings to which we are subject meet the threshold for disclosure under this item.
ITEM 4
Mine Safety Disclosures
Not applicable.
INFINITY PROPERTY AND CASUALTY CORPORATION 10-K
PART II
ITEM 5
Market for Registrant’s Common Equity, Related Stockholder Matters and Issuer Purchases of Equity Securities
We had 49 registered holders of record as of February 13, 2015. Our common stock is listed and traded on the NASDAQ Global Select Market under the symbol IPCC. The stock prices in the following table are over-the-counter market quotations that reflect transactions between dealers; retail markups and commissions are not reflected. These prices may not represent actual transactions. Our closing per-share stock price on February 13, 2015, was $73.93. See Note 12 – Statutory Information of the Notes to Consolidated Financial Statements for information about restrictions on transfer of funds and assets of subsidiaries.
Infinity Quarterly High and Low Stock Prices and Dividends Paid by Quarter
For the quarter ended: | High | Low | Close | Dividends Declared and Paid Per Share | Return to Shareholders (excluding dividends) (a) | Return to Shareholders (including dividends) (b) | |||||||||||||||
March 31, 2013 | $ | 61.20 | $ | 55.12 | $ | 56.20 | $ | 0.30 | (3.5 | )% | (3.0 | )% | |||||||||
June 30, 2013 | 61.15 | 54.32 | 59.76 | 0.30 | 6.3 | % | 6.9 | % | |||||||||||||
September 30, 2013 | 67.56 | 59.32 | 64.60 | 0.30 | 8.1 | % | 8.6 | % | |||||||||||||
December 31, 2013 | 72.70 | 64.10 | 71.75 | 0.30 | 11.1 | % | 11.5 | % | |||||||||||||
March 31, 2014 | $ | 75.66 | $ | 67.45 | $ | 67.63 | $ | 0.36 | (5.7 | )% | (5.2 | )% | |||||||||
June 30, 2014 | 69.70 | 62.12 | 67.23 | 0.36 | (0.6 | )% | (0.1 | )% | |||||||||||||
September 30, 2014 | 70.28 | 64.00 | 64.01 | 0.36 | (4.8 | )% | (4.3 | )% | |||||||||||||
December 31, 2014 | 78.20 | 62.19 | 77.26 | 0.36 | 20.7 | % | 21.3 | % | |||||||||||||
For the twelve months ended: | |||||||||||||||||||||
December 31, 2013 | $ | 72.70 | $ | 54.32 | $ | 71.75 | $ | 1.20 | 23.2 | % | 25.3 | % | |||||||||
December 31, 2014 | 78.20 | 62.12 | 77.26 | 1.44 | 7.7 | % | 9.7 | % | |||||||||||||
(a) | Calculated by dividing the difference between our share price at the end and the beginning of the periods presented by the share price at the beginning of the period presented. |
(b) | Calculated by dividing the sum of (i) the amount of dividends, assuming dividend reinvestment during the period presented and (ii) the difference between our share price at the end and the beginning of the periods presented by the share price at the beginning of the period presented. |
The information required under the heading “Equity Compensation Plan Information” is provided under Item 12 herein.
During the fiscal year ended December 31, 2014, all of our equity securities sold were registered under the Securities Act of 1933, as amended.
7
The following table presents information with respect to purchases of our common stock made during the three months ended December 31, 2014, by us or any of our "affiliated purchasers" as defined in Rule 10b-18(a)(3) under the Exchange Act.
Period | Total Number of Shares Purchased | Average Price Paid per Share (a) | Total Number of Shares Purchased as Part of Publicly Announced Plans or Programs | Approximate Dollar Value that May Yet Be Purchased Under the Plans or Programs (b) | |||||||
October 1, 2014 - October 31, 2014 | 6,400 | $ | 66.84 | 6,400 | $ | 38,855,057 | |||||
November 1, 2014 - November 30, 2014 | 5,600 | $ | 73.41 | 5,600 | $ | 74,610,592 | |||||
December 1, 2014 - December 31, 2014 | 7,300 | $ | 74.84 | 7,300 | $ | 74,064,029 | |||||
Total | 19,300 | $ | 71.77 | 19,300 | $ | 74,064,029 | |||||
(a) | Average price paid per share excludes commissions. |
(b) | On November 4, 2014, our Board of Directors increased the authority under our current share and debt repurchase plan to a total of $75.0 million and extended the date to execute the program to December 31, 2016, from December 31, 2014. |
The following graph shows the percentage change in cumulative total shareholder return on our common stock over the five years ending December 31, 2014. The return is measured by dividing the sum of (A) the cumulative amount of dividends, assuming dividend reinvestment during the periods presented and (B) the difference between our share price at the end and the beginning of the periods presented by the share price at the beginning of the periods presented. The graph demonstrates cumulative total returns for Infinity, the NASDAQ OMX Global Total Return Index for NASDAQ US Benchmark and the NASDAQ OMX Global Total Return for Industrial Classification Benchmark (ICB): 8500 Insurance (Supersector).
Cumulative Total Return as of December 31, 2014
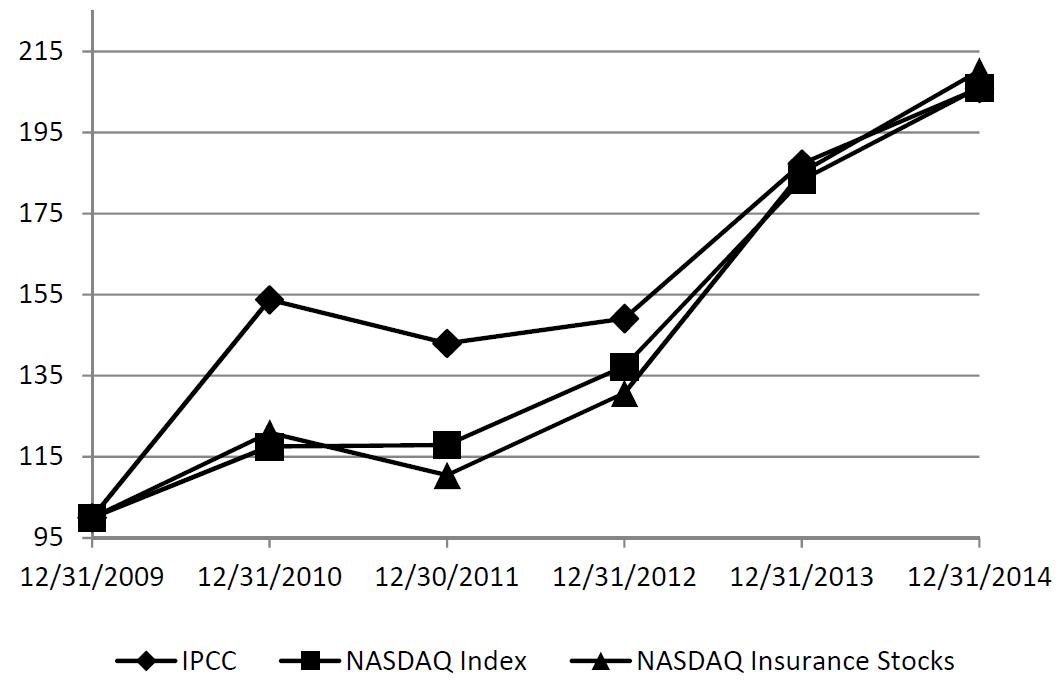
(Assumes a $100 investment at the close of trading on December 31, 2009)
12/31/2009 | 12/31/2010 | 12/31/2011 | 12/31/2012 | 12/31/2013 | 12/31/2014 | ||||||
IPCC | 100.00 | 153.78 | 143.02 | 149.13 | 187.28 | 205.92 | |||||
NASDAQ US | 100.00 | 117.55 | 117.91 | 137.29 | 183.26 | 206.09 | |||||
ICB: 8500 Insurance | 100.00 | 120.93 | 110.47 | 130.72 | 185.15 | 210.26 | |||||
INFINITY PROPERTY AND CASUALTY CORPORATION 10-K
ITEM 6
Selected Financial Data
($ in thousands, except per share data) | 2014 | 2013 | 2012 | 2011 | 2010 | ||||||||||||||
Gross written premium | $ | 1,360,870 | $ | 1,339,819 | $ | 1,254,929 | $ | 1,082,466 | $ | 952,426 | |||||||||
Net written premium | 1,347,604 | 1,329,892 | 1,247,198 | 1,075,976 | 946,869 | ||||||||||||||
Net written premium growth | 1.3 | % | 6.6 | % | 15.9 | % | 13.6 | % | 12.2 | % | |||||||||
Net premium earned | 1,325,935 | 1,302,525 | 1,184,090 | 1,019,060 | 905,919 | ||||||||||||||
Total revenues | 1,461,709 | 1,443,233 | 1,349,585 | 1,163,379 | 1,038,396 | ||||||||||||||
Loss & LAE ratio | 75.5 | % | 78.1 | % | 79.6 | % | 75.3 | % | 67.0 | % | |||||||||
Underwriting ratio | 19.6 | % | 19.9 | % | 21.1 | % | 22.7 | % | 22.7 | % | |||||||||
Combined ratio | 95.1 | % | 98.0 | % | 100.7 | % | 98.0 | % | 89.7 | % | |||||||||
Net earnings | $ | 57,201 | $ | 32,633 | $ | 24,319 | $ | 41,833 | $ | 91,062 | |||||||||
Net earnings per diluted share | $ | 4.95 | $ | 2.80 | $ | 2.04 | $ | 3.37 | $ | 6.91 | |||||||||
Return on average common shareholders’ equity | 8.4 | % | 5.0 | % | 3.7 | % | 6.4 | % | 14.4 | % | |||||||||
Cash and investments | $ | 1,611,594 | $ | 1,582,238 | $ | 1,560,116 | $ | 1,308,684 | $ | 1,283,624 | |||||||||
Total assets | 2,384,812 | 2,317,265 | 2,303,593 | 1,930,371 | 1,846,200 | ||||||||||||||
Unpaid losses and LAE | 668,177 | 646,577 | 572,894 | 495,403 | 477,833 | ||||||||||||||
Unearned premium | 589,260 | 566,004 | 538,142 | 474,528 | 417,371 | ||||||||||||||
Debt outstanding | 275,000 | 275,000 | 275,000 | 194,810 | 194,729 | ||||||||||||||
Total liabilities | 1,687,153 | 1,660,507 | 1,647,351 | 1,268,582 | 1,191,173 | ||||||||||||||
Shareholders’ equity | 697,659 | 656,758 | 656,242 | 661,789 | 655,027 | ||||||||||||||
Cash dividend per common share | $ | 1.44 | $ | 1.20 | $ | 0.90 | $ | 0.72 | $ | 0.56 | |||||||||
Common shares outstanding | 11,483 | 11,504 | 11,605 | 11,807 | 12,469 | ||||||||||||||
Book value per common share | $ | 60.75 | $ | 57.09 | $ | 56.55 | $ | 56.05 | $ | 52.53 | |||||||||
Ratios: | |||||||||||||||||||
Debt to total capital | 28.3 | % | 29.5 | % | 29.5 | % | 22.7 | % | 22.9 | % | |||||||||
Debt to tangible capital | 30.6 | % | 32.1 | % | 32.1 | % | 24.9 | % | 25.1 | % | |||||||||
Interest coverage | 7.0 | 4.2 | 2.7 | 6.0 | 12.8 | ||||||||||||||
8
INFINITY PROPERTY AND CASUALTY CORPORATION 10-K
Management’s Discussion and Analysis of Financial Condition and Results of Operations
ITEM 7
Management’s Discussion and Analysis (“MD&A”) of Financial Condition and Results of Operations
INDEX TO MD&A
Page | |
See “Cautionary Statement Regarding Forward-Looking Statements” on page 1.
9
INFINITY PROPERTY AND CASUALTY CORPORATION 10-K
Management’s Discussion and Analysis of Financial Condition and Results of Operations
Overview
During 2014 we focused on growing premium in California, Florida and Texas personal auto and countrywide Commercial Vehicle while improving the profitability in Arizona, Georgia, Nevada and Pennsylvania. Although we have seen improvement in the combined ratios, we have determined that our personal auto business in Georgia, Nevada and Pennsylvania, which accounted for 5.9% of our total gross written premium as of December 31, 2014, no longer meets our long-term strategic and financial objectives. As a result, we began offering renewal business only in these three states as of January 1, 2015. In addition, we are evaluating strategic alternatives for our Classic Collector book of business, which was 1.1% of our business as of December 31, 2014.
In 2014 our gross written premium grew 1.6%. The majority of this growth came from California and Florida. See Results of Operations - Underwriting – Premium for a more detailed discussion of our gross written premium growth.
Net earnings and diluted earnings per share for the year ended December 31, 2014, were $57.2 million and $4.95, respectively, compared to $32.6 million and $2.80, respectively, for 2013. The increase in diluted earnings per share for the year ended December 31, 2014, was primarily due to an increase in underwriting income with an improvement in the accident year combined ratio from 97.7% at December 31, 2013, to 96.4% at December 31, 2014.
Included in net earnings for the year ended December 31, 2014, was $11.3 million ($17.4 million pre-tax) of favorable development on prior accident year loss and LAE reserves. This development was primarily due to property damage coverage in California and bodily injury coverage in Florida, related to accident year 2013. This compares to $1.9 million ($2.9 million pre-tax) of unfavorable development for 2013. The following table displays GAAP combined ratio results by accident year developed through December 31, 2014.
Accident Year Combined Ratio Developed Through | Prior Accident Year (Favorable) Unfavorable Development | Prior Accident Year (Favorable) Unfavorable Development ($ in millions) | ||||||||||||||||||||||||||
Dec. | Mar. | June | Sep. | Dec. | Q4 | YTD | Q4 | YTD | ||||||||||||||||||||
Accident Year | 2013 | 2014 | 2014 | 2014 | 2014 | 2014 | 2014 | 2014 | 2014 | |||||||||||||||||||
Prior | $ | (0.6 | ) | $ | (1.1 | ) | ||||||||||||||||||||||
2007 | 92.2 | % | 92.2 | % | 92.2 | % | 92.1 | % | 92.1 | % | 0.0 | % | (0.1 | )% | (0.4 | ) | (0.7 | ) | ||||||||||
2008 | 91.3 | % | 91.3 | % | 91.3 | % | 91.3 | % | 91.2 | % | (0.1 | )% | (0.2 | )% | (1.1 | ) | (1.6 | ) | ||||||||||
2009 | 92.3 | % | 92.3 | % | 92.3 | % | 92.4 | % | 92.4 | % | 0.0 | % | 0.1 | % | (0.2 | ) | 0.8 | |||||||||||
2010 | 99.6 | % | 99.5 | % | 99.3 | % | 99.3 | % | 99.2 | % | (0.1 | )% | (0.4 | )% | (0.6 | ) | (3.4 | ) | ||||||||||
2011 | 100.3 | % | 100.2 | % | 100.4 | % | 100.2 | % | 100.1 | % | (0.1 | )% | (0.2 | )% | (1.4 | ) | (2.0 | ) | ||||||||||
2012 | 99.8 | % | 100.1 | % | 100.2 | % | 100.1 | % | 100.1 | % | (0.1 | )% | 0.2 | % | (0.7 | ) | 2.5 | |||||||||||
2013 | 97.7 | % | 97.4 | % | 97.4 | % | 97.1 | % | 96.8 | % | (0.3 | )% | (0.9 | )% | (3.8 | ) | (11.9 | ) | ||||||||||
$ | (8.8 | ) | $ | (17.4 | ) | |||||||||||||||||||||||
See Results of Operations – Underwriting – Profitability for a more detailed discussion of our underwriting results.
Pre-tax net investment income for the year ended December 31, 2014, was $35.6 million compared to $35.5 million for 2013.
Our book value per share increased 6.4% from $57.09 at December 31, 2013, to $60.75 at December 31, 2014. This increase was primarily due to net earnings and an increase in unrealized gains as a result of a decrease in interest rates, partially offset by shareholder dividends during 2014.
Critical Accounting Policies
(See Note 1- Significant Reporting and Accounting Policies of the Notes to Consolidated Financial Statements)
The preparation of financial statements requires management to make estimates and assumptions that can have a significant effect on amounts reported in the financial statements. As more information becomes known, these estimates and assumptions could change and thus impact amounts reported in the future. We believe that the establishment of insurance reserves, the determination of “other-than-temporary” impairment on investments, accruals for litigation and valuation of goodwill are the
10
INFINITY PROPERTY AND CASUALTY CORPORATION 10-K
Management’s Discussion and Analysis of Financial Condition and Results of Operations
areas where the degree of judgment required to determine amounts recorded in the financial statements makes the accounting policies critical.
Insurance Reserves
Insurance reserves, or unpaid losses and LAE, are our best estimate of the ultimate amounts that will be paid for (i) all claims that have been reported up to the date of the current accounting period but have not yet been paid, (ii) all claims that have occurred but have not yet been reported to us (“incurred but not reported” or “IBNR”), and (iii) unpaid claim settlement expenses.
We establish IBNR reserves for the quarter and year-end based on a quarterly reserve analysis by our actuarial staff. We apply various standard actuarial tests to subsets of the business at a state, product and coverage level. Included in the analyses are the following:
• | Paid and incurred extrapolation methods utilizing paid and incurred loss development to predict ultimate losses; |
• | Paid and incurred frequency and severity methods utilizing paid and incurred claims count development and paid and incurred loss development to predict ultimate average frequency (claims count per policy or auto insured) or ultimate average severity (cost of claim per claim); and |
• | Paid and incurred Bornhuetter-Ferguson methods adding expected development to actual paid or incurred experience to project ultimate losses. |
For each subset of the business evaluated, each test generates a point estimate based on development factors applied to known paid and incurred losses and claim counts to estimate ultimate paid losses and claim counts. We base our selection of factors on historical loss development patterns with adjustment based on professional actuarial judgment where anticipated development patterns vary from those seen historically. This estimation of IBNR requires selection of hundreds of such factors. We then select a single point estimate for the subset evaluated from the results of various tests, based on a combination of simple averages of the point estimates of the various tests and selections based on professional actuarial judgment.
Estimating the liability for unpaid losses and LAE is inherently judgmental and is influenced by factors that are subject to significant variation. We estimate liabilities for the costs of losses and LAE for both reported and unreported (IBNR) claims based on historical trends in the following areas adjusted for deviations in such trends:
• | Claims settlement and payment practices; |
• | Business mix; |
• | Coverage limits and deductibles; |
• | Inflation trends in auto repair and medical costs; and |
• | Legal and regulatory trends affecting claims settlements. |
When possible, we make quantitative and qualitative modifications to, or selections of, such factors where deviations from historical trends in these key areas exist. We analyze the adequacy of reserves using actuarial data and analytical reserve development techniques, including projections of ultimate paid losses, to determine the ultimate amount of reserves. The list of historical trends provided above are non-exhaustive examples of major factors that we take into account in developing these estimates.
We review loss reserve adequacy quarterly by accident year at a state and coverage level. We adjust reserves as additional information becomes known. We reflect such adjustments in current year operations.
During each quarterly review by the internal actuarial staff, using the additional information obtained with the passage of time, factor selections are updated, which in turn adjust the ultimate loss estimates and held IBNR reserves for the subset of the business and accident periods affected by such updates. The actuarial staff also performs various tests to estimate ultimate average severity and frequency of claims. Severity represents the average cost per claim and frequency represents the number of claims per auto or per policy. As an overall review, the staff then evaluates for reasonableness loss and LAE ratios by accident year by state and by coverage.
Factors that can significantly affect actual frequency include, among others, changes in weather, driving patterns or trends and class of driver. Changes in claims settlement and reserving practices can affect estimates of average frequency and severity. Auto repair and medical cost inflation, jury awards and changes in policy limit profiles can affect loss severity. Estimation of LAE reserves is subject to variation from factors such as the use of outside adjusters, frequency of lawsuits, claims staffing and experience levels.
11
INFINITY PROPERTY AND CASUALTY CORPORATION 10-K
Management’s Discussion and Analysis of Financial Condition and Results of Operations
We believe that our relatively low average policy limit and concentration on the nonstandard auto driver classification help stabilize fluctuations in frequency and severity. For example, approximately 85% of our policies include only the state-mandated minimum policy limits for bodily injury, which somewhat mitigates the challenge of estimating average severity. These low limits tend to reduce the exposure of the loss reserves on this coverage to medical cost inflation on severe injuries since the minimum policy limits will limit the total payout.
Ultimate loss estimates, excluding extra-contractual obligation (“ECO”) losses, usually experience the greatest adjustment within the first twelve to eighteen months after the accident year. Accordingly, the highest degree of uncertainty is associated with reserves for the current accident year because the current accident year contains the greatest proportion of losses that have not been reported or settled, and we must estimate these elements as of the current reporting date. The proportion of losses with these characteristics typically diminishes in subsequent years.
As compared with loss and LAE reserves held at December 31, 2014, our best estimate of reserve ranges using indicated results from utilized estimates of loss and LAE could range from a deficiency of 7% or $46.6 million to a redundancy of 8% or $53.8 million. These ranges do not present a forecast of future redundancy or deficiency since actual development of future losses on current loss reserves may vary materially from those estimated in the year-end 2014 reserve tests. Reserves recorded are our best estimate of the ultimate amounts that will be paid.
As noted above, the highest degree of uncertainty is associated with reserves in the first twelve to eighteen months. The following table displays the accident year combined ratios as developed through December 31, 2014, for the four most recent accident years along with the potential combined ratios based on the low and high outcomes of the loss and LAE tests utilized:
Combined Ratios Developed Through | |||||||||
December 31, 2014 | |||||||||
Accident year | Low | As Reported | High | ||||||
2011 | 99.6 | % | 100.1 | % | 100.4 | % | |||
2012 | 99.3 | % | 100.1 | % | 100.6 | % | |||
2013 | 95.7 | % | 96.8 | % | 97.7 | % | |||
2014 | 94.8 | % | 96.4 | % | 98.1 | % | |||
ECO losses represent estimates of losses incurred from actual or threatened litigation by claimants alleging improper handling of claims by us, which are commonly known as “bad faith” claims. Oftentimes, the onset of such litigation, subsequent discovery, settlement discussions, trial and appeal may occur several years after the date of the original claim. Because of the infrequent nature of such claims, we accrue a liability for each case based on the facts and circumstances in accordance with the Loss Contingency topic of the FASB Accounting Standards Codification, which requires that such loss be probable and estimable. As such, no reserve is permissible for IBNR for threatened litigation yet to occur on accidents with dates prior to the balance sheet date. Consequently, the effect of setting accruals for such items likely will result in unfavorable reserve development in the following reserve tables.
Calendar year losses incurred for ECO losses, gross and net of reinsurance, over the past five calendar years have ranged from $0.3 million to $4.2 million, averaging $1.7 million per year. Losses for 2014, 2013 and 2012 have been $4.2 million, $1.3 million and $1.7 million, respectively.
The following tables present the development of our loss reserves, net of reinsurance, on a GAAP basis for the calendar years 2004 through 2014. The top line of each table shows the estimated liability for unpaid losses and LAE recorded at the balance sheet date for the indicated years. The next line shows the re-estimated liability as of December 31, 2014. The remainder of the table presents intervening development as percentages of the initially estimated liability. Additional information and experience in subsequent years results in development. The middle line shows a cumulative deficiency (redundancy) which represents the aggregate percentage increase (decrease) in the liability initially estimated. The lower portion of the table indicates the cumulative amounts paid as of successive periods as a percentage of the original loss reserve liability.
These tables do not present accident or policy year development data. Furthermore, in evaluating the re-estimated liability and cumulative deficiency (redundancy), note that each percentage includes the effects of changes in amounts for prior periods. Conditions and trends that have affected development of the liability in the past may not necessarily exist in the future. Accordingly, it is not appropriate to extrapolate future redundancies or deficiencies based on these tables.
12
INFINITY PROPERTY AND CASUALTY CORPORATION 10-K
Management’s Discussion and Analysis of Financial Condition and Results of Operations
($ in millions) | 2004 | 2005 | 2006 | 2007 | 2008 | 2009 | 2010 | 2011 | 2012 | 2013 | 2014 | ||||||||||||||||||||||||||||||||
Liability for unpaid losses & LAE: | |||||||||||||||||||||||||||||||||||||||||||
As originally estimated | $ | 669 | $ | 610 | $ | 568 | $ | 590 | $ | 524 | $ | 491 | $ | 461 | $ | 481 | $ | 559 | $ | 632 | $ | 654 | |||||||||||||||||||||
As re-estimated at December 31, 2014 | 610 | 510 | 461 | 466 | 388 | 389 | 445 | 486 | 557 | 615 | N/A | ||||||||||||||||||||||||||||||||
Liability re-estimated: | |||||||||||||||||||||||||||||||||||||||||||
One year later | 97.5 | % | 94.9 | % | 97.6 | % | 95.0 | % | 87.5 | % | 85.0 | % | 101.0 | % | 103.4 | % | 100.5 | % | 97.3 | % | |||||||||||||||||||||||
Two years later | 94.2 | % | 91.6 | % | 91.3 | % | 86.5 | % | 78.7 | % | 83.0 | % | 99.2 | % | 102.7 | % | 99.6 | % | |||||||||||||||||||||||||
Three years later | 93.7 | % | 89.1 | % | 85.2 | % | 81.7 | % | 76.8 | % | 81.0 | % | 97.8 | % | 101.0 | % | |||||||||||||||||||||||||||
Four years later | 93.7 | % | 85.6 | % | 82.4 | % | 80.5 | % | 75.5 | % | 79.7 | % | 96.5 | % | |||||||||||||||||||||||||||||
Five years later | 91.9 | % | 84.0 | % | 81.7 | % | 79.6 | % | 74.7 | % | 79.1 | % | |||||||||||||||||||||||||||||||
Six years later | 91.2 | % | 83.8 | % | 81.5 | % | 79.3 | % | 74.1 | % | |||||||||||||||||||||||||||||||||
Seven years later | 91.2 | % | 83.7 | % | 81.4 | % | 79.0 | % | |||||||||||||||||||||||||||||||||||
Eight years later | 91.1 | % | 83.7 | % | 81.2 | % | |||||||||||||||||||||||||||||||||||||
Nine years later | 91.3 | % | 83.7 | % | |||||||||||||||||||||||||||||||||||||||
Ten years later | 91.2 | % | |||||||||||||||||||||||||||||||||||||||||
Cumulative deficiency (redundancy) | (8.8 | )% | (16.4 | )% | (18.8 | )% | (21.0 | )% | (25.9 | )% | (20.9 | )% | (3.5 | )% | 1.0 | % | (0.5 | )% | (2.8 | )% | N/A | ||||||||||||||||||||||
Cumulative deficiency (redundancy) excluding ECO losses | (17.0 | )% | (23.0 | )% | (24.7 | )% | (24.8 | )% | (26.2 | )% | (22.0 | )% | (4.7 | )% | (0.4 | )% | (1.4 | )% | (3.4 | )% | N/A | ||||||||||||||||||||||
Cumulative paid as of: | |||||||||||||||||||||||||||||||||||||||||||
One year later | 52.6 | % | 50.3 | % | 48.4 | % | 54.6 | % | 46.8 | % | 48.2 | % | 62.5 | % | 64.5 | % | 62.7 | % | 59.7 | % | |||||||||||||||||||||||
Two years later | 72.6 | % | 66.5 | % | 69.1 | % | 67.4 | % | 61.0 | % | 65.9 | % | 81.1 | % | 84.2 | % | 82.4 | % | |||||||||||||||||||||||||
Three years later | 80.1 | % | 77.4 | % | 74.8 | % | 72.9 | % | 67.9 | % | 72.7 | % | 88.8 | % | 92.3 | % | |||||||||||||||||||||||||||
Four years later | 87.3 | % | 79.9 | % | 77.4 | % | 75.8 | % | 70.9 | % | 75.5 | % | 92.0 | % | |||||||||||||||||||||||||||||
Five years later | 88.5 | % | 81.1 | % | 78.8 | % | 77.1 | % | 72.3 | % | 76.9 | % | |||||||||||||||||||||||||||||||
Six years later | 89.3 | % | 81.7 | % | 79.5 | % | 77.8 | % | 72.6 | % | |||||||||||||||||||||||||||||||||
Seven years later | 89.7 | % | 82.3 | % | 80.1 | % | 77.9 | % | |||||||||||||||||||||||||||||||||||
Eight years later | 90.1 | % | 82.7 | % | 80.1 | % | |||||||||||||||||||||||||||||||||||||
Nine years later | 90.4 | % | 82.6 | % | |||||||||||||||||||||||||||||||||||||||
Ten years later | 88.2 | % | |||||||||||||||||||||||||||||||||||||||||
13
INFINITY PROPERTY AND CASUALTY CORPORATION 10-K
Management’s Discussion and Analysis of Financial Condition and Results of Operations
The following table presents a reconciliation of our net liability to the gross liability for unpaid losses and LAE ($ in millions):
2004 | 2005 | 2006 | 2007 | 2008 | 2009 | 2010 | 2011 | 2012 | 2013 | 2014 | |||||||||||||||||||||||||||||||||
As originally estimated | |||||||||||||||||||||||||||||||||||||||||||
Net liability shown above | $ | 669 | $ | 610 | $ | 568 | $ | 590 | $ | 524 | $ | 491 | $ | 461 | $ | 481 | $ | 559 | $ | 632 | $ | 654 | |||||||||||||||||||||
Add reinsurance recoverables | 27 | 15 | 28 | 28 | 21 | 18 | 17 | 15 | 14 | 14 | 14 | ||||||||||||||||||||||||||||||||
Gross liability | $ | 696 | $ | 625 | $ | 595 | $ | 618 | $ | 545 | $ | 509 | $ | 478 | $ | 495 | $ | 573 | $ | 647 | $ | 668 | |||||||||||||||||||||
As re-estimated at | |||||||||||||||||||||||||||||||||||||||||||
December 31, 2014 | |||||||||||||||||||||||||||||||||||||||||||
Net liability shown above | $ | 610 | $ | 510 | $ | 461 | $ | 466 | $ | 388 | $ | 389 | $ | 445 | $ | 486 | $ | 557 | $ | 615 | N/A | ||||||||||||||||||||||
Add reinsurance recoverables | 48 | 38 | 32 | 30 | 25 | 22 | 17 | 15 | 14 | 15 | N/A | ||||||||||||||||||||||||||||||||
Gross liability | $ | 658 | $ | 548 | $ | 493 | $ | 497 | $ | 414 | $ | 411 | $ | 462 | $ | 501 | $ | 570 | $ | 630 | N/A | ||||||||||||||||||||||
Gross cumulative deficiency (redundancy) | (5.5 | )% | (12.4 | )% | (17.2 | )% | (19.7 | )% | (24.1 | )% | (19.3 | )% | (3.3 | )% | 1.0 | % | (0.4 | )% | (2.6 | )% | N/A | ||||||||||||||||||||||
Gross cumulative deficiency (redundancy) excluding ECO losses | (15.7 | )% | (19.9 | )% | (23.5 | )% | (23.8 | )% | (24.4 | )% | (20.4 | )% | (4.4 | )% | (0.3 | )% | (1.4 | )% | (3.2 | )% | N/A | ||||||||||||||||||||||
We find it useful to evaluate accident year loss and LAE ratios by calendar year to monitor reserve development. The following table presents, by accident year, loss and LAE ratios (including IBNR):
Accident Year Loss and LAE Ratios Through Calendar Year End | |||||||||||||||||||||||||||||
2005 | 2006 | 2007 | 2008 | 2009 | 2010 | 2011 | 2012 | 2013 | 2014 | ||||||||||||||||||||
Accident Year | |||||||||||||||||||||||||||||
2005 | 70.5 | % | 69.6 | % | 67.8 | % | 66.2 | % | 65.2 | % | 64.8 | % | 64.6 | % | 64.6 | % | 64.5 | % | 64.5 | % | |||||||||
2006 | 70.3 | % | 71.0 | % | 68.9 | % | 67.4 | % | 66.8 | % | 66.5 | % | 66.4 | % | 66.3 | % | 66.3 | % | |||||||||||
2007 | 71.9 | % | 72.5 | % | 71.0 | % | 69.8 | % | 69.5 | % | 69.1 | % | 69.0 | % | 68.9 | % | |||||||||||||
2008 | 73.5 | % | 71.9 | % | 69.9 | % | 69.6 | % | 69.4 | % | 69.2 | % | 69.0 | % | |||||||||||||||
2009 | 74.2 | % | 71.0 | % | 71.0 | % | 70.7 | % | 70.4 | % | 70.4 | % | |||||||||||||||||
2010 | 75.1 | % | 76.7 | % | 76.8 | % | 76.9 | % | 76.5 | % | |||||||||||||||||||
2011 | 74.9 | % | 77.3 | % | 77.6 | % | 77.4 | % | |||||||||||||||||||||
2012 | 78.2 | % | 78.7 | % | 79.0 | % | |||||||||||||||||||||||
2013 | 77.9 | % | 77.0 | % | |||||||||||||||||||||||||
2014 | 76.9 | % | |||||||||||||||||||||||||||
14
INFINITY PROPERTY AND CASUALTY CORPORATION 10-K
Management’s Discussion and Analysis of Financial Condition and Results of Operations
The following table summarizes the effect on each calendar year of reserve re-estimates, net of reinsurance, for each of the accident years presented. The total of each column details the amount of reserve re-estimates made in the indicated calendar year and shows the accident years to which the re-estimates are applicable.
Calendar Year Impact of Reserve Development by Accident Year (Favorable) Unfavorable Reserve Development | |||||||||||||||||||||||||||||||||||
($ in millions) | 2006 | 2007 | 2008 | 2009 | 2010 | 2011 | 2012 | 2013 | 2014 | ||||||||||||||||||||||||||
Accident year | |||||||||||||||||||||||||||||||||||
Prior | $ | (23 | ) | $ | (3 | ) | $ | (0 | ) | $ | (12 | ) | $ | (5 | ) | $ | 0 | $ | (1 | ) | $ | 1 | $ | (1 | ) | ||||||||||
2005 | (9 | ) | (17 | ) | (15 | ) | (10 | ) | (4 | ) | (2 | ) | (0 | ) | (1 | ) | 0 | ||||||||||||||||||
2006 | 7 | (21 | ) | (14 | ) | (6 | ) | (3 | ) | (1 | ) | (1 | ) | (1 | ) | ||||||||||||||||||||
2007 | 6 | (16 | ) | (12 | ) | (3 | ) | (4 | ) | (1 | ) | (1 | ) | ||||||||||||||||||||||
2008 | (15 | ) | (19 | ) | (3 | ) | (2 | ) | (2 | ) | (2 | ) | |||||||||||||||||||||||
2009 | (28 | ) | 0 | (3 | ) | (3 | ) | 1 | |||||||||||||||||||||||||||
2010 | 14 | 1 | 0 | (3 | ) | ||||||||||||||||||||||||||||||
2011 | 25 | 3 | (2 | ) | |||||||||||||||||||||||||||||||
2012 | 6 | 2 | |||||||||||||||||||||||||||||||||
2013 | (12 | ) | |||||||||||||||||||||||||||||||||
Total | $ | (31 | ) | $ | (13 | ) | $ | (29 | ) | $ | (65 | ) | $ | (74 | ) | $ | 5 | $ | 16 | $ | 3 | $ | (17 | ) | |||||||||||
Decreases in severity in property damage coverage in California and in both severity and frequency in Florida bodily injury coverage, related to accident year 2013, were the primary sources of the $17.4 million favorable reserve development during the twelve months ended December 31, 2014.
Increases in severities in both bodily injury coverage in California and personal injury protection coverage in Florida related to
accident year 2012 were the primary sources of the $2.9 million unfavorable reserve development during the twelve months ended December 31, 2013.
Increases in severities in both bodily injury coverage in California and personal injury protection coverage in Florida related to
accident year 2011 were the primary sources of the $16.2 million unfavorable reserve development during the twelve months ended December 31, 2012.
Other-than-Temporary Losses on Investments
The determination of whether unrealized losses on investments are “other-than-temporary” requires judgment based on subjective as well as objective factors. We consider the following factors and resources:
• | whether the unrealized loss is credit-driven or a result of changes in market interest rates; |
• | the length of time the security’s market value has been below its cost; |
• | the extent to which fair value is less than cost basis; |
• | the intent to sell the security; |
• | whether it is more likely than not that there will be a requirement to sell the security before its anticipated recovery; |
• | historical operating, balance sheet and cash flow data contained in issuer SEC filings; |
• | issuer news releases; |
• | near-term prospects for improvement in the issuer and/or its industry; |
• | industry research and communications with industry specialists; and |
• | third-party research and credit rating reports. |
15
INFINITY PROPERTY AND CASUALTY CORPORATION 10-K
Management’s Discussion and Analysis of Financial Condition and Results of Operations
We regularly evaluate our investment portfolio for potential impairment by evaluating each security position that has either of the following: a fair value of less than 95% of our book value or an unrealized loss that equals or exceeds $100,000. Since accurately predicting if or when a specific security will become other-than-temporarily impaired is not possible, total impairment charges could be material to the results of operations in a future period.
For fixed maturity securities that are other-than-temporarily impaired, we assess our intent to sell and the likelihood that we will be required to sell the security before recovery of our amortized cost. If a fixed maturity security is considered other-than-temporarily impaired but we do not intend to and will not more than likely be required to sell the security before our recovery to amortized cost, the amount of the impairment is separated into a credit loss component and the amount due to all other factors. The excess of the amortized cost over the present value of the expected cash flows determines the credit loss component of an impairment charge on a fixed maturity security. The present value is determined using the best estimate of cash flows discounted at (1) the effective interest rate implicit at the date of acquisition for non-structured securities or (2) the book yield for structured securities. The techniques and assumptions for determining the best estimate of cash flows vary depending on the type of security. We recognize the credit loss component of an impairment charge in net earnings and the non-credit component in accumulated other comprehensive income. If we intend to sell or will, more likely than not, be required to sell a security, the entire amount of the impairment is treated as a credit loss.
Accruals for Litigation
We continually evaluate potential liabilities and reserves for litigation using the criteria established by the Loss Contingency topic of the FASB Accounting Standards Codification. Under this guidance, we may only record reserves for loss if the likelihood of occurrence is probable and the amount is reasonably estimable. We consider each legal action and record reserves for losses in accordance with this guidance. We believe the current assumptions and other considerations used to estimate potential liability for litigation are appropriate. Certain claims and legal actions have been brought against us for which, under the rules described above, no loss has been accrued. While it is not possible to know with certainty the ultimate outcome of these claims or lawsuits, we do not expect them to have a material effect on our financial condition or liquidity. See Note 13 - Legal and Regulatory Proceedings of the Notes to Consolidated Financial Statements for a discussion of our material Legal Proceedings.
Goodwill
In accordance with the Goodwill topic of the FASB Accounting Standards Codification, we perform impairment test procedures for goodwill on an annual basis. These procedures require us to calculate the fair value of goodwill, compare the result to our carrying value and record the amount of any shortfall as an impairment charge.
We performed this test as of October 1, 2014, using a variety of methods, including estimates of future discounted cash flows and comparisons of our market value to that of our major competitors. Our cash flow projections rely on assumptions that are subject to uncertainty, including premium growth, loss and LAE ratios, interest rates and capital requirements.
The October 1, 2014, test results indicated that the fair value of our goodwill exceeded our carrying value and therefore no impairment charge was required at that date. Additionally, there was no indication of impairment at December 31, 2014.
16
INFINITY PROPERTY AND CASUALTY CORPORATION 10-K
Management’s Discussion and Analysis of Financial Condition and Results of Operations
Liquidity and Capital Resources
Ratios
The National Association of Insurance Commissioners’ (“NAIC”) model law for risk-based capital (“RBC”) provides formulas to determine the amount of capital that an insurance company needs to ensure that it has an acceptable expectation of not becoming financially impaired. At December 31, 2014, the capital ratios of all our insurance subsidiaries exceeded the RBC requirements.
Sources of Funds
We are a holding company and our insurance subsidiaries conduct our operations. Accordingly, we will have continuing cash needs for administrative expenses, the payment of interest on borrowings, shareholder dividends, share repurchases and taxes.
Funds to meet expenditures at the holding company come primarily from dividends from the insurance subsidiaries as well as cash and investments held by the holding company. The ordinary dividend capacity and payment activity of our insurance companies for the two most recent years as well as the dividend capacity for the upcoming year are shown in the following table ($ in thousands):
2015 | 2014 | 2013 | |||||||||
Maximum ordinary dividends available to Infinity | $ | 68,143 | $ | 66,770 | $ | 60,770 | |||||
Dividends paid from subsidiaries to parent | N/A | 60,100 | 125 | ||||||||
As of December 31, 2014, the holding company had $136.6 million of cash and investments. In 2015, our insurance subsidiaries may pay us up to $68.1 million in ordinary dividends without prior regulatory approval. Rating agency capital requirements, among other factors, will be considered when determining the actual amount of dividends paid in 2015.
Our insurance subsidiaries generate liquidity to satisfy their obligations, primarily by collecting and investing premium in advance of paying claims. Our insurance subsidiaries had positive cash flow from operations of approximately $117.9 million in 2014, $145.6 million in 2013 and $175.3 million in 2012. In addition, to satisfy their obligations, our insurance subsidiaries generate cash from maturing securities from their combined $1.4 billion portfolio.
In September 2012 we issued $275 million principal of senior notes due September 2022 (the “5.0% Senior Notes”). The 5.0%
Senior Notes accrue interest at 5.0%, payable semiannually each March and September. The majority of the proceeds from this
issuance were used to redeem the 5.5% senior notes due 2014 (the "5.5% Senior Notes"). On October 17, 2012, we fully redeemed the $195.0 million outstanding principal of 5.5% Senior Notes at a price of 106.729%, or $208.1 million plus accrued interest of $1.8 million. Refer to Note 4 - Long Term Debt of the Notes to Consolidated Financial Statements for more information on our long-term debt.
In August 2014 we renewed our agreement for a $50 million three-year revolving credit facility (the “Credit Agreement”) that
requires us to meet certain financial and other covenants. We are currently in compliance with all covenants under the Credit
Agreement. At December 31, 2014, there were no borrowings outstanding under the Credit Agreement.
In June 2013 we filed a "shelf" registration statement with the Securities and Exchange Commission registering $300.0 million of our securities, which will allow us to sell any combination of senior or subordinated debt securities, common stock, preferred stock, warrants, depositary shares and units in one or more offerings should we choose to do so in the future.
Uses of Funds
In February 2015 we increased our quarterly dividend to $0.43 per share from $0.36 per share. At this current amount, our 2015 annualized dividend payments will be approximately $19.8 million.
Our Board of Directors previously authorized a share and debt repurchase program. On November 4, 2014, our Board of Directors increased the authority to a total of $75 million and extended the date to execute the program from December 31, 2014 to December 31, 2016. During 2014 we repurchased 85,600 shares at an average cost, excluding commissions, of $69.07 per share. As of December 31, 2014, we had $74.1 million of authority remaining under this program.
17
INFINITY PROPERTY AND CASUALTY CORPORATION 10-K
Management’s Discussion and Analysis of Financial Condition and Results of Operations
We believe that cash balances, cash flows generated from operations or borrowings, and maturities and sales of investments are
adequate to meet our future liquidity needs and those of our insurance subsidiaries.
Contractual Obligations
Our contractual obligations and those of our insurance subsidiaries as of December 31, 2014, were ($ in thousands):
Due in: | Long-Term Debt & Interest | Operating Leases | Capital Leases | Loss and LAE Reserves (a) | Post-retirement Benefit Payments (b) | Total | |||||||||||||||||
2015 | $ | 13,750 | $ | 9,200 | $ | 481 | $ | 410,536 | $ | 259 | $ | 434,226 | |||||||||||
2016-2017 | 27,500 | 8,282 | 743 | 193,539 | 599 | 230,663 | |||||||||||||||||
2018-2019 | 27,500 | 4,080 | 458 | 39,732 | 651 | 72,421 | |||||||||||||||||
2020 and after | 316,250 | 375 | 0 | 24,370 | 1,840 | 342,835 | |||||||||||||||||
Total | $ | 385,000 | $ | 21,937 | $ | 1,682 | $ | 668,177 | $ | 3,348 | $ | 1,080,144 | |||||||||||
________________
(a) | We base the payout pattern for reserves for losses and LAE upon historical payment patterns and they do not represent actual contractual obligations. The timing and amounts ultimately paid will vary from these estimates, as discussed above under “Critical Accounting Policies” and in Note 1- Significant Reporting and Accounting Policies of the Notes to Consolidated Financial Statements. |
(b) | The payments for post-retirement benefits do not represent actual contractual obligations. The payments presented represent the best estimate of future contributions. |
18
INFINITY PROPERTY AND CASUALTY CORPORATION 10-K
Management’s Discussion and Analysis of Financial Condition and Results of Operations
Investments
General
Our Investment Committee, which is composed exclusively of independent directors, has approved our investment guidelines. The guidelines specifically address overall investment objectives, permissible assets, prohibited assets, permitted exceptions to the guidelines and credit quality.
We engage three unaffiliated money managers for our fixed income portfolio and we own a Vanguard exchange-traded fund designed to track the FTSE Global All Cap Index for our equity portfolio. The investment managers conduct, in accordance with our investment guidelines, all of our investment purchases and sales. Our Chief Financial Officer and the Investment Committee, at least quarterly, review the performance of the money managers and compliance with our investment guidelines. National banks unaffiliated with the money managers maintain physical custody of securities.
Our consolidated investment portfolio at December 31, 2014, contained $1.4 billion in fixed maturity securities, $94.4 million in equity securities and $0.8 million of short-term investments, all carried at fair value with unrealized gains and losses reported in accumulated other comprehensive income, a separate component of shareholders' equity on an after-tax basis. At December 31, 2014, we had pre-tax net unrealized gains of $19.4 million on fixed maturities and pre-tax net unrealized gains of $16.5 million on equity securities. Combined, the pre-tax net unrealized gain increased by $10.3 million for the twelve months ended December 31, 2014, as a result of decreases in market interest rates during 2014.
Approximately 91.3% of our fixed maturity portfolio at December 31, 2014, was rated “investment grade” (credit rating of AAA to BBB) by nationally recognized rating agencies. The average credit rating of our fixed maturity portfolio was AA- at December 31, 2014. Investment grade securities generally bear lower yields and lower degrees of risk than those that are unrated or non-investment grade. We believe that a high quality investment portfolio is more likely to generate stable and predictable investment returns.
Because we carry all of these securities at fair value in the Consolidated Balance Sheets, there is virtually no effect on liquidity or financial condition upon the sale and ultimate realization of unrealized gains and losses. The average duration of our fixed maturity portfolio was 3.1 years at December 31, 2014.
Fair values of instruments are based on (i) quoted prices in active markets for identical assets (Level 1), (ii) quoted prices for similar instruments in active markets, quoted prices for identical or similar instruments in markets that are not active and model-derived valuations in which all significant inputs are observable in active markets (Level 2) or (iii) valuations derived from valuation techniques in which one or more significant inputs are unobservable in the marketplace (Level 3).
Our Level 1 securities are U.S. Treasury securities, an exchange-traded fund and equity securities held in a rabbi trust. Our Level 2 securities are comprised of securities whose fair value was determined using observable market inputs. Our Level 3 securities are comprised of (i) securities for which there is no active or inactive market for similar instruments, (ii) securities whose fair value is determined based on unobservable inputs and (iii) securities that nationally recognized statistical rating organizations do not rate.
A third party nationally recognized pricing service provides the fair value of securities in Level 2. We periodically review the third party pricing methodologies used by our primary independent pricing service to verify that prices are determined in accordance with fair value guidance in U.S. GAAP, including the use of observable market inputs, and to ensure that assets are properly classified in the fair value hierarchy.
Further, for all Level 2 securities, we compare the market price from the primary independent third party pricing service that is used to value the security with market prices from recent sales activity or, for those securities with no recent sales activity, with prices from another independent third party pricing service or non-binding broker quotes. This comparison is performed in order to determine if the price obtained from the primary independent pricing service is a reasonable price to use in our financial statements. We made no adjustments to the prices obtained from the primary independent pricing service as a result of
this comparison.
19
INFINITY PROPERTY AND CASUALTY CORPORATION 10-K
Management’s Discussion and Analysis of Financial Condition and Results of Operations
Summarized information for our investment portfolio at December 31, 2014 follows ($ in thousands):
Amortized Cost | Fair Value | % of Total Fair Value | ||||||||
Fixed maturities: | ||||||||||
U.S. government | $ | 66,625 | $ | 66,933 | 4.4 | % | ||||
State and municipal | 493,350 | 503,650 | 33.0 | % | ||||||
Mortgage- and asset-backed: | ||||||||||
Residential mortgage-backed securities | 349,371 | 354,528 | 23.2 | % | ||||||
Commercial mortgage-backed securities | 50,914 | 50,838 | 3.3 | % | ||||||
Asset-backed securities ("ABS"): | ||||||||||
Auto loans | 46,550 | 46,566 | 3.0 | % | ||||||
Equipment leases | 6,716 | 6,732 | 0.4 | % | ||||||
Home equity | 505 | 526 | 0.0 | % | ||||||
Credit card receivables | 4,515 | 4,516 | 0.3 | % | ||||||
Tax liens | 150 | 150 | 0.0 | % | ||||||
Student loans | 110 | 117 | 0.0 | % | ||||||
Total ABS | 58,546 | 58,607 | 3.8 | % | ||||||
Total mortgage- and asset-backed | 458,831 | 463,973 | 30.4 | % | ||||||
Corporates | ||||||||||
Investment grade | 268,315 | 272,242 | 17.8 | % | ||||||
Non-investment grade | 125,296 | 125,045 | 8.2 | % | ||||||
Total corporates | 393,611 | 397,286 | 26.0 | % | ||||||
Total fixed maturities | 1,412,417 | 1,431,843 | 93.8 | % | ||||||
Equity securities | 77,862 | 94,408 | 6.2 | % | ||||||
Short-term investments | 803 | 803 | 0.1 | % | ||||||
Total investment portfolio | $ | 1,491,082 | $ | 1,527,054 | 100.0 | % | ||||
The following table presents the returns, gross of investment expenses, of our investment portfolios based on quarterly investment balances as reflected in the financial statements, excluding equities invested in a rabbi trust.
Twelve months ended December 31, | ||||||||
2014 | 2013 | 2012 | ||||||
Return on fixed income securities: | ||||||||
Excluding realized gains and losses | 2.5 | % | 2.7 | % | 3.2 | % | ||
Including realized gains and losses | 2.8 | % | 3.1 | % | 4.0 | % | ||
Return on equity securities: | ||||||||
Excluding realized gains and losses | 3.0 | % | 2.5 | % | 4.0 | % | ||
Including realized gains and losses | 4.7 | % | 3.5 | % | 44.4 | % | ||
Return on all investments: | ||||||||
Excluding realized gains and losses | 2.4 | % | 2.5 | % | 3.1 | % | ||
Including realized gains and losses | 2.7 | % | 2.9 | % | 4.9 | % | ||
Receivable for Securities Sold
The $4.5 million and $2.8 million balances in receivable for securities sold at December 31, 2014, and December 31, 2013, respectively, represent fixed income securities sold in the normal course of business that had not settled prior to the end of their respective years.
20
INFINITY PROPERTY AND CASUALTY CORPORATION 10-K
Management’s Discussion and Analysis of Financial Condition and Results of Operations
Payable for Securities Purchased
The $17.2 million and $39.9 million balances in payable for securities purchased at December 31, 2014, and December 31, 2013, respectively, represent fixed income securities and treasury stock purchased in the normal course of business that had not settled prior to the end of their respective years.
Exposure to Market Risk
Market risk represents the potential economic loss arising from adverse changes in the fair value of financial instruments. Our exposures to market risk relate principally to our investment portfolio, which is exposed primarily to interest rate risk and credit risk and, to a lesser extent, equity price risk.
Changes in market interest rates directly affect the fair value of our fixed maturity portfolio. Generally, the fair value of fixed-income investments moves inversely with movements in market interest rates. Our fixed maturity portfolio is comprised of substantially all fixed rate investments with primarily short-term and intermediate-term maturities. We strive to maintain a "laddered" portfolio, with maturities and prepaid principal spread across the maturity spectrum. This portfolio composition allows flexibility in reacting to fluctuations of interest rates. In addition, higher market rates available for new funds available for investment partially mitigate the risk of loss in fair value. We manage the portfolios of our insurance companies to achieve an adequate risk-adjusted return while maintaining sufficient liquidity to meet policyholder obligations.
Interest Rate Risk
The fair values of our fixed maturity investments fluctuate in response to changes in market interest rates. Increases and decreases in prevailing interest rates generally translate into decreases and increases, respectively, in fair values of those instruments. Additionally, the creditworthiness of the issuer, prepayment options, relative values of alternative investments, the liquidity of the instrument and other general market conditions may affect fair values of interest rate sensitive instruments.
The following table summarizes the estimated effects of hypothetical increases and decreases in interest rates resulting from parallel shifts in market yield curves on our fixed maturity portfolio and long-term debt. We assume that we will realize the effects immediately upon the change in interest rates. The hypothetical changes in market interest rates do not reflect best or worst case scenarios. Variations in market interest rates could produce significant changes in the timing of repayments due to prepayment options available. For these reasons, actual results might differ from those reflected in the table.
($ in thousands) | Sensitivity to Instantaneous Interest Rate Changes (basis points) | ||||||||||||||||||||||||||
(200) | (100) | (50) | — | 50 | 100 | 200 | |||||||||||||||||||||
Fair value of fixed maturity portfolio | $ | 1,509,076 | $ | 1,475,333 | $ | 1,454,149 | $ | 1,431,843 | $ | 1,409,365 | $ | 1,386,874 | $ | 1,341,856 | |||||||||||||
Fair value of long-term debt | 331,336 | 310,420 | 300,547 | 291,044 | 281,894 | 273,083 | 256,427 | ||||||||||||||||||||
The following table provides information about our fixed maturity investments at December 31, 2014, which are sensitive to interest rate risk. The table shows expected principal cash flows by expected maturity date for each of the five subsequent years and collectively for all years thereafter. Callable bonds and notes are included based on call date or maturity date depending upon which date produces the most conservative yield. MBS and sinking fund issues are included based on maturity year adjusted for expected payment patterns.
21
INFINITY PROPERTY AND CASUALTY CORPORATION 10-K
Management’s Discussion and Analysis of Financial Condition and Results of Operations
($ in thousands) | Expected Principal Cash Flows | ||||||||||||
MBS and ABS only | Excluding MBS and ABS | Total | Maturing Book Yield | ||||||||||
For the twelve months ending December 31, | |||||||||||||
2015 | $ | 72,387 | $ | 132,879 | $ | 205,267 | 2.4 | ||||||
2016 | 79,929 | 152,842 | 232,771 | 2.3 | |||||||||
2017 | 71,268 | 201,648 | 272,916 | 2.2 | |||||||||
2018 | 42,295 | 103,511 | 145,806 | 2.6 | |||||||||
2019 | 29,729 | 111,355 | 141,085 | 2.6 | |||||||||
Thereafter | 145,486 | 195,787 | 341,273 | 3.1 | |||||||||
Total | $ | 441,095 | $ | 898,023 | $ | 1,339,118 | 2.6 | ||||||
The cash flows presented take into consideration historical relationships of market yields and prepayment rates. However, the actual prepayment rate may differ from historical trends resulting in actual principal cash flows that differ from those presented above.
Credit Risk
We manage credit risk by diversifying our portfolio to avoid concentrations in any single industry group or issuer and by limiting investments in securities with lower credit ratings. The largest investment in any one fixed income security, excluding U.S. government securities, is $9.1 million or 0.6% of the fixed income investment portfolio. The top five investments in fixed income securities, excluding those issued by the U.S. government, make up 2.4% of the fixed income portfolio. The fair value of non-performing fixed maturities, securities that have not produced their stated rate of investment income during the previous twelve months, was $0.1 million, less than 0.1% of the $1.4 billion fixed portfolio as of December 31, 2014.
We categorize securities by rating based upon ratings issued by Moody's, Standard & Poor's or Fitch, where available. If all three ratings are available but not equivalent, we exclude the lowest rating and the lower of the remaining ratings is used. If ratings are only available from two agencies, the lowest is used. This methodology is consistent with that used by the major bond indices. State and municipal bond ratings presented are underlying ratings without regard to any insurance.
The following table presents the credit rating and fair value ($ in thousands) of our fixed maturity portfolio by major security type:
Rating | ||||||||||||||||||||||||||
AAA | AA | A | BBB | Non- investment Grade | Total Fair Value | % of Total Exposure | ||||||||||||||||||||
U.S. government | $ | 66,933 | $ | 0 | $ | 0 | $ | 0 | $ | 0 | $ | 66,933 | 4.7 | % | ||||||||||||
State and municipal | 110,333 | 290,145 | 103,172 | 0 | 0 | 503,650 | 35.2 | % | ||||||||||||||||||
Mortgage- and asset-backed | 424,676 | 35,042 | 4,255 | 0 | 0 | 463,973 | 32.4 | % | ||||||||||||||||||
Corporates | 0 | 17,717 | 124,140 | 130,384 | 125,045 | 397,286 | 27.7 | % | ||||||||||||||||||
Total fair value | $ | 601,942 | $ | 342,904 | $ | 231,568 | $ | 130,384 | $ | 125,045 | $ | 1,431,843 | 100.0 | % | ||||||||||||
% of total fair value | 42.0 | % | 23.9 | % | 16.2 | % | 9.1 | % | 8.7 | % | 100.0 | % | ||||||||||||||
22
INFINITY PROPERTY AND CASUALTY CORPORATION 10-K
Management’s Discussion and Analysis of Financial Condition and Results of Operations
The following table presents the credit rating and fair value of our residential mortgage-backed securities at December 31, 2014, by deal origination year ($ in thousands):
Rating | ||||||||||||||||||||||||||
Deal Origination Year | AAA | AA | A | BBB | Non- investment Grade | Total Fair Value | % of Total Exposure | |||||||||||||||||||
2002 | $ | 98 | $ | 0 | $ | 0 | $ | 0 | $ | 0 | $ | 98 | 0.0 | % | ||||||||||||
2003 | 3,079 | 0 | 0 | 0 | 0 | 3,079 | 0.9 | % | ||||||||||||||||||
2004 | 2,906 | 0 | 0 | 0 | 0 | 2,906 | 0.8 | % | ||||||||||||||||||
2005 | 9,072 | 0 | 0 | 0 | 0 | 9,072 | 2.6 | % | ||||||||||||||||||
2006 | 2,907 | 0 | 0 | 0 | 0 | 2,907 | 0.8 | % | ||||||||||||||||||
2007 | 5,919 | 0 | 0 | 0 | 0 | 5,919 | 1.7 | % | ||||||||||||||||||
2008 | 7,888 | 0 | 0 | 0 | 0 | 7,888 | 2.2 | % | ||||||||||||||||||
2009 | 28,335 | 0 | 0 | 0 | 0 | 28,335 | 8.0 | % | ||||||||||||||||||
2010 | 42,442 | 0 | 0 | 0 | 0 | 42,442 | 12.0 | % | ||||||||||||||||||
2011 | 39,977 | 0 | 0 | 0 | 0 | 39,977 | 11.3 | % | ||||||||||||||||||
2012 | 76,743 | 0 | 0 | 0 | 0 | 76,743 | 21.6 | % | ||||||||||||||||||
2013 | 79,017 | 0 | 0 | 0 | 0 | 79,017 | 22.3 | % | ||||||||||||||||||
2014 | 56,145 | 0 | 0 | 0 | 0 | 56,145 | 15.8 | % | ||||||||||||||||||
Total fair value | $ | 354,528 | $ | 0 | $ | 0 | $ | 0 | $ | 0 | $ | 354,528 | 100.0 | % | ||||||||||||
% of total fair value | 100.0 | % | 0.0 | % | 0.0 | % | 0.0 | % | 0.0 | % | 100.0 | % | ||||||||||||||
All of the $354.5 million of residential mortgage-backed securities were issued by government-sponsored enterprises (“GSE”) or by Government National Mortgage Association ("GNMA").
The following table presents the credit rating and fair value of our commercial mortgage-backed securities at December 31, 2014, by deal origination year ($ in thousands):
Rating | ||||||||||||||||||||||||||
Deal Origination Year | AAA | AA | A | BBB | Non-investment Grade | Total Fair Value | % of Total Exposure | |||||||||||||||||||
2005 | 3,301 | 0 | 0 | 0 | 0 | 3,301 | 6.5 | % | ||||||||||||||||||
2006 | 14,087 | 0 | 0 | 0 | 0 | 14,087 | 27.7 | % | ||||||||||||||||||
2007 | 10,683 | 8,200 | 0 | 0 | 0 | 18,883 | 37.1 | % | ||||||||||||||||||
2008 | 0 | 665 | 0 | 0 | 0 | 665 | 1.3 | % | ||||||||||||||||||
2010 | 3,667 | 0 | 0 | 0 | 0 | 3,667 | 7.2 | % | ||||||||||||||||||
2011 | 1,223 | 0 | 0 | 0 | 0 | 1,223 | 2.4 | % | ||||||||||||||||||
2012 | 4,060 | 0 | 0 | 0 | 0 | 4,060 | 8.0 | % | ||||||||||||||||||
2013 | 1,433 | 0 | 0 | 0 | 0 | 1,433 | 2.8 | % | ||||||||||||||||||
2014 | 3,518 | 0 | 0 | 0 | 0 | 3,518 | 6.9 | % | ||||||||||||||||||
Total fair value | $ | 41,972 | $ | 8,866 | $ | 0 | $ | 0 | $ | 0 | $ | 50,838 | 100.0 | % | ||||||||||||
% of total fair value | 82.6 | % | 17.4 | % | 0.0 | % | 0.0 | % | 0.0 | % | 100.0 | % | ||||||||||||||
None of the $50.8 million of commercial mortgage-backed securities were issued by GSEs.
23
INFINITY PROPERTY AND CASUALTY CORPORATION 10-K
Management’s Discussion and Analysis of Financial Condition and Results of Operations
The following table presents the credit rating and fair value of our ABS portfolio at December 31, 2014 by deal origination
year ($ in thousands):
Rating | ||||||||||||||||||||||||||
Deal Origination Year | AAA | AA | A | BBB | Non-investment Grade | Total Fair Value | % of Total Exposure | |||||||||||||||||||
2001 | $ | 83 | $ | 0 | $ | 0 | $ | 0 | $ | 0 | $ | 83 | 0.1 | % | ||||||||||||
2003 | 443 | 0 | 0 | 0 | 0 | 443 | 0.8 | % | ||||||||||||||||||
2011 | 204 | 136 | 0 | 0 | 0 | 340 | 0.6 | % | ||||||||||||||||||
2012 | 8,150 | 5,873 | 241 | 0 | 0 | 14,264 | 24.3 | % | ||||||||||||||||||
2013 | 14,664 | 11,826 | 2,043 | 0 | 0 | 28,534 | 48.7 | % | ||||||||||||||||||
2014 | 4,631 | 8,341 | 1,971 | 0 | 0 | 14,943 | 25.5 | % | ||||||||||||||||||
Total fair value | $ | 28,176 | $ | 26,176 | $ | 4,255 | $ | 0 | $ | 0 | $ | 58,607 | 100.0 | % | ||||||||||||
% of total fair value | 48.1 | % | 44.7 | % | 7.3 | % | 0.0 | % | 0.0 | % | 100.0 | % | ||||||||||||||
The following table presents the credit rating and fair value of our state and municipal bond portfolio, by state, at
December 31, 2014 ($ in thousands):
Rating | ||||||||||||||||||||||||||
State | AAA | AA | A | BBB | Non- investment Grade | Total Fair Value | % of Total Exposure | |||||||||||||||||||
NY | $ | 3,835 | $ | 49,299 | $ | 16,842 | $ | 0 | $ | 0 | $ | 69,976 | 13.9 | % | ||||||||||||
CA | 4,323 | 27,730 | 5,839 | 0 | 0 | 37,893 | 7.5 | % | ||||||||||||||||||
TX | 15,118 | 13,021 | 5,611 | 0 | 0 | 33,750 | 6.7 | % | ||||||||||||||||||
GA | 12,971 | 1,106 | 11,913 | 0 | 0 | 25,990 | 5.2 | % | ||||||||||||||||||
MD | 16,871 | 7,156 | 0 | 0 | 0 | 24,027 | 4.8 | % | ||||||||||||||||||
WA | 737 | 21,582 | 1,671 | 0 | 0 | 23,990 | 4.8 | % | ||||||||||||||||||
PA | 0 | 12,998 | 8,098 | 0 | 0 | 21,097 | 4.2 | % | ||||||||||||||||||
NC | 8,258 | 10,151 | 0 | 0 | 0 | 18,409 | 3.7 | % | ||||||||||||||||||
NJ | 1,693 | 1,096 | 15,366 | 0 | 0 | 18,155 | 3.6 | % | ||||||||||||||||||
VA | 7,694 | 9,728 | 0 | 0 | 0 | 17,422 | 3.5 | % | ||||||||||||||||||
All other states | 38,833 | 136,278 | 37,831 | 0 | 0 | 212,942 | 42.3 | % | ||||||||||||||||||
Total fair value | $ | 110,333 | $ | 290,145 | $ | 103,172 | $ | 0 | $ | 0 | $ | 503,650 | 100.0 | % | ||||||||||||
% of total fair value | 21.9 | % | 57.6 | % | 20.5 | % | 0.0 | % | 0.0 | % | 100.0 | % | ||||||||||||||
24
INFINITY PROPERTY AND CASUALTY CORPORATION 10-K
Management’s Discussion and Analysis of Financial Condition and Results of Operations
The following table presents the fair value of our state and municipal bond portfolio, by state and type of bond, at December 31, 2014 ($ in thousands):
Type | ||||||||||||||||||||||||||
General Obligation | ||||||||||||||||||||||||||
State | State | Local | Revenue | Certificate Participation | Other | Total Fair Value | % of Total Exposure | |||||||||||||||||||
NY | $ | 7,559 | $ | 8,342 | $ | 54,075 | $ | 0 | $ | 0 | $ | 69,976 | 13.9 | % | ||||||||||||
CA | 7,818 | 14,278 | 15,796 | 0 | 0 | 37,893 | 7.5 | % | ||||||||||||||||||
TX | 1,416 | 14,961 | 17,373 | 0 | 0 | 33,750 | 6.7 | % | ||||||||||||||||||
GA | 12,971 | 1,106 | 11,913 | 0 | 0 | 25,990 | 5.2 | % | ||||||||||||||||||
MD | 5,219 | 15,895 | 2,913 | 0 | 0 | 24,027 | 4.8 | % | ||||||||||||||||||
WA | 5,620 | 2,976 | 15,394 | 0 | 0 | 23,990 | 4.8 | % | ||||||||||||||||||
PA | 7,861 | 779 | 12,457 | 0 | 0 | 21,097 | 4.2 | % | ||||||||||||||||||
NC | 1,020 | 3,191 | 14,199 | 0 | 0 | 18,409 | 3.7 | % | ||||||||||||||||||
NJ | 3,583 | 0 | 14,573 | 0 | 0 | 18,155 | 3.6 | % | ||||||||||||||||||
VA | 1,016 | 6,578 | 9,829 | 0 | 0 | 17,422 | 3.5 | % | ||||||||||||||||||
All other states | 50,918 | 25,311 | 130,289 | 4,504 | 1,920 | 212,942 | 42.3 | % | ||||||||||||||||||
Total fair value | $ | 105,000 | $ | 93,416 | $ | 298,810 | $ | 4,504 | $ | 1,920 | $ | 503,650 | 100.0 | % | ||||||||||||
% of total fair value | 20.8 | % | 18.5 | % | 59.3 | % | 0.9 | % | 0.4 | % | 100.0 | % | ||||||||||||||
The following table presents the fair value of the revenue category of our state and municipal bond portfolio, by state and further classification, at December 31, 2014 ($ in thousands):
Revenue Bonds | ||||||||||||||||||||||
State | Transportation | Utilities | Education | Other | Total Fair Value | % of Total Exposure | ||||||||||||||||
NY | $ | 27,011 | $ | 0 | $ | 5,975 | $ | 21,089 | $ | 54,075 | 18.1 | % | ||||||||||
TX | 3,540 | 2,892 | 4,021 | 6,920 | 17,373 | 5.8 | % | |||||||||||||||
CA | 8,064 | 5,600 | 0 | 2,131 | 15,796 | 5.3 | % | |||||||||||||||
WA | 0 | 11,951 | 0 | 3,443 | 15,394 | 5.2 | % | |||||||||||||||
NJ | 1,982 | 0 | 4,527 | 8,064 | 14,573 | 4.9 | % | |||||||||||||||
CO | 0 | 0 | 9,134 | 5,209 | 14,343 | 4.8 | % | |||||||||||||||
NC | 0 | 4,048 | 0 | 10,151 | 14,199 | 4.8 | % | |||||||||||||||
PA | 8,098 | 0 | 2,756 | 1,603 | 12,457 | 4.2 | % | |||||||||||||||
GA | 6,492 | 4,321 | 0 | 1,100 | 11,913 | 4.0 | % | |||||||||||||||
MN | 0 | 2,072 | 0 | 9,746 | 11,817 | 4.0 | % | |||||||||||||||
All other states | 19,153 | 12,298 | 19,181 | 66,239 | 116,871 | 39.1 | % | |||||||||||||||
Total fair value | $ | 74,340 | $ | 43,181 | $ | 45,593 | $ | 135,696 | $ | 298,810 | 100.0 | % | ||||||||||
% of total fair value | 24.9 | % | 14.5 | % | 15.3 | % | 45.4 | % | 100.0 | % | ||||||||||||
25
INFINITY PROPERTY AND CASUALTY CORPORATION 10-K
Management’s Discussion and Analysis of Financial Condition and Results of Operations
The following table presents the fair value of our corporate bond portfolio, by industry sector and rating of bond, at
December 31, 2014 ($ in thousands):
Rating | ||||||||||||||||||||||||||
Industry Sector | AAA | AA | A | BBB | Non- investment Grade | Total Fair Value | % of Total Exposure | |||||||||||||||||||
Financial | $ | 0 | $ | 14,003 | $ | 81,947 | $ | 42,513 | $ | 9,308 | $ | 147,771 | 37.2 | % | ||||||||||||
Consumer, Non-cyclical | 0 | 2,049 | 20,243 | 19,467 | 26,552 | 68,311 | 17.2 | % | ||||||||||||||||||
Communications | 0 | 0 | 2,725 | 22,287 | 21,864 | 46,875 | 11.8 | % | ||||||||||||||||||
Consumer, Cyclical | 0 | 0 | 6,635 | 9,622 | 20,992 | 37,249 | 9.4 | % | ||||||||||||||||||
Energy | 0 | 1,665 | 5,877 | 10,820 | 17,163 | 35,524 | 8.9 | % | ||||||||||||||||||
Industrial | 0 | 0 | 0 | 7,929 | 11,785 | 19,713 | 5.0 | % | ||||||||||||||||||
Utilities | 0 | 0 | 2,756 | 9,249 | 4,243 | 16,248 | 4.1 | % | ||||||||||||||||||
Technology | 0 | 0 | 1,719 | 3,261 | 9,005 | 13,985 | 3.5 | % | ||||||||||||||||||
Basic Materials | 0 | 0 | 578 | 5,237 | 4,133 | 9,949 | 2.5 | % | ||||||||||||||||||
Diversified | 0 | 0 | 1,661 | 0 | 0 | 1,661 | 0.4 | % | ||||||||||||||||||
Total fair value | $ | 0 | $ | 17,717 | $ | 124,140 | $ | 130,384 | $ | 125,045 | $ | 397,286 | 100.0 | % | ||||||||||||
% of total fair value | 0.0 | % | 4.5 | % | 31.3 | % | 32.8 | % | 31.5 | % | 100.0 | % | ||||||||||||||
The average credit rating of our non-investment grade bonds is BB- and we have none that are rated below B-.
Included in our investments in corporate fixed income securities at December 31, 2014 are $46.5 million of dollar-denominated
investments with issues or guarantors in foreign countries, as follows ($ in thousands):
Rating | ||||||||||||||||||||||||||
Issuer or Guarantor | AAA | AA | A | BBB | Non- investment Grade | Total Fair Value | % of Total Exposure | |||||||||||||||||||
Britain | $ | 0 | $ | 4,405 | $ | 12,602 | $ | 0 | $ | 0 | $ | 17,007 | 36.6 | % | ||||||||||||
Switzerland | 0 | 0 | 5,739 | 0 | 0 | 5,739 | 12.3 | % | ||||||||||||||||||
Australia | 0 | 1,674 | 3,931 | 0 | 0 | 5,605 | 12.1 | % | ||||||||||||||||||
Canada | 0 | 3,410 | 1,718 | 0 | 398 | 5,526 | 11.9 | % | ||||||||||||||||||
France | 0 | 2,049 | 2,674 | 0 | 0 | 4,723 | 10.2 | % | ||||||||||||||||||
Japan | 0 | 0 | 2,625 | 0 | 0 | 2,625 | 5.6 | % | ||||||||||||||||||
Cayman Islands | 0 | 0 | 1,661 | 0 | 279 | 1,940 | 4.2 | % | ||||||||||||||||||
Sweden | 0 | 1,667 | 0 | 0 | 0 | 1,667 | 3.6 | % | ||||||||||||||||||
Norway | 0 | 1,665 | 0 | 0 | 0 | 1,665 | 3.6 | % | ||||||||||||||||||
Total fair value | $ | 0 | $ | 14,871 | $ | 30,950 | $ | 0 | $ | 677 | $ | 46,498 | 100.0 | % | ||||||||||||
% of total fair value | 0.0 | % | 32.0 | % | 66.6 | % | 0.0 | % | 1.5 | % | 100.0 | % | ||||||||||||||
We do not own any investments that are denominated in a currency other than the U.S. dollar.
Equity Price Risk
Equity price risk is the potential economic loss from adverse changes in equity security prices. Our exposure to equity price risk is limited, as our equity investments comprise only 6.2% of our total investment portfolio. At December 31, 2014, the fair value of our equity portfolio was $94.4 million.
26
INFINITY PROPERTY AND CASUALTY CORPORATION 10-K
Management’s Discussion and Analysis of Financial Condition and Results of Operations
Results of Operations
Underwriting
Premium
Our net earned premium was as follows ($ in thousands):
Twelve months ended December 31, | ||||||||||||||
2014 | 2013 | Change | % Change | |||||||||||
Net earned premium | ||||||||||||||
Gross written premium | ||||||||||||||
Personal Auto: | ||||||||||||||
Focus States | $ | 1,150,825 | $ | 1,108,478 | $ | 42,348 | 3.8 | % | ||||||
Other States | 86,949 | 132,735 | (45,787 | ) | (34.5 | )% | ||||||||
Total Personal Auto | 1,237,774 | 1,241,213 | (3,439 | ) | (0.3 | )% | ||||||||
Commercial Vehicle | 108,640 | 85,301 | 23,339 | 27.4 | % | |||||||||
Classic Collector | 14,456 | 13,305 | 1,151 | 8.6 | % | |||||||||
Total gross written premium | 1,360,870 | 1,339,819 | 21,051 | 1.6 | % | |||||||||
Ceded reinsurance | (13,266 | ) | (9,927 | ) | (3,339 | ) | 33.6 | % | ||||||
Net written premium | 1,347,604 | 1,329,892 | 17,712 | 1.3 | % | |||||||||
Change in unearned premium | (21,669 | ) | (27,367 | ) | 5,698 | (20.8 | )% | |||||||
Net earned premium | $ | 1,325,935 | $ | 1,302,525 | $ | 23,410 | 1.8 | % | ||||||
Twelve months ended December 31, | ||||||||||||||
2013 | 2012 | Change | % Change | |||||||||||
Net earned premium | ||||||||||||||
Gross written premium | ||||||||||||||
Personal Auto: | ||||||||||||||
Focus States | $ | 1,108,478 | $ | 998,234 | $ | 110,243 | 11.0 | % | ||||||
Other States | 132,735 | 167,698 | (34,963 | ) | (20.8 | )% | ||||||||
Total Personal Auto | 1,241,213 | 1,165,932 | 75,280 | 6.5 | % | |||||||||
Commercial Vehicle | 85,301 | 76,618 | 8,682 | 11.3 | % | |||||||||
Classic Collector | 13,305 | 12,379 | 927 | 7.5 | % | |||||||||
Other | 0 | (1 | ) | 1 | (100.0 | )% | ||||||||
Total gross written premium | 1,339,819 | 1,254,929 | 84,890 | 6.8 | % | |||||||||
Ceded reinsurance | (9,927 | ) | (7,731 | ) | (2,196 | ) | 28.4 | % | ||||||
Net written premium | 1,329,892 | 1,247,198 | 82,694 | 6.6 | % | |||||||||
Change in unearned premium | (27,367 | ) | (63,108 | ) | 35,741 | (56.6 | )% | |||||||
Net earned premium | $ | 1,302,525 | $ | 1,184,090 | $ | 118,435 | 10.0 | % | ||||||
27
INFINITY PROPERTY AND CASUALTY CORPORATION 10-K
Management’s Discussion and Analysis of Financial Condition and Results of Operations
The following table shows our policies in force:
Twelve months ended December 31, | |||||||||||
2014 | 2013 | Change | % Change | ||||||||
Policies in Force | |||||||||||
Personal Auto | |||||||||||
Focus States | 749,983 | 768,373 | (18,390 | ) | (2.4 | )% | |||||
Other States | 51,041 | 78,674 | (27,633 | ) | (35.1 | )% | |||||
Total Personal Auto | 801,024 | 847,047 | (46,023 | ) | (5.4 | )% | |||||
Commercial Vehicle | 44,772 | 40,183 | 4,589 | 11.4 | % | ||||||
Classic Collector | 40,825 | 39,179 | 1,646 | 4.2 | % | ||||||
Total policies in force | 886,621 | 926,409 | (39,788 | ) | (4.3 | )% | |||||
Twelve months ended December 31, | |||||||||||
2013 | 2012 | Change | % Change | ||||||||
Policies in Force | |||||||||||
Personal Auto | |||||||||||
Focus States | 768,373 | 770,212 | (1,839 | ) | (0.2 | )% | |||||
Other States | 78,674 | 117,403 | (38,729 | ) | (33.0 | )% | |||||
Total Personal Auto | 847,047 | 887,615 | (40,568 | ) | (4.6 | )% | |||||
Commercial Vehicle | 40,183 | 39,621 | 562 | 1.4 | % | ||||||
Classic Collector | 39,179 | 38,235 | 944 | 2.5 | % | ||||||
Total policies in force | 926,409 | 965,471 | (39,062 | ) | (4.0 | )% | |||||
2014 compared to 2013
Gross written premium grew 1.6% during 2014. We implemented rate revisions in various states with an overall rate increase of 6.4% during the year. Excluding the effect of rate changes in California and Florida, our largest states, the overall rate increase was 5.7%. Policies in force at December 31, 2014, declined 4.3% compared with 2013. Gross written premium grew despite the decline in policies in force due to growth in Florida, which has a higher average premium per policy than our other states.
During 2014 personal auto insurance gross written premium in our Focus States grew 3.8% when compared with 2013. The increase in gross written premium is primarily due to growth in California and Florida, which grew a combined 3.8% during 2014 as a result of higher average premium in both states, renewal business growth in California and new business growth in Florida.
The growth in the Focus States during 2014 was partially offset by declining gross written premium in the Other States as we took actions to improve profitability in those states, which resulted in a decline in written premium. Upon management's strategic review in late 2014, as of January 1, 2015, we no longer write new business in Georgia, Nevada, and Pennsylvania, previously included in "Focus States", and maintain renewal business only in these states.
Our Commercial Vehicle gross written premium grew 27.4% during the twelve months ended December 31, 2014. This growth was primarily due to higher average premium and new business growth.
Gross written premium in our Classic Collector product grew 8.6% during 2014. This growth was primarily due to growth in renewal business. As we narrow our focus in 2015, we will look for strategic alternatives for our Classic Collector book of business.
2013 compared to 2012
Gross written premium grew 6.8% during 2013. We implemented rate revisions in various states with an overall rate increase of 6.9% during the year. Excluding the effect of rate changes in California and Florida, our largest states, the overall rate increase was 10.7%. Policies in force at December 31, 2013, declined 4.0% compared with 2012. Gross written premium grew
28
INFINITY PROPERTY AND CASUALTY CORPORATION 10-K
Management’s Discussion and Analysis of Financial Condition and Results of Operations
despite the decline in policies in force due to a shift in overall business mix toward policies offering broader coverage and higher average premium as well as growth in Florida business, which has a higher average premium per policy than our other states.
During 2013 personal auto insurance gross written premium in our Focus States grew 11.0% when compared with 2012. The increase in gross written premium was primarily due to growth in California and Florida, which grew a combined 14.6% during 2013 as a result of higher average premium and renewal business growth in both states. The growth in California and Florida was partially offset by declines in Texas and Arizona. We raised rates and tightened underwriting restrictions in these states in order to improve profitability.
Our Commercial Vehicle gross written premium grew 11.3% during the twelve months ended December 31, 2013. This growth was primarily due to higher average premium and renewal business growth for this product.
Gross written premium in our Classic Collector product grew 7.5% during 2013. This growth was primarily due to growth in renewal business.
Profitability
A key operating performance measure of insurance companies is underwriting profitability, as opposed to overall profitability
or net earnings. We measure underwriting profitability by the combined ratio. When the combined ratio is under 100%, we
consider underwriting results profitable; when the ratio is over 100%, we consider underwriting results unprofitable. The
combined ratio does not reflect investment income, other income, interest expense, corporate general and administrative
expenses, other expenses or federal income taxes.
While we report financial results in accordance with GAAP for shareholder and other users’ purposes, we report it on a
statutory basis for insurance regulatory purposes. We evaluate underwriting profitability based on a combined ratio calculated
using statutory accounting principles. The statutory combined ratio represents the sum of the following ratios: (i) losses and
LAE incurred as a percentage of net earned premium and (ii) underwriting expenses incurred, net of fees, as a percentage of net
written premium. Certain expenses are treated differently under statutory and GAAP accounting principles. Under GAAP,
commissions, premium taxes and other variable costs incurred in connection with successfully writing new and renewal business are capitalized as deferred policy acquisition costs and amortized on a pro rata basis over the period in which the related premium is earned. On a statutory basis, these items are expensed as incurred. Additionally, bad debt charge-offs on agent balances and premium receivables are included only in the GAAP combined ratios.
The following table presents the statutory and GAAP combined ratios:
Twelve months ended December 31, | ||||||||||||||||||||||||||
2014 | 2013 | % Point Change | ||||||||||||||||||||||||
Loss & LAE Ratio | Underwriting Ratio | Combined Ratio | Loss & LAE Ratio | Underwriting Ratio | Combined Ratio | Loss & LAE Ratio | Underwriting Ratio | Combined Ratio | ||||||||||||||||||
Personal Auto: | ||||||||||||||||||||||||||
Focus States | 77.0 | % | 17.8 | % | 94.8 | % | 78.2 | % | 17.7 | % | 96.0 | % | (1.2 | )% | 0.1 | % | (1.2 | )% | ||||||||
Other States | 74.3 | % | 17.3 | % | 91.6 | % | 80.9 | % | 17.1 | % | 98.0 | % | (6.6 | )% | 0.2 | % | (6.4 | )% | ||||||||
Total Personal Auto | 76.8 | % | 17.8 | % | 94.5 | % | 78.6 | % | 17.7 | % | 96.2 | % | (1.8 | )% | 0.1 | % | (1.7 | )% | ||||||||
Commercial Vehicle | 63.7 | % | 17.4 | % | 81.1 | % | 75.8 | % | 16.7 | % | 92.4 | % | (12.1 | )% | 0.7 | % | (11.3 | )% | ||||||||
Classic Collector | 62.7 | % | 32.5 | % | 95.2 | % | 54.7 | % | 36.6 | % | 91.4 | % | 8.0 | % | (4.1 | )% | 3.8 | % | ||||||||
Total statutory ratios | 75.7 | % | 17.9 | % | 93.6 | % | 78.2 | % | 17.8 | % | 96.0 | % | (2.5 | )% | 0.1 | % | (2.4 | )% | ||||||||
Total statutory ratios excluding development | 77.0 | % | 17.9 | % | 94.9 | % | 78.0 | % | 17.8 | % | 95.8 | % | (1.0 | )% | 0.1 | % | (0.9 | )% | ||||||||
GAAP ratios | 75.5 | % | 19.6 | % | 95.1 | % | 78.1 | % | 19.9 | % | 98.0 | % | (2.6 | )% | (0.3 | )% | (2.9 | )% | ||||||||
GAAP ratios excluding development | 76.9 | % | 19.6 | % | 96.4 | % | 77.9 | % | 19.9 | % | 97.7 | % | (1.0 | )% | (0.3 | )% | (1.3 | )% | ||||||||
29
INFINITY PROPERTY AND CASUALTY CORPORATION 10-K
Management’s Discussion and Analysis of Financial Condition and Results of Operations
Twelve months ended December 31, | |||||||||||||||||||||||||||
2013 | 2012 | % Point Change | |||||||||||||||||||||||||
Loss & LAE Ratio | Underwriting Ratio | Combined Ratio | Loss & LAE Ratio | Underwriting Ratio | Combined Ratio | Loss & LAE Ratio | Underwriting Ratio | Combined Ratio | |||||||||||||||||||
Personal Auto: | |||||||||||||||||||||||||||
Focus States | 78.2 | % | 17.7 | % | 96.0 | % | 79.1 | % | 18.4 | % | 97.4 | % | (0.8 | )% | (0.6 | )% | (1.4 | )% | |||||||||
Other States | 80.9 | % | 17.1 | % | 98.0 | % | 86.4 | % | 18.2 | % | 104.6 | % | (5.5 | )% | (1.1 | )% | (6.6 | )% | |||||||||
Total Personal Auto | 78.6 | % | 17.7 | % | 96.2 | % | 80.2 | % | 18.3 | % | 98.5 | % | (1.6 | )% | (0.7 | )% | (2.3 | )% | |||||||||
Commercial Vehicle | 75.8 | % | 16.7 | % | 92.4 | % | 70.8 | % | 17.9 | % | 88.7 | % | 5.0 | % | (1.2 | )% | 3.7 | % | |||||||||
Classic Collector | 54.7 | % | 36.6 | % | 91.4 | % | 78.7 | % | 38.4 | % | 117.0 | % | (23.9 | )% | (1.7 | )% | (25.6 | )% | |||||||||
Total statutory ratios | 78.2 | % | 17.8 | % | 96.0 | % | 79.7 | % | 18.6 | % | 98.3 | % | (1.5 | )% | (0.8 | )% | (2.2 | )% | |||||||||
Total statutory ratios excluding development | 78.0 | % | 17.8 | % | 95.8 | % | 78.3 | % | 18.6 | % | 96.9 | % | (0.3 | )% | (0.8 | )% | (1.1 | )% | |||||||||
GAAP ratios | 78.1 | % | 19.9 | % | 98.0 | % | 79.6 | % | 21.1 | % | 100.7 | % | (1.5 | )% | (1.2 | )% | (2.7 | )% | |||||||||
GAAP ratios excluding development | 77.9 | % | 19.9 | % | 97.7 | % | 78.2 | % | 21.1 | % | 99.3 | % | (0.3 | )% | (1.2 | )% | (1.6 | )% | |||||||||
In evaluating the profit performance of our business, we review underwriting profitability using statutory combined ratios. Accordingly, the discussion of underwriting results that follows will focus on these ratios and the components thereof, unless otherwise indicated.
2014 compared to 2013
The statutory combined ratio for the twelve months ended December 31, 2014, decreased by 2.4 points from the same period of 2013. The twelve months ended December 31, 2014, included $17.4 million of favorable development on prior year loss and LAE reserves compared to $2.9 million of unfavorable development on prior year loss and LAE reserves in 2013. Excluding the effect of development from both periods, the statutory combined ratio decreased by 0.9 points for the twelve months ended December 31, 2014, compared to 2013.
The GAAP combined ratio for the twelve months ended December 31, 2014, decreased by 2.9 points compared to 2013. Excluding the effect of development from both periods, the GAAP combined ratio decreased by 1.3 points for the twelve months ended December 31, 2014, compared to 2013.
Losses from catastrophes were $2.5 million for the twelve months ended December 31, 2014, compared to $1.8 million for 2013.
The combined ratio in the Focus States decreased by 1.2 points for the twelve months ended December 31, 2014. The decline was primarily due to improvement in the California calendar year loss ratio as a result of favorable development from prior accident year loss and LAE reserves as well as an increase in average earned premium.
The combined ratio in the Other States decreased by 6.4 points for the twelve months ended December 31, 2014, primarily due to the fact that the business in Georgia, Nevada and Pennsylvania is primarily renewal business, which has a lower combined ratio. Earned premium and losses in these states are expected to continue to decline as we focus on renewal business only.
The combined ratio for the Commercial Vehicle product decreased by 11.3 points during the twelve months ended December 31, 2014, primarily due to favorable development on loss and LAE reserves.
2013 compared to 2012
The statutory combined ratio for the twelve months ended December 31, 2013, decreased by 2.2 points from the same period of 2012. The twelve months ended December 31, 2013, included $2.9 million of unfavorable development on prior year loss and LAE reserves compared to $16.2 million of unfavorable development on prior year loss and LAE reserves in 2012. Excluding the effect of development from both periods, the statutory combined ratio decreased by 1.1 points for the twelve months ended December 31, 2013, compared to 2012.
30
INFINITY PROPERTY AND CASUALTY CORPORATION 10-K
Management’s Discussion and Analysis of Financial Condition and Results of Operations
The GAAP combined ratio for the twelve months ended December 31, 2013, decreased by 2.7 points compared to 2012. Excluding the effect of development from both periods, the GAAP combined ratio decreased by 1.6 points for the twelve months ended December 31, 2013, compared to 2012. The GAAP underwriting ratio declined by 1.2 points for the twelve months ended December 31, 2013, as a result of reduced commission rates on new and renewal business, a lower proportion of new business (on which we pay a higher commission rate than renewal business) and a lower ratio of fixed costs to premium as a result of premium growth in 2013.
Excluding the effect of development, the GAAP combined ratio was 97.7% for the twelve months ended December 31, 2013.
Losses from catastrophes were $1.8 million for the twelve months ended December 31, 2013, compared to $4.0 million for 2012.
The combined ratio in the Focus States decreased by 1.4 points for the twelve months ended December 31, 2013. The decline was primarily due to improvement in the loss and LAE ratio in all states except California coupled with an overall decline in the underwriting ratio in the Focus States. As we experience premium growth in these states, the ratio of fixed underwriting costs to premium has declined. Also, the average commission ratios declined due to a shift in business mix from new to renewal business. We typically pay lower commission rates on renewal business than on new business.
The combined ratio in the Other States decreased by 6.6 points for the twelve months ended December 31, 2013, primarily due to decreases in the loss and LAE ratios in Georgia, Nevada and Pennsylvania. We have raised rates and tightened underwriting restrictions in these states in order to improve their profitability.
The combined ratio for the Commercial Vehicle product increased by 3.7 points during the twelve months ended December 31, 2013, due to an increase in the loss and LAE ratio.
Installment and Other Fee Income
Installment and other fee income of $95.2 million, $98.4 million and $100.0 million for the twelve months ended December 31, 2014, 2013, and 2012, respectively, is primarily made up of installment and other fees charged to policyholders. The 3.2% decline during 2014 was primarily due to a reduction in late fees charged.
Net Investment Income
Investment income primarily includes gross investment revenue net of investment management fees as shown in the following table ($ in thousands):
Twelve months ended December 31, | |||||||||||
2014 | 2013 | 2012 | |||||||||
Investment income: | |||||||||||
Interest income on fixed maturities, cash and cash equivalents | $ | 35,596 | $ | 36,113 | $ | 38,234 | |||||
Dividends on equity securities | 2,245 | 1,711 | 1,415 | ||||||||
Gross investment income | 37,841 | 37,825 | 39,649 | ||||||||
Investment expenses | (2,211 | ) | (2,279 | ) | (2,077 | ) | |||||
Net investment income | $ | 35,629 | $ | 35,546 | $ | 37,571 | |||||
Average investment balance, at cost | $ | 1,563,028 | $ | 1,511,558 | $ | 1,294,932 | |||||
Annualized returns excluding realized gains and losses | 2.3 | % | 2.4 | % | 2.9 | % | |||||
Annualized returns including realized gains and losses | 2.6 | % | 2.8 | % | 4.8 | % | |||||
Annualized returns declined in 2014 and 2013 due to new money rates that were lower than the book yields of maturing securities. Additionally, new money from operating cash flows was invested at these lower new money rates.
Changes in investment income reflect fluctuations in market rates and changes in average invested assets. Net investment income in 2014 and 2013 declined when compared to the respective prior year primarily due to a decline in book yields because of a general decline in market interest rates for high quality bonds.
31
INFINITY PROPERTY AND CASUALTY CORPORATION 10-K
Management’s Discussion and Analysis of Financial Condition and Results of Operations
Included in investment income in 2013 was $1.7 million related to a change in estimate for principal prepayments for mortgage-backed securities. In October 2013 we began using a better estimate of expected mortgage principal prepayments. Until then, we had used an estimate that was based on the past three months of actual prepayments. The new estimate takes into consideration current and expected market conditions.
Realized Gains on Investments
We recorded realized gains (losses) on sales and disposals and impairments for unrealized losses deemed other-than-temporary as follows (before tax, $ in thousands):
Twelve months ended | |||||||||||
December 31, 2014 | |||||||||||
Net Realized Gains (Losses) on Sales | Impairments Recognized in Earnings | Total Realized Gains (Losses) | |||||||||
Fixed maturities | $ | 3,137 | $ | (160 | ) | $ | 2,976 | ||||
Equities | 1,303 | 0 | 1,303 | ||||||||
Short-term investments | 5 | 0 | 5 | ||||||||
Total | $ | 4,444 | $ | (160 | ) | $ | 4,284 | ||||
Twelve months ended | |||||||||||
December 31, 2013 | |||||||||||
Net Realized Gains (Losses) on Sales | Impairments Recognized in Earnings | Total Realized Gains (Losses) | |||||||||
Fixed maturities | $ | 6,818 | $ | (1,468 | ) | $ | 5,349 | ||||
Equities | 677 | 0 | 677 | ||||||||
Short-term investments | 0 | 0 | 0 | ||||||||
Total | $ | 7,495 | $ | (1,468 | ) | $ | 6,026 | ||||
Twelve months ended | |||||||||||
December 31, 2012 | |||||||||||
Net Realized Gains (Losses) on Sales | Impairments Recognized in Earnings | Total Realized Gains (Losses) | |||||||||
Fixed maturities | $ | 11,594 | $ | (1,393 | ) | $ | 10,202 | ||||
Equities | 13,853 | 0 | 13,853 | ||||||||
Short-term investments | 0 | 0 | 0 | ||||||||
Total | $ | 25,447 | $ | (1,393 | ) | $ | 24,055 | ||||
2013 compared to 2012
The decline in the total realized gain in 2013 was primarily due to a large capital gain from the sale of our investment in the Vanguard U.S. broad based exchange-traded fund in 2012.
Gain on Sale of Subsidiaries
On September 30, 2012, we completed the sale of an inactive, shell subsidiary company to an unaffiliated third party. The total
gain recorded on a GAAP basis was $2.9 million.
Other Income
Other income of $0.6 million, $0.7 million and $1.0 million for the twelve months ended December 31, 2014, 2013 and 2012, respectively, is primarily made up of items of a non-recurring nature.
32
INFINITY PROPERTY AND CASUALTY CORPORATION 10-K
Management’s Discussion and Analysis of Financial Condition and Results of Operations
Interest Expense
($ in thousands) | Twelve months ended December 31, | ||||||||||
2014 | 2013 | 2012 | |||||||||
5.5% Senior Notes | $ | 0 | $ | 0 | $ | 8,605 | |||||
5.0% Senior Notes | 13,750 | 13,826 | 3,934 | ||||||||
Total | $ | 13,750 | $ | 13,826 | $ | 12,539 | |||||
At December 31, 2014, we had $275.0 million of senior notes outstanding. These notes carry a coupon rate of 5.0% and require no principal payment until maturity in September 2022. On October 17, 2012, we fully redeemed the $195.0 million outstanding principal of senior notes (the "5.5% Senior Notes") due 2014 at a price of 106.729%, or $208.1 million plus accrued interest of $1.8 million. (See Note 4 - Long-Term Debt of the Notes to Consolidated Financial Statements for additional information on the Senior Notes).
Corporate General and Administrative Expenses
($ in thousands) | Twelve months ended December 31, | ||||||||||
2014 | 2013 | 2012 | |||||||||
Corporate general and administrative expenses | $ | 7,702 | $ | 7,870 | $ | 7,408 | |||||
Corporate general and administrative expenses are comprised of expenses of the holding company, including board of directors' fees, directors and officers insurance and a portion of the salaries and benefits of senior executives.
Loss on Redemption of Long-Term Debt
On October 17, 2012, we fully redeemed the $195.0 million principal outstanding of the 5.5% Senior Notes at a price of
106.729%, or $208.1 million, plus accrued interest of $1.8 million. As a result, we recognized a pre-tax loss on redemption as follows ($ in thousands):
Redemption price | $ | 208,122 | |
Amortized cost at redemption | (194,878 | ) | |
Unamortized issuance costs | 352 | ||
Loss on redemption of debt, pre-tax | $ | 13,595 | |
Other Expenses
($ in thousands) | Twelve months ended December 31, | ||||||||||
2014 | 2013 | 2012 | |||||||||
Corporate litigation expense | $ | 238 | $ | 1,169 | $ | 910 | |||||
Loss on subleases | 99 | 56 | 109 | ||||||||
Loss on disposal of software and equipment | 15 | 46 | 59 | ||||||||
Other | 530 | 803 | 448 | ||||||||
Total other expenses | $ | 882 | $ | 2,073 | $ | 1,526 | |||||
2014 compared to 2013
Other expenses for the twelve months ended December 31, 2014, decreased $1.2 million, primarily due to a $0.9 million decrease in corporate litigation expense.
2013 compared to 2012
Other expenses for the twelve months ended December 31, 2013, increased $0.5 million, primarily due to a $0.3 million increase in corporate litigation expense made up of items of a non-recurring nature.
33
INFINITY PROPERTY AND CASUALTY CORPORATION 10-K
Management’s Discussion and Analysis of Financial Condition and Results of Operations
Income Taxes
The following table reconciles our U.S. statutory rate and effective tax rate for the periods ended December 31, 2014, 2013 and 2012:
Twelve months ended December 31, | ||||||||
2014 | 2013 | 2012 | ||||||
U.S. Statutory tax rate | 35.0 | % | 35.0 | % | 35.0 | % | ||
Adjustments: | ||||||||
Dividends received deduction | (0.6 | )% | (0.8 | )% | (1.3 | )% | ||
Tax exempt interest | (3.3 | )% | (6.1 | )% | (14.9 | )% | ||
Adjustment to valuation allowance | 0.0 | % | (0.1 | )% | (29.0 | )% | ||
Other | 0.1 | % | (0.4 | )% | 0.1 | % | ||
Effective tax rate | 31.2 | % | 27.6 | % | (10.1 | )% | ||
In 2014 our underwriting profits increased as a result of a decrease in our combined ratio. This increase in income resulted in a smaller benefit from both tax exempt interest and the dividends received deduction, which therefore increased the effective tax rate.
In 2008 as a result of the significant fall in the stock market, the fair value of our exchange-traded fund (“ETF”) fell significantly. At that time, we wrote the book value down to market as an other-than-temporary impairment (“OTTI”) and thereby incurred a GAAP pre-tax loss. This loss created a basis difference that generated a significant deferred tax asset. Given the market conditions at the time, and the fact that we were in a capital loss carryforward position, we did not believe that it was more-likely-than-not that this deferred tax asset would be recognized. Therefore, a full valuation allowance was established for this deferred tax asset. This was consistent with the full valuation allowance that had been established for the deferred tax asset relating to the capital loss carryforward.
In the fourth quarter of 2012 the ETF was sold as part of our plan to seek better diversification in our equity portfolio, resulting
in a release of the valuation allowance related to the ETF. Due to the market recovery, the tax loss was fully recognized. Based
on the remaining OTTI balance as of December 31, 2012, and our carryback potential, it was management's belief that it was more likely than not that we would be able to fully utilize the tax deductions related to OTTI that would be recognized in the future. Therefore, the balance in the valuation allowance was released in the fourth quarter of 2012.
34
ITEM 7A
Quantitative and Qualitative Disclosures about Market Risk
The information required by Item 7A is included in Management’s Discussion and Analysis of Financial Condition and Results of Operations under the caption, Exposure to Market Risk.
ITEM 8
Financial Statements and Supplementary Data
Infinity Property and Casualty Corporation and Subsidiaries: | |
ITEM 9
Changes in and Disagreements with Accountants on Accounting and Financial Disclosure
None.
35
ITEM 9A
Controls and Procedures
Evaluation of Disclosure Controls and Procedures
We carried out an evaluation, under the supervision and with the participation of our management, including our Chief Executive Officer and Chief Financial Officer, of the effectiveness of our disclosure controls and procedures (as defined in Exchange Act Rules 13a-15(e) and 15d-15(e)) as of December 31, 2014. Based on that evaluation, our Chief Executive Officer and Chief Financial Officer concluded that the controls and procedures are effective in providing reasonable assurance that material information required to be disclosed in our reports filed with or submitted to the Securities and Exchange Commission (“SEC”) under the Securities Exchange Act is recorded, processed, summarized and reported within the time periods specified in the SEC rules and forms and that such information is accumulated and communicated to our management, including our Chief Executive Officer and Chief Financial Officer, as appropriate.
Management's Report on Internal Control over Financial Reporting
Our management is responsible for establishing and maintaining adequate internal control over financial reporting, as such term is defined in Exchange Act Rules 13a-15(f) and 15d-15(f). Under the supervision and with the participation of management, including the principal executive officer and principal financial officer, we conducted an evaluation of the effectiveness of our internal control over financial reporting as of December 31, 2014, based on the framework in the 2013 edition of the Internal Control - Integrated Framework issued by the Committee of Sponsoring Organizations of the Treadway Commission. Based on our evaluation, management concluded that our internal control over financial reporting was effective as of December 31, 2014.
Ernst & Young LLP, the independent registered public accounting firm that audited our consolidated financial statements contained in this Annual Report on Form 10-K, has issued an attestation report on the effectiveness of our internal control over financial reporting as of December 31, 2014, which is included herein.
Because of our inherent limitations, a system of internal control over financial reporting can provide only reasonable assurance and may not prevent or detect misstatements. Further, because of changes in conditions, effectiveness of internal controls over financial reporting may vary over time. Our system contains self-monitoring mechanisms, and we take actions to correct deficiencies as we identify them.
Changes in Internal Control over Financial Reporting
During the fiscal quarter ended December 31, 2014, there have been no changes to our internal control over financial reporting that have materially affected, or are reasonably likely to materially affect our internal control over financial reporting.
36
Report of Independent Registered Public Accounting Firm on
Internal Control over Financial Reporting
The Board of Directors and Shareholders
Infinity Property and Casualty Corporation and Subsidiaries
We have audited Infinity Property and Casualty Corporation and subsidiaries’ internal control over financial reporting as of December 31, 2014, based on criteria established in Internal Control-Integrated Framework issued by the Committee of Sponsoring Organizations of the Treadway Commission (2013 framework) (the COSO criteria). Infinity Property and Casualty Corporation and subsidiaries' management is responsible for maintaining effective internal control over financial reporting, and for its assessment of the effectiveness of internal control over financial reporting included in the accompanying Management’s Report on Internal Control over Financial Reporting. Our responsibility is to express an opinion on the company’s internal control over financial reporting based on our audit.
We conducted our audit in accordance with the standards of the Public Company Accounting Oversight Board (United States). Those standards require that we plan and perform the audit to obtain reasonable assurance about whether effective internal control over financial reporting was maintained in all material respects. Our audit included obtaining an understanding of internal control over financial reporting, assessing the risk that a material weakness exists, testing and evaluating the design and operating effectiveness of internal control based on the assessed risk, and performing such other procedures as we considered necessary in the circumstances. We believe that our audit provides a reasonable basis for our opinion.
A company’s internal control over financial reporting is a process designed to provide reasonable assurance regarding the reliability of financial reporting and the preparation of financial statements for external purposes in accordance with generally accepted accounting principles. A company’s internal control over financial reporting includes those policies and procedures that (1) pertain to the maintenance of records that, in reasonable detail, accurately and fairly reflect the transactions and dispositions of the assets of the company; (2) provide reasonable assurance that transactions are recorded as necessary to permit preparation of financial statements in accordance with generally accepted accounting principles, and that receipts and expenditures of the company are being made only in accordance with authorizations of management and directors of the company; and (3) provide reasonable assurance regarding prevention or timely detection of unauthorized acquisition, use, or disposition of the company’s assets that could have a material effect on the financial statements.
Because of its inherent limitations, internal control over financial reporting may not prevent or detect misstatements. Also, projections of any evaluation of effectiveness to future periods are subject to the risk that controls may become inadequate because of changes in conditions, or that the degree of compliance with the policies or procedures may deteriorate.
In our opinion, Infinity Property and Casualty Corporation and subsidiaries maintained, in all material respects, effective internal control over financial reporting as of December 31, 2014 based on the COSO criteria.
We also have audited, in accordance with the standards of the Public Company Accounting Oversight Board (United States), the consolidated balance sheets as of December 31, 2014 and 2013, and the related consolidated statements of earnings, comprehensive income, changes in shareholders’ equity, and cash flows for each of the three years in the period ended December 31, 2014, of Infinity Property and Casualty Corporation and subsidiaries and our report dated February 26, 2015 expressed an unqualified opinion thereon.
/S/ ERNST & YOUNG LLP
Birmingham, Alabama
February 26, 2015
ITEM 9B
Other Information
None.
PART III
ITEM 10
Directors, Executive Officers and Corporate Governance
We make available free of charge within the Investor Relations section of our website at www.infinityauto.com, our Corporate Governance Guidelines, the Charter of each standing committee of the Board of Directors, and the Code of Ethics adopted by the Board and applicable to all of our directors, officers and employees. Requests for copies may be directed to our Corporate Secretary at Infinity Property and Casualty Corporation, 3700 Colonnade Parkway, Suite 600, Birmingham, Alabama 35243. We intend to disclose any amendments to the Code of Ethics, and any waiver from a provision of the Code of Ethics granted to our Chief Executive Officer or Chief Financial Officer, on our website following such amendment or waiver. We may disclose any such amendment or waiver in a report on Form 8-K filed with the SEC either in addition to or in lieu of the website disclosure. The information contained on or connected to our website is not incorporated by reference into this Form 10-K and should not be considered part of this or any other report that we file with or furnish to the SEC.
The information required by this Item 10 regarding Directors, Executive Officers, Promoters and Control Persons; Compliance with Section 16(a) of the Exchange Act of 1934; and Corporate Governance is incorporated by reference from our Proxy Statement for the 2015 Annual Meeting of Shareholders to be held on May 19, 2015.
ITEM 11
Executive Compensation
Incorporated by reference from our Proxy Statement for the 2015 Annual Meeting of Shareholders to be held on May 19, 2015.
ITEM 12
Security Ownership of Certain Beneficial Owners and Management and Related Stockholder Matters
Incorporated by reference from our Proxy Statement for the 2015 Annual Meeting of Shareholders to be held on May 19, 2015.
ITEM 13
Certain Relationships and Related Transactions, and Director Independence
Incorporated by reference from our Proxy Statement for the 2015 Annual Meeting of Shareholders to be held on May 19, 2015.
ITEM 14
Principal Accountant Fees and Services
Incorporated by reference from our Proxy Statement for the 2015 Annual Meeting of Shareholders to be held on May 19, 2015.
37
INFINITY PROPERTY AND CASUALTY CORPORATION AND SUBSIDIARIES
REPORT OF INDEPENDENT REGISTERED PUBLIC ACCOUNTING FIRM
The Board of Directors and Shareholders
Infinity Property and Casualty Corporation and Subsidiaries
We have audited the accompanying consolidated balance sheets of Infinity Property and Casualty Corporation and subsidiaries as of December 31, 2014 and 2013, and the related consolidated statements of earnings, comprehensive income, changes in shareholders’ equity and cash flows for each of the three years in the period ended December 31, 2014. Our audits also included the financial statement schedules listed in the Index at Item 15(a). These financial statements and schedules are the responsibility of the Company's management. Our responsibility is to express an opinion on these financial statements and schedules based on our audits.
We conducted our audits in accordance with the standards of the Public Company Accounting Oversight Board (United States). Those standards require that we plan and perform the audit to obtain reasonable assurance about whether the financial statements are free of material misstatement. An audit includes examining, on a test basis, evidence supporting the amounts and disclosures in the financial statements. An audit also includes assessing the accounting principles used and significant estimates made by management, as well as evaluating the overall financial statement presentation. We believe that our audits provide a reasonable basis for our opinion.
In our opinion, the financial statements referred to above present fairly, in all material respects, the consolidated financial position of the Infinity Property and Casualty Corporation and subsidiaries at December 31, 2014 and 2013, and the consolidated results of their operations and their cash flows for each of the three years in the period ended December 31, 2014, in conformity with U.S. generally accepted accounting principles. Also, in our opinion, the related financial statement schedules, when considered in relation to the basic financial statements taken as a whole, present fairly in all material respects the information set forth therein.
We also have audited, in accordance with the standards of the Public Company Accounting Oversight Board (United States), Infinity Property and Casualty Corporation and subsidiaries’ internal control over financial reporting as of December 31, 2014, based on criteria established in Internal Control-Integrated Framework issued by the Committee of Sponsoring Organizations of the Treadway Commission (2013 framework) and our report dated February 26, 2015 expressed an unqualified opinion thereon.
/S/ ERNST & YOUNG LLP
Birmingham, Alabama
February 26, 2015
INFINITY PROPERTY AND CASUALTY CORPORATION AND SUBSIDIARIES
CONSOLIDATED STATEMENTS OF EARNINGS
(in thousands, except per share data)
Twelve months ended December 31, | |||||||||||||||||
2014 | 2013 | % Change | 2012 | % Change | |||||||||||||
Revenues: | |||||||||||||||||
Earned premium | $ | 1,325,935 | $ | 1,302,525 | 1.8 | % | $ | 1,184,090 | 10.0 | % | |||||||
Installment and other fee income | 95,242 | 98,428 | (3.2 | )% | 99,952 | (1.5 | )% | ||||||||||
Net investment income | 35,629 | 35,546 | 0.2 | % | 37,571 | (5.4 | )% | ||||||||||
Net realized gains on investments(1) | 4,284 | 6,026 | (28.9 | )% | 24,055 | (74.9 | )% | ||||||||||
Gain on sale of subsidiaries | 0 | 0 | 0.0 | % | 2,922 | (100.0 | )% | ||||||||||
Other income | 619 | 707 | (12.5 | )% | 996 | (29.0 | )% | ||||||||||
Total revenues | 1,461,709 | 1,443,233 | 1.3 | % | 1,349,585 | 6.9 | % | ||||||||||
Costs and Expenses: | |||||||||||||||||
Losses and loss adjustment expenses | 1,001,628 | 1,017,247 | (1.5 | )% | 942,253 | 8.0 | % | ||||||||||
Commissions and other underwriting expenses | 354,559 | 357,052 | (0.7 | )% | 349,808 | 2.1 | % | ||||||||||
Interest expense | 13,801 | 13,912 | (0.8 | )% | 12,908 | 7.8 | % | ||||||||||
Corporate general and administrative expenses | 7,702 | 7,870 | (2.1 | )% | 7,408 | 6.2 | % | ||||||||||
Loss on redemption of long-term debt | 0 | 0 | 0.0 | % | 13,595 | (100.0 | )% | ||||||||||
Other expenses | 882 | 2,073 | (57.5 | )% | 1,526 | 35.9 | % | ||||||||||
Total costs and expenses | 1,378,572 | 1,398,155 | (1.4 | )% | 1,327,498 | 5.3 | % | ||||||||||
Earnings before income taxes | 83,138 | 45,078 | 84.4 | % | 22,088 | 104.1 | % | ||||||||||
Provision for income taxes | 25,936 | 12,445 | 108.4 | % | (2,231 | ) | NM | ||||||||||
Net Earnings | $ | 57,201 | $ | 32,633 | 75.3 | % | $ | 24,319 | 34.2 | % | |||||||
Net Earnings per Common Share: | |||||||||||||||||
Basic | $ | 5.00 | $ | 2.85 | 75.4 | % | $ | 2.09 | 36.4 | % | |||||||
Diluted | 4.95 | 2.80 | 76.8 | % | 2.04 | 37.3 | % | ||||||||||
Average Number of Common Shares: | |||||||||||||||||
Basic | 11,440 | 11,451 | (0.1 | )% | 11,660 | (1.8 | )% | ||||||||||
Diluted | 11,562 | 11,657 | (0.8 | )% | 11,941 | (2.4 | )% | ||||||||||
Cash Dividends per Common Share | $ | 1.44 | $ | 1.20 | 20.0 | % | $ | 0.90 | 33.3 | % | |||||||
(1) Net realized gains before impairment losses | $ | 4,444 | $ | 7,495 | (40.7 | )% | $ | 25,447 | (70.5 | )% | |||||||
Total other-than-temporary impairment (OTTI) losses | (1,023 | ) | (3,772 | ) | (72.9 | )% | (1,404 | ) | 168.7 | % | |||||||
Non-credit portion in other comprehensive income | 888 | 2,338 | (62.0 | )% | 44 | NM | |||||||||||
OTTI losses reclassified from other comprehensive income | (25 | ) | (33 | ) | (26.1 | )% | (32 | ) | 3.3 | % | |||||||
Net impairment losses recognized in earnings | $ | (160 | ) | $ | (1,468 | ) | (89.1 | )% | $ | (1,393 | ) | 5.4 | % | ||||
Total net realized gains on investments | $ | 4,284 | $ | 6,026 | (28.9 | )% | $ | 24,055 | (74.9 | )% | |||||||
NM = Not meaningful
See Notes to Consolidated Financial Statements.
38
INFINITY PROPERTY AND CASUALTY CORPORATION AND SUBSIDIARIES
CONSOLIDATED STATEMENTS OF COMPREHENSIVE INCOME
(in thousands)
Twelve months ended December 31, | |||||||||||
2014 | 2013 | 2012 | |||||||||
Net earnings | $ | 57,201 | $ | 32,633 | $ | 24,319 | |||||
Other comprehensive (loss) income before tax: | |||||||||||
Net change in postretirement benefit liability | 235 | 906 | (1,487 | ) | |||||||
Unrealized gains (losses) on investments: | |||||||||||
Unrealized holding gains (losses) arising during the period | 14,618 | (15,227 | ) | 17,129 | |||||||
Less: Reclassification adjustments for gains included in net earnings | (4,284 | ) | (6,026 | ) | (24,055 | ) | |||||
Unrealized gains (losses) on investments, net | 10,334 | (21,254 | ) | (6,926 | ) | ||||||
Other comprehensive income (loss), before tax | 10,569 | (20,348 | ) | (8,412 | ) | ||||||
Income tax benefit (expense) related to components of other comprehensive income | (3,699 | ) | 7,122 | 2,944 | |||||||
Other comprehensive income (loss), net of tax | 6,870 | (13,226 | ) | (5,468 | ) | ||||||
Comprehensive income | $ | 64,071 | $ | 19,406 | $ | 18,851 | |||||
See Notes to Consolidated Financial Statements.
INFINITY PROPERTY AND CASUALTY CORPORATION AND SUBSIDIARIES
CONSOLIDATED BALANCE SHEETS
(in thousands, except share amounts in line descriptions)
December 31, | |||||||
2014 | 2013 | ||||||
Assets | |||||||
Investments: | |||||||
Fixed maturities – at fair value (amortized cost $1,412,417 and $1,345,077) | $ | 1,431,843 | $ | 1,354,305 | |||
Equity securities – at fair value (cost $77,862 and $74,718) | 94,408 | 91,127 | |||||
Short-term investments - at fair value (amortized cost $803 and $2,595) | 803 | 2,596 | |||||
Total investments | $ | 1,527,054 | $ | 1,448,027 | |||
Cash and cash equivalents | 84,541 | 134,211 | |||||
Accrued investment income | 12,976 | 12,772 | |||||
Agents’ balances and premium receivable, net of allowances for doubtful accounts of $15,510 and $15,884 | 483,638 | 451,339 | |||||
Property and equipment, net of accumulated depreciation of $63,929 and $53,368 | 55,880 | 48,061 | |||||
Prepaid reinsurance premium | 4,809 | 3,133 | |||||
Recoverables from reinsurers (includes $161 and $77 on paid losses and LAE) | 14,530 | 14,508 | |||||
Deferred policy acquisition costs | 90,428 | 88,258 | |||||
Current and deferred income taxes | 20,022 | 28,648 | |||||
Receivable for securities sold | 4,549 | 2,791 | |||||
Other assets | 11,108 | 10,242 | |||||
Goodwill | 75,275 | 75,275 | |||||
Total assets | $ | 2,384,812 | $ | 2,317,265 | |||
Liabilities and Shareholders’ Equity | |||||||
Liabilities: | |||||||
Unpaid losses and loss adjustment expenses | $ | 668,177 | $ | 646,577 | |||
Unearned premium | 589,260 | 566,004 | |||||
Long-term debt (fair value $291,044 and $272,632) | 275,000 | 275,000 | |||||
Commissions payable | 18,673 | 19,100 | |||||
Payable for securities purchased | 17,173 | 39,887 | |||||
Other liabilities | 118,870 | 113,938 | |||||
Total liabilities | $ | 1,687,153 | $ | 1,660,507 | |||
Commitments and contingencies (See Note 14) | |||||||
Shareholders’ equity: | |||||||
Common stock, no par value (50,000,000 shares authorized; 21,728,032 and 21,599,047 shares issued) | $ | 21,745 | $ | 21,684 | |||
Additional paid-in capital | 372,368 | 368,902 | |||||
Retained earnings | 725,651 | 685,011 | |||||
Accumulated other comprehensive income, net of tax | 23,494 | 16,624 | |||||
Treasury stock, at cost (10,244,672 and 10,095,416 shares) | (445,599 | ) | (435,463 | ) | |||
Total shareholders’ equity | $ | 697,659 | $ | 656,758 | |||
Total liabilities and shareholders’ equity | $ | 2,384,812 | $ | 2,317,265 | |||
See Notes to Consolidated Financial Statements.
INFINITY PROPERTY AND CASUALTY CORPORATION AND SUBSIDIARIES
CONSOLIDATED STATEMENTS OF CHANGES IN SHAREHOLDERS’ EQUITY
(in thousands)
Common Stock | Additional Paid-in Capital | Retained Earnings | Accumulated Other Comprehensive Income, Net of Tax | Treasury Stock | Total | |||||||||||||
Balance at January 1, 2012 | $ | 21,358 | $ | 355,911 | $ | 652,423 | $ | 35,319 | $ | (403,221 | ) | $ | 661,789 | |||||
Net earnings | — | — | 24,319 | — | — | 24,319 | ||||||||||||
Net change in postretirement benefit liability | — | — | — | (966 | ) | — | (966 | ) | ||||||||||
Change in unrealized gain on investments | — | — | — | (5,866 | ) | — | (5,866 | ) | ||||||||||
Change in non-credit component of impairment losses on fixed maturities | — | — | — | 1,365 | — | 1,365 | ||||||||||||
Comprehensive income | 18,851 | |||||||||||||||||
Dividends paid to common shareholders | — | — | (10,544 | ) | — | — | (10,544 | ) | ||||||||||
Shares issued and share-based compensation expense, including tax benefit | 172 | 5,934 | — | — | — | 6,106 | ||||||||||||
Acquisition of treasury stock | — | — | — | — | (19,960 | ) | (19,960 | ) | ||||||||||
Balance at December 31, 2012 | $ | 21,529 | $ | 361,845 | $ | 666,199 | $ | 29,851 | $ | (423,181 | ) | $ | 656,242 | |||||
Net earnings | — | — | 32,633 | — | — | 32,633 | ||||||||||||
Net change in postretirement benefit liability | — | — | — | 589 | — | 589 | ||||||||||||
Change in unrealized gain on investments | — | — | — | (12,724 | ) | — | (12,724 | ) | ||||||||||
Change in non-credit component of impairment losses on fixed maturities | — | — | — | (1,091 | ) | — | (1,091 | ) | ||||||||||
Comprehensive income | 19,406 | |||||||||||||||||
Dividends paid to common shareholders | — | — | (13,821 | ) | — | — | (13,821 | ) | ||||||||||
Shares issued and share-based compensation expense, including tax benefit | 155 | 7,057 | — | — | — | 7,212 | ||||||||||||
Acquisition of treasury stock | — | — | — | — | (12,282 | ) | (12,282 | ) | ||||||||||
Balance at December 31, 2013 | $ | 21,684 | $ | 368,902 | $ | 685,011 | $ | 16,624 | $ | (435,463 | ) | $ | 656,758 | |||||
Net earnings | — | — | 57,201 | — | — | 57,201 | ||||||||||||
Net change in postretirement benefit liability | — | — | — | 153 | — | 153 | ||||||||||||
Change in unrealized gain on investments | — | — | — | 6,810 | — | 6,810 | ||||||||||||
Change in non-credit component of impairment losses on fixed maturities | — | — | — | (93 | ) | — | (93 | ) | ||||||||||
Comprehensive income | 64,071 | |||||||||||||||||
Dividends paid to common shareholders | — | — | (16,562 | ) | — | — | (16,562 | ) | ||||||||||
Shares issued and share-based compensation expense, including tax benefit | 61 | 3,466 | — | — | — | 3,527 | ||||||||||||
Acquisition of treasury stock | — | — | — | — | (10,136 | ) | (10,136 | ) | ||||||||||
Balance at December 31, 2014 | $ | 21,745 | $ | 372,368 | $ | 725,651 | $ | 23,494 | $ | (445,599 | ) | $ | 697,659 | |||||
See Notes to Consolidated Financial Statements.
INFINITY PROPERTY AND CASUALTY CORPORATION AND SUBSIDIARIES
CONSOLIDATED STATEMENTS OF CASH FLOWS
(in thousands)
Twelve months ended December 31, | |||||||||||
2014 | 2013 | 2012 | |||||||||
Operating Activities: | |||||||||||
Net earnings | $ | 57,201 | $ | 32,633 | $ | 24,319 | |||||
Adjustments: | |||||||||||
Depreciation | 10,803 | 9,030 | 8,565 | ||||||||
Amortization | 21,952 | 18,936 | 9,122 | ||||||||
Net realized gains on investments | (4,284 | ) | (6,026 | ) | (24,055 | ) | |||||
(Gain) loss on disposal of property and equipment | (16 | ) | (120 | ) | 52 | ||||||
Gain on sale of subsidiaries | 0 | 0 | (2,922 | ) | |||||||
Loss on redemption of long-term debt | 0 | 0 | 13,595 | ||||||||
Share-based compensation expense | 2,634 | 4,009 | 3,194 | ||||||||
Excess tax benefits from share-based payment arrangements | (108 | ) | (573 | ) | (896 | ) | |||||
Activity related to rabbi trust | 48 | 126 | 65 | ||||||||
Change in accrued investment income | (205 | ) | (845 | ) | (1,165 | ) | |||||
Change in agents’ balances and premium receivable | (32,299 | ) | (24,183 | ) | (44,535 | ) | |||||
Change in reinsurance receivables | (1,699 | ) | (575 | ) | (216 | ) | |||||
Change in deferred policy acquisition costs | (2,170 | ) | (7 | ) | (8,180 | ) | |||||
Change in other assets | 4,251 | 4,583 | (15,911 | ) | |||||||
Change in unpaid losses and loss adjustment expenses | 21,600 | 73,683 | 77,491 | ||||||||
Change in unearned premium | 23,256 | 27,862 | 63,614 | ||||||||
Change in other liabilities | 5,056 | 4,725 | 36,234 | ||||||||
Net cash provided by operating activities | 106,020 | 143,258 | 138,371 | ||||||||
Investing Activities: | |||||||||||
Purchases of fixed maturities | (516,522 | ) | (774,640 | ) | (699,797 | ) | |||||
Purchases of equity securities | (6,600 | ) | (11,100 | ) | (69,002 | ) | |||||
Purchases of short-term investments | (7,920 | ) | (5,798 | ) | 0 | ||||||
Purchases of property and equipment | (18,641 | ) | (17,840 | ) | (9,235 | ) | |||||
Maturities and redemptions of fixed maturities | 167,011 | 193,421 | 182,292 | ||||||||
Maturities and redemptions of short-term investments | 2,800 | 0 | 0 | ||||||||
Proceeds from sale of subsidiary companies | 0 | 0 | 9,107 | ||||||||
Proceeds from sale of fixed maturities | 238,893 | 454,647 | 452,127 | ||||||||
Proceeds from sale of equity securities | 4,999 | 7,244 | 39,502 | ||||||||
Proceeds from sale of short-term investments | 6,864 | 3,204 | 0 | ||||||||
Proceeds from sale of property and equipment | 34 | 171 | 11 | ||||||||
Net cash used in investing activities | (129,082 | ) | (150,691 | ) | (94,995 | ) | |||||
Financing Activities: | |||||||||||
Proceeds from stock options exercised and employee stock purchases | 784 | 3,203 | 2,911 | ||||||||
Excess tax benefits from share-based payment arrangements | 108 | 573 | 896 | ||||||||
Proceeds from issuance of long-term debt | 0 | 0 | 273,213 | ||||||||
Redemption of long-term debt | 0 | 0 | (208,122 | ) | |||||||
Principal payments under capital lease obligations | (840 | ) | (882 | ) | (673 | ) | |||||
Acquisition of treasury stock | (10,100 | ) | (12,612 | ) | (19,643 | ) | |||||
Dividends paid to shareholders | (16,562 | ) | (13,821 | ) | (10,544 | ) | |||||
Net cash (used in) provided by financing activities | (26,609 | ) | (23,538 | ) | 38,039 | ||||||
Net (decrease) increase in cash and cash equivalents | (49,670 | ) | (30,971 | ) | 81,415 | ||||||
Cash and cash equivalents at beginning of period | 134,211 | 165,182 | 83,767 | ||||||||
Cash and cash equivalents at end of period | $ | 84,541 | $ | 134,211 | $ | 165,182 | |||||
See Notes to Consolidated Financial Statements.
INFINITY PROPERTY AND CASUALTY CORPORATION AND SUBSIDIARIES
NOTES TO CONSOLIDATED FINANCIAL STATEMENTS
December 31, 2014
INDEX TO NOTES
1 | 10 | |||||||
2 | 11 | |||||||
3 | 12 | |||||||
4 | 13 | |||||||
5 | 14 | |||||||
6 | 15 | |||||||
7 | 16 | |||||||
8 | 17 | |||||||
9 | ||||||||
Note 1 Significant Reporting and Accounting Policies
Nature of Operations
We currently write personal automobile insurance with a concentration on nonstandard automobile insurance, mono-line commercial vehicle insurance and classic collector automobile insurance. Personal auto insurance accounts for 91% of our total gross written premium and we primarily write it in four states. We wrote approximately 50% of our personal auto gross written premium in the state of California during 2014.
Basis of Consolidation and Reporting
The accompanying consolidated financial statements include our accounts and those of our subsidiaries. These financial statements reflect certain adjustments necessary for a fair presentation of our results of operations and financial position. Such adjustments consist of normal, recurring accruals recorded to accurately match expenses with their related revenue streams and the elimination of all significant inter-company transactions and balances.
We revised the presentation of our Consolidated Statements of Earnings for the years ending 2013 and 2012 to correctly classify $98.4 million and $100.0 million, respectively, of installment and other fee income as a component of total revenues and to conform to our current-year presentation. Previously, installment and other fee income was presented net within our commissions and other underwriting expenses, which was not in compliance with GAAP, thereby understating both total revenues and total expenses by an equivalent amount. This revision is not considered to be material to previously issued financial statements since it has no effect on the results of operations, financial condition or cash flows in any period presented or in any previously issued financial statements.
We have evaluated events that occurred after December 31, 2014, for recognition or disclosure in our financial statements and the notes to the financial statements.
Schedules may not foot due to rounding.
Estimates
The preparation of the financial statements in conformity with generally accepted accounting principles of the United States requires us to make estimates and assumptions that affect the amounts reported in the financial statements and accompanying notes. Changes in circumstances could cause actual results to differ materially from those estimates.
Investments
We consider all fixed maturity securities “available for sale” and report them at fair value with unrealized gains or losses reported after-tax in accumulated other comprehensive income within shareholders' equity. We base the fair values of investments on prices quoted in the most active market for each security. If quoted prices are not available, we estimate fair value based on the fair value of comparable securities, discounted cash flow models or similar methods. We treat premium and discounts on mortgage-backed securities (“MBS”) and asset-backed securities (“ABS”) as a yield adjustment over the estimated life of the securities, adjusted for anticipated prepayments, using the interest method. We base prepayment assumptions on data from widely accepted third party data sources or internal estimates. We review the amortized cost and effective yield of the security periodically and adjust it to reflect actual prepayments and changes in expectations. For high credit quality MBS and ABS (those rated AA or above at the time of purchase), the adjustments to amortized cost are recorded as a charge or credit to net investment income in accordance with the retrospective method. For MBS and ABS rated below AA, we adjust the yield prospectively for any changes in estimated cash flows.
Gains or losses on securities are determined on the specific identification basis. When we consider impairment in the value of a specific investment other-than-temporary (“OTTI”), the cost basis of that investment is reduced. For fixed maturity securities that are OTTI, we assess our intent to sell and the likelihood that we will be required to sell the security before recovery of our amortized cost. If a fixed maturity security is considered OTTI, but we do not intend to and are not more than likely to be required to sell the security prior to its recovery to amortized cost, the amount of the impairment is separated into a credit loss component and the amount due to all other factors. The excess of the amortized cost over the present value of the expected cash flows determines the credit loss component of an impairment charge on a fixed maturity security. The present value is determined using the best estimate of cash flows discounted at (1) the effective interest rate implicit at the date of acquisition for non-structured securities or (2) the book yield for structured securities. The techniques and assumptions for determining the best estimate of cash flows varies depending on the type of security. We recognize the credit loss component of an impairment charge in net earnings and the non-credit component in accumulated other comprehensive income.
Securities having a fair value of approximately $21.2 million at December 31, 2014, were on deposit as required by regulatory authorities.
Cash and Cash Equivalents
We consider liquid investments having original maturities of three months or less when purchased to be cash equivalents for purposes of the financial statements.
Reinsurance
Our insurance subsidiaries cede insurance to other companies. To the extent that any reinsuring companies are unable to meet obligations under agreements covering reinsurance ceded, our insurance subsidiaries would remain liable. We estimate amounts recoverable from reinsurers in a manner consistent with the claim liability associated with the reinsured policies. Our insurance subsidiaries report as assets (a) the estimated reinsurance recoverable on unpaid losses and (b) amounts paid to reinsurers applicable to the unexpired terms of policies in force.
Deferred Policy Acquisition Costs (“DPAC”)
We defer and charge against income ratably over the terms of the related policies policy acquisition costs (principally commissions, premium taxes and other marketing and underwriting expenses) related to the successful production of premium writings. The method followed in computing DPAC limits the amount of such costs to their estimated realizable value without any consideration for anticipated investment income. Each quarter, we evaluate the recoverability of these costs. The DPAC amortization expense recognized in the Consolidated Statements of Earnings during 2014, 2013 and 2012 was $204.7 million, $206.7 million and $194.9 million, respectively.
Goodwill
In accordance with the Goodwill topic of the FASB Accounting Standards Codification (“FASC”), we perform impairment test procedures for goodwill on an annual basis. These procedures require us to calculate the fair value of goodwill, compare the result to our carrying value and record the amount of any shortfall as an impairment charge.
We performed this test as of October 1, 2014, using a variety of methods, including estimates of future discounted cash flows and comparisons of our market value to that of our major competitors. Our cash flow projections rely on assumptions that are subject to uncertainty, including premium growth, loss and loss adjustment expense ratios, interest rates and capital requirements.
The October 1, 2014, test results indicated that the fair value of our goodwill exceeded our carrying value and therefore no impairment charge was required at that date. Additionally, there was no indication of impairment at December 31, 2014.
Unpaid Losses and Loss Adjustment Expenses (“LAE”)
The net liabilities stated for unpaid claims and for expenses of investigation and adjustment of unpaid claims are based upon (a) the accumulation of case estimates for losses reported prior to the close of the accounting period on direct business written; (b) estimates received from ceding reinsurers and insurance pools and associations; (c) estimates of unreported losses based on past experience; (d) estimates based on experience of expenses for investigating and adjusting claims; and (e) the current state of the law and coverage litigation. These liabilities are subject to the impact of changes in claim amounts and frequency and other factors. We have not reduced liabilities for unpaid losses and LAE for reinsurance recoverables; such recoverables are recorded separately as assets. Changes in estimates of the liabilities for losses and LAE are reflected in the Consolidated Statements of Earnings in the period in which determined. In spite of the variability inherent in such estimates, we believe that the liabilities for unpaid losses and LAE are adequate.
Premium and Receivables
We earn insurance premium written over the terms of the policies on a pro rata basis. Unearned premium represents that portion of premium written which is applicable to the unexpired terms of policies in force. On reinsurance assumed from other insurance companies or written through various underwriting organizations, we base unearned premium on reports received from such companies and organizations. We provide insurance and related services to individuals and small commercial accounts throughout the United States and offer a variety of payment plans. We establish an allowance for doubtful accounts based on the relationship, on a policy basis, between receivables and unearned premium, or an aging analysis of past due balances. We charge off premium due from insureds if not collected within 90 days of the policies' expiration or cancellation dates. However, even after we charge off premium, attempts to collect the premium continue.
Income Taxes
We file a consolidated federal income tax return, which includes all 80% and greater owned U.S. subsidiaries. We and our 80% and greater owned subsidiaries are parties to a tax allocation agreement, which designates how members of the tax group share tax payments. In general, each subsidiary agrees to pay us taxes computed on a separate company taxable income basis. We agree to pay each subsidiary for the tax benefit, if any, of net losses used by other members of the consolidated group.
We calculate deferred income taxes using the “asset and liability method.” Under this method, deferred income tax assets and liabilities are determined based on differences between financial reporting and tax basis and are measured using enacted tax rates. We recognize deferred tax assets if it is more likely than not that a benefit will be realized. We aggregate current and deferred tax assets and liabilities on the Consolidated Balance Sheets.
Property and Equipment
We report property and equipment balances at cost less accumulated depreciation. Property and equipment, which consists of land, buildings, leasehold improvements, computer equipment, capitalized software and furniture and fixtures, consisted of the following balances as of December 31, 2014 ($ in millions):
Gross Asset | Accumulated Depreciation | Net Asset | ||||||||||
Real Estate Related | $ | 41.4 | $ | (6.5 | ) | $ | 34.9 | |||||
Computer Equipment & Software | 66.1 | (48.4 | ) | 17.8 | ||||||||
Furniture & Fixtures | 12.2 | (9.0 | ) | 3.2 | ||||||||
$ | 119.8 | $ | (63.9 | ) | $ | 55.9 | ||||||
We recognized $1.8 million, net of accumulated depreciation of $0.9 million, of equipment held under capital leases in other assets on the Consolidated Balance Sheets with the related lease obligations recorded in other liabilities. We compute depreciation over the estimated useful lives of the assets using the straight-line method. Property and equipment is a separate line item on the Consolidated Balance Sheets and we allocate the related expenses, including amortization of assets recorded under capital leases, to one or more of the following line items on the Consolidated Statements of Earnings depending on the asset: losses and LAE, commissions and other underwriting expenses, corporate general and administrative expenses or other expenses.
Benefit Plans
We provide retirement benefits to qualified employees and healthcare and life insurance benefits to eligible retirees. We also provide post-employment benefits to former or inactive employees (primarily those on disability) who were not deemed retired under other company plans. The projected future cost of providing these benefits is expensed over the period the employees earn such benefits.
Recently Issued Accounting Standards
In May 2014 the Financial Accounting Standards Board (FASB) issued an Accounting Standards Update (ASU) related to the accounting for revenue from contracts with customers. Insurance contracts have been excluded from the scope of the guidance, which is effective for fiscal years beginning after December 15, 2016. We do not expect the adoption of this standard to have a material impact on our financial condition or results of operations.
Note 2 Fair Value
Fair values of instruments are based on (i) quoted prices in active markets for identical assets (Level 1); (ii) quoted prices for similar instruments in active markets, quoted prices for identical or similar instruments in markets that are not active and model-derived valuations in which all significant inputs are observable in active markets (Level 2); or (iii) valuations derived from valuation techniques in which one or more significant inputs are unobservable in the marketplace (Level 3).
39
INFINITY PROPERTY AND CASUALTY CORPORATION AND SUBSIDIARIES
Notes to Consolidated Financial Statements
The following tables present, for each of the fair value hierarchy levels, our assets and liabilities for which we report fair value on a recurring basis ($ in thousands):
Fair Value | ||||||||||||||||
December 31, 2014 | Level 1 | Level 2 | Level 3 | Total | ||||||||||||
Cash and cash equivalents | $ | 84,541 | $ | 0 | $ | 0 | $ | 84,541 | ||||||||
Fixed maturity securities: | ||||||||||||||||
U.S. government | 66,847 | 87 | 0 | 66,933 | ||||||||||||
State and municipal | 0 | 503,650 | 0 | 503,650 | ||||||||||||
Mortgage-backed securities: | ||||||||||||||||
Residential | 0 | 354,528 | 0 | 354,528 | ||||||||||||
Commercial | 0 | 50,838 | 0 | 50,838 | ||||||||||||
Total mortgage-backed securities | 0 | 405,366 | 0 | 405,366 | ||||||||||||
Collateralized mortgage obligations | 0 | 0 | 0 | 0 | ||||||||||||
Asset-backed securities | 0 | 58,457 | 150 | 58,607 | ||||||||||||
Corporates | 0 | 394,152 | 3,134 | 397,286 | ||||||||||||
Total fixed maturities | 66,847 | 1,361,711 | 3,285 | 1,431,843 | ||||||||||||
Equity securities | 94,408 | 0 | 0 | 94,408 | ||||||||||||
Short-term investments | 0 | 803 | 0 | 803 | ||||||||||||
Total cash and investments | $ | 245,795 | $ | 1,362,514 | $ | 3,285 | $ | 1,611,594 | ||||||||
Percentage of total cash and investments | 15.3 | % | 84.5 | % | 0.2 | % | 100.0 | % | ||||||||
Fair Value | ||||||||||||||||
December 31, 2013 | Level 1 | Level 2 | Level 3 | Total | ||||||||||||
Cash and cash equivalents | $ | 134,211 | $ | 0 | $ | 0 | $ | 134,211 | ||||||||
Fixed maturity securities: | ||||||||||||||||
U.S. government | 64,496 | 171 | 0 | 64,666 | ||||||||||||
State and municipal | 0 | 487,111 | 0 | 487,111 | ||||||||||||
Mortgage-backed securities: | ||||||||||||||||
Residential | 0 | 323,346 | 0 | 323,346 | ||||||||||||
Commercial | 0 | 35,816 | 0 | 35,816 | ||||||||||||
Total mortgage-backed securities | 0 | 359,162 | 0 | 359,162 | ||||||||||||
Collateralized mortgage obligations | 0 | 1,291 | 0 | 1,291 | ||||||||||||
Asset-backed securities | 0 | 70,573 | 686 | 71,259 | ||||||||||||
Corporates | 0 | 365,642 | 5,175 | 370,816 | ||||||||||||
Total fixed maturities | 64,496 | 1,283,949 | 5,860 | 1,354,305 | ||||||||||||
Equity securities | 91,127 | 0 | 0 | 91,127 | ||||||||||||
Short-term investments | 1,200 | 1,396 | 0 | 2,596 | ||||||||||||
Total cash and investments | $ | 291,033 | $ | 1,285,345 | $ | 5,860 | $ | 1,582,238 | ||||||||
Percentage of total cash and investments | 18.4 | % | 81.2 | % | 0.4 | % | 100.0 | % | ||||||||
We do not report our long-term debt at fair value in the Consolidated Balance Sheets. The $291.0 million and $272.6 million fair value of our long-term debt at December 31, 2014, and December 31, 2013, respectively, would be included in Level 2 of the fair value hierarchy if it were reported at fair value.
Level 1 includes cash and cash equivalents, U.S. Treasury securities, an exchange-traded fund and equities invested in a rabbi trust. Level 2 securities are comprised of securities whose fair value was determined using observable market inputs. Level 3
40
INFINITY PROPERTY AND CASUALTY CORPORATION AND SUBSIDIARIES
Notes to Consolidated Financial Statements
securities are comprised of (i) securities for which there is no active or inactive market for similar instruments, (ii) securities whose fair value is determined based on unobservable inputs and (iii) securities, other than those backed by the U.S. Government, that are not rated by a nationally recognized statistical rating organization ("NRSRO"). Transfers between levels are recognized at the beginning of the reporting period.
A third party nationally recognized pricing service provides the fair value of securities in Level 2. We review the third party pricing methodologies quarterly and test for significant differences between the market price used to value the security and recent sales activity.
The following tables present the changes in the Level 3 fair value category ($ in thousands):
Twelve months ended | |||||||||||||||
December 31, 2014 | |||||||||||||||
U.S. Government | Corporates | Asset-Backed Securities | Total | ||||||||||||
Balance at beginning of period | $ | 0 | $ | 5,175 | $ | 686 | $ | 5,860 | |||||||
Total gains or (losses), unrealized or realized | |||||||||||||||
Included in net earnings | 0 | 274 | 0 | 274 | |||||||||||
Included in other comprehensive income | 0 | (230 | ) | (1 | ) | (231 | ) | ||||||||
Purchases | 0 | 0 | 0 | 0 | |||||||||||
Sales | 0 | (880 | ) | 0 | (880 | ) | |||||||||
Settlements | 0 | (1,204 | ) | (534 | ) | (1,739 | ) | ||||||||
Transfers in | 0 | 0 | 0 | 0 | |||||||||||
Transfers out | 0 | 0 | 0 | 0 | |||||||||||
Balance at end of period | $ | 0 | $ | 3,134 | $ | 150 | $ | 3,285 | |||||||
Twelve months ended | |||||||||||||||
December 31, 2013 | |||||||||||||||
U.S. Government | Corporates | Asset-Backed Securities | Total | ||||||||||||
Balance at beginning of period | $ | 3,712 | $ | 9,101 | $ | 0 | $ | 12,813 | |||||||
Total gains or (losses), unrealized or realized | |||||||||||||||
Included in net earnings | 268 | 583 | 0 | 852 | |||||||||||
Included in other comprehensive income | (418 | ) | (477 | ) | 1 | (895 | ) | ||||||||
Purchases | 0 | 0 | 0 | 0 | |||||||||||
Sales | (2,968 | ) | (877 | ) | 0 | (3,845 | ) | ||||||||
Settlements | (594 | ) | (1,824 | ) | (310 | ) | (2,729 | ) | |||||||
Transfers in | 0 | 0 | 995 | 995 | |||||||||||
Transfers out | 0 | (1,331 | ) | 0 | (1,331 | ) | |||||||||
Balance at end of period | $ | 0 | $ | 5,175 | $ | 686 | $ | 5,860 | |||||||
41
INFINITY PROPERTY AND CASUALTY CORPORATION AND SUBSIDIARIES
Notes to Consolidated Financial Statements
Of the $3.3 million fair value of securities in Level 3 at December 31, 2014, which consisted of seven securities, we priced five based on non-binding broker quotes, one price was provided by our unaffiliated money manager and one security, which was included in Level 3 because it was not rated by a nationally recognized statistical rating organization, was priced by a nationally recognized pricing service.
We transferred approximately $1.3 million of securities from Level 3 into Level 2 during 2013 because we obtained a price for those securities from a third party nationally recognized pricing service. We transferred approximately $1.0 million of securities from Level 2 into Level 3 during 2013 because we could not obtain a price from a third party nationally recognized pricing service or because a rating by a NRSRO was not available. There were no transfers between Levels 2 and 3 during 2014 and there were no transfers between Levels 1 and 2 during 2014 or 2013.
The gains or losses included in net earnings are included in the line item "Net realized gains on investments" in the Consolidated Statements of Earnings. We recognize the net gains or losses included in other comprehensive income in the line item "Unrealized gains (losses) on investments, net" in the Consolidated Statements of Comprehensive Income and the line item "Change in unrealized gain on investments" or "Change in non-credit component of impairment losses on fixed maturities" in the Consolidated Statements of Changes in Shareholders’ Equity.
The following table presents the carrying value and estimated fair value of our financial instruments ($ in thousands):
December 31, 2014 | December 31, 2013 | ||||||||||||||
Carrying Value | Fair Value | Carrying Value | Fair Value | ||||||||||||
Assets: | |||||||||||||||
Cash and cash equivalents | $ | 84,541 | $ | 84,541 | $ | 134,211 | $ | 134,211 | |||||||
Available-for-sale securities | |||||||||||||||
Fixed maturities | 1,431,843 | 1,431,843 | 1,354,305 | 1,354,305 | |||||||||||
Equity securities | 94,408 | 94,408 | 91,127 | 91,127 | |||||||||||
Short-term investments | 803 | 803 | 2,596 | 2,596 | |||||||||||
Total cash and investments | $ | 1,611,594 | $ | 1,611,594 | $ | 1,582,238 | $ | 1,582,238 | |||||||
Liabilities: | |||||||||||||||
Long-term debt | $ | 275,000 | $ | 291,044 | $ | 275,000 | $ | 272,632 | |||||||
See Note 3 to the Consolidated Financial Statements for additional information on investments and Note 4 for additional information on long-term debt.
Note 3 Investments
We consider all fixed maturity and equity securities to be available-for-sale and report them at fair value with the net unrealized gains or losses reported after-tax (net of any valuation allowance) as a component of other comprehensive income. The proceeds from sales of securities for the twelve months ended December 31, 2014, were $250.8 million. These proceeds are net of $4.5 million of receivable for securities sold during 2014 that had not settled at December 31, 2014. The proceeds from sales of securities for the twelve months ended December 31, 2013, were $465.1 million. These proceeds are net of $2.8 million of receivable for securities sold during 2013 that had not settled at December 31, 2013. The proceeds from sales of securities for the twelve months ended December 31, 2012, were $491.6 million. These proceeds are net of $48.5 million of receivable for securities sold during 2012 that had not settled at December 31, 2012.
Gross gains of $5.1 million, $9.5 million and $26.0 million were realized on sales of available for sale securities during the years ending 2014, 2013, and 2012, respectively. Gross losses of $0.7 million, $2.0 million and $0.6 million were realized on sales of available for sale securities during the years ending 2014, 2013, and 2012, respectively. Gains or losses on securities are determined on a specific identification basis.
42
INFINITY PROPERTY AND CASUALTY CORPORATION AND SUBSIDIARIES
Notes to Consolidated Financial Statements
Summarized information for the major categories of our investment portfolio follows ($ in thousands):
December 31, 2014 | |||||||||||||||||||
Amortized Cost or Cost | Gross Unrealized Gains | Gross Unrealized Losses | Fair Value | OTTI Recognized in Accumulated OCI(1) | |||||||||||||||
Fixed maturities: | |||||||||||||||||||
U.S. government | $ | 66,625 | $ | 502 | $ | (193 | ) | $ | 66,933 | $ | 0 | ||||||||
State and municipal | 493,350 | 10,637 | (337 | ) | 503,650 | (69 | ) | ||||||||||||
Mortgage-backed securities: | |||||||||||||||||||
Residential | 349,371 | 6,547 | (1,390 | ) | 354,528 | (2,914 | ) | ||||||||||||
Commercial | 50,914 | 182 | (258 | ) | 50,838 | 0 | |||||||||||||
Total mortgage-backed securities | $ | 400,285 | $ | 6,729 | $ | (1,648 | ) | $ | 405,366 | $ | (2,914 | ) | |||||||
Collateralized mortgage obligations | 0 | 0 | 0 | 0 | 0 | ||||||||||||||
Asset-backed securities | 58,546 | 131 | (70 | ) | 58,607 | (8 | ) | ||||||||||||
Corporates | 393,611 | 5,999 | (2,324 | ) | 397,286 | (441 | ) | ||||||||||||
Total fixed maturities | $ | 1,412,417 | $ | 23,998 | $ | (4,572 | ) | $ | 1,431,843 | $ | (3,433 | ) | |||||||
Equity securities | 77,862 | 16,546 | 0 | 94,408 | 0 | ||||||||||||||
Short-term investments | 803 | 0 | (1 | ) | 803 | 0 | |||||||||||||
Total | $ | 1,491,082 | $ | 40,544 | $ | (4,573 | ) | $ | 1,527,054 | $ | (3,433 | ) | |||||||
December 31, 2013 | |||||||||||||||||||
Amortized Cost or Cost | Gross Unrealized Gains | Gross Unrealized Losses | Fair Value | OTTI Recognized in Accumulated OCI(1) | |||||||||||||||
Fixed maturities: | |||||||||||||||||||
U.S. government | $ | 64,194 | $ | 900 | $ | (427 | ) | $ | 64,666 | $ | 0 | ||||||||
State and municipal | 478,092 | 10,789 | (1,771 | ) | 487,111 | (73 | ) | ||||||||||||
Mortgage-backed securities: | |||||||||||||||||||
Residential | 330,169 | 1,985 | (8,809 | ) | 323,346 | (2,435 | ) | ||||||||||||
Commercial | 35,781 | 339 | (304 | ) | 35,816 | 0 | |||||||||||||
Total mortgage-backed securities | $ | 365,950 | $ | 2,324 | $ | (9,113 | ) | $ | 359,162 | $ | (2,435 | ) | |||||||
Collateralized mortgage obligations | 1,228 | 63 | 0 | 1,291 | (161 | ) | |||||||||||||
Asset-backed securities | 71,183 | 178 | (103 | ) | 71,259 | (8 | ) | ||||||||||||
Corporates | 364,430 | 9,086 | (2,700 | ) | 370,816 | (612 | ) | ||||||||||||
Total fixed maturities | $ | 1,345,077 | $ | 23,340 | $ | (14,112 | ) | $ | 1,354,305 | $ | (3,290 | ) | |||||||
Equity securities | 74,718 | 16,409 | 0 | 91,127 | 0 | ||||||||||||||
Short-term investments | 2,595 | 1 | 0 | 2,596 | 0 | ||||||||||||||
Total | $ | 1,422,390 | $ | 39,750 | $ | (14,112 | ) | $ | 1,448,027 | $ | (3,290 | ) | |||||||
(1) The total non-credit portion of OTTI recognized in Accumulated OCI reflecting the original non-credit loss at the time the credit impairment was determined. | |||||||||||||||||||
43
INFINITY PROPERTY AND CASUALTY CORPORATION AND SUBSIDIARIES
Notes to Consolidated Financial Statements
The following table sets forth the amount of unrealized loss by investment category and length of time that individual securities have been in a continuous unrealized loss position ($ in thousands):
Less than 12 Months | 12 Months or More | ||||||||||||||||||||||||
December 31, 2014 | Number of Securities with Unrealized Losses | Fair Value | Gross Unrealized Losses | Unrealized Losses as % of Cost | Number of Securities with Unrealized Losses | Fair Value | Gross Unrealized Losses | Unrealized Losses as % of Cost | |||||||||||||||||
Fixed maturities: | |||||||||||||||||||||||||
U.S. government | 2 | $ | 5,275 | $ | (13 | ) | 0.3 | % | 8 | $ | 21,051 | $ | (180 | ) | 0.8 | % | |||||||||
State and municipal | 45 | 108,721 | (290 | ) | 0.3 | % | 2 | 4,183 | (47 | ) | 1.1 | % | |||||||||||||
Mortgage-backed securities: | |||||||||||||||||||||||||
Residential | 24 | 12,855 | (34 | ) | 0.3 | % | 109 | 100,752 | (1,356 | ) | 1.3 | % | |||||||||||||
Commercial | 8 | 15,638 | (122 | ) | 0.8 | % | 5 | 9,519 | (136 | ) | 1.4 | % | |||||||||||||
Total mortgage-backed securities | 32 | 28,493 | (156 | ) | 0.5 | % | 114 | 110,271 | (1,492 | ) | 1.3 | % | |||||||||||||
Asset-backed securities | 24 | 23,351 | (60 | ) | 0.3 | % | 2 | 1,150 | (9 | ) | 0.8 | % | |||||||||||||
Corporate | 103 | 142,046 | (1,820 | ) | 1.3 | % | 16 | 19,865 | (503 | ) | 2.5 | % | |||||||||||||
Total fixed maturities | 206 | 307,886 | (2,340 | ) | 0.8 | % | 142 | 156,521 | (2,232 | ) | 1.4 | % | |||||||||||||
Equity securities | 0 | 0 | 0 | 0.0 | % | 0 | 0 | 0 | 0.0 | % | |||||||||||||||
Short-term investments | 2 | 803 | (1 | ) | 0.1 | % | 0 | 0 | 0 | 0.0 | % | ||||||||||||||
Total | 208 | $ | 308,689 | $ | (2,341 | ) | 0.8 | % | 142 | $ | 156,521 | $ | (2,232 | ) | 1.4 | % | |||||||||
Less than 12 Months | 12 Months or More | ||||||||||||||||||||||||
December 31, 2013 | Number of Securities with Unrealized Losses | Fair Value | Gross Unrealized Losses | Unrealized Losses as % of Cost | Number of Securities with Unrealized Losses | Fair Value | Gross Unrealized Losses | Unrealized Losses as % of Cost | |||||||||||||||||
Fixed maturities: | |||||||||||||||||||||||||
U.S. government | 11 | $ | 26,396 | $ | (427 | ) | 1.6 | % | 0 | $ | 0 | $ | 0 | 0.0 | % | ||||||||||
State and municipal | 51 | 121,431 | (1,425 | ) | 1.2 | % | 4 | 8,062 | (346 | ) | 4.1 | % | |||||||||||||
Mortgage-backed securities: | |||||||||||||||||||||||||
Residential | 229 | 207,821 | (7,064 | ) | 3.3 | % | 34 | 39,659 | (1,744 | ) | 4.2 | % | |||||||||||||
Commercial | 11 | 22,311 | (290 | ) | 1.3 | % | 1 | 756 | (14 | ) | 1.8 | % | |||||||||||||
Total mortgage-backed securities | 240 | 230,133 | (7,354 | ) | 3.1 | % | 35 | 40,415 | (1,758 | ) | 4.2 | % | |||||||||||||
Asset-backed securities | 18 | 14,738 | (103 | ) | 0.7 | % | 0 | 0 | 0 | 0.0 | % | ||||||||||||||
Corporate | 90 | 115,735 | (2,621 | ) | 2.2 | % | 1 | 1,212 | (79 | ) | 6.1 | % | |||||||||||||
Total fixed maturities | 410 | 508,432 | (11,929 | ) | 2.3 | % | 40 | 49,688 | (2,183 | ) | 4.2 | % | |||||||||||||
Equity securities | 0 | 0 | 0 | 0.0 | % | 0 | 0 | 0 | 0.0 | % | |||||||||||||||
Short-term investments | 0 | 0 | 0 | 0.0 | % | 0 | 0 | 0 | 0.0 | % | |||||||||||||||
Total | 410 | $ | 508,432 | $ | (11,929 | ) | 2.3 | % | 40 | $ | 49,688 | $ | (2,183 | ) | 4.2 | % | |||||||||
44
INFINITY PROPERTY AND CASUALTY CORPORATION AND SUBSIDIARIES
Notes to Consolidated Financial Statements
The determination of whether unrealized losses are “other-than-temporary” requires judgment based on subjective as well as objective factors. Factors we considered and resources we used in our determination include:
• | whether the unrealized loss is credit-driven or a result of changes in market interest rates; |
• | the length of time the security’s market value has been below its cost; |
• | the extent to which fair value is less than cost basis; |
• | the intent to sell the security; |
• | whether it is more likely than not that there will be a requirement to sell the security before its anticipated recovery; |
• | historical operating, balance sheet and cash flow data contained in issuer SEC filings; |
• | issuer news releases; |
• | near-term prospects for improvement in the issuer and/or its industry; |
• | industry research and communications with industry specialists; and |
• | third-party research and credit rating reports. |
We regularly evaluate for potential impairment each security position that has either of the following: a fair value of less than 95% of its book value or an unrealized loss that equals or exceeds $100,000.
The following table summarizes those securities, excluding the rabbi trust, with unrealized gains or losses:
December 31, 2014 | December 31, 2013 | ||||
Number of positions held with unrealized: | |||||
Gains | 778 | 590 | |||
Losses | 350 | 450 | |||
Number of positions held that individually exceed unrealized: | |||||
Gains of $500,000 | 3 | 1 | |||
Losses of $500,000 | 0 | 0 | |||
Percentage of positions held with unrealized: | |||||
Gains that were investment grade | 92 | % | 81 | % | |
Losses that were investment grade | 84 | % | 93 | % | |
Percentage of fair value held with unrealized: | |||||
Gains that were investment grade | 94 | % | 88 | % | |
Losses that were investment grade | 86 | % | 95 | % | |
45
INFINITY PROPERTY AND CASUALTY CORPORATION AND SUBSIDIARIES
Notes to Consolidated Financial Statements
The following table sets forth the amount of unrealized losses, excluding the rabbi trust, by age and severity at December 31, 2014 ($ in thousands):
Fair Value of Securities with Unrealized Losses | Total Gross Unrealized Losses | Less Than 5%* | 5% - 10%* | Total Gross Greater Than 10%* | |||||||||||||||
Age of Unrealized Losses: | |||||||||||||||||||
Three months or less | $ | 245,391 | $ | (1,077 | ) | $ | (1,004 | ) | $ | (74 | ) | $ | 0 | ||||||
Four months through six months | 49,083 | (1,018 | ) | (585 | ) | (334 | ) | (99 | ) | ||||||||||
Seven months through nine months | 11,639 | (171 | ) | (135 | ) | (36 | ) | 0 | |||||||||||
Ten months through twelve months | 2,576 | (74 | ) | (74 | ) | 0 | 0 | ||||||||||||
Greater than twelve months | 156,521 | (2,232 | ) | (2,044 | ) | 0 | (188 | ) | |||||||||||
Total | $ | 465,210 | $ | (4,573 | ) | $ | (3,842 | ) | $ | (443 | ) | $ | (288 | ) | |||||
* | As a percentage of amortized cost or cost. |
The change in unrealized gains (losses) on securities included the following ($ in thousands):
Pretax | |||||||||||||||||||
Fixed Maturities | Equity Securities | Short-Term Investments | Tax Effects | Net | |||||||||||||||
December 31, 2014 | |||||||||||||||||||
Unrealized holding gains (losses) on securities arising during the period | $ | 13,174 | $ | 1,440 | $ | 4 | $ | (5,116 | ) | $ | 9,502 | ||||||||
Realized (gains) losses included in net earnings | (3,137 | ) | (1,303 | ) | (5 | ) | 1,556 | (2,889 | ) | ||||||||||
Impairment losses recognized in net earnings | 160 | 0 | 0 | (56 | ) | 104 | |||||||||||||
Change in unrealized gain (loss) on securities, net | $ | 10,198 | $ | 137 | $ | (1 | ) | $ | (3,617 | ) | $ | 6,717 | |||||||
December 31, 2013 | |||||||||||||||||||
Unrealized holding gains (losses) on securities arising during the period | $ | (29,199 | ) | $ | 13,971 | $ | 1 | $ | 5,330 | $ | (9,898 | ) | |||||||
Realized (gains) losses included in net earnings | (6,818 | ) | (677 | ) | 0 | 2,623 | (4,872 | ) | |||||||||||
Impairment losses recognized in net earnings | 1,468 | 0 | 0 | (514 | ) | 954 | |||||||||||||
Change in unrealized gain (loss) on securities, net | $ | (34,549 | ) | $ | 13,294 | $ | 1 | $ | 7,439 | $ | (13,815 | ) | |||||||
December 31, 2012 | |||||||||||||||||||
Unrealized holding gains (losses) on securities arising during the period | $ | 10,678 | $ | 6,451 | $ | 0 | $ | (5,995 | ) | $ | 11,134 | ||||||||
Realized (gains) losses included in net earnings(1) | (11,594 | ) | (13,853 | ) | 0 | 8,907 | (16,541 | ) | |||||||||||
Impairment losses recognized in net earnings | 1,393 | 0 | 0 | (487 | ) | 905 | |||||||||||||
Change in unrealized gain (loss) on securities, net | $ | 476 | $ | (7,402 | ) | $ | 0 | $ | 2,424 | $ | (4,502 | ) | |||||||
(1) The tax effect is exclusive of the release of the deferred tax valuation allowance of $6.4 million in 2012. | |||||||||||||||||||
46
INFINITY PROPERTY AND CASUALTY CORPORATION AND SUBSIDIARIES
Notes to Consolidated Financial Statements
For fixed maturity securities that are other-than-temporarily impaired, we assess our intent to sell and the likelihood that we
will be required to sell the security before recovery of our amortized cost. If a fixed maturity security is considered other-than temporarily impaired but we do not intend to and are not more than likely to be required to sell the security before our recovery
to amortized cost, we separate the amount of the impairment into a credit loss component and the amount due to all other
factors. The excess of the amortized cost over the present value of the expected cash flows determines the credit loss
component of an impairment charge on a fixed maturity security. The present value is determined using the best estimate of
cash flows discounted at (1) the effective interest rate implicit at the date of acquisition for non-structured securities or (2) the
book yield for structured securities. The techniques and assumptions for determining the best estimate of cash flows vary
depending on the type of security. We recognize the credit loss component of an impairment charge in net earnings and the non-credit component in accumulated other comprehensive income. If we intend to sell or will, more likely than not, be required to sell a security, we treat the entire amount of the impairment as a credit loss.
For our securities held with unrealized losses, we believe, based on our analysis, that we will recover our cost basis in these securities and we do not intend to sell the securities nor is it more likely than not that there will be a requirement to sell the securities before they recover in value.
The following table is a progression of credit losses on fixed maturity securities that were bifurcated between a credit and non-credit component ($ in thousands):
2014 | 2013 | ||||||
Balance at beginning of year | $ | 956 | $ | 487 | |||
Additions for: | |||||||
Previously impaired securities | 19 | 27 | |||||
Newly impaired securities | 15 | 659 | |||||
Previously all credit | 0 | 26 | |||||
Reductions for: | |||||||
Securities sold and paydowns | (139 | ) | (206 | ) | |||
Securities that no longer have a non-credit component | 0 | (37 | ) | ||||
Balance at end of year | $ | 852 | $ | 956 | |||
The table below sets forth the scheduled maturities of fixed maturity securities at December 31, 2014, based on their fair values
($ in thousands). We report securities that do not have a single maturity date at average maturity. Actual maturities may differ
from contractual maturities because certain securities may be called or prepaid by the issuers.
Amortized | |||||||||||||||||||
Fair Value | Cost | ||||||||||||||||||
Maturity | Securities with Unrealized Gains | Securities with Unrealized Losses | Securities with No Unrealized Gains or Losses | All Fixed Maturity Securities | All Fixed Maturity Securities | ||||||||||||||
One year or less | $ | 89,487 | $ | 9,567 | $ | 1,102 | $ | 100,156 | $ | 99,523 | |||||||||
After one year through five years | 392,906 | 190,302 | 1,353 | 584,560 | 575,609 | ||||||||||||||
After five years through ten years | 165,735 | 100,053 | 1,777 | 267,565 | 263,488 | ||||||||||||||
After ten years | 11,741 | 1,219 | 2,628 | 15,588 | 14,966 | ||||||||||||||
Mortgage- and asset-backed | 297,407 | 163,266 | 3,301 | 463,973 | 458,831 | ||||||||||||||
Total | $ | 957,275 | $ | 464,407 | $ | 10,160 | $ | 1,431,843 | $ | 1,412,417 | |||||||||
47
INFINITY PROPERTY AND CASUALTY CORPORATION AND SUBSIDIARIES
Notes to Consolidated Financial Statements
Net Investment Income
The following table shows investment income earned and investment expenses incurred ($ in thousands):
Twelve months ended December 31, | |||||||||||
2014 | 2013 | 2012 | |||||||||
Investment income: | |||||||||||
Interest income on fixed maturities, cash and cash equivalents | $ | 35,596 | $ | 36,113 | $ | 38,234 | |||||
Dividends on equity securities | 2,245 | 1,711 | 1,415 | ||||||||
Gross investment income | 37,841 | 37,825 | 39,649 | ||||||||
Investment expenses | (2,211 | ) | (2,279 | ) | (2,077 | ) | |||||
Net investment income | $ | 35,629 | $ | 35,546 | $ | 37,571 | |||||
Note 4 Long-Term Debt
In February 2004 we issued $200 million principal of senior notes due February 2014 (the “5.5% Senior Notes”). The 5.5%
Senior Notes accrued interest at an effective yield of 5.55% and bore a coupon of 5.5%, payable semiannually. At the time we
issued the 5.5% Senior Notes, we capitalized $2.1 million of debt issuance costs, which we amortized over the term of the 5.5%
Senior Notes. During 2009, we repurchased $5.0 million of the 5.5% Senior Notes, bringing the outstanding principal to $195.0 million. The 5.5% Senior Notes were fully redeemed on October 17, 2012, at a price of 106.729%, or $208.1 million, plus accrued interest of $1.8 million. The remaining $0.4 million issuance costs were written off at redemption.
In September 2012 we issued $275 million principal of senior notes due September 2022 (the “5.0% Senior Notes”). The 5.0%
Senior Notes accrue interest at 5.0%, payable semiannually. At the time we issued the 5.0% Senior Notes, we capitalized $2.2
million of debt issuance costs, which we are amortizing over the term of the 5.0% Senior Notes. We calculated the
December 31, 2014, fair value of $291.0 million using a 194 basis point spread to the ten year U.S. Treasury Note of 2.173%.
We paid interest on long-term debt of $13.8 million, $13.8 million and $12.5 million for the twelve months ended December 31, 2014, 2013 and 2012, respectively.
In August 2014 we renewed our agreement for a $50 million three-year revolving credit facility (the “Credit Agreement”) that
requires us to meet certain financial and other covenants. We are currently in compliance with all covenants under the Credit
Agreement. At December 31, 2014, there were no borrowings outstanding under the Credit Agreement.
48
INFINITY PROPERTY AND CASUALTY CORPORATION AND SUBSIDIARIES
Notes to Consolidated Financial Statements
Note 5 Income Taxes
In the years 2014, 2013 and 2012, we paid $20.9 million, $7.6 million and $9.0 million, respectively, in taxes. The following is a reconciliation of income taxes at the statutory rate of 35.0% to the effective provision for income taxes as shown in the Consolidated Statements of Earnings ($ in thousands):
Twelve Months December 31, | |||||||||||
2014 | 2013 | 2012 | |||||||||
Earnings before income taxes | $ | 83,138 | $ | 45,078 | $ | 22,088 | |||||
Income taxes at statutory rate | 29,098 | 15,777 | 7,731 | ||||||||
Effect of: | |||||||||||
Dividends-received deduction | (469 | ) | (357 | ) | (296 | ) | |||||
Tax-exempt interest | (2,752 | ) | (2,743 | ) | (3,294 | ) | |||||
Adjustment to valuation allowance | 1 | (48 | ) | (6,402 | ) | ||||||
Other | 58 | (184 | ) | 30 | |||||||
Provision for income taxes as shown on the Consolidated Statements of Earnings | $ | 25,936 | $ | 12,445 | $ | (2,231 | ) | ||||
GAAP effective tax rate | 31.2 | % | 27.6 | % | (10.1 | )% | |||||
The total income tax provision (benefit) consists of ($ in thousands):
2014 | 2013 | 2012 | |||||||||
Current | $ | 25,342 | $ | 10,541 | $ | 3,605 | |||||
Deferred | 594 | 1,904 | (5,836 | ) | |||||||
Provision for income taxes | $ | 25,936 | $ | 12,445 | $ | (2,231 | ) | ||||
A full valuation allowance was maintained on the deferred tax asset relating to the credit portion of the reserve for other-than-temporarily impaired securities. In 2012, a security which accounted for approximately 77% of the balance in the reserve for other-than-temporarily impaired securities was sold. As of December 31, 2012, management determined that it was more likely than not that the deferred tax asset relating to the reserve for other-than-temporarily impaired securities would be recognized and the valuation allowance was released through the provision for income taxes.
49
INFINITY PROPERTY AND CASUALTY CORPORATION AND SUBSIDIARIES
Notes to Consolidated Financial Statements
Deferred income tax assets and liabilities reflect temporary differences between the carrying amounts of assets and liabilities recognized for financial reporting purposes and the amounts recognized for tax purposes. The significant components of deferred tax assets and liabilities included in the Consolidated Balance Sheets were as follows ($ in thousands):
As of December 31, | |||||||
2014 | 2013 | ||||||
Deferred tax assets: | |||||||
Discount on loss reserves | $ | 6,001 | $ | 7,045 | |||
Unearned premium reserve | 40,918 | 39,401 | |||||
Bad debts | 5,428 | 5,559 | |||||
Accrued bonuses | 2,791 | 2,442 | |||||
Deferred compensation | 5,372 | 4,842 | |||||
Long-term incentive compensation | 1,193 | 2,040 | |||||
Other | 5,157 | 5,473 | |||||
Gross deferred tax assets | $ | 66,860 | $ | 66,803 | |||
Valuation allowance for deferred tax assets | (166 | ) | (165 | ) | |||
Total deferred tax assets | $ | 66,694 | $ | 66,638 | |||
Deferred tax liabilities: | |||||||
Deferred policy acquisition costs | $ | (31,650 | ) | $ | (30,890 | ) | |
Investment securities – unrealized gains | (12,590 | ) | (8,973 | ) | |||
Other | (1,951 | ) | (2,111 | ) | |||
Total deferred tax liabilities | $ | (46,191 | ) | $ | (41,975 | ) | |
Net deferred tax assets | $ | 20,503 | $ | 24,663 | |||
Current income taxes | (481 | ) | 3,985 | ||||
Current and deferred income taxes | $ | 20,022 | $ | 28,648 | |||
An analysis is performed on a quarterly basis to determine if there is sufficient evidence that it is more likely than not that the deferred tax assets will be recognized for tax purposes. The evidence that is considered in assessing the need for a valuation allowance includes: (i) sufficient future taxable income; (ii) sufficient ordinary and capital taxable income in carryback periods; (iii) the reversals of existing taxable temporary differences; and (iv) tax planning strategies that could be utilized to accelerate the recognition of capital gains in the future. Based on this evaluation, it is management’s belief the only valuation allowance required at December 31, 2014, and December 31, 2013, related to the net operating loss carryover for an inactive company that is required to file its federal tax return on a separate company basis.
We did not have any gross unrecognized tax benefits that would exceed a materiality threshold and therefore, there was no reduction to Retained Earnings in our Consolidated Balance Sheets at January 1, 2014. The gross unrecognized tax benefit did not exceed the materiality threshold as of December 31, 2014.
The Company is not currently under examination by the IRS and the statute of limitations has expired for all years prior to 2011.
50
INFINITY PROPERTY AND CASUALTY CORPORATION AND SUBSIDIARIES
Notes to Consolidated Financial Statements
Note 6 Computation of Net Earnings per Share
The following table illustrates our computations of basic and diluted net earnings per common share ($ in thousands, except per share figures):
Twelve months ended December 31, | |||||||||||
2014 | 2013 | 2012 | |||||||||
Net earnings | $ | 57,201 | $ | 32,633 | $ | 24,319 | |||||
Average basic shares outstanding | 11,440 | 11,451 | 11,660 | ||||||||
Basic net earnings per share | $ | 5.00 | $ | 2.85 | $ | 2.09 | |||||
Average basic shares outstanding | 11,440 | 11,451 | 11,660 | ||||||||
Restricted stock not vested | 37 | 46 | 28 | ||||||||
Dilutive effect of assumed option exercises | 1 | 29 | 97 | ||||||||
Dilutive effect of Performance Share Plan | 84 | 130 | 156 | ||||||||
Average diluted shares outstanding | 11,562 | 11,657 | 11,941 | ||||||||
Diluted net earnings per share | $ | 4.95 | $ | 2.80 | $ | 2.04 | |||||
Note 7 Share-Based Compensation
We established the Amended and Restated 2013 Stock Incentive Plan (the “2013 Plan”), which was approved by the Company’s shareholders on May 21, 2013. Under the 2013 Plan, 750,000 shares are authorized and reserved for issuance. Upon the approval by the shareholders of the 2013 Plan, we became prohibited from issuing any further grants under the Restricted Stock Plan, Directors’ Plan, Performance Share Plan, or Stock Option Plan (collectively, the "Prior Plans"). However, all outstanding awards under the Prior Plans remain outstanding and will continue to be administered and settled with the applicable provisions of the Prior Plans.
The number of shares issued, by plan, for share-based compensation arrangements was as follows:
2014 | 2013 | 2012 | |||||||
2013 Plan | Prior Plans | 2013 Plan | Prior Plans | ||||||
Restricted Stock | 46,328 | 0 | 0 | 0 | 0 | ||||
Non-employee Directors’ Stock | 8,016 | 0 | 6,517 | 0 | 5,502 | ||||
Performance Shares | 0 | 55,245 | 0 | 17,934 | 49,098 | ||||
Total | 54,344 | 55,245 | 6,517 | 17,934 | 54,600 | ||||
The amount of total compensation cost for share-based compensation arrangements was as follows ($ in thousands):
Twelve months ended December 31, | |||||||||||||||||||||||
2014 | 2013 | 2012 | |||||||||||||||||||||
Expense Recognized in Earnings | Tax Benefit | Expense Recognized in Earnings | Tax Benefit | Expense Recognized in Earnings | Tax Benefit | ||||||||||||||||||
Restricted Stock | $ | 1,126 | $ | 394 | $ | 1,190 | $ | 417 | $ | 1,190 | $ | 417 | |||||||||||
Non-employee Directors’ Stock Ownership Plan | 520 | 182 | 385 | 135 | 300 | 105 | |||||||||||||||||
Employee Stock Purchase Plan | 55 | 0 | 54 | 0 | 55 | 0 | |||||||||||||||||
Performance Shares | 933 | 327 | 2,380 | 833 | 1,704 | 596 | |||||||||||||||||
Total | $ | 2,634 | $ | 903 | $ | 4,009 | $ | 1,384 | $ | 3,249 | $ | 1,118 | |||||||||||
51
INFINITY PROPERTY AND CASUALTY CORPORATION AND SUBSIDIARIES
Notes to Consolidated Financial Statements
Restricted Stock
On August 2, 2011, the Compensation Committee ("the Committee") approved the grant of 72,234 shares of restricted stock to certain officers under the Restricted Stock Plan. These shares vested in full on August 2, 2014. On August 5, 2014, the Committee approved the grant of an additional 46,328 shares of restricted stock to certain officers under the 2013 Plan. These shares will vest in full on August 5, 2017. During the vesting period, the shares of restricted stock will not have voting rights but will accrue dividends, which we will not pay until the shares have vested. We treat the restricted shares as issued and outstanding for calculation of diluted earnings per share only. Until fully vested, we will not consider the shares issued and outstanding for purposes of the basic earnings per share calculation.
Restricted Stock | Number of Shares | Weighted-average Grant Date Fair Value | ||
Non-vested as of January 1, 2014 | 72,234 | $49.44 | ||
Granted | 46,328 | $67.04 | ||
Vested | (72,234 | ) | $49.44 | |
Non-vested as of December 31, 2014 | 46,328 | $67.04 | ||
Non-employee Directors’ Stock
Shares are issued to non-employee directors on or about June 1 of each year as part of the compensation provided and to provide for stock ownership requirements for our non-employee directors. We restrict these shares from sale or transfer by any recipient for six months from the grant date. These shares are treated as issued and outstanding for basic and diluted earnings per share calculations.
Performance Shares
The purpose of the Performance Shares is to align further the interest of management with our long-term shareholders by including performance-based compensation, payable in shares of common stock, as a component of an executive’s annual compensation. The Committee administers the Performance Shares and (i) establishes the performance goals, which may include but are not limited to, combined ratio, premium growth, growth within certain geographic areas and earnings per share or return on equity over the course of the upcoming three year period, (ii) determines the Performance Share participants, (iii) sets the performance share units to be awarded to such participants, and (iv) sets the rate at which performance share units will convert to shares of common stock based upon attainment of the performance goals.
Stock Option Plan
We have not granted options under this plan since 2004. We generally granted options with an exercise price equal to the closing price of our stock at the date of grant with a 10 year contractual life. All of the options under this plan have fully vested. As of February 13, 2014, all options granted under the SOP had either expired or been exercised.
Optionees must make payment for shares purchased upon exercise by tendering cash, by delivery of shares of common stock already owned by the optionee having a fair market value equal to the cash option price of the shares, by assigning the proceeds of a sale or loan with respect to some or all of the shares being acquired (subject to applicable law), by a combination of the foregoing or by any other method.
Persons who received options incurred no federal income tax liability at the time of grant. Persons exercising nonqualified options recognize taxable income, and we have a tax deduction at the time of exercise to the extent of the difference between market price on the day of exercise and the exercise price. Persons exercising incentive stock options defer the recognition of taxable income until they sell the underlying common stock. Sales within two years of the date of grant or one year of the date of exercise result in taxable income to the holder and a deduction for us, both measured by the difference between the market price at the time of sale and the exercise price. Sales after such period are treated as capital transactions to the holder, and we receive no deduction. The foregoing is only a summary of the federal income tax rules applicable to options granted under the
52
INFINITY PROPERTY AND CASUALTY CORPORATION AND SUBSIDIARIES
Notes to Consolidated Financial Statements
plan and is not intended to be complete. In addition, this summary does not discuss the effect of the income or other tax laws of any state or foreign country in which a participant may reside.
We estimated the weighted-average grant date fair value of options granted during 2004 using the modified Black-Scholes valuation model and the following weighted-average assumptions:
2004 Grants | |||
Weighted-average grant date fair value | $ | 13.87 | |
Dividend yield | 0.7 | % | |
Expected volatility | 33.0 | % | |
Risk-free interest rate | 4.3 | % | |
Expected life (in years) | 7.5 | ||
Weighted-average grant exercise price | $ | 33.56 | |
Outstanding as of December 31, 2014 | 0 | ||
The following table describes activity for our SOP for the twelve-month period ended December 31, 2014:
Options | Number of Options | Weighted- Average Exercise Price | Weighted- Average Remaining Term (in years) | Aggregate Intrinsic Value (a) (in millions) | ||||||||
Outstanding as of January 1, 2014 | 16,000 | $ | 33.58 | |||||||||
Exercised | (14,000 | ) | 33.58 | |||||||||
Forfeited | (2,000 | ) | 33.58 | |||||||||
Outstanding as of December 31, 2014 | 0 | $ | 0 | 0 | $ | 0 | ||||||
Vested as of December 31, 2014 | 0 | $ | 0 | 0 | $ | 0 | ||||||
Exercisable as of December 31, 2014 | 0 | $ | 0 | 0 | $ | 0 | ||||||
(a) | The intrinsic value for the stock options is calculated based on the difference between the exercise price of the underlying awards and our closing stock price as of the reporting date. |
Cash received from option exercises for the years ended December 31, 2014, 2013 and 2012 were $0.2 million, $1.3 million and $0.6 million, respectively. The actual tax benefit realized for the tax deductions from options exercised for the years ended December 31, 2014, 2013 and 2012 totaled $0.1 million, $0.5 million and $0.6 million, respectively. The total intrinsic value of options exercised during the years ended December 31, 2014, 2013 and 2012, was approximately $0.5 million, $2.4 million and $3.9 million, respectively.
In 2014 a senior executive of the company surrendered to the company 3,361 shares of stock owned in order to exercise 7,500 options.
We have a policy of issuing new stock for the exercise of options.
Employee Stock Purchase Plan
Under the ESPP, all eligible full-time employees may purchase shares of our common stock at a 15% discount to the current market price. Employees may allocate up to 25% of their base salary with a maximum annual participation amount of $25,000. If a participant sells any shares purchased under the ESPP within one year, we preclude that employee from participating in the
ESPP for one year from the date of sale. The source of shares issued to participants is treasury shares or authorized but
previously unissued shares. The maximum number of shares that we may issue under the ESPP may not exceed 1,000,000, of which we have issued 65,341 as of December 31, 2014. Our ESPP is qualified under Section 423 of the Internal Revenue Code of 1986, as amended. We treat participants’ shares as issued and outstanding for basic and diluted earnings per share calculations.
53
INFINITY PROPERTY AND CASUALTY CORPORATION AND SUBSIDIARIES
Notes to Consolidated Financial Statements
Note 8 Benefit Plans
We provide retirement benefits for all eligible employees by matching contributions made on participants' discretionary basis to participants' accounts in our qualified 401(k) Retirement Plan. Eligible employees may contribute up to a maximum of the lesser of $17,500 per year or 25% of the participant's salary in 2014. Participants age 50 or over at the end of the calendar year may make an additional elective deferral contribution of up to $5,500 for 2014. These additional contributions (commonly referred to as catch-up contributions) are not subject to the general limits that apply to 401(k) plans. The matching percentage made by us was 100% of participants' contributions up to a ceiling of 4% and 50% of the next 2% of contributions with a maximum match of $13,000 in 2014. The plan expense was $5.1 million, $4.9 million and $4.6 million for the twelve-month periods ended December 31, 2014, 2013 and 2012, respectively.
Our Supplemental Employee Retirement Plan (“SERP”) is a non-qualified deferred compensation plan that enables eligible employees to contribute and to receive employer-matching contributions that the provisions of the 401(k) Retirement Plan or laws preclude due to limits on compensation. We amended the SERP effective January 1, 2010, to permit participants to make contributions and to permit us to make matching contributions on compensation that exceeds the statutory annual compensation limit of $260,000 for qualified defined contribution plans. We contributed $0.1 million to the SERP for each of the years ended December 31, 2014, 2013 and 2012. We maintain a rabbi trust that includes investments to fund the SERP. As of December 31, 2014, investments in the rabbi trust totaled $1.6 million. We reflected these investments at fair value as equity securities on the Consolidated Balance Sheets.
We maintain a non-qualified deferred compensation plan for certain highly compensated employees, which permits the participants to defer a portion of their salaries and bonuses. The deferred amounts accrue interest at our approximate long-term borrowing rate. The deferred amounts are our general obligation liability and amounted to $15.3 million, $13.8 million and $12.4 million at December 31, 2014, 2013 and 2012, respectively. We credited interest of approximately $0.7 million, $0.6 million and $0.6 million for these same periods.
We also provide post-retirement medical and life insurance benefits to certain eligible retirees. During 2006, we determined that the benefits provided under this plan were actuarially equivalent to those benefits provided by the Medicare Prescription Drug, Improvement and Modernization Act of 2003 (“MMA”). Our calculation of the accumulated post-retirement benefit obligation (“APBO”) as of December 31, 2014, 2013 and 2012 does not reflect the government subsidy provided by the MMA, other than as reflected in the insured over 65 rates going forward.
Unrecognized actuarial gains of $0.5 million ($0.3 million net of tax) and prior service costs of $0.3 million ($0.2 million net of tax) that have not yet been recognized in net periodic post-retirement benefit costs are included in accumulated other comprehensive income at December 31, 2014. We expect to recognize less than a $0.1 million actuarial gain and $0.1 million of amortization of prior service costs in net periodic post-retirement benefit income during the fiscal year ended December 31, 2015.
We recognized the unfunded status of the APBO plan of $4.3 million at December 31, 2014 in the Consolidated Balance Sheets. We expect no plan assets to be returned to us during the fiscal year ended December 31, 2015.
The following tables show data related to the APBO plan ($ in thousands):
2014 | 2013 | ||||||
Net benefit obligation at beginning of year | $ | 4,473 | $ | 5,004 | |||
Service cost | 198 | 331 | |||||
Interest cost | 150 | 159 | |||||
Participant contributions | 28 | 27 | |||||
Plan amendment | (660 | ) | 0 | ||||
Assumption change | 534 | (342 | ) | ||||
Actuarial (gain) loss | (120 | ) | (364 | ) | |||
Gross benefits paid | (291 | ) | (342 | ) | |||
Net benefit obligation at end of year | $ | 4,313 | $ | 4,473 | |||
The 2014 $0.7 million plan amendment relates to a modification in the premium charged to eligible retirees.
54
INFINITY PROPERTY AND CASUALTY CORPORATION AND SUBSIDIARIES
Notes to Consolidated Financial Statements
The following table discloses the components of net periodic post-retirement benefit cost ($ in thousands):
2014 | 2013 | 2012 | |||||||||
Service cost | $ | 198 | $ | 331 | $ | 119 | |||||
Interest cost | 150 | 159 | 136 | ||||||||
Amortization of prior service cost | 71 | 199 | 0 | ||||||||
Amortization of net cumulative (gain)/loss | (81 | ) | 0 | (23 | ) | ||||||
Net periodic post-retirement benefit cost | $ | 339 | $ | 690 | $ | 232 | |||||
The following table discloses discount rates used to determine benefit obligations:
2014 | 2013 | 2012 | |||
Discount rate | 3.50% | 4.10% | 3.30% | ||
The weighted average health care cost trend rate used in measuring the accumulated post-retirement benefit cost is 8.0% for 2015, declining to 5.0% in 2036.
The following table discloses the effects of a hypothetical one percentage point increase and the effects of a hypothetical one percentage point decrease in the assumed healthcare trend rate ($ in thousands):
2014 | 2013 | 2012 | ||||||||
A one percentage point hypothetical change in the assumed healthcare trend rate would have the following effect on the post-retirement benefit obligations: | ||||||||||
1% increase | $ | 396 | 349 | 389 | ||||||
1% decrease | (348 | ) | (318 | ) | (363 | ) | ||||
A one percentage point hypothetical change in the assumed healthcare trend rate would have the following effect on the aggregate of the service and interest cost components of net periodic post-retirement healthcare benefit costs: | ||||||||||
1% increase | $ | 40 | 53 | $ | 56 | |||||
1% decrease | (34 | ) | (47 | ) | (49 | ) | ||||
55
INFINITY PROPERTY AND CASUALTY CORPORATION AND SUBSIDIARIES
Notes to Consolidated Financial Statements
The following table reconciles the beginning and ending balances of the fair value of plan assets for the years ended December 31, 2014, and 2013 ($ in thousands):
2014 | 2013 | ||||||
Fair value of plan assets at beginning of year | $ | 0 | $ | 0 | |||
Employer contributions | 263 | 315 | |||||
Participant contributions | 28 | 27 | |||||
Gross benefits paid | (291 | ) | (342 | ) | |||
Fair value of plan assets at end of year | $ | 0 | $ | 0 | |||
The following table presents the funded status and the amounts recognized in the Consolidated Balance Sheets ($ in thousands):
2014 | 2013 | ||||||
Fair value of plan assets | $ | 0 | $ | 0 | |||
Benefit obligations | (4,313 | ) | (4,473 | ) | |||
Funded status at end of year | $ | (4,313 | ) | $ | (4,473 | ) | |
Contributions made after the measurement date | 0 | 0 | |||||
Unrecognized actuarial net (gain) loss | 0 | 0 | |||||
Unrecognized prior service cost | 0 | 0 | |||||
Net amount recognized at end of year | $ | (4,313 | ) | $ | (4,473 | ) | |
The following table presents the ten-year forecast and best estimate of expected benefit payments ($ in thousands):
2014 | 2013 | 2012 | ||||||||||||
2015 | $ | 259 | 2014 | $ | 292 | 2013 | 315 | |||||||
2016 | 294 | 2015 | 304 | 2014 | 341 | |||||||||
2017 | 304 | 2016 | 346 | 2015 | 356 | |||||||||
2018 | 314 | 2017 | 361 | 2016 | 390 | |||||||||
2019 | 337 | 2018 | 398 | 2017 | 395 | |||||||||
2020-2024 | 1,840 | 2019-2023 | 2,459 | 2018-2022 | 2,474 | |||||||||
Ten Year Total | $ | 3,348 | $ | 4,160 | 4,270 | |||||||||
Our best estimate of contributions expected to be paid to the plan during the fiscal year beginning January 1, 2015, is $0.3 million.
56
INFINITY PROPERTY AND CASUALTY CORPORATION AND SUBSIDIARIES
Notes to Consolidated Financial Statements
Note 9 Quarterly Operating Results (Unaudited)
While we recognize insurance premium on a relatively level basis, claim losses related to adverse weather (snow, hail, hurricanes, tornadoes, etc.) may be seasonal. Quarterly results rely heavily on estimates and are not necessarily indicative of results for longer periods.
The following are quarterly results of our consolidated operations for the three years ended December 31, 2014 ($ in thousands, except per share amounts):
1st Quarter | 2nd Quarter | 3rd Quarter | 4th Quarter | Total Year | |||||||||||||||
2014 | |||||||||||||||||||
Revenues | $ | 361,613 | $ | 367,954 | $ | 366,160 | $ | 365,982 | $ | 1,461,709 | |||||||||
Net earnings | 10,327 | 10,667 | 14,855 | 21,352 | 57,201 | ||||||||||||||
Net earnings per share: | |||||||||||||||||||
Basic | $ | 0.90 | $ | 0.93 | $ | 1.30 | $ | 1.87 | $ | 5.00 | |||||||||
Diluted | 0.89 | 0.92 | 1.29 | 1.85 | 4.95 | ||||||||||||||
2013 | |||||||||||||||||||
Revenues | $ | 356,102 | $ | 365,656 | $ | 359,145 | $ | 362,330 | $ | 1,443,233 | |||||||||
Net earnings | 8,662 | 7,408 | 7,195 | 9,368 | 32,633 | ||||||||||||||
Net earnings per share: | |||||||||||||||||||
Basic | $ | 0.75 | $ | 0.65 | $ | 0.63 | $ | 0.82 | $ | 2.85 | |||||||||
Diluted | 0.74 | 0.64 | 0.62 | 0.81 | 2.80 | ||||||||||||||
2012 | |||||||||||||||||||
Revenues | $ | 312,116 | $ | 331,081 | $ | 338,879 | $ | 367,510 | $ | 1,349,585 | |||||||||
Net earnings | 4,294 | 6,954 | 5,154 | 7,917 | 24,319 | ||||||||||||||
Net earnings per share: | |||||||||||||||||||
Basic | $ | 0.37 | $ | 0.59 | $ | 0.44 | $ | 0.68 | $ | 2.09 | |||||||||
Diluted | 0.35 | 0.58 | 0.43 | 0.67 | 2.04 | ||||||||||||||
Net realized gains (losses) on investments amounted to: | |||||||||||||||||||
1st Quarter | 2nd Quarter | 3rd Quarter | 4th Quarter | Total Year | |||||||||||||||
2014 | $ | 645 | $ | 1,846 | $ | 1,013 | $ | 781 | $ | 4,284 | |||||||||
2013 | 3,824 | 794 | (546 | ) | 1,955 | 6,026 | |||||||||||||
2012 | 238 | 2,166 | 268 | 21,382 | 24,055 | ||||||||||||||
We revised the presentation of our Consolidated Statements of Earnings for the years ending 2013 and 2012 to correctly classify $98.4 million and $100.0 million, respectively, of installment and other fee income as a component of total revenues and to conform to our current-year presentation (see Note 1 to the Consolidated Financial Statements). The following are the amounts of installment and other fee income that have been included in the revenue shown above that were not included in the amounts previously reported.
1st Quarter | 2nd Quarter | 3rd Quarter | 4th Quarter | Total Year | |||||||||||||||
2013 | $ | 25,300 | $ | 24,952 | $ | 24,183 | $ | 23,994 | $ | 98,428 | |||||||||
2012 | 24,714 | 25,098 | 25,145 | 24,995 | 99,952 | ||||||||||||||
57
INFINITY PROPERTY AND CASUALTY CORPORATION AND SUBSIDIARIES
Notes to Consolidated Financial Statements
Note 10 Insurance Reserves
Our insurance reserves consist of business produced directly by our wholly owned insurance subsidiaries, the Assumed Agency Business and two other unaffiliated insurance companies.
Incurred but not reported (“IBNR”) reserves for the direct and Assumed Agency Business are established for the quarter and year-end based on a quarterly reserve analysis by our actuarial staff. Various standard actuarial tests are applied to subsets of the business at a state, product and coverage basis. Included in the analyses are the following:
• | Paid and incurred extrapolation methods utilizing paid and incurred loss development to predict ultimate losses; |
• | Paid and incurred frequency and severity methods utilizing paid and incurred claims count development and paid and incurred claims cost development to predict ultimate average frequency (claims count per policy or auto insured) or ultimate average severity (cost of claim per claim); and |
• | Paid and incurred Bornhuetter-Ferguson methods adding expected development to actual paid or incurred experience to project ultimate losses. |
For each subset of the business evaluated, each test generates a point estimate based on development factors applied to known paid and incurred claims and claim counts to estimate ultimate paid claims and claim counts. Selections of development factors are based on historical loss development patterns with adjustment based on professional actuarial judgment where anticipated development patterns vary from those seen historically. Deviations from historical loss development patterns may occur due to changes in items such as claims settlement and payment practices, business mix, coverage limits and deductibles, inflation trends in auto repair and medical costs and legal and regulatory trends affecting claims settlements. This estimation of IBNR requires selection of hundreds of such factors. A single point estimate for the subset being evaluated is then selected from the results of various tests, based on a combination of simple averages of the point estimates of the various tests and selections based on professional actuarial judgment. During recent years, paid methods have been less reliable because of changes in settlement practices, so we have more heavily relied on incurred methods.
58
INFINITY PROPERTY AND CASUALTY CORPORATION AND SUBSIDIARIES
Notes to Consolidated Financial Statements
The following table provides an analysis of changes in the liability for losses and LAE, net of reinsurance:
($ in thousands) | 2014 | 2013 | 2012 | ||||||||
Balance at Beginning of Period | |||||||||||
Unpaid losses on known claims | $ | 221,447 | $ | 205,589 | $ | 181,972 | |||||
IBNR losses | 262,660 | 218,552 | 177,645 | ||||||||
LAE | 162,469 | 148,753 | 135,787 | ||||||||
Total unpaid losses and LAE | 646,577 | 572,894 | 495,403 | ||||||||
Reinsurance recoverables | (14,431 | ) | (13,678 | ) | (14,640 | ) | |||||
Unpaid losses and LAE, net of reinsurance recoverables | 632,146 | 559,215 | 480,764 | ||||||||
Current Activity | |||||||||||
Loss and LAE incurred: | |||||||||||
Current accident year | 1,019,033 | 1,014,299 | 926,033 | ||||||||
Prior accident years | (17,405 | ) | 2,948 | 16,219 | |||||||
Total loss and LAE incurred | 1,001,628 | 1,017,247 | 942,253 | ||||||||
Loss and LAE payments: | |||||||||||
Current accident year | (602,732 | ) | (593,850 | ) | (553,549 | ) | |||||
Prior accident years | (377,235 | ) | (350,466 | ) | (310,252 | ) | |||||
Total loss and LAE payments | (979,967 | ) | (944,316 | ) | (863,801 | ) | |||||
Balance at End of Period | |||||||||||
Unpaid losses and LAE, net of reinsurance recoverables | 653,808 | 632,146 | 559,215 | ||||||||
Add back reinsurance recoverables | 14,370 | 14,431 | 13,678 | ||||||||
Total unpaid losses and LAE | $ | 668,177 | $ | 646,577 | $ | 572,894 | |||||
Unpaid losses on known claims | $ | 235,037 | $ | 221,447 | $ | 205,589 | |||||
IBNR losses | 277,482 | 262,660 | 218,552 | ||||||||
LAE | 155,658 | 162,469 | 148,753 | ||||||||
Total unpaid losses and LAE | $ | 668,177 | $ | 646,577 | $ | 572,894 | |||||
The $17.4 million favorable reserve development during the twelve months ended December 31, 2014, was primarily due to decreases in severity in California property damage and in both severity and frequency in Florida bodily injury coverages, related to accident year 2013.
Increases in severities in both bodily injury coverage in California and personal injury protection coverage in Florida related to
accident year 2012 were the primary sources of the $2.9 million unfavorable reserve development during the twelve months ended December 31, 2013.
Increases in severities in both bodily injury coverage in California and personal injury protection coverage in Florida related to accident year 2011 were the primary sources of the $16.2 million unfavorable reserve development during the twelve months ended December 31, 2012.
59
INFINITY PROPERTY AND CASUALTY CORPORATION AND SUBSIDIARIES
Notes to Consolidated Financial Statements
Note 11 Reinsurance
The following table shows written and earned premium included in earnings for reinsurance assumed and amounts deducted from written and earned premium in connection with reinsurance ceded ($ in thousands):
Year | Direct Written Premium | Reinsurance Assumed | Reinsurance Ceded | Net Written Premium | % of Amount Assumed to Net | |||||||||||||
2014 | $ | 1,360,807 | $ | 63 | $ | (13,266 | ) | $ | 1,347,604 | 0.0 | % | |||||||
2013 | 1,339,803 | 16 | (9,927 | ) | 1,329,892 | 0.0 | % | |||||||||||
2012 | 1,254,386 | 543 | (7,731 | ) | 1,247,198 | 0.0 | % | |||||||||||
Year | Direct Earned Premium | Reinsurance Assumed | Reinsurance Ceded | Net Earned Premium | % of Amount Assumed to Net | |||||||||||||
2014 | $ | 1,337,557 | $ | 57 | $ | (11,679 | ) | $ | 1,325,935 | 0.0 | % | |||||||
2013 | 1,311,942 | 15 | (9,432 | ) | 1,302,525 | 0.0 | % | |||||||||||
2012 | 1,190,773 | 542 | (7,225 | ) | 1,184,090 | 0.0 | % | |||||||||||
Assumed Reinsurance
Assumed business consists of business assumed from unaffiliated insurance companies and involuntary pools and associations.
We assumed $3.5 million, $4.1 million and $5.4 million, respectively, at December 31, 2014, 2013 and 2012 of total unpaid losses and LAE from unaffiliated insurance companies. We assumed no premium from unaffiliated insurance companies in 2014 or 2013. In 2012, we assumed $0.5 million of premium from unaffiliated insurance companies.
At December 31, 2014, 2013 and 2012, we assumed $7.5 million, $7.8 million and $8.0 million, respectively, of assumed unpaid losses and LAE as part of fronting arrangements under which we utilized these companies' insurance licenses to write business while assuming substantially all of that business back from these carriers. Although the business was issued on these unaffiliated companies' policies, we manage the claims adjusting and loss reserving for this business.
During the twelve months ended December 31, 2014, 2013 and 2012, we assumed, from involuntary pools and associations, premium and unpaid losses and LAE of less than $0.1 million each.
Ceded Reinsurance
We use excess of loss, catastrophe and extra-contractual loss reinsurance to mitigate the financial impact of large or
catastrophic losses. During 2012, our catastrophe reinsurance protection was 100% of $25 million in excess of $5 million. For 2013, we increased our catastrophe reinsurance protection to 100% of $45 million in excess of $5 million. For 2014, we increased our catastrophe reinsurance protection to 100% of $55 million in excess of $5 million. Our excess of loss reinsurance provides reinsurance protection for commercial auto losses up to $700,000 for claims in excess of $300,000 per occurrence. Our extra-contractual loss reinsurance provides protection for losses up to $10 million in excess of $5 million for any single extra-contractual loss. We also use reinsurance to mitigate losses on our Classic Collector business.
Ceded reinsurance for all programs reduced our incurred losses and LAE by $3.5 million, $1.6 million and $2.5 million for the twelve months ended December 31, 2014, 2013 and 2012, respectively.
60
INFINITY PROPERTY AND CASUALTY CORPORATION AND SUBSIDIARIES
Notes to Consolidated Financial Statements
Note 12 Statutory Information
Capital and Surplus
Insurance companies are required to file financial statements with state insurance regulatory authorities prepared on an accounting basis prescribed or permitted by such authorities (statutory basis). Net earnings and capital and surplus on a statutory basis were as follows ($ in thousands):
Statutory Net Earnings | Statutory Capital and Surplus | |||||||
2014 | 2013 | 2012 | 2014 | 2013 | ||||
$67,360 | $44,906 | $31,141 | $682,068 | $673,973 | ||||
For the twelve-month periods ended December 31, 2014, 2013 and 2012, statutory results differed from net earnings on a GAAP basis primarily due to the amortization of deferred acquisition costs, the basis difference in realized gains and holding company expenses, including interest. Net earnings for 2012 include $0.1 million related to a subsidiary sold as of December 31, 2012.
At December 31, 2014, the consolidated amount of statutory capital and surplus necessary to satisfy regulatory requirements as defined by the National Association of Insurance Commissioners' ("NAIC") Risk-Based Capital ("RBC") calculation was $144.9 million. This amount of statutory capital and surplus represents the Company Action Level ("CAL") of minimum surplus. Falling below this level would require a company to prepare and submit an RBC plan to address the deficiency in surplus to the CAL to the commissioner of its state of domicile.
Restrictions on Transfer of Funds and Assets of Subsidiaries
As of December 31, 2014, there are no regulatory restrictions on the payment of dividends to our shareholders. However, our ability to declare and pay dividends will depend on the working capital in the holding company, as well as dividends received from our insurance subsidiaries.
Payments of dividends, loans and advances by our insurance subsidiaries are subject to certain restrictions under various state laws, federal regulations and debt covenants that limit the amount of dividends, loans and advances that can be paid. Under applicable restrictions, the maximum amount of dividends payable in 2015 from our insurance subsidiaries without regulatory approval is approximately $68.1 million. Additional amounts of dividends, loans and advances require regulatory approval.
Note 13 Legal and Regulatory Proceedings
From time to time we and our subsidiaries are named as defendants in various lawsuits incidental to our insurance operations. We consider legal actions relating to claims made in the ordinary course of seeking indemnification for a loss covered by the insurance policy in establishing loss and LAE reserves.
We also face in the ordinary course of business lawsuits that seek damages beyond policy limits, commonly known as extra-contractual claims, as well as class action and individual lawsuits that involve issues not unlike those facing other insurance companies and employers. We continually evaluate potential liabilities and reserves for litigation of these types using the criteria established by the Contingencies topic of the FASC. Under this guidance we may only record reserves for a loss if the likelihood of occurrence is probable and we can reasonably estimate the amount. If a material loss, while not probable, is judged to be reasonably possible, we will disclose, if it can be estimated, a possible range of loss or state that an estimate cannot be made. We consider each legal action using this guidance and record reserves for losses as warranted by establishing a reserve captured within our Consolidated Balance Sheets line-items “Unpaid losses and LAE” for extra-contractual claims and “Other liabilities” for class action and other non-claims related lawsuits. We record amounts incurred on the Consolidated Statements of Earnings within “Losses and LAE” for extra-contractual claims and “Other expenses” for class action and other non-claims related lawsuits.
Certain claims and legal actions have been brought against us for which we have accrued no loss, and for which an estimate of a possible range of loss cannot be made under the above rules. While it is not possible to predict the ultimate outcome of these claims or lawsuits, we do not believe they are likely to have a material effect on our financial condition or liquidity. However, losses incurred because of these cases could have a material adverse impact on net earnings in a given period.
61
INFINITY PROPERTY AND CASUALTY CORPORATION AND SUBSIDIARIES
Notes to Consolidated Financial Statements
In Reyes v. Infinity Indemnity Insurance Company (Circuit Court of Miami-Dade County, Florida), a third party claimant is attempting to recover from Infinity a $30 million consent judgment obtained against an Infinity policyholder for personal injuries suffered by claimant. Infinity believes any claims of bad faith are unfounded and has denied any and all liability to plaintiff. In December 2014 the court granted Infinity's motion for partial summary judgment finding the $30 million consent judgment unenforceable and that no bad faith claim can exist as a matter of law. Plantiff has appealed this ruling. While a decision on the appeal cannot be predicted with certainty, we believe that a material loss is not probable.
Note 14 Commitments and Contingencies
Commitments
Minimum rental commitments under non-cancelable leases with an initial or remaining term of more than one year as of December 31, 2014, were as follows ($ in thousands):
Due in | Operating Leases | Capital Leases | |||||
2015 | $ | 9,200 | $ | 481 | |||
2016 | 4,921 | 425 | |||||
2017 | 3,361 | 318 | |||||
2018 | 2,927 | 236 | |||||
2019 | 1,153 | 222 | |||||
Thereafter | 375 | 0 | |||||
Total | $ | 21,937 | $ | 1,682 | |||
All of these leases expire within 7 years. The most significant leased office spaces are located in Birmingham, Alabama ($4.4 million) and suburban Los Angeles, California ($7.3 million).
The operating leases above include leased vehicles. As vehicles are surrendered, they are sold for cash by the lessor. We guarantee that proceeds from sales will be at least equal to the lessor's depreciated book value. Otherwise, we are credited the excess or we pay the deficit. The lessors depreciated book value at December 31, 2014, on the vehicles we lease was $6.4 million, which represents the maximum deficit we would be required to pay if the lessor received no proceeds from the sale. Historically, we have not made any material additional rental payments due to surrendered vehicles. As of December 31, 2014, the current fair market value of the vehicles we lease was approximately $6.6 million.
Lease expense incurred for all leases during the last three years was as follows ($ in thousands):
Twelve months ended December 31, | |||||||||||
2014 | 2013 | 2012 | |||||||||
Lease expense | $ | 10,447 | $ | 12,015 | $ | 12,389 | |||||
Sublease income | 0 | (163 | ) | (420 | ) | ||||||
Total | $ | 10,447 | $ | 11,851 | $ | 11,969 | |||||
Contingencies
Based on the criteria established by the Contingencies topic of the FASC, we have the following loss contingencies for which we accrue in our financial statements:
• Other-than-temporary impairments on investments | Note 3 | |
• Insurance reserves | Note 10 | |
• Legal and regulatory proceedings | Note 13 | |
• Allowances for uncollectible accounts | Note 15 | |
For each item listed above, please refer to the notes referenced for additional discussion.
62
INFINITY PROPERTY AND CASUALTY CORPORATION AND SUBSIDIARIES
Notes to Consolidated Financial Statements
Note 15 Additional Information
Allowances for Uncollectible Accounts
Agents’ balances and premium receivable included in the Consolidated Balance Sheets are net of allowances for uncollectible accounts. The provision for such losses is included in commissions and other underwriting expenses. A progression of the aggregate allowance follows ($ in thousands):
2014 | 2013 | 2012 | |||||||||
Beginning balance | $ | 15,884 | $ | 16,124 | $ | 13,497 | |||||
Provision for losses | 19,541 | 20,913 | 24,884 | ||||||||
Uncollectible amounts written off | (19,916 | ) | (21,154 | ) | (22,257 | ) | |||||
Ending balance | $ | 15,510 | $ | 15,884 | $ | 16,124 | |||||
Negative Cash Book Balances
Negative cash book balances, included in the line item “Other liabilities” in the Consolidated Balance Sheets, were $51.2 million, $50.5 million and $45.4 million, respectively, at December 31, 2014, 2013 and 2012.
63
INFINITY PROPERTY AND CASUALTY CORPORATION AND SUBSIDIARIES
Notes to Consolidated Financial Statements
Note 16 Accumulated Other Comprehensive Income
The components of other comprehensive income before and after tax are as follows ($ in thousands):
Twelve Months Ended December 31, | ||||||||||||||||||||||||||||||||||||
2014 | 2013 | 2012 | ||||||||||||||||||||||||||||||||||
Before Tax | Income Tax | Net | Before Tax | Income Tax | Net | Before Tax | Income Tax | Net | ||||||||||||||||||||||||||||
Accumulated change in postretirement benefit liability, beginning of period | $ | (62 | ) | $ | 22 | $ | (40 | ) | $ | (967 | ) | $ | 339 | $ | (629 | ) | $ | 519 | $ | (182 | ) | $ | 337 | |||||||||||||
Effect on other comprehensive income | 235 | (82 | ) | 153 | 906 | (317 | ) | 589 | (1,487 | ) | 520 | (966 | ) | |||||||||||||||||||||||
Accumulated change in postretirement benefit liability, end of period | $ | 174 | $ | (61 | ) | $ | 113 | $ | (62 | ) | $ | 22 | $ | (40 | ) | $ | (967 | ) | $ | 339 | $ | (629 | ) | |||||||||||||
Accumulated unrealized gains on investments, net, beginning of period | $ | 25,638 | $ | (8,973 | ) | $ | 16,665 | $ | 46,892 | $ | (16,412 | ) | $ | 30,480 | $ | 53,817 | $ | (18,836 | ) | $ | 34,981 | |||||||||||||||
Other comprehensive income before reclassification | 14,618 | (5,116 | ) | 9,502 | (15,227 | ) | 5,330 | (9,898 | ) | 17,129 | (5,995 | ) | 11,134 | |||||||||||||||||||||||
Reclassification adjustment for other-than-temporary impairments included in net income | 160 | (56 | ) | 104 | 1,468 | (514 | ) | 954 | 1,393 | (487 | ) | 905 | ||||||||||||||||||||||||
Reclassification adjustment for realized gains included in net income | (4,444 | ) | 1,556 | (2,889 | ) | (7,495 | ) | 2,623 | (4,872 | ) | (25,447 | ) | 8,907 | (16,541 | ) | |||||||||||||||||||||
Effect on other comprehensive income | 10,334 | (3,617 | ) | 6,717 | (21,254 | ) | 7,439 | (13,815 | ) | (6,926 | ) | 2,424 | (4,502 | ) | ||||||||||||||||||||||
Accumulated unrealized gains on investments, net, end of period | $ | 35,972 | $ | (12,590 | ) | $ | 23,382 | $ | 25,638 | $ | (8,973 | ) | $ | 16,665 | $ | 46,892 | $ | (16,412 | ) | $ | 30,480 | |||||||||||||||
Accumulated other comprehensive income, beginning of period | $ | 25,576 | $ | (8,952 | ) | $ | 16,624 | $ | 45,924 | $ | (16,073 | ) | $ | 29,851 | $ | 54,336 | $ | (19,018 | ) | $ | 35,319 | |||||||||||||||
Change in postretirement benefit liability | 235 | (82 | ) | 153 | 906 | (317 | ) | 589 | (1,487 | ) | 520 | (966 | ) | |||||||||||||||||||||||
Change in unrealized gains on investments, net | 10,334 | (3,617 | ) | 6,717 | (21,254 | ) | 7,439 | (13,815 | ) | (6,926 | ) | 2,424 | (4,502 | ) | ||||||||||||||||||||||
Effect on other comprehensive income | 10,569 | (3,699 | ) | 6,870 | (20,348 | ) | 7,122 | (13,226 | ) | (8,412 | ) | 2,944 | (5,468 | ) | ||||||||||||||||||||||
Accumulated other comprehensive income, end of period | $ | 36,145 | $ | (12,651 | ) | $ | 23,494 | $ | 25,576 | $ | (8,952 | ) | $ | 16,624 | $ | 45,924 | $ | (16,073 | ) | $ | 29,851 | |||||||||||||||
Note 17 Subsequent Events
On February 5, 2015, we signed a $20.0 million purchase agreement for a 120,493 square foot building to replace a location currently leased in Birmingham, Alabama. The purchase will be made with internally generated funds and is expected to close in approximately 60 days.
64
INFINITY PROPERTY AND CASUALTY CORPORATION 10-K
INFINITY PROPERTY AND CASUALTY CORPORATION AND SUBSIDIARIES
PART IV
ITEM 15
Exhibits and Financial Statement Schedules
(a) Documents filed as part of this Report: | |
1. Financial Statements are included in Part II, Item 8. | |
2. Financial Statement Schedules: | |
A. Selected Quarterly Financial Data is included in Note 9 to the Consolidated Financial Statements. | |
B. Schedules filed herewith as of December 31, 2014: | |
Page | |
I – Summary of Investments (See Note 3) | |
II – Condensed Financial Information of Registrant | |
III – Supplementary Insurance Information | Not required |
IV – Reinsurance (See Note 11) | |
V – Valuation and Qualifying Accounts (see Note 15) | |
VI – Supplemental Information Concerning Property-Casualty Insurance Operations | |
All other schedules for which provisions are made in the applicable regulation of the Securities and Exchange Commission have been omitted, as they are not applicable, not required, or the information required thereby is set forth in the Financial Statements or the notes thereto.
65
INFINITY PROPERTY AND CASUALTY CORPORATION 10-K
INFINITY PROPERTY AND CASUALTY CORPORATION – PARENT ONLY
SCHEDULE II – CONDENSED FINANCIAL INFORMATION OF REGISTRANT
Condensed Balance Sheets
($ in thousands)
December 31, | |||||||
2014 | 2013 | ||||||
Assets: | |||||||
Investment in subsidiaries | $ | 830,712 | $ | 814,371 | |||
Fixed maturities – at fair value (amortized cost: $97,678 and $80,648) | 98,076 | 78,401 | |||||
Equity securities – at fair value (cost $1,471 and $1,201) | 1,620 | 1,332 | |||||
Short-term investments – at fair value (amortized cost $803 and $0) | 803 | 0 | |||||
Cash and cash equivalents | 37,731 | 33,441 | |||||
Other assets | 15,293 | 13,163 | |||||
Total assets | $ | 984,237 | $ | 940,707 | |||
Liabilities and Shareholders’ Equity: | |||||||
Long-term debt | $ | 275,000 | $ | 275,000 | |||
Other liabilities | 10,743 | 7,955 | |||||
Payable to affiliates | 835 | 993 | |||||
Shareholders’ equity | 697,659 | 656,758 | |||||
Total liabilities and shareholders’ equity | $ | 984,237 | $ | 940,707 | |||
Condensed Statements of Earnings
($ in thousands)
Twelve months ended December 31, | |||||||||||||||||
2014 | 2013 | % Change | 2012 | % Change | |||||||||||||
Income: | |||||||||||||||||
Income in equity of subsidiaries | $ | 69,964 | $ | 45,010 | 55.4 | % | $ | 42,253 | 6.5 | % | |||||||
Net investment income | 1,757 | 1,799 | (2.3 | )% | 2,725 | (34.0 | )% | ||||||||||
Realized gain on investments | 24 | 611 | (96.1 | )% | 2,883 | (78.8 | )% | ||||||||||
Other income | 19 | 0 | NM | 0 | 0.0 | % | |||||||||||
Total income | 71,765 | 47,420 | 51.3 | % | 47,861 | (0.9 | )% | ||||||||||
Costs and Expenses: | |||||||||||||||||
Interest expense | 13,750 | 13,826 | (0.6 | )% | 12,539 | 10.3 | % | ||||||||||
Loss on redemption of long-term debt | 0 | 0 | 0.0 | % | 13,595 | (100.0 | )% | ||||||||||
Corporate general and administrative expenses | 7,702 | 7,870 | (2.1 | )% | 7,408 | 6.2 | % | ||||||||||
Other expense | 26 | 25 | 3.3 | % | 193 | (87.0 | )% | ||||||||||
Total expenses | 21,478 | 21,722 | (1.1 | )% | 33,735 | (35.6 | )% | ||||||||||
Earnings before income taxes | 50,287 | 25,699 | 95.7 | % | 14,125 | 81.9 | % | ||||||||||
Provision for income taxes | (6,914 | ) | (6,934 | ) | (0.3 | )% | (10,194 | ) | (32.0 | )% | |||||||
Net earnings | $ | 57,201 | $ | 32,633 | 75.3 | % | $ | 24,319 | 34.2 | % | |||||||
NM = Not meaningful
66
INFINITY PROPERTY AND CASUALTY CORPORATION 10-K
INFINITY PROPERTY AND CASUALTY CORPORATION - PARENT ONLY
Condensed Statements of Cash Flows
($ in thousands)
Twelve months ended December 31, | |||||||||||
2014 | 2013 | 2012 | |||||||||
Operating Activities: | |||||||||||
Net income | $ | 57,201 | $ | 32,633 | $ | 24,319 | |||||
Equity in consolidated subsidiaries | (69,964 | ) | (45,010 | ) | (42,253 | ) | |||||
Loss on redemption of long-term debt | 0 | 0 | 13,595 | ||||||||
Excess tax benefits from share-based payment arrangements | (108 | ) | (573 | ) | (896 | ) | |||||
Other | 1,055 | 10,622 | (31,509 | ) | |||||||
Net cash used in operating activities | (11,816 | ) | (2,329 | ) | (36,743 | ) | |||||
Investing Activities: | |||||||||||
Purchases of fixed maturities | (26,572 | ) | (120,115 | ) | (81,925 | ) | |||||
Purchases of short-term maturities | (821 | ) | 0 | 0 | |||||||
Maturities and redemptions of fixed maturities | 27,750 | 19,645 | 13,580 | ||||||||
Proceeds from sale of fixed maturities | 8,327 | 80,921 | 116,343 | ||||||||
Dividends received from subsidiary(1) | 34,530 | 125 | 425 | ||||||||
Capital contributed to subsidiaries(2) | (1,338 | ) | (2,321 | ) | (2,205 | ) | |||||
Net cash (used in) provided by investing activities | 41,876 | (21,744 | ) | 46,218 | |||||||
Financing Activities: | |||||||||||
Proceeds from stock options exercised and employee stock purchases, including tax benefit | 784 | 3,203 | 2,911 | ||||||||
Excess tax benefits from share-based payment arrangements | 108 | 573 | 896 | ||||||||
Acquisition of treasury stock | (10,100 | ) | (12,612 | ) | (19,643 | ) | |||||
Redemption of long-term debt | 0 | 0 | (208,122 | ) | |||||||
Proceeds from issuance of long-term debt | 0 | 0 | 273,213 | ||||||||
Dividends paid to shareholders | (16,562 | ) | (13,821 | ) | (10,544 | ) | |||||
Net cash (used in) provided by financing activities | (25,769 | ) | (22,656 | ) | 38,712 | ||||||
Net (decrease) increase in cash and cash equivalents | 4,290 | (46,730 | ) | 48,187 | |||||||
Cash and cash equivalents at beginning of period | 33,441 | 80,171 | 31,984 | ||||||||
Cash and cash equivalents at end of period | $ | 37,731 | $ | 33,441 | $ | 80,171 | |||||
(1) | We received $25.6 million in the form of securities from our subsidiaries in 2014. |
(2) | We contributed $49.7 million in the form of securities to our subsidiaries in 2012. |
INFINITY PROPERTY AND CASUALTY CORPORATION 10-K
INFINITY PROPERTY AND CASUALTY CORPORATION
SCHEDULE VI – SUPPLEMENTAL INFORMATION CONCERNING
PROPERTY-CASUALTY INSURANCE OPERATIONS
THREE YEARS ENDED DECEMBER 31, 2014
($ in thousands)
COLUMN A | COLUMN B | COLUMN C | COLUMN D | COLUMN E | COLUMN F | COLUMN G | COLUMN H | COLUMN I | COLUMN J | COLUMN K | ||||||||||||||||||||||||||||||||||||||
Affiliation with Registrant | Deferred Policy Acquisition Costs | Reserves for Unpaid Claims and Loss Adjustment Expenses (a) | Discount Deducted in Column C | Unearned Premium (b) | Earned Premium | Net Investment Income | Claims and Claim Adjustment Expenses Incurred Related to | Amortization of Deferred Policy Acquisition Costs | Other Operating Expenses | Paid Claims and Claim Adjustment Expenses | Net Premium Written | |||||||||||||||||||||||||||||||||||||
Current Years | Prior Years | |||||||||||||||||||||||||||||||||||||||||||||||
2014 | $ | 90,428 | $ | 668,177 | $ | 0 | $ | 589,260 | $ | 1,325,935 | $ | 35,629 | $ | 1,019,033 | $ | (17,405 | ) | $ | 204,678 | $ | 149,880 | $ | 979,967 | $ | 1,347,604 | |||||||||||||||||||||||
2013 | 88,258 | 646,577 | 0 | 566,004 | 1,302,525 | 35,546 | 1,014,299 | 2,948 | 206,704 | 150,348 | 944,316 | 1,329,892 | ||||||||||||||||||||||||||||||||||||
2012 | 88,251 | 572,894 | 0 | 538,142 | 1,184,090 | 37,571 | 926,033 | 16,219 | 194,944 | 154,864 | 863,801 | 1,247,198 | ||||||||||||||||||||||||||||||||||||
________________
(a) | Gross of reinsurance recoverables of $14.4 million, $14.4 million and $13.7 million at December 31, 2014, 2013 and 2012, respectively. |
(b) | Gross of prepaid reinsurance premium of $4.8 million, $3.1 million and $2.6 million at December 31, 2014, 2013 and 2012, respectively. |
67
INFINITY PROPERTY AND CASUALTY CORPORATION AND SUBSIDIARIES
Pursuant to the requirements of Section 13 or 15(d) of the Securities Exchange Act of 1934, Infinity Property and Casualty Corporation has duly caused this Report to be signed on its behalf by the undersigned, thereunto duly authorized.
Signed: February 26, 2015
Infinity Property and Casualty Corporation | |
By: | /S/ JAMES R. GOBER |
James R. Gober | |
Chief Executive Officer | |
Pursuant to the requirements of the Securities Exchange Act of 1934, this Report has been signed below by the following persons on behalf of the Registrant and in the capacities and on the dates indicated:
Signature | Capacity | Date | ||
/S/ JAMES R. GOBER | Chairman of the Board of Directors, | February 26, 2015 | ||
James R. Gober | Chief Executive Officer, and President (principal executive officer) | |||
/S/ ROGER SMITH | Executive Vice President, Chief Financial | February 26, 2015 | ||
Roger Smith | Officer, and Treasurer (principal financial and accounting officer) | |||
/S/ ANGELA BROCK-KYLE | Director* | February 26, 2015 | ||
Angela Brock-Kyle | ||||
/S/ TERESA A. CANIDA | Director | February 26, 2015 | ||
Teresa A. Canida | ||||
Director | February 26, 2015 | |||
Jorge G. Castro | ||||
/S/ HAROLD E. LAYMAN | Director* | February 26, 2015 | ||
Harold E. Layman | ||||
/S/ E. ROBERT MEANEY | Director* | February 26, 2015 | ||
E. Robert Meaney | ||||
/S/ DRAYTON NABERS, JR. | Director | February 26, 2015 | ||
Drayton Nabers, Jr. | ||||
/S/ WILLIAM S. STARNES | Director* | February 26, 2015 | ||
William S. Starnes | ||||
/S/ SAMUEL J. WEINHOFF | Director* | February 26, 2015 | ||
Samuel J. Weinhoff | ||||
________________
* | Member of the Audit Committee |
68
INFINITY PROPERTY AND CASUALTY CORPORATION
INDEX TO EXHIBITS
Number | Exhibit Description | ||
3.1 | Amended and Restated Articles of Incorporation (incorporated by reference to Exhibit 3.1 to Infinity’s Form 10-Q filed on August 8, 2007) | ||
3.2 | Regulations (incorporated by reference to Exhibit 3.2 to Infinity’s Form S-1 filed on October 9, 2002) | ||
4.1 | Form of Senior Indentures, dated August 6, 2010, between Infinity and U.S. Bank National Association, as Trustee (incorporated by reference to Exhibit 4.4 to Infinity’s Form S-3 filed on August 6, 2010) | ||
4.2 | Form of Subordinated Indenture between Infinity and U.S. Bank National Association, as Trustee (incorporated by reference to Exhibit 4.5 to Infinity’s Form S-3 filed on August 6, 2010) | ||
4.3 | Form of Junior Subordinated Indenture between Infinity and U.S. Bank National Association, as Trustee (incorporated by reference to Exhibit 4.6 to Infinity’s Form S-3 filed on August 6, 2010) | ||
4.4 | First Supplemental Indenture to Senior Indenture, dated September 17, 2012, between Infinity and U.S. Bank National Association, as Trustee (incorporated by reference to Exhibit 4.1 to Infinity's Form 8-K filed on September 17, 2012) | ||
Material Contracts: | |||
10.1 | Reinsurance Agreement between Infinity Standard Insurance Company [formerly known as Windsor Insurance Company], as Reinsurer, and Great American Insurance Company and Affiliates, as Reassured (incorporated by reference to Exhibit 10.4 to Infinity’s Form 10-K filed on March 31, 2003) | ||
10.2 | Side Letter Agreement to amend Reinsurance Agreement between Infinity Standard Insurance Company [formerly known as Windsor Insurance Company], as Reinsurer, and Great American Insurance Company and Affiliates, as Reassured (incorporated by reference to Exhibit 10 to Infinity’s Form 8-K filed on February 1, 2007) | ||
10.3 | Lease between Colonial Properties and Infinity, dated August 26, 2003 for Colonnade property in Birmingham, Alabama (incorporated by reference to Exhibit 10.23 to Infinity’s Form 10-K/A filed on April 2, 2004) | ||
10.4 | Tax Allocation Agreement, dated December 31, 2003 and effective February 13, 2003 by and among Infinity and its Subsidiaries (incorporated by reference to Exhibit 10.24 to Infinity’s Form 10-K/A filed on April 2, 2004) | ||
10.5 | Amended and Restated Credit Agreement, dated August 31, 2008, between Infinity and Regions Bank (incorporated by reference to Exhibit 10 to Infinity's Form 8-K filed on September 4, 2008. | ||
10.6 | First Amendment to Amended and Restated Credit Agreement, dated August 31, 2011 between Infinity and Regions Bank (incorporated by reference to Exhibit 10 to Infinity’s Form 8-K filed on September 1, 2011) | ||
10.7 | Second Amendment to Amended and Restated Credit Agreement, dated August 20, 2014 between Infinity and Regions Bank (incorporated by reference to Exhibit 10 to Infinity's Form 8-K filed on August 26, 2014) | ||
10.8 | Amended and Restated Employee Stock Purchase Plan (incorporated by reference to Exhibit 10 to Infinity’s Form 10-Q filed on August 6, 2010) | (*) | |
10.9 | Deferred Compensation Plan as amended and restated effective February 9, 2010 (incorporated by reference to Exhibit 10.9 to Infinity's Form 10-K filed February 26, 2010) | (*) | |
69
10.10 | Supplemental Retirement Plan as amended and restated effective January 1, 2010 (incorporated by reference to Exhibit 10.10 to Infinity's Form 10-K filed February 26, 2010) | (*) | |
10.11 | Employment Agreement for James R. Gober (incorporated by reference to Exhibit 10.1 to Infinity’s Form 8-K filed on September 17, 2014) | (*) | |
10.12 | Employment Agreement for Glen N. Godwin (incorporated by reference to Exhibit 10.2 to Infinity’s Form 8-K filed on September 17, 2014) | (*) | |
10.13 | Employment Agreement for Scott C. Pitrone (incorporated by reference to Exhibit 10.3 to Infinity’s Form 8-K filed on September 17, 2014) | (*) | |
10.14 | Employment Agreement for Samuel J. Simon (incorporated by reference to Exhibit 10.4 to Infinity’s Form 8-K filed on September 17, 2014) | (*) | |
10.15 | Employment Agreement for Roger Smith (incorporated by reference to Exhibit 10.5 to Infinity’s Form 8-K filed on September 17, 2014) | (*) | |
10.16 | Annual Executive Bonus Plan (incorporated by reference to Appendix A to Infinity’s Definitive Proxy Statement, Schedule 14A filed on April 19, 2010) | (*) | |
10.17 | Second Amended and Restated 2008 Performance Share Plan (incorporated by reference to Appendix B to Infinity’s Definitive Proxy Statement, Schedule 14A filed on April 19, 2010) | (*) | |
10.18 | Form of Performance Share Agreement (incorporated by reference to Exhibit A of Appendix B to Infinity’s Definitive Proxy Statement, Schedule 14A filed on April 19, 2010) | (*) | |
10.19 | Purchase Agreement, dated February 5, 2015 between Infinity Insurance Company, as Purchaser, and Advance Alabama Media LLC, as Seller (incorporated by reference to Exhibit 10 to Infinity's Form 8-K filed on February 11, 2015) | ||
10.20 | Form of Performance Share Award Agreement (incorporated by reference to Exhibit 10 to Infinity's Form 10-Q filed on May 8, 2014) | (*) | |
10.21 | Second Amended and Restated 2013 Stock Incentive Plan | (*) | |
10.22 | Form of Restricted Share Award Agreement | (*) | |
21 | Subsidiaries of the Registrant | ||
23 | Consent of Independent Registered Public Accounting Firm | ||
31.1 | Certification of the Chief Executive Officer under Exchange Act Rule 13a-14(a). | ||
31.2 | Certification of the Chief Financial Officer under Exchange Act Rule 15d-14(a). | ||
32 | Section 1350 Certification of Chief Executive Officer and Chief Financial Officer | ||
101.INS | XBRL Instance Document | ||
101.SCH | XBRL Taxonomy Extension Schema | ||
101.CAL | XBRL Taxonomy Extension Calculation Linkbase | ||
101.DEF | XBRL Taxonomy Extension Definition Linkbase | ||
101.LAB | XBRL Taxonomy Extension Label Linkbase | ||
101.PRE | XBRL Taxonomy Extension Presentation Linkbase | ||
(*) | Management Contract or Compensatory Plan or Arrangement. |
70